
UNITED STATES
SECURITIES AND EXCHANGE COMMISSION
Washington, D.C. 20549
FORM N-CSR
CERTIFIED SHAREHOLDER REPORT OF REGISTERED
MANAGEMENT INVESTMENT COMPANIES
Investment Company Act file number: 811-09253
Wells Fargo Funds Trust
(Exact name of registrant as specified in charter)
525 Market St., San Francisco, CA 94105
(Address of principal executive offices) (Zip code)
C. David Messman
Wells Fargo Funds Management, LLC
525 Market St., San Francisco, CA 94105
(Name and address of agent for service)
Registrant’s telephone number, including area code: 800-222-8222
Date of fiscal year end: April 30
Registrant is making a filing for 2 of its series:
Wells Fargo Absolute Return Fund and Wells Fargo Asset Allocation Fund.
Date of reporting period: April 30, 2018
| ITEM 1. | REPORT TO STOCKHOLDERS |
Annual Report
April 30, 2018

Wells Fargo Absolute Return Fund


Reduce clutter. Save trees.
Sign up for electronic delivery of prospectuses and shareholder reports at wellsfargo.com/advantagedelivery
Contents
The views expressed and any forward-looking statements are as of April 30, 2018, unless otherwise noted, and are those of the Fund managers and/or Wells Fargo Funds Management, LLC. Discussions of individual securities, or the markets generally, or any Wells Fargo Fund are not intended as individual recommendations. Future events or results may vary significantly from those expressed in any forward-looking statements. The views expressed are subject to change at any time in response to changing circumstances in the market. Wells Fargo Funds Management, LLC and the Fund disclaim any obligation to publicly update or revise any views expressed or forward-looking statements.
NOT FDIC INSURED ◾ NO BANK GUARANTEE ◾ MAY LOSE VALUE
| | | | |
| 2 | | Wells Fargo Absolute Return Fund | | Letter to shareholders (unaudited) |

Andrew Owen
President
Wells Fargo Funds
Globally, economies strengthened, equity markets advanced, and foreign bonds outperformed fixed-income investments in the U.S.
Dear Shareholder:
We are pleased to offer you this annual report for the Wells Fargo Absolute Return Fund for the 12-month period that ended April 30, 2018. Globally, economies strengthened, equity markets advanced, and foreign bonds outperformed fixed-income investments in the U.S.
For the 12-month period, U.S. stocks, as measured by the S&P 500 Index,1 gained 13.27% and international stocks, as measured by the MSCI ACWI ex USA Index (Net),2 added 15.91%. Emerging market stocks, as measured by the MSCI EM Index (Net),3 added 21.71%. In bond markets, the Bloomberg Barclays U.S. Aggregate Bond Index4 declined 0.32% while fixed-income investments outside the U.S. gained 7.68%, as measured by the Bloomberg Barclays Global Aggregate ex-USD Index.5 The Bloomberg Barclays Municipal Bond Index6 added 1.56%, and the ICE BofAML U.S. High Yield Index7 was up 3.21%.
Global economic growth benefited equity investments during the second quarter of 2017.
During the second quarter of 2017, U.S. economic data reflected a healthy economy. Gross domestic product (GDP) growth on an annualized basis was 3.1% for the second quarter. Hiring remained strong, and business and consumer sentiment improved.
In June, the U.S. Federal Reserve (Fed) raised the target federal funds interest rate by a quarter percentage point to a range of 0.75% to 1.00%. With the interest rate increase, short-term bond yields rose while longer-term Treasury yields were little changed, leading to positive performance. Investment-grade, high-yield, and municipal bonds benefited from strong demand.
Although economic momentum increased in Europe, the European Central Bank (ECB) held its rates steady at low levels because underlying inflation remained subdued. In emerging markets, many countries benefited from stronger currencies versus the U.S. dollar. The Bank of Japan also continued economic and monetary policies that align with Prime Minister Shinzō Abe’s efforts to encourage business activity and economic growth.
| 1 | The S&P 500 Index consists of 500 stocks chosen for market size, liquidity, and industry group representation. It is a market-value-weighted index with each stock’s weight in the index proportionate to its market value. You cannot invest directly in an index. |
| 2 | The Morgan Stanley Capital International (MSCI) All Country World Index (ACWI) ex USA Index (Net) is a free-float-adjusted market-capitalization-weighted index that is designed to measure the equity market performance of developed markets, excluding the United States and Canada. Source: MSCI. MSCI makes no express or implied warranties or representations and shall have no liability whatsoever with respect to any MSCI data contained herein. The MSCI data may not be further redistributed or used as a basis for other indices or any securities or financial products. This report is not approved, reviewed, or produced by MSCI. You cannot invest directly in an index. |
| 3 | The MSCI Emerging Markets (EM) Index (Net) is a free-float-adjusted market-capitalization-weighted index that is designed to measure large- and mid-cap equity market performance of emerging markets. The MSCI EM Index (Net) consists of the following 24 emerging market country indices: Brazil, Chile, China, Colombia, Czech Republic, Egypt, Greece, Hungary, India, Indonesia, Korea, Malaysia, Mexico, Pakistan, Peru, the Philippines, Poland, Qatar, Russia, South Africa, Taiwan, Thailand, Turkey, and the United Arab Emirates. You cannot invest directly in an index. |
| 4 | The Bloomberg Barclays U.S. Aggregate Bond Index is a broad-based benchmark that measures the investment-grade, U.S. dollar-denominated, fixed-rate taxable bond market, including Treasuries, government-related and corporate securities, mortgage-backed securities (agency fixed-rate and hybrid adjustable-rate mortgage pass-throughs), asset-backed securities, and commercial mortgage-backed securities. You cannot invest directly in an index. |
| 5 | The Bloomberg Barclays Global Aggregate ex-USD Index is an unmanaged index that provides a broad-based measure of the global investment-grade fixed-income markets excluding the U.S. dollar-denominated debt market. You cannot invest directly in an index. |
| 6 | The Bloomberg Barclays Municipal Bond Index is an unmanaged index composed of long-term tax-exempt bonds with a minimum credit rating of Baa. You cannot invest directly in an index. |
| 7 | The ICE BofAML U.S. High Yield Index is a market-capitalization-weighted index of domestic and Yankee high-yield bonds. The index tracks the performance of high-yield securities traded in the U.S. bond market. You cannot invest directly in an index. Copyright 2018. ICE Data Indices, LLC. All rights reserved. |
| | | | | | |
| Letter to shareholders (unaudited) | | Wells Fargo Absolute Return Fund | | | 3 | |
Volatility increased during the third quarter of 2017, but favorable data curbed concerns.
During the third quarter of 2017, investor expectations advanced and fell amid shifting geopolitical tensions, particularly in Asia, and repeated but ultimately unsuccessful efforts to reform health care laws in the U.S. Corporate earnings and consumer confidence improved. Annualized U.S. GDP growth for the quarter was 3.2%. Meanwhile, inflation continued to trail the Fed’s targets.
Economic momentum increased in Europe; the ECB held its rates steady at low levels and continued its quantitative easing bond-buying program with the goal of sparking economic activity. In emerging markets, many countries benefited from stronger currencies versus the U.S. dollar while commodity price increases benefited countries that rely on natural resources for exports.
The fourth quarter of 2017 was characterized by continued optimism in global markets.
U.S. stocks continued to rally during the fourth quarter of 2017, boosted by synchronized expansion in the global economy and favorable company earnings. In October 2017, the Fed began to sell the bonds acquired during a series of quantitative easing programs following the 2008 financial crisis. The Bank of England suggested it could hike interest rates in November, and the pound gained against other currencies. In addition, the Fed increased rates by another 25 basis points (bps; 100 bps equal 1.00%) in December. Stocks received a boost from growing optimism about tax reform legislation.
International markets, particularly emerging markets, continued to show strength, supported by several factors that led some observers to describe conditions as a Goldilocks economic scenario: synchronized global growth, low inflation, and healthy corporate earnings, all supported abroad by a weaker U.S. dollar.
Volatility reemerged during the first four months of 2018 as economic signals were mixed.
The first four months of 2018 began with stock market gains in January. Subsequently, investor optimism was supplanted by several concerns. Trade tensions emerged, particularly between the U.S. and China, as the U.S. threatened to impose tariffs on a broad range of imported products. Increasing interest rates and inflation also caused concern. Long-term interest rates in the U.S. trended higher—rates on the 10-year and 30-year Treasury bonds moved from 2.46% and 2.81%, respectively, at the beginning of the year on January 1, 2018, to 2.95% and 3.11%, respectively, on April 30, 2018.
During February 2018, the U.S. stock market endured a loss of more than 10% before recovering. The Fed increased the federal funds rate by 25 bps in March and the rate of inflation reached the Fed’s 2% target for the first time in a year. In April, the U.S. Bureau of Economic Analysis placed first-quarter U.S. GDP growth at 2.3%. The unemployment rate fell to a 17-year low of 3.9% in April and wage growth data improved.
Internationally, central banks maintained low interest rates and monetary policies that were accommodative of business activity. Industrial production, retail sales, and fixed-asset investment increased in China. During January 2018, purchasing managers’ indices in China, the eurozone, India, and Japan reported data for December that indicated continued growth. Despite positive economic signals and business fundamentals, international stock values fell during February and March 2018, swept up in the selling momentum in U.S. markets before generally moving higher in April.
During February 2018, the U.S. stock market endured a loss of more than 10% before recovering.
| | | | |
| 4 | | Wells Fargo Absolute Return Fund | | Letter to shareholders (unaudited) |
Don’t let short-term uncertainty derail long-term investment goals.
Periods of investment uncertainty can present challenges, but experience has taught us that maintaining long-term investment goals can be an effective way to plan for the future. To help you create a sound strategy based on your personal goals and risk tolerance, Wells Fargo Funds offers more than 100 mutual funds spanning a wide range of asset classes and investment styles. Although diversification cannot guarantee an investment profit or prevent losses, we believe it can be an effective way to manage investment risk and potentially smooth out overall portfolio performance. We encourage investors to know their investments and to understand that appropriate levels of risk-taking may unlock opportunities.
Thank you for choosing to invest with Wells Fargo Funds. We appreciate your confidence in us and remain committed to helping you meet your financial needs.
Sincerely,

Andrew Owen
President
Wells Fargo Funds
For further information about your Fund, contact your investment professional, visit our website at wellsfargofunds.com, or call us directly at 1-800-222-8222.
This page is intentionally left blank.
| | | | |
| 6 | | Wells Fargo Absolute Return Fund | | Performance highlights (unaudited) |
Investment objective
The Fund seeks a positive total return.
Manager
Wells Fargo Funds Management, LLC
Portfolio manager
Ben Inker, CFA®1
Average annual total returns (%) as of April 30, 20182
| | | | | | | | | | | | | | | | | | | | | | | | | | | | | | | | | | |
| | | | | Including sales charge | | | Excluding sales charge | | | Expense ratios3 (%) | |
| | | Inception date | | 1 year | | | 5 year | | | 10 year | | | 1 year | | | 5 year | | | 10 year | | | Gross | | | Net4 | |
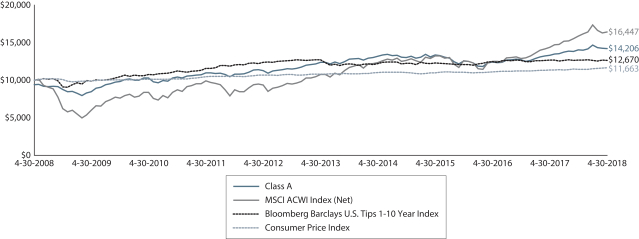
| Class A (WARAX) | | 3-1-2012 | | | 0.37 | | | | 1.53 | | | | 3.57 | | | | 6.45 | | | | 2.73 | | | | 4.19 | | | | 1.55 | | | | 1.55 | |
| Class C (WARCX) | | 3-1-2012 | | | 4.60 | | | | 1.97 | | | | 3.40 | | | | 5.60 | | | | 1.97 | | | | 3.40 | | | | 2.30 | | | | 2.30 | |
| Class R (WARHX) | | 9-30-2015 | | | – | | | | – | | | | – | | | | 6.21 | | | | 2.50 | | | | 4.31 | | | | 1.80 | | | | 1.80 | |
| Class R6 (WARRX) | | 10-31-2014 | | | – | | | | – | | | | – | | | | 6.97 | | | | 3.20 | | | | 4.52 | | | | 1.12 | | | | 1.12 | |
| Administrator Class (WARDX) | | 3-1-2012 | | | – | | | | – | | | | – | | | | 6.62 | | | | 2.87 | | | | 4.34 | | | | 1.47 | | | | 1.44 | |
| Institutional Class (WABIX) | | 11-30-2012 | | | – | | | | – | | | | – | | | | 6.78 | | | | 3.14 | | | | 4.48 | | | | 1.22 | | | | 1.20 | |
| MSCI ACWI Index (Net)5 | | – | | | – | | | | – | | | | – | | | | 14.16 | | | | 8.80 | | | | 5.10 | | | | – | | | | – | |
| Bloomberg Barclays U.S. TIPS 1-10 Year Index6 | | – | | | – | | | | – | | | | – | | | | (0.15 | ) | | | (0.09 | ) | | | 2.39 | | | | – | | | | – | |
| Consumer Price Index7 | | – | | | – | | | | – | | | | – | | | | 2.46 | | | | 1.50 | | | | 1.55 | | | | – | | | | – | |
Figures quoted represent past performance, which is no guarantee of future results, and do not reflect taxes that a shareholder may pay on fund distributions or the redemption of fund shares. Investment return and principal value of an investment will fluctuate so that an investor’s shares, when redeemed, may be worth more or less than their original cost. Performance shown without sales charges would be lower if sales charges were reflected. Current performance may be lower or higher than the performance data quoted, which assumes the reinvestment of dividends and capital gains. Current month-end performance is available on the Fund’s website, wellsfargofunds.com.
Index returns do not include transaction costs associated with buying and selling securities, any mutual fund fees or expenses, or any taxes. It is not possible to invest directly in an index.
For Class A shares, the maximum front-end sales charge is 5.75%. For Class C shares, the maximum contingent deferred sales charge is 1.00%. Performance including a contingent deferred sales charge assumes the sales charge for the corresponding time period. Class R, Class R6, Administrator Class, and Institutional Class shares are sold without a front-end sales charge or contingent deferred sales charge.
Absolute return funds are not intended to outperform stocks and bonds in strong markets, and there is no guarantee of positive returns or that the Fund’s objectives will be achieved. Stock values fluctuate in response to the activities of individual companies and general market and economic conditions. Bond values fluctuate in response to the financial condition of individual issuers, general market and economic conditions, and changes in interest rates. Changes in market conditions and government policies may lead to periods of heightened volatility in the bond market and reduced liquidity for certain bonds held by the Fund. In general, when interest rates rise, bond values fall and investors may lose principal value. Interest-rate changes and their impact on the Fund and its share price can be sudden and unpredictable. Borrowing money to purchase securities or to cover short positions magnifies losses and incurs expenses. Short selling is generally considered speculative, has the potential for unlimited loss, and may involve leverage. Alternative investments, such as commodities and merger arbitrage strategies, are speculative and entail a high degree of risk. Foreign investments are especially volatile and can rise or fall dramatically due to differences in the political and economic conditions of the host country. The Fund will indirectly be exposed to all of the risks of an investment in the underlying funds and will indirectly bear expenses of the underlying funds. The use of derivatives may reduce returns and/or increase volatility. Certain investment strategies tend to increase the total risk of an investment (relative to the broader market). The Fund is exposed to asset-backed securities risk, non-diversification risk, geographic risk, and smaller company securities risk. Consult the Fund’s prospectus for additional information on these and other risks.
Please see footnotes on pages 7-8.
| | | | | | |
| Performance highlights (unaudited) | | Wells Fargo Absolute Return Fund | | | 7 | |
|
| Growth of $10,000 investment as of April 30, 20188 |
|
|
| 1 | The Fund invests substantially all of its investable assets directly in GMO Benchmark-Free Allocation Fund, an investment company advised by Grantham, Mayo, Van Otterloo & Co. LLC (GMO). Mr. Inker, a senior member of GMO’s Asset Allocation Team, has been primarily responsible for coordinating the portfolio management of GMO Benchmark-Free Allocation Fund since 2003. |
| 2 | Historical performance shown for Class A, Class C, and Administrator Class prior to their inception is based on the performance of Class III shares of GMO Benchmark-Free Allocation Fund (GBMFX). The inception date of GMO Benchmark-Free Allocation Fund Class III shares is July 23, 2003. Returns for the Class III shares do not reflect GMO Benchmark-Free Allocation Fund’s current fee arrangement and have been adjusted downward to reflect the higher expense ratios applicable to Class A, Class C, and Administrator Class at their inception. These ratios were 1.66% for Class A, 2.41% for Class C, and 1.50% for Administrator Class. Historical performance shown for the Class R shares prior to their inception reflects the performance of the Administrator Class shares, and is not adjusted to reflect the expenses of Class R shares. If these expenses had been included, returns for Class R shares would be lower. Historical performance shown for Class R6 shares prior to their inception reflects the performance of the Institutional Class shares, and is not adjusted to reflect Class R6 expenses. If these expenses had been included, returns for Class R6 shares would be higher. Historical performance shown for Institutional Class prior to its inception reflects the performance of the Administrator Class, and is not adjusted to reflect Institutional Class expenses. If these expenses had been included, returns for Institutional Class shares would be higher. |
| 3 | Reflects the expense ratios as stated in the most recent prospectuses, which include the impact of 0.79% in acquired fund fees and expenses and underlying GMO fees. The expense ratios shown are subject to change and may differ from the annualized expense ratios shown in the financial highlights of this report, which do not include the expenses of GMO Benchmark-Free Allocation Fund and other acquired fund fees and expenses. |
| 4 | The manager has contractually committed through August 31, 2018, to waive fees and/or reimburse expenses to the extent necessary to cap the Fund’s Total Annual Fund Operating Expenses After Fee Waivers at 0.71% for Class A, 1.46% for Class C, 0.96% for Class R, 0.28% for Class R6, 0.57% for Administrator Class, and 0.33% for Institutional Class. After this time, the cap may be increased or the commitment to maintain the cap may be terminated only with the approval of the Board of Trustees. Brokerage commissions, stamp duty fees, interest, taxes, acquired fund fees and expenses (including the expenses of GMO Benchmark-Free Allocation Fund), and extraordinary expenses are excluded from the expense cap. Without this cap, the Fund’s returns would have been lower. The expense ratio paid by an investor is the net expense ratio (the total annual fund operating expenses after fee waivers) as stated in the prospectuses. |
| 5 | The Morgan Stanley Capital International (MSCI) All Country World Index (ACWI) Index (Net) is a free-float-adjusted market-capitalization-weighted index that is designed to measure the equity market performance of developed and emerging markets. The MSCI ACWI Index (Net) consists of 46 country indexes comprising 23 developed and 23 emerging markets country indexes. The developed markets country indexes included are Australia, Austria, Belgium, Canada, Denmark, Finland, France, Germany, Hong Kong, Ireland, Israel, Italy, Japan, the Netherlands, New Zealand, Norway, Portugal, Singapore, Spain, Sweden, Switzerland, the United Kingdom, and the United States. The emerging markets country indexes included are Brazil, Chile, China, Colombia, Czech Republic, Egypt, Greece, Hungary, India, Indonesia, Korea, Malaysia, Mexico, Peru, the Philippines, Poland, Qatar, Russia, South Africa, Taiwan, Thailand, Turkey, and United Arab Emirates. Source: MSCI. MSCI makes no express or implied warranties or representations and shall have no liability whatsoever with respect to any MSCI data contained herein. The MSCI data may not be further redistributed or used as a basis for other indexes or any securities or financial products. This report is not approved, reviewed, or produced by MSCI. You cannot invest directly in an index. |
| 6 | The Bloomberg Barclays U.S. Treasury Inflation-Protected Securities (TIPS) 1-10 Year Index is an unmanaged index of U.S. Treasury securities with maturities of less than 10 years and more than 1 year. You cannot invest directly in an index. |
| 7 | The Consumer Price Index is a measure of the average change over time in the prices paid by urban consumers for a market basket of consumer goods and services. You cannot invest directly in an index. |
| 8 | The chart compares the performance of Class A shares for the most recent ten years with the performance of the MSCI ACWI Index (Net), Bloomberg Barclays U.S. TIPS 1-10 Year Index, and the Consumer Price Index. The chart assumes a hypothetical investment of $10,000 in Class A shares and reflects all operating expenses and assumes the maximum initial sales charge of 5.75%. |
| 9 | The S&P 500 Index consists of 500 stocks chosen for market size, liquidity, and industry group representation. It is a market-value-weighted index with each stock’s weight in the index proportionate to its market value. You cannot invest directly in an index. |
| 10 | The MSCI ACWI ex USA Index (Net) is a free-float-adjusted market-capitalization-weighted index that is designed to measure the equity market performance of developed markets, excluding the United States and Canada. You cannot invest directly in an index. |
| | | | |
| 8 | | Wells Fargo Absolute Return Fund | | Performance highlights (unaudited) |
| 11 | The MSCI Emerging Markets (EM) Index (Net) is a free-float-adjusted market-capitalization-weighted index that is designed to measure large- and mid-cap equity market performance of emerging markets. The MSCI EM Index (Net) consists of the following 24 emerging market country indices: Brazil, Chile, China, Colombia, Czech Republic, Egypt, Greece, Hungary, India, Indonesia, Korea, Malaysia, Mexico, Pakistan, Peru, the Philippines, Poland, Qatar, Russia, South Africa, Taiwan, Thailand, Turkey, and the United Arab Emirates. You cannot invest directly in an index. |
| 12 | The Bloomberg Barclays U.S. Aggregate Bond Index is a broad-based benchmark that measures the investment-grade, U.S. dollar-denominated, fixed-rate taxable bond market, including Treasuries, government-related and corporate securities, mortgage-backed securities (agency fixed-rate and hybrid adjustable-rate mortgage pass-throughs), asset-backed securities, and commercial mortgage-backed securities. You cannot invest directly in an index. |
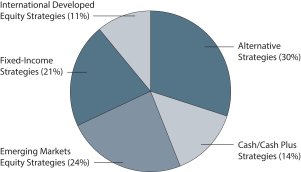
| 13 | The holdings, excluding cash, cash equivalents and any money market funds, are calculated based on the value of the investments of GMO Benchmark-Free Allocation Fund divided by total net assets of the Fund. Holdings are subject to change and may have changed since the date specified. |
| 14 | The MSCI Europe, Australasia, Far East (EAFE) Index is a free-float-adjusted market-capitalization-weighted index that is designed to measure the equity market performance of developed markets, excluding the United States and Canada. The MSCI EAFE Index consists of the following 21 developed markets country indices: Australia, Austria, Belgium, Denmark, Finland, France, Germany, Hong Kong, Ireland, Israel, Italy, Japan, the Netherlands, New Zealand, Norway, Portugal, Singapore, Spain, Sweden, Switzerland, and the United Kingdom. You cannot invest directly in an index. |
| 15 | Portfolio allocation represents the portfolio allocation of the GMO Benchmark-Free Allocation Fund, which is calculated based on the investment exposures of the underlying GMO funds. Portfolio allocation is subject to change and may have changed since the date specified. |
| | | | | | |
| Performance highlights (unaudited) | | Wells Fargo Absolute Return Fund | | | 9 | |
MANAGER’S DISCUSSION
Fund highlights
| ∎ | | The Fund underperformed the MSCI ACWI Index (Net) while delivering a positive return and outperforming the Bloomberg Barclays U.S. TIPS 1–10 Year Index and the Consumer Price Index for the 12-month period that ended April 30, 2018. |
| ∎ | | The Fund’s equity, alternatives, fixed-income, and cash/cash-plus allocations all contributed to performance. Investments in equities in emerging and developed markets outside the U.S. were additive, as were allocations to and security selection among high-quality stocks, which can be defined as companies with high and stable profits and low levels of leverage. |
| ∎ | | Fixed income delivered positive results across all credit strategies, while Treasury Inflation-Protected Securities (TIPS) were a modest detractor. |
All strategies, including equity, fixed income, alternative, and cash/cash-plus, contributed to absolute returns.
Risk assets rallied strongly during the past year. Global equities, represented by the MSCI ACWI Index (Net), rose 14.16%. U.S. stocks recorded a 13.27% return, as measured by the S&P 500 Index,9 which trailed non-U.S. developed markets and emerging markets. The MSCI ACWI ex USA Index (Net)10 rose 15.91%, while emerging markets, as measured by the MSCI EM Index (Net),11 rallied 21.71%.
Equities rose as central banks remained highly accommodative, fundamentals improved globally, and hopes for and the ultimate passage of corporate-friendly tax policy in the U.S. came to fruition. During the past year, the appreciation in equity values was driven once again by expansion of stock price/earnings multiples and some improvements in fundamentals, both of which are at or near peak levels. The recent rise in U.S. interest rates led to mildly negative returns in the fixed-income markets, with the Bloomberg Barclays U.S. Aggregate Bond Index12 falling 0.32%.
Investments in emerging market equities contributed. Developed ex-U.S. stock exposure also contributed as security selection helped the allocation outperform global equities. The contributions of high-quality stocks, though smaller in size, were additive as well due to security selection.
Alternative strategies delivered positive returns—except for the merger arbitrage strategy, which fell—but they failed to keep up with global equities. The special opportunities strategy was particularly helpful as strong security selection led the portfolio with a gain of more than 25%.
Fixed-income exposures performance was a significant win relative to the Bloomberg Barclays U.S. Aggregate Bond Index, which declined. Distressed credit and asset-backed exposures were positive contributors to fund performance. Emerging debt rose as well, but TIPS detracted modestly as underlying Treasury rates rose. Our cash exposure rose 1% during the year, offering a modest return and ballast though trailing inflation.
| | | | |
| Holdings (%) as of April 30, 201813 | |
GMO Implementation Fund | | | 80.84 | |
GMO SGM Major Markets Fund Class VI | | | 7.53 | |
GMO Special Opportunities Fund Class VI | | | 4.77 | |
GMO Opportunistic Income Fund Class VI | | | 4.00 | |
GMO Emerging Country Debt Fund Class IV | | | 2.49 | |
We made a number of portfolio allocation changes as valuations and market conditions changed.
Our equity allocation declined, ending the period at approximately 35% of the portfolio, as we reduced and later re-characterized our remaining quality equity exposure as a long/short position within alternatives. We also modestly decreased our developed ex-U.S. exposure while increasing our emerging exposure. Our alternatives
allocation rose late in the fiscal year when we increased and re-characterized our quality long-equity position into a long quality/short S&P Index 500 exposure and a smaller long MSCI EAFE Index14/short S&P Index 500 position. We also added modestly to our merger arbitrage position within alternatives. The overall exposure to our fixed-income allocation remained constant, though we trimmed emerging debt and some high yield while adding to TIPS. The portfolio’s allocation to cash/cash-plus declined approximately 7% to fund the increase in alternatives.
Please see footnotes on pages 7-8.
| | | | |
| 10 | | Wells Fargo Absolute Return Fund | | Performance highlights (unaudited) |
|
| Portfolio allocation as of April 30, 201815 |
|
 |
Going forward, we see value in international stocks (primarily emerging market value and developed ex-U.S. equities) and select alternative strategies.
We believe that equity markets are priced to deliver below-average returns, even negative in many cases after inflation. Within equity markets, we have a strong preference for international and emerging market exposures over U.S. equities. Within international stocks, we believe that value stocks are priced to potentially deliver a higher return than growth stocks, and emerging market value stocks remain our favored equity asset class. While absolute return potential looks muted, the spread in some of our forecasts may offer the opportunity to generate attractive returns.
Our outlook for U.S. and developed ex-U.S. sovereign debt, as well as TIPS, remains negative to muted, at best. Given the narrowing of credit spreads over the period, our forecasts for and exposure to emerging market debt declined. As the real yields of TIPS varied throughout the year, so, too, did our TIPS exposure, ending modestly up for the period.
Alternative strategies offer a diversifying way to pursue returns with less duration than traditional stocks and bonds and less exposure to expensive equity valuations. We continued to hold significant positions in what we perceive to be safer assets, like U.S. cash and short-duration, high-credit-quality fixed-income positions. This capital enables us to bear risk elsewhere in the portfolio, helps minimize drawdowns, and affords us the option to redeploy capital when risk assets are more attractively priced.
Please see footnotes on pages 7-8.
| | | | | | |
| Fund expenses (unaudited) | | Wells Fargo Absolute Return Fund | | | 11 | |
As a shareholder of the Fund, you incur two types of costs: (1) transaction costs, including sales charges (loads) on purchase payments and contingent deferred sales charges (if any) on redemptions and (2) ongoing costs, including management fees, distribution (12b-1) and/or shareholder servicing fees, and other Fund expenses. This example is intended to help you understand your ongoing costs (in dollars) of investing in the Fund and to compare these costs with the ongoing costs of investing in other mutual funds.
The example is based on an investment of $1,000 invested at the beginning of the six-month period and held for the entire period from November 1, 2017 to April 30, 2018.
Actual expenses
The “Actual” line of the table below provides information about actual account values and actual expenses. You may use the information in this line, together with the amount you invested, to estimate the expenses that you paid over the period. Simply divide your account value by $1,000 (for example, an $8,600 account value divided by $1,000 = 8.6), then multiply the result by the number in the “Actual” line under the heading entitled “Expenses paid during period” for your applicable class of shares to estimate the expenses you paid on your account during this period.
Hypothetical example for comparison purposes
The “Hypothetical” line of the table below provides information about hypothetical account values and hypothetical expenses based on the Fund’s actual expense ratio and an assumed rate of return of 5% per year before expenses, which is not the Fund’s actual return. The hypothetical account values and expenses may not be used to estimate the actual ending account balance or expenses you paid for the period. You may use this information to compare the ongoing costs of investing in the Fund and other funds. To do so, compare this 5% hypothetical example with the 5% hypothetical examples that appear in the shareholder reports of the other funds.
Please note that the expenses shown in the table are meant to highlight your ongoing costs only and do not reflect any transactional costs, such as sales charges (loads) and contingent deferred sales charges. Therefore, the “Hypothetical” line of the table is useful in comparing ongoing costs only and will not help you determine the relative total costs of owning different funds. In addition, if these transactional costs were included, your costs would have been higher.
| | | | | | | | | | | | | | | | |
Wells Fargo Absolute Return Fund (excluding GMO Benchmark-
Free Allocation Fund and underlying fund expenses) | | Beginning
account value
11-1-2017 | | | Ending
account value
4-30-2018 | | | Expenses
paid during
the period¹ | | | Annualized net
expense ratio | |
Class A | | | | | | | | | | | | | | | | |
Actual | | $ | 1,000.00 | | | $ | 1,010.71 | | | $ | 3.36 | | | | 0.67 | % |
Hypothetical (5% return before expenses) | | $ | 1,000.00 | | | $ | 1,021.45 | | | $ | 3.38 | | | | 0.67 | % |
Class C | | | | | | | | | | | | | | | | |
Actual | | $ | 1,000.00 | | | $ | 1,007.02 | | | $ | 7.09 | | | | 1.42 | % |
Hypothetical (5% return before expenses) | | $ | 1,000.00 | | | $ | 1,017.73 | | | $ | 7.12 | | | | 1.42 | % |
Class R | | | | | | | | | | | | | | | | |
Actual | | $ | 1,000.00 | | | $ | 1,009.86 | | | $ | 4.61 | | | | 0.93 | % |
Hypothetical (5% return before expenses) | | $ | 1,000.00 | | | $ | 1,020.21 | | | $ | 4.63 | | | | 0.93 | % |
Class R6 | | | | | | | | | | | | | | | | |
Actual | | $ | 1,000.00 | | | $ | 1,013.07 | | | $ | 1.22 | | | | 0.24 | % |
Hypothetical (5% return before expenses) | | $ | 1,000.00 | | | $ | 1,023.58 | | | $ | 1.22 | | | | 0.24 | % |
Administrator Class | | | | | | | | | | | | | | | | |
Actual | | $ | 1,000.00 | | | $ | 1,011.52 | | | $ | 2.84 | | | | 0.57 | % |
Hypothetical (5% return before expenses) | | $ | 1,000.00 | | | $ | 1,021.97 | | | $ | 2.86 | | | | 0.57 | % |
Institutional Class | | | | | | | | | | | | | | | | |
Actual | | $ | 1,000.00 | | | $ | 1,013.03 | | | $ | 1.65 | | | | 0.33 | % |
Hypothetical (5% return before expenses) | | $ | 1,000.00 | | | $ | 1,023.16 | | | $ | 1.66 | | | | 0.33 | % |
Please see footnote on page 12.
| | | | |
| 12 | | Wells Fargo Absolute Return Fund | | Fund expenses (unaudited) |
| | | | | | | | | | | | | | | | |
Wells Fargo Absolute Return Fund (including GMO Benchmark-
Free Allocation Fund and underlying fund expenses) | | Beginning
account value
11-1-2017 | | | Ending
account value
4-30-2018 | | | Expenses
paid during
the period¹ | | | Annualized net
expense ratio | |
Class A | | | | | | | | | | | | | | | | |
Actual | | $ | 1,000.00 | | | $ | 1,010.71 | | | $ | 7.30 | | | | 1.46 | % |
Hypothetical (5% return before expenses) | | $ | 1,000.00 | | | $ | 1,017.53 | | | $ | 7.32 | | | | 1.46 | % |
Class C | | | | | | | | | | | | | | | | |
Actual | | $ | 1,000.00 | | | $ | 1,007.02 | | | $ | 11.02 | | | | 2.21 | % |
Hypothetical (5% return before expenses) | | $ | 1,000.00 | | | $ | 1,013.81 | | | $ | 11.06 | | | | 2.21 | % |
Class R | | | | | | | | | | | | | | | | |
Actual | | $ | 1,000.00 | | | $ | 1,009.86 | | | $ | 8.55 | | | | 1.72 | % |
Hypothetical (5% return before expenses) | | $ | 1,000.00 | | | $ | 1,016.29 | | | $ | 8.57 | | | | 1.72 | % |
Class R6 | | | | | | | | | | | | | | | | |
Actual | | $ | 1,000.00 | | | $ | 1,013.07 | | | $ | 5.16 | | | | 1.03 | % |
Hypothetical (5% return before expenses) | | $ | 1,000.00 | | | $ | 1,019.67 | | | $ | 5.18 | | | | 1.03 | % |
Administrator Class | | | | | | | | | | | | | | | | |
Actual | | $ | 1,000.00 | | | $ | 1,011.52 | | | $ | 6.78 | | | | 1.36 | % |
Hypothetical (5% return before expenses) | | $ | 1,000.00 | | | $ | 1,018.05 | | | $ | 6.80 | | | | 1.36 | % |
Institutional Class | | | | | | | | | | | | | | | | |
Actual | | $ | 1,000.00 | | | $ | 1,013.03 | | | $ | 5.59 | | | | 1.12 | % |
Hypothetical (5% return before expenses) | | $ | 1,000.00 | | | $ | 1,019.24 | | | $ | 5.61 | | | | 1.12 | % |
| 1 | Expenses paid is equal to the annualized net expense ratio of each class multiplied by the average account value over the period, multiplied by the number of days in the most recent fiscal half-year divided by the number of days in the fiscal year (to reflect the one-half-year period). |
| | | | | | |
| Portfolio of investments—April 30, 2018 | | Wells Fargo Absolute Return Fund | | | 13 | |
| | | | | | | | | | | | | | | | |
| Security name | | | | | | | | Shares | | | Value | |
| | | | |
Investment Companies: 98.91% | | | | | | | | | | | | | | | | |
GMO Benchmark-Free Allocation Fund Class MF (l) | | | | | | | | | | | 201,120,148 | | | $ | 5,534,826,461 | |
| | | | | | | | | | | | | | | | |
| | | | |
Total Investment Companies (Cost $5,019,573,448) | | | | | | | | | | | | | | | 5,534,826,461 | |
| | | | | | | | | | | | | | | | |
| | | | | | | | |
| Total investments (Cost $5,019,573,448) | | | 98.91 | % | | | 5,534,826,461 | |
Other assets and liabilities, net | | | 1.09 | | | | 60,804,619 | |
| | | | | | | | |
| Total net assets | | | 100.00 | % | | $ | 5,595,631,080 | |
| | | | | | | | |
| (l) | The issuer of the security is an affiliated person of the Fund as defined in the Investment Company Act of 1940. |
Investments in Affiliates
An affiliated investment is an investment in which the Fund owns at least 5% of the outstanding voting shares of the issuer or as a result of other relationships, such as the Fund and the issuer having the same investment manager. Transactions with issuers that were either affiliated persons of the Fund at the beginning of the period or the end of the period were as follows:
| | | | | | | | | | | | | | | | | | | | | | | | | | | | | | | | | | | | |
| | | Shares,
beginning of
period | | | Shares
purchased | | | Shares sold | | | Shares,
end of
period | | | Net
realized
gains
(losses) | | | Net change in unrealized
gains
(losses) | | | Dividends
from
affiliated
investment
companies | | | Value,
end
of period | | | % of
net
assets | |
Investment Companies | | | | | | | | | | | | | | | | | | | | | | | | | | | | | | | | | | | | |
GMO Benchmark-Free Allocation Fund Class MF | | | 215,754,180 | | | | 9,398,882 | | | | 24,032,914 | | | | 201,120,148 | | | $ | 16,405,452 | | | $ | 245,367,476 | | | $ | 136,226,196 | | | $ | 5,534,826,461 | | | | 98.91 | % |
The accompanying notes are an integral part of these financial statements.
| | | | |
| 14 | | Wells Fargo Absolute Return Fund | | Statement of assets and liabilities—April 30, 2018 |
| | | | |
| | | | |
| |
Assets | | | | |
Investments in affiliated investment companies, at value (cost $5,019,573,448) | | $ | 5,534,826,461 | |
Cash | | | 50,000,000 | |
Receivable for Fund shares sold | | | 17,602,810 | |
Prepaid expenses and other assets | | | 74,343 | |
| | | | |
Total assets | | | 5,602,503,614 | |
| | | | |
| |
Liabilities | | | | |
Payable for Fund shares redeemed | | | 4,225,616 | |
Management fee payable | | | 920,867 | |
Administration fees payable | | | 671,420 | |
Distribution fees payable | | | 392,946 | |
Trustees’ fees and expenses payable | | | 2,251 | |
Accrued expenses and other liabilities | | | 659,434 | |
| | | | |
Total liabilities | | | 6,872,534 | |
| | | | |
Total net assets | | $ | 5,595,631,080 | |
| | | | |
| |
NET ASSETS CONSIST OF | | | | |
Paid-in capital | | $ | 5,619,050,532 | |
Undistributed net investment income | | | 51,574,245 | |
Accumulated net realized losses on investments | | | (590,246,710 | ) |
Net unrealized gains on investments | | | 515,253,013 | |
| | | | |
Total net assets | | $ | 5,595,631,080 | |
| | | | |
| |
COMPUTATION OF NET ASSET VALUE AND OFFERING PRICE PER SHARE | | | | |
Net assets – Class A | | $ | 516,085,078 | |
Shares outstanding – Class A1 | | | 45,270,277 | |
Net asset value per share – Class A | | | $11.40 | |
Maximum offering price per share – Class A2 | | | $12.10 | |
Net assets – Class C | | $ | 629,812,779 | |
Shares outstanding – Class C1 | | | 56,279,508 | |
Net asset value per share – Class C | | | $11.19 | |
Net assets – Class R | | $ | 368,353 | |
Shares outstanding – Class R1 | | | 32,410 | |
Net asset value per share – Class R | | | $11.37 | |
Net assets – Class R6 | | $ | 46,753,164 | |
Shares outstanding – Class R61 | | | 4,096,920 | |
Net asset value per share – Class R6 | | | $11.41 | |
Net assets – Administrator Class | | $ | 212,965,085 | |
Shares outstanding – Administrator Class1 | | | 18,636,924 | |
Net asset value per share – Administrator Class | | | $11.43 | |
Net assets – Institutional Class | | $ | 4,189,646,621 | |
Shares outstanding – Institutional Class1 | | | 367,232,316 | |
Net asset value per share – Institutional Class | | | $11.41 | |
| 1 | The Fund has an unlimited number of authorized shares. |
| 2 | Maximum offering price is computed as 100/94.25 of net asset value. On investments of $50,000 or more, the offering price is reduced. |
The accompanying notes are an integral part of these financial statements.
| | | | | | |
| Statement of operations—year ended April 30, 2018 | | Wells Fargo Absolute Return Fund | | | 15 | |
| | | | |
| | | | |
| |
Investment income | | | | |
Dividends from affiliated investment companies | | $ | 136,226,196 | |
| | | | |
| |
Expenses | | | | |
Management fee | | | 11,506,213 | |
Administration fees | | | | |
Class A | | | 1,156,799 | |
Class C | | | 1,446,917 | |
Class R | | | 1,262 | |
Class R6 | | | 9,979 | |
Administrator Class | | | 320,665 | |
Institutional Class | | | 5,456,674 | |
Shareholder servicing fees | | | | |
Class A | | | 1,377,142 | |
Class C | | | 1,722,520 | |
Class R | | | 1,502 | |
Administrator Class | | | 616,157 | |
Distribution fees | | | | |
Class C | | | 5,167,561 | |
Class R | | | 1,502 | |
Custody and accounting fees | | | 24,578 | |
Professional fees | | | 50,603 | |
Registration fees | | | 151,136 | |
Shareholder report expenses | | | 588,091 | |
Trustees’ fees and expenses | | | 19,248 | |
Other fees and expenses | | | 125,278 | |
| | | | |
Total expenses | | | 29,743,827 | |
Less: Fee waivers and/or expense reimbursements | | | (824,101 | ) |
| | | | |
Net expenses | | | 28,919,726 | |
| | | | |
Net investment income | | | 107,306,470 | |
| | | | |
| |
REALIZED AND UNREALIZED GAINS (LOSSES) ON INVESTMENTS | | | | |
Net realized gains on investments | �� | | 16,405,452 | |
Net change in unrealized gains (losses) on investments | | | 245,367,476 | |
| | | | |
Net realized and unrealized gains (losses) on investments | | | 261,772,928 | |
| | | | |
Net increase in net assets resulting from operations | | $ | 369,079,398 | |
| | | | |
The accompanying notes are an integral part of these financial statements.
| | | | |
| 16 | | Wells Fargo Absolute Return Fund | | Statement of changes in net assets |
| | | | | | | | | | | | | | | | |
| | | Year ended
April 30, 2018 | | | Year ended
April 30, 2017 | |
| | | | |
Operations | | | | | | | | | | | | | | | | |
Net investment income | | | | | | $ | 107,306,470 | | | | | | | $ | 62,791,349 | |
Net realized gains (losses) on investments | | | | | | | 16,405,452 | | | | | | | | (177,096,650 | ) |
Net change in unrealized gains (losses) on investments | | | | | | | 245,367,476 | | | | | | | | 562,274,089 | |
| | | | |
Net increase in net assets resulting from operations | | | | | | | 369,079,398 | | | | | | | | 447,968,788 | |
| | | | |
| | | |
Distributions to shareholders from | | | | | | | | | | | | |
Net investment income | | | | | | | | | | | | | | | | |
Class A | | | | | | | (9,408,721 | ) | | | | | | | (5,821,922 | ) |
Class C | | | | | | | (6,375,512 | ) | | | | | | | 0 | |
Class R | | | | | | | (4,480 | ) | | | | | | | (7,045 | ) |
Class R6 | | | | | | | (955,835 | ) | | | | | | | (116,905 | ) |
Administrator Class | | | | | | | (4,226,442 | ) | | | | | | | (3,758,342 | ) |
Institutional Class | | | | | | | (90,625,040 | ) | | | | | | | (47,222,699 | ) |
| | | | |
Total distributions to shareholders | | | | | | | (111,596,030 | ) | | | | | | | (56,926,913 | ) |
| | | | |
| | | | |
Capital share transactions | | | Shares | | | | | | | | Shares | | | | | |
Proceeds from shares sold | | | | | | | | | | | | | | | | |
Class A | | | 3,985,939 | | | | 45,281,967 | | | | 5,243,059 | | | | 54,837,320 | |
Class C | | | 3,127,436 | | | | 35,016,593 | | | | 2,598,816 | | | | 26,553,467 | |
Class R | | | 19,303 | | | | 214,620 | | | | 78,735 | | | | 810,279 | |
Class R6 | | | 3,123,629 | | | | 35,699,083 | | | | 613,623 | | | | 6,599,400 | |
Administrator Class | | | 2,555,544 | | | | 29,155,651 | | | | 5,237,782 | | | | 54,707,991 | |
Institutional Class | | | 80,890,157 | | | | 920,815,025 | | | | 174,507,418 | | | | 1,809,018,186 | |
| | | | |
| | | | | | | 1,066,182,939 | | | | | | | | 1,952,526,643 | |
| | | | |
Reinvestment of distributions | | | | | | | | | | | | | | | | |
Class A | | | 732,700 | | | | 8,308,823 | | | | 514,997 | | | | 5,314,766 | |
Class C | | | 500,886 | | | | 5,589,886 | | | | 0 | | | | 0 | |
Class R | | | 16 | | | | 184 | | | | 338 | | | | 3,472 | |
Class R6 | | | 82,831 | | | | 939,299 | | | | 10,385 | | | | 107,169 | |
Administrator Class | | | 364,796 | | | | 4,144,083 | | | | 358,190 | | | | 3,703,682 | |
Institutional Class | | | 6,634,478 | | | | 75,234,979 | | | | 3,787,270 | | | | 39,122,494 | |
| | | | |
| | | | | | | 94,217,254 | | | | | | | | 48,251,583 | |
| | | | |
Payment for shares redeemed | | | | | | | | | | | | | | | | |
Class A | | | (13,273,439 | ) | | | (150,272,256 | ) | | | (67,658,813 | ) | | | (707,084,139 | ) |
Class C | | | (18,920,056 | ) | | | (209,697,879 | ) | | | (51,207,978 | ) | | | (523,929,726 | ) |
Class R | | | (56,798 | ) | | | (639,402 | ) | | | (14,692 | ) | | | (153,428 | ) |
Class R6 | | | (451,000 | ) | | | (5,129,814 | ) | | | (89,036 | ) | | | (949,233 | ) |
Administrator Class | | | (10,603,706 | ) | | | (120,532,571 | ) | | | (116,456,444 | ) | | | (1,196,858,673 | ) |
Institutional Class | | | (95,116,208 | ) | | | (1,082,787,960 | ) | | | (226,863,030 | ) | | | (2,373,841,969 | ) |
| | | | |
| | | | | | | (1,569,059,882 | ) | | | | | | | (4,802,817,168 | ) |
| | | | |
Net decrease in net assets resulting from capital share transactions | | | | | | | (408,659,689 | ) | | | | | | | (2,802,038,942 | ) |
| | | | |
Total decrease in net assets | | | | | | | (151,176,321 | ) | | | | | | | (2,410,997,067 | ) |
| | | | |
| | |
Net assets | | | | | | | | |
Beginning of period | | | | | | | 5,746,807,401 | | | | | | | | 8,157,804,468 | |
| | | | |
End of period | | | | | | $ | 5,595,631,080 | | | | | | | $ | 5,746,807,401 | |
| | | | |
Undistributed net investment income | | | | | | $ | 51,574,245 | | | | | | | $ | 55,863,805 | |
| | | | |
The accompanying notes are an integral part of these financial statements.
| | | | | | |
| Financial highlights | | Wells Fargo Absolute Return Fund | | | 17 | |
(For a share outstanding throughout each period)
| | | | | | | | | | | | | | | | | | | | | | | | |
| | | Year ended April 30 | | | Year ended September 30, 2013 | |
| CLASS A | | 2018 | | | 2017 | | | 2016 | | | 2015 | | | 20141 | | |
Net asset value, beginning of period | | | $10.90 | | | | $10.25 | | | | $11.15 | | | | $11.39 | | | | $10.94 | | | | $10.16 | |
Net investment income | | | 0.19 | 2 | | | 0.08 | 2 | | | 0.11 | | | | 0.14 | 2 | | | 0.10 | | | | 0.08 | |
Net realized and unrealized gains (losses) on investments | | | 0.51 | | | | 0.65 | | | | (0.88 | ) | | | (0.01 | ) | | | 0.51 | | | | 0.73 | |
| | | | | | | | | | | | | | | | | | | | | | | | |
Total from investment operations | | | 0.70 | | | | 0.73 | | | | (0.77 | ) | | | 0.13 | | | | 0.61 | | | | 0.81 | |
Distributions to shareholders from | | | | | | | | | | | | | | | | | | | | | | | | |
Net investment income | | | (0.20 | ) | | | (0.08 | ) | | | (0.01 | ) | | | (0.26 | ) | | | (0.16 | ) | | | (0.03 | ) |
Net realized gains | | | 0.00 | | | | 0.00 | | | | (0.12 | ) | | | (0.11 | ) | | | (0.00 | )3 | | | 0.00 | |
| | | | | | | | | | | | | | | | | | | | | | | | |
Total distributions to shareholders | | | (0.20 | ) | | | (0.08 | ) | | | (0.13 | ) | | | (0.37 | ) | | | (0.16 | ) | | | (0.03 | ) |
Net asset value, end of period | | | $11.40 | | | | $10.90 | | | | $10.25 | | | | $11.15 | | | | $11.39 | | | | $10.94 | |
Total return4 | | | 6.45 | % | | | 7.15 | % | | | (6.82 | )% | | | 1.23 | % | | | 5.66 | % | | | 8.02 | % |
Ratios to average net assets (annualized) | | | | | | | | | | | | | | | | | | | | | | | | |
Gross expenses5 | | | 0.68 | % | | | 0.67 | % | | | 0.68 | % | | | 0.71 | % | | | 0.72 | % | | | 0.73 | % |
Net expenses5 | | | 0.68 | % | | | 0.67 | % | | | 0.68 | % | | | 0.71 | % | | | 0.72 | % | | | 0.73 | % |
Net investment income5 | | | 1.67 | % | | | 0.78 | % | | | 0.87 | % | | | 1.21 | % | | | 1.55 | % | | | 0.92 | % |
Supplemental data | | | | | | | | | | | | | | | | | | | | | | | | |
Portfolio turnover rate | | | 5 | % | | | 2 | % | | | 8 | % | | | 6 | % | | | 0 | % | | | 0 | % |
Net assets, end of period (000s omitted) | | | $516,085 | | | | $586,785 | | | | $1,185,631 | | | | $1,954,792 | | | | $2,277,448 | | | | $1,512,891 | |
| 1 | For the seven months ended April 30, 2014. The Fund changed its fiscal year end from September 30 to April 30, effective April 30, 2014. |
| 2 | Calculated based upon average shares outstanding |
| 3 | Amount is less than $0.005. |
| 4 | Total return calculations do not include any sales charges. Returns for periods of less than one year are not annualized. |
| 5 | Ratios do not reflect net expenses of GMO Benchmark-Free Allocation Fund, Class MF. Including net expenses allocated from GMO Benchmark-Free Allocation Fund, Class MF, the ratios would be increased by the following amounts: |
| | | | |
Year ended April 30, 2018 | | | 0.60 | % |
Year ended April 30, 2017 | | | 0.59 | % |
Year ended April 30, 2016 | | | 0.59 | % |
Year ended April 30, 2015 | | | 0.55 | % |
Year ended April 30, 20141 | | | 0.54 | % |
Year ended September 30, 2013 | | | 0.50 | % |
The accompanying notes are an integral part of these financial statements.
| | | | |
| 18 | | Wells Fargo Absolute Return Fund | | Financial highlights |
(For a share outstanding throughout each period)
| | | | | | | | | | | | | | | | | | | | | | | | |
| | | Year ended April 30 | | | Year ended
September 30, 2013 | |
| CLASS C | | 2018 | | | 2017 | | | 2016 | | | 2015 | | | 20141 | | |
Net asset value, beginning of period | | | $10.70 | | | | $10.05 | | | | $11.01 | | | | $11.27 | | | | $10.82 | | | | $10.11 | |
Net investment income | | | 0.10 | 2 | | | 0.00 | 2 | | | 0.01 | 2 | | | 0.06 | 2 | | | 0.06 | | | | 0.03 | |
Net realized and unrealized gains (losses) on investments | | | 0.50 | | | | 0.65 | | | | (0.85 | ) | | | (0.01 | ) | | | 0.50 | | | | 0.70 | |
| | | | | | | | | | | | | | | | | | | | | | | | |
Total from investment operations | | | 0.60 | | | | 0.65 | | | | (0.84 | ) | | | 0.05 | | | | 0.56 | | | | 0.73 | |
Distributions to shareholders from | | | | | | | | | | | | | | | | | | | | | | | | |
Net investment income | | | (0.11 | ) | | | 0.00 | | | | 0.00 | | | | (0.20 | ) | | | (0.11 | ) | | | (0.02 | ) |
Net realized gains | | | 0.00 | | | | 0.00 | | | | (0.12 | ) | | | (0.11 | ) | | | (0.00 | )3 | | | 0.00 | |
| | | | | | | | | | | | | | | | | | | | | | | | |
Total distributions to shareholders | | | (0.11 | ) | | | 0.00 | | | | (0.12 | ) | | | (0.31 | ) | | | (0.11 | ) | | | (0.02 | ) |
Net asset value, end of period | | | $11.19 | | | | $10.70 | | | | $10.05 | | | | $11.01 | | | | $11.27 | | | | $10.82 | |
Total return4 | | | 5.60 | % | | | 6.47 | % | | | (7.59 | )% | | | 0.47 | % | | | 5.23 | % | | | 7.20 | % |
Ratios to average net assets (annualized) | | | | | | | | | | | | | | | | | | | | | | | | |
Gross expenses5 | | | 1.43 | % | | | 1.42 | % | | | 1.43 | % | | | 1.47 | % | | | 1.47 | % | | | 1.48 | % |
Net expenses5 | | | 1.43 | % | | | 1.42 | % | | | 1.43 | % | | | 1.47 | % | | | 1.47 | % | | | 1.48 | % |
Net investment income5 | | | 0.88 | % | | | 0.04 | % | | | 0.08 | % | | | 0.53 | % | | | 0.78 | % | | | 0.14 | % |
Supplemental data | | | | | | | | | | | | | | | | | | | | | | | | |
Portfolio turnover rate | | | 5 | % | | | 2 | % | | | 8 | % | | | 6 | % | | | 0 | % | | | 0 | % |
Net assets, end of period (000s omitted) | | | $629,813 | | | | $765,561 | | | | $1,207,967 | | | | $1,820,384 | | | | $1,600,482 | | | | $1,042,487 | |
| 1 | For the seven months ended April 30, 2014. The Fund changed its fiscal year end from September 30 to April 30, effective April 30, 2014. |
| 2 | Calculated based upon average shares outstanding |
| 3 | Amount is less than $0.005. |
| 4 | Total return calculations do not include any sales charges. Returns for periods of less than one year are not annualized. |
| 5 | Ratios do not reflect net expenses of GMO Benchmark-Free Allocation Fund, Class MF. Including net expenses allocated from GMO Benchmark-Free Allocation Fund, Class MF, the ratios would be increased by the following amounts: |
| | | | |
Year ended April 30, 2018 | | | 0.60 | % |
Year ended April 30, 2017 | | | 0.59 | % |
Year ended April 30, 2016 | | | 0.59 | % |
Year ended April 30, 2015 | | | 0.55 | % |
Year ended April 30, 20141 | | | 0.54 | % |
Year ended September 30, 2013 | | | 0.50 | % |
The accompanying notes are an integral part of these financial statements.
| | | | | | |
| Financial highlights | | Wells Fargo Absolute Return Fund | | | 19 | |
(For a share outstanding throughout each period)
| | | | | | | | | | | | |
| | | Year ended April 30 | |
| CLASS R | | 2018 | | | 2017 | | | 20161 | |
Net asset value, beginning of period | | | $10.82 | | | | $10.22 | | | | $10.19 | |
Net investment income (loss) | | | 0.12 | | | | 0.13 | | | | (0.05 | )2 |
Net realized and unrealized gains (losses) on investments | | | 0.55 | | | | 0.57 | | | | 0.26 | |
| | | | | | | | | | | | |
Total from investment operations | | | 0.67 | | | | 0.70 | | | | 0.21 | |
Distributions to shareholders from | | | | | | | | | | | | |
Net investment income | | | (0.12 | ) | | | (0.10 | ) | | | (0.06 | ) |
Net realized gains | | | 0.00 | | | | 0.00 | | | | (0.12 | ) |
| | | | | | | | | | | | |
Total distributions to shareholders | | | (0.12 | ) | | | (0.10 | ) | | | (0.18 | ) |
Net asset value, end of period | | | $11.37 | | | | $10.82 | | | | $10.22 | |
Total return3 | | | 6.21 | % | | | 6.91 | % | | | 2.10 | % |
Ratios to average net assets (annualized) | | | | | | | | | | | | |
Gross expenses4 | | | 0.93 | % | | | 0.93 | % | | | 0.93 | % |
Net expenses4 | | | 0.93 | % | | | 0.93 | % | | | 0.93 | % |
Net investment income (loss)4 | | | 0.85 | % | | | 1.40 | % | | | (0.92 | )% |
Supplemental data | | | | | | | | | | | | |
Portfolio turnover rate | | | 5 | % | | | 2 | % | | | 8 | % |
Net assets, end of period (000s omitted) | | | $368 | | | | $756 | | | | $56 | |
| 1 | For the period from September 30, 2015 (commencement of class operations) to April 30, 2016 |
| 2 | Calculated based upon average shares outstanding |
| 3 | Returns for periods of less than one year are not annualized. |
| 4 | Ratios do not reflect net expenses of GMO Benchmark-Free Allocation Fund, Class MF. Including net expenses allocated from GMO Benchmark-Free Allocation Fund, Class MF, the ratios would be increased by the following amounts: |
| | | | |
Year ended April 30, 2018 | | | 0.60 | % |
Year ended April 30, 2017 | | | 0.59 | % |
Year ended April 30, 20161 | | | 0.59 | % |
The accompanying notes are an integral part of these financial statements.
| | | | |
| 20 | | Wells Fargo Absolute Return Fund | | Financial highlights |
(For a share outstanding throughout each period)
| | | | | | | | | | | | | | | | |
| | | Year ended April 30 | |
| CLASS R6 | | 2018 | | | 2017 | | | 2016 | | | 20151 | |
Net asset value, beginning of period | | | $10.91 | | | | $10.26 | | | | $11.18 | | | | $11.32 | |
Net investment income | | | 0.31 | 2 | | | 0.14 | 2 | | | 0.10 | 2 | | | 0.09 | 2 |
Net realized and unrealized gains (losses) on investments | | | 0.45 | | | | 0.64 | | | | (0.82 | ) | | | 0.20 | |
| | | | | | | | | | | | | | | | |
Total from investment operations | | | 0.76 | | | | 0.78 | | | | (0.72 | ) | | | 0.29 | |
Distributions to shareholders from | | | | | | | | | | | | | | | | |
Net investment income | | | (0.26 | ) | | | (0.13 | ) | | | (0.08 | ) | | | (0.32 | ) |
Net realized gains | | | 0.00 | | | | 0.00 | | | | (0.12 | ) | | | (0.11 | ) |
| | | | | | | | | | | | | | | | |
Total distributions to shareholders | | | (0.26 | ) | | | (0.13 | ) | | | (0.20 | ) | | | (0.43 | ) |
Net asset value, end of period | | | $11.41 | | | | $10.91 | | | | $10.26 | | | | $11.18 | |
Total return3 | | | 6.97 | % | | | 7.67 | % | | | (6.42 | )% | | | 2.68 | % |
Ratios to average net assets (annualized) | | | | | | | | | | | | | | | | |
Gross expenses4 | | | 0.25 | % | | | 0.25 | % | | | 0.24 | % | | | 0.24 | % |
Net expenses4 | | | 0.25 | % | | | 0.25 | % | | | 0.24 | % | | | 0.24 | % |
Net investment income4 | | | 2.69 | % | | | 1.37 | % | | | 0.99 | % | | | 1.67 | % |
Supplemental data | | | | | | | | | | | | | | | | |
Portfolio turnover rate | | | 5 | % | | | 2 | % | | | 8 | % | | | 6 | % |
Net assets, end of period (000s omitted) | | | $46,753 | | | | $14,636 | | | | $8,274 | | | | $84 | |
| 1 | For the period from October 31, 2014 (commencement of class operations) to April 30, 2015 |
| 2 | Calculated based upon average shares outstanding |
| 3 | Returns for periods of less than one year are not annualized. |
| 4 | Ratios do not reflect net expenses of GMO Benchmark-Free Allocation Fund, Class MF. Including net expenses allocated from GMO Benchmark-Free Allocation Fund, Class MF, the ratios would be increased by the following amounts: |
| | | | |
Year ended April 30, 2018 | | | 0.60 | % |
Year ended April 30, 2017 | | | 0.59 | % |
Year ended April 30, 2016 | | | 0.59 | % |
Year ended April 30, 20151 | | | 0.55 | % |
The accompanying notes are an integral part of these financial statements.
| | | | | | |
| Financial highlights | | Wells Fargo Absolute Return Fund | | | 21 | |
(For a share outstanding throughout each period)
| | | | | | | | | | | | | | | | | | | | | | | | |
| | | Year ended April 30 | | | Year ended September 30, 2013 | |
| ADMINISTRATOR CLASS | | 2018 | | | 2017 | | | 2016 | | | 2015 | | | 20141 | | |
Net asset value, beginning of period | | | $10.92 | | | | $10.27 | | | | $11.18 | | | | $11.42 | | | | $10.97 | | | | $10.17 | |
Net investment income | | | 0.19 | 2 | | | 0.07 | 2 | | | 0.14 | 2 | | | 0.14 | 2 | | | 0.11 | | | | 0.09 | |
Net realized and unrealized gains (losses) on investments | | | 0.53 | | | | 0.68 | | | | (0.91 | ) | | | 0.01 | | | | 0.51 | | | | 0.75 | |
| | | | | | | | | | | | | | | | | | | | | | | | |
Total from investment operations | | | 0.72 | | | | 0.75 | | | | (0.77 | ) | | | 0.15 | | | | 0.62 | | | | 0.84 | |
Distributions to shareholders from | | | | | | | | | | | | | | | | | | | | | | | | |
Net investment income | | | (0.21 | ) | | | (0.10 | ) | | | (0.02 | ) | | | (0.28 | ) | | | (0.17 | ) | | | (0.04 | ) |
Net realized gains | | | 0.00 | | | | 0.00 | | | | (0.12 | ) | | | (0.11 | ) | | | (0.00 | )3 | | | 0.00 | |
| | | | | | | | | | | | | | | | | | | | | | | | |
Total distributions to shareholders | | | (0.21 | ) | | | (0.10 | ) | | | (0.14 | ) | | | (0.39 | ) | | | (0.17 | ) | | | (0.04 | ) |
Net asset value, end of period | | | $11.43 | | | | $10.92 | | | | $10.27 | | | | $11.18 | | | | $11.42 | | | | $10.97 | |
Total return4 | | | 6.62 | % | | | 7.31 | % | | | (6.85 | )% | | | 1.40 | % | | | 5.74 | % | | | 8.25 | % |
Ratios to average net assets (annualized) | | | | | | | | | | | | | | | | | | | | | | | | |
Gross expenses5 | | | 0.60 | % | | | 0.59 | % | | | 0.58 | % | | | 0.55 | % | | | 0.55 | % | | | 0.55 | % |
Net expenses5 | | | 0.57 | % | | | 0.57 | % | | | 0.57 | % | | | 0.55 | % | | | 0.55 | % | | | 0.55 | % |
Net investment income5 | | | 1.70 | % | | | 0.72 | % | | | 1.31 | % | | | 1.26 | % | | | 1.69 | % | | | 1.03 | % |
Supplemental data | | | | | | | | | | | | | | | | | | | | | | | | |
Portfolio turnover rate | | | 5 | % | | | 2 | % | | | 8 | % | | | 6 | % | | | 0 | % | | | 0 | % |
Net assets, end of period (000s omitted) | | | $212,965 | | | | $287,532 | | | | $1,409,516 | | | | $3,763,871 | | | | $4,223,678 | | | | $2,763,630 | |
| 1 | For the seven months ended April 30, 2014. The Fund changed its fiscal year end from September 30 to April 30, effective April 30, 2014. |
| 2 | Calculated based upon average shares outstanding |
| 3 | Amount is less than $0.005. |
| 4 | Returns for periods of less than one year are not annualized. |
| 5 | Ratios do not reflect net expenses of GMO Benchmark-Free Allocation Fund, Class MF. Including net expenses allocated from GMO Benchmark-Free Allocation Fund, Class MF, the ratios would be increased by the following amounts: |
| | | | |
Year ended April 30, 2018 | | | 0.60 | % |
Year ended April 30, 2017 | | | 0.59 | % |
Year ended April 30, 2016 | | | 0.59 | % |
Year ended April 30, 2015 | | | 0.55 | % |
Year ended April 30, 20141 | | | 0.54 | % |
Year ended September 30, 2013 | | | 0.50 | % |
The accompanying notes are an integral part of these financial statements.
| | | | |
| 22 | | Wells Fargo Absolute Return Fund | | Financial highlights |
(For a share outstanding throughout each period)
| | | | | | | | | | | | | | | | | | | | | | | | |
| | | Year ended April 30 | | | Year ended September 30, 20132 | |
| INSTITUTIONAL CLASS | | 2018 | | | 2017 | | | 2016 | | | 2015 | | | 20141 | | |
Net asset value, beginning of period | | | $10.92 | | | | $10.27 | | | | $11.19 | | | | $11.44 | | | | $10.99 | | | | $10.18 | |
Net investment income | | | 0.24 | | | | 0.14 | | | | 0.11 | 3 | | | 0.23 | 3 | | | 0.12 | | | | 0.14 | 3 |
Net realized and unrealized gains (losses) on investments | | | 0.50 | | | | 0.63 | | | | (0.84 | ) | | | (0.05 | ) | | | 0.52 | | | | 0.71 | |
| | | | | | | | | | | | | | | | | | | | | | | | |
Total from investment operations | | | 0.74 | | | | 0.77 | | | | (0.73 | ) | | | 0.18 | | | | 0.64 | | | | 0.85 | |
Distributions to shareholders from | | | | | | | | | | | | | | | | | | | | | | | | |
Net investment income | | | (0.25 | ) | | | (0.12 | ) | | | (0.07 | ) | | | (0.32 | ) | | | (0.19 | ) | | | (0.04 | ) |
Net realized gains | | | 0.00 | | | | 0.00 | | | | (0.12 | ) | | | (0.11 | ) | | | (0.00 | )4 | | | 0.00 | |
| | | | | | | | | | | | | | | | | | | | | | | | |
Total distributions to shareholders | | | (0.25 | ) | | | (0.12 | ) | | | (0.19 | ) | | | (0.43 | ) | | | (0.19 | ) | | | (0.04 | ) |
Net asset value, end of period | | | $11.41 | | | | $10.92 | | | | $10.27 | | | | $11.19 | | | | $11.44 | | | | $10.99 | |
Total return5 | | | 6.78 | % | | | 7.58 | % | | | (6.51 | )% | | | 1.65 | % | | | 5.93 | % | | | 8.41 | % |
Ratios to average net assets (annualized) | | | | | | | | | | | | | | | | | | | | | | | | |
Gross expenses6 | | | 0.35 | % | | | 0.35 | % | | | 0.33 | % | | | 0.29 | % | | | 0.29 | % | | | 0.30 | % |
Net expenses6 | | | 0.33 | % | | | 0.33 | % | | | 0.32 | % | | | 0.29 | % | | | 0.29 | % | | | 0.30 | % |
Net investment income6 | | | 2.07 | % | | | 1.19 | % | | | 1.05 | % | | | 2.00 | % | | | 1.84 | % | | | 1.56 | % |
Supplemental data | | | | | | | | | | | | | | | | | | | | | | | | |
Portfolio turnover rate | | | 5 | % | | | 2 | % | | | 8 | % | | | 6 | % | | | 0 | % | | | 0 | % |
Net assets, end of period (000s omitted) | | | $4,189,647 | | | | $4,091,536 | | | | $4,346,360 | | | | $4,824,238 | | | | $2,180,627 | | | | $982,490 | |
| 1 | For the seven months ended April 30, 2014. The Fund changed its fiscal year end from September 30 to April 30, effective April 30, 2014. |
| 2 | For the period from November 30, 2012 (commencement of class operations) to September 30, 2013 |
| 3 | Calculated based upon average shares outstanding |
| 4 | Amount is less than $0.005. |
| 5 | Returns for periods of less than one year are not annualized. |
| 6 | Ratios do not reflect net expenses of GMO Benchmark-Free Allocation Fund, Class MF. Including net expenses allocated from GMO Benchmark-Free Allocation Fund, Class MF, the ratios would be increased by the following amounts: |
| | | | |
Year ended April 30, 2018 | | | 0.60 | % |
Year ended April 30, 2017 | | | 0.59 | % |
Year ended April 30, 2016 | | | 0.59 | % |
Year ended April 30, 2015 | | | 0.55 | % |
Year ended April 30, 20141 | | | 0.54 | % |
Year ended September 30, 20132 | | | 0.50 | % |
The accompanying notes are an integral part of these financial statements.
| | | | | | |
| Notes to financial statements | | Wells Fargo Absolute Return Fund | | | 23 | |
1. ORGANIZATION
Wells Fargo Funds Trust (the “Trust”), a Delaware statutory trust organized on March 10, 1999, is an open-end management investment company registered under the Investment Company Act of 1940, as amended (the “1940 Act”). As an investment company, the Trust follows the accounting and reporting guidance in Financial Accounting Standards Board Accounting Standards Codification Topic 946, Financial Services – Investment Companies. These financial statements report on the Wells Fargo Absolute Return Fund (the “Fund”) which is a diversified series of the Trust.
The Fund invests all of its investable assets in the GMO Benchmark-Free Allocation Fund (the “Benchmark-Free Allocation Fund”), an investment company managed by Grantham, Mayo, Van Otterloo & Co. LLC (“GMO”). Benchmark-Free Allocation Fund is a fund-of-funds that gains its investment exposures primarily by investing in GMO Implementation Fund. In addition, Benchmark-Free Allocation Fund may invest in other GMO Funds (together with GMO Implementation Fund, the “underlying funds”), whether currently existing or created in the future. These additional underlying funds may include, among others, GMO Alpha Only Fund, GMO Emerging Country Debt Fund, GMO Opportunistic Income Fund, GMO Special Opportunities Fund, and GMO SGM Major Markets Fund. GMO Implementation Fund is permitted to invest in any asset class. Benchmark-Free Allocation Fund also may invest in securities (including other underlying funds) and derivatives. As of April 30, 2018, the Fund owned 42% of Benchmark-Free Allocation Fund. Because the Fund invests all of its assets in Benchmark-Free Allocation Fund, the shareholders of the Fund bear the fees and expense of Benchmark-Free Allocation Fund, which are not included in the Statement of Operations, but are incurred indirectly because they are considered in the calculation of the net asset value of Benchmark-Free Allocation Fund. As a result, the Fund’s actual expenses may be higher than those of other mutual funds that invest directly in securities.
2. SIGNIFICANT ACCOUNTING POLICIES
The following significant accounting policies, which are consistently followed in the preparation of the financial statements of the Fund, are in conformity with U.S. generally accepted accounting principles which require management to make estimates and assumptions that affect the reported amounts of assets and liabilities, disclosure of contingent assets and liabilities at the date of the financial statements, and the reported amounts of revenues and expenses during the reporting period. Actual results could differ from those estimates.
Securities valuation
All investments are valued each business day as of the close of regular trading on the New York Stock Exchange (generally 4 p.m. Eastern Time), although the Fund may deviate from this calculation time under unusual or unexpected circumstances.
The Fund values its investment in Benchmark-Free Allocation Fund at net asset value. The valuation of investments in securities and the underlying funds held by Benchmark-Free Allocation Fund is discussed in the annual report of Benchmark-Free Allocation Fund, which is included in the mailing of this shareholder report. An unaudited Statement of Assets and Liabilities and an unaudited Schedule of Investments for Benchmark-Free Allocation Fund as of April 30, 2018 have also been included as Appendix II in this report for your reference.
Investment transactions and income recognition
Investment transactions in Benchmark-Free Allocation Fund are recorded on a trade date basis. Realized gains and losses resulting from investment transactions in Benchmark-Free Allocation Fund are determined on the identified cost basis.
Income dividends and capital gain distributions from Benchmark-Free Allocation Fund are recorded on the ex-dividend date. Capital gain distributions from Benchmark-Free Allocation Fund are treated as realized gains.
Distributions to shareholders
Distributions to shareholders from net investment income and net realized gains are recorded on the ex-dividend date and paid at least annually. Such distributions are determined in accordance with income tax regulations and may differ from U.S. generally accepted accounting principles. Dividend sources are estimated at the time of declaration. The tax character of distributions is determined as of the Fund’s fiscal year end. Therefore, a portion of the Fund’s distributions made prior to the Fund’s fiscal year end may be categorized as a tax return of capital at year end.
Federal and other taxes
The Fund intends to continue to qualify as a regulated investment company by distributing substantially all of its investment company taxable income and any net realized capital gains (after reduction for capital loss carryforwards) sufficient to relieve it from all, or substantially all, federal income taxes. Accordingly, no provision for federal income taxes was required.
| | | | |
| 24 | | Wells Fargo Absolute Return Fund | | Notes to financial statements |
The Fund’s income and federal excise tax returns and all financial records supporting those returns for the prior three fiscal years are subject to examination by the federal and Delaware revenue authorities. Management has analyzed the Fund’s tax positions taken on federal, state, and foreign tax returns for all open tax years and does not believe that there are any uncertain tax positions that require recognition of a tax liability.
As of April 30, 2018, the aggregate cost of all investments for federal income tax purposes was $5,126,701,675 and the unrealized gains (losses) consisted of:
| | | | |
Gross unrealized gains | | $ | 515,253,013 | |
Gross unrealized losses | | | (107,128,227 | ) |
Net unrealized gains | | $ | 408,124,786 | |
As of April 30, 2018, the Fund had capital loss carryforwards which consist of $3,791,016 in short-term capital losses and $479,327,467 in long-term capital losses.
Class allocations
The separate classes of shares offered by the Fund differ principally in applicable sales charges, distribution, shareholder servicing, and administration fees. Class specific expenses are charged directly to that share class. Investment income, common expenses, and realized and unrealized gains (losses) on investments are allocated daily to each class of shares based on the relative proportion of net assets of each class.
3. FAIR VALUATION MEASUREMENTS
As of April 30, 2018, the Fund’s investment in Benchmark-Free Allocation Fund was measured at fair value using the net asset value per share as a practical expedient. Benchmark-Free Allocation Fund seeks positive total return, not “relative” return, by investing in asset classes GMO believes offer the most attractive return and risk opportunities. The Fund’s investment in Benchmark-Free Allocation Fund valued at $5,534,826,461 does not have a redemption period notice, can be redeemed daily and does not have any unfunded commitments.
4. TRANSACTIONS WITH AFFILIATES
Management fee
Wells Fargo Funds Management, LLC (“Funds Management”), an indirect wholly owned subsidiary of Wells Fargo & Company (“Wells Fargo”), is the manager of the Fund and provides advisory and fund-level administrative services under an investment management agreement. Under the investment management agreement, Funds Management is responsible for, among other services, implementing the investment objectives and strategies of the Fund, supervising the subadviser, providing fund-level administrative services in connection with the Fund’s operations, and providing any other fund-level administrative services reasonably necessary for the operation of the Fund. As compensation for its services under the investment management agreement, Funds Management is entitled to receive an annual management fee starting at 0.225% and declining to 0.16% as the average daily net assets of the Fund increase. For the year ended April 30, 2018, the management fee was equivalent to an annual rate of 0.20% of the Fund’s average daily net assets.
Administration fees
Under a class-level administration agreement, Funds Management provides class-level administrative services to the Fund, which includes paying fees and expenses for services provided by the transfer agent, sub-transfer agents, omnibus account servicers and record-keepers. As compensation for its services under the class-level administration agreement, Funds Management receives an annual fee which is calculated based on the average daily net assets of each class as follows:
| | | | |
| | | Class-level
administration fee | |
Class A, Class C, Class R | | | 0.21 | % |
Class R6 | | | 0.03 | |
Administrator Class, Institutional Class | | | 0.13 | |
| | | | | | |
| Notes to financial statements | | Wells Fargo Absolute Return Fund | | | 25 | |
Funds Management has contractually waived and/or reimbursed management and administration fees to the extent necessary to maintain certain net operating expense ratios for the Fund. Waiver of fees and/or reimbursement of expenses by Funds Management were made first from fund level expenses on a proportionate basis and then from class specific expenses. Funds Management has committed through August 31, 2018 to waive fees and/or reimburse expenses to the extent necessary to cap the Fund’s expenses (excluding expenses of Benchmark-Free Allocation Fund and acquired fund fees and expenses) at 0.71% for Class A shares, 1.46% for Class C shares, 0.96% for Class R shares, 0.28% for Class R6 shares, 0.57% for Administrator Class shares, and 0.33% for Institutional Class shares. After this time, the cap may be increased or the commitment to maintain the cap may be terminated only with the approval of the Board of Trustees.
Distribution fees
The Trust has adopted a distribution plan for Class C and Class R shares of the Fund pursuant to Rule 12b-1 under the 1940 Act. Distribution fees are charged to Class C and Class R shares and paid to Wells Fargo Funds Distributor, LLC (“Funds Distributor”), the principal underwriter, at an annual rate of 0.75% of the average daily net assets of Class C shares and 0.25% of the average daily net assets of Class R shares.
In addition, Funds Distributor is entitled to receive the front-end sales charge from the purchase of Class A shares and a contingent deferred sales charge on the redemption of certain Class A shares. Funds Distributor is also entitled to receive the contingent deferred sales charges from redemptions of Class C shares. For the year ended April 30, 2018, Funds Distributor received $48,438 from the sale of Class A shares and $1,139 in contingent deferred sales charges from redemptions of Class C shares. No contingent deferred sales charges were incurred by Class A shares for the year ended April 30, 2018.
Shareholder servicing fees
The Trust has entered into contracts with one or more shareholder servicing agents, whereby Class A, Class C, Class R, and Administrator Class of the Fund are charged a fee at an annual rate of 0.25% of the average daily net assets of each respective class.
A portion of these total shareholder servicing fees were paid to affiliates of Wells Fargo.
5. INVESTMENT TRANSACTIONS
For the year ended April 30, 2018, the Fund made aggregate purchases and sales of $257,149,776 and $656,273,629, respectively, in its investment in Benchmark-Free Allocation Fund.
As a result of its investment in Benchmark-Free Allocation Fund, the Fund incurs purchase premium and redemption fees. These purchase premium and redemption fees are paid by the Fund to Benchmark-Free Allocation Fund to help offset estimated portfolio transaction and related costs incurred as a result of a purchase or redemption order by allocating estimated transaction costs to the purchasing or redeeming shareholder. The Fund is currently charged 0.20% for purchases and redemptions which are reflected in paid in capital. GMO reassesses these fees annually.
6. BANK BORROWINGS
The Trust (excluding the money market funds and certain other funds) and Wells Fargo Variable Trust are parties to a $280,000,000 revolving credit agreement whereby the Fund is permitted to use bank borrowings for temporary or emergency purposes, such as to fund shareholder redemption requests. Interest under the credit agreement is charged to the Fund based on a borrowing rate equal to the higher of the Federal Funds rate in effect on that day plus 1.25% or the overnight LIBOR rate in effect on that day plus 1.25%. In addition, an annual commitment fee equal to 0.25% of the unused balance is allocated to each participating fund. Prior to August 29, 2017, the revolving credit agreement amount was $250,000,000.
For the year ended April 30, 2018, there were no borrowings by the Fund under the agreement.
7. DISTRIBUTIONS TO SHAREHOLDERS
The tax character of distributions paid during the years ended April 30, 2018 and April 30, 2017 were as follows:
| | | | | | | | |
| | | Year ended April 30 | |
| | | 2018 | | | 2017 | |
Ordinary income | | $ | 111,596,030 | | | $ | 56,926,913 | |
| | | | |
| 26 | | Wells Fargo Absolute Return Fund | | Notes to financial statements |
As of April 30, 2018, the components of distributable earnings on a tax basis were as follows:
| | | | |
Undistributed
ordinary
income | | Unrealized
gains | | Capital loss
carryforward |
| $51,574,245 | | $408,124,786 | | $(483,118,483) |
8. INDEMNIFICATION
Under the Trust’s organizational documents, the officers and Trustees have been granted certain indemnification rights against certain liabilities that may arise out of performance of their duties to the Trust. Additionally, in the normal course of business, the Trust may enter into contracts with service providers that contain a variety of indemnification clauses. The Trust’s maximum exposure under these arrangements is dependent on future claims that may be made against the Fund and, therefore, cannot be estimated
| | | | | | |
| Report of independent registered public accounting firm | | Wells Fargo Absolute Return Fund | | | 27 | |
BOARD OF TRUSTEES AND SHAREHOLDERS OF WELLS FARGO FUNDS TRUST:
Opinion on the Financial Statements
We have audited the accompanying statements of assets and liabilities of the Wells Fargo Absolute Return Fund (the “Fund”), one of the funds constituting the Wells Fargo Funds Trust, including the portfolio of investments, as of April 30, 2018, and the related statements of operations for the year then ended, the statements of changes in net assets for each of the years in the two-year period then ended, and the related notes (collectively, the “financial statements”) and the financial highlights for each of the years in the four-year period then ended, the period from October 1, 2013 to April 30, 2014 and the year ended September 30, 2013. In our opinion, the financial statements and financial highlights present fairly, in all material respects, the financial position of the Fund as of April 30, 2018, the results of its operations for the year then ended, the changes in its net assets for each of the years in the two-year period then ended and the financial highlights for each of the years or periods noted above, in conformity with U.S. generally accepted accounting principles.
Basis for Opinion
These financial statements and financial highlights are the responsibility of the Fund’s management. Our responsibility is to express an opinion on these financial statements and financial highlights based on our audits. We are a public accounting firm registered with the Public Company Accounting Oversight Board (United States) (“PCAOB”) and are required to be independent with respect to the Fund in accordance with the U.S. federal securities laws and the applicable rules and regulations of the Securities and Exchange Commission and the PCAOB.
We conducted our audits in accordance with the standards of the PCAOB. Those standards require that we plan and perform the audit to obtain reasonable assurance about whether the financial statements and financial highlights are free of material misstatement, whether due to error or fraud. Our audits included performing procedures to assess the risks of material misstatement of the financial statements and financial highlights, whether due to error or fraud, and performing procedures that respond to those risks. Such procedures included examining, on a test basis, evidence regarding the amounts and disclosures in the financial statements and financial highlights. Such procedures also included confirmation of securities owned as of April 30, 2018, by correspondence with the custodian and brokers, or by other appropriate auditing procedures. Our audits also included evaluating the accounting principles used and significant estimates made by management, as well as evaluating the overall presentation of the financial statements and financial highlights. We believe that our audits provide a reasonable basis for our opinion.

We have not been able to determine the specific year that we began serving as the auditor of one or more Wells Fargo Funds investment companies, however we are aware that we have served as the auditor of one or more Wells Fargo Funds investment companies since at least 1955.
Boston, Massachusetts
June 25, 2018
| | | | |
| 28 | | Wells Fargo Absolute Return Fund | | Other information (unaudited) |
TAX INFORMATION
For corporate shareholders, pursuant to Section 854 of the Internal Revenue Code, 15.59% of ordinary income dividends qualify for the corporate dividends-received deduction for the fiscal year ended April 30, 2018.
Pursuant to Section 854 of the Internal Revenue Code, $87,872,494 of income dividends paid during the fiscal year ended April 30, 2018 has been designated as qualified dividend income (QDI).
PROXY VOTING INFORMATION
A description of the policies and procedures that the Fund uses to determine how to vote proxies relating to portfolio securities is available, upon request, by calling 1-800-222-8222, visiting our website at wellsfargofunds.com, or visiting the SEC website at sec.gov. Information regarding how the Fund voted proxies relating to portfolio securities during the most recent 12-month period ended June 30 is available on the Fund’s website at wellsfargofunds.com or by visiting the SEC website at sec.gov.
PORTFOLIO HOLDINGS INFORMATION
The complete portfolio holdings for the Fund are publicly available monthly on the Fund’s website (wellsfargofunds.com), on a one-month delayed basis. In addition, top ten holdings information (excluding derivative positions) for the Fund is publicly available on the Fund’s website on a monthly, seven-day or more delayed basis. The Fund files its complete schedule of portfolio holdings with the SEC for the first and third quarters of each fiscal year on Form N-Q, which is available by visiting the SEC website at sec.gov. In addition, the Fund’s Form N-Q may be reviewed and copied at the SEC’s Public Reference Room in Washington, DC, and at regional offices in New York City, at 233 Broadway, and in Chicago, at 175 West Jackson Boulevard, Suite 900. Information about the Public Reference Room may be obtained by calling 1-800-SEC-0330.
| | | | | | |
| Other information (unaudited) | | Wells Fargo Absolute Return Fund | | | 29 | |
BOARD OF TRUSTEES AND OFFICERS
Each of the Trustees and Officers1 listed in the table below acts in identical capacities for each fund in the Wells Fargo family of funds, which consists of 153 mutual funds comprising the Wells Fargo Funds Trust, Wells Fargo Variable Trust, Wells Fargo Master Trust and four closed-end funds (collectively the “Fund Complex”). This table should be read in conjunction with the Prospectus and the Statement of Additional Information2. The mailing address of each Trustee and Officer is 525 Market Street, 12th Floor, San Francisco, CA 94105. Each Trustee and Officer serves an indefinite term, however, each Trustee serves such term until reaching the mandatory retirement age established by the Trustees.
Independent Trustees
| | | | | | |
Name and
year of birth | | Position held and
length of service* | | Principal occupations during past five years or longer | | Current other
public company or
investment company
directorships |
William R. Ebsworth (Born 1957) | | Trustee, since 2015 | | Retired. From 1984 to 2013, equities analyst, portfolio manager, research director and chief investment officer at Fidelity Management and Research Company in Boston, Tokyo, and Hong Kong, and retired in 2013 as Chief Investment Officer of Fidelity Strategic Advisers, Inc. where he led a team of investment professionals managing client assets. Prior thereto, Board member of Hong Kong Securities Clearing Co., Hong Kong Options Clearing Corp., the Thailand International Fund, Ltd., Fidelity Investments Life Insurance Company, and Empire Fidelity Investments Life Insurance Company. Board member of the Forté Foundation (non-profit organization) and the Vincent Memorial Hospital Endowment (non-profit organization), where he serves on the Investment Committee and as a Chair of the Audit Committee. Mr. Ebsworth is a CFA® charterholder. | | Asset Allocation Trust |
Jane A. Freeman (Born 1953) | | Trustee, since 2015; Chair Liaison, since 2018 | | Retired. From 2012 to 2014 and 1999 to 2008, Chief Financial Officer of Scientific Learning Corporation. From 2008 to 2012, Ms. Freeman provided consulting services related to strategic business projects. Prior to 1999, Portfolio Manager at Rockefeller & Co. and Scudder, Stevens & Clark. Board member of the Harding Loevner Funds from 1996 to 2014, serving as both Lead Independent Director and chair of the Audit Committee. Board member of the Russell Exchange Traded Funds Trust from 2011 to 2012 and the chair of the Audit Committee. Ms. Freeman is a Board Member of Ruth Bancroft Garden (non-profit organization) and the Glimmerglass Festival. She is also an inactive Chartered Financial Analyst. | | Asset Allocation Trust |
Isaiah Harris, Jr. (Born 1952) | | Trustee, since 2009 | | Retired. Chairman of the Board of CIGNA Corporation since 2009, and Director since 2005. From 2003 to 2011, Director of Deluxe Corporation. Prior thereto, President and CEO of BellSouth Advertising and Publishing Corp. from 2005 to 2007, President and CEO of BellSouth Enterprises from 2004 to 2005 and President of BellSouth Consumer Services from 2000 to 2003. Emeritus member of the Iowa State University Foundation Board of Governors. Emeritus Member of the Advisory Board of Iowa State University School of Business. Advisory Board Member, Palm Harbor Academy (charter school). Advisory Board Member, Child Evangelism Fellowship (non-profit). Mr. Harris is a certified public accountant (inactive status). | | CIGNA Corporation; Asset Allocation Trust |
Judith M. Johnson (Born 1949) | | Trustee, since 2008; Audit Committee Chairman, since 2008 | | Retired. Prior thereto, Chief Executive Officer and Chief Investment Officer of Minneapolis Employees Retirement Fund from 1996 to 2008. Ms. Johnson is an attorney, certified public accountant and a certified managerial accountant. | | Asset Allocation Trust |
David F. Larcker (Born 1950) | | Trustee, since 2009 | | James Irvin Miller Professor of Accounting at the Graduate School of Business, Stanford University, Director of the Corporate Governance Research Initiative and Senior Faculty of The Rock Center for Corporate Governance since 2006. From 2005 to 2008, Professor of Accounting at the Graduate School of Business, Stanford University. Prior thereto, Ernst & Young Professor of Accounting at The Wharton School, University of Pennsylvania from 1985 to 2005. | | Asset Allocation Trust |
| | | | |
| 30 | | Wells Fargo Absolute Return Fund | | Other information (unaudited) |
| | | | | | |
Name and
year of birth | | Position held and
length of service* | | Principal occupations during past five years or longer | | Current other
public company or
investment company
directorships |
Olivia S. Mitchell (Born 1953) | | Trustee, since 2006; Governance Committee Chairman, since 2018 | | International Foundation of Employee Benefit Plans Professor, Wharton School of the University of Pennsylvania since 1993. Director of Wharton’s Pension Research Council and Boettner Center on Pensions & Retirement Research, and Research Associate at the National Bureau of Economic Research. Previously, Cornell University Professor from 1978 to 1993. | | Asset Allocation Trust |
Timothy J. Penny (Born 1951) | | Trustee since 1996; Chairman, since 2018; Vice Chairman, from 2017 to 2018 | | President and Chief Executive Officer of Southern Minnesota Initiative Foundation, a non-profit organization, since 2007. Member of the Board of Trustees of NorthStar Education Finance, Inc., a non-profit organization, since 2007. | | Asset Allocation Trust |
James G. Polisson (Born 1959) | | Trustee, since 2018; Advisory Board Member, from 2017 to 2018 | | Retired. Chief Marketing Officer, Source (ETF) UK Services, Ltd, from 2015 to 2017. From 2012 to 2015, Principal of The Polisson Group, LLC, a management consulting, corporate advisory and principal investing company. Chief Executive Officer and Managing Director at Russell Investments, Global Exchange Traded Funds from 2010 to 2012. Managing Director of Barclays Global Investors from 1998 to 2010 and Global Chief Marketing Officer for iShares and Barclays Global Investors from 2000 to 2010. Trustee of the San Francisco Mechanics’ Institute, a non-profit organization, from 2013 to 2015. Board member of the Russell Exchange Traded Fund Trust from 2011 to 2012. Director of Barclays Global Investors Holdings Deutschland GmbH from 2006 to 2009. Mr. Polisson is an attorney and has a retired status with the Massachusetts and District of Columbia Bar Associations. | | Asset Allocation Trust |
Michael S. Scofield (Born 1943) | | Trustee, since 2010 | | Served on the Investment Company Institute’s Board of Governors and Executive Committee from 2008-2011 as well the Governing Council of the Independent Directors Council from 2006-2011 and the Independent Directors Council Executive Committee from 2008-2011. Trustee of the Evergreen Fund complex (and its predecessors) from 1984 to 2010. Chairman of the Evergreen Funds from 2000-2010. Former Trustee of the Mentor Funds. Retired Attorney, Law Offices of Michael S. Scofield. | | Asset Allocation Trust |
Pamela Wheelock (Born 1959) | | Trustee, since 2018; Advisory Board Member, from 2017 to 2018 | | Chief Operating Officer, Twin Cities Habitat for Humanity, since January, 2017. Vice President of University Services, University of Minnesota from 2012 to 2017. Prior thereto, on the Board of Directors, Governance Committee and Finance Committee for the Minnesota Philanthropy Partners (Saint Paul Foundation) from 2012 to 2018, Interim President and Chief Executive Officer of Blue Cross Blue Shield of Minnesota from 2010 to 2011, Chairman of the Board from 2009 to 2011 and Board Director from 2003 to 2015. Vice President, Leadership and Community Engagement, Bush Foundation, Saint Paul, Minnesota (a private foundation) from 2009 to 2011. Executive Vice President and Chief Financial Officer, Minnesota Sports and Entertainment from 2004 to 2009 and Senior Vice President from 2002 to 2004. Commissioner of Finance, State of Minnesota, from 1999 to 2002. Currently the Board Chair of the Minnesota Wild Foundation since 2010. | | Asset Allocation Trust |
| * | Length of service dates reflect the Trustee’s commencement of service with the Trust’s predecessor entities, where applicable. |
| | | | | | |
| Other information (unaudited) | | Wells Fargo Absolute Return Fund | | | 31 | |
Officers
| | | | | | |
Name and
year of birth | | Position held and
length of service | | Principal occupations during past five years or longer | | |
Andrew Owen (Born 1960) | | President, since 2017 | | Executive Vice President of Wells Fargo & Company and Head of Affiliated Managers, Wells Fargo Asset Management, since 2014. In addition, Mr. Owen is currently President, Chief Executive Officer and Director of Wells Fargo Funds Management, LLC since 2017. Prior thereto, Executive Vice President responsible for marketing, investments and product development for Wells Fargo Funds Management, LLC, from 2009 to 2014. | | |
Jeremy DePalma1 (Born 1974) | | Treasurer, since 2012 | | Senior Vice President of Wells Fargo Funds Management, LLC since 2009. Senior Vice President of Evergreen Investment Management Company, LLC from 2008 to 2010 and head of the Fund Reporting and Control Team within Fund Administration from 2005 to 2010. | | |
Alexander Kymn* (Born 1973) | | Secretary, since 2018; Chief Legal Officer, since 2018 | | Senior Company Counsel of Wells Fargo Bank, N.A. since 2018 (previously Senior Counsel from 2007 to 2018). Vice President of Wells Fargo Funds Management, LLC from 2008 to 2014. | | |
Michael H. Whitaker (Born 1967) | | Chief Compliance Officer, since 2016 | | Senior Vice President and Chief Compliance Officer since 2016. Senior Vice President and Chief Compliance Officer for Fidelity Investments from 2007 to 2016. | | |
David Berardi (Born 1975) | | Assistant Treasurer, since 2009 | | Vice President of Wells Fargo Funds Management, LLC since 2009. Vice President of Evergreen Investment Management Company, LLC from 2008 to 2010. Manager of Fund Reporting and Control for Evergreen Investment Management Company, LLC from 2004 to 2010. | | |
| 1 | Jeremy DePalma acts as Treasurer of 76 funds and Assistant Treasurer of 77 funds in the Fund Complex. |
| 2 | The Statement of Additional Information includes additional information about the Trustees and is available, without charge, upon request, by calling 1-800-222-8222 or by visiting the website at wellsfargofunds.com. |
| * | Alexander Kymn became the Secretary and Chief Legal Officer effective April 17, 2018. |
| | | | |
| 32 | | Wells Fargo Absolute Return Fund | | Appendix I (unaudited) |
SALES CHARGE REDUCTIONS AND WAIVERS FOR CERTAIN INTERMEDIARIES
Ameriprise
Effective June 1, 2018, shareholders purchasing Fund shares through an Ameriprise Financial platform or account will be eligible only for the following Class A load waivers (front-end sales charge waivers), which may differ from those disclosed elsewhere in the Fund’s prospectus or Statement of Additional Information.
Front-end Sales Load Waivers on Class A Shares Available at Ameriprise Financial
| | • | | Employer-sponsored retirement plans (e.g., 401(k) plans, 457 plans, employer-sponsored 403(b) plans, profit sharing and money purchase pension plans and defined benefit plans). For purposes of this provision, employer-sponsored retirement plans do not include SEP IRAs, Simple IRAs or SAR-SEPs. | |
| | • | | Shares purchased through an Ameriprise Financial investment advisory program (if an Advisory or similar share class for such investment advisory program is not available) | |
| | • | | Shares purchased by third party investment advisors on behalf of their advisory clients through Ameriprise Financial’s platform (if an Advisory or similar share class for such investment advisory program is not available) | |
| | • | | Shares purchased through reinvestment of distributions and dividend reinvestment when purchasing shares of the same Fund (but not any other fund within the same fund family) | |
| | • | | Shares exchanged from Class C shares of the same fund in the month of or following the 10-year anniversary of the purchase date. To the extent that the Fund’s prospectus elsewhere provides for a waiver with respect to such shares following a shorter holding period, that waiver will apply to exchanges following such shorter period. To the extent that the Fund’s prospectus elsewhere provides for a waiver with respect to exchanges of Class C shares for load-waived shares, that waiver will also apply to such exchanges. | |
| | • | | Employees and registered representatives of Ameriprise Financial or its affiliates and their immediate family members | |
| | • | | Shares purchased by or through qualified accounts (including IRAs, Coverdell Education Savings Accounts, 401(k)s, 403(b) TSCAs subject to ERISA and defined benefit plans) that are held by a covered family member, defined as an Ameriprise financial advisor and/or the advisor’s spouse, advisor’s lineal ascendant (mother, father, grandmother, grandfather, great grandmother, great grandfather), advisor’s lineal descendant (son, step-son, daughter, step-daughter, grandson, granddaughter, great grandson, great granddaughter) or any spouse of a covered family member who is a lineal descendant | |
| | • | | Shares purchased from the proceeds of redemptions within the same fund family, provided (1) the repurchase occurs within 90 days following the redemption, (2) the redemption and purchase occur in the same account, and (3) redeemed shares were subject to a front-end or deferred sales load (i.e. Rights of Reinstatement). Subject to the Fund’s policy regarding frequent purchases and redemptions of Fund shares, you may not be able to repurchase shares for the first 30 days after your redemption. | |
Automatic Exchange of Class C Shares Available at Ameriprise Financial
| | • | | Class C shares will automatically exchange to Class A shares in the month of the 10-year anniversary of the purchase date. | |
Merrill Lynch
Effective April 10, 2017, shareholders purchasing Fund shares through a Merrill Lynch platform or account will be eligible only for the following load waivers (front-end sales charge waivers and contingent deferred, or back-end, sales charge waivers) and discounts, which may differ from those disclosed elsewhere in the Fund’s prospectus or Statement of Additional Information.
Front-end Sales Load Waivers on Class A Shares available at Merrill Lynch
| | • | | Employer-sponsored retirement, deferred compensation and employee benefit plans (including health savings accounts) and trusts used to fund those plans, provided that the shares are not held in a commission-based brokerage account and shares are held for the benefit of the plan | |
| | • | | Shares purchased by or through a 529 Plan | |
| | • | | Shares purchased through a Merrill Lynch affiliated investment advisory program | |
| | | | | | |
| Appendix I (unaudited) | | Wells Fargo Absolute Return Fund | | | 33 | |
| | • | | Shares purchased by third party investment advisors on behalf of their advisory clients through Merrill Lynch’s platform | |
| | • | | Shares of funds purchased through the Merrill Edge Self-Directed platform (if applicable) | |
| | • | | Shares purchased through reinvestment of capital gains distributions and dividend reinvestment when purchasing shares of the same fund (but not any other fund within the fund family) | |
| | • | | Shares exchanged from Class C (i.e. level-load) shares of the same fund in the month of or following the 10-year anniversary of the purchase date | |
| | • | | Employees and registered representatives of Merrill Lynch or its affiliates and their family members, as defined by Merrill Lynch, which may differ from the definition of family member in the Fund’s prospectus. | |
| | • | | Directors or Trustees of the Fund, and employees of the Fund’s investment adviser or any of its affiliates, as described in the Fund’s prospectus | |
| | • | | Shares purchased from the proceeds of redemptions within the same fund family, provided (1) the repurchase occurs within 90 days following the redemption, (2) the redemption and purchase occur in the same account, and (3) redeemed shares were subject to a front-end or deferred sales load (known as Rights of Reinstatement). Subject to the Fund’s policy regarding frequent purchases and redemptions of Fund shares, you may not be able to repurchase shares for the first 30 days after your redemption. | |
CDSC Waivers on A, B and C Shares available at Merrill Lynch
| | • | | Death or disability of the shareholder | |
| | • | | Shares sold as part of a systematic withdrawal plan as described in the Fund’s prospectus | |
| | • | | Return of excess contributions from an IRA Account | |
| | • | | Shares sold as part of a required minimum distribution for IRA and retirement accounts due to the shareholder reaching age 70 1⁄2 | |
| | • | | Shares sold to pay Merrill Lynch fees but only if the transaction is initiated by Merrill Lynch | |
| | • | | Shares acquired through a right of reinstatement | |
| | • | | Shares held in retirement brokerage accounts, that are exchanged for a lower cost share class due to transfer to certain fee based accounts or platforms (applicable to A and C shares only) | |
Front-end load Discounts Available at Merrill Lynch: Breakpoints, Rights of Accumulation & Letters of Intent
| | • | | Breakpoints as described in the Fund’s prospectus | |
| | • | | Rights of Accumulation (ROA) which entitle shareholders to breakpoint discounts will be automatically calculated based on the aggregated holding of fund family assets held by accounts within the purchaser’s household at Merrill Lynch. Eligible fund family assets not held at Merrill Lynch may be included in the ROA calculation only if the shareholder notifies his or her financial advisor about such assets. | |
| | • | | Letters of Intent (LOI) which allow for breakpoint discounts based on anticipated purchases within a fund family, through Merrill Lynch, over a 13-month period of time (if applicable) | |
Morgan Stanley
Effective on or about July 1, 2018, shareholders purchasing Fund shares through a Morgan Stanley Wealth Management transactional brokerage account will be eligible only for the following Class A load waivers (front-end sales charge waivers), which may differ from and be more limited than those disclosed in the Fund’s prospectus or Statement of Additional Information.
Front-end Sales Load Waivers on Class A Shares Available at Morgan Stanley
| | • | | Employer-sponsored retirement plans (e.g., 401(k) plans, 457 plans, employer-sponsored 403(b) plans, profit sharing and money purchase pension plans and defined benefit plans). For purposes of this provision, employer-sponsored retirement plans do not include SEP IRAs, Simple IRAs, SAR-SEPs or Keogh plans. | |
| | • | | Morgan Stanley employee and employee-related accounts according to Morgan Stanley’s account linking rules | |
| | • | | Shares purchased through reinvestment of dividends and capital gains distributions when purchasing shares of the same fund | |
| | • | | Shares purchased through a Morgan Stanley self-directed brokerage account | |
| | | | |
| 34 | | Wells Fargo Absolute Return Fund | | Appendix I (unaudited) |
| | • | | Class C (i.e., level-load) shares that are no longer subject to a contingent deferred sales charge and are exchanged to Class A shares of the same fund pursuant to Morgan Stanley Wealth Management’s share class exchange program. | |
| | • | | Shares purchased from the proceeds of redemptions within the same fund family, provided (i) the repurchase occurs within 90 days following the redemption, (ii) the redemption and purchase occur in the same account, and (iii) redeemed shares were subject to a front-end or deferred sales charge. This waiver is subject to the Fund’s policy regarding frequent purchases and redemption of Fund shares, as discussed under “Account Information—Frequent Purchases and Redemptions of Fund Shares” in the Fund’s prospectus. | |
| | | | | | |
| Appendix II (unaudited) | | | | | 35 | |
GMO Benchmark-Free Allocation Fund
(A Series of GMO Trust)
Schedule of Investments
(showing percentage of total net assets)
April 30, 2018 (Unaudited)
| | | | | | | | | | |
| Shares | | | Description | | Value ($) | |
| | | | | | MUTUAL FUNDS — 99.9% | |
| | |
| | | | | | Affiliated Issuers — 99.9% | |
| | | 11,726,648 | | | GMO Emerging Country Debt Fund, Class IV | | | 331,277,808 | |
| | | 772,061,352 | | | GMO Implementation Fund | | | 10,770,255,862 | |
| | | 20,070,465 | | | GMO Opportunistic Income Fund, Class VI | | | 532,268,739 | |
| | | 30,767,103 | | | GMO SGM Major Markets Fund, Class VI | | | 1,002,699,887 | |
| | | 26,236,986 | | | GMO Special Opportunities Fund, Class VI | | | 635,197,433 | |
| | | | | | | | | | |
| | | |
| | | | | | TOTAL MUTUAL FUNDS (COST $12,473,664,497) | | | 13,271,699,729 | |
| | | | | | | | | | |
| | |
| | | | | | SHORT-TERM INVESTMENTS — 0.1% | |
| | |
| | | | | | Money Market Funds — 0.1% | |
| | | 6,756,880 | | | State Street Institutional Treasury Plus Money Market Fund-Premier Class, 1.61% (a) | | | 6,756,880 | |
| | | | | | | | | | |
| | | |
| | | | | | TOTAL SHORT-TERM INVESTMENTS (COST $6,756,880) | | | 6,756,880 | |
| | | | | | | | | | |
| | | |
| | | | | | TOTAL INVESTMENTS — 100.0%
(Cost $12,480,421,377) | | | 13,278,456,609 | |
| | | | | | Other Assets and Liabilities
(net) — (0.0%) | | | (5,595,126 | ) |
| | | | | | | | | | |
| | | |
| | | | | | TOTAL NET ASSETS — 100.0% | | $ | 13,272,861,483 | |
| | | | | | | | | | |
Notes to Schedule of Investments:
| (a) | The rate disclosed is the 7 day net yield as of April 30, 2018. |
| | | | | | |
| 36 | | Appendix II (unaudited) | | | | |
GMO Benchmark-Free Allocation Fund
(A Series of GMO Trust)
Statement of Assets and Liabilities — April 30, 2018 (Unaudited)
| | | | |
Assets: | |
Investments in affiliated issuers, at value(a) | | $ | 13,271,699,729 | |
Investments in unaffiliated issuers, at value(b) | | | 6,756,880 | |
Receivable for Fund shares sold | | | 2,580,346 | |
Dividends and interest receivable | | | 3,430 | |
Receivable for expenses reimbursed and/or waived by GMO | | | 1,837,448 | |
Miscellaneous receivable | | | 3,754 | |
| | | | |
Total assets | | | 13,282,881,587 | |
| | | | |
Liabilities: | | | | |
Payable for Fund shares repurchased | | | 707,645 | |
Payable to affiliate for: | |
Management fee | | | 7,627,088 | |
Supplemental support fee – Class MF | | | 486,986 | |
Shareholder service fee | | | 909,289 | |
Payable to agents unaffiliated with GMO | | | 2,400 | |
Payable to Trustees and related expenses | | | 47,557 | |
Accrued expenses | | | 239,139 | |
| | | | |
Total liabilities | | | 10,020,104 | |
| | | | |
Net assets | | $ | 13,272,861,483 | |
| | | | |
Net assets consist of: | | | | |
Paid-in capital | | $ | 12,879,727,940 | |
Accumulated undistributed (distributions in excess of) net investment income | | | (17,437,671 | ) |
Accumulated net realized gain (loss) | | | (387,464,018 | ) |
Net unrealized appreciation (depreciation) | | | 798,035,232 | |
| | | | |
| | $ | 13,272,861,483 | |
| | | | |
Net assets attributable to: | | | | |
Class III | | $ | 5,005,941,544 | |
| | | | |
Class IV | | $ | 2,732,917,009 | |
| | | | |
Class MF | | $ | 5,534,002,930 | |
| | | | |
Shares outstanding: | | | | |
Class III | | | 182,063,785 | |
| | | | |
Class IV | | | 99,395,712 | |
| | | | |
Class MF | | | 201,120,148 | |
| | | | |
Net asset value per share: | | | | |
Class III | | $ | 27.50 | |
| | | | |
Class IV | | $ | 27.50 | |
| | | | |
Class MF | | $ | 27.52 | |
| | | | |
(a) Cost of investments – affiliated issuers: | | $ | 12,473,664,497 | |
(b) Cost of investments – unaffiliated issuers: | | $ | 6,756,880 | |

For more information
More information about Wells Fargo Funds is available free upon request. To obtain literature, please write, email, visit the Fund’s website, or call:
Wells Fargo Funds
P.O. Box 8266
Boston, MA 02266-8266
Email: fundservice@wellsfargo.com
Website: wellsfargofunds.com
Individual investors: 1-800-222-8222
Retail investment professionals: 1-888-877-9275
Institutional investment professionals:
1-866-765-0778
This report and the financial statements contained herein are submitted for the general information of the shareholders of the Fund. If this report is used for promotional purposes, distribution of the report must be accompanied or preceded by a current prospectus. Before investing, please consider the investment objectives, risks, charges, and expenses of the investment. For a current prospectus and, if available, a summary prospectus, containing this information, call 1-800-222-8222 or visit the Fund’s website at wellsfargofunds.com. Read the prospectus carefully before you invest or send money.
Wells Fargo Asset Management (WFAM) is a trade name used by the asset management businesses of Wells Fargo & Company. Wells Fargo Funds Management, LLC, a wholly owned subsidiary of Wells Fargo & Company, provides investment advisory and administrative services for Wells Fargo Funds. Other affiliates of Wells Fargo & Company provide subadvisory and other services for the funds. The funds are distributed by Wells Fargo Funds Distributor, LLC, Member FINRA, an affiliate of Wells Fargo & Company. Neither Wells Fargo Funds Distributor nor Wells Fargo Funds Management holds fund shareholder accounts or assets. This material is for general informational and educational purposes only and is NOT intended to provide investment advice or a recommendation of any kind—including a recommendation for any specific investment, strategy, or plan.
NOT FDIC INSURED ◾ NO BANK GUARANTEE ◾ MAY LOSE VALUE
© 2018 Wells Fargo Funds Management, LLC. All rights reserved.
| | |
 | | 311861 06-18 A260/AR260 04-18 |
Annual Report
April 30, 2018

Wells Fargo Asset Allocation Fund


Reduce clutter. Save trees.
Sign up for electronic delivery of prospectuses and shareholder reports at wellsfargo.com/advantagedelivery
Contents
The views expressed and any forward-looking statements are as of April 30, 2018, unless otherwise noted, and are those of the Fund managers and/or Wells Fargo Funds Management, LLC. Discussions of individual securities, or the markets generally, or any Wells Fargo Fund are not intended as individual recommendations. Future events or results may vary significantly from those expressed in any forward-looking statements. The views expressed are subject to change at any time in response to changing circumstances in the market. Wells Fargo Funds Management, LLC and the Fund disclaim any obligation to publicly update or revise any views expressed or forward-looking statements.
NOT FDIC INSURED ◾ NO BANK GUARANTEE ◾ MAY LOSE VALUE
| | | | |
| 2 | | Wells Fargo Asset Allocation Fund | | Letter to shareholders (unaudited) |

Andrew Owen
President
Wells Fargo Funds
Globally, economies strengthened, equity markets advanced, and foreign bonds outperformed fixed-income investments in the U.S.
Dear Shareholder:
We are pleased to offer you this annual report for the Wells Fargo Asset Allocation Fund for the 12-month period that ended April 30, 2018. Globally, economies strengthened, equity markets advanced, and foreign bonds outperformed fixed-income investments in the U.S.
For the 12-month period, U.S. stocks, as measured by the S&P 500 Index,1 gained 13.27% and international stocks, as measured by the MSCI ACWI ex USA Index (Net),2 added 15.91%. Emerging market stocks, as measured by the MSCI EM Index (Net),3 added 21.71%. In bond markets, the Bloomberg Barclays U.S. Aggregate Bond Index4 declined 0.32% while fixed-income investments outside the U.S. gained 7.68%, as measured by the Bloomberg Barclays Global Aggregate ex-USD Index.5 The Bloomberg Barclays Municipal Bond Index6 added 1.56%, and the ICE BofAML U.S. High Yield Index7 was up 3.21%.
Global economic growth benefited equity investments during the second quarter of 2017.
During the second quarter of 2017, U.S. economic data reflected a healthy economy. Gross domestic product (GDP) growth on an annualized basis was 3.1% for the second quarter. Hiring remained strong, and business and consumer sentiment improved.
In June, the U.S. Federal Reserve (Fed) raised the target federal funds interest rate by a quarter percentage point to a range of 0.75% to 1.00%. With the interest rate increase, short-term bond yields rose while longer-term Treasury yields were little changed, leading to positive performance. Investment-grade, high-yield, and municipal bonds benefited from strong demand.
Although economic momentum increased in Europe, the European Central Bank (ECB) held its rates steady at low levels because underlying inflation remained subdued. In emerging markets, many countries benefited from stronger currencies versus the U.S. dollar. The Bank of Japan also continued economic and monetary policies that align with Prime Minister Shinzō Abe’s efforts to encourage business activity and economic growth.
| 1 | The S&P 500 Index consists of 500 stocks chosen for market size, liquidity, and industry group representation. It is a market-value-weighted index with each stock’s weight in the index proportionate to its market value. You cannot invest directly in an index. |
| 2 | The Morgan Stanley Capital International (MSCI) All Country World Index (ACWI) ex USA Index (Net) is a free-float-adjusted market-capitalization-weighted index that is designed to measure the equity market performance of developed markets, excluding the United States and Canada. Source: MSCI. MSCI makes no express or implied warranties or representations and shall have no liability whatsoever with respect to any MSCI data contained herein. The MSCI data may not be further redistributed or used as a basis for other indices or any securities or financial products. This report is not approved, reviewed, or produced by MSCI. You cannot invest directly in an index. |
| 3 | The MSCI Emerging Markets (EM) Index (Net) is a free-float-adjusted market-capitalization-weighted index that is designed to measure large- and mid-cap equity market performance of emerging markets. The MSCI EM Index (Net) consists of the following 24 emerging market country indices: Brazil, Chile, China, Colombia, Czech Republic, Egypt, Greece, Hungary, India, Indonesia, Korea, Malaysia, Mexico, Pakistan, Peru, the Philippines, Poland, Qatar, Russia, South Africa, Taiwan, Thailand, Turkey, and the United Arab Emirates. You cannot invest directly in an index. |
| 4 | The Bloomberg Barclays U.S. Aggregate Bond Index is a broad-based benchmark that measures the investment-grade, U.S. dollar-denominated, fixed-rate taxable bond market, including Treasuries, government-related and corporate securities, mortgage-backed securities (agency fixed-rate and hybrid adjustable-rate mortgage pass-throughs), asset-backed securities, and commercial mortgage-backed securities. You cannot invest directly in an index. |
| 5 | The Bloomberg Barclays Global Aggregate ex-USD Index is an unmanaged index that provides a broad-based measure of the global investment-grade fixed-income markets excluding the U.S. dollar-denominated debt market. You cannot invest directly in an index. |
| 6 | The Bloomberg Barclays Municipal Bond Index is an unmanaged index composed of long-term tax-exempt bonds with a minimum credit rating of Baa. You cannot invest directly in an index. |
| 7 | The ICE BofAML U.S. High Yield Index is a market-capitalization-weighted index of domestic and Yankee high-yield bonds. The index tracks the performance of high-yield securities traded in the U.S. bond market. You cannot invest directly in an index. Copyright 2018. ICE Data Indices, LLC. All rights reserved. |
| | | | | | |
| Letter to shareholders (unaudited) | | Wells Fargo Asset Allocation Fund | | | 3 | |
Volatility increased during the third quarter of 2017, but favorable data curbed concerns.
During the third quarter of 2017, investor expectations advanced and fell amid shifting geopolitical tensions, particularly in Asia, and repeated but ultimately unsuccessful efforts to reform health care laws in the U.S. Corporate earnings and consumer confidence improved. Annualized U.S. GDP growth for the quarter was 3.2%. Meanwhile, inflation continued to trail the Fed’s targets.
Economic momentum increased in Europe; the ECB held its rates steady at low levels and continued its quantitative easing bond-buying program with the goal of sparking economic activity. In emerging markets, many countries benefited from stronger currencies versus the U.S. dollar while commodity price increases benefited countries that rely on natural resources for exports.
The fourth quarter of 2017 was characterized by continued optimism in global markets.
U.S. stocks continued to rally during the fourth quarter of 2017, boosted by synchronized expansion in the global economy and favorable company earnings. In October 2017, the Fed began to sell the bonds acquired during a series of quantitative easing programs following the 2008 financial crisis. The Bank of England suggested it could hike interest rates in November, and the pound gained against other currencies. In addition, the Fed increased rates by another 25 basis points (bps; 100 bps equal 1.00%) in December. Stocks received a boost from growing optimism about tax reform legislation.
International markets, particularly emerging markets, continued to show strength, supported by several factors that led some observers to describe conditions as a Goldilocks economic scenario: synchronized global growth, low inflation, and healthy corporate earnings, all supported abroad by a weaker U.S. dollar.
Volatility reemerged during the first four months of 2018 as economic signals were mixed.
The first four months of 2018 began with stock market gains in January. Subsequently, investor optimism was supplanted by several concerns. Trade tensions emerged, particularly between the U.S. and China, as the U.S. threatened to impose tariffs on a broad range of imported products. Increasing interest rates and inflation also caused concern. Long-term interest rates in the U.S. trended higher—rates on the 10-year and 30-year Treasury bonds moved from 2.46% and 2.81%, respectively, at the beginning of the year on January 1, 2018, to 2.95% and 3.11%, respectively, on April 30, 2018.
During February 2018, the U.S. stock market endured a loss of more than 10% before recovering. The Fed increased the federal funds rate by 25 bps in March and the rate of inflation reached the Fed’s 2% target for the first time in a year. In April, the U.S. Bureau of Economic Analysis placed first-quarter U.S. GDP growth at 2.3%. The unemployment rate fell to a 17-year low of 3.9% in April and wage growth data improved.
Internationally, central banks maintained low interest rates and monetary policies that were accommodative of business activity. Industrial production, retail sales, and fixed-asset investment increased in China. During January 2018, purchasing managers’ indices in China, the eurozone, India, and Japan reported data for December that indicated continued growth. Despite positive economic signals and business fundamentals, international stock values fell during February and March 2018, swept up in the selling momentum in U.S. markets before generally moving higher in April.
During February 2018, the U.S. stock market endured a loss of more than 10% before recovering.
| | | | |
| 4 | | Wells Fargo Asset Allocation Fund | | Letter to shareholders (unaudited) |
Don’t let short-term uncertainty derail long-term investment goals.
Periods of investment uncertainty can present challenges, but experience has taught us that maintaining long-term investment goals can be an effective way to plan for the future. To help you create a sound strategy based on your personal goals and risk tolerance, Wells Fargo Funds offers more than 100 mutual funds spanning a wide range of asset classes and investment styles. Although diversification cannot guarantee an investment profit or prevent losses, we believe it can be an effective way to manage investment risk and potentially smooth out overall portfolio performance. We encourage investors to know their investments and to understand that appropriate levels of risk-taking may unlock opportunities.
Thank you for choosing to invest with Wells Fargo Funds. We appreciate your confidence in us and remain committed to helping you meet your financial needs.
Sincerely,

Andrew Owen
President
Wells Fargo Funds
For further information about your Fund, contact your investment professional, visit our website at wellsfargofunds.com, or call us directly at 1-800-222-8222.
This page is intentionally left blank.
| | | | |
| 6 | | Wells Fargo Asset Allocation Fund | | Performance highlights (unaudited) |
Investment objective
The Fund seeks long-term total return, consisting of capital appreciation and current income.
Manager
Wells Fargo Funds Management, LLC
Subadviser‡
Wells Capital Management Incorporated
Portfolio managers‡
Kandarp R. Acharya, CFA®, FRM
Petros N. Bocray, CFA®, FRM
Christian L. Chan, CFA®
Average annual total returns (%) as of April 30, 20181
| | | | | | | | | | | | | | | | | | | | | | | | | | | | | | | | | | |
| | | | | Including sales charge | | | Excluding sales charge | | | Expense ratios2 (%) | |
| | | Inception date | | 1 year | | | 5 year | | | 10 year | | | 1 year | | | 5 year | | | 10 year | | | Gross | | | Net3 | |
| Class A (EAAFX) | | 7-29-1996 | | | 0.87 | | | | 2.34 | | | | 3.56 | | | | 7.01 | | | | 3.56 | | | | 4.18 | | | | 1.35 | | | | 1.35 | |
| Class C (EACFX) | | 10-3-2002 | | | 5.16 | | | | 2.79 | | | | 3.40 | | | | 6.16 | | | | 2.79 | | | | 3.40 | | | | 2.10 | | | | 2.10 | |
| Class R (EAXFX) | | 10-10-2003 | | | – | | | | – | | | | – | | | | 6.70 | | | | 3.30 | | | | 3.92 | | | | 1.60 | | | | 1.60 | |
| Administrator Class (EAIFX) | | 10-3-2002 | | | – | | | | – | | | | – | | | | 7.10 | | | | 3.74 | | | | 4.40 | | | | 1.27 | | | | 1.19 | |
| Institutional Class (EAAIX) | | 11-30-2012 | | | – | | | | – | | | | – | | | | 7.33 | | | | 3.97 | | | | 4.52 | | | | 1.02 | | | | 0.99 | |
| GMO Global Asset Allocation Index4 | | – | | | – | | | | – | | | | – | | | | 8.98 | | | | 6.31 | | | | 4.90 | | | | – | | | | – | |
| Bloomberg Barclays U.S. Aggregate Bond Index5 | | – | | | – | | | | – | | | | – | | | | (0.32 | ) | | | 1.47 | | | | 3.57 | | | | – | | | | – | |
| MSCI ACWI Index (Net)6 | | – | | | – | | | | – | | | | – | | | | 14.16 | | | | 8.80 | | | | 5.10 | | | | – | | | | – | |
Figures quoted represent past performance, which is no guarantee of future results, and do not reflect taxes that a shareholder may pay on fund distributions or the redemption of fund shares. Investment return and principal value of an investment will fluctuate so that an investor’s shares, when redeemed, may be worth more or less than their original cost. Performance shown without sales charges would be lower if sales charges were reflected. Current performance may be lower or higher than the performance data quoted, which assumes the reinvestment of dividends and capital gains. Current month-end performance is available on the Fund’s website, wellsfargofunds.com.
Index returns do not include transaction costs associated with buying and selling securities, any mutual fund fees or expenses, or any taxes. It is not possible to invest directly in an index.
For Class A shares, the maximum front-end sales charge is 5.75%. For Class C shares, the maximum contingent deferred sales charge is 1.00%. Performance including a contingent deferred sales charge assumes the sales charge for the corresponding time period. Class R, Administrator Class, and Institutional Class shares are sold without a front-end sales charge or contingent deferred sales charge.
Balanced funds may invest in stocks and bonds. Stock values fluctuate in response to the activities of individual companies and general market and economic conditions. Bond values fluctuate in response to the financial condition of individual issuers, general market and economic conditions, and changes in interest rates. Changes in market conditions and government policies may lead to periods of heightened volatility in the bond market and reduced liquidity for certain bonds held by the Fund. In general, when interest rates rise, bond values fall and investors may lose principal value. Interest-rate changes and their impact on the Fund and its share price can be sudden and unpredictable. Alternative investments, such as short sales, are speculative and entail a high degree of risk. Foreign investments are especially volatile and can rise or fall dramatically due to differences in the political and economic conditions of the host country. The Fund will indirectly be exposed to all of the risks of an investment in the underlying funds and will indirectly bear expenses of the underlying funds. The use of derivatives may reduce returns and/or increase volatility. Certain investment strategies tend to increase the total risk of an investment (relative to the broader market). The Fund is exposed to high-yield securities risk, mortgage- and asset backed securities risk, geographic risk, and smaller-company securities risk. Consult the Fund’s prospectus for additional information on these and other risks. The Fund invests substantially all of its assets in Asset Allocation Trust, an open-end management investment company having the same investment objective and strategy as the Fund. Any portfolio data shown for the Fund represents that of the Asset Allocation Trust.
Please see footnotes on page 9.
| | | | | | |
| Performance highlights (unaudited) | | Wells Fargo Asset Allocation Fund | | | 7 | |
|
| Growth of $10,000 investment as of April 30, 20187 |
|
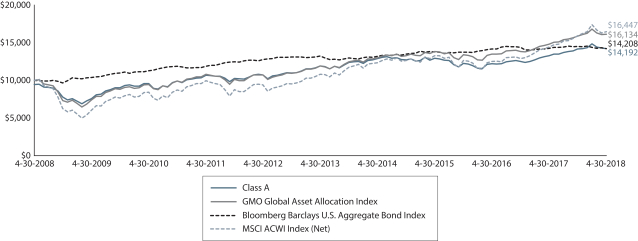 |
Wells Fargo Asset Allocation Fund Changes
The following are changes to the Fund that were approved by the Wells Fargo Funds Board of Trustees and were implemented after close of business June 15, 2018:
| ∎ | | Wells Capital Management Incorporated was named subadvisor, and assumed all portfolio management responsibilities for the Fund. Christian Chan, Kandarp Acharya, and Petros Bocray, experienced managers of multiple asset allocation investment strategies, were named portfolio managers and will be supported by their colleagues on the WFAM Multi-Asset Solutions (MAS) team on portfolio construction and implementation of the Fund’s investment strategy. |
| ∎ | | Changes to the Fund’s investment strategy were implemented to seek to achieve more consistent long-term returns. The Fund will continue to be managed as a globally diversified multi-asset investment strategy and the risk profile will remain similar. |
| ∎ | | The Fund will adopt a new performance benchmark index: the GMO Global Asset Allocation Blended Index which is comprised of 45% Russell 3000 Index®,8 20% MSCI ACWI ex USA Index (Net), and 35% Bloomberg Barclays U.S. Aggregate Bond Index. |
| ∎ | | The Fund’s net operating expense ratios across all classes will be reduced. |
Please see footnotes on page 9.
| | | | |
| 8 | | Wells Fargo Asset Allocation Fund | | Performance highlights (unaudited) |
MANAGER’S DISCUSSION
Notice to shareholders
The following discussion provides an analysis of fund performance and market impacts on fund performance during the period from the Fund’s prior portfolio manager at Grantham, Mayo, Van Otterloo & Co. LLC. For additional information regarding previously, announced changes, please see the section entitled “Wells Fargo Asset Allocation Fund Changes” on page 7.
Fund highlights
| ∎ | | The Fund underperformed the GMO Global Asset Allocation Index and the MSCI ACWI Index (Net) benchmarks and outperformed the Bloomberg Barclays U.S. Aggregate Bond Index for the 12-month period that ended April 30, 2018. |
| ∎ | | Our underweight to equities during a rising market detracted from performance, as did security selection within equities. Cash/cash-plus detracted relative to the GMO benchmark because investors were more willing to assume risk in the equity and fixed-income markets during the year. Security selection among alternative investments detracted from relative performance as alternatives failed to match strong equity returns, while alternative investments contributed to the Fund on an absolute basis. |
| ∎ | | Asset allocation decisions contributed to relative results, due largely to our emerging market equity exposure and underweight to fixed income investments which was beneficial, as the Bloomberg Barclays U.S. Aggregate Bond Index underperformed the GMO Global Asset Allocation Index. Our selection within fixed income was additive with asset-backed securities and emerging markets performing particularly well. |
Equities and alternative strategies delivered strong absolute returns.
Risk assets rallied strongly during the past year. Global equities, represented by the MSCI ACWI (Net), rose 14.2%. U.S. stocks recorded an impressive 13.3% return, as measured by the S&P 500 Index,9 which trailed non-U.S. developed markets and emerging markets. The MSCI ACWI ex USA Index (Net)10 rose 15.9%, while emerging markets, as measured by the MSCI EM Index (Net),11 rallied 21.7%.
| | | | |
| Ten largest holdings (%) as of April 30, 201812 | |
GMO International Equity Fund Class IV | | | 21.01 | |
GMO Emerging Markets Fund Class VI | | | 18.98 | |
GMO Asset Allocation Bond Fund Class VI | | | 16.12 | |
GMO Core Plus Bond Fund Class IV | | | 10.07 | |
GMO Quality Equity Fund Class VI | | | 7.30 | |
GMO U.S. Equity Allocation Fund Class VI | | | 7.22 | |
GMO U.S. Treasury Fund Class IV | | | 5.28 | |
GMO SGM Major Markets Fund Class IV | | | 3.06 | |
GMO Alpha Only Fund Class IV | | | 3.04 | |
GMO Risk Premium Fund Class VI | | | 2.53 | |
Equities rose as central banks remained highly accommodative, fundamentals improved globally, and hopes for and the ultimate passage of corporate-friendly tax policy in the U.S. came to fruition. During the past year, the appreciation in equity values was driven once again by expansion of stock price/earnings multiples and some improvements in fundamentals, both of which are at or near peak levels. The recent rise in U.S. interest rates led to mildly negative returns in the fixed-income markets, with the Bloomberg Barclays U.S. Aggregate Bond Index falling 0.3%.
Alternative strategies delivered positive returns, though they failed to keep up with global equities.
Fixed-income exposures rose modestly, thanks to spread compression that drove asset-backed securities and emerging market debt returns. Our Treasury Inflation-Protected Securities (TIPS) exposure, which evolved through the year as rates vacillated, modestly detracted from absolute returns. While our cash allocation contributed to performance on an absolute basis, it could not keep pace with the returns available in equity markets which contributed to the Fund’s underperformance on a relative basis.
Equity exposure contributed to Fund performance on an absolute basis, outperforming the MSCI ACWI Index (Net) but our underweight detracted from relative performance. Our significant weight in emerging market equities was the key driver, though our value bias hurt relative to the emerging market benchmark. The Fund’s exposures to developed ex-U.S. and high-quality stocks, which can be defined as companies with high and stable profits and low levels of leverage, also contributed, with both outperforming their indices: the MSCI World Index (Net)13 and the S&P 500 Index, respectively.
Please see footnotes on page 9.
| | | | | | |
| Performance highlights (unaudited) | | Wells Fargo Asset Allocation Fund | | | 9 | |
|
| Portfolio allocation as of April 30, 201814 |
|
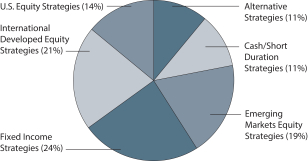
|
We made a number of portfolio allocation changes as valuations and market conditions changed.
Our overall equity allocation rose modestly during the period as we sold U.S. exposures in favor of additional emerging market equity weight. Our alternatives allocation stayed essentially flat. The overall exposure to our fixed-income allocation increased approximately 3%, largely due to an increase in our core-plus bond position and a modest addition to our TIPS position. In the process, we trimmed direct holdings in our asset-backed and emerging market debt strategies given they are held within our core-plus bond portfolio. The portfolio’s cash/cash-plus position decreased.
| ‡ | The subadviser and portfolio managers began management of the Fund effective June 15, 2018. Prior to that date, the Fund invested all of its investable assets directly in Asset Allocation Trust, an investment company advised by Grantham, Mayo, Van Otterloo & Co. LLC. |
| 1 | Historical performance shown for Institutional Class shares prior to their inception reflects the performance of Administrator Class shares, and includes the higher expenses applicable to Administrator Class shares. If these expenses had been included, returns for Institutional Class shares would be higher. Historical performance shown for all classes of the Fund prior to July 19, 2010, is based on the performance of the Fund’s predecessor, Evergreen Asset Allocation Fund. |
| 2 | Reflects the expense ratios as stated in the most recent prospectuses, which include the impact of 0.55% in acquired fund fees and expenses. The expense ratios shown are subject to change and may differ from the annualized expense ratios shown in the financial highlights of this report, which do not include the expenses of Asset Allocation Trust and other acquired fund fees and expenses. |
| 3 | The manager has contractually committed through August 31, 2018, to waive fees and/or reimburse expenses to the extent necessary to cap the Fund’s Total Annual Operating Expenses After Fee Waivers at 0.87% for Class A, 1.62% for Class C, 1.12% for Class R, 0.64% for Administrator Class, and 0.44% for Institutional Class. After this time, the cap may be increased or the commitment to maintain the cap may be terminated only with the approval of the Board of Trustees. Brokerage commissions, stamp duty fees, interest, taxes, acquired fees and expenses (including the expenses of Asset Allocation Trust) (if any), and extraordinary expenses are excluded from the expense cap. Without this cap, the Fund’s returns would have been lower. The expense ratio paid by an investor is the net expense ratio (the total annual fund operating expenses after fee waivers) as stated in the prospectuses. |
| 4 | The GMO Global Asset Allocation Index is a composite benchmark computed by GMO. Since May 1, 2007, the GMO Global Asset Allocation Index has been composed of 65% MSCI ACWI Index (Net) and 35% Barclays U.S. Aggregate Bond Index. Prior to May 1, 2007, it was composed of 48.75% S&P 500 Index, 35% Bloomberg Barclays U.S. Aggregate Bond Index, and 16.25% MSCI ACWI ex USA Index (Net). You cannot invest directly in an index. |
| 5 | The Bloomberg Barclays U.S. Aggregate Bond Index is a broad-based benchmark that measures the investment-grade, U.S. dollar–denominated, fixed rate taxable bond market, including Treasuries, government-related and corporate securities, mortgage-backed securities (agency fixed-rate and hybrid adjustable-rate mortgage pass-throughs), asset-backed securities, and commercial mortgage-backed. You cannot invest directly in an index. |
| 6 | The Morgan Stanley Capital International (MSCI) All Country World Index (ACWI) Index (Net) is a free-float-adjusted market-capitalization-weighted index that is designed to measure the equity market performance of developed and emerging markets. The MSCI ACWI Index (Net) consists of 46 country indexes comprising 23 developed and 23 emerging markets country indexes. The developed markets country indexes included are Australia, Austria, Belgium, Canada, Denmark, Finland, France, Germany, Hong Kong, Ireland, Israel, Italy, Japan, the Netherlands, New Zealand, Norway, Portugal, Singapore, Spain, Sweden, Switzerland, the United Kingdom, and the United States. The emerging markets country indexes included are Brazil, Chile, China, Colombia, Czech Republic, Egypt, Greece, Hungary, India, Indonesia, Korea, Malaysia, Mexico, Peru, the Philippines, Poland, Qatar, Russia, South Africa, Taiwan, Thailand, Turkey, and United Arab Emirates. Source: MSCI. MSCI makes no express or implied warranties or representations and shall have no liability whatsoever with respect to any MSCI data contained herein. The MSCI data may not be further redistributed or used as a basis for other indexes or any securities or financial products. This report is not approved, reviewed, or produced by MSCI. You cannot invest directly in an index. |
| 7 | The chart compares the performance of Class A shares for the most recent ten years with the GMO Global Asset Allocation Index, Bloomberg Barclays U.S. Aggregate Bond Index, and the MSCI ACWI Index (Net). The chart assumes a hypothetical investment of $10,000 in Class A shares and reflects all operating expenses and assumes the maximum initial sales charge of 5.75%. |
| 8 | The Russell 3000® Index measures the performance of the 3,000 largest U.S. companies based on total market capitalization, which represents approximately 98% of the investable U.S. equity market. You cannot invest directly in an index. |
| 9 | The S&P 500 Index consists of 500 stocks chosen for market size, liquidity, and industry group representation. It is a market-value-weighted index with each stock’s weight in the index proportionate to its market value. You cannot invest directly in an index. |
| 10 | The MSCI ACWI ex USA Index (Net) is a free-float-adjusted market-capitalization-weighted index that is designed to measure the equity market performance of developed markets, excluding the United States and Canada. You cannot invest directly in an index. |
| 11 | The MSCI Emerging Markets (EM) Index (Net) is a free-float-adjusted market-capitalization-weighted index that is designed to measure large- and mid-cap equity market performance of emerging markets. The MSCI EM Index (Net) consists of the following 24 emerging markets country indices: Brazil, Chile, China, Colombia, Czech Republic, Egypt, Greece, Hungary, India, Indonesia, Korea, Malaysia, Mexico, Pakistan, Peru, the Philippines, Poland, Qatar, Russia, South Africa, Taiwan, Thailand, Turkey, and the United Arab Emirates. You cannot invest directly in an index. |
| 12 | The ten largest holdings, excluding cash, cash equivalents and any money market funds, are calculated based on the value of the investments divided by total net assets of the Fund. Holdings are subject to change and may have changed since the date specified. |
| 13 | The MSCI World Index (Net) is a free-float-adjusted market-capitalization-weighted index that is designed to measure the equity market performance of developed markets. The MSCI World Index (Net) consists of the following 23 developed market country indices: Australia, Austria, Belgium, Canada, Denmark, Finland, France, Germany, Hong Kong, Ireland, Israel, Italy, Japan, the Netherlands, New Zealand, Norway, Portugal, Singapore, Spain, Sweden, Switzerland, the United Kingdom, and the United States. You cannot invest directly in an index. |
| 14 | Portfolio allocation is based on the investment exposures of the underlying GMO funds. Holdings are subject to change and may have changed since the date specified. |
| | | | |
| 10 | | Wells Fargo Asset Allocation Fund | | Fund expenses (unaudited) |
As a shareholder of the Fund, you incur two types of costs: (1) transaction costs, including sales charges (loads) on purchase payments and contingent deferred sales charges (if any) on redemptions and (2) ongoing costs, including management fees, distribution (12b-1) and/or shareholder servicing fees, and other Fund expenses. This example is intended to help you understand your ongoing costs (in dollars) of investing in the Fund and to compare these costs with the ongoing costs of investing in other mutual funds.
The example is based on an investment of $1,000 invested at the beginning of the six-month period and held for the entire period from November 1, 2017 to April 30, 2018.
Actual expenses
The “Actual” line of the table below provides information about actual account values and actual expenses. You may use the information in this line, together with the amount you invested, to estimate the expenses that you paid over the period. Simply divide your account value by $1,000 (for example, an $8,600 account value divided by $1,000 = 8.6), then multiply the result by the number in the “Actual” line under the heading entitled “Expenses paid during period” for your applicable class of shares to estimate the expenses you paid on your account during this period.
Hypothetical example for comparison purposes
The “Hypothetical” line of the table below provides information about hypothetical account values and hypothetical expenses based on the Fund’s actual expense ratio and an assumed rate of return of 5% per year before expenses, which is not the Fund’s actual return. The hypothetical account values and expenses may not be used to estimate the actual ending account balance or expenses you paid for the period. You may use this information to compare the ongoing costs of investing in the Fund and other funds. To do so, compare this 5% hypothetical example with the 5% hypothetical examples that appear in the shareholder reports of the other funds.
Please note that the expenses shown in the table are meant to highlight your ongoing costs only and do not reflect any transactional costs, such as sales charges (loads) and contingent deferred sales charges. Therefore, the “Hypothetical” line of the table is useful in comparing ongoing costs only and will not help you determine the relative total costs of owning different funds. In addition, if these transactional costs were included, your costs would have been higher.
| | | | | | | | | | | | | | | | |
Wells Fargo Asset Allocation Fund
(excluding Asset Allocation Trust expenses) | | Beginning
account value
11-1-2017 | | | Ending
account value
4-30-2018 | | | Expenses
paid during
the period¹ | | | Annualized net
expense ratio | |
Class A | | | | | | | | | | | | | | | | |
Actual | | $ | 1,000.00 | | | $ | 1,002.42 | | | $ | 4.11 | | | | 0.83 | % |
Hypothetical (5% return before expenses) | | $ | 1,000.00 | | | $ | 1,020.69 | | | $ | 4.15 | | | | 0.83 | % |
Class C | | | | | | | | | | | | | | | | |
Actual | | $ | 1,000.00 | | | $ | 998.71 | | | $ | 7.82 | | | | 1.58 | % |
Hypothetical (5% return before expenses) | | $ | 1,000.00 | | | $ | 1,016.97 | | | $ | 7.89 | | | | 1.58 | % |
Class R | | | | | | | | | | | | | | | | |
Actual | | $ | 1,000.00 | | | $ | 1,000.93 | | | $ | 5.34 | | | | 1.08 | % |
Hypothetical (5% return before expenses) | | $ | 1,000.00 | | | $ | 1,019.46 | | | $ | 5.39 | | | | 1.08 | % |
Administrator Class | | | | | | | | | | | | | | | | |
Actual | | $ | 1,000.00 | | | $ | 1,003.29 | | | $ | 3.18 | | | | 0.64 | % |
Hypothetical (5% return before expenses) | | $ | 1,000.00 | | | $ | 1,021.62 | | | $ | 3.21 | | | | 0.64 | % |
Institutional Class | | | | | | | | | | | | | | | | |
Actual | | $ | 1,000.00 | | | $ | 1,004.17 | | | $ | 2.19 | | | | 0.44 | % |
Hypothetical (5% return before expenses) | | $ | 1,000.00 | | | $ | 1,022.61 | | | $ | 2.21 | | | | 0.44 | % |
Please see footnote on page 11.
| | | | | | |
| Fund expenses (unaudited) | | Wells Fargo Asset Allocation Fund | | | 11 | |
| | | | | | | | | | | | | | | | |
Wells Fargo Asset Allocation Fund
(including Asset Allocation Trust and underlying fund expenses) | | Beginning
account value
11-1-2017 | | | Ending
account value
4-30-2018 | | | Expenses
paid during
the period¹ | | | Annualized net
expense ratio | |
Class A | | | | | | | | | | | | | | | | |
Actual | | $ | 1,000.00 | | | $ | 1,002.42 | | | $ | 7.09 | | | | 1.43 | % |
Hypothetical (5% return before expenses) | | $ | 1,000.00 | | | $ | 1,017.71 | | | $ | 7.15 | | | | 1.43 | % |
Class C | | | | | | | | | | | | | | | | |
Actual | | $ | 1,000.00 | | | $ | 998.71 | | | $ | 10.79 | | | | 2.18 | % |
Hypothetical (5% return before expenses) | | $ | 1,000.00 | | | $ | 1,014.00 | | | $ | 10.87 | | | | 2.18 | % |
Class R | | | | | | | | | | | | | | | | |
Actual | | $ | 1,000.00 | | | $ | 1,000.93 | | | $ | 8.31 | | | | 1.68 | % |
Hypothetical (5% return before expenses) | | $ | 1,000.00 | | | $ | 1,016.48 | | | $ | 8.38 | | | | 1.68 | % |
Administrator Class | | | | | | | | | | | | | | | | |
Actual | | $ | 1,000.00 | | | $ | 1,003.29 | | | $ | 6.16 | | | | 1.24 | % |
Hypothetical (5% return before expenses) | | $ | 1,000.00 | | | $ | 1,018.85 | | | $ | 6.21 | | | | 1.24 | % |
Institutional Class | | | | | | | | | | | | | | | | |
Actual | | $ | 1,000.00 | | | $ | 1,004.17 | | | $ | 5.17 | | | | 1.04 | % |
Hypothetical (5% return before expenses) | | $ | 1,000.00 | | | $ | 1,019.64 | | | $ | 5.21 | | | | 1.04 | % |
| Asset Allocation Trust | | | | | | | | | | | | |
Actual | | $ | 1,000.00 | | | $ | 1,002.40 | | | $ | 0.00 | | | | 0.00 | % |
Hypothetical (5% return before expenses) | | $ | 1,000.00 | | | $ | 1,024.79 | | | $ | 0.00 | | | | 0.00 | % |
| Asset Allocation Trust (including underlying fund expenses) | | | | | | | | | | | | |
Actual | | $ | 1,000.00 | | | $ | 1,002.40 | | | $ | 2.98 | | | | 0.60 | % |
Hypothetical (5% return before expenses) | | $ | 1,000.00 | | | $ | 1,021.82 | | | $ | 3.01 | | | | 0.60 | % |
| 1 | Expenses paid is equal to the annualized net expense ratio of each class multiplied by the average account value over the period, multiplied by the number of days in the most recent fiscal half-year divided by the number of days in the fiscal year (to reflect the one-half-year period). |
| | | | |
| 12 | | Wells Fargo Asset Allocation Fund | | Portfolio of investments—April 30, 2018 |
| | | | | | | | | | | | | | | | |
| Security name | | | | | | | | Shares | | | Value | |
| | | | |
Investment Companies: 100.60% | | | | | | | | | | | | | | | | |
Asset Allocation Trust (l) | | | | | | | | | | | 164,736,608 | | | $ | 2,928,919,673 | |
| | | | | | | | | | | | | | | | |
| |
Total Investment Companies (Cost $1,754,906,090) | | | | 2,928,919,673 | |
| | | | | | | | | | | | | | | | |
| | | | | | | | |
| Total Investments (Cost $1,754,906,090) | | | 100.60 | % | | | 2,928,919,673 | |
Other Assets and Liabilities, Net | | | (0.60 | ) | | | (17,409,237 | ) |
| | | | | | | | |
| Total Net Assets | | | 100.00 | % | | $ | 2,911,510,436 | |
| | | | | | | | |
| (l) | The issuer of the security is an affiliated person of the Fund as defined in the Investment Company Act of 1940. |
Investment in Affiliates
An affiliated investment is an investment in which the Fund owns at least 5% of the outstanding voting shares of the issuer or as a result of other relationships, such as the Fund and the issuer having the same investment manager. Transactions with issuers that were either affiliated persons of the Fund at the beginning of the period or the end of the period were as follows:
| | | | | | | | | | | | | | | | | | | | | | | | | | | | | | | | | | | | |
| | | Shares, beginning of period | | | Shares
purchased | | | Shares sold | | | Shares,
end of
period | | | Net
realized
gains on
investments | | | Net change in
unrealized
gains
(losses) on
investments | | | Investment
income | | | Value, end of period | | | % of
net
assets | |
Investment Companies | | | | | | | | | | | | | | | | | | | | | | | | | | | | | | | | | | | | |
Asset Allocation Trust | | | 208,884,063 | | | | 227,359 | | | | 44,374,814 | | | | 164,736,608 | | | $ | 284,342,013 | | | $ | (27,051,854 | ) | | $ | 0 | | | $ | 2,928,919,673 | | | | 100.60 | % |
The accompanying notes are an integral part of these financial statements.
| | | | | | |
| Statement of assets and liabilities—April 30, 2018 | | Wells Fargo Asset Allocation Fund | | | 13 | |
| | | | |
| | | | |
| |
Assets | | | | |
Investments in affiliated investment companies, at value (cost $1,754,906,090) | | $ | 2,928,919,673 | |
Cash | | | 15,001,930 | |
Receivable for investments sold | | | 5,270,755 | |
Receivable for Fund shares sold | | | 597,666 | |
Prepaid expenses and other assets | | | 62,060 | |
| | | | |
Total assets | | | 2,949,852,084 | |
| | | | |
| |
Liabilities | | | | |
Payable for Fund shares redeemed | | | 35,972,592 | |
Management fee payable | | | 767,059 | |
Distribution fees payable | | | 575,457 | |
Administration fees payable | | | 475,407 | |
Trustees’ fees and expenses payable | | | 54 | |
Accrued expenses and other liabilities | | | 551,079 | |
| | | | |
Total liabilities | | | 38,341,648 | |
| | | | |
Total net assets | | $ | 2,911,510,436 | |
| | | | |
| |
NET ASSETS CONSIST OF | | | | |
Paid-in capital | | $ | 2,696,862,556 | |
Accumulated net investment loss | | | (9,340,106 | ) |
Accumulated net realized losses on investments | | | (950,025,597 | ) |
Net unrealized gains on investments | | | 1,174,013,583 | |
| | | | |
Total net assets | | $ | 2,911,510,436 | |
| | | | |
| |
COMPUTATION OF NET ASSET VALUE AND OFFERING PRICE PER SHARE | | | | |
Net assets – Class A | | $ | 1,348,107,314 | |
Shares outstanding – Class A1 | | | 94,099,943 | |
Net asset value per share – Class A | | | $14.33 | |
Maximum offering price per share – Class A2 | | | $15.20 | |
Net assets – Class C | | $ | 905,335,737 | |
Shares outstanding – Class C1 | | | 65,279,706 | |
Net asset value per share – Class C | | | $13.87 | |
Net assets – Class R | | $ | 15,657,949 | |
Shares outstanding – Class R1 | | | 1,102,622 | |
Net asset value per share – Class R | | | $14.20 | |
Net assets – Administrator Class | | $ | 69,606,501 | |
Shares outstanding – Administrator Class1 | | | 4,802,833 | |
Net asset value per share – Administrator Class | | | $14.49 | |
Net assets – Institutional Class | | $ | 572,802,935 | |
Shares outstanding – Institutional Class1 | | | 39,884,045 | |
Net asset value per share – Institutional Class | | | $14.36 | |
| 1 | The Fund has an unlimited number of authorized shares. |
| 2 | Maximum offering price is computed as 100/94.25 of net asset value. On investments of $50,000 or more, the offering price is reduced. |
The accompanying notes are an integral part of these financial statements.
| | | | |
| 14 | | Wells Fargo Asset Allocation Fund | | Statement of operations—year ended April 30, 2018 |
| | | | |
| | | | |
| |
Investment income | | $ | 0 | |
| | | | |
| |
Expenses | | | | |
Management fee | | | 10,958,391 | |
Administration fees | | | | |
Class A | | | 3,067,865 | |
Class B | | | 860 | 1 |
Class C | | | 2,198,419 | |
Class R | | | 36,311 | |
Administrator Class | | | 105,441 | |
Institutional Class | | | 894,824 | |
Shareholder servicing fees | | | | |
Class A | | | 3,651,992 | |
Class B | | | 1,024 | 1 |
Class C | | | 2,617,165 | |
Class R | | | 42,822 | |
Administrator Class | | | 200,772 | |
Distribution fees | | | | |
Class B | | | 3,073 | 1 |
Class C | | | 7,851,495 | |
Class R | | | 43,228 | |
Custody and accounting fees | | | 108,598 | |
Professional fees | | | 52,639 | |
Registration fees | | | 120,984 | |
Shareholder report expenses | | | 400,584 | |
Trustees’ fees and expenses | | | 15,171 | |
Other fees and expenses | | | 61,447 | |
| | | | |
Total expenses | | | 32,433,105 | |
Less: Fee waivers and/or expense reimbursements | | | (391,664 | ) |
| | | | |
Net expenses | | | 32,041,441 | |
| | | | |
Net investment loss | | | (32,041,441 | ) |
| | | | |
| |
REALIZED AND UNREALIZED GAINS (LOSSES) ON INVESTMENTS | | | | |
Net realized gains on investments | | | 284,342,013 | |
Net change in unrealized gains (losses) on investments | | | (27,051,854 | ) |
| | | | |
Net realized and unrealized gains (losses) on investments | | | 257,290,159 | |
| | | | |
Net increase in net assets resulting from operations | | $ | 225,248,718 | |
| | | | |
| 1 | For the period from May 1, 2017 to July 5, 2017. Effective at the close of business on July 5, 2017, Class B shares were converted to Class A shares and are no longer offered by the Fund. |
The accompanying notes are an integral part of these financial statements.
| | | | | | |
| Statement of changes in net assets | | Wells Fargo Asset Allocation Fund | | | 15 | |
| | | | | | | | | | | | | | | | |
| | | Year ended
April 30, 2018 | | | Year ended
April 30, 2017 | |
| | | |
Operations | | | | | | | | | | | | |
Net investment loss | | | | | | $ | (32,041,441 | ) | | | | | | $ | (37,953,524 | ) |
Net realized gains on investments | | | | | | | 284,342,013 | | | | | | | | 295,012,749 | |
Net change in unrealized gains (losses) on investments | | | | | | | (27,051,854 | ) | | | | | | | 47,001,210 | |
| | | | |
Net increase in net assets resulting from operations | | | | | | | 225,248,718 | | | | | | | | 304,060,435 | |
| | | | |
| | | |
Distributions to shareholders from | | | | | | | | | | | | |
Net investment income | | | | | | | | | | | | | | | | |
Class A | | | | | | | (24,440,974 | ) | | | | | | | (22,298,266 | ) |
Class C | | | | | | | (8,184,877 | ) | | | | | | | (10,080,390 | ) |
Class R | | | | | | | (219,977 | ) | | | | | | | (262,521 | ) |
Administrator Class | | | | | | | (1,446,446 | ) | | | | | | | (1,895,514 | ) |
Institutional Class | | | | | | | (14,348,210 | ) | | | | | | | (13,296,989 | ) |
| | | | |
Total distributions to shareholders | | | | | | | (48,640,484 | ) | | | | | | | (47,833,680 | ) |
| | | | |
| | | | |
Capital share transactions | | | Shares | | | | | | | | Shares | | | | | |
Proceeds from shares sold | | | | | | | | | | | | | | | | |
Class A | | | 11,511,562 | | | | 160,896,028 | | | | 6,460,527 | | | | 84,064,948 | |
Class B | | | 0 | 1 | | | 0 | 1 | | | 886 | | | | 11,258 | |
Class C | | | 978,519 | | | | 13,569,878 | | | | 1,608,519 | | | | 20,136,417 | |
Class R | | | 163,929 | | | | 2,323,571 | | | | 206,005 | | | | 2,655,203 | |
Administrator Class | | | 668,649 | | | | 9,643,917 | | | | 888,805 | | | | 11,689,667 | |
Institutional Class | | | 9,188,062 | | | | 130,720,843 | | | | 12,427,639 | | | | 162,531,374 | |
| | | | |
| | | | | | | 317,154,237 | | | | | | | | 281,088,867 | |
| | | | |
Reinvestment of distributions | | | | | | | | | | | | | | | | |
Class A | | | 1,500,973 | | | | 21,629,017 | | | | 1,618,675 | | | | 20,735,238 | |
Class C | | | 531,325 | | | | 7,433,250 | | | | 638,999 | | | | 7,936,363 | |
Class R | | | 12,304 | | | | 175,949 | | | | 17,166 | | | | 218,012 | |
Administrator Class | | | 91,292 | | | | 1,330,122 | | | | 138,414 | | | | 1,792,458 | |
Institutional Class | | | 764,436 | | | | 11,030,803 | | | | 817,682 | | | | 10,490,863 | |
| | | | |
| | | | | | | 41,599,141 | | | | | | | | 41,172,934 | |
| | | | |
Payment for shares redeemed | | | | | | | | | | | | | | | | |
Class A | | | (22,678,076 | ) | | | (324,082,990 | ) | | | (28,537,791 | ) | | | (371,707,111 | ) |
Class B | | | (434,890 | )1 | | | (6,060,263 | )1 | | | (4,008,052 | ) | | | (52,307,884 | ) |
Class C | | | (29,777,992 | ) | | | (407,067,877 | ) | | | (35,902,965 | ) | | | (451,626,755 | ) |
Class R | | | (574,093 | ) | | | (8,049,337 | ) | | | (640,122 | ) | | | (8,213,299 | ) |
Administrator Class | | | (2,678,274 | ) | | | (38,411,562 | ) | | | (6,554,862 | ) | | | (86,006,274 | ) |
Institutional Class | | | (19,309,825 | ) | | | (277,421,505 | ) | | | (25,813,387 | ) | | | (337,023,250 | ) |
| | | | |
| | | | | | | (1,061,093,534 | ) | | | | | | | (1,306,884,573 | ) |
| | | | |
Net decrease in net assets resulting from capital share transactions | | | | | | | (702,340,156 | ) | | | | | | | (984,622,772 | ) |
| | | | |
Total decrease in net assets | | | | | | | (525,731,922 | ) | | | | | | | (728,396,017 | ) |
| | | | |
| | |
Net assets | | | | | | | | |
Beginning of period | | | | | | | 3,437,242,358 | | | | | | | | 4,165,638,375 | |
| | | | |
End of period | | | | | | $ | 2,911,510,436 | | | | | | | $ | 3,437,242,358 | |
| | | | |
Accumulated net investment loss | | | | | | $ | (9,340,106 | ) | | | | | | $ | (10,820,128 | ) |
| | | | |
| 1 | For the period from May 1, 2017 to July 5, 2017. Effective at the close of business on July 5, 2017, Class B shares were converted to Class A shares and are no longer offered by the Fund. |
The accompanying notes are an integral part of these financial statements.
| | | | |
| 16 | | Wells Fargo Asset Allocation Fund | | Financial highlights |
(For a share outstanding throughout each period)
| | | | | | | | | | | | | | | | | | | | | | | | |
| | | Year ended April 30 | | | Year ended
September 30, 2013 | |
| CLASS A | | 2018 | | | 2017 | | | 2016 | | | 2015 | | | 20141 | | |
Net asset value, beginning of period | | | $13.62 | | | | $12.71 | | | | $14.10 | | | | $14.43 | | | | $13.73 | | | | $12.91 | |
Net investment loss | | | (0.12 | ) | | | (0.09 | ) | | | (0.11 | ) | | | (0.11 | ) | | | (0.07 | ) | | | (0.11 | ) |
Net realized and unrealized gains (losses) on investments | | | 1.08 | | | | 1.20 | | | | (0.72 | ) | | | 0.18 | | | | 1.01 | | | | 1.26 | |
| | | | | | | | | | | | | | | | | | | | | | | | |
Total from investment operations | | | 0.96 | | | | 1.11 | | | | (0.83 | ) | | | 0.07 | | | | 0.94 | | | | 1.15 | |
Distributions to shareholders from | | | | | | | | | | | | | | | | | | | | |
Net investment income | | | (0.25 | ) | | | (0.20 | ) | | | (0.37 | ) | | | (0.40 | ) | | | (0.24 | ) | | | (0.33 | ) |
Net realized gains | | | 0.00 | | | | 0.00 | | | | (0.19 | ) | | | 0.00 | | | | 0.00 | | | | 0.00 | |
| | | | | | | | | | | | | | | | | | | | | | | | |
Total distributions to shareholders | | | (0.25 | ) | | | (0.20 | ) | | | (0.56 | ) | | | (0.40 | ) | | | (0.24 | ) | | | (0.33 | ) |
Net asset value, end of period | | | $14.33 | | | | $13.62 | | | | $12.71 | | | | $14.10 | | | | $14.43 | | | | $13.73 | |
Total return2 | | | 7.01 | % | | | 8.86 | % | | | (5.78 | )% | | | 0.53 | % | | | 6.92 | % | | | 9.12 | % |
Ratios to average net assets (annualized) | | | | | | | | | | | | | | | | | | | | |
Gross expenses3 | | | 0.82 | % | | | 0.80 | % | | | 0.82 | % | | | 0.85 | % | | | 0.85 | % | | | 0.84 | % |
Net expenses3 | | | 0.82 | % | | | 0.80 | % | | | 0.82 | % | | | 0.85 | % | | | 0.85 | % | | | 0.84 | % |
Net investment loss3 | | | (0.82 | )% | | | (0.80 | )% | | | (0.82 | )% | | | (0.85 | )% | | | (0.85 | )% | | | (0.84 | )% |
Supplemental data | | | | | | | | | | | | | | | | | | | | |
Portfolio turnover rate4 | | | 0 | % | | | 0 | % | | | 1 | % | | | 0 | % | | | 1 | % | | | 0 | % |
Net assets, end of period (000s omitted) | | | $1,348,107 | | | | $1,413,776 | | | | $1,578,517 | | | | $2,058,444 | | | | $2,398,503 | | | | $2,332,077 | |
| 1 | For the seven months ended April 30, 2014. The Fund changed its fiscal year end from September 30 to April 30, effective April 30, 2014. |
| 2 | Total return calculations do not include any sales charges. Returns for periods of less than one year are not annualized. |
| 3 | Ratios do not include any expenses from Asset Allocation Trust or its investments in underlying funds. Asset Allocation Trust does not have any net expenses. |
| 4 | Portfolio turnover rate represents the purchase and sales of the Fund’s investment in Asset Allocation Trust and not the underlying investment transactions of Asset Allocation Trust. |
The accompanying notes are an integral part of these financial statements.
| | | | | | |
| Financial highlights | | Wells Fargo Asset Allocation Fund | | | 17 | |
(For a share outstanding throughout each period)
| | | | | | | | | | | | | | | | | | | | | | | | |
| | | Year ended April 30 | | | Year ended
September 30, 2013 | |
| CLASS C | | 2018 | | | 2017 | | | 2016 | | | 2015 | | | 20141 | | |
Net asset value, beginning of period | | | $13.17 | | | | $12.28 | | | | $13.61 | | | | $13.92 | | | | $13.20 | | | | $12.40 | |
Net investment loss | | | (0.22 | )2 | | | (0.19 | )2 | | | (0.20 | )2 | | | (0.22 | )2 | | | (0.14 | ) | | | (0.20 | )2 |
Net realized and unrealized gains (losses) on investments | | | 1.03 | | | | 1.18 | | | | (0.69 | ) | | | 0.18 | | | | 0.99 | | | | 1.22 | |
| | | | | | | | | | | | | | | | | | | | | | | | |
Total from investment operations | | | 0.81 | | | | 0.99 | | | | (0.89 | ) | | | (0.04 | ) | | | 0.85 | | | | 1.02 | |
Distributions to shareholders from | | | | | | | | | | | | | | | | | | | | |
Net investment income | | | (0.11 | ) | | | (0.10 | ) | | | (0.25 | ) | | | (0.27 | ) | | | (0.13 | ) | | | (0.22 | ) |
Net realized gains | | | 0.00 | | | | 0.00 | | | | (0.19 | ) | | | 0.00 | | | | 0.00 | | | | 0.00 | |
| | | | | | | | | | | | | | | | | | | | | | | | |
Total distributions to shareholders | | | (0.11 | ) | | | (0.10 | ) | | | (0.44 | ) | | | (0.27 | ) | | | (0.13 | ) | | | (0.22 | ) |
Net asset value, end of period | | | $13.87 | | | | $13.17 | | | | $12.28 | | | | $13.61 | | | | $13.92 | | | | $13.20 | |
Total return3 | | | 6.16 | % | | | 8.08 | % | | | (6.48 | )% | | | (0.23 | )% | | | 6.44 | % | | �� | 8.32 | % |
Ratios to average net assets (annualized) | | | | | | | | | | | | | | | | | | | | |
Gross expenses4 | | | 1.57 | % | | | 1.55 | % | | | 1.57 | % | | | 1.60 | % | | | 1.60 | % | | | 1.59 | % |
Net expenses4 | | | 1.57 | % | | | 1.55 | % | | | 1.57 | % | | | 1.60 | % | | | 1.60 | % | | | 1.59 | % |
Net investment loss4 | | | (1.57 | )% | | | (1.55 | )% | | | (1.57 | )% | | | (1.60 | )% | | | (1.60 | )% | | | (1.59 | )% |
Supplemental data | | | | | | | | | | | | | | | | | | | | |
Portfolio turnover rate5 | | | 0 | % | | | 0 | % | | | 1 | % | | | 0 | % | | | 1 | % | | | 0 | % |
Net assets, end of period (000s omitted) | | | $905,336 | | | | $1,232,098 | | | | $1,561,695 | | | | $2,060,672 | | | | $2,377,997 | | | | $2,399,839 | |
| 1 | For the seven months ended April 30, 2014. The Fund changed its fiscal year end from September 30 to April 30, effective April 30, 2014. |
| 2 | Calculated based upon average shares outstanding |
| 3 | Total return calculations do not include any sales charges. Returns for periods of less than one year are not annualized. |
| 4 | Ratios do not include any expenses from Asset Allocation Trust or its investments in underlying funds. Asset Allocation Trust does not have any net expenses. |
| 5 | Portfolio turnover rate represents the purchase and sales of the Fund’s investment in Asset Allocation Trust and not the underlying investment transactions of Asset Allocation Trust. |
The accompanying notes are an integral part of these financial statements.
| | | | |
| 18 | | Wells Fargo Asset Allocation Fund | | Financial highlights |
(For a share outstanding throughout each period)
| | | | | | | | | | | | | | | | | | | | | | | | |
| | | Year ended April 30 | | | Year ended
September 30, 2013 | |
| CLASS R | | 2018 | | | 2017 | | | 2016 | | | 2015 | | | 20141 | | |
Net asset value, beginning of period | | | $13.49 | | | | $12.58 | | | | $13.95 | | | | $14.28 | | | | $13.58 | | | | $12.76 | |
Net investment loss | | | (0.15 | )2 | | | (0.13 | )2 | | | (0.14 | )2 | | | (0.15 | )2 | | | (0.10 | ) | | | (0.14 | )2 |
Net realized and unrealized gains (losses) on investments | | | 1.05 | | | | 1.21 | | | | (0.71 | ) | | | 0.18 | | | | 1.01 | | | | 1.26 | |
| | | | | | | | | | | | | | | | | | | | | | | | |
Total from investment operations | | | 0.90 | | | | 1.08 | | | | (0.85 | ) | | | 0.03 | | | | 0.91 | | | | 1.12 | |
Distributions to shareholders from | | | | | | | | | | | | | | | | | | | | |
Net investment income | | | (0.19 | ) | | | (0.17 | ) | | | (0.33 | ) | | | (0.36 | ) | | | (0.21 | ) | | | (0.30 | ) |
Net realized gains | | | 0.00 | | | | 0.00 | | | | (0.19 | ) | | | 0.00 | | | | 0.00 | | | | 0.00 | |
| | | | | | | | | | | | | | | | | | | | | | | | |
Total distributions to shareholders | | | (0.19 | ) | | | (0.17 | ) | | | (0.52 | ) | | | (0.36 | ) | | | (0.21 | ) | | | (0.30 | ) |
Net asset value, end of period | | | $14.20 | | | | $13.49 | | | | $12.58 | | | | $13.95 | | | | $14.28 | | | | $13.58 | |
Total return3 | | | 6.70 | % | | | 8.64 | % | | | (6.02 | )% | | | 0.27 | % | | | 6.74 | % | | | 8.92 | % |
Ratios to average net assets (annualized) | | | | | | | | | | | | | | | | | | | | |
Gross expenses4 | | | 1.06 | % | | | 1.05 | % | | | 1.06 | % | | | 1.09 | % | | | 1.10 | % | | | 1.09 | % |
Net expenses4 | | | 1.06 | % | | | 1.05 | % | | | 1.06 | % | | | 1.09 | % | | | 1.10 | % | | | 1.09 | % |
Net investment loss4 | | | (1.06 | )% | | | (1.05 | )% | | | (1.06 | )% | | | (1.09 | )% | | | (1.10 | )% | | | (1.09 | )% |
Supplemental data | | | | | | | | | | | | | | | | | | | | |
Portfolio turnover rate5 | | | 0 | % | | | 0 | % | | | 1 | % | | | 0 | % | | | 1 | % | | | 0 | % |
Net assets, end of period (000s omitted) | | | $15,658 | | | | $20,244 | | | | $24,122 | | | | $30,355 | | | | $33,984 | | | | $33,934 | |
| 1 | For the seven months ended April 30, 2014. The Fund changed its fiscal year end from September 30 to April 30, effective April 30, 2014. |
| 2 | Calculated based upon average shares outstanding |
| 3 | Returns for periods of less than one year are not annualized. |
| 4 | Ratios do not include any expenses from Asset Allocation Trust or its investments in underlying funds. Asset Allocation Trust does not have any net expenses. |
| 5 | Portfolio turnover rate represents the purchase and sales of the Fund’s investment in Asset Allocation Trust and not the underlying investment transactions of Asset Allocation Trust. |
The accompanying notes are an integral part of these financial statements.
| | | | | | |
| Financial highlights | | Wells Fargo Asset Allocation Fund | | | 19 | |
(For a share outstanding throughout each period)
| | | | | | | | | | | | | | | | | | | | | | | | |
| | | Year ended April 30 | | | Year ended
September 30, 2013 | |
| ADMINISTRATOR CLASS | | 2018 | | | 2017 | | | 2016 | | | 2015 | | | 20141 | | |
Net asset value, beginning of period | | | $13.78 | | | | $12.84 | | | | $14.23 | | | | $14.54 | | | | $13.84 | | | | $13.01 | |
Net investment loss | | | (0.09 | )2 | | | (0.08 | )2 | | | (0.09 | )2 | | | (0.09 | )2 | | | (0.05 | )2 | | | (0.08 | )2 |
Net realized and unrealized gains (losses) on investments | | | 1.07 | | | | 1.24 | | | | (0.73 | ) | | | 0.19 | | | | 1.01 | | | | 1.27 | |
| | | | | | | | | | | | | | | | | | | | | | | | |
Total from investment operations | | | 0.98 | | | | 1.16 | | | | (0.82 | ) | | | 0.10 | | | | 0.96 | | | | 1.19 | |
Distributions to shareholders from | | | | | | | | | | | | | | | | | | | | |
Net investment income | | | (0.27 | ) | | | (0.22 | ) | | | (0.38 | ) | | | (0.41 | ) | | | (0.26 | ) | | | (0.36 | ) |
Net realized gains | | | 0.00 | | | | 0.00 | | | | (0.19 | ) | | | 0.00 | | | | 0.00 | | | | 0.00 | |
| | | | | | | | | | | | | | | | | | | | | | | | |
Total distributions to shareholders | | | (0.27 | ) | | | (0.22 | ) | | | (0.57 | ) | | | (0.41 | ) | | | (0.26 | ) | | | (0.36 | ) |
Net asset value, end of period | | | $14.49 | | | | $13.78 | | | | $12.84 | | | | $14.23 | | | | $14.54 | | | | $13.84 | |
Total return3 | | | 7.10 | % | | | 9.14 | % | | | (5.69 | )% | | | 0.77 | % | | | 7.01 | % | | | 9.39 | % |
Ratios to average net assets (annualized) | | | | | | | | | | | | | | | | | | | | |
Gross expenses4 | | | 0.73 | % | | | 0.72 | % | | | 0.71 | % | | | 0.68 | % | | | 0.69 | % | | | 0.67 | % |
Net expenses4 | | | 0.64 | % | | | 0.64 | % | | | 0.64 | % | | | 0.64 | % | | | 0.64 | % | | | 0.64 | % |
Net investment loss4 | | | (0.64 | )% | | | (0.64 | )% | | | (0.64 | )% | | | (0.64 | )% | | | (0.64 | )% | | | (0.64 | )% |
Supplemental data | | | | | | | | | | | | | | | | | | | | |
Portfolio turnover rate5 | | | 0 | % | | | 0 | % | | | 1 | % | | | 0 | % | | | 1 | % | | | 0 | % |
Net assets, end of period (000s omitted) | | | $69,607 | | | | $92,600 | | | | $157,303 | | | | $427,916 | | | | $776,035 | | | | $809,554 | |
| 1 | For the seven months ended April 30, 2014. The Fund changed its fiscal year end from September 30 to April 30, effective April 30, 2014. |
| 2 | Calculated based upon average shares outstanding |
| 3 | Returns for periods of less than one year are not annualized. |
| 4 | Ratios do not include any expenses from Asset Allocation Trust or its investments in underlying funds. Asset Allocation Trust does not have any net expenses. |
| 5 | Portfolio turnover rate represents the purchase and sales of the Fund’s investment in Asset Allocation Trust and not the underlying investment transactions of Asset Allocation Trust. |
The accompanying notes are an integral part of these financial statements.
| | | | |
| 20 | | Wells Fargo Asset Allocation Fund | | Financial highlights |
(For a share outstanding throughout each period)
| | | | | | | | | | | | | | | | | | | | | | | | |
| | | Year ended April 30 | | | Year ended
September 30, 20132 | |
| INSTITUTIONAL CLASS | | 2018 | | | 2017 | | | 2016 | | | 2015 | | | 20141 | | |
Net asset value, beginning of period | | | $13.66 | | | | $12.74 | | | | $14.15 | | | | $14.49 | | | | $13.82 | | | | $13.01 | |
Net investment loss | | | (0.06 | )3 | | | (0.06 | )3 | | | (0.06 | )3 | | | (0.06 | )3 | | | (0.03 | ) | | | (0.05 | )3 |
Net realized and unrealized gains (losses) on investments | | | 1.06 | | | | 1.23 | | | | (0.72 | ) | | | 0.19 | | | | 1.01 | | | | 1.26 | |
| | | | | | | | | | | | | | | | | | | | | | | | |
Total from investment operations | | | 1.00 | | | | 1.17 | | | | (0.78 | ) | | | 0.13 | | | | 0.98 | | | | 1.21 | |
Distributions to shareholders from | | | | | | | | | | | | | | | | | | | | |
Net investment income | | | (0.30 | ) | | | (0.25 | ) | | | (0.44 | ) | | | (0.47 | ) | | | (0.31 | ) | | | (0.40 | ) |
Net realized gains | | | 0.00 | | | | 0.00 | | | | (0.19 | ) | | | 0.00 | | | | 0.00 | | | | 0.00 | |
| | | | | | | | | | | | | | | | | | | | | | | | |
Total distributions to shareholders | | | (0.30 | ) | | | (0.25 | ) | | | (0.63 | ) | | | (0.47 | ) | | | (0.31 | ) | | | (0.40 | ) |
Net asset value, end of period | | | $14.36 | | | | $13.66 | | | | $12.74 | | | | $14.15 | | | | $14.49 | | | | $13.82 | |
Total return4 | | | 7.33 | % | | | 9.34 | % | | | (5.44 | )% | | | 0.99 | % | | | 7.15 | % | | | 9.58 | % |
Ratios to average net assets (annualized) | | | | | | | | | | | | | | | | | | | | |
Gross expenses5 | | | 0.49 | % | | | 0.47 | % | | | 0.47 | % | | | 0.42 | % | | | 0.42 | % | | | 0.42 | % |
Net expenses5 | | | 0.44 | % | | | 0.44 | % | | | 0.44 | % | | | 0.42 | % | | | 0.42 | % | | | 0.42 | % |
Net investment loss5 | | | (0.44 | )% | | | (0.44 | )% | | | (0.44 | )% | | | (0.42 | )% | | | (0.42 | )% | | | (0.42 | )% |
Supplemental data | | | | | | | | | | | | | | | | | | | | |
Portfolio turnover rate6 | | | 0 | % | | | 0 | % | | | 1 | % | | | 0 | % | | | 1 | % | | | 0 | % |
Net assets, end of period (000s omitted) | | | $572,803 | | | | $672,544 | | | | $787,484 | | | | $1,032,319 | | | | $716,789 | | | | $679,254 | |
| 1 | For the seven months ended April 30, 2014. The Fund changed its fiscal year end from September 30 to April 30, effective April 30, 2014. |
| 2 | For the period from November 30, 2012 (commencement of class operations) to September 30, 2013 |
| 3 | Calculated based upon average shares outstanding |
| 4 | Returns for periods of less than one year are not annualized. |
| 5 | Ratios do not include any expenses from Asset Allocation Trust or its investments in underlying funds. Asset Allocation Trust does not have any net expenses. |
| 6 | Portfolio turnover rate represents the purchase and sales of the Fund’s investment in Asset Allocation Trust and not the underlying investment transactions of Asset Allocation Trust. |
The accompanying notes are an integral part of these financial statements.
| | | | | | |
| Notes to financial statements | | Wells Fargo Asset Allocation Fund | | | 21 | |
1. ORGANIZATION
Wells Fargo Funds Trust (the “Trust”), a Delaware statutory trust organized on March 10, 1999, is an open-end management investment company registered under the Investment Company Act of 1940, as amended (the “1940 Act”). As an investment company, the Trust follows the accounting and reporting guidance in Financial Accounting Standards Board Accounting Standards Codification Topic 946, Financial Services – Investment Companies. These financial statements report on the Wells Fargo Asset Allocation Fund (the “Fund”) which is a diversified series of the Trust.
As of April 30, 2017, the Fund invested all of its investable assets in Asset Allocation Trust, an investment company managed by Grantham, Mayo, Van Otterloo & Co. LLC (“GMO”). Asset Allocation Trust in turn invested its assets in GMO-managed mutual funds (“underlying funds”) and was exposed to any asset class, including U.S. and foreign equities (including emerging country equities), U.S. and foreign fixed income securities (including emerging country debt securities), and, from time to time, other alternative asset classes. At April 30, 2018, the Fund owned 100% of Asset Allocation Trust. Because the Fund invested all of its assets in Asset Allocation Trust, the shareholders of the Fund bore the fees and expenses of Asset Allocation Trust which are not included in the Statement of Operations but are incurred indirectly because they are considered in the calculation of the net asset value of Asset Allocation Trust. As a result, the Fund’s actual expenses may be higher than those of other mutual funds that invest directly in securities. The financial statements of Asset Allocation Trust, including the Portfolio of Investments, are included elsewhere in this report and should be read in conjunction with the Fund’s financial statements.
Effective at the close of business on July 5, 2017, Class B shares were converted to Class A shares and are no longer offered by the Fund. Information for Class B shares reflected in the financial statements represents activity through July 5, 2017.
2. SIGNIFICANT ACCOUNTING POLICIES
The following significant accounting policies, which are consistently followed in the preparation of the financial statements of the Fund, are in conformity with U.S. generally accepted accounting principles which require management to make estimates and assumptions that affect the reported amounts of assets and liabilities, disclosure of contingent assets and liabilities at the date of the financial statements, and the reported amounts of revenues and expenses during the reporting period. Actual results could differ from those estimates.
Securities valuation
Investments are valued each business day as of the close of regular trading on the New York Stock Exchange (generally 4 p.m. Eastern Time), although the Fund may deviate from this calculation time under unusual or unexpected circumstances.
The Fund values its investment in Asset Allocation Trust at net asset value. The valuation of investments in securities and the underlying funds held by Asset Allocation Trust is discussed in its Notes to Financial Statements, which is included elsewhere in this report.
Investment transactions and income recognition
Investment transactions in Asset Allocation Trust are recorded on a trade date basis. Realized gains or losses resulting from investment transactions in Asset Allocation Trust are determined on the identified cost basis. Income dividends and capital gain distributions from Asset Allocation Trust are recorded on the ex-dividend date. Capital gain distributions from Asset Allocation Trust are treated as realized gains.
Distributions to shareholders
Distributions to shareholders from net investment income and any net realized gains are recorded on the ex-dividend date and paid at least annually. Net investment income is primarily derived from redemptions in Asset Allocation Trust which are deemed dividends to the Fund. Such distributions are determined in accordance with income tax regulations and may differ from U.S. generally accepted accounting principles. Dividend sources are estimated at the time of declaration. The tax character of distributions is determined as of the Fund’s fiscal year end. Therefore, a portion of the Fund’s distributions made prior the Fund’s fiscal year end may be categorized as a tax return of capital at year end.
Federal and other taxes
The Fund intends to continue to qualify as a regulated investment company by distributing substantially all of its investment company taxable income and any net realized capital gains (after reduction for capital loss carryforwards) sufficient to relieve it from all, or substantially all, federal income taxes. Accordingly, no provision for federal income taxes was required.
| | | | |
| 22 | | Wells Fargo Asset Allocation Fund | | Notes to financial statements |
The Fund’s income and federal excise tax returns and all financial records supporting those returns for the prior three fiscal years are subject to examination by the federal and Delaware revenue authorities. Management has analyzed the Fund’s tax positions taken on federal, state, and foreign tax returns for all open tax years and does not believe that there are any uncertain tax positions that require recognition of a tax liability.
As of April 30, 2018, the aggregate cost of all investments for federal income tax purposes was $2,704,931,687 and the unrealized gains (losses) consisted of:
| | | | |
Gross unrealized gains | | $ | 223,987,986 | |
Gross unrealized losses | | | 0 | |
Net unrealized gains | | $ | 223,987,986 | |
Reclassifications are made to the Fund’s capital accounts for permanent tax differences to reflect income and gains available for distribution (or available capital loss carryforwards) under federal income tax regulations. U.S. generally accepted accounting principles require that certain components of net assets be adjusted to reflect permanent differences between financial and tax reporting. These reclassifications have no effect on net assets or net asset values per share. The primary permanent differences causing such reclassifications are due to reversal of net realized gains from investments and deemed dividends received from Asset Allocation Trust. At April 30, 2018, as a result of permanent book-to-tax differences, the following reclassification adjustments were made on the Statement of Assets and Liabilities:
| | | | |
| Paid-in capital | | Accumulated net
investment loss | | Accumulated net
realized losses
on investments |
| $1,152,030,070 | | $82,161,947 | | $(1,234,192,017) |
As of April 30, 2018, the Fund had a qualified late-year ordinary loss of $9,241,449 which will be recognized on the first day of the following fiscal year.
Class allocations
The separate classes of shares offered by the Fund differ principally in applicable sales charges, distribution, shareholder servicing, and administration fees. Class specific expenses are charged directly to that share class. Investment income, common expenses, and realized and unrealized gains (losses) on investments are allocated daily to each class of shares based on the relative proportion of net assets of each class.
3. FAIR VALUATION MEASUREMENTS
As of April 30, 2018, the Fund’s investment in Asset Allocation Trust was measured at fair value using the net asset value per share as a practical expedient. Asset Allocation Trust seeks to provide total return by investing in GMO managed mutual funds and may be exposed to any asset class. GMO intends to expose the assets of Asset Allocation Trust to at least 15% in fixed income investments and at least 25% in equity investments. The Fund’s investment in Asset Allocation Trust valued at $2,928,919,673 does not have a redemption period notice, can be redeemed daily and does not have any unfunded commitments.
4. TRANSACTIONS WITH AFFILIATES
Management fee
Wells Fargo Funds Management, LLC (“Funds Management”), an indirect wholly owned subsidiary of Wells Fargo & Company (“Wells Fargo”), is the manager of the Fund and provides advisory and fund-level administrative services under an investment management agreement. Under the investment management agreement, Funds Management is responsible for, among other services, implementing the investment objectives and strategies of the Fund, providing fund-level administrative services in connection with the Fund’s operations, and providing any other fund-level administrative services reasonably necessary for the operation of the Fund. As compensation for its services under the investment management agreement, Funds Management is entitled to receive an annual management fee starting at 0.35% and declining to 0.235% as the average daily net assets of the Fund increase. For the year ended April 30, 2018, the management fee was equivalent to an annual rate of 0.33% of the Fund’s average daily net assets.
| | | | | | |
| Notes to financial statements | | Wells Fargo Asset Allocation Fund | | | 23 | |
Administration fees
Under a class-level administration agreement, Funds Management provides class-level administrative services to the Fund, which includes paying fees and expenses for services provided by the transfer agent, sub-transfer agents, omnibus account servicers and record-keepers. As compensation for its services under the class-level administration agreement, Funds Management receives an annual fee which is calculated based on the average daily net assets of each class as follows:
| | | | |
| | | Class-level
administration fee | |
Class A, Class B, Class C, Class R | | | 0.21 | % |
Administrator Class, Institutional Class | | | 0.13 | |
Funds Management has contractually waived and/or reimbursed management and administration fees to the extent necessary to maintain certain net operating expense ratios for the Fund. Waiver of fees and/or reimbursement of expenses by Funds Management were made first from fund level expenses on a proportionate basis and then from class specific expenses. Funds Management has committed through August 31, 2018 to waive fees and/or reimburse expenses to the extent necessary to cap the Fund’s expenses (excluding acquired fund fees and expenses and the expenses of Asset Allocation Trust) at 0.87% for Class A shares, 1.62% for Class C shares, 1.12% for Class R shares, 0.64% for Administrator Class shares, and 0.44% for Institutional Class shares. After this time, the cap may be increased or the commitment to maintain the cap may be terminated only with the approval of the Board of Trustees.
Distribution fees
The Trust has adopted a Distribution Plan for Class B, Class C, and Class R shares of the Fund pursuant to Rule 12b-1 under the 1940 Act. Distribution fees are charged to Class B, Class C, and Class R shares and paid to Wells Fargo Funds Distributor, LLC (“Funds Distributor”), the principal underwriter, at an annual rate of 0.75% of the average daily net assets of Class B and Class C shares and 0.25% of the average daily net assets of Class R shares.
In addition, Funds Distributor is entitled to receive the front-end sales charge from the purchase of Class A shares and a contingent deferred sales charge on the redemption of certain Class A shares. Funds Distributor is also entitled to receive the contingent deferred sales charges from redemptions of Class B and Class C shares. For the year ended April 30, 2018, Funds Distributor received $59,815 from the sale of Class A shares and $2,662 in contingent deferred sales charges from redemptions of Class C shares. No contingent deferred sales charges were incurred by Class A and Class B shares for the year ended April 30, 2018.
Shareholder servicing fees
The Trust has entered into contracts with one or more shareholder servicing agents, whereby Class A, Class B, Class C, Class R, and Administrator Class of the Fund are charged a fee at an annual rate of 0.25% of the average daily net assets of each respective class.
A portion of these total shareholder servicing fees were paid to affiliates of Wells Fargo.
5. INVESTMENT PORTFOLIO TRANSACTIONS
For the year ended April 30, 2018, the Fund made aggregate purchases and sales of $4,047,369 and $774,169,650, respectively, in its investment into Asset Allocation Trust.
6. BANK BORROWINGS
The Trust (excluding the money market funds and certain other funds) and Wells Fargo Variable Trust are parties to a $280,000,000 revolving credit agreement whereby the Fund is permitted to use bank borrowings for temporary or emergency purposes, such as to fund shareholder redemption requests. Interest under the credit agreement is charged to the Fund based on a borrowing rate equal to the higher of the Federal Funds rate in effect on that day plus 1.25% or the overnight LIBOR rate in effect on that day plus 1.25%. In addition, an annual commitment fee equal to 0.25% of the unused balance is allocated to each participating fund. Prior to August 29, 2017, the revolving credit agreement amount was $250,000,000.
For the year ended April 30, 2018, there were no borrowing by the Fund under the agreement.
| | | | |
| 24 | | Wells Fargo Asset Allocation Fund | | Notes to financial statements |
7. DISTRIBUTIONS TO SHAREHOLDERS
The tax character of distributions paid during the years ended April 30, 2018 and April 30, 2017 were as follows:
| | | | | | | | |
| | | Year ended April 30 | |
| | | 2018 | | | 2017 | |
Ordinary income | | $ | 48,640,484 | | | $ | 47,833,680 | |
As of April 30, 2018, the components of distributable earnings on a tax basis were as follows:
| | |
Unrealized
gains | | Late-year
ordinary losses
deferred |
| $223,987,986 | | $(9,241,449) |
8. INDEMNIFICATION
Under the Trust’s organizational documents, the officers and Trustees have been granted certain indemnification rights against certain liabilities that may arise out of performance of their duties to the Trust. Additionally, in the normal course of business, the Trust may enter into contracts with service providers that contain a variety of indemnification clauses. The Trust’s maximum exposure under these arrangements is dependent on future claims that may be made against the Fund and, therefore, cannot be estimated.
9. SUBSEQUENT EVENTS
On June 15, 2018, the Fund implemented changes to its principal investments strategies and management which included adding Wells Capital Management Incorporated, an affiliate of Funds Management and an indirect wholly owned subsidiary of Wells Fargo, as the subadviser to the Fund. The Fund redeemed its investment in Asset Allocation Trust, the Fund’s primary investment, after Asset Allocation Trust fully redeemed out of all its holdings in the GMO funds. The redemption was a taxable event for Asset Allocation Trust which in turn distributed the gains to the Fund. The Fund will include the gains in its annual capital gains distributions to shareholders. As a result of the redemption, the Fund received cash which was subsequently invested into multiple diversified portfolios of Wells Fargo Master Trust and the Fund began operating as a fund-of-funds.
| | | | | | |
| Report of independent registered public accounting firm | | Wells Fargo Asset Allocation Fund | | | 25 | |
BOARD OF TRUSTEES AND SHAREHOLDERS OF WELLS FARGO FUNDS TRUST:
Opinion on the Financial Statements
We have audited the accompanying statements of assets and liabilities of the Wells Fargo Asset Allocation Fund (the “Fund”), one of the funds constituting the Wells Fargo Funds Trust, including the portfolio of investments, as of April 30, 2018, and the related statements of operations for the year then ended, the statements of changes in net assets for each of the years in the two-year period then ended, and the related notes (collectively, the “financial statements”) and the financial highlights for each of the years in the four-year period then ended, the period from October 1, 2013 to April 20, 2014 and the year ended September 30, 2013. In our opinion, the financial statements and financial highlights present fairly, in all material respects, the financial position of the Fund as of April 30, 2018, the results of its operations for the year then ended, the changes in its net assets for each of the years in the two-year period then ended and the financial highlights for each of the years or periods noted above, in conformity with U.S. generally accepted accounting principles.
Basis for Opinion
These financial statements and financial highlights are the responsibility of the Funds’ management. Our responsibility is to express an opinion on these financial statements and financial highlights based on our audits. We are a public accounting firm registered with the Public Company Accounting Oversight Board (United States) (“PCAOB”) and are required to be independent with respect to the Fund in accordance with the U.S. federal securities laws and the applicable rules and regulations of the Securities and Exchange Commission and the PCAOB.
We conducted our audits in accordance with the standards of the PCAOB. Those standards require that we plan and perform the audit to obtain reasonable assurance about whether the financial statements and financial highlights are free of material misstatement, whether due to error or fraud. Our audits included performing procedures to assess the risks of material misstatement of the financial statements and financial highlights, whether due to error or fraud, and performing procedures that respond to those risks. Such procedures included examining, on a test basis, evidence regarding the amounts and disclosures in the financial statements and financial highlights. Such procedures also included confirmation of securities owned as of April 30, 2018, by correspondence with the transfer agent. Our audits also included evaluating the accounting principles used and significant estimates made by management, as well as evaluating the overall presentation of the financial statements and financial highlights. We believe that our audits provide a reasonable basis for our opinion.

We have not been able to determine the specific year that we began serving as the auditor of one or more Wells Fargo Funds investment companies, however we are aware that we have served as the auditor of one or more Wells Fargo Funds investment companies since at least 1955.
Boston, Massachusetts
June 25, 2018
| | | | |
| 26 | | Wells Fargo Asset Allocation Fund | | Other information (unaudited) |
TAX INFORMATION
For corporate shareholders, pursuant to Section 854 of the Internal Revenue Code, 17.44% of ordinary income dividends qualify for the corporate dividends-received deduction for the fiscal year ended April 30, 2018.
Pursuant to Section 854 of the Internal Revenue Code, $43,225,725 of income dividends paid during the fiscal year ended April 30, 2018 has been designated as qualified dividend income (QDI).
Pursuant to Section 853 of the Internal Revenue Code, the following amounts have been designated as foreign taxes paid for the fiscal year ended April 30, 2018. These amounts may be less than the actual foreign taxes paid for financial statement purposes. Foreign taxes paid or withheld should be included in taxable income with an offsetting deduction from gross income or as a credit for taxes paid to foreign governments. None of the income was derived from ineligible foreign sources as defined under Section 901(j) of the Internal Revenue Code.
| | | | |
Creditable foreign taxes paid | | Per share amount | | Foreign income as % of ordinary income distributions |
| $5,468,778 | | $0.0266 | | 47.56% |
PROXY VOTING INFORMATION
A description of the policies and procedures that the Fund uses to determine how to vote proxies relating to portfolio securities is available, upon request, by calling 1-800-222-8222, visiting our website at wellsfargofunds.com, or visiting the SEC website at sec.gov. Information regarding how the Fund voted proxies relating to portfolio securities during the most recent 12-month period ended June 30 is available on the Fund’s website at wellsfargofunds.com or by visiting the SEC website at sec.gov.
PORTFOLIO HOLDINGS INFORMATION
The complete portfolio holdings for the Fund are publicly available monthly on the Fund’s website (wellsfargofunds.com), on a one-month delayed basis. In addition, top ten holdings information (excluding derivative positions) for the Fund is publicly available on the Fund’s website on a monthly, seven-day or more delayed basis. The Fund files its complete schedule of portfolio holdings with the SEC for the first and third quarters of each fiscal year on Form N-Q, which is available by visiting the SEC website at sec.gov. In addition, the Fund’s Form N-Q may be reviewed and copied at the SEC’s Public Reference Room in Washington, DC, and at regional offices in New York City, at 233 Broadway, and in Chicago, at 175 West Jackson Boulevard, Suite 900. Information about the Public Reference Room may be obtained by calling 1-800-SEC-0330.
| | | | | | |
| Other information (unaudited) | | Wells Fargo Asset Allocation Fund | | | 27 | |
BOARD OF TRUSTEES AND OFFICERS
Each of the Trustees and Officers1 listed in the table below acts in identical capacities for each fund in the Wells Fargo family of funds, which consists of 153 mutual funds comprising the Wells Fargo Funds Trust, Wells Fargo Variable Trust, Wells Fargo Master Trust and four closed-end funds (collectively the “Fund Complex”). This table should be read in conjunction with the Prospectus and the Statement of Additional Information2. The mailing address of each Trustee and Officer is 525 Market Street, 12th Floor, San Francisco, CA 94105. Each Trustee and Officer serves an indefinite term, however, each Trustee serves such term until reaching the mandatory retirement age established by the Trustees.
Independent Trustees
| | | | | | |
Name and
year of birth | | Position held and
length of service* | | Principal occupations during past five years or longer | | Current other
public company or
investment company
directorships |
William R. Ebsworth (Born 1957) | | Trustee, since 2015 | | Retired. From 1984 to 2013, equities analyst, portfolio manager, research director and chief investment officer at Fidelity Management and Research Company in Boston, Tokyo, and Hong Kong, and retired in 2013 as Chief Investment Officer of Fidelity Strategic Advisers, Inc. where he led a team of investment professionals managing client assets. Prior thereto, Board member of Hong Kong Securities Clearing Co., Hong Kong Options Clearing Corp., the Thailand International Fund, Ltd., Fidelity Investments Life Insurance Company, and Empire Fidelity Investments Life Insurance Company. Board member of the Forté Foundation (non-profit organization) and the Vincent Memorial Hospital Endowment (non-profit organization), where he serves on the Investment Committee and as a Chair of the Audit Committee. Mr. Ebsworth is a CFA® charterholder. | | Asset Allocation Trust |
Jane A. Freeman (Born 1953) | | Trustee, since 2015; Chair Liaison, since 2018 | | Retired. From 2012 to 2014 and 1999 to 2008, Chief Financial Officer of Scientific Learning Corporation. From 2008 to 2012, Ms. Freeman provided consulting services related to strategic business projects. Prior to 1999, Portfolio Manager at Rockefeller & Co. and Scudder, Stevens & Clark. Board member of the Harding Loevner Funds from 1996 to 2014, serving as both Lead Independent Director and chair of the Audit Committee. Board member of the Russell Exchange Traded Funds Trust from 2011 to 2012 and the chair of the Audit Committee. Ms. Freeman is a Board Member of Ruth Bancroft Garden (non-profit organization) and the Glimmerglass Festival. She is also an inactive Chartered Financial Analyst. | | Asset Allocation Trust |
Isaiah Harris, Jr. (Born 1952) | | Trustee, since 2009 | | Retired. Chairman of the Board of CIGNA Corporation since 2009, and Director since 2005. From 2003 to 2011, Director of Deluxe Corporation. Prior thereto, President and CEO of BellSouth Advertising and Publishing Corp. from 2005 to 2007, President and CEO of BellSouth Enterprises from 2004 to 2005 and President of BellSouth Consumer Services from 2000 to 2003. Emeritus member of the Iowa State University Foundation Board of Governors. Emeritus Member of the Advisory Board of Iowa State University School of Business. Advisory Board Member, Palm Harbor Academy (charter school). Advisory Board Member, Child Evangelism Fellowship (non-profit). Mr. Harris is a certified public accountant (inactive status). | | CIGNA Corporation; Asset Allocation Trust |
Judith M. Johnson (Born 1949) | | Trustee, since 2008; Audit Committee Chairman, since 2008 | | Retired. Prior thereto, Chief Executive Officer and Chief Investment Officer of Minneapolis Employees Retirement Fund from 1996 to 2008. Ms. Johnson is an attorney, certified public accountant and a certified managerial accountant. | | Asset Allocation Trust |
David F. Larcker (Born 1950) | | Trustee, since 2009 | | James Irvin Miller Professor of Accounting at the Graduate School of Business, Stanford University, Director of the Corporate Governance Research Initiative and Senior Faculty of The Rock Center for Corporate Governance since 2006. From 2005 to 2008, Professor of Accounting at the Graduate School of Business, Stanford University. Prior thereto, Ernst & Young Professor of Accounting at The Wharton School, University of Pennsylvania from 1985 to 2005. | | Asset Allocation Trust |
| | | | |
| 28 | | Wells Fargo Asset Allocation Fund | | Other information (unaudited) |
| | | | | | |
Name and
year of birth | | Position held and
length of service* | | Principal occupations during past five years or longer | | Current other
public company or
investment company
directorships |
Olivia S. Mitchell (Born 1953) | | Trustee, since 2006; Governance Committee Chairman, since 2018 | | International Foundation of Employee Benefit Plans Professor, Wharton School of the University of Pennsylvania since 1993. Director of Wharton’s Pension Research Council and Boettner Center on Pensions & Retirement Research, and Research Associate at the National Bureau of Economic Research. Previously, Cornell University Professor from 1978 to 1993. | | Asset Allocation Trust |
Timothy J. Penny (Born 1951) | | Trustee since 1996; Chairman, since 2018; Vice Chairman, from 2017 to 2018 | | President and Chief Executive Officer of Southern Minnesota Initiative Foundation, a non-profit organization, since 2007. Member of the Board of Trustees of NorthStar Education Finance, Inc., a non-profit organization, since 2007. | | Asset Allocation Trust |
James G. Polisson (Born 1959) | | Trustee, since 2018; Advisory Board Member, from 2017 to 2018 | | Retired. Chief Marketing Officer, Source (ETF) UK Services, Ltd, from 2015 to 2017. From 2012 to 2015, Principal of The Polisson Group, LLC, a management consulting, corporate advisory and principal investing company. Chief Executive Officer and Managing Director at Russell Investments, Global Exchange Traded Funds from 2010 to 2012. Managing Director of Barclays Global Investors from 1998 to 2010 and Global Chief Marketing Officer for iShares and Barclays Global Investors from 2000 to 2010. Trustee of the San Francisco Mechanics’ Institute, a non-profit organization, from 2013 to 2015. Board member of the Russell Exchange Traded Fund Trust from 2011 to 2012. Director of Barclays Global Investors Holdings Deutschland GmbH from 2006 to 2009. Mr. Polisson is an attorney and has a retired status with the Massachusetts and District of Columbia Bar Associations. | | Asset Allocation Trust |
Michael S. Scofield (Born 1943) | | Trustee, since 2010 | | Served on the Investment Company Institute’s Board of Governors and Executive Committee from 2008-2011 as well the Governing Council of the Independent Directors Council from 2006-2011 and the Independent Directors Council Executive Committee from 2008-2011. Trustee of the Evergreen Fund complex (and its predecessors) from 1984 to 2010. Chairman of the Evergreen Funds from 2000-2010. Former Trustee of the Mentor Funds. Retired Attorney, Law Offices of Michael S. Scofield. | | Asset Allocation Trust |
Pamela Wheelock (Born 1959) | | Trustee, since 2018; Advisory Board Member, from 2017 to 2018 | | Chief Operating Officer, Twin Cities Habitat for Humanity, since January, 2017. Vice President of University Services, University of Minnesota from 2012 to 2017. Prior thereto, on the Board of Directors, Governance Committee and Finance Committee for the Minnesota Philanthropy Partners (Saint Paul Foundation) from 2012 to 2018, Interim President and Chief Executive Officer of Blue Cross Blue Shield of Minnesota from 2010 to 2011, Chairman of the Board from 2009 to 2011 and Board Director from 2003 to 2015. Vice President, Leadership and Community Engagement, Bush Foundation, Saint Paul, Minnesota (a private foundation) from 2009 to 2011. Executive Vice President and Chief Financial Officer, Minnesota Sports and Entertainment from 2004 to 2009 and Senior Vice President from 2002 to 2004. Commissioner of Finance, State of Minnesota, from 1999 to 2002. Currently the Board Chair of the Minnesota Wild Foundation since 2010. | | Asset Allocation Trust |
| * | Length of service dates reflect the Trustee’s commencement of service with the Trust’s predecessor entities, where applicable. |
| | | | | | |
| Other information (unaudited) | | Wells Fargo Asset Allocation Fund | | | 29 | |
Officers
| | | | | | |
Name and
year of birth | | Position held and
length of service | | Principal occupations during past five years or longer | | |
Andrew Owen (Born 1960) | | President, since 2017 | | Executive Vice President of Wells Fargo & Company and Head of Affiliated Managers, Wells Fargo Asset Management, since 2014. In addition, Mr. Owen is currently President, Chief Executive Officer and Director of Wells Fargo Funds Management, LLC since 2017. Prior thereto, Executive Vice President responsible for marketing, investments and product development for Wells Fargo Funds Management, LLC, from 2009 to 2014. | | |
Jeremy DePalma1 (Born 1974) | | Treasurer, since 2012 | | Senior Vice President of Wells Fargo Funds Management, LLC since 2009. Senior Vice President of Evergreen Investment Management Company, LLC from 2008 to 2010 and head of the Fund Reporting and Control Team within Fund Administration from 2005 to 2010. | | |
Alexander Kymn* (Born 1973) | | Secretary, since 2018; Chief Legal Officer, since 2018 | | Senior Company Counsel of Wells Fargo Bank, N.A. since 2018 (previously Senior Counsel from 2007 to 2018). Vice President of Wells Fargo Funds Management, LLC from 2008 to 2014. | | |
Michael H. Whitaker (Born 1967) | | Chief Compliance Officer, since 2016 | | Senior Vice President and Chief Compliance Officer since 2016. Senior Vice President and Chief Compliance Officer for Fidelity Investments from 2007 to 2016. | | |
David Berardi (Born 1975) | | Assistant Treasurer, since 2009 | | Vice President of Wells Fargo Funds Management, LLC since 2009. Vice President of Evergreen Investment Management Company, LLC from 2008 to 2010. Manager of Fund Reporting and Control for Evergreen Investment Management Company, LLC from 2004 to 2010. | | |
| 1 | Jeremy DePalma acts as Treasurer of 76 funds and Assistant Treasurer of 77 funds in the Fund Complex. |
| 2 | The Statement of Additional Information includes additional information about the Trustees and is available, without charge, upon request, by calling 1-800-222-8222 or by visiting the website at wellsfargofunds.com. |
| * | Alexander Kymn became the Secretary and Chief Legal Officer effective April 17, 2018. |
| | | | |
| 30 | | Wells Fargo Asset Allocation Fund | | Appendix (unaudited) |
SALES CHARGE REDUCTIONS AND WAIVERS FOR CERTAIN INTERMEDIARIES
Ameriprise
Effective June 1, 2018, shareholders purchasing Fund shares through an Ameriprise Financial platform or account will be eligible only for the following Class A load waivers (front-end sales charge waivers), which may differ from those disclosed elsewhere in the Fund’s prospectus or Statement of Additional Information.
Front-end Sales Load Waivers on Class A Shares Available at Ameriprise Financial
| | • | | Employer-sponsored retirement plans (e.g., 401(k) plans, 457 plans, employer-sponsored 403(b) plans, profit sharing and money purchase pension plans and defined benefit plans). For purposes of this provision, employer-sponsored retirement plans do not include SEP IRAs, Simple IRAs or SAR-SEPs. |
| | • | | Shares purchased through an Ameriprise Financial investment advisory program (if an Advisory or similar share class for such investment advisory program is not available) |
| | • | | Shares purchased by third party investment advisors on behalf of their advisory clients through Ameriprise Financial’s platform (if an Advisory or similar share class for such investment advisory program is not available) |
| | • | | Shares purchased through reinvestment of distributions and dividend reinvestment when purchasing shares of the same Fund (but not any other fund within the same fund family) |
| | • | | Shares exchanged from Class C shares of the same fund in the month of or following the 10-year anniversary of the purchase date. To the extent that the Fund’s prospectus elsewhere provides for a waiver with respect to such shares following a shorter holding period, that waiver will apply to exchanges following such shorter period. To the extent that the Fund’s prospectus elsewhere provides for a waiver with respect to exchanges of Class C shares for load-waived shares, that waiver will also apply to such exchanges. |
| | • | | Employees and registered representatives of Ameriprise Financial or its affiliates and their immediate family members |
| | • | | Shares purchased by or through qualified accounts (including IRAs, Coverdell Education Savings Accounts, 401(k)s, 403(b) TSCAs subject to ERISA and defined benefit plans) that are held by a covered family member, defined as an Ameriprise financial advisor and/or the advisor’s spouse, advisor’s lineal ascendant (mother, father, grandmother, grandfather, great grandmother, great grandfather), advisor’s lineal descendant (son, step-son, daughter, step-daughter, grandson, granddaughter, great grandson, great granddaughter) or any spouse of a covered family member who is a lineal descendant |
| | • | | Shares purchased from the proceeds of redemptions within the same fund family, provided (1) the repurchase occurs within 90 days following the redemption, (2) the redemption and purchase occur in the same account, and (3) redeemed shares were subject to a front-end or deferred sales load (i.e. Rights of Reinstatement). Subject to the Fund’s policy regarding frequent purchases and redemptions of Fund shares, you may not be able to repurchase shares for the first 30 days after your redemption. |
Automatic Exchange of Class C Shares Available at Ameriprise Financial
| | • | | Class C shares will automatically exchange to Class A shares in the month of the 10-year anniversary of the purchase date. |
Merrill Lynch
Effective April 10, 2017, shareholders purchasing Fund shares through a Merrill Lynch platform or account will be eligible only for the following load waivers (front-end sales charge waivers and contingent deferred, or back-end, sales charge waivers) and discounts, which may differ from those disclosed elsewhere in the Fund’s prospectus or Statement of Additional Information.
Front-end Sales Load Waivers on Class A Shares available at Merrill Lynch
| | • | | Employer-sponsored retirement, deferred compensation and employee benefit plans (including health savings accounts) and trusts used to fund those plans, provided that the shares are not held in a commission-based brokerage account and shares are held for the benefit of the plan |
| | • | | Shares purchased by or through a 529 Plan |
| | • | | Shares purchased through a Merrill Lynch affiliated investment advisory program |
| | | | | | |
| Appendix (unaudited) | | Wells Fargo Asset Allocation Fund | | | 31 | |
| | • | | Shares purchased by third party investment advisors on behalf of their advisory clients through Merrill Lynch’s platform |
| | • | | Shares of funds purchased through the Merrill Edge Self-Directed platform (if applicable) |
| | • | | Shares purchased through reinvestment of capital gains distributions and dividend reinvestment when purchasing shares of the same fund (but not any other fund within the fund family) |
| | • | | Shares exchanged from Class C (i.e. level-load) shares of the same fund in the month of or following the 10-year anniversary of the purchase date |
| | • | | Employees and registered representatives of Merrill Lynch or its affiliates and their family members, as defined by Merrill Lynch, which may differ from the definition of family member in the Fund’s prospectus. |
| | • | | Directors or Trustees of the Fund, and employees of the Fund’s investment adviser or any of its affiliates, as described in the Fund’s prospectus |
| | • | | Shares purchased from the proceeds of redemptions within the same fund family, provided (1) the repurchase occurs within 90 days following the redemption, (2) the redemption and purchase occur in the same account, and (3) redeemed shares were subject to a front-end or deferred sales load (known as Rights of Reinstatement). Subject to the Fund’s policy regarding frequent purchases and redemptions of Fund shares, you may not be able to repurchase shares for the first 30 days after your redemption. |
CDSC Waivers on A, B and C Shares available at Merrill Lynch
| | • | | Death or disability of the shareholder |
| | • | | Shares sold as part of a systematic withdrawal plan as described in the Fund’s prospectus |
| | • | | Return of excess contributions from an IRA Account |
| | • | | Shares sold as part of a required minimum distribution for IRA and retirement accounts due to the shareholder reaching age 70½ |
| | • | | Shares sold to pay Merrill Lynch fees but only if the transaction is initiated by Merrill Lynch |
| | • | | Shares acquired through a right of reinstatement |
| | • | | Shares held in retirement brokerage accounts, that are exchanged for a lower cost share class due to transfer to certain fee based accounts or platforms (applicable to A and C shares only) |
Front-end load Discounts Available at Merrill Lynch: Breakpoints, Rights of Accumulation & Letters of Intent
| | • | | Breakpoints as described in the Fund’s prospectus |
| | • | | Rights of Accumulation (ROA) which entitle shareholders to breakpoint discounts will be automatically calculated based on the aggregated holding of fund family assets held by accounts within the purchaser’s household at Merrill Lynch. Eligible fund family assets not held at Merrill Lynch may be included in the ROA calculation only if the shareholder notifies his or her financial advisor about such assets. |
| | • | | Letters of Intent (LOI) which allow for breakpoint discounts based on anticipated purchases within a fund family, through Merrill Lynch, over a 13-month period of time (if applicable) |
Morgan Stanley
Effective on or about July 1, 2018, shareholders purchasing Fund shares through a Morgan Stanley Wealth Management transactional brokerage account will be eligible only for the following Class A load waivers (front-end sales charge waivers), which may differ from and be more limited than those disclosed in the Fund’s prospectus or Statement of Additional Information.
Front-end Sales Load Waivers on Class A Shares Available at Morgan Stanley
| | • | | Employer-sponsored retirement plans (e.g., 401(k) plans, 457 plans, employer-sponsored 403(b) plans, profit sharing and money purchase pension plans and defined benefit plans). For purposes of this provision, employer-sponsored retirement plans do not include SEP IRAs, Simple IRAs, SAR-SEPs or Keogh plans. |
| | • | | Morgan Stanley employee and employee-related accounts according to Morgan Stanley’s account linking rules |
| | • | | Shares purchased through reinvestment of dividends and capital gains distributions when purchasing shares of the same fund |
| | • | | Shares purchased through a Morgan Stanley self-directed brokerage account |
| | | | |
| 32 | | Wells Fargo Asset Allocation Fund | | Appendix (unaudited) |
| | • | | Class C (i.e., level-load) shares that are no longer subject to a contingent deferred sales charge and are exchanged to Class A shares of the same fund pursuant to Morgan Stanley Wealth Management’s share class exchange program. |
| | • | | Shares purchased from the proceeds of redemptions within the same fund family, provided (i) the repurchase occurs within 90 days following the redemption, (ii) the redemption and purchase occur in the same account, and (iii) redeemed shares were subject to a front-end or deferred sales charge. This waiver is subject to the Fund’s policy regarding frequent purchases and redemption of Fund shares, as discussed under “Account Information—Frequent Purchases and Redemptions of Fund Shares” in the Fund’s prospectus. |
| | | | | | |
| Portfolio of investments—April 30, 2018 | | Asset Allocation Trust | | | 33 | |
| | | | | | | | | | | | | | | | |
| Security name | | | | | | | | Shares | | | Value | |
| | | | |
Investment Companies: 98.90% | | | | | | | | | | | | | | | | |
GMO Alpha Only Fund Class IV (l) | | | | | | | | | | | 4,073,955 | | | $ | 89,056,652 | |
GMO Asset Allocation Bond Fund Class VI (l) | | | | | | | | | | | 21,294,584 | | | | 472,100,932 | |
GMO Core Plus Bond Fund Class IV (l) | | | | | | | | | | | 14,032,650 | | | | 294,825,967 | |
GMO Emerging Country Debt Fund Class IV (l) | | | | | | | | | | | 2,346,855 | | | | 66,298,659 | |
GMO Emerging Markets Fund Class VI (l) | | | | | | | | | | | 16,204,040 | | | | 555,798,569 | |
GMO International Equity Fund Class IV (l) | | | | | | | | | | | 26,020,026 | | | | 615,373,615 | |
GMO Opportunistic Income Fund Class VI (l) | | | | | | | | | | | 2,240,313 | | | | 59,413,094 | |
GMO Quality Equity Fund Class VI (l) | | | | | | | | | | | 8,748,679 | | | | 213,817,724 | |
GMO Risk Premium Fund Class VI (l) | | | | | | | | | | | 2,767,734 | | | | 74,202,961 | |
GMO SGM Major Markets Fund Class IV (l) | | | | | | | | | | | 2,748,659 | | | | 89,578,789 | |
GMO U.S. Equity Allocation Fund Class VI (l) | | | | | | | | | | | 14,084,092 | | | | 211,543,055 | |
GMO U.S. Treasury Fund Class IV (l) | | | | | | | | | | | 6,193,516 | | | | 154,714,019 | |
| | | | |
Total Investment Companies (Cost $2,566,458,925) | | | | | | | | | | | | | | | 2,896,724,036 | |
| | | | | | | | | | | | | | | | |
| | | | |
| | | Interest rate | | | Maturity date | | | Principal | | | | |
| Short-Term Investments: 1.28% | | | | | | | | | | | | | | | | |
| | | | |
| Time Deposit: 1.28% | | | | | | | | | | | | | | | | |
State Street Bank Euro Dollar | | | 0.28 | % | | | 5-1-2018 | | | $ | 37,490,853 | | | | 37,490,853 | |
| | | | | | | | | | | | | | | | |
| | | | |
Total Short-Term Investments (Cost $37,490,853) | | | | | | | | | | | | | | | 37,490,853 | |
| | | | | | | | | | | | | | | | |
| | | | | | | | |
| Total investments in securities (Cost $2,603,949,778) | | | 100.18 | % | | | 2,934,214,889 | |
Other assets and liabilities, net | | | (0.18 | ) | | | (5,295,216 | ) |
| | | | | | | | |
| Total net assets | | | 100.00 | % | | $ | 2,928,919,673 | |
| | | | | | | | |
| (l) | The issuer of the security is an affiliated person of the Trust as defined in the Investment Company Act of 1940. |
The accompanying notes are an integral part of these financial statements.
| | | | |
| 34 | | Asset Allocation Trust | | Portfolio of investments—April 30, 2018 |
Investments in Affiliates
An affiliated investment is an investment in which the Trust owns at least 5% of the outstanding voting shares of the issuer or as a result of other relationships, such as the Trust and the issuer having the same investment adviser. Transactions with issuers that were either affiliated persons of the Trust at the beginning of the period or the end of the period were as follows:
| | | | | | | | | | | | | | | | | | | | | | | | | | | | | | | | | | | | | | | | |
| | | Shares, beginning of period | | | Shares purchased | | | Shares sold | | | Shares, end of period | | | Net realized gains (losses) on sale at affiliated investment companies | | | Net realized gains (losses) on capital gain distributions from affiliated investment companies | | | Net change in unrealized gains (losses) on investments | | | Dividends from affiliated investment companies | | | Value, end of period | | | % of net assets | |
Investment Companies | | | | | | | | | | | | | | | | | | | | | | | | | | | | | | | | | | | | | |
GMO Alpha Only Fund Class IV | | | 4,819,350 | | | | 55,689 | | | | 801,084 | | | | 4,073,955 | | | $ | (1,620,081 | ) | | $ | 0 | | | $ | 3,504,161 | | | $ | 1,199,013 | | | $ | 89,056,652 | | | | | |
GMO Asset Allocation Bond Fund Class VI | | | 27,493,735 | | | | 250,389 | | | | 6,449,540 | | | | 21,294,584 | | | | (14,890,938 | ) | | | 0 | | | | 10,773,647 | | | | 5,566,150 | | | | 472,100,932 | | | | | |
GMO Core Plus Fund Class VI | | | 7,966,036 | | | | 8,262,778 | | | | 2,196,164 | | | | 14,032,650 | | | | (490,074 | ) | | | 0 | | | | (6,310,389 | ) | | | 7,680,616 | | | | 294,825,967 | | | | | |
GMO Emerging Country Debt Fund Class IV | | | 4,665,358 | | | | 206,502 | | | | 2,525,005 | | | | 2,346,855 | | | | 2,655,774 | | | | 0 | | | | (6,832,333 | ) | | | 5,983,505 | | | | 66,298,659 | | | | | |
GMO Emerging Markets Fund Class VI | | | 16,710,984 | | | | 4,326,659 | | | | 4,833,603 | | | | 16,204,040 | | | | 9,771,803 | | | | 0 | | | | 49,853,337 | | | | 16,741,764 | | | | 555,798,569 | | | | | |
GMO International Equity Fund Class IV | | | 34,044,547 | | | | 958,795 | | | | 8,983,316 | | | | 26,020,026 | | | | 13,759,135 | | | | 0 | | | | 60,089,302 | | | | 22,279,049 | | | | 615,373,615 | | | | | |
GMO Opportunitstic Income Fund Class VI | | | 3,946,238 | | | | 74,030 | �� | | | 1,779,955 | | | | 2,240,313 | | | | 6,116,738 | | | | 0 | | | | (4,695,431 | ) | | | 1,940,727 | | | | 59,413,094 | | | | | |
GMO Quality Equity Fund Class VI | | | 12,585,683 | | | | 784,756 | | | | 4,621,760 | | | | 8,748,679 | | | | 12,988,081 | | | | 14,960,140 | | | | 5,777,837 | | | | 4,116,560 | | | | 213,817,724 | | | | | |
GMO Risk Premium Fund Class VI | | | 2,812,507 | | | | 488,234 | | | | 533,007 | | | | 2,767,734 | | | | (141,802 | ) | | | 13,608,361 | | | | (11,775,322 | ) | | | 264,612 | | | | 74,202,961 | | | | | |
GMO SGM Major Markets Fund Class IV | | | 3,146,550 | | | | 120,306 | | | | 518,197 | | | | 2,748,659 | | | | (194,321 | ) | | | 3,859,050 | | | | (207,808 | ) | | | 0 | | | | 89,578,789 | | | | | |
GMO U.S. Equity Allocation Fund Class VI | | | 18,908,640 | | | | 1,887,989 | | | | 6,712,537 | | | | 14,084,092 | | | | (4,799,272 | ) | | | 23,701,971 | | | | 5,013,938 | | | | 4,549,268 | | | | 211,543,055 | | | | | |
GMO U.S. Treasury Fund Class IV | | | 11,763,164 | | | | 956,177 | | | | 6,525,825 | | | | 6,193,516 | | | | (77,247 | ) | | | 0 | | | | (10,685 | ) | | | 2,572,697 | | | | 154,714,019 | | | | | |
| | | | | | | | | | | | | | | | | | | | | | | | | | | | | | | | | | | | | | | | |
| | | | | | | | | | | | | | | | | | $ | 23,077,796 | | | $ | 56,129,522 | | | $ | 105,180,254 | | | $ | 72,893,961 | | | $ | 2,896,724,036 | | | | 98.90 | % |
| | | | | | | | | | | | | | | | | | | | | | | | | | | | | | | | | | | | | | | | |
The accompanying notes are an integral part of these financial statements.
| | | | | | |
| Statement of assets and liabilities—April 30, 2018 | | Asset Allocation Trust | | | 35 | |
| | | | |
| | | | |
| |
Assets | | | | |
Investments in affiliated investment companies, at value (cost $2,566,458,925) | | $ | 2,896,724,036 | |
Investments in unaffiliated securities, at value (cost $37,490,853) | | | 37,490,853 | |
Receivable for dividends and interest | | | 234,583 | |
Receivable from administrator | | | 12,118 | |
Prepaid expenses and other assets | | | 15 | |
| | | | |
Total assets | | | 2,934,461,605 | |
| | | | |
| |
Liabilities | | | | |
Payable for Fund shares redeemed | | | 5,270,755 | |
Payable for investments purchased | | | 226,622 | |
Accrued expenses and other liabilities | | | 44,555 | |
| | | | |
Total liabilities | | | 5,541,932 | |
| | | | |
Total net assets | | $ | 2,928,919,673 | |
| | | | |
| |
NET ASSETS CONSIST OF | | | | |
Paid-in capital | | $ | 2,704,931,687 | |
Accumulated net realized losses on investments | | | (106,277,125 | ) |
Net unrealized gains on investments | | | 330,265,111 | |
| | | | |
Total net assets | | $ | 2,928,919,673 | |
| | | | |
| |
COMPUTATION OF NET ASSET VALUE | | | | |
Net assets | | $ | 2,928,919,673 | |
Shares outstanding1 | | | 164,736,608 | |
Net asset value per share | | | $17.78 | |
| 1 | The Fund has an unlimited number of authorized shares. |
The accompanying notes are an integral part of these financial statements.
| | | | |
| 36 | | Asset Allocation Trust | | Statement of operations—year ended April 30, 2018 |
| | | | |
| | | | |
| |
Investment income | | | | |
Dividends from affiliated investment companies | | $ | 72,893,961 | |
Interest | | | 25,363 | |
| | | | |
Total investment income | | | 72,919,324 | |
| | | | |
| |
Expenses | | | | |
Custody and accounting fees | | | 11,776 | |
Professional fees | | | 44,861 | |
Shareholder report expenses | | | 4,187 | |
Other fees and expenses | | | 220 | |
| | | | |
Total expenses | | | 61,044 | |
Less: Fee waivers and/or expense reimbursements | | | (61,044 | ) |
| | | | |
Net expenses | | | 0 | |
| | | | |
Net investment income | | | 72,919,324 | |
| | | | |
| |
REALIZED AND UNREALIZED GAINS (LOSSES) ON INVESTMENTS | | | | |
| |
Net realized gains on: | | | | |
Sale of affiliated investment companies | | | 23,077,796 | |
Capital gain distributions from affiliated investment companies | | | 56,129,522 | |
| | | | |
Net realized gains on investments | | | 79,207,318 | |
Net change in unrealized gains (losses) on investments | | | 105,180,254 | |
| | | | |
Net realized and unrealized gains (losses) on investments | | | 184,387,572 | |
| | | | |
Net increase in net assets resulting from operations | | $ | 257,306,896 | |
| | | | |
The accompanying notes are an integral part of these financial statements.
| | | | | | |
| Statement of changes in net assets | | Asset Allocation Trust | | | 37 | |
| | | | | | | | | | | | | | | | |
| | | Year ended
April 30, 2018 | | | Year ended
April 30, 2017 | |
| | | | |
Operations | | | | | | | | | | | | | | | | |
Net investment income | | | | | | $ | 72,919,324 | | | | | | | $ | 84,561,741 | |
Net realized gains (losses) on investments | | | | | | | 79,207,318 | | | | | | | | (51,869,940 | ) |
Net change in unrealized gains (losses) on investments | | | | | | | 105,180,254 | | | | | | | | 309,311,011 | |
| | | | |
Net increase in net assets resulting from operations | | | | | | | 257,306,896 | | | | | | | | 342,002,812 | |
| | | | |
| | | | |
Capital share transactions | | | Shares | | | | | | | | Shares | | | | | |
Contributions | | | 227,359 | | | | 4,047,369 | | | | 237,079 | | | | 3,650,879 | |
Withdrawals | | | (44,374,814 | ) | | | (777,169,650 | ) | | | (69,180,703 | ) | | | (1,074,512,640 | ) |
| | | | |
Net decrease in net assets resulting from capital share transactions | | | | | | | (773,122,281 | ) | | | | | | | (1,070,861,761 | ) |
| | | | |
Total decrease in net assets | | | | | | | (515,815,385 | ) | | | | | | | (728,858,949 | ) |
| | | | |
| | | | |
Net assets | | | | | | | | | | | | | | | | |
Beginning of period | | | | | | | 3,444,735,058 | | | | | | | | 4,173,594,007 | |
| | | | |
End of period | | | | | | $ | 2,928,919,673 | | | | | | | $ | 3,444,735,058 | |
| | | | |
Undistributed net investment income | | | | | | $ | 0 | | | | | | | $ | 0 | |
| | | | |
The accompanying notes are an integral part of these financial statements.
| | | | |
| 38 | | Asset Allocation Trust | | Financial highlights |
(For a share outstanding throughout each period)
| | | | | | | | | | | | | | | | | | | | | | | | |
| | | Year ended April 30 | | | Year ended
September 30, 2013 | |
| | | 2018 | | | 2017 | | | 2016 | | | 2015 | | | 20141 | | |
Net asset value, beginning of period | | | $16.49 | | | | $15.02 | | | | $15.82 | | | | $15.60 | | | | $14.52 | | | | $13.19 | |
Net investment income | | | 0.44 | | | | 0.40 | | | | 0.64 | | | | 0.49 | | | | 0.19 | | | | 0.49 | |
Net realized and unrealized gains (losses) on investments | | | 0.85 | | | | 1.07 | | | | (1.44 | ) | | | (0.27 | ) | | | 0.89 | | | | 0.84 | |
| | | | | | | | | | | | | | | | | | | | | | | | |
Total from investment operations | | | 1.29 | | | | 1.47 | | | | (0.80 | ) | | | 0.22 | | | | 1.08 | | | | 1.33 | |
Net asset value, end of period | | | $17.78 | | | | $16.49 | | | | $15.02 | | | | $15.82 | | | | $15.60 | | | | $14.52 | |
Total return2 | | | 7.82 | % | | | 9.79 | % | | | (5.06 | )% | | | 1.41 | % | | | 7.44 | % | | | 10.08 | % |
Ratios to average net assets (annualized) | | | | | | | | | | | | | | | | | | | | |
Gross expenses3 | | | 0.00 | % | | | 0.00 | % | | | 0.00 | % | | | 0.00 | % | | | 0.00 | % | | | 0.00 | % |
Net expenses3 | | | 0.00 | % | | | 0.00 | % | | | 0.00 | % | | | 0.00 | % | | | 0.00 | % | | | 0.00 | % |
Net investment income3 | | | 2.21 | % | | | 2.25 | % | | | 3.60 | % | | | 2.90 | % | | | 2.12 | % | | | 3.23 | % |
Supplemental data | | | | | | | | | | | | | | | | | | | | |
Portfolio turnover rate | | | 14 | % | | | 19 | % | | | 24 | % | | | 42 | % | | | 40 | % | | | 36 | % |
Net assets, end of period (000s omitted) | | | $2,928,920 | | | | $3,444,735 | | | | $4,173,594 | | | | $5,783,480 | | | | $6,631,831 | | | | $6,694,019 | |
| 1 | For the seven months ended April 30, 2014. The Fund changed its fiscal year end from September 30 to April 30, effective April 30, 2014. |
| 2 | Returns for periods of less than one year are not annualized. |
| 3 | Excludes expenses incurred indirectly through investment in underlying funds. |
The accompanying notes are an integral part of these financial statements.
| | | | | | |
| Notes to financial statements | | Asset Allocation Trust | | | 39 | |
1. ORGANIZATION
Asset Allocation Trust (the “Trust”) was organized as a statutory trust under the laws of the state of Delaware on June 14, 2005 and is registered under the Investment Company Act of 1940, as amended (the “1940 Act”), as a no-load, open-end management investment company. As an investment company, the Trust follows the accounting and reporting guidance in Financial Accounting Standards Board Accounting Standards Codification Topic 946, Financial Services – Investment Companies. The Trust issues its shares of beneficial interest solely in private placement transactions that do not involve any “public offering” within the meaning of Section 4(2) of the Securities Act of 1933, as amended. The Trust is only offered to the Wells Fargo Asset Allocation Fund, a diversified series of Wells Fargo Funds Trust, an open-end management investment company, which was organized as a Delaware statutory trust on March 10, 1999.
The Trust operates as a “fund-of-funds” which primarily invests in shares of open-end mutual funds (“underlying funds”) managed by Grantham, Mayo, Van Otterloo & Co. LLC (“GMO”). Each underlying fund’s accounting policies are outlined in the underlying fund’s financial statements, which are available upon request.
2. SIGNIFICANT ACCOUNTING POLICIES
The following significant accounting policies, which are consistently followed in the preparation of the financial statements of the Trust, are in conformity with U.S. generally accepted accounting principles which require management to make estimates and assumptions that affect the reported amounts of assets and liabilities, disclosure of contingent assets and liabilities at the date of the financial statements, and the reported amounts of revenues and expenses during the reporting period. Actual results could differ from those estimates.
Securities valuation
All investments are valued each business day as of the close of regular trading on the New York Stock Exchange (generally 4 p.m. Eastern Time), although the Trust may deviate from this calculation time under unusual or unexpected circumstances.
Investments in each class of the underlying funds are valued at the net asset value per share as reported by the underlying funds. Some of the classes of the underlying funds are not publicly available.
Debt securities are valued at the evaluated bid price provided by an independent pricing service or, if a reliable price is not available, the quoted bid price from an independent broker-dealer.
Investments which are not valued using any of the methods discussed above are valued at their fair value, as determined in good faith by the Board of Trustees of the Trust. The Board of Trustees has established a Valuation Committee comprised of the Trustees and has delegated to it the authority to take any actions regarding the valuation of portfolio securities that the Valuation Committee deems necessary or appropriate, including determining the fair value of portfolio securities, unless the determination has been delegated to the Wells Fargo Asset Management Pricing Committee at Wells Fargo Funds Management, LLC (“Funds Management”). The Board of Trustees retains the authority to make or ratify any valuation decisions or approve any changes to the Valuation Procedures as it deems appropriate. On a quarterly basis, the Board of Trustees receives reports on any valuation actions taken by the Valuation Committee or the Wells Fargo Asset Management Pricing Committee which may include items for ratification.
Valuations of fair valued securities are compared to the next actual sales price when available, or other appropriate market values, to assess the continued appropriateness of the fair valuation methodologies used. These securities are fair valued on a day-to-day basis, taking into consideration changes to appropriate market information and any significant changes to the inputs considered in the valuation process until there is a readily available price provided on an exchange or by an independent pricing service. Valuations received from an independent pricing service or independent broker-dealer quotes are periodically validated by comparisons to most recent trades and valuations provided by other independent pricing services in addition to the review of prices by the adviser. Unobservable inputs used in determining fair valuations are identified based on the type of security, taking into consideration factors utilized by market participants in valuing the investment, knowledge about the issuer and the current market environment.
Investment transactions and income recognition
Investment transactions are recorded on trade date. Income dividends and capital gain distributions from underlying funds are recorded on the ex-dividend date. Capital gain distributions from the underlying funds are treated as realized gains.
Interest income is accrued daily and bond discounts are accreted and premiums are amortized daily. To the extent debt obligations are placed on non-accrual status, any related interest income may be reduced by writing off interest receivables when the collection of all or a portion of interest has become doubtful based on consistently applied procedures and the fair value has decreased. If the issuer subsequently resumes interest payments or when the collectability of interest is reasonably assured, the debt obligation is removed from non-accrual status.
| | | | |
| 40 | | Asset Allocation Trust | | Notes to financial statements |
Distributions to shareholders
Distributions to shareholders from net investment income and any net realized gains are recorded on the ex-dividend date and paid at least annually. Such distributions are determined in accordance with income tax regulations and may differ from U.S. generally accepted accounting principles. Dividend sources are estimated at the time of declaration. The tax character of distributions is determined as of the Fund’s fiscal year end. Therefore, a portion of the Fund’s distributions made prior to the Fund’s fiscal year end may be categorized as a tax return of capital at year end.
Federal and other taxes
The Trust intends to continue to qualify as a regulated investment company by distributing substantially all of its investment company taxable income and any net realized capital gains (after reduction for capital loss carryforwards) sufficient to relieve it from all, or substantially all, federal income taxes. Accordingly, no provision for federal income taxes was required.
The Trust’s income and federal excise tax returns and all financial records supporting those returns for the prior three fiscal years are subject to examination by the federal and Delaware revenue authorities. Management has analyzed the Trust’s tax positions taken on federal, state, and foreign tax returns for all open tax years and does not believe that there are any uncertain tax positions that require recognition of a tax liability.
As of April 30, 2018, the aggregate cost of all investments for federal income tax purposes was $2,648,920,654 and the unrealized gains (losses) consisted of:
| | | | |
Gross unrealized gains | | $ | 349,561,999 | |
Gross unrealized losses | | | (64,267,764 | ) |
Net unrealized gains | | $ | 285,294,235 | |
Reclassifications are made to the Trust’s capital accounts for permanent tax differences to reflect income and gains available for distribution (or available capital loss carryforwards) under federal income tax regulations. U.S. generally accepted accounting principles require that certain components of net assets be adjusted to reflect permanent differences between financial and tax reporting. These reclassifications have no effect on net assets or net asset values per share. The primary permanent differences causing such reclassifications are due to dividends deemed paid and dividends from certain securities. At April 30, 2018, as a result of permanent book-to-tax differences, the following reclassification adjustments were made on the Statement of Assets and Liabilities:
| | | | |
| Paid-in capital | | Undistributed net
investment income | | Accumulated net
realized losses
on investments |
| $82,053,609 | | $(72,919,324) | | $(9,134,285) |
As of April 30, 2018, the Fund had capital loss carryforwards which consist of $30,624,479 in short-term capital losses and $30,681,770 in long-term capital losses.
3. FAIR VALUATION MEASUREMENTS
Fair value measurements of investments are determined within a framework that has established a fair value hierarchy based upon the various data inputs utilized in determining the value of the Fund’s investments. The three-level hierarchy gives the highest priority to unadjusted quoted prices in active markets for identical assets or liabilities (Level 1) and the lowest priority to unobservable inputs (Level 3). The Fund’s investments are classified within the fair value hierarchy based on the lowest level of input that is significant to the fair value measurement. The inputs are summarized into three broad levels as follows:
| ∎ | | Level 1 – quoted prices in active markets for identical securities |
| ∎ | | Level 2 – other significant observable inputs (including quoted prices for similar securities, interest rates, prepayment speeds, credit risk, etc.) |
| ∎ | | Level 3 – significant unobservable inputs (including the Trust’s own assumptions in determining the fair value of investments) |
The inputs or methodologies used for valuing investments in securities are not necessarily an indication of the risk associated with investing in those securities.
| | | | | | |
| Notes to financial statements | | Asset Allocation Trust | | | 41 | |
The following is a summary of the inputs used in valuing the Trust’s assets and liabilities as of April 30, 2018:
| | | | | | | | | | | | | | | | |
| Investments in securities | | Quoted prices
(Level 1) | | | Other significant
observable inputs (Level 2) | | | Significant unobservable inputs (Level 3) | | | Total | |
Assets | | | | | | | | | | | | | | | | |
Investments in: | | | | | | | | | | | | | | | | |
| | | | |
Investment companies | | $ | 2,896,724,036 | | | $ | 0 | | | $ | 0 | | | $ | 2,896,724,036 | |
| | | | |
Short-term investments | | | | | | | | | | | | | | | | |
Time deposit | | | 0 | | | | 37,490,853 | | | | 0 | | | | 37,490,853 | |
Total assets | | $ | 2,896,724,036 | | | $ | 37,490,853 | | | $ | 0 | | | $ | 2,934,214,889 | |
The Trust recognizes transfers between levels within the fair value hierarchy at the end of the reporting period. At April 30, 2018, the Trust did not have any transfers into/out of Level 1, Level 2, or Level 3.
4. TRANSACTIONS WITH AFFILIATES
GMO, a private company founded in 1977, is the adviser to the Trust. GMO also serves as adviser to each of the underlying funds. GMO does not receive a fee from the Trust for its advisory services. However, the Trust incurs fees and expenses indirectly as a shareholder of the underlying GMO–managed funds, including its indirect share of management or other fees paid to GMO.
Funds Management, an indirect wholly owned subsidiary of Wells Fargo & Company, serves as the administrator to the Trust. As administrator, Funds Management provides the Trust with facilities, equipment, and personnel. Funds Management receives no compensation from the Trust for its services. During the year ended April 30, 2018, Funds Management voluntarily reimbursed the Trust for expenses in the amount of $61,044.
5. INVESTMENT PORTFOLIO TRANSACTIONS
Purchases and sales of investments, excluding U.S. government obligations (if any) and short-term securities, for the year ended April 30, 2018 were $446,629,068 and $1,114,898,230, respectively.
6. DISTRIBUTIONS TO SHAREHOLDERS
For the year ended April 30, 2018 and year ended April 30, 2017, the Trust paid $82,053,609 and $88,720,742, respectively, of deemed dividends to Wells Fargo Asset Allocation Fund through redemptions of shares.
As of April 30, 2018, the components of distributable earnings on a tax basis were as follows:
| | |
Unrealized
gains | | Capital loss
carryforward |
| $285,294,235 | | $(61,306,249) |
7. INDEMNIFICATION
Under the Trust’s organizational documents, the officers and Trustees have been granted certain indemnification rights against certain liabilities that may arise out of performance of their duties to the Trust. Additionally, in the normal course of business, the Trust may enter into contracts with service providers that contain a variety of indemnification clauses. The Trust’s maximum exposure under these arrangements is dependent on future claims that may be made against the Trust and, therefore, cannot be estimated.
8. SUBSEQUENT EVENTS
On June 15, 2018, the Trust redeemed its investments in the underlying GMO funds and received cash and securities in-kind. Subsequently, the Trust’s sole investor, Wells Fargo Asset Allocation Fund, redeemed most of its investments out of the Trust and received cash from the Trust. The portfolio of securities received through the redemption were sold to various portfolios of Wells Master Trust pursuant to Rule 17a-7 under the 1940 Act. The cash received from these transactions were distributed to Wells Fargo Asset Allocation Fund which redeemed all of its remaining investments in the Trust. With its primary investor fully redeemed out of the Trust, the Trust is expected to terminate and liquidate on June 28, 2018.
| | | | |
| 42 | | Asset Allocation Trust | | Report of independent registered public accounting firm |
BOARD OF TRUSTEES AND SHAREHOLDERS OF ASSET ALLOCATION TRUST:
Opinion on the Financial Statements
We have audited the accompanying statements of assets and liabilities of the Asset Allocation Trust (the “Trust”), including the portfolio of investments, as of April 30, 2018, and the related statements of operations for the year then ended, the statements of changes in net assets for each of the years in the two-year period then ended, and the related notes (collectively, the “financial statements”) and the financial highlights for each of the years in the four-year period then ended, the period from October 1, 2013 to April 20, 2014 and the year ended September 30, 2013 . In our opinion, the financial statements and financial highlights present fairly, in all material respects, the financial position of the Trust as of April 30, 2018, the results of its operations, the changes in its net assets for each of the years in the two-year period then ended and the financial highlights for the years or periods noted above, in conformity with U.S. generally accepted accounting principles.
Basis for Opinion
These financial statements and financial highlights are the responsibility of the Trust’s management. Our responsibility is to express an opinion on these financial statements and financial highlights based on our audits. We are a public accounting firm registered with the Public Company Accounting Oversight Board (United States) (“PCAOB”) and are required to be independent with respect to the Trust in accordance with the U.S. federal securities laws and the applicable rules and regulations of the Securities and Exchange Commission and the PCAOB.
We conducted our audits in accordance with the standards of the PCAOB. Those standards require that we plan and perform the audit to obtain reasonable assurance about whether the financial statements and financial highlights are free of material misstatement, whether due to error or fraud. Our audits included performing procedures to assess the risks of material misstatement of the financial statements and financial highlights, whether due to error or fraud, and performing procedures that respond to those risks. Such procedures included examining, on a test basis, evidence regarding the amounts and disclosures in the financial statements and financial highlights. Such procedures also included confirmation of securities owned as of April 30, 2018, by correspondence with the custodian and brokers, or by other appropriate auditing procedures. Our audits also included evaluating the accounting principles used and significant estimates made by management, as well as evaluating the overall presentation of the financial statements and financial highlights. We believe that our audits provide a reasonable basis for our opinion.
We have not been able to determine the specific year that we began serving as the auditor of one or more Wells Fargo Funds investment companies, however we are aware that we have served as the auditor of one or more Wells Fargo Funds investment companies since at least 1955.
Boston, Massachusetts
June 25, 2018
| | | | | | |
| Other information (unaudited) | | Asset Allocation Trust | | | 43 | |
TAX INFORMATION
For corporate shareholders, pursuant to Section 854 of the Internal Revenue Code, 11.48% of ordinary income dividends qualify for the corporate dividends-received deduction for the fiscal year ended April 30, 2018.
Pursuant to Section 854 of the Internal Revenue Code, $46,012,269 of income dividends paid during the fiscal year ended April 30, 2018 has been designated as qualified dividend income (QDI).
Pursuant to Section 853 of the Internal Revenue Code, the following amounts have been designated as foreign taxes paid for the fiscal year ended April 30, 2018. These amounts may be less than the actual foreign taxes paid for financial statement purposes. Foreign taxes paid or withheld should be included in taxable income with an offsetting deduction from gross income or as a credit for taxes paid to foreign governments. None of the income was derived from ineligible foreign sources as defined under Section 901(j) of the Internal Revenue Code.
| | | | |
Creditable foreign taxes paid | | Per share amount | | Foreign income as % of ordinary income distributions |
| $5,468,778 | | $0.0332 | | 47.56% |
PROXY VOTING INFORMATION
A description of the policies and procedures that the Trust uses to determine how to vote proxies relating to portfolio securities is available, upon request, by calling 1-800-222-8222, visiting our website at wellsfargofunds.com, or visiting the SEC website at sec.gov. Information regarding how the Trust voted proxies relating to portfolio securities during the most recent 12-month period ended June 30 is available on the Trust’s website at wellsfargofunds.com or by visiting the SEC website at sec.gov.
PORTFOLIO HOLDINGS INFORMATION
The complete portfolio holdings for the Trust are publicly available monthly on the Trust’s website (wellsfargofunds.com), on a one-month delayed basis. In addition, top ten holdings information (excluding derivative positions) for the Trust is publicly available on the Trust’s website on a monthly, seven-day or more delayed basis. The Trust files its complete schedule of portfolio holdings with the SEC for the first and third quarters of each fiscal year on Form N-Q, which is available by visiting the SEC website at sec.gov. In addition, the Trust’s Form N-Q may be reviewed and copied at the SEC’s Public Reference Room in Washington, DC, and at regional offices in New York City, at 233 Broadway, and in Chicago, at 175 West Jackson Boulevard, Suite 900. Information about the Public Reference Room may be obtained by calling 1-800-SEC-0330.
| | | | |
| 44 | | Asset Allocation Trust | | Other information (unaudited) |
BOARD OF TRUSTEES AND OFFICERS
The following table provides basic information about the Board of Trustees (the “Trustees”) and Officers of Asset Allocation Trust. The mailing address of each Trustee and Officer is 525 Market Street, 12th Floor, San Francisco, CA 94105. Each Trustee and Officer serves an indefinite term, however, each Trustee serves such term until reaching the mandatory retirement age established by the Trustees.
Independent Trustees
| | | | | | |
Name and
year of birth | | Position held and
length of service* | | Principal occupations during past five years or longer | | Current other
public company or
investment company
directorships |
William R. Ebsworth (Born 1957) | | Trustee, since 2015 | | Retired. From 1984 to 2013, equities analyst, portfolio manager, research director and chief investment officer at Fidelity Management and Research Company in Boston, Tokyo, and Hong Kong, and retired in 2013 as Chief Investment Officer of Fidelity Strategic Advisers, Inc. where he led a team of investment professionals managing client assets. Prior thereto, Board member of Hong Kong Securities Clearing Co., Hong Kong Options Clearing Corp., the Thailand International Fund, Ltd., Fidelity Investments Life Insurance Company, and Empire Fidelity Investments Life Insurance Company. Board member of the Forté Foundation (non-profit organization) and the Vincent Memorial Hospital Endowment (non-profit organization), where he serves on the Investment Committee and as a Chair of the Audit Committee. Mr. Ebsworth is a CFA® charterholder. | | Wells Fargo family of funds consisting of 153 funds, |
Jane A. Freeman (Born 1953) | | Trustee, since 2015; Chair Liaison, since 2018 | | Retired. From 2012 to 2014 and 1999 to 2008, Chief Financial Officer of Scientific Learning Corporation. From 2008 to 2012, Ms. Freeman provided consulting services related to strategic business projects. Prior to 1999, Portfolio Manager at Rockefeller & Co. and Scudder, Stevens & Clark. Board member of the Harding Loevner Funds from 1996 to 2014, serving as both Lead Independent Director and chair of the Audit Committee. Board member of the Russell Exchange Traded Funds Trust from 2011 to 2012 and the chair of the Audit Committee. Ms. Freeman is a Board Member of Ruth Bancroft Garden (non-profit organization) and the Glimmerglass Festival. She is also an inactive Chartered Financial Analyst. | | Wells Fargo family of funds consisting of 153 funds, |
Isaiah Harris, Jr. (Born 1952) | | Trustee, since 2010 | | Retired. Chairman of the Board of CIGNA Corporation since 2009, and Director since 2005. From 2003 to 2011, Director of Deluxe Corporation. Prior thereto, President and CEO of BellSouth Advertising and Publishing Corp. from 2005 to 2007, President and CEO of BellSouth Enterprises from 2004 to 2005 and President of BellSouth Consumer Services from 2000 to 2003. Emeritus member of the Iowa State University Foundation Board of Governors. Emeritus Member of the Advisory Board of Iowa State University School of Business. Advisory Board Member, Palm Harbor Academy (charter school). Advisory Board Member, Child Evangelism Fellowship (non-profit). Mr. Harris is a certified public accountant (inactive status). | | CIGNA Corporation; Wells Fargo family of funds consisting of 153 funds, |
Judith M. Johnson (Born 1949) | | Trustee, since 2010; Audit Committee Chairman, since 2010 | | Retired. Prior thereto, Chief Executive Officer and Chief Investment Officer of Minneapolis Employees Retirement Fund from 1996 to 2008. Ms. Johnson is an attorney, certified public accountant and a certified managerial accountant. | | Wells Fargo family of funds consisting of 153 funds, |
David F. Larcker (Born 1950) | | Trustee, since 2010 | | James Irvin Miller Professor of Accounting at the Graduate School of Business, Stanford University, Director of the Corporate Governance Research Initiative and Senior Faculty of The Rock Center for Corporate Governance since 2006. From 2005 to 2008, Professor of Accounting at the Graduate School of Business, Stanford University. Prior thereto, Ernst & Young Professor of Accounting at The Wharton School, University of Pennsylvania from 1985 to 2005. | | Wells Fargo family of funds consisting of 153 funds, |
| | | | | | |
| Other information (unaudited) | | Asset Allocation Trust | | | 45 | |
| | | | | | |
Name and
year of birth | | Position held and
length of service* | | Principal occupations during past five years or longer | | Current other
public company or
investment company
directorships |
Olivia S. Mitchell (Born 1953) | | Trustee, since 2010; Governance Committee Chairman, since 2018 | | International Foundation of Employee Benefit Plans Professor, Wharton School of the University of Pennsylvania since 1993. Director of Wharton’s Pension Research Council and Boettner Center on Pensions & Retirement Research, and Research Associate at the National Bureau of Economic Research. Previously, Cornell University Professor from 1978 to 1993. | | Wells Fargo family of funds consisting of 153 funds, |
Timothy J. Penny (Born 1951) | | Trustee, since 2010; Chairman, since 2018; Vice Chairman, from 2017 to 2018 | | President and Chief Executive Officer of Southern Minnesota Initiative Foundation, a non-profit organization, since 2007. Member of the Board of Trustees of NorthStar Education Finance, Inc., a non-profit organization, since 2007. | | Wells Fargo family of funds consisting of 153 funds, |
James G. Polisson (Born 1959) | | Trustee, since 2018; Advisory Board Member, from 2017 to 2018 | | Retired. Chief Marketing Officer, Source (ETF) UK Services, Ltd, from 2015 to 2017. From 2012 to 2015, Principal of The Polisson Group, LLC, a management consulting, corporate advisory and principal investing company. Chief Executive Officer and Managing Director at Russell Investments, Global Exchange Traded Funds from 2010 to 2012. Managing Director of Barclays Global Investors from 1998 to 2010 and Global Chief Marketing Officer for iShares and Barclays Global Investors from 2000 to 2010. Trustee of the San Francisco Mechanics’ Institute, a non-profit organization, from 2013 to 2015. Board member of the Russell Exchange Traded Fund Trust from 2011 to 2012. Director of Barclays Global Investors Holdings Deutschland GmbH from 2006 to 2009. Mr. Polisson is an attorney and has a retired status with the Massachusetts and District of Columbia Bar Associations. | | Wells Fargo family of funds consisting of 153 funds, |
Michael S. Scofield (Born 1943) | | Trustee, since 2005 | | Served on the Investment Company Institute’s Board of Governors and Executive Committee from 2008-2011 as well the Governing Council of the Independent Directors Council from 2006-2011 and the Independent Directors Council Executive Committee from 2008-2011. Trustee of the Evergreen Fund complex (and its predecessors) from 1984 to 2010. Chairman of the Evergreen Funds from 2000-2010. Former Trustee of the Mentor Funds. Retired Attorney, Law Offices of Michael S. Scofield. | | Wells Fargo family of funds consisting of 153 funds, |
Pamela Wheelock (Born 1959) | | Trustee, since 2018; Advisory Board Member, from 2017 to 2018 | | Chief Operating Officer, Twin Cities Habitat for Humanity, since January, 2017. Vice President of University Services, University of Minnesota from 2012 to 2017. Prior thereto, on the Board of Directors, Governance Committee and Finance Committee for the Minnesota Philanthropy Partners (Saint Paul Foundation) from 2012 to 2018, Interim President and Chief Executive Officer of Blue Cross Blue Shield of Minnesota from 2010 to 2011, Chairman of the Board from 2009 to 2011 and Board Director from 2003 to 2015. Vice President, Leadership and Community Engagement, Bush Foundation, Saint Paul, Minnesota (a private foundation) from 2009 to 2011. Executive Vice President and Chief Financial Officer, Minnesota Sports and Entertainment from 2004 to 2009 and Senior Vice President from 2002 to 2004. Commissioner of Finance, State of Minnesota, from 1999 to 2002. Currently the Board Chair of the Minnesota Wild Foundation since 2010. | | Wells Fargo family of funds consisting of 153 funds, |
| * | Length of service dates reflect the Trustee’s commencement of service with the Trust’s predecessor entities, where applicable. |
| | | | |
| 46 | | Asset Allocation Trust | | Other information (unaudited) |
Officers
| | | | | | |
Name and year of birth | | Position held and length of service | | Principal occupations during past five years or longer | | |
Andrew Owen (Born 1960) | | President, since 2017 | | Executive Vice President of Wells Fargo & Company and Head of Affiliated Managers, Wells Fargo Asset Management, since 2014. In addition, Mr. Owen is currently President, Chief Executive Officer and Director of Wells Fargo Funds Management, LLC since 2017. Prior thereto, Executive Vice President responsible for marketing, investments and product development for Wells Fargo Funds Management, LLC, from 2009 to 2014. | | |
Jeremy DePalma (Born 1974) | | Treasurer, since 2012 | | Senior Vice President of Wells Fargo Funds Management, LLC since 2009. Senior Vice President of Evergreen Investment Management Company, LLC from 2008 to 2010 and head of the Fund Reporting and Control Team within Fund Administration from 2005 to 2010. | | |
Alexander Kymn* (Born 1973) | | Secretary, since 2018; Chief Legal Officer, since 2018 | | Senior Company Counsel of Wells Fargo Bank, N.A. since 2018 (previously Senior Counsel from 2007 to 2018). Vice President of Wells Fargo Funds Management, LLC from 2008 to 2014. | | |
Michael H. Whitaker (Born 1967) | | Chief Compliance Officer, since 2016 | | Senior Vice President and Chief Compliance Officer since 2016. Senior Vice President and Chief Compliance Officer for Fidelity Investments from 2007 to 2016. | | |
David Berardi (Born 1975) | | Assistant Treasurer, since 2009 | | Vice President of Wells Fargo Funds Management, LLC since 2009. Vice President of Evergreen Investment Management Company, LLC from 2008 to 2010. Manager of Fund Reporting and Control for Evergreen Investment Management Company, LLC from 2004 to 2010. | | |
| * | Alexander Kymn became the Secretary effective April 17, 2018. |
This page is intentionally left blank.
This page is intentionally left blank.

For more information
More information about Wells Fargo Funds is available free upon request. To obtain literature, please write, email, visit the Fund’s website, or call:
Wells Fargo Funds
P.O. Box 8266
Boston, MA 02266-8266
Email: fundservice@wellsfargo.com
Website: wellsfargofunds.com
Individual investors: 1-800-222-8222
Retail investment professionals: 1-888-877-9275
Institutional investment professionals:
1-866-765-0778
This report and the financial statements contained herein are submitted for the general information of the shareholders of the Fund. If this report is used for promotional purposes, distribution of the report must be accompanied or preceded by a current prospectus. Before investing, please consider the investment objectives, risks, charges, and expenses of the investment. For a current prospectus and, if available, a summary prospectus, containing this information, call 1-800-222-8222 or visit the Fund’s website at wellsfargofunds.com. Read the prospectus carefully before you invest or send money.
Wells Fargo Asset Management (WFAM) is a trade name used by the asset management businesses of Wells Fargo & Company. Wells Fargo Funds Management, LLC, a wholly owned subsidiary of Wells Fargo & Company, provides investment advisory and administrative services for Wells Fargo Funds. Other affiliates of Wells Fargo & Company provide subadvisory and other services for the funds. The funds are distributed by Wells Fargo Funds Distributor, LLC, Member FINRA, an affiliate of Wells Fargo & Company. Neither Wells Fargo Funds Distributor nor Wells Fargo Funds Management holds fund shareholder accounts or assets. This material is for general informational and educational purposes only and is NOT intended to provide investment advice or a recommendation of any kind—including a recommendation for any specific investment, strategy, or plan.
NOT FDIC INSURED ◾ NO BANK GUARANTEE ◾ MAY LOSE VALUE
© 2018 Wells Fargo Funds Management, LLC. All rights reserved.
| | |
 | | 311862 06-18 A224/AR224 04-18 |
(a) As of the end of the period covered by the report, Wells Fargo Funds Trust has adopted a code of ethics that applies to its President and Treasurer. A copy of the code of ethics is filed as an exhibit to this Form N-CSR.
(c) During the period covered by this report, there were no amendments to the provisions of the code of ethics adopted in Item 2(a) above.
(d) During the period covered by this report, there were no implicit or explicit waivers to the provisions of the code of ethics adopted in Item 2(a) above.
| ITEM 3. | AUDIT COMMITTEE FINANCIAL EXPERT |
The Board of Trustees of Wells Fargo Funds Trust has determined that Judith Johnson is an audit committee financial expert, as defined in Item 3 of Form N-CSR. Mrs. Johnson is independent for purposes of Item 3 of Form N-CSR.
| ITEM 4. | PRINCIPAL ACCOUNTANT FEES AND SERVICES |
(a), (b), (c), (d) The following table presents aggregate fees billed in each of the last two fiscal years for services rendered
to the Registrant by the Registrant’s principal accountant. These fees were billed to the registrant and were approved by
the Registrant’s audit committee.
| | | | | | | | |
| | | Fiscal year
ended
April 30, 2018 | | | Fiscal year
ended
April 30, 2017 | |
Audit fees | | $ | 55,365 | | | $ | 53,454 | |
Audit-related fees | | | — | | | | — | |
Tax fees (1) | | | 8,000 | | | | 7,700 | |
All other fees | | | — | | | | — | |
| | | | | | | | |
| | $ | 63,365 | | | $ | 61,154 | |
| | | | | | | | |
| (1) | Tax fees consist of fees for tax compliance, tax advice, tax planning and excise tax. |
(e) The Chairman of the Audit Committees is authorized to pre-approve: (1) audit services for the mutual funds of Wells Fargo Funds Trust; (2) non-audit tax or compliance consulting or training services provided to the Funds by the independent auditors (“Auditors”) if the fees for any particular engagement are not anticipated to exceed $50,000; and (3) non-audit tax or compliance consulting or training services provided by the Auditors to a Fund’s investment adviser and its controlling entities (where pre-approval is required because the engagement relates directly to the operations and financial reporting of the Fund) if the fee to the Auditors for any particular engagement is not anticipated to exceed $50,000. For any such pre-approval sought from the Chairman, Management shall prepare a brief description of the proposed services. If the Chairman approves of such service, he or she shall sign the statement prepared by Management. Such written statement shall be presented to the full Committees at their next regularly scheduled meetings.
(f) Not applicable
(g) Not applicable
(h) Not applicable
| ITEM 5. | AUDIT COMMITTEE OF LISTED REGISTRANTS |
Not applicable.
A Portfolio of Investments for each series of Wells Fargo Funds Trust is included as part of the report to shareholders filed under Item 1 of this Form.
| ITEM 7. | DISCLOSURE OF PROXY VOTING POLICIES AND PROCEDURES FOR CLOSED-END MANAGEMENT INVESTMENT COMPANIES |
Not applicable.
| ITEM 8. | PORTFOLIO MANAGERS OF CLOSED-END MANAGEMENT INVESTMENT COMPANIES |
Not applicable.
| ITEM 9. | PURCHASES OF EQUITY SECURITIES BY CLOSED-END MANAGEMENT INVESTMENT COMPANY AND AFFILIATED PURCHASERS |
Not applicable.
| ITEM 10. | SUBMISSION OF MATTERS TO A VOTE OF SECURITY HOLDERS |
There have been no material changes to the procedures by which shareholders may recommend nominees to the registrant’s Board of Trustees that have been implemented since the registrant’s last provided disclosure in response to the requirements of this Item.
| ITEM 11. | CONTROLS AND PROCEDURES |
(a) The President and Treasurer have concluded that the Wells Fargo Funds Trust (the “Trust”) disclosure controls and procedures (as defined in Rule 30a-3(c) under the Investment Company Act of 1940) provide reasonable assurances that material information relating to the Trust is made known to them by the appropriate persons based on their evaluation of these controls and procedures as of a date within 90 days of the filing of this report.
(b) There were no significant changes in the Trust’s internal controls over financial reporting (as defined in Rule 30a-3(d) under the Investment Company Act of 1940) that occurred during the second fiscal quarter of the period covered by this report that materially affected, or is reasonably likely to materially affect, the registrant’s internal control over financial reporting.
(a)(1) Code of Ethics pursuant to Item 2 of Form N-CSR is filed and attached hereto as Exhibit COE.
(a)(2) Certification pursuant to Rule 30a-2(a) under the Investment Company Act of 1940 (17 CFR 270.30a-2(a)) is filed and attached hereto as Exhibit 99.CERT.
(a)(3) Not applicable.
(b) Certification pursuant to Rule 30a-2(b) under the Investment Company Act of 1940 (17 CFR 270.30a-2(b)) is filed and attached hereto as Exhibit 99.906CERT.
SIGNATURES
Pursuant to the requirements of the Securities Exchange Act of 1934 and the Investment Company Act of 1940, the registrant has duly caused this report to be signed on its behalf by the undersigned, thereunto duly authorized.
| | |
| Wells Fargo Funds Trust |
| |
| By: | | /s/ Andrew Owen |
| | Andrew Owen |
| | President |
| |
| Date: | | June 25, 2018 |
Pursuant to the requirements of the Securities Exchange Act of 1934 and the Investment Company Act of 1940, this report has been signed below by the following persons on behalf of the registrant and in the capacities and on the date indicated.
| | |
| Wells Fargo Funds Trust |
| |
| By: | | /s/ Andrew Owen |
| | Andrew Owen |
| | President |
| |
| Date: | | June 25, 2018 |
| |
| By: | | /s/Jeremy DePalma |
| | Jeremy DePalma |
| | Treasurer |
| |
| Date: | | June 25, 2018 |