
UNITED STATES
SECURITIES AND EXCHANGE COMMISSION
Washington, D.C. 20549
FORM N-CSR
CERTIFIED SHAREHOLDER REPORT OF REGISTERED
MANAGEMENT INVESTMENT COMPANIES
Investment Company Act file number: 811-09253
Wells Fargo Funds Trust
(Exact name of registrant as specified in charter)
525 Market St., San Francisco, CA 94105
(Address of principal executive offices) (Zip code)
C. David Messman
Wells Fargo Funds Management, LLC
525 Market St., San Francisco, CA 94105
(Name and address of agent for service)
Registrant’s telephone number, including area code: 800-222-8222
Date of fiscal year end: July 31, 2018
Registrant is making a filing for 11 of its series:
Wells Fargo Capital Growth Fund, Wells Fargo Disciplined U.S. Core Fund, Wells Fargo Endeavor Select Fund, Wells Fargo Growth Fund, Wells Fargo Intrinsic Value Fund, Wells Fargo Large Cap Core Fund, Wells Fargo Large Cap Growth Fund, Wells Fargo Large Company Value Fund, Wells Fargo Low Volatility U.S. Equity Fund, Wells Fargo Omega Growth Fund, and Wells Fargo Premier Large Company Growth Fund.
Date of reporting period: July 31, 2018
ITEM 1. REPORT TO STOCKHOLDERS
Annual Report
July 31, 2018

Wells Fargo Capital Growth Fund


Reduce clutter. Save trees.
Sign up for electronic delivery of prospectuses and shareholder reports at wellsfargo.com/advantagedelivery
Contents
The views expressed and any forward-looking statements are as of July 31, 2018, unless otherwise noted, and are those of the Fund managers and/or Wells Fargo Funds Management, LLC. Discussions of individual securities, or the markets generally, or any Wells Fargo Fund are not intended as individual recommendations. Future events or results may vary significantly from those expressed in any forward-looking statements. The views expressed are subject to change at any time in response to changing circumstances in the market. Wells Fargo Funds Management, LLC and the Fund disclaim any obligation to publicly update or revise any views expressed or forward-looking statements.
NOT FDIC INSURED ◾ NO BANK GUARANTEE ◾ MAY LOSE VALUE
| | | | |
| 2 | | Wells Fargo Capital Growth Fund | | Letter to shareholders (unaudited) |

Andrew Owen
President
Wells Fargo Funds
After advancing during the summer and fall of 2017 in a roughly synchronized way, economic growth and stock markets globally diverged during the first seven months of 2018.
Dear Shareholder:
We are pleased to offer you this annual report for the Wells Fargo Capital Growth Fund for the 12-month period that ended July 31, 2018. After advancing during the summer and fall of 2017 in a roughly synchronized way, economic growth and stock markets globally diverged during the first seven months of 2018. For fixed-income investors, higher U.S. interest rates, rising inflation, and intensifying global geopolitical tensions tended to restrain taxable bond prices while high-yield and municipal bond investors generally enjoyed positive returns.
For the period, U.S. stocks, as measured by the S&P 500 Index,1 gained 16.24%, and international stocks, as measured by the MSCI ACWI ex USA Index (Net),2 added 5.94%. Emerging market stocks, as measured by the MSCI EM Index (Net),3 added 4.36%. In bond markets, the Bloomberg Barclays U.S. Aggregate Bond Index4 declined 0.80% while fixed-income investments outside the U.S. fell 0.27%, according to the Bloomberg Barclays Global Aggregate ex-USD Index.5 The Bloomberg Barclays Municipal Bond Index6 added 0.99%, and the ICE BofAML U.S. High Yield Index7 was up 2.49%.
Volatility increased as summer turned to fall in 2017, although data generally was favorable.
During the third quarter of 2017, investor expectations rose and fell amid shifting geopolitical tensions, particularly in Asia as North Korea’s nuclear aspirations and U.S./China trade rhetoric caused concerns. In the U.S., corporate earnings and consumer confidence improved. The U.S. Bureau of Economic Analysis reported that annualized U.S. gross domestic product (GDP) growth for the quarter was 2.8%. The rate of inflation was below the U.S. Federal Reserve’s (Fed’s) targets.
Economic momentum increased in Europe; the European Central Bank (ECB) held its rates steady at low levels and continued its quantitative easing bond-buying program with the goal of sparking economic activity. In emerging markets, many countries benefited from stronger currencies versus the U.S. dollar while commodity price increases benefited countries that rely on natural resources for exports.
| 1 | The S&P 500 Index consists of 500 stocks chosen for market size, liquidity, and industry group representation. It is a market-value-weighted index with each stock’s weight in the index proportionate to its market value. You cannot invest directly in an index. |
| 2 | The Morgan Stanley Capital International (MSCI) All Country World Index (ACWI) ex USA Index (Net) is a free-float-adjusted market-capitalization-weighted index that is designed to measure the equity market performance of developed markets, excluding the United States and Canada. Source: MSCI. MSCI makes no express or implied warranties or representations and shall have no liability whatsoever with respect to any MSCI data contained herein. The MSCI data may not be further redistributed or used as a basis for other indices or any securities or financial products. This report is not approved, reviewed, or produced by MSCI. You cannot invest directly in an index. |
| 3 | The MSCI Emerging Markets (EM) Index (Net) is a free-float-adjusted market-capitalization-weighted index that is designed to measure large- and mid-cap equity market performance of emerging markets. The MSCI EM Index (Net) consists of the following 24 emerging market country indices: Brazil, Chile, China, Colombia, Czech Republic, Egypt, Greece, Hungary, India, Indonesia, Korea, Malaysia, Mexico, Pakistan, Peru, the Philippines, Poland, Qatar, Russia, South Africa, Taiwan, Thailand, Turkey, and the United Arab Emirates. You cannot invest directly in an index. |
| 4 | The Bloomberg Barclays U.S. Aggregate Bond Index is a broad-based benchmark that measures the investment-grade, U.S. dollar-denominated, fixed-rate taxable bond market, including Treasuries, government-related and corporate securities, mortgage-backed securities (agency fixed-rate and hybrid adjustable-rate mortgage pass-throughs), asset-backed securities, and commercial mortgage-backed securities. You cannot invest directly in an index. |
| 5 | The Bloomberg Barclays Global Aggregate ex-USD Index is an unmanaged index that provides a broad-based measure of the global investment-grade fixed-income markets excluding the U.S. dollar-denominated debt market. You cannot invest directly in an index. |
| 6 | The Bloomberg Barclays Municipal Bond Index is an unmanaged index composed of long-term tax-exempt bonds with a minimum credit rating of Baa. You cannot invest directly in an index. |
| 7 | The ICE BofAML U.S. High Yield Index is a market-capitalization-weighted index of domestic and Yankee high-yield bonds. The index tracks the performance of high-yield securities traded in the U.S. bond market. You cannot invest directly in an index. Copyright 2018. ICE Data Indices, LLC. All rights reserved. |
| 8 | The Consumer Price Index For All Urban Consumers (CPI-U) measures the changes in the price of a basket of goods and services purchased by urban consumers. The urban consumer population is deemed by many as a better representative measure of the general public because most of the country’s population lives in highly populated areas, which represent close to 90% of the total population. You cannot invest directly in an index. |
| | | | | | |
| Letter to shareholders (unaudited) | | Wells Fargo Capital Growth Fund | | | 3 | |
The fourth quarter of 2017 was characterized by continued optimism in the U.S.
By the end of 2017, some observers were describing conditions as a Goldilocks economic scenario: synchronized global growth, low inflation, and healthy corporate earnings, all supported abroad by a weaker U.S. dollar.
U.S. stocks continued to rally during the fourth quarter of 2017, boosted by favorable company earnings and the potential for tax reform and industry deregulation. The Fed increased rates by 25 basis points (bps; 100 bps equal 1.00%) in December. The annualized GDP growth rate for the fourth quarter was 2.3%.
Internationally, the Bank of England (BoE) raised interest rates in November 2017 to 0.50%, the first increase in more than 10 years and a move up from the 0.25% rate put in place after the Brexit vote to leave the European Union in June 2016. The pound gained against other currencies. Meanwhile, the ECB and the Bank of Japan maintained interest rate policies and bond-buying programs intended to spur business activities and enhance the attractiveness of equity investments. The People’s Bank of China (PBOC) also continued policies that encouraged business investment. International equity markets, particularly emerging markets, continued to show strength.
Volatility reemerged during the first quarter of 2018 as economic signals were mixed.
The first quarter of 2018 began with stock market gains in January following U.S. tax reform that lowered rates for individuals and corporations and deregulation advanced in some economic sectors. Then, investor optimism was supplanted by several concerns. Trade tensions intensified, particularly between the U.S. and China. The U.S. threatened to impose tariffs on a broad range of imported products. Increasing interest rates and inflation also caused concern. During February 2018, the U.S. stock market endured a loss of more than 10% before recovering in March and April. The S&P 500 Index closed the first quarter with a negative return, the first negative quarterly return for the index since 2014.
The Fed increased the federal funds rate by 25 bps in March 2018 and the rate of inflation reached the Fed’s 2% target for the first time in a year. The unemployment rate fell to 4.1%. The third revision of first-quarter GDP growth by the U.S. Bureau of Economic Analysis released during June 2018 was lowered to 2.0%.
Overseas, investment market returns reversed the strong returns of 2017. After having gained 27.19% for the 12-month period that ended December 31, 2017, the MSCI ACWI ex USA Index (Net) fell 1.46% for the 7-month period that ended July 31, 2018. The U.S. dollar strengthened relative to local currencies, which served to restrain returns.
Global trade tensions escalated during the second quarter and into the third quarter of 2018.
Global trade tensions escalated as the second quarter of 2018 opened and equity markets fell in response before resuming upward momentum later in April. The U.S. government imposed tariffs on products and commodities imported from other markets in North America, Europe, and Asia. In retaliation, governments imposed tariffs on U.S. products and commodities. In addition, the U.S. pushed its North American neighbors to renegotiate the North American Free Trade Agreement, furthering trade tensions and investor uncertainty.
The CPI-U8 added 0.2% in May after a similar increase in April. On a year-over-year basis, the all-items index rose 2.8% for the 12 months that ended May 31, continuing its upward trend since the beginning of the year. The index for all items less food and energy rose 2.2% for the same 12-month period. Interest rates generally increased and the bond markets tended to decline.
During February 2018, the U.S. stock market endured a loss of more than 10% before recovering in March and April.
| | | | |
| 4 | | Wells Fargo Capital Growth Fund | | Letter to shareholders (unaudited) |
During June 2018, the Fed increased the federal funds rate by 25 bps. Investment markets began to anticipate two more rate increases in 2018. Long-term interest rates in the U.S. trended higher—rates on the 10-year and 30-year Treasury bonds moved from 2.46% and 2.81%, respectively, on January 1, 2018, to 2.96% and 3.08%, respectively, on July 31, 2018. While higher at the end of the period, rates were off their peak levels on May 17, 2018, of 3.11% and 3.25%, respectively. Investors became more aware of and concerned about the potential for an inverted yield curve—sometimes a recession signal—as short-term rates increased more quickly than long-term rates.
The unemployment rate fell to 3.9% in July after ticking up slightly in June from May’s 3.8% level, according to the U.S. Department of Labor. The annualized rate of GDP growth for the second quarter of 2018 was reported in July to be 4.1%, the highest level since the third quarter of 2014, according to the U.S. Bureau of Economic Analysis.
Internationally, the prospects for a smooth U.K. Brexit agreement was cast into doubt as members of Prime Minister Theresa May’s negotiating team resigned. Despite the uncertainty, the period closed with expectations that the BoE’s Monetary Policy Committee in July would announce an increase in its key interest rate to 0.75%, which it did in early August.
Meanwhile, central banks in Europe and Japan maintained low interest rates and accommodative monetary policies. Amid rising trade uncertainty, PBOC monetary policies shifted with cuts to reserve requirement ratios and implementation of supportive measures such as accelerated infrastructure spending and tax cuts for small and medium enterprises and for individuals. Nevertheless, a strengthening U.S. dollar and the tensions associated with trade policies remained headwinds for investors overseas.
Don’t let short-term uncertainty derail long-term investment goals.
Periods of investment uncertainty can present challenges, but experience has taught us that maintaining long-term investment goals can be an effective way to plan for the future. To help you create a sound strategy based on your personal goals and risk tolerance, Wells Fargo Funds offers more than 100 mutual funds spanning a wide range of asset classes and investment styles. Although diversification cannot guarantee an investment profit or prevent losses, we believe it can be an effective way to manage investment risk and potentially smooth out overall portfolio performance. We encourage investors to know their investments and to understand that appropriate levels of risk-taking may unlock opportunities.
Thank you for choosing to invest with Wells Fargo Funds. We appreciate your confidence in us and remain committed to helping you meet your financial needs.
Sincerely,

Andrew Owen
President
Wells Fargo Funds
| | | | | | |
| Letter to shareholders (unaudited) | | Wells Fargo Capital Growth Fund | | | 5 | |
Notice to shareholders
At a meeting held on August 14-15, 2018, the Board of Trustees of the Fund approved the following policy which will be effective on or about February 5, 2019:
Class C shares will convert automatically into Class A shares ten years after the initial date of purchase or, if you acquired your Class C shares through an exchange or conversion from another share class, ten years after the date you acquired your Class C shares. When Class C shares that you acquired through a purchase or exchange convert, any other Class C shares that you purchased with reinvested dividends and distributions also will convert into Class A shares on a pro rata basis. A shorter holding period may also apply depending on your intermediary. Please see “Appendix A—Sales Charge Reductions and Waivers for Certain Intermediaries” in the Fund’s prospectus or at the end of this report.
For further information about your Fund, contact your investment professional, visit our website at wellsfargofunds.com, or call us directly at 1-800-222-8222.
| | | | |
| 6 | | Wells Fargo Capital Growth Fund | | Performance highlights (unaudited) |
Investment objective
The Fund seeks long-term capital appreciation.
Manager
Wells Fargo Funds Management, LLC
Subadviser
Wells Capital Management Incorporated
Portfolio managers
Michael T. Smith, CFA®
Christopher J. Warner, CFA®
Average annual total returns (%) as of July 31, 20181
| | | | | | | | | | | | | | | | | | | | | | | | | | | | | | | | | | |
| | | | | Including sales charge | | | Excluding sales charge | | | Expense ratios2 (%) | |
| | | Inception date | | 1 year | | | 5 year | | | 10 year | | | 1 year | | | 5 year | | | 10 year | | | Gross | | | Net3 | |
| Class A (WFCGX) | | 7-31-2007 | | | 18.60 | | | | 13.55 | | | | 8.61 | | | | 25.83 | | | | 14.90 | | | | 9.26 | | | | 1.24 | | | | 1.11 | |
| Class C (WFCCX) | | 7-31-2007 | | | 23.89 | | | | 14.05 | | | | 8.45 | | | | 24.89 | | | | 14.05 | | | | 8.45 | | | | 1.99 | | | | 1.86 | |
| Class R6 (WFCRX) | | 11-30-2012 | | | – | | | | – | | | | – | | | | 26.13 | | | | 15.42 | | | | 9.77 | | | | 0.81 | | | | 0.60 | |
| Administrator Class (WFCDX) | | 6-30-2003 | | | – | | | | – | | | | – | | | | 26.01 | | | | 15.09 | | | | 9.49 | | | | 1.16 | | | | 0.94 | |
| Institutional Class (WWCIX) | | 4-8-2005 | | | – | | | | – | | | | – | | | | 26.25 | | | | 15.38 | | | | 9.75 | | | | 0.91 | | | | 0.70 | |
| Russell 1000® Growth Index4 | | – | | | – | | | | – | | | | – | | | | 22.84 | | | | 15.83 | | | | 12.37 | | | | – | | | | – | |
Figures quoted represent past performance, which is no guarantee of future results, and do not reflect taxes that a shareholder may pay on fund distributions or the redemption of fund shares. Investment return and principal value of an investment will fluctuate so that an investor’s shares, when redeemed, may be worth more or less than their original cost. Performance shown without sales charges would be lower if sales charges were reflected. Current performance may be lower or higher than the performance data quoted, which assumes the reinvestment of dividends and capital gains. Current month-end performance is available on the Fund’s website, wellsfargofunds.com.
Please keep in mind that high double-digit returns were primarily achieved during favorable market conditions. You should not expect that such favorable returns can be consistently achieved. A fund’s performance, especially for short time periods, should not be the sole factor in making your investment decision.
Index returns do not include transaction costs associated with buying and selling securities, any mutual fund fees or expenses, or any taxes. It is not possible to invest directly in an index.
For Class A shares, the maximum front-end sales charge is 5.75%. For Class C shares, the maximum contingent deferred sales charge is 1.00%. Performance including a contingent deferred sales charge assumes the sales charge for the corresponding time period. Class R6, Administrator Class, and Institutional Class shares are sold without a front-end sales charge or contingent deferred sales charge.
Stock values fluctuate in response to the activities of individual companies and general market and economic conditions. Certain investment strategies tend to increase the total risk of an investment (relative to the broader market). The Fund is exposed to foreign investment risk. Consult the Fund’s prospectus for additional information on these and other risks.
Please see footnotes on page 7.
| | | | | | |
| Performance highlights (unaudited) | | Wells Fargo Capital Growth Fund | | | 7 | |
|
| Growth of $10,000 investment as of July 31, 20185 |
|
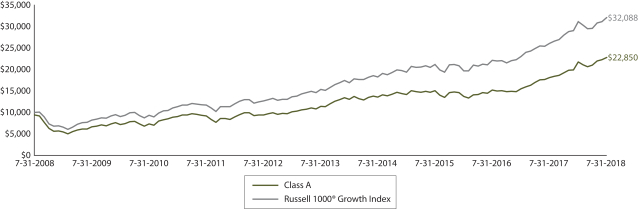 |
| 1 | Historical performance shown for Class R6 shares prior to their inception reflects the performance of Institutional Class shares, and includes the higher expenses applicable to Institutional Class shares. If these expenses had not been included, returns for Class R6 shares would be higher. |
| 2 | Reflects the expense ratios as stated in the most recent prospectuses. The expense ratios shown are subject to change and may differ from the annualized expense ratios shown in the financial highlights of this report. |
| 3 | The manager has contractually committed through November 30, 2018, to waive fees and/or reimburse expenses to the extent necessary to cap the Fund’s Total Annual Fund Operating Expenses After Fee Waivers at the amounts shown. After this time, the cap may be increased or the commitment to maintain the cap may be terminated only with the approval of the Board of Trustees. Brokerage commissions, stamp duty fees, interest, taxes, acquired fund fees and expenses (if any), and extraordinary expenses are excluded from the expense cap. Without this cap, the Fund’s returns would have been lower. The expense ratio paid by an investor is the net expense ratio (the total annual fund operating expenses after fee waivers) as stated in the prospectuses. |
| 4 | The Russell 1000® Growth Index measures the performance of those Russell 1000 companies with higher price/book ratios and higher forecasted growth values. You cannot invest directly in an index. |
| 5 | The chart compares the performance of Class A shares for the most recent ten years with the Russell 1000® Growth Index. The chart assumes a hypothetical investment of $10,000 in Class A shares and reflects all operating expenses and assumes the maximum initial sales charge of 5.75%. |
| 6 | The ten largest holdings, excluding cash, cash equivalents and any money market funds, are calculated based on the value of the investments divided by total net assets of the Fund. Holdings are subject to change and may have changed since the date specified. |
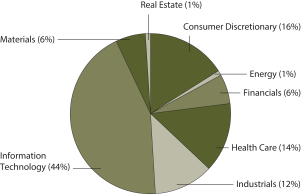
| 7 | Amounts are calculated based on the total long-term investments of the Fund. These amounts are subject to change and may have changed since the date specified. |
| | | | |
| 8 | | Wells Fargo Capital Growth Fund | | Performance highlights (unaudited) |
MANAGER’S DISCUSSION
Fund highlights
| ∎ | | The Fund outperformed its benchmark, the Russell 1000® Growth Index, for the 12-month period that ended July 31, 2018. |
| ∎ | | Stock selection in the consumer discretionary and industrials sectors was a key contributor to performance. |
| ∎ | | Stock selection within the health care sector detracted from performance. |
For much of the past 12 months, bullish sentiment for U.S. equities was apparent as global growth was synchronized, corporate earnings were strong, widespread tax cuts had been passed, and deregulations were being enacted. More recently, however, a combination of crosscurrents from macro and geopolitical sources caused a downshift in growth expectations. The most significant change to outlooks came from markets outside the U.S. Arguably the biggest factor precipitating the downshift in growth came from concerns around global trade. The U.S. government expanded tariffs on goods from around the world, with a particular focus on China. This prompted retaliation from China and other trading partners, heightening fears of a possible trade war. These recent global developments highlighted a dynamic that we have long appreciated and incorporated into our portfolio positioning: true organic growth remains scarce and the firms that can make their own luck will likely be rewarded by investors.
| | | | |
| Ten largest holdings (%) as of July 31, 20186 | |
Amazon.com Incorporated | | | 7.47 | |
Microsoft Corporation | | | 7.02 | |
Alphabet Incorporated Class A | | | 6.13 | |
Visa Incorporated Class A | | | 4.90 | |
UnitedHealth Group Incorporated | | | 4.88 | |
Union Pacific Corporation | | | 3.01 | |
The Home Depot Incorporated | | | 2.99 | |
Waste Connections Incorporated | | | 2.98 | |
First Data Corporation Class A | | | 2.84 | |
Cintas Corporation | | | 2.53 | |
The Fund’s consumer discretionary and industrials holdings contributed to performance relative to the index.
Within the consumer discretionary sector, strength was visible among internet and direct-marketing retail holdings and the portfolio management team’s security selection in this industry proved additive to returns. Shares of Amazon.com, Incorporated, appreciated over the past year as the company remains levered to powerful secular growth trends. Over the past 12 months, sales continued to accelerate while profits soared to a record level. The company also announced plans to increase the price of Amazon Prime subscriptions by 20%, while subscribers topped 100 million for the first time.
Additionally, the company has made strategic acquisitions such as Whole Foods Market, Incorporated. Amazon continues to benefit from the powerful shift to online retail spending, while Amazon Web Services (AWS) has become the dominant provider of cloud-computing services. AWS was the largest driver of profit gains during the year. We continue to be impressed with Amazon’s growing scale in a number of large market opportunities.
Within the industrials sector, our position in TransUnion contributed to returns. TransUnion historically operated as a traditional credit bureau by providing data about consumers to institutions for credit extension and fraud protection. Over the past few years, however, the company’s management team has capitalized on the rapid demand growth for data analytics. The company has launched new products, including Credit Vision, which uses data trends to provide a real-time picture of a consumer’s financial strength, and Prama, which allows clients to access TransUnion’s data to perform their own analysis. Additionally, TransUnion has developed new vertical markets, such as health care, insurance, and international/emerging markets. This innovation has allowed TransUnion to produce above-consensus growth in earnings and revenue, which, in turn, has propelled TransUnion shares higher over the past 12 months.
Please see footnotes on page 7.
| | | | | | |
| Performance highlights (unaudited) | | Wells Fargo Capital Growth Fund | | | 9 | |
|
| Sector distribution as of July 31, 20187 |
|
 |
Stock selection in the health care sector detracted from performance.
Among the Fund’s health care holdings, Celgene Corporation detracted from performance. Celgene, a global biopharmaceutical company, has a strong franchise with several drugs, including Revlimid to treat multiple myeloma and Otezla to treat psoriasis. While Revlimid has been the largest contributor to the company’s recent success and expectations for growth of Revlimid remain on track, this blockbuster drug will come off patent by the middle of 2020. The company has been investing in several other drug-development trials. Over the past 12 months, the stock came under pressure when it was announced that the development of a drug to treat
multiple sclerosis had its filing refused by the FDA. While Celgene intends to refile with additional data, the setback resulted in a downward revision to the company’s longer-term earnings profile.
Additionally within the sector, our position in Hologic, Incorporated, weighed on returns over the past year. Hologic is a medical device company that specializes in imaging, diagnostics, and gynecology surgical tools. The company, a leader in mammography, has developed a breast-imaging device that uses a new technology to produce a 3D image. This 3D screening test is the only one approved by the FDA and is considered superior to standard mammography. The stock came under pressure after the company missed revenue and earnings projections. The results were primarily the result of a slowdown in the surgical business. The other issue affecting Hologic over the past 12 months has been the company’s Cynosure business. Cynosure, which is a noninvasive body contouring business, had been acquired by Hologic in an effort to diversify revenue sources. The integration of the acquisition has been slower than expected, prompting investor concern and weakness in the stock.
We remain somewhat cautious given geopolitical and macroeconomic uncertainties; however, we maintain confidence in the Fund’s positioning.
Looking broadly at financial markets through our lens of a bottom-up, fundamentally based investment process, we see ample reasons to maintain a cautious stance given potential factors such as trade wars, political instability, softness in China, and a hawkish U.S. Federal Reserve. We are, however, excited about companies held in the portfolio—those that we believe have prospects for organic growth and strategies that we believe are on the right side of change. Yet, with uncertainties on the rise, we advise clients to be mindful of downside risks and to moderate return expectations.
From a portfolio positioning standpoint, our strategy is to stay balanced. We have a healthy allocation to our core holdings, which are companies that we believe have consistent and durable fundamentals. These are businesses that our analysis holds have profitable models, competitive advantages, and long runways of visible growth. On the other side, we own companies we consider to have idiosyncratic qualities. These are developing situations that our process finds to have unique drivers that are not yet clearly visible to other investors. These companies typically trade at reasonable valuations and, importantly, should buffer volatility if the market rotates out of momentum and high-beta factors. Finally, we are being very selective in the areas of our universe where valuations are approaching extremes, including certain cloud software, medical device, and biotechnology companies. The portfolio holds companies that we believe possess strong fundamentals and growth prospects, and yet it trades at a reasonable valuation profile. This is an attractive structure that has us excited to seek continued strong performance for our clients.
Please see footnotes on page 7.
| | | | |
| 10 | | Wells Fargo Capital Growth Fund | | Fund expenses (unaudited) |
As a shareholder of the Fund, you incur two types of costs: (1) transaction costs, including sales charges (loads) on purchase payments and contingent deferred sales charges (if any) on redemptions and (2) ongoing costs, including management fees, distribution (12b-1) and/or shareholder servicing fees, and other Fund expenses. This example is intended to help you understand your ongoing costs (in dollars) of investing in the Fund and to compare these costs with the ongoing costs of investing in other mutual funds.
The example is based on an investment of $1,000 invested at the beginning of the six-month period and held for the entire period from February 1, 2018 to July 31, 2018.
Actual expenses
The “Actual” line of the table below provides information about actual account values and actual expenses. You may use the information in this line, together with the amount you invested, to estimate the expenses that you paid over the period. Simply divide your account value by $1,000 (for example, an $8,600 account value divided by $1,000 = 8.6), then multiply the result by the number in the “Actual” line under the heading entitled “Expenses paid during period” for your applicable class of shares to estimate the expenses you paid on your account during this period.
Hypothetical example for comparison purposes
The “Hypothetical” line of the table below provides information about hypothetical account values and hypothetical expenses based on the Fund’s actual expense ratio and an assumed rate of return of 5% per year before expenses, which is not the Fund’s actual return. The hypothetical account values and expenses may not be used to estimate the actual ending account balance or expenses you paid for the period. You may use this information to compare the ongoing costs of investing in the Fund and other funds. To do so, compare this 5% hypothetical example with the 5% hypothetical examples that appear in the shareholder reports of the other funds.
Please note that the expenses shown in the table are meant to highlight your ongoing costs only and do not reflect any transactional costs, such as sales charges (loads) and contingent deferred sales charges. Therefore, the “Hypothetical” line of the table is useful in comparing ongoing costs only and will not help you determine the relative total costs of owning different funds. In addition, if these transactional costs were included, your costs would have been higher.
| | | | | | | | | | | | | | | | |
| | | Beginning
account value
2-1-2018 | | | Ending
account value
7-31-2018 | | | Expenses
paid during
the period¹ | | | Annualized net
expense ratio | |
Class A | | | | | | | | | | | | | | | | |
Actual | | $ | 1,000.00 | | | $ | 1,050.80 | | | $ | 5.48 | | | | 1.06 | % |
Hypothetical (5% return before expenses) | | $ | 1,000.00 | | | $ | 1,019.86 | | | $ | 5.40 | | | | 1.06 | % |
Class C | | | | | | | | | | | | | | | | |
Actual | | $ | 1,000.00 | | | $ | 1,047.22 | | | $ | 9.34 | | | | 1.81 | % |
Hypothetical (5% return before expenses) | | $ | 1,000.00 | | | $ | 1,016.08 | | | $ | 9.20 | | | | 1.81 | % |
Class R6 | | | | | | | | | | | | | | | | |
Actual | | $ | 1,000.00 | | | $ | 1,051.22 | | | $ | 3.10 | | | | 0.60 | % |
Hypothetical (5% return before expenses) | | $ | 1,000.00 | | | $ | 1,022.18 | | | $ | 3.06 | | | | 0.60 | % |
Administrator Class | | | | | | | | | | | | | | | | |
Actual | | $ | 1,000.00 | | | $ | 1,051.80 | | | $ | 4.86 | | | | 0.94 | % |
Hypothetical (5% return before expenses) | | $ | 1,000.00 | | | $ | 1,020.47 | | | $ | 4.79 | | | | 0.94 | % |
Institutional Class | | | | | | | | | | | | | | | | |
Actual | | $ | 1,000.00 | | | $ | 1,052.45 | | | $ | 3.62 | | | | 0.70 | % |
Hypothetical (5% return before expenses) | | $ | 1,000.00 | | | $ | 1,021.68 | | | $ | 3.57 | | | | 0.70 | % |
| 1 | Expenses paid is equal to the annualized net expense ratio of each class multiplied by the average account value over the period, multiplied by the number of days in the most recent fiscal half-year divided by the number of days in the fiscal year (to reflect the one-half-year period). |
| | | | | | |
| Portfolio of investments—July 31, 2018 | | Wells Fargo Capital Growth Fund | | | 11 | |
| | | | | | | | | | | | | | | | |
| Security name | | | | | | | | Shares | | | Value | |
| | | | |
Common Stocks: 99.79% | | | | | | | | | | | | | | | | |
| | | | |
Consumer Discretionary: 16.14% | | | | | | | | | | | | | | | | |
| | | | |
| Auto Components: 1.77% | | | | | | | | | | | | | | | | |
Aptiv plc | | | | | | | | | | | 22,800 | | | $ | 2,235,992 | |
| | | | | | | | | | | | | | | | |
| | | | |
| Automobiles: 1.11% | | | | | | | | | | | | | | | | |
Ferrari NV « | | | | | | | | | | | 10,600 | | | | 1,405,772 | |
| | | | | | | | | | | | | | | | |
| | | | |
| Hotels, Restaurants & Leisure: 0.98% | | | | | | | | | | | | | | | | |
Melco Crown Entertainment Limited ADR | | | | | | | | | | | 47,650 | | | | 1,232,229 | |
| | | | | | | | | | | | | | | | |
| | | | |
| Internet & Direct Marketing Retail: 9.29% | | | | | | | | | | | | | | | | |
Amazon.com Incorporated † | | | | | | | | | | | 5,305 | | | | 9,429,319 | |
Netflix Incorporated † | | | | | | | | | | | 6,800 | | | | 2,294,660 | |
| | | | |
| | | | | | | | | | | | | | | 11,723,979 | |
| | | | | | | | | | | | | | | | |
| | | | |
| Specialty Retail: 2.99% | | | | | | | | | | | | | | | | |
The Home Depot Incorporated | | | | | | | | | | | 19,083 | | | | 3,769,274 | |
| | | | | | | | | | | | | | | | |
| | | | |
Energy: 0.98% | | | | | | | | | | | | | | | | |
| | | | |
| Oil, Gas & Consumable Fuels: 0.98% | | | | | | | | | | | | | | | | |
Pioneer Natural Resources Company | | | | | | | | | | | 6,550 | | | | 1,239,719 | |
| | | | | | | | | | | | | | | | |
| | | | |
Financials: 5.44% | | | | | | | | | | | | | | | | |
| | | | |
| Capital Markets: 5.44% | | | | | | | | | | | | | | | | |
Intercontinental Exchange Incorporated | | | | | | | | | | | 35,975 | | | | 2,658,912 | |
Raymond James Financial Incorporated | | | | | | | | | | | 26,900 | | | | 2,463,771 | |
S&P Global Incorporated | | | | | | | | | | | 8,663 | | | | 1,736,412 | |
| | | | |
| | | | | | | | | | | | | | | 6,859,095 | |
| | | | | | | | | | | | | | | | |
| | | | |
Health Care: 14.03% | | | | | | | | | | | | | | | | |
| | | | |
| Biotechnology: 2.15% | | | | | | | | | | | | | | | | |
Celgene Corporation † | | | | | | | | | | | 19,400 | | | | 1,747,746 | |
Exelixis Incorporated † | | | | | | | | | | | 46,500 | | | | 962,550 | |
| | | | |
| | | | | | | | | | | | | | | 2,710,296 | |
| | | | | | | | | | | | | | | | |
| | | | |
| Health Care Equipment & Supplies: 5.40% | | | | | | | | | | | | | | | | |
Baxter International Incorporated | | | | | | | | | | | 22,200 | | | | 1,608,390 | |
Boston Scientific Corporation † | | | | | | | | | | | 68,150 | | | | 2,290,522 | |
Edwards Lifesciences Corporation † | | | | | | | | | | | 12,750 | | | | 1,816,238 | |
Hologic Incorporated † | | | | | | | | | | | 25,550 | | | | 1,096,351 | |
| | | | |
| | | | | | | | | | | | | | | 6,811,501 | |
| | | | | | | | | | | | | | | | |
| | | | |
| Health Care Providers & Services: 4.87% | | | | | | | | | | | | | | | | |
UnitedHealth Group Incorporated | | | | | | | | | | | 24,300 | | | | 6,153,246 | |
| | | | | | | | | | | | | | | | |
| | | | |
| Life Sciences Tools & Services: 1.61% | | | | | | | | | | | | | | | | |
Illumina Incorporated † | | | | | | | | | | | 6,250 | | | | 2,027,250 | |
| | | | | | | | | | | | | | | | |
The accompanying notes are an integral part of these financial statements.
| | | | |
| 12 | | Wells Fargo Capital Growth Fund | | Portfolio of investments—July 31, 2018 |
| | | | | | | | | | | | | | | | |
| Security name | | | | | | | | Shares | | | Value | |
| | | | |
Industrials: 12.02% | | | | | | | | | | | | | | | | |
| | | | |
| Aerospace & Defense: 1.33% | | | | | | | | | | | | | | | | |
Northrop Grumman Corporation | | | | | | | | | | | 5,600 | | | $ | 1,682,744 | |
| | | | | | | | | | | | | | | | |
| | | | |
| Commercial Services & Supplies: 5.51% | | | | | | | | | | | | | | | | |
Cintas Corporation | | | | | | | | | | | 15,600 | | | | 3,189,888 | |
Waste Connections Incorporated | | | | | | | | | | | 48,480 | | | | 3,762,533 | |
| | | | |
| | | | | | | | | | | | | | | 6,952,421 | |
| | | | | | | | | | | | | | | | |
| | | | |
| Electrical Equipment: 1.03% | | | | | | | | | | | | | | | | |
Rockwell Automation Incorporated | | | | | | | | | | | 6,950 | | | | 1,303,542 | |
| | | | | | | | | | | | | | | | |
| | | | |
| Professional Services: 1.14% | | | | | | | | | | | | | | | | |
TransUnion† | | | | | | | | | | | 19,923 | | | | 1,442,425 | |
| | | | | | | | | | | | | | | | |
| | | | |
| Road & Rail: 3.01% | | | | | | | | | | | | | | | | |
Union Pacific Corporation | | | | | | | | | | | 25,300 | | | | 3,792,217 | |
| | | | | | | | | | | | | | | | |
| | | | |
Information Technology: 44.08% | | | | | | | | | | | | | | | | |
| | | | |
| Internet Software & Services: 12.78% | | | | | | | | | | | | | | | | |
Alibaba Group Holding Limited ADR † | | | | | | | | | | | 13,600 | | | | 2,546,328 | |
Alphabet Incorporated Class A † | | | | | | | | | | | 6,308 | | | | 7,741,304 | |
Facebook Incorporated Class A † | | | | | | | | | | | 12,274 | | | | 2,118,247 | |
MercadoLibre Incorporated | | | | | | | | | | | 5,200 | | | | 1,783,132 | |
Tencent Holdings Limited ADR | | | | | | | | | | | 42,350 | | | | 1,935,395 | |
| | | | |
| | | | | | | | | | | | | | | 16,124,406 | |
| | | | | | | | | | | | | | | | |
| | | | |
| IT Services: 14.55% | | | | | | | | | | | | | | | | |
Black Knight Incorporated † | | | | | | | | | | | 32,150 | | | | 1,660,548 | |
Fidelity National Information Services Incorporated | | | | | | | | | | | 17,050 | | | | 1,758,367 | |
First Data Corporation Class A † | | | | | | | | | | | 154,200 | | | | 3,586,692 | |
FleetCor Technologies Incorporated † | | | | | | | | | | | 12,100 | | | | 2,625,700 | |
PayPal Holdings Incorporated † | | | | | | | | | | | 14,100 | | | | 1,158,174 | |
Total System Services Incorporated | | | | | | | | | | | 15,200 | | | | 1,391,408 | |
Visa Incorporated Class A | | | | | | | | | | | 45,183 | | | | 6,178,323 | |
| | | | |
| | | | | | | | | | | | | | | 18,359,212 | |
| | | | | | | | | | | | | | | | |
| | | | |
| Semiconductors & Semiconductor Equipment: 0.91% | | | | | | | | | | | | | | | | |
Infineon Technologies AG ADR | | | | | | | | | | | 43,450 | | | | 1,152,511 | |
| | | | | | | | | | | | | | | | |
| | | | |
| Software: 15.84% | | | | | | | | | | | | | | | | |
Activision Blizzard Incorporated | | | | | | | | | | | 27,300 | | | | 2,004,366 | |
Autodesk Incorporated † | | | | | | | | | | | 10,400 | | | | 1,335,776 | |
Microsoft Corporation | | | | | | | | | | | 83,500 | | | | 8,857,680 | |
Nintendo Company Limited | | | | | | | | | | | 32,450 | | | | 1,384,642 | |
Red Hat Incorporated † | | | | | | | | | | | 15,150 | | | | 2,139,635 | |
Salesforce.com Incorporated † | | | | | | | | | | | 20,180 | | | | 2,767,687 | |
ServiceNow Incorporated † | | | | | | | | | | | 8,480 | | | | 1,492,141 | |
| | | | |
| | | | | | | | | | | | | | | 19,981,927 | |
| | | | | | | | | | | | | | | | |
The accompanying notes are an integral part of these financial statements.
| | | | | | |
| Portfolio of investments—July 31, 2018 | | Wells Fargo Capital Growth Fund | | | 13 | |
| | | | | | | | | | | | | | | | |
| Security name | | | | | | | | Shares | | | Value | |
| | | | |
Materials: 6.30% | | | | | | | | | | | | | | | | |
| | | | |
| Chemicals: 4.47% | | | | | | | | | | | | | | | | |
Air Products & Chemicals Incorporated | | | | | | | | | | | 16,650 | | | $ | 2,733,431 | |
The Sherwin-Williams Company | | | | | | | | | | | 6,600 | | | | 2,908,818 | |
| | | | |
| | | | | | | | | | | | | | | 5,642,249 | |
| | | | | | | | | | | | | | | | |
| | | | |
| Construction Materials: 1.83% | | | | | | | | | | | | | | | | |
Vulcan Materials Company | | | | | | | | | | | 20,600 | | | | 2,307,200 | |
| | | | | | | | | | | | | | | | |
| | | | |
Real Estate: 0.80% | | | | | | | | | | | | | | | | |
| | | | |
| Equity REITs: 0.80% | | | | | | | | | | | | | | | | |
SBA Communications Corporation † | | | | | | | | | | | 6,400 | | | | 1,012,800 | |
| | | | | | | | | | | | | | | | |
| | | | |
Total Common Stocks (Cost $73,349,364) | | | | | | | | | | | | | | | 125,922,007 | |
| | | | | | | | | | | | | | | | |
| | | | |
| | | Yield | | | | | | | | | | |
| Short-Term Investments: 1.78% | | | | | | | | | | | | | | | | |
| | | | |
| Investment Companies: 1.78% | | | | | | | | | | | | | | | | |
Securities Lending Cash Investment LLC (l)(r)(u) | | | 2.10 | % | | | | | | | 1,332,367 | | | | 1,332,500 | |
Wells Fargo Government Money Market Fund Select Class (l)(u) | | | 1.83 | | | | | | | | 922,555 | | | | 922,555 | |
| | | | |
Total Short-Term Investments (Cost $2,255,055) | | | | | | | | | | | | | | | 2,255,055 | |
| | | | | | | | | | | | | | | | |
| | | | | | | | |
| Total investments in securities (Cost $75,604,419) | | | 101.57 | % | | | 128,177,062 | |
Other assets and liabilities, net | | | (1.57 | ) | | | (1,987,480 | ) |
| | | | | | | | |
| Total net assets | | | 100.00 | % | | $ | 126,189,582 | |
| | | | | | | | |
| « | All or a portion of this security is on loan. |
| † | Non-income-earning security |
| (l) | The issuer of the security is an affiliated person of the Fund as defined in the Investment Company Act of 1940. |
| (r) | The investment is a non-registered investment company purchased with cash collateral received from securities on loan. |
| (u) | The rate represents the 7-day annualized yield at period end. |
Abbreviations:
| ADR | American depositary receipt |
| REIT | Real estate investment trust |
Investments in Affiliates
An affiliated investment is an investment in which the Fund owns at least 5% of the outstanding voting shares of the issuer or as a result of other relationships, such as the Fund and the issuer having the same investment manager. Transactions with issuers that were either affiliated persons of the Fund at the beginning of the period or the end of the period were as follows:
| | | | | | | | | | | | | | | | | | | | | | | | | | | | | | | | | | | | |
| | | Shares,
beginning of
period | | | Shares
purchased | | | Shares
sold | | | Shares,
end of
period | | | Net
realized
gains
(losses) | | | Net
change in
unrealized
gains
(losses) | | | Income
from
affiliated
securities | | | Value,
end
of period | | | % of
net
assets | |
Short-Term Investments | | | | | | | | | | | | | | | | | | | | | | | | | | | | | | | | | | | | |
Investment Companies | | | | | | | | | | | | | | | | | | | | | | | | | | | | | | | | | | | | |
Securities Lending Cash Investment LLC | | | 695,935 | | | | 83,828,843 | | | | 83,192,411 | | | | 1,332,367 | | | $ | 0 | | | $ | 0 | | | $ | 10,051 | | | $ | 1,332,500 | | | | | |
Wells Fargo Government Money Market Fund Select Class | | | 3,766,873 | | | | 63,253,993 | | | | 66,098,311 | | | | 922,555 | | | | 0 | | | | 0 | | | | 55,873 | | | | 922,555 | | | | | |
| | | | | | | | | | | | | | | | | | | | | | | | | | | | | | | | | | | | |
| | | | | | | | | | | | | | | | | | $ | 0 | | | $ | 0 | | | $ | 65,924 | | | $ | 2,255,055 | | | | 1.78 | % |
| | | | | | | | | | | | | | | | | | | | | | | | | | | | | | | | | | | | |
The accompanying notes are an integral part of these financial statements.
| | | | |
| 14 | | Wells Fargo Capital Growth Fund | | Statement of assets and liabilities—July 31, 2018 |
| | | | |
| | | | |
| |
Assets | | | | |
Investments in unaffiliated securities (including $1,326,200 of securities loaned), at value (cost $73,349,364) | | $ | 125,922,007 | |
Investments in affiliated securities, at value (cost $2,255,055) | | | 2,255,055 | |
Receivable for investments sold | | | 115,523 | |
Receivable for Fund shares sold | | | 7,838 | |
Receivable for dividends | | | 23,675 | |
Receivable for securities lending income | | | 76 | |
Prepaid expenses and other assets | | | 77,394 | |
| | | | |
Total assets | | | 128,401,568 | |
| | | | |
| |
Liabilities | | | | |
Payable upon receipt of securities loaned | | | 1,332,500 | |
Payable for Fund shares redeemed | | | 740,149 | |
Management fee payable | | | 44,531 | |
Administration fees payable | | | 19,383 | |
Distribution fee payable | | | 2,165 | |
Trustees’ fees and expenses payable | | | 1,228 | |
Accrued expenses and other liabilities | | | 72,030 | |
| | | | |
Total liabilities | | | 2,211,986 | |
| | | | |
Total net assets | | $ | 126,189,582 | |
| | | | |
| |
NET ASSETS CONSIST OF | | | | |
Paid-in capital | | $ | 16,086,706 | |
Accumulated net realized gains on investments | | | 57,530,233 | |
Net unrealized gains on investments | | | 52,572,643 | |
| | | | |
Total net assets | | $ | 126,189,582 | |
| | | | |
| |
COMPUTATION OF NET ASSET VALUE AND OFFERING PRICE PER SHARE | | | | |
Net assets – Class A | | $ | 86,285,262 | |
Shares outstanding – Class A1 | | | 4,534,511 | |
Net asset value per share – Class A | | | $19.03 | |
Maximum offering price per share – Class A2 | | | $20.19 | |
Net assets – Class C | | $ | 3,364,838 | |
Shares outstanding – Class C1 | | | 205,071 | |
Net asset value per share – Class C | | | $16.41 | |
Net assets – Class R6 | | $ | 10,360,497 | |
Shares outstanding – Class R61 | | | 480,736 | |
Net asset value per share – Class R6 | | | $21.55 | |
Net assets – Administrator Class | | $ | 5,949,641 | |
Shares outstanding – Administrator Class1 | | | 287,292 | |
Net asset value per share – Administrator Class | | | $20.71 | |
Net assets – Institutional Class | | $ | 20,229,344 | |
Shares outstanding – Institutional Class1 | | | 942,052 | |
Net asset value per share – Institutional Class | | | $21.47 | |
| 1 | The Fund has an unlimited number of authorized shares. |
| 2 | Maximum offering price is computed as 100/94.25 of net asset value. On investments of $50,000 or more, the offering price is reduced. |
The accompanying notes are an integral part of these financial statements.
| | | | | | |
| Statement of operations—year ended July 31, 2018 | | Wells Fargo Capital Growth Fund | | | 15 | |
| | | | |
| | | | |
|
Investment income | |
Dividends (net of foreign withholding taxes of $13,485) | | $ | 1,602,421 | |
Income from affiliated securities | | | 65,924 | |
| | | | |
Total investment income | | | 1,668,345 | |
| | | | |
|
Expenses | |
Management fee | | | 1,524,807 | |
Administration fees | |
Class A | | | 167,324 | |
Class C | | | 6,527 | |
Class R4 | | | 4 | 1 |
Class R6 | | | 30,563 | |
Administrator Class | | | 16,229 | |
Institutional Class | | | 26,881 | |
Shareholder servicing fees | |
Class A | | | 199,195 | |
Class C | | | 7,770 | |
Class R4 | | | 5 | 1 |
Administrator Class | | | 31,210 | |
Distribution fee | |
Class C | | | 23,311 | |
Custody and accounting fees | | | 10,231 | |
Professional fees | | | 50,571 | |
Registration fees | | | 83,971 | |
Shareholder report expenses | | | 31,905 | |
Trustees’ fees and expenses | | | 25,017 | |
Other fees and expenses | | | 8,054 | |
| | | | |
Total expenses | | | 2,243,575 | |
Less: Fee waivers and/or expense reimbursements | | | (469,339 | ) |
| | | | |
Net expenses | | | 1,774,236 | |
| | | | |
Net investment loss | | | (105,891 | ) |
| | | | |
|
REALIZED AND UNREALIZED GAINS (LOSSES) ON INVESTMENTS | |
Net realized gains on investments | | | 84,278,242 | |
Net change in unrealized gains (losses) on investments | | | (34,428,399 | ) |
| | | | |
Net realized and unrealized gains (losses) on investments | | | 49,849,843 | |
| | | | |
Net increase in net assets resulting from operations | | $ | 49,743,952 | |
| | | | |
| 1 | For the period from August 1, 2017 to November 13, 2017. Effective at the close of business on November 13, 2017, Class R4 shares were liquidated and the class was subsequently closed. Class R4 shares are no longer offered by the Fund. |
The accompanying notes are an integral part of these financial statements.
| | | | |
| 16 | | Wells Fargo Capital Growth Fund | | Statement of changes in net assets |
| | | | | | | | | | | | | | | | |
| | | Year ended
July 31, 2018 | | | Year ended
July 31, 2017 | |
| | | | |
Operations | | | | | | | | | | | | | | | | |
Net investment income (loss) | | | | | | $ | (105,891 | ) | | | | | | $ | 164,681 | |
Net realized gains on investments | | | | | | | 84,278,242 | | | | | | | | 31,756,709 | |
Net change in unrealized gains (losses) on investments | | | | | | | (34,428,399 | ) | | | | | | | 15,387,708 | |
| | | | |
Net increase in net assets resulting from operations | | | | | | | 49,743,952 | | | | | | | | 47,309,098 | |
| | | | |
| | | | |
Distributions to shareholders from | | | | | | | | | | | | | | | | |
Net investment income | | | | | | | | | | | | | | | | |
Class A | | | | | | | 0 | | | | | | | | (97,914 | ) |
Class R4 | | | | | | | 0 | 1 | | | | | | | (38 | ) |
Class R6 | | | | | | | 0 | | | | | | | | (412,002 | ) |
Administrator Class | | | | | | | 0 | | | | | | | | (39,091 | ) |
Institutional Class | | | | | | | 0 | | | | | | | | (65,942 | ) |
Net realized gains | | | | | | | | | | | | | | | | |
Class A | | | | | | | (10,659,612 | ) | | | | | | | (1,953,165 | ) |
Class C | | | | | | | (475,651 | ) | | | | | | | (101,375 | ) |
Class R4 | | | | | | | (1,544 | )1 | | | | | | | (384 | ) |
Class R6 | | | | | | | (16,512,790 | ) | | | | | | | (3,243,150 | ) |
Administrator Class | | | | | | | (2,322,996 | ) | | | | | | | (611,585 | ) |
Institutional Class | | | | | | | (2,869,464 | ) | | | | | | | (616,477 | ) |
| | | | |
Total distributions to shareholders | | | | | | | (32,842,057 | ) | | | | | | | (7,141,123 | ) |
| | | | |
| | | | |
Capital share transactions | | | Shares | | | | | | | | Shares | | | | | |
Proceeds from shares sold | | | | | | | | | | | | | | | | |
Class A | | | 324,772 | | | | 5,663,591 | | | | 198,409 | | | | 3,094,087 | |
Class C | | | 51,472 | | | | 773,137 | | | | 32,238 | | | | 431,568 | |
Class R6 | | | 429,937 | | | | 8,300,687 | | | | 877,107 | | | | 15,875,391 | |
Administrator Class | | | 98,501 | | | | 1,847,357 | | | | 166,111 | | | | 2,827,992 | |
Institutional Class | | | 180,220 | | | | 3,556,665 | | | | 929,940 | | | | 16,102,051 | |
| | | | |
| | | | | | | 20,141,437 | | | | | | | | 38,331,089 | |
| | | | |
Reinvestment of distributions | | | | | | | | | | | | | | | | |
Class A | | | 642,270 | | | | 10,449,869 | | | | 137,411 | | | | 2,007,306 | |
Class C | | | 30,860 | | | | 437,693 | | | | 6,718 | | | | 87,332 | |
Class R4 | | | 0 | 1 | | | 0 | 1 | | | 26 | | | | 422 | |
Class R6 | | | 905,002 | | | | 16,500,487 | | | | 225,598 | | | | 3,655,152 | |
Administrator Class | | | 131,868 | | | | 2,308,838 | | | | 41,308 | | | | 647,990 | |
Institutional Class | | | 155,432 | | | | 2,828,945 | | | | 41,696 | | | | 673,156 | |
| | | | |
| | | | | | | 32,525,832 | | | | | | | | 7,071,358 | |
| | | | |
Payment for shares redeemed | | | | | | | | | | | | | | | | |
Class A | | | (560,818 | ) | | | (9,909,912 | ) | | | (1,344,184 | ) | | | (20,771,420 | ) |
Class C | | | (62,592 | ) | | | (954,216 | ) | | | (105,879 | ) | | | (1,470,006 | ) |
Class R4 | | | (974 | )1 | | | (18,521 | )1 | | | 0 | | | | 0 | |
Class R6 | | | (8,922,240 | ) | | | (178,495,590 | ) | | | (1,450,824 | ) | | | (24,773,295 | ) |
Administrator Class | | | (1,169,379 | ) | | | (22,013,800 | ) | | | (898,996 | ) | | | (14,559,948 | ) |
Institutional Class | | | (661,462 | ) | | | (12,665,267 | ) | | | (1,125,342 | ) | | | (19,712,480 | ) |
| | | | |
| | | | | | | (224,057,306 | ) | | | | | | | (81,287,149 | ) |
| | | | |
Net decrease in net assets resulting from capital share transactions | | | | | | | (171,390,037 | ) | | | | | | | (35,884,702 | ) |
| | | | |
Total increase (decrease) in net assets | | | | | | | (154,488,142 | ) | | | | | | | 4,283,273 | |
| | | | |
| | | | |
Net assets | | | | | | | | | | | | | | | | |
Beginning of period | | | | | | | 280,677,724 | | | | | | | | 276,394,451 | |
| | | | |
End of period | | | | | | $ | 126,189,582 | | | | | | | $ | 280,677,724 | |
| | | | |
Undistributed (overdistributed) net investment income | | | | | | $ | 0 | | | | | | | $ | (90,944 | ) |
| | | | |
| 1 | For the period from August 1, 2017 to November 13, 2017. Effective at the close of business on November 13, 2017, Class R4 shares were liquidated and the class was subsequently closed. Class R4 shares are no longer offered by the Fund. |
The accompanying notes are an integral part of these financial statements.
| | | | | | |
| Financial highlights | | Wells Fargo Capital Growth Fund | | | 17 | |
(For a share outstanding throughout each period)
| | | | | | | | | | | | | | | | | | | | |
| | | Year ended July 31 | |
| CLASS A | | 2018 | | | 2017 | | | 2016 | | | 2015 | | | 2014 | |
Net asset value, beginning of period | | | $17.56 | | | | $15.12 | | | | $17.38 | | | | $21.31 | | | | $19.87 | |
Net investment loss | | | (0.06 | )1 | | | (0.03 | )1 | | | (0.03 | )1 | | | (0.07 | )1 | | | (0.10 | )1 |
Net realized and unrealized gains (losses) on investments | | | 4.06 | | | | 2.90 | | | | 0.04 | | | | 2.09 | | | | 3.79 | |
| | | | | | | | | | | | | | | | | | | | |
Total from investment operations | | | 4.00 | | | | 2.87 | | | | 0.01 | | | | 2.02 | | | | 3.69 | |
Distributions to shareholders from | | | | | | | | | | | | | | | | | | | | |
Net investment income | | | 0.00 | | | | (0.02 | ) | | | 0.00 | | | | 0.00 | | | | (0.02 | ) |
Net realized gains | | | (2.53 | ) | | | (0.41 | ) | | | (2.27 | ) | | | (5.95 | ) | | | (2.23 | ) |
| | | | | | | | | | | | | | | | | | | | |
Total distributions to shareholders | | | (2.53 | ) | | | (0.43 | ) | | | (2.27 | ) | | | (5.95 | ) | | | (2.25 | ) |
Net asset value, end of period | | | $19.03 | | | | $17.56 | | | | $15.12 | | | | $17.38 | | | | $21.31 | |
Total return2 | | | 25.83 | % | | | 19.52 | % | | | 0.75 | % | | | 11.00 | % | | | 19.09 | % |
Ratios to average net assets (annualized) | | | | | | | | | | | | | | | | | | | | |
Gross expenses | | | 1.26 | % | | | 1.24 | % | | | 1.24 | % | | | 1.27 | % | | | 1.26 | % |
Net expenses | | | 1.06 | % | | | 1.06 | % | | | 1.06 | % | | | 1.11 | % | | | 1.11 | % |
Net investment loss | | | (0.32 | )% | | | (0.21 | )% | | | (0.18 | )% | | | (0.39 | )% | | | (0.46 | )% |
Supplemental data | | | | | | | | | | | | | | | | | | | | |
Portfolio turnover rate | | | 40 | % | | | 59 | % | | | 85 | % | | | 114 | % | | | 94 | % |
Net assets, end of period (000s omitted) | | | $86,285 | | | | $72,511 | | | | $77,648 | | | | $17,126 | | | | $18,561 | |
| 1 | Calculated based upon average shares outstanding |
| 2 | Total return calculations do not include any sales charges. |
The accompanying notes are an integral part of these financial statements.
| | | | |
| 18 | | Wells Fargo Capital Growth Fund | | Financial highlights |
(For a share outstanding throughout each period)
| | | | | | | | | | | | | | | | | | | | |
| | | Year ended July 31 | |
| CLASS C | | 2018 | | | 2017 | | | 2016 | | | 2015 | | | 2014 | |
Net asset value, beginning of period | | | $15.58 | | | | $13.54 | | | | $15.92 | | | | $20.12 | | | | $18.98 | |
Net investment loss | | | (0.16 | )1 | | | (0.13 | )1 | | | (0.13 | )1 | | | (0.20 | )1 | | | (0.24 | )1 |
Net realized and unrealized gains (losses) on investments | | | 3.52 | | | | 2.58 | | | | 0.02 | | | | 1.95 | | | | 3.61 | |
| | | | | | | | | | | | | | | | | | | | |
Total from investment operations | | | 3.36 | | | | 2.45 | | | | (0.11 | ) | | | 1.75 | | | | 3.37 | |
Distributions to shareholders from | | | | | | | | | | | | | | | | | | | | |
Net realized gains | | | (2.53 | ) | | | (0.41 | ) | | | (2.27 | ) | | | (5.95 | ) | | | (2.23 | ) |
Net asset value, end of period | | | $16.41 | | | | $15.58 | | | | $13.54 | | | | $15.92 | | | | $20.12 | |
Total return2 | | | 24.89 | % | | | 18.65 | % | | | 0.00 | % | | | 10.15 | % | | | 18.21 | % |
Ratios to average net assets (annualized) | | | | | | | | | | | | | | | | | | | | |
Gross expenses | | | 2.01 | % | | | 1.99 | % | | | 1.99 | % | | | 2.02 | % | | | 2.01 | % |
Net expenses | | | 1.81 | % | | | 1.81 | % | | | 1.81 | % | | | 1.86 | % | | | 1.86 | % |
Net investment loss | | | (1.07 | )% | | | (0.95 | )% | | | (0.98 | )% | | | (1.14 | )% | | | (1.20 | )% |
Supplemental data | | | | | | | | | | | | | | | | | | | | |
Portfolio turnover rate | | | 40 | % | | | 59 | % | | | 85 | % | | | 114 | % | | | 94 | % |
Net assets, end of period (000s omitted) | | | $3,365 | | | | $2,888 | | | | $3,415 | | | | $4,212 | | | | $4,628 | |
| 1 | Calculated based upon average shares outstanding |
| 2 | Total return calculations do not include any sales charges. |
The accompanying notes are an integral part of these financial statements.
| | | | | | |
| Financial highlights | | Wells Fargo Capital Growth Fund | | | 19 | |
(For a share outstanding throughout each period)
| | | | | | | | | | | | | | | | | | | | |
| | | Year ended July 31 | |
| CLASS R6 | | 2018 | | | 2017 | | | 2016 | | | 2015 | | | 2014 | |
Net asset value, beginning of period | | | $19.52 | | | | $16.70 | | | | $18.87 | | | | $22.56 | | | | $20.85 | |
Net investment income | | | 0.04 | 1 | | | 0.04 | | | | 0.04 | 1 | | | 0.02 | | | | 0.00 | 1,2 |
Net realized and unrealized gains (losses) on investments | | | 4.52 | | | | 3.24 | | | | 0.06 | | | | 2.24 | | | | 4.00 | |
| | | | | | | | | | | | | | | | | | | | |
Total from investment operations | | | 4.56 | | | | 3.28 | | | | 0.10 | | | | 2.26 | | | | 4.00 | |
Distributions to shareholders from | | | | | | | | | | | | | | | | | | | | |
Net investment income | | | 0.00 | | | | (0.05 | ) | | | 0.00 | | | | 0.00 | | | | (0.06 | ) |
Net realized gains | | | (2.53 | ) | | | (0.41 | ) | | | (2.27 | ) | | | (5.95 | ) | | | (2.23 | ) |
| | | | | | | | | | | | | | | | | | | | |
Total distributions to shareholders | | | (2.53 | ) | | | (0.46 | ) | | | (2.27 | ) | | | (5.95 | ) | | | (2.29 | ) |
Net asset value, end of period | | | $21.55 | | | | $19.52 | | | | $16.70 | | | | $18.87 | | | | $22.56 | |
Total return | | | 26.13 | % | | | 20.18 | % | | | 1.20 | % | | | 11.54 | % | | | 19.71 | % |
Ratios to average net assets (annualized) | | | | | | | | | | | | | | | | | | | | |
Gross expenses | | | 0.82 | % | | | 0.81 | % | | | 0.81 | % | | | 0.79 | % | | | 0.78 | % |
Net expenses | | | 0.60 | % | | | 0.60 | % | | | 0.60 | % | | | 0.60 | % | | | 0.60 | % |
Net investment income | | | 0.19 | % | | | 0.23 | % | | | 0.23 | % | | | 0.11 | % | | | 0.01 | % |
Supplemental data | | | | | | | | | | | | | | | | | | | | |
Portfolio turnover rate | | | 40 | % | | | 59 | % | | | 85 | % | | | 114 | % | | | 94 | % |
Net assets, end of period (000s omitted) | | | $10,360 | | | | $157,462 | | | | $140,581 | | | | $153,009 | | | | $142,754 | |
| 1 | Calculated based upon average shares outstanding |
| 2 | Amount is less than $0.005. |
The accompanying notes are an integral part of these financial statements.
| | | | |
| 20 | | Wells Fargo Capital Growth Fund | | Financial highlights |
(For a share outstanding throughout each period)
| | | | | | | | | | | | | | | | | | | | |
| | | Year ended July 31 | |
| ADMINISTRATOR CLASS | | 2018 | | | 2017 | | | 2016 | | | 2015 | | | 2014 | |
Net asset value, beginning of period | | | $18.87 | | | | $16.20 | | | | $18.43 | | | | $22.22 | | | | $20.61 | |
Net investment loss | | | (0.03 | )1 | | | (0.01 | )1 | | | (0.01 | )1 | | | (0.03 | )1 | | | (0.05 | )1 |
Net realized and unrealized gains (losses) on investments | | | 4.40 | | | | 3.12 | | | | 0.05 | | | | 2.19 | | | | 3.93 | |
| | | | | | | | | | | | | | | | | | | | |
Total from investment operations | | | 4.37 | | | | 3.11 | | | | 0.04 | | | | 2.16 | | | | 3.88 | |
Distributions to shareholders from | | | | | | | | | | | | | | | | | | | | |
Net investment income | | | 0.00 | | | | (0.03 | ) | | | 0.00 | | | | 0.00 | | | | (0.04 | ) |
Net realized gains | | | (2.53 | ) | | | (0.41 | ) | | | (2.27 | ) | | | (5.95 | ) | | | (2.23 | ) |
| | | | | | | | | | | | | | | | | | | | |
Total distributions to shareholders | | | (2.53 | ) | | | (0.44 | ) | | | (2.27 | ) | | | (5.95 | ) | | | (2.27 | ) |
Net asset value, end of period | | | $20.71 | | | | $18.87 | | | | $16.20 | | | | $18.43 | | | | $22.22 | |
Total return | | | 26.01 | % | | | 19.68 | % | | | 0.88 | % | | | 11.22 | % | | | 19.35 | % |
Ratios to average net assets (annualized) | | | | | | | | | | | | | | | | | | | | |
Gross expenses | | | 1.17 | % | | | 1.16 | % | | | 1.16 | % | | | 1.11 | % | | | 1.09 | % |
Net expenses | | | 0.94 | % | | | 0.94 | % | | | 0.93 | % | | | 0.90 | % | | | 0.90 | % |
Net investment loss | | | (0.18 | )% | | | (0.04 | )% | | | (0.09 | )% | | | (0.16 | )% | | | (0.24 | )% |
Supplemental data | | | | | | | | | | | | | | | | | | | | |
Portfolio turnover rate | | | 40 | % | | | 59 | % | | | 85 | % | | | 114 | % | | | 94 | % |
Net assets, end of period (000s omitted) | | | $5,950 | | | | $23,144 | | | | $31,064 | | | | $34,886 | | | | $67,830 | |
| 1 | Calculated based upon average shares outstanding |
The accompanying notes are an integral part of these financial statements.
| | | | | | |
| Financial highlights | | Wells Fargo Capital Growth Fund | | | 21 | |
(For a share outstanding throughout each period)
| | | | | | | | | | | | | | | | | | | | |
| | | Year ended July 31 | |
| INSTITUTIONAL CLASS | | 2018 | | | 2017 | | | 2016 | | | 2015 | | | 2014 | |
Net asset value, beginning of period | | | $19.44 | | | | $16.65 | | | | $18.84 | | | | $22.54 | | | | $20.84 | |
Net investment income | | | 0.01 | 1 | | | 0.02 | 1 | | | 0.03 | 1 | | | 0.02 | 1 | | | 0.01 | 1 |
Net realized and unrealized gains (losses) on investments | | | 4.55 | | | | 3.22 | | | | 0.05 | | | | 2.23 | | | | 4.00 | |
| | | | | | | | | | | | | | | | | | | | |
Total from investment operations | | | 4.56 | | | | 3.24 | | | | 0.08 | | | | 2.25 | | | | 4.01 | |
Distributions to shareholders from | | | | | | | | | | | | | | | | | | | | |
Net investment income | | | 0.00 | | | | (0.04 | ) | | | 0.00 | | | | 0.00 | | | | (0.08 | ) |
Net realized gains | | | (2.53 | ) | | | (0.41 | ) | | | (2.27 | ) | | | (5.95 | ) | | | (2.23 | ) |
| | | | | | | | | | | | | | | | | | | | |
Total distributions to shareholders | | | (2.53 | ) | | | (0.45 | ) | | | (2.27 | ) | | | (5.95 | ) | | | (2.31 | ) |
Net asset value, end of period | | | $21.47 | | | | $19.44 | | | | $16.65 | | | | $18.84 | | | | $22.54 | |
Total return | | | 26.25 | % | | | 20.00 | % | | | 1.09 | % | | | 11.50 | % | | | 19.76 | % |
Ratios to average net assets (annualized) | | | | | | | | | | | | | | | | | | | | |
Gross expenses | | | 0.93 | % | | | 0.91 | % | | | 0.91 | % | | | 0.84 | % | | | 0.82 | % |
Net expenses | | | 0.70 | % | | | 0.70 | % | | | 0.68 | % | | | 0.65 | % | | | 0.65 | % |
Net investment income | | | 0.05 | % | | | 0.13 | % | | | 0.16 | % | | | 0.09 | % | | | 0.05 | % |
Supplemental data | | | | | | | | | | | | | | | | | | | | |
Portfolio turnover rate | | | 40 | % | | | 59 | % | | | 85 | % | | | 114 | % | | | 94 | % |
Net assets, end of period (000s omitted) | | | $20,229 | | | | $24,653 | | | | $23,670 | | | | $22,578 | | | | $49,816 | |
| 1 | Calculated based upon average shares outstanding |
The accompanying notes are an integral part of these financial statements.
| | | | |
| 22 | | Wells Fargo Capital Growth Fund | | Notes to financial statements |
1. ORGANIZATION
Wells Fargo Funds Trust (the “Trust”), a Delaware statutory trust organized on March 10, 1999, is an open-end management investment company registered under the Investment Company Act of 1940, as amended (the “1940 Act”). As an investment company, the Trust follows the accounting and reporting guidance in Financial Accounting Standards Board Accounting Standards Codification Topic 946, Financial Services – Investment Companies. These financial statements report on the Wells Fargo Capital Growth Fund (the “Fund”) which is a diversified series of the Trust.
Effective at the close of business on November 13, 2017, Class R4 shares were liquidated and the class was subsequently closed. Class R4 shares are no longer offered by the Fund. Information for Class R4 shares reflected in the financial statements represents activity through November 13, 2017.
2. SIGNIFICANT ACCOUNTING POLICIES
The following significant accounting policies, which are consistently followed in the preparation of the financial statements of the Fund, are in conformity with U.S. generally accepted accounting principles which require management to make estimates and assumptions that affect the reported amounts of assets and liabilities, disclosure of contingent assets and liabilities at the date of the financial statements, and the reported amounts of revenues and expenses during the reporting period. Actual results could differ from those estimates.
Securities valuation
All investments are valued each business day as of the close of regular trading on the New York Stock Exchange (generally 4 p.m. Eastern Time), although the Fund may deviate from this calculation time under unusual or unexpected circumstances.
Equity securities that are listed on a foreign or domestic exchange or market are valued at the official closing price or, if none, the last sales price. If no sale occurs on the principal exchange or market that day, a fair value price will be determined in accordance with the Fund’s Valuation Procedures.
Investments in registered open-end investment companies are valued at net asset value. Interests in non-registered investment companies that are redeemable at net asset value are fair valued normally at net asset value.
Investments which are not valued using any of the methods discussed above are valued at their fair value, as determined in good faith by the Board of Trustees of the Fund. The Board of Trustees has established a Valuation Committee comprised of the Trustees and has delegated to it the authority to take any actions regarding the valuation of portfolio securities that the Valuation Committee deems necessary or appropriate, including determining the fair value of portfolio securities, unless the determination has been delegated to the Wells Fargo Asset Management Pricing Committee at Wells Fargo Funds Management, LLC (“Funds Management”). The Board of Trustees retains the authority to make or ratify any valuation decisions or approve any changes to the Valuation Procedures as it deems appropriate. On a quarterly basis, the Board of Trustees receives reports on any valuation actions taken by the Valuation Committee or the Wells Fargo Asset Management Pricing Committee which may include items for ratification.
Valuations of fair valued securities are compared to the next actual sales price when available, or other appropriate market values, to assess the continued appropriateness of the fair valuation methodologies used. These securities are fair valued on a day-to-day basis, taking into consideration changes to appropriate market information and any significant changes to the inputs considered in the valuation process until there is a readily available price provided on an exchange or by an independent pricing service. Valuations received from an independent pricing service or independent broker-dealer quotes are periodically validated by comparisons to most recent trades and valuations provided by other independent pricing services in addition to the review of prices by the manager and/or subadviser. Unobservable inputs used in determining fair valuations are identified based on the type of security, taking into consideration factors utilized by market participants in valuing the investment, knowledge about the issuer and the current market environment.
Foreign currency translation
The accounting records of the Fund are maintained in U.S. dollars. The values of other assets and liabilities denominated in foreign currencies are translated into U.S. dollars at rates provided by an independent foreign currency pricing source at a time each business day specified by the Wells Fargo Asset Management Pricing Committee. Purchases and sales of securities, and income and expenses are converted at the rate of exchange on the respective dates of such transactions. Net realized foreign exchange gains or losses arise from sales of foreign currencies, currency gains or losses realized between the trade and settlement dates on securities transactions, and the difference between the amounts of dividends, interest and foreign withholding taxes recorded and the U.S. dollar equivalent of the amounts actually paid or received. Net unrealized foreign exchange gains and losses arise from changes in the fair value of assets and liabilities other than investments in securities resulting from changes in exchange
| | | | | | |
| Notes to financial statements | | Wells Fargo Capital Growth Fund | | | 23 | |
rates. The changes in net assets arising from changes in exchange rates of securities and the changes in net assets resulting from changes in market prices of securities are not separately presented. Such changes are included in net realized and unrealized gains or losses from investments.
Securities lending
The Fund may lend its securities from time to time in order to earn additional income in the form of fees or interest on securities received as collateral or the investment of any cash received as collateral. The Fund continues to receive interest or dividends on the securities loaned. The Fund receives collateral in the form of cash or securities with a value at least equal to the value of the securities on loan. The value of the loaned securities is determined at the close of each business day and any additional required collateral is delivered to the Fund on the next business day. In a securities lending transaction, the net asset value of the Fund will be affected by an increase or decrease in the value of the securities loaned and by an increase or decrease in the value of the instrument in which collateral is invested. The amount of securities lending activity undertaken by the Fund fluctuates from time to time. In the event of default or bankruptcy by the borrower, the Fund may be prevented from recovering the loaned securities or gaining access to the collateral or may experience delays or costs in doing so. In addition, the investment of any cash collateral received may lose all or part of its value. The Fund has the right under the lending agreement to recover the securities from the borrower on demand.
The Fund lends its securities through an unaffiliated securities lending agent. Cash collateral received in connection with its securities lending transactions is invested in Securities Lending Cash Investments, LLC (the “Securities Lending Fund”). The Securities Lending Fund is exempt from registration under Section 3(c)(7) of the 1940 Act and is managed by Funds Management and is subadvised by Wells Capital Management Incorporated (“WellsCap”), an affiliate of Funds Management and an indirect wholly owned subsidiary of Wells Fargo & Company (“Wells Fargo”). Funds Management receives an advisory fee starting at 0.05% and declining to 0.01% as the average daily net assets of the Securities Lending Fund increase. All of the fees received by Funds Management are paid to WellsCap for its services as subadviser. The Securities Lending Fund seeks to provide a positive return compared to the daily Fed Funds Open Rate by investing in high-quality, U.S. dollar-denominated short-term money market instruments. Securities Lending Fund investments are valued at the evaluated bid price provided by an independent pricing service. Income earned from investment in the Securities Lending Fund, if any, is included in income from affiliated securities on the Statement of Operations.
Security transactions and income recognition
Securities transactions are recorded on a trade date basis. Realized gains or losses are recorded on the basis of identified cost.
Dividend income is recognized on the ex-dividend date. Dividend income is recorded net of foreign taxes withheld where recovery of such taxes is not assured.
Distributions to shareholders
Distributions to shareholders from net investment income and any net realized gains are recorded on the ex-dividend date and paid at least annually. Such distributions are determined in accordance with income tax regulations and may differ from U.S. generally accepted accounting principles. Dividend sources are estimated at the time of declaration. The tax character of distributions is determined as of the Fund’s fiscal year end. Therefore, a portion of the Fund’s distributions made prior to the Fund’s fiscal year end may be categorized as a tax return of capital at year end.
Federal and other taxes
The Fund intends to continue to qualify as a regulated investment company by distributing substantially all of its investment company taxable income and any net realized capital gains (after reduction for capital loss carryforwards) sufficient to relieve it from all, or substantially all, federal income taxes. Accordingly, no provision for federal income taxes was required.
The Fund’s income and federal excise tax returns and all financial records supporting those returns for the prior three fiscal years are subject to examination by the federal and Delaware revenue authorities. Management has analyzed the Fund’s tax positions taken on federal, state, and foreign tax returns for all open tax years and does not believe that there are any uncertain tax positions that require recognition of a tax liability.
As of July 31, 2018, the aggregate cost of all investments for federal income tax purposes was $75,816,195 and the unrealized gains (losses) consisted of:
| | | | |
Gross unrealized gains | | $ | 53,214,304 | |
Gross unrealized losses | | | (853,437 | ) |
Net unrealized gains | | $ | 52,360,867 | |
| | | | |
| 24 | | Wells Fargo Capital Growth Fund | | Notes to financial statements |
Reclassifications are made to the Fund’s capital accounts for permanent tax differences to reflect income and gains available for distribution (or available capital loss carryforwards) under federal income tax regulations. U.S. generally accepted accounting principles require that certain components of net assets be adjusted to reflect permanent differences between financial and tax reporting. These reclassifications have no effect on net assets or net asset values per share. The primary permanent difference causing such reclassification are due to equalization payments and net operating losses. At July 31, 2018, as a result of permanent book-to-tax differences, the following reclassification adjustments were made on the Statement of Assets and Liabilities:
| | | | |
| Paid-in capital | | Accumulated net
investment loss | | Accumulated net
realized gains
on investments |
| $16,448,219 | | $196,835 | | $(16,645,054) |
Class allocations
The separate classes of shares offered by the Fund differ principally in applicable sales charges, distribution, shareholder servicing, and administration fees. Class specific expenses are charged directly to that share class. Investment income, common expenses, and realized and unrealized gains (losses) on investments are allocated daily to each class of shares based on the relative proportion of net assets of each class.
3. FAIR VALUATION MEASUREMENTS
Fair value measurements of investments are determined within a framework that has established a fair value hierarchy based upon the various data inputs utilized in determining the value of the Fund’s investments. The three-level hierarchy gives the highest priority to unadjusted quoted prices in active markets for identical assets or liabilities (Level 1) and the lowest priority to unobservable inputs (Level 3). The Fund’s investments are classified within the fair value hierarchy based on the lowest level of input that is significant to the fair value measurement. The inputs are summarized into three broad levels as follows:
| ∎ | | Level 1 – quoted prices in active markets for identical securities |
| ∎ | | Level 2 – other significant observable inputs (including quoted prices for similar securities, interest rates, prepayment speeds, credit risk, etc.) |
| ∎ | | Level 3 – significant unobservable inputs (including the Fund’s own assumptions in determining the fair value of investments) |
The inputs or methodologies used for valuing investments in securities are not necessarily an indication of the risk associated with investing in those securities.
The following is a summary of the inputs used in valuing the Fund’s assets and liabilities as of July 31, 2018:
| | | | | | | | | | | | | | | | |
| | | Quoted prices
(Level 1) | | | Other significant
observable inputs
(Level 2) | | | Significant
unobservable inputs
(Level 3) | | | Total | |
Assets | | | | | | | | | | | | | | | | |
Investments in: | | | | | | | | | | | | | | | | |
| | | | |
Common stocks | | | | | | | | | | | | | | | | |
Consumer discretionary | | $ | 20,367,246 | | | $ | 0 | | | $ | 0 | | | $ | 20,367,246 | |
Energy | | | 1,239,719 | | | | 0 | | | | 0 | | | | 1,239,719 | |
Financials | | | 6,859,095 | | | | 0 | | | | 0 | | | | 6,859,095 | |
Health care | | | 17,702,293 | | | | 0 | | | | 0 | | | | 17,702,293 | |
Industrials | | | 15,173,349 | | | | 0 | | | | 0 | | | | 15,173,349 | |
Information technology | | | 55,618,056 | | | | 0 | | | | 0 | | | | 55,618,056 | |
Materials | | | 7,949,449 | | | | 0 | | | | 0 | | | | 7,949,449 | |
Real estate | | | 1,012,800 | | | | 0 | | | | 0 | | | | 1,012,800 | |
| | | | |
Short-term investments | | | | | | | | | | | | | | | | |
Investment companies | | | 922,555 | | | | 0 | | | | 0 | | | | 922,555 | |
Investments measured at net asset value* | | | | | | | | | | | | | | | 1,332,500 | |
Total assets | | $ | 126,844,562 | | | $ | 0 | | | $ | 0 | | | $ | 128,177,062 | |
| * | Investments that are measured at fair value using the net asset value per share (or its equivalent) as a practical expedient have not been categorized in the fair value hierarchy. The fair value amount presented in the table is intended to permit reconciliation of the fair value hierarchy to the amounts presented in the Statement of Assets and Liabilities. The Fund’s investment in Securities Lending Cash Investments, LLC valued at $1,332,500 does not have a redemption period notice, can be redeemed daily and does not have any unfunded commitments. |
| | | | | | |
| Notes to financial statements | | Wells Fargo Capital Growth Fund | | | 25 | |
The Fund recognizes transfers between levels within the fair value hierarchy at the end of the reporting period. At July 31, 2018, the Fund did not have any transfers into/out of Level 1, Level 2, or Level 3.
4. TRANSACTIONS WITH AFFILIATES
Management fee
Funds Management, an indirect wholly owned subsidiary of Wells Fargo, is the manager of the Fund and provides advisory and fund-level administrative services under an investment management agreement. Under the investment management agreement, Funds Management is responsible for, among other services, implementing the investment objectives and strategies of the Fund, supervising the subadviser and providing fund-level administrative services in connection with the Fund’s operations. As compensation for its services under the investment management agreement, Funds Management is entitled to receive an annual management fee starting at 0.70% and declining to 0.505% as the average daily net assets of the Fund increase. For the year ended July 31, 2018, the management fee was equivalent to an annual rate of 0.70% of the Fund’s average daily net assets.
Funds Management has retained the services of a subadviser to provide daily portfolio management to the Fund. The fee for subadvisory services is borne by Funds Management. WellsCap is the subadviser to the Fund and is entitled to receive a fee from Funds Management at an annual rate starting at 0.30% and declining to 0.20% as the average daily net assets of the Fund increase.
Administration fees
Under a class-level administration agreement, Funds Management provides class-level administrative services to the Fund, which includes paying fees and expenses for services provided by the transfer agent, sub-transfer agents, omnibus account servicers and record-keepers. As compensation for its services under the class-level administration agreement, Funds Management receives an annual fee which is calculated based on the average daily net assets of each class as follows:
| | | | |
| | | Class-level
administration fee | |
Class A, Class C | | | 0.21 | % |
Class R4 | | | 0.08 | |
Class R6 | | | 0.03 | |
Administrator Class, Institutional Class | | | 0.13 | |
Funds Management has contractually waived and/or reimbursed management and administration fees to the extent necessary to maintain certain net operating expense ratios for the Fund. When each class of the Fund has exceeded its expense cap, Funds Management has waived fees and/or reimbursed expenses from fund level expenses on a proportionate basis and then from class specific expenses; otherwise, waivers and/or reimbursements are applied against class specific expenses before fund level expenses. Funds Management has committed through November 30, 2018 to waive fees and/or reimburse expenses to the extent necessary to cap the Fund’s expenses at 1.11% for Class A shares, 1.86% for Class C shares, 0.60% for Class R6 shares, 0.94% for Administrator Class shares, and 0.70% for Institutional Class shares. After this time, the cap may be increased or the commitment to maintain the cap may be terminated only with the approval of the Board of Trustees.
Distribution fee
The Trust has adopted a distribution plan for Class C shares of the Fund pursuant to Rule 12b-1 under the 1940 Act. A distribution fee is charged to Class C shares and paid to Wells Fargo Funds Distributor, LLC (“Funds Distributor”), the principal underwriter, at an annual rate of 0.75% of the average daily net assets of Class C shares.
In addition, Funds Distributor is entitled to receive the front-end sales charge from the purchase of Class A shares and a contingent deferred sales charge on the redemption of certain Class A shares. Funds Distributor is also entitled to receive the contingent deferred sales charges from redemptions of Class C shares. For the year ended July 31, 2018, Funds Distributor received $2,211 from the sale of Class A. No contingent deferred sales charges were incurred by Class A and Class C shares for the year ended July 31, 2018.
Shareholder servicing fees
The Trust has entered into contracts with one or more shareholder servicing agents, whereby Class A, Class C, and Administrator Class of the Fund are charged a fee at an annual rate of 0.25% of the average daily net assets of each respective class. Class R4 is charged a fee at an annual rate of 0.10% of its average daily net assets.
A portion of these total shareholder servicing fees were paid to affiliates of Wells Fargo.
| | | | |
| 26 | | Wells Fargo Capital Growth Fund | | Notes to financial statements |
Interfund transactions
The Fund may purchase or sell investment securities to other Wells Fargo affiliates pursuant to Rule 17a-7 of the 1940 Act and under procedures adopted by the Board of Trustees. The procedures have been designed to ensure that these interfund transactions, which do not incur broker commissions, are effected at current market prices.
5. INVESTMENT PORTFOLIO TRANSACTIONS
Purchases and sales of investments, excluding U.S. government obligations (if any) and short-term securities, for the year ended July 31, 2018 were $83,485,466 and $281,224,165, respectively.
6. BANK BORROWINGS
The Trust (excluding the money market funds and certain other funds) and Wells Fargo Variable Trust are parties to a $280,000,000 revolving credit agreement whereby the Fund is permitted to use bank borrowings for temporary or emergency purposes, such as to fund shareholder redemption requests. Interest under the credit agreement is charged to the Fund based on a borrowing rate equal to the higher of the Federal Funds rate in effect on that day plus 1.25% or the overnight LIBOR rate in effect on that day plus 1.25%. In addition, an annual commitment fee equal to 0.25% of the unused balance is allocated to each participating fund. Prior to August 29, 2017, the revolving credit agreement amount was $250,000,000
For the year ended July 31, 2018, there were no borrowings by the Fund under the agreement.
7. DISTRIBUTIONS TO SHAREHOLDERS
The tax character of distributions paid during the years ended July 31, 2018 and July 31, 2017 were as follows:
| | | | | | | | |
| | | Year ended July 31 | |
| | | 2018 | | | 2017 | |
Ordinary income | | $ | 5,090,507 | | | $ | 614,987 | |
Long-term capital gain | | | 27,751,550 | | | | 6,526,136 | |
As of July 31, 2018, the components of distributable earnings on a tax basis were as follows:
| | |
Undistributed
long-term
gain | | Unrealized gains |
| $57,742,009 | | $52,360,867 |
8. CONCENTRATION RISK
Concentration risks result from exposure to a limited number of sectors. A fund that invests a substantial portion of its assets in any sector may be more affected by changes in that sector than would be a fund whose investments are not heavily weighted in any sector.
9. INDEMNIFICATION
Under the Trust’s organizational documents, the officers and Trustees have been granted certain indemnification rights against certain liabilities that may arise out of performance of their duties to the Trust. Additionally, in the normal course of business, the Trust may enter into contracts with service providers that contain a variety of indemnification clauses. The Trust’s maximum exposure under these arrangements is dependent on future claims that may be made against the Fund and, therefore, cannot be estimated.
| | | | | | |
| Report of independent registered public accounting firm | | Wells Fargo Capital Growth Fund | | | 27 | |
BOARD OF TRUSTEES AND SHAREHOLDERS OF WELLS FARGO FUNDS TRUST:
Opinion on the Financial Statements
We have audited the accompanying statement of assets and liabilities of Wells Fargo Capital Growth Fund (the “Fund”), one of the funds constituting Wells Fargo Funds Trust, including the portfolio of investments, as of July 31, 2018, the related statement of operations for the year then ended, the statements of changes in net assets for each of the years in the two-year period then ended, and the related notes (collectively, the “financial statements”) and the financial highlights for each of the years in the five-year period then ended. In our opinion, the financial statements and financial highlights present fairly, in all material respects, the financial position of the Fund as of July 31, 2018, the results of its operations for the year then ended, the changes in its net assets for each of the years in the two-year period then ended, and the financial highlights for each of the years in the five-year period then ended, in conformity with U.S. generally accepted accounting principles.
Basis for Opinion
These financial statements and financial highlights are the responsibility of the Fund’s management. Our responsibility is to express an opinion on these financial statements and financial highlights based on our audits. We are a public accounting firm registered with the Public Company Accounting Oversight Board (United States) (“PCAOB”) and are required to be independent with respect to the Fund in accordance with the U.S. federal securities laws and the applicable rules and regulations of the Securities and Exchange Commission and the PCAOB.
We conducted our audits in accordance with the standards of the PCAOB. Those standards require that we plan and perform the audit to obtain reasonable assurance about whether the financial statements and financial highlights are free of material misstatement, whether due to error or fraud. Our audits included performing procedures to assess the risks of material misstatement of the financial statements and financial highlights, whether due to error or fraud, and performing procedures that respond to those risks. Such procedures included examining, on a test basis, evidence regarding the amounts and disclosures in the financial statements and financial highlights. Such procedures also included confirmation of securities owned as of July 31, 2018, by correspondence with the custodian and brokers, or by other appropriate auditing procedures. Our audits also included evaluating the accounting principles used and significant estimates made by management, as well as evaluating the overall presentation of the financial statements and financial highlights. We believe that our audits provide a reasonable basis for our opinion.

We have not been able to determine the specific year that we began serving as the auditor of one or more Wells Fargo Funds investment companies, however we are aware that we have served as the auditor of one or more Wells Fargo Funds investment companies since at least 1955.
Boston, Massachusetts
September 24, 2018
| | | | |
| 28 | | Wells Fargo Capital Growth Fund | | Other information (unaudited) |
TAX INFORMATION
For corporate shareholders, pursuant to Section 854 of the Internal Revenue Code, 35.16% of ordinary income dividends qualify for the corporate dividends-received deduction for the fiscal year ended July 31, 2018.
Pursuant to Section 852 of the Internal Revenue Code, $35,626,926 was designated as a 20% rate gain distribution for the fiscal year ended July 31, 2018. Long-term capital gains in the amount of $7,875,376 were distributed in connection with Fund share redemptions.
Pursuant to Section 854 of the Internal Revenue Code, $2,066,242 of income dividends paid during the fiscal year ended July 31, 2018 has been designated as qualified dividend income (QDI).
For the fiscal year ended July 31, 2018, $5,090,507 has been designated as short-term capital gain dividends for nonresident alien shareholders pursuant to Section 871 of the Internal Revenue Code.
PROXY VOTING INFORMATION
A description of the policies and procedures that the Fund uses to determine how to vote proxies relating to portfolio securities is available, upon request, by calling 1-800-222-8222, visiting our website at wellsfargofunds.com, or visiting the SEC website at sec.gov. Information regarding how the Fund voted proxies relating to portfolio securities during the most recent 12-month period ended June 30 is available on the Fund’s website at wellsfargofunds.com or by visiting the SEC website at sec.gov.
PORTFOLIO HOLDINGS INFORMATION
The complete portfolio holdings for the Fund are publicly available monthly on the Fund’s website (wellsfargofunds.com), on a one-month delayed basis. In addition, top ten holdings information (excluding derivative positions) for the Fund is publicly available on the Fund’s website on a monthly, seven-day or more delayed basis. The Fund files its complete schedule of portfolio holdings with the SEC for the first and third quarters of each fiscal year on Form N-Q, which is available by visiting the SEC website at sec.gov. In addition, the Fund’s Form N-Q may be reviewed and copied at the SEC’s Public Reference Room in Washington, DC, and at regional offices in New York City, at 233 Broadway, and in Chicago, at 175 West Jackson Boulevard, Suite 900. Information about the Public Reference Room may be obtained by calling 1-800-SEC-0330.
| | | | | | |
| Other information (unaudited) | | Wells Fargo Capital Growth Fund | | | 29 | |
BOARD OF TRUSTEES AND OFFICERS
Each of the Trustees and Officers1 listed in the table below acts in identical capacities for each fund in the Wells Fargo family of funds, which consists of 154 mutual funds comprising the Wells Fargo Funds Trust, Wells Fargo Variable Trust, Wells Fargo Master Trust and four closed-end funds (collectively the “Fund Complex”). This table should be read in conjunction with the Prospectus and the Statement of Additional Information2. The mailing address of each Trustee and Officer is 525 Market Street, 12th Floor, San Francisco, CA 94105. Each Trustee and Officer serves an indefinite term, however, each Trustee serves such term until reaching the mandatory retirement age established by the Trustees.
Independent Trustees
| | | | | | |
Name and year of birth | | Position held and length of service* | | Principal occupations during past five years or longer | | Current other public company or
investment company
directorships |
William R. Ebsworth (Born 1957) | | Trustee, since 2015 | | Retired. From 1984 to 2013, equities analyst, portfolio manager, research director and chief investment officer at Fidelity Management and Research Company in Boston, Tokyo, and Hong Kong, and retired in 2013 as Chief Investment Officer of Fidelity Strategic Advisers, Inc. where he led a team of investment professionals managing client assets. Prior thereto, Board member of Hong Kong Securities Clearing Co., Hong Kong Options Clearing Corp., the Thailand International Fund, Ltd., Fidelity Investments Life Insurance Company, and Empire Fidelity Investments Life Insurance Company. Board member of the Forté Foundation (non-profit organization) and the Vincent Memorial Hospital Endowment (non-profit organization), where he serves on the Investment Committee and as a Chair of the Audit Committee. Mr. Ebsworth is a CFA® charterholder. | | Asset Allocation Trust |
Jane A. Freeman (Born 1953) | | Trustee, since 2015; Chair Liaison, since 2018 | | Retired. From 2012 to 2014 and 1999 to 2008, Chief Financial Officer of Scientific Learning Corporation. From 2008 to 2012, Ms. Freeman provided consulting services related to strategic business projects. Prior to 1999, Portfolio Manager at Rockefeller & Co. and Scudder, Stevens & Clark. Board member of the Harding Loevner Funds from 1996 to 2014, serving as both Lead Independent Director and chair of the Audit Committee. Board member of the Russell Exchange Traded Funds Trust from 2011 to 2012 and the chair of the Audit Committee. Ms. Freeman is a Board Member of Ruth Bancroft Garden (non-profit organization) and the Glimmerglass Festival. She is also an inactive Chartered Financial Analyst. | | Asset Allocation Trust |
Isaiah Harris, Jr. (Born 1952) | | Trustee, since 2009 | | Retired. Chairman of the Board of CIGNA Corporation since 2009, and Director since 2005. From 2003 to 2011, Director of Deluxe Corporation. Prior thereto, President and CEO of BellSouth Advertising and Publishing Corp. from 2005 to 2007, President and CEO of BellSouth Enterprises from 2004 to 2005 and President of BellSouth Consumer Services from 2000 to 2003. Emeritus member of the Iowa State University Foundation Board of Governors. Emeritus Member of the Advisory Board of Iowa State University School of Business. Advisory Board Member, Palm Harbor Academy (charter school). Advisory Board Member, Child Evangelism Fellowship (non-profit). Mr. Harris is a certified public accountant (inactive status). | | CIGNA Corporation; Asset Allocation Trust |
Judith M. Johnson (Born 1949) | | Trustee, since 2008; Audit Committee Chairman, since 2009 | | Retired. Prior thereto, Chief Executive Officer and Chief Investment Officer of Minneapolis Employees Retirement Fund from 1996 to 2008. Ms. Johnson is an attorney, certified public accountant and a certified managerial accountant. | | Asset Allocation Trust |
David F. Larcker (Born 1950) | | Trustee, since 2009 | | James Irvin Miller Professor of Accounting at the Graduate School of Business, Stanford University, Director of the Corporate Governance Research Initiative and Senior Faculty of The Rock Center for Corporate Governance since 2006. From 2005 to 2008, Professor of Accounting at the Graduate School of Business, Stanford University. Prior thereto, Ernst & Young Professor of Accounting at The Wharton School, University of Pennsylvania from 1985 to 2005. | | Asset Allocation Trust |
| | | | |
| 30 | | Wells Fargo Capital Growth Fund | | Other information (unaudited) |
| | | | | | |
Name and year of birth | | Position held and length of service* | | Principal occupations during past five years or longer | | Current other public company or
investment company
directorships |
Olivia S. Mitchell (Born 1953) | | Trustee, since 2006; Governance Committee Chairman, since 2018 | | International Foundation of Employee Benefit Plans Professor, Wharton School of the University of Pennsylvania since 1993. Director of Wharton’s Pension Research Council and Boettner Center on Pensions & Retirement Research, and Research Associate at the National Bureau of Economic Research. Previously, Cornell University Professor from 1978 to 1993. | | Asset Allocation Trust |
Timothy J. Penny (Born 1951) | | Trustee, since 1996; Chairman, since 2018; Vice Chairman, from 2017 to 2018 | | President and Chief Executive Officer of Southern Minnesota Initiative Foundation, a non-profit organization, since 2007. Member of the Board of Trustees of NorthStar Education Finance, Inc., a non-profit organization, since 2007. | | Asset Allocation Trust |
James G. Polisson (Born 1959) | | Trustee, since 2018; Advisory Board Member, from 2017 to 2018 | | Retired. Chief Marketing Officer, Source (ETF) UK Services, Ltd, from 2015 to 2017. From 2012 to 2015, Principal of The Polisson Group, LLC, a management consulting, corporate advisory and principal investing company. Chief Executive Officer and Managing Director at Russell Investments, Global Exchange Traded Funds from 2010 to 2012. Managing Director of Barclays Global Investors from 1998 to 2010 and Global Chief Marketing Officer for iShares and Barclays Global Investors from 2000 to 2010. Trustee of the San Francisco Mechanics’ Institute, a non-profit organization, from 2013 to 2015. Board member of the Russell Exchange Traded Fund Trust from 2011 to 2012. Director of Barclays Global Investors Holdings Deutschland GmbH from 2006 to 2009. Mr. Polisson is an attorney and has a retired status with the Massachusetts and District of Columbia Bar Associations. | | Asset Allocation Trust |
Michael S. Scofield (Born 1943) | | Trustee, since 2010 | | Served on the Investment Company Institute’s Board of Governors and Executive Committee from 2008-2011 as well the Governing Council of the Independent Directors Council from 2006-2011 and the Independent Directors Council Executive Committee from 2008-2011. Trustee of the Evergreen Fund complex (and its predecessors) from 1984 to 2010. Chairman of the Evergreen Funds from 2000-2010. Former Trustee of the Mentor Funds. Retired Attorney, Law Offices of Michael S. Scofield. | | Asset Allocation Trust |
Pamela Wheelock (Born 1959) | | Trustee, since 2018; Advisory Board Member, from 2017 to 2018 | | Chief Operating Officer, Twin Cities Habitat for Humanity, since January, 2017. Vice President of University Services, University of Minnesota from 2012 to 2017. Prior thereto, on the Board of Directors, Goverance Committee and Finance Committee for the Minnesota Philanthropy Partners (Saint Paul Foundation) from 2012 to 2018, Interim President and Chief Executive Officer of Blue Cross Blue shield of Minnesota of Minnesota from 2010 to 2011, Chairman of the Board from 2009 to 2011 and Board Director 003 to 2015. Vice President, Leadership and Community Engagement, Bush Foundation, Saint Paul, Minnesota (a private foundation) from 2009 to 2011. Executive Vice President and Chief Financial Officer, Minnesota Sports and Entertainment from 2004 to 2009 and Senior Vice President from 2002 to 2004. Commissioner of Finance, State of Minnesota, from 1999 to 2002. Currently the Board Chair of the Minnesota Wild Foundation since 2010. | | Asset Allocation Trust |
| * | Length of service dates reflect the Trustee’s commencement of service with the Trust’s predecessor entities, where applicable. |
| | | | | | |
| Other information (unaudited) | | Wells Fargo Capital Growth Fund | | | 31 | |
Officers
| | | | | | |
Name and year of birth | | Position held and length of service | | Principal occupations during past five years or longer | | |
Andrew Owen (Born 1960) | | President, since 2017 | | Executive Vice President of Wells Fargo & Company and Head of Affiliated Managers, Wells Fargo Asset Management, since 2014. In addition, Mr. Owen is currently President, Chief Executive Officer and Director of Wells Fargo Funds Management, LLC since 2017. Prior thereto, Executive Vice President responsible for marketing, investments and product development for Wells Fargo Funds Management, LLC, from 2009 to 2014. | | |
Jeremy DePalma1 (Born 1974) | | Treasurer, since 2012 | | Senior Vice President of Wells Fargo Funds Management, LLC since 2009. Senior Vice President of Evergreen Investment Management Company, LLC from 2008 to 2010 and head of the Fund Reporting and Control Team within Fund Administration from 2005 to 2010. | | |
Alexander Kymn3 (Born 1973) | | Secretary, since 2018; Chief Legal Officer, since 2018 | | Senior Company Counsel of Wells Fargo Bank, N.A. since 2018 (previously Senior Counsel from 2007 to 2018). Vice President of Wells Fargo Funds Management, LLC from 2008 to 2014. | | |
Michael H. Whitaker (Born 1967) | | Chief Compliance Officer, since 2016 | | Senior Vice President and Chief Compliance Officer since 2016. Senior Vice President and Chief Compliance Officer for Fidelity Investments from 2007 to 2016. | | |
David Berardi (Born 1975) | | Assistant Treasurer, since 2009 | | Vice President of Wells Fargo Funds Management, LLC since 2009. Vice President of Evergreen Investment Management Company, LLC from 2008 to 2010. Manager of Fund Reporting and Control for Evergreen Investment Management Company, LLC from 2004 to 2010. | | |
| 1 | Jeremy DePalma acts as Treasurer of 77 funds and Assistant Treasurer of 77 funds in the Fund Complex. |
| 2 | The Statement of Additional Information includes additional information about the Trustees and is available, without charge, upon request, by calling 1-800-222-8222 or by visiting the website at wellsfargofunds.com. |
| 3 | Alexander Kymn became the Secretary and Chief Legal Officer effective April 17, 2018. |
| | | | |
| 32 | | Wells Fargo Capital Growth Fund | | Other information (unaudited) |
BOARD CONSIDERATION OF INVESTMENT MANAGEMENT AND SUB-ADVISORY AGREEMENTS:
Wells Fargo Capital Growth Fund
Under the Investment Company Act of 1940 (the “1940 Act”), the Board of Trustees (the “Board”) of Wells Fargo Funds Trust (the “Trust”) must determine annually whether to approve the continuation of the Trust’s investment management and sub-advisory agreements. In this regard, at an in-person meeting held on May 22-23, 2018 (the “Meeting”), the Board, all the members of which have no direct or indirect interest in the investment management and sub-advisory agreements and are not “interested persons” of the Trust, as defined in the 1940 Act (the “Independent Trustees”), reviewed and approved for Wells Fargo Capital Growth Fund (the “Fund”): (i) an investment management agreement (the “Management Agreement”) with Wells Fargo Funds Management, LLC (“Funds Management”); and (ii) an investment sub-advisory agreement (the “Sub-Advisory Agreement”) with Wells Capital Management Incorporated (the “Sub-Adviser”), an affiliate of Funds Management. The Management Agreement and the Sub-Advisory Agreement are collectively referred to as the “Advisory Agreements.”
At the Meeting, the Board considered the factors and reached the conclusions described below relating to the selection of Funds Management and the Sub-Adviser and the approval of the Advisory Agreements. Prior to the Meeting, including at an in-person meeting in April 2018, the Trustees conferred extensively among themselves and with representatives of Funds Management about these matters. Also, the Board has adopted a team-based approach, with each team consisting of a sub-set of Trustees, to assist the full Board in the discharge of its duties in reviewing investment performance and other matters throughout the year. The Independent Trustees were assisted in their evaluation of the Advisory Agreements by independent legal counsel, from whom they received separate legal advice and with whom they met separately.
In providing information to the Board, Funds Management and the Sub-Adviser were guided by a detailed set of requests for information submitted to them by independent legal counsel on behalf of the Independent Trustees at the start of the Board’s annual contract renewal process earlier in 2018. In considering and approving the Advisory Agreements, the Trustees considered the information they believed relevant, including but not limited to the information discussed below. The Board considered not only the specific information presented in connection with the Meeting, but also the knowledge gained over time through interaction with Funds Management and the Sub-Adviser about various topics. In this regard, the Board reviewed reports of Funds Management at each of its quarterly meetings, which included, among other things, portfolio reviews and investment performance reports. In addition, the Board and the teams mentioned above confer with portfolio managers at various times throughout the year. The Board did not identify any particular information or consideration that was all-important or controlling, and each individual Trustee may have attributed different weights to various factors.
After its deliberations, the Board unanimously approved the continuation of the Advisory Agreements for a one-year term and determined that the compensation payable to Funds Management and the Sub-Adviser under each of the Advisory Agreements was reasonable. The Board considered the approval of the Advisory Agreements for the Fund as part of its consideration of agreements for funds across the complex, but its approvals were made on a fund-by-fund basis. The following summarizes a number of important, but not necessarily all, factors considered by the Board in support of its approvals.
Nature, extent and quality of services
The Board received and considered various information regarding the nature, extent and quality of services provided to the Fund by Funds Management and the Sub-Adviser under the Advisory Agreements. This information included a description of the investment advisory services and Fund-level administrative services covered by the Management Agreement, as well as, among other things, a summary of the background and experience of senior management of Wells Fargo Asset Management (“WFAM”), of which Funds Management and the Sub-Adviser are a part, a summary of investments made in the business of WFAM, a summary of certain organizational and personnel changes involving Funds Management and the Sub-Adviser, and a description of Funds Management’s and the Sub-Adviser’s business continuity planning programs and of their approaches to data privacy and cybersecurity. The Board also considered the qualifications, background, tenure and responsibilities of each of the portfolio managers primarily responsible for the day-to-day portfolio management of the Fund.
The Board evaluated the ability of Funds Management and the Sub-Adviser to attract and retain qualified investment professionals, including research, advisory and supervisory personnel. The Board further considered the compliance programs and compliance records of Funds Management and the Sub-Adviser. In addition, the Board took into account the full range of services provided to the Fund by Funds Management and its affiliates.
| | | | | | |
| Other information (unaudited) | | Wells Fargo Capital Growth Fund | | | 33 | |
Fund investment performance and expenses
The Board considered the investment performance results for the Fund over various time periods ended December 31, 2017. The Board considered these results in comparison to the investment performance of funds in a universe that was determined by Broadridge Inc. (“Broadridge”) to be similar to the Fund (the “Universe”), and in comparison to the Fund’s benchmark index and to other comparative data. Broadridge is an independent provider of investment company data. The Board received a description of the methodology used by Broadridge to select the mutual funds in the performance Universe. The Board noted that the investment performance of the Fund (Administrator Class) was higher than or in range of the average investment performance of the Universe for the one-, three- and five-year periods under review, but lower than the average investment performance of the Universe for the ten-year period under review. The Board also noted that the investment performance of the Fund was higher than its benchmark index, the Russell 1000 Growth Index, for the one-year period under review, but lower than its benchmark index for the three-, five-, and ten-year periods under review.
The Board also received and considered information regarding the Fund’s net operating expense ratios and their various components, including actual management fees, custodian and other non-management fees, and Rule 12b-1 and non-Rule 12b-1 shareholder service fees. The Board considered these ratios in comparison to the median ratios of funds in class-specific expense groups that were determined by Broadridge to be similar to the Fund (the “Groups”). The Board received a description of the methodology used by Broadridge to select the mutual funds in the expense Groups and an explanation of how funds comprising expense groups and their expense ratios may vary from year-to-year. Based on the Broadridge reports, the Board noted that the net operating expense ratios of the Fund were lower than the median net operating expense ratios of the expense Groups for each share class.
The Board took into account the Fund’s investment performance and expense information provided to it among the factors considered in deciding to re-approve the Advisory Agreements.
Investment management and sub-advisory fee rates
The Board reviewed and considered the contractual fee rates payable by the Fund to Funds Management under the Management Agreement, as well as the contractual fee rates payable by the Fund to Funds Management for class-level administrative services under a Class-Level Administration Agreement, which include, among other things, class-level transfer agency and sub-transfer agency costs (collectively, the “Management Rates”). The Board also reviewed and considered the contractual investment sub-advisory fee rates that are payable by Funds Management to the Sub-Adviser for investment sub-advisory services.
Among other information reviewed by the Board was a comparison of the Fund’s Management Rates with the average contractual investment management fee rates of funds in the expense Groups at a common asset level as well as transfer agency costs of the funds in the expense Groups. The Board noted that the Management Rates of the Fund were lower than, equal to or in range of the sum of these average rates for the Fund’s expense Groups for all share classes.
The Board also received and considered information about the portion of the total management fee that was retained by Funds Management after payment of the fee to the Sub-Adviser for sub-advisory services. In assessing the reasonableness of this amount, the Board received and evaluated information about the nature and extent of responsibilities retained and risks assumed by Funds Management and not delegated to or assumed by the Sub-Adviser, and about Funds Management’s on-going oversight services. Given the affiliation between Funds Management and the Sub-Adviser, the Board ascribed limited relevance to the allocation of fees between them.
The Board also received and considered information about the nature and extent of services offered and fee rates charged by Funds Management and the Sub-Adviser to other types of clients with investment strategies similar to those of the Fund. In this regard, the Board received information about the significantly greater scope of services, and compliance, reporting and other legal burdens and risks of managing mutual funds compared with those associated with managing assets of non-mutual fund clients such as institutional separate accounts.
Based on its consideration of the factors and information it deemed relevant, including those described here, the Board determined that the compensation payable to Funds Management under the Management Agreement and to the Sub-Adviser under the Sub-Advisory Agreement was reasonable.
Profitability
The Board received and considered information concerning the profitability of Funds Management, as well as the profitability of both WFAM and Wells Fargo & Co. (“Wells Fargo”) as a whole, from providing services to the Fund and the fund family as a whole. The Board noted that the Sub-Adviser’s profitability information with respect to providing services to the Fund was subsumed in the WFAM and Wells Fargo profitability analysis.
| | | | |
| 34 | | Wells Fargo Capital Growth Fund | | Other information (unaudited) |
Funds Management reported on the methodologies and estimates used in calculating profitability, including a description of the methodology used to allocate certain expenses and recent enhancements made to the methodology. Among other things, the Board noted that the levels of profitability reported on a fund-by-fund basis varied widely, depending on factors such as the size and type of fund. Based on its review, the Board did not deem the profits reported by Funds Management, WFAM or Wells Fargo from services provided to the Fund to be at a level that would prevent it from approving the continuation of the Advisory Agreements.
Economies of scale
The Board considered the extent to which Funds Management may experience economies of scale in the provision of management services, and the extent to which scale benefits, if any, would be shared with shareholders. In particular, the Board noted the existence of breakpoints in the Fund’s management fee structure, which operate generally to reduce the Fund’s expense ratios as the Fund grows in size. It considered that, for a small fund or a fund that shrinks in size, breakpoints conversely can result in higher fee levels. The Board also considered that in addition to management fee breakpoints, competitive management fee rates set at the outset without regard to breakpoints and fee waiver and expense reimbursement arrangements, as well as investments in the business intended to enhance services available to Fund shareholders, are means of sharing potential economies of scale with shareholders of the Fund.
The Board concluded that the Fund’s fee and expense arrangements, including contractual breakpoints, constituted a reasonable approach to sharing potential economies of scale with the Fund and its shareholders.
Other benefits to Funds Management and the Sub-Adviser
The Board received and considered information regarding potential “fall-out” or ancillary benefits received by Funds Management and its affiliates, including the Sub-Adviser, as a result of their relationships with the Fund. Ancillary benefits could include, among others, benefits directly attributable to other relationships with the Fund and benefits potentially derived from an increase in Funds Management’s and the Sub-Adviser’s business as a result of their relationships with the Fund. The Board noted that various affiliates of Funds Management may receive distribution-related fees, shareholder servicing payments and sub-transfer agency fees in respect of shares sold or held through them and services provided.
The Board also reviewed information about soft dollar credits earned and utilized by the Sub-Adviser, fees earned by Funds Management and the Sub-Adviser from managing a private investment vehicle for the fund family’s securities lending collateral and commissions earned by an affiliated broker from portfolio transactions.
Based on its consideration of the factors and information it deemed relevant, including those described here, the Board did not find that any ancillary benefits received by Funds Management and its affiliates, including the Sub-Adviser, were unreasonable.
Conclusion
At the Meeting, after considering the above-described factors and based on its deliberations and its evaluation of the information described above, the Board unanimously approved the continuation of the Advisory Agreements for a one-year term and determined that the compensation payable to Funds Management and the Sub-Adviser under each of the Advisory Agreements was reasonable.
| | | | | | |
| Appendix A (unaudited) | | Wells Fargo Capital Growth Fund | | | 35 | |
SALES CHARGE REDUCTIONS AND WAIVERS FOR CERTAIN INTERMEDIARIES
Ameriprise
Effective June 1, 2018, shareholders purchasing Fund shares through an Ameriprise Financial platform or account will be eligible only for the following Class A load waivers (front-end sales charge waivers), which may differ from those disclosed elsewhere in the Fund’s prospectus or Statement of Additional Information.
Front-end Sales Load Waivers on Class A Shares Available at Ameriprise Financial
| | • | | Employer-sponsored retirement plans (e.g., 401(k) plans, 457 plans, employer-sponsored 403(b) plans, profit sharing and money purchase pension plans and defined benefit plans). For purposes of this provision, employer-sponsored retirement plans do not include SEP IRAs, Simple IRAs or SAR-SEPs. |
| | • | | Shares purchased through an Ameriprise Financial investment advisory program (if an Advisory or similar share class for such investment advisory program is not available) |
| | • | | Shares purchased by third party investment advisors on behalf of their advisory clients through Ameriprise Financial’s platform (if an Advisory or similar share class for such investment advisory program is not available) |
| | • | | Shares purchased through reinvestment of distributions and dividend reinvestment when purchasing shares of the same Fund (but not any other fund within the same fund family) |
| | • | | Shares exchanged from Class C shares of the same fund in the month of or following the 10-year anniversary of the purchase date. To the extent that the Fund’s prospectus elsewhere provides for a waiver with respect to such shares following a shorter holding period, that waiver will apply to exchanges following such shorter period. To the extent that the Fund’s prospectus elsewhere provides for a waiver with respect to exchanges of Class C shares for load-waived shares, that waiver will also apply to such exchanges. |
| | • | | Employees and registered representatives of Ameriprise Financial or its affiliates and their immediate family members |
| | • | | Shares purchased by or through qualified accounts (including IRAs, Coverdell Education Savings Accounts, 401(k)s, 403(b) TSCAs subject to ERISA and defined benefit plans) that are held by a covered family member, defined as an Ameriprise financial advisor and/or the advisor’s spouse, advisor’s lineal ascendant (mother, father, grandmother, grandfather, great grandmother, great grandfather), advisor’s lineal descendant (son, step-son, daughter, step-daughter, grandson, granddaughter, great grandson, great granddaughter) or any spouse of a covered family member who is a lineal descendant |
| | • | | Shares purchased from the proceeds of redemptions within the same fund family, provided (1) the repurchase occurs within 90 days following the redemption, (2) the redemption and purchase occur in the same account, and (3) redeemed shares were subject to a front-end or deferred sales load (i.e. Rights of Reinstatement). Subject to the Fund’s policy regarding frequent purchases and redemptions of Fund shares, you may not be able to repurchase shares for the first 30 days after your redemption. |
Automatic Exchange of Class C Shares Available at Ameriprise Financial
| | • | | Class C shares will automatically exchange to Class A shares in the month of the 10-year anniversary of the purchase date. |
Merrill Lynch
Effective April 10, 2017, shareholders purchasing Fund shares through a Merrill Lynch platform or account will be eligible only for the following load waivers (front-end sales charge waivers and contingent deferred, or back-end, sales charge waivers) and discounts, which may differ from those disclosed elsewhere in the Fund’s prospectus or Statement of Additional Information.
Front-end Sales Load Waivers on Class A Shares available at Merrill Lynch
| | • | | Employer-sponsored retirement, deferred compensation and employee benefit plans (including health savings accounts) and trusts used to fund those plans, provided that the shares are not held in a commission-based brokerage account and shares are held for the benefit of the plan |
| | • | | Shares purchased by or through a 529 Plan |
| | • | | Shares purchased through a Merrill Lynch affiliated investment advisory program |
| | | | |
| 36 | | Wells Fargo Capital Growth Fund | | Appendix A (unaudited) |
| | • | | Shares purchased by third party investment advisors on behalf of their advisory clients through Merrill Lynch’s platform |
| | • | | Shares of funds purchased through the Merrill Edge Self-Directed platform (if applicable) |
| | • | | Shares purchased through reinvestment of capital gains distributions and dividend reinvestment when purchasing shares of the same fund (but not any other fund within the fund family) |
| | • | | Shares exchanged from Class C (i.e. level-load) shares of the same fund in the month of or following the 10-year anniversary of the purchase date |
| | • | | Employees and registered representatives of Merrill Lynch or its affiliates and their family members, as defined by Merrill Lynch, which may differ from the definition of family member in the Fund’s prospectus. |
| | • | | Directors or Trustees of the Fund, and employees of the Fund’s investment adviser or any of its affiliates, as described in the Fund’s prospectus |
| | • | | Shares purchased from the proceeds of redemptions within the same fund family, provided (1) the repurchase occurs within 90 days following the redemption, (2) the redemption and purchase occur in the same account, and (3) redeemed shares were subject to a front-end or deferred sales load (known as Rights of Reinstatement). Subject to the Fund’s policy regarding frequent purchases and redemptions of Fund shares, you may not be able to repurchase shares for the first 30 days after your redemption. |
CDSC Waivers on A, B and C Shares available at Merrill Lynch
| | • | | Death or disability of the shareholder |
| | • | | Shares sold as part of a systematic withdrawal plan as described in the Fund’s prospectus |
| | • | | Return of excess contributions from an IRA Account |
| | • | | Shares sold as part of a required minimum distribution for IRA and retirement accounts due to the shareholder reaching age 70½ |
| | • | | Shares sold to pay Merrill Lynch fees but only if the transaction is initiated by Merrill Lynch |
| | • | | Shares acquired through a right of reinstatement |
| | • | | Shares held in retirement brokerage accounts, that are exchanged for a lower cost share class due to transfer to certain fee based accounts or platforms (applicable to A and C shares only) |
Front-end load Discounts Available at Merrill Lynch: Breakpoints, Rights of Accumulation & Letters of Intent
| | • | | Breakpoints as described in the Fund’s prospectus |
| | • | | Rights of Accumulation (ROA) which entitle shareholders to breakpoint discounts will be automatically calculated based on the aggregated holding of fund family assets held by accounts within the purchaser’s household at Merrill Lynch. Eligible fund family assets not held at Merrill Lynch may be included in the ROA calculation only if the shareholder notifies his or her financial advisor about such assets. |
| | • | | Letters of Intent (LOI) which allow for breakpoint discounts based on anticipated purchases within a fund family, through Merrill Lynch, over a 13-month period of time (if applicable) |
Morgan Stanley
Effective on or about July 1, 2018, shareholders purchasing Fund shares through a Morgan Stanley Wealth Management transactional brokerage account will be eligible only for the following Class A load waivers (front-end sales charge waivers), which may differ from and be more limited than those disclosed in the Fund’s prospectus or Statement of Additional Information.
Front-end Sales Load Waivers on Class A Shares Available at Morgan Stanley
| | • | | Employer-sponsored retirement plans (e.g., 401(k) plans, 457 plans, employer-sponsored 403(b) plans, profit sharing and money purchase pension plans and defined benefit plans). For purposes of this provision, employer-sponsored retirement plans do not include SEP IRAs, Simple IRAs, SAR-SEPs or Keogh plans. |
| | • | | Morgan Stanley employee and employee-related accounts according to Morgan Stanley’s account linking rules |
| | • | | Shares purchased through reinvestment of dividends and capital gains distributions when purchasing shares of the same fund |
| | • | | Shares purchased through a Morgan Stanley self-directed brokerage account |
| | | | | | |
| Appendix A (unaudited) | | Wells Fargo Capital Growth Fund | | | 37 | |
| | • | | Class C (i.e., level-load) shares that are no longer subject to a contingent deferred sales charge and are exchanged to Class A shares of the same fund pursuant to Morgan Stanley Wealth Management’s share class exchange program. |
| | • | | Shares purchased from the proceeds of redemptions within the same fund family, provided (i) the repurchase occurs within 90 days following the redemption, (ii) the redemption and purchase occur in the same account, and (iii) redeemed shares were subject to a front-end or deferred sales charge. This waiver is subject to the Fund’s policy regarding frequent purchases and redemption of Fund shares, as discussed under “Account Information—Frequent Purchases and Redemptions of Fund Shares” in the Fund’s prospectus. |
This page is intentionally left blank.
This page is intentionally left blank.
This page is intentionally left blank.

For more information
More information about Wells Fargo Funds is available free upon request. To obtain literature, please write, email, visit the Fund’s website, or call:
Wells Fargo Funds
P.O. Box 219967
Kansas City, MO 64121-9967
Website: wellsfargofunds.com
Individual investors: 1-800-222-8222
Retail investment professionals: 1-888-877-9275
Institutional investment professionals:
1-866-765-0778
This report and the financial statements contained herein are submitted for the general information of the shareholders of the Fund. If this report is used for promotional purposes, distribution of the report must be accompanied or preceded by a current prospectus. Before investing, please consider the investment objectives, risks, charges, and expenses of the investment. For a current prospectus and, if available, a summary prospectus, containing this information, call 1-800-222-8222 or visit the Fund’s website at wellsfargofunds.com. Read the prospectus carefully before you invest or send money.
Wells Fargo Asset Management (WFAM) is the trade name for certain investment advisory/management firms owned by Wells Fargo & Company. These firms include but are not limited to Wells Capital Management Incorporated and Wells Fargo Funds Management, LLC. Certain products managed by WFAM entities are distributed by Wells Fargo Funds Distributor, LLC (a broker/dealer and Member FINRA).
This material is for general informational and educational purposes only and is NOT intended to provide investment advice or a recommendation of any kind—including a recommendation for any specific investment, strategy, or plan.
NOT FDIC INSURED ◾ NO BANK GUARANTEE ◾ MAY LOSE VALUE
© 2018 Wells Fargo Funds Management, LLC. All rights reserved.
| | |
 | | 314793 09-18 A200/AR200 07-18 |
Annual Report
July 31, 2018

Wells Fargo Disciplined U.S. Core Fund


Reduce clutter. Save trees.
Sign up for electronic delivery of prospectuses and shareholder reports at wellsfargo.com/advantagedelivery
Contents
The views expressed and any forward-looking statements are as of July 31, 2018, unless otherwise noted, and are those of the Fund managers and/or Wells Fargo Funds Management, LLC. Discussions of individual securities, or the markets generally, or any Wells Fargo Fund are not intended as individual recommendations. Future events or results may vary significantly from those expressed in any forward-looking statements. The views expressed are subject to change at any time in response to changing circumstances in the market. Wells Fargo Funds Management, LLC and the Fund disclaim any obligation to publicly update or revise any views expressed or forward-looking statements.
NOT FDIC INSURED ◾ NO BANK GUARANTEE ◾ MAY LOSE VALUE
| | | | |
| 2 | | Wells Fargo Disciplined U.S. Core Fund | | Letter to shareholders (unaudited) |

Andrew Owen
President
Wells Fargo Funds
After advancing during the summer and fall of 2017 in a roughly synchronized way, economic growth and stock markets globally diverged during the first seven months of 2018.
Dear Shareholder:
We are pleased to offer you this annual report for the Wells Fargo Disciplined U.S. Core Fund for the 12-month period that ended July 31, 2018. After advancing during the summer and fall of 2017 in a roughly synchronized way, economic growth and stock markets globally diverged during the first seven months of 2018. For fixed-income investors, higher U.S. interest rates, rising inflation, and intensifying global geopolitical tensions tended to restrain taxable bond prices while high-yield and municipal bond investors generally enjoyed positive returns.
For the period, U.S. stocks, as measured by the S&P 500 Index,1 gained 16.24%, and international stocks, as measured by the MSCI ACWI ex USA Index (Net),2 added 5.94%. Emerging market stocks, as measured by the MSCI EM Index (Net),3 added 4.36%. In bond markets, the Bloomberg Barclays U.S. Aggregate Bond Index4 declined 0.80% while fixed-income investments outside the U.S. fell 0.27%, according to the Bloomberg Barclays Global Aggregate ex-USD Index.5 The Bloomberg Barclays Municipal Bond Index6 added 0.99%, and the ICE BofAML U.S. High Yield Index7 was up 2.49%.
Volatility increased as summer turned to fall in 2017, although data generally was favorable.
During the third quarter of 2017, investor expectations rose and fell amid shifting geopolitical tensions, particularly in Asia as North Korea’s nuclear aspirations and U.S./China trade rhetoric caused concerns. In the U.S., corporate earnings and consumer confidence improved. The U.S. Bureau of Economic Analysis reported that annualized U.S. gross domestic product (GDP) growth for the quarter was 2.8%. The rate of inflation was below the U.S. Federal Reserve’s (Fed’s) targets.
Economic momentum increased in Europe; the European Central Bank (ECB) held its rates steady at low levels and continued its quantitative easing bond-buying program with the goal of sparking economic activity. In emerging markets, many countries benefited from stronger currencies versus the U.S. dollar while commodity price increases benefited countries that rely on natural resources for exports.
| 1 | The S&P 500 Index consists of 500 stocks chosen for market size, liquidity, and industry group representation. It is a market-value-weighted index with each stock’s weight in the index proportionate to its market value. You cannot invest directly in an index. |
| 2 | The Morgan Stanley Capital International (MSCI) All Country World Index (ACWI) ex USA Index (Net) is a free-float-adjusted market-capitalization-weighted index that is designed to measure the equity market performance of developed markets, excluding the United States and Canada. Source: MSCI. MSCI makes no express or implied warranties or representations and shall have no liability whatsoever with respect to any MSCI data contained herein. The MSCI data may not be further redistributed or used as a basis for other indices or any securities or financial products. This report is not approved, reviewed, or produced by MSCI. You cannot invest directly in an index. |
| 3 | The MSCI Emerging Markets (EM) Index (Net) is a free-float-adjusted market-capitalization-weighted index that is designed to measure large- and mid-cap equity market performance of emerging markets. The MSCI EM Index (Net) consists of the following 24 emerging market country indices: Brazil, Chile, China, Colombia, Czech Republic, Egypt, Greece, Hungary, India, Indonesia, Korea, Malaysia, Mexico, Pakistan, Peru, the Philippines, Poland, Qatar, Russia, South Africa, Taiwan, Thailand, Turkey, and the United Arab Emirates. You cannot invest directly in an index. |
| 4 | The Bloomberg Barclays U.S. Aggregate Bond Index is a broad-based benchmark that measures the investment-grade, U.S. dollar-denominated, fixed-rate taxable bond market, including Treasuries, government-related and corporate securities, mortgage-backed securities (agency fixed-rate and hybrid adjustable-rate mortgage pass-throughs), asset-backed securities, and commercial mortgage-backed securities. You cannot invest directly in an index. |
| 5 | The Bloomberg Barclays Global Aggregate ex-USD Index is an unmanaged index that provides a broad-based measure of the global investment-grade fixed-income markets excluding the U.S. dollar-denominated debt market. You cannot invest directly in an index. |
| 6 | The Bloomberg Barclays Municipal Bond Index is an unmanaged index composed of long-term tax-exempt bonds with a minimum credit rating of Baa. You cannot invest directly in an index. |
| 7 | The ICE BofAML U.S. High Yield Index is a market-capitalization-weighted index of domestic and Yankee high-yield bonds. The index tracks the performance of high-yield securities traded in the U.S. bond market. You cannot invest directly in an index. Copyright 2018. ICE Data Indices, LLC. All rights reserved. |
| 8 | The Consumer Price Index For All Urban Consumers (CPI-U) measures the changes in the price of a basket of goods and services purchased by urban consumers. The urban consumer population is deemed by many as a better representative measure of the general public because most of the country’s population lives in highly populated areas, which represent close to 90% of the total population. You cannot invest directly in an index. |
| | | | | | |
| Letter to shareholders (unaudited) | | Wells Fargo Disciplined U.S. Core Fund | | | 3 | |
The fourth quarter of 2017 was characterized by continued optimism in the U.S.
By the end of 2017, some observers were describing conditions as a Goldilocks economic scenario: synchronized global growth, low inflation, and healthy corporate earnings, all supported abroad by a weaker U.S. dollar.
U.S. stocks continued to rally during the fourth quarter of 2017, boosted by favorable company earnings and the potential for tax reform and industry deregulation. The Fed increased rates by 25 basis points (bps; 100 bps equal 1.00%) in December. The annualized GDP growth rate for the fourth quarter was 2.3%.
Internationally, the Bank of England (BoE) raised interest rates in November 2017 to 0.50%, the first increase in more than 10 years and a move up from the 0.25% rate put in place after the Brexit vote to leave the European Union in June 2016. The pound gained against other currencies. Meanwhile, the ECB and the Bank of Japan maintained interest rate policies and bond-buying programs intended to spur business activities and enhance the attractiveness of equity investments. The People’s Bank of China (PBOC) also continued policies that encouraged business investment. International equity markets, particularly emerging markets, continued to show strength.
Volatility reemerged during the first quarter of 2018 as economic signals were mixed.
The first quarter of 2018 began with stock market gains in January following U.S. tax reform that lowered rates for individuals and corporations and deregulation advanced in some economic sectors. Then, investor optimism was supplanted by several concerns. Trade tensions intensified, particularly between the U.S. and China. The U.S. threatened to impose tariffs on a broad range of imported products. Increasing interest rates and inflation also caused concern. During February 2018, the U.S. stock market endured a loss of more than 10% before recovering in March and April. The S&P 500 Index closed the first quarter with a negative return, the first negative quarterly return for the index since 2014.
The Fed increased the federal funds rate by 25 bps in March 2018 and the rate of inflation reached the Fed’s 2% target for the first time in a year. The unemployment rate fell to 4.1%. The third revision of first-quarter GDP growth by the U.S. Bureau of Economic Analysis released during June 2018 was lowered to 2.0%.
Overseas, investment market returns reversed the strong returns of 2017. After having gained 27.19% for the 12-month period that ended December 31, 2017, the MSCI ACWI ex USA Index (Net) fell 1.46% for the 7-month period that ended July 31, 2018. The U.S. dollar strengthened relative to local currencies, which served to restrain returns.
Global trade tensions escalated during the second quarter and into the third quarter of 2018.
Global trade tensions escalated as the second quarter of 2018 opened and equity markets fell in response before resuming upward momentum later in April. The U.S. government imposed tariffs on products and commodities imported from other markets in North America, Europe, and Asia. In retaliation, governments imposed tariffs on U.S. products and commodities. In addition, the U.S. pushed its North American neighbors to renegotiate the North American Free Trade Agreement, furthering trade tensions and investor uncertainty.
The CPI-U8 added 0.2% in May after a similar increase in April. On a year-over-year basis, the all-items index rose 2.8% for the 12 months that ended May 31, continuing its upward trend since the beginning of the year. The index for all items less food and energy rose 2.2% for the same 12-month period. Interest rates generally increased and the bond markets tended to decline.
During February 2018, the U.S. stock market endured a loss of more than 10% before recovering in March and April.
| | | | |
| 4 | | Wells Fargo Disciplined U.S. Core Fund | | Letter to shareholders (unaudited) |
During June 2018, the Fed increased the federal funds rate by 25 bps. Investment markets began to anticipate two more rate increases in 2018. Long-term interest rates in the U.S. trended higher—rates on the 10-year and 30-year Treasury bonds moved from 2.46% and 2.81%, respectively, on January 1, 2018, to 2.96% and 3.08%, respectively, on July 31, 2018. While higher at the end of the period, rates were off their peak levels on May 17, 2018, of 3.11% and 3.25%, respectively. Investors became more aware of and concerned about the potential for an inverted yield curve—sometimes a recession signal—as short-term rates increased more quickly than long-term rates.
The unemployment rate fell to 3.9% in July after ticking up slightly in June from May’s 3.8% level, according to the U.S. Department of Labor. The annualized rate of GDP growth for the second quarter of 2018 was reported in July to be 4.1%, the highest level since the third quarter of 2014, according to the U.S. Bureau of Economic Analysis.
Internationally, the prospects for a smooth U.K. Brexit agreement was cast into doubt as members of Prime Minister Theresa May’s negotiating team resigned. Despite the uncertainty, the period closed with expectations that the BoE’s Monetary Policy Committee in July would announce an increase in its key interest rate to 0.75%, which it did in early August.
Meanwhile, central banks in Europe and Japan maintained low interest rates and accommodative monetary policies. Amid rising trade uncertainty, PBOC monetary policies shifted with cuts to reserve requirement ratios and implementation of supportive measures such as accelerated infrastructure spending and tax cuts for small and medium enterprises and for individuals. Nevertheless, a strengthening U.S. dollar and the tensions associated with trade policies remained headwinds for investors overseas.
Don’t let short-term uncertainty derail long-term investment goals.
Periods of investment uncertainty can present challenges, but experience has taught us that maintaining long-term investment goals can be an effective way to plan for the future. To help you create a sound strategy based on your personal goals and risk tolerance, Wells Fargo Funds offers more than 100 mutual funds spanning a wide range of asset classes and investment styles. Although diversification cannot guarantee an investment profit or prevent losses, we believe it can be an effective way to manage investment risk and potentially smooth out overall portfolio performance. We encourage investors to know their investments and to understand that appropriate levels of risk-taking may unlock opportunities.
Thank you for choosing to invest with Wells Fargo Funds. We appreciate your confidence in us and remain committed to helping you meet your financial needs.
Sincerely,

Andrew Owen
President
Wells Fargo Funds
| | | | | | |
| Letter to shareholders (unaudited) | | Wells Fargo Disciplined U.S. Core Fund | | | 5 | |
Notice to shareholders
At a meeting held on August 14-15, 2018, the Board of Trustees of the Fund approved the following policy which will be effective on or about February 5, 2019:
Class C shares will convert automatically into Class A shares ten years after the initial date of purchase or, if you acquired your Class C shares through an exchange or conversion from another share class, ten years after the date you acquired your Class C shares. When Class C shares that you acquired through a purchase or exchange convert, any other Class C shares that you purchased with reinvested dividends and distributions also will convert into Class A shares on a pro rata basis. A shorter holding period may also apply depending on your intermediary. Please see “Appendix A—Sales Charge Reductions and Waivers for Certain Intermediaries” in the Fund’s prospectus or at the end of this report.
For further information about your Fund, contact your investment professional, visit our website at wellsfargofunds.com, or call us directly at 1-800-222-8222.
| | | | |
| 6 | | Wells Fargo Disciplined U.S. Core Fund | | Performance highlights (unaudited) |
Investment objective
The Fund seeks long-term capital appreciation.
Manager
Wells Fargo Funds Management, LLC
Subadviser‡
Wells Capital Management Incorporated
Portfolio managers
Justin Carr, CFA®
Greg W. Golden, CFA®
Average annual total returns (%) as of July 31, 20181
| | | | | | | | | | | | | | | | | | | | | | | | | | | | | | | | | | |
| | | | | Including sales charge | | | Excluding sales charge | | | Expense ratios2 (%) | |
| | | Inception date | | 1 year | | | 5 year | | | 10 year | | | 1 year | | | 5 year | | | 10 year | | | Gross | | | Net3 | |
| Class A (EVSAX) | | 2-28-1990 | | | 6.79 | | | | 11.13 | | | | 9.50 | | | | 13.28 | | | | 12.45 | | | | 10.15 | | | | 0.85 | | | | 0.85 | |
| Class C (EVSTX) | | 6-30-1999 | | | 11.41 | | | | 11.60 | | | | 9.32 | | | | 12.41 | | | | 11.60 | | | | 9.32 | | | | 1.60 | | | | 1.60 | |
| Class R (EVSHX) | | 9-30-2015 | | | – | | | | – | | | | – | | | | 12.97 | | | | 12.16 | | | | 9.86 | | | | 1.10 | | | | 1.10 | |
| Class R6 (EVSRX) | | 9-30-2015 | | | – | | | | – | | | | – | | | | 13.78 | | | | 12.94 | | | | 10.59 | | | | 0.42 | | | | 0.42 | |
| Administrator Class (EVSYX) | | 2-21-1995 | | | – | | | | – | | | | – | | | | 13.40 | | | | 12.59 | | | | 10.33 | | | | 0.77 | | | | 0.74 | |
| Institutional Class (EVSIX) | | 7-30-2010 | | | – | | | | – | | | | – | | | | 13.65 | | | | 12.89 | | | | 10.56 | | | | 0.52 | | | | 0.48 | |
| S&P 500 Index4 | | – | | | – | | | | – | | | | – | | | | 16.24 | | | | 13.12 | | | | 10.67 | | | | – | | | | – | |
Figures quoted represent past performance, which is no guarantee of future results, and do not reflect taxes that a shareholder may pay on fund distributions or the redemption of fund shares. Investment return and principal value of an investment will fluctuate so that an investor’s shares, when redeemed, may be worth more or less than their original cost. Performance shown without sales charges would be lower if sales charges were reflected. Current performance may be lower or higher than the performance data quoted, which assumes the reinvestment of dividends and capital gains. Current month-end performance is available on the Fund’s website, wellsfargofunds.com.
Index returns do not include transaction costs associated with buying and selling securities, any mutual fund fees or expenses, or any taxes. It is not possible to invest directly in an index.
For Class A shares, the maximum front-end sales charge is 5.75%. For Class C shares, the maximum contingent deferred sales charge is 1.00%. Performance including a contingent deferred sales charge assumes the sales charge for the corresponding time period. Class R, Class R6, Administrator Class, and Institutional Class shares are sold without a front-end sales charge or contingent deferred sales charge.
Stock values fluctuate in response to the activities of individual companies and general market and economic conditions. The use of derivatives may reduce returns and/or increase volatility. Consult the Fund’s prospectus for additional information on these and other risks.
Please see footnotes on page 7.
| | | | | | |
| Performance highlights (unaudited) | | Wells Fargo Disciplined U.S. Core Fund | | | 7 | |
|
| Growth of $10,000 investment as of July 31, 20185 |
|
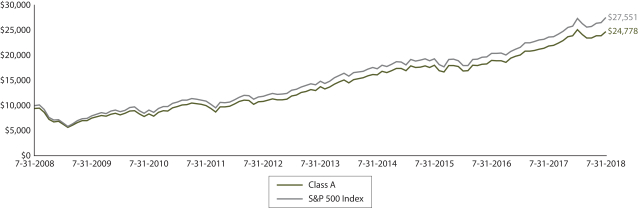 |
| ‡ | Wells Capital Management Incorporated became the subadviser of the Fund on January 1, 2018. |
| 1 | Historical performance shown for Class R shares prior to their inception reflects the performance of Administrator Class shares, adjusted to reflect higher expenses applicable to Class R shares. Historical performance shown for Class R6 shares prior to their inception reflects the performance of Institutional Class shares, and includes the higher expenses applicable to Institutional Class shares. If these expenses had not been included, returns for Class R6 shares would be higher. Historical performance shown for Institutional Class shares prior to their inception reflects the performance of Administrator Class shares, and includes the higher expenses applicable to Administrator Class shares. If these expenses had not been included, returns for Institutional Class shares would be higher. Historical performance shown for all classes of the Fund prior to July 19, 2010, is based on the performance of the Fund’s predecessor, Evergreen Enhanced S&P 500 Fund. |
| 2 | Reflects the expense ratios as stated in the most recent prospectuses. The expense ratios shown are subject to change and may differ from the annualized expense ratios shown in the financial highlights of this report. |
| 3 | The manager has contractually committed through November 30, 2018, to waive fees and/or reimburse expenses to the extent necessary to cap the Fund’s Total Annual Fund Operating Expenses After Fee Waivers at 0.87% for Class A, 1.62% for Class C, 1.12% for Class R, 0.43% for Class R6, 0.74% for Administrator Class, and 0.48% for Institutional Class. After this time, the cap may be increased or the commitment to maintain the cap may be terminated only with the approval of the Board of Trustees. Brokerage commissions, stamp duty fees, interest, taxes, acquired fund fees and expenses (if any), and extraordinary expenses are excluded from the expense cap. Without this cap, the Fund’s returns would have been lower. The expense ratio paid by an investor is the net expense ratio (the total annual fund operating expenses after fee waivers) as stated in the prospectuses. |
| 4 | The S&P 500 Index consists of 500 stocks chosen for market size, liquidity, and industry group representation. It is a market-value weighted index with each stock’s weight in the index proportionate to its market value. You cannot invest directly in an index. |
| 5 | The chart compares the performance of Class A shares for the most recent ten years with the S&P 500 Index. The chart assumes a hypothetical investment of $10,000 in Class A shares and reflects all operating expenses and assumes the maximum initial sales charge of 5.75%. |
| 6 | The ten largest holdings, excluding cash, cash equivalents and any money market funds, are calculated based on the value of the investments divided by total net assets of the Fund. Holdings are subject to change and may have changed since the date specified. |
| 7 | Amounts are calculated based on the total long-term investments of the Fund. These amounts are subject to change and may have changed since the date specified. |
| * | This security was no longer held at the end of the reporting period. |
| | | | |
| 8 | | Wells Fargo Disciplined U.S. Core Fund | | Performance highlights (unaudited) |
MANAGER’S DISCUSSION
Fund highlights
| ∎ | | The Fund underperformed its benchmark, the S&P 500 Index, for the 12-month period that ended July 31, 2018. |
| ∎ | | Stock selection was the main performance detractor, adding value in only 2 out of 11 sectors. Favorable stock selection came from the materials and health care sectors. Notable weakness in stock selection was found within consumer discretionary, industrials, financials, telecommunication services, and utilities. |
| ∎ | | Sector weighting decisions were modestly positive. Contributions to total return came from being underweight within the consumer staples and utilities sectors. Performance detractors included being underweight within consumer discretionary and having overweight exposures to health care and materials sectors. Variation in sector weights were relatively small, as is typical for the strategy. |
The combination of a moderate growth economy and potential benefits of tax reform boosted investor sentiment and broad market averages over the trailing 12-month period. Both manufacturing and retail sales were generally positive and continued job growth offset concerns from the U.S. Federal Reserve’s (Fed’s) stated goal of normalizing interest rates.
| | | | |
| Ten largest holdings (%) as of July 31, 20186 | |
Apple Incorporated | | | 4.16% | |
Microsoft Corporation | | | 4.02% | |
Amazon.com Incorporated | | | 3.11% | |
Facebook Incorporated Class A | | | 2.04% | |
Johnson & Johnson | | | 2.02% | |
Alphabet Incorporated Class C | | | 1.99% | |
Exxon Mobil Corporation | | | 1.95% | |
Alphabet Incorporated Class A | | | 1.92% | |
JPMorgan Chase & Company | | | 1.88% | |
Berkshire Hathaway Incorporated Class B | | | 1.83% | |
Stock selection detracted from performance while sector allocation decisions helped.
Stock selection was the main detractor from performance during the period. The most notable weakness came from the consumer discretionary sector, specifically due to our overweight position in Nutrisystem, Incorporated*, and lack of exposure to Netflix, Incorporated. A slight underweight earlier in the year to Amazon.com, Incorporated, also negatively affected relative performance. Within industrials, performance headwinds came from the timing of the purchase of machinery maker Caterpillar, Incorporated, which was added to the portfolio later in the reporting period. The portfolio did benefit from being underweight industrial conglomerate General Electric Company*, which declined nearly 45% over the trailing 12-month period.
|
| Sector distribution as of July 31, 20187 |
|
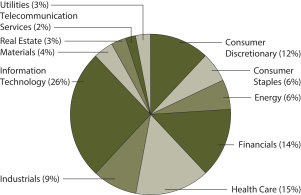 |
Other contributors to stock selection included holdings within the chemicals subsector, such as LyondellBasell Industries N.V.; an overweight position in The Boeing Company within the aerospace industry; and an overweight position in semiconductor manufacturer Micron Technology, Incorporated.
In terms of sector-weighting decisions, top contributions to total return came from being underweight within the consumer staples and utilities sectors. Performance detractors included being underweight within consumer discretionary and having overweight exposures to health care and materials.
Our market outlook is favorable.
As we have noted in previous quarters, we believe the trends of modest economic growth, strong corporate profit growth, and favorable fiscal policy are likely to continue. Leading economic indicators point to moderate economic growth over the medium term supporting further sales and earnings growth.
Please see footnotes on page 7.
| | | | | | |
| Performance highlights (unaudited) | | Wells Fargo Disciplined U.S. Core Fund | | | 9 | |
On balance, risk levels are slightly elevated relative to the beginning of the year. We believe that stock valuations are supported by current fundamentals. With the significant earnings growth reported so far in 2018, valuation multiples have contracted. While the risk of a significant uptick in inflation seems to have lessened, geopolitical risks and the prospects for tighter monetary policy have increased. However, we expect a damaging trade war will be averted, Fed policy will be well communicated and data dependent, and the pace of monetary policy normalization will be gradual.
We continue to expect a heightened level of volatility throughout 2018 as the markets price in changing expectations for trade and monetary policies. We will focus on company fundamentals while being mindful of the evolving macroeconomic environment and its impact on the expectations for corporate earnings as well as investors’ risk appetites.
We strive to add value relative to the benchmark.
Within the Fund, we strive to add value relative to the benchmark through a full market cycle, independent of overall market direction or movements by style (growth or value) or size (large or small). Our investment process will continue to focus on building a stock portfolio that emphasizes attractive valuations, earnings growth, earnings and sales momentum, earnings quality, and trading momentum. Based on our research and experience, we believe the Fund may provide shareholders with meaningful capital appreciation over time.
| | | | |
| 10 | | Wells Fargo Disciplined U.S. Core Fund | | Fund expenses (unaudited) |
As a shareholder of the Fund, you incur two types of costs: (1) transaction costs, including sales charges (loads) on purchase payments and contingent deferred sales charges (if any) on redemptions and (2) ongoing costs, including management fees, distribution (12b-1) and/or shareholder servicing fees, and other Fund expenses. This example is intended to help you understand your ongoing costs (in dollars) of investing in the Fund and to compare these costs with the ongoing costs of investing in other mutual funds.
The example is based on an investment of $1,000 invested at the beginning of the six-month period and held for the entire period from February 1, 2018 to July 31, 2018.
Actual expenses
The “Actual” line of the table below provides information about actual account values and actual expenses. You may use the information in this line, together with the amount you invested, to estimate the expenses that you paid over the period. Simply divide your account value by $1,000 (for example, an $8,600 account value divided by $1,000 = 8.6), then multiply the result by the number in the “Actual” line under the heading entitled “Expenses paid during period” for your applicable class of shares to estimate the expenses you paid on your account during this period.
Hypothetical example for comparison purposes
The “Hypothetical” line of the table below provides information about hypothetical account values and hypothetical expenses based on the Fund’s actual expense ratio and an assumed rate of return of 5% per year before expenses, which is not the Fund’s actual return. The hypothetical account values and expenses may not be used to estimate the actual ending account balance or expenses you paid for the period. You may use this information to compare the ongoing costs of investing in the Fund and other funds. To do so, compare this 5% hypothetical example with the 5% hypothetical examples that appear in the shareholder reports of the other funds.
Please note that the expenses shown in the table are meant to highlight your ongoing costs only and do not reflect any transactional costs, such as sales charges (loads) and contingent deferred sales charges. Therefore, the “Hypothetical” line of the table is useful in comparing ongoing costs only and will not help you determine the relative total costs of owning different funds. In addition, if these transactional costs were included, your costs would have been higher.
| | | | | | | | | | | | | | | | |
| | | Beginning
account value
2-1-2018 | | | Ending
account value
7-31-2018 | | | Expenses
paid during
the period¹ | | | Annualized net
expense ratio | |
Class A | | | | | | | | | | | | | | | | |
Actual | | $ | 1,000.00 | | | $ | 985.52 | | | $ | 4.16 | | | | 0.83 | % |
Hypothetical (5% return before expenses) | | $ | 1,000.00 | | | $ | 1,021.01 | | | $ | 4.24 | | | | 0.83 | % |
Class C | | | | | | | | | | | | | | | | |
Actual | | $ | 1,000.00 | | | $ | 981.31 | | | $ | 7.90 | | | | 1.58 | % |
Hypothetical (5% return before expenses) | | $ | 1,000.00 | | | $ | 1,017.23 | | | $ | 8.04 | | | | 1.58 | % |
Class R | | | | | | | | | | | | | | | | |
Actual | | $ | 1,000.00 | | | $ | 984.04 | | | $ | 5.41 | | | | 1.08 | % |
Hypothetical (5% return before expenses) | | $ | 1,000.00 | | | $ | 1,019.75 | | | $ | 5.51 | | | | 1.08 | % |
Class R6 | | | | | | | | | | | | | | | | |
Actual | | $ | 1,000.00 | | | $ | 987.50 | | | $ | 2.01 | | | | 0.40 | % |
Hypothetical (5% return before expenses) | | $ | 1,000.00 | | | $ | 1,023.18 | | | $ | 2.05 | | | | 0.40 | % |
Administrator Class | | | | | | | | | | | | | | | | |
Actual | | $ | 1,000.00 | | | $ | 985.89 | | | $ | 3.70 | | | | 0.74 | % |
Hypothetical (5% return before expenses) | | $ | 1,000.00 | | | $ | 1,021.48 | | | $ | 3.77 | | | | 0.74 | % |
Institutional Class | | | | | | | | | | | | | | | | |
Actual | | $ | 1,000.00 | | | $ | 987.37 | | | $ | 2.40 | | | | 0.48 | % |
Hypothetical (5% return before expenses) | | $ | 1,000.00 | | | $ | 1,022.79 | | | $ | 2.45 | | | | 0.48 | % |
| 1 | Expenses paid is equal to the annualized net expense ratio of each class multiplied by the average account value over the period, multiplied by the number of days in the most recent fiscal half-year divided by the number of days in the fiscal year (to reflect the one-half-year period). |
| | | | | | |
| Portfolio of investments—July 31, 2018 | | Wells Fargo Disciplined U.S. Core Fund | | | 11 | |
| | | | | | | | | | | | | | | | |
| Security name | | | | | | | | Shares | | | Value | |
| | | | |
Common Stocks: 99.48% | | | | | | | | | | | | | | | | |
| | | | |
Consumer Discretionary: 12.24% | | | | | | | | | | | | | | | | |
| | | | |
| Automobiles: 0.69% | | | | | | | | | | | | | | | | |
Ford Motor Company | | | | | | | | | | | 1,027,981 | | | $ | 10,320,929 | |
| | | | | | | | | | | | | | | | |
| | | | |
| Hotels, Restaurants & Leisure: 0.97% | | | | | | | | | | | | | | | | |
Carnival Corporation | | | | | | | | | | | 128,187 | | | | 7,593,798 | |
Las Vegas Sands Corporation | | | | | | | | | | | 96,208 | | | | 6,917,355 | |
| | | | |
| | | | | | | | | | | | | | | 14,511,153 | |
| | | | | | | | | | | | | | | | |
| | | | |
| Household Durables: 0.59% | | | | | | | | | | | | | | | | |
Garmin Limited | | | | | | | | | | | 59,037 | | | | 3,686,861 | |
NVR Incorporated † | | | | | | | | | | | 1,164 | | | | 3,211,977 | |
Pulte Group Incorporated | | | | | | | | | | | 65,134 | | | | 1,855,668 | |
| | | | |
| | | | | | | | | | | | | | | 8,754,506 | |
| | | | | | | | | | | | | | | | |
| | | | |
| Internet & Direct Marketing Retail: 3.11% | | | | | | | | | | | | | | | | |
Amazon.com Incorporated † | | | | | | | | | | | 26,017 | | | | 46,243,656 | |
| | | | | | | | | | | | | | | | |
| | | | |
| Media: 2.81% | | | | | | | | | | | | | | | | |
Comcast Corporation Class A | | | | | | | | | | | 139,209 | | | | 4,980,898 | |
John Wiley & Sons Incorporated Class A | | | | | | | | | | | 112,425 | | | | 7,099,639 | |
News Corporation Class A | | | | | | | | | | | 267,929 | | | | 4,037,690 | |
The Walt Disney Company | | | | | | | | | | | 144,096 | | | | 16,363,542 | |
Twenty-First Century Fox Incorporated Class A | | | | | | | | | | | 162,345 | | | | 7,305,525 | |
Viacom Incorporated Class B | | | | | | | | | | | 71,642 | | | | 2,081,200 | |
| | | | |
| | | | | | | | | | | | | | | 41,868,494 | |
| | | | | | | | | | | | | | | | |
| | | | |
| Multiline Retail: 1.25% | | | | | | | | | | | | | | | | |
Kohl’s Corporation | | | | | | | | | | | 67,183 | | | | 4,962,808 | |
Macy’s Incorporated | | | | | | | | | | | 219,362 | | | | 8,715,252 | |
Target Corporation | | | | | | | | | | | 61,252 | | | | 4,941,811 | |
| | | | |
| | | | | | | | | | | | | | | 18,619,871 | |
| | | | | | | | | | | | | | | | |
| | | | |
| Specialty Retail: 2.82% | | | | | | | | | | | | | | | | |
Best Buy Company Incorporated | | | | | | | | | | | 123,809 | | | | 9,289,389 | |
Lowe’s Companies Incorporated | | | | | | | | | | | 37,682 | | | | 3,743,330 | |
Ross Stores Incorporated | | | | | | | | | | | 54,699 | | | | 4,782,334 | |
The Home Depot Incorporated | | | | | | | | | | | 98,936 | | | | 19,541,839 | |
The TJX Companies Incorporated | | | | | | | | | | | 46,840 | | | | 4,555,658 | |
| | | | |
| | | | | | | | | | | | | | | 41,912,550 | |
| | | | | | | | | | | | | | | | |
| | | | |
Consumer Staples: 6.06% | | | | | | | | | | | | | | | | |
| | | | |
| Beverages: 0.48% | | | | | | | | | | | | | | | | |
Molson Coors Brewing Company Class B | | | | | | | | | | | 105,855 | | | | 7,092,285 | |
| | | | | | | | | | | | | | | | |
| | | | |
| Food & Staples Retailing: 2.79% | | | | | | | | | | | | | | | | |
Costco Wholesale Corporation | | | | | | | | | | | 20,679 | | | | 4,522,704 | |
The Kroger Company | | | | | | | | | | | 318,632 | | | | 9,240,328 | |
The accompanying notes are an integral part of these financial statements.
| | | | |
| 12 | | Wells Fargo Disciplined U.S. Core Fund | | Portfolio of investments—July 31, 2018 |
| | | | | | | | | | | | | | | | |
| Security name | | | | | | | | Shares | | | Value | |
| | | | |
| Food & Staples Retailing (continued) | | | | | | | | | | | | | | | | |
Wal-Mart Stores Incorporated | | | | | | | | | | | 176,591 | | | $ | 15,757,215 | |
Walgreens Boots Alliance Incorporated | | | | | | | | | | | 177,778 | | | | 12,021,348 | |
| | | | |
| | | | | | | | | | | | | | | 41,541,595 | |
| | | | | | | | | | | | | | | | |
| | | | |
| Food Products: 1.65% | | | | | | | | | | | | | | | | |
Cal-Maine Foods Incorporated † | | | | | | | | | | | 157,086 | | | | 7,068,870 | |
General Mills Incorporated | | | | | | | | | | | 97,340 | | | | 4,483,480 | |
Sanderson Farms Incorporated | | | | | | | | | | | 56,402 | | | | 5,687,014 | |
Tyson Foods Incorporated Class A | | | | | | | | | | | 125,893 | | | | 7,257,731 | |
| | | | |
| | | | | | | | | | | | | | | 24,497,095 | |
| | | | | | | | | | | | | | | | |
| | | | |
| Household Products: 1.14% | | | | | | | | | | | | | | | | |
Kimberly-Clark Corporation | | | | | | | | | | | 97,089 | | | | 11,054,554 | |
The Procter & Gamble Company | | | | | | | | | | | 73,814 | | | | 5,970,076 | |
| | | | |
| | | | | | | | | | | | | | | 17,024,630 | |
| | | | | | | | | | | | | | | | |
| | | | |
Energy: 5.88% | | | | | | | | | | | | | | | | |
| | | | |
| Oil, Gas & Consumable Fuels: 5.88% | | | | | | | | | | | | | | | | |
Chevron Corporation | | | | | | | | | | | 187,271 | | | | 23,646,709 | |
Exxon Mobil Corporation | | | | | | | | | | | 355,200 | | | | 28,952,352 | |
HollyFrontier Corporation | | | | | | | | | | | 52,625 | | | | 3,924,773 | |
Kinder Morgan Incorporated | | | | | | | | | | | 585,489 | | | | 10,409,994 | |
ONEOK Incorporated | | | | | | | | | | | 134,085 | | | | 9,444,947 | |
Valero Energy Corporation | | | | | | | | | | | 93,580 | | | | 11,075,193 | |
| | | | |
| | | | | | | | | | | | | | | 87,453,968 | |
| | | | | | | | | | | | | | | | |
| | | | |
Financials: 13.47% | | | | | | | | | | | | | | | | |
| | | | |
| Banks: 6.03% | | | | | | | | | | | | | | | | |
Bank of America Corporation | | | | | | | | | | | 689,835 | | | | 21,302,105 | |
Citigroup Incorporated | | | | | | | | | | | 273,373 | | | | 19,652,785 | |
Citizens Financial Group Incorporated | | | | | | | | | | | 96,279 | | | | 3,829,979 | |
Fifth Third Bancorp | | | | | | | | | | | 100,382 | | | | 2,970,303 | |
JPMorgan Chase & Company | | | | | | | | | | | 243,305 | | | | 27,967,910 | |
People’s United Financial Incorporated | | | | | | | | | | | 189,827 | | | | 3,460,546 | |
Popular Incorporated | | | | | | | | | | | 115,752 | | | | 5,744,772 | |
Regions Financial Corporation | | | | | | | | | | | 259,649 | | | | 4,832,068 | |
| | | | |
| | | | | | | | | | | | | | | 89,760,468 | |
| | | | | | | | | | | | | | | | |
| | | | |
| Capital Markets: 1.80% | | | | | | | | | | | | | | | | |
Bank of New York Mellon Corporation | | | | | | | | | | | 130,574 | | | | 6,981,792 | |
Eaton Vance Corporation | | | | | | | | | | | 112,445 | | | | 5,974,203 | |
Evercore Partners Incorporated Class A | | | | | | | | | | | 81,962 | | | | 9,261,706 | |
Waddell & Reed Financial Incorporated Class A | | | | | | | | | | | 223,080 | | | | 4,619,987 | |
| | | | |
| | | | | | | | | | | | | | | 26,837,688 | |
| | | | | | | | | | | | | | | | |
| | | | |
| Consumer Finance: 0.35% | | | | | | | | | | | | | | | | |
Synchrony Financial | | | | | | | | | | | 181,025 | | | | 5,238,864 | |
| | | | | | | | | | | | | | | | |
The accompanying notes are an integral part of these financial statements.
| | | | | | |
| Portfolio of investments—July 31, 2018 | | Wells Fargo Disciplined U.S. Core Fund | | | 13 | |
| | | | | | | | | | | | | | | | |
| Security name | | | | | | | | Shares | | | Value | |
| | | | |
| Diversified Financial Services: 1.83% | | | | | | | | | | | | | | | | |
Berkshire Hathaway Incorporated Class B † | | | | | | | | | | | 137,372 | | | $ | 27,181,798 | |
| | | | | | | | | | | | | | | | |
| | | | |
| Insurance: 3.18% | | | | | | | | | | | | | | | | |
AFLAC Incorporated | | | | | | | | | | | 227,690 | | | | 10,596,693 | |
MetLife Incorporated | | | | | | | | | | | 233,206 | | | | 10,666,842 | |
Principal Financial Group Incorporated | | | | | | | | | | | 84,589 | | | | 4,912,929 | |
Prudential Financial Incorporated | | | | | | | | | | | 100,130 | | | | 10,104,118 | |
The Progressive Corporation | | | | | | | | | | | 182,647 | | | | 10,960,646 | |
| | | | |
| | | | | | | | | | | | | | | 47,241,228 | |
| | | | | | | | | | | | | | | | |
| | | | |
| Thrifts & Mortgage Finance: 0.28% | | | | | | | | | | | | | | | | |
MGIC Investment Corporation † | | | | | | | | | | | 335,932 | | | | 4,192,431 | |
| | | | | | | | | | | | | | | | |
| | | | |
Health Care: 15.14% | | | | | | | | | | | | | | | | |
| | | | |
| Biotechnology: 2.69% | | | | | | | | | | | | | | | | |
AbbVie Incorporated | | | | | | | | | | | 177,085 | | | | 16,332,550 | |
Amgen Incorporated | | | | | | | | | | | 74,192 | | | | 14,582,438 | |
Gilead Sciences Incorporated | | | | | | | | | | | 117,939 | | | | 9,179,192 | |
| | | | |
| | | | | | | | | | | | | | | 40,094,180 | |
| | | | | | | | | | | | | | | | |
| | | | |
| Health Care Equipment & Supplies: 2.68% | | | | | | | | | | | | | | | | |
Abbott Laboratories | | | | | | | | | | | 248,664 | | | | 16,297,439 | |
Baxter International Incorporated | | | | | | | | | | | 134,501 | | | | 9,744,597 | |
ICU Medical Incorporated † | | | | | | | | | | | 11,282 | | | | 3,235,678 | |
Medtronic plc | | | | | | | | | | | 117,782 | | | | 10,627,470 | |
| | | | |
| | | | | | | | | | | | | | | 39,905,184 | |
| | | | | | | | | | | | | | | | |
| | | | |
| Health Care Providers & Services: 3.79% | | | | | | | | | | | | | | | | |
Anthem Incorporated | | | | | | | | | | | 47,203 | | | | 11,942,359 | |
CVS Health Corporation | | | | | | | | | | | 176,842 | | | | 11,469,972 | |
Magellan Health Services Incorporated † | | | | | | | | | | | 31,558 | | | | 2,295,845 | |
McKesson Corporation | | | | | | | | | | | 54,180 | | | | 6,805,008 | |
UnitedHealth Group Incorporated | | | | | | | | | | | 94,529 | | | | 23,936,633 | |
| | | | |
| | | | | | | | | | | | | | | 56,449,817 | |
| | | | | | | | | | | | | | | | |
| | | | |
| Life Sciences Tools & Services: 0.40% | | | | | | | | | | | | | | | | |
Thermo Fisher Scientific Incorporated | | | | | | | | | | | 25,035 | | | | 5,871,459 | |
| | | | | | | | | | | | | | | | |
| | | | |
| Pharmaceuticals: 5.58% | | | | | | | | | | | | | | | | |
Bristol-Myers Squibb Company | | | | | | | | | | | 151,955 | | | | 8,927,356 | |
Eli Lilly & Company | | | | | | | | | | | 52,332 | | | | 5,170,925 | |
Johnson & Johnson | | | | | | | | | | | 226,743 | | | | 30,047,982 | |
Merck & Company Incorporated | | | | | | | | | | | 270,533 | | | | 17,820,009 | |
Pfizer Incorporated | | | | | | | | | | | 528,068 | | | | 21,085,755 | |
| | | | |
| | | | | | | | | | | | | | | 83,052,027 | |
| | | | | | | | | | | | | | | | |
The accompanying notes are an integral part of these financial statements.
| | | | |
| 14 | | Wells Fargo Disciplined U.S. Core Fund | | Portfolio of investments—July 31, 2018 |
| | | | | | | | | | | | | | | | |
| Security name | | | | | | | | Shares | | | Value | |
| | | | |
Industrials: 9.11% | | | | | | | | | | | | | | | | |
| | | | |
| Aerospace & Defense: 1.46% | | | | | | | | | | | | | | | | |
Huntington Ingalls Industries Incorporated | | | | | | | | | | | 5,267 | | | $ | 1,227,474 | |
Northrop Grumman Corporation | | | | | | | | | | | 12,196 | | | | 3,664,776 | |
Raytheon Company | | | | | | | | | | | 18,054 | | | | 3,575,234 | |
The Boeing Company | | | | | | | | | | | 25,760 | | | | 9,178,288 | |
United Technologies Corporation | | | | | | | | | | | 30,352 | | | | 4,119,980 | |
| | | | |
| | | | | | | | | | | | | | | 21,765,752 | |
| | | | | | | | | | | | | | | | |
| | | | |
| Air Freight & Logistics: 0.88% | | | | | | | | | | | | | | | | |
FedEx Corporation | | | | | | | | | | | 53,290 | | | | 13,102,412 | |
| | | | | | | | | | | | | | | | |
| | | | |
| Airlines: 1.59% | | | | | | | | | | | | | | | | |
Copa Holdings SA Class A | | | | | | | | | | | 33,493 | | | | 3,260,209 | |
Delta Air Lines Incorporated | | | | | | | | | | | 180,457 | | | | 9,820,470 | |
Hawaiian Holdings Incorporated | | | | | | | | | | | 177,079 | | | | 7,100,868 | |
United Continental Holdings Incorporated † | | | | | | | | | | | 42,689 | | | | 3,432,196 | |
| | | | |
| | | | | | | | | | | | | | | 23,613,743 | |
| | | | | | | | | | | | | | | | |
| | | | |
| Commercial Services & Supplies: 0.97% | | | | | | | | | | | | | | | | |
Herman Miller Incorporated | | | | | | | | | | | 118,977 | | | | 4,503,279 | |
Waste Management Incorporated | | | | | | | | | | | 109,798 | | | | 9,881,820 | |
| | | | |
| | | | | | | | | | | | | | | 14,385,099 | |
| | | | | | | | | | | | | | | | |
| | | | |
| Construction & Engineering: 0.66% | | | | | | | | | | | | | | | | |
MasTec Incorporated † | | | | | | | | | | | 136,162 | | | | 6,338,341 | |
Quanta Services Incorporated † | | | | | | | | | | | 103,507 | | | | 3,526,483 | |
| | | | |
| | | | | | | | | | | | | | | 9,864,824 | |
| | | | | | | | | | | | | | | | |
| | | | |
| Electrical Equipment: 0.82% | | | | | | | | | | | | | | | | |
AMETEK Incorporated | | | | | | | | | | | 53,898 | | | | 4,193,264 | |
Emerson Electric Company | | | | | | | | | | | 110,683 | | | | 8,000,167 | |
| | | | |
| | | | | | | | | | | | | | | 12,193,431 | |
| | | | | | | | | | | | | | | | |
| | | | |
| Industrial Conglomerates: 0.65% | | | | | | | | | | | | | | | | |
Honeywell International Incorporated | | | | | | | | | | | 60,998 | | | | 9,738,331 | |
| | | | | | | | | | | | | | | | |
| | | | |
| Machinery: 1.56% | | | | | | | | | | | | | | | | |
Caterpillar Incorporated | | | | | | | | | | | 66,890 | | | | 9,618,782 | |
Cummins Incorporated | | | | | | | | | | | 41,862 | | | | 5,978,312 | |
Illinois Tool Works Incorporated | | | | | | | | | | | 21,662 | | | | 3,104,814 | |
Paccar Incorporated | | | | | | | | | | | 67,467 | | | | 4,433,931 | |
| | | | |
| | | | | | | | | | | | | | | 23,135,839 | |
| | | | | | | | | | | | | | | | |
| | | | |
| Professional Services: 0.52% | | | | | | | | | | | | | | | | |
Manpower Incorporated | | | | | | | | | | | 82,684 | | | | 7,711,110 | |
| | | | | | | | | | | | | | | | |
| | | | |
Information Technology: 25.63% | | | | | | | | | | | | | | | | |
| | | | |
| Communications Equipment: 1.33% | | | | | | | | | | | | | | | | |
Cisco Systems Incorporated | | | | | | | | | | | 468,665 | | | | 19,819,843 | |
| | | | | | | | | | | | | | | | |
The accompanying notes are an integral part of these financial statements.
| | | | | | |
| Portfolio of investments—July 31, 2018 | | Wells Fargo Disciplined U.S. Core Fund | | | 15 | |
| | | | | | | | | | | | | | | | |
| Security name | | | | | | | | Shares | | | Value | |
| | | | |
| Internet Software & Services: 5.94% | | | | | | | | | | | | | | | | |
Alphabet Incorporated Class A † | | | | | | | | | | | 23,250 | | | $ | 28,532,865 | |
Alphabet Incorporated Class C † | | | | | | | | | | | 24,320 | | | | 29,603,763 | |
Facebook Incorporated Class A † | | | | | | | | | | | 175,888 | | | | 30,354,751 | |
| | | | |
| | | | | | | | | | | | | | | 88,491,379 | |
| | | | | | | | | | | | | | | | |
| | | | |
| IT Services: 3.33% | | | | | | | | | | | | | | | | |
Accenture plc Class A | | | | | | | | | | | 87,174 | | | | 13,889,433 | |
CACI International Incorporated Class A † | | | | | | | | | | | 17,093 | | | | 2,994,694 | |
International Business Machines Corporation | | | | | | | | | | | 101,050 | | | | 14,645,177 | |
Total System Services Incorporated | | | | | | | | | | | 97,666 | | | | 8,940,346 | |
Visa Incorporated Class A | | | | | | | | | | | 66,149 | | | | 9,045,214 | |
| | | | |
| | | | | | | | | | | | | | | 49,514,864 | |
| | | | | | | | | | | | | | | | |
| | | | |
| Semiconductors & Semiconductor Equipment: 4.20% | | | | | | | | | | | | | | | | |
Applied Materials Incorporated | | | | | | | | | | | 127,862 | | | | 6,217,929 | |
Cypress Semiconductor Corporation | | | | | | | | | | | 416,055 | | | | 7,409,940 | |
Intel Corporation | | | | | | | | | | | 446,255 | | | | 21,464,866 | |
Lam Research Corporation | | | | | | | | | | | 17,476 | | | | 3,331,625 | |
Micron Technology Incorporated † | | | | | | | | | | | 231,476 | | | | 12,219,618 | |
NVIDIA Corporation | | | | | | | | | | | 20,674 | | | | 5,062,236 | |
Texas Instruments Incorporated | | | | | | | | | | | 61,408 | | | | 6,835,939 | |
| | | | |
| | | | | | | | | | | | | | | 62,542,153 | |
| | | | | | | | | | | | | | | | |
| | | | |
| Software: 5.44% | | | | | | | | | | | | | | | | |
Activision Blizzard Incorporated | | | | | | | | | | | 62,711 | | | | 4,604,242 | |
Microsoft Corporation | | | | | | | | | | | 563,862 | | | | 59,814,481 | |
Oracle Corporation | | | | | | | | | | | 346,551 | | | | 16,523,552 | |
| | | | |
| | | | | | | | | | | | | | | 80,942,275 | |
| | | | | | | | | | | | | | | | |
| | | | |
| Technology Hardware, Storage & Peripherals: 5.39% | | | | | | | | | | | | | | | | |
Apple Incorporated | | | | | | | | | | | 325,276 | | | | 61,896,770 | |
HP Incorporated | | | | | | | | | | | 457,026 | | | | 10,548,160 | |
Western Digital Corporation | | | | | | | | | | | 110,460 | | | | 7,748,769 | |
| | | | |
| | | | | | | | | | | | | | | 80,193,699 | |
| | | | | | | | | | | | | | | | |
| | | | |
Materials: 3.55% | | | | | | | | | | | | | | | | |
| | | | |
| Chemicals: 1.30% | | | | | | | | | | | | | | | | |
Huntsman Corporation | | | | | | | | | | | 276,255 | | | | 9,262,830 | |
LyondellBasell Industries NV Class A | | | | | | | | | | | 91,791 | | | | 10,169,525 | |
| | | | |
| | | | | | | | | | | | | | | 19,432,355 | |
| | | | | | | | | | | | | | | | |
| | | | |
| Containers & Packaging: 0.54% | | | | | | | | | | | | | | | | |
Avery Dennison Corporation | | | | | | | | | | | 69,952 | | | | 8,022,095 | |
| | | | | | | | | | | | | | | | |
| | | | |
| Metals & Mining: 1.22% | | | | | | | | | | | | | | | | |
Freeport-McMoRan Incorporated | | | | | | | | | | | 550,818 | | | | 9,088,497 | |
Newmont Mining Corporation | | | | | | | | | | | 245,533 | | | | 9,006,150 | |
| | | | |
| | | | | | | | | | | | | | | 18,094,647 | |
| | | | | | | | | | | | | | | | |
The accompanying notes are an integral part of these financial statements.
| | | | |
| 16 | | Wells Fargo Disciplined U.S. Core Fund | | Portfolio of investments—July 31, 2018 |
| | | | | | | | | | | | | | | | |
| Security name | | | | | | | | Shares | | | Value | |
| | | | |
| Paper & Forest Products: 0.49% | | | | | | | | | | | | | | | | |
Louisiana-Pacific Corporation | | | | | | | | | | | 271,728 | | | $ | 7,314,918 | |
| | | | | | | | | | | | | | | | |
| | | | |
Real Estate: 3.42% | | | | | | | | | | | | | | | | |
| | | | |
| Equity REITs: 2.93% | | | | | | | | | | | | | | | | |
American Tower Corporation | | | | | | | | | | | 79,962 | | | | 11,853,567 | |
Crown Castle International Corporation | | | | | | | | | | | 26,720 | | | | 2,961,378 | |
Equinix Incorporated | | | | | | | | | | | 24,460 | | | | 10,744,789 | |
GGP Incorporated | | | | | | | | | | | 70,508 | | | | 1,503,231 | |
Kimco Realty Corporation | | | | | | | | | | | 254,593 | | | | 4,249,157 | |
Prologis Incorporated | | | | | | | | | | | 65,075 | | | | 4,270,222 | |
Weyerhaeuser Company | | | | | | | | | | | 235,862 | | | | 8,061,763 | |
| | | | |
| | | | | | | | | | | | | | | 43,644,107 | |
| | | | | | | | | | | | | | | | |
| | | | |
| Real Estate Management & Development: 0.49% | | | | | | | | | | | | | | | | |
CBRE Group Incorporated Class A † | | | | | | | | | | | 144,833 | | | | 7,212,683 | |
| | | | | | | | | | | | | | | | |
| | | | |
Telecommunication Services: 2.39% | | | | | | | | | | | | | | | | |
| | | | |
| Diversified Telecommunication Services: 2.39% | | | | | | | | | | | | | | | | |
AT&T Incorporated | | | | | | | | | | | 659,452 | | | | 21,082,680 | |
Verizon Communications Incorporated | | | | | | | | | | | 280,594 | | | | 14,489,874 | |
| | | | |
| | | | | | | | | | | | | | | 35,572,554 | |
| | | | | | | | | | | | | | | | |
| | | | |
Utilities: 2.59% | | | | | | | | | | | | | | | | |
| | | | |
| Electric Utilities: 0.92% | | | | | | | | | | | | | | | | |
Exelon Corporation | | | | | | | | | | | 243,461 | | | | 10,347,093 | |
Otter Tail Corporation | | | | | | | | | | | 69,909 | | | | 3,383,596 | |
| | | | |
| | | | | | | | | | | | | | | 13,730,689 | |
| | | | | | | | | | | | | | | | |
| | | | |
| Gas Utilities: 0.71% | | | | | | | | | | | | | | | | |
New Jersey Resources Corporation | | | | | | | | | | | 90,130 | | | | 4,168,513 | |
UGI Corporation | | | | | | | | | | | 118,957 | | | | 6,321,375 | |
| | | | |
| | | | | | | | | | | | | | | 10,489,888 | |
| | | | | | | | | | | | | | | | |
| | | | |
| Multi-Utilities: 0.96% | | | | | | | | | | | | | | | | |
CenterPoint Energy Incorporated | | | | | | | | | | | 317,102 | | | | 9,031,062 | |
DTE Energy Company | | | | | | | | | | | 48,664 | | | | 5,281,991 | |
| | | | |
| | | | | | | | | | | | | | | 14,313,053 | |
| | | | | | | | | | | | | | | | |
| | | | |
Total Common Stocks (Cost $1,151,698,459) | | | | | | | | | | | | | | | 1,480,507,619 | |
| | | | | | | | | | | | | | | | |
| | | | |
| | | Yield | | | | | | | | | | |
| Short-Term Investments: 0.60% | | | | | | | | | | | | | | | | |
| | | | |
| Investment Companies: 0.60% | | | | | | | | | | | | | | | | |
Wells Fargo Government Money Market Fund Select Class (l)(u) | | | 1.83 | % | | | | | | | 9,015,872 | | | | 9,015,872 | |
| | | | | | | | | | | | | | | | |
| | | | |
Total Short-Term Investments (Cost $9,015,872) | | | | | | | | | | | | | | | 9,015,872 | |
| | | | | | | | | | | | | | | | |
| | | | | | | | |
| Total investments in securities (Cost $1,160,714,331) | | | 100.08 | % | | | 1,489,523,491 | |
Other assets and liabilities, net | | | (0.08 | ) | | | (1,252,508 | ) |
| | | | | | | | |
| Total net assets | | | 100.00 | % | | $ | 1,488,270,983 | |
| | | | | | | | |
The accompanying notes are an integral part of these financial statements.
| | | | | | |
| Portfolio of investments—July 31, 2018 | | Wells Fargo Disciplined U.S. Core Fund | | | 17 | |
| † | Non-income-earning security |
| (l) | The issuer of the security is an affiliated person of the Fund as defined in the Investment Company Act of 1940. |
| (u) | The rate represents the 7-day annualized yield at period end. |
Abbreviations:
| REIT | Real estate investment trust |
Investments in Affiliates
An affiliated investment is an investment in which the Fund owns at least 5% of the outstanding voting shares of the issuer or as a result of other relationships, such as the Fund and the issuer having the same investment manager. Transactions with issuers that were either affiliated persons of the Fund at the beginning of the period or the end of the period were as follows:
| | | | | | | | | | | | | | | | | | | | | | | | | | | | | | | | | | | | |
| | | Shares,
beginning of
period | | | Shares
purchased | | | Shares
sold | | | Shares,
end of
period | | | Net
realized
gains
(losses) | | | Net
change in
unrealized
gains
(losses) | | | Income
from
affiliated
securities | | | Value,
end
of period | | | % of
net assets | |
Short-Term Investments | | | | | | | | | | | | | | | | | | | | | | | | | | | | | | | | | | | | |
Investment Companies | | | | | | | | | | | | | | | | | | | | | | | | | | | | | | | | | | | | |
Securities Lending Cash Investment LLC * | | | 13,021,998 | | | | 111,425,421 | | | | 124,447,419 | | | | 0 | | | $ | 0 | | | $ | (1,302 | ) | | $ | 34,919 | | | $ | 0 | | | | | |
Wells Fargo Government Money Market Fund Select Class | | | 5,020,581 | | | | 208,385,658 | | | | 204,390,367 | | | | 9,015,872 | | | | 0 | | | | 0 | | | | 125,563 | | | | 9,015,872 | | | | | |
| | | | | | | | | | | | | | | | | | | | | | | | | | | | | | | | | | | | |
| | | | | | | | | | | | | | | | | | $ | 0 | | | $ | (1,302 | ) | | $ | 160,482 | | | $ | 9,015,872 | | | | 0.60 | % |
| | | | | | | | | | | | | | | | | | | | | | | | | | | | | | | | | | | | |
| | * | No longer held at the end of the period |
The accompanying notes are an integral part of these financial statements.
| | | | |
| 18 | | Wells Fargo Disciplined U.S. Core Fund | | Statement of assets and liabilities—July 31, 2018 |
| | | | |
| | | | |
| |
Assets | | | | |
Investments in unaffiliated securities, at value (cost $1,151,698,459) | | $ | 1,480,507,619 | |
Investments in affiliated securities, at value (cost $9,015,872) | | | 9,015,872 | |
Receivable for Fund shares sold | | | 671,002 | |
Receivable for dividends | | | 1,686,531 | |
Prepaid expenses and other assets | | | 196,592 | |
| | | | |
Total assets | | | 1,492,077,616 | |
| | | | |
| |
Liabilities | | | | |
Payable for Fund shares redeemed | | | 3,060,099 | |
Management fee payable | | | 423,087 | |
Administration fees payable | | | 162,268 | |
Distribution fees payable | | | 32,241 | |
Trustees’ fees and expenses payable | | | 1,519 | |
Accrued expenses and other liabilities | | | 127,419 | |
| | | | |
Total liabilities | | | 3,806,633 | |
| | | | |
Total net assets | | $ | 1,488,270,983 | |
| | | | |
| |
NET ASSETS CONSIST OF | | | | |
Paid-in capital | | $ | 1,086,695,496 | |
Undistributed net investment income | | | 18,219,041 | |
Accumulated net realized gains on investments | | | 54,547,286 | |
Net unrealized gains on investments | | | 328,809,160 | |
| | | | |
Total net assets | | $ | 1,488,270,983 | |
| | | | |
| |
COMPUTATION OF NET ASSET VALUE AND OFFERING PRICE PER SHARE | | | | |
Net assets – Class A | | $ | 480,602,092 | |
Shares outstanding – Class A1 | | | 27,154,270 | |
Net asset value per share – Class A | | | $17.70 | |
Maximum offering price per share – Class A2 | | | $18.78 | |
Net assets – Class C | | $ | 52,646,871 | |
Shares outstanding – Class C1 | | | 3,232,901 | |
Net asset value per share – Class C | | | $16.28 | |
Net assets – Class R | | $ | 3,298,191 | |
Shares outstanding – Class R1 | | | 184,471 | |
Net asset value per share – Class R | | | $17.88 | |
Net assets – Class R6 | | $ | 445,678,066 | |
Shares outstanding – Class R61 | | | 24,530,664 | |
Net asset value per share – Class R6 | | | $18.17 | |
Net assets – Administrator Class | | $ | 94,057,606 | |
Shares outstanding – Administrator Class1 | | | 5,176,164 | |
Net asset value per share – Administrator Class | | | $18.17 | |
Net assets – Institutional Class | | $ | 411,988,157 | |
Shares outstanding – Institutional Class1 | | | 22,914,778 | |
Net asset value per share – Institutional Class | | | $17.98 | |
| 1 | The Fund has an unlimited number of authorized shares. |
| 2 | Maximum offering price is computed as 100/94.25 of net asset value. On investments of $50,000 or more, the offering price is reduced. |
The accompanying notes are an integral part of these financial statements.
| | | | | | |
| Statement of operations—year ended July 31, 2018 | | Wells Fargo Disciplined U.S. Core Fund | | | 19 | |
| | | | |
| | | | |
| |
Investment income | | | | |
Dividends (net of foreign withholding taxes of $6,851) | | $ | 26,480,851 | |
Income from affiliated securities | | | 160,482 | |
| | | | |
Total investment income | | | 26,641,333 | |
| | | | |
| |
Expenses | | | | |
Management fee | | | 4,274,359 | |
Administration fees | | | | |
Class A | | | 1,020,702 | |
Class C | | | 113,846 | |
Class R | | | 5,263 | |
Class R6 | | | 59,181 | |
Administrator Class | | | 124,646 | |
Institutional Class | | | 523,055 | |
Shareholder servicing fees | | | | |
Class A | | | 1,215,122 | |
Class C | | | 135,531 | |
Class R | | | 6,265 | |
Administrator Class | | | 239,492 | |
Distribution fees | | | | |
Class C | | | 406,593 | |
Class R | | | 6,265 | |
Custody and accounting fees | | | 39,188 | |
Professional fees | | | 53,403 | |
Registration fees | | | 137,881 | |
Shareholder report expenses | | | 73,390 | |
Trustees’ fees and expenses | | | 22,956 | |
Other fees and expenses | | | 26,894 | |
| | | | |
Total expenses | | | 8,484,032 | |
Less: Fee waivers and/or expense reimbursements | | | (109,988 | ) |
| | | | |
Net expenses | | | 8,374,044 | |
| | | | |
Net investment income | | | 18,267,289 | |
| | | | |
| |
REALIZED AND UNREALIZED GAINS (LOSSES) ON INVESTMENTS | | | | |
| |
Net realized gains on investments | | | 58,671,899 | |
| |
Net change in unrealized gains (losses) on: | | | | |
Unaffiliated securities | | | 83,410,869 | |
Affiliated securities | | | (1,302 | ) |
| | | | |
Net change in unrealized gains (losses) on investments | | | 83,409,567 | |
| | | | |
Net realized and unrealized gains (losses) on investments | | | 142,081,466 | |
| | | | |
Net increase in net assets resulting from operations | | $ | 160,348,755 | |
| | | | |
The accompanying notes are an integral part of these financial statements.
| | | | |
| 20 | | Wells Fargo Disciplined U.S. Core Fund | | Statement of changes in net assets |
| | | | | | | | | | | | | | | | |
| | | Year ended
July 31, 2018 | | | Year ended
July 31, 2017 | |
| | | | |
Operations | | | | | | | | | | | | | | | | |
Net investment income | | | | | | $ | 18,267,289 | | | | | | | $ | 13,483,173 | |
Net realized gains on investments | | | | | | | 58,671,899 | | | | | | | | 40,249,528 | |
Net change in unrealized gains (losses) on investments | | | | | | | 83,409,567 | | | | | | | | 73,326,880 | |
| | | | |
Net increase in net assets resulting from operations | | | | | | | 160,348,755 | | | | | | | | 127,059,581 | |
| | | | |
| | | | |
Distributions to shareholders from | | | | | | | | | | | | | | | | |
Net investment income | | | | | | | | | | | | | | | | |
Class A | | | | | | | (4,337,310 | ) | | | | | | | (4,241,326 | ) |
Class C | | | | | | | (71,920 | ) | | | | | | | (349,824 | ) |
Class R | | | | | | | (19,170 | ) | | | | | | | (11,093 | ) |
Class R6 | | | | | | | (2,941,311 | ) | | | | | | | (347,445 | ) |
Administrator Class | | | | | | | (938,093 | ) | | | | | | | (881,706 | ) |
Institutional Class | | | | | | | (5,006,239 | ) | | | | | | | (3,455,983 | ) |
Net realized gains | | | | | | | | | | | | | | | | |
Class A | | | | | | | (16,367,452 | ) | | | | | | | (5,786,410 | ) |
Class C | | | | | | | (1,975,046 | ) | | | | | | | (762,481 | ) |
Class R | | | | | | | (67,065 | ) | | | | | | | (10,965 | ) |
Class R6 | | | | | | | (7,459,553 | ) | | | | | | | (335,630 | ) |
Administrator Class | | | | | | | (3,240,553 | ) | | | | | | | (1,132,641 | ) |
Institutional Class | | | | | | | (13,501,914 | ) | | | | | | | (3,458,102 | ) |
| | | | |
Total distributions to shareholders | | | | | | | (55,925,626 | ) | | | | | | | (20,773,606 | ) |
| | | | |
| | | | |
Capital share transactions | | | Shares | | | | | | | | Shares | | | | | |
Proceeds from shares sold | | | | | | | | | | | | | | | | |
Class A | | | 3,025,519 | | | | 51,764,763 | | | | 7,395,158 | | | | 112,884,775 | |
Class C | | | 374,010 | | | | 5,918,031 | | | | 944,833 | | | | 13,103,182 | |
Class R | | | 106,436 | | | | 1,833,037 | | | | 123,340 | | | | 1,889,259 | |
Class R6 | | | 31,753,862 | | | | 558,773,061 | | | | 2,649,029 | | | | 41,071,466 | |
Administrator Class | | | 801,468 | | | | 14,055,574 | | | | 2,626,510 | | | | 40,190,122 | |
Institutional Class | | | 9,147,678 | | | | 158,493,564 | | | | 17,067,003 | | | | 262,837,225 | |
| | | | |
| | | | | | | 790,838,030 | | | | | | | | 471,976,029 | |
| | | | |
Reinvestment of distributions | | | | | | | | | | | | | | | | |
Class A | | | 1,131,935 | | | | 19,445,471 | | | | 632,192 | | | | 9,490,471 | |
Class C | | | 117,892 | | | | 1,860,460 | | | | 67,906 | | | | 944,467 | |
Class R | | | 4,876 | | | | 84,764 | | | | 1,447 | | | | 22,058 | |
Class R6 | | | 589,809 | | | | 10,399,263 | | | | 44,450 | | | | 683,075 | |
Administrator Class | | | 230,133 | | | | 4,058,515 | | | | 122,191 | | | | 1,880,016 | |
Institutional Class | | | 851,853 | | | | 14,861,788 | | | | 358,107 | | | | 5,452,012 | |
| | | | |
| | | | | | | 50,710,261 | | | | | | | | 18,472,099 | |
| | | | |
Payment for shares redeemed | | | | | | | | | | | | | | | | |
Class A | | | (5,686,039 | ) | | | (97,150,526 | ) | | | (7,798,736 | ) | | | (119,001,666 | ) |
Class C | | | (852,666 | ) | | | (13,443,380 | ) | | | (897,430 | ) | | | (12,701,056 | ) |
Class R | | | (48,086 | ) | | | (836,247 | ) | | | (17,137 | ) | | | (260,936 | ) |
Class R6 | | | (10,312,522 | ) | | | (185,383,377 | ) | | | (464,804 | ) | | | (7,429,067 | ) |
Administrator Class | | | (1,497,144 | ) | | | (26,145,921 | ) | | | (4,970,876 | ) | | | (75,703,203 | ) |
Institutional Class | | | (8,454,555 | ) | | | (147,923,158 | ) | | | (7,177,876 | ) | | | (112,590,745 | ) |
| | | | |
| | | | | | | (470,882,609 | ) | | | | | | | (327,686,673 | ) |
| | | | |
Net increase in net assets resulting from capital share transactions | | | | | | | 370,665,682 | | | | | | | | 162,761,455 | |
| | | | |
Total increase in net assets | | | | | | | 475,088,811 | | | | | | | | 269,047,430 | |
| | | | |
| | | | |
Net assets | | | | | | | | | | | | | | | | |
Beginning of period | | | | | | | 1,013,182,172 | | | | | | | | 744,134,742 | |
| | | | |
End of period | | | | | | $ | 1,488,270,983 | | | | | | | $ | 1,013,182,172 | |
| | | | |
Undistributed net investment income | | | | | | $ | 18,219,041 | | | | | | | $ | 13,265,795 | |
| | | | |
The accompanying notes are an integral part of these financial statements.
| | | | | | |
| Financial highlights | | Wells Fargo Disciplined U.S. Core Fund | | | 21 | |
(For a share outstanding throughout each period)
| | | | | | | | | | | | | | | | | | | | |
| | | Year ended July 31 | |
| CLASS A | | 2018 | | | 2017 | | | 2016 | | | 2015 | | | 2014 | |
Net asset value, beginning of period | | | $16.30 | | | | $14.50 | | | | $15.45 | | | | $16.29 | | | | $16.27 | |
Net investment income | | | 0.24 | | | | 0.22 | | | | 0.21 | | | | 0.21 | | | | 0.19 | |
Net realized and unrealized gains (losses) on investments | | | 1.90 | | | | 1.94 | | | | 0.47 | | | | 1.60 | | | | 2.35 | |
| | | | | | | | | | | | | | | | | | | | |
Total from investment operations | | | 2.14 | | | | 2.16 | | | | 0.68 | | | | 1.81 | | | | 2.54 | |
Distributions to shareholders from | | | | | | | | | | | | | | | | | | | | |
Net investment income | | | (0.15 | ) | | | (0.15 | ) | | | (0.19 | ) | | | (0.16 | ) | | | (0.24 | ) |
Net realized gains | | | (0.59 | ) | | | (0.21 | ) | | | (1.44 | ) | | | (2.49 | ) | | | (2.28 | ) |
| | | | | | | | | | | | | | | | | | | | |
Total distributions to shareholders | | | (0.74 | ) | | | (0.36 | ) | | | (1.63 | ) | | | (2.65 | ) | | | (2.52 | ) |
Net asset value, end of period | | | $17.70 | | | | $16.30 | | | | $14.50 | | | | $15.45 | | | | $16.29 | |
Total return1 | | | 13.28 | % | | | 15.12 | % | | | 5.22 | % | | | 12.01 | % | | | 17.00 | % |
Ratios to average net assets (annualized) | | | | | | | | | | | | | | | | | | | | |
Gross expenses | | | 0.83 | % | | | 0.85 | % | | | 0.87 | % | | | 0.89 | % | | | 0.93 | % |
Net expenses | | | 0.83 | % | | | 0.85 | % | | | 0.87 | % | | | 0.89 | % | | | 0.92 | % |
Net investment income | | | 1.33 | % | | | 1.45 | % | | | 1.60 | % | | | 1.43 | % | | | 1.27 | % |
Supplemental data | | | | | | | | | | | | | | | | | | | | |
Portfolio turnover rate | | | 73 | % | | | 60 | % | | | 52 | % | | | 53 | % | | | 71 | % |
Net assets, end of period (000s omitted) | | | $480,602 | | | | $467,491 | | | | $412,629 | | | | $331,123 | | | | $305,577 | |
| 1 | Total return calculations do not include any sales charges. |
The accompanying notes are an integral part of these financial statements.
| | | | |
| 22 | | Wells Fargo Disciplined U.S. Core Fund | | Financial highlights |
(For a share outstanding throughout each period)
| | | | | | | | | | | | | | | | | | | | |
| | | Year ended July 31 | |
| CLASS C | | 2018 | | | 2017 | | | 2016 | | | 2015 | | | 2014 | |
Net asset value, beginning of period | | | $15.04 | | | | $13.45 | | | | $14.50 | | | | $15.47 | | | | $15.58 | |
Net investment income | | | 0.09 | | | | 0.10 | | | | 0.14 | | | | 0.13 | | | | 0.08 | |
Net realized and unrealized gains (losses) on investments | | | 1.76 | | | | 1.79 | | | | 0.38 | | | | 1.48 | | | | 2.23 | |
| | | | | | | | | | | | | | | | | | | | |
Total from investment operations | | | 1.85 | | | | 1.89 | | | | 0.52 | | | | 1.61 | | | | 2.31 | |
Distributions to shareholders from | | | | | | | | | | | | | | | | | | | | |
Net investment income | | | (0.02 | ) | | | (0.09 | ) | | | (0.13 | ) | | | (0.09 | ) | | | (0.14 | ) |
Net realized gains | | | (0.59 | ) | | | (0.21 | ) | | | (1.44 | ) | | | (2.49 | ) | | | (2.28 | ) |
| | | | | | | | | | | | | | | | | | | | |
Total distributions to shareholders | | | (0.61 | ) | | | (0.30 | ) | | | (1.57 | ) | | | (2.58 | ) | | | (2.42 | ) |
Net asset value, end of period | | | $16.28 | | | | $15.04 | | | | $13.45 | | | | $14.50 | | | | $15.47 | |
Total return1 | | | 12.41 | % | | | 14.27 | % | | | 4.43 | % | | | 11.18 | % | | | 16.10 | % |
Ratios to average net assets (annualized) | | | | | | | | | | | | | | | | | | | | |
Gross expenses | | | 1.58 | % | | | 1.60 | % | | | 1.62 | % | | | 1.64 | % | | | 1.68 | % |
Net expenses | | | 1.58 | % | | | 1.60 | % | | | 1.62 | % | | | 1.64 | % | | | 1.67 | % |
Net investment income | | | 0.58 | % | | | 0.69 | % | | | 0.82 | % | | | 0.66 | % | | | 0.51 | % |
Supplemental data | | | | | | | | | | | | | | | | | | | | |
Portfolio turnover rate | | | 73 | % | | | 60 | % | | | 52 | % | | | 53 | % | | | 71 | % |
Net assets, end of period (000s omitted) | | | $52,647 | | | | $54,054 | | | | $46,801 | | | | $20,680 | | | | $10,913 | |
| 1 | Total return calculations do not include any sales charges. |
The accompanying notes are an integral part of these financial statements.
| | | | | | |
| Financial highlights | | Wells Fargo Disciplined U.S. Core Fund | | | 23 | |
(For a share outstanding throughout each period)
| | | | | | | | | | | | |
| | | Year ended July 31 | |
| CLASS R | | 2018 | | | 2017 | | | 20161 | |
Net asset value, beginning of period | | | $16.51 | | | | $14.77 | | | | $14.62 | |
Net investment income | | | 0.18 | 2 | | | 0.17 | 2 | | | 0.13 | 2 |
Net realized and unrealized gains (losses) on investments | | | 1.94 | | | | 1.99 | | | | 1.72 | |
| | | | | | | | | | | | |
Total from investment operations | | | 2.12 | | | | 2.16 | | | | 1.85 | |
Distributions to shareholders from | | | | | | | | | | | | |
Net investment income | | | (0.16 | ) | | | (0.21 | ) | | | (0.26 | ) |
Net realized gains | | | (0.59 | ) | | | (0.21 | ) | | | (1.44 | ) |
| | | | | | | | | | | | |
Total distributions to shareholders | | | (0.75 | ) | | | (0.42 | ) | | | (1.70 | ) |
Net asset value, end of period | | | $17.88 | | | | $16.51 | | | | $14.77 | |
Total return3 | | | 12.97 | % | | | 14.86 | % | | | 13.56 | % |
Ratios to average net assets (annualized) | | | | | | | | | | | | |
Gross expenses | | | 1.08 | % | | | 1.10 | % | | | 1.12 | % |
Net expenses | | | 1.08 | % | | | 1.10 | % | | | 1.12 | % |
Net investment income | | | 1.04 | % | | | 1.10 | % | | | 1.12 | % |
Supplemental data | | | | | | | | | | | | |
Portfolio turnover rate | | | 73 | % | | | 60 | % | | | 52 | % |
Net assets, end of period (000s omitted) | | | $3,298 | | | | $2,001 | | | | $201 | |
| 1 | For the period from September 30, 2015 (commencement of class operations) to July 31, 2016 |
| 2 | Calculated based upon average shares outstanding |
| 3 | Returns for periods of less than one year are not annualized. |
The accompanying notes are an integral part of these financial statements.
| | | | |
| 24 | | Wells Fargo Disciplined U.S. Core Fund | | Financial highlights |
(For a share outstanding throughout each period)
| | | | | | | | | | | | |
| | | Year ended July 31 | |
| CLASS R6 | | 2018 | | | 2017 | | | 20161 | |
Net asset value, beginning of period | | | $16.71 | | | | $14.86 | | | | $14.62 | |
Net investment income | | | 0.30 | 2 | | | 0.28 | 2 | | | 0.22 | 2 |
Net realized and unrealized gains (losses) on investments | | | 1.97 | | | | 1.99 | | | | 1.72 | |
| | | | | | | | | | | | |
Total from investment operations | | | 2.27 | | | | 2.27 | | | | 1.94 | |
Distributions to shareholders from | | | | | | | | | | | | |
Net investment income | | | (0.22 | ) | | | (0.21 | ) | | | (0.26 | ) |
Net realized gains | | | (0.59 | ) | | | (0.21 | ) | | | (1.44 | ) |
| | | | | | | | | | | | |
Total distributions to shareholders | | | (0.81 | ) | | | (0.42 | ) | | | (1.70 | ) |
Net asset value, end of period | | | $18.17 | | | | $16.71 | | | | $14.86 | |
Total return3 | | | 13.78 | % | | | 15.56 | % | | | 14.24 | % |
Ratios to average net assets (annualized) | | | | | | | | | | | | |
Gross expenses | | | 0.40 | % | | | 0.42 | % | | | 0.44 | % |
Net expenses | | | 0.40 | % | | | 0.42 | % | | | 0.43 | % |
Net investment income | | | 1.71 | % | | | 1.77 | % | | | 1.88 | % |
Supplemental data | | | | | | | | | | | | |
Portfolio turnover rate | | | 73 | % | | | 60 | % | | | 52 | % |
Net assets, end of period (000s omitted) | | | $445,678 | | | | $41,770 | | | | $4,024 | |
| 1 | For the period from September 30, 2015 (commencement of class operations) to July 31, 2016 |
| 2 | Calculated based upon average shares outstanding |
| 3 | Returns for periods of less than one year are not annualized. |
The accompanying notes are an integral part of these financial statements.
| | | | | | |
| Financial highlights | | Wells Fargo Disciplined U.S. Core Fund | | | 25 | |
(For a share outstanding throughout each period)
| | | | | | | | | | | | | | | | | | | | |
| | | Year ended July 31 | |
| ADMINISTRATOR CLASS | | 2018 | | | 2017 | | | 2016 | | | 2015 | | | 2014 | |
Net asset value, beginning of period | | | $16.71 | | | | $14.85 | | | | $15.80 | | | | $16.60 | | | | $16.47 | |
Net investment income | | | 0.25 | 1 | | | 0.25 | 1 | | | 0.24 | 1 | | | 0.25 | 1 | | | 0.25 | 1 |
Net realized and unrealized gains (losses) on investments | | | 1.97 | | | | 1.98 | | | | 0.48 | | | | 1.63 | | | | 2.35 | |
| | | | | | | | | | | | | | | | | | | | |
Total from investment operations | | | 2.22 | | | | 2.23 | | | | 0.72 | | | | 1.88 | | | | 2.60 | |
Distributions to shareholders from | | | | | | | | | | | | | | | | | | | | |
Net investment income | | | (0.17 | ) | | | (0.16 | ) | | | (0.23 | ) | | | (0.19 | ) | | | (0.19 | ) |
Net realized gains | | | (0.59 | ) | | | (0.21 | ) | | | (1.44 | ) | | | (2.49 | ) | | | (2.28 | ) |
| | | | | | | | | | | | | | | | | | | | |
Total distributions to shareholders | | | (0.76 | ) | | | (0.37 | ) | | | (1.67 | ) | | | (2.68 | ) | | | (2.47 | ) |
Net asset value, end of period | | | $18.17 | | | | $16.71 | | | | $14.85 | | | | $15.80 | | | | $16.60 | |
Total return | | | 13.40 | % | | | 15.24 | % | | | 5.36 | % | | | 12.20 | % | | | 17.12 | % |
Ratios to average net assets (annualized) | | | | | | | | | | | | | | | | | | | | |
Gross expenses | | | 0.75 | % | | | 0.77 | % | | | 0.78 | % | | | 0.74 | % | | | 0.76 | % |
Net expenses | | | 0.74 | % | | | 0.74 | % | | | 0.74 | % | | | 0.73 | % | | | 0.74 | % |
Net investment income | | | 1.42 | % | | | 1.60 | % | | | 1.71 | % | | | 1.58 | % | | | 1.56 | % |
Supplemental data | | | | | | | | | | | | | | | | | | | | |
Portfolio turnover rate | | | 73 | % | | | 60 | % | | | 52 | % | | | 53 | % | | | 71 | % |
Net assets, end of period (000s omitted) | | | $94,058 | | | | $94,294 | | | | $116,807 | | | | $63,544 | | | | $50,498 | |
| 1 | Calculated based upon average shares outstanding |
The accompanying notes are an integral part of these financial statements.
| | | | |
| 26 | | Wells Fargo Disciplined U.S. Core Fund | | Financial highlights |
(For a share outstanding throughout each period)
| | | | | | | | | | | | | | | | | | | | |
| | | Year ended July 31 | |
| INSTITUTIONAL CLASS | | 2018 | | | 2017 | | | 2016 | | | 2015 | | | 2014 | |
Net asset value, beginning of period | | | $16.55 | | | | $14.72 | | | | $15.66 | | | | $16.47 | | | | $16.43 | |
Net investment income | | | 0.28 | | | | 0.27 | 1 | | | 0.28 | 1 | | | 0.30 | | | | 0.26 | 1 |
Net realized and unrealized gains (losses) on investments | | | 1.95 | | | | 1.98 | | | | 0.47 | | | | 1.61 | | | | 2.37 | |
| | | | | | | | | | | | | | | | | | | | |
Total from investment operations | | | 2.23 | | | | 2.25 | | | | 0.75 | | | | 1.91 | | | | 2.63 | |
Distributions to shareholders from | | | | | | | | | | | | | | | | | | | | |
Net investment income | | | (0.21 | ) | | | (0.21 | ) | | | (0.25 | ) | | | (0.23 | ) | | | (0.31 | ) |
Net realized gains | | | (0.59 | ) | | | (0.21 | ) | | | (1.44 | ) | | | (2.49 | ) | | | (2.28 | ) |
| | | | | | | | | | | | | | | | | | | | |
Total distributions to shareholders | | | (0.80 | ) | | | (0.42 | ) | | | (1.69 | ) | | | (2.72 | ) | | | (2.59 | ) |
Net asset value, end of period | | | $17.98 | | | | $16.55 | | | | $14.72 | | | | $15.66 | | | | $16.47 | |
Total return | | | 13.65 | % | | | 15.51 | % | | | 5.64 | % | | | 12.55 | % | | | 17.48 | % |
Ratios to average net assets (annualized) | | | | | | | | | | | | | | | | | | | | |
Gross expenses | | | 0.50 | % | | | 0.52 | % | | | 0.54 | % | | | 0.47 | % | | | 0.50 | % |
Net expenses | | | 0.48 | % | | | 0.48 | % | | | 0.48 | % | | | 0.47 | % | | | 0.48 | % |
Net investment income | | | 1.67 | % | | | 1.76 | % | | | 1.96 | % | | | 1.86 | % | | | 1.63 | % |
Supplemental data | | | | | | | | | | | | | | | | | | | | |
Portfolio turnover rate | | | 73 | % | | | 60 | % | | | 52 | % | | | 53 | % | | | 71 | % |
Net assets, end of period (000s omitted) | | | $411,988 | | | | $353,573 | | | | $163,674 | | | | $109,901 | | | | $91,144 | |
| 1 | Calculated based upon average shares outstanding |
The accompanying notes are an integral part of these financial statements.
| | | | | | |
| Notes to financial statements | | Wells Fargo Disciplined U.S. Core Fund | | | 27 | |
1. ORGANIZATION
Wells Fargo Funds Trust (the “Trust”), a Delaware statutory trust organized on March 10, 1999, is an open-end management investment company registered under the Investment Company Act of 1940, as amended (the “1940 Act”). As an investment company, the Trust follows the accounting and reporting guidance in Financial Accounting Standards Board Accounting Standards Codification Topic 946, Financial Services – Investment Companies. These financial statements report on the Wells Fargo Disciplined U.S. Core Fund (the “Fund”) which is a diversified series of the Trust.
2. SIGNIFICANT ACCOUNTING POLICIES
The following significant accounting policies, which are consistently followed in the preparation of the financial statements of the Fund, are in conformity with U.S. generally accepted accounting principles which require management to make estimates and assumptions that affect the reported amounts of assets and liabilities, disclosure of contingent assets and liabilities at the date of the financial statements, and the reported amounts of revenues and expenses during the reporting period. Actual results could differ from those estimates.
Securities valuation
All investments are valued each business day as of the close of regular trading on the New York Stock Exchange (generally 4 p.m. Eastern Time), although the Fund may deviate from this calculation time under unusual or unexpected circumstances.
Equity securities that are listed on a foreign or domestic exchange or market are valued at the official closing price or, if none, the last sales price. If no sale occurs on the principal exchange or market that day, a fair value price will be determined in accordance with the Fund’s Valuation Procedures.
Investments in registered open-end investment companies are valued at net asset value. Interests in non-registered investment companies that are redeemable at net asset value are fair valued normally at net asset value.
Investments which are not valued using any of the methods discussed above are valued at their fair value, as determined in good faith by the Board of Trustees of the Fund. The Board of Trustees has established a Valuation Committee comprised of the Trustees and has delegated to it the authority to take any actions regarding the valuation of portfolio securities that the Valuation Committee deems necessary or appropriate, including determining the fair value of portfolio securities, unless the determination has been delegated to the Wells Fargo Asset Management Pricing Committee at Wells Fargo Funds Management, LLC (“Funds Management”). The Board of Trustees retains the authority to make or ratify any valuation decisions or approve any changes to the Valuation Procedures as it deems appropriate. On a quarterly basis, the Board of Trustees receives reports on any valuation actions taken by the Valuation Committee or the Wells Fargo Asset Management Pricing Committee which may include items for ratification.
Valuations of fair valued securities are compared to the next actual sales price when available, or other appropriate market values, to assess the continued appropriateness of the fair valuation methodologies used. These securities are fair valued on a day-to-day basis, taking into consideration changes to appropriate market information and any significant changes to the inputs considered in the valuation process until there is a readily available price provided on an exchange or by an independent pricing service. Valuations received from an independent pricing service or independent broker-dealer quotes are periodically validated by comparisons to most recent trades and valuations provided by other independent pricing services in addition to the review of prices by the manager and/or subadviser. Unobservable inputs used in determining fair valuations are identified based on the type of security, taking into consideration factors utilized by market participants in valuing the investment, knowledge about the issuer and the current market environment.
Securities lending
The Fund may lend its securities from time to time in order to earn additional income in the form of fees or interest on securities received as collateral or the investment of any cash received as collateral. The Fund continues to receive interest or dividends on the securities loaned. The Fund receives collateral in the form of cash or securities with a value at least equal to the value of the securities on loan. The value of the loaned securities is determined at the close of each business day and any additional required collateral is delivered to the Fund on the next business day. In a securities lending transaction, the net asset value of the Fund will be affected by an increase or decrease in the value of the securities loaned and by an increase or decrease in the value of the instrument in which collateral is invested. The amount of securities lending activity undertaken by the Fund fluctuates from time to time. In the event of default or bankruptcy by the borrower, the Fund may be prevented from recovering the loaned securities or gaining access to the collateral or may experience delays or costs in doing so. In addition, the investment of any cash collateral received may lose all or part of its value. The Fund has the right under the lending agreement to recover the securities from the borrower on demand.
| | | | |
| 28 | | Wells Fargo Disciplined U.S. Core Fund | | Notes to financial statements |
The Fund lends its securities through an unaffiliated securities lending agent. Cash collateral received in connection with its securities lending transactions is invested in Securities Lending Cash Investments, LLC (the “Securities Lending Fund”). The Securities Lending Fund is exempt from registration under Section 3(c)(7) of the 1940 Act and is managed by Funds Management and is subadvised by Wells Capital Management Incorporated (“WellsCap”), an affiliate of Funds Management and an indirect wholly owned subsidiary of Wells Fargo & Company (“Wells Fargo”). Funds Management receives an advisory fee starting at 0.05% and declining to 0.01% as the average daily net assets of the Securities Lending Fund increase. All of the fees received by Funds Management are paid to WellsCap for its services as subadviser. The Securities Lending Fund seeks to provide a positive return compared to the daily Fed Funds Open Rate by investing in high-quality, U.S. dollar-denominated short-term money market instruments. Securities Lending Fund investments are valued at the evaluated bid price provided by an independent pricing service. Income earned from investment in the Securities Lending Fund, if any, is included in income from affiliated securities on the Statement of Operations.
Security transactions and income recognition
Securities transactions are recorded on a trade date basis. Realized gains or losses are recorded on the basis of identified cost.
Dividend income is recognized on the ex-dividend date. Dividend income is recorded net of foreign taxes withheld where recovery of such taxes is not assured.
Distributions to shareholders
Distributions to shareholders from net investment income and any net realized gains are recorded on the ex-dividend date and paid at least annually. Such distributions are determined in accordance with income tax regulations and may differ from U.S. generally accepted accounting principles. Dividend sources are estimated at the time of declaration. The tax character of distributions is determined as of the Fund’s fiscal year end. Therefore, a portion of the Fund’s distributions made prior to the Fund’s fiscal year end may be categorized as a tax return of capital at year end.
Federal and other taxes
The Fund intends to continue to qualify as a regulated investment company by distributing substantially all of its investment company taxable income and any net realized capital gains (after reduction for capital loss carryforwards) sufficient to relieve it from all, or substantially all, federal income taxes. Accordingly, no provision for federal income taxes was required.
The Fund’s income and federal excise tax returns and all financial records supporting those returns for the prior three fiscal years are subject to examination by the federal and Delaware revenue authorities. Management has analyzed the Fund’s tax positions taken on federal, state, and foreign tax returns for all open tax years and does not believe that there are any uncertain tax positions that require recognition of a tax liability.
As of July 31, 2018, the aggregate cost of all investments for federal income tax purposes was $1,171,763,575 and the unrealized gains (losses) consisted of:
| | | | |
Gross unrealized gains | | $ | 334,467,066 | |
Gross unrealized losses | | | (16,707,150 | ) |
Net unrealized gains | | $ | 317,759,916 | |
Class allocations
The separate classes of shares offered by the Fund differ principally in applicable sales charges, distribution, shareholder servicing, and administration fees. Class specific expenses are charged directly to that share class. Investment income, common expenses, and realized and unrealized gains (losses) on investments are allocated daily to each class of shares based on the relative proportion of net assets of each class.
3. FAIR VALUATION MEASUREMENTS
Fair value measurements of investments are determined within a framework that has established a fair value hierarchy based upon the various data inputs utilized in determining the value of the Fund’s investments. The three-level hierarchy gives the highest priority to unadjusted quoted prices in active markets for identical assets or liabilities (Level 1) and the lowest priority to unobservable inputs (Level 3). The Fund’s investments are classified within the fair value hierarchy based on the lowest level of input that is significant to the fair value measurement. The inputs are summarized into three broad levels as follows:
| ∎ | | Level 1 – quoted prices in active markets for identical securities |
| ∎ | | Level 2 – other significant observable inputs (including quoted prices for similar securities, interest rates, prepayment speeds, credit risk, etc.) |
| ∎ | | Level 3 – significant unobservable inputs (including the Fund’s own assumptions in determining the fair value of investments) |
| | | | | | |
| Notes to financial statements | | Wells Fargo Disciplined U.S. Core Fund | | | 29 | |
The inputs or methodologies used for valuing investments in securities are not necessarily an indication of the risk associated with investing in those securities.
The following is a summary of the inputs used in valuing the Fund’s assets and liabilities as of July 31, 2018:
| | | | | | | | | | | | | | | | |
| | | Quoted prices (Level 1) | | | Other significant
observable inputs (Level 2) | | | Significant
unobservable inputs (Level 3) | | | Total | |
Assets | | | | | | | | | | | | | | | | |
Investments in: | | | | | | | | | | | | | | | | |
| | | | |
Common stocks | | | | | | | | | | | | | | | | |
Consumer discretionary | | $ | 182,231,159 | | | $ | 0 | | | $ | 0 | | | $ | 182,231,159 | |
Consumer staples | | | 90,155,605 | | | | 0 | | | | 0 | | | | 90,155,605 | |
Energy | | | 87,453,968 | | | | 0 | | | | 0 | | | | 87,453,968 | |
Financials | | | 200,452,477 | | | | 0 | | | | 0 | | | | 200,452,477 | |
Health care | | | 225,372,667 | | | | 0 | | | | 0 | | | | 225,372,667 | |
Industrials | | | 135,510,541 | | | | 0 | | | | 0 | | | | 135,510,541 | |
Information technology | | | 381,504,213 | | | | 0 | | | | 0 | | | | 381,504,213 | |
Materials | | | 52,864,015 | | | | 0 | | | | 0 | | | | 52,864,015 | |
Real estate | | | 50,856,790 | | | | 0 | | | | 0 | | | | 50,856,790 | |
Telecommunications | | | 35,572,554 | | | | 0 | | | | 0 | | | | 35,572,554 | |
Utilities | | | 38,533,630 | | | | 0 | | | | 0 | | | | 38,533,630 | |
| | | | |
Short-term investments | | | | | | | | | | | | | | | | |
Investment companies | | | 9,015,872 | | | | 0 | | | | 0 | | | | 9,015,872 | |
Total assets | | $ | 1,489,523,491 | | | $ | 0 | | | $ | 0 | | | $ | 1,489,523,491 | |
The Fund recognizes transfers between levels within the fair value hierarchy at the end of the reporting period. At July 31, 2018, the Fund did not have any transfers into/out of Level 1, Level 2, or Level 3.
4. TRANSACTIONS WITH AFFILIATES
Management fee
Funds Management, an indirect wholly owned subsidiary of Wells Fargo, is the manager of the Fund and provides advisory and fund-level administrative services under an investment management agreement. Under the investment management agreement, Funds Management is responsible for, among other services, implementing the investment objectives and strategies of the Fund, supervising the subadviser and providing fund-level administrative services in connection with the Fund’s operations. As compensation for its services under the investment management agreement, Funds Management is entitled to receive an annual management fee starting at 0.35% and declining to 0.28% as the average daily net assets of the Fund increase. For the year ended July 31, 2018, the management fee was equivalent to an annual rate of 0.35% of the Fund’s average daily net assets.
Funds Management has retained the services of a subadviser to provide daily portfolio management to the Fund. The fee for subadvisory services is borne by Funds Management. WellsCap is the subadvisor to the Fund and is entitled to receive a fee from Funds Management at an annual rate starting at 0.25% and declining to 0.15% as the average daily net assets of the Fund increase. Prior to January 1, 2018, Golden Capital Management, LLC, an affiliate of Funds Management and an indirect wholly owned subsidiary of Wells Fargo, was the subadviser to the Fund. In connection with the completion of the merger of Golden Capital Management, LLC into WellsCap on January 1, 2018, WellsCap became the subadviser to the Fund. The merger did not result in any change to the services provided to the Fund or to its strategies or fees and expenses.
Administration fees
Under a class-level administration agreement, Funds Management provides class-level administrative services to the Fund, which includes paying fees and expenses for services provided by the transfer agent, sub-transfer agents, omnibus account
| | | | |
| 30 | | Wells Fargo Disciplined U.S. Core Fund | | Notes to financial statements |
servicers and record-keepers. As compensation for its services under the class-level administration agreement, Funds Management receives an annual fee which is calculated based on the average daily net assets of each class as follows:
| | | | |
| | | Class-level
administration fee | |
Class A, Class C, Class R | | | 0.21 | % |
Class R6 | | | 0.03 | |
Administrator Class, Institutional Class | | | 0.13 | |
Funds Management has contractually waived and/or reimbursed management and administration fees to the extent necessary to maintain certain net operating expense ratios for the Fund. When each class of the Fund has exceeded its expense cap, Funds Management has waived fees and/or reimbursed expenses from fund level expenses on a proportionate basis and then from class specific expenses; otherwise, waivers and/or reimbursements are applied against class specific expenses before fund level expenses. Funds Management has committed through November 30, 2018 to waive fees and/or reimburse expenses to the extent necessary to cap the Fund’s expenses at 0.87% for Class A shares, 1.62% for Class C shares, 1.12% for Class R shares, 0.43% for Class R6 shares, 0.74% for Administrator Class, and 0.48% for Institutional Class shares. After this time, the cap may be increased or the commitment to maintain the cap may be terminated only with the approval of the Board of Trustees.
Distribution fees
The Trust has adopted a distribution plan for Class C and Class R shares of the Fund pursuant to Rule 12b-1 under the 1940 Act. Distribution fees are charged to Class C and Class R shares and paid to Wells Fargo Funds Distributor, LLC (“Funds Distributor”), the principal underwriter, at an annual rate of 0.75% of the average daily net assets of Class C shares and 0.25% of the average daily net assets of Class R shares.
In addition, Funds Distributor is entitled to receive the front-end sales charge from the purchase of Class A shares and a contingent deferred sales charge on the redemption of certain Class A shares. Funds Distributor is also entitled to receive the contingent deferred sales charges from redemptions of Class C shares. For the year ended July 31, 2018, Funds Distributor received $24,063 from the sale of Class A shares and $227 in contingent deferred sales charges from redemptions of Class C shares. No contingent deferred sales charges were incurred by Class A shares for the year ended July 31, 2018.
Shareholder servicing fees
The Trust has entered into contracts with one or more shareholder servicing agents, whereby Class A, Class C, Class R, and Administrator Class of the Fund are charged a fee at an annual rate of 0.25% of the average daily net assets of each respective class. A portion of these total shareholder servicing fees were paid to affiliates of Wells Fargo.
A portion of these total shareholder servicing fees were paid to affiliates of Wells Fargo.
Interfund transactions
The Fund may purchase or sell portfolio investment securities to certain other Wells Fargo affiliates pursuant to Rule 17a-7 under the 1940 Act and under procedures adopted by the Board of Trustees. The procedures have been designed to ensure that these interfund transactions, which do not incur broker commissions, are effected at current market prices. Pursuant to these procedures, the Fund had $312,926,405 and $139,638,697 in interfund purchases and sales, respectively, during the year ended July 31, 2018.
5. INVESTMENT PORTFOLIO TRANSACTIONS
Purchases and sales of investments, excluding U.S. government obligations (if any) and short-term securities, for the year ended July 31, 2018 were $1,245,655,110 and $901,253,266, respectively.
6. BANK BORROWINGS
The Trust (excluding the money market funds and certain other funds) and Wells Fargo Variable Trust are parties to a $280,000,000 revolving credit agreement whereby the Fund is permitted to use bank borrowings for temporary or emergency purposes, such as to fund shareholder redemption requests. Interest under the credit agreement is charged to the Fund based on a borrowing rate equal to the higher of the Federal Funds rate in effect on that day plus 1.25% or the overnight LIBOR rate in effect on that day plus 1.25%. In addition, an annual commitment fee equal to 0.25% of the unused balance is allocated to each participating fund. Prior to August 29, 2017, the revolving credit agreement amount was $250,000,000.
| | | | | | |
| Notes to financial statements | | Wells Fargo Disciplined U.S. Core Fund | | | 31 | |
For the year ended July 31, 2018, there were no borrowings by the Fund under the agreement.
7. DISTRIBUTIONS TO SHAREHOLDERS
The tax character of distributions paid during the years ended July 31, 2018 and July 31, 2017 were as follows:
| | | | | | | | |
| | | Year ended July 31 | |
| | | 2018 | | | 2017 | |
Ordinary income | | $ | 27,352,794 | | | $ | 9,287,377 | |
Long-term capital gain | | | 28,572,832 | | | | 11,486,229 | |
As of July 31, 2018, the components of distributable earnings on a tax basis were as follows:
| | | | |
Undistributed ordinary income | | Undistributed long-term gain | | Unrealized gains |
| $19,977,062 | | $63,885,783 | | $317,759,916 |
8. CONCENTRATION RISK
Concentration risks result from exposure to a limited number of sectors. A fund that invests a substantial portion of its assets in any sector may be more affected by changes in that sector than would be a fund whose investments are not heavily weighted in any sector.
9. INDEMNIFICATION
Under the Trust’s organizational documents, the officers and Trustees have been granted certain indemnification rights against certain liabilities that may arise out of performance of their duties to the Trust. Additionally, in the normal course of business, the Trust may enter into contracts with service providers that contain a variety of indemnification clauses. The Trust’s maximum exposure under these arrangements is dependent on future claims that may be made against the Fund and, therefore, cannot be estimated.
| | | | |
| 32 | | Wells Fargo Disciplined U.S. Core Fund | | Report of independent registered public accounting firm |
BOARD OF TRUSTEES AND SHAREHOLDERS OF WELLS FARGO FUNDS TRUST:
Opinion on the Financial Statements
We have audited the accompanying statement of assets and liabilities of Wells Fargo Disciplined U.S. Core Fund (the “Fund”), one of the funds constituting Wells Fargo Funds Trust, including the portfolio of investments, as of July 31, 2018, the related statement of operations for the year then ended, the statements of changes in net assets for each of the years in the two-year period then ended, and the related notes (collectively, the “financial statements”) and the financial highlights for each of the years or periods in the five-year period then ended. In our opinion, the financial statements and financial highlights present fairly, in all material respects, the financial position of the Fund as of July 31, 2018, the results of its operations for the year then ended, the changes in its net assets for each of the years in the two-year period then ended, and the financial highlights for each of the years or periods in the five-year period then ended, in conformity with U.S. generally accepted accounting principles.
Basis for Opinion
These financial statements and financial highlights are the responsibility of the Fund’s management. Our responsibility is to express an opinion on these financial statements and financial highlights based on our audits. We are a public accounting firm registered with the Public Company Accounting Oversight Board (United States) (“PCAOB”) and are required to be independent with respect to the Fund in accordance with the U.S. federal securities laws and the applicable rules and regulations of the Securities and Exchange Commission and the PCAOB.
We conducted our audits in accordance with the standards of the PCAOB. Those standards require that we plan and perform the audit to obtain reasonable assurance about whether the financial statements and financial highlights are free of material misstatement, whether due to error or fraud. Our audits included performing procedures to assess the risks of material misstatement of the financial statements and financial highlights, whether due to error or fraud, and performing procedures that respond to those risks. Such procedures included examining, on a test basis, evidence regarding the amounts and disclosures in the financial statements and financial highlights. Such procedures also included confirmation of securities owned as of July 31, 2018, by correspondence with the custodian and brokers, or by other appropriate auditing procedures. Our audits also included evaluating the accounting principles used and significant estimates made by management, as well as evaluating the overall presentation of the financial statements and financial highlights. We believe that our audits provide a reasonable basis for our opinion.

We have not been able to determine the specific year that we began serving as the auditor of one or more Wells Fargo Funds investment companies, however we are aware that we have served as the auditor of one or more Wells Fargo Funds investment companies since at least 1955.
Boston, Massachusetts
September 24, 2018
| | | | | | |
| Other information (unaudited) | | Wells Fargo Disciplined U.S. Core Fund | | | 33 | |
TAX INFORMATION
For corporate shareholders, pursuant to Section 854 of the Internal Revenue Code, 66.60% of ordinary income dividends qualify for the corporate dividends-received deduction for the fiscal year ended July 31, 2018.
Pursuant to Section 852 of the Internal Revenue Code, $28,572,832 was designated as a 20% rate gain distribution for the fiscal year ended July 31, 2018.
Pursuant to Section 854 of the Internal Revenue Code, $18,972,307 of income dividends paid during the fiscal year ended July 31, 2018 has been designated as qualified dividend income (QDI).
For the fiscal year ended July 31, 2018, $35,950 has been designated as interest-related dividends for nonresident alien shareholders pursuant to Section 871 of the Internal Revenue Code.
For the fiscal year ended July 31, 2018, $14,038,751 has been designated as short-term capital gain dividends for nonresident alien shareholders pursuant to Section 871 of the Internal Revenue Code.
PROXY VOTING INFORMATION
A description of the policies and procedures that the Fund uses to determine how to vote proxies relating to portfolio securities is available, upon request, by calling 1-800-222-8222, visiting our website at wellsfargofunds.com, or visiting the SEC website at sec.gov. Information regarding how the Fund voted proxies relating to portfolio securities during the most recent 12-month period ended June 30 is available on the Fund’s website at wellsfargofunds.com or by visiting the SEC website at sec.gov.
PORTFOLIO HOLDINGS INFORMATION
The complete portfolio holdings for the Fund are publicly available monthly on the Fund’s website (wellsfargofunds.com), on a one-month delayed basis. In addition, top ten holdings information (excluding derivative positions) for the Fund is publicly available on the Fund’s website on a monthly, seven-day or more delayed basis. The Fund files its complete schedule of portfolio holdings with the SEC for the first and third quarters of each fiscal year on Form N-Q, which is available by visiting the SEC website at sec.gov. In addition, the Fund’s Form N-Q may be reviewed and copied at the SEC’s Public Reference Room in Washington, DC, and at regional offices in New York City, at 233 Broadway, and in Chicago, at 175 West Jackson Boulevard, Suite 900. Information about the Public Reference Room may be obtained by calling 1-800-SEC-0330.
| | | | |
| 34 | | Wells Fargo Disciplined U.S. Core Fund | | Other information (unaudited) |
BOARD OF TRUSTEES AND OFFICERS
Each of the Trustees and Officers1 listed in the table below acts in identical capacities for each fund in the Wells Fargo family of funds, which consists of 154 mutual funds comprising the Wells Fargo Funds Trust, Wells Fargo Variable Trust, Wells Fargo Master Trust and four closed-end funds (collectively the “Fund Complex”). This table should be read in conjunction with the Prospectus and the Statement of Additional Information2. The mailing address of each Trustee and Officer is 525 Market Street, 12th Floor, San Francisco, CA 94105. Each Trustee and Officer serves an indefinite term, however, each Trustee serves such term until reaching the mandatory retirement age established by the Trustees.
Independent Trustees
| | | | | | |
Name and year of birth | | Position held and length of service* | | Principal occupations during past five years or longer | | Current other public company or investment company directorships |
William R. Ebsworth (Born 1957) | | Trustee, since 2015 | | Retired. From 1984 to 2013, equities analyst, portfolio manager, research director and chief investment officer at Fidelity Management and Research Company in Boston, Tokyo, and Hong Kong, and retired in 2013 as Chief Investment Officer of Fidelity Strategic Advisers, Inc. where he led a team of investment professionals managing client assets. Prior thereto, Board member of Hong Kong Securities Clearing Co., Hong Kong Options Clearing Corp., the Thailand International Fund, Ltd., Fidelity Investments Life Insurance Company, and Empire Fidelity Investments Life Insurance Company. Board member of the Forté Foundation (non-profit organization) and the Vincent Memorial Hospital Endowment (non-profit organization), where he serves on the Investment Committee and as a Chair of the Audit Committee. Mr. Ebsworth is a CFA® charterholder. | | Asset Allocation Trust |
Jane A. Freeman (Born 1953) | | Trustee, since 2015; Chair Liaison,
since 2018 | | Retired. From 2012 to 2014 and 1999 to 2008, Chief Financial Officer of Scientific Learning Corporation. From 2008 to 2012, Ms. Freeman provided consulting services related to strategic business projects. Prior to 1999, Portfolio Manager at Rockefeller & Co. and Scudder, Stevens & Clark. Board member of the Harding Loevner Funds from 1996 to 2014, serving as both Lead Independent Director and chair of the Audit Committee. Board member of the Russell Exchange Traded Funds Trust from 2011 to 2012 and the chair of the Audit Committee. Ms. Freeman is a Board Member of Ruth Bancroft Garden (non-profit organization) and the Glimmerglass Festival. She is also an inactive Chartered Financial Analyst. | | Asset Allocation Trust |
Isaiah Harris, Jr. (Born 1952) | | Trustee, since 2009 | | Retired. Chairman of the Board of CIGNA Corporation since 2009, and Director since 2005. From 2003 to 2011, Director of Deluxe Corporation. Prior thereto, President and CEO of BellSouth Advertising and Publishing Corp. from 2005 to 2007, President and CEO of BellSouth Enterprises from 2004 to 2005 and President of BellSouth Consumer Services from 2000 to 2003. Emeritus member of the Iowa State University Foundation Board of Governors. Emeritus Member of the Advisory Board of Iowa State University School of Business. Advisory Board Member, Palm Harbor Academy (charter school). Advisory Board Member, Child Evangelism Fellowship (non-profit). Mr. Harris is a certified public accountant (inactive status). | | CIGNA Corporation; Asset Allocation Trust |
Judith M. Johnson (Born 1949) | | Trustee, since 2008; Audit Committee Chairman, since 2009 | | Retired. Prior thereto, Chief Executive Officer and Chief Investment Officer of Minneapolis Employees Retirement Fund from 1996 to 2008. Ms. Johnson is an attorney, certified public accountant and a certified managerial accountant. | | Asset Allocation Trust |
David F. Larcker (Born 1950) | | Trustee, since 2009 | | James Irvin Miller Professor of Accounting at the Graduate School of Business, Stanford University, Director of the Corporate Governance Research Initiative and Senior Faculty of The Rock Center for Corporate Governance since 2006. From 2005 to 2008, Professor of Accounting at the Graduate School of Business, Stanford University. Prior thereto, Ernst & Young Professor of Accounting at The Wharton School, University of Pennsylvania from 1985 to 2005. | | Asset Allocation Trust |
| | | | | | |
| Other information (unaudited) | | Wells Fargo Disciplined U.S. Core Fund | | | 35 | |
| | | | | | |
Name and year of birth | | Position held and length of service* | | Principal occupations during past five years or longer | | Current other public company or investment company directorships |
Olivia S. Mitchell (Born 1953) | | Trustee, since 2006; Governance Committee Chairman, since 2018 | | International Foundation of Employee Benefit Plans Professor, Wharton School of the University of Pennsylvania since 1993. Director of Wharton’s Pension Research Council and Boettner Center on Pensions & Retirement Research, and Research Associate at the National Bureau of Economic Research. Previously, Cornell University Professor from 1978 to 1993. | | Asset Allocation Trust |
Timothy J. Penny (Born 1951) | | Trustee, since 1996; Chairman, since 2018; Vice Chairman, from 2017 to 2018 | | President and Chief Executive Officer of Southern Minnesota Initiative Foundation, a non-profit organization, since 2007. Member of the Board of Trustees of NorthStar Education Finance, Inc., a non-profit organization, since 2007. | | Asset Allocation Trust |
James G. Polisson (Born 1959) | | Trustee, since 2018; Advisory Board Member, from 2017 to 2018 | | Retired. Chief Marketing Officer, Source (ETF) UK Services, Ltd, from 2015 to 2017. From 2012 to 2015, Principal of The Polisson Group, LLC, a management consulting, corporate advisory and principal investing company. Chief Executive Officer and Managing Director at Russell Investments, Global Exchange Traded Funds from 2010 to 2012. Managing Director of Barclays Global Investors from 1998 to 2010 and Global Chief Marketing Officer for iShares and Barclays Global Investors from 2000 to 2010. Trustee of the San Francisco Mechanics’ Institute, a non-profit organization, from 2013 to 2015. Board member of the Russell Exchange Traded Fund Trust from 2011 to 2012. Director of Barclays Global Investors Holdings Deutschland GmbH from 2006 to 2009. Mr. Polisson is an attorney and has a retired status with the Massachusetts and District of Columbia Bar Associations. | | Asset Allocation Trust |
Michael S. Scofield (Born 1943) | | Trustee, since 2010 | | Served on the Investment Company Institute’s Board of Governors and Executive Committee from 2008-2011 as well the Governing Council of the Independent Directors Council from 2006-2011 and the Independent Directors Council Executive Committee from 2008-2011. Trustee of the Evergreen Fund complex (and its predecessors) from 1984 to 2010. Chairman of the Evergreen Funds from 2000-2010. Former Trustee of the Mentor Funds. Retired Attorney, Law Offices of Michael S. Scofield. | | Asset Allocation Trust |
Pamela Wheelock (Born 1959) | | Trustee, since 2018; Advisory Board Member, from 2017 to 2018 | | Chief Operating Officer, Twin Cities Habitat for Humanity, since January, 2017. Vice President of University Services, University of Minnesota from 2012 to 2017. Prior thereto, on the Board of Directors, Goverance Committee and Finance Committee for the Minnesota Philanthropy Partners (Saint Paul Foundation) from 2012 to 2018, Interim President and Chief Executive Officer of Blue Cross Blue shield of Minnesota of Minnesota from 2010 to 2011, Chairman of the Board from 2009 to 2011 and Board Director 003 to 2015. Vice President, Leadership and Community Engagement, Bush Foundation, Saint Paul, Minnesota (a private foundation) from 2009 to 2011. Executive Vice President and Chief Financial Officer, Minnesota Sports and Entertainment from 2004 to 2009 and Senior Vice President from 2002 to 2004. Commissioner of Finance, State of Minnesota, from 1999 to 2002. Currently the Board Chair of the Minnesota Wild Foundation since 2010. | | Asset Allocation Trust |
| * | Length of service dates reflect the Trustee’s commencement of service with the Trust’s predecessor entities, where applicable. |
| | | | |
| 36 | | Wells Fargo Disciplined U.S. Core Fund | | Other information (unaudited) |
Officers
| | | | | | |
Name and year of birth | | Position held and length of service | | Principal occupations during past five years or longer | | |
Andrew Owen (Born 1960) | | President, since 2017 | | Executive Vice President of Wells Fargo & Company and Head of Affiliated Managers, Wells Fargo Asset Management, since 2014. In addition, Mr. Owen is currently President, Chief Executive Officer and Director of Wells Fargo Funds Management, LLC since 2017. Prior thereto, Executive Vice President responsible for marketing, investments and product development for Wells Fargo Funds Management, LLC, from 2009 to 2014. | | |
Jeremy DePalma1 (Born 1974) | | Treasurer, since 2012 | | Senior Vice President of Wells Fargo Funds Management, LLC since 2009. Senior Vice President of Evergreen Investment Management Company, LLC from 2008 to 2010 and head of the Fund Reporting and Control Team within Fund Administration from 2005 to 2010. | | |
Alexander Kymn3 (Born 1973) | | Secretary, since 2018; Chief Legal Officer, since 2018 | | Senior Company Counsel of Wells Fargo Bank, N.A. since 2018 (previously Senior Counsel from 2007 to 2018). Vice President of Wells Fargo Funds Management, LLC from 2008 to 2014. | | |
Michael H. Whitaker (Born 1967) | | Chief Compliance Officer, since 2016 | | Senior Vice President and Chief Compliance Officer since 2016. Senior Vice President and Chief Compliance Officer for Fidelity Investments from 2007 to 2016. | | |
David Berardi (Born 1975) | | Assistant Treasurer, since 2009 | | Vice President of Wells Fargo Funds Management, LLC since 2009. Vice President of Evergreen Investment Management Company, LLC from 2008 to 2010. Manager of Fund Reporting and Control for Evergreen Investment Management Company, LLC from 2004 to 2010. | | |
| 1 | Jeremy DePalma acts as Treasurer of 77 funds and Assistant Treasurer of 77 funds in the Fund Complex. |
| 2 | The Statement of Additional Information includes additional information about the Trustees and is available, without charge, upon request, by calling 1-800-222-8222 or by visiting the website at wellsfargofunds.com. |
| 3 | Alexander Kymn became the Secretary and Chief Legal Officer effective April 17, 2018. |
| | | | | | |
| Other information (unaudited) | | Wells Fargo Disciplined U.S. Core Fund | | | 37 | |
BOARD CONSIDERATION OF INVESTMENT MANAGEMENT AND SUB-ADVISORY AGREEMENTS:
Wells Fargo Disciplined U.S. Core Fund
Under the Investment Company Act of 1940 (the “1940 Act”), the Board of Trustees (the “Board”) of Wells Fargo Funds Trust (the “Trust”) must determine annually whether to approve the continuation of the Trust’s investment management and sub-advisory agreements. In this regard, at an in-person meeting held on May 22-23, 2018 (the “Meeting”), the Board, all the members of which have no direct or indirect interest in the investment management and sub-advisory agreements and are not “interested persons” of the Trust, as defined in the 1940 Act (the “Independent Trustees”), reviewed and approved for Wells Fargo Disciplined U.S. Core Fund (the “Fund”): (i) an investment management agreement (the “Management Agreement”) with Wells Fargo Funds Management, LLC (“Funds Management”); and (ii) an investment sub-advisory agreement (the “Sub-Advisory Agreement”) with Wells Capital Management Incorporated (the “Sub-Adviser”), an affiliate of Funds Management. The Management Agreement and the Sub-Advisory Agreement are collectively referred to as the “Advisory Agreements.”
At the Meeting, the Board considered the factors and reached the conclusions described below relating to the selection of Funds Management and the Sub-Adviser and the approval of the Advisory Agreements. Prior to the Meeting, including at an in-person meeting in April 2018, the Trustees conferred extensively among themselves and with representatives of Funds Management about these matters. Also, the Board has adopted a team-based approach, with each team consisting of a sub-set of Trustees, to assist the full Board in the discharge of its duties in reviewing investment performance and other matters throughout the year. The Independent Trustees were assisted in their evaluation of the Advisory Agreements by independent legal counsel, from whom they received separate legal advice and with whom they met separately.
In providing information to the Board, Funds Management and the Sub-Adviser were guided by a detailed set of requests for information submitted to them by independent legal counsel on behalf of the Independent Trustees at the start of the Board’s annual contract renewal process earlier in 2018. In considering and approving the Advisory Agreements, the Trustees considered the information they believed relevant, including but not limited to the information discussed below. The Board considered not only the specific information presented in connection with the Meeting, but also the knowledge gained over time through interaction with Funds Management and the Sub-Adviser about various topics. In this regard, the Board reviewed reports of Funds Management at each of its quarterly meetings, which included, among other things, portfolio reviews and investment performance reports. In addition, the Board and the teams mentioned above confer with portfolio managers at various times throughout the year. The Board did not identify any particular information or consideration that was all-important or controlling, and each individual Trustee may have attributed different weights to various factors.
After its deliberations, the Board unanimously approved the continuation of the Advisory Agreements for a one-year term and determined that the compensation payable to Funds Management and the Sub-Adviser under each of the Advisory Agreements was reasonable. The Board considered the approval of the Advisory Agreements for the Fund as part of its consideration of agreements for funds across the complex, but its approvals were made on a fund-by-fund basis. The following summarizes a number of important, but not necessarily all, factors considered by the Board in support of its approvals.
Nature, extent and quality of services
The Board received and considered various information regarding the nature, extent and quality of services provided to the Fund by Funds Management and the Sub-Adviser under the Advisory Agreements. This information included a description of the investment advisory services and Fund-level administrative services covered by the Management Agreement, as well as, among other things, a summary of the background and experience of senior management of Wells Fargo Asset Management (“WFAM”), of which Funds Management and the Sub-Adviser are a part, a summary of investments made in the business of WFAM, a summary of certain organizational and personnel changes involving Funds Management and the Sub-Adviser, and a description of Funds Management’s and the Sub-Adviser’s business continuity planning programs and of their approaches to data privacy and cybersecurity. The Board also considered the qualifications, background, tenure and responsibilities of each of the portfolio managers primarily responsible for the day-to-day portfolio management of the Fund.
The Board evaluated the ability of Funds Management and the Sub-Adviser to attract and retain qualified investment professionals, including research, advisory and supervisory personnel. The Board further considered the compliance programs and compliance records of Funds Management and the Sub-Adviser. In addition, the Board took into account the full range of services provided to the Fund by Funds Management and its affiliates.
| | | | |
| 38 | | Wells Fargo Disciplined U.S. Core Fund | | Other information (unaudited) |
Fund investment performance and expenses
The Board considered the investment performance results for the Fund over various time periods ended December 31, 2017. The Board considered these results in comparison to the investment performance of funds in a universe that was determined by Broadridge Inc. (“Broadridge”) to be similar to the Fund (the “Universe”), and in comparison to the Fund’s benchmark index and to other comparative data. Broadridge is an independent provider of investment company data. The Board received a description of the methodology used by Broadridge to select the mutual funds in the performance Universe. The Board noted that the investment performance of the Fund (Administrator Class) was higher than or in range of the average investment performance of the Universe for all periods under review. The Board also noted that the investment performance of the Fund was higher than or in range of its benchmark index, the S & P 500 Index, for the three-, five-, and ten-year periods under review, but lower than its benchmark index for the one-year period under review.
The Board also received and considered information regarding the Fund’s net operating expense ratios and their various components, including actual management fees, custodian and other non-management fees, and Rule 12b-1 and non-Rule 12b-1 shareholder service fees. The Board considered these ratios in comparison to the median ratios of funds in class-specific expense groups that were determined by Broadridge to be similar to the Fund (the “Groups”). The Board received a description of the methodology used by Broadridge to select the mutual funds in the expense Groups and an explanation of how funds comprising expense groups and their expense ratios may vary from year-to-year. Based on the Broadridge reports, the Board noted that the net operating expense ratios of the Fund were lower than or equal to the median net operating expense ratios of the expense Groups for each share class.
The Board took into account the Fund’s investment performance and expense information provided to it among the factors considered in deciding to re-approve the Advisory Agreements.
Investment management and sub-advisory fee rates
The Board reviewed and considered the contractual fee rates payable by the Fund to Funds Management under the Management Agreement, as well as the contractual fee rates payable by the Fund to Funds Management for class-level administrative services under a Class-Level Administration Agreement, which include, among other things, class-level transfer agency and sub-transfer agency costs (collectively, the “Management Rates”). The Board also reviewed and considered the contractual investment sub-advisory fee rates that are payable by Funds Management to the Sub-Adviser for investment sub-advisory services.
Among other information reviewed by the Board was a comparison of the Fund’s Management Rates with the average contractual investment management fee rates of funds in the expense Groups at a common asset level as well as transfer agency costs of the funds in the expense Groups. The Board noted that the Management Rates of the Fund were lower than the sum of these average rates for the Fund’s expense Groups for all share classes.
The Board also received and considered information about the portion of the total management fee that was retained by Funds Management after payment of the fee to the Sub-Adviser for sub-advisory services. In assessing the reasonableness of this amount, the Board received and evaluated information about the nature and extent of responsibilities retained and risks assumed by Funds Management and not delegated to or assumed by the Sub-Adviser, and about Funds Management’s on-going oversight services. Given the affiliation between Funds Management and the Sub-Adviser, the Board ascribed limited relevance to the allocation of fees between them.
The Board also received and considered information about the nature and extent of services offered and fee rates charged by Funds Management and the Sub-Adviser to other types of clients with investment strategies similar to those of the Fund. In this regard, the Board received information about the significantly greater scope of services, and compliance, reporting and other legal burdens and risks of managing mutual funds compared with those associated with managing assets of non-mutual fund clients such as institutional separate accounts.
Based on its consideration of the factors and information it deemed relevant, including those described here, the Board determined that the compensation payable to Funds Management under the Management Agreement and to the Sub-Adviser under the Sub-Advisory Agreement was reasonable.
Profitability
The Board received and considered information concerning the profitability of Funds Management, as well as the profitability of both WFAM and Wells Fargo & Co. (“Wells Fargo”) as a whole, from providing services to the Fund and the fund family as a whole. The Board noted that the Sub-Adviser’s profitability information with respect to providing services to the Fund was subsumed in the WFAM and Wells Fargo profitability analysis.
| | | | | | |
| Other information (unaudited) | | Wells Fargo Disciplined U.S. Core Fund | | | 39 | |
Funds Management reported on the methodologies and estimates used in calculating profitability, including a description of the methodology used to allocate certain expenses and recent enhancements made to the methodology. Among other things, the Board noted that the levels of profitability reported on a fund-by-fund basis varied widely, depending on factors such as the size and type of fund. Based on its review, the Board did not deem the profits reported by Funds Management, WFAM or Wells Fargo from services provided to the Fund to be at a level that would prevent it from approving the continuation of the Advisory Agreements.
Economies of scale
The Board considered the extent to which Funds Management may experience economies of scale in the provision of management services, and the extent to which scale benefits, if any, would be shared with shareholders. In particular, the Board noted the existence of breakpoints in the Fund’s management fee structure, which operate generally to reduce the Fund’s expense ratios as the Fund grows in size. It considered that, for a small fund or a fund that shrinks in size, breakpoints conversely can result in higher fee levels. The Board also considered that in addition to management fee breakpoints, competitive management fee rates set at the outset without regard to breakpoints and fee waiver and expense reimbursement arrangements, as well as investments in the business intended to enhance services available to Fund shareholders, are means of sharing potential economies of scale with shareholders of the Fund.
The Board concluded that the Fund’s fee and expense arrangements, including contractual breakpoints, constituted a reasonable approach to sharing potential economies of scale with the Fund and its shareholders.
Other benefits to Funds Management and the Sub-Adviser
The Board received and considered information regarding potential “fall-out” or ancillary benefits received by Funds Management and its affiliates, including the Sub-Adviser, as a result of their relationships with the Fund. Ancillary benefits could include, among others, benefits directly attributable to other relationships with the Fund and benefits potentially derived from an increase in Funds Management’s and the Sub-Adviser’s business as a result of their relationships with the Fund. The Board noted that various affiliates of Funds Management may receive distribution-related fees, shareholder servicing payments and sub-transfer agency fees in respect of shares sold or held through them and services provided.
The Board also reviewed information about soft dollar credits earned and utilized by the Sub-Adviser, fees earned by Funds Management and the Sub-Adviser from managing a private investment vehicle for the fund family’s securities lending collateral and commissions earned by an affiliated broker from portfolio transactions.
Based on its consideration of the factors and information it deemed relevant, including those described here, the Board did not find that any ancillary benefits received by Funds Management and its affiliates, including the Sub-Adviser, were unreasonable.
Conclusion
At the Meeting, after considering the above-described factors and based on its deliberations and its evaluation of the information described above, the Board unanimously approved the continuation of the Advisory Agreements for a one-year term and determined that the compensation payable to Funds Management and the Sub-Adviser under each of the Advisory Agreements was reasonable.
| | | | |
| 40 | | Wells Fargo Disciplined U.S. Core Fund | | Appendix A (unaudited) |
SALES CHARGE REDUCTIONS AND WAIVERS FOR CERTAIN INTERMEDIARIES
Ameriprise
Effective June 1, 2018, shareholders purchasing Fund shares through an Ameriprise Financial platform or account will be eligible only for the following Class A load waivers (front-end sales charge waivers), which may differ from those disclosed elsewhere in the Fund’s prospectus or Statement of Additional Information.
Front-end Sales Load Waivers on Class A Shares Available at Ameriprise Financial
| | • | | Employer-sponsored retirement plans (e.g., 401(k) plans, 457 plans, employer-sponsored 403(b) plans, profit sharing and money purchase pension plans and defined benefit plans). For purposes of this provision, employer-sponsored retirement plans do not include SEP IRAs, Simple IRAs or SAR-SEPs. |
| | • | | Shares purchased through an Ameriprise Financial investment advisory program (if an Advisory or similar share class for such investment advisory program is not available) |
| | • | | Shares purchased by third party investment advisors on behalf of their advisory clients through Ameriprise Financial’s platform (if an Advisory or similar share class for such investment advisory program is not available) |
| | • | | Shares purchased through reinvestment of distributions and dividend reinvestment when purchasing shares of the same Fund (but not any other fund within the same fund family) |
| | • | | Shares exchanged from Class C shares of the same fund in the month of or following the 10-year anniversary of the purchase date. To the extent that the Fund’s prospectus elsewhere provides for a waiver with respect to such shares following a shorter holding period, that waiver will apply to exchanges following such shorter period. To the extent that the Fund’s prospectus elsewhere provides for a waiver with respect to exchanges of Class C shares for load-waived shares, that waiver will also apply to such exchanges. |
| | • | | Employees and registered representatives of Ameriprise Financial or its affiliates and their immediate family members |
| | • | | Shares purchased by or through qualified accounts (including IRAs, Coverdell Education Savings Accounts, 401(k)s, 403(b) TSCAs subject to ERISA and defined benefit plans) that are held by a covered family member, defined as an Ameriprise financial advisor and/or the advisor’s spouse, advisor’s lineal ascendant (mother, father, grandmother, grandfather, great grandmother, great grandfather), advisor’s lineal descendant (son, step-son, daughter, step-daughter, grandson, granddaughter, great grandson, great granddaughter) or any spouse of a covered family member who is a lineal descendant |
| | • | | Shares purchased from the proceeds of redemptions within the same fund family, provided (1) the repurchase occurs within 90 days following the redemption, (2) the redemption and purchase occur in the same account, and (3) redeemed shares were subject to a front-end or deferred sales load (i.e. Rights of Reinstatement). Subject to the Fund’s policy regarding frequent purchases and redemptions of Fund shares, you may not be able to repurchase shares for the first 30 days after your redemption. |
Automatic Exchange of Class C Shares Available at Ameriprise Financial
| | • | | Class C shares will automatically exchange to Class A shares in the month of the 10-year anniversary of the purchase date. |
Merrill Lynch
Effective April 10, 2017, shareholders purchasing Fund shares through a Merrill Lynch platform or account will be eligible only for the following load waivers (front-end sales charge waivers and contingent deferred, or back-end, sales charge waivers) and discounts, which may differ from those disclosed elsewhere in the Fund’s prospectus or Statement of Additional Information.
Front-end Sales Load Waivers on Class A Shares available at Merrill Lynch
| | • | | Employer-sponsored retirement, deferred compensation and employee benefit plans (including health savings accounts) and trusts used to fund those plans, provided that the shares are not held in a commission-based brokerage account and shares are held for the benefit of the plan |
| | • | | Shares purchased by or through a 529 Plan |
| | • | | Shares purchased through a Merrill Lynch affiliated investment advisory program |
| | | | | | |
| Appendix A (unaudited) | | Wells Fargo Disciplined U.S. Core Fund | | | 41 | |
| | • | | Shares purchased by third party investment advisors on behalf of their advisory clients through Merrill Lynch’s platform |
| | • | | Shares of funds purchased through the Merrill Edge Self-Directed platform (if applicable) |
| | • | | Shares purchased through reinvestment of capital gains distributions and dividend reinvestment when purchasing shares of the same fund (but not any other fund within the fund family) |
| | • | | Shares exchanged from Class C (i.e. level-load) shares of the same fund in the month of or following the 10-year anniversary of the purchase date |
| | • | | Employees and registered representatives of Merrill Lynch or its affiliates and their family members, as defined by Merrill Lynch, which may differ from the definition of family member in the Fund’s prospectus. |
| | • | | Directors or Trustees of the Fund, and employees of the Fund’s investment adviser or any of its affiliates, as described in the Fund’s prospectus |
| | • | | Shares purchased from the proceeds of redemptions within the same fund family, provided (1) the repurchase occurs within 90 days following the redemption, (2) the redemption and purchase occur in the same account, and (3) redeemed shares were subject to a front-end or deferred sales load (known as Rights of Reinstatement). Subject to the Fund’s policy regarding frequent purchases and redemptions of Fund shares, you may not be able to repurchase shares for the first 30 days after your redemption. |
CDSC Waivers on A, B and C Shares available at Merrill Lynch
| | • | | Death or disability of the shareholder |
| | • | | Shares sold as part of a systematic withdrawal plan as described in the Fund’s prospectus |
| | • | | Return of excess contributions from an IRA Account |
| | • | | Shares sold as part of a required minimum distribution for IRA and retirement accounts due to the shareholder reaching age 70½ |
| | • | | Shares sold to pay Merrill Lynch fees but only if the transaction is initiated by Merrill Lynch |
| | • | | Shares acquired through a right of reinstatement |
| | • | | Shares held in retirement brokerage accounts, that are exchanged for a lower cost share class due to transfer to certain fee based accounts or platforms (applicable to A and C shares only) |
Front-end load Discounts Available at Merrill Lynch: Breakpoints, Rights of Accumulation & Letters of Intent
| | • | | Breakpoints as described in the Fund’s prospectus |
| | • | | Rights of Accumulation (ROA) which entitle shareholders to breakpoint discounts will be automatically calculated based on the aggregated holding of fund family assets held by accounts within the purchaser’s household at Merrill Lynch. Eligible fund family assets not held at Merrill Lynch may be included in the ROA calculation only if the shareholder notifies his or her financial advisor about such assets. |
| | • | | Letters of Intent (LOI) which allow for breakpoint discounts based on anticipated purchases within a fund family, through Merrill Lynch, over a 13-month period of time (if applicable) |
Morgan Stanley
Effective on or about July 1, 2018, shareholders purchasing Fund shares through a Morgan Stanley Wealth Management transactional brokerage account will be eligible only for the following Class A load waivers (front-end sales charge waivers), which may differ from and be more limited than those disclosed in the Fund’s prospectus or Statement of Additional Information.
Front-end Sales Load Waivers on Class A Shares Available at Morgan Stanley
| | • | | Employer-sponsored retirement plans (e.g., 401(k) plans, 457 plans, employer-sponsored 403(b) plans, profit sharing and money purchase pension plans and defined benefit plans). For purposes of this provision, employer-sponsored retirement plans do not include SEP IRAs, Simple IRAs, SAR-SEPs or Keogh plans. |
| | • | | Morgan Stanley employee and employee-related accounts according to Morgan Stanley’s account linking rules |
| | • | | Shares purchased through reinvestment of dividends and capital gains distributions when purchasing shares of the same fund |
| | • | | Shares purchased through a Morgan Stanley self-directed brokerage account |
| | | | |
| 42 | | Wells Fargo Disciplined U.S. Core Fund | | Appendix A (unaudited) |
| | • | | Class C (i.e., level-load) shares that are no longer subject to a contingent deferred sales charge and are exchanged to Class A shares of the same fund pursuant to Morgan Stanley Wealth Management’s share class exchange program. |
| | • | | Shares purchased from the proceeds of redemptions within the same fund family, provided (i) the repurchase occurs within 90 days following the redemption, (ii) the redemption and purchase occur in the same account, and (iii) redeemed shares were subject to a front-end or deferred sales charge. This waiver is subject to the Fund’s policy regarding frequent purchases and redemption of Fund shares, as discussed under “Account Information—Frequent Purchases and Redemptions of Fund Shares” in the Fund’s prospectus. |
This page is intentionally left blank.
This page is intentionally left blank.

For more information
More information about Wells Fargo Funds is available free upon request. To obtain literature, please write, email, visit the Fund’s website, or call:
Wells Fargo Funds
219967
Kansas City, MO 64121-9967
Website: wellsfargofunds.com
Individual investors: 1-800-222-8222
Retail investment professionals: 1-888-877-9275
Institutional investment professionals: 1-866-765-0778
This report and the financial statements contained herein are submitted for the general information of the shareholders of the Fund. If this report is used for promotional purposes, distribution of the report must be accompanied or preceded by a current prospectus. Before investing, please consider the investment objectives, risks, charges, and expenses of the investment. For a current prospectus and, if available, a summary prospectus, containing this information, call 1-800-222-8222 or visit the Fund’s website at wellsfargofunds.com. Read the prospectus carefully before you invest or send money.
Wells Fargo Asset Management (WFAM) is the trade name for certain investment advisory/management firms owned by Wells Fargo & Company. These firms include but are not limited to Wells Capital Management Incorporated and Wells Fargo Funds Management, LLC. Certain products managed by WFAM entities are distributed by Wells Fargo Funds Distributor, LLC (a broker/dealer and Member FINRA).
This material is for general informational and educational purposes only and is NOT intended to provide investment advice or a recommendation of any kind—including a recommendation for any specific investment, strategy, or plan.
NOT FDIC INSURED ◾ NO BANK GUARANTEE ◾ MAY LOSE VALUE
© 2018 Wells Fargo Funds Management, LLC. All rights reserved.
| | |
 | | 314794 09-18 A203/AR203 07-18 |
Annual Report
July 31, 2018

Wells Fargo Endeavor Select Fund


Reduce clutter. Save trees.
Sign up for electronic delivery of prospectuses and shareholder reports at wellsfargo.com/advantagedelivery
Contents
The views expressed and any forward-looking statements are as of July 31, 2018, unless otherwise noted, and are those of the Fund managers and/or Wells Fargo Funds Management, LLC. Discussions of individual securities, or the markets generally, or any Wells Fargo Fund are not intended as individual recommendations. Future events or results may vary significantly from those expressed in any forward-looking statements. The views expressed are subject to change at any time in response to changing circumstances in the market. Wells Fargo Funds Management, LLC and the Fund disclaim any obligation to publicly update or revise any views expressed or forward-looking statements.
NOT FDIC INSURED ◾ NO BANK GUARANTEE ◾ MAY LOSE VALUE
| | | | |
| 2 | | Wells Fargo Endeavor Select Fund | | Letter to shareholders (unaudited) |

Andrew Owen
President
Wells Fargo Funds
After advancing during the summer and fall of 2017 in a roughly synchronized way, economic growth and stock markets globally diverged during the first seven months of 2018.
Dear Shareholder:
We are pleased to offer you this annual report for the Wells Fargo Endeavor Select Fund for the 12-month period that ended July 31, 2018. After advancing during the summer and fall of 2017 in a roughly synchronized way, economic growth and stock markets globally diverged during the first seven months of 2018. For fixed-income investors, higher U.S. interest rates, rising inflation, and intensifying global geopolitical tensions tended to restrain taxable bond prices while high-yield and municipal bond investors generally enjoyed positive returns.
For the period, U.S. stocks, as measured by the S&P 500 Index,1 gained 16.24%, and international stocks, as measured by the MSCI ACWI ex USA Index (Net),2 added 5.94%. Emerging market stocks, as measured by the MSCI EM Index (Net),3 added 4.36%. In bond markets, the Bloomberg Barclays U.S. Aggregate Bond Index4 declined 0.80% while fixed-income investments outside the U.S. fell 0.27%, according to the Bloomberg Barclays Global Aggregate ex-USD Index.5 The Bloomberg Barclays Municipal Bond Index6 added 0.99%, and the ICE BofAML U.S. High Yield Index7 was up 2.49%.
Volatility increased as summer turned to fall in 2017, although data generally was favorable.
During the third quarter of 2017, investor expectations rose and fell amid shifting geopolitical tensions, particularly in Asia as North Korea’s nuclear aspirations and U.S./China trade rhetoric caused concerns. In the U.S., corporate earnings and consumer confidence improved. The U.S. Bureau of Economic Analysis reported that annualized U.S. gross domestic product (GDP) growth for the quarter was 2.8%. The rate of inflation was below the U.S. Federal Reserve’s (Fed’s) targets.
Economic momentum increased in Europe; the European Central Bank (ECB) held its rates steady at low levels and continued its quantitative easing bond-buying program with the goal of sparking economic activity. In emerging markets, many countries benefited from stronger currencies versus the U.S. dollar while commodity price increases benefited countries that rely on natural resources for exports.
| 1 | The S&P 500 Index consists of 500 stocks chosen for market size, liquidity, and industry group representation. It is a market-value-weighted index with each stock’s weight in the index proportionate to its market value. You cannot invest directly in an index. |
| 2 | The Morgan Stanley Capital International (MSCI) All Country World Index (ACWI) ex USA Index (Net) is a free-float-adjusted market-capitalization-weighted index that is designed to measure the equity market performance of developed markets, excluding the United States and Canada. Source: MSCI. MSCI makes no express or implied warranties or representations and shall have no liability whatsoever with respect to any MSCI data contained herein. The MSCI data may not be further redistributed or used as a basis for other indices or any securities or financial products. This report is not approved, reviewed, or produced by MSCI. You cannot invest directly in an index. |
| 3 | The MSCI Emerging Markets (EM) Index (Net) is a free-float-adjusted market-capitalization-weighted index that is designed to measure large- and mid-cap equity market performance of emerging markets. The MSCI EM Index (Net) consists of the following 24 emerging market country indices: Brazil, Chile, China, Colombia, Czech Republic, Egypt, Greece, Hungary, India, Indonesia, Korea, Malaysia, Mexico, Pakistan, Peru, the Philippines, Poland, Qatar, Russia, South Africa, Taiwan, Thailand, Turkey, and the United Arab Emirates. You cannot invest directly in an index. |
| 4 | The Bloomberg Barclays U.S. Aggregate Bond Index is a broad-based benchmark that measures the investment-grade, U.S. dollar-denominated, fixed-rate taxable bond market, including Treasuries, government-related and corporate securities, mortgage-backed securities (agency fixed-rate and hybrid adjustable-rate mortgage pass-throughs), asset-backed securities, and commercial mortgage-backed securities. You cannot invest directly in an index. |
| 5 | The Bloomberg Barclays Global Aggregate ex-USD Index is an unmanaged index that provides a broad-based measure of the global investment-grade fixed-income markets excluding the U.S. dollar-denominated debt market. You cannot invest directly in an index. |
| 6 | The Bloomberg Barclays Municipal Bond Index is an unmanaged index composed of long-term tax-exempt bonds with a minimum credit rating of Baa. You cannot invest directly in an index. |
| 7 | The ICE BofAML U.S. High Yield Index is a market-capitalization-weighted index of domestic and Yankee high-yield bonds. The index tracks the performance of high-yield securities traded in the U.S. bond market. You cannot invest directly in an index. Copyright 2018. ICE Data Indices, LLC. All rights reserved. |
| 8 | The Consumer Price Index For All Urban Consumers (CPI-U) measures the changes in the price of a basket of goods and services purchased by urban consumers. The urban consumer population is deemed by many as a better representative measure of the general public because most of the country’s population lives in highly populated areas, which represent close to 90% of the total population. You cannot invest directly in an index. |
| | | | | | |
| Letter to shareholders (unaudited) | | Wells Fargo Endeavor Select Fund | | | 3 | |
The fourth quarter of 2017 was characterized by continued optimism in the U.S.
By the end of 2017, some observers were describing conditions as a Goldilocks economic scenario: synchronized global growth, low inflation, and healthy corporate earnings, all supported abroad by a weaker U.S. dollar.
U.S. stocks continued to rally during the fourth quarter of 2017, boosted by favorable company earnings and the potential for tax reform and industry deregulation. The Fed increased rates by 25 basis points (bps; 100 bps equal 1.00%) in December. The annualized GDP growth rate for the fourth quarter was 2.3%.
Internationally, the Bank of England (BoE) raised interest rates in November 2017 to 0.50%, the first increase in more than 10 years and a move up from the 0.25% rate put in place after the Brexit vote to leave the European Union in June 2016. The pound gained against other currencies. Meanwhile, the ECB and the Bank of Japan maintained interest rate policies and bond-buying programs intended to spur business activities and enhance the attractiveness of equity investments. The People’s Bank of China (PBOC) also continued policies that encouraged business investment. International equity markets, particularly emerging markets, continued to show strength.
Volatility reemerged during the first quarter of 2018 as economic signals were mixed.
The first quarter of 2018 began with stock market gains in January following U.S. tax reform that lowered rates for individuals and corporations and deregulation advanced in some economic sectors. Then, investor optimism was supplanted by several concerns. Trade tensions intensified, particularly between the U.S. and China. The U.S. threatened to impose tariffs on a broad range of imported products. Increasing interest rates and inflation also caused concern. During February 2018, the U.S. stock market endured a loss of more than 10% before recovering in March and April. The S&P 500 Index closed the first quarter with a negative return, the first negative quarterly return for the index since 2014.
The Fed increased the federal funds rate by 25 bps in March 2018 and the rate of inflation reached the Fed’s 2% target for the first time in a year. The unemployment rate fell to 4.1%. The third revision of first-quarter GDP growth by the U.S. Bureau of Economic Analysis released during June 2018 was lowered to 2.0%.
Overseas, investment market returns reversed the strong returns of 2017. After having gained 27.19% for the 12-month period that ended December 31, 2017, the MSCI ACWI ex USA Index (Net) fell 1.46% for the 7-month period that ended July 31, 2018. The U.S. dollar strengthened relative to local currencies, which served to restrain returns.
Global trade tensions escalated during the second quarter and into the third quarter of 2018.
Global trade tensions escalated as the second quarter of 2018 opened and equity markets fell in response before resuming upward momentum later in April. The U.S. government imposed tariffs on products and commodities imported from other markets in North America, Europe, and Asia. In retaliation, governments imposed tariffs on U.S. products and commodities. In addition, the U.S. pushed its North American neighbors to renegotiate the North American Free Trade Agreement, furthering trade tensions and investor uncertainty.
The CPI-U8 added 0.2% in May after a similar increase in April. On a year-over-year basis, the all-items index rose 2.8% for the 12 months that ended May 31, continuing its upward trend since the beginning of the year. The index for all items less food and energy rose 2.2% for the same 12-month period. Interest rates generally increased and the bond markets tended to decline.
During February 2018, the U.S. stock market endured a loss of more than 10% before recovering in March and April.
| | | | |
| 4 | | Wells Fargo Endeavor Select Fund | | Letter to shareholders (unaudited) |
During June 2018, the Fed increased the federal funds rate by 25 bps. Investment markets began to anticipate two more rate increases in 2018. Long-term interest rates in the U.S. trended higher—rates on the 10-year and 30-year Treasury bonds moved from 2.46% and 2.81%, respectively, on January 1, 2018, to 2.96% and 3.08%, respectively, on July 31, 2018. While higher at the end of the period, rates were off their peak levels on May 17, 2018, of 3.11% and 3.25%, respectively. Investors became more aware of and concerned about the potential for an inverted yield curve—sometimes a recession signal—as short-term rates increased more quickly than long-term rates.
The unemployment rate fell to 3.9% in July after ticking up slightly in June from May’s 3.8% level, according to the U.S. Department of Labor. The annualized rate of GDP growth for the second quarter of 2018 was reported in July to be 4.1%, the highest level since the third quarter of 2014, according to the U.S. Bureau of Economic Analysis.
Internationally, the prospects for a smooth U.K. Brexit agreement was cast into doubt as members of Prime Minister Theresa May’s negotiating team resigned. Despite the uncertainty, the period closed with expectations that the BoE’s Monetary Policy Committee in July would announce an increase in its key interest rate to 0.75%, which it did in early August.
Meanwhile, central banks in Europe and Japan maintained low interest rates and accommodative monetary policies. Amid rising trade uncertainty, PBOC monetary policies shifted with cuts to reserve requirement ratios and implementation of supportive measures such as accelerated infrastructure spending and tax cuts for small and medium enterprises and for individuals. Nevertheless, a strengthening U.S. dollar and the tensions associated with trade policies remained headwinds for investors overseas.
Don’t let short-term uncertainty derail long-term investment goals.
Periods of investment uncertainty can present challenges, but experience has taught us that maintaining long-term investment goals can be an effective way to plan for the future. To help you create a sound strategy based on your personal goals and risk tolerance, Wells Fargo Funds offers more than 100 mutual funds spanning a wide range of asset classes and investment styles. Although diversification cannot guarantee an investment profit or prevent losses, we believe it can be an effective way to manage investment risk and potentially smooth out overall portfolio performance. We encourage investors to know their investments and to understand that appropriate levels of risk-taking may unlock opportunities.
Thank you for choosing to invest with Wells Fargo Funds. We appreciate your confidence in us and remain committed to helping you meet your financial needs.
Sincerely,

Andrew Owen
President
Wells Fargo Funds
| | | | | | |
| Letter to shareholders (unaudited) | | Wells Fargo Endeavor Select Fund | | | 5 | |
Notice to shareholders
At a meeting held on August 14-15, 2018, the Board of Trustees of the Fund approved the following policy which will be effective on or about February 5, 2019:
Class C shares will convert automatically into Class A shares ten years after the initial date of purchase or, if you acquired your Class C shares through an exchange or conversion from another share class, ten years after the date you acquired your Class C shares. When Class C shares that you acquired through a purchase or exchange convert, any other Class C shares that you purchased with reinvested dividends and distributions also will convert into Class A shares on a pro rata basis. A shorter holding period may also apply depending on your intermediary. Please see “Appendix A—Sales Charge Reductions and Waivers for Certain Intermediaries” in the Fund’s prospectus or at the end of this report.
For further information about your Fund, contact your investment professional, visit our website at wellsfargofunds.com, or call us directly at 1-800-222-8222.
| | | | |
| 6 | | Wells Fargo Endeavor Select Fund | | Performance highlights (unaudited) |
Investment objective
The Fund seeks long-term capital appreciation.
Manager
Wells Fargo Funds Management, LLC
Subadviser
Wells Capital Management Incorporated
Portfolio managers
Michael T. Smith, CFA®
Christopher J. Warner, CFA®
Average annual total returns (%) as of July 31, 2018
| | | | | | | | | | | | | | | | | | | | | | | | | | | | | | | | | | |
| | | | | Including sales charge | | | Excluding sales charge | | | Expense ratios1 (%) | |
| | | Inception date | | 1 year | | | 5 year | | | 10 year | | | 1 year | | | 5 year | | | 10 year | | | Gross | | | Net2 | |
| Class A (STAEX) | | 12-29-2000 | | | 20.09 | | | | 13.72 | | | | 8.65 | | | | 27.35 | | | | 15.07 | | | | 9.30 | | | | 1.22 | | | | 1.20 | |
| Class C (WECCX) | | 12-29-2000 | | | 25.43 | | | | 14.22 | | | | 8.49 | | | | 26.43 | | | | 14.22 | | | | 8.49 | | | | 1.97 | | | | 1.95 | |
| Administrator Class (WECDX) | | 4-8-2005 | | | – | | | | – | | | | – | | | | 27.55 | | | | 15.34 | | | | 9.56 | | | | 1.14 | | | | 1.00 | |
| Institutional Class (WFCIX) | | 4-8-2005 | | | – | | | | – | | | | – | | | | 28.01 | | | | 15.57 | | | | 9.78 | | | | 0.89 | | | | 0.80 | |
| Russell 1000® Growth Index3 | | – | | | – | | | | – | | | | – | | | | 22.84 | | | | 15.83 | | | | 12.37 | | | | – | | | | – | |
Figures quoted represent past performance, which is no guarantee of future results, and do not reflect taxes that a shareholder may pay on fund distributions or the redemption of fund shares. Investment return and principal value of an investment will fluctuate so that an investor’s shares, when redeemed, may be worth more or less than their original cost. Performance shown without sales charges would be lower if sales charges were reflected. Current performance may be lower or higher than the performance data quoted, which assumes the reinvestment of dividends and capital gains. Current month-end performance is available on the Fund’s website, wellsfargofunds.com.
Please keep in mind that high double-digit returns were primarily achieved during favorable market conditions. You should not expect that such favorable returns can be consistently achieved. A fund’s performance, especially for short time periods, should not be the sole factor in making your investment decision.
Index returns do not include transaction costs associated with buying and selling securities, any mutual fund fees or expenses, or any taxes. It is not possible to invest directly in an index.
For Class A shares, the maximum front-end sales charge is 5.75%. For Class C shares, the maximum contingent deferred sales charge is 1.00%. Performance including a contingent deferred sales charge assumes the sales charge for the corresponding time period. Administrator Class and Institutional Class shares are sold without a front-end sales charge or contingent deferred sales charge.
Stock values fluctuate in response to the activities of individual companies and general market and economic conditions. Certain investment strategies tend to increase the total risk of an investment (relative to the broader market). The Fund is exposed to foreign investment risk, focused portfolio risk, and smaller-company securities risk. Consult the Fund’s prospectus for additional information on these and other risks.
Please see footnotes on page 7.
| | | | | | |
| Performance highlights (unaudited) | | Wells Fargo Endeavor Select Fund | | | 7 | |
|
| Growth of $10,000 investment as of July 31, 20184 |
|
 |
| 1 | Reflects the expense ratios as stated in the most recent prospectuses. The expense ratios shown are subject to change and may differ from the annualized expense ratios shown in the financial highlights of this report. |
| 2 | The manager has contractually committed through November 30, 2018, to waive fees and/or reimburse expenses to the extent necessary to cap the Fund’s Total Annual Fund Operating Expenses After Fee Waivers at the amounts shown. After this time, the cap may be increased or the commitment to maintain the cap may be terminated only with the approval of the Board of Trustees. Brokerage commissions, stamp duty fees, interest, taxes, acquired fund fees and expenses (if any), and extraordinary expenses are excluded from the expense cap. Without this cap, the Fund’s returns would have been lower. The expense ratio paid by an investor is the net expense ratio (the total annual fund operating expenses after fee waivers) as stated in the prospectuses. |
| 3 | The Russell 1000® Growth Index measures the performance of those Russell 1000 companies with higher price/book ratios and higher forecasted growth values. You cannot invest directly in an index. |
| 4 | The chart compares the performance of Class A shares for the most recent ten years with the Russell 1000® Growth Index. The chart assumes a hypothetical investment of $10,000 in Class A shares and reflects all operating expenses and assumes the maximum initial sales charge of 5.75%. |
| 5 | The ten largest holdings, excluding cash, cash equivalents and any money market funds, are calculated based on the value of the investments divided by total net assets of the Fund. Holdings are subject to change and may have changed since the date specified. |
| 6 | Amounts are calculated based on the total long-term investments of the Fund. These amounts are subject to change and may have changed since the date specified. |
| | | | |
| 8 | | Wells Fargo Endeavor Select Fund | | Performance highlights (unaudited) |
MANAGER’S DISCUSSION
Fund highlights
| ∎ | | The Fund outperformed its benchmark, the Russell 1000® Growth Index, for the 12-month period that ended July 31, 2018. |
| ∎ | | Stock selection in the consumer discretionary sector contributed to performance. |
| ∎ | | Stock selection in the health care sector detracted from performance. |
For much of the period, bullish sentiment for U.S. equities was apparent as global growth was synchronized, corporate earnings were strong, widespread tax cuts had been passed, and deregulations were being enacted. More recently, however, a combination of crosscurrents from macro and geopolitical sources caused a downshift in growth expectations. The most significant change to outlooks came from markets outside the U.S. Arguably the biggest factor precipitating the downshift in growth came from concerns around global trade. The U.S. government expanded tariffs on goods from around the world, with a particular focus on China. This prompted retaliation from China and other trading partners, heightening fears of a possible trade war. These recent global developments highlighted a dynamic that we have long appreciated and incorporated into our portfolio positioning: true organic growth remains scarce and the firms that can make their own luck will be rewarded by investors with continued and new investments.
| | | | |
| Ten largest holdings (%) as of July 31, 20185 | |
Amazon.com Incorporated | | | 7.87 | |
Microsoft Corporation | | | 7.49 | |
Visa Incorporated Class A | | | 5.40 | |
Alphabet Incorporated Class A | | | 5.39 | |
UnitedHealth Group Incorporated | | | 5.32 | |
Union Pacific Corporation | | | 3.50 | |
First Data Corporation Class A | | | 3.50 | |
Waste Connections Incorporated | | | 3.45 | |
Salesforce.com Incorporated | | | 3.27 | |
The Home Depot Incorporated | | | 3.25 | |
The Fund’s consumer discretionary holdings contributed to relative performance.
Within the consumer discretionary sector, strength was visible among internet and direct-marketing retail holdings and the portfolio management team’s security selection in this industry proved additive to returns. Shares of Amazon.com, Incorporated, appreciated over the past year as the company remains levered to powerful secular growth trends. Over the past 12 months, sales continued to accelerate while profits soared to a record level. The company also announced plans to increase the price of Amazon Prime subscriptions by 20%, while subscribers topped 100 million for the first time. Additionally, the company has made strategic acquisitions, such as Whole Foods Market, Incorporated. Amazon has continued to
benefit from the powerful shift to online retail spending, while Amazon Web Services (AWS) has become the dominant provider of cloud-computing services. AWS was the largest driver of profit gains during the year. We continue to be impressed with Amazon’s growing scale in a number of large market opportunities.
Despite weakness toward the end of the period, Netflix, Incorporated, also proved additive to returns within the consumer discretionary sector. Netflix is the leading subscription video on demand (SVOD) provider with over 125 million global subscribers. SVOD is taking viewing share from traditional video viewing due to convenience, value proposition, and original content. Over the past 12 months, Netflix posted solid growth in its total streaming subscribers despite raising prices. The company attributed the net additions to content and worldwide adoption of internet video products. Netflix’s strategy is to invest aggressively in original programming to drive additional subscribers, which in turn provides more capital to reinvest in original programming.
Please see footnotes on page 7.
| | | | | | |
| Performance highlights (unaudited) | | Wells Fargo Endeavor Select Fund | | | 9 | |
|
| Sector distribution as of July 31, 20186 |
|
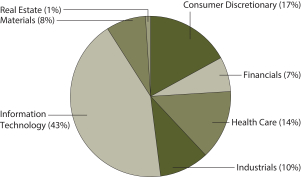 |
Stock selection in the health care sector detracted from performance.
Among the Fund’s health care holdings, Celgene Corporation detracted from performance. Celgene, a global biopharmaceutical company, has a strong franchise with several drugs, including Revlimid to treat multiple myeloma and Otezla to treat psoriasis. While Revlimid has been the largest contributor to the company’s recent success and expectations for growth of Revlimid remain on track, this blockbuster drug will come off patent by the middle of 2020. As such, the company has been investing in several other drug-development trials. Over the past 12 months, the stock came under
pressure when it was announced that the development of a drug to treat multiple sclerosis had its filing refused by the FDA. While Celgene intends to refile with additional data, the setback resulted in a downward revision to the company’s longer-term earnings profile.
Additionally within the sector, our position in Hologic, Incorporated, weighed on returns over the past year. Hologic is a medical device company that specializes in imaging, diagnostics, and gynecology surgical tools. The company, a leader in mammography, has developed a breast-imaging device that uses a new technology to produce a 3D image. This 3D screening test is the only one approved by the FDA and is considered superior to standard mammography. The stock came under pressure after the company missed revenue and earnings projections. The results were primarily the result of a slowdown in the surgical business. The other issue affecting Hologic over the past 12 months has been the company’s Cynosure business. Cynosure, which is a noninvasive body-contouring business, had been acquired by Hologic in an effort to diversify revenue sources. The integration of the acquisition has been slower than expected, prompting investor concern and weakness in the stock.
We remain somewhat cautious given geopolitical and macroeconomic uncertainties; however, we maintain confidence in the Fund’s positioning.
Looking broadly at financial markets through our lens of a bottom-up, fundamentally based investment process, we see ample reasons to maintain a cautious stance given factors such as trade wars, political instability, softness in China, and a hawkish Fed. We are, however, excited about companies held in the portfolio—those with organic growth and strategies that we believe are on the right side of change. Yet, with uncertainties on the rise, it may be prudent for investors to be mindful of downside risks and to moderate return expectations.
From a portfolio positioning standpoint, our strategy is to stay balanced. The portfolio includes a substantial allocation to stocks we consider to be core holdings, companies that we believe have consistent and durable fundamentals. These are businesses that our analysis suggests have profitable models, competitive advantages, and long runways of visible growth. On the other side, we own companies we consider to have idiosyncratic qualities. These are developing situations that our process finds to have unique drivers that are not yet clearly visible to other investors. These companies typically trade at reasonable valuations and, importantly, should buffer volatility if the market rotates out of momentum and high-beta factors. Finally, we are being very selective in the areas of our universe where valuations are approaching extremes, including certain cloud software, medical device, and biotechnology companies. The portfolio holds companies that we believe possess strong fundamentals and growth prospect, and yet it trades at a reasonable valuation profile. This is an attractive structure that has us excited to seek continued competitive performance for investors.
Please see footnotes on page 7.
| | | | |
| 10 | | Wells Fargo Endeavor Select Fund | | Fund expenses (unaudited) |
As a shareholder of the Fund, you incur two types of costs: (1) transaction costs, including sales charges (loads) on purchase payments and contingent deferred sales charges (if any) on redemptions and (2) ongoing costs, including management fees, distribution (12b-1) and/or shareholder servicing fees, and other Fund expenses. This example is intended to help you understand your ongoing costs (in dollars) of investing in the Fund and to compare these costs with the ongoing costs of investing in other mutual funds.
The example is based on an investment of $1,000 invested at the beginning of the six-month period and held for the entire period from February 1, 2018 to July 31, 2018.
Actual expenses
The “Actual” line of the table below provides information about actual account values and actual expenses. You may use the information in this line, together with the amount you invested, to estimate the expenses that you paid over the period. Simply divide your account value by $1,000 (for example, an $8,600 account value divided by $1,000 = 8.6), then multiply the result by the number in the “Actual” line under the heading entitled “Expenses paid during period” for your applicable class of shares to estimate the expenses you paid on your account during this period.
Hypothetical example for comparison purposes
The “Hypothetical” line of the table below provides information about hypothetical account values and hypothetical expenses based on the Fund’s actual expense ratio and an assumed rate of return of 5% per year before expenses, which is not the Fund’s actual return. The hypothetical account values and expenses may not be used to estimate the actual ending account balance or expenses you paid for the period. You may use this information to compare the ongoing costs of investing in the Fund and other funds. To do so, compare this 5% hypothetical example with the 5% hypothetical examples that appear in the shareholder reports of the other funds.
Please note that the expenses shown in the table are meant to highlight your ongoing costs only and do not reflect any transactional costs, such as sales charges (loads) and contingent deferred sales charges. Therefore, the “Hypothetical” line of the table is useful in comparing ongoing costs only and will not help you determine the relative total costs of owning different funds. In addition, if these transactional costs were included, your costs would have been higher.
| | | | | | | | | | | | | | | | |
| | | Beginning
account value
2-1-2018 | | | Ending
account value
7-31-2018 | | | Expenses
paid during
the period¹ | | | Annualized net
expense ratio | |
Class A | | | | | | | | | | | | | | | | |
Actual | | $ | 1,000.00 | | | $ | 1,053.63 | | | $ | 6.21 | | | | 1.20 | % |
Hypothetical (5% return before expenses) | | $ | 1,000.00 | | | $ | 1,019.16 | | | $ | 6.11 | | | | 1.20 | % |
Class C | | | | | | | | | | | | | | | | |
Actual | | $ | 1,000.00 | | | $ | 1,050.41 | | | $ | 10.08 | | | | 1.95 | % |
Hypothetical (5% return before expenses) | | $ | 1,000.00 | | | $ | 1,015.38 | | | $ | 9.90 | | | | 1.95 | % |
Administrator Class | | | | | | | | | | | | | | | | |
Actual | | $ | 1,000.00 | | | $ | 1,055.27 | | | $ | 5.18 | | | | 1.00 | % |
Hypothetical (5% return before expenses) | | $ | 1,000.00 | | | $ | 1,020.16 | | | $ | 5.09 | | | | 1.00 | % |
Institutional Class | | | | | | | | | | | | | | | | |
Actual | | $ | 1,000.00 | | | $ | 1,057.00 | | | $ | 4.15 | | | | 0.80 | % |
Hypothetical (5% return before expenses) | | $ | 1,000.00 | | | $ | 1,021.17 | | | $ | 4.08 | | | | 0.80 | % |
| 1 | Expenses paid is equal to the annualized net expense ratio of each class multiplied by the average account value over the period, multiplied by the number of days in the most recent fiscal half-year divided by the number of days in the fiscal year (to reflect the one-half-year period). |
| | | | | | |
| Portfolio of investments—July 31, 2018 | | Wells Fargo Endeavor Select Fund | | | 11 | |
| | | | | | | | | | | | | | | | |
| Security name | | | | | | | | Shares | | | Value | |
|
Common Stocks: 98.22% | |
| | | | |
Consumer Discretionary: 16.46% | | | | | | | | | | | | | | | | |
| | | | |
| Auto Components: 1.89% | | | | | | | | | | | | | | | | |
Aptiv plc | | | | | | | | | | | 29,800 | | | $ | 2,922,486 | |
| | | | | | | | | | | | | | | | |
| | | | |
| Automobiles: 1.47% | | | | | | | | | | | | | | | | |
Ferrari NV « | | | | | | | | | | | 17,200 | | | | 2,281,064 | |
| | | | | | | | | | | | | | | | |
| | | | |
| Internet & Direct Marketing Retail: 9.85% | | | | | | | | | | | | | | | | |
Amazon.com Incorporated † | | | | | | | | | | | 6,853 | | | | 12,180,796 | |
Netflix Incorporated † | | | | | | | | | | | 9,100 | | | | 3,070,795 | |
| |
| | | | 15,251,591 | |
| | | | | | | | | | | | | | | | |
| | | | |
| Specialty Retail: 3.25% | | | | | | | | | | | | | | | | |
The Home Depot Incorporated | | | | | | | | | | | 25,483 | | | | 5,033,402 | |
| | | | | | | | | | | | | | | | |
| | | | |
Financials: 6.77% | | | | | | | | | | | | | | | | |
| | | | |
| Capital Markets: 6.77% | | | | | | | | | | | | | | | | |
Intercontinental Exchange Incorporated | | | | | | | | | | | 52,415 | | | | 3,873,993 | |
Raymond James Financial Incorporated | | | | | | | | | | | 40,700 | | | | 3,727,713 | |
S&P Global Incorporated | | | | | | | | | | | 14,378 | | | | 2,881,926 | |
| |
| | | | 10,483,632 | |
| | | | | | | | | | | | | | | | |
| | | | |
Health Care: 13.68% | | | | | | | | | | | | | | | | |
| | | | |
| Biotechnology: 1.65% | | | | | | | | | | | | | | | | |
Celgene Corporation † | | | | | | | | | | | 28,379 | | | | 2,556,664 | |
| | | | | | | | | | | | | | | | |
| | | | |
| Health Care Equipment & Supplies: 6.71% | | | | | | | | | | | | | | | | |
Baxter International Incorporated | | | | | | | | | | | 31,800 | | | | 2,303,910 | |
Boston Scientific Corporation † | | | | | | | | | | | 95,300 | | | | 3,203,033 | |
Edwards Lifesciences Corporation † | | | | | | | | | | | 18,200 | | | | 2,592,590 | |
Hologic Incorporated † | | | | | | | | | | | 53,300 | | | | 2,287,103 | |
| |
| | | | 10,386,636 | |
| | | | | | | | | | | | | | | | |
| | | | |
| Health Care Providers & Services: 5.32% | | | | | | | | | | | | | | | | |
UnitedHealth Group Incorporated | | | | | | | | | | | 32,500 | | | | 8,229,650 | |
| | | | | | | | | | | | | | | | |
| | | | |
Industrials: 9.82% | | | | | | | | | | | | | | | | |
| | | | |
| Commercial Services & Supplies: 6.32% | | | | | | | | | | | | | | | | |
Cintas Corporation | | | | | | | | | | | 21,700 | | | | 4,437,216 | |
Waste Connections Incorporated | | | | | | | | | | | 68,860 | | | | 5,344,225 | |
| |
| | | | 9,781,441 | |
| | | | | | | | | | | | | | | | |
| | | | |
| Road & Rail: 3.50% | | | | | | | | | | | | | | | | |
Union Pacific Corporation | | | | | | | | | | | 36,200 | | | | 5,426,018 | |
| | | | | | | | | | | | | | | | |
| | | | |
Information Technology: 42.79% | | | | | | | | | | | | | | | | |
| | | | |
| Internet Software & Services: 13.02% | | | | | | | | | | | | | | | | |
Alibaba Group Holding Limited ADR † | | | | | | | | | | | 17,000 | | | | 3,182,910 | |
Alphabet Incorporated Class A † | | | | | | | | | | | 6,799 | | | | 8,343,869 | |
The accompanying notes are an integral part of these financial statements.
| | | | |
| 12 | | Wells Fargo Endeavor Select Fund | | Portfolio of investments—July 31, 2018 |
| | | | | | | | | | | | | | | | |
| Security name | | | | | | | | Shares | | | Value | |
|
| Internet Software & Services (continued) | |
Alphabet Incorporated Class C † | | | | | | | | | | | 1,350 | | | $ | 1,643,301 | |
Facebook Incorporated Class A † | | | | | | | | | | | 14,549 | | | | 2,510,866 | |
MercadoLibre Incorporated | | | | | | | | | | | 6,400 | | | | 2,194,624 | |
Tencent Holdings Limited ADR | | | | | | | | | | | 50,000 | | | | 2,285,000 | |
| |
| | | | 20,160,570 | |
| | | | | | | | | | | | | | | | |
| | | | |
| IT Services: 15.94% | | | | | | | | | | | | | | | | |
Fidelity National Information Services Incorporated | | | | | | | | | | | 23,700 | | | | 2,444,181 | |
First Data Corporation Class A † | | | | | | | | | | | 232,800 | | | | 5,414,928 | |
FleetCor Technologies Incorporated † | | | | | | | | | | | 18,900 | | | | 4,101,300 | |
PayPal Holdings Incorporated † | | | | | | | | | | | 21,800 | | | | 1,790,652 | |
Total System Services Incorporated | | | | | | | | | | | 28,100 | | | | 2,572,274 | |
Visa Incorporated Class A | | | | | | | | | | | 61,158 | | | | 8,362,745 | |
| |
| | | | 24,686,080 | |
| | | | | | | | | | | | | | | | |
| | | | |
| Software: 13.83% | | | | | | | | | | | | | | | | |
Activision Blizzard Incorporated | | | | | | | | | | | 40,400 | | | | 2,966,168 | |
Microsoft Corporation | | | | | | | | | | | 109,300 | | | | 11,594,544 | |
Nintendo Company Limited | | | | | | | | | | | 41,800 | | | | 1,783,606 | |
Salesforce.com Incorporated † | | | | | | | | | | | 36,900 | | | | 5,060,835 | |
| |
| | | | 21,405,153 | |
| | | | | | | | | | | | | | | | |
| | | | |
Materials: 7.55% | | | | | | | | | | | | | | | | |
| | | | |
| Chemicals: 5.23% | | | | | | | | | | | | | | | | |
Air Products & Chemicals Incorporated | | | | | | | | | | | 22,500 | | | | 3,693,825 | |
The Sherwin-Williams Company | | | | | | | | | | | 10,000 | | | | 4,407,300 | |
| |
| | | | 8,101,125 | |
| | | | | | | | | | | | | | | | |
| | | | |
| Construction Materials: 2.32% | | | | | | | | | | | | | | | | |
Vulcan Materials Company | | | | | | | | | | | 32,000 | | | | 3,584,000 | |
| | | | | | | | | | | | | | | | |
| | | | |
Real Estate: 1.15% | | | | | | | | | | | | | | | | |
| | | | |
| Equity REITs: 1.15% | | | | | | | | | | | | | | | | |
SBA Communications Corporation † | | | | | | | | | | | 11,200 | | | | 1,772,400 | |
| | | | | | | | | | | | | | | | |
| |
Total Common Stocks (Cost $90,549,410) | | | | 152,061,912 | |
| | | | | | | | | | | | | | | | |
| | | | |
| | | Yield | | | | | | | | | | |
| Short-Term Investments: 3.08% | |
|
| Investment Companies: 3.08% | |
Securities Lending Cash Investment LLC (l)(r)(u) | | | 2.10 | % | | | | | | | 2,171,758 | | | | 2,171,975 | |
Wells Fargo Government Money Market Fund Select Class (l)(u) | | | 1.83 | | | | | | | | 2,588,003 | | | | 2,588,003 | |
| |
Total Short-Term Investments (Cost $4,759,978) | | | | 4,759,978 | |
| | | | | | | | | | | | | | | | |
| | | | | | | | |
| Total investments in securities (Cost $95,309,388) | | | 101.30 | % | | | 156,821,890 | |
Other assets and liabilities, net | | | (1.30 | ) | | | (2,006,504 | ) |
| | | | | | | | |
| Total net assets | | | 100.00 | % | | $ | 154,815,386 | |
| | | | | | | | |
The accompanying notes are an integral part of these financial statements.
| | | | | | |
| Portfolio of investments—July 31, 2018 | | Wells Fargo Endeavor Select Fund | | | 13 | |
| « | All or a portion of this security is on loan. |
| † | Non-income-earning security |
| (l) | The issuer of the security is an affiliated person of the Fund as defined in the Investment Company Act of 1940. |
| (r) | The investment is a non-registered investment company purchased with cash collateral received from securities on loan. |
| (u) | The rate represents the 7-day annualized yield at period end. |
Abbreviations:
| ADR | American depositary receipt |
| REIT | Real estate investment trust |
Investments in Affiliates
An affiliated investment is an investment in which the Fund owns at least 5% of the outstanding voting shares of the issuer or as a result of other relationships, such as the Fund and the issuer having the same investment manager. Transactions with issuers that were either affiliated persons of the Fund at the beginning of the period or the end of the period were as follows:
| | | | | | | | | | | | | | | | | | | | | | | | | | | | | | | | | | | | |
| | | Shares,
beginning of
period | | | Shares
purchased | | | Shares
sold | | | Shares,
end of
period | | | Net
realized
gains
(losses) | | | Net
change in
unrealized
gains
(losses) | | | Income
from
affiliated
securities | | | Value,
end
of period | | | % of
net
assets | |
Short-Term Investments | | | | | | | | | | | | | | | | | | | | | | | | | | | | | | | | | | | | |
Investment Companies | | | | | | | | | | | | | | | | | | | | | | | | | | | | | | | | | | | | |
Securities Lending Cash Investment LLC | | | 0 | | | | 83,846,076 | | | | 81,674,318 | | | | 2,171,758 | | | $ | 0 | | | $ | 0 | | | $ | 6,803 | | | $ | 2,171,975 | | | | | |
Wells Fargo Government Money Market Fund Select Class | | | 4,487,680 | | | | 66,601,871 | | | | 68,501,548 | | | | 2,588,003 | | | | 0 | | | | 0 | | | | 34,047 | | | | 2,588,003 | | | | | |
| | | | | | | | | | | | | | | | | | | | | | | | | | | | | | | | | | | | |
| | | | | | | | | | | | | | | | | | $ | 0 | | | $ | 0 | | | $ | 40,850 | | | $ | 4,759,978 | | | | 3.08 | % |
| | | | | | | | | | | | | | | | | | | | | | | | | | | | | | | | | | | | |
The accompanying notes are an integral part of these financial statements.
| | | | |
| 14 | | Wells Fargo Endeavor Select Fund | | Statement of assets and liabilities—July 31, 2018 |
| | | | |
| | | | |
| |
Assets | | | | |
Investments in unaffiliated securities (including $2,161,706 of securities loaned), at value (cost $90,549,410) | | $ | 152,061,912 | |
Investments in affiliated securities, at value (cost $4,759,978) | | | 4,759,978 | |
Receivable for investments sold | | | 145,482 | |
Receivable for Fund shares sold | | | 461,895 | |
Receivable for dividends | | | 31,844 | |
Receivable for securities lending income | | | 381 | |
Prepaid expenses and other assets | | | 138,137 | |
| | | | |
Total assets | | | 157,599,629 | |
| | | | |
| |
Liabilities | | | | |
Payable upon receipt of securities loaned | | | 2,171,975 | |
Payable for Fund shares redeemed | | | 475,498 | |
Management fee payable | | | 42,121 | |
Administration fees payable | | | 18,953 | |
Distribution fee payable | | | 2,370 | |
Trustees’ fees and expenses payable | | | 1,510 | |
Accrued expenses and other liabilities | | | 71,816 | |
| | | | |
Total liabilities | | | 2,784,243 | |
| | | | |
Total net assets | | $ | 154,815,386 | |
| | | | |
| |
NET ASSETS CONSIST OF | | | | |
Paid-in capital | | $ | 70,667,999 | |
Accumulated net realized gains on investments | | | 22,634,885 | |
Net unrealized gains on investments | | | 61,512,502 | |
| | | | |
Total net assets | | $ | 154,815,386 | |
| | | | |
| |
COMPUTATION OF NET ASSET VALUE AND OFFERING PRICE PER SHARE | | | | |
Net assets – Class A | | $ | 16,300,556 | |
Shares outstanding – Class A1 | | | 1,728,201 | |
Net asset value per share – Class A | | | $9.43 | |
Maximum offering price per share – Class A2 | | | $10.01 | |
Net assets – Class C | | $ | 3,791,744 | |
Shares outstanding – Class C1 | | | 586,926 | |
Net asset value per share – Class C | | | $6.46 | |
Net assets – Administrator Class | | $ | 3,067,948 | |
Shares outstanding – Administrator Class1 | | | 303,096 | |
Net asset value per share – Administrator Class | | | $10.12 | |
Net assets – Institutional Class | | $ | 131,655,138 | |
Shares outstanding – Institutional Class1 | | | 12,461,178 | |
Net asset value per share – Institutional Class | | | $10.57 | |
| 1 | The Fund has an unlimited number of authorized shares. |
| 2 | Maximum offering price is computed as 100/94.25 of net asset value. On investments of $50,000 or more, the offering price is reduced. |
The accompanying notes are an integral part of these financial statements.
| | | | | | |
| Statement of operations—year ended July 31, 2018 | | Wells Fargo Endeavor Select Fund | | | 15 | |
| | | | |
| | | | |
| |
Investment income | | | | |
Dividends (net of foreign withholding taxes of $8,959) | | $ | 1,118,033 | |
Income from affiliated securities | | | 40,850 | |
| | | | |
Total investment income | | | 1,158,883 | |
| | | | |
| |
Expenses | | | | |
Management fee | | | 1,125,660 | |
Administration fees | |
Class A | | | 29,660 | |
Class C | | | 7,986 | |
Administrator Class | | | 4,287 | |
Institutional Class | | | 181,460 | |
Shareholder servicing fees | |
Class A | | | 35,309 | |
Class C | | �� | 9,507 | |
Administrator Class | | | 8,244 | |
Distribution fee | |
Class C | | | 28,522 | |
Custody and accounting fees | | | 13,903 | |
Professional fees | | | 45,413 | |
Registration fees | | | 41,825 | |
Shareholder report expenses | | | 1,534 | |
Trustees’ fees and expenses | | | 23,291 | |
Other fees and expenses | | | 12,396 | |
| | | | |
Total expenses | | | 1,568,997 | |
Less: Fee waivers and/or expense reimbursements | | | (175,724 | ) |
| | | | |
Net expenses | | | 1,393,273 | |
| | | | |
Net investment loss | | | (234,390 | ) |
| | | | |
| |
REALIZED AND UNREALIZED GAINS (LOSSES) ON INVESTMENTS | | | | |
Net realized gains on investments | | | 29,720,347 | |
Net change in unrealized gains (losses) on investments | | | 10,190,328 | |
| | | | |
Net realized and unrealized gains (losses) on investments | | | 39,910,675 | |
| | | | |
Net increase in net assets resulting from operations | | $ | 39,676,285 | |
| | | | |
The accompanying notes are an integral part of these financial statements.
| | | | |
| 16 | | Wells Fargo Endeavor Select Fund | | Statement of changes in net assets |
| | | | | | | | | | | | | | | | |
| | | Year ended
July 31, 2018 | | | Year ended
July 31, 2017 | |
| |
Operations | | | | | |
Net investment loss | | | | | | $ | (234,390 | ) | | | | | | $ | (27,223 | ) |
Net realized gains on investments | | | | | | | 29,720,347 | | | | | | | | 31,650,789 | |
Net change in unrealized gains (losses) on investments | | | | | | | 10,190,328 | | | | | | | | (1,943,395 | ) |
| | | | |
Net increase in net assets resulting from operations | | | | | | | 39,676,285 | | | | | | | | 29,680,171 | |
| | | | |
| |
Distributions to shareholders from | | | | | |
Net investment income | |
Institutional Class | | | | | | | (159,467 | ) | | | | | | | (104,471 | ) |
Net realized gains | |
Class A | | | | | | | (2,526,049 | ) | | | | | | | (2,338,187 | ) |
Class C | | | | | | | (946,756 | ) | | | | | | | (802,158 | ) |
Administrator Class | | | | | | | (597,659 | ) | | | | | | | (612,919 | ) |
Institutional Class | | | | | | | (24,016,577 | ) | | | | | | | (20,446,180 | ) |
| | | | |
Total distributions to shareholders | | | | | | | (28,246,508 | ) | | | | | | | (24,303,915 | ) |
| | | | |
| | | | |
Capital share transactions | | | Shares | | | | | | | | Shares | | | | | |
Proceeds from shares sold | |
Class A | | | 742,375 | | | | 6,708,296 | | | | 223,513 | | | | 1,869,031 | |
Class C | | | 68,071 | | | | 431,126 | | | | 16,419 | | | | 100,249 | |
Administrator Class | | | 8,610 | | | | 83,829 | | | | 43,507 | | | | 395,396 | |
Institutional Class | | | 829,379 | | | | 8,252,736 | | | | 926,362 | | | | 8,245,314 | |
| | | | |
| | | | | | | 15,475,987 | | | | | | | | 10,609,990 | |
| | | | |
Reinvestment of distributions | |
Class A | | | 267,712 | | | | 2,179,176 | | | | 285,522 | | | | 2,141,414 | |
Class C | | | 168,269 | | | | 942,309 | | | | 141,389 | | | | 797,434 | |
Administrator Class | | | 65,748 | | | | 573,324 | | | | 74,930 | | | | 594,196 | |
Institutional Class | | | 2,647,483 | | | | 24,092,788 | | | | 2,494,029 | | | | 20,451,160 | |
| | | | |
| | | | | | | 27,787,597 | | | | | | | | 23,984,204 | |
| | | | |
Payment for shares redeemed | |
Class A | | | (706,902 | ) | | | (6,353,582 | ) | | | (1,149,400 | ) | | | (9,511,750 | ) |
Class B | | | N/A | | | | N/A | | | | (3,203 | )1 | | | (22,604 | )1 |
Class C | | | (189,968 | ) | | | (1,213,972 | ) | | | (301,126 | ) | | | (1,863,589 | ) |
Administrator Class | | | (155,500 | ) | | | (1,499,494 | ) | | | (294,386 | ) | | | (2,594,416 | ) |
Institutional Class | | | (5,501,471 | ) | | | (55,332,910 | ) | | | (5,816,960 | ) | | | (53,011,376 | ) |
| | | | |
| | | | | | | (64,399,958 | ) | | | | | | | (67,003,735 | ) |
| | | | |
Net decrease in net assets resulting from capital share transactions | | | | | | | (21,136,374 | ) | | | | | | | (32,409,541 | ) |
| | | | |
Total decrease in net assets | | | | | | | (9,706,597 | ) | | | | | | | (27,033,285 | ) |
| | | | |
| | |
Net assets | | | | | | | | |
Beginning of period | | | | | | | 164,521,983 | | | | | | | | 191,555,268 | |
| | | | |
End of period | | | | | | $ | 154,815,386 | | | | | | | $ | 164,521,983 | |
| | | | |
Undistributed (accumulated) net investment income (loss) | | | | | | $ | 0 | | | | | | | $ | 159,330 | |
| | | | |
| 1 | For the period from August 1, 2016 to September 9, 2016, Class B shares of the Fund were no longer offered to shareholders effective September 10, 2016. |
The accompanying notes are an integral part of these financial statements.
| | | | | | |
| Financial highlights | | Wells Fargo Endeavor Select Fund | | | 17 | |
(For a share outstanding throughout each period)
| | | | | | | | | | | | | | | | | | | | |
| | | Year ended July 31 | |
| CLASS A | | 2018 | | | 2017 | | | 2016 | | | 2015 | | | 2014 | |
Net asset value, beginning of period | | | $9.09 | | | | $8.96 | | | | $13.74 | | | | $14.13 | | | | $12.52 | |
Net investment loss | | | (0.04 | )1 | | | (0.03 | )1 | | | (0.04 | )1 | | | (0.08 | )1 | | | (0.09 | )1 |
Net realized and unrealized gains (losses) on investments | | | 2.23 | | | | 1.49 | | | | (0.14 | ) | | | 1.65 | | | | 2.37 | |
| | | | | | | | | | | | | | | | | | | | |
Total from investment operations | | | 2.19 | | | | 1.46 | | | | (0.18 | ) | | | 1.57 | | | | 2.28 | |
Distributions to shareholders from | | | | | | | | | | | | | | | | | | | | |
Net realized gains | | | (1.85 | ) | | | (1.33 | ) | | | (4.60 | ) | | | (1.96 | ) | | | (0.67 | ) |
Net asset value, end of period | | | $9.43 | | | | $9.09 | | | | $8.96 | | | | $13.74 | | | | $14.13 | |
Total return2 | | | 27.35 | % | | | 19.39 | % | | | (0.07 | )% | | | 12.14 | % | | | 18.40 | % |
Ratios to average net assets (annualized) | | | | | | | | | | | | | | | | | | | | |
Gross expenses | | | 1.25 | % | | | 1.22 | % | | | 1.28 | % | | | 1.24 | % | | | 1.25 | % |
Net expenses | | | 1.20 | % | | | 1.20 | % | | | 1.20 | % | | | 1.23 | % | | | 1.24 | % |
Net investment loss | | | (0.49 | )% | | | (0.33 | )% | | | (0.36 | )% | | | (0.55 | )% | | | (0.66 | )% |
Supplemental data | | | | | | | | | | | | | | | | | | | | |
Portfolio turnover rate | | | 36 | % | | | 59 | % | | | 79 | % | | | 126 | % | | | 100 | % |
Net assets, end of period (000s omitted) | | | $16,301 | | | | $12,953 | | | | $18,498 | | | | $26,197 | | | | $41,708 | |
| 1 | Calculated based upon average shares outstanding |
| 2 | Total return calculations do not include any sales charges. |
The accompanying notes are an integral part of these financial statements.
| | | | |
| 18 | | Wells Fargo Endeavor Select Fund | | Financial highlights |
(For a share outstanding throughout each period)
| | | | | | | | | | | | | | | | | | | | |
| | | Year ended July 31 | |
| CLASS C | | 2018 | | | 2017 | | | 2016 | | | 2015 | | | 2014 | |
Net asset value, beginning of period | | | $6.80 | | | | $7.09 | | | | $11.93 | | | | $12.61 | | | | $11.32 | |
Net investment loss | | | (0.08 | )1 | | | (0.07 | )1 | | | (0.09 | )1 | | | (0.16 | )1 | | | (0.17 | )1 |
Net realized and unrealized gains (losses) on investments | | | 1.59 | | | | 1.11 | | | | (0.15 | ) | | | 1.44 | | | | 2.13 | |
| | | | | | | | | | | | | | | | | | | | |
Total from investment operations | | | 1.51 | | | | 1.04 | | | | (0.24 | ) | | | 1.28 | | | | 1.96 | |
Distributions to shareholders from | | | | | | | | | | | | | | | | | | | | |
Net realized gains | | | (1.85 | ) | | | (1.33 | ) | | | (4.60 | ) | | | (1.96 | ) | | | (0.67 | ) |
Net asset value, end of period | | | $6.46 | | | | $6.80 | | | | $7.09 | | | | $11.93 | | | | $12.61 | |
Total return2 | | | 26.43 | % | | | 18.46 | % | | | (0.76 | )% | | | 11.21 | % | | | 17.60 | % |
Ratios to average net assets (annualized) | | | | | | | | | | | | | | | | | | | | |
Gross expenses | | | 2.00 | % | | | 1.97 | % | | | 2.03 | % | | | 1.99 | % | | | 2.00 | % |
Net expenses | | | 1.95 | % | | | 1.95 | % | | | 1.95 | % | | | 1.99 | % | | | 1.99 | % |
Net investment loss | | | (1.22 | )% | | | (1.08 | )% | | | (1.11 | )% | | | (1.32 | )% | | | (1.41 | )% |
Supplemental data | | | | | | | | | | | | | | | | | | | | |
Portfolio turnover rate | | | 36 | % | | | 59 | % | | | 79 | % | | | 126 | % | | | 100 | % |
Net assets, end of period (000s omitted) | | | $3,792 | | | | $3,676 | | | | $4,845 | | | | $6,914 | | | | $6,747 | |
| 1 | Calculated based upon average shares outstanding |
| 2 | Total return calculations do not include any sales charges. |
The accompanying notes are an integral part of these financial statements.
| | | | | | |
| Financial highlights | | Wells Fargo Endeavor Select Fund | | | 19 | |
(For a share outstanding throughout each period)
| | | | | | | | | | | | | | | | | | | | |
| | | Year ended July 31 | |
| ADMINISTRATOR CLASS | | 2018 | | | 2017 | | | 2016 | | | 2015 | | | 2014 | |
Net asset value, beginning of period | | | $9.62 | | | | $9.38 | | | | $14.13 | | | | $14.45 | | | | $12.78 | |
Net investment income (loss) | | | (0.03 | )1 | | | (0.01 | )1 | | | 0.01 | 1 | | | (0.05 | )1 | | | (0.06 | )1 |
Net realized and unrealized gains (losses) on investments | | | 2.38 | | | | 1.58 | | | | (0.16 | ) | | | 1.69 | | | | 2.42 | |
| | | | | | | | | | | | | | | | | | | | |
Total from investment operations | | | 2.35 | | | | 1.57 | | | | (0.15 | ) | | | 1.64 | | | | 2.36 | |
Distributions to shareholders from | | | | | | | | | | | | | | | | | | | | |
Net investment income | | | 0.00 | | | | 0.00 | | | | 0.00 | | | | 0.00 | | | | (0.02 | ) |
Net realized gains | | | (1.85 | ) | | | (1.33 | ) | | | (4.60 | ) | | | (1.96 | ) | | | (0.67 | ) |
| | | | | | | | | | | | | | | | | | | | |
Total distributions to shareholders | | | (1.85 | ) | | | (1.33 | ) | | | (4.60 | ) | | | (1.96 | ) | | | (0.69 | ) |
Net asset value, end of period | | | $10.12 | | | | $9.62 | | | | $9.38 | | | | $14.13 | | | | $14.45 | |
Total return | | | 27.55 | % | | | 19.71 | % | | | 0.16 | % | | | 12.38 | % | | | 18.77 | % |
Ratios to average net assets (annualized) | | | | | | | | | | | | | | | | | | | | |
Gross expenses | | | 1.16 | % | | | 1.14 | % | | | 1.14 | % | | | 1.05 | % | | | 1.06 | % |
Net expenses | | | 1.00 | % | | | 1.00 | % | | | 1.00 | % | | | 0.99 | % | | | 1.00 | % |
Net investment income (loss) | | | (0.28 | )% | | | (0.12 | )% | | | 0.06 | % | | | (0.32 | )% | | | (0.42 | )% |
Supplemental data | | | | | | | | | | | | | | | | | | | | |
Portfolio turnover rate | | | 36 | % | | | 59 | % | | | 79 | % | | | 126 | % | | | 100 | % |
Net assets, end of period (000s omitted) | | | $3,068 | | | | $3,695 | | | | $5,254 | | | | $42,776 | | | | $48,560 | |
| 1 | Calculated based upon average shares outstanding |
The accompanying notes are an integral part of these financial statements.
| | | | |
| 20 | | Wells Fargo Endeavor Select Fund | | Financial highlights |
(For a share outstanding throughout each period)
| | | | | | | | | | | | | | | | | | | | |
| | | Year ended July 31 | |
| INSTITUTIONAL CLASS | | 2018 | | | 2017 | | | 2016 | | | 2015 | | | 2014 | |
Net asset value, beginning of period | | | $9.95 | | | | $9.65 | | | | $14.39 | | | | $14.65 | | | | $12.95 | |
Net investment income (loss) | | | (0.01 | )1 | | | 0.00 | 1,2 | | | 0.00 | 1,2 | | | (0.01 | )1 | | | (0.03 | )1 |
Net realized and unrealized gains (losses) on investments | | | 2.49 | | | | 1.64 | | | | (0.14 | ) | | | 1.71 | | | | 2.45 | |
| | | | | | | | | | | | | | | | | | | | |
Total from investment operations | | | 2.48 | | | | 1.64 | | | | (0.14 | ) | | | 1.70 | | | | 2.42 | |
Distributions to shareholders from | | | | | | | | | | | | | | | | | | | | |
Net investment income | | | (0.01 | ) | | | (0.01 | ) | | | 0.00 | | | | 0.00 | | | | (0.05 | ) |
Net realized gains | | | (1.85 | ) | | | (1.33 | ) | | | (4.60 | ) | | | (1.96 | ) | | | (0.67 | ) |
| | | | | | | | | | | | | | | | | | | | |
Total distributions to shareholders | | | (1.86 | ) | | | (1.34 | ) | | | (4.60 | ) | | | (1.96 | ) | | | (0.72 | ) |
Net asset value, end of period | | | $10.57 | | | | $9.95 | | | | $9.65 | | | | $14.39 | | | | $14.65 | |
Total return | | | 28.01 | % | | | 19.87 | % | | | 0.27 | % | | | 12.63 | % | | | 18.98 | % |
Ratios to average net assets (annualized) | | | | | | | | | | | | | | | | | | | | |
Gross expenses | | | 0.92 | % | | | 0.89 | % | | | 0.95 | % | | | 0.81 | % | | | 0.82 | % |
Net expenses | | | 0.80 | % | | | 0.80 | % | | | 0.80 | % | | | 0.80 | % | | | 0.80 | % |
Net investment income (loss) | | | (0.08 | )% | | | 0.05 | % | | | 0.04 | % | | | (0.09 | )% | | | (0.22 | )% |
Supplemental data | | | | | | | | | | | | | | | | | | | | |
Portfolio turnover rate | | | 36 | % | | | 59 | % | | | 79 | % | | | 126 | % | | | 100 | % |
Net assets, end of period (000s omitted) | | | $131,655 | | | | $144,199 | | | | $162,935 | | | | $221,801 | | | | $618,502 | |
| 1 | Calculated based upon average shares outstanding |
| 2 | Amount is less than $0.005. |
The accompanying notes are an integral part of these financial statements.
| | | | | | |
| Notes to financial statements | | Wells Fargo Endeavor Select Fund | | | 21 | |
1. ORGANIZATION
Wells Fargo Funds Trust (the “Trust”), a Delaware statutory trust organized on March 10, 1999, is an open-end management investment company registered under the Investment Company Act of 1940, as amended (the “1940 Act”). As an investment company, the Trust follows the accounting and reporting guidance in Financial Accounting Standards Board Accounting Standards Codification Topic 946, Financial Services – Investment Companies. These financial statements report on the Wells Fargo Endeavor Select Fund (the “Fund”) which is a diversified series of the Trust.
Effective at the close of business on September 9, 2016, Class B shares of the Fund were liquidated and the class was subsequently closed. Class B shares are no longer offered by the Fund. Information for Class B shares reflected in the financial statements represents activity through September 9, 2016.
2. SIGNIFICANT ACCOUNTING POLICIES
The following significant accounting policies, which are consistently followed in the preparation of the financial statements of the Fund, are in conformity with U.S. generally accepted accounting principles which require management to make estimates and assumptions that affect the reported amounts of assets and liabilities, disclosure of contingent assets and liabilities at the date of the financial statements, and the reported amounts of revenues and expenses during the reporting period. Actual results could differ from those estimates.
All investments are valued each business day as of the close of regular trading on the New York Stock Exchange (generally 4 p.m. Eastern Time), although the Fund may deviate from this calculation time under unusual or unexpected circumstances.
Equity securities that are listed on a foreign or domestic exchange or market are valued at the official closing price or, if none, the last sales price. If no sale occurs on the principal exchange or market that day, a fair value price will be determined in accordance with the Fund’s Valuation Procedures.
Investments in registered open-end investment companies are valued at net asset value. Interests in non-registered investment companies that are redeemable at net asset value are fair valued normally at net asset value.
Investments which are not valued using any of the methods discussed above are valued at their fair value, as determined in good faith by the Board of Trustees of the Fund. The Board of Trustees has established a Valuation Committee comprised of the Trustees and has delegated to it the authority to take any actions regarding the valuation of portfolio securities that the Valuation Committee deems necessary or appropriate, including determining the fair value of portfolio securities, unless the determination has been delegated to the Wells Fargo Asset Management Pricing Committee at Wells Fargo Funds Management, LLC (“Funds Management”). The Board of Trustees retains the authority to make or ratify any valuation decisions or approve any changes to the Valuation Procedures as it deems appropriate. On a quarterly basis, the Board of Trustees receives reports on any valuation actions taken by the Valuation Committee or the Wells Fargo Asset Management Pricing Committee which may include items for ratification.
Valuations of fair valued securities are compared to the next actual sales price when available, or other appropriate market values, to assess the continued appropriateness of the fair valuation methodologies used. These securities are fair valued on a day-to-day basis, taking into consideration changes to appropriate market information and any significant changes to the inputs considered in the valuation process until there is a readily available price provided on an exchange or by an independent pricing service. Valuations received from an independent pricing service or independent broker-dealer quotes are periodically validated by comparisons to most recent trades and valuations provided by other independent pricing services in addition to the review of prices by the manager and/or subadviser. Unobservable inputs used in determining fair valuations are identified based on the type of security, taking into consideration factors utilized by market participants in valuing the investment, knowledge about the issuer and the current market environment.
Foreign currency translation
The accounting records of the Fund are maintained in U.S. dollars. The values of other assets and liabilities denominated in foreign currencies are translated into U.S. dollars at rates provided by an independent foreign currency pricing source at a time each business day specified by the Wells Fargo Asset Management Pricing Committee. Purchases and sales of securities, and income and expenses are converted at the rate of exchange on the respective dates of such transactions. Net realized foreign exchange gains or losses arise from sales of foreign currencies, currency gains or losses realized between the trade and settlement dates on securities transactions, and the difference between the amounts of dividends, interest and foreign withholding taxes recorded and the U.S. dollar equivalent of the amounts actually paid or received. Net unrealized foreign exchange gains and losses arise from changes in the fair value of assets and liabilities other than investments in securities resulting from changes in exchange rates. The changes in net assets arising from changes in exchange rates of securities and the changes in net assets resulting from changes in market prices of securities are not separately presented. Such changes are included in net realized and unrealized gains or losses from investments.
| | | | |
| 22 | | Wells Fargo Endeavor Select Fund | | Notes to financial statements |
Securities lending
The Fund may lend its securities from time to time in order to earn additional income in the form of fees or interest on securities received as collateral or the investment of any cash received as collateral. The Fund continues to receive interest or dividends on the securities loaned. The Fund receives collateral in the form of cash or securities with a value at least equal to the value of the securities on loan. The value of the loaned securities is determined at the close of each business day and any additional required collateral is delivered to the Fund on the next business day. In a securities lending transaction, the net asset value of the Fund will be affected by an increase or decrease in the value of the securities loaned and by an increase or decrease in the value of the instrument in which collateral is invested. The amount of securities lending activity undertaken by the Fund fluctuates from time to time. In the event of default or bankruptcy by the borrower, the Fund may be prevented from recovering the loaned securities or gaining access to the collateral or may experience delays or costs in doing so. In addition, the investment of any cash collateral received may lose all or part of its value. The Fund has the right under the lending agreement to recover the securities from the borrower on demand.
The Fund lends its securities through an unaffiliated securities lending agent. Cash collateral received in connection with its securities lending transactions is invested in Securities Lending Cash Investments, LLC (the “Securities Lending Fund”). The Securities Lending Fund is exempt from registration under Section 3(c)(7) of the 1940 Act and is managed by Funds Management and is subadvised by Wells Capital Management Incorporated (“WellsCap”), an affiliate of Funds Management and an indirect wholly owned subsidiary of Wells Fargo & Company (“Wells Fargo”). Funds Management receives an advisory fee starting at 0.05% and declining to 0.01% as the average daily net assets of the Securities Lending Fund increase. All of the fees received by Funds Management are paid to WellsCap for its services as subadviser. The Securities Lending Fund seeks to provide a positive return compared to the daily Fed Funds Open Rate by investing in high-quality, U.S. dollar-denominated short-term money market instruments. Securities Lending Fund investments are valued at the evaluated bid price provided by an independent pricing service. Income earned from investment in the Securities Lending Fund, if any, is included in income from affiliated securities on the Statement of Operations.
Security transactions and income recognition
Securities transactions are recorded on a trade date basis. Realized gains or losses are recorded on the basis of identified cost.
Dividend income is recognized on the ex-dividend date. Dividend income is recorded net of foreign taxes withheld where recovery of such taxes is not assured.
Distributions to shareholders
Distributions to shareholders from net investment income and any net realized gains are recorded on the ex-dividend date and paid at least annually. Such distributions are determined in accordance with income tax regulations and may differ from U.S. generally accepted accounting principles. Dividend sources are estimated at the time of declaration. The tax character of distributions is determined as of the Fund’s fiscal year end. Therefore, a portion of the Fund’s distributions made prior to the Fund’s fiscal year end may be categorized as a tax return of capital at year end.
Federal and other taxes
The Fund intends to continue to qualify as a regulated investment company by distributing substantially all of its investment company taxable income and any net realized capital gains (after reduction for capital loss carryforwards) sufficient to relieve it from all, or substantially all, federal income taxes. Accordingly, no provision for federal income taxes was required.
The Fund’s income and federal excise tax returns and all financial records supporting those returns for the prior three fiscal years are subject to examination by the federal and Delaware revenue authorities. Management has analyzed the Fund’s tax positions taken on federal, state, and foreign tax returns for all open tax years and does not believe that there are any uncertain tax positions that require recognition of a tax liability.
As of July 31, 2018, the aggregate cost of all investments for federal income tax purposes was $95,804,539 and the unrealized gains consisted of:
| | | | |
Gross unrealized gains | | $ | 62,079,811 | |
Gross unrealized losses | | | (1,062,460 | ) |
Net unrealized gains | | $ | 61,017,351 | |
Reclassifications are made to the Fund’s capital accounts for permanent tax differences to reflect income and gains available for distribution (or available capital loss carryforwards) under federal income tax regulations. U.S. generally accepted accounting principles require that certain components of net assets be adjusted to reflect permanent differences between financial and tax
| | | | | | |
| Notes to financial statements | | Wells Fargo Endeavor Select Fund | | | 23 | |
reporting. In addition, the Fund may utilize equalization accounting for tax purposes and designate earnings and profits, including net realized gains distributed to shareholders on redemption of shares, as a part of the dividends paid deduction for income tax purposes. These reclassifications have no effect on net assets or net asset values per share. The primary permanent differences causing such reclassifications are due to equalization payments and net operating losses. At July 31, 2018, as a result of permanent book-to-tax differences, the following reclassification adjustments were made on the Statement of Assets and Liabilities:
| | | | |
| Paid-in capital | | Accumulated net
investment loss | | Accumulated net
realized gains
on investments |
| $1,261,005 | | $234,527 | | $(1,495,532) |
Class allocations
The separate classes of shares offered by the Fund differ principally in applicable sales charges, distribution, shareholder servicing, and administration fees. Class specific expenses are charged directly to that share class. Investment income, common expenses, and realized and unrealized gains (losses) on investments are allocated daily to each class of shares based on the relative proportion of net assets of each class.
3. FAIR VALUATION MEASUREMENTS
Fair value measurements of investments are determined within a framework that has established a fair value hierarchy based upon the various data inputs utilized in determining the value of the Fund’s investments. The three-level hierarchy gives the highest priority to unadjusted quoted prices in active markets for identical assets or liabilities (Level 1) and the lowest priority to unobservable inputs (Level 3). The Fund’s investments are classified within the fair value hierarchy based on the lowest level of input that is significant to the fair value measurement. The inputs are summarized into three broad levels as follows:
| ∎ | | Level 1 – quoted prices in active markets for identical securities |
| ∎ | | Level 2 – other significant observable inputs (including quoted prices for similar securities, interest rates, prepayment speeds, credit risk, etc.) |
| ∎ | | Level 3 – significant unobservable inputs (including the Fund’s own assumptions in determining the fair value of investments) |
The inputs or methodologies used for valuing investments in securities are not necessarily an indication of the risk associated with investing in those securities.
The following is a summary of the inputs used in valuing the Fund’s assets and liabilities as of July 31, 2018:
| | | | | | | | | | | | | | | | |
| | | Quoted prices
(Level 1) | | | Other significant
observable inputs
(Level 2) | | | Significant
unobservable inputs (Level 3) | | | Total | |
Assets | | | | | | | | | | | | | | | | |
Investments in: | | | | | | | | | | | | | | | | |
| | | | |
Common stocks | | | | | | | | | | | | | | | | |
Consumer discretionary | | $ | 25,488,543 | | | $ | 0 | | | $ | 0 | | | $ | 25,488,543 | |
Financials | | | 10,483,632 | | | | 0 | | | | 0 | | | | 10,483,632 | |
Health care | | | 21,172,950 | | | | 0 | | | | 0 | | | | 21,172,950 | |
Industrials | | | 15,207,459 | | | | 0 | | | | 0 | | | | 15,207,459 | |
Information technology | | | 66,251,803 | | | | 0 | | | | 0 | | | | 66,251,803 | |
Materials | | | 11,685,125 | | | | 0 | | | | 0 | | | | 11,685,125 | |
Real estate | | | 1,772,400 | | | | 0 | | | | 0 | | | | 1,772,400 | |
| | | | |
Short-term investments | | | | | | | 0 | | | | 0 | | | | | |
Investment companies | | | 2,588,003 | | | | 0 | | | | 0 | | | | 2,588,003 | |
Investments measured at net asset value* | | | | | | | 0 | | | | 0 | | | | 2,171,975 | |
Total assets | | $ | 154,649,915 | | | $ | 0 | | | $ | 0 | | | $ | 156,821,890 | |
| * | Investments that are measured at fair value using the net asset value per share (or its equivalent) as a practical expedient have not been categorized in the fair value hierarchy. The fair value amount presented in the table is intended to permit reconciliation of the fair value hierarchy to the amounts presented in the Statement of Assets and Liabilities. The Fund’s investment in Securities Lending Cash Investments, LLC valued at $2,171,975 does not have a redemption period notice, can be redeemed daily and does not have any unfunded commitments. |
| | | | |
| 24 | | Wells Fargo Endeavor Select Fund | | Notes to financial statements |
The Fund recognizes transfers between levels within the fair value hierarchy at the end of the reporting period. At July 31, 2018, the Fund did not have any transfers into/out of Level 1, Level 2, or Level 3.
4. TRANSACTIONS WITH AFFILIATES
Management fee
Funds Management, an indirect wholly owned subsidiary of Wells Fargo, is the manager of the Fund and provides advisory and fund-level administrative services under an investment management agreement. Under the investment management agreement, Funds Management is responsible for, among other services, implementing the investment objectives and strategies of the Fund, supervising the subadviser and providing fund-level administrative services in connection with the Fund’s operations. As compensation for its services under the investment management agreement, Funds Management is entitled to receive an annual management fee starting at 0.70% and declining to 0.505% as the average daily net assets of the Fund increase. For the year ended July 31, 2018, the management fee was equivalent to an annual rate of 0.70% of the Fund’s average daily net assets.
Funds Management has retained the services of a subadviser to provide daily portfolio management to the Fund. The fee for subadvisory services is borne by Funds Management. WellsCap is the subadviser to the Fund and is entitled to receive a fee from Funds Management at an annual rate starting at 0.30% and declining to 0.20% as the average daily net assets of the Fund increase.
Administration fees
Under a class-level administration agreement, Funds Management provides class-level administrative services to the Fund, which includes paying fees and expenses for services provided by the transfer agent, sub-transfer agents, omnibus account servicers and record-keepers. As compensation for its services under the class-level administration agreement, Funds Management receives an annual fee which is calculated based on the average daily net assets of each class as follows:
| | | | |
| | | Class-level
administration fee | |
Class A, Class C | | | 0.21 | % |
Administrator Class, Institutional Class | | | 0.13 | |
Funds Management has contractually waived and/or reimbursed management and administration fees to the extent necessary to maintain certain net operating expense ratios for the Fund. When each class of the Fund has exceeded its expense cap, Funds Management has waived fees and/or reimbursed expenses from fund level expenses on a proportionate basis and then from class specific expenses; otherwise, waivers and/or reimbursements are applied against class specific expenses before fund level expenses. Funds Management has committed through November 30, 2018 to waive fees and/or reimburse expenses to the extent necessary to cap the Fund’s expenses at 1.20% for Class A shares, 1.95% for Class C shares, 1.00% for Administrator Class shares, and 0.80% for Institutional Class shares. After this time, the cap may be increased or the commitment to maintain the cap may be terminated only with the approval of the Board of Trustees.
Distribution fee
The Trust has adopted a distribution plan for Class C shares of the Fund pursuant to Rule 12b-1 under the 1940 Act. A distribution fee is charged to Class C shares and paid to Wells Fargo Funds Distributor, LLC (“Funds Distributor”), the principal underwriter, at an annual rate of 0.75% of the average daily net assets of Class C shares.
In addition, Funds Distributor is entitled to receive the front-end sales charge from the purchase of Class A shares and a contingent deferred sales charge on the redemption of certain Class A shares. Funds Distributor is also entitled to receive the contingent deferred sales charges from redemptions of Class C shares. For the year ended July 31, 2018, Funds Distributor received $4,866 from the sale of Class A shares. No contingent deferred sales charges were incurred by Class A and Class C shares for the year ended July 31, 2018.
Shareholder servicing fees
The Trust has entered into contracts with one or more shareholder servicing agents, whereby Class A, Class C, and Administrator Class of the Fund are charged a fee at an annual rate of 0.25% of the average daily net assets of each respective class.
A portion of these total shareholder servicing fees were paid to affiliates of Wells Fargo.
| | | | | | |
| Notes to financial statements | | Wells Fargo Endeavor Select Fund | | | 25 | |
Interfund transactions
The Fund may purchase or sell portfolio investment securities to certain other Wells Fargo affiliates pursuant to Rule 17a-7 under the 1940 Act and under procedures adopted by the Board of Trustees. The procedures have been designed to ensure that these interfund transactions, which do not incur broker commissions, are effected at current market prices.
5. INVESTMENT PORTFOLIO TRANSACTIONS
Purchases and sales of investments, excluding U.S. government obligations (if any) and short-term securities, for the year ended July 31, 2018 were $56,028,722 and $102,754,598, respectively.
6. BANK BORROWINGS
The Trust (excluding the money market funds and certain other funds) and Wells Fargo Variable Trust are parties to a $280,000,000 revolving credit agreement whereby the Fund is permitted to use bank borrowings for temporary or emergency purposes, such as to fund shareholder redemption requests. Interest under the credit agreement is charged to the Fund based on a borrowing rate equal to the higher of the Federal Funds rate in effect on that day plus 1.25% or the overnight LIBOR rate in effect on that day plus 1.25%. In addition, an annual commitment fee equal to 0.25% of the unused balance is allocated to each participating fund. Prior to August 29, 2017, the revolving credit agreement amount was $250,000,000.
For the year ended July 31, 2018, there were no borrowings by the Fund under the agreement.
7. DISTRIBUTIONS TO SHAREHOLDERS
The tax character of distributions paid during the years ended July 31, 2018 and July 31, 2017 were as follows:
| | | | | | | | |
| | | Year ended July 31 | |
| | | 2018 | | | 2017 | |
Ordinary income | | $ | 3,933,421 | | | $ | 104,471 | |
Long-term capital gain | | | 24,313,087 | | | | 24,199,444 | |
As of July 31, 2018, the components of distributable earnings on a tax basis were as follows:
| | | | |
Undistributed ordinary income | | Undistributed long-term gain | | Unrealized gains |
| $2,970,580 | | $20,159,456 | | $61,017,351 |
8. CONCENTRATION RISK
Concentration risks result from exposure to a limited number of sectors. A fund that invests a substantial portion of its assets in any sector may be more affected by changes in that sector than would be a fund whose investments are not heavily weighted in any sector.
9. INDEMNIFICATION
Under the Trust’s organizational documents, the officers and Trustees have been granted certain indemnification rights against certain liabilities that may arise out of performance of their duties to the Trust. Additionally, in the normal course of business, the Trust may enter into contracts with service providers that contain a variety of indemnification clauses. The Trust’s maximum exposure under these arrangements is dependent on future claims that may be made against the Fund and, therefore, cannot be estimated.
| | | | |
| 26 | | Wells Fargo Endeavor Select Fund | | Report of independent registered public accounting firm |
BOARD OF TRUSTEES AND SHAREHOLDERS OF WELLS FARGO FUNDS TRUST:
Opinion on the Financial Statements
We have audited the accompanying statement of assets and liabilities of Wells Fargo Endeavor Select Fund (the “Fund”), one of the funds constituting Wells Fargo Funds Trust, including the portfolio of investments, as of July 31, 2018, the related statement of operations for the year then ended, the statements of changes in net assets for each of the years in the two-year period then ended, and the related notes (collectively, the “financial statements”) and the financial highlights for each of the years in the five-year period then ended. In our opinion, the financial statements and financial highlights present fairly, in all material respects, the financial position of the Fund as of July 31, 2018, the results of its operations for the year then ended, the changes in its net assets for each of the years in the two-year period then ended, and the financial highlights for each of the years in the five-year period then ended, in conformity with U.S. generally accepted accounting principles.
Basis for Opinion
These financial statements and financial highlights are the responsibility of the Fund’s management. Our responsibility is to express an opinion on these financial statements and financial highlights based on our audits. We are a public accounting firm registered with the Public Company Accounting Oversight Board (United States) (“PCAOB”) and are required to be independent with respect to the Fund in accordance with the U.S. federal securities laws and the applicable rules and regulations of the Securities and Exchange Commission and the PCAOB.
We conducted our audits in accordance with the standards of the PCAOB. Those standards require that we plan and perform the audit to obtain reasonable assurance about whether the financial statements and financial highlights are free of material misstatement, whether due to error or fraud. Our audits included performing procedures to assess the risks of material misstatement of the financial statements and financial highlights, whether due to error or fraud, and performing procedures that respond to those risks. Such procedures included examining, on a test basis, evidence regarding the amounts and disclosures in the financial statements and financial highlights. Such procedures also included confirmation of securities owned as of July 31, 2018, by correspondence with the custodian and brokers, or by other appropriate auditing procedures. Our audits also included evaluating the accounting principles used and significant estimates made by management, as well as evaluating the overall presentation of the financial statements and financial highlights. We believe that our audits provide a reasonable basis for our opinion.

We have not been able to determine the specific year that we began serving as the auditor of one or more Wells Fargo Funds investment companies, however we are aware that we have served as the auditor of one or more Wells Fargo Funds investment companies since at least 1955.
Boston, Massachusetts
September 24, 2018
| | | | | | |
| Other information (unaudited) | | Wells Fargo Endeavor Select Fund | | | 27 | |
TAX INFORMATION
For corporate shareholders, pursuant to Section 854 of the Internal Revenue Code, 39.47% of ordinary income dividends qualify for the corporate dividends-received deduction for the fiscal year ended July 31, 2018.
Pursuant to Section 852 of the Internal Revenue Code, $25,574,092 was designated as a 20% rate gain distribution for the fiscal year ended July 31, 2018. Long-term capital gains in the amount of $1,261,005 were distributed in connection with Fund share redemptions.
Pursuant to Section 854 of the Internal Revenue Code, $1,765,466 of income dividends paid during the fiscal year ended July 31, 2018 has been designated as qualified dividend income (QDI).
For the fiscal year ended July 31, 2018, $3,773,954 has been designated as short-term capital gain dividends for nonresident alien shareholders pursuant to Section 871 of the Internal Revenue Code.
PROXY VOTING INFORMATION
A description of the policies and procedures that the Fund uses to determine how to vote proxies relating to portfolio securities is available, upon request, by calling 1-800-222-8222, visiting our website at wellsfargofunds.com, or visiting the SEC website at sec.gov. Information regarding how the Fund voted proxies relating to portfolio securities during the most recent 12-month period ended June 30 is available on the Fund’s website at wellsfargofunds.com or by visiting the SEC website at sec.gov.
PORTFOLIO HOLDINGS INFORMATION
The complete portfolio holdings for the Fund are publicly available monthly on the Fund’s website (wellsfargofunds.com), on a one-month delayed basis. In addition, top ten holdings information (excluding derivative positions) for the Fund is publicly available on the Fund’s website on a monthly, seven-day or more delayed basis. The Fund files its complete schedule of portfolio holdings with the SEC for the first and third quarters of each fiscal year on Form N-Q, which is available by visiting the SEC website at sec.gov. In addition, the Fund’s Form N-Q may be reviewed and copied at the SEC’s Public Reference Room in Washington, DC, and at regional offices in New York City, at 233 Broadway, and in Chicago, at 175 West Jackson Boulevard, Suite 900. Information about the Public Reference Room may be obtained by calling 1-800-SEC-0330.
| | | | |
| 28 | | Wells Fargo Endeavor Select Fund | | Other information (unaudited) |
BOARD OF TRUSTEES AND OFFICERS
Each of the Trustees and Officers1 listed in the table below acts in identical capacities for each fund in the Wells Fargo family of funds, which consists of 154 mutual funds comprising the Wells Fargo Funds Trust, Wells Fargo Variable Trust, Wells Fargo Master Trust and four closed-end funds (collectively the “Fund Complex”). This table should be read in conjunction with the Prospectus and the Statement of Additional Information2. The mailing address of each Trustee and Officer is 525 Market Street, 12th Floor, San Francisco, CA 94105. Each Trustee and Officer serves an indefinite term, however, each Trustee serves such term until reaching the mandatory retirement age established by the Trustees.
Independent Trustees
| | | | | | |
Name and year of birth | | Position held and length of service* | | Principal occupations during past five years or longer | | Current other
public company or
investment company
directorships |
William R. Ebsworth (Born 1957) | | Trustee, since 2015 | | Retired. From 1984 to 2013, equities analyst, portfolio manager, research director and chief investment officer at Fidelity Management and Research Company in Boston, Tokyo, and Hong Kong, and retired in 2013 as Chief Investment Officer of Fidelity Strategic Advisers, Inc. where he led a team of investment professionals managing client assets. Prior thereto, Board member of Hong Kong Securities Clearing Co., Hong Kong Options Clearing Corp., the Thailand International Fund, Ltd., Fidelity Investments Life Insurance Company, and Empire Fidelity Investments Life Insurance Company. Board member of the Forté Foundation (non-profit organization) and the Vincent Memorial Hospital Endowment (non-profit organization), where he serves on the Investment Committee and as a Chair of the Audit Committee. Mr. Ebsworth is a CFA® charterholder. | | Asset Allocation Trust |
Jane A. Freeman (Born 1953) | | Trustee, since 2015; Chair Liaison, since 2018 | | Retired. From 2012 to 2014 and 1999 to 2008, Chief Financial Officer of Scientific Learning Corporation. From 2008 to 2012, Ms. Freeman provided consulting services related to strategic business projects. Prior to 1999, Portfolio Manager at Rockefeller & Co. and Scudder, Stevens & Clark. Board member of the Harding Loevner Funds from 1996 to 2014, serving as both Lead Independent Director and chair of the Audit Committee. Board member of the Russell Exchange Traded Funds Trust from 2011 to 2012 and the chair of the Audit Committee. Ms. Freeman is a Board Member of Ruth Bancroft Garden (non-profit organization) and the Glimmerglass Festival. She is also an inactive Chartered Financial Analyst. | | Asset Allocation Trust |
Isaiah Harris, Jr. (Born 1952) | | Trustee, since 2009 | | Retired. Chairman of the Board of CIGNA Corporation since 2009, and Director since 2005. From 2003 to 2011, Director of Deluxe Corporation. Prior thereto, President and CEO of BellSouth Advertising and Publishing Corp. from 2005 to 2007, President and CEO of BellSouth Enterprises from 2004 to 2005 and President of BellSouth Consumer Services from 2000 to 2003. Emeritus member of the Iowa State University Foundation Board of Governors. Emeritus Member of the Advisory Board of Iowa State University School of Business. Advisory Board Member, Palm Harbor Academy (charter school). Advisory Board Member, Child Evangelism Fellowship (non-profit). Mr. Harris is a certified public accountant (inactive status). | | CIGNA Corporation; Asset Allocation Trust |
Judith M. Johnson (Born 1949) | | Trustee, since 2008; Audit Committee Chairman, since 2009 | | Retired. Prior thereto, Chief Executive Officer and Chief Investment Officer of Minneapolis Employees Retirement Fund from 1996 to 2008. Ms. Johnson is an attorney, certified public accountant and a certified managerial accountant. | | Asset Allocation Trust |
David F. Larcker (Born 1950) | | Trustee, since 2009 | | James Irvin Miller Professor of Accounting at the Graduate School of Business, Stanford University, Director of the Corporate Governance Research Initiative and Senior Faculty of The Rock Center for Corporate Governance since 2006. From 2005 to 2008, Professor of Accounting at the Graduate School of Business, Stanford University. Prior thereto, Ernst & Young Professor of Accounting at The Wharton School, University of Pennsylvania from 1985 to 2005. | | Asset Allocation Trust |
| | | | | | |
| Other information (unaudited) | | Wells Fargo Endeavor Select Fund | | | 29 | |
| | | | | | |
Name and year of birth | | Position held and length of service* | | Principal occupations during past five years or longer | | Current other
public company or
investment company
directorships |
Olivia S. Mitchell (Born 1953) | | Trustee, since 2006; Governance Committee Chairman, since 2018 | | International Foundation of Employee Benefit Plans Professor, Wharton School of the University of Pennsylvania since 1993. Director of Wharton’s Pension Research Council and Boettner Center on Pensions & Retirement Research, and Research Associate at the National Bureau of Economic Research. Previously, Cornell University Professor from 1978 to 1993. | | Asset Allocation Trust |
Timothy J. Penny (Born 1951) | | Trustee, since 1996; Chairman, since 2018; Vice Chairman, from 2017 to 2018 | | President and Chief Executive Officer of Southern Minnesota Initiative Foundation, a non-profit organization, since 2007. Member of the Board of Trustees of NorthStar Education Finance, Inc., a non-profit organization, since 2007. | | Asset Allocation Trust |
James G. Polisson (Born 1959) | | Trustee, since 2018; Advisory Board Member, from 2017 to 2018 | | Retired. Chief Marketing Officer, Source (ETF) UK Services, Ltd, from 2015 to 2017. From 2012 to 2015, Principal of The Polisson Group, LLC, a management consulting, corporate advisory and principal investing company. Chief Executive Officer and Managing Director at Russell Investments, Global Exchange Traded Funds from 2010 to 2012. Managing Director of Barclays Global Investors from 1998 to 2010 and Global Chief Marketing Officer for iShares and Barclays Global Investors from 2000 to 2010. Trustee of the San Francisco Mechanics’ Institute, a non-profit organization, from 2013 to 2015. Board member of the Russell Exchange Traded Fund Trust from 2011 to 2012. Director of Barclays Global Investors Holdings Deutschland GmbH from 2006 to 2009. Mr. Polisson is an attorney and has a retired status with the Massachusetts and District of Columbia Bar Associations. | | Asset Allocation Trust |
Michael S. Scofield (Born 1943) | | Trustee, since 2010 | | Served on the Investment Company Institute’s Board of Governors and Executive Committee from 2008-2011 as well the Governing Council of the Independent Directors Council from 2006-2011 and the Independent Directors Council Executive Committee from 2008-2011. Trustee of the Evergreen Fund complex (and its predecessors) from 1984 to 2010. Chairman of the Evergreen Funds from 2000-2010. Former Trustee of the Mentor Funds. Retired Attorney, Law Offices of Michael S. Scofield. | | Asset Allocation Trust |
Pamela Wheelock (Born 1959) | | Trustee, since 2018; Advisory Board Member, from 2017 to 2018 | | Chief Operating Officer, Twin Cities Habitat for Humanity, since January, 2017. Vice President of University Services, University of Minnesota from 2012 to 2017. Prior thereto, on the Board of Directors, Goverance Committee and Finance Committee for the Minnesota Philanthropy Partners (Saint Paul Foundation) from 2012 to 2018, Interim President and Chief Executive Officer of Blue Cross Blue shield of Minnesota of Minnesota from 2010 to 2011, Chairman of the Board from 2009 to 2011 and Board Director 003 to 2015. Vice President, Leadership and Community Engagement, Bush Foundation, Saint Paul, Minnesota (a private foundation) from 2009 to 2011. Executive Vice President and Chief Financial Officer, Minnesota Sports and Entertainment from 2004 to 2009 and Senior Vice President from 2002 to 2004. Commissioner of Finance, State of Minnesota, from 1999 to 2002. Currently the Board Chair of the Minnesota Wild Foundation since 2010. | | Asset Allocation Trust |
| * | Length of service dates reflect the Trustee’s commencement of service with the Trust’s predecessor entities, where applicable. |
| | | | |
| 30 | | Wells Fargo Endeavor Select Fund | | Other information (unaudited) |
Officers
| | | | | | |
Name and year of birth | | Position held and length of service | | Principal occupations during past five years or longer | | |
Andrew Owen (Born 1960) | | President, since 2017 | | Executive Vice President of Wells Fargo & Company and Head of Affiliated Managers, Wells Fargo Asset Management, since 2014. In addition, Mr. Owen is currently President, Chief Executive Officer and Director of Wells Fargo Funds Management, LLC since 2017. Prior thereto, Executive Vice President responsible for marketing, investments and product development for Wells Fargo Funds Management, LLC, from 2009 to 2014. | | |
Jeremy DePalma1 (Born 1974) | | Treasurer, since 2012 | | Senior Vice President of Wells Fargo Funds Management, LLC since 2009. Senior Vice President of Evergreen Investment Management Company, LLC from 2008 to 2010 and head of the Fund Reporting and Control Team within Fund Administration from 2005 to 2010. | | |
Alexander Kymn3 (Born 1973) | | Secretary, since 2018; Chief Legal Officer, since 2018 | | Senior Company Counsel of Wells Fargo Bank, N.A. since 2018 (previously Senior Counsel from 2007 to 2018). Vice President of Wells Fargo Funds Management, LLC from 2008 to 2014. | | |
Michael H. Whitaker (Born 1967) | | Chief Compliance Officer, since 2016 | | Senior Vice President and Chief Compliance Officer since 2016. Senior Vice President and Chief Compliance Officer for Fidelity Investments from 2007 to 2016. | | |
David Berardi (Born 1975) | | Assistant Treasurer, since 2009 | | Vice President of Wells Fargo Funds Management, LLC since 2009. Vice President of Evergreen Investment Management Company, LLC from 2008 to 2010. Manager of Fund Reporting and Control for Evergreen Investment Management Company, LLC from 2004 to 2010. | | |
| 1 | Jeremy DePalma acts as Treasurer of 77 funds and Assistant Treasurer of 77 funds in the Fund Complex. |
| 2 | The Statement of Additional Information includes additional information about the Trustees and is available, without charge, upon request, by calling 1-800-222-8222 or by visiting the website at wellsfargofunds.com. |
| 3 | Alexander Kymn became the Secretary and Chief Legal Officer effective April 17, 2018. |
| | | | | | |
| Other information (unaudited) | | Wells Fargo Endeavor Select Fund | | | 31 | |
BOARD CONSIDERATION OF INVESTMENT MANAGEMENT AND SUB-ADVISORY AGREEMENTS:
Wells Fargo Endeavor Select Fund
Under the Investment Company Act of 1940 (the “1940 Act”), the Board of Trustees (the “Board”) of Wells Fargo Funds Trust (the “Trust”) must determine annually whether to approve the continuation of the Trust’s investment management and sub-advisory agreements. In this regard, at an in-person meeting held on May 22-23, 2018 (the “Meeting”), the Board, all the members of which have no direct or indirect interest in the investment management and sub-advisory agreements and are not “interested persons” of the Trust, as defined in the 1940 Act (the “Independent Trustees”), reviewed and approved for Wells Fargo Endeavor Select Fund (the “Fund”): (i) an investment management agreement (the “Management Agreement”) with Wells Fargo Funds Management, LLC (“Funds Management”); and (ii) an investment sub-advisory agreement (the “Sub-Advisory Agreement”) with Wells Capital Management Incorporated (the “Sub-Adviser”), an affiliate of Funds Management. The Management Agreement and the Sub-Advisory Agreement are collectively referred to as the “Advisory Agreements.”
At the Meeting, the Board considered the factors and reached the conclusions described below relating to the selection of Funds Management and the Sub-Adviser and the approval of the Advisory Agreements. Prior to the Meeting, including at an in-person meeting in April 2018, the Trustees conferred extensively among themselves and with representatives of Funds Management about these matters. Also, the Board has adopted a team-based approach, with each team consisting of a sub-set of Trustees, to assist the full Board in the discharge of its duties in reviewing investment performance and other matters throughout the year. The Independent Trustees were assisted in their evaluation of the Advisory Agreements by independent legal counsel, from whom they received separate legal advice and with whom they met separately.
In providing information to the Board, Funds Management and the Sub-Adviser were guided by a detailed set of requests for information submitted to them by independent legal counsel on behalf of the Independent Trustees at the start of the Board’s annual contract renewal process earlier in 2018. In considering and approving the Advisory Agreements, the Trustees considered the information they believed relevant, including but not limited to the information discussed below. The Board considered not only the specific information presented in connection with the Meeting, but also the knowledge gained over time through interaction with Funds Management and the Sub-Adviser about various topics. In this regard, the Board reviewed reports of Funds Management at each of its quarterly meetings, which included, among other things, portfolio reviews and investment performance reports. In addition, the Board and the teams mentioned above confer with portfolio managers at various times throughout the year. The Board did not identify any particular information or consideration that was all-important or controlling, and each individual Trustee may have attributed different weights to various factors.
After its deliberations, the Board unanimously approved the continuation of the Advisory Agreements for a one-year term and determined that the compensation payable to Funds Management and the Sub-Adviser under each of the Advisory Agreements was reasonable. The Board considered the approval of the Advisory Agreements for the Fund as part of its consideration of agreements for funds across the complex, but its approvals were made on a fund-by-fund basis. The following summarizes a number of important, but not necessarily all, factors considered by the Board in support of its approvals.
Nature, extent and quality of services
The Board received and considered various information regarding the nature, extent and quality of services provided to the Fund by Funds Management and the Sub-Adviser under the Advisory Agreements. This information included a description of the investment advisory services and Fund-level administrative services covered by the Management Agreement, as well as, among other things, a summary of the background and experience of senior management of Wells Fargo Asset Management (“WFAM”), of which Funds Management and the Sub-Adviser are a part, a summary of investments made in the business of WFAM, a summary of certain organizational and personnel changes involving Funds Management and the Sub-Adviser, and a description of Funds Management’s and the Sub-Adviser’s business continuity planning programs and of their approaches to data privacy and cybersecurity. The Board also considered the qualifications, background, tenure and responsibilities of each of the portfolio managers primarily responsible for the day-to-day portfolio management of the Fund.
The Board evaluated the ability of Funds Management and the Sub-Adviser to attract and retain qualified investment professionals, including research, advisory and supervisory personnel. The Board further considered the compliance programs and compliance records of Funds Management and the Sub-Adviser. In addition, the Board took into account the full range of services provided to the Fund by Funds Management and its affiliates.
| | | | |
| 32 | | Wells Fargo Endeavor Select Fund | | Other information (unaudited) |
Fund investment performance and expenses
The Board considered the investment performance results for the Fund over various time periods ended December 31, 2017. The Board considered these results in comparison to the investment performance of funds in a universe that was determined by Broadridge Inc. (“Broadridge”) to be similar to the Fund (the “Universe”), and in comparison to the Fund’s benchmark index and to other comparative data. Broadridge is an independent provider of investment company data. The Board received a description of the methodology used by Broadridge to select the mutual funds in the performance Universe. The Board noted that the investment performance of the Fund (Administrator Class) was higher than the average investment performance of the Universe for the one- and three-year periods under review, but lower than the average investment performance of the Universe for the five- and ten-year periods under review. The Board also noted that the investment performance of the Fund was higher than its benchmark index, the Russell 1000 Growth Index, for the one-year period under review, but lower than its benchmark index for the three-, five-, and ten-year periods under review.
The Board also received and considered information regarding the Fund’s net operating expense ratios and their various components, including actual management fees, custodian and other non-management fees, and Rule 12b-1 and non-Rule 12b-1 shareholder service fees. The Board considered these ratios in comparison to the median ratios of funds in class-specific expense groups that were determined by Broadridge to be similar to the Fund (the “Groups”). The Board received a description of the methodology used by Broadridge to select the mutual funds in the expense Groups and an explanation of how funds comprising expense groups and their expense ratios may vary from year-to-year. Based on the Broadridge reports, the Board noted that the net operating expense ratios of the Fund were lower than or equal to the median net operating expense ratios of the expense Groups for each share class.
The Board took into account the Fund’s investment performance and expense information provided to it among the factors considered in deciding to re-approve the Advisory Agreements.
Investment management and sub-advisory fee rates
The Board reviewed and considered the contractual fee rates payable by the Fund to Funds Management under the Management Agreement, as well as the contractual fee rates payable by the Fund to Funds Management for class-level administrative services under a Class-Level Administration Agreement, which include, among other things, class-level transfer agency and sub-transfer agency costs (collectively, the “Management Rates”). The Board also reviewed and considered the contractual investment sub-advisory fee rates that are payable by Funds Management to the Sub-Adviser for investment sub-advisory services.
Among other information reviewed by the Board was a comparison of the Fund’s Management Rates with the average contractual investment management fee rates of funds in the expense Groups at a common asset level as well as transfer agency costs of the funds in the expense Groups. The Board noted that the Management Rates of the Fund were lower than or in the range of the sum of these average rates for the Fund’s expense Groups for all share classes. The Board noted that the net operating expense ratios of the Fund were lower than or in range of the median net operating expense ratios of the expense Groups for each share class.
The Board also received and considered information about the portion of the total management fee that was retained by Funds Management after payment of the fee to the Sub-Adviser for sub-advisory services. In assessing the reasonableness of this amount, the Board received and evaluated information about the nature and extent of responsibilities retained and risks assumed by Funds Management and not delegated to or assumed by the Sub-Adviser, and about Funds Management’s on-going oversight services. Given the affiliation between Funds Management and the Sub-Adviser, the Board ascribed limited relevance to the allocation of fees between them.
The Board also received and considered information about the nature and extent of services offered and fee rates charged by Funds Management and the Sub-Adviser to other types of clients with investment strategies similar to those of the Fund. In this regard, the Board received information about the significantly greater scope of services, and compliance, reporting and other legal burdens and risks of managing mutual funds compared with those associated with managing assets of non-mutual fund clients such as institutional separate accounts.
Based on its consideration of the factors and information it deemed relevant, including those described here, the Board determined that the compensation payable to Funds Management under the Management Agreement and to the Sub-Adviser under the Sub-Advisory Agreement was reasonable.
Profitability
The Board received and considered information concerning the profitability of Funds Management, as well as the profitability of both WFAM and Wells Fargo & Co. (“Wells Fargo”) as a whole, from providing services to the Fund and the fund family as a whole. The Board noted that the Sub-Adviser’s profitability information with respect to providing services to the Fund was subsumed in the WFAM and Wells Fargo profitability analysis.
| | | | | | |
| Other information (unaudited) | | Wells Fargo Endeavor Select Fund | | | 33 | |
Funds Management reported on the methodologies and estimates used in calculating profitability, including a description of the methodology used to allocate certain expenses and recent enhancements made to the methodology. Among other things, the Board noted that the levels of profitability reported on a fund-by-fund basis varied widely, depending on factors such as the size and type of fund. Based on its review, the Board did not deem the profits reported by Funds Management, WFAM or Wells Fargo from services provided to the Fund to be at a level that would prevent it from approving the continuation of the Advisory Agreements.
Economies of scale
The Board considered the extent to which Funds Management may experience economies of scale in the provision of management services, and the extent to which scale benefits, if any, would be shared with shareholders. In particular, the Board noted the existence of breakpoints in the Fund’s management fee structure, which operate generally to reduce the Fund’s expense ratios as the Fund grows in size. It considered that, for a small fund or a fund that shrinks in size, breakpoints conversely can result in higher fee levels. The Board also considered that in addition to management fee breakpoints, competitive management fee rates set at the outset without regard to breakpoints and fee waiver and expense reimbursement arrangements, as well as investments in the business intended to enhance services available to Fund shareholders, are means of sharing potential economies of scale with shareholders of the Fund.
The Board concluded that the Fund’s fee and expense arrangements, including contractual breakpoints, constituted a reasonable approach to sharing potential economies of scale with the Fund and its shareholders.
Other benefits to Funds Management and the Sub-Adviser
The Board received and considered information regarding potential “fall-out” or ancillary benefits received by Funds Management and its affiliates, including the Sub-Adviser, as a result of their relationships with the Fund. Ancillary benefits could include, among others, benefits directly attributable to other relationships with the Fund and benefits potentially derived from an increase in Funds Management’s and the Sub-Adviser’s business as a result of their relationships with the Fund. The Board noted that various affiliates of Funds Management may receive distribution-related fees, shareholder servicing payments and sub-transfer agency fees in respect of shares sold or held through them and services provided.
The Board also reviewed information about soft dollar credits earned and utilized by the Sub-Adviser, fees earned by Funds Management and the Sub-Adviser from managing a private investment vehicle for the fund family’s securities lending collateral and commissions earned by an affiliated broker from portfolio transactions.
Based on its consideration of the factors and information it deemed relevant, including those described here, the Board did not find that any ancillary benefits received by Funds Management and its affiliates, including the Sub-Adviser, were unreasonable.
Conclusion
At the Meeting, after considering the above-described factors and based on its deliberations and its evaluation of the information described above, the Board unanimously approved the continuation of the Advisory Agreements for a one-year term and determined that the compensation payable to Funds Management and the Sub-Adviser under each of the Advisory Agreements was reasonable.
| | | | |
| 34 | | Wells Fargo Endeavor Select Fund | | Appendix A (unaudited) |
SALES CHARGE REDUCTIONS AND WAIVERS FOR CERTAIN INTERMEDIARIES
Ameriprise
Effective June 1, 2018, shareholders purchasing Fund shares through an Ameriprise Financial platform or account will be eligible only for the following Class A load waivers (front-end sales charge waivers), which may differ from those disclosed elsewhere in the Fund’s prospectus or Statement of Additional Information.
Front-end Sales Load Waivers on Class A Shares Available at Ameriprise Financial
| | • | | Employer-sponsored retirement plans (e.g., 401(k) plans, 457 plans, employer-sponsored 403(b) plans, profit sharing and money purchase pension plans and defined benefit plans). For purposes of this provision, employer-sponsored retirement plans do not include SEP IRAs, Simple IRAs or SAR-SEPs. |
| | • | | Shares purchased through an Ameriprise Financial investment advisory program (if an Advisory or similar share class for such investment advisory program is not available) |
| | • | | Shares purchased by third party investment advisors on behalf of their advisory clients through Ameriprise Financial’s platform (if an Advisory or similar share class for such investment advisory program is not available) |
| | • | | Shares purchased through reinvestment of distributions and dividend reinvestment when purchasing shares of the same Fund (but not any other fund within the same fund family) |
| | • | | Shares exchanged from Class C shares of the same fund in the month of or following the 10-year anniversary of the purchase date. To the extent that the Fund’s prospectus elsewhere provides for a waiver with respect to such shares following a shorter holding period, that waiver will apply to exchanges following such shorter period. To the extent that the Fund’s prospectus elsewhere provides for a waiver with respect to exchanges of Class C shares for load-waived shares, that waiver will also apply to such exchanges. |
| | • | | Employees and registered representatives of Ameriprise Financial or its affiliates and their immediate family members |
| | • | | Shares purchased by or through qualified accounts (including IRAs, Coverdell Education Savings Accounts, 401(k)s, 403(b) TSCAs subject to ERISA and defined benefit plans) that are held by a covered family member, defined as an Ameriprise financial advisor and/or the advisor’s spouse, advisor’s lineal ascendant (mother, father, grandmother, grandfather, great grandmother, great grandfather), advisor’s lineal descendant (son, step-son, daughter, step-daughter, grandson, granddaughter, great grandson, great granddaughter) or any spouse of a covered family member who is a lineal descendant |
| | • | | Shares purchased from the proceeds of redemptions within the same fund family, provided (1) the repurchase occurs within 90 days following the redemption, (2) the redemption and purchase occur in the same account, and (3) redeemed shares were subject to a front-end or deferred sales load (i.e. Rights of Reinstatement). Subject to the Fund’s policy regarding frequent purchases and redemptions of Fund shares, you may not be able to repurchase shares for the first 30 days after your redemption. |
Automatic Exchange of Class C Shares Available at Ameriprise Financial
| | • | | Class C shares will automatically exchange to Class A shares in the month of the 10-year anniversary of the purchase date. |
Merrill Lynch
Effective April 10, 2017, shareholders purchasing Fund shares through a Merrill Lynch platform or account will be eligible only for the following load waivers (front-end sales charge waivers and contingent deferred, or back-end, sales charge waivers) and discounts, which may differ from those disclosed elsewhere in the Fund’s prospectus or Statement of Additional Information.
Front-end Sales Load Waivers on Class A Shares available at Merrill Lynch
| | • | | Employer-sponsored retirement, deferred compensation and employee benefit plans (including health savings accounts) and trusts used to fund those plans, provided that the shares are not held in a commission-based brokerage account and shares are held for the benefit of the plan |
| | • | | Shares purchased by or through a 529 Plan |
| | • | | Shares purchased through a Merrill Lynch affiliated investment advisory program |
| | | | | | |
| Appendix A (unaudited) | | Wells Fargo Endeavor Select Fund | | | 35 | |
| | • | | Shares purchased by third party investment advisors on behalf of their advisory clients through Merrill Lynch’s platform |
| | • | | Shares of funds purchased through the Merrill Edge Self-Directed platform (if applicable) |
| | • | | Shares purchased through reinvestment of capital gains distributions and dividend reinvestment when purchasing shares of the same fund (but not any other fund within the fund family) |
| | • | | Shares exchanged from Class C (i.e. level-load) shares of the same fund in the month of or following the 10-year anniversary of the purchase date |
| | • | | Employees and registered representatives of Merrill Lynch or its affiliates and their family members, as defined by Merrill Lynch, which may differ from the definition of family member in the Fund’s prospectus. |
| | • | | Directors or Trustees of the Fund, and employees of the Fund’s investment adviser or any of its affiliates, as described in the Fund’s prospectus |
| | • | | Shares purchased from the proceeds of redemptions within the same fund family, provided (1) the repurchase occurs within 90 days following the redemption, (2) the redemption and purchase occur in the same account, and (3) redeemed shares were subject to a front-end or deferred sales load (known as Rights of Reinstatement). Subject to the Fund’s policy regarding frequent purchases and redemptions of Fund shares, you may not be able to repurchase shares for the first 30 days after your redemption. |
CDSC Waivers on A, B and C Shares available at Merrill Lynch
| | • | | Death or disability of the shareholder |
| | • | | Shares sold as part of a systematic withdrawal plan as described in the Fund’s prospectus |
| | • | | Return of excess contributions from an IRA Account |
| | • | | Shares sold as part of a required minimum distribution for IRA and retirement accounts due to the shareholder reaching age 70½ |
| | • | | Shares sold to pay Merrill Lynch fees but only if the transaction is initiated by Merrill Lynch |
| | • | | Shares acquired through a right of reinstatement |
| | • | | Shares held in retirement brokerage accounts, that are exchanged for a lower cost share class due to transfer to certain fee based accounts or platforms (applicable to A and C shares only) |
Front-end load Discounts Available at Merrill Lynch: Breakpoints, Rights of Accumulation & Letters of Intent
| | • | | Breakpoints as described in the Fund’s prospectus |
| | • | | Rights of Accumulation (ROA) which entitle shareholders to breakpoint discounts will be automatically calculated based on the aggregated holding of fund family assets held by accounts within the purchaser’s household at Merrill Lynch. Eligible fund family assets not held at Merrill Lynch may be included in the ROA calculation only if the shareholder notifies his or her financial advisor about such assets. |
| | • | | Letters of Intent (LOI) which allow for breakpoint discounts based on anticipated purchases within a fund family, through Merrill Lynch, over a 13-month period of time (if applicable) |
Morgan Stanley
Effective on or about July 1, 2018, shareholders purchasing Fund shares through a Morgan Stanley Wealth Management transactional brokerage account will be eligible only for the following Class A load waivers (front-end sales charge waivers), which may differ from and be more limited than those disclosed in the Fund’s prospectus or Statement of Additional Information.
Front-end Sales Load Waivers on Class A Shares Available at Morgan Stanley
| | • | | Employer-sponsored retirement plans (e.g., 401(k) plans, 457 plans, employer-sponsored 403(b) plans, profit sharing and money purchase pension plans and defined benefit plans). For purposes of this provision, employer-sponsored retirement plans do not include SEP IRAs, Simple IRAs, SAR-SEPs or Keogh plans. |
| | • | | Morgan Stanley employee and employee-related accounts according to Morgan Stanley’s account linking rules |
| | • | | Shares purchased through reinvestment of dividends and capital gains distributions when purchasing shares of the same fund |
| | • | | Shares purchased through a Morgan Stanley self-directed brokerage account |
| | | | |
| 36 | | Wells Fargo Endeavor Select Fund | | Appendix A (unaudited) |
| | • | | Class C (i.e., level-load) shares that are no longer subject to a contingent deferred sales charge and are exchanged to Class A shares of the same fund pursuant to Morgan Stanley Wealth Management’s share class exchange program. |
| | • | | Shares purchased from the proceeds of redemptions within the same fund family, provided (i) the repurchase occurs within 90 days following the redemption, (ii) the redemption and purchase occur in the same account, and (iii) redeemed shares were subject to a front-end or deferred sales charge. This waiver is subject to the Fund’s policy regarding frequent purchases and redemption of Fund shares, as discussed under “Account Information—Frequent Purchases and Redemptions of Fund Shares” in the Fund’s prospectus. |

For more information
More information about Wells Fargo Funds is available free upon request. To obtain literature, please write, email, visit the Fund’s website, or call:
Wells Fargo Funds
P.O. Box 219967
Kansas City, MO 64121-9967
Website: wellsfargofunds.com
Individual investors: 1-800-222-8222
Retail investment professionals: 1-888-877-9275
Institutional investment professionals: 1-866-765-0778
This report and the financial statements contained herein are submitted for the general information of the shareholders of the Fund. If this report is used for promotional purposes, distribution of the report must be accompanied or preceded by a current prospectus. Before investing, please consider the investment objectives, risks, charges, and expenses of the investment. For a current prospectus and, if available, a summary prospectus, containing this information, call 1-800-222-8222 or visit the Fund’s website at wellsfargofunds.com. Read the prospectus carefully before you invest or send money.
Wells Fargo Asset Management (WFAM) is the trade name for certain investment advisory/management firms owned by Wells Fargo & Company. These firms include but are not limited to Wells Capital Management Incorporated and Wells Fargo Funds Management, LLC. Certain products managed by WFAM entities are distributed by Wells Fargo Funds Distributor, LLC (a broker/dealer and Member FINRA).
This material is for general informational and educational purposes only and is NOT intended to provide investment advice or a recommendation of any kind—including a recommendation for any specific investment, strategy, or plan.
NOT FDIC INSURED ◾ NO BANK GUARANTEE ◾ MAY LOSE VALUE
© 2018 Wells Fargo Funds Management, LLC. All rights reserved.
| | |
 | | 314795 09-18 A205/AR205 07-18 |
Annual Report
July 31, 2018

Wells Fargo Growth Fund


Reduce clutter. Save trees.
Sign up for electronic delivery of prospectuses and shareholder reports at wellsfargo.com/advantagedelivery
Contents
The views expressed and any forward-looking statements are as of July 31, 2018, unless otherwise noted, and are those of the Fund managers and/or Wells Fargo Funds Management, LLC. Discussions of individual securities, or the markets generally, or any Wells Fargo Fund are not intended as individual recommendations. Future events or results may vary significantly from those expressed in any forward-looking statements. The views expressed are subject to change at any time in response to changing circumstances in the market. Wells Fargo Funds Management, LLC and the Fund disclaim any obligation to publicly update or revise any views expressed or forward-looking statements.
NOT FDIC INSURED ◾ NO BANK GUARANTEE ◾ MAY LOSE VALUE
| | | | |
| 2 | | Wells Fargo Growth Fund | | Letter to shareholders (unaudited) |

Andrew Owen
President
Wells Fargo Funds
After advancing during the summer and fall of 2017 in a roughly synchronized way, economic growth and stock markets globally diverged during the first seven months of 2018.
Dear Shareholder:
We are pleased to offer you this annual report for the Wells Fargo Growth Fund for the 12-month period that ended July 31, 2018. After advancing during the summer and fall of 2017 in a roughly synchronized way, economic growth and stock markets globally diverged during the first seven months of 2018. For fixed-income investors, higher U.S. interest rates, rising inflation, and intensifying global geopolitical tensions tended to restrain taxable bond prices while high-yield and municipal bond investors generally enjoyed positive returns.
For the period, U.S. stocks, as measured by the S&P 500 Index,1 gained 16.24%, and international stocks, as measured by the MSCI ACWI ex USA Index (Net),2 added 5.94%. Emerging market stocks, as measured by the MSCI EM Index (Net),3 added 4.36%. In bond markets, the Bloomberg Barclays U.S. Aggregate Bond Index4 declined 0.80% while fixed-income investments outside the U.S. fell 0.27%, according to the Bloomberg Barclays Global Aggregate ex-USD Index.5 The Bloomberg Barclays Municipal Bond Index6 added 0.99%, and the ICE BofAML U.S. High Yield Index7 was up 2.49%.
Volatility increased as summer turned to fall in 2017, although data generally was favorable.
During the third quarter of 2017, investor expectations rose and fell amid shifting geopolitical tensions, particularly in Asia as North Korea’s nuclear aspirations and U.S./China trade rhetoric caused concerns. In the U.S., corporate earnings and consumer confidence improved. The U.S. Bureau of Economic Analysis reported that annualized U.S. gross domestic product (GDP) growth for the quarter was 2.8%. The rate of inflation was below the U.S. Federal Reserve’s (Fed’s) targets.
Economic momentum increased in Europe; the European Central Bank (ECB) held its rates steady at low levels and continued its quantitative easing bond-buying program with the goal of sparking economic activity. In emerging markets, many countries benefited from stronger currencies versus the U.S. dollar while commodity price increases benefited countries that rely on natural resources for exports.
| 1 | The S&P 500 Index consists of 500 stocks chosen for market size, liquidity, and industry group representation. It is a market-value-weighted index with each stock’s weight in the index proportionate to its market value. You cannot invest directly in an index. |
| 2 | The Morgan Stanley Capital International (MSCI) All Country World Index (ACWI) ex USA Index (Net) is a free-float-adjusted market-capitalization-weighted index that is designed to measure the equity market performance of developed markets, excluding the United States and Canada. Source: MSCI. MSCI makes no express or implied warranties or representations and shall have no liability whatsoever with respect to any MSCI data contained herein. The MSCI data may not be further redistributed or used as a basis for other indices or any securities or financial products. This report is not approved, reviewed, or produced by MSCI. You cannot invest directly in an index. |
| 3 | The MSCI Emerging Markets (EM) Index (Net) is a free-float-adjusted market-capitalization-weighted index that is designed to measure large- and mid-cap equity market performance of emerging markets. The MSCI EM Index (Net) consists of the following 24 emerging market country indices: Brazil, Chile, China, Colombia, Czech Republic, Egypt, Greece, Hungary, India, Indonesia, Korea, Malaysia, Mexico, Pakistan, Peru, the Philippines, Poland, Qatar, Russia, South Africa, Taiwan, Thailand, Turkey, and the United Arab Emirates. You cannot invest directly in an index. |
| 4 | The Bloomberg Barclays U.S. Aggregate Bond Index is a broad-based benchmark that measures the investment-grade, U.S. dollar-denominated, fixed-rate taxable bond market, including Treasuries, government-related and corporate securities, mortgage-backed securities (agency fixed-rate and hybrid adjustable-rate mortgage pass-throughs), asset-backed securities, and commercial mortgage-backed securities. You cannot invest directly in an index. |
| 5 | The Bloomberg Barclays Global Aggregate ex-USD Index is an unmanaged index that provides a broad-based measure of the global investment-grade fixed-income markets excluding the U.S. dollar-denominated debt market. You cannot invest directly in an index. |
| 6 | The Bloomberg Barclays Municipal Bond Index is an unmanaged index composed of long-term tax-exempt bonds with a minimum credit rating of Baa. You cannot invest directly in an index. |
| 7 | The ICE BofAML U.S. High Yield Index is a market-capitalization-weighted index of domestic and Yankee high-yield bonds. The index tracks the performance of high-yield securities traded in the U.S. bond market. You cannot invest directly in an index. Copyright 2018. ICE Data Indices, LLC. All rights reserved. |
| 8 | The Consumer Price Index For All Urban Consumers (CPI-U) measures the changes in the price of a basket of goods and services purchased by urban consumers. The urban consumer population is deemed by many as a better representative measure of the general public because most of the country’s population lives in highly populated areas, which represent close to 90% of the total population. You cannot invest directly in an index. |
| | | | | | |
| Letter to shareholders (unaudited) | | Wells Fargo Growth Fund | | | 3 | |
The fourth quarter of 2017 was characterized by continued optimism in the U.S.
By the end of 2017, some observers were describing conditions as a Goldilocks economic scenario: synchronized global growth, low inflation, and healthy corporate earnings, all supported abroad by a weaker U.S. dollar.
U.S. stocks continued to rally during the fourth quarter of 2017, boosted by favorable company earnings and the potential for tax reform and industry deregulation. The Fed increased rates by 25 basis points (bps; 100 bps equal 1.00%) in December. The annualized GDP growth rate for the fourth quarter was 2.3%.
Internationally, the Bank of England (BoE) raised interest rates in November 2017 to 0.50%, the first increase in more than 10 years and a move up from the 0.25% rate put in place after the Brexit vote to leave the European Union in June 2016. The pound gained against other currencies. Meanwhile, the ECB and the Bank of Japan maintained interest rate policies and bond-buying programs intended to spur business activities and enhance the attractiveness of equity investments. The People’s Bank of China (PBOC) also continued policies that encouraged business investment. International equity markets, particularly emerging markets, continued to show strength.
Volatility reemerged during the first quarter of 2018 as economic signals were mixed.
The first quarter of 2018 began with stock market gains in January following U.S. tax reform that lowered rates for individuals and corporations and deregulation advanced in some economic sectors. Then, investor optimism was supplanted by several concerns. Trade tensions intensified, particularly between the U.S. and China. The U.S. threatened to impose tariffs on a broad range of imported products. Increasing interest rates and inflation also caused concern. During February 2018, the U.S. stock market endured a loss of more than 10% before recovering in March and April. The S&P 500 Index closed the first quarter with a negative return, the first negative quarterly return for the index since 2014.
The Fed increased the federal funds rate by 25 bps in March 2018 and the rate of inflation reached the Fed’s 2% target for the first time in a year. The unemployment rate fell to 4.1%. The third revision of first-quarter GDP growth by the U.S. Bureau of Economic Analysis released during June 2018 was lowered to 2.0%.
Overseas, investment market returns reversed the strong returns of 2017. After having gained 27.19% for the 12-month period that ended December 31, 2017, the MSCI ACWI ex USA Index (Net) fell 1.46% for the 7-month period that ended July 31, 2018. The U.S. dollar strengthened relative to local currencies, which served to restrain returns.
Global trade tensions escalated during the second quarter and into the third quarter of 2018.
Global trade tensions escalated as the second quarter of 2018 opened and equity markets fell in response before resuming upward momentum later in April. The U.S. government imposed tariffs on products and commodities imported from other markets in North America, Europe, and Asia. In retaliation, governments imposed tariffs on U.S. products and commodities. In addition, the U.S. pushed its North American neighbors to renegotiate the North American Free Trade Agreement, furthering trade tensions and investor uncertainty.
The CPI-U8 added 0.2% in May after a similar increase in April. On a year-over-year basis, the all-items index rose 2.8% for the 12 months that ended May 31, continuing its upward trend since the beginning of the year. The index for all items less food and energy rose 2.2% for the same 12-month period. Interest rates generally increased and the bond markets tended to decline.
During February 2018, the U.S. stock market endured a loss of more than 10% before recovering in March and April.
| | | | |
| 4 | | Wells Fargo Growth Fund | | Letter to shareholders (unaudited) |
During June 2018, the Fed increased the federal funds rate by 25 bps. Investment markets began to anticipate two more rate increases in 2018. Long-term interest rates in the U.S. trended higher—rates on the 10-year and 30-year Treasury bonds moved from 2.46% and 2.81%, respectively, on January 1, 2018, to 2.96% and 3.08%, respectively, on July 31, 2018. While higher at the end of the period, rates were off their peak levels on May 17, 2018, of 3.11% and 3.25%, respectively. Investors became more aware of and concerned about the potential for an inverted yield curve—sometimes a recession signal—as short-term rates increased more quickly than long-term rates.
The unemployment rate fell to 3.9% in July after ticking up slightly in June from May’s 3.8% level, according to the U.S. Department of Labor. The annualized rate of GDP growth for the second quarter of 2018 was reported in July to be 4.1%, the highest level since the third quarter of 2014, according to the U.S. Bureau of Economic Analysis.
Internationally, the prospects for a smooth U.K. Brexit agreement was cast into doubt as members of Prime Minister Theresa May’s negotiating team resigned. Despite the uncertainty, the period closed with expectations that the BoE’s Monetary Policy Committee in July would announce an increase in its key interest rate to 0.75%, which it did in early August.
Meanwhile, central banks in Europe and Japan maintained low interest rates and accommodative monetary policies. Amid rising trade uncertainty, PBOC monetary policies shifted with cuts to reserve requirement ratios and implementation of supportive measures such as accelerated infrastructure spending and tax cuts for small and medium enterprises and for individuals. Nevertheless, a strengthening U.S. dollar and the tensions associated with trade policies remained headwinds for investors overseas.
Don’t let short-term uncertainty derail long-term investment goals.
Periods of investment uncertainty can present challenges, but experience has taught us that maintaining long-term investment goals can be an effective way to plan for the future. To help you create a sound strategy based on your personal goals and risk tolerance, Wells Fargo Funds offers more than 100 mutual funds spanning a wide range of asset classes and investment styles. Although diversification cannot guarantee an investment profit or prevent losses, we believe it can be an effective way to manage investment risk and potentially smooth out overall portfolio performance. We encourage investors to know their investments and to understand that appropriate levels of risk-taking may unlock opportunities.
Thank you for choosing to invest with Wells Fargo Funds. We appreciate your confidence in us and remain committed to helping you meet your financial needs.
Sincerely,

Andrew Owen
President
Wells Fargo Funds
| | | | | | |
| Letter to shareholders (unaudited) | | Wells Fargo Growth Fund | | | 5 | |
Notice to shareholders
At a meeting held on August 14-15, 2018, the Board of Trustees of the Fund approved the following policy which will be effective on or about February 5, 2019:
Class C shares will convert automatically into Class A shares ten years after the initial date of purchase or, if you acquired your Class C shares through an exchange or conversion from another share class, ten years after the date you acquired your Class C shares. When Class C shares that you acquired through a purchase or exchange convert, any other Class C shares that you purchased with reinvested dividends and distributions also will convert into Class A shares on a pro rata basis. A shorter holding period may also apply depending on your intermediary. Please see “Appendix A—Sales Charge Reductions and Waivers for Certain Intermediaries” in the Fund’s prospectus or at the end of this report.
For further information about your Fund, contact your investment professional, visit our website at wellsfargofunds.com, or call us directly at 1-800-222-8222.
| | | | |
| 6 | | Wells Fargo Growth Fund | | Performance highlights (unaudited) |
Investment objective
The Fund seeks long-term capital appreciation.
Manager
Wells Fargo Funds Management, LLC
Subadviser
Wells Capital Management Incorporated
Portfolio managers
Joseph M. Eberhardy, CFA®, CPA
Thomas C. Ognar, CFA®
Average annual total returns (%) as of July 31, 20181
| | | | | | | | | | | | | | | | | | | | | | | | | | | | | | | | | | |
| | | | | Including sales charge | | | Excluding sales charge | | | Expense ratios2 (%) | |
| | | Inception date | | 1 year | | | 5 year | | | 10 year | | | 1 year | | | 5 year | | | 10 year | | | Gross | | | Net3 | |
| Class A (SGRAX) | | 2-24-2000 | | | 20.33 | | | | 11.81 | | | | 12.63 | | | | 27.66 | | | | 13.14 | | | | 13.30 | | | | 1.17 | | | | 1.16 | |
| Class C (WGFCX) | | 12-26-2002 | | | 25.73 | | | | 12.30 | | | | 12.46 | | | | 26.73 | | | | 12.30 | | | | 12.46 | | | | 1.92 | | | | 1.91 | |
| Class R6 (SGRHX) | | 9-30-2015 | | | – | | | | – | | | | – | | | | 28.26 | | | | 13.65 | | | | 13.81 | | | | 0.74 | | | | 0.70 | |
| Administrator Class (SGRKX) | | 8-30-2002 | | | – | | | | – | | | | – | | | | 27.90 | | | | 13.38 | | | | 13.57 | | | | 1.09 | | | | 0.96 | |
| Institutional Class (SGRNX) | | 2-24-2000 | | | – | | | | – | | | | – | | | | 28.21 | | | | 13.62 | | | | 13.80 | | | | 0.84 | | | | 0.75 | |
| Russell 3000® Growth Index4 | | – | | | – | | | | – | | | | – | | | | 22.86 | | | | 15.55 | | | | 12.27 | | | | – | | | | – | |
Figures quoted represent past performance, which is no guarantee of future results, and do not reflect taxes that a shareholder may pay on fund distributions or the redemption of fund shares. Investment return and principal value of an investment will fluctuate so that an investor’s shares, when redeemed, may be worth more or less than their original cost. Performance shown without sales charges would be lower if sales charges were reflected. Current performance may be lower or higher than the performance data quoted, which assumes the reinvestment of dividends and capital gains. Current month-end performance is available on the Fund’s website, wellsfargofunds.com.
Index returns do not include transaction costs associated with buying and selling securities, any mutual fund fees or expenses, or any taxes. It is not possible to invest directly in an index.
Please keep in mind that high double-digit returns were primarily achieved during favorable market conditions. You should not expect that such favorable returns can be consistently achieved. A fund’s performance, especially for short time periods, should not be the sole factor in making your investment decision.
For Class A shares, the maximum front-end sales charge is 5.75%. For Class C shares, the maximum contingent deferred sales charge is 1.00%. Performance including a contingent deferred sales charge assumes the sales charge for the corresponding time period. Class R6, Administrator Class, and Institutional Class shares are sold without a front-end sales charge or contingent deferred sales charge.
Stock values fluctuate in response to the activities of individual companies and general market and economic conditions. Certain investment strategies tend to increase the total risk of an investment (relative to the broader market). The Fund is exposed to foreign investment risk and smaller-company securities risk. Consult the Fund’s prospectus for additional information on these and other risks.
Please see footnotes on page 7.
| | | | | | |
| Performance highlights (unaudited) | | Wells Fargo Growth Fund | | | 7 | |
|
| Growth of $10,000 investment as of July 31, 20185 |
|
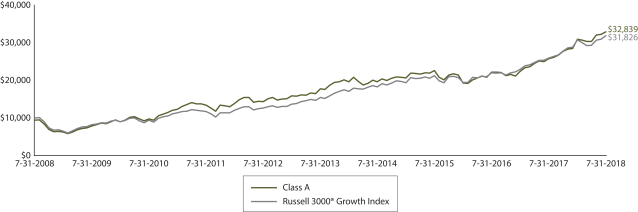 |
| 1 | Historical performance shown for Class R6 shares prior to their inception reflects the performance of Institutional Class shares, and includes the higher expenses applicable to Institutional Class shares. If these expenses had not been included, returns for Class R6 shares would be higher. |
| 2 | Reflects the expense ratios as stated in the most recent prospectuses. The expense ratios shown are subject to change and may differ from the annualized expense ratios shown in the financial highlights of this report. |
| 3 | The manager has contractually committed through November 30, 2018, to waive fees and/or reimburse expenses to the extent necessary to cap the Fund’s Total Annual Fund Operating Expenses After Fee Waivers at the amounts shown. After this time, the cap may be increased or the commitment to maintain the cap may be terminated only with the approval of the Board of Trustees. Brokerage commissions, stamp duty fees, interest, taxes, acquired fund fees and expenses (if any), and extraordinary expenses are excluded from the expense cap. Without this cap, the Fund’s returns would have been lower. The expense ratio paid by an investor is the net expense ratio (the total annual fund operating expenses after fee waivers) as stated in the prospectuses. |
| 4 | The Russell 3000® Growth Index measures the performance of those Russell 3000® Index companies with higher price/book ratios and higher forecasted growth values. You cannot invest directly in an index. |
| 5 | The chart compares the performance of Class A shares for the most recent ten years with the Russell 3000® Growth Index. The chart assumes a hypothetical investment of $10,000 in Class A shares and reflects all operating expenses and assumes the maximum initial sales charge of 5.75%. |
| 6 | The ten largest holdings, excluding cash, cash equivalents and any money market funds, are calculated based on the value of the investments divided by total net assets of the Fund. Holdings are subject to change and may have changed since the date specified. |
| 7 | Amounts are calculated based on the total long-term investments of the Fund. These amounts are subject to change and may have changed since the date specified. |
| * | This security was no longer held at the end of the reporting period. |
| | | | |
| 8 | | Wells Fargo Growth Fund | | Performance highlights (unaudited) |
MANAGER’S DISCUSSION
Fund highlights
| ∎ | | The Fund outperformed its benchmark, the Russell 3000® Growth Index, for the 12-month period that ended July 31, 2018. |
| ∎ | | Holdings within consumer discretionary, industrials, information technology (IT), and materials and an underweight to consumer staples aided the Fund’s performance for the period. |
| ∎ | | The Fund’s performance was inhibited by stocks within the health care sector. |
The equity market has remained buoyant over the trailing one-year period as strong economic fundamentals have outweighed a series of geopolitical issues, many of which were exacerbated during the first half of 2018. Strong equity performance largely has been an earnings story as robust profits have supported the market, particularly companies benefiting from secular growth drivers. For example, the success of many of our holdings in gaining share in their respective rapidly growing vertical markets has led to strong growth in revenues, cash flow, and earnings for these companies. Despite the increased volatility that emerged during the beginning of 2018, we have managed to navigate the volatility in the market well, trading around the valuation gap of many of our holdings to generate outperformance. With monetary policy expected to tighten, we believe that a tempered rise in rates is beneficial to faster-growth equities as it mollifies the bond proxy trade that has been a headwind to our investing style in recent years.
| | | | |
| Ten largest holdings (%) as of July 31, 20186 | |
Amazon.com Incorporated | | | 7.77 | |
Alphabet Incorporated Class A | | | 6.27 | |
Facebook Incorporated Class A | | | 3.69 | |
Microsoft Corporation | | | 3.42 | |
Microchip Technology Incorporated | | | 3.30 | |
Visa Incorporated Class A | | | 3.08 | |
MasterCard Incorporated Class A | | | 2.90 | |
Burlington Stores Incorporated | | | 2.21 | |
Apple Incorporated | | | 2.17 | |
PayPal Holdings Incorporated | | | 2.12 | |
Performance of consumer discretionary holdings benefited Fund performance.
Select holdings within the consumer discretionary sector were the best-performing area of the Fund. Robust e-commerce and retail sales were driven by strong spending data, which aided companies like Amazon.com, Incorporated, as well as discount retailers like Burlington Stores, Incorporated, with differentiated concepts that offer low prices, convenience, fresh inventory, and economies of scale that cater to a distinct demographic. In addition, select railroad holdings from the industrials sector contributed to performance as firms like Norfolk Southern Corporation reported strong rail volumes and effective cost discipline, which boosted its bottom line.
We remain overweight railroad companies due to their cost efficiencies and environmental benefits of shipping goods across the country.
|
| Sector distribution as of July 31, 20187 |
|
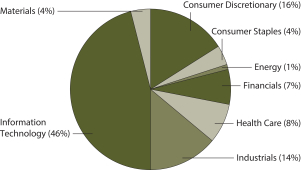 |
Other areas of the Fund that performed well were the high growth areas such as payment processing and software-as-a-service industries within IT that generated market-share penetration and margin expansion in their respective vertical markets. Within the payment space, the movement toward e-commerce has had a positive effect on overall demand as more consumers are moving from cash to digital payments. Within software, demand remained strong as corporate spending continued to rise, coupled with next-generation cloud computing platforms that garnered a disproportionate share of new business at the expense of legacy solutions. The Fund’s underweight to consumer staples also added to relative performance as many high-dividend-yielding equities have struggled in conjunction with a rise in fixed-income yields.
Please see footnotes on page 7.
| | | | | | |
| Performance highlights (unaudited) | | Wells Fargo Growth Fund | | | 9 | |
Certain health care holdings detracted from performance.
Select holdings in the health care sector inhibited relative returns during the period. Biotechnology stocks like Celgene Corporation* retraced prior price gains after reporting less-than-inspiring earnings results, with increasing competition impending on some of their key drugs. Throughout the course of the period, we reduced our exposure to the health care sector and the biotechnology industry within it. Although we believe that the industry remains innovative, many larger biopharma companies are facing questions around competition in existing core franchises and sustainability of growth after the future loss of exclusivity in key drugs.
Our view of faster-growth stocks is positive.
We are very positive on the outlook for faster-growth stocks, a core focus of our investment process. Many of these companies are trading at attractive valuations relative to the rest of the market. Additionally, many of our portfolio companies have continued to deliver strong revenue, cash flow, and earnings growth, which were rewarded by the market during the period. We believe that market leadership by growth stocks has been influenced by strong earnings fundamentals over the past several quarters. We also contend that growth companies should benefit from tax reform, influenced by their ability to retain much of the additional post-tax-reform profits. This is in contrast to many cyclical value-oriented names where, in our analysis, the tax benefits have been largely arbitraged away. Going forward, we believe that the faster-growing stocks emphasized in our investment process should continue to drive robust growth through pricing power and strong customer demand in an environment of slightly increased costs and uneven global growth trends.
Please see footnotes on page 7.
| | | | |
| 10 | | Wells Fargo Growth Fund | | Fund expenses (unaudited) |
As a shareholder of the Fund, you incur two types of costs: (1) transaction costs, including sales charges (loads) on purchase payments and contingent deferred sales charges (if any) on redemptions and (2) ongoing costs, including management fees, distribution (12b-1) and/or shareholder servicing fees, and other Fund expenses. This example is intended to help you understand your ongoing costs (in dollars) of investing in the Fund and to compare these costs with the ongoing costs of investing in other mutual funds.
The example is based on an investment of $1,000 invested at the beginning of the six-month period and held for the entire period from February 1, 2018 to July 31, 2018.
Actual expenses
The “Actual” line of the table below provides information about actual account values and actual expenses. You may use the information in this line, together with the amount you invested, to estimate the expenses that you paid over the period. Simply divide your account value by $1,000 (for example, an $8,600 account value divided by $1,000 = 8.6), then multiply the result by the number in the “Actual” line under the heading entitled “Expenses paid during period” for your applicable class of shares to estimate the expenses you paid on your account during this period.
Hypothetical example for comparison purposes
The “Hypothetical” line of the table below provides information about hypothetical account values and hypothetical expenses based on the Fund’s actual expense ratio and an assumed rate of return of 5% per year before expenses, which is not the Fund’s actual return. The hypothetical account values and expenses may not be used to estimate the actual ending account balance or expenses you paid for the period. You may use this information to compare the ongoing costs of investing in the Fund and other funds. To do so, compare this 5% hypothetical example with the 5% hypothetical examples that appear in the shareholder reports of the other funds.
Please note that the expenses shown in the table are meant to highlight your ongoing costs only and do not reflect any transactional costs, such as sales charges (loads) and contingent deferred sales charges. Therefore, the “Hypothetical” line of the table is useful in comparing ongoing costs only and will not help you determine the relative total costs of owning different funds. In addition, if these transactional costs were included, your costs would have been higher.
| | | | | | | | | | | | | | | | |
| | | Beginning
account value
2-1-2018 | | | Ending
account value
7-31-2018 | | | Expenses
paid during
the period¹ | | | Annualized net
expense ratio | |
Class A | | | | | | | | | | | | | | | | |
Actual | | $ | 1,000.00 | | | $ | 1,061.78 | | | $ | 6.03 | | | | 1.16 | % |
Hypothetical (5% return before expenses) | | $ | 1,000.00 | | | $ | 1,019.36 | | | $ | 5.90 | | | | 1.16 | % |
Class C | | | | | | | | | | | | | | | | |
Actual | | $ | 1,000.00 | | | $ | 1,057.90 | | | $ | 9.91 | | | | 1.91 | % |
Hypothetical (5% return before expenses) | | $ | 1,000.00 | | | $ | 1,015.58 | | | $ | 9.70 | | | | 1.91 | % |
Class R6 | | | | | | | | | | | | | | | | |
Actual | | $ | 1,000.00 | | | $ | 1,064.03 | | | $ | 3.64 | | | | 0.70 | % |
Hypothetical (5% return before expenses) | | $ | 1,000.00 | | | $ | 1,021.68 | | | $ | 3.57 | | | | 0.70 | % |
Administrator Class | | | | | | | | | | | | | | | | |
Actual | | $ | 1,000.00 | | | $ | 1,062.71 | | | $ | 4.99 | | | | 0.96 | % |
Hypothetical (5% return before expenses) | | $ | 1,000.00 | | | $ | 1,020.37 | | | $ | 4.89 | | | | 0.96 | % |
Institutional Class | | | | | | | | | | | | | | | | |
Actual | | $ | 1,000.00 | | | $ | 1,063.93 | | | $ | 3.90 | | | | 0.75 | % |
Hypothetical (5% return before expenses) | | $ | 1,000.00 | | | $ | 1,021.42 | | | $ | 3.82 | | | | 0.75 | % |
| 1 | Expenses paid is equal to the annualized net expense ratio of each class multiplied by the average account value over the period, multiplied by the number of days in the most recent fiscal half-year divided by the number of days in the fiscal year (to reflect the one-half-year period). |
| | | | | | |
| Portfolio of investments—July 31, 2018 | | Wells Fargo Growth Fund | | | 11 | |
| | | | | | | | | | | | | | | | |
| Security name | | | | | | | | Shares | | | Value | |
| | | |
Common Stocks: 99.93% | | | | | | | | | | | | | |
| | | | |
Consumer Discretionary: 15.62% | | | | | | | | | | | | | | | | |
| | | | |
| Diversified Consumer Services: 0.67% | | | | | | | | | | | | | | | | |
Bright Horizons Family Solutions Incorporated † | | | | | | | | | | | 134,180 | | | $ | 14,355,918 | |
Grand Canyon Education Incorporated † | | | | | | | | | | | 148,400 | | | | 17,293,052 | |
| | | | |
| | | | | | | | | | | | | | | 31,648,970 | |
| | | | | | | | | | | | | | | | |
| | | | |
| Hotels, Restaurants & Leisure: 0.80% | | | | | | | | | | | | | | | | |
Carnival Corporation | | | | | | | | | | | 420,300 | | | | 24,898,572 | |
Norwegian Cruise Line Holdings Limited † | | | | | | | | | | | 259,100 | | | | 12,962,773 | |
| | | | |
| | | | | | | | | | | | | | | 37,861,345 | |
| | | | | | | | | | | | | | | | |
| | | | |
| Internet & Direct Marketing Retail: 8.52% | | | | | | | | | | | | | | | | |
Amazon.com Incorporated † | | | | | | | | | | | 207,670 | | | | 369,120,965 | |
Netflix Incorporated † | | | | | | | | | | | 106,190 | | | | 35,833,816 | |
| | | | |
| | | | | | | | | | | | | | | 404,954,781 | |
| | | | | | | | | | | | | | | | |
| | | | |
| Multiline Retail: 1.39% | | | | | | | | | | | | | | | | |
Dollar Tree Incorporated † | | | | | | | | | | | 722,110 | | | | 65,914,201 | |
| | | | | | | | | | | | | | | | |
| | | | |
| Specialty Retail: 4.24% | | | | | | | | | | | | | | | | |
Burlington Stores Incorporated † | | | | | | | | | | | 688,100 | | | | 105,148,561 | |
Five Below Incorporated † | | | | | | | | | | | 249,475 | | | | 24,238,991 | |
The Home Depot Incorporated | | | | | | | | | | | 298,110 | | | | 58,882,687 | |
ULTA Beauty Incorporated † | | | | | | | | | | | 54,700 | | | | 13,368,133 | |
| | | | |
| | | | | | | | | | | | | | | 201,638,372 | |
| | | | | | | | | | | | | | | | |
| | | | |
Consumer Staples: 3.80% | | | | | | | | | | | | | | | | |
| | | | |
| Beverages: 2.13% | | | | | | | | | | | | | | | | |
Constellation Brands Incorporated Class A | | | | | | | | | | | 253,110 | | | | 53,211,315 | |
The Coca-Cola Company | | | | | | | | | | | 1,030,100 | | | | 48,033,563 | |
| | | | |
| | | | | | | | | | | | | | | 101,244,878 | |
| | | | | | | | | | | | | | | | |
| | | | |
| Food & Staples Retailing: 0.96% | | | | | | | | | | | | | | | | |
Costco Wholesale Corporation | | | | | | | | | | | 208,420 | | | | 45,583,538 | |
| | | | | | | | | | | | | | | | |
| | | | |
| Personal Products: 0.71% | | | | | | | | | | | | | | | | |
The Estee Lauder Companies Incorporated Class A | | | | | | | | | | | 250,160 | | | | 33,756,590 | |
| | | | | | | | | | | | | | | | |
| | | | |
Energy: 1.34% | | | | | | | | | | | | | | | | |
| | | | |
| Energy Equipment & Services: 0.15% | | | | | | | | | | | | | | | | |
Liberty Oilfield Services Class A « | | | | | | | | | | | 366,300 | | | | 7,179,480 | |
| | | | | | | | | | | | | | | | |
| | | | |
| Oil, Gas & Consumable Fuels: 1.19% | | | | | | | | | | | | | | | | |
Concho Resources Incorporated † | | | | | | | | | | | 335,600 | | | | 48,947,260 | |
Pioneer Natural Resources Company | | | | | | | | | | | 39,800 | | | | 7,532,946 | |
| | | | |
| | | | | | | | | | | | | | | 56,480,206 | |
| | | | | | | | | | | | | | | | |
The accompanying notes are an integral part of these financial statements.
| | | | |
| 12 | | Wells Fargo Growth Fund | | Portfolio of investments—July 31, 2018 |
| | | | | | | | | | | | | | | | |
| Security name | | | | | | | | Shares | | | Value | |
| | | | |
Financials: 7.53% | | | | | | | | | | | | | | | | |
| | | | |
| Capital Markets: 6.82% | | | | | | | | | | | | | | | | |
CME Group Incorporated | | | | | | | | | | | 304,560 | | | $ | 48,461,587 | |
E*TRADE Financial Corporation † | | | | | | | | | | | 285,700 | | | | 17,087,717 | |
MarketAxess Holdings Incorporated | | | | | | | | | | | 514,071 | | | | 99,611,538 | |
Raymond James Financial Incorporated | | | | | | | | | | | 726,240 | | | | 66,516,322 | |
TD Ameritrade Holding Corporation | | | | | | | | | | | 391,400 | | | | 22,368,510 | |
The Charles Schwab Corporation | | | | | | | | | | | 1,365,000 | | | | 69,696,900 | |
| | | | |
| | | | | | | | | | | | | | | 323,742,574 | |
| | | | | | | | | | | | | | | | |
| | | | |
| Thrifts & Mortgage Finance: 0.71% | | | | | | | | | | | | | | | | |
LendingTree Incorporated †« | | | | | | | | | | | 141,490 | | | | 33,787,812 | |
| | | | | | | | | | | | | | | | |
| | | | |
Health Care: 8.03% | | | | | | | | | | | | | | | | |
| | | | |
| Biotechnology: 3.65% | | | | | | | | | | | | | | | | |
Agios Pharmaceuticals Incorporated † | | | | | | | | | | | 252,800 | | | | 21,844,448 | |
Alexion Pharmaceuticals Incorporated † | | | | | | | | | | | 114,900 | | | | 15,277,104 | |
BioMarin Pharmaceutical Incorporated † | | | | | | | | | | | 48,100 | | | | 4,836,936 | |
Neurocrine Biosciences Incorporated † | | | | | | | | | | | 371,940 | | | | 37,376,251 | |
Sage Therapeutics Incorporated † | | | | | | | | | | | 118,300 | | | | 17,073,056 | |
Spark Therapeutics Incorporated †« | | | | | | | | | | | 80,530 | | | | 6,178,262 | |
Vertex Pharmaceuticals Incorporated † | | | | | | | | | | | 405,200 | | | | 70,930,260 | |
| | | | |
| | | | | | | | | | | | | | | 173,516,317 | |
| | | | | | | | | | | | | | | | |
| | | | |
| Health Care Equipment & Supplies: 2.09% | | | | | | | | | | | | | | | | |
Boston Scientific Corporation † | | | | | | | | | | | 1,928,170 | | | | 64,805,794 | |
Edwards Lifesciences Corporation † | | | | | | | | | | | 91,680 | | | | 13,059,816 | |
ICU Medical Incorporated † | | | | | | | | | | | 50,880 | | | | 14,592,384 | |
Stryker Corporation | | | | | | | | | | | 41,900 | | | | 6,840,175 | |
| | | | |
| | | | | | | | | | | | | | | 99,298,169 | |
| | | | | | | | | | | | | | | | |
| | | | |
| Health Care Technology: 1.54% | | | | | | | | | | | | | | | | |
Veeva Systems Incorporated Class A † | | | | | | | | | | | 964,900 | | | | 72,975,387 | |
| | | | | | | | | | | | | | | | |
| | | | |
| Life Sciences Tools & Services: 0.07% | | | | | | | | | | | | | | | | |
PRA Health Sciences Incorporated † | | | | | | | | | | | 29,000 | | | | 3,049,060 | |
| | | | | | | | | | | | | | | | |
| | | | |
| Pharmaceuticals: 0.68% | | | | | | | | | | | | | | | | |
Zoetis Incorporated | | | | | | | | | | | 375,220 | | | | 32,449,026 | |
| | | | | | | | | | | | | | | | |
| | | | |
Industrials: 14.06% | | | | | | | | | | | | | | | | |
| | | | |
| Aerospace & Defense: 1.43% | | | | | | | | | | | | | | | | |
The Boeing Company | | | | | | | | | | | 190,930 | | | | 68,028,359 | |
| | | | | | | | | | | | | | | | |
| | | | |
| Air Freight & Logistics: 1.72% | | | | | | | | | | | | | | | | |
XPO Logistics Incorporated † | | | | | | | | | | | 820,722 | | | | 81,842,398 | |
| | | | | | | | | | | | | | | | |
| | | | |
| Airlines: 0.35% | | | | | | | | | | | | | | | | |
Southwest Airlines Company | | | | | | | | | | | 283,500 | | | | 16,488,360 | |
| | | | | | | | | | | | | | | | |
The accompanying notes are an integral part of these financial statements.
| | | | | | |
| Portfolio of investments—July 31, 2018 | | Wells Fargo Growth Fund | | | 13 | |
| | | | | | | | | | | | | | | | |
| Security name | | | | | | | | Shares | | | Value | |
| | | | |
| Commercial Services & Supplies: 3.64% | | | | | | | | | | | | | | | | |
Casella Waste Systems Incorporated Class A † | | | | | | | | | | | 680,180 | | | $ | 18,745,761 | |
Copart Incorporated † | | | | | | | | | | | 404,070 | | | | 23,189,577 | |
KAR Auction Services Incorporated | | | | | | | | | | | 895,590 | | | | 53,242,826 | |
Waste Connections Incorporated | | | | | | | | | | | 1,000,805 | | | | 77,672,476 | |
| | | | |
| | | | | | | | | | | | | | | 172,850,640 | |
| | | | | | | | | | | | | | | | |
| | | | |
| Industrial Conglomerates: 0.44% | | | | | | | | | | | | | | | | |
Roper Industries Incorporated | | | | | | | | | | | 69,640 | | | | 21,024,316 | |
| | | | | | | | | | | | | | | | |
| | | | |
| Machinery: 1.95% | | | | | | | | | | | | | | | | |
Fortive Corporation | | | | | | | | | | | 125,310 | | | | 10,285,445 | |
Milacron Holdings Corporation †(l) | | | | | | | | | | | 3,945,835 | | | | 82,270,660 | |
| | | | |
| | | | | | | | | | | | | | | 92,556,105 | |
| | | | | | | | | | | | | | | | |
| | | | |
| Road & Rail: 4.33% | | | | | | | | | | | | | | | | |
CSX Corporation | | | | | | | | | | | 436,980 | | | | 30,885,746 | |
Norfolk Southern Corporation | | | | | | | | | | | 549,840 | | | | 92,922,960 | |
Union Pacific Corporation | | | | | | | | | | | 545,960 | | | | 81,833,944 | |
| | | | |
| | | | | | | | | | | | | | | 205,642,650 | |
| | | | | | | | | | | | | | | | |
| | | | |
| Trading Companies & Distributors: 0.20% | | | | | | | | | | | | | | | | |
SiteOne Landscape Supply Incorporated † | | | | | | | | | | | 103,100 | | | | 9,192,396 | |
| | | | | | | | | | | | | | | | |
| | | | |
Information Technology: 45.66% | | | | | | | | | | | | | | | | |
| | |
| Internet Software & Services: 15.56% | | | | | | | | | |
2U Incorporated † | | | | | | | | | | | 226,410 | | | | 17,130,181 | |
Alibaba Group Holding Limited ADR † | | | | | | | | | | | 195,810 | | | | 36,661,506 | |
Alphabet Incorporated Class A † | | | | | | | | | | | 242,635 | | | | 297,766,525 | |
Alphabet Incorporated Class C † | | | | | | | | | | | 22,690 | | | | 27,619,629 | |
CarGurus Incorporated † | | | | | | | | | | | 187,000 | | | | 8,106,450 | |
Envestnet Incorporated † | | | | | | | | | | | 1,543,570 | | | | 90,453,202 | |
Facebook Incorporated Class A † | | | | | | | | | | | 1,016,800 | | | | 175,479,344 | |
MongoDB Incorporated †« | | | | | | | | | | | 543,920 | | | | 29,431,511 | |
New Relic Incorporated † | | | | | | | | | | | 142,160 | | | | 13,889,032 | |
SendGrid Incorporated † | | | | | | | | | | | 649,100 | | | | 16,571,523 | |
Shopify Incorporated Class A †« | | | | | | | | | | | 114,960 | | | | 15,888,622 | |
Twilio Incorporated Class A † | | | | | | | | | | | 174,330 | | | | 10,091,964 | |
| | | | |
| | | | | | | | | | | | | | | 739,089,489 | |
| | | | | | | | | | | | | | | | |
| | |
| IT Services: 10.65% | | | | | | | | | |
Global Payments Incorporated | | | | | | | | | | | 584,970 | | | | 65,850,073 | |
MasterCard Incorporated Class A | | | | | | | | | | | 695,970 | | | | 137,802,060 | |
PayPal Holdings Incorporated † | | | | | | | | | | | 1,225,890 | | | | 100,694,605 | |
Square Incorporated Class A † | | | | | | | | | | | 522,850 | | | | 33,802,253 | |
Switch Incorporated Class A « | | | | | | | | | | | 1,642,307 | | | | 21,382,837 | |
Visa Incorporated Class A | | | | | | | | | | | 1,069,760 | | | | 146,278,982 | |
| | | | |
| | | | | | | | | | | | | | | 505,810,810 | |
| | | | | | | | | | | | | | | | |
The accompanying notes are an integral part of these financial statements.
| | | | |
| 14 | | Wells Fargo Growth Fund | | Portfolio of investments—July 31, 2018 |
| | | | | | | | | | | | | | | | |
| Security name | | | | | | | | Shares | | | Value | |
| | |
| Semiconductors & Semiconductor Equipment: 7.34% | | | | | | | | | |
Microchip Technology Incorporated « | | | | | | | | | | | 1,675,790 | | | $ | 156,569,060 | |
Monolithic Power Systems Incorporated | | | | | | | | | | | 596,970 | | | | 79,205,980 | |
NVIDIA Corporation | | | | | | | | | | | 154,000 | | | | 37,708,440 | |
Texas Instruments Incorporated | | | | | | | | | | | 674,380 | | | | 75,071,982 | |
| | | | |
| | | | | | | | | | | | | | | 348,555,462 | |
| | | | | | | | | | | | | | | | |
| | |
| Software: 9.94% | | | | | | | | | |
Activision Blizzard Incorporated | | | | | | | | | | | 298,930 | | | | 21,947,441 | |
Adobe Systems Incorporated † | | | | | | | | | | | 110,220 | | | | 26,968,630 | |
BlackLine Incorporated † | | | | | | | | | | | 427,780 | | | | 18,266,206 | |
Electronic Arts Incorporated † | | | | | | | | | | | 254,570 | | | | 32,775,888 | |
Microsoft Corporation | | | | | | | | | | | 1,532,200 | | | | 162,535,776 | |
Pivotal Software Incorporated Class A † | | | | | | | | | | | 1,012,164 | | | | 23,229,164 | |
Proofpoint Incorporated † | | | | | | | | | | | 664,340 | | | | 75,767,977 | |
SailPoint Technologies Holdings Incorporated † | | | | | | | | | | | 302,071 | | | | 7,276,890 | |
Salesforce.com Incorporated † | | | | | | | | | | | 283,880 | | | | 38,934,142 | |
ServiceNow Incorporated † | | | | | | | | | | | 98,490 | | | | 17,330,300 | |
Splunk Incorporated † | | | | | | | | | | | 201,250 | | | | 19,340,125 | |
Tenable Holdings Incorporated † | | | | | | | | | | | 34,389 | | | | 1,028,231 | |
The Ultimate Software Group Incorporated † | | | | | | | | | | | 89,320 | | | | 24,731,815 | |
Zscaler Incorporated †« | | | | | | | | | | | 57,942 | | | | 2,045,932 | |
| | | | |
| | | | | | | | | | | | | | | 472,178,517 | |
| | | | | | | | | | | | | | | | |
| | | | |
| Technology Hardware, Storage & Peripherals: 2.17% | | | | | | | | | | | | | | | | |
Apple Incorporated | | | | | | | | | | | 542,790 | | | | 103,287,509 | |
| | | | | | | | | | | | | | | | |
| | | | |
Materials: 3.89% | | | | | | | | | | | | | | | | |
| | | | |
| Chemicals: 3.89% | | | | | | | | | | | | | | | | |
Air Products & Chemicals Incorporated | | | | | | | | | | | 127,600 | | | | 20,948,092 | |
PolyOne Corporation | | | | | | | | | | | 1,667,963 | | | | 74,808,136 | |
Praxair Incorporated | | | | | | | | | | | 532,560 | | | | 89,203,800 | |
| | | | |
| | | | | | | | | | | | | | | 184,960,028 | |
| | | | | | | | | | | | | | | | |
| | | | |
Total Common Stocks (Cost $2,256,477,594) | | | | | | | | | | | | | | | 4,746,587,745 | |
| | | | | | | | | | | | | | | | |
| | | | |
| | | Yield | | | | | | | | | | |
| Short-Term Investments: 3.51% | | | | | | | | | | | | | | | | |
| | | | |
| Investment Companies: 3.51% | | | | | | | | | | | | | | | | |
Securities Lending Cash Investment LLC (l)(r)(u) | | | 2.10 | % | | | | | | | 149,251,008 | | | | 149,265,933 | |
Wells Fargo Government Money Market Fund Select Class (l)(u) | | | 1.83 | | | | | | | | 17,742,561 | | | | 17,742,561 | |
| | | | |
Total Short-Term Investments (Cost $167,004,154) | | | | | | | | | | | | | | | 167,008,494 | |
| | | | | | | | | | | | | | | | |
| | | | | | | | |
| Total investments in securities (Cost $2,423,481,748) | | | 103.44 | % | | | 4,913,596,239 | |
Other assets and liabilities, net | | | (3.44 | ) | | | (163,592,311 | ) |
| | | | | | | | |
| Total net assets | | | 100.00 | % | | $ | 4,750,003,928 | |
| | | | | | | | |
The accompanying notes are an integral part of these financial statements.
| | | | | | |
| Portfolio of investments—July 31, 2018 | | Wells Fargo Growth Fund | | | 15 | |
| † | Non-income-earning security |
| « | All or a portion of this security is on loan. |
| (l) | The issuer of the security is an affiliated person of the Fund as defined in the Investment Company Act of 1940. |
| (r) | The investment is a non-registered investment company purchased with cash collateral received from securities on loan. |
| (u) | The rate represents the 7-day annualized yield at period end. |
Abbreviations:
| ADR | American depositary receipt |
Investments in Affiliates
An affiliated investment is an investment in which the Fund owns at least 5% of the outstanding voting shares of the issuer or as a result of other relationships, such as the Fund and the issuer having the same investment manager. Transactions with issuers that were either affiliated persons of the Fund at the beginning of the period or the end of the period were as follows:
| | | | | | | | | | | | | | | | | | | | | | | | | | | | | | | | | | | | |
| | | Shares,
beginning of
period | | | Shares
purchased | | | Shares
sold | | | Shares,
end of
period | | | Net realized
gains
(losses) | | | Net change in
unrealized
gains
(losses) | | | Income
from
affiliated
securities | | | Value,
end
of period | | | % of
net
assets | |
Common Stocks | | | | | | | | | | | | | | | | | | | | | | | | | | | | | | | | | | | | |
Consumer Discretionary | | | | | | | | | | | | | | | | | | | | | | | | | | | | | | | | | | | | |
Hotels, Restaurants & Leisure | | | | | | | | | | | | | | | | | | | | | | | | | | | | | | | | | | | | |
The Habit Restaurants Incorporated Class A * | | | 1,735,600 | | | | 51,000 | | | | 1,786,600 | | | | 0 | | | $ | (15,305,107 | ) | | $ | 4,210,514 | | | $ | 0 | | | $ | 0 | | | | | |
Industrials | | | | | | | | | | | | | | | | | | | | | | | | | | | | | | | | | | | | |
Machinery | | | | | | | | | | | | | | | | | | | | | | | | | | | | | | | | | | | | |
Milacron Holdings Corporation † | | | 688,196 | | | | 3,417,919 | | | | 160,280 | | | | 3,945,835 | | | | 198,210 | | | | 14,593,989 | | | | 0 | | | | 82,270,660 | | | | | |
| | | | | | | | | | | | | | | | | | | | | | | | | | | | | | | 82,270,660 | | | | 1.73 | % |
| | | | | | | | | | | | | | | | | | | | | | | | | | | | | | | | | | | | |
| | | | | | | | | |
Short-Term Investments | | | | | | | | | | | | | | | | | | | | | | | | | | | | | | | | | | | | |
Investment Companies | | | | | | | | | | | | | | | | | | | | | | | | | | | | | | | | | | | | |
Securities Lending Cash Investment LLC | | | 92,492,281 | | | | 1,335,249,673 | | | | 1,278,490,946 | | | | 149,251,008 | | | | 1,801 | | | | (1,801 | ) | | | 728,709 | | | | 149,265,933 | | | | | |
Wells Fargo Government Money Market Fund Select Class | | | 36,046,917 | | | | 896,042,717 | | | | 914,347,073 | | | | 17,742,561 | | | | 0 | | | | 0 | | | | 388,869 | | | | 17,742,561 | | | | | |
| | | | | | | | | |
| | | | | | | | | | | | | | | | | | | | | | | | | | | | | | | 167,008,494 | | | | 3.51 | % |
| | | | | | | | | | | | | | | | | | | | | | | | | | | | | | | | | | | | |
| | | | | | | | | | | | | | | | | | $ | (15,105,096 | ) | | $ | 18,802,702 | | | $ | 1,117,578 | | | $ | 249,279,154 | | | | 5.24 | % |
| | | | | | | | | | | | | | | | | | | | | | | | | | | | | | | | | | | | |
| | * | No longer held at the end of the period |
| | † | Non-income-earning security |
The accompanying notes are an integral part of these financial statements.
| | | | |
| 16 | | Wells Fargo Growth Fund | | Statement of assets and liabilities—July 31, 2018 |
| | | | |
| | | | |
| |
Assets | | | | |
Investments in unaffiliated securities (including $146,940,024 of securities loaned), at value (cost $2,188,800,923) | | $ | 4,664,317,085 | |
Investments in affiliated securities, at value (cost $234,680,825) | | | 249,279,154 | |
Receivable for investments sold | | | 7,489,616 | |
Receivable for Fund shares sold | | | 2,432,082 | |
Receivable for dividends | | | 799,039 | |
Receivable for securities lending income | | | 63,366 | |
| | | | |
Total assets | | | 4,924,380,342 | |
| | | | |
| |
Liabilities | | | | |
Payable upon receipt of securities loaned | | | 149,254,842 | |
Payable for Fund shares redeemed | | | 11,391,782 | |
Payable for investments purchased | | | 6,507,073 | |
Management fee payable | | | 2,666,799 | |
Due to custodian bank | | | 2,452,673 | |
Administration fees payable | | | 677,431 | |
Distribution fee payable | | | 120,394 | |
Trustees’ fees and expenses payable | | | 1,224 | |
Accrued expenses and other liabilities | | | 1,304,196 | |
| | | | |
Total liabilities | | | 174,376,414 | |
| | | | |
Total net assets | | $ | 4,750,003,928 | |
| | | | |
| |
NET ASSETS CONSIST OF | | | | |
Paid-in capital | | $ | 1,768,260,835 | |
Accumulated net realized gains on investments | | | 491,628,602 | |
Net unrealized gains on investments | | | 2,490,114,491 | |
| | | | |
Total net assets | | $ | 4,750,003,928 | |
| | | | |
| |
COMPUTATION OF NET ASSET VALUE AND OFFERING PRICE PER SHARE | | | | |
Net assets – Class A | | $ | 2,142,854,712 | |
Shares outstanding – Class A1 | | | 55,410,173 | |
Net asset value per share – Class A | | | $38.67 | |
Maximum offering price per share – Class A2 | | | $41.03 | |
Net assets – Class C | | $ | 185,345,897 | |
Shares outstanding – Class C1 | | | 6,111,635 | |
Net asset value per share – Class C | | | $30.33 | |
Net assets – Class R6 | | $ | 242,837,914 | |
Shares outstanding – Class R61 | | | 5,109,017 | |
Net asset value per share – Class R6 | | | $47.53 | |
Net assets – Administrator Class | | $ | 564,390,507 | |
Shares outstanding – Administrator Class1 | | | 12,857,840 | |
Net asset value per share – Administrator Class | | | $43.89 | |
Net assets – Institutional Class | | $ | 1,614,574,898 | |
Shares outstanding – Institutional Class1 | | | 34,044,613 | |
Net asset value per share – Institutional Class | | | $47.43 | |
| 1 | The Fund has an unlimited number of authorized shares. |
| 2 | Maximum offering price is computed as 100/94.25 of net asset value. On investments of $50,000 or more, the offering price is reduced. |
The accompanying notes are an integral part of these financial statements.
| | | | | | |
| Statement of operations—year ended July 31, 2018 | | Wells Fargo Growth Fund | | | 17 | |
| | | | |
| | | | |
| |
Investment income | | | | |
Dividends (net of foreign withholding taxes of $92,749) | | $ | 31,930,093 | |
Income from affiliated securities | | | 1,117,578 | |
| | | | |
Total investment income | | | 33,047,671 | |
| | | | |
| |
Expenses | | | | |
Management fee | | | 32,401,026 | |
Administration fees | |
Class A | | | 4,319,763 | |
Class C | | | 405,841 | |
Class R6 | | | 43,943 | |
Administrator Class | | | 762,727 | |
Institutional Class | | | 2,151,686 | |
Shareholder servicing fees | |
Class A | | | 5,142,575 | |
Class C | | | 483,144 | |
Administrator Class | | | 1,465,187 | |
Distribution fee | |
Class C | | | 1,449,432 | |
Custody and accounting fees | | | 157,293 | |
Professional fees | | | 50,954 | |
Registration fees | | | 175,673 | |
Shareholder report expenses | | | 296,409 | |
Trustees’ fees and expenses | | | 25,013 | |
Other fees and expenses | | | 148,825 | |
| | | | |
Total expenses | | | 49,479,491 | |
Less: Fee waivers and/or expense reimbursements | | | (2,855,393 | ) |
| | | | |
Net expenses | | | 46,624,098 | |
| | | | |
Net investment loss | | | (13,576,427 | ) |
| | | | |
| |
REALIZED AND UNREALIZED GAINS (LOSSES) ON INVESTMENTS | | | | |
|
Net realized gains (losses) on: | |
Unaffiliated securities | | | 760,836,420 | |
Affiliated securities | | | (15,105,096 | ) |
| | | | |
Net realized gains on investments | | | 745,731,324 | |
| | | | |
|
Net change in unrealized gains (losses) on: | |
Unaffiliated securities | | | 383,647,649 | |
Affiliated securities | | | 18,802,702 | |
| | | | |
Net change in unrealized gains (losses) on investments | | | 402,450,351 | |
| | | | |
Net realized and unrealized gains (losses) on investments | | | 1,148,181,675 | |
| | | | |
Net increase in net assets resulting from operations | | $ | 1,134,605,248 | |
| | | | |
The accompanying notes are an integral part of these financial statements.
| | | | |
| 18 | | Wells Fargo Growth Fund | | Statement of changes in net assets |
| | | | | | | | | | | | | | | | |
| | | Year ended
July 31, 2018 | | | Year ended
July 31, 2017 | |
| | | | |
Operations | | | | | | | | | | | | | | | | |
Net investment loss | | | | | | $ | (13,576,427 | ) | | | | | | $ | (17,306,908 | ) |
Net realized gains on investments | | | | | | | 745,731,324 | | | | | | | | 1,277,104,391 | |
Net change in unrealized gains (losses) on investments | | | | | | | 402,450,351 | | | | | | | | (595,860,372 | ) |
| | | | |
Net increase in net assets resulting from operations | | | | | | | 1,134,605,248 | | | | | | | | 663,937,111 | |
| | | | |
| | | | |
Distributions to shareholders from | | | | | | | | | | | | | | | | |
Net realized gains | | | | | | | | | | | | | | | | |
Class A | | | | | | | (505,431,285 | ) | | | | | | | (385,155,921 | ) |
Class C | | | | | | | (57,934,182 | ) | | | | | | | (51,825,133 | ) |
Class R6 | | | | | | | (16,966,960 | ) | | | | | | | (3,453,520 | ) |
Administrator Class | | | | | | | (138,040,210 | ) | | | | | | | (132,054,015 | ) |
Institutional Class | | | | | | | (379,819,630 | ) | | | | | | | (317,034,333 | ) |
| | | | |
Total distributions to shareholders | | | | | | | (1,098,192,267 | ) | | | | | | | (889,522,922 | ) |
| | | | |
| | | | |
Capital share transactions | | | Shares | | | | | | | | Shares | | | | | |
Proceeds from shares sold | | | | | | | | | | | | | | | | |
Class A | | | 2,597,711 | | | | 97,664,924 | | | | 2,480,636 | | | | 94,368,185 | |
Class C | | | 567,969 | | | | 15,881,145 | | | | 652,761 | | | | 19,766,572 | |
Class R6 | | | 4,402,138 | | | | 197,214,825 | | | | 1,123,887 | | | | 49,275,787 | |
Administrator Class | | | 2,015,636 | | | | 86,044,136 | | | | 2,602,562 | | | | 109,976,524 | |
Institutional Class | | | 8,063,218 | | | | 384,247,586 | | | | 12,846,486 | | | | 573,284,219 | |
| | | | |
| | | | | | | 781,052,616 | | | | | | | | 846,671,287 | |
| | | | |
Reinvestment of distributions | | | | | | | | | | | | | | | | |
Class A | | | 14,511,944 | | | | 482,812,377 | | | | 10,734,969 | | | | 367,135,939 | |
Class C | | | 1,880,250 | | | | 49,281,340 | | | | 1,346,264 | | | | 39,028,199 | |
Class R6 | | | 415,977 | | | | 16,959,366 | | | | 86,772 | | | | 3,453,520 | |
Administrator Class | | | 3,626,546 | | | | 136,757,066 | | | | 3,489,159 | | | | 131,017,902 | |
Institutional Class | | | 9,008,188 | | | | 366,543,153 | | | | 7,686,540 | | | | 305,616,849 | |
| | | | |
| | | | | | | 1,052,353,302 | | | | | | | | 846,252,409 | |
| | | | |
Payment for shares redeemed | |
Class A | | | (10,001,358 | ) | | | (381,655,936 | ) | | | (26,011,523 | ) | | | (994,860,639 | ) |
Class C | | | (2,374,317 | ) | | | (73,235,128 | ) | | | (4,621,153 | ) | | | (150,552,988 | ) |
Class R6 | | | (758,315 | ) | | | (34,584,223 | ) | | | (806,700 | ) | | | (36,722,935 | ) |
Administrator Class | | | (7,153,909 | ) | | | (302,587,215 | ) | | | (25,194,674 | ) | | | (1,090,486,678 | ) |
Institutional Class | | | (18,199,975 | ) | | | (827,075,266 | ) | | | (35,457,129 | ) | | | (1,556,706,417 | ) |
| | | | |
| | | | | | | (1,619,137,768 | ) | | | | | | | (3,829,329,657 | ) |
| | | | |
Net increase (decrease) in net assets resulting from capital share transactions | | | | | | | 214,268,150 | | | | | | | | (2,136,405,961 | ) |
| | | | |
Total increase (decrease) in net assets | | | | | | | 250,681,131 | | | | | | | | (2,361,991,772 | ) |
| | | | |
| | | | |
Net assets | | | | | | | | | | | | | | | | |
Beginning of period | | | | | | | 4,499,322,797 | | | | | | | | 6,861,314,569 | |
| | | | |
End of period | | | | | | $ | 4,750,003,928 | | | | | | | $ | 4,499,322,797 | |
| | | | |
Undistributed net investment income | | | | | | $ | 0 | | | | | | | $ | 0 | |
| | | | |
The accompanying notes are an integral part of these financial statements.
| | | | | | |
| Financial highlights | | Wells Fargo Growth Fund | | | 19 | |
(For a share outstanding throughout each period)
| | | | | | | | | | | | | | | | | | | | |
| | | Year ended July 31 | |
| CLASS A | | 2018 | | | 2017 | | | 2016 | | | 2015 | | | 2014 | |
Net asset value, beginning of period | | | $40.38 | | | | $42.28 | | | | $49.50 | | | | $49.99 | | | | $46.74 | |
Net investment loss | | | (0.12 | ) | | | (0.19 | )1 | | | (0.20 | )1 | | | (0.29 | )1 | | | (0.32 | )1 |
Net realized and unrealized gains (losses) on investments | | | 9.49 | | | | 5.61 | | | | (0.99 | ) | | | 7.03 | | | | 5.34 | |
| | | | | | | | | | | | | | | | | | | | |
Total from investment operations | | | 9.37 | | | | 5.42 | | | | (1.19 | ) | | | 6.74 | | | | 5.02 | |
Distributions to shareholders from | | | | | | | | | | | | | | | | | | | | |
Net realized gains | | | (11.08 | ) | | | (7.32 | ) | | | (6.03 | ) | | | (7.23 | ) | | | (1.77 | ) |
Net asset value, end of period | | | $38.67 | | | | $40.38 | | | | $42.28 | | | | $49.50 | | | | $49.99 | |
Total return2 | | | 27.66 | % | | | 15.95 | % | | | (1.69 | )% | | | 15.01 | % | | | 10.77 | % |
Ratios to average net assets (annualized) | | | | | | | | | | | | | | | | | | | | |
Gross expenses | | | 1.18 | % | | | 1.17 | % | | | 1.15 | % | | | 1.18 | % | | | 1.18 | % |
Net expenses | | | 1.16 | % | | | 1.16 | % | | | 1.14 | % | | | 1.18 | % | | | 1.18 | % |
Net investment loss | | | (0.45 | )% | | | (0.49 | )% | | | (0.49 | )% | | | (0.59 | )% | | | (0.64 | )% |
Supplemental data | | | | | | | | | | | | | | | | | | | | |
Portfolio turnover rate | | | 37 | % | | | 42 | % | | | 38 | % | | | 35 | % | | | 42 | % |
Net assets, end of period (000s omitted) | | | $2,142,855 | | | | $1,950,551 | | | | $2,582,955 | | | | $1,465,643 | | | | $2,047,410 | |
| 1 | Calculated based upon average shares outstanding |
| 2 | Total return calculations do not include any sales charges. |
The accompanying notes are an integral part of these financial statements.
| | | | |
| 20 | | Wells Fargo Growth Fund | | Financial highlights |
(For a share outstanding throughout each period)
| | | | | | | | | | | | | | | | | | | | |
| | | Year ended July 31 | |
| CLASS C | | 2018 | | | 2017 | | | 2016 | | | 2015 | | | 2014 | |
Net asset value, beginning of period | | | $34.05 | | | | $37.07 | | | | $44.51 | | | | $45.95 | | | | $43.41 | |
Net investment loss | | | (0.33 | ) | | | (0.41 | )1 | | | (0.46 | )1 | | | (0.60 | )1 | | | (0.64 | )1 |
Net realized and unrealized gains (losses) on investments | | | 7.69 | | | | 4.71 | | | | (0.95 | ) | | | 6.39 | | | | 4.95 | |
| | | | | | | | | | | | | | | | | | | | |
Total from investment operations | | | 7.36 | | | | 4.30 | | | | (1.41 | ) | | | 5.79 | | | | 4.31 | |
Distributions to shareholders from | | | | | | | | | | | | | | | | | | | | |
Net realized gains | | | (11.08 | ) | | | (7.32 | ) | | | (6.03 | ) | | | (7.23 | ) | | | (1.77 | ) |
Net asset value, end of period | | | $30.33 | | | | $34.05 | | | | $37.07 | | | | $44.51 | | | | $45.95 | |
Total return2 | | | 26.73 | % | | | 15.05 | % | | | (2.44 | )% | | | 14.16 | % | | | 9.96 | % |
Ratios to average net assets (annualized) | | | | | | | | | | | | | | | | | | | | |
Gross expenses | | | 1.93 | % | | | 1.92 | % | | | 1.90 | % | | | 1.93 | % | | | 1.93 | % |
Net expenses | | | 1.91 | % | | | 1.91 | % | | | 1.89 | % | | | 1.93 | % | | | 1.93 | % |
Net investment loss | | | (1.19 | )% | | | (1.23 | )% | | | (1.24 | )% | | | (1.34 | )% | | | (1.39 | )% |
Supplemental data | | | | | | | | | | | | | | | | | | | | |
Portfolio turnover rate | | | 37 | % | | | 42 | % | | | 38 | % | | | 35 | % | | | 42 | % |
Net assets, end of period (000s omitted) | | | $185,346 | | | | $205,607 | | | | $321,032 | | | | $465,833 | | | | $560,481 | |
| 1 | Calculated based upon average shares outstanding |
| 2 | Total return calculations do not include any sales charges. |
The accompanying notes are an integral part of these financial statements.
| | | | | | |
| Financial highlights | | Wells Fargo Growth Fund | | | 21 | |
(For a share outstanding throughout each period)
| | | | | | | | | | | | |
| | | Year ended July 31 | |
| CLASS R6 | | 2018 | | | 2017 | | | 20161 | |
Net asset value, beginning of period | | | $47.13 | | | | $47.90 | | | | $48.97 | |
Net investment loss | | | (0.01 | )2 | | | (0.02 | )2 | | | (0.02 | ) |
Net realized and unrealized gains (losses) on investments | | | 11.49 | | | | 6.57 | | | | 4.98 | |
| | | | | | | | | | | | |
Total from investment operations | | | 11.48 | | | | 6.55 | | | | 4.96 | |
Distributions to shareholders from | | | | | | | | | | | | |
Net realized gains | | | (11.08 | ) | | | (7.32 | ) | | | (6.03 | ) |
Net asset value, end of period | | | $47.53 | | | | $47.13 | | | | $47.90 | |
Total return3 | | | 28.26 | % | | | 16.49 | % | | | 10.89 | % |
Ratios to average net assets (annualized) | | | | | | | | | | | | |
Gross expenses | | | 0.75 | % | | | 0.74 | % | | | 0.74 | % |
Net expenses | | | 0.70 | % | | | 0.70 | % | | | 0.70 | % |
Net investment loss | | | (0.02 | )% | | | (0.05 | )% | | | (0.23 | )% |
Supplemental data | | | | | | | | | | | | |
Portfolio turnover rate | | | 37 | % | | | 42 | % | | | 38 | % |
Net assets, end of period (000s omitted) | | | $242,838 | | | | $49,454 | | | | $30,906 | |
| 1 | For the period from September 30, 2015 (commencement of class operations) to July 31, 2016 |
| 2 | Calculated based upon average shares outstanding |
| 3 | Returns for periods of less than one year are not annualized. |
The accompanying notes are an integral part of these financial statements.
| | | | |
| 22 | | Wells Fargo Growth Fund | | Financial highlights |
(For a share outstanding throughout each period)
| | | | | | | | | | | | | | | | | | | | |
| | | Year ended July 31 | |
| ADMINISTRATOR CLASS | | 2018 | | | 2017 | | | 2016 | | | 2015 | | | 2014 | |
Net asset value, beginning of period | | | $44.40 | | | | $45.66 | | | | $52.86 | | | | $52.80 | | | | $49.16 | |
Net investment loss | | | (0.11 | )1 | | | (0.11 | )1 | | | (0.14 | )1 | | | (0.20 | )1 | | | (0.23 | ) |
Net realized and unrealized gains (losses) on investments | | | 10.68 | | | | 6.17 | | | | (1.03 | ) | | | 7.49 | | | | 5.64 | |
| | | | | | | | | | | | | | | | | | | | |
Total from investment operations | | | 10.57 | | | | 6.06 | | | | (1.17 | ) | | | 7.29 | | | | 5.41 | |
Distributions to shareholders from | | | | | | | | | | | | | | | | | | | | |
Net realized gains | | | (11.08 | ) | | | (7.32 | ) | | | (6.03 | ) | | | (7.23 | ) | | | (1.77 | ) |
Net asset value, end of period | | | $43.89 | | | | $44.40 | | | | $45.66 | | | | $52.86 | | | | $52.80 | |
Total return | | | 27.90 | % | | | 16.20 | % | | | (1.53 | )% | | | 15.28 | % | | | 11.04 | % |
Ratios to average net assets (annualized) | | | | | | | | | | | | | | | | | | | | |
Gross expenses | | | 1.10 | % | | | 1.09 | % | | | 1.07 | % | | | 1.02 | % | | | 1.02 | % |
Net expenses | | | 0.96 | % | | | 0.96 | % | | | 0.96 | % | | | 0.96 | % | | | 0.96 | % |
Net investment loss | | | (0.24 | )% | | | (0.27 | )% | | | (0.31 | )% | | | (0.37 | )% | | | (0.42 | )% |
Supplemental data | | | | | | | | | | | | | | | | | | | | |
Portfolio turnover rate | | | 37 | % | | | 42 | % | | | 38 | % | | | 35 | % | | | 42 | % |
Net assets, end of period (000s omitted) | | | $564,391 | | | | $637,987 | | | | $1,528,288 | | | | $2,349,359 | | | | $3,359,480 | |
| 1 | Calculated based upon average shares outstanding |
The accompanying notes are an integral part of these financial statements.
| | | | | | |
| Financial highlights | | Wells Fargo Growth Fund | | | 23 | |
(For a share outstanding throughout each period)
| | | | | | | | | | | | | | | | | | | | |
| | | Year ended July 31 | |
| INSTITUTIONAL CLASS | | 2018 | | | 2017 | | | 2016 | | | 2015 | | | 2014 | |
Net asset value, beginning of period | | | $47.07 | | | | $47.87 | | | | $54.99 | | | | $54.54 | | | | $50.63 | |
Net investment loss | | | (0.02 | )1 | | | (0.04 | )1 | | | (0.05 | )1 | | | (0.09 | )1 | | | (0.13 | ) |
Net realized and unrealized gains (losses) on investments | | | 11.46 | | | | 6.56 | | | | (1.04 | ) | | | 7.77 | | | | 5.81 | |
| | | | | | | | | | | | | | | | | | | | |
Total from investment operations | | | 11.44 | | | | 6.52 | | | | (1.09 | ) | | | 7.68 | | | | 5.68 | |
Distributions to shareholders from | | | | | | | | | | | | | | | | | | | | |
Net realized gains | | | (11.08 | ) | | | (7.32 | ) | | | (6.03 | ) | | | (7.23 | ) | | | (1.77 | ) |
Net asset value, end of period | | | $47.43 | | | | $47.07 | | | | $47.87 | | | | $54.99 | | | | $54.54 | |
Total return | | | 28.21 | % | | | 16.44 | % | | | (1.31 | )% | | | 15.53 | % | | | 11.26 | % |
Ratios to average net assets (annualized) | | | | | | | | | | | | | | | | | | | | |
Gross expenses | | | 0.85 | % | | | 0.84 | % | | | 0.82 | % | | | 0.76 | % | | | 0.75 | % |
Net expenses | | | 0.75 | % | | | 0.75 | % | | | 0.75 | % | | | 0.75 | % | | | 0.75 | % |
Net investment loss | | | (0.03 | )% | | | (0.08 | )% | | | (0.10 | )% | | | (0.17 | )% | | | (0.21 | )% |
Supplemental data | | | | | | | | | | | | | | | | | | | | |
Portfolio turnover rate | | | 37 | % | | | 42 | % | | | 38 | % | | | 35 | % | | | 42 | % |
Net assets, end of period (000s omitted) | | | $1,614,575 | | | | $1,655,724 | | | | $2,398,134 | | | | $3,863,196 | | | | $2,975,721 | |
| 1 | Calculated based upon average shares outstanding |
The accompanying notes are an integral part of these financial statements.
| | | | |
| 24 | | Wells Fargo Growth Fund | | Notes to financial statements |
1. ORGANIZATION
Wells Fargo Funds Trust (the “Trust”), a Delaware statutory trust organized on March��10, 1999, is an open-end management investment company registered under the Investment Company Act of 1940, as amended (the “1940 Act”). As an investment company, the Trust follows the accounting and reporting guidance in Financial Accounting Standards Board Accounting Standards Codification Topic 946, Financial Services – Investment Companies. These financial statements report on the Wells Fargo Growth Fund (the “Fund”) which is a diversified series of the Trust.
2. SIGNIFICANT ACCOUNTING POLICIES
The following significant accounting policies, which are consistently followed in the preparation of the financial statements of the Fund, are in conformity with U.S. generally accepted accounting principles which require management to make estimates and assumptions that affect the reported amounts of assets and liabilities, disclosure of contingent assets and liabilities at the date of the financial statements, and the reported amounts of revenues and expenses during the reporting period. Actual results could differ from those estimates.
Securities valuation
All investments are valued each business day as of the close of regular trading on the New York Stock Exchange (generally 4 p.m. Eastern Time), although the Fund may deviate from this calculation time under unusual or unexpected circumstances.
Equity securities that are listed on a foreign or domestic exchange or market are valued at the official closing price or, if none, the last sales price. If no sale occurs on the principal exchange or market that day, a fair value price will be determined in accordance with the Fund’s Valuation Procedures.
Investments in registered open-end investment companies are valued at net asset value. Interests in non-registered investment companies that are redeemable at net asset value are fair valued normally at net asset value.
Investments which are not valued using any of the methods discussed above are valued at their fair value, as determined in good faith by the Board of Trustees of the Fund. The Board of Trustees has established a Valuation Committee comprised of the Trustees and has delegated to it the authority to take any actions regarding the valuation of portfolio securities that the Valuation Committee deems necessary or appropriate, including determining the fair value of portfolio securities, unless the determination has been delegated to the Wells Fargo Asset Management Pricing Committee at Wells Fargo Funds Management, LLC (“Funds Management”). The Board of Trustees retains the authority to make or ratify any valuation decisions or approve any changes to the Valuation Procedures as it deems appropriate. On a quarterly basis, the Board of Trustees receives reports on any valuation actions taken by the Valuation Committee or the Wells Fargo Asset Management Pricing Committee which may include items for ratification.
Valuations of fair valued securities are compared to the next actual sales price when available, or other appropriate market values, to assess the continued appropriateness of the fair valuation methodologies used. These securities are fair valued on a day-to-day basis, taking into consideration changes to appropriate market information and any significant changes to the inputs considered in the valuation process until there is a readily available price provided on an exchange or by an independent pricing service. Valuations received from an independent pricing service or independent broker-dealer quotes are periodically validated by comparisons to most recent trades and valuations provided by other independent pricing services in addition to the review of prices by the manager and/or subadviser. Unobservable inputs used in determining fair valuations are identified based on the type of security, taking into consideration factors utilized by market participants in valuing the investment, knowledge about the issuer and the current market environment.
Foreign currency translation
The accounting records of the Fund are maintained in U.S. dollars. The values of other assets and liabilities denominated in foreign currencies are translated into U.S. dollars at rates provided by an independent foreign currency pricing source at a time each business day specified by the Wells Fargo Asset Management Pricing Committee. Purchases and sales of securities, and income and expenses are converted at the rate of exchange on the respective dates of such transactions. Net realized foreign exchange gains or losses arise from sales of foreign currencies, currency gains or losses realized between the trade and settlement dates on securities transactions, and the difference between the amounts of dividends, interest and foreign withholding taxes recorded and the U.S. dollar equivalent of the amounts actually paid or received. Net unrealized foreign exchange gains and losses arise from changes in the fair value of assets and liabilities other than investments in securities resulting from changes in exchange rates. The changes in net assets arising from changes in exchange rates of securities and the changes in net assets resulting from changes in market prices of securities are not separately presented. Such changes are included in net realized and unrealized gains or losses from investments.
| | | | | | |
| Notes to financial statements | | Wells Fargo Growth Fund | | | 25 | |
Securities lending
The Fund may lend its securities from time to time in order to earn additional income in the form of fees or interest on securities received as collateral or the investment of any cash received as collateral. The Fund continues to receive interest or dividends on the securities loaned. The Fund receives collateral in the form of cash or securities with a value at least equal to the value of the securities on loan. The value of the loaned securities is determined at the close of each business day and any additional required collateral is delivered to the Fund on the next business day. In a securities lending transaction, the net asset value of the Fund will be affected by an increase or decrease in the value of the securities loaned and by an increase or decrease in the value of the instrument in which collateral is invested. The amount of securities lending activity undertaken by the Fund fluctuates from time to time. In the event of default or bankruptcy by the borrower, the Fund may be prevented from recovering the loaned securities or gaining access to the collateral or may experience delays or costs in doing so. In addition, the investment of any cash collateral received may lose all or part of its value. The Fund has the right under the lending agreement to recover the securities from the borrower on demand.
The Fund lends its securities through an unaffiliated securities lending agent. Cash collateral received in connection with its securities lending transactions is invested in Securities Lending Cash Investments, LLC (the “Securities Lending Fund”). The Securities Lending Fund is exempt from registration under Section 3(c)(7) of the 1940 Act and is managed by Funds Management and is subadvised by Wells Capital Management Incorporated (“WellsCap”), an affiliate of Funds Management and an indirect wholly owned subsidiary of Wells Fargo & Company (“Wells Fargo”). Funds Management receives an advisory fee starting at 0.05% and declining to 0.01% as the average daily net assets of the Securities Lending Fund increase. All of the fees received by Funds Management are paid to WellsCap for its services as subadviser. The Securities Lending Fund seeks to provide a positive return compared to the daily Fed Funds Open Rate by investing in high-quality, U.S. dollar-denominated short-term money market instruments. Securities Lending Fund investments are valued at the evaluated bid price provided by an independent pricing service. Income earned from investment in the Securities Lending Fund, if any, is included in income from affiliated securities on the Statement of Operations.
Security transactions and income recognition
Securities transactions are recorded on a trade date basis. Realized gains or losses are recorded on the basis of identified cost.
Dividend income is recognized on the ex-dividend date. Dividend income is recorded net of foreign taxes withheld where recovery of such taxes is not assured.
Distributions to shareholders
Distributions to shareholders from net investment income and any net realized gains are recorded on the ex-dividend date and paid at least annually. Such distributions are determined in accordance with income tax regulations and may differ from U.S. generally accepted accounting principles. Dividend sources are estimated at the time of declaration. The tax character of distributions is determined as of the Fund’s fiscal year end. Therefore, a portion of the Fund’s distributions made prior to the Fund’s fiscal year end may be categorized as a tax return of capital at year end.
Federal and other taxes
The Fund intends to continue to qualify as a regulated investment company by distributing substantially all of its investment company taxable income and any net realized capital gains (after reduction for capital loss carryforwards) sufficient to relieve it from all, or substantially all, federal income taxes. Accordingly, no provision for federal income taxes was required.
The Fund’s income and federal excise tax returns and all financial records supporting those returns for the prior three fiscal years are subject to examination by the federal and Delaware revenue authorities. Management has analyzed the Fund’s tax positions taken on federal, state, and foreign tax returns for all open tax years and does not believe that there are any uncertain tax positions that require recognition of a tax liability.
As of July 31, 2018, the aggregate cost of all investments for federal income tax purposes was $2,431,332,961 and the unrealized gains (losses) consisted of:
| | | | |
Gross unrealized gains | | $ | 2,491,374,152 | |
Gross unrealized losses | | | (9,110,874 | ) |
Net unrealized gains | | $ | 2,482,263,278 | |
Reclassifications are made to the Fund’s capital accounts for permanent tax differences to reflect income and gains available for distribution (or available capital loss carryforwards) under federal income tax regulations. U.S. generally accepted accounting principles require that certain components of net assets be adjusted to reflect permanent
| | | | |
| 26 | | Wells Fargo Growth Fund | | Notes to financial statements |
differences between financial and tax reporting. These reclassifications have no effect on net assets or net asset values per share. The primary permanent differences causing such reclassifications are due to net operating losses and redemptions in-kind. At July 31, 2018, as a result of permanent book-to-tax differences, the following reclassification adjustments were made on the Statement of Assets and Liabilities:
| | | | |
| Paid-in capital | | Accumulated net
investment loss | | Accumulated net
realized gains
on investments |
| $46,209,517 | | $13,576,427 | | $(59,785,944) |
Class allocations
The separate classes of shares offered by the Fund differ principally in applicable sales charges, distribution, shareholder servicing, and administration fees. Class specific expenses are charged directly to that share class. Investment income, common expenses, and realized and unrealized gains (losses) on investments are allocated daily to each class of shares based on the relative proportion of net assets of each class.
3. FAIR VALUATION MEASUREMENTS
Fair value measurements of investments are determined within a framework that has established a fair value hierarchy based upon the various data inputs utilized in determining the value of the Fund’s investments. The three-level hierarchy gives the highest priority to unadjusted quoted prices in active markets for identical assets or liabilities (Level 1) and the lowest priority to unobservable inputs (Level 3). The Fund’s investments are classified within the fair value hierarchy based on the lowest level of input that is significant to the fair value measurement. The inputs are summarized into three broad levels as follows:
| ∎ | | Level 1 – quoted prices in active markets for identical securities |
| ∎ | | Level 2 – other significant observable inputs (including quoted prices for similar securities, interest rates, prepayment speeds, credit risk, etc.) |
| ∎ | | Level 3 – significant unobservable inputs (including the Fund’s own assumptions in determining the fair value of investments) |
The inputs or methodologies used for valuing investments in securities are not necessarily an indication of the risk associated with investing in those securities.
The following is a summary of the inputs used in valuing the Fund’s assets and liabilities as of July 31, 2018:
| | | | | | | | | | | | | | | | |
| | | Quoted prices
(Level 1) | | | Other significant
observable inputs
(Level 2) | | | Significant
unobservable inputs
(Level 3) | | | Total | |
Assets | | | | | | | | | | | | | | | | |
Investments in: | | | | | | | | | | | | | | | | |
| | | | |
Common stocks | | | | | | | | | | | | | | | | |
Consumer discretionary | | $ | 742,017,669 | | | $ | 0 | | | $ | 0 | | | $ | 742,017,669 | |
Consumer staples | | | 180,585,006 | | | | 0 | | | | 0 | | | | 180,585,006 | |
Energy | | | 63,659,686 | | | | 0 | | | | 0 | | | | 63,659,686 | |
Financials | | | 357,530,386 | | | | 0 | | | | 0 | | | | 357,530,386 | |
Health care | | | 381,287,959 | | | | 0 | | | | 0 | | | | 381,287,959 | |
Industrials | | | 667,625,224 | | | | 0 | | | | 0 | | | | 667,625,224 | |
Information technology | | | 2,168,921,787 | | | | 0 | | | | 0 | | | | 2,168,921,787 | |
Materials | | | 184,960,028 | | | | 0 | | | | 0 | | | | 184,960,028 | |
| | | | |
Short-term investments | | | | | | | | | | | | | | | | |
Investment companies | | | 17,742,561 | | | | 0 | | | | 0 | | | | 17,742,561 | |
Investments measured at net asset value* | | | | | | | | | | | | | | | 149,265,933 | |
Total assets | | $ | 4,764,330,306 | | | $ | 0 | | | $ | 0 | | | $ | 4,913,596,239 | |
| * | Investments that are measured at fair value using the net asset value per share (or its equivalent) as a practical expedient have not been categorized in the fair value hierarchy. The fair value amount presented in the table is intended to permit reconciliation of the fair value hierarchy to the amounts presented in the Statement of Assets and Liabilities. The Fund’s investment in Securities Lending Cash Investments, LLC valued at $149,265,933 does not have a redemption period notice, can be redeemed daily and does not have any unfunded commitments. |
The Fund recognizes transfers between levels within the fair value hierarchy at the end of the reporting period. At July 31, 2018, the Fund did not have any transfers into/out of Level 1, Level 2, or Level 3.
| | | | | | |
| Notes to financial statements | | Wells Fargo Growth Fund | | | 27 | |
4. TRANSACTIONS WITH AFFILIATES
Management fee
Funds Management, an indirect wholly owned subsidiary of Wells Fargo, is the manager of the Fund and provides advisory and fund-level administrative services under an investment management agreement. Under the investment management agreement, Funds Management is responsible for, among other services, implementing the investment objectives and strategies of the Fund, supervising the subadviser and providing fund-level administrative services in connection with the Fund’s operations. As compensation for its services under the investment management agreement, Funds Management is entitled to receive an annual management fee starting at 0.80% and declining to 0.555% as the average daily net assets of the Fund increase. For the year ended July 31, 2018, the management fee was equivalent to an annual rate of 0.70% of the Fund’s average daily net assets.
Funds Management has retained the services of a subadviser to provide daily portfolio management to the Fund. The fee for subadvisory services is borne by Funds Management. WellsCap is the subadviser to the Fund and is entitled to receive a fee from Funds Management at an annual rate starting at 0.45% and declining to 0.30% as the average daily net assets of the Fund increase.
Administration fees
Under a class-level administration agreement, Funds Management provides class-level administrative services to the Fund, which includes paying fees and expenses for services provided by the transfer agent, sub-transfer agents, omnibus account servicers and record-keepers. As compensation for its services under the class-level administration agreement, Funds Management receives an annual fee which is calculated based on the average daily net assets of each class as follows:
| | | | |
| | | Class-level
administration fee | |
Class A, Class C | | | 0.21 | % |
Class R6 | | | 0.03 | |
Administrator Class, Institutional Class | | | 0.13 | |
Funds Management has contractually waived and/or reimbursed management and administration fees to the extent necessary to maintain certain net operating expense ratios for the Fund. When each class of the Fund has exceeded its expense cap, Funds Management has waived fees and/or reimbursed expenses from fund level expenses on a proportionate basis and then from class specific expenses; otherwise, waivers and/or reimbursements are applied against class specific expenses before fund level expenses. Funds Management has committed through November 30, 2018 to waive fees and/or reimburse expenses to the extent necessary to cap the Fund’s expenses at 1.16% for Class A shares, 1.91% for Class C shares, 0.70% for Class R6 shares, 0.96% for Administrator Class shares, and 0.75% for Institutional Class shares. After this time, the cap may be increased or the commitment to maintain the cap may be terminated only with the approval of the Board of Trustees.
Distribution fee
The Trust has adopted a distribution plan for Class C shares of the Fund pursuant to Rule 12b-1 under the 1940 Act. A distribution fee is charged to Class C shares and paid to Wells Fargo Funds Distributor, LLC (“Funds Distributor”), the principal underwriter, at an annual rate of 0.75% of the average daily net assets of Class C shares.
In addition, Funds Distributor is entitled to receive the front-end sales charge from the purchase of Class A shares and a contingent deferred sales charge on the redemption of certain Class A shares. Funds Distributor is also entitled to receive the contingent deferred sales charges from redemptions of Class C shares. For the year ended July 31, 2018, Funds Distributor received $23,415 from the sale of Class A shares and $536 in contingent deferred sales charges from redemptions of C shares. No contingent deferred sales charges were incurred by Class A shares for the year ended July 31, 2018.
Shareholder servicing fees
The Trust has entered into contracts with one or more shareholder servicing agents, whereby Class A, Class C, and Administrator Class of the Fund are charged a fee at an annual rate of 0.25% of the average daily net assets of each respective class.
A portion of these total shareholder servicing fees were paid to affiliates of Wells Fargo.
Interfund transactions
The Fund may purchase or sell portfolio investment securities to certain other Wells Fargo affiliates pursuant to Rule 17a-7 under the 1940 Act and under procedures adopted by the Board of Trustees. The procedures have been designed to ensure that these interfund transactions, which do not incur broker commissions, are effected at current market prices.
| | | | |
| 28 | | Wells Fargo Growth Fund | | Notes to financial statements |
5. INVESTMENT PORTFOLIO TRANSACTIONS
Purchases and sales of investments, excluding U.S. government obligations (if any) and short-term securities, for the year ended July 31, 2018 were $1,706,656,517 and $2,493,570,737, respectively.
6. BANK BORROWINGS
The Trust (excluding the money market funds and certain other funds) and Wells Fargo Variable Trust are parties to a $280,000,000 revolving credit agreement whereby the Fund is permitted to use bank borrowings for temporary or emergency purposes, such as to fund shareholder redemption requests. Interest under the credit agreement is charged to the Fund based on a borrowing rate equal to the higher of the Federal Funds rate in effect on that day plus 1.25% or the overnight LIBOR rate in effect on that day plus 1.25%. In addition, an annual commitment fee equal to 0.25% of the unused balance is allocated to each participating fund. Prior to August 29, 2017, the revolving credit agreement amount was $250,000,000.
For the year ended July 31, 2018, there were no borrowings by the Fund under the agreement.
7. DISTRIBUTIONS TO SHAREHOLDERS
The tax character of distributions paid during the years ended July 31, 2018 and July 31, 2017 were as follows:
| | | | | | | | |
| | | Year ended July 31 | |
| | | 2018 | | | 2017 | |
Ordinary income | | $ | 19,197,330 | | | $ | 14,498,099 | |
Long-term capital gain | | | 1,078,994,937 | | | | 875,024,823 | |
As of July 31, 2018, the components of distributable earnings on a tax basis were as follows:
| | | | |
Undistributed
ordinary
income | | Undistributed
long-term
gain | | Unrealized
gains |
$25,417,735 | | $474,062,080 | | $2,482,263,278 |
8. CONCENTRATION RISK
Concentration risks result from exposure to a limited number of sectors. A fund that invests a substantial portion of its assets in any sector may be more affected by changes in that sector than would be a fund whose investments are not heavily weighted in any sector.
9. INDEMNIFICATION
Under the Trust’s organizational documents, the officers and Trustees have been granted certain indemnification rights against certain liabilities that may arise out of performance of their duties to the Trust. Additionally, in the normal course of business, the Trust may enter into contracts with service providers that contain a variety of indemnification clauses. The Trust’s maximum exposure under these arrangements is dependent on future claims that may be made against the Fund and, therefore, cannot be estimated.
10. REDEMPTION IN-KIND
After the close of business on July 12, 2018, the Fund redeemed assets through an in-kind redemption. In the redemption transaction, the Fund issued securities with a value of $75,847,965 and cash in the amount of $271,155. The Fund recognized gains in the amount of $46,392,938 which is reflected on the Statement of Operations. The redemption in-kind by a shareholder of the Institutional Class represented 1.54% of the Fund and is reflected on the Statement of Changes in Net Assets.
| | | | | | |
| Report of independent registered public accounting firm | | Wells Fargo Growth Fund | | | 29 | |
BOARD OF TRUSTEES AND SHAREHOLDERS OF WELLS FARGO FUNDS TRUST:
Opinion on the Financial Statements
We have audited the accompanying statement of assets and liabilities of Wells Fargo Growth Fund (the “Fund”), one of the funds constituting Wells Fargo Funds Trust, including the portfolio of investments, as of July 31, 2018, the related statement of operations for the year then ended, the statements of changes in net assets for each of the years in the two-year period then ended, and the related notes (collectively, the “financial statements”) and the financial highlights for each of the years or periods in the five-year period then ended. In our opinion, the financial statements and financial highlights present fairly, in all material respects, the financial position of the Fund as of July 31, 2018, the results of its operations for the year then ended, the changes in its net assets for each of the years in the two-year period then ended, and the financial highlights for each of the years or periods in the five-year period then ended, in conformity with U.S. generally accepted accounting principles.
Basis for Opinion
These financial statements and financial highlights are the responsibility of the Fund’s management. Our responsibility is to express an opinion on these financial statements and financial highlights based on our audits. We are a public accounting firm registered with the Public Company Accounting Oversight Board (United States) (“PCAOB”) and are required to be independent with respect to the Fund in accordance with the U.S. federal securities laws and the applicable rules and regulations of the Securities and Exchange Commission and the PCAOB.
We conducted our audits in accordance with the standards of the PCAOB. Those standards require that we plan and perform the audit to obtain reasonable assurance about whether the financial statements and financial highlights are free of material misstatement, whether due to error or fraud. Our audits included performing procedures to assess the risks of material misstatement of the financial statements and financial highlights, whether due to error or fraud, and performing procedures that respond to those risks. Such procedures included examining, on a test basis, evidence regarding the amounts and disclosures in the financial statements and financial highlights. Such procedures also included confirmation of securities owned as of July 31, 2018, by correspondence with the custodian and brokers, or by other appropriate auditing procedures. Our audits also included evaluating the accounting principles used and significant estimates made by management, as well as evaluating the overall presentation of the financial statements and financial highlights. We believe that our audits provide a reasonable basis for our opinion.

We have not been able to determine the specific year that we began serving as the auditor of one or more Wells Fargo Funds investment companies, however we are aware that we have served as the auditor of one or more Wells Fargo Funds investment companies since at least 1955.
Boston, Massachusetts
September 24, 2018
| | | | |
| 30 | | Wells Fargo Growth Fund | | Other information (unaudited) |
TAX INFORMATION
For corporate shareholders, pursuant to Section 854 of the Internal Revenue Code, 99.68% of ordinary income dividends qualify for the corporate dividends-received deduction for the fiscal year ended July 31, 2018
Pursuant to Section 852 of the Internal Revenue Code, $1,078,994,937 was designated as a 20% rate gain distribution for the fiscal year ended July 31, 2018.
Pursuant to Section 854 of the Internal Revenue Code, $19,197,330 of income dividends paid during the fiscal year ended July 31, 2018 has been designated as qualified dividend income (QDI).
For the fiscal year ended July 31, 2018, $19,197,330 has been designated as short-term capital gain dividends for nonresident alien shareholders pursuant to Section 871 of the Internal Revenue Code.
PROXY VOTING INFORMATION
A description of the policies and procedures that the Fund uses to determine how to vote proxies relating to portfolio securities is available, upon request, by calling 1-800-222-8222, visiting our website at wellsfargofunds.com, or visiting the SEC website at sec.gov. Information regarding how the Fund voted proxies relating to portfolio securities during the most recent 12-month period ended June 30 is available on the Fund’s website at wellsfargofunds.com or by visiting the SEC website at sec.gov.
PORTFOLIO HOLDINGS INFORMATION
The complete portfolio holdings for the Fund are publicly available monthly on the Fund’s website (wellsfargofunds.com), on a one-month delayed basis. In addition, top ten holdings information (excluding derivative positions) for the Fund is publicly available on the Fund’s website on a monthly, seven-day or more delayed basis. The Fund files its complete schedule of portfolio holdings with the SEC for the first and third quarters of each fiscal year on Form N-Q, which is available by visiting the SEC website at sec.gov. In addition, the Fund’s Form N-Q may be reviewed and copied at the SEC’s Public Reference Room in Washington, DC, and at regional offices in New York City, at 233 Broadway, and in Chicago, at 175 West Jackson Boulevard, Suite 900. Information about the Public Reference Room may be obtained by calling 1-800-SEC-0330.
| | | | | | |
| Other information (unaudited) | | Wells Fargo Growth Fund | | | 31 | |
BOARD OF TRUSTEES AND OFFICERS
Each of the Trustees and Officers1 listed in the table below acts in identical capacities for each fund in the Wells Fargo family of funds, which consists of 154 mutual funds comprising the Wells Fargo Funds Trust, Wells Fargo Variable Trust, Wells Fargo Master Trust and four closed-end funds (collectively the “Fund Complex”). This table should be read in conjunction with the Prospectus and the Statement of Additional Information2. The mailing address of each Trustee and Officer is 525 Market Street, 12th Floor, San Francisco, CA 94105. Each Trustee and Officer serves an indefinite term, however, each Trustee serves such term until reaching the mandatory retirement age established by the Trustees.
Independent Trustees
| | | | | | |
Name and year of birth | | Position held and length of service* | | Principal occupations during past five years or longer | | Current other public company or
investment company
directorships |
William R. Ebsworth (Born 1957) | | Trustee, since 2015 | | Retired. From 1984 to 2013, equities analyst, portfolio manager, research director and chief investment officer at Fidelity Management and Research Company in Boston, Tokyo, and Hong Kong, and retired in 2013 as Chief Investment Officer of Fidelity Strategic Advisers, Inc. where he led a team of investment professionals managing client assets. Prior thereto, Board member of Hong Kong Securities Clearing Co., Hong Kong Options Clearing Corp., the Thailand International Fund, Ltd., Fidelity Investments Life Insurance Company, and Empire Fidelity Investments Life Insurance Company. Board member of the Forté Foundation (non-profit organization) and the Vincent Memorial Hospital Endowment (non-profit organization), where he serves on the Investment Committee and as a Chair of the Audit Committee. Mr. Ebsworth is a CFA® charterholder. | | Asset Allocation Trust |
Jane A. Freeman (Born 1953) | | Trustee, since 2015; Chair Liaison, since 2018 | | Retired. From 2012 to 2014 and 1999 to 2008, Chief Financial Officer of Scientific Learning Corporation. From 2008 to 2012, Ms. Freeman provided consulting services related to strategic business projects. Prior to 1999, Portfolio Manager at Rockefeller & Co. and Scudder, Stevens & Clark. Board member of the Harding Loevner Funds from 1996 to 2014, serving as both Lead Independent Director and chair of the Audit Committee. Board member of the Russell Exchange Traded Funds Trust from 2011 to 2012 and the chair of the Audit Committee. Ms. Freeman is a Board Member of Ruth Bancroft Garden (non-profit organization) and the Glimmerglass Festival. She is also an inactive Chartered Financial Analyst. | | Asset Allocation Trust |
Isaiah Harris, Jr. (Born 1952) | | Trustee, since 2009 | | Retired. Chairman of the Board of CIGNA Corporation since 2009, and Director since 2005. From 2003 to 2011, Director of Deluxe Corporation. Prior thereto, President and CEO of BellSouth Advertising and Publishing Corp. from 2005 to 2007, President and CEO of BellSouth Enterprises from 2004 to 2005 and President of BellSouth Consumer Services from 2000 to 2003. Emeritus member of the Iowa State University Foundation Board of Governors. Emeritus Member of the Advisory Board of Iowa State University School of Business. Advisory Board Member, Palm Harbor Academy (charter school). Advisory Board Member, Child Evangelism Fellowship (non-profit). Mr. Harris is a certified public accountant (inactive status). | | CIGNA Corporation; Asset Allocation Trust |
Judith M. Johnson (Born 1949) | | Trustee, since 2008; Audit Committee Chairman, since 2009 | | Retired. Prior thereto, Chief Executive Officer and Chief Investment Officer of Minneapolis Employees Retirement Fund from 1996 to 2008. Ms. Johnson is an attorney, certified public accountant and a certified managerial accountant. | | Asset Allocation Trust |
David F. Larcker (Born 1950) | | Trustee, since 2009 | | James Irvin Miller Professor of Accounting at the Graduate School of Business, Stanford University, Director of the Corporate Governance Research Initiative and Senior Faculty of The Rock Center for Corporate Governance since 2006. From 2005 to 2008, Professor of Accounting at the Graduate School of Business, Stanford University. Prior thereto, Ernst & Young Professor of Accounting at The Wharton School, University of Pennsylvania from 1985 to 2005. | | Asset Allocation Trust |
| | | | |
| 32 | | Wells Fargo Growth Fund | | Other information (unaudited) |
| | | | | | |
Name and year of birth | | Position held and length of service* | | Principal occupations during past five years or longer | | Current other public company or
investment company
directorships |
Olivia S. Mitchell (Born 1953) | | Trustee, since 2006; Governance Committee Chairman, since 2018 | | International Foundation of Employee Benefit Plans Professor, Wharton School of the University of Pennsylvania since 1993. Director of Wharton’s Pension Research Council and Boettner Center on Pensions & Retirement Research, and Research Associate at the National Bureau of Economic Research. Previously, Cornell University Professor from 1978 to 1993. | | Asset Allocation Trust |
Timothy J. Penny (Born 1951) | | Trustee, since 1996; Chairman, since 2018; Vice Chairman, from 2017 to 2018 | | President and Chief Executive Officer of Southern Minnesota Initiative Foundation, a non-profit organization, since 2007. Member of the Board of Trustees of NorthStar Education Finance, Inc., a non-profit organization, since 2007. | | Asset Allocation Trust |
James G. Polisson (Born 1959) | | Trustee, since 2018; Advisory Board Member, from 2017 to 2018 | | Retired. Chief Marketing Officer, Source (ETF) UK Services, Ltd, from 2015 to 2017. From 2012 to 2015, Principal of The Polisson Group, LLC, a management consulting, corporate advisory and principal investing company. Chief Executive Officer and Managing Director at Russell Investments, Global Exchange Traded Funds from 2010 to 2012. Managing Director of Barclays Global Investors from 1998 to 2010 and Global Chief Marketing Officer for iShares and Barclays Global Investors from 2000 to 2010. Trustee of the San Francisco Mechanics’ Institute, a non-profit organization, from 2013 to 2015. Board member of the Russell Exchange Traded Fund Trust from 2011 to 2012. Director of Barclays Global Investors Holdings Deutschland GmbH from 2006 to 2009. Mr. Polisson is an attorney and has a retired status with the Massachusetts and District of Columbia Bar Associations. | | Asset Allocation Trust |
Michael S. Scofield (Born 1943) | | Trustee, since 2010 | | Served on the Investment Company Institute’s Board of Governors and Executive Committee from 2008-2011 as well the Governing Council of the Independent Directors Council from 2006-2011 and the Independent Directors Council Executive Committee from 2008-2011. Trustee of the Evergreen Fund complex (and its predecessors) from 1984 to 2010. Chairman of the Evergreen Funds from 2000-2010. Former Trustee of the Mentor Funds. Retired Attorney, Law Offices of Michael S. Scofield. | | Asset Allocation Trust |
Pamela Wheelock (Born 1959) | | Trustee, since 2018; Advisory Board Member, from 2017 to 2018 | | Chief Operating Officer, Twin Cities Habitat for Humanity, since January, 2017. Vice President of University Services, University of Minnesota from 2012 to 2017. Prior thereto, on the Board of Directors, Goverance Committee and Finance Committee for the Minnesota Philanthropy Partners (Saint Paul Foundation) from 2012 to 2018, Interim President and Chief Executive Officer of Blue Cross Blue shield of Minnesota of Minnesota from 2010 to 2011, Chairman of the Board from 2009 to 2011 and Board Director 003 to 2015. Vice President, Leadership and Community Engagement, Bush Foundation, Saint Paul, Minnesota (a private foundation) from 2009 to 2011. Executive Vice President and Chief Financial Officer, Minnesota Sports and Entertainment from 2004 to 2009 and Senior Vice President from 2002 to 2004. Commissioner of Finance, State of Minnesota, from 1999 to 2002. Currently the Board Chair of the Minnesota Wild Foundation since 2010. | | Asset Allocation Trust |
| * | Length of service dates reflect the Trustee’s commencement of service with the Trust’s predecessor entities, where applicable. |
| | | | | | |
| Other information (unaudited) | | Wells Fargo Growth Fund | | | 33 | |
Officers
| | | | | | |
Name and year of birth | | Position held and length of service | | Principal occupations during past five years or longer | | |
Andrew Owen (Born 1960) | | President, since 2017 | | Executive Vice President of Wells Fargo & Company and Head of Affiliated Managers, Wells Fargo Asset Management, since 2014. In addition, Mr. Owen is currently President, Chief Executive Officer and Director of Wells Fargo Funds Management, LLC since 2017. Prior thereto, Executive Vice President responsible for marketing, investments and product development for Wells Fargo Funds Management, LLC, from 2009 to 2014. | | |
Jeremy DePalma1 (Born 1974) | | Treasurer, since 2012 | | Senior Vice President of Wells Fargo Funds Management, LLC since 2009. Senior Vice President of Evergreen Investment Management Company, LLC from 2008 to 2010 and head of the Fund Reporting and Control Team within Fund Administration from 2005 to 2010. | | |
Alexander Kymn3 (Born 1973) | | Secretary, since 2018; Chief Legal Officer, since 2018 | | Senior Company Counsel of Wells Fargo Bank, N.A. since 2018 (previously Senior Counsel from 2007 to 2018). Vice President of Wells Fargo Funds Management, LLC from 2008 to 2014. | | |
Michael H. Whitaker (Born 1967) | | Chief Compliance Officer, since 2016 | | Senior Vice President and Chief Compliance Officer since 2016. Senior Vice President and Chief Compliance Officer for Fidelity Investments from 2007 to 2016. | | |
David Berardi (Born 1975) | | Assistant Treasurer, since 2009 | | Vice President of Wells Fargo Funds Management, LLC since 2009. Vice President of Evergreen Investment Management Company, LLC from 2008 to 2010. Manager of Fund Reporting and Control for Evergreen Investment Management Company, LLC from 2004 to 2010. | | |
| 1 | Jeremy DePalma acts as Treasurer of 77 funds and Assistant Treasurer of 77 funds in the Fund Complex. |
| 2 | The Statement of Additional Information includes additional information about the Trustees and is available, without charge, upon request, by calling 1-800-222-8222 or by visiting the website at wellsfargofunds.com. |
| 3 | Alexander Kymn became the Secretary and Chief Legal Officer effective April 17, 2018. |
| | | | |
| 34 | | Wells Fargo Growth Fund | | Other information (unaudited) |
BOARD CONSIDERATION OF INVESTMENT MANAGEMENT AND SUB-ADVISORY AGREEMENTS:
Wells Fargo Growth Fund
Under the Investment Company Act of 1940 (the “1940 Act”), the Board of Trustees (the “Board”) of Wells Fargo Funds Trust (the “Trust”) must determine annually whether to approve the continuation of the Trust’s investment management and sub-advisory agreements. In this regard, at an in-person meeting held on May 22-23, 2018 (the “Meeting”), the Board, all the members of which have no direct or indirect interest in the investment management and sub-advisory agreements and are not “interested persons” of the Trust, as defined in the 1940 Act (the “Independent Trustees”), reviewed and approved for Wells Fargo Growth Fund (the “Fund”): (i) an investment management agreement (the “Management Agreement”) with Wells Fargo Funds Management, LLC (“Funds Management”); and (ii) an investment sub-advisory agreement (the “Sub-Advisory Agreement”) with Wells Capital Management Incorporated (the “Sub-Adviser”), an affiliate of Funds Management. The Management Agreement and the Sub-Advisory Agreement are collectively referred to as the “Advisory Agreements.”
At the Meeting, the Board considered the factors and reached the conclusions described below relating to the selection of Funds Management and the Sub-Adviser and the approval of the Advisory Agreements. Prior to the Meeting, including at an in-person meeting in April 2018, the Trustees conferred extensively among themselves and with representatives of Funds Management about these matters. Also, the Board has adopted a team-based approach, with each team consisting of a sub-set of Trustees, to assist the full Board in the discharge of its duties in reviewing investment performance and other matters throughout the year. The Independent Trustees were assisted in their evaluation of the Advisory Agreements by independent legal counsel, from whom they received separate legal advice and with whom they met separately.
In providing information to the Board, Funds Management and the Sub-Adviser were guided by a detailed set of requests for information submitted to them by independent legal counsel on behalf of the Independent Trustees at the start of the Board’s annual contract renewal process earlier in 2018. In considering and approving the Advisory Agreements, the Trustees considered the information they believed relevant, including but not limited to the information discussed below. The Board considered not only the specific information presented in connection with the Meeting, but also the knowledge gained over time through interaction with Funds Management and the Sub-Adviser about various topics. In this regard, the Board reviewed reports of Funds Management at each of its quarterly meetings, which included, among other things, portfolio reviews and investment performance reports. In addition, the Board and the teams mentioned above confer with portfolio managers at various times throughout the year. The Board did not identify any particular information or consideration that was all-important or controlling, and each individual Trustee may have attributed different weights to various factors.
After its deliberations, the Board unanimously approved the continuation of the Advisory Agreements for a one-year term and determined that the compensation payable to Funds Management and the Sub-Adviser under each of the Advisory Agreements was reasonable. The Board considered the approval of the Advisory Agreements for the Fund as part of its consideration of agreements for funds across the complex, but its approvals were made on a fund-by-fund basis. The following summarizes a number of important, but not necessarily all, factors considered by the Board in support of its approvals.
Nature, extent and quality of services
The Board received and considered various information regarding the nature, extent and quality of services provided to the Fund by Funds Management and the Sub-Adviser under the Advisory Agreements. This information included a description of the investment advisory services and Fund-level administrative services covered by the Management Agreement, as well as, among other things, a summary of the background and experience of senior management of Wells Fargo Asset Management (“WFAM”), of which Funds Management and the Sub-Adviser are a part, a summary of investments made in the business of WFAM, a summary of certain organizational and personnel changes involving Funds Management and the Sub-Adviser, and a description of Funds Management’s and the Sub-Adviser’s business continuity planning programs and of their approaches to data privacy and cybersecurity. The Board also considered the qualifications, background, tenure and responsibilities of each of the portfolio managers primarily responsible for the day-to-day portfolio management of the Fund.
The Board evaluated the ability of Funds Management and the Sub-Adviser to attract and retain qualified investment professionals, including research, advisory and supervisory personnel. The Board further considered the compliance programs and compliance records of Funds Management and the Sub-Adviser. In addition, the Board took into account the full range of services provided to the Fund by Funds Management and its affiliates.
| | | | | | |
| Other information (unaudited) | | Wells Fargo Growth Fund | | | 35 | |
Fund investment performance and expenses
The Board considered the investment performance results for the Fund over various time periods ended December 31, 2017. The Board considered these results in comparison to the investment performance of funds in a universe that was determined by Broadridge Inc. (“Broadridge”) to be similar to the Fund (the “Universe”), and in comparison to the Fund’s benchmark index and to other comparative data. Broadridge is an independent provider of investment company data. The Board received a description of the methodology used by Broadridge to select the mutual funds in the performance Universe. The Board noted that the investment performance of the Fund (Administrator Class) was higher than the average investment performance of the Universe for the one-, three-, and ten-year periods under review, but lower than the average investment performance of the Universe for the five-year period under review. The Board also noted that the investment performance of the Fund was higher than its benchmark index, the Russell 3000 Growth Index, for the one- and ten-year periods under review, but lower than its benchmark index for the three- and five-year periods under review.
The Board received information concerning, and discussed factors contributing to, the underperformance of the Fund relative to the Universe and benchmark for the periods identified above. The Board took note of the explanations for the relative underperformance during these periods, including with respect to investment decisions and market factors that affected the Fund’s investment performance.
The Board also received and considered information regarding the Fund’s net operating expense ratios and their various components, including actual management fees, custodian and other non-management fees, and Rule 12b-1 and non-Rule 12b-1 shareholder service fees. The Board considered these ratios in comparison to the median ratios of funds in class-specific expense groups that were determined by Broadridge to be similar to the Fund (the “Groups”). The Board received a description of the methodology used by Broadridge to select the mutual funds in the expense Groups and an explanation of how funds comprising expense groups and their expense ratios may vary from year-to-year. Based on the Broadridge reports, the Board noted that the net operating expense ratios of the Fund were lower than, equal to, or in range of the median net operating expense ratios of the expense Groups for each share class.
The Board took into account the Fund’s investment performance and expense information provided to it among the factors considered in deciding to re-approve the Advisory Agreements.
Investment management and sub-advisory fee rates
The Board reviewed and considered the contractual fee rates payable by the Fund to Funds Management under the Management Agreement, as well as the contractual fee rates payable by the Fund to Funds Management for class-level administrative services under a Class-Level Administration Agreement, which include, among other things, class-level transfer agency and sub-transfer agency costs (collectively, the “Management Rates”). The Board also reviewed and considered the contractual investment sub-advisory fee rates that are payable by Funds Management to the Sub-Adviser for investment sub-advisory services.
Among other information reviewed by the Board was a comparison of the Fund’s Management Rates with the average contractual investment management fee rates of funds in the expense Groups at a common asset level as well as transfer agency costs of the funds in the expense Groups. The Board noted that the Management Rates of the Fund were in range of the sum of these average rates for the Fund’s expense Groups for all share classes.
The Board also received and considered information about the portion of the total management fee that was retained by Funds Management after payment of the fee to the Sub-Adviser for sub-advisory services. In assessing the reasonableness of this amount, the Board received and evaluated information about the nature and extent of responsibilities retained and risks assumed by Funds Management and not delegated to or assumed by the Sub-Adviser, and about Funds Management’s on-going oversight services. Given the affiliation between Funds Management and the Sub-Adviser, the Board ascribed limited relevance to the allocation of fees between them.
The Board also received and considered information about the nature and extent of services offered and fee rates charged by Funds Management and the Sub-Adviser to other types of clients with investment strategies similar to those of the Fund. In this regard, the Board received information about the significantly greater scope of services, and compliance, reporting and other legal burdens and risks of managing mutual funds compared with those associated with managing assets of non-mutual fund clients such as institutional separate accounts.
Based on its consideration of the factors and information it deemed relevant, including those described here, the Board determined that the compensation payable to Funds Management under the Management Agreement and to the Sub-Adviser under the Sub-Advisory Agreement was reasonable.
| | | | |
| 36 | | Wells Fargo Growth Fund | | Other information (unaudited) |
Profitability
The Board received and considered information concerning the profitability of Funds Management, as well as the profitability of both WFAM and Wells Fargo & Co. (“Wells Fargo”) as a whole, from providing services to the Fund and the fund family as a whole. The Board noted that the Sub-Adviser’s profitability information with respect to providing services to the Fund was subsumed in the WFAM and Wells Fargo profitability analysis.
Funds Management reported on the methodologies and estimates used in calculating profitability, including a description of the methodology used to allocate certain expenses and recent enhancements made to the methodology. Among other things, the Board noted that the levels of profitability reported on a fund-by-fund basis varied widely, depending on factors such as the size and type of fund. Based on its review, the Board did not deem the profits reported by Funds Management, WFAM or Wells Fargo from services provided to the Fund to be at a level that would prevent it from approving the continuation of the Advisory Agreements.
Economies of scale
The Board considered the extent to which Funds Management may experience economies of scale in the provision of management services, and the extent to which scale benefits, if any, would be shared with shareholders. In particular, the Board noted the existence of breakpoints in the Fund’s management fee structure, which operate generally to reduce the Fund’s expense ratios as the Fund grows in size. It considered that, for a small fund or a fund that shrinks in size, breakpoints conversely can result in higher fee levels. The Board also considered that in addition to management fee breakpoints, competitive management fee rates set at the outset without regard to breakpoints and fee waiver and expense reimbursement arrangements, as well as investments in the business intended to enhance services available to Fund shareholders, are means of sharing potential economies of scale with shareholders of the Fund.
The Board concluded that the Fund’s fee and expense arrangements, including contractual breakpoints, constituted a reasonable approach to sharing potential economies of scale with the Fund and its shareholders.
Other benefits to Funds Management and the Sub-Adviser
The Board received and considered information regarding potential “fall-out” or ancillary benefits received by Funds Management and its affiliates, including the Sub-Adviser, as a result of their relationships with the Fund. Ancillary benefits could include, among others, benefits directly attributable to other relationships with the Fund and benefits potentially derived from an increase in Funds Management’s and the Sub-Adviser’s business as a result of their relationships with the Fund. The Board noted that various affiliates of Funds Management may receive distribution-related fees, shareholder servicing payments and sub-transfer agency fees in respect of shares sold or held through them and services provided.
The Board also reviewed information about soft dollar credits earned and utilized by the Sub-Adviser, fees earned by Funds Management and the Sub-Adviser from managing a private investment vehicle for the fund family’s securities lending collateral and commissions earned by an affiliated broker from portfolio transactions.
Based on its consideration of the factors and information it deemed relevant, including those described here, the Board did not find that any ancillary benefits received by Funds Management and its affiliates, including the Sub-Adviser, were unreasonable.
Conclusion
At the Meeting, after considering the above-described factors and based on its deliberations and its evaluation of the information described above, the Board unanimously approved the continuation of the Advisory Agreements for a one-year term and determined that the compensation payable to Funds Management and the Sub-Adviser under each of the Advisory Agreements was reasonable.
| | | | | | |
| Appendix A (unaudited) | | Wells Fargo Growth Fund | | | 37 | |
SALES CHARGE REDUCTIONS AND WAIVERS FOR CERTAIN INTERMEDIARIES
Ameriprise
Effective June 1, 2018, shareholders purchasing Fund shares through an Ameriprise Financial platform or account will be eligible only for the following Class A load waivers (front-end sales charge waivers), which may differ from those disclosed elsewhere in the Fund’s prospectus or Statement of Additional Information.
Front-end Sales Load Waivers on Class A Shares Available at Ameriprise Financial
| | • | | Employer-sponsored retirement plans (e.g., 401(k) plans, 457 plans, employer-sponsored 403(b) plans, profit sharing and money purchase pension plans and defined benefit plans). For purposes of this provision, employer-sponsored retirement plans do not include SEP IRAs, Simple IRAs or SAR-SEPs. |
| | • | | Shares purchased through an Ameriprise Financial investment advisory program (if an Advisory or similar share class for such investment advisory program is not available) |
| | • | | Shares purchased by third party investment advisors on behalf of their advisory clients through Ameriprise Financial’s platform (if an Advisory or similar share class for such investment advisory program is not available) |
| | • | | Shares purchased through reinvestment of distributions and dividend reinvestment when purchasing shares of the same Fund (but not any other fund within the same fund family) |
| | • | | Shares exchanged from Class C shares of the same fund in the month of or following the 10-year anniversary of the purchase date. To the extent that the Fund’s prospectus elsewhere provides for a waiver with respect to such shares following a shorter holding period, that waiver will apply to exchanges following such shorter period. To the extent that the Fund’s prospectus elsewhere provides for a waiver with respect to exchanges of Class C shares for load-waived shares, that waiver will also apply to such exchanges. |
| | • | | Employees and registered representatives of Ameriprise Financial or its affiliates and their immediate family members |
| | • | | Shares purchased by or through qualified accounts (including IRAs, Coverdell Education Savings Accounts, 401(k)s, 403(b) TSCAs subject to ERISA and defined benefit plans) that are held by a covered family member, defined as an Ameriprise financial advisor and/or the advisor’s spouse, advisor’s lineal ascendant (mother, father, grandmother, grandfather, great grandmother, great grandfather), advisor’s lineal descendant (son, step-son, daughter, step-daughter, grandson, granddaughter, great grandson, great granddaughter) or any spouse of a covered family member who is a lineal descendant |
| | • | | Shares purchased from the proceeds of redemptions within the same fund family, provided (1) the repurchase occurs within 90 days following the redemption, (2) the redemption and purchase occur in the same account, and (3) redeemed shares were subject to a front-end or deferred sales load (i.e. Rights of Reinstatement). Subject to the Fund’s policy regarding frequent purchases and redemptions of Fund shares, you may not be able to repurchase shares for the first 30 days after your redemption. |
Automatic Exchange of Class C Shares Available at Ameriprise Financial
| | • | | Class C shares will automatically exchange to Class A shares in the month of the 10-year anniversary of the purchase date. |
Merrill Lynch
Effective April 10, 2017, shareholders purchasing Fund shares through a Merrill Lynch platform or account will be eligible only for the following load waivers (front-end sales charge waivers and contingent deferred, or back-end, sales charge waivers) and discounts, which may differ from those disclosed elsewhere in the Fund’s prospectus or Statement of Additional Information.
Front-end Sales Load Waivers on Class A Shares available at Merrill Lynch
| | • | | Employer-sponsored retirement, deferred compensation and employee benefit plans (including health savings accounts) and trusts used to fund those plans, provided that the shares are not held in a commission-based brokerage account and shares are held for the benefit of the plan |
| | • | | Shares purchased by or through a 529 Plan |
| | • | | Shares purchased through a Merrill Lynch affiliated investment advisory program |
| | | | |
| 38 | | Wells Fargo Growth Fund | | Appendix A (unaudited) |
| | • | | Shares purchased by third party investment advisors on behalf of their advisory clients through Merrill Lynch’s platform |
| | • | | Shares of funds purchased through the Merrill Edge Self-Directed platform (if applicable) |
| | • | | Shares purchased through reinvestment of capital gains distributions and dividend reinvestment when purchasing shares of the same fund (but not any other fund within the fund family) |
| | • | | Shares exchanged from Class C (i.e. level-load) shares of the same fund in the month of or following the 10-year anniversary of the purchase date |
| | • | | Employees and registered representatives of Merrill Lynch or its affiliates and their family members, as defined by Merrill Lynch, which may differ from the definition of family member in the Fund’s prospectus. |
| | • | | Directors or Trustees of the Fund, and employees of the Fund’s investment adviser or any of its affiliates, as described in the Fund’s prospectus |
| | • | | Shares purchased from the proceeds of redemptions within the same fund family, provided (1) the repurchase occurs within 90 days following the redemption, (2) the redemption and purchase occur in the same account, and (3) redeemed shares were subject to a front-end or deferred sales load (known as Rights of Reinstatement). Subject to the Fund’s policy regarding frequent purchases and redemptions of Fund shares, you may not be able to repurchase shares for the first 30 days after your redemption. |
CDSC Waivers on A, B and C Shares available at Merrill Lynch
| | • | | Death or disability of the shareholder |
| | • | | Shares sold as part of a systematic withdrawal plan as described in the Fund’s prospectus |
| | • | | Return of excess contributions from an IRA Account |
| | • | | Shares sold as part of a required minimum distribution for IRA and retirement accounts due to the shareholder reaching age 70½ |
| | • | | Shares sold to pay Merrill Lynch fees but only if the transaction is initiated by Merrill Lynch |
| | • | | Shares acquired through a right of reinstatement |
| | • | | Shares held in retirement brokerage accounts, that are exchanged for a lower cost share class due to transfer to certain fee based accounts or platforms (applicable to A and C shares only) |
Front-end load Discounts Available at Merrill Lynch: Breakpoints, Rights of Accumulation & Letters of Intent
| | • | | Breakpoints as described in the Fund’s prospectus |
| | • | | Rights of Accumulation (ROA) which entitle shareholders to breakpoint discounts will be automatically calculated based on the aggregated holding of fund family assets held by accounts within the purchaser’s household at Merrill Lynch. Eligible fund family assets not held at Merrill Lynch may be included in the ROA calculation only if the shareholder notifies his or her financial advisor about such assets. |
| | • | | Letters of Intent (LOI) which allow for breakpoint discounts based on anticipated purchases within a fund family, through Merrill Lynch, over a 13-month period of time (if applicable) |
Morgan Stanley
Effective on or about July 1, 2018, shareholders purchasing Fund shares through a Morgan Stanley Wealth Management transactional brokerage account will be eligible only for the following Class A load waivers (front-end sales charge waivers), which may differ from and be more limited than those disclosed in the Fund’s prospectus or Statement of Additional Information.
Front-end Sales Load Waivers on Class A Shares Available at Morgan Stanley
| | • | | Employer-sponsored retirement plans (e.g., 401(k) plans, 457 plans, employer-sponsored 403(b) plans, profit sharing and money purchase pension plans and defined benefit plans). For purposes of this provision, employer-sponsored retirement plans do not include SEP IRAs, Simple IRAs, SAR-SEPs or Keogh plans. |
| | • | | Morgan Stanley employee and employee-related accounts according to Morgan Stanley’s account linking rules |
| | • | | Shares purchased through reinvestment of dividends and capital gains distributions when purchasing shares of the same fund |
| | • | | Shares purchased through a Morgan Stanley self-directed brokerage account |
| | | | | | |
| Appendix A (unaudited) | | Wells Fargo Growth Fund | | | 39 | |
| | • | | Class C (i.e., level-load) shares that are no longer subject to a contingent deferred sales charge and are exchanged to Class A shares of the same fund pursuant to Morgan Stanley Wealth Management’s share class exchange program. |
| | • | | Shares purchased from the proceeds of redemptions within the same fund family, provided (i) the repurchase occurs within 90 days following the redemption, (ii) the redemption and purchase occur in the same account, and (iii) redeemed shares were subject to a front-end or deferred sales charge. This waiver is subject to the Fund’s policy regarding frequent purchases and redemption of Fund shares, as discussed under “Account Information—Frequent Purchases and Redemptions of Fund Shares” in the Fund’s prospectus. |
This page is intentionally left blank.

For more information
More information about Wells Fargo Funds is available free upon request. To obtain literature, please write, email, visit the Fund’s website, or call:
Wells Fargo Funds
P.O. Box 219967
Kansas City, MO 64121-9967
Website: wellsfargofunds.com
Individual investors: 1-800-222-8222
Retail investment professionals: 1-888-877-9275
Institutional investment professionals:
1-866-765-0778
This report and the financial statements contained herein are submitted for the general information of the shareholders of the Fund. If this report is used for promotional purposes, distribution of the report must be accompanied or preceded by a current prospectus. Before investing, please consider the investment objectives, risks, charges, and expenses of the investment. For a current prospectus and, if available, a summary prospectus, containing this information, call 1-800-222-8222 or visit the Fund’s website at wellsfargofunds.com. Read the prospectus carefully before you invest or send money.
Wells Fargo Asset Management (WFAM) is the trade name for certain investment advisory/management firms owned by Wells Fargo & Company. These firms include but are not limited to Wells Capital Management Incorporated and Wells Fargo Funds Management, LLC. Certain products managed by WFAM entities are distributed by Wells Fargo Funds Distributor, LLC (a broker/dealer and Member FINRA).
This material is for general informational and educational purposes only and is NOT intended to provide investment advice or a recommendation of any kind—including a recommendation for any specific investment, strategy, or plan.
NOT FDIC INSURED ◾ NO BANK GUARANTEE ◾ MAY LOSE VALUE
© 2018 Wells Fargo Funds Management, LLC. All rights reserved.
| | |
 | | 314796 09-18 A206/AR206 07-18 |
Annual Report
July 31, 2018

Wells Fargo Intrinsic Value Fund


Reduce clutter. Save trees.
Sign up for electronic delivery of prospectuses and shareholder reports at wellsfargo.com/advantagedelivery
Contents
The views expressed and any forward-looking statements are as of July 31, 2018, unless otherwise noted, and are those of the Fund managers and/or Wells Fargo Funds Management, LLC. Discussions of individual securities, or the markets generally, or any Wells Fargo Fund are not intended as individual recommendations. Future events or results may vary significantly from those expressed in any forward-looking statements. The views expressed are subject to change at any time in response to changing circumstances in the market. Wells Fargo Funds Management, LLC and the Fund disclaim any obligation to publicly update or revise any views expressed or forward-looking statements.
NOT FDIC INSURED ◾ NO BANK GUARANTEE ◾ MAY LOSE VALUE
| | | | |
| 2 | | Wells Fargo Intrinsic Value Fund | | Letter to shareholders (unaudited) |

Andrew Owen
President
Wells Fargo Funds
After advancing during the summer and fall of 2017 in a roughly synchronized way, economic growth and stock markets globally diverged during the first seven months of 2018.
Dear Shareholder:
We are pleased to offer you this annual report for the Wells Fargo Intrinsic Value Fund for the 12-month period that ended July 31, 2018. After advancing during the summer and fall of 2017 in a roughly synchronized way, economic growth and stock markets globally diverged during the first seven months of 2018. For fixed-income investors, higher U.S. interest rates, rising inflation, and intensifying global geopolitical tensions tended to restrain taxable bond prices while high-yield and municipal bond investors generally enjoyed positive returns.
For the period, U.S. stocks, as measured by the S&P 500 Index,1 gained 16.24%, and international stocks, as measured by the MSCI ACWI ex USA Index (Net),2 added 5.94%. Emerging market stocks, as measured by the MSCI EM Index (Net),3 added 4.36%. In bond markets, the Bloomberg Barclays U.S. Aggregate Bond Index4 declined 0.80% while fixed-income investments outside the U.S. fell 0.27%, according to the Bloomberg Barclays Global Aggregate ex-USD Index.5 The Bloomberg Barclays Municipal Bond Index6 added 0.99%, and the ICE BofAML U.S. High Yield Index7 was up 2.49%.
Volatility increased as summer turned to fall in 2017, although data generally was favorable.
During the third quarter of 2017, investor expectations rose and fell amid shifting geopolitical tensions, particularly in Asia as North Korea’s nuclear aspirations and U.S./China trade rhetoric caused concerns. In the U.S., corporate earnings and consumer confidence improved. The U.S. Bureau of Economic Analysis reported that annualized U.S. gross domestic product (GDP) growth for the quarter was 2.8%. The rate of inflation was below the U.S. Federal Reserve’s (Fed’s) targets.
Economic momentum increased in Europe; the European Central Bank (ECB) held its rates steady at low levels and continued its quantitative easing bond-buying program with the goal of sparking economic activity. In emerging markets, many countries benefited from stronger currencies versus the U.S. dollar while commodity price increases benefited countries that rely on natural resources for exports.
| 1 | The S&P 500 Index consists of 500 stocks chosen for market size, liquidity, and industry group representation. It is a market-value-weighted index with each stock’s weight in the index proportionate to its market value. You cannot invest directly in an index. |
| 2 | The Morgan Stanley Capital International (MSCI) All Country World Index (ACWI) ex USA Index (Net) is a free-float-adjusted market-capitalization-weighted index that is designed to measure the equity market performance of developed markets, excluding the United States and Canada. Source: MSCI. MSCI makes no express or implied warranties or representations and shall have no liability whatsoever with respect to any MSCI data contained herein. The MSCI data may not be further redistributed or used as a basis for other indices or any securities or financial products. This report is not approved, reviewed, or produced by MSCI. You cannot invest directly in an index. |
| 3 | The MSCI Emerging Markets (EM) Index (Net) is a free-float-adjusted market-capitalization-weighted index that is designed to measure large- and mid-cap equity market performance of emerging markets. The MSCI EM Index (Net) consists of the following 24 emerging market country indices: Brazil, Chile, China, Colombia, Czech Republic, Egypt, Greece, Hungary, India, Indonesia, Korea, Malaysia, Mexico, Pakistan, Peru, the Philippines, Poland, Qatar, Russia, South Africa, Taiwan, Thailand, Turkey, and the United Arab Emirates. You cannot invest directly in an index. |
| 4 | The Bloomberg Barclays U.S. Aggregate Bond Index is a broad-based benchmark that measures the investment-grade, U.S. dollar-denominated, fixed-rate taxable bond market, including Treasuries, government-related and corporate securities, mortgage-backed securities (agency fixed-rate and hybrid adjustable-rate mortgage pass-throughs), asset-backed securities, and commercial mortgage-backed securities. You cannot invest directly in an index. |
| 5 | The Bloomberg Barclays Global Aggregate ex-USD Index is an unmanaged index that provides a broad-based measure of the global investment-grade fixed-income markets excluding the U.S. dollar-denominated debt market. You cannot invest directly in an index. |
| 6 | The Bloomberg Barclays Municipal Bond Index is an unmanaged index composed of long-term tax-exempt bonds with a minimum credit rating of Baa. You cannot invest directly in an index. |
| 7 | The ICE BofAML U.S. High Yield Index is a market-capitalization-weighted index of domestic and Yankee high-yield bonds. The index tracks the performance of high-yield securities traded in the U.S. bond market. You cannot invest directly in an index. Copyright 2018. ICE Data Indices, LLC. All rights reserved. |
| 8 | The Consumer Price Index For All Urban Consumers (CPI-U) measures the changes in the price of a basket of goods and services purchased by urban consumers. The urban consumer population is deemed by many as a better representative measure of the general public because most of the country’s population lives in highly populated areas, which represent close to 90% of the total population. You cannot invest directly in an index. |
| | | | | | |
| Letter to shareholders (unaudited) | | Wells Fargo Intrinsic Value Fund | | | 3 | |
The fourth quarter of 2017 was characterized by continued optimism in the U.S.
By the end of 2017, some observers were describing conditions as a Goldilocks economic scenario: synchronized global growth, low inflation, and healthy corporate earnings, all supported abroad by a weaker U.S. dollar.
U.S. stocks continued to rally during the fourth quarter of 2017, boosted by favorable company earnings and the potential for tax reform and industry deregulation. The Fed increased rates by 25 basis points (bps; 100 bps equal 1.00%) in December. The annualized GDP growth rate for the fourth quarter was 2.3%.
Internationally, the Bank of England (BoE) raised interest rates in November 2017 to 0.50%, the first increase in more than 10 years and a move up from the 0.25% rate put in place after the Brexit vote to leave the European Union in June 2016. The pound gained against other currencies. Meanwhile, the ECB and the Bank of Japan maintained interest rate policies and bond-buying programs intended to spur business activities and enhance the attractiveness of equity investments. The People’s Bank of China (PBOC) also continued policies that encouraged business investment. International equity markets, particularly emerging markets, continued to show strength.
Volatility reemerged during the first quarter of 2018 as economic signals were mixed.
The first quarter of 2018 began with stock market gains in January following U.S. tax reform that lowered rates for individuals and corporations and deregulation advanced in some economic sectors. Then, investor optimism was supplanted by several concerns. Trade tensions intensified, particularly between the U.S. and China. The U.S. threatened to impose tariffs on a broad range of imported products. Increasing interest rates and inflation also caused concern. During February 2018, the U.S. stock market endured a loss of more than 10% before recovering in March and April. The S&P 500 Index closed the first quarter with a negative return, the first negative quarterly return for the index since 2014.
The Fed increased the federal funds rate by 25 bps in March 2018 and the rate of inflation reached the Fed’s 2% target for the first time in a year. The unemployment rate fell to 4.1%. The third revision of first-quarter GDP growth by the U.S. Bureau of Economic Analysis released during June 2018 was lowered to 2.0%.
Overseas, investment market returns reversed the strong returns of 2017. After having gained 27.19% for the 12-month period that ended December 31, 2017, the MSCI ACWI ex USA Index (Net) fell 1.46% for the 7-month period that ended July 31, 2018. The U.S. dollar strengthened relative to local currencies, which served to restrain returns.
Global trade tensions escalated during the second quarter and into the third quarter of 2018.
Global trade tensions escalated as the second quarter of 2018 opened and equity markets fell in response before resuming upward momentum later in April. The U.S. government imposed tariffs on products and commodities imported from other markets in North America, Europe, and Asia. In retaliation, governments imposed tariffs on U.S. products and commodities. In addition, the U.S. pushed its North American neighbors to renegotiate the North American Free Trade Agreement, furthering trade tensions and investor uncertainty.
The CPI-U8 added 0.2% in May after a similar increase in April. On a year-over-year basis, the all-items index rose 2.8% for the 12 months that ended May 31, continuing its upward trend since the beginning of the year. The index for all items less food and energy rose 2.2% for the same 12-month period. Interest rates generally increased and the bond markets tended to decline.
During February 2018, the U.S. stock market endured a loss of more than 10% before recovering in March and April.
| | | | |
| 4 | | Wells Fargo Intrinsic Value Fund | | Letter to shareholders (unaudited) |
During June 2018, the Fed increased the federal funds rate by 25 bps. Investment markets began to anticipate two more rate increases in 2018. Long-term interest rates in the U.S. trended higher—rates on the 10-year and 30-year Treasury bonds moved from 2.46% and 2.81%, respectively, on January 1, 2018, to 2.96% and 3.08%, respectively, on July 31, 2018. While higher at the end of the period, rates were off their peak levels on May 17, 2018, of 3.11% and 3.25%, respectively. Investors became more aware of and concerned about the potential for an inverted yield curve—sometimes a recession signal—as short-term rates increased more quickly than long-term rates.
The unemployment rate fell to 3.9% in July after ticking up slightly in June from May’s 3.8% level, according to the U.S. Department of Labor. The annualized rate of GDP growth for the second quarter of 2018 was reported in July to be 4.1%, the highest level since the third quarter of 2014, according to the U.S. Bureau of Economic Analysis.
Internationally, the prospects for a smooth U.K. Brexit agreement was cast into doubt as members of Prime Minister Theresa May’s negotiating team resigned. Despite the uncertainty, the period closed with expectations that the BoE’s Monetary Policy Committee in July would announce an increase in its key interest rate to 0.75%, which it did in early August.
Meanwhile, central banks in Europe and Japan maintained low interest rates and accommodative monetary policies. Amid rising trade uncertainty, PBOC monetary policies shifted with cuts to reserve requirement ratios and implementation of supportive measures such as accelerated infrastructure spending and tax cuts for small and medium enterprises and for individuals. Nevertheless, a strengthening U.S. dollar and the tensions associated with trade policies remained headwinds for investors overseas.
Don’t let short-term uncertainty derail long-term investment goals.
Periods of investment uncertainty can present challenges, but experience has taught us that maintaining long-term investment goals can be an effective way to plan for the future. To help you create a sound strategy based on your personal goals and risk tolerance, Wells Fargo Funds offers more than 100 mutual funds spanning a wide range of asset classes and investment styles. Although diversification cannot guarantee an investment profit or prevent losses, we believe it can be an effective way to manage investment risk and potentially smooth out overall portfolio performance. We encourage investors to know their investments and to understand that appropriate levels of risk-taking may unlock opportunities.
Thank you for choosing to invest with Wells Fargo Funds. We appreciate your confidence in us and remain committed to helping you meet your financial needs.
Sincerely,

Andrew Owen
President
Wells Fargo Funds
| | | | | | |
| Letter to shareholders (unaudited) | | Wells Fargo Intrinsic Value Fund | | | 5 | |
Notice to shareholders
At a meeting held on August 14-15, 2018, the Board of Trustees of the Fund approved the following policy which will be effective on or about February 5, 2019:
Class C shares will convert automatically into Class A shares ten years after the initial date of purchase or, if you acquired your Class C shares through an exchange or conversion from another share class, ten years after the date you acquired your Class C shares. When Class C shares that you acquired through a purchase or exchange convert, any other Class C shares that you purchased with reinvested dividends and distributions also will convert into Class A shares on a pro rata basis. A shorter holding period may also apply depending on your intermediary. Please see “Appendix A—Sales Charge Reductions and Waivers for Certain Intermediaries” in the Fund’s prospectus or at the end of this report.
For further information about your Fund, contact your investment professional, visit our website at wellsfargofunds.com, or call us directly at 1-800-222-8222.
| | | | |
| 6 | | Wells Fargo Intrinsic Value Fund | | Performance highlights (unaudited) |
Investment objective
The Fund seeks long-term capital appreciation.
Manager
Wells Fargo Funds Management, LLC
Subadviser
Wells Capital Management Incorporated
Portfolio managers
Miguel E. Giaconi, CFA®
Jean-Baptiste Nadal, CFA®
Average annual total returns (%) as of July 31, 20181
| | | | | | | | | | | | | | | | | | | | | | | | | | | | | | | | | | |
| | | | | Including sales charge | | | Excluding sales charge | | | Expense ratios2 (%) | |
| | | Inception date | | 1 year | | | 5 year | | | 10 year | | | 1 year | | | 5 year | | | 10 year | | | Gross | | | Net3 | |
| Class A (EIVAX) | | 8-1-2006 | | | 5.96 | | | | 7.85 | | | | 8.55 | | | | 12.43 | | | | 9.14 | | | | 9.20 | | | | 1.18 | | | | 1.11 | |
| Class C (EIVCX) | | 8-1-2006 | | | 10.65 | | | | 8.33 | | | | 8.38 | | | | 11.65 | | | | 8.33 | | | | 8.38 | | | | 1.93 | | | | 1.86 | |
| Class R (EIVTX) | | 3-1-2013 | | | – | | | | – | | | | – | | | | 12.21 | | | | 8.88 | | | | 8.94 | | | | 1.43 | | | | 1.36 | |
| Class R6 (EIVFX) | | 11-30-2012 | | | – | | | | – | | | | – | | | | 12.96 | | | | 9.57 | | | | 9.58 | | | | 0.75 | | | | 0.65 | |
| Administrator Class (EIVDX) | | 7-30-2010 | | | – | | | | – | | | | – | | | | 12.63 | | | | 9.34 | | | | 9.40 | | | | 1.10 | | | | 0.95 | |
| Institutional Class (EIVIX) | | 8-1-2006 | | | – | | | | – | | | | – | | | | 12.96 | | | | 9.62 | | | | 9.60 | | | | 0.85 | | | | 0.70 | |
| Russell 1000® Value Index4 | | – | | | – | | | | – | | | | – | | | | 9.54 | | | | 10.04 | | | | 8.95 | | | | – | | | | – | |
Figures quoted represent past performance, which is no guarantee of future results, and do not reflect taxes that a shareholder may pay on fund distributions or the redemption of fund shares. Investment return and principal value of an investment will fluctuate so that an investor’s shares, when redeemed, may be worth more or less than their original cost. Performance shown without sales charges would be lower if sales charges were reflected. Current performance may be lower or higher than the performance data quoted, which assumes the reinvestment of dividends and capital gains. Current month-end performance is available on the Fund’s website, wellsfargofunds.com.
Index returns do not include transaction costs associated with buying and selling securities, any mutual fund fees or expenses, or any taxes. It is not possible to invest directly in an index.
For Class A shares, the maximum front-end sales charge is 5.75%. For Class C shares, the maximum contingent deferred sales charge is 1.00%. Performance including a contingent deferred sales charge assumes the sales charge for the corresponding time period. Class R, Class R6, Administrator Class, and Institutional Class shares are sold without a front-end sales charge or contingent deferred sales charge.
Stock values fluctuate in response to the activities of individual companies and general market and economic conditions. Certain investment strategies tend to increase the total risk of an investment (relative to the broader market). The Fund is exposed to foreign investment risk and focused portfolio risk. Consult the Fund’s prospectus for additional information on these and other risks.
Please see footnotes on page 7.
| | | | | | |
| Performance highlights (unaudited) | | Wells Fargo Intrinsic Value Fund | | | 7 | |
|
| Growth of $10,000 investment as of July 31, 20185 |
|
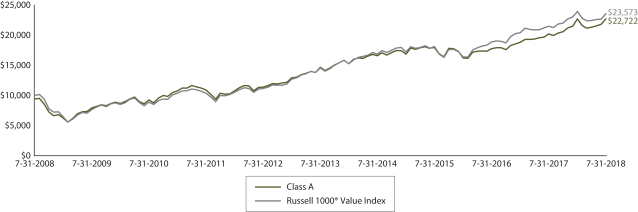 |
| 1 | Historical performance shown for Class R shares prior to their inception reflects the performance of Institutional Class shares, adjusted to reflect the higher expenses applicable to Class R shares. Historical performance shown for Class R6 shares prior to their inception reflects the performance of Institutional Class shares, and includes the higher expenses applicable to Institutional Class shares. If these expenses had not been included, returns for Class R6 shares would be higher. Historical performance shown for Administrator Class shares prior to their inception reflects the performance of Institutional Class shares, adjusted to reflect the higher expenses applicable to Administrator Class shares. Historical performance shown for all classes of the Fund prior to July 19, 2010, is based on the performance of the Fund’s predecessor, Evergreen Intrinsic Value Fund. |
| 2 | Reflects the expense ratios as stated in the most recent prospectuses. The expense ratios shown are subject to change and may differ from the annualized expense ratios shown in the financial highlights of this report. |
| 3 | The manager has contractually committed through November 30, 2018, to waive fees and/or reimburse expenses to the extent necessary to cap the Fund’s Total Annual Fund Operating Expenses After Fee Waivers at the amounts shown. After this time, the cap may be increased or the commitment to maintain the cap may be terminated only with the approval of the Board of Trustees. Brokerage commissions, stamp duty fees, interest, taxes, acquired fund fees and expenses (if any), and extraordinary expenses are excluded from the expense cap. Without this cap, the Fund’s returns would have been lower. The expense ratio paid by an investor is the net expense ratio (the total annual fund operating expenses after fee waivers) as stated in the prospectuses. |
| 4 | The Russell 1000® Value Index measures the performance of those Russell 1000 companies with lower price/book ratios and lower forecasted growth values. You cannot invest directly in an index. |
| 5 | The chart compares the performance of Class A shares for the most recent ten years with the Russell 1000® Value Index. The chart assumes a hypothetical investment of $10,000 in Class A shares and reflects all operating expenses and assumes the maximum initial sales charge of 5.75%. |
| 6 | The ten largest holdings, excluding cash, cash equivalents and any money market funds, are calculated based on the value of the investments divided by total net assets of the Fund. Holdings are subject to change and may have changed since the date specified. |
| 7 | Amounts are calculated based on the total long-term investments of the Fund. These amounts are subject to change and may have changed since the date specified. |
| * | This security was no longer held at the end of the reporting period. |
| | | | |
| 8 | | Wells Fargo Intrinsic Value Fund | | Performance highlights (unaudited) |
MANAGER’S DISCUSSION
Fund highlights
| ∎ | | The Fund outperformed its benchmark, the Russell 1000® Value Index, for the 12-month period that ended July 31, 2018. |
| ∎ | | Stock selection in the information technology (IT), industrials, and consumer discretionary sectors was the primary contributor to relative performance; an overweight to IT proved beneficial as well. |
| ∎ | | Stock selection in the consumer staples and financials sectors detracted from the Fund’s relative performance. |
Strong market performance from the Russell 1000® Value Index during the reporting period was driven mainly by strong corporate earnings growth, positive impact of tax reform, continued normalization of interest rates, and economic growth combined with muted inflation. We continued to adhere to our disciplined investment process that relies predominantly on discounted free cash flow. We also continued our focus on individual companies rather than on broad, top-down economic or sector forecasts. To manage risk, we maintained the Fund’s broad diversification by sector, industry, and position.
| | | | |
| Ten largest holdings (%) as of July 31, 20186 | |
Microsoft Corporation | | | 3.78 | |
Alphabet Incorporated Class C | | | 3.78 | |
Merck & Company Incorporated | | | 3.24 | |
Motorola Solutions Incorporated | | | 3.24 | |
Cisco Systems Incorporated | | | 3.14 | |
AerCap Holdings NV | | | 3.11 | |
Advance Auto Parts Incorporated | | | 2.97 | |
Honeywell International Incorporated | | | 2.88 | |
Comcast Corporation Class A | | | 2.88 | |
EOG Resources Incorporated | | | 2.85 | |
|
| Sector distribution as of July 31, 20187 |
|
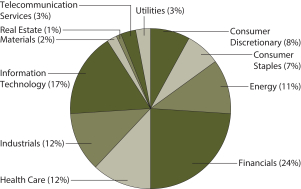
|
Stock selection in multiple sectors contributed to Fund performance.
Within the IT sector, the largest contributors to the Fund’s performance were computer software giant Microsoft Corporation; parent of Google, Alphabet Incorporated; and specialty wireless communication provider Motorola Solutions, Incorporated. Diversified industrial technology company Honeywell International Incorporated was the Fund’s top contributor within the industrials sector. In the consumer discretionary sector, off-price apparel and home fashion retailer The TJX Companies, Incorporated*, and Advance Auto Parts, Incorporated, a retailer/distributor of aftermarket automotive parts, added value.
Security selection in two sectors was the Fund’s main detractor from relative performance.
Within the consumer staples sector, the primary detractor was the largest private-label food supplier, TreeHouse Foods, Incorporated. Stock selection in the financials sector also detracted from relative returns—especially Synchrony Financial, the largest private-label credit card provider, and Swiss bank UBS AG, with strong recognition providing wealth management, asset management, and investment banking services.
During the period, we made changes to the Fund’s portfolio based on our fundamental research.
As a result of trades, stock price movements, and the annual reconstitution of the Russell family of indices, the Fund’s positioning relative to its benchmark shifted noticeably during the period. The most notable sector-weighting change within the Fund was an increase in the financials sector’s weighting; we added positions in four financials companies: global insurer American International Group, Incorporated; global insurance brokerage and consulting firm Aon plc; large diversified megabank Bank of America Corporation; and global commodity and financial-product exchanges operator Intercontinental Exchange, Incorporated. In all cases, trades within the Fund were made based on fundamental bottom-up research and were not top-down sector allocation decisions.
Please see footnotes on page 7.
| | | | | | |
| Performance highlights (unaudited) | | Wells Fargo Intrinsic Value Fund | | | 9 | |
We continued to focus on our investment strategy and process.
Expectations for a continuation of improving economic and earnings growth may bode well for the Fund’s positioning. The strong global economy and corporate earnings and rising interest rates are all favorable factors for high-quality companies. The lower corporate tax structure and immediate expensing of capital expenditures should boost U.S. corporate earnings. Corporate cash repatriation is in the early stages and may be a strong catalyst for the economy and the equity markets. As such, we believe investors may be well served by committing to the investment team’s intrinsic value approach.
Despite some of the potential risks in the market, such as trade wars, geopolitical events, renewed deflationary pressures or faster-than-expected inflation, and 2018 U.S. midterm elections, the Fund may be well positioned to benefit from normalization of interest rates, acceleration in global economic growth, expansion in valuation multiples, fundamentals gaining traction, and an increase in market volatility.
We continue to believe that our long-term focus on company fundamentals, our determination to seek out mispricing opportunities in the marketplace, and our ability to identify catalysts that create or unlock value over our investment time horizon should return value for shareholders over a complete market cycle.
| | | | |
| 10 | | Wells Fargo Intrinsic Value Fund | | Fund expenses (unaudited) |
As a shareholder of the Fund, you incur two types of costs: (1) transaction costs, including sales charges (loads) on purchase payments and contingent deferred sales charges (if any) on redemptions and (2) ongoing costs, including management fees, distribution (12b-1) and/or shareholder servicing fees, and other Fund expenses. This example is intended to help you understand your ongoing costs (in dollars) of investing in the Fund and to compare these costs with the ongoing costs of investing in other mutual funds.
The example is based on an investment of $1,000 invested at the beginning of the six-month period and held for the entire period from February 1, 2018 to July 31, 2018.
Actual expenses
The “Actual” line of the table below provides information about actual account values and actual expenses. You may use the information in this line, together with the amount you invested, to estimate the expenses that you paid over the period. Simply divide your account value by $1,000 (for example, an $8,600 account value divided by $1,000 = 8.6), then multiply the result by the number in the “Actual” line under the heading entitled “Expenses paid during period” for your applicable class of shares to estimate the expenses you paid on your account during this period.
Hypothetical example for comparison purposes
The “Hypothetical” line of the table below provides information about hypothetical account values and hypothetical expenses based on the Fund’s actual expense ratio and an assumed rate of return of 5% per year before expenses, which is not the Fund’s actual return. The hypothetical account values and expenses may not be used to estimate the actual ending account balance or expenses you paid for the period. You may use this information to compare the ongoing costs of investing in the Fund and other funds. To do so, compare this 5% hypothetical example with the 5% hypothetical examples that appear in the shareholder reports of the other funds.
Please note that the expenses shown in the table are meant to highlight your ongoing costs only and do not reflect any transactional costs, such as sales charges (loads) and contingent deferred sales charges. Therefore, the “Hypothetical” line of the table is useful in comparing ongoing costs only and will not help you determine the relative total costs of owning different funds. In addition, if these transactional costs were included, your costs would have been higher.
| | | | | | | | | | | | | | | | |
| | | Beginning account value 2-1-2018 | | | Ending account value 7-31-2018 | | | Expenses paid during the period¹ | | | Annualized net expense ratio | |
Class A | | | | | | | | | | | | | | | | |
Actual | | $ | 1,000.00 | | | $ | 999.23 | | | $ | 5.54 | | | | 1.10 | % |
Hypothetical (5% return before expenses) | | $ | 1,000.00 | | | $ | 1,019.66 | | | $ | 5.60 | | | | 1.10 | % |
Class C | | | | | | | | | | | | | | | | |
Actual | | $ | 1,000.00 | | | $ | 996.08 | | | $ | 9.36 | | | | 1.86 | % |
Hypothetical (5% return before expenses) | | $ | 1,000.00 | | | $ | 1,015.83 | | | $ | 9.45 | | | | 1.86 | % |
Class R | | | | | | | | | | | | | | | | |
Actual | | $ | 1,000.00 | | | $ | 999.24 | | | $ | 6.85 | | | | 1.36 | % |
Hypothetical (5% return before expenses) | | $ | 1,000.00 | | | $ | 1,018.35 | | | $ | 6.92 | | | | 1.36 | % |
Class R6 | | | | | | | | | | | | | | | | |
Actual | | $ | 1,000.00 | | | $ | 1,002.33 | | | $ | 3.28 | | | | 0.65 | % |
Hypothetical (5% return before expenses) | | $ | 1,000.00 | | | $ | 1,021.93 | | | $ | 3.31 | | | | 0.65 | % |
Administrator Class | | | | | | | | | | | | | | | | |
Actual | | $ | 1,000.00 | | | $ | 1,000.00 | | | $ | 4.79 | | | | 0.95 | % |
Hypothetical (5% return before expenses) | | $ | 1,000.00 | | | $ | 1,020.42 | | | $ | 4.84 | | | | 0.95 | % |
Institutional Class | | | | | | | | | | | | | | | | |
Actual | | $ | 1,000.00 | | | $ | 1,001.52 | | | $ | 3.53 | | | | 0.70 | % |
Hypothetical (5% return before expenses) | | $ | 1,000.00 | | | $ | 1,021.68 | | | $ | 3.57 | | | | 0.70 | % |
| 1 | Expenses paid is equal to the annualized net expense ratio of each class multiplied by the average account value over the period, multiplied by the number of days in the most recent fiscal half-year divided by the number of days in the fiscal year (to reflect the one-half-year period). |
| | | | | | |
| Portfolio of investments—July 31, 2018 | | Wells Fargo Intrinsic Value Fund | | | 11 | |
| | | | | | | | | | | | | | | | |
| Security name | | | | | | | | Shares | | | Value | |
| | | | |
Common Stocks: 99.00% | | | | | | | | | | | | | | | | |
| | | | |
Consumer Discretionary: 8.32% | | | | | | | | | | | | | | | | |
| | | | |
| Media: 5.35% | | | | | | | | | | | | | | | | |
Comcast Corporation Class A | | | | | | | | | | | 739,300 | | | $ | 26,452,154 | |
The Walt Disney Company | | | | | | | | | | | 199,700 | | | | 22,677,932 | |
| | | | |
| | | | | | | | | | | | | | | 49,130,086 | |
| | | | | | | | | | | | | | | | |
| | | | |
| Specialty Retail: 2.97% | | | | | | | | | | | | | | | | |
Advance Auto Parts Incorporated | | | | | | | | | | | 193,300 | | | | 27,299,759 | |
| | | | | | | | | | | | | | | | |
| | | | |
Consumer Staples: 7.28% | | | | | | | | | | | | | | | | |
| | | | |
| Beverages: 2.31% | | | | | | | | | | | | | | | | |
Anheuser-Busch InBev NV ADR « | | | | | | | | | | | 208,900 | | | | 21,249,308 | |
| | | | | | | | | | | | | | | | |
| | | | |
| Food Products: 4.97% | | | | | | | | | | | | | | | | |
Mondelez International Incorporated Class A | | | | | | | | | | | 581,900 | | | | 25,242,822 | |
Nestle SA ADR | | | | | | | | | | | 228,200 | | | | 18,600,582 | |
TreeHouse Foods Incorporated † | | | | | | | | | | | 38,841 | | | | 1,844,559 | |
| | | | |
| | | | | | | | | | | | | | | 45,687,963 | |
| | | | | | | | | | | | | | | | |
| | | | |
Energy: 10.63% | | | | | | | | | | | | | | | | |
| | | | |
| Energy Equipment & Services: 3.26% | | | | | | | | | | | | | | | | |
Schlumberger Limited | | | | | | | | | | | 291,500 | | | | 19,682,080 | |
TechnipFMC plc | | | | | | | | | | | 316,000 | | | | 10,285,800 | |
| | | | |
| | | | | | | | | | | | | | | 29,967,880 | |
| | | | | | | | | | | | | | | | |
| | | | |
| Oil, Gas & Consumable Fuels: 7.37% | | | | | | | | | | | | | | | | |
Chevron Corporation | | | | | | | | | | | 186,800 | | | | 23,587,236 | |
Concho Resources Incorporated † | | | | | | | | | | | 122,700 | | | | 17,895,795 | |
EOG Resources Incorporated | | | | | | | | | | | 203,400 | | | | 26,226,396 | |
| | | | |
| | | | | | | | | | | | | | | 67,709,427 | |
| | | | | | | | | | | | | | | | |
| | | | |
Financials: 23.38% | | | | | | | | | | | | | | | | |
| | | | |
| Banks: 10.55% | | | | | | | | | | | | | | | | |
Bank of America Corporation | | | | | | | | | | | 793,400 | | | | 24,500,192 | |
BB&T Corporation | | | | | | | | | | | 476,200 | | | | 24,195,722 | |
CIT Group Incorporated | | | | | | | | | | | 441,700 | | | | 23,379,181 | |
US Bancorp | | | | | | | | | | | 469,900 | | | | 24,909,399 | |
| | | | |
| | | | | | | | | | | | | | | 96,984,494 | |
| | | | | | | | | | | | | | | | |
| | | | |
| Capital Markets: 3.47% | | | | | | | | | | | | | | | | |
Intercontinental Exchange Incorporated | | | | | | | | | | | 186,570 | | | | 13,789,389 | |
UBS Group AG « | | | | | | | | | | | 1,099,800 | | | | 18,058,716 | |
| | | | |
| | | | | | | | | | | | | | | 31,848,105 | |
| | | | | | | | | | | | | | | | |
| | | | |
| Consumer Finance: 2.31% | | | | | | | | | | | | | | | | |
Synchrony Financial | | | | | | | | | | | 732,100 | | | | 21,186,972 | |
| | | | | | | | | | | | | | | | |
The accompanying notes are an integral part of these financial statements.
| | | | |
| 12 | | Wells Fargo Intrinsic Value Fund | | Portfolio of investments—July 31, 2018 |
| | | | | | | | | | | | | | | | |
| Security name | | | | | | | | Shares | | | Value | |
| | | | |
| Insurance: 7.05% | | | | | | | | | | | | | | | | |
American International Group Incorporated | | | | | | | | | | | 419,500 | | | $ | 23,160,595 | |
Aon plc | | | | | | | | | | | 148,100 | | | | 21,259,755 | |
The Allstate Corporation | | | | | | | | | | | 214,400 | | | | 20,393,728 | |
| | | | |
| | | | | | | | | | | | | | | 64,814,078 | |
| | | | | | | | | | | | | | | | |
| | | | |
Health Care: 12.16% | | | | | | | | | | | | | | | | |
| | | | |
| Biotechnology: 2.15% | | | | | | | | | | | | | | | | |
Gilead Sciences Incorporated | | | | | | | | | | | 254,200 | | | | 19,784,386 | |
| | | | | | | | | | | | | | | | |
| | | | |
| Health Care Equipment & Supplies: 1.75% | | | | | | | | | | | | | | | | |
Abbott Laboratories | | | | | | | | | | | 245,300 | | | | 16,076,962 | |
| | | | | | | | | | | | | | | | |
| | | | |
| Health Care Providers & Services: 2.58% | | | | | | | | | | | | | | | | |
Cigna Corporation | | | | | | | | | | | 131,900 | | | | 23,665,498 | |
| | | | | | | | | | | | | | | | |
| | | | |
| Pharmaceuticals: 5.68% | | | | | | | | | | | | | | | | |
Eli Lilly & Company | | | | | | | | | | | 227,300 | | | | 22,459,513 | |
Merck & Company Incorporated | | | | | | | | | | | 451,800 | | | | 29,760,066 | |
| | | | |
| | | | | | | | | | | | | | | 52,219,579 | |
| | | | | | | | | | | | | | | | |
| | | | |
Industrials: 11.42% | | | | | | | | | | | | | | | | |
| | | | |
| Aerospace & Defense: 2.49% | | | | | | | | | | | | | | | | |
General Dynamics Corporation | | | | | | | | | | | 114,800 | | | | 22,932,448 | |
| | | | | | | | | | | | | | | | |
| | | | |
| Air Freight & Logistics: 1.93% | | | | | | | | | | | | | | | | |
United Parcel Service Incorporated Class B | | | | | | | | | | | 147,600 | | | | 17,695,764 | |
| | | | | | | | | | | | | | | | |
| | | | |
| Electrical Equipment: 1.01% | | | | | | | | | | | | | | | | |
Sensata Technologies Holding plc † | | | | | | | | | | | 170,500 | | | | 9,270,085 | |
| | | | | | | | | | | | | | | | |
| | | | |
| Industrial Conglomerates: 2.88% | | | | | | | | | | | | | | | | |
Honeywell International Incorporated | | | | | | | | | | | 165,700 | | | | 26,454,005 | |
| | | | | | | | | | | | | | | | |
| | | | |
| Trading Companies & Distributors: 3.11% | | | | | | | | | | | | | | | | |
AerCap Holdings NV † | | | | | | | | | | | 509,700 | | | | 28,609,461 | |
| | | | | | | | | | | | | | | | |
| | | | |
Information Technology: 16.99% | | | | | | | | | | | | | | | | |
| | | | |
| Communications Equipment: 6.38% | | | | | | | | | | | | | | | | |
Cisco Systems Incorporated | | | | | | | | | | | 682,600 | | | | 28,867,154 | |
Motorola Solutions Incorporated | | | | | | | | | | | 245,300 | | | | 29,754,890 | |
| | | | |
| | | | | | | | | | | | | | | 58,622,044 | |
| | | | | | | | | | | | | | | | |
| | | | |
| Internet Software & Services: 3.77% | | | | | | | | | | | | | | | | |
Alphabet Incorporated Class C † | | | | | | | | | | | 28,500 | | | | 34,691,910 | |
| | | | | | | | | | | | | | | | |
| | | | |
| IT Services: 2.05% | | | | | | | | | | | | | | | | |
Accenture plc Class A | | | | | | | | | | | 118,300 | | | | 18,848,741 | |
| | | | | | | | | | | | | | | | |
| | | | |
| Software: 3.78% | | | | | | | | | | | | | | | | |
Microsoft Corporation | | | | | | | | | | | 327,300 | | | | 34,719,984 | |
| | | | | | | | | | | | | | | | |
The accompanying notes are an integral part of these financial statements.
| | | | | | |
| Portfolio of investments—July 31, 2018 | | Wells Fargo Intrinsic Value Fund | | | 13 | |
| | | | | | | | | | | | | | | | |
| Security name | | | | | | | | Shares | | | Value | |
| | | | |
| Technology Hardware, Storage & Peripherals: 1.01% | | | | | | | | | | | | | | | | |
Apple Incorporated | | | | | | | | | | | 48,800 | | | $ | 9,286,152 | |
| | | | | | | | | | | | | | | | |
| | | | |
Materials: 2.46% | | | | | | | | | | | | | | | | |
| | | | |
| Construction Materials: 2.46% | | | | | | | | | | | | | | | | |
Vulcan Materials Company | | | | | | | | | | | 201,800 | | | | 22,601,600 | |
| | | | | | | | | | | | | | | | |
| | | | |
Real Estate: 0.93% | | | | | | | | | | | | | | | | |
| | | | |
| Equity REITs: 0.93% | | | | | | | | | | | | | | | | |
Crown Castle International Corporation | | | | | | | | | | | 76,900 | | | | 8,522,827 | |
| | | | | | | | | | | | | | | | |
| | | | |
Telecommunication Services: 2.66% | | | | | | | | | | | | | | | | |
| | | | |
| Diversified Telecommunication Services: 2.66% | | | | | | | | | | | | | | | | |
Verizon Communications Incorporated | | | | | | | | | | | 472,900 | | | | 24,420,556 | |
| | | | | | | | | | | | | | | | |
| | | | |
Utilities: 2.77% | | | | | | | | | | | | | | | | |
| | | | |
| Electric Utilities: 1.90% | | | | | | | | | | | | | | | | |
NextEra Energy Incorporated | | | | | | | | | | | 104,000 | | | | 17,424,160 | |
| | | | | | | | | | | | | | | | |
| | | | |
| Multi-Utilities: 0.87% | | | | | | | | | | | | | | | | |
WEC Energy Group Incorporated | | | | | | | | | | | 121,000 | | | | 8,030,770 | |
| | | | | | | | | | | | | | | | |
| | | | |
Total Common Stocks (Cost $699,920,083) | | | | | | | | | | | | | | | 909,755,004 | |
| | | | | | | | | | | | | | | | |
| | | | |
| | | Yield | | | | | | | | | | |
| Short-Term Investments: 3.49% | | | | | | | | | | | | | | | | |
| | | | |
| Investment Companies: 3.49% | | | | | | | | | | | | | | | | |
Securities Lending Cash Investment LLC (l)(r)(u) | | | 2.10 | % | | | | | | | 22,455,104 | | | | 22,457,350 | |
Wells Fargo Government Money Market Fund Select Class (l)(u) | | | 1.83 | | | | | | | | 9,615,845 | | | | 9,615,845 | |
| | | | |
Total Short-Term Investments (Cost $32,073,195) | | | | | | | | | | | | | | | 32,073,195 | |
| | | | | | | | | | | | | | | | |
| | | | | | | | |
| Total investments in securities (Cost $731,993,278) | | | 102.49 | % | | | 941,828,199 | |
Other assets and liabilities, net | | | (2.49 | ) | | | (22,892,706 | ) |
| | | | | | | | |
| Total net assets | | | 100.00 | % | | $ | 918,935,493 | |
| | | | | | | | |
| « | All or a portion of this security is on loan. |
| † | Non-income-earning security |
| (l) | The issuer of the security is an affiliated person of the Fund as defined in the Investment Company Act of 1940. |
| (r) | The investment is a non-registered investment company purchased with cash collateral received from securities on loan. |
| (u) | The rate represents the 7-day annualized yield at period end. |
Abbreviations:
| ADR | American depositary receipt |
| REIT | Real estate investment trust |
The accompanying notes are an integral part of these financial statements.
| | | | |
| 14 | | Wells Fargo Intrinsic Value Fund | | Portfolio of investments—July 31, 2018 |
Investments in Affiliates
An affiliated investment is an investment in which the Fund owns at least 5% of the outstanding voting shares of the issuer or as a result of other relationships, such as the Fund and the issuer having the same investment manager. Transactions with issuers that were either affiliated persons of the Fund at the beginning of the period or the end of the period were as follows:
| | | | | | | | | | | | | | | | | | | | | | | | | | | | | | | | | | | | |
| | | Shares, beginning of period | | | Shares purchased | | | Shares sold | | | Shares, end of period | | | Net realized gains (losses) | | | Net change in unrealized gains (losses) | | | Income from affiliated securities | | | Value, end of period | | | % of net assets | |
Short-Term Investments | | | | | | | | | | | | | | | | | | | | | | | | | | | | | | | | | | | | |
Investment Companies | | | | | | | | | | | | | | | | | | | | | | | | | | | | | | | | | | | | |
Securities Lending Cash Investment LLC | | | 17,030,618 | | | | 488,604,100 | | | | 483,179,614 | | | | 22,455,104 | | | $ | 28 | | | $ | (29 | ) | | $ | 103,879 | | | $ | 22,457,350 | | | | | |
Wells Fargo Government Money Market Fund Select Class | | | 9,318,825 | | | | 172,733,555 | | | | 172,436,535 | | | | 9,615,845 | | | | 0 | | | | 0 | | | | 111,378 | | | | 9,615,845 | | | | | |
| | | | | | | | | | | | | | | | | | | | | | | | | | | | | | | | | | | | |
| | | | | | | | | | | | | | | | | | $ | 28 | | | $ | (29 | ) | | $ | 215,257 | | | $ | 32,073,195 | | | | 3.49 | % |
| | | | | | | | | | | | | | | | | | | | | | | | | | | | | | | | | | | | |
The accompanying notes are an integral part of these financial statements.
| | | | | | |
| Statement of assets and liabilities—July 31, 2018 | | Wells Fargo Intrinsic Value Fund | | | 15 | |
| | | | |
| | | | |
| |
Assets | | | | |
Investments in unaffiliated securities (including $22,066,028 of securities on loan), at value (cost $699,920,083) | | $ | 909,755,004 | |
Investments in affiliated securities, at value (cost $32,073,195) | | | 32,073,195 | |
Receivable for Fund shares sold | | | 30,448 | |
Receivable for dividends | | | 648,942 | |
Receivable for securities lending income | | | 12,622 | |
Prepaid expenses and other assets | | | 11,654 | |
| | | | |
Total assets | | | 942,531,865 | |
| | | | |
| |
Liabilities | | | | |
Payable upon receipt of securities loaned | | | 22,456,028 | |
Management fee payable | | | 434,078 | |
Payable for Fund shares redeemed | | | 299,766 | |
Administration fees payable | | | 120,826 | |
Distribution fees payable | | | 12,559 | |
Trustees’ fees and expenses payable | | | 1,665 | |
Accrued expenses and other liabilities | | | 271,450 | |
| | | | |
Total liabilities | | | 23,596,372 | |
| | | | |
Total net assets | | $ | 918,935,493 | |
| | | | |
| |
NET ASSETS CONSIST OF | | | | |
Paid-in capital | | $ | 655,404,744 | |
Undistributed net investment income | | | 7,412,219 | |
Accumulated net realized gains on investments | | | 46,283,609 | |
Net unrealized gains on investments | | | 209,834,921 | |
| | | | |
Total net assets | | $ | 918,935,493 | |
| | | | |
| |
COMPUTATION OF NET ASSET VALUE AND OFFERING PRICE PER SHARE | | | | |
Net assets – Class A | | $ | 289,682,511 | |
Shares outstanding – Class A1 | | | 22,192,463 | |
Net asset value per share – Class A | | | $13.05 | |
Maximum offering price per share – Class A2 | | | $13.85 | |
Net assets – Class C | | $ | 19,873,987 | |
Shares outstanding – Class C1 | | | 1,565,970 | |
Net asset value per share – Class C | | | $12.69 | |
Net assets – Class R | | $ | 74,172 | |
Shares outstanding – Class R1 | | | 5,642 | |
Net asset value per share – Class R | | | $13.15 | |
Net assets – Class R6 | | $ | 2,577,870 | |
Shares outstanding – Class R61 | | | 199,528 | |
Net asset value per share – Class R6 | | | $12.92 | |
Net assets – Administrator Class | | $ | 469,463,856 | |
Shares outstanding – Administrator Class1 | | | 34,307,257 | |
Net asset value per share – Administrator Class | | | $13.68 | |
Net assets – Institutional Class | | $ | 137,263,097 | |
Shares outstanding – Institutional Class1 | | | 10,446,225 | |
Net asset value per share – Institutional Class | | | $13.14 | |
| 1 | The Fund has an unlimited number of authorized shares. |
| 2 | Maximum offering price is computed as 100/94.25 of net asset value. On investments of $50,000 or more, the offering price is reduced. |
The accompanying notes are an integral part of these financial statements.
| | | | |
| 16 | | Wells Fargo Intrinsic Value Fund | | Statement of operations—year ended July 31, 2018 |
| | | | |
| | | | |
| |
Investment income | | | | |
Dividends (net of foreign withholding taxes of $189,913) | | $ | 17,507,321 | |
Income from affiliated securities | | | 215,257 | |
| | | | |
Total investment income | | | 17,722,578 | |
| | | | |
| |
Expenses | | | | |
Management fee | | | 6,310,202 | |
Administration fees | | | | |
Class A | | | 606,915 | |
Class C | | | 43,838 | |
Class R | | | 115 | |
Class R4 | | | 4 | 1 |
Class R6 | | | 738 | |
Administrator Class | | | 597,357 | |
Institutional Class | | | 187,743 | |
Shareholder servicing fees | | | | |
Class A | | | 698,297 | |
Class C | | | 52,189 | |
Class R | | | 137 | |
Class R4 | | | 5 | 1 |
Administrator Class | | | 1,147,785 | |
Distribution fees | | | | |
Class C | | | 156,565 | |
Class R | | | 137 | |
Custody and accounting fees | | | 35,153 | |
Professional fees | | | 44,778 | |
Registration fees | | | 100,028 | |
Shareholder report expenses | | | 94,682 | |
Trustees’ fees and expenses | | | 24,559 | |
Other fees and expenses | | | 25,935 | |
| | | | |
Total expenses | | | 10,127,162 | |
Less: Fee waivers and/or expense reimbursements | | | (1,166,796 | ) |
| | | | |
Net expenses | | | 8,960,366 | |
| | | | |
Net investment income | | | 8,762,212 | |
| | | | |
| |
REALIZED AND UNREALIZED GAINS (LOSSES) ON INVESTMENTS | | | | |
| |
Net realized gains on: | | | | |
Unaffiliated securities | | | 72,505,890 | |
Affiliated securities | | | 28 | |
| | | | |
Net realized gains on investments | | | 72,505,918 | |
| | | | |
| |
Net change in unrealized gains (losses) on: | | | | |
Unaffiliated securities | | | 27,765,483 | |
Affiliated securities | | | (29 | ) |
| | | | |
Net change in unrealized gains (losses) on investments | | | 27,765,454 | |
| | | | |
Net realized and unrealized gains (losses) on investments | | | 100,271,372 | |
| | | | |
Net increase in net assets resulting from operations | | $ | 109,033,584 | |
| | | | |
| 1 | For the period from August 1, 2017 to November 13, 2017. Effective at the close of business on November 13, 2017, Class R4 shares were liquidated and the class was subsequently closed. Class R4 shares are no longer offered by the Fund. |
The accompanying notes are an integral part of these financial statements.
| | | | | | |
| Statement of changes in net assets | | Wells Fargo Intrinsic Value Fund | | | 17 | |
| | | | | | | | | | | | | | | | |
| | | Year ended
July 31, 2018 | | | Year ended
July 31, 2017 | |
| | | | |
Operations | | | | | | | | | | | | | | | | |
Net investment income | | | | | | $ | 8,762,212 | | | | | | | $ | 10,341,304 | |
Net realized gains on investments | | | | | | | 72,505,918 | | | | | | | | 70,124,352 | |
Net change in unrealized gains (losses) on investments | | | | | | | 27,765,454 | | | | | | | | 41,233,576 | |
| | | | |
Net increase in net assets resulting from operations | | | | | | | 109,033,584 | | | | | | | | 121,699,232 | |
| | | | |
| | | | |
Distributions to shareholders from | | | | | | | | | | | | | | | | |
Net investment income | | | | | | | | | | | | | | | | |
Class A | | | | | | | (1,516,748 | ) | | | | | | | (3,621,237 | ) |
Class C | | | | | | | 0 | | | | | | | | (86,648 | ) |
Class R | | | | | | | (163 | ) | | | | | | | (354 | ) |
Class R4 | | | | | | | 0 | 1 | | | | | | | (231 | ) |
Class R6 | | | | | | | (23,745 | ) | | | | | | | (49,302 | ) |
Administrator Class | | | | | | | (3,138,315 | ) | | | | | | | (6,085,411 | ) |
Institutional Class | | | | | | | (1,366,652 | ) | | | | | | | (2,733,344 | ) |
Net realized gains | | | | | | | | | | | | | | | | |
Class A | | | | | | | (22,059,131 | ) | | | | | | | (19,813,428 | ) |
Class B | | | | | | | N/A | | | | | | | | (17,948 | )2 |
Class C | | | | | | | (1,660,929 | ) | | | | | | | (1,747,106 | ) |
Class R | | | | | | | (3,846 | ) | | | | | | | (2,423 | ) |
Class R4 | | | | | | | 0 | 1 | | | | | | | (1,001 | ) |
Class R6 | | | | | | | (185,128 | ) | | | | | | | (195,458 | ) |
Administrator Class | | | | | | | (33,610,953 | ) | | | | | | | (28,268,900 | ) |
Institutional Class | | | | | | | (11,360,927 | ) | | | | | | | (11,235,310 | ) |
| | | | |
Total distributions to shareholders | | | | | | | (74,926,537 | ) | | | | | | | (73,858,101 | ) |
| | | | |
| | | | |
Capital share transactions | | | Shares | | | | | | | | Shares | | | | | |
Proceeds from shares sold | | | | | | | | | | | | | | | | |
Class A | | | 331,519 | | | | 4,190,768 | | | | 305,954 | | | | 3,691,813 | |
Class B | | | N/A | | | | N/A | | | | 1 | 2 | | | 13 | 2 |
Class C | | | 19,728 | | | | 240,572 | | | | 51,575 | | | | 603,442 | |
Class R | | | 1,671 | | | | 20,842 | | | | 719 | | | | 8,721 | |
Class R6 | | | 12,234 | | | | 151,356 | | | | 11,205 | | | | 133,634 | |
Administrator Class | | | 128,470 | | | | 1,686,875 | | | | 221,167 | | | | 2,768,721 | |
Institutional Class | | | 594,996 | | | | 7,543,156 | | | | 2,650,238 | | | | 32,333,431 | |
| | | | |
| | | | | | | 13,833,569 | | | | | | | | 39,539,775 | |
| | | | |
Reinvestment of distributions | | | | | | | | | | | | | | | | |
Class A | | | 1,816,483 | | | | 22,389,992 | | | | 1,877,183 | | | | 22,194,613 | |
Class B | | | N/A | | | | N/A | | | | 1,535 | 2 | | | 17,865 | 2 |
Class C | | | 131,832 | | | | 1,579,351 | | | | 138,250 | | | | 1,593,565 | |
Class R | | | 220 | | | | 2,728 | | | | 233 | | | | 2,777 | |
Class R4 | | | 0 | 1 | | | 0 | 1 | | | 104 | | | | 1,232 | |
Class R6 | | | 16,488 | | | | 201,277 | | | | 20,897 | | | | 244,760 | |
Administrator Class | | | 2,684,570 | | | | 34,693,107 | | | | 2,623,161 | | | | 32,407,128 | |
Institutional Class | | | 901,012 | | | | 11,188,786 | | | | 949,096 | | | | 11,290,466 | |
| | | | |
| | | | | | | 70,055,241 | | | | | | | | 67,752,406 | |
| | | | |
Payment for shares redeemed | | | | | | | | | | | | | | | | |
Class A | | | (3,243,108 | ) | | | (40,904,939 | ) | | | (5,420,473 | ) | | | (65,302,884 | ) |
Class B | | | N/A | | | | N/A | | | | (47,468 | )2 | | | (566,965 | )2 |
Class C | | | (349,959 | ) | | | (4,293,957 | ) | | | (875,054 | ) | | | (10,310,692 | ) |
Class R | | | (33 | ) | | | (423 | ) | | | (698 | ) | | | (8,357 | ) |
Class R4 | | | (1,342 | )1 | | | (17,226 | )1 | | | 0 | | | | 0 | |
Class R6 | | | (21,179 | ) | | | (269,458 | ) | | | (78,948 | ) | | | (936,987 | ) |
Administrator Class | | | (3,402,317 | ) | | | (44,953,219 | ) | | | (5,523,798 | ) | | | (69,697,862 | ) |
Institutional Class | | | (3,859,490 | ) | | | (48,539,311 | ) | | | (8,606,311 | ) | | | (104,462,351 | ) |
| | | | |
| | | | | | | (138,978,533 | ) | | | | | | | (251,286,098 | ) |
| | | | |
Net decrease in net assets resulting from capital share transactions | | | | | | | (55,089,723 | ) | | | | | | | (143,993,917 | ) |
| | | | |
Total decrease in net assets | | | | | | | (20,982,676 | ) | | | | | | | (96,152,786 | ) |
| | | | |
| | | | |
Net assets | | | | | | | | | | | | | | | | |
Beginning of period | | | | | | | 939,918,169 | | | | | | | | 1,036,070,955 | |
| | | | |
End of period | | | | | | $ | 918,935,493 | | | | | | | $ | 939,918,169 | |
| | | | |
Undistributed net investment income | | | | | | $ | 7,412,219 | | | | | | | $ | 4,695,630 | |
| | | | |
| 1 | For the period from August 1, 2017 to November 13, 2017. Effective at the close of business on November 13, 2017, Class R4 shares were liquidated and the class was subsequently closed. Class R4 shares are no longer offered by the Fund. |
| 2 | For the period from August 1, 2016 to May 5, 2017. Effective at the close of business on May 5, 2017, Class B shares were converted to Class A shares and are no longer offered by the Fund. |
The accompanying notes are an integral part of these financial statements.
| | | | |
| 18 | | Wells Fargo Intrinsic Value Fund | | Financial highlights |
(For a share outstanding throughout each period)
| | | | | | | | | | | | | | | | | | | | |
| | | Year ended July 31 | |
| CLASS A | | 2018 | | | 2017 | | | 2016 | | | 2015 | | | 2014 | |
Net asset value, beginning of period | | | $12.61 | | | | $12.01 | | | | $13.73 | | | | $13.60 | | | | $12.52 | |
Net investment income | | | 0.11 | | | | 0.12 | 1 | | | 0.13 | | | | 0.10 | | | | 0.07 | |
Net realized and unrealized gains (losses) on investments | | | 1.39 | | | | 1.43 | | | | (0.42 | ) | | | 1.09 | | | | 1.53 | |
| | | | | | | | | | | | | | | | | | | | |
Total from investment operations | | | 1.50 | | | | 1.55 | | | | (0.29 | ) | | | 1.19 | | | | 1.60 | |
Distributions to shareholders from | | | | | | | | | | | | | | | | | | | | |
Net investment income | | | (0.06 | ) | | | (0.14 | ) | | | (0.11 | ) | | | (0.07 | ) | | | (0.06 | ) |
Net realized gains | | | (1.00 | ) | | | (0.81 | ) | | | (1.32 | ) | | | (0.99 | ) | | | (0.46 | ) |
| | | | | | | | | | | | | | | | | | | | |
Total distributions to shareholders | | | (1.06 | ) | | | (0.95 | ) | | | (1.43 | ) | | | (1.06 | ) | | | (1.52 | ) |
Net asset value, end of period | | | $13.05 | | | | $12.61 | | | | $12.01 | | | | $13.73 | | | | $13.60 | |
Total return2 | | | 12.43 | % | | | 13.50 | % | | | (1.73 | )% | | | 9.19 | % | | | 13.09 | % |
Ratios to average net assets (annualized) | | | | | | | | | | | | | | | | | | | | |
Gross expenses | | | 1.18 | % | | | 1.17 | % | | | 1.17 | % | | | 1.20 | % | | | 1.21 | % |
Net expenses | | | 1.10 | % | | | 1.10 | % | | | 1.10 | % | | | 1.16 | % | | | 1.16 | % |
Net investment income | | | 0.83 | % | | | 0.95 | % | | | 1.12 | % | | | 0.75 | % | | | 0.53 | % |
Supplemental data | | | | | | | | | | | | | | | | | | | | |
Portfolio turnover rate | | | 21 | % | | | 27 | % | | | 34 | % | | | 29 | % | | | 23 | % |
Net assets, end of period (000s omitted) | | | $289,683 | | | | $293,599 | | | | $318,543 | | | | $372,443 | | | | $391,028 | |
| 1 | Calculated based upon average shares outstanding |
| 2 | Total return calculations do not include any sales charges. |
The accompanying notes are an integral part of these financial statements.
| | | | | | |
| Financial highlights | | Wells Fargo Intrinsic Value Fund | | | 19 | |
(For a share outstanding throughout each period)
| | | | | | | | | | | | | | | | | | | | |
| | | Year ended July 31 | |
| CLASS C | | 2018 | | | 2017 | | | 2016 | | | 2015 | | | 2014 | |
Net asset value, beginning of period | | | $12.31 | | | | $11.74 | | | | $13.45 | | | | $13.36 | | | | $12.35 | |
Net investment income (loss) | | | 0.01 | 1 | | | 0.02 | 1 | | | 0.03 | | | | 0.00 | 2 | | | (0.03 | ) |
Net realized and unrealized gains (losses) on investments | | | 1.37 | | | | 1.40 | | | | (0.41 | ) | | | 1.08 | | | | 1.50 | |
| | | | | | | | | | | | | | | | | | | | |
Total from investment operations | | | 1.38 | | | | 1.42 | | | | (0.38 | ) | | | 1.08 | | | | 1.47 | |
Distributions to shareholders from | | | | | | | | | | | | | | | | | | | | |
Net investment income | | | 0.00 | | | | (0.04 | ) | | | (0.01 | ) | | | 0.00 | | | | 0.00 | |
Net realized gains | | | (1.00 | ) | | | (0.81 | ) | | | (1.32 | ) | | | (0.99 | ) | | | (0.46 | ) |
| | | | | | | | | | | | | | | | | | | | |
Total distributions to shareholders | | | (1.00 | ) | | | (0.85 | ) | | | (1.33 | ) | | | (0.99 | ) | | | (0.46 | ) |
Net asset value, end of period | | | $12.69 | | | | $12.31 | | | | $11.74 | | | | $13.45 | | | | $13.36 | |
Total return3 | | | 11.65 | % | | | 12.58 | % | | | (2.47 | )% | | | 8.42 | % | | | 12.24 | % |
Ratios to average net assets (annualized) | | | | | | | | | | | | | | | | | | | | |
Gross expenses | | | 1.93 | % | | | 1.93 | % | | | 1.93 | % | | | 1.96 | % | | | 1.97 | % |
Net expenses | | | 1.86 | % | | | 1.86 | % | | | 1.86 | % | | | 1.91 | % | | | 1.91 | % |
Net investment income (loss) | | | 0.08 | % | | | 0.20 | % | | | 0.37 | % | | | 0.00 | % | | | (0.22 | )% |
Supplemental data | | | | | | | | | | | | | | | | | | | | |
Portfolio turnover rate | | | 21 | % | | | 27 | % | | | 34 | % | | | 29 | % | | | 23 | % |
Net assets, end of period (000s omitted) | | | $19,874 | | | | $21,727 | | | | $28,756 | | | | $36,098 | | | | $36,654 | |
| 1 | Calculated based upon average shares outstanding |
| 2 | Amount is less than $0.005. |
| 3 | Total return calculations do not include any sales charges. |
The accompanying notes are an integral part of these financial statements.
| | | | |
| 20 | | Wells Fargo Intrinsic Value Fund | | Financial highlights |
(For a share outstanding throughout each period)
| | | | | | | | | | | | | | | | | | | | |
| | | Year ended July 31 | |
| CLASS R | | 2018 | | | 2017 | | | 2016 | | | 2015 | | | 2014 | |
Net asset value, beginning of period | | | $12.70 | | | | $12.09 | | | | $13.81 | | | | $13.66 | | | | $12.55 | |
Net investment income | | | 0.05 | | | | 0.08 | 1 | | | 0.10 | | | | 0.05 | | | | 0.03 | |
Net realized and unrealized gains (losses) on investments | | | 1.44 | | | | 1.45 | | | | (0.43 | ) | | | 1.12 | | | | 1.54 | |
| | | | | | | | | | | | | | | | | | | | |
Total from investment operations | | | 1.49 | | | | 1.53 | | | | (0.33 | ) | | | 1.17 | | | | 1.57 | |
Distributions to shareholders from | | | | | | | | | | | | | | | | | | | | |
Net investment income | | | (0.04 | ) | | | (0.11 | ) | | | (0.07 | ) | | | (0.03 | ) | | | 0.00 | |
Net realized gains | | | (1.00 | ) | | | (0.81 | ) | | | (1.32 | ) | | | (0.99 | ) | | | (0.46 | ) |
| | | | | | | | | | | | | | | | | | | | |
Total distributions to shareholders | | | (1.04 | ) | | | (0.92 | ) | | | (1.39 | ) | | | (1.02 | ) | | | (0.46 | ) |
Net asset value, end of period | | | $13.15 | | | | $12.70 | | | | $12.09 | | | | $13.81 | | | | $13.66 | |
Total return | | | 12.21 | % | | | 13.22 | % | | | (1.99 | )% | | | 8.96 | % | | | 12.77 | % |
Ratios to average net assets (annualized) | | | | | | | | | | | | | | | | | | | | |
Gross expenses | | | 1.44 | % | | | 1.44 | % | | | 1.44 | % | | | 1.47 | % | | | 1.49 | % |
Net expenses | | | 1.36 | % | | | 1.36 | % | | | 1.36 | % | | | 1.40 | % | | | 1.41 | % |
Net investment income | | | 0.56 | % | | | 0.69 | % | | | 0.86 | % | | | 0.50 | % | | | 0.26 | % |
Supplemental data | | | | | | | | | | | | | | | | | | | | |
Portfolio turnover rate | | | 21 | % | | | 27 | % | | | 34 | % | | | 29 | % | | | 23 | % |
Net assets, end of period (000s omitted) | | | $74 | | | | $48 | | | | $43 | | | | $41 | | | | $28 | |
| 1 | Calculated based upon average shares outstanding |
The accompanying notes are an integral part of these financial statements.
| | | | | | |
| Financial highlights | | Wells Fargo Intrinsic Value Fund | | | 21 | |
(For a share outstanding throughout each period)
| | | | | | | | | | | | | | | | | | | | |
| | | Year ended July 31 | |
| CLASS R6 | | 2018 | | | 2017 | | | 2016 | | | 2015 | | | 2014 | |
Net asset value, beginning of period | | | $12.49 | | | | $11.90 | | | | $13.62 | | | | $13.60 | | | | $12.56 | |
Net investment income | | | 0.16 | | | | 0.17 | 1 | | | 0.17 | | | | 0.17 | 1 | | | 0.14 | 1 |
Net realized and unrealized gains (losses) on investments | | | 1.39 | | | | 1.42 | | | | (0.40 | ) | | | 1.08 | | | | 1.47 | |
| | | | | | | | | | | | | | | | | | | | |
Total from investment operations | | | 1.55 | | | | 1.59 | | | | (0.23 | ) | | | 1.25 | | | | 1.61 | |
Distributions to shareholders from | | | | | | | | | | | | | | | | | | | | |
Net investment income | | | (0.12 | ) | | | (0.19 | ) | | | (0.17 | ) | | | (0.24 | ) | | | (0.11 | ) |
Net realized gains | | | (1.00 | ) | | | (0.81 | ) | | | (1.32 | ) | | | (0.99 | ) | | | (0.46 | ) |
| | | | | | | | | | | | | | | | | | | | |
Total distributions to shareholders | | | (1.12 | ) | | | (1.00 | ) | | | (1.49 | ) | | | (1.23 | ) | | | (0.57 | ) |
Net asset value, end of period | | | $12.92 | | | | $12.49 | | | | $11.90 | | | | $13.62 | | | | $13.60 | |
Total return | | | 12.96 | % | | | 14.03 | % | | | (1.30 | )% | | | 9.74 | % | | | 13.19 | % |
Ratios to average net assets (annualized) | | | | | | | | | | | | | | | | | | | | |
Gross expenses | | | 0.75 | % | | | 0.75 | % | | | 0.75 | % | | | 0.74 | % | | | 0.74 | % |
Net expenses | | | 0.65 | % | | | 0.65 | % | | | 0.65 | % | | | 0.65 | % | | | 0.65 | % |
Net investment income | | | 1.29 | % | | | 1.40 | % | | | 1.47 | % | | | 1.25 | % | | | 1.10 | % |
Supplemental data | | | | | | | | | | | | | | | | | | | | |
Portfolio turnover rate | | | 21 | % | | | 27 | % | | | 34 | % | | | 29 | % | | | 23 | % |
Net assets, end of period (000s omitted) | | | $2,578 | | | | $2,397 | | | | $2,842 | | | | $169 | | | | $150 | |
| 1 | Calculated based upon average shares outstanding |
The accompanying notes are an integral part of these financial statements.
| | | | |
| 22 | | Wells Fargo Intrinsic Value Fund | | Financial highlights |
(For a share outstanding throughout each period)
| | | | | | | | | | | | | | | | | | | | |
| | | Year ended July 31 | |
| ADMINISTRATOR CLASS | | 2018 | | | 2017 | | | 2016 | | | 2015 | | | 2014 | |
Net asset value, beginning of period | | | $13.17 | | | | $12.51 | | | | $14.25 | | | | $14.08 | | | | $12.95 | |
Net investment income | | | 0.13 | | | | 0.14 | 1 | | | 0.15 | | | | 0.13 | | | | 0.10 | |
Net realized and unrealized gains (losses) on investments | | | 1.47 | | | | 1.49 | | | | (0.43 | ) | | | 1.14 | | | | 1.58 | |
| | | | | | | | | | | | | | | | | | | | |
Total from investment operations | | | 1.60 | | | | 1.63 | | | | (0.28 | ) | | | 1.27 | | | | 1.68 | |
Distributions to shareholders from | | | | | | | | | | | | | | | | | | | | |
Net investment income | | | (0.09 | ) | | | (0.16 | ) | | | (0.14 | ) | | | (0.11 | ) | | | (0.09 | ) |
Net realized gains | | | (1.00 | ) | | | (0.81 | ) | | | (1.32 | ) | | | (0.99 | ) | | | (0.46 | ) |
| | | | | | | | | | | | | | | | | | | | |
Total distributions to shareholders | | | (1.09 | ) | | | (0.97 | ) | | | (1.46 | ) | | | (1.10 | ) | | | (0.55 | ) |
Net asset value, end of period | | | $13.68 | | | | $13.17 | | | | $12.51 | | | | $14.25 | | | | $14.08 | |
Total return | | | 12.63 | % | | | 13.66 | % | | | (1.58 | )% | | | 9.42 | % | | | 13.36 | % |
Ratios to average net assets (annualized) | | | | | | | | | | | | | | | | | | | | |
Gross expenses | | | 1.10 | % | | | 1.10 | % | | | 1.10 | % | | | 1.06 | % | | | 1.06 | % |
Net expenses | | | 0.95 | % | | | 0.95 | % | | | 0.95 | % | | | 0.95 | % | | | 0.95 | % |
Net investment income | | | 0.98 | % | | | 1.10 | % | | | 1.27 | % | | | 0.95 | % | | | 0.74 | % |
Supplemental data | | | | | | | | | | | | | | | | | | | | |
Portfolio turnover rate | | | 21 | % | | | 27 | % | | | 34 | % | | | 29 | % | | | 23 | % |
Net assets, end of period (000s omitted) | | | $469,464 | | | | $459,650 | | | | $470,152 | | | | $529,293 | | | | $534,641 | |
| 1 | Calculated based upon average shares outstanding |
The accompanying notes are an integral part of these financial statements.
| | | | | | |
| Financial highlights | | Wells Fargo Intrinsic Value Fund | | | 23 | |
(For a share outstanding throughout each period)
| | | | | | | | | | | | | | | | | | | | |
| | | Year ended July 31 | |
| INSTITUTIONAL CLASS | | 2018 | | | 2017 | | | 2016 | | | 2015 | | | 2014 | |
Net asset value, beginning of period | | | $12.68 | | | | $12.08 | | | | $13.80 | | | | $13.67 | | | | $12.58 | |
Net investment income | | | 0.22 | | | | 0.17 | 1 | | | 0.18 | | | | 0.15 | | | | 0.13 | |
Net realized and unrealized gains (losses) on investments | | | 1.35 | | | | 1.43 | | | | (0.41 | ) | | | 1.11 | | | | 1.53 | |
| | | | | | | | | | | | | | | | | | | | |
Total from investment operations | | | 1.57 | | | | 1.60 | | | | (0.23 | ) | | | 1.26 | | | | 1.66 | |
Distributions to shareholders from | | | | | | | | | | | | | | | | | | | | |
Net investment income | | | (0.11 | ) | | | (0.19 | ) | | | (0.17 | ) | | | (0.14 | ) | | | (0.11 | ) |
Net realized gains | | | (1.00 | ) | | | (0.81 | ) | | | (1.32 | ) | | | (0.99 | ) | | | (0.46 | ) |
| | | | | | | | | | | | | | | | | | | | |
Total distributions to shareholders | | | (1.11 | ) | | | (1.00 | ) | | | (1.49 | ) | | | (1.13 | ) | | | (0.57 | ) |
Net asset value, end of period | | | $13.14 | | | | $12.68 | | | | $12.08 | | | | $13.80 | | | | $13.67 | |
Total return | | | 12.96 | % | | | 13.88 | % | | | (1.27 | )% | | | 9.66 | % | | | 13.64 | % |
Ratios to average net assets (annualized) | | | | | | | | | | | | | | | | | | | | |
Gross expenses | | | 0.85 | % | | | 0.85 | % | | | 0.85 | % | | | 0.79 | % | | | 0.79 | % |
Net expenses | | | 0.70 | % | | | 0.70 | % | | | 0.70 | % | | | 0.70 | % | | | 0.70 | % |
Net investment income | | | 1.24 | % | | | 1.36 | % | | | 1.52 | % | | | 1.20 | % | | | 0.99 | % |
Supplemental data | | | | | | | | | | | | | | | | | | | | |
Portfolio turnover rate | | | 21 | % | | | 27 | % | | | 34 | % | | | 29 | % | | | 23 | % |
Net assets, end of period (000s omitted) | | | $137,263 | | | | $162,480 | | | | $215,175 | | | | $255,565 | | | | $244,378 | |
| 1 | Calculated based upon average shares outstanding |
The accompanying notes are an integral part of these financial statements.
| | | | |
| 24 | | Wells Fargo Intrinsic Value Fund | | Notes to financial statements |
1. ORGANIZATION
Wells Fargo Funds Trust (the “Trust”), a Delaware statutory trust organized on March 10, 1999, is an open-end management investment company registered under the Investment Company Act of 1940, as amended (the “1940 Act”). As an investment company, the Trust follows the accounting and reporting guidance in Financial Accounting Standards Board Accounting Standards Codification Topic 946, Financial Services – Investment Companies. These financial statements report on the Wells Fargo Intrinsic Value Fund (the “Fund”) which is a diversified series of the Trust.
Effective at the close of business on November 13, 2017, Class R4 shares were liquidated and the class was subsequently closed. Class R4 shares are no longer offered by the Fund. Information for Class R4 shares reflected in the financial statements represents activity through November 13, 2017.
Effective at the close of business on May 5, 2017, Class B shares were converted to Class A shares and are no longer offered by the Fund. Information for Class B shares reflected in the financial statements represents activity through May 5, 2017.
2. SIGNIFICANT ACCOUNTING POLICIES
The following significant accounting policies, which are consistently followed in the preparation of the financial statements of the Fund, are in conformity with U.S. generally accepted accounting principles which require management to make estimates and assumptions that affect the reported amounts of assets and liabilities, disclosure of contingent assets and liabilities at the date of the financial statements, and the reported amounts of revenues and expenses during the reporting period. Actual results could differ from those estimates.
Securities valuation
All investments are valued each business day as of the close of regular trading on the New York Stock Exchange (generally 4 p.m. Eastern Time), although the Fund may deviate from this calculation time under unusual or unexpected circumstances.
Equity securities that are listed on a foreign or domestic exchange or market are valued at the official closing price or, if none, the last sales price. If no sale occurs on the principal exchange or market that day, a fair value price will be determined in accordance with the Fund’s Valuation Procedures.
Investments in registered open-end investment companies are valued at net asset value. Interests in non-registered investment companies that are redeemable at net asset value are fair valued normally at net asset value.
Investments which are not valued using any of the methods discussed above are valued at their fair value, as determined in good faith by the Board of Trustees of the Fund. The Board of Trustees has established a Valuation Committee comprised of the Trustees and has delegated to it the authority to take any actions regarding the valuation of portfolio securities that the Valuation Committee deems necessary or appropriate, including determining the fair value of portfolio securities, unless the determination has been delegated to the Wells Fargo Asset Management Pricing Committee at Wells Fargo Funds Management, LLC (“Funds Management”). The Board of Trustees retains the authority to make or ratify any valuation decisions or approve any changes to the Valuation Procedures as it deems appropriate. On a quarterly basis, the Board of Trustees receives reports on any valuation actions taken by the Valuation Committee or the Wells Fargo Asset Management Pricing Committee which may include items for ratification.
Valuations of fair valued securities are compared to the next actual sales price when available, or other appropriate market values, to assess the continued appropriateness of the fair valuation methodologies used. These securities are fair valued on a day-to-day basis, taking into consideration changes to appropriate market information and any significant changes to the inputs considered in the valuation process until there is a readily available price provided on an exchange or by an independent pricing service. Valuations received from an independent pricing service or independent broker-dealer quotes are periodically validated by comparisons to most recent trades and valuations provided by other independent pricing services in addition to the review of prices by the manager and/or subadviser. Unobservable inputs used in determining fair valuations are identified based on the type of security, taking into consideration factors utilized by market participants in valuing the investment, knowledge about the issuer and the current market environment.
Securities lending
The Fund may lend its securities from time to time in order to earn additional income in the form of fees or interest on securities received as collateral or the investment of any cash received as collateral. The Fund continues to receive interest or dividends on the securities loaned. The Fund receives collateral in the form of cash or securities with a value at least equal to the value of the securities on loan. The value of the loaned securities is determined at the close of each business day and any additional required collateral is delivered to the Fund on the next business day. In a securities
| | | | | | |
| Notes to financial statements | | Wells Fargo Intrinsic Value Fund | | | 25 | |
lending transaction, the net asset value of the Fund will be affected by an increase or decrease in the value of the securities loaned and by an increase or decrease in the value of the instrument in which collateral is invested. The amount of securities lending activity undertaken by the Fund fluctuates from time to time. In the event of default or bankruptcy by the borrower, the Fund may be prevented from recovering the loaned securities or gaining access to the collateral or may experience delays or costs in doing so. In addition, the investment of any cash collateral received may lose all or part of its value. The Fund has the right under the lending agreement to recover the securities from the borrower on demand.
The Fund lends its securities through an unaffiliated securities lending agent. Cash collateral received in connection with its securities lending transactions is invested in Securities Lending Cash Investments, LLC (the “Securities Lending Fund”). The Securities Lending Fund is exempt from registration under Section 3(c)(7) of the 1940 Act and is managed by Funds Management and is subadvised by Wells Capital Management Incorporated (“WellsCap”), an affiliate of Funds Management and an indirect wholly owned subsidiary of Wells Fargo & Company (“Wells Fargo”). Funds Management receives an advisory fee starting at 0.05% and declining to 0.01% as the average daily net assets of the Securities Lending Fund increase. All of the fees received by Funds Management are paid to WellsCap for its services as subadviser. The Securities Lending Fund seeks to provide a positive return compared to the daily Fed Funds Open Rate by investing in high-quality, U.S. dollar-denominated short-term money market instruments. Securities Lending Fund investments are valued at the evaluated bid price provided by an independent pricing service. Income earned from investment in the Securities Lending Fund, if any, is included in income from affiliated securities on the Statement of Operations.
Security transactions and income recognition
Securities transactions are recorded on a trade date basis. Realized gains or losses are recorded on the basis of identified cost.
Dividend income is recognized on the ex-dividend date. Dividend income is recorded net of foreign taxes withheld where recovery of such taxes is not assured.
Distributions to shareholders
Distributions to shareholders from net investment income and any net realized gains are recorded on the ex-dividend date and paid at least annually. Such distributions are determined in accordance with income tax regulations and may differ from U.S. generally accepted accounting principles. Dividend sources are estimated at the time of declaration. The tax character of distributions is determined as of the Fund’s fiscal year end. Therefore, a portion of the Fund’s distributions made prior to the Fund’s fiscal year end may be categorized as a tax return of capital at year end.
Federal and other taxes
The Fund intends to continue to qualify as a regulated investment company by distributing substantially all of its investment company taxable income and any net realized capital gains (after reduction for capital loss carryforwards) sufficient to relieve it from all, or substantially all, federal income taxes. Accordingly, no provision for federal income taxes was required.
The Fund’s income and federal excise tax returns and all financial records supporting those returns for the prior three fiscal years are subject to examination by the federal and Delaware revenue authorities. Management has analyzed the Fund’s tax positions taken on federal, state, and foreign tax returns for all open tax years and does not believe that there are any uncertain tax positions that require recognition of a tax liability.
As of July 31, 2018, the aggregate cost of all investments for federal income tax purposes was $733,054,463 and the unrealized gains (losses) consisted of:
| | | | |
Gross unrealized gains | | $ | 219,426,060 | |
Gross unrealized losses | | | (10,652,324 | ) |
Net unrealized gains | | $ | 208,773,736 | |
Class allocations
The separate classes of shares offered by the Fund differ principally in applicable sales charges, distribution, shareholder servicing, and administration fees. Class specific expenses are charged directly to that share class. Investment income, common expenses, and realized and unrealized gains (losses) on investments are allocated daily to each class of shares based on the relative proportion of net assets of each class.
| | | | |
| 26 | | Wells Fargo Intrinsic Value Fund | | Notes to financial statements |
3. FAIR VALUATION MEASUREMENTS
Fair value measurements of investments are determined within a framework that has established a fair value hierarchy based upon the various data inputs utilized in determining the value of the Fund’s investments. The three-level hierarchy gives the highest priority to unadjusted quoted prices in active markets for identical assets or liabilities (Level 1) and the lowest priority to unobservable inputs (Level 3). The Fund’s investments are classified within the fair value hierarchy based on the lowest level of input that is significant to the fair value measurement. The inputs are summarized into three broad levels as follows:
| ∎ | | Level 1 – quoted prices in active markets for identical securities |
| ∎ | | Level 2 – other significant observable inputs (including quoted prices for similar securities, interest rates, prepayment speeds, credit risk, etc.) |
| ∎ | | Level 3 – significant unobservable inputs (including the Fund’s own assumptions in determining the fair value of investments) |
The inputs or methodologies used for valuing investments in securities are not necessarily an indication of the risk associated with investing in those securities.
The following is a summary of the inputs used in valuing the Fund’s assets and liabilities as of July 31, 2018:
| | | | | | | | | | | | | | | | |
| | | Quoted prices (Level 1) | | | Other significant observable inputs (Level 2) | | | Significant unobservable inputs (Level 3) | | | Total | |
Assets | | | | | | | | | | | | | | | | |
Investments in: | | | | | | | | | | | | | | | | |
| | | | |
Common stocks | | | | | | | | | | | | | | | | |
Consumer discretionary | | $ | 76,429,845 | | | $ | 0 | | | $ | 0 | | | $ | 76,429,845 | |
Consumer staples | | | 66,937,271 | | | | 0 | | | | 0 | | | | 66,937,271 | |
Energy | | | 97,677,307 | | | | 0 | | | | 0 | | | | 97,677,307 | |
Financials | | | 214,833,649 | | | | 0 | | | | 0 | | | | 214,833,649 | |
Health care | | | 111,746,425 | | | | 0 | | | | 0 | | | | 111,746,425 | |
Industrials | | | 104,961,763 | | | | 0 | | | | 0 | | | | 104,961,763 | |
Information technology | | | 156,168,831 | | | | 0 | | | | 0 | | | | 156,168,831 | |
Materials | | | 22,601,600 | | | | 0 | | | | 0 | | | | 22,601,600 | |
Real estate | | | 8,522,827 | | | | 0 | | | | 0 | | | | 8,522,827 | |
Telecommunication services | | | 24,420,556 | | | | 0 | | | | 0 | | | | 24,420,556 | |
Utilities | | | 25,454,930 | | | | 0 | | | | 0 | | | | 25,454,930 | |
| | | | |
Short-term investments | | | | | | | | | | | | | | | | |
Investment companies | | | 9,615,845 | | | | 0 | | | | 0 | | | | 9,615,845 | |
Investments measured at net asset value* | | | | | | | | | | | | | | | 22,457,350 | |
Total assets | | $ | 919,370,849 | | | $ | 0 | | | $ | 0 | | | $ | 941,828,199 | |
| * | Investments that are measured at fair value using the net asset value per share (or its equivalent) as a practical expedient have not been categorized in the fair value hierarchy. The fair value amount presented in the table is intended to permit reconciliation of the fair value hierarchy to the amounts presented in the Statement of Assets and Liabilities. The Fund’s investment in Securities Lending Cash Investments, LLC valued at $22,457,350 does not have a redemption period notice, can be redeemed daily and does not have any unfunded commitments. |
The Fund recognizes transfers between levels within the fair value hierarchy at the end of the reporting period. At July 31, 2018, the Fund did not have any transfers into/out of Level 1, Level 2, or Level 3.
4. TRANSACTIONS WITH AFFILIATES
Management fee
Funds Management, an indirect wholly owned subsidiary of Wells Fargo, is the manager of the Fund and provides advisory and fund-level administrative services under an investment management agreement. Under the investment management agreement, Funds Management is responsible for, among other services, implementing the investment objectives and strategies of the Fund, supervising the subadviser and providing fund-level administrative services in connection with the Fund’s operations. As compensation for its services under the investment management agreement,
| | | | | | |
| Notes to financial statements | | Wells Fargo Intrinsic Value Fund | | | 27 | |
Funds Management is entitled to receive an annual management fee starting at 0.70% and declining to 0.505% as the average daily net assets of the Fund increase. For the year ended July 31, 2018, the management fee was equivalent to an annual rate of 0.69% of the Fund’s average daily net assets.
Funds Management has retained the services of a subadviser to provide daily portfolio management to the Fund. The fee for subadvisory services is borne by Funds Management. WellsCap is the subadviser to the Fund and is entitled to receive a fee from Funds Management at an annual rate starting at 0.35% and declining to 0.25% as the average daily net assets of the Fund increase.
Administration fees
Under a class-level administration agreement, Funds Management provides class-level administrative services to the Fund, which includes paying fees and expenses for services provided by the transfer agent, sub-transfer agents, omnibus account servicers and record-keepers. As compensation for its services under the class-level administration agreement, Funds Management receives an annual fee which is calculated based on the average daily net assets of each class as follows:
| | | | |
| | | Class-level administration fee | |
Class A, Class C, Class R | | | 0.21 | % |
Class R4 | | | 0.08 | |
Class R6 | | | 0.03 | |
Administrator Class, Institutional Class | | | 0.13 | |
Funds Management has contractually waived and/or reimbursed management and administration fees to the extent necessary to maintain certain net operating expense ratios for the Fund. When each class of the Fund has exceeded its expense cap, Funds Management has waived fees and/or reimbursed expenses from fund level expenses on a proportionate basis and then from class specific expenses; otherwise, waivers and/or reimbursements are applied against class specific expenses before fund level expenses. Funds Management has committed through November 30, 2018 to waive fees and/or reimburse expenses to the extent necessary to cap the Fund’s expenses at 1.11% for Class A shares, 1.86% for Class C shares, 1.36% for Class R shares, 0.65% for Class R6 shares, 0.95% for Administrator Class shares, and 0.70% for Institutional Class shares. After this time, the cap may be increased or the commitment to maintain the cap may be terminated only with the approval of the Board of Trustees.
Distribution fees
The Trust has adopted a distribution plan for Class C and Class R shares of the Fund pursuant to Rule 12b-1 under the 1940 Act. Distribution fees are charged to Class C and Class R shares and paid to Wells Fargo Funds Distributor, LLC (“Funds Distributor”), the principal underwriter, at an annual rate of 0.75% of the average daily net assets of Class C shares and 0.25% of the average daily net assets of Class R shares.
In addition, Funds Distributor is entitled to receive the front-end sales charge from the purchase of Class A shares and a contingent deferred sales charge on the redemption of certain Class A shares. Funds Distributor is also entitled to receive the contingent deferred sales charges from redemptions of Class C shares. For the year ended July 31, 2018, Funds Distributor received $3,741 from the sale of Class A shares. No contingent deferred sales charges were incurred by Class A and Class C shares for the year ended July 31, 2018.
Shareholder servicing fees
The Trust has entered into contracts with one or more shareholder servicing agents, whereby Class A, Class C, Class R, and Administrator Class of the Fund are charged a fee at an annual rate of 0.25% of the average daily net assets of each respective class. Class R4 was charged a fee at an annual rate of 0.10% of its average daily net assets.
A portion of these total shareholder servicing fees were paid to affiliates of Wells Fargo.
Interfund transactions
The Fund may purchase or sell portfolio investment securities to certain other Wells Fargo affiliates pursuant to Rule 17a-7 under the 1940 Act and under procedures adopted by the Board of Trustees. The procedures have been designed to ensure that these interfund transactions, which do not incur broker commissions, are effected at current market prices.
| | | | |
| 28 | | Wells Fargo Intrinsic Value Fund | | Notes to financial statements |
5. INVESTMENT PORTFOLIO TRANSACTIONS
Purchases and sales of investments, excluding U.S. government obligations (if any) and short-term securities, for the year ended July 31, 2018 were $192,179,101 and $312,836,387, respectively.
6. BANK BORROWINGS
The Trust (excluding the money market funds and certain other funds) and Wells Fargo Variable Trust are parties to a $280,000,000 revolving credit agreement whereby the Fund is permitted to use bank borrowings for temporary or emergency purposes, such as to fund shareholder redemption requests. Interest under the credit agreement is charged to the Fund based on a borrowing rate equal to the higher of the Federal Funds rate in effect on that day plus 1.25% or the overnight LIBOR rate in effect on that day plus 1.25%. In addition, an annual commitment fee equal to 0.25% of the unused balance is allocated to each participating fund. Prior to August 29, 2017, the revolving credit agreement amount was $250,000,000.
For the year ended July 31, 2018, there were no borrowings by the Fund under the agreement
7. DISTRIBUTIONS TO SHAREHOLDERS
The tax character of distributions paid during the years ended July 31, 2018 and July 31, 2017 were as follows:
| | | | | | | | |
| | | Year ended July 31 | |
| | | 2018 | | | 2017 | |
Ordinary income | | $ | 6,045,623 | | | $ | 12,576,527 | |
Long-term capital gain | | | 68,880,914 | | | | 61,281,574 | |
As of July 31, 2018, the components of distributable earnings on a tax basis were as follows:
| | | | |
Undistributed ordinary income | | Undistributed long-term gain | | Unrealized gains |
| $7,531,668 | | $47,344,797 | | $208,773,736 |
8. INDEMNIFICATION
Under the Trust’s organizational documents, the officers and Trustees have been granted certain indemnification rights against certain liabilities that may arise out of performance of their duties to the Trust. Additionally, in the normal course of business, the Trust may enter into contracts with service providers that contain a variety of indemnification clauses. The Trust’s maximum exposure under these arrangements is dependent on future claims that may be made against the Fund and, therefore, cannot be estimated.
| | | | | | |
| Report of independent registered public accounting firm | | Wells Fargo Intrinsic Value Fund | | | 29 | |
BOARD OF TRUSTEES AND SHAREHOLDERS OF WELLS FARGO FUNDS TRUST:
Opinion on the Financial Statements
We have audited the accompanying statement of assets and liabilities of Wells Fargo Intrinsic Value Fund (the “Fund”), one of the funds constituting Wells Fargo Funds Trust, including the portfolio of investments, as of July 31, 2018, the related statement of operations for the year then ended, the statements of changes in net assets for each of the years in the two-year period then ended, and the related notes (collectively, the “financial statements”) and the financial highlights for each of the years in the five-year period then ended. In our opinion, the financial statements and financial highlights present fairly, in all material respects, the financial position of the Fund as of July 31, 2018, the results of its operations for the year then ended, the changes in its net assets for each of the years in the two-year period then ended, and the financial highlights for each of the years in the five-year period then ended, in conformity with U.S. generally accepted accounting principles.
Basis for Opinion
These financial statements and financial highlights are the responsibility of the Fund’s management. Our responsibility is to express an opinion on these financial statements and financial highlights based on our audits. We are a public accounting firm registered with the Public Company Accounting Oversight Board (United States) (“PCAOB”) and are required to be independent with respect to the Fund in accordance with the U.S. federal securities laws and the applicable rules and regulations of the Securities and Exchange Commission and the PCAOB.
We conducted our audits in accordance with the standards of the PCAOB. Those standards require that we plan and perform the audit to obtain reasonable assurance about whether the financial statements and financial highlights are free of material misstatement, whether due to error or fraud. Our audits included performing procedures to assess the risks of material misstatement of the financial statements and financial highlights, whether due to error or fraud, and performing procedures that respond to those risks. Such procedures included examining, on a test basis, evidence regarding the amounts and disclosures in the financial statements and financial highlights. Such procedures also included confirmation of securities owned as of July 31, 2018, by correspondence with the custodian and brokers, or by other appropriate auditing procedures. Our audits also included evaluating the accounting principles used and significant estimates made by management, as well as evaluating the overall presentation of the financial statements and financial highlights. We believe that our audits provide a reasonable basis for our opinion.

We have not been able to determine the specific year that we began serving as the auditor of one or more Wells Fargo Funds investment companies, however we are aware that we have served as the auditor of one or more Wells Fargo Funds investment companies since at least 1955.
Boston, Massachusetts
September 24, 2018
| | | | |
| 30 | | Wells Fargo Intrinsic Value Fund | | Other information (unaudited) |
TAX INFORMATION
For corporate shareholders, pursuant to Section 854 of the Internal Revenue Code, 100% of ordinary income dividends qualify for the corporate dividends-received deduction for the fiscal year ended July 31, 2018.
Pursuant to Section 852 of the Internal Revenue Code, $68,880,914 was designated as a 20% rate gain distribution for the fiscal year ended July 31, 2018.
Pursuant to Section 854 of the Internal Revenue Code, $6,045,623 of income dividends paid during the fiscal year ended July 31, 2018 has been designated as qualified dividend income (QDI).
PROXY VOTING INFORMATION
A description of the policies and procedures that the Fund uses to determine how to vote proxies relating to portfolio securities is available, upon request, by calling 1-800-222-8222, visiting our website at wellsfargofunds.com, or visiting the SEC website at sec.gov. Information regarding how the Fund voted proxies relating to portfolio securities during the most recent 12-month period ended June 30 is available on the Fund’s website at wellsfargofunds.com or by visiting the SEC website at sec.gov.
PORTFOLIO HOLDINGS INFORMATION
The complete portfolio holdings for the Fund are publicly available monthly on the Fund’s website (wellsfargofunds.com), on a one-month delayed basis. In addition, top ten holdings information (excluding derivative positions) for the Fund is publicly available on the Fund’s website on a monthly, seven-day or more delayed basis. The Fund files its complete schedule of portfolio holdings with the SEC for the first and third quarters of each fiscal year on Form N-Q, which is available by visiting the SEC website at sec.gov. In addition, the Fund’s Form N-Q may be reviewed and copied at the SEC’s Public Reference Room in Washington, DC, and at regional offices in New York City, at 233 Broadway, and in Chicago, at 175 West Jackson Boulevard, Suite 900. Information about the Public Reference Room may be obtained by calling 1-800-SEC-0330.
| | | | | | |
| Other information (unaudited) | | Wells Fargo Intrinsic Value Fund | | | 31 | |
BOARD OF TRUSTEES AND OFFICERS
Each of the Trustees and Officers1 listed in the table below acts in identical capacities for each fund in the Wells Fargo family of funds, which consists of 154 mutual funds comprising the Wells Fargo Funds Trust, Wells Fargo Variable Trust, Wells Fargo Master Trust and four closed-end funds (collectively the “Fund Complex”). This table should be read in conjunction with the Prospectus and the Statement of Additional Information2. The mailing address of each Trustee and Officer is 525 Market Street, 12th Floor, San Francisco, CA 94105. Each Trustee and Officer serves an indefinite term, however, each Trustee serves such term until reaching the mandatory retirement age established by the Trustees.
Independent Trustees
| | | | | | |
Name and year of birth | | Position held and
length of service* | | Principal occupations during past five years or longer | | Current other
public company or
investment company
directorships |
William R. Ebsworth (Born 1957) | | Trustee, since 2015 | | Retired. From 1984 to 2013, equities analyst, portfolio manager, research director and chief investment officer at Fidelity Management and Research Company in Boston, Tokyo, and Hong Kong, and retired in 2013 as Chief Investment Officer of Fidelity Strategic Advisers, Inc. where he led a team of investment professionals managing client assets. Prior thereto, Board member of Hong Kong Securities Clearing Co., Hong Kong Options Clearing Corp., the Thailand International Fund, Ltd., Fidelity Investments Life Insurance Company, and Empire Fidelity Investments Life Insurance Company. Board member of the Forté Foundation (non-profit organization) and the Vincent Memorial Hospital Endowment (non-profit organization), where he serves on the Investment Committee and as a Chair of the Audit Committee. Mr. Ebsworth is a CFA® charterholder. | | Asset Allocation Trust |
Jane A. Freeman (Born 1953) | | Trustee, since 2015; Chair Liaison, since 2018 | | Retired. From 2012 to 2014 and 1999 to 2008, Chief Financial Officer of Scientific Learning Corporation. From 2008 to 2012, Ms. Freeman provided consulting services related to strategic business projects. Prior to 1999, Portfolio Manager at Rockefeller & Co. and Scudder, Stevens & Clark. Board member of the Harding Loevner Funds from 1996 to 2014, serving as both Lead Independent Director and chair of the Audit Committee. Board member of the Russell Exchange Traded Funds Trust from 2011 to 2012 and the chair of the Audit Committee. Ms. Freeman is a Board Member of Ruth Bancroft Garden (non-profit organization) and the Glimmerglass Festival. She is also an inactive Chartered Financial Analyst. | | Asset Allocation Trust |
Isaiah Harris, Jr. (Born 1952) | | Trustee, since 2009 | | Retired. Chairman of the Board of CIGNA Corporation since 2009, and Director since 2005. From 2003 to 2011, Director of Deluxe Corporation. Prior thereto, President and CEO of BellSouth Advertising and Publishing Corp. from 2005 to 2007, President and CEO of BellSouth Enterprises from 2004 to 2005 and President of BellSouth Consumer Services from 2000 to 2003. Emeritus member of the Iowa State University Foundation Board of Governors. Emeritus Member of the Advisory Board of Iowa State University School of Business. Advisory Board Member, Palm Harbor Academy (charter school). Advisory Board Member, Child Evangelism Fellowship (non-profit). Mr. Harris is a certified public accountant (inactive status). | | CIGNA Corporation; Asset Allocation Trust |
Judith M. Johnson (Born 1949) | | Trustee, since 2008; Audit Committee Chairman, since 2009 | | Retired. Prior thereto, Chief Executive Officer and Chief Investment Officer of Minneapolis Employees Retirement Fund from 1996 to 2008. Ms. Johnson is an attorney, certified public accountant and a certified managerial accountant. | | Asset Allocation Trust |
David F. Larcker (Born 1950) | | Trustee, since 2009 | | James Irvin Miller Professor of Accounting at the Graduate School of Business, Stanford University, Director of the Corporate Governance Research Initiative and Senior Faculty of The Rock Center for Corporate Governance since 2006. From 2005 to 2008, Professor of Accounting at the Graduate School of Business, Stanford University. Prior thereto, Ernst & Young Professor of Accounting at The Wharton School, University of Pennsylvania from 1985 to 2005. | | Asset Allocation Trust |
| | | | |
| 32 | | Wells Fargo Intrinsic Value Fund | | Other information (unaudited) |
| | | | | | |
Name and year of birth | | Position held and
length of service* | | Principal occupations during past five years or longer | | Current other
public company or
investment company
directorships |
Olivia S. Mitchell (Born 1953) | | Trustee, since 2006; Governance Committee Chairman, since 2018 | | International Foundation of Employee Benefit Plans Professor, Wharton School of the University of Pennsylvania since 1993. Director of Wharton’s Pension Research Council and Boettner Center on Pensions & Retirement Research, and Research Associate at the National Bureau of Economic Research. Previously, Cornell University Professor from 1978 to 1993. | | Asset Allocation Trust |
Timothy J. Penny (Born 1951) | | Trustee, since 1996; Chairman, since 2018; Vice Chairman, from 2017 to 2018 | | President and Chief Executive Officer of Southern Minnesota Initiative Foundation, a non-profit organization, since 2007. Member of the Board of Trustees of NorthStar Education Finance, Inc., a non-profit organization, since 2007. | | Asset Allocation Trust |
James G. Polisson (Born 1959) | | Trustee, since 2018; Advisory Board Member, from 2017 to 2018 | | Retired. Chief Marketing Officer, Source (ETF) UK Services, Ltd, from 2015 to 2017. From 2012 to 2015, Principal of The Polisson Group, LLC, a management consulting, corporate advisory and principal investing company. Chief Executive Officer and Managing Director at Russell Investments, Global Exchange Traded Funds from 2010 to 2012. Managing Director of Barclays Global Investors from 1998 to 2010 and Global Chief Marketing Officer for iShares and Barclays Global Investors from 2000 to 2010. Trustee of the San Francisco Mechanics’ Institute, a non-profit organization, from 2013 to 2015. Board member of the Russell Exchange Traded Fund Trust from 2011 to 2012. Director of Barclays Global Investors Holdings Deutschland GmbH from 2006 to 2009. Mr. Polisson is an attorney and has a retired status with the Massachusetts and District of Columbia Bar Associations. | | Asset Allocation Trust |
Michael S. Scofield (Born 1943) | | Trustee, since 2010 | | Served on the Investment Company Institute’s Board of Governors and Executive Committee from 2008-2011 as well the Governing Council of the Independent Directors Council from 2006-2011 and the Independent Directors Council Executive Committee from 2008-2011. Trustee of the Evergreen Fund complex (and its predecessors) from 1984 to 2010. Chairman of the Evergreen Funds from 2000-2010. Former Trustee of the Mentor Funds. Retired Attorney, Law Offices of Michael S. Scofield. | | Asset Allocation Trust |
Pamela Wheelock (Born 1959) | | Trustee, since 2018; Advisory Board Member, from 2017 to 2018 | | Chief Operating Officer, Twin Cities Habitat for Humanity, since January, 2017. Vice President of University Services, University of Minnesota from 2012 to 2017. Prior thereto, on the Board of Directors, Goverance Committee and Finance Committee for the Minnesota Philanthropy Partners (Saint Paul Foundation) from 2012 to 2018, Interim President and Chief Executive Officer of Blue Cross Blue shield of Minnesota of Minnesota from 2010 to 2011, Chairman of the Board from 2009 to 2011 and Board Director 003 to 2015. Vice President, Leadership and Community Engagement, Bush Foundation, Saint Paul, Minnesota (a private foundation) from 2009 to 2011. Executive Vice President and Chief Financial Officer, Minnesota Sports and Entertainment from 2004 to 2009 and Senior Vice President from 2002 to 2004. Commissioner of Finance, State of Minnesota, from 1999 to 2002. Currently the Board Chair of the Minnesota Wild Foundation since 2010. | | Asset Allocation Trust |
| * | Length of service dates reflect the Trustee’s commencement of service with the Trust’s predecessor entities, where applicable. |
| | | | | | |
| Other information (unaudited) | | Wells Fargo Intrinsic Value Fund | | | 33 | |
Officers
| | | | | | |
Name and year of birth | | Position held and
length of service | | Principal occupations during past five years or longer | | |
Andrew Owen (Born 1960) | | President, since 2017 | | Executive Vice President of Wells Fargo & Company and Head of Affiliated Managers, Wells Fargo Asset Management, since 2014. In addition, Mr. Owen is currently President, Chief Executive Officer and Director of Wells Fargo Funds Management, LLC since 2017. Prior thereto, Executive Vice President responsible for marketing, investments and product development for Wells Fargo Funds Management, LLC, from 2009 to 2014. | | |
Jeremy DePalma1 (Born 1974) | | Treasurer, since 2012 | | Senior Vice President of Wells Fargo Funds Management, LLC since 2009. Senior Vice President of Evergreen Investment Management Company, LLC from 2008 to 2010 and head of the Fund Reporting and Control Team within Fund Administration from 2005 to 2010. | | |
Alexander Kymn3 (Born 1973) | | Secretary, since 2018; Chief Legal Officer, since 2018 | | Senior Company Counsel of Wells Fargo Bank, N.A. since 2018 (previously Senior Counsel from 2007 to 2018). Vice President of Wells Fargo Funds Management, LLC from 2008 to 2014. | | |
Michael H. Whitaker (Born 1967) | | Chief Compliance Officer, since 2016 | | Senior Vice President and Chief Compliance Officer since 2016. Senior Vice President and Chief Compliance Officer for Fidelity Investments from 2007 to 2016. | | |
David Berardi (Born 1975) | | Assistant Treasurer, since 2009 | | Vice President of Wells Fargo Funds Management, LLC since 2009. Vice President of Evergreen Investment Management Company, LLC from 2008 to 2010. Manager of Fund Reporting and Control for Evergreen Investment Management Company, LLC from 2004 to 2010. | | |
| 1 | Jeremy DePalma acts as Treasurer of 77 funds and Assistant Treasurer of 77 funds in the Fund Complex. |
| 2 | The Statement of Additional Information includes additional information about the Trustees and is available, without charge, upon request, by calling 1-800-222-8222 or by visiting the website at wellsfargofunds.com. |
| 3 | Alexander Kymn became the Secretary and Chief Legal Officer effective April 17, 2018. |
| | | | |
| 34 | | Wells Fargo Intrinsic Value Fund | | Other information (unaudited) |
BOARD CONSIDERATION OF INVESTMENT MANAGEMENT AND SUB-ADVISORY AGREEMENTS:
Wells Fargo Intrinsic Value Fund
Under the Investment Company Act of 1940 (the “1940 Act”), the Board of Trustees (the “Board”) of Wells Fargo Funds Trust (the “Trust”) must determine annually whether to approve the continuation of the Trust’s investment management and sub-advisory agreements. In this regard, at an in-person meeting held on May 22-23, 2018 (the “Meeting”), the Board, all the members of which have no direct or indirect interest in the investment management and sub-advisory agreements and are not “interested persons” of the Trust, as defined in the 1940 Act (the “Independent Trustees”), reviewed and approved for Wells Fargo Intrinsic Value Fund (the “Fund”): (i) an investment management agreement (the “Management Agreement”) with Wells Fargo Funds Management, LLC (“Funds Management”); and (ii) an investment sub-advisory agreement (the “Sub-Advisory Agreement”) with Wells Capital Management Incorporated (the “Sub-Adviser”), an affiliate of Funds Management. The Management Agreement and the Sub-Advisory Agreement are collectively referred to as the “Advisory Agreements.”
At the Meeting, the Board considered the factors and reached the conclusions described below relating to the selection of Funds Management and the Sub-Adviser and the approval of the Advisory Agreements. Prior to the Meeting, including at an in-person meeting in April 2018, the Trustees conferred extensively among themselves and with representatives of Funds Management about these matters. Also, the Board has adopted a team-based approach, with each team consisting of a sub-set of Trustees, to assist the full Board in the discharge of its duties in reviewing investment performance and other matters throughout the year. The Independent Trustees were assisted in their evaluation of the Advisory Agreements by independent legal counsel, from whom they received separate legal advice and with whom they met separately.
In providing information to the Board, Funds Management and the Sub-Adviser were guided by a detailed set of requests for information submitted to them by independent legal counsel on behalf of the Independent Trustees at the start of the Board’s annual contract renewal process earlier in 2018. In considering and approving the Advisory Agreements, the Trustees considered the information they believed relevant, including but not limited to the information discussed below. The Board considered not only the specific information presented in connection with the Meeting, but also the knowledge gained over time through interaction with Funds Management and the Sub-Adviser about various topics. In this regard, the Board reviewed reports of Funds Management at each of its quarterly meetings, which included, among other things, portfolio reviews and investment performance reports. In addition, the Board and the teams mentioned above confer with portfolio managers at various times throughout the year. The Board did not identify any particular information or consideration that was all-important or controlling, and each individual Trustee may have attributed different weights to various factors.
After its deliberations, the Board unanimously approved the continuation of the Advisory Agreements for a one-year term and determined that the compensation payable to Funds Management and the Sub-Adviser under each of the Advisory Agreements was reasonable. The Board considered the approval of the Advisory Agreements for the Fund as part of its consideration of agreements for funds across the complex, but its approvals were made on a fund-by-fund basis. The following summarizes a number of important, but not necessarily all, factors considered by the Board in support of its approvals.
Nature, extent and quality of services
The Board received and considered various information regarding the nature, extent and quality of services provided to the Fund by Funds Management and the Sub-Adviser under the Advisory Agreements. This information included a description of the investment advisory services and Fund-level administrative services covered by the Management Agreement, as well as, among other things, a summary of the background and experience of senior management of Wells Fargo Asset Management (“WFAM”), of which Funds Management and the Sub-Adviser are a part, a summary of investments made in the business of WFAM, a summary of certain organizational and personnel changes involving Funds Management and the Sub-Adviser, and a description of Funds Management’s and the Sub-Adviser’s business continuity planning programs and of their approaches to data privacy and cybersecurity. The Board also considered the qualifications, background, tenure and responsibilities of each of the portfolio managers primarily responsible for the day-to-day portfolio management of the Fund.
The Board evaluated the ability of Funds Management and the Sub-Adviser to attract and retain qualified investment professionals, including research, advisory and supervisory personnel. The Board further considered the compliance programs and compliance records of Funds Management and the Sub-Adviser. In addition, the Board took into account the full range of services provided to the Fund by Funds Management and its affiliates.
| | | | | | |
| Other information (unaudited) | | Wells Fargo Intrinsic Value Fund | | | 35 | |
Fund investment performance and expenses
The Board considered the investment performance results for the Fund over various time periods ended December 31, 2017. The Board considered these results in comparison to the investment performance of funds in a universe that was determined by Broadridge Inc. (“Broadridge”) to be similar to the Fund (the “Universe”), and in comparison to the Fund’s benchmark index and to other comparative data. Broadridge is an independent provider of investment company data. The Board received a description of the methodology used by Broadridge to select the mutual funds in the performance Universe. The Board noted that the investment performance of the Fund (Class A) was in range of the average investment performance of the Universe for the ten-year period under review, but lower than the average investment performance of the Universe for the one-, three- and five-year periods under review. The Board also noted that the investment performance of the Fund was higher than its benchmark index, the Russell 1000 Value Index, for the one- and ten-year periods under review, but lower than its benchmark index for the three- and five-year periods under review.
The Board received information concerning, and discussed factors contributing to, the underperformance of the Fund relative to the Universe and benchmark for the periods identified above. The Board took note of the explanations for the relative underperformance during these periods, including with respect to investment decisions and market factors that affected the Fund’s investment performance. The Board also took note of the Fund’s outperformance relative to the Universe and benchmark over the more recent time periods under review.
The Board also received and considered information regarding the Fund’s net operating expense ratios and their various components, including actual management fees, custodian and other non-management fees, and Rule 12b-1 and non-Rule 12b-1 shareholder service fees. The Board considered these ratios in comparison to the median ratios of funds in class-specific expense groups that were determined by Broadridge to be similar to the Fund (the “Groups”). The Board received a description of the methodology used by Broadridge to select the mutual funds in the expense Groups and an explanation of how funds comprising expense groups and their expense ratios may vary from year-to-year. Based on the Broadridge reports, the Board noted that the net operating expense ratios of the Fund were lower than, equal to, or in range of the median net operating expense ratios of the expense Groups for each share class.
The Board took into account the Fund’s investment performance and expense information provided to it among the factors considered in deciding to re-approve the Advisory Agreements.
Investment management and sub-advisory fee rates
The Board reviewed and considered the contractual fee rates payable by the Fund to Funds Management under the Management Agreement, as well as the contractual fee rates payable by the Fund to Funds Management for class-level administrative services under a Class-Level Administration Agreement, which include, among other things, class-level transfer agency and sub-transfer agency costs (collectively, the “Management Rates”). The Board also reviewed and considered the contractual investment sub-advisory fee rates that are payable by Funds Management to the Sub-Adviser for investment sub-advisory services.
Among other information reviewed by the Board was a comparison of the Fund’s Management Rates with the average contractual investment management fee rates of funds in the expense Groups at a common asset level as well as transfer agency costs of the funds in the expense Groups. The Board noted that the Management Rates of the Fund were higher than the sum of these average rates for the expense Groups for each of the Fund’s share classes other than Administrator Class. However, the Board noted that the net operating expense ratios of the Fund were lower than, equal to, or in range of the median net operating expense ratios of the expense Groups for each share class.
The Board also received and considered information about the portion of the total management fee that was retained by Funds Management after payment of the fee to the Sub-Adviser for sub-advisory services. In assessing the reasonableness of this amount, the Board received and evaluated information about the nature and extent of responsibilities retained and risks assumed by Funds Management and not delegated to or assumed by the Sub-Adviser, and about Funds Management’s on-going oversight services. Given the affiliation between Funds Management and the Sub-Adviser, the Board ascribed limited relevance to the allocation of fees between them.
The Board also received and considered information about the nature and extent of services offered and fee rates charged by Funds Management and the Sub-Adviser to other types of clients with investment strategies similar to those of the Fund. In this regard, the Board received information about the significantly greater scope of services, and compliance, reporting and other legal burdens and risks of managing mutual funds compared with those associated with managing assets of non-mutual fund clients such as institutional separate accounts.
| | | | |
| 36 | | Wells Fargo Intrinsic Value Fund | | Other information (unaudited) |
Based on its consideration of the factors and information it deemed relevant, including those described here, the Board determined that the compensation payable to Funds Management under the Management Agreement and to the Sub-Adviser under the Sub-Advisory Agreement was reasonable.
Profitability
The Board received and considered information concerning the profitability of Funds Management, as well as the profitability of both WFAM and Wells Fargo & Co. (“Wells Fargo”) as a whole, from providing services to the Fund and the fund family as a whole. The Board noted that the Sub-Adviser’s profitability information with respect to providing services to the Fund was subsumed in the WFAM and Wells Fargo profitability analysis.
Funds Management reported on the methodologies and estimates used in calculating profitability, including a description of the methodology used to allocate certain expenses and recent enhancements made to the methodology. Among other things, the Board noted that the levels of profitability reported on a fund-by-fund basis varied widely, depending on factors such as the size and type of fund. Based on its review, the Board did not deem the profits reported by Funds Management, WFAM or Wells Fargo from services provided to the Fund to be at a level that would prevent it from approving the continuation of the Advisory Agreements.
Economies of scale
The Board considered the extent to which Funds Management may experience economies of scale in the provision of management services, and the extent to which scale benefits, if any, would be shared with shareholders. In particular, the Board noted the existence of breakpoints in the Fund’s management fee structure, which operate generally to reduce the Fund’s expense ratios as the Fund grows in size. It considered that, for a small fund or a fund that shrinks in size, breakpoints conversely can result in higher fee levels. The Board also considered that in addition to management fee breakpoints, competitive management fee rates set at the outset without regard to breakpoints and fee waiver and expense reimbursement arrangements, as well as investments in the business intended to enhance services available to Fund shareholders, are means of sharing potential economies of scale with shareholders of the Fund.
The Board concluded that the Fund’s fee and expense arrangements, including contractual breakpoints, constituted a reasonable approach to sharing potential economies of scale with the Fund and its shareholders.
Other benefits to Funds Management and the Sub-Adviser
The Board received and considered information regarding potential “fall-out” or ancillary benefits received by Funds Management and its affiliates, including the Sub-Adviser, as a result of their relationships with the Fund. Ancillary benefits could include, among others, benefits directly attributable to other relationships with the Fund and benefits potentially derived from an increase in Funds Management’s and the Sub-Adviser’s business as a result of their relationships with the Fund. The Board noted that various affiliates of Funds Management may receive distribution-related fees, shareholder servicing payments and sub-transfer agency fees in respect of shares sold or held through them and services provided.
The Board also reviewed information about soft dollar credits earned and utilized by the Sub-Adviser, fees earned by Funds Management and the Sub-Adviser from managing a private investment vehicle for the fund family’s securities lending collateral and commissions earned by an affiliated broker from portfolio transactions.
Based on its consideration of the factors and information it deemed relevant, including those described here, the Board did not find that any ancillary benefits received by Funds Management and its affiliates, including the Sub-Adviser, were unreasonable.
Conclusion
At the Meeting, after considering the above-described factors and based on its deliberations and its evaluation of the information described above, the Board unanimously approved the continuation of the Advisory Agreements for a one-year term and determined that the compensation payable to Funds Management and the Sub-Adviser under each of the Advisory Agreements was reasonable.
| | | | | | |
| Appendix A (unaudited) | | Wells Fargo Intrinsic Value Fund | | | 37 | |
SALES CHARGE REDUCTIONS AND WAIVERS FOR CERTAIN INTERMEDIARIES
Ameriprise
Effective June 1, 2018, shareholders purchasing Fund shares through an Ameriprise Financial platform or account will be eligible only for the following Class A load waivers (front-end sales charge waivers), which may differ from those disclosed elsewhere in the Fund’s prospectus or Statement of Additional Information.
Front-end Sales Load Waivers on Class A Shares Available at Ameriprise Financial
| | • | | Employer-sponsored retirement plans (e.g., 401(k) plans, 457 plans, employer-sponsored 403(b) plans, profit sharing and money purchase pension plans and defined benefit plans). For purposes of this provision, employer-sponsored retirement plans do not include SEP IRAs, Simple IRAs or SAR-SEPs. |
| | • | | Shares purchased through an Ameriprise Financial investment advisory program (if an Advisory or similar share class for such investment advisory program is not available) |
| | • | | Shares purchased by third party investment advisors on behalf of their advisory clients through Ameriprise Financial’s platform (if an Advisory or similar share class for such investment advisory program is not available) |
| | • | | Shares purchased through reinvestment of distributions and dividend reinvestment when purchasing shares of the same Fund (but not any other fund within the same fund family) |
| | • | | Shares exchanged from Class C shares of the same fund in the month of or following the 10-year anniversary of the purchase date. To the extent that the Fund’s prospectus elsewhere provides for a waiver with respect to such shares following a shorter holding period, that waiver will apply to exchanges following such shorter period. To the extent that the Fund’s prospectus elsewhere provides for a waiver with respect to exchanges of Class C shares for load-waived shares, that waiver will also apply to such exchanges. |
| | • | | Employees and registered representatives of Ameriprise Financial or its affiliates and their immediate family members |
| | • | | Shares purchased by or through qualified accounts (including IRAs, Coverdell Education Savings Accounts, 401(k)s, 403(b) TSCAs subject to ERISA and defined benefit plans) that are held by a covered family member, defined as an Ameriprise financial advisor and/or the advisor’s spouse, advisor’s lineal ascendant (mother, father, grandmother, grandfather, great grandmother, great grandfather), advisor’s lineal descendant (son, step-son, daughter, step-daughter, grandson, granddaughter, great grandson, great granddaughter) or any spouse of a covered family member who is a lineal descendant |
| | • | | Shares purchased from the proceeds of redemptions within the same fund family, provided (1) the repurchase occurs within 90 days following the redemption, (2) the redemption and purchase occur in the same account, and (3) redeemed shares were subject to a front-end or deferred sales load (i.e. Rights of Reinstatement). Subject to the Fund’s policy regarding frequent purchases and redemptions of Fund shares, you may not be able to repurchase shares for the first 30 days after your redemption. |
Automatic Exchange of Class C Shares Available at Ameriprise Financial
| | • | | Class C shares will automatically exchange to Class A shares in the month of the 10-year anniversary of the purchase date. |
Merrill Lynch
Effective April 10, 2017, shareholders purchasing Fund shares through a Merrill Lynch platform or account will be eligible only for the following load waivers (front-end sales charge waivers and contingent deferred, or back-end, sales charge waivers) and discounts, which may differ from those disclosed elsewhere in the Fund’s prospectus or Statement of Additional Information.
Front-end Sales Load Waivers on Class A Shares available at Merrill Lynch
| | • | | Employer-sponsored retirement, deferred compensation and employee benefit plans (including health savings accounts) and trusts used to fund those plans, provided that the shares are not held in a commission-based brokerage account and shares are held for the benefit of the plan |
| | • | | Shares purchased by or through a 529 Plan |
| | • | | Shares purchased through a Merrill Lynch affiliated investment advisory program |
| | | | |
| 38 | | Wells Fargo Intrinsic Value Fund | | Appendix A (unaudited) |
| | • | | Shares purchased by third party investment advisors on behalf of their advisory clients through Merrill Lynch’s platform |
| | • | | Shares of funds purchased through the Merrill Edge Self-Directed platform (if applicable) |
| | • | | Shares purchased through reinvestment of capital gains distributions and dividend reinvestment when purchasing shares of the same fund (but not any other fund within the fund family) |
| | • | | Shares exchanged from Class C (i.e. level-load) shares of the same fund in the month of or following the 10-year anniversary of the purchase date |
| | • | | Employees and registered representatives of Merrill Lynch or its affiliates and their family members, as defined by Merrill Lynch, which may differ from the definition of family member in the Fund’s prospectus. |
| | • | | Directors or Trustees of the Fund, and employees of the Fund’s investment adviser or any of its affiliates, as described in the Fund’s prospectus |
| | • | | Shares purchased from the proceeds of redemptions within the same fund family, provided (1) the repurchase occurs within 90 days following the redemption, (2) the redemption and purchase occur in the same account, and (3) redeemed shares were subject to a front-end or deferred sales load (known as Rights of Reinstatement). Subject to the Fund’s policy regarding frequent purchases and redemptions of Fund shares, you may not be able to repurchase shares for the first 30 days after your redemption. |
CDSC Waivers on A, B and C Shares available at Merrill Lynch
| | • | | Death or disability of the shareholder |
| | • | | Shares sold as part of a systematic withdrawal plan as described in the Fund’s prospectus |
| | • | | Return of excess contributions from an IRA Account |
| | • | | Shares sold as part of a required minimum distribution for IRA and retirement accounts due to the shareholder reaching age 70½ |
| | • | | Shares sold to pay Merrill Lynch fees but only if the transaction is initiated by Merrill Lynch |
| | • | | Shares acquired through a right of reinstatement |
| | • | | Shares held in retirement brokerage accounts, that are exchanged for a lower cost share class due to transfer to certain fee based accounts or platforms (applicable to A and C shares only) |
Front-end load Discounts Available at Merrill Lynch: Breakpoints, Rights of Accumulation & Letters of Intent
| | • | | Breakpoints as described in the Fund’s prospectus |
| | • | | Rights of Accumulation (ROA) which entitle shareholders to breakpoint discounts will be automatically calculated based on the aggregated holding of fund family assets held by accounts within the purchaser’s household at Merrill Lynch. Eligible fund family assets not held at Merrill Lynch may be included in the ROA calculation only if the shareholder notifies his or her financial advisor about such assets. |
| | • | | Letters of Intent (LOI) which allow for breakpoint discounts based on anticipated purchases within a fund family, through Merrill Lynch, over a 13-month period of time (if applicable) |
Morgan Stanley
Effective on or about July 1, 2018, shareholders purchasing Fund shares through a Morgan Stanley Wealth Management transactional brokerage account will be eligible only for the following Class A load waivers (front-end sales charge waivers), which may differ from and be more limited than those disclosed in the Fund’s prospectus or Statement of Additional Information.
Front-end Sales Load Waivers on Class A Shares Available at Morgan Stanley
| | • | | Employer-sponsored retirement plans (e.g., 401(k) plans, 457 plans, employer-sponsored 403(b) plans, profit sharing and money purchase pension plans and defined benefit plans). For purposes of this provision, employer-sponsored retirement plans do not include SEP IRAs, Simple IRAs, SAR-SEPs or Keogh plans. |
| | • | | Morgan Stanley employee and employee-related accounts according to Morgan Stanley’s account linking rules |
| | • | | Shares purchased through reinvestment of dividends and capital gains distributions when purchasing shares of the same fund |
| | • | | Shares purchased through a Morgan Stanley self-directed brokerage account |
| | | | | | |
| Appendix A (unaudited) | | Wells Fargo Intrinsic Value Fund | | | 39 | |
| | • | | Class C (i.e., level-load) shares that are no longer subject to a contingent deferred sales charge and are exchanged to Class A shares of the same fund pursuant to Morgan Stanley Wealth Management’s share class exchange program. |
| | • | | Shares purchased from the proceeds of redemptions within the same fund family, provided (i) the repurchase occurs within 90 days following the redemption, (ii) the redemption and purchase occur in the same account, and (iii) redeemed shares were subject to a front-end or deferred sales charge. This waiver is subject to the Fund’s policy regarding frequent purchases and redemption of Fund shares, as discussed under “Account Information—Frequent Purchases and Redemptions of Fund Shares” in the Fund’s prospectus. |
This page is intentionally left blank.

For more information
More information about Wells Fargo Funds is available free upon request. To obtain literature, please write, email, visit the Fund’s website, or call:
Wells Fargo Funds
P.O. Box 219967
Kansas City, MO 64121-9967
Website: wellsfargofunds.com
Individual investors: 1-800-222-8222
Retail investment professionals: 1-888-877-9275
Institutional investment professionals:
1-866-765-0778
This report and the financial statements contained herein are submitted for the general information of the shareholders of the Fund. If this report is used for promotional purposes, distribution of the report must be accompanied or preceded by a current prospectus. Before investing, please consider the investment objectives, risks, charges, and expenses of the investment. For a current prospectus and, if available, a summary prospectus, containing this information, call 1-800-222-8222 or visit the Fund’s website at wellsfargofunds.com. Read the prospectus carefully before you invest or send money.
Wells Fargo Asset Management (WFAM) is the trade name for certain investment advisory/management firms owned by Wells Fargo & Company. These firms include but are not limited to Wells Capital Management Incorporated and Wells Fargo Funds Management, LLC. Certain products managed by WFAM entities are distributed by Wells Fargo Funds Distributor, LLC (a broker/dealer and Member FINRA).
This material is for general informational and educational purposes only and is NOT intended to provide investment advice or a recommendation of any kind—including a recommendation for any specific investment, strategy, or plan.
NOT FDIC INSURED ◾ NO BANK GUARANTEE ◾ MAY LOSE VALUE
© 2018 Wells Fargo Funds Management, LLC. All rights reserved.
| | |
 | | 314797 09-18 A207/AR207 07-18 |
Annual Report
July 31, 2018

Wells Fargo Large Cap Core Fund


Reduce clutter. Save trees.
Sign up for electronic delivery of prospectuses and shareholder reports at wellsfargo.com/advantagedelivery
Contents
The views expressed and any forward-looking statements are as of July 31, 2018, unless otherwise noted, and are those of the Fund managers and/or Wells Fargo Funds Management, LLC. Discussions of individual securities, or the markets generally, or any Wells Fargo Fund are not intended as individual recommendations. Future events or results may vary significantly from those expressed in any forward-looking statements. The views expressed are subject to change at any time in response to changing circumstances in the market. Wells Fargo Funds Management, LLC and the Fund disclaim any obligation to publicly update or revise any views expressed or forward-looking statements.
NOT FDIC INSURED ◾ NO BANK GUARANTEE ◾ MAY LOSE VALUE
| | | | |
| 2 | | Wells Fargo Large Cap Core Fund | | Letter to shareholders (unaudited) |

Andrew Owen
President
Wells Fargo Funds
After advancing during the summer and fall of 2017 in a roughly synchronized way, economic growth and stock markets globally diverged during the first seven months of 2018.
Dear Shareholder:
We are pleased to offer you this annual report for the Wells Fargo Large Cap Core Fund for the 12-month period that ended July 31, 2018. After advancing during the summer and fall of 2017 in a roughly synchronized way, economic growth and stock markets globally diverged during the first seven months of 2018. For fixed-income investors, higher U.S. interest rates, rising inflation, and intensifying global geopolitical tensions tended to restrain taxable bond prices while high-yield and municipal bond investors generally enjoyed positive returns.
For the period, U.S. stocks, as measured by the S&P 500 Index,1 gained 16.24%, and international stocks, as measured by the MSCI ACWI ex USA Index (Net),2 added 5.94%. Emerging market stocks, as measured by the MSCI EM Index (Net),3 added 4.36%. In bond markets, the Bloomberg Barclays U.S. Aggregate Bond Index4 declined 0.80% while fixed-income investments outside the U.S. fell 0.27%, according to the Bloomberg Barclays Global Aggregate ex-USD Index.5 The Bloomberg Barclays Municipal Bond Index6 added 0.99%, and the ICE BofAML U.S. High Yield Index7 was up 2.49%.
Volatility increased as summer turned to fall in 2017, although data generally was favorable.
During the third quarter of 2017, investor expectations rose and fell amid shifting geopolitical tensions, particularly in Asia as North Korea’s nuclear aspirations and U.S./China trade rhetoric caused concerns. In the U.S., corporate earnings and consumer confidence improved. The U.S. Bureau of Economic Analysis reported that annualized U.S. gross domestic product (GDP) growth for the quarter was 2.8%. The rate of inflation was below the U.S. Federal Reserve’s (Fed’s) targets.
Economic momentum increased in Europe; the European Central Bank (ECB) held its rates steady at low levels and continued its quantitative easing bond-buying program with the goal of sparking economic activity. In emerging markets, many countries benefited from stronger currencies versus the U.S. dollar while commodity price increases benefited countries that rely on natural resources for exports.
| 1 | The S&P 500 Index consists of 500 stocks chosen for market size, liquidity, and industry group representation. It is a market-value-weighted index with each stock’s weight in the index proportionate to its market value. You cannot invest directly in an index. |
| 2 | The Morgan Stanley Capital International (MSCI) All Country World Index (ACWI) ex USA Index (Net) is a free-float-adjusted market-capitalization-weighted index that is designed to measure the equity market performance of developed markets, excluding the United States and Canada. Source: MSCI. MSCI makes no express or implied warranties or representations and shall have no liability whatsoever with respect to any MSCI data contained herein. The MSCI data may not be further redistributed or used as a basis for other indices or any securities or financial products. This report is not approved, reviewed, or produced by MSCI. You cannot invest directly in an index. |
| 3 | The MSCI Emerging Markets (EM) Index (Net) is a free-float-adjusted market-capitalization-weighted index that is designed to measure large- and mid-cap equity market performance of emerging markets. The MSCI EM Index (Net) consists of the following 24 emerging market country indices: Brazil, Chile, China, Colombia, Czech Republic, Egypt, Greece, Hungary, India, Indonesia, Korea, Malaysia, Mexico, Pakistan, Peru, the Philippines, Poland, Qatar, Russia, South Africa, Taiwan, Thailand, Turkey, and the United Arab Emirates. You cannot invest directly in an index. |
| 4 | The Bloomberg Barclays U.S. Aggregate Bond Index is a broad-based benchmark that measures the investment-grade, U.S. dollar-denominated, fixed-rate taxable bond market, including Treasuries, government-related and corporate securities, mortgage-backed securities (agency fixed-rate and hybrid adjustable-rate mortgage pass-throughs), asset-backed securities, and commercial mortgage-backed securities. You cannot invest directly in an index. |
| 5 | The Bloomberg Barclays Global Aggregate ex-USD Index is an unmanaged index that provides a broad-based measure of the global investment-grade fixed-income markets excluding the U.S. dollar-denominated debt market. You cannot invest directly in an index. |
| 6 | The Bloomberg Barclays Municipal Bond Index is an unmanaged index composed of long-term tax-exempt bonds with a minimum credit rating of Baa. You cannot invest directly in an index. |
| 7 | The ICE BofAML U.S. High Yield Index is a market-capitalization-weighted index of domestic and Yankee high-yield bonds. The index tracks the performance of high-yield securities traded in the U.S. bond market. You cannot invest directly in an index. Copyright 2018. ICE Data Indices, LLC. All rights reserved. |
| 8 | The Consumer Price Index For All Urban Consumers (CPI-U) measures the changes in the price of a basket of goods and services purchased by urban consumers. The urban consumer population is deemed by many as a better representative measure of the general public because most of the country’s population lives in highly populated areas, which represent close to 90% of the total population. You cannot invest directly in an index. |
| | | | | | |
| Letter to shareholders (unaudited) | | Wells Fargo Large Cap Core Fund | | | 3 | |
The fourth quarter of 2017 was characterized by continued optimism in the U.S.
By the end of 2017, some observers were describing conditions as a Goldilocks economic scenario: synchronized global growth, low inflation, and healthy corporate earnings, all supported abroad by a weaker U.S. dollar.
U.S. stocks continued to rally during the fourth quarter of 2017, boosted by favorable company earnings and the potential for tax reform and industry deregulation. The Fed increased rates by 25 basis points (bps; 100 bps equal 1.00%) in December. The annualized GDP growth rate for the fourth quarter was 2.3%.
Internationally, the Bank of England (BoE) raised interest rates in November 2017 to 0.50%, the first increase in more than 10 years and a move up from the 0.25% rate put in place after the Brexit vote to leave the European Union in June 2016. The pound gained against other currencies. Meanwhile, the ECB and the Bank of Japan maintained interest rate policies and bond-buying programs intended to spur business activities and enhance the attractiveness of equity investments. The People’s Bank of China (PBOC) also continued policies that encouraged business investment. International equity markets, particularly emerging markets, continued to show strength.
Volatility reemerged during the first quarter of 2018 as economic signals were mixed.
The first quarter of 2018 began with stock market gains in January following U.S. tax reform that lowered rates for individuals and corporations and deregulation advanced in some economic sectors. Then, investor optimism was supplanted by several concerns. Trade tensions intensified, particularly between the U.S. and China. The U.S. threatened to impose tariffs on a broad range of imported products. Increasing interest rates and inflation also caused concern. During February 2018, the U.S. stock market endured a loss of more than 10% before recovering in March and April. The S&P 500 Index closed the first quarter with a negative return, the first negative quarterly return for the index since 2014.
The Fed increased the federal funds rate by 25 bps in March 2018 and the rate of inflation reached the Fed’s 2% target for the first time in a year. The unemployment rate fell to 4.1%. The third revision of first-quarter GDP growth by the U.S. Bureau of Economic Analysis released during June 2018 was lowered to 2.0%.
Overseas, investment market returns reversed the strong returns of 2017. After having gained 27.19% for the 12-month period that ended December 31, 2017, the MSCI ACWI ex USA Index (Net) fell 1.46% for the 7-month period that ended July 31, 2018. The U.S. dollar strengthened relative to local currencies, which served to restrain returns.
Global trade tensions escalated during the second quarter and into the third quarter of 2018.
Global trade tensions escalated as the second quarter of 2018 opened and equity markets fell in response before resuming upward momentum later in April. The U.S. government imposed tariffs on products and commodities imported from other markets in North America, Europe, and Asia. In retaliation, governments imposed tariffs on U.S. products and commodities. In addition, the U.S. pushed its North American neighbors to renegotiate the North American Free Trade Agreement, furthering trade tensions and investor uncertainty.
The CPI-U8 added 0.2% in May after a similar increase in April. On a year-over-year basis, the all-items index rose 2.8% for the 12 months that ended May 31, continuing its upward trend since the beginning of the year. The index for all items less food and energy rose 2.2% for the same 12-month period. Interest rates generally increased and the bond markets tended to decline.
During February 2018, the U.S. stock market endured a loss of more than 10% before recovering in March and April.
| | | | |
| 4 | | Wells Fargo Large Cap Core Fund | | Letter to shareholders (unaudited) |
During June 2018, the Fed increased the federal funds rate by 25 bps. Investment markets began to anticipate two more rate increases in 2018. Long-term interest rates in the U.S. trended higher—rates on the 10-year and 30-year Treasury bonds moved from 2.46% and 2.81%, respectively, on January 1, 2018, to 2.96% and 3.08%, respectively, on July 31, 2018. While higher at the end of the period, rates were off their peak levels on May 17, 2018, of 3.11% and 3.25%, respectively. Investors became more aware of and concerned about the potential for an inverted yield curve—sometimes a recession signal—as short-term rates increased more quickly than long-term rates.
The unemployment rate fell to 3.9% in July after ticking up slightly in June from May’s 3.8% level, according to the U.S. Department of Labor. The annualized rate of GDP growth for the second quarter of 2018 was reported in July to be 4.1%, the highest level since the third quarter of 2014, according to the U.S. Bureau of Economic Analysis.
Internationally, the prospects for a smooth U.K. Brexit agreement was cast into doubt as members of Prime Minister Theresa May’s negotiating team resigned. Despite the uncertainty, the period closed with expectations that the BoE’s Monetary Policy Committee in July would announce an increase in its key interest rate to 0.75%, which it did in early August.
Meanwhile, central banks in Europe and Japan maintained low interest rates and accommodative monetary policies. Amid rising trade uncertainty, PBOC monetary policies shifted with cuts to reserve requirement ratios and implementation of supportive measures such as accelerated infrastructure spending and tax cuts for small and medium enterprises and for individuals. Nevertheless, a strengthening U.S. dollar and the tensions associated with trade policies remained headwinds for investors overseas.
Don’t let short-term uncertainty derail long-term investment goals.
Periods of investment uncertainty can present challenges, but experience has taught us that maintaining long-term investment goals can be an effective way to plan for the future. To help you create a sound strategy based on your personal goals and risk tolerance, Wells Fargo Funds offers more than 100 mutual funds spanning a wide range of asset classes and investment styles. Although diversification cannot guarantee an investment profit or prevent losses, we believe it can be an effective way to manage investment risk and potentially smooth out overall portfolio performance. We encourage investors to know their investments and to understand that appropriate levels of risk-taking may unlock opportunities.
Thank you for choosing to invest with Wells Fargo Funds. We appreciate your confidence in us and remain committed to helping you meet your financial needs.
Sincerely,

Andrew Owen
President
Wells Fargo Funds
| | | | | | |
| Letter to shareholders (unaudited) | | Wells Fargo Large Cap Core Fund | | | 5 | |
Notice to shareholders
At a meeting held on August 14-15, 2018, the Board of Trustees of the Fund approved the following policy which will be effective on or about February 5, 2019:
Class C shares will convert automatically into Class A shares ten years after the initial date of purchase or, if you acquired your Class C shares through an exchange or conversion from another share class, ten years after the date you acquired your Class C shares. When Class C shares that you acquired through a purchase or exchange convert, any other Class C shares that you purchased with reinvested dividends and distributions also will convert into Class A shares on a pro rata basis. A shorter holding period may also apply depending on your intermediary. Please see “Appendix A—Sales Charge Reductions and Waivers for Certain Intermediaries” in the Fund’s prospectus or at the end of this report.
For further information about your Fund, contact your investment professional, visit our website at wellsfargofunds.com, or call us directly at 1-800-222-8222.
| | | | |
| 6 | | Wells Fargo Large Cap Core Fund | | Performance highlights (unaudited) |
Investment objective
The Fund seeks long-term capital appreciation.
Manager
Wells Fargo Funds Management, LLC
Subadviser‡
Wells Capital Management Incorporated
Portfolio managers
John R. Campbell, CFA®
Jeff C. Moser, CFA®
Average annual total returns (%) as of July 31, 20181
| | | | | | | | | | | | | | | | | | | | | | | | | | | | | | | | | | |
| | | | | Including sales charge | | | Excluding sales charge | | | Expense ratios2 (%) | |
| | | Inception date | | 1 year | | | 5 year | | | 10 year | | | 1 year | | | 5 year | | | 10 year | | | Gross | | | Net3 | |
| Class A (EGOAX) | | 12-17-2007 | | | 10.89 | | | | 11.13 | | | | 9.36 | | | | 17.66 | | | | 12.45 | | | | 10.02 | | | | 1.19 | | | | 1.08 | |
| Class C (EGOCX) | | 12-17-2007 | | | 15.78 | | | | 11.62 | | | | 9.20 | | | | 16.78 | | | | 11.62 | | | | 9.20 | | | | 1.94 | | | | 1.83 | |
| Class R (EGOHX) | | 9-30-2015 | | | – | | | | – | | | | – | | | | 17.37 | | | | 12.16 | | | | 9.75 | | | | 1.44 | | | | 1.33 | |
| Class R6 (EGORX) | | 9-30-2015 | | | – | | | | – | | | | – | | | | 18.16 | | | | 13.63 | | | | 10.81 | | | | 0.76 | | | | 0.65 | |
| Administrator Class (WFLLX) | | 7-16-2010 | | | – | | | | – | | | | – | | | | 17.81 | | | | 12.64 | | | | 10.21 | | | | 1.11 | | | | 0.97 | |
| Institutional Class (EGOIX) | | 12-17-2007 | | | – | | | | – | | | | – | | | | 18.16 | | | | 12.96 | | | | 10.49 | | | | 0.86 | | | | 0.67 | |
| S&P 500 Index4 | | – | | | – | | | | – | | | | – | | | | 16.24 | | | | 13.12 | | | | 10.67 | | | | – | | | | – | |
Figures quoted represent past performance, which is no guarantee of future results, and do not reflect taxes that a shareholder may pay on fund distributions or the redemption of fund shares. Investment return and principal value of an investment will fluctuate so that an investor’s shares, when redeemed, may be worth more or less than their original cost. Performance shown without sales charges would be lower if sales charges were reflected. Current performance may be lower or higher than the performance data quoted, which assumes the reinvestment of dividends and capital gains. Current month-end performance is available on the Fund’s website, wellsfargofunds.com.
Index returns do not include transaction costs associated with buying and selling securities, any mutual fund fees or expenses, or any taxes. It is not possible to invest directly in an index.
For Class A shares, the maximum front-end sales charge is 5.75%. For Class C shares, the maximum contingent deferred sales charge is 1.00%. Performance including a contingent deferred sales charge assumes the sales charge for the corresponding time period. Class R, Class R6, Administrator Class, and Institutional Class shares are sold without a front-end sales charge or contingent deferred sales charge.
Stock values fluctuate in response to the activities of individual companies and general market and economic conditions. Certain investment strategies tend to increase the total risk of an investment (relative to the broader market). The Fund is exposed to foreign investment risk and focused portfolio risk. Consult the Fund’s prospectus for additional information on these and other risks.
Please see footnotes on page 7.
| | | | | | |
| Performance highlights (unaudited) | | Wells Fargo Large Cap Core Fund | | | 7 | |
|
| Growth of $10,000 investment as of July 31, 20185 |
|
 |
| ‡ | Wells Capital Management Incorporated became the subadviser of the Fund on January 1, 2018. |
| 1 | Historical performance shown for Class R shares prior to their inception reflects the performance of Administrator Class shares, adjusted to reflect higher expenses applicable to Class R shares. Historical performance shown for Class R6 shares prior to their inception reflects the performance of Institutional Class shares, adjusted to reflect higher expenses applicable to Class R6 shares. Historical performance shown for Administrator Class shares prior to their inception reflects the performance of Institutional Class shares, adjusted to reflect higher expenses applicable to Administrator Class shares. Historical performance shown for all classes of the Fund prior to July 19, 2010, is based on the performance of the Fund’s predecessor, Evergreen Golden Large Cap Core Fund. |
| 2 | Reflects the expense ratios as stated in the most recent prospectuses. The expense ratios shown are subject to change and may differ from the annualized expense ratios shown in the financial highlights of this report. |
| 3 | The manager has contractually committed through November 30, 2018, to waive fees and/or reimburse expenses to the extent necessary to cap the Fund’s Total Annual Fund Operating Expenses After Fee Waivers at the amounts shown. After this time, the cap may be increased or the commitment to maintain the cap may be terminated only with the approval of the Board of Trustees. Brokerage commissions, stamp duty fees, interest, taxes, acquired fund fees and expenses (if any), and extraordinary expenses are excluded from the expense cap. Without this cap, the Fund’s returns would have been lower. The expense ratio paid by an investor is the net expense ratio (the total annual fund operating expenses after fee waivers) as stated in the prospectuses. |
| 4 | The S&P 500 Index consists of 500 stocks chosen for market size, liquidity, and industry group representation. It is a market-value weighted index with each stock’s weight in the index proportionate to its market value. You cannot invest directly in an index. |
| 5 | The chart compares the performance of Class A shares for the most recent ten years with the S&P 500 Index. The chart assumes a hypothetical investment of $10,000 in Class A shares and reflects all operating expenses and assumes the maximum initial sales charge of 5.75%. |
| 6 | The ten largest holdings, excluding cash, cash equivalents and any money market funds, are calculated based on the value of the investments divided by total net assets of the Fund. Holdings are subject to change and may have changed since the date specified. |
| 7 | Amounts are calculated based on the total long-term investments of the Fund. These amounts are subject to change and may have changed since the date specified. |
| | | | |
| 8 | | Wells Fargo Large Cap Core Fund | | Performance highlights (unaudited) |
MANAGER’S DISCUSSION
Fund highlights
| ∎ | | The Fund outperformed its benchmark, the S&P 500 Index, for the 12-month period that ended July 31, 2018. |
| ∎ | | Stock selection and sector positioning were additive to performance relative to the benchmark index. |
| ∎ | | Investments within the industrials sector detracted from performance—especially in capital goods, where holdings in Cummins Incorporated and Toro Company were affected by uneven sales trends. |
We experienced an improving economy and earnings-driven market during the period.
Accelerating economic growth and strong earnings led to rewarding overall stock performance over the past year. Earnings have been supported by a positive economic environment, reduced regulatory burdens, and corporate tax reductions. This is likely to present the opportunity for further corporate revenue growth. The markets also have been receptive to a continuation of U.S. Federal Reserve (Fed) policy where actions have been well communicated, data dependent, and in the direction of monetary normalization as the Fed gradually unwinds quantitative easing initiatives.
| | | | |
| Ten largest holdings (%) as of July 31, 20186 | |
Apple Incorporated | | | 2.78 | |
NetApp Incorporated | | | 2.68 | |
VMware Incorporated Class A | | | 2.62 | |
Centene Corporation | | | 2.54 | |
Microsoft Corporation | | | 2.52 | |
JPMorgan Chase & Company | | | 2.50 | |
Valero Energy Corporation | | | 2.50 | |
UnitedHealth Group Incorporated | | | 2.49 | |
NVIDIA Corporation | | | 2.43 | |
The Home Depot Incorporated | | | 2.39 | |
The Fund was well positioned to participate in the earnings recovery.
The Fund was overweight the two best-performing sectors in the market (information technology [IT] and consumer discretionary) and underweight the two worst-performing sectors (telecommunication services and consumer staples). Stock selection was additive overall but especially strong in IT and health care. Some of the top contributors in IT included NetApp, Incorporated, and NVIDIA Corporation, which experienced exceptional earnings growth. In health care, long-term holding Centene Corporation continued to execute profitably within the Affordable Care Act health insurance exchanges along with its other business lines.
|
| Sector distribution as of July 31, 20187 |
|
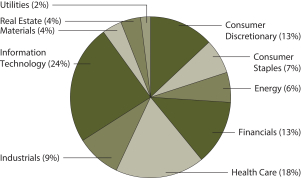 |
Investments in the industrials sector detracted, largely due to weakness in capital goods.
Stock selection suffered in industrials. Toro declined on unsteady and less-than-inspiring results from its commercial division and was sold from the Fund. Cummins also performed poorly due to unsteady results. Cummins remains in the Fund as we believe the company may participate in accelerating economic growth in the U.S., which potentially could benefit the stock based on its current valuation.
Our market outlook is favorable.
We remain positioned to potentially benefit from modest economic growth, strong corporate profit growth, and favorable fiscal policy. We believe a broadening of the
market with better participation by value stocks could benefit the portfolio. Our biggest threat continues to be a significant risk-off event triggered by an economic slowdown or a geopolitical shock where investors seek defensive and lower-beta stocks.
We believe that stocks remain somewhat expensive but supported by current fundamentals. With the significant earnings growth so far in 2018, valuation multiples have contracted. While the risk of a significant uptick in inflation seems to have lessened, the risk of geopolitical shocks has increased.
Inflation and the interest rate environment are likely to be a significant focus for investors in 2018. Geopolitical risk also has risen with trade tensions. We will focus on company fundamentals while being mindful of the evolving macroeconomic environment and its impact on the expectations for corporate earnings as well as investors’ risk appetites.
Please see footnotes on page 7.
| | | | | | |
| Fund expenses (unaudited) | | Wells Fargo Large Cap Core Fund | | | 9 | |
As a shareholder of the Fund, you incur two types of costs: (1) transaction costs, including sales charges (loads) on purchase payments and contingent deferred sales charges (if any) on redemptions and (2) ongoing costs, including management fees, distribution (12b-1) and/or shareholder servicing fees, and other Fund expenses. This example is intended to help you understand your ongoing costs (in dollars) of investing in the Fund and to compare these costs with the ongoing costs of investing in other mutual funds.
The example is based on an investment of $1,000 invested at the beginning of the six-month period and held for the entire period from February 1, 2018 to July 31, 2018.
Actual expenses
The “Actual” line of the table below provides information about actual account values and actual expenses. You may use the information in this line, together with the amount you invested, to estimate the expenses that you paid over the period. Simply divide your account value by $1,000 (for example, an $8,600 account value divided by $1,000 = 8.6), then multiply the result by the number in the “Actual” line under the heading entitled “Expenses paid during period” for your applicable class of shares to estimate the expenses you paid on your account during this period.
Hypothetical example for comparison purposes
The “Hypothetical” line of the table below provides information about hypothetical account values and hypothetical expenses based on the Fund’s actual expense ratio and an assumed rate of return of 5% per year before expenses, which is not the Fund’s actual return. The hypothetical account values and expenses may not be used to estimate the actual ending account balance or expenses you paid for the period. You may use this information to compare the ongoing costs of investing in the Fund and other funds. To do so, compare this 5% hypothetical example with the 5% hypothetical examples that appear in the shareholder reports of the other funds.
Please note that the expenses shown in the table are meant to highlight your ongoing costs only and do not reflect any transactional costs, such as sales charges (loads) and contingent deferred sales charges. Therefore, the “Hypothetical” line of the table is useful in comparing ongoing costs only and will not help you determine the relative total costs of owning different funds. In addition, if these transactional costs were included, your costs would have been higher.
| | | | | | | | | | | | | | | | |
| | | Beginning
account value
2-1-2018 | | | Ending
account value
7-31-2018 | | | Expenses
paid during
the period¹ | | | Annualized net
expense ratio | |
Class A | | | | | | | | | | | | | | | | |
Actual | | $ | 1,000.00 | | | $ | 992.85 | | | $ | 5.42 | | | | 1.08 | % |
Hypothetical (5% return before expenses) | | $ | 1,000.00 | | | $ | 1,019.76 | | | $ | 5.50 | | | | 1.08 | % |
Class C | | | | | | | | | | | | | | | | |
Actual | | $ | 1,000.00 | | | $ | 989.35 | | | $ | 9.18 | | | | 1.83 | % |
Hypothetical (5% return before expenses) | | $ | 1,000.00 | | | $ | 1,015.98 | | | $ | 9.30 | | | | 1.83 | % |
Class R | | | | | | | | | | | | | | | | |
Actual | | $ | 1,000.00 | | | $ | 991.42 | | | $ | 6.68 | | | | 1.33 | % |
Hypothetical (5% return before expenses) | | $ | 1,000.00 | | | $ | 1,018.50 | | | $ | 6.77 | | | | 1.33 | % |
Class R6 | | | | | | | | | | | | | | | | |
Actual | | $ | 1,000.00 | | | $ | 994.77 | | | $ | 3.27 | | | | 0.65 | % |
Hypothetical (5% return before expenses) | | $ | 1,000.00 | | | $ | 1,021.93 | | | $ | 3.31 | | | | 0.65 | % |
Administrator Class | | | | | | | | | | | | | | | | |
Actual | | $ | 1,000.00 | | | $ | 993.39 | | | $ | 4.87 | | | | 0.97 | % |
Hypothetical (5% return before expenses) | | $ | 1,000.00 | | | $ | 1,020.32 | | | $ | 4.94 | | | | 0.97 | % |
Institutional Class | | | | | | | | | | | | | | | | |
Actual | | $ | 1,000.00 | | | $ | 994.78 | | | $ | 3.37 | | | | 0.67 | % |
Hypothetical (5% return before expenses) | | $ | 1,000.00 | | | $ | 1,021.83 | | | $ | 3.41 | | | | 0.67 | % |
| 1 | Expenses paid is equal to the annualized net expense ratio of each class multiplied by the average account value over the period, multiplied by the number of days in the most recent fiscal half-year divided by the number of days in the fiscal year (to reflect the one-half-year period). |
| | | | |
| 10 | | Wells Fargo Large Cap Core Fund | | Portfolio of investments—July 31, 2018 |
| | | | | | | | | | | | | | | | |
| Security name | | | | | | | | Shares | | | Value | |
| | | | |
Common Stocks: 99.13% | | | | | | | | | | | | | | | | |
| | | | |
Consumer Discretionary: 12.72% | | | | | | | | | | | | | | | | |
| | | | |
| Auto Components: 2.22% | | | | | | | | | | | | | | | | |
Lear Corporation | | | | | | | | | | | 142,546 | | | $ | 25,676,811 | |
| | | | | | | | | | | | | | | | |
| | | | |
| Automobiles: 1.65% | | | | | | | | | | | | | | | | |
General Motors Company | | | | | | | | | | | 503,758 | | | | 19,097,466 | |
| | | | | | | | | | | | | | | | |
| | | | |
| Multiline Retail: 4.68% | | | | | | | | | | | | | | | | |
Macy’s Incorporated | | | | | | | | | | | 677,336 | | | | 26,910,559 | |
Target Corporation | | | | | | | | | | | 337,152 | | | | 27,201,423 | |
| | | | |
| | | | | | | | | | | | | | | 54,111,982 | |
| | | | | | | | | | | | | | | | |
| | | | |
| Specialty Retail: 4.17% | | | | | | | | | | | | | | | | |
The Home Depot Incorporated | | | | | | | | | | | 140,045 | | | | 27,661,688 | |
The TJX Companies Incorporated | | | | | | | | | | | 211,223 | | | | 20,543,549 | |
| | | | |
| | | | | | | | | | | | | | | 48,205,237 | |
| | | | | | | | | | | | | | | | |
| | | | |
Consumer Staples: 7.12% | | | | | | | | | | | | | | | | |
| | | | |
| Food & Staples Retailing: 5.84% | | | | | | | | | | | | | | | | |
Costco Wholesale Corporation | | | | | | | | | | | 118,141 | | | | 25,838,618 | |
Sysco Corporation | | | | | | | | | | | 314,853 | | | | 21,161,270 | |
Wal-Mart Stores Incorporated | | | | | | | | | | | 229,441 | | | | 20,473,020 | |
| | | | |
| | | | | | | | | | | | | | | 67,472,908 | |
| | | | | | | | | | | | | | | | |
| | | | |
| Food Products: 1.28% | | | | | | | | | | | | | | | | |
Tyson Foods Incorporated Class A | | | | | | | | | | | 257,141 | | | | 14,824,179 | |
| | | | | | | | | | | | | | | | |
| | | | |
Energy: 5.51% | | | | | | | | | | | | | | | | |
| | | | |
| Oil, Gas & Consumable Fuels: 5.51% | | | | | | | | | | | | | | | | |
Chevron Corporation | | | | | | | | | | | 152,248 | | | | 19,224,355 | |
Exxon Mobil Corporation | | | | | | | | | | | 191,370 | | | | 15,598,569 | |
Valero Energy Corporation | | | | | | | | | | | 243,748 | | | | 28,847,576 | |
| | | | |
| | | | | | | | | | | | | | | 63,670,500 | |
| | | | | | | | | | | | | | | | |
| | | | |
Financials: 13.44% | | | | | | | | | | | | | | | | |
| | | | |
| Banks: 6.25% | | | | | | | | | | | | | | | | |
Bank of America Corporation | | | | | | | | | | | 773,831 | | | | 23,895,901 | |
Citizens Financial Group Incorporated | | | | | | | | | | | 489,067 | | | | 19,455,085 | |
JPMorgan Chase & Company | | | | | | | | | | | 251,722 | | | | 28,935,444 | |
| | | | |
| | | | | | | | | | | | | | | 72,286,430 | |
| | | | | | | | | | | | | | | | |
| | | | |
| Capital Markets: 3.93% | | | | | | | | | | | | | | | | |
Evercore Partners Incorporated Class A | | | | | | | | | | | 201,914 | | | | 22,816,282 | |
Raymond James Financial Incorporated | | | | | | | | | | | 246,312 | | | | 22,559,716 | |
| | | | |
| | | | | | | | | | | | | | | 45,375,998 | |
| | | | | | | | | | | | | | | | |
The accompanying notes are an integral part of these financial statements.
| | | | | | |
| Portfolio of investments—July 31, 2018 | | Wells Fargo Large Cap Core Fund | | | 11 | |
| | | | | | | | | | | | | | | | |
| Security name | | | | | | | | Shares | | | Value | |
| | | | |
| Insurance: 3.26% | | | | | | | | | | | | | | | | |
Lincoln National Corporation | | | | | | | | | | | 284,091 | | | $ | 19,346,597 | |
Prudential Financial Incorporated | | | | | | | | | | | 181,729 | | | | 18,338,273 | |
| | | | |
| | | | | | | | | | | | | | | 37,684,870 | |
| | | | | | | | | | | | | | | | |
| | | | |
Health Care: 17.86% | | | | | | | | | | | | | | | | |
| | | | |
| Biotechnology: 3.22% | | | | | | | | | | | | | | | | |
AbbVie Incorporated | | | | | | | | | | | 190,694 | | | | 17,587,708 | |
Amgen Incorporated | | | | | | | | | | | 100,070 | | | | 19,668,759 | |
| | | | |
| | | | | | | | | | | | | | | 37,256,467 | |
| | | | | | | | | | | | | | | | |
| | | | |
| Health Care Equipment & Supplies: 4.18% | | | | | | | | | | | | | | | | |
Abbott Laboratories | | | | | | | | | | | 371,917 | | | | 24,375,440 | |
Baxter International Incorporated | | | | | | | | | | | 330,553 | | | | 23,948,565 | |
| | | | |
| | | | | | | | | | | | | | | 48,324,005 | |
| | | | | | | | | | | | | | | | |
| | | | |
| Health Care Providers & Services: 7.09% | | | | | | | | | | | | | | | | |
Aetna Incorporated | | | | | | | | | | | 126,252 | | | | 23,784,614 | |
Centene Corporation † | | | | | | | | | | | 224,894 | | | | 29,310,435 | |
UnitedHealth Group Incorporated | | | | | | | | | | | 113,835 | | | | 28,825,299 | |
| | | | |
| | | | | | | | | | | | | | | 81,920,348 | |
| | | | | | | | | | | | | | | | |
| | | | |
| Life Sciences Tools & Services: 1.68% | | | | | | | | | | | | | | | | |
Agilent Technologies Incorporated | | | | | | | | | | | 295,096 | | | | 19,488,140 | |
| | | | | | | | | | | | | | | | |
| | | | |
| Pharmaceuticals: 1.69% | | | | | | | | | | | | | | | | |
Johnson & Johnson | | | | | | | | | | | 147,381 | | | | 19,530,930 | |
| | | | | | | | | | | | | | | | |
| | | | |
Industrials: 8.84% | | | | | | | | | | | | | | | | |
| | | | |
| Aerospace & Defense: 1.72% | | | | | | | | | | | | | | | | |
Northrop Grumman Corporation | | | | | | | | | | | 65,954 | | | | 19,818,517 | |
| | | | | | | | | | | | | | | | |
| | | | |
| Air Freight & Logistics: 2.00% | | | | | | | | | | | | | | | | |
Expeditors International of Washington Incorporated | | | | | | | | | | | 303,956 | | | | 23,152,329 | |
| | | | | | | | | | | | | | | | |
| | | | |
| Construction & Engineering: 1.60% | | | | | | | | | | | | | | | | |
EMCOR Group Incorporated | | | | | | | | | | | 240,047 | | | | 18,471,617 | |
| | | | | | | | | | | | | | | | |
| | | | |
| Machinery: 1.51% | | | | | | | | | | | | | | | | |
Cummins Incorporated | | | | | | | | | | | 122,226 | | | | 17,455,095 | |
| | | | | | | | | | | | | | | | |
| | | | |
| Trading Companies & Distributors: 2.01% | | | | | | | | | | | | | | | | |
Applied Industrial Technologies Incorporated | | | | | | | | | | | 311,905 | | | | 23,283,708 | |
| | | | | | | | | | | | | | | | |
| | | | |
Information Technology: 24.18% | | | | | | | | | | | | | | | | |
| | | | |
| Communications Equipment: 1.77% | | | | | | | | | | | | | | | | |
Cisco Systems Incorporated | | | | | | | | | | | 483,488 | | | | 20,446,708 | |
| | | | | | | | | | | | | | | | |
| | | | |
| Electronic Equipment, Instruments & Components: 1.63% | | | | | | | | | | | | | | | | |
Jabil Circuit Incorporated | | | | | | | | | | | 670,160 | | | | 18,878,407 | |
| | | | | | | | | | | | | | | | |
The accompanying notes are an integral part of these financial statements.
| | | | |
| 12 | | Wells Fargo Large Cap Core Fund | | Portfolio of investments—July 31, 2018 |
| | | | | | | | | | | | | | | | |
| Security name | | | | | | | | Shares | | | Value | |
| | | | |
| Internet Software & Services: 2.14% | | | | | | | | | | | | | | | | |
Alphabet Incorporated Class C † | | | | | | | | | | | 20,339 | | | $ | 24,757,851 | |
| | | | | | | | | | | | | | | | |
| | | | |
| Semiconductors & Semiconductor Equipment: 6.09% | | | | | | | | | | | | | | | | |
Intel Corporation | | | | | | | | | | | 437,013 | | | | 21,020,325 | |
NVIDIA Corporation | | | | | | | | | | | 114,545 | | | | 28,047,489 | |
ON Semiconductor Corporation † | | | | | | | | | | | 966,452 | | | | 21,310,267 | |
| | | | |
| | | | | | | | | | | | | | | 70,378,081 | |
| | | | | | | | | | | | | | | | |
| | | | |
| Software: 5.14% | | | | | | | | | | | | | | | | |
Microsoft Corporation | | | | | | | | | | | 274,753 | | | | 29,145,798 | |
VMware Incorporated Class A † | | | | | | | | | | | 209,267 | | | | 30,257,916 | |
| | | | |
| | | | | | | | | | | | | | | 59,403,714 | |
| | | | | | | | | | | | | | | | |
| | | | |
| Technology Hardware, Storage & Peripherals: 7.41% | | | | | | | | | | | | | | | | |
Apple Incorporated | | | | | | | | | | | 168,643 | | | | 32,091,076 | |
HP Incorporated | | | | | | | | | | | 977,824 | | | | 22,568,178 | |
NetApp Incorporated | | | | | | | | | | | 399,558 | | | | 30,973,735 | |
| | | | |
| | | | | | | | | | | | | | | 85,632,989 | |
| | | | | | | | | | | | | | | | |
| | | | |
Materials: 4.28% | | | | | | | | | | | | | | | | |
| | | | |
| Chemicals: 2.03% | | | | | | | | | | | | | | | | |
Huntsman Corporation | | | | | | | | | | | 698,869 | | | | 23,433,078 | |
| | | | | | | | | | | | | | | | |
| | | | |
| Containers & Packaging: 2.25% | | | | | | | | | | | | | | | | |
Avery Dennison Corporation | | | | | | | | | | | 227,210 | | | | 26,056,443 | |
| | | | | | | | | | | | | | | | |
| | | | |
Real Estate: 3.58% | | | | | | | | | | | | | | | | |
| | | | |
| Equity REITs: 3.58% | | | | | | | | | | | | | | | | |
American Tower Corporation | | | | | | | | | | | 143,424 | | | | 21,261,174 | |
Prologis Incorporated | | | | | | | | | | | 306,867 | | | | 20,136,613 | |
| | | | |
| | | | | | | | | | | | | | | 41,397,787 | |
| | | | | | | | | | | | | | | | |
| | | | |
Utilities: 1.60% | | | | | | | | | | | | | | | | |
| | | | |
| Multi-Utilities: 1.60% | | | | | | | | | | | | | | | | |
CenterPoint Energy Incorporated | | | | | | | | | | | 651,024 | | | | 18,541,164 | |
| | | | | | | | | | | | | | | | |
| | | | |
Total Common Stocks (Cost $830,021,690) | | | | | | | | | | | | | | | 1,146,033,759 | |
| | | | | | | | | | | | | | | | |
| | | | |
| | | Yield | | | | | | | | | | |
| Short-Term Investments: 0.87% | | | | | | | | | | | | | | | | |
| | | | |
| Investment Companies: 0.87% | | | | | | | | | | | | | | | | |
Wells Fargo Government Money Market Fund Select Class (l)(u) | | | 1.83 | % | | | | | | | 10,016,109 | | | | 10,016,109 | |
| | | | | | | | | | | | | | | | |
| | | | |
Total Short-Term Investments (Cost $10,016,109) | | | | | | | | | | | | | | | 10,016,109 | |
| | | | | | | | | | | | | | | | |
| | | | | | | | |
| Total investments in securities (Cost $840,037,799) | | | 100.00 | % | | | 1,156,049,868 | |
Other assets and liabilities, net | | | 0.00 | | | | (18,359 | ) |
| | | | | | | | |
| Total net assets | | | 100.00 | % | | $ | 1,156,031,509 | |
| | | | | | | | |
The accompanying notes are an integral part of these financial statements.
| | | | | | |
| Portfolio of investments—July 31, 2018 | | Wells Fargo Large Cap Core Fund | | | 13 | |
| † | Non-income-earning security |
| (l) | The issuer of the security is an affiliated person of the Fund as defined in the Investment Company Act of 1940. |
| (u) | The rate represents the 7-day annualized yield at period end. |
Abbreviations:
| REIT | Real estate investment trust |
Investments in Affiliates
An affiliated investment is an investment in which the Fund owns at least 5% of the outstanding voting shares of the issuer or as a result of other relationships, such as the Fund and the issuer having the same investment manager. Transactions with issuers that were either affiliated persons of the Fund at the beginning of the period or the end of the period were as follows:
| | | | | | | | | | | | | | | | | | | | | | | | | | | | | | | | | | | | |
| | | Shares,
beginning of
period | | | Shares
purchased | | | Shares
sold | | | Shares,
end of
period | | | Net
realized
gains
(losses) | | | Net
change in
unrealized
gains
(losses) | | | Income
from
affiliated
securities | | | Value,
end
of period | | | % of
net
assets | |
Short-Term Investments | | | | | | | | | | | | | | | | | | | | | | | | | | | | | | | | | | | | |
Investment Companies | | | | | | | | | | | | | | | | | | | | | | | | | | | | | | | | | | | | |
Securities Lending Cash Investment LLC * | | | 19,847,049 | | | | 225,975,484 | | | | 245,822,533 | | | | 0 | | | $ | 0 | | | $ | 0 | | | $ | 122,282 | | | $ | 0 | | | | | |
Wells Fargo Government Money Market Fund Select Class | | | 7,987,308 | | | | 105,679,249 | | | | 103,650,448 | | | | 10,016,109 | | | | 0 | | | | 0 | | | | 127,010 | | | | 10,016,109 | | | | | |
| | | | | | | | | | | | | | | | | | | | | | | | | | | | | | | | | | | | |
| | | | | | | | | | | | | | | | | | $ | 0 | | | $ | 0 | | | $ | 249,292 | | | $ | 10,016,109 | | | | 0.87 | % |
| | | | | | | | | | | | | | | | | | | | | | | | | | | | | | | | | | | | |
| | * | No longer held at the end of the period. |
The accompanying notes are an integral part of these financial statements.
| | | | |
| 14 | | Wells Fargo Large Cap Core Fund | | Statement of assets and liabilities—July 31, 2018 |
| | | | |
| | | | |
| |
Assets | | | | |
Investments in unaffiliated securities, at value (cost $830,021,690) | | $ | 1,146,033,759 | |
Investments in affiliated securities, at value (cost $10,016,109) | | | 10,016,109 | |
Receivable for Fund shares sold | | | 972,695 | |
Receivable for dividends | | | 591,883 | |
Receivable for securities lending income | | | 4,550 | |
Prepaid expenses and other assets | | | 28,522 | |
| | | | |
Total assets | | | 1,157,647,518 | |
| | | | |
| |
Liabilities | | | | |
Payable for Fund shares redeemed | | | 894,650 | |
Management fee payable | | | 521,068 | |
Administration fees payable | | | 153,876 | |
Distribution fees payable | | | 39,534 | |
Trustees’ fees and expenses payable | | | 1,549 | |
Accrued expenses and other liabilities | | | 5,332 | |
| | | | |
Total liabilities | | | 1,616,009 | |
| | | | |
Total net assets | | $ | 1,156,031,509 | |
| | | | |
| |
NET ASSETS CONSIST OF | | | | |
Paid-in capital | | $ | 752,543,474 | |
Undistributed net investment income | | | 5,856,737 | |
Accumulated net realized gains on investments | | | 81,619,229 | |
Net unrealized gains on investments | | | 316,012,069 | |
| | | | |
Total net assets | | $ | 1,156,031,509 | |
| | | | |
| |
COMPUTATION OF NET ASSET VALUE AND OFFERING PRICE PER SHARE | | | | |
Net assets – Class A | | $ | 360,936,573 | |
Shares outstanding – Class A1 | | | 17,337,053 | |
Net asset value per share – Class A | | | $20.82 | |
Maximum offering price per share – Class A2 | | | $22.09 | |
Net assets – Class C | | $ | 61,528,850 | |
Shares outstanding – Class C1 | | | 3,010,749 | |
Net asset value per share – Class C | | | $20.44 | |
Net assets – Class R | | $ | 2,042,371 | |
Shares outstanding – Class R1 | | | 98,124 | |
Net asset value per share – Class R | | | $20.81 | |
Net assets – Class R6 | | $ | 15,225,079 | |
Shares outstanding – Class R61 | | | 727,661 | |
Net asset value per share – Class R6 | | | $20.92 | |
Net assets – Administrator Class | | $ | 25,443,970 | |
Shares outstanding – Administrator Class1 | | | 1,208,798 | |
Net asset value per share – Administrator Class | | | $21.05 | |
Net assets – Institutional Class | | $ | 690,854,666 | |
Shares outstanding – Institutional Class1 | | | 32,972,225 | |
Net asset value per share – Institutional Class | | | $20.95 | |
| 1 | The Fund has an unlimited number of authorized shares. |
| 2 | Maximum offering price is computed as 100/94.25 of net asset value. On investments of $50,000 or more, the offering price is reduced. |
The accompanying notes are an integral part of these financial statements.
| | | | | | |
| Statement of operations—year ended July 31, 2018 | | Wells Fargo Large Cap Core Fund | | | 15 | |
| | | | |
| | | | |
| |
Investment income | | | | |
Dividends | | $ | 20,071,623 | |
Income from affiliated securities | | | 249,292 | |
| | | | |
Total investment income | | | 20,320,915 | |
| | | | |
| |
Expenses | | | | |
Management fee | | | 7,599,675 | |
Administration fees | | | | |
Class A | | | 734,829 | |
Class C | | | 130,146 | |
Class R | | | 3,793 | |
Class R6 | | | 1,363 | |
Administrator Class | | | 41,015 | |
Institutional Class | | | 860,205 | |
Shareholder servicing fees | | | | |
Class A | | | 874,797 | |
Class C | | | 154,935 | |
Class R | | | 4,515 | |
Administrator Class | | | 78,874 | |
Distribution fees | | | | |
Class C | | | 464,806 | |
Class R | | | 4,515 | |
Custody and accounting fees | | | 37,467 | |
Professional fees | | | 46,596 | |
Registration fees | | | 130,622 | |
Shareholder report expenses | | | 141,459 | |
Trustees’ fees and expenses | | | 23,298 | |
Other fees and expenses | | | 22,589 | |
| | | | |
Total expenses | | | 11,355,499 | |
Less: Fee waivers and/or expense reimbursements | | | (1,502,761 | ) |
| | | | |
Net expenses | | | 9,852,738 | |
| | | | |
Net investment income | | | 10,468,177 | |
| | | | |
| |
REALIZED AND UNREALIZED GAINS (LOSSES) ON INVESTMENTS | | | | |
Net realized gains on investments | | | 93,764,997 | |
Net change in unrealized gains (losses) on investments | | | 76,367,116 | |
| | | | |
Net realized and unrealized gains (losses) on investments | | | 170,132,113 | |
| | | | |
Net increase in net assets resulting from operations | | $ | 180,600,290 | |
| | | | |
The accompanying notes are an integral part of these financial statements.
| | | | |
| 16 | | Wells Fargo Large Cap Core Fund | | Statement of changes in net assets |
| | | | | | | | | | | | | | | | |
| | | Year ended
July 31, 2018 | | | Year ended
July 31, 2017 | |
| | | |
Operations | | | | | | | | | | | | |
Net investment income | | | | | | $ | 10,468,177 | | | | | | | $ | 10,460,847 | |
Net realized gains on investments | | | | | | | 93,764,997 | | | | | | | | 51,027,002 | |
Net change in unrealized gains (losses) on investments | | | | | | | 76,367,116 | | | | | | | | 125,930,322 | |
| | | | |
Net increase in net assets resulting from operations | | | | | | | 180,600,290 | | | | | | | | 187,418,171 | |
| | | | |
| | | |
Distributions to shareholders from | | | | | | | | | | | | |
Net investment income | | | | | | | | | | | | | | | | |
Class A | | | | | | | (2,344,339 | ) | | | | | | | (2,565,745 | ) |
Class R | | | | | | | (8,939 | ) | | | | | | | (172 | ) |
Class R6 | | | | | | | (6,623 | ) | | | | | | | (1,269 | ) |
Administrator Class | | | | | | | (275,902 | ) | | | | | | | (3,812 | ) |
Institutional Class | | | | | | | (7,110,676 | ) | | | | | | | (7,464,521 | ) |
Net realized gains | | | | | | | | | | | | | | | | |
Class A | | | | | | | (3,861,410 | ) | | | | | | | 0 | |
Class C | | | | | | | (697,513 | ) | | | | | | | 0 | |
Class R | | | | | | | (15,405 | ) | | | | | | | 0 | |
Class R6 | | | | | | | (6,840 | ) | | | | | | | 0 | |
Administrator Class | | | | | | | (370,395 | ) | | | | | | | 0 | |
Institutional Class | | | | | | | (7,219,501 | ) | | | | | | | 0 | |
| | | | |
Total distributions to shareholders | | | | | | | (21,917,543 | ) | | | | | | | (10,035,519 | ) |
| | | | |
| | | | |
Capital share transactions | | | Shares | | | | | | | | Shares | | | | | |
Proceeds from shares sold | | | | | | | | | | | | | | | | |
Class A | | | 1,110,773 | | | | 22,158,115 | | | | 1,356,533 | | | | 22,414,439 | |
Class C | | | 379,357 | | | | 7,444,081 | | | | 498,889 | | | | 8,120,255 | |
Class R | | | 64,450 | | | | 1,271,370 | | | | 75,652 | | | | 1,314,056 | |
Class R6 | | | 768,314 | | | | 15,462,838 | | | | 7,956 | | | | 134,824 | |
Administrator Class | | | 183,497 | | | | 3,604,364 | | | | 1,481,988 | | | | 25,548,238 | |
Institutional Class | | | 7,081,551 | | | | 141,445,213 | | | | 23,412,722 | | | | 371,792,237 | |
| | | | |
| | | | | | | 191,385,981 | | | | | | | | 429,324,049 | |
| | | | |
Reinvestment of distributions | | | | | | | | | | | | | | | | |
Class A | | | 301,834 | | | | 5,924,919 | | | | 149,877 | | | | 2,451,983 | |
Class C | | | 30,164 | | | | 580,958 | | | | 0 | | | | 0 | |
Class R | | | 1,208 | | | | 23,747 | | | | 10 | | | | 172 | |
Class R6 | | | 644 | | | | 12,693 | | | | 77 | | | | 1,269 | |
Administrator Class | | | 31,853 | | | | 632,062 | | | | 230 | | | | 3,794 | |
Institutional Class | | | 658,543 | | | | 12,996,677 | | | | 405,841 | | | | 6,663,907 | |
| | | | |
| | | | | | | 20,171,056 | | | | | | | | 9,121,125 | |
| | | | |
Payment for shares redeemed | | | | | | | | | | | | | | | | |
Class A | | | (2,398,895 | ) | | | (47,209,115 | ) | | | (6,971,518 | ) | | | (112,765,238 | ) |
Class C | | | (828,652 | ) | | | (16,059,336 | ) | | | (1,878,343 | ) | | | (29,564,534 | ) |
Class R | | | (43,438 | ) | | | (851,162 | ) | | | (1,487 | ) | | | (25,647 | ) |
Class R6 | | | (48,034 | ) | | | (992,474 | ) | | | (162,028 | ) | | | (2,459,889 | ) |
Administrator Class | | | (768,837 | ) | | | (15,531,475 | ) | | | (3,533,468 | ) | | | (56,128,061 | ) |
Institutional Class | | | (9,084,266 | ) | | | (179,681,555 | ) | | | (16,596,815 | ) | | | (273,283,736 | ) |
| | | | |
| | | | | | | (260,325,117 | ) | | | | | | | (474,227,105 | ) |
| | | | |
Net decrease in net assets resulting from capital share transactions | | | | | | | (48,768,080 | ) | | | | | | | (35,781,931 | ) |
| | | | |
Total increase in net assets | | | | | | | 109,914,667 | | | | | | | | 141,600,721 | |
| | | | |
| | |
Net assets | | | | | | | | |
Beginning of period | | | | | | | 1,046,116,842 | | | | | | | | 904,516,121 | |
| | | | |
End of period | | | | | | $ | 1,156,031,509 | | | | | | | $ | 1,046,116,842 | |
| | | | |
Undistributed net investment income | | | | | | $ | 5,856,737 | | | | | | | $ | 5,135,039 | |
| | | | |
The accompanying notes are an integral part of these financial statements.
| | | | | | |
| Financial highlights | | Wells Fargo Large Cap Core Fund | | | 17 | |
(For a share outstanding throughout each period)
| | | | | | | | | | | | | | | | | | | | |
| | | Year ended July 31 | |
| CLASS A | | 2018 | | | 2017 | | | 2016 | | | 2015 | | | 2014 | |
Net asset value, beginning of period | | | $18.01 | | | | $15.13 | | | | $15.81 | | | | $14.30 | | | | $12.13 | |
Net investment income | | | 0.15 | | | | 0.15 | | | | 0.10 | | | | 0.06 | | | | 0.06 | 1 |
Net realized and unrealized gains (losses) on investments | | | 3.01 | | | | 2.85 | | | | (0.60 | ) | | | 1.50 | | | | 2.20 | |
| | | | | | | | | | | | | | | | | | | | |
Total from investment operations | | | 3.16 | | | | 3.00 | | | | (0.50 | ) | | | 1.56 | | | | 2.26 | |
Distributions to shareholders from | | | | | | | | | | | | | | | | | | | | |
Net investment income | | | (0.13 | ) | | | (0.12 | ) | | | (0.05 | ) | | | (0.05 | ) | | | (0.09 | ) |
Net realized gains | | | (0.22 | ) | | | 0.00 | | | | (0.13 | ) | | | 0.00 | | | | 0.00 | |
| | | | | | | | | | | | | | | | | | | | |
Total distributions to shareholders | | | (0.35 | ) | | | (0.12 | ) | | | (0.18 | ) | | | (0.05 | ) | | | (0.09 | ) |
Net asset value, end of period | | | $20.82 | | | | $18.01 | | | | $15.13 | | | | $15.81 | | | | $14.30 | |
Total return2 | | | 17.66 | % | | | 19.94 | % | | | (3.18 | )% | | | 10.99 | % | | | 18.58 | % |
Ratios to average net assets (annualized) | | | | | | | | | | | | | | | | | | | | |
Gross expenses | | | 1.18 | % | | | 1.19 | % | | | 1.20 | % | | | 1.26 | % | | | 1.29 | % |
Net expenses | | | 1.10 | % | | | 1.14 | % | | | 1.14 | % | | | 1.14 | % | | | 1.14 | % |
Net investment income | | | 0.73 | % | | | 0.82 | % | | | 0.80 | % | | | 0.35 | % | | | 0.47 | % |
Supplemental data | | | | | | | | | | | | | | | | | | | | |
Portfolio turnover rate | | | 33 | % | | | 50 | % | | | 51 | % | | | 44 | % | | | 61 | % |
Net assets, end of period (000s omitted) | | | $360,937 | | | | $329,974 | | | | $359,971 | | | | $97,041 | | | | $26,685 | |
| 1 | Calculated based upon average shares outstanding |
| 2 | Total return calculations do not include any sales charges. |
The accompanying notes are an integral part of these financial statements.
| | | | |
| 18 | | Wells Fargo Large Cap Core Fund | | Financial highlights |
(For a share outstanding throughout each period)
| | | | | | | | | | | | | | | | | | | | |
| | | Year ended July 31 | |
| CLASS C | | 2018 | | | 2017 | | | 2016 | | | 2015 | | | 2014 | |
Net asset value, beginning of period | | | $17.70 | | | | $14.87 | | | | $15.61 | | | | $14.17 | | | | $12.05 | |
Net investment income (loss) | | | (0.00 | )1 | | | 0.00 | 2 | | | 0.00 | 2,3 | | | (0.06 | )3 | | | (0.01 | ) |
Net realized and unrealized gains (losses) on investments | | | 2.96 | | | | 2.83 | | | | (0.61 | ) | | | 1.50 | | | | 2.15 | |
| | | | | | | | | | | | | | | | | | | | |
Total from investment operations | | | 2.96 | | | | 2.83 | | | | (0.61 | ) | | | 1.44 | | | | 2.14 | |
Distributions to shareholders from | | | | | | | | | | | | | | | | | | | | |
Net investment income | | | 0.00 | | | | 0.00 | | | | 0.00 | | | | 0.00 | | | | (0.02 | ) |
Net realized gains | | | (0.22 | ) | | | 0.00 | | | | (0.13 | ) | | | 0.00 | | | | 0.00 | |
| | | | | | | | | | | | | | | | | | | | |
Total distributions to shareholders | | | (0.22 | ) | | | 0.00 | | | | (0.13 | ) | | | 0.00 | | | | (0.02 | ) |
Net asset value, end of period | | | $20.44 | | | | $17.70 | | | | $14.87 | | | | $15.61 | | | | $14.17 | |
Total return4 | | | 16.78 | % | | | 19.03 | % | | | (3.90 | )% | | | 10.16 | % | | | 17.73 | % |
Ratios to average net assets (annualized) | | | | | | | | | | | | | | | | | | | | |
Gross expenses | | | 1.93 | % | | | 1.94 | % | | | 1.95 | % | | | 2.01 | % | | | 2.04 | % |
Net expenses | | | 1.85 | % | | | 1.89 | % | | | 1.89 | % | | | 1.89 | % | | | 1.89 | % |
Net investment income (loss) | | | (0.02 | )% | | | 0.07 | % | | | 0.02 | % | | | (0.38 | )% | | | (0.30 | )% |
Supplemental data | | | | | | | | | | | | | | | | | | | | |
Portfolio turnover rate | | | 33 | % | | | 50 | % | | | 51 | % | | | 44 | % | | | 61 | % |
Net assets, end of period (000s omitted) | | | $61,529 | | | | $60,697 | | | | $71,512 | | | | $53,076 | | | | $8,624 | |
| 1 | Amount is more than $(0.005). |
| 2 | Amount is less than $0.005. |
| 3 | Calculated based upon average shares outstanding |
| 4 | Total return calculations do not include any sales charges. |
The accompanying notes are an integral part of these financial statements.
| | | | | | |
| Financial highlights | | Wells Fargo Large Cap Core Fund | | | 19 | |
(For a share outstanding throughout each period)
| | | | | | | | | | | | |
| | | Year ended July 31 | |
| CLASS R | | 2018 | | | 2017 | | | 20161 | |
Net asset value, beginning of period | | | $18.04 | | | | $15.17 | | | | $14.66 | |
Net investment income | | | 0.12 | | | | 0.13 | | | | 0.06 | |
Net realized and unrealized gains (losses) on investments | | | 2.99 | | | | 2.84 | | | | 0.66 | |
| | | | | | | | | | | | |
Total from investment operations | | | 3.11 | | | | 2.97 | | | | 0.72 | |
Distributions to shareholders from | | | | | | | | | | | | |
Net investment income | | | (0.12 | ) | | | (0.10 | ) | | | (0.08 | ) |
Net realized gains | | | (0.22 | ) | | | 0.00 | | | | (0.13 | ) |
| | | | | | | | | | | | |
Total distributions to shareholders | | | (0.34 | ) | | | (0.10 | ) | | | (0.21 | ) |
Net asset value, end of period | | | $20.81 | | | | $18.04 | | | | $15.17 | |
Total return2 | | | 17.37 | % | | | 19.64 | % | | | 4.90 | % |
Ratios to average net assets (annualized) | | | | | | | | | | | | |
Gross expenses | | | 1.43 | % | | | 1.44 | % | | | 1.46 | % |
Net expenses | | | 1.34 | % | | | 1.39 | % | | | 1.39 | % |
Net investment income | | | 0.48 | % | | | 0.51 | % | | | 0.52 | % |
Supplemental data | | | | | | | | | | | | |
Portfolio turnover rate | | | 33 | % | | | 50 | % | | | 51 | % |
Net assets, end of period (000s omitted) | | | $2,042 | | | | $1,369 | | | | $26 | |
| 1 | For the period from September 30, 2015 (commencement of class operations) to July 31, 2016 |
| 2 | Returns for periods of less than one year are not annualized. |
The accompanying notes are an integral part of these financial statements.
| | | | |
| 20 | | Wells Fargo Large Cap Core Fund | | Financial highlights |
(For a share outstanding throughout each period)
| | | | | | | | | | | | |
| | | Year ended July 31 | |
| CLASS R6 | | 2018 | | | 2017 | | | 20161 | |
Net asset value, beginning of period | | | $18.09 | | | | $15.24 | | | | $14.66 | |
Net investment income | | | 0.22 | 2 | | | 0.25 | 2 | | | 0.20 | |
Net realized and unrealized gains (losses) on investments | | | 3.04 | | | | 3.33 | | | | 0.62 | |
| | | | | | | | | | | | |
Total from investment operations | | | 3.26 | | | | 3.58 | | | | 0.82 | |
Distributions to shareholders from | | | | | | | | | | | | |
Net investment income | | | (0.21 | ) | | | (0.73 | ) | | | (0.11 | ) |
Net realized gains | | | (0.22 | ) | | | 0.00 | | | | (0.13 | ) |
| | | | | | | | | | | | |
Total distributions to shareholders | | | (0.43 | ) | | | (0.73 | ) | | | (0.24 | ) |
Net asset value, end of period | | | $20.92 | | | | $18.09 | | | | $15.24 | |
Total return3 | | | 18.16 | % | | | 24.01 | % | | | 5.57 | % |
Ratios to average net assets (annualized) | | | | | | | | | | | | |
Gross expenses | | | 0.75 | % | | | 0.76 | % | | | 0.77 | % |
Net expenses | | | 0.65 | % | | | 0.68 | % | | | 0.68 | % |
Net investment income | | | 1.08 | % | | | 1.62 | % | | | 1.31 | % |
Supplemental data | | | | | | | | | | | | |
Portfolio turnover rate | | | 33 | % | | | 50 | % | | | 51 | % |
Net assets, end of period (000s omitted) | | | $15,225 | | | | $122 | | | | $2,449 | |
| 1 | For the period from September 30, 2015 (commencement of class operations) to July 31, 2016 |
| 2 | Calculated based upon average shares outstanding |
| 3 | Returns for periods of less than one year are not annualized. |
The accompanying notes are an integral part of these financial statements.
| | | | | | |
| Financial highlights | | Wells Fargo Large Cap Core Fund | | | 21 | |
(For a share outstanding throughout each period)
| | | | | | | | | | | | | | | | | | | | |
| | | Year ended July 31 | |
| ADMINISTRATOR CLASS | | 2018 | | | 2017 | | | 2016 | | | 2015 | | | 2014 | |
Net asset value, beginning of period | | | $18.21 | | | | $15.18 | | | | $15.87 | | | | $14.34 | | | | $12.16 | |
Net investment income | | | 0.17 | 1 | | | 0.16 | 1 | | | 0.15 | | | | 0.10 | | | | 0.09 | |
Net realized and unrealized gains (losses) on investments | | | 3.05 | | | | 2.87 | | | | (0.62 | ) | | | 1.50 | | | | 2.20 | |
| | | | | | | | | | | | | | | | | | | | |
Total from investment operations | | | 3.22 | | | | 3.03 | | | | (0.47 | ) | | | 1.60 | | | | 2.29 | |
Distributions to shareholders from | | | | | | | | | | | | | | | | | | | | |
Net investment income | | | (0.16 | ) | | | (0.00 | )2 | | | (0.09 | ) | | | (0.07 | ) | | | (0.11 | ) |
Net realized gains | | | (0.22 | ) | | | 0.00 | | | | (0.13 | ) | | | 0.00 | | | | 0.00 | |
| | | | | | | | | | | | | | | | | | | | |
Total distributions to shareholders | | | (0.38 | ) | | | (0.00 | )2 | | | (0.22 | ) | | | (0.07 | ) | | | (0.11 | ) |
Net asset value, end of period | | | $21.05 | | | | $18.21 | | | | $15.18 | | | | $15.87 | | | | $14.34 | |
Total return | | | 17.81 | % | | | 19.99 | % | | | (2.98 | )% | | | 11.28 | % | | | 18.83 | % |
Ratios to average net assets (annualized) | | | | | | | | | | | | | | | | | | | | |
Gross expenses | | | 1.10 | % | | | 1.10 | % | | | 1.12 | % | | | 1.11 | % | | | 1.11 | % |
Net expenses | | | 0.98 | % | | | 1.00 | % | | | 0.96 | % | | | 0.90 | % | | | 0.90 | % |
Net investment income | | | 0.86 | % | | | 1.00 | % | | | 0.95 | % | | | 0.61 | % | | | 0.63 | % |
Supplemental data | | | | | | | | | | | | | | | | | | | | |
Portfolio turnover rate | | | 33 | % | | | 50 | % | | | 51 | % | | | 44 | % | | | 61 | % |
Net assets, end of period (000s omitted) | | | $25,444 | | | | $32,091 | | | | $57,879 | | | | $83,692 | | | | $6,849 | |
| 1 | Calculated based upon average shares outstanding |
| 2 | Amount is less than $0.005. |
The accompanying notes are an integral part of these financial statements.
| | | | |
| 22 | | Wells Fargo Large Cap Core Fund | | Financial highlights |
(For a share outstanding throughout each period)
| | | | | | | | | | | | | | | | | | | | |
| | | Year ended July 31 | |
| INSTITUTIONAL CLASS | | 2018 | | | 2017 | | | 2016 | | | 2015 | | | 2014 | |
Net asset value, beginning of period | | | $18.12 | | | | $15.23 | | | | $15.91 | | | | $14.35 | | | | $12.16 | |
Net investment income | | | 0.23 | | | | 0.18 | | | | 0.18 | 1 | | | 0.14 | 1 | | | 0.11 | 1 |
Net realized and unrealized gains (losses) on investments | | | 3.03 | | | | 2.91 | | | | (0.62 | ) | | | 1.50 | | | | 2.21 | |
| | | | | | | | | | | | | | | | | | | | |
Total from investment operations | | | 3.26 | | | | 3.09 | | | | (0.44 | ) | | | 1.64 | | | | 2.32 | |
Distributions to shareholders from | | | | | | | | | | | | | | | | | | | | |
Net investment income | | | (0.21 | ) | | | (0.20 | ) | | | (0.11 | ) | | | (0.08 | ) | | | (0.13 | ) |
Net realized gains | | | (0.22 | ) | | | 0.00 | | | | (0.13 | ) | | | 0.00 | | | | 0.00 | |
| | | | | | | | | | | | | | | | | | | | |
Total distributions to shareholders | | | (0.43 | ) | | | (0.20 | ) | | | (0.24 | ) | | | (0.08 | ) | | | (0.13 | ) |
Net asset value, end of period | | | $20.95 | | | | $18.12 | | | | $15.23 | | | | $15.91 | | | | $14.35 | |
Total return | | | 18.16 | % | | | 20.43 | % | | | (2.75 | )% | | | 11.51 | % | | | 19.21 | % |
Ratios to average net assets (annualized) | | | | | | | | | | | | | | | | | | | | |
Gross expenses | | | 0.85 | % | | | 0.86 | % | | | 0.87 | % | | | 0.84 | % | | | 0.85 | % |
Net expenses | | | 0.68 | % | | | 0.70 | % | | | 0.70 | % | | | 0.66 | % | | | 0.66 | % |
Net investment income | | | 1.15 | % | | | 1.23 | % | | | 1.22 | % | | | 0.86 | % | | | 0.83 | % |
Supplemental data | | | | | | | | | | | | | | | | | | | | |
Portfolio turnover rate | | | 33 | % | | | 50 | % | | | 51 | % | | | 44 | % | | | 61 | % |
Net assets, end of period (000s omitted) | | | $690,855 | | | | $621,864 | | | | $412,678 | | | | $63,235 | | | | $5,775 | |
| 1 | Calculated based upon average shares outstanding |
The accompanying notes are an integral part of these financial statements.
| | | | | | |
| Notes to financial statements | | Wells Fargo Large Cap Core Fund | | | 23 | |
1. ORGANIZATION
Wells Fargo Funds Trust (the “Trust”), a Delaware statutory trust organized on March 10, 1999, is an open-end management investment company registered under the Investment Company Act of 1940, as amended (the “1940 Act”). As an investment company, the Trust follows the accounting and reporting guidance in Financial Accounting Standards Board Accounting Standards Codification Topic 946, Financial Services – Investment Companies. These financial statements report on the Wells Fargo Large Cap Core Fund (the “Fund”) which is a diversified series of the Trust.
2. SIGNIFICANT ACCOUNTING POLICIES
The following significant accounting policies, which are consistently followed in the preparation of the financial statements of the Fund, are in conformity with U.S. generally accepted accounting principles which require management to make estimates and assumptions that affect the reported amounts of assets and liabilities, disclosure of contingent assets and liabilities at the date of the financial statements, and the reported amounts of revenues and expenses during the reporting period. Actual results could differ from those estimates.
Securities valuation
All investments are valued each business day as of the close of regular trading on the New York Stock Exchange (generally 4 p.m. Eastern Time), although the Fund may deviate from this calculation time under unusual or unexpected circumstances.
Equity securities that are listed on a foreign or domestic exchange or market are valued at the official closing price or, if none, the last sales price. If no sale occurs on the principal exchange or market that day, a fair value price will be determined in accordance with the Fund’s Valuation Procedures.
Investments in registered open-end investment companies are valued at net asset value. Interests in non-registered investment companies that are redeemable at net asset value are fair valued normally at net asset value.
Investments which are not valued using any of the methods discussed above are valued at their fair value, as determined in good faith by the Board of Trustees of the Fund. The Board of Trustees has established a Valuation Committee comprised of the Trustees and has delegated to it the authority to take any actions regarding the valuation of portfolio securities that the Valuation Committee deems necessary or appropriate, including determining the fair value of portfolio securities, unless the determination has been delegated to the Wells Fargo Asset Management Pricing Committee at Wells Fargo Funds Management, LLC (“Funds Management”). The Board of Trustees retains the authority to make or ratify any valuation decisions or approve any changes to the Valuation Procedures as it deems appropriate. On a quarterly basis, the Board of Trustees receives reports on any valuation actions taken by the Valuation Committee or the Wells Fargo Asset Management Pricing Committee which may include items for ratification.
Valuations of fair valued securities are compared to the next actual sales price when available, or other appropriate market values, to assess the continued appropriateness of the fair valuation methodologies used. These securities are fair valued on a day-to-day basis, taking into consideration changes to appropriate market information and any significant changes to the inputs considered in the valuation process until there is a readily available price provided on an exchange or by an independent pricing service. Valuations received from an independent pricing service or independent broker-dealer quotes are periodically validated by comparisons to most recent trades and valuations provided by other independent pricing services in addition to the review of prices by the manager and/or subadviser. Unobservable inputs used in determining fair valuations are identified based on the type of security, taking into consideration factors utilized by market participants in valuing the investment, knowledge about the issuer and the current market environment.
Securities lending
The Fund may lend its securities from time to time in order to earn additional income in the form of fees or interest on securities received as collateral or the investment of any cash received as collateral. The Fund continues to receive interest or dividends on the securities loaned. The Fund receives collateral in the form of cash or securities with a value at least equal to the value of the securities on loan. The value of the loaned securities is determined at the close of each business day and any additional required collateral is delivered to the Fund on the next business day. In a securities lending transaction, the net asset value of the Fund will be affected by an increase or decrease in the value of the securities loaned and by an increase or decrease in the value of the instrument in which collateral is invested. The amount of securities lending activity undertaken by the Fund fluctuates from time to time. In the event of default or bankruptcy by the borrower, the Fund may be prevented from recovering the loaned securities or gaining access to the collateral or may experience delays or costs in doing so. In addition, the investment of any cash collateral received may lose all or part of its value. The Fund has the right under the lending agreement to recover the securities from the borrower on demand.
The Fund lends its securities through an unaffiliated securities lending agent. Cash collateral received in connection with its securities lending transactions is invested in Securities Lending Cash Investments, LLC (the “Securities Lending Fund”). The
| | | | |
| 24 | | Wells Fargo Large Cap Core Fund | | Notes to financial statements |
Securities Lending Fund is exempt from registration under Section 3(c)(7) of the 1940 Act and is managed by Funds Management and is subadvised by Wells Capital Management Incorporated (“WellsCap”), an affiliate of Funds Management and an indirect wholly owned subsidiary of Wells Fargo & Company (“Wells Fargo”). Funds Management receives an advisory fee starting at 0.05% and declining to 0.01% as the average daily net assets of the Securities Lending Fund increase. All of the fees received by Funds Management are paid to WellsCap for its services as subadviser. The Securities Lending Fund seeks to provide a positive return compared to the daily Fed Funds Open Rate by investing in high-quality, U.S. dollar-denominated short-term money market instruments. Securities Lending Fund investments are valued at the evaluated bid price provided by an independent pricing service. Income earned from investment in the Securities Lending Fund, if any, is included in income from affiliated securities on the Statement of Operations.
Security transactions and income recognition
Securities transactions are recorded on a trade date basis. Realized gains or losses are recorded on the basis of identified cost.
Dividend income is recognized on the ex-dividend date.
Distributions to shareholders
Distributions to shareholders from net investment income and any net realized gains are recorded on the ex-dividend date and paid at least annually. Such distributions are determined in accordance with income tax regulations and may differ from U.S. generally accepted accounting principles. Dividend sources are estimated at the time of declaration. The tax character of distributions is determined as of the Fund’s fiscal year end. Therefore, a portion of the Fund’s distributions made prior to the Fund’s fiscal year end may be categorized as a tax return of capital at year end.
Federal and other taxes
The Fund intends to continue to qualify as a regulated investment company by distributing substantially all of its investment company taxable income and any net realized capital gains (after reduction for capital loss carryforwards) sufficient to relieve it from all, or substantially all, federal income taxes. Accordingly, no provision for federal income taxes was required.
The Fund’s income and federal excise tax returns and all financial records supporting those returns for the prior three fiscal years are subject to examination by the federal and Delaware revenue authorities. Management has analyzed the Fund’s tax positions taken on federal, state, and foreign tax returns for all open tax years and does not believe that there are any uncertain tax positions that require recognition of a tax liability.
As of July 31, 2018, the aggregate cost of all investments for federal income tax purposes was $841,706,098 and the unrealized gains (losses) consisted of:
| | | | |
Gross unrealized gains | | $ | 331,440,873 | |
Gross unrealized losses | | | (17,097,103 | ) |
Net unrealized gains | | $ | 314,343,770 | |
Class allocations
The separate classes of shares offered by the Fund differ principally in applicable sales charges, distribution, shareholder servicing, and administration fees. Class specific expenses are charged directly to that share class. Investment income, common expenses, and realized and unrealized gains (losses) on investments are allocated daily to each class of shares based on the relative proportion of net assets of each class.
3. FAIR VALUATION MEASUREMENTS
Fair value measurements of investments are determined within a framework that has established a fair value hierarchy based upon the various data inputs utilized in determining the value of the Fund’s investments. The three-level hierarchy gives the highest priority to unadjusted quoted prices in active markets for identical assets or liabilities (Level 1) and the lowest priority to unobservable inputs (Level 3). The Fund’s investments are classified within the fair value hierarchy based on the lowest level of input that is significant to the fair value measurement. The inputs are summarized into three broad levels as follows:
| ∎ | | Level 1 – quoted prices in active markets for identical securities |
| ∎ | | Level 2 – other significant observable inputs (including quoted prices for similar securities, interest rates, prepayment speeds, credit risk, etc.) |
| ∎ | | Level 3 – significant unobservable inputs (including the Fund’s own assumptions in determining the fair value of investments) |
The inputs or methodologies used for valuing investments in securities are not necessarily an indication of the risk associated with investing in those securities.
| | | | | | |
| Notes to financial statements | | Wells Fargo Large Cap Core Fund | | | 25 | |
The following is a summary of the inputs used in valuing the Fund’s assets and liabilities as of July 31, 2018:
| | | | | | | | | | | | | | | | |
| | | Quoted prices
(Level 1) | | | Other significant
observable inputs
(Level 2) | | | Significant
unobservable inputs (Level 3) | | | Total | |
Assets | | | | | | | | | | | | | | | | |
Investments in: | | | | | | | | | | | | | | | | |
| | | | |
Common stocks | | | | | | | | | | | | | | | | |
Consumer discretionary | | $ | 147,091,496 | | | $ | 0 | | | $ | 0 | | | $ | 147,091,496 | |
Consumer staples | | | 82,297,087 | | | | 0 | | | | 0 | | | | 82,297,087 | |
Energy | | | 63,670,500 | | | | 0 | | | | 0 | | | | 63,670,500 | |
Financials | | | 155,347,298 | | | | 0 | | | | 0 | | | | 155,347,298 | |
Health care | | | 206,519,890 | | | | 0 | | | | 0 | | | | 206,519,890 | |
Industrials | | | 102,181,266 | | | | 0 | | | | 0 | | | | 102,181,266 | |
Information technology | | | 279,497,750 | | | | 0 | | | | 0 | | | | 279,497,750 | |
Materials | | | 49,489,521 | | | | 0 | | | | 0 | | | | 49,489,521 | |
Real estate | | | 41,397,787 | | | | 0 | | | | 0 | | | | 41,397,787 | |
Utilities | | | 18,541,164 | | | | 0 | | | | 0 | | | | 18,541,164 | |
| | | | |
Short-term investments | | | | | | | | | | | | | | | | |
Investment companies | | | 10,016,109 | | | | 0 | | | | 0 | | | | 10,016,109 | |
Total assets | | $ | 1,156,049,868 | | | $ | 0 | | | $ | 0 | | | $ | 1,156,049,868 | |
The Fund recognizes transfers between levels within the fair value hierarchy at the end of the reporting period. At July 31, 2018, the Fund did not have any transfers into/out of Level 1, Level 2, or Level 3.
4. TRANSACTIONS WITH AFFILIATES
Management fee
Funds Management, an indirect wholly owned subsidiary of Wells Fargo, is the manager of the Fund and provides advisory and fund-level administrative services under an investment management agreement. Under the investment management agreement, Funds Management is responsible for, among other services, implementing the investment objectives and strategies of the Fund, supervising the subadviser and providing fund-level administrative services in connection with the Fund’s operations. As compensation for its services under the investment management agreement, Funds Management is entitled to receive an annual management fee starting at 0.70% and declining to 0.505% as the average daily net assets of the Fund increase. For the year ended July 31, 2018, the management fee was equivalent to an annual rate of 0.68% of the Fund’s average daily net assets.
Funds Management has retained the services of a subadviser to provide daily portfolio management to the Fund. The fee for subadvisory services is borne by Funds Management. WellsCap is the subadviser to the Fund and is entitled to receive a fee from Funds Management at an annual rate starting at 0.35% and declining to 0.30% as the average daily net assets of the Fund increase. Prior to January 1, 2018, Golden Capital Management, LLC, an affiliate of Funds Management and an indirect wholly owned subsidiary of Wells Fargo, was the subadviser to the Fund. In connection with the completion of the merger of Golden Capital Management LLC into WellsCap on January 1, 2018, WellsCap became the subadviser to the Fund. The merger did not result in any change to the services provided to the Fund or to its strategies or fees and expenses.
Administration fees
Under a class-level administration agreement, Funds Management provides class-level administrative services to the Fund, which includes paying fees and expenses for services provided by the transfer agent, sub-transfer agents, omnibus account servicers and record-keepers. As compensation for its services under the class-level administration agreement, Funds Management receives an annual fee which is calculated based on the average daily net assets of each class as follows:
| | | | |
| | | Class-level
administration fee | |
Class A, Class C, Class R | | | 0.21 | % |
Class R6 | | | 0.03 | |
Administrator Class, Institutional Class | | | 0.13 | |
| | | | |
| 26 | | Wells Fargo Large Cap Core Fund | | Notes to financial statements |
Funds Management has contractually waived and/or reimbursed management and administration fees to the extent necessary to maintain certain net operating expense ratios for the Fund. When each class of the Fund has exceeded its expense cap, Funds Management has waived fees and/or reimbursed expenses from fund level expenses on a proportionate basis and then from class specific expenses; otherwise, waivers and/or reimbursements are applied against class specific expenses before fund level expenses. Funds Management has committed through November 30, 2018 to waive fees and/or reimburse expenses to the extent necessary to cap the Fund’s expenses at 1.08% for Class A shares, 1.83% for Class C shares, 1.33% for Class R shares, 0.65% for Class R6 shares, 0.97% for Administrator Class shares, and 0.67% for Institutional Class shares. After this time, the cap may be increased or the commitment to maintain the cap may be terminated only with the approval of the Board of Trustees. Prior to December 1, 2017, the Fund’s expenses were capped at 1.14% for Class A shares, 1.89% for Class C shares, 1.39% for Class R shares, 0.68% for Class R6 shares, 1.00% for Administrator Class shares, and 0.70% for Institutional Class shares.
Distribution fees
The Trust has adopted a distribution plan for Class C and Class R shares of the Fund pursuant to Rule 12b-1 under the 1940 Act. Distribution fees are charged to Class C and Class R shares and paid to Wells Fargo Funds Distributor, LLC (“Funds Distributor”), the principal underwriter, at an annual rate of 0.75% of the average daily net assets of Class C shares and 0.25% of the average daily net assets of Class R shares.
In addition, Funds Distributor is entitled to receive the front-end sales charge from the purchase of Class A shares and a contingent deferred sales charge on the redemption of certain Class A shares. Funds Distributor is also entitled to receive the contingent deferred sales charges from redemptions of Class C shares. For the year ended July 31, 2018, Funds Distributor received $20,993 from the sale of Class A shares and $272 in contingent deferred sales charges from redemptions of Class C shares. No contingent deferred sales charges were incurred by Class A shares for the year ended July 31, 2018.
Shareholder servicing fees
The Trust has entered into contracts with one or more shareholder servicing agents, whereby Class A, Class C, Class R, and Administrator Class of the Fund are charged a fee at an annual rate of 0.25% of the average daily net assets of each respective class.
A portion of these total shareholder servicing fees were paid to affiliates of Wells Fargo.
Interfund transactions
The Fund may purchase or sell portfolio investment securities to certain other Wells Fargo affiliates pursuant to Rule 17a-7 under the 1940 Act and under procedures adopted by the Board of Trustees. The procedures have been designed to ensure that these interfund transactions, which do not incur broker commissions, are effected at current market prices.
5. INVESTMENT PORTFOLIO TRANSACTIONS
Purchases and sales of investments, excluding U.S. government obligations (if any) and short-term securities, for the year ended July 31, 2018 were $366,095,120 and $425,456,088, respectively.
6. BANK BORROWINGS
The Trust (excluding the money market funds and certain other funds) and Wells Fargo Variable Trust are parties to a $280,000,000 revolving credit agreement whereby the Fund is permitted to use bank borrowings for temporary or emergency purposes, such as to fund shareholder redemption requests. Interest under the credit agreement is charged to the Fund based on a borrowing rate equal to the higher of the Federal Funds rate in effect on that day plus 1.25% or the overnight LIBOR rate in effect on that day plus 1.25%. In addition, an annual commitment fee equal to 0.25% of the unused balance is allocated to each participating fund. Prior to August 29, 2017, the revolving credit agreement amount was $250,000,000.
For the year ended July 31, 2018, there were no borrowings by the Fund under the agreement.
7. DISTRIBUTIONS TO SHAREHOLDERS
The tax character of distributions paid during the years ended July 31, 2018 and July 31, 2017 were as follows:
| | | | | | | | |
| | | Year ended July 31 | |
| | | 2018 | | | 2017 | |
Ordinary income | | $ | 9,746,479 | | | $ | 10,035,519 | |
Long-term capital gain | | | 12,171,064 | | | | 0 | |
| | | | | | |
| Notes to financial statements | | Wells Fargo Large Cap Core Fund | | | 27 | |
As of July 31, 2018, the components of distributable earnings on a tax basis were as follows:
| | | | |
Undistributed ordinary income | | Undistributed
long-term
gain | | Unrealized
gains |
| $5,856,775 | | $83,287,528 | | $314,343,770 |
8. INDEMNIFICATION
Under the Trust’s organizational documents, the officers and Trustees have been granted certain indemnification rights against certain liabilities that may arise out of performance of their duties to the Trust. Additionally, in the normal course of business, the Trust may enter into contracts with service providers that contain a variety of indemnification clauses. The Trust’s maximum exposure under these arrangements is dependent on future claims that may be made against the Fund and, therefore, cannot be estimated.
| | | | |
| 28 | | Wells Fargo Large Cap Core Fund | | Report of independent registered public accounting firm |
BOARD OF TRUSTEES AND SHAREHOLDERS OF WELLS FARGO FUNDS TRUST:
Opinion on the Financial Statements
We have audited the accompanying statement of assets and liabilities of Wells Fargo Large Cap Core Fund (the “Fund”), one of the funds constituting Wells Fargo Funds Trust, including the portfolio of investments, as of July 31, 2018, the related statement of operations for the year then ended, the statements of changes in net assets for each of the years in the two-year period then ended, and the related notes (collectively, the “financial statements”) and the financial highlights for each of the years or periods in the five-year period then ended. In our opinion, the financial statements and financial highlights present fairly, in all material respects, the financial position of the Fund as of July 31, 2018, the results of its operations for the year then ended, the changes in its net assets for each of the years in the two-year period then ended, and the financial highlights for each of the years or periods in the five-year period then ended, in conformity with U.S. generally accepted accounting principles.
Basis for Opinion
These financial statements and financial highlights are the responsibility of the Fund’s management. Our responsibility is to express an opinion on these financial statements and financial highlights based on our audits. We are a public accounting firm registered with the Public Company Accounting Oversight Board (United States) (“PCAOB”) and are required to be independent with respect to the Fund in accordance with the U.S. federal securities laws and the applicable rules and regulations of the Securities and Exchange Commission and the PCAOB.
We conducted our audits in accordance with the standards of the PCAOB. Those standards require that we plan and perform the audit to obtain reasonable assurance about whether the financial statements and financial highlights are free of material misstatement, whether due to error or fraud. Our audits included performing procedures to assess the risks of material misstatement of the financial statements and financial highlights, whether due to error or fraud, and performing procedures that respond to those risks. Such procedures included examining, on a test basis, evidence regarding the amounts and disclosures in the financial statements and financial highlights. Such procedures also included confirmation of securities owned as of July 31, 2018, by correspondence with the custodian and brokers, or by other appropriate auditing procedures. Our audits also included evaluating the accounting principles used and significant estimates made by management, as well as evaluating the overall presentation of the financial statements and financial highlights. We believe that our audits provide a reasonable basis for our opinion.

We have not been able to determine the specific year that we began serving as the auditor of one or more Wells Fargo Funds investment companies, however we are aware that we have served as the auditor of one or more Wells Fargo Funds investment companies since at least 1955.
Boston, Massachusetts
September 24, 2018
| | | | | | |
| Other information (unaudited) | | Wells Fargo Large Cap Core Fund | | | 29 | |
TAX INFORMATION
For corporate shareholders, pursuant to Section 854 of the Internal Revenue Code, 100% of ordinary income dividends qualify for the corporate dividends-received deduction for the fiscal year ended July 31, 2018.
Pursuant to Section 852 of the Internal Revenue Code, $12,171,064 was designated as a 20% rate gain distribution for the fiscal year ended August 31, 2018.
Pursuant to Section 854 of the Internal Revenue Code, $9,746,479 of income dividends paid during the fiscal year ended July 31, 2018 has been designated as qualified dividend income (QDI).
PROXY VOTING INFORMATION
A description of the policies and procedures that the Fund uses to determine how to vote proxies relating to portfolio securities is available, upon request, by calling 1-800-222-8222, visiting our website at wellsfargofunds.com, or visiting the SEC website at sec.gov. Information regarding how the Fund voted proxies relating to portfolio securities during the most recent 12-month period ended June 30 is available on the Fund’s website at wellsfargofunds.com or by visiting the SEC website at sec.gov.
PORTFOLIO HOLDINGS INFORMATION
The complete portfolio holdings for the Fund are publicly available monthly on the Fund’s website (wellsfargofunds.com), on a one-month delayed basis. In addition, top ten holdings information (excluding derivative positions) for the Fund is publicly available on the Fund’s website on a monthly, seven-day or more delayed basis. The Fund files its complete schedule of portfolio holdings with the SEC for the first and third quarters of each fiscal year on Form N-Q, which is available by visiting the SEC website at sec.gov. In addition, the Fund’s Form N-Q may be reviewed and copied at the SEC’s Public Reference Room in Washington, DC, and at regional offices in New York City, at 233 Broadway, and in Chicago, at 175 West Jackson Boulevard, Suite 900. Information about the Public Reference Room may be obtained by calling 1-800-SEC-0330.
| | | | |
| 30 | | Wells Fargo Large Cap Core Fund | | Other information (unaudited) |
BOARD OF TRUSTEES AND OFFICERS
Each of the Trustees and Officers1 listed in the table below acts in identical capacities for each fund in the Wells Fargo family of funds, which consists of 154 mutual funds comprising the Wells Fargo Funds Trust, Wells Fargo Variable Trust, Wells Fargo Master Trust and four closed-end funds (collectively the “Fund Complex”). This table should be read in conjunction with the Prospectus and the Statement of Additional Information2. The mailing address of each Trustee and Officer is 525 Market Street, 12th Floor, San Francisco, CA 94105. Each Trustee and Officer serves an indefinite term, however, each Trustee serves such term until reaching the mandatory retirement age established by the Trustees.
Independent Trustees
| | | | | | |
Name and year of birth | | Position held and length of service* | | Principal occupations during past five years or longer | | Current other public company or investment company directorships |
William R. Ebsworth (Born 1957) | | Trustee, since 2015 | | Retired. From 1984 to 2013, equities analyst, portfolio manager, research director and chief investment officer at Fidelity Management and Research Company in Boston, Tokyo, and Hong Kong, and retired in 2013 as Chief Investment Officer of Fidelity Strategic Advisers, Inc. where he led a team of investment professionals managing client assets. Prior thereto, Board member of Hong Kong Securities Clearing Co., Hong Kong Options Clearing Corp., the Thailand International Fund, Ltd., Fidelity Investments Life Insurance Company, and Empire Fidelity Investments Life Insurance Company. Board member of the Forté Foundation (non-profit organization) and the Vincent Memorial Hospital Endowment (non-profit organization), where he serves on the Investment Committee and as a Chair of the Audit Committee. Mr. Ebsworth is a CFA® charterholder. | | Asset Allocation Trust |
Jane A. Freeman (Born 1953) | | Trustee, since 2015; Chair Liaison, since 2018 | | Retired. From 2012 to 2014 and 1999 to 2008, Chief Financial Officer of Scientific Learning Corporation. From 2008 to 2012, Ms. Freeman provided consulting services related to strategic business projects. Prior to 1999, Portfolio Manager at Rockefeller & Co. and Scudder, Stevens & Clark. Board member of the Harding Loevner Funds from 1996 to 2014, serving as both Lead Independent Director and chair of the Audit Committee. Board member of the Russell Exchange Traded Funds Trust from 2011 to 2012 and the chair of the Audit Committee. Ms. Freeman is a Board Member of Ruth Bancroft Garden (non-profit organization) and the Glimmerglass Festival. She is also an inactive Chartered Financial Analyst. | | Asset Allocation Trust |
Isaiah Harris, Jr. (Born 1952) | | Trustee, since 2009 | | Retired. Chairman of the Board of CIGNA Corporation since 2009, and Director since 2005. From 2003 to 2011, Director of Deluxe Corporation. Prior thereto, President and CEO of BellSouth Advertising and Publishing Corp. from 2005 to 2007, President and CEO of BellSouth Enterprises from 2004 to 2005 and President of BellSouth Consumer Services from 2000 to 2003. Emeritus member of the Iowa State University Foundation Board of Governors. Emeritus Member of the Advisory Board of Iowa State University School of Business. Advisory Board Member, Palm Harbor Academy (charter school). Advisory Board Member, Child Evangelism Fellowship (non-profit). Mr. Harris is a certified public accountant (inactive status). | | CIGNA Corporation; Asset Allocation Trust |
Judith M. Johnson (Born 1949) | | Trustee, since 2008; Audit Committee Chairman, since 2009 | | Retired. Prior thereto, Chief Executive Officer and Chief Investment Officer of Minneapolis Employees Retirement Fund from 1996 to 2008. Ms. Johnson is an attorney, certified public accountant and a certified managerial accountant. | | Asset Allocation Trust |
David F. Larcker (Born 1950) | | Trustee, since 2009 | | James Irvin Miller Professor of Accounting at the Graduate School of Business, Stanford University, Director of the Corporate Governance Research Initiative and Senior Faculty of The Rock Center for Corporate Governance since 2006. From 2005 to 2008, Professor of Accounting at the Graduate School of Business, Stanford University. Prior thereto, Ernst & Young Professor of Accounting at The Wharton School, University of Pennsylvania from 1985 to 2005. | | Asset Allocation Trust |
| | | | | | |
| Other information (unaudited) | | Wells Fargo Large Cap Core Fund | | | 31 | |
| | | | | | |
Name and year of birth | | Position held and length of service* | | Principal occupations during past five years or longer | | Current other public company or investment company directorships |
Olivia S. Mitchell (Born 1953) | | Trustee, since 2006; Governance Committee Chairman, since 2018 | | International Foundation of Employee Benefit Plans Professor, Wharton School of the University of Pennsylvania since 1993. Director of Wharton’s Pension Research Council and Boettner Center on Pensions & Retirement Research, and Research Associate at the National Bureau of Economic Research. Previously, Cornell University Professor from 1978 to 1993. | | Asset Allocation Trust |
Timothy J. Penny (Born 1951) | | Trustee, since 1996; Chairman, since 2018; Vice Chairman, from 2017 to 2018 | | President and Chief Executive Officer of Southern Minnesota Initiative Foundation, a non-profit organization, since 2007. Member of the Board of Trustees of NorthStar Education Finance, Inc., a non-profit organization, since 2007. | | Asset Allocation Trust |
James G. Polisson (Born 1959) | | Trustee, since 2018; Advisory Board Member, from 2017 to 2018 | | Retired. Chief Marketing Officer, Source (ETF) UK Services, Ltd, from 2015 to 2017. From 2012 to 2015, Principal of The Polisson Group, LLC, a management consulting, corporate advisory and principal investing company. Chief Executive Officer and Managing Director at Russell Investments, Global Exchange Traded Funds from 2010 to 2012. Managing Director of Barclays Global Investors from 1998 to 2010 and Global Chief Marketing Officer for iShares and Barclays Global Investors from 2000 to 2010. Trustee of the San Francisco Mechanics’ Institute, a non-profit organization, from 2013 to 2015. Board member of the Russell Exchange Traded Fund Trust from 2011 to 2012. Director of Barclays Global Investors Holdings Deutschland GmbH from 2006 to 2009. Mr. Polisson is an attorney and has a retired status with the Massachusetts and District of Columbia Bar Associations. | | Asset Allocation Trust |
Michael S. Scofield (Born 1943) | | Trustee, since 2010 | | Served on the Investment Company Institute’s Board of Governors and Executive Committee from 2008-2011 as well the Governing Council of the Independent Directors Council from 2006-2011 and the Independent Directors Council Executive Committee from 2008-2011. Trustee of the Evergreen Fund complex (and its predecessors) from 1984 to 2010. Chairman of the Evergreen Funds from 2000-2010. Former Trustee of the Mentor Funds. Retired Attorney, Law Offices of Michael S. Scofield. | | Asset Allocation Trust |
Pamela Wheelock (Born 1959) | | Trustee, since 2018; Advisory Board Member, from 2017 to 2018 | | Chief Operating Officer, Twin Cities Habitat for Humanity, since January, 2017. Vice President of University Services, University of Minnesota from 2012 to 2017. Prior thereto, on the Board of Directors, Goverance Committee and Finance Committee for the Minnesota Philanthropy Partners (Saint Paul Foundation) from 2012 to 2018, Interim President and Chief Executive Officer of Blue Cross Blue shield of Minnesota of Minnesota from 2010 to 2011, Chairman of the Board from 2009 to 2011 and Board Director 003 to 2015. Vice President, Leadership and Community Engagement, Bush Foundation, Saint Paul, Minnesota (a private foundation) from 2009 to 2011. Executive Vice President and Chief Financial Officer, Minnesota Sports and Entertainment from 2004 to 2009 and Senior Vice President from 2002 to 2004. Commissioner of Finance, State of Minnesota, from 1999 to 2002. Currently the Board Chair of the Minnesota Wild Foundation since 2010. | | Asset Allocation Trust |
| * | Length of service dates reflect the Trustee’s commencement of service with the Trust’s predecessor entities, where applicable. |
| | | | |
| 32 | | Wells Fargo Large Cap Core Fund | | Other information (unaudited) |
Officers
| | | | | | |
Name and year of birth | | Position held and length of service | | Principal occupations during past five years or longer | | |
Andrew Owen (Born 1960) | | President, since 2017 | | Executive Vice President of Wells Fargo & Company and Head of Affiliated Managers, Wells Fargo Asset Management, since 2014. In addition, Mr. Owen is currently President, Chief Executive Officer and Director of Wells Fargo Funds Management, LLC since 2017. Prior thereto, Executive Vice President responsible for marketing, investments and product development for Wells Fargo Funds Management, LLC, from 2009 to 2014. | | |
Jeremy DePalma1 (Born 1974) | | Treasurer, since 2012 | | Senior Vice President of Wells Fargo Funds Management, LLC since 2009. Senior Vice President of Evergreen Investment Management Company, LLC from 2008 to 2010 and head of the Fund Reporting and Control Team within Fund Administration from 2005 to 2010. | | |
Alexander Kymn3 (Born 1973) | | Secretary, since 2018; Chief Legal Officer, since 2018 | | Senior Company Counsel of Wells Fargo Bank, N.A. since 2018 (previously Senior Counsel from 2007 to 2018). Vice President of Wells Fargo Funds Management, LLC from 2008 to 2014. | | |
Michael H. Whitaker (Born 1967) | | Chief Compliance Officer, since 2016 | | Senior Vice President and Chief Compliance Officer since 2016. Senior Vice President and Chief Compliance Officer for Fidelity Investments from 2007 to 2016. | | |
David Berardi (Born 1975) | | Assistant Treasurer, since 2009 | | Vice President of Wells Fargo Funds Management, LLC since 2009. Vice President of Evergreen Investment Management Company, LLC from 2008 to 2010. Manager of Fund Reporting and Control for Evergreen Investment Management Company, LLC from 2004 to 2010. | | |
| 1 | Jeremy DePalma acts as Treasurer of 77 funds and Assistant Treasurer of 77 funds in the Fund Complex. |
| 2 | The Statement of Additional Information includes additional information about the Trustees and is available, without charge, upon request, by calling 1-800-222-8222 or by visiting the website at wellsfargofunds.com. |
| 3 | Alexander Kymn became the Secretary and Chief Legal Officer effective April 17, 2018. |
| | | | | | |
| Other information (unaudited) | | Wells Fargo Large Cap Core Fund | | | 33 | |
BOARD CONSIDERATION OF INVESTMENT MANAGEMENT AND SUB-ADVISORY AGREEMENTS:
Wells Fargo Large Cap Core Fund
Under the Investment Company Act of 1940 (the “1940 Act”), the Board of Trustees (the “Board”) of Wells Fargo Funds Trust (the “Trust”) must determine annually whether to approve the continuation of the Trust’s investment management and sub-advisory agreements. In this regard, at an in-person meeting held on May 22-23, 2018 (the “Meeting”), the Board, all the members of which have no direct or indirect interest in the investment management and sub-advisory agreements and are not “interested persons” of the Trust, as defined in the 1940 Act (the “Independent Trustees”), reviewed and approved for Wells Fargo Large Cap Core Fund (the “Fund”): (i) an investment management agreement (the “Management Agreement”) with Wells Fargo Funds Management, LLC (“Funds Management”); and (ii) an investment sub-advisory agreement (the “Sub-Advisory Agreement”) with Wells Capital Management Incorporated (the “Sub-Adviser”), an affiliate of Funds Management. The Management Agreement and the Sub-Advisory Agreement are collectively referred to as the “Advisory Agreements.”
At the Meeting, the Board considered the factors and reached the conclusions described below relating to the selection of Funds Management and the Sub-Adviser and the approval of the Advisory Agreements. Prior to the Meeting, including at an in-person meeting in April 2018, the Trustees conferred extensively among themselves and with representatives of Funds Management about these matters. Also, the Board has adopted a team-based approach, with each team consisting of a sub-set of Trustees, to assist the full Board in the discharge of its duties in reviewing investment performance and other matters throughout the year. The Independent Trustees were assisted in their evaluation of the Advisory Agreements by independent legal counsel, from whom they received separate legal advice and with whom they met separately.
In providing information to the Board, Funds Management and the Sub-Adviser were guided by a detailed set of requests for information submitted to them by independent legal counsel on behalf of the Independent Trustees at the start of the Board’s annual contract renewal process earlier in 2018. In considering and approving the Advisory Agreements, the Trustees considered the information they believed relevant, including but not limited to the information discussed below. The Board considered not only the specific information presented in connection with the Meeting, but also the knowledge gained over time through interaction with Funds Management and the Sub-Adviser about various topics. In this regard, the Board reviewed reports of Funds Management at each of its quarterly meetings, which included, among other things, portfolio reviews and investment performance reports. In addition, the Board and the teams mentioned above confer with portfolio managers at various times throughout the year. The Board did not identify any particular information or consideration that was all-important or controlling, and each individual Trustee may have attributed different weights to various factors.
After its deliberations, the Board unanimously approved the continuation of the Advisory Agreements for a one-year term and determined that the compensation payable to Funds Management and the Sub-Adviser under each of the Advisory Agreements was reasonable. The Board considered the approval of the Advisory Agreements for the Fund as part of its consideration of agreements for funds across the complex, but its approvals were made on a fund-by-fund basis. The following summarizes a number of important, but not necessarily all, factors considered by the Board in support of its approvals.
Nature, extent and quality of services
The Board received and considered various information regarding the nature, extent and quality of services provided to the Fund by Funds Management and the Sub-Adviser under the Advisory Agreements. This information included a description of the investment advisory services and Fund-level administrative services covered by the Management Agreement, as well as, among other things, a summary of the background and experience of senior management of Wells Fargo Asset Management (“WFAM”), of which Funds Management and the Sub-Adviser are a part, a summary of investments made in the business of WFAM, a summary of certain organizational and personnel changes involving Funds Management and the Sub-Adviser, and a description of Funds Management’s and the Sub-Adviser’s business continuity planning programs and of their approaches to data privacy and cybersecurity. The Board also considered the qualifications, background, tenure and responsibilities of each of the portfolio managers primarily responsible for the day-to-day portfolio management of the Fund.
The Board evaluated the ability of Funds Management and the Sub-Adviser to attract and retain qualified investment professionals, including research, advisory and supervisory personnel. The Board further considered the compliance programs and compliance records of Funds Management and the Sub-Adviser. In addition, the Board took into account the full range of services provided to the Fund by Funds Management and its affiliates.
| | | | |
| 34 | | Wells Fargo Large Cap Core Fund | | Other information (unaudited) |
Fund investment performance and expenses
The Board considered the investment performance results for the Fund over various time periods ended December 31, 2017. The Board considered these results in comparison to the investment performance of funds in a universe that was determined by Broadridge Inc. (“Broadridge”) to be similar to the Fund (the “Universe”), and in comparison to the Fund’s benchmark index and to other comparative data. Broadridge is an independent provider of investment company data. The Board received a description of the methodology used by Broadridge to select the mutual funds in the performance Universe. The Board noted that the investment performance of the Fund (Class A) was higher than the average investment performance of the Universe for all periods under review. The Board also noted that the investment performance of the Fund was higher than its benchmark index, the S&P 500 Index, for the one- and five-year periods under review, but lower than its benchmark index for the three- and ten-year periods under review.
The Board also received and considered information regarding the Fund’s net operating expense ratios and their various components, including actual management fees, custodian and other non-management fees, and Rule 12b-1 and non-Rule 12b-1 shareholder service fees. The Board considered these ratios in comparison to the median ratios of funds in class-specific expense groups that were determined by Broadridge to be similar to the Fund (the “Groups”). The Board received a description of the methodology used by Broadridge to select the mutual funds in the expense Groups and an explanation of how funds comprising expense groups and their expense ratios may vary from year-to-year. Based on the Broadridge reports, the Board noted that the net operating expense ratios of the Fund were lower than the median net operating expense ratios of the expense Groups for each share class.
The Board took into account the Fund’s investment performance and expense information provided to it among the factors considered in deciding to re-approve the Advisory Agreements.
Investment management and sub-advisory fee rates
The Board reviewed and considered the contractual fee rates payable by the Fund to Funds Management under the Management Agreement, as well as the contractual fee rates payable by the Fund to Funds Management for class-level administrative services under a Class-Level Administration Agreement, which include, among other things, class-level transfer agency and sub-transfer agency costs (collectively, the “Management Rates”). The Board also reviewed and considered the contractual investment sub-advisory fee rates that are payable by Funds Management to the Sub-Adviser for investment sub-advisory services.
Among other information reviewed by the Board was a comparison of the Fund’s Management Rates with the average contractual investment management fee rates of funds in the expense Groups at a common asset level as well as transfer agency costs of the funds in the expense Groups. The Board noted that the Management Rates of the Fund were in range of the sum of these average rates for the Fund’s expense Groups for all share classes.
The Board also received and considered information about the portion of the total management fee that was retained by Funds Management after payment of the fee to the Sub-Adviser for sub-advisory services. In assessing the reasonableness of this amount, the Board received and evaluated information about the nature and extent of responsibilities retained and risks assumed by Funds Management and not delegated to or assumed by the Sub-Adviser, and about Funds Management’s on-going oversight services. Given the affiliation between Funds Management and the Sub-Adviser, the Board ascribed limited relevance to the allocation of fees between them.
The Board also received and considered information about the nature and extent of services offered and fee rates charged by Funds Management and the Sub-Adviser to other types of clients with investment strategies similar to those of the Fund. In this regard, the Board received information about the significantly greater scope of services, and compliance, reporting and other legal burdens and risks of managing mutual funds compared with those associated with managing assets of non-mutual fund clients such as institutional separate accounts.
Based on its consideration of the factors and information it deemed relevant, including those described here, the Board determined that the compensation payable to Funds Management under the Management Agreement and to the Sub-Adviser under the Sub-Advisory Agreement was reasonable.
Profitability
The Board received and considered information concerning the profitability of Funds Management, as well as the profitability of both WFAM and Wells Fargo & Co. (“Wells Fargo”) as a whole, from providing services to the Fund and the fund family as a whole. The Board noted that the Sub-Adviser’s profitability information with respect to providing services to the Fund was subsumed in the WFAM and Wells Fargo profitability analysis.
| | | | | | |
| Other information (unaudited) | | Wells Fargo Large Cap Core Fund | | | 35 | |
Funds Management reported on the methodologies and estimates used in calculating profitability, including a description of the methodology used to allocate certain expenses and recent enhancements made to the methodology. Among other things, the Board noted that the levels of profitability reported on a fund-by-fund basis varied widely, depending on factors such as the size and type of fund. Based on its review, the Board did not deem the profits reported by Funds Management, WFAM or Wells Fargo from services provided to the Fund to be at a level that would prevent it from approving the continuation of the Advisory Agreements.
Economies of scale
The Board considered the extent to which Funds Management may experience economies of scale in the provision of management services, and the extent to which scale benefits, if any, would be shared with shareholders. In particular, the Board noted the existence of breakpoints in the Fund’s management fee structure, which operate generally to reduce the Fund’s expense ratios as the Fund grows in size. It considered that, for a small fund or a fund that shrinks in size, breakpoints conversely can result in higher fee levels. The Board also considered that in addition to management fee breakpoints, competitive management fee rates set at the outset without regard to breakpoints and fee waiver and expense reimbursement arrangements, as well as investments in the business intended to enhance services available to Fund shareholders, are means of sharing potential economies of scale with shareholders of the Fund.
The Board concluded that the Fund’s fee and expense arrangements, including contractual breakpoints, constituted a reasonable approach to sharing potential economies of scale with the Fund and its shareholders.
Other benefits to Funds Management and the Sub-Adviser
The Board received and considered information regarding potential “fall-out” or ancillary benefits received by Funds Management and its affiliates, including the Sub-Adviser, as a result of their relationships with the Fund. Ancillary benefits could include, among others, benefits directly attributable to other relationships with the Fund and benefits potentially derived from an increase in Funds Management’s and the Sub-Adviser’s business as a result of their relationships with the Fund. The Board noted that various affiliates of Funds Management may receive distribution-related fees, shareholder servicing payments and sub-transfer agency fees in respect of shares sold or held through them and services provided.
The Board also reviewed information about soft dollar credits earned and utilized by the Sub-Adviser, fees earned by Funds Management and the Sub-Adviser from managing a private investment vehicle for the fund family’s securities lending collateral and commissions earned by an affiliated broker from portfolio transactions.
Based on its consideration of the factors and information it deemed relevant, including those described here, the Board did not find that any ancillary benefits received by Funds Management and its affiliates, including the Sub-Adviser, were unreasonable.
Conclusion
At the Meeting, after considering the above-described factors and based on its deliberations and its evaluation of the information described above, the Board unanimously approved the continuation of the Advisory Agreements for a one-year term and determined that the compensation payable to Funds Management and the Sub-Adviser under each of the Advisory Agreements was reasonable.
| | | | |
| 36 | | Wells Fargo Large Cap Core Fund | | Appendix A (unaudited) |
SALES CHARGE REDUCTIONS AND WAIVERS FOR CERTAIN INTERMEDIARIES
Ameriprise
Effective June 1, 2018, shareholders purchasing Fund shares through an Ameriprise Financial platform or account will be eligible only for the following Class A load waivers (front-end sales charge waivers), which may differ from those disclosed elsewhere in the Fund’s prospectus or Statement of Additional Information.
Front-end Sales Load Waivers on Class A Shares Available at Ameriprise Financial
| | • | | Employer-sponsored retirement plans (e.g., 401(k) plans, 457 plans, employer-sponsored 403(b) plans, profit sharing and money purchase pension plans and defined benefit plans). For purposes of this provision, employer-sponsored retirement plans do not include SEP IRAs, Simple IRAs or SAR-SEPs. |
| | • | | Shares purchased through an Ameriprise Financial investment advisory program (if an Advisory or similar share class for such investment advisory program is not available) |
| | • | | Shares purchased by third party investment advisors on behalf of their advisory clients through Ameriprise Financial’s platform (if an Advisory or similar share class for such investment advisory program is not available) |
| | • | | Shares purchased through reinvestment of distributions and dividend reinvestment when purchasing shares of the same Fund (but not any other fund within the same fund family) |
| | • | | Shares exchanged from Class C shares of the same fund in the month of or following the 10-year anniversary of the purchase date. To the extent that the Fund’s prospectus elsewhere provides for a waiver with respect to such shares following a shorter holding period, that waiver will apply to exchanges following such shorter period. To the extent that the Fund’s prospectus elsewhere provides for a waiver with respect to exchanges of Class C shares for load-waived shares, that waiver will also apply to such exchanges. |
| | • | | Employees and registered representatives of Ameriprise Financial or its affiliates and their immediate family members |
| | • | | Shares purchased by or through qualified accounts (including IRAs, Coverdell Education Savings Accounts, 401(k)s, 403(b) TSCAs subject to ERISA and defined benefit plans) that are held by a covered family member, defined as an Ameriprise financial advisor and/or the advisor’s spouse, advisor’s lineal ascendant (mother, father, grandmother, grandfather, great grandmother, great grandfather), advisor’s lineal descendant (son, step-son, daughter, step-daughter, grandson, granddaughter, great grandson, great granddaughter) or any spouse of a covered family member who is a lineal descendant |
| | • | | Shares purchased from the proceeds of redemptions within the same fund family, provided (1) the repurchase occurs within 90 days following the redemption, (2) the redemption and purchase occur in the same account, and (3) redeemed shares were subject to a front-end or deferred sales load (i.e. Rights of Reinstatement). Subject to the Fund’s policy regarding frequent purchases and redemptions of Fund shares, you may not be able to repurchase shares for the first 30 days after your redemption. |
Automatic Exchange of Class C Shares Available at Ameriprise Financial
| | • | | Class C shares will automatically exchange to Class A shares in the month of the 10-year anniversary of the purchase date. |
Merrill Lynch
Effective April 10, 2017, shareholders purchasing Fund shares through a Merrill Lynch platform or account will be eligible only for the following load waivers (front-end sales charge waivers and contingent deferred, or back-end, sales charge waivers) and discounts, which may differ from those disclosed elsewhere in the Fund’s prospectus or Statement of Additional Information.
Front-end Sales Load Waivers on Class A Shares available at Merrill Lynch
| | • | | Employer-sponsored retirement, deferred compensation and employee benefit plans (including health savings accounts) and trusts used to fund those plans, provided that the shares are not held in a commission-based brokerage account and shares are held for the benefit of the plan |
| | • | | Shares purchased by or through a 529 Plan |
| | • | | Shares purchased through a Merrill Lynch affiliated investment advisory program |
| | | | | | |
| Appendix A (unaudited) | | Wells Fargo Large Cap Core Fund | | | 37 | |
| | • | | Shares purchased by third party investment advisors on behalf of their advisory clients through Merrill Lynch’s platform |
| | • | | Shares of funds purchased through the Merrill Edge Self-Directed platform (if applicable) |
| | • | | Shares purchased through reinvestment of capital gains distributions and dividend reinvestment when purchasing shares of the same fund (but not any other fund within the fund family) |
| | • | | Shares exchanged from Class C (i.e. level-load) shares of the same fund in the month of or following the 10-year anniversary of the purchase date |
| | • | | Employees and registered representatives of Merrill Lynch or its affiliates and their family members, as defined by Merrill Lynch, which may differ from the definition of family member in the Fund’s prospectus. |
| | • | | Directors or Trustees of the Fund, and employees of the Fund’s investment adviser or any of its affiliates, as described in the Fund’s prospectus |
| | • | | Shares purchased from the proceeds of redemptions within the same fund family, provided (1) the repurchase occurs within 90 days following the redemption, (2) the redemption and purchase occur in the same account, and (3) redeemed shares were subject to a front-end or deferred sales load (known as Rights of Reinstatement). Subject to the Fund’s policy regarding frequent purchases and redemptions of Fund shares, you may not be able to repurchase shares for the first 30 days after your redemption. |
CDSC Waivers on A, B and C Shares available at Merrill Lynch
| | • | | Death or disability of the shareholder |
| | • | | Shares sold as part of a systematic withdrawal plan as described in the Fund’s prospectus |
| | • | | Return of excess contributions from an IRA Account |
| | • | | Shares sold as part of a required minimum distribution for IRA and retirement accounts due to the shareholder reaching age 70½ |
| | • | | Shares sold to pay Merrill Lynch fees but only if the transaction is initiated by Merrill Lynch |
| | • | | Shares acquired through a right of reinstatement |
| | • | | Shares held in retirement brokerage accounts, that are exchanged for a lower cost share class due to transfer to certain fee based accounts or platforms (applicable to A and C shares only) |
Front-end load Discounts Available at Merrill Lynch: Breakpoints, Rights of Accumulation & Letters of Intent
| | • | | Breakpoints as described in the Fund’s prospectus |
| | • | | Rights of Accumulation (ROA) which entitle shareholders to breakpoint discounts will be automatically calculated based on the aggregated holding of fund family assets held by accounts within the purchaser’s household at Merrill Lynch. Eligible fund family assets not held at Merrill Lynch may be included in the ROA calculation only if the shareholder notifies his or her financial advisor about such assets. |
| | • | | Letters of Intent (LOI) which allow for breakpoint discounts based on anticipated purchases within a fund family, through Merrill Lynch, over a 13-month period of time (if applicable) |
Morgan Stanley
Effective on or about July 1, 2018, shareholders purchasing Fund shares through a Morgan Stanley Wealth Management transactional brokerage account will be eligible only for the following Class A load waivers (front-end sales charge waivers), which may differ from and be more limited than those disclosed in the Fund’s prospectus or Statement of Additional Information.
Front-end Sales Load Waivers on Class A Shares Available at Morgan Stanley
| | • | | Employer-sponsored retirement plans (e.g., 401(k) plans, 457 plans, employer-sponsored 403(b) plans, profit sharing and money purchase pension plans and defined benefit plans). For purposes of this provision, employer-sponsored retirement plans do not include SEP IRAs, Simple IRAs, SAR-SEPs or Keogh plans. |
| | • | | Morgan Stanley employee and employee-related accounts according to Morgan Stanley’s account linking rules |
| | • | | Shares purchased through reinvestment of dividends and capital gains distributions when purchasing shares of the same fund |
| | • | | Shares purchased through a Morgan Stanley self-directed brokerage account |
| | | | |
| 38 | | Wells Fargo Large Cap Core Fund | | Appendix A (unaudited) |
| | • | | Class C (i.e., level-load) shares that are no longer subject to a contingent deferred sales charge and are exchanged to Class A shares of the same fund pursuant to Morgan Stanley Wealth Management’s share class exchange program. |
| | • | | Shares purchased from the proceeds of redemptions within the same fund family, provided (i) the repurchase occurs within 90 days following the redemption, (ii) the redemption and purchase occur in the same account, and (iii) redeemed shares were subject to a front-end or deferred sales charge. This waiver is subject to the Fund’s policy regarding frequent purchases and redemption of Fund shares, as discussed under “Account Information—Frequent Purchases and Redemptions of Fund Shares” in the Fund’s prospectus. |
This page is intentionally left blank.
This page is intentionally left blank.

For more information
More information about Wells Fargo Funds is available free upon request. To obtain literature, please write, email, visit the Fund’s website, or call:
Wells Fargo Funds
P.O. Box 219967
Kansas City, MO 64121-9967
Website: wellsfargofunds.com
Individual investors: 1-800-222-8222
Retail investment professionals: 1-888-877-9275
Institutional investment professionals: 1-866-765-0778
This report and the financial statements contained herein are submitted for the general information of the shareholders of the Fund. If this report is used for promotional purposes, distribution of the report must be accompanied or preceded by a current prospectus. Before investing, please consider the investment objectives, risks, charges, and expenses of the investment. For a current prospectus and, if available, a summary prospectus, containing this information, call 1-800-222-8222 or visit the Fund’s website at wellsfargofunds.com. Read the prospectus carefully before you invest or send money.
Wells Fargo Asset Management (WFAM) is the trade name for certain investment advisory/management firms owned by Wells Fargo & Company. These firms include but are not limited to Wells Capital Management Incorporated and Wells Fargo Funds Management, LLC. Certain products managed by WFAM entities are distributed by Wells Fargo Funds Distributor, LLC (a broker/dealer and Member FINRA).
This material is for general informational and educational purposes only and is NOT intended to provide investment advice or a recommendation of any kind—including a recommendation for any specific investment, strategy, or plan.
NOT FDIC INSURED ◾ NO BANK GUARANTEE ◾ MAY LOSE VALUE
© 2018 Wells Fargo Funds Management, LLC. All rights reserved.
| | |
 | | 314798 09-18 A208/AR208 07-18 |
Annual Report
July 31, 2018

Wells Fargo Large Cap Growth Fund


Reduce clutter. Save trees.
Sign up for electronic delivery of prospectuses and shareholder reports at wellsfargo.com/advantagedelivery
Contents
The views expressed and any forward-looking statements are as of July 31, 2018, unless otherwise noted, and are those of the Fund managers and/or Wells Fargo Funds Management, LLC. Discussions of individual securities, or the markets generally, or any Wells Fargo Fund are not intended as individual recommendations. Future events or results may vary significantly from those expressed in any forward-looking statements. The views expressed are subject to change at any time in response to changing circumstances in the market. Wells Fargo Funds Management, LLC and the Fund disclaim any obligation to publicly update or revise any views expressed or forward-looking statements.
NOT FDIC INSURED ◾ NO BANK GUARANTEE ◾ MAY LOSE VALUE
| | | | |
| 2 | | Wells Fargo Large Cap Growth Fund | | Letter to shareholders (unaudited) |

Andrew Owen
President
Wells Fargo Funds
After advancing during the summer and fall of 2017 in a roughly synchronized way, economic growth and stock markets globally diverged during the first seven months of 2018.
Dear Shareholder:
We are pleased to offer you this annual report for the Wells Fargo Large Cap Growth Fund for the 12-month period that ended July 31, 2018. After advancing during the summer and fall of 2017 in a roughly synchronized way, economic growth and stock markets globally diverged during the first seven months of 2018. For fixed-income investors, higher U.S. interest rates, rising inflation, and intensifying global geopolitical tensions tended to restrain taxable bond prices while high-yield and municipal bond investors generally enjoyed positive returns.
For the period, U.S. stocks, as measured by the S&P 500 Index,1 gained 16.24%, and international stocks, as measured by the MSCI ACWI ex USA Index (Net),2 added 5.94%. Emerging market stocks, as measured by the MSCI EM Index (Net),3 added 4.36%. In bond markets, the Bloomberg Barclays U.S. Aggregate Bond Index4 declined 0.80% while fixed-income investments outside the U.S. fell 0.27%, according to the Bloomberg Barclays Global Aggregate ex-USD Index.5 The Bloomberg Barclays Municipal Bond Index6 added 0.99%, and the ICE BofAML U.S. High Yield Index7 was up 2.49%.
Volatility increased as summer turned to fall in 2017, although data generally was favorable.
During the third quarter of 2017, investor expectations rose and fell amid shifting geopolitical tensions, particularly in Asia as North Korea’s nuclear aspirations and U.S./China trade rhetoric caused concerns. In the U.S., corporate earnings and consumer confidence improved. The U.S. Bureau of Economic Analysis reported that annualized U.S. gross domestic product (GDP) growth for the quarter was 2.8%. The rate of inflation was below the U.S. Federal Reserve’s (Fed’s) targets.
Economic momentum increased in Europe; the European Central Bank (ECB) held its rates steady at low levels and continued its quantitative easing bond-buying program with the goal of sparking economic activity. In emerging markets, many countries benefited from stronger currencies versus the U.S. dollar while commodity price increases benefited countries that rely on natural resources for exports.
| 1 | The S&P 500 Index consists of 500 stocks chosen for market size, liquidity, and industry group representation. It is a market-value-weighted index with each stock’s weight in the index proportionate to its market value. You cannot invest directly in an index. |
| 2 | The Morgan Stanley Capital International (MSCI) All Country World Index (ACWI) ex USA Index (Net) is a free-float-adjusted market-capitalization-weighted index that is designed to measure the equity market performance of developed markets, excluding the United States and Canada. Source: MSCI. MSCI makes no express or implied warranties or representations and shall have no liability whatsoever with respect to any MSCI data contained herein. The MSCI data may not be further redistributed or used as a basis for other indices or any securities or financial products. This report is not approved, reviewed, or produced by MSCI. You cannot invest directly in an index. |
| 3 | The MSCI Emerging Markets (EM) Index (Net) is a free-float-adjusted market-capitalization-weighted index that is designed to measure large- and mid-cap equity market performance of emerging markets. The MSCI EM Index (Net) consists of the following 24 emerging market country indices: Brazil, Chile, China, Colombia, Czech Republic, Egypt, Greece, Hungary, India, Indonesia, Korea, Malaysia, Mexico, Pakistan, Peru, the Philippines, Poland, Qatar, Russia, South Africa, Taiwan, Thailand, Turkey, and the United Arab Emirates. You cannot invest directly in an index. |
| 4 | The Bloomberg Barclays U.S. Aggregate Bond Index is a broad-based benchmark that measures the investment-grade, U.S. dollar-denominated, fixed-rate taxable bond market, including Treasuries, government-related and corporate securities, mortgage-backed securities (agency fixed-rate and hybrid adjustable-rate mortgage pass-throughs), asset-backed securities, and commercial mortgage-backed securities. You cannot invest directly in an index. |
| 5 | The Bloomberg Barclays Global Aggregate ex-USD Index is an unmanaged index that provides a broad-based measure of the global investment-grade fixed-income markets excluding the U.S. dollar-denominated debt market. You cannot invest directly in an index. |
| 6 | The Bloomberg Barclays Municipal Bond Index is an unmanaged index composed of long-term tax-exempt bonds with a minimum credit rating of Baa. You cannot invest directly in an index. |
| 7 | The ICE BofAML U.S. High Yield Index is a market-capitalization-weighted index of domestic and Yankee high-yield bonds. The index tracks the performance of high-yield securities traded in the U.S. bond market. You cannot invest directly in an index. Copyright 2018. ICE Data Indices, LLC. All rights reserved. |
| 8 | The Consumer Price Index For All Urban Consumers (CPI-U) measures the changes in the price of a basket of goods and services purchased by urban consumers. The urban consumer population is deemed by many as a better representative measure of the general public because most of the country’s population lives in highly populated areas, which represent close to 90% of the total population. You cannot invest directly in an index. |
| | | | | | |
| Letter to shareholders (unaudited) | | Wells Fargo Large Cap Growth Fund | | | 3 | |
The fourth quarter of 2017 was characterized by continued optimism in the U.S.
By the end of 2017, some observers were describing conditions as a Goldilocks economic scenario: synchronized global growth, low inflation, and healthy corporate earnings, all supported abroad by a weaker U.S. dollar.
U.S. stocks continued to rally during the fourth quarter of 2017, boosted by favorable company earnings and the potential for tax reform and industry deregulation. The Fed increased rates by 25 basis points (bps; 100 bps equal 1.00%) in December. The annualized GDP growth rate for the fourth quarter was 2.3%.
Internationally, the Bank of England (BoE) raised interest rates in November 2017 to 0.50%, the first increase in more than 10 years and a move up from the 0.25% rate put in place after the Brexit vote to leave the European Union in June 2016. The pound gained against other currencies. Meanwhile, the ECB and the Bank of Japan maintained interest rate policies and bond-buying programs intended to spur business activities and enhance the attractiveness of equity investments. The People’s Bank of China (PBOC) also continued policies that encouraged business investment. International equity markets, particularly emerging markets, continued to show strength.
Volatility reemerged during the first quarter of 2018 as economic signals were mixed.
The first quarter of 2018 began with stock market gains in January following U.S. tax reform that lowered rates for individuals and corporations and deregulation advanced in some economic sectors. Then, investor optimism was supplanted by several concerns. Trade tensions intensified, particularly between the U.S. and China. The U.S. threatened to impose tariffs on a broad range of imported products. Increasing interest rates and inflation also caused concern. During February 2018, the U.S. stock market endured a loss of more than 10% before recovering in March and April. The S&P 500 Index closed the first quarter with a negative return, the first negative quarterly return for the index since 2014.
The Fed increased the federal funds rate by 25 bps in March 2018 and the rate of inflation reached the Fed’s 2% target for the first time in a year. The unemployment rate fell to 4.1%. The third revision of first-quarter GDP growth by the U.S. Bureau of Economic Analysis released during June 2018 was lowered to 2.0%.
Overseas, investment market returns reversed the strong returns of 2017. After having gained 27.19% for the 12-month period that ended December 31, 2017, the MSCI ACWI ex USA Index (Net) fell 1.46% for the 7-month period that ended July 31, 2018. The U.S. dollar strengthened relative to local currencies, which served to restrain returns.
Global trade tensions escalated during the second quarter and into the third quarter of 2018.
Global trade tensions escalated as the second quarter of 2018 opened and equity markets fell in response before resuming upward momentum later in April. The U.S. government imposed tariffs on products and commodities imported from other markets in North America, Europe, and Asia. In retaliation, governments imposed tariffs on U.S. products and commodities. In addition, the U.S. pushed its North American neighbors to renegotiate the North American Free Trade Agreement, furthering trade tensions and investor uncertainty.
The CPI-U8 added 0.2% in May after a similar increase in April. On a year-over-year basis, the all-items index rose 2.8% for the 12 months that ended May 31, continuing its upward trend since the beginning of the year. The index for all items less food and energy rose 2.2% for the same 12-month period. Interest rates generally increased and the bond markets tended to decline.
During February 2018, the U.S. stock market endured a loss of more than 10% before recovering in March and April.
| | | | |
| 4 | | Wells Fargo Large Cap Growth Fund | | Letter to shareholders (unaudited) |
During June 2018, the Fed increased the federal funds rate by 25 bps. Investment markets began to anticipate two more rate increases in 2018. Long-term interest rates in the U.S. trended higher—rates on the 10-year and 30-year Treasury bonds moved from 2.46% and 2.81%, respectively, on January 1, 2018, to 2.96% and 3.08%, respectively, on July 31, 2018. While higher at the end of the period, rates were off their peak levels on May 17, 2018, of 3.11% and 3.25%, respectively. Investors became more aware of and concerned about the potential for an inverted yield curve—sometimes a recession signal—as short-term rates increased more quickly than long-term rates.
The unemployment rate fell to 3.9% in July after ticking up slightly in June from May’s 3.8% level, according to the U.S. Department of Labor. The annualized rate of GDP growth for the second quarter of 2018 was reported in July to be 4.1%, the highest level since the third quarter of 2014, according to the U.S. Bureau of Economic Analysis.
Internationally, the prospects for a smooth U.K. Brexit agreement was cast into doubt as members of Prime Minister Theresa May’s negotiating team resigned. Despite the uncertainty, the period closed with expectations that the BoE’s Monetary Policy Committee in July would announce an increase in its key interest rate to 0.75%, which it did in early August.
Meanwhile, central banks in Europe and Japan maintained low interest rates and accommodative monetary policies. Amid rising trade uncertainty, PBOC monetary policies shifted with cuts to reserve requirement ratios and implementation of supportive measures such as accelerated infrastructure spending and tax cuts for small and medium enterprises and for individuals. Nevertheless, a strengthening U.S. dollar and the tensions associated with trade policies remained headwinds for investors overseas.
Don’t let short-term uncertainty derail long-term investment goals.
Periods of investment uncertainty can present challenges, but experience has taught us that maintaining long-term investment goals can be an effective way to plan for the future. To help you create a sound strategy based on your personal goals and risk tolerance, Wells Fargo Funds offers more than 100 mutual funds spanning a wide range of asset classes and investment styles. Although diversification cannot guarantee an investment profit or prevent losses, we believe it can be an effective way to manage investment risk and potentially smooth out overall portfolio performance. We encourage investors to know their investments and to understand that appropriate levels of risk-taking may unlock opportunities.
Thank you for choosing to invest with Wells Fargo Funds. We appreciate your confidence in us and remain committed to helping you meet your financial needs.
Sincerely,

Andrew Owen
President
Wells Fargo Funds
| | | | | | |
| Letter to shareholders (unaudited) | | Wells Fargo Large Cap Growth Fund | | | 5 | |
Notice to shareholders
At a meeting held on August 14-15, 2018, the Board of Trustees of the Fund approved the following policy which will be effective on or about February 5, 2019:
Class C shares will convert automatically into Class A shares ten years after the initial date of purchase or, if you acquired your Class C shares through an exchange or conversion from another share class, ten years after the date you acquired your Class C shares. When Class C shares that you acquired through a purchase or exchange convert, any other Class C shares that you purchased with reinvested dividends and distributions also will convert into Class A shares on a pro rata basis. A shorter holding period may also apply depending on your intermediary. Please see “Appendix A—Sales Charge Reductions and Waivers for Certain Intermediaries” in the Fund’s prospectus or at the end of this report.
For further information about your Fund, contact your investment professional, visit our website at wellsfargofunds.com, or call us directly at 1-800-222-8222.
| | | | |
| 6 | | Wells Fargo Large Cap Growth Fund | | Performance highlights (unaudited) |
Investment objective
The Fund seeks long-term capital appreciation.
Manager
Wells Fargo Funds Management, LLC
Subadviser
Wells Capital Management Incorporated
Portfolio managers
Joseph M. Eberhardy, CFA®, CPA
Bob Gruendyke, CFA®‡
Thomas C. Ognar, CFA®
Average annual total returns (%) as of July 31, 20181
| | | | | | | | | | | | | | | | | | | | | | | | | | | | | | | | | | |
| | | | | Including sales charge | | | Excluding sales charge | | | Expense ratios2 (%) | |
| | | Inception date | | 1 year | | | 5 year | | | 10 year | | | 1 year | | | 5 year | | | 10 year | | | Gross | | | Net3 | |
| Class A (STAFX) | | 7-30-2010 | | | 20.63 | | | | 12.80 | | | | 10.57 | | | | 27.98 | | | | 14.14 | | | | 11.23 | | | | 1.16 | | | | 1.07 | |
| Class C (STOFX) | | 7-30-2010 | | | 26.03 | | | | 13.29 | | | | 10.41 | | | | 27.03 | | | | 13.29 | | | | 10.41 | | | | 1.91 | | | | 1.82 | |
| Class R (STMFX) | | 6-15-2012 | | | – | | | | – | | | | – | | | | 27.65 | | | | 13.85 | | | | 10.98 | | | | 1.41 | | | | 1.32 | |
| Class R4 (SLGRX) | | 11-30-2012 | | | | | | | | | | | | | | | 28.31 | | | | 14.49 | | | | 11.52 | | | | 0.88 | | | | 0.80 | |
| Class R6 (STFFX) | | 11-30-2012 | | | – | | | | – | | | | – | | | | 28.51 | | | | 14.65 | | | | 11.61 | | | | 0.73 | | | | 0.65 | |
| Administrator Class (STDFX) | | 7-30-2010 | | | – | | | | – | | | | – | | | | 28.14 | | | | 14.29 | | | | 11.35 | | | | 1.08 | | | | 0.95 | |
| Institutional Class (STNFX) | | 7-30-2010 | | | – | | | | – | | | | – | | | | 28.37 | | | | 14.56 | | | | 11.56 | | | | 0.83 | | | | 0.75 | |
| Russell 1000® Growth Index4 | | – | | | – | | | | – | | | | – | | | | 22.84 | | | | 15.83 | | | | 12.37 | | | | – | | | | – | |
Figures quoted represent past performance, which is no guarantee of future results, and do not reflect taxes that a shareholder may pay on fund distributions or the redemption of fund shares. Investment return and principal value of an investment will fluctuate so that an investor’s shares, when redeemed, may be worth more or less than their original cost. Performance shown without sales charges would be lower if sales charges were reflected. Current performance may be lower or higher than the performance data quoted, which assumes the reinvestment of dividends and capital gains. Current month-end performance is available on the Fund’s website, wellsfargofunds.com.
Please keep in mind that high double-digit returns were primarily achieved during favorable market conditions. You should not expect that such favorable returns can be consistently achieved. A fund’s performance, especially for short time periods, should not be the sole factor in making your investment decision.
Index returns do not include transaction costs associated with buying and selling securities, any mutual fund fees or expenses, or any taxes. It is not possible to invest directly in an index.
For Class A shares, the maximum front-end sales charge is 5.75%. For Class C shares, the maximum contingent deferred sales charge is 1.00%. Performance including a contingent deferred sales charge assumes the sales charge for the corresponding time period. Class R, Class R4, Class R6, Administrator Class, and Institutional Class shares are sold without a front-end sales charge or contingent deferred sales charge.
Stock values fluctuate in response to the activities of individual companies and general market and economic conditions. Certain investment strategies tend to increase the total risk of an investment (relative to the broader market). The Fund is exposed to foreign investment risk. Consult the Fund’s prospectus for additional information on these and other risks.
Please see footnotes on page 7.
| | | | | | |
| Performance highlights (unaudited) | | Wells Fargo Large Cap Growth Fund | | | 7 | |
|
| Growth of $10,000 investment as of July 31, 20185 |
|
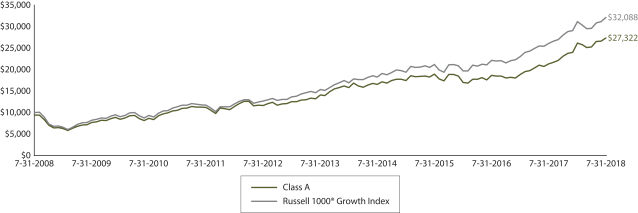 |
| ‡ | Mr. Gruendyke became a portfolio manager of the Fund on December 1, 2017. |
| 1 | Historical performance shown for Class A, Administrator Class, and Institutional Class shares prior to their inception reflects the performance of the former Investor Class shares, and includes the higher expenses applicable to the former Investor Class shares. If these expenses had not been included, returns for Class A, Administrator Class, and Institutional Class shares would be higher. Historical performance shown for Class C and Class R shares prior to their inception reflects the performance of the former Investor Class shares, adjusted to reflect the higher expenses applicable to Class C and Class R shares. Historical performance shown for Class R4 shares prior to their inception reflects the performance of Institutional Class shares, adjusted to reflect the higher expenses applicable to Class R4 shares. Historical performance shown for Class R6 shares prior to their inception reflects the performance of Institutional Class shares, and includes the higher expenses applicable to Institutional Class shares. If these expenses had not been included, returns for Class R6 shares would be higher. |
| 2 | Reflects the expense ratios as stated in the most recent prospectuses. The expense ratios shown are subject to change and may differ from the annualized expense ratios shown in the financial highlights of this report. |
| 3 | The manager has contractually committed through November 30, 2018, to waive fees and/or reimburse expenses to the extent necessary to cap the Fund’s Total Annual Fund Operating Expenses After Fee Waivers at the amounts shown. After this time, the cap may be increased or the commitment to maintain the cap may be terminated only with the approval of the Board of Trustees. Brokerage commissions, stamp duty fees, interest, taxes, acquired fund fees and expenses (if any), and extraordinary expenses are excluded from the expense cap. Without this cap, the Fund’s returns would have been lower. The expense ratio paid by an investor is the net expense ratio (the total annual fund operating expenses after fee waivers) as stated in the prospectuses. |
| 4 | The Russell 1000® Growth Index measures the performance of those Russell 1000 companies with higher price/book ratios and higher forecasted growth values. You cannot invest directly in an index. |
| 5 | The chart compares the performance of Class A shares for the most recent ten years with the Russell 1000® Growth Index. The chart assumes a hypothetical investment of $10,000 in Class A shares and reflects all operating expenses and assumes the maximum initial sales charge of 5.75%. |
| 6 | The ten largest holdings, excluding cash, cash equivalents and any money market funds, are calculated based on the value of the investments divided by total net assets of the Fund. Holdings are subject to change and may have changed since the date specified. |
| 7 | Amounts are calculated based on the total long-term investments of the Fund. These amounts are subject to change and may have changed since the date specified. |
| * | This security was no longer held at the end of the reporting period. |
| | | | |
| 8 | | Wells Fargo Large Cap Growth Fund | | Performance highlights (unaudited) |
MANAGER’S DISCUSSION
Fund highlights
| ∎ | | The Fund outperformed its benchmark, the Russell 1000® Growth Index, for the 12-month period that ended July 31, 2018. |
| ∎ | | Holdings within the information technology (IT), consumer discretionary, and industrials sectors and an underweight to consumer staples aided the Fund’s performance for the period. |
| ∎ | | The Fund’s performance was inhibited by stocks within the health care sector. |
The equity market has remained buoyant over the trailing one-year period as strong economic fundamentals have outweighed a series of geopolitical issues, many of which were exacerbated during the first half of 2018. Strong equity performance largely has been an earnings story as robust profits have supported the market, particularly companies benefiting from secular growth drivers. For example, the success of many of our holdings in gaining share in their respective rapidly growing vertical markets has led to strong growth in revenues, cash flow, and earnings for these companies. Despite the increased volatility that emerged during the beginning of 2018, we have managed to navigate the volatility in the market well and trade around the valuation gap of many of our holdings to generate outperformance. With monetary policy expected to tighten, we believe that a tempered rise in rates is beneficial to faster-growth equities as it mollifies the bond proxy trade when equity investors tend to choose stocks that pay higher dividends and have more moderate and stable growth levels. That trade has been a headwind to our investing style in recent years.
| | | | |
| Ten largest holdings (%) as of July 31, 20186 | |
Amazon.com Incorporated | | | 7.96 | |
Microsoft Corporation | | | 5.98 | |
Alphabet Incorporated Class A | | | 4.65 | |
Facebook Incorporated Class A | | | 4.20 | |
Visa Incorporated Class A | | | 3.64 | |
MasterCard Incorporated Class A | | | 3.64 | |
Microchip Technology Incorporated | | | 3.40 | |
Alphabet Incorporated Class C | | | 3.27 | |
Texas Instruments Incorporated | | | 2.64 | |
PayPal Holdings Incorporated | | | 2.53 | |
Performance of IT holdings benefited Fund performance.
Select holdings within the IT sector were the best-performing area of the Fund. High-growth areas such as payment processing and software-as-a-service were contributors during the period as several holdings generated market-share penetration and margin expansion in their respective vertical markets. Within the payment space, the movement toward e-commerce has had a positive effect on overall demand as more consumers are moving from cash to digital payments. Within software, demand remains strong as corporate spending continues to rise coupled with next-generation cloud-computing platforms garnering a disproportionate
share of new business at the expense of legacy solutions. Other areas of the portfolio that drove performance were companies like Amazon.com, Incorporated, which benefits from a strong ecosystem of approximately 100 million Amazon Prime members. The company continues to execute on various fronts, from logistics to e-commerce to its rapidly growing Amazon Web Services. The portfolio’s underweight to consumer staples also added to relative performance as many high-dividend-yielding equities have struggled in conjunction with a rise in fixed-income yields.
|
| Sector distribution as of July 31, 20187 |
|
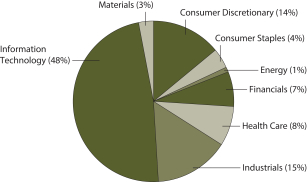 |
Certain health care holdings detracted from performance.
Select holdings in the health care sector inhibited relative returns during the period. Biotechnology stocks like Celgene Corporation* retraced prior price gains after reporting less-than-inspiring earnings results, with increasing competition impending on some of their key drugs. Throughout the course of the period, we reduced our exposure to the health care sector and the biotechnology industry within it. Although we believe that the industry remains innovative, many larger biopharma companies are facing questions around competition in existing core franchises and sustainability of growth after the future loss of exclusivity in key drugs.
Please see footnotes on page 7.
| | | | | | |
| Performance highlights (unaudited) | | Wells Fargo Large Cap Growth Fund | | | 9 | |
We remain underweight consumer discretionary, as changing spending patterns have negatively affected our expectations for the sustainability of growth for many stocks in the sector. Nevertheless, we continue to be attracted to companies whose business models are resistant to e-commerce competition. Some of these holdings include off-price stores and retailers with differentiated concepts that offer convenience, low prices, and economies of scale that cater to a distinct demographic.
Our view of faster-growth stocks is positive.
We are very positive on the outlook for faster-growth stocks, a core focus of our investment process. Many of these companies are trading at attractive valuations relative to the rest of the market. Additionally, many of our portfolio companies continue to deliver strong revenue, cash flow, and earnings growth, which were rewarded by the market during the period. We believe that market leadership by growth stocks has been influenced by strong earnings fundamentals over the past several quarters. We also contend that growth companies should benefit from tax reform, influenced by their ability to retain much of the additional post-tax-reform profits. This is in contrast to many cyclical value-oriented names where, in our analysis, the tax benefits have been largely arbitraged away. Going forward, the faster-growing stocks emphasized in our investment process should continue to drive robust growth through pricing power and strong customer demand in an environment of slightly increased costs and uneven global growth trends.
| | | | |
| 10 | | Wells Fargo Large Cap Growth Fund | | Fund expenses (unaudited) |
As a shareholder of the Fund, you incur two types of costs: (1) transaction costs, including sales charges (loads) on purchase payments and contingent deferred sales charges (if any) on redemptions and (2) ongoing costs, including management fees, distribution (12b-1) and/or shareholder servicing fees, and other Fund expenses. This example is intended to help you understand your ongoing costs (in dollars) of investing in the Fund and to compare these costs with the ongoing costs of investing in other mutual funds.
The example is based on an investment of $1,000 invested at the beginning of the six-month period and held for the entire period from February 1, 2018 to July 31, 2018.
Actual expenses
The “Actual” line of the table below provides information about actual account values and actual expenses. You may use the information in this line, together with the amount you invested, to estimate the expenses that you paid over the period. Simply divide your account value by $1,000 (for example, an $8,600 account value divided by $1,000 = 8.6), then multiply the result by the number in the “Actual” line under the heading entitled “Expenses paid during period” for your applicable class of shares to estimate the expenses you paid on your account during this period.
Hypothetical example for comparison purposes
The “Hypothetical” line of the table below provides information about hypothetical account values and hypothetical expenses based on the Fund’s actual expense ratio and an assumed rate of return of 5% per year before expenses, which is not the Fund’s actual return. The hypothetical account values and expenses may not be used to estimate the actual ending account balance or expenses you paid for the period. You may use this information to compare the ongoing costs of investing in the Fund and other funds. To do so, compare this 5% hypothetical example with the 5% hypothetical examples that appear in the shareholder reports of the other funds.
Please note that the expenses shown in the table are meant to highlight your ongoing costs only and do not reflect any transactional costs, such as sales charges (loads) and contingent deferred sales charges. Therefore, the “Hypothetical” line of the table is useful in comparing ongoing costs only and will not help you determine the relative total costs of owning different funds. In addition, if these transactional costs were included, your costs would have been higher.
| | | | | | | | | | | | | | | | |
| | | Beginning
account value
2-1-2018 | | | Ending
account value
7-31-2018 | | | Expenses
paid during
the period¹ | | | Annualized net
expense ratio | |
Class A | | | | | | | | | | | | | | | | |
Actual | | $ | 1,000.00 | | | $ | 1,043.33 | | | $ | 5.51 | | | | 1.07 | % |
Hypothetical (5% return before expenses) | | $ | 1,000.00 | | | $ | 1,019.81 | | | $ | 5.45 | | | | 1.07 | % |
Class C | | | | | | | | | | | | | | | | |
Actual | | $ | 1,000.00 | | | $ | 1,039.44 | | | $ | 9.36 | | | | 1.82 | % |
Hypothetical (5% return before expenses) | | $ | 1,000.00 | | | $ | 1,016.03 | | | $ | 9.25 | | | | 1.82 | % |
Class R | | | | | | | | | | | | | | | | |
Actual | | $ | 1,000.00 | | | $ | 1,041.97 | | | $ | 6.79 | | | | 1.32 | % |
Hypothetical (5% return before expenses) | | $ | 1,000.00 | | | $ | 1,018.55 | | | $ | 6.72 | | | | 1.32 | % |
Class R4 | | | | | | | | | | | | | | | | |
Actual | | $ | 1,000.00 | | | $ | 1,044.54 | | | $ | 4.12 | | | | 0.80 | % |
Hypothetical (5% return before expenses) | | $ | 1,000.00 | | | $ | 1,021.17 | | | $ | 4.08 | | | | 0.80 | % |
Class R6 | | | | | | | | | | | | | | | | |
Actual | | $ | 1,000.00 | | | $ | 1,045.34 | | | $ | 3.35 | | | | 0.65 | % |
Hypothetical (5% return before expenses) | | $ | 1,000.00 | | | $ | 1,021.93 | | | $ | 3.31 | | | | 0.65 | % |
Administrator Class | | | | | | | | | | | | | | | | |
Actual | | $ | 1,000.00 | | | $ | 1,043.91 | | | $ | 4.89 | | | | 0.95 | % |
Hypothetical (5% return before expenses) | | $ | 1,000.00 | | | $ | 1,020.42 | | | $ | 4.84 | | | | 0.95 | % |
Institutional Class | | | | | | | | | | | | | | | | |
Actual | | $ | 1,000.00 | | | $ | 1,044.88 | | | $ | 3.87 | | | | 0.75 | % |
Hypothetical (5% return before expenses) | | $ | 1,000.00 | | | $ | 1,021.42 | | | $ | 3.82 | | | | 0.75 | % |
| 1 | Expenses paid is equal to the annualized net expense ratio of each class multiplied by the average account value over the period, multiplied by the number of days in the most recent fiscal half-year divided by the number of days in the fiscal year (to reflect the one-half-year period). |
| | | | | | |
| Portfolio of investments—July 31, 2018 | | Wells Fargo Large Cap Growth Fund | | | 11 | |
| | | | | | | | | | | | | | | | |
| Security name | | | | | | | | Shares | | | Value | |
| | | |
Common Stocks: 98.96% | | | | | | | | | | | | | |
| | | | |
Consumer Discretionary: 14.30% | | | | | | | | | | | | | | | | |
| | | |
| Hotels, Restaurants & Leisure: 1.52% | | | | | | | | | | | | | |
Carnival Corporation | | | | | | | | | | | 27,000 | | | $ | 1,599,480 | |
Marriott International Incorporated Class A | | | | | | | | | | | 54,800 | | | | 7,005,632 | |
Norwegian Cruise Line Holdings Limited † | | | | | | | | | | | 149,700 | | | | 7,489,490 | |
| | | | |
| | | | | | | | | | | | | | | 16,094,602 | |
| | | | | | | | | | | | | | | | |
| | | | |
| Internet & Direct Marketing Retail: 9.05% | | | | | | | | | | | | | | | | |
Amazon.com Incorporated † | | | | | | | | | | | 47,500 | | | | 84,428,400 | |
Netflix Incorporated † | | | | | | | | | | | 34,300 | | | | 11,574,535 | |
| | | | |
| | | | | | | | | | | | | | | 96,002,935 | |
| | | | | | | | | | | | | | | | |
| | | | |
| Multiline Retail: 1.84% | | | | | | | | | | | | | | | | |
Dollar Tree Incorporated † | | | | | | | | | | | 213,900 | | | | 19,524,792 | |
| | | | | | | | | | | | | | | | |
| | | | |
| Specialty Retail: 1.89% | | | | | | | | | | | | | | | | |
The Home Depot Incorporated | | | | | | | | | | | 101,600 | | | | 20,068,032 | |
| | | | | | | | | | | | | | | | |
| | | | |
Consumer Staples: 4.26% | | | | | | | | | | | | | | | | |
| | | | |
| Beverages: 2.16% | | | | | | | | | | | | | | | | |
Constellation Brands Incorporated Class A | | | | | | | | | | | 34,100 | | | | 7,168,843 | |
The Coca-Cola Company | | | | | | | | | | | 337,100 | | | | 15,718,973 | |
| | | | |
| | | | | | | | | | | | | | | 22,887,816 | |
| | | | | | | | | | | | | | | | |
| | | | |
| Food & Staples Retailing: 1.11% | | | | | | | | | | | | | | | | |
Costco Wholesale Corporation | | | | | | | | | | | 53,950 | | | | 11,799,405 | |
| | | | | | | | | | | | | | | | |
| | | | |
| Personal Products: 0.99% | | | | | | | | | | | | | | | | |
The Estee Lauder Companies Incorporated Class A | | | | | | | | | | | 78,100 | | | | 10,538,814 | |
| | | | | | | | | | | | | | | | |
| | | | |
Energy: 1.29% | | | | | | | | | | | | | | | | |
| | | | |
| Oil, Gas & Consumable Fuels: 1.29% | | | | | | | | | | | | | | | | |
Concho Resources Incorporated † | | | | | | | | | | | 93,800 | | | | 13,680,730 | |
| | | | | | | | | | | | | | | | |
| | | | |
Financials: 6.29% | | | | | | | | | | | | | | | | |
| | | | |
| Capital Markets: 5.82% | | | | | | | | | | | | | | | | |
CME Group Incorporated | | | | | | | | | | | 106,760 | | | | 16,987,651 | |
Morgan Stanley | | | | | | | | | | | 157,840 | | | | 7,980,390 | |
Raymond James Financial Incorporated | | | | | | | | | | | 118,800 | | | | 10,880,892 | |
The Charles Schwab Corporation | | | | | | | | | | | 507,350 | | | | 25,905,291 | |
| | | | |
| | | | | | | | | | | | | | | 61,754,224 | |
| | | | | | | | | | | | | | | | |
| | | | |
| Insurance: 0.47% | | | | | | | | | | | | | | | | |
The Progressive Corporation | | | | | | | | | | | 83,800 | | | | 5,028,838 | |
| | | | | | | | | | | | | | | | |
The accompanying notes are an integral part of these financial statements.
| | | | |
| 12 | | Wells Fargo Large Cap Growth Fund | | Portfolio of investments—July 31, 2018 |
| | | | | | | | | | | | | | | | |
| Security name | | | | | | | | Shares | | | Value | |
| | | | |
Health Care: 8.10% | | | | | | | | | | | | | | | | |
| | | | |
| Biotechnology: 1.79% | | | | | | | | | | | | | | | | |
BioMarin Pharmaceutical Incorporated † | | | | | | | | | | | 21,200 | | | $ | 2,131,872 | |
Vertex Pharmaceuticals Incorporated † | | | | | | | | | | | 96,280 | | | | 16,853,814 | |
| | | | |
| | | | | | | | | | | | | | | 18,985,686 | |
| | | | | | | | | | | | | | | | |
| | | | |
| Health Care Equipment & Supplies: 3.80% | | | | | | | | | | | | | | | | |
Abbott Laboratories | | | | | | | | | | | 80,400 | | | | 5,269,416 | |
Baxter International Incorporated | | | | | | | | | | | 101,100 | | | | 7,324,695 | |
Boston Scientific Corporation † | | | | | | | | | | | 466,690 | | | | 15,685,451 | |
Edwards Lifesciences Corporation † | | | | | | | | | | | 29,880 | | | | 4,256,406 | |
Stryker Corporation | | | | | | | | | | | 47,700 | | | | 7,787,025 | |
| | | | |
| | | | | | | | | | | | | | | 40,322,993 | |
| | | | | | | | | | | | | | | | |
| | | | |
| Life Sciences Tools & Services: 0.60% | | | | | | | | | | | | | | | | |
Agilent Technologies Incorporated | | | | | | | | | | | 97,000 | | | | 6,405,880 | |
| | | | | | | | | | | | | | | | |
| | | | |
| Pharmaceuticals: 1.91% | | | | | | | | | | | | | | | | |
Zoetis Incorporated | | | | | | | | | | | 234,200 | | | | 20,253,616 | |
| | | | | | | | | | | | | | | | |
| | | | |
Industrials: 14.63% | | | | | | | | | | | | | | | | |
| | | | |
| Aerospace & Defense: 1.79% | | | | | | | | | | | | | | | | |
The Boeing Company | | | | | | | | | | | 53,200 | | | | 18,955,160 | |
| | | | | | | | | | | | | | | | |
| | | | |
| Air Freight & Logistics: 1.73% | | | | | | | | | | | | | | | | |
FedEx Corporation | | | | | | | | | | | 38,450 | | | | 9,453,702 | |
XPO Logistics Incorporated † | | | | | | | | | | | 89,600 | | | | 8,934,912 | |
| | | | |
| | | | | | | | | | | | | | | 18,388,614 | |
| | | | | | | | | | | | | | | | |
| | | | |
| Airlines: 0.90% | | | | | | | | | | | | | | | | |
Southwest Airlines Company | | | | | | | | | | | 163,900 | | | | 9,532,424 | |
| | | | | | | | | | | | | | | | |
| | | | |
| Commercial Services & Supplies: 2.31% | | | | | | | | | | | | | | | | |
KAR Auction Services Incorporated | | | | | | | | | | | 138,950 | | | | 8,260,578 | |
Waste Connections Incorporated | | | | | | | | | | | 208,700 | | | | 16,197,207 | |
| | | | |
| | | | | | | | | | | | | | | 24,457,785 | |
| | | | | | | | | | | | | | | | |
| | | | |
| Electrical Equipment: 0.80% | | | | | | | | | | | | | | | | |
Rockwell Automation Incorporated | | | | | | | | | | | 45,400 | | | | 8,515,224 | |
| | | | | | | | | | | | | | | | |
| | | | |
| Industrial Conglomerates: 1.54% | | | | | | | | | | | | | | | | |
3M Company | | | | | | | | | | | 36,600 | | | | 7,770,912 | |
Roper Industries Incorporated | | | | | | | | | | | 28,300 | | | | 8,543,770 | |
| | | | |
| | | | | | | | | | | | | | | 16,314,682 | |
| | | | | | | | | | | | | | | | |
| | | | |
| Machinery: 0.93% | | | | | | | | | | | | | | | | |
Fortive Corporation | | | | | | | | | | | 120,500 | | | | 9,890,640 | |
| | | | | | | | | | | | | | | | |
The accompanying notes are an integral part of these financial statements.
| | | | | | |
| Portfolio of investments—July 31, 2018 | | Wells Fargo Large Cap Growth Fund | | | 13 | |
| | | | | | | | | | | | | | | | |
| Security name | | | | | | | | Shares | | | Value | |
| | | | |
| Road & Rail: 4.63% | | | | | | | | | | | | | | | | |
CSX Corporation | | | | | | | | | | | 111,200 | | | $ | 7,859,616 | |
Norfolk Southern Corporation | | | | | | | | | | | 126,610 | | | | 21,397,090 | |
Union Pacific Corporation | | | | | | | | | | | 132,900 | | | | 19,920,381 | |
| | | | |
| | | | | | | | | | | | | | | 49,177,087 | |
| | | | | | | | | | | | | | | | |
| | | | |
Information Technology: 47.04% | | | | | | | | | | | | | | | | |
| | | | |
| Internet Software & Services: 13.18% | | | | | | | | | | | | | | | | |
Alibaba Group Holding Limited ADR † | | | | | | | | | | | 22,900 | | | | 4,287,567 | |
Alphabet Incorporated Class A † | | | | | | | | | | | 40,200 | | | | 49,334,244 | |
Alphabet Incorporated Class C † | | | | | | | | | | | 28,500 | | | | 34,691,910 | |
eBay Incorporated † | | | | | | | | | | | 25,800 | | | | 863,010 | |
Facebook Incorporated Class A † | | | | | | | | | | | 258,300 | | | | 44,577,414 | |
Shopify Incorporated Class A †« | | | | | | | | | | | 44,100 | | | | 6,095,061 | |
| | | | |
| | | | | | | | | | | | | | | 139,849,206 | |
| | | | | | | | | | | | | | | | |
| | | | |
| IT Services: 11.87% | | | | | | | | | | | | | | | | |
MasterCard Incorporated Class A | | | | | | | | | | | 195,100 | | | | 38,629,800 | |
PayPal Holdings Incorporated † | | | | | | | | | | | 326,300 | | | | 26,802,282 | |
Square Incorporated Class A † | | | | | | | | | | | 214,600 | | | | 13,873,890 | |
Visa Incorporated Class A | | | | | | | | | | | 282,700 | | | | 38,656,398 | |
Worldpay Incorporated Class A † | | | | | | | | | | | 96,700 | | | | 7,947,773 | |
| | | | |
| | | | | | | | | | | | | | | 125,910,143 | |
| | | | | | | | | | | | | | | | |
| | | | |
| Semiconductors & Semiconductor Equipment: 7.29% | | | | | | | | | | | | | | | | |
Microchip Technology Incorporated « | | | | | | | | | | | 386,480 | | | | 36,108,826 | |
NVIDIA Corporation | | | | | | | | | | | 53,940 | | | | 13,207,748 | |
Texas Instruments Incorporated | | | | | | | | | | | 251,500 | | | | 27,996,980 | |
| | | | |
| | | | | | | | | | | | | | | 77,313,554 | |
| | | | | | | | | | | | | | | | |
| | | | |
| Software: 12.69% | | | | | | | | | | | | | | | | |
Activision Blizzard Incorporated | | | | | | | | | | | 167,530 | | | | 12,300,053 | |
Adobe Systems Incorporated † | | | | | | | | | | | 56,900 | | | | 13,922,292 | |
Electronic Arts Incorporated † | | | | | | | | | | | 43,700 | | | | 5,626,375 | |
Microsoft Corporation | | | | | | | | | | | 597,700 | | | | 63,404,016 | |
Salesforce.com Incorporated † | | | | | | | | | | | 112,800 | | | | 15,470,520 | |
ServiceNow Incorporated † | | | | | | | | | | | 54,000 | | | | 9,501,840 | |
Splunk Incorporated † | | | | | | | | | | | 53,410 | | | | 5,132,701 | |
Ultimate Software Group Incorporated † | | | | | | | | | | | 19,300 | | | | 5,343,977 | |
VMware Incorporated Class A † | | | | | | | | | | | 26,900 | | | | 3,889,471 | |
| | | | |
| | | | | | | | | | | | | | | 134,591,245 | |
| | | | | | | | | | | | | | | | |
| | | | |
| Technology Hardware, Storage & Peripherals: 2.01% | | | | | | | | | | | | | | | | |
Apple Incorporated | | | | | | | | | | | 112,300 | | | | 21,369,567 | |
| | | | | | | | | | | | | | | | |
The accompanying notes are an integral part of these financial statements.
| | | | |
| 14 | | Wells Fargo Large Cap Growth Fund | | Portfolio of investments—July 31, 2018 |
| | | | | | | | | | | | | | | | |
| Security name | | | | | | | | Shares | | | Value | |
| | | | |
Materials: 3.05% | | | | | | | | | | | | | | | | |
| | | | |
| Chemicals: 3.05% | | | | | | | | | | | | | | | | |
Air Products & Chemicals Incorporated | | | | | | | | | | | 61,200 | | | $ | 10,047,204 | |
Praxair Incorporated | | | | | | | | | | | 132,900 | | | | 22,260,750 | |
| | | | |
| | | | | | | | | | | | | | | 32,307,954 | |
| | | | | | | | | | | | | | | | |
| | | | |
Total Common Stocks (Cost $498,895,223) | | | | | | | | | | | | | | | 1,049,921,648 | |
| | | | | | | | | | | | | | | | |
| | | | |
| | | Yield | | | | | | | | | | |
| Short-Term Investments: 4.62% | | | | | | | | | | | | | | | | |
| | | | |
| Investment Companies: 4.62% | | | | | | | | | | | | | | | | |
Securities Lending Cash Investment LLC (l)(r)(u) | | | 2.10 | % | | | | | | | 38,751,625 | | | | 38,755,500 | |
Wells Fargo Government Money Market Fund Select Class (l)(u) | | | 1.83 | | | | | | | | 10,229,653 | | | | 10,229,653 | |
| | | | |
Total Short-Term Investments (Cost $48,985,153) | | | | | | | | | | | | | | | 48,985,153 | |
| | | | | | | | | | | | | | | | |
| | | | | | | | |
| Total investments in securities (Cost $547,880,376) | | | 103.58 | % | | | 1,098,906,801 | |
Other assets and liabilities, net | | | (3.58 | ) | | | (37,971,348 | ) |
| | | | | | | | |
| Total net assets | | | 100.00 | % | | $ | 1,060,935,453 | |
| | | | | | | | |
| † | Non-income-earning security |
| « | All or a portion of this security is on loan. |
| (l) | The issuer of the security is an affiliated person of the Fund as defined in the Investment Company Act of 1940. |
| (r) | The investment is a non-registered investment company purchased with cash collateral received from securities on loan. |
| (u) | The rate represents the 7-day annualized yield at period end. |
Abbreviations:
| ADR | American depositary receipt |
Investments in Affiliates
An affiliated investment is an investment in which the Fund owns at least 5% of the outstanding voting shares of the issuer or as a result of other relationships, such as the Fund and the issuer having the same investment manager. Transactions with issuers that were either affiliated persons of the Fund at the beginning of the period or the end of the period were as follows:
| | | | | | | | | | | | | | | | | | | | | | | | | | | | | | | | | | | | |
| | | Shares,
beginning of
period | | | Shares
purchased | | | Shares
sold | | | Shares,
end of
period | | | Net
realized
gains
(losses) | | | Net
change in
unrealized
gains
(losses) | | | Income
from
affiliated
securities | | | Value,
end
of period | | | % of
net
assets | |
Short-Term Investments | | | | | | | | | | | | | | | | | | | | | | | | | | | | | | | | | | | | |
Investment Companies | | | | | | | | | | | | | | | | | | | | | | | | | | | | | | | | | | | | |
Securities Lending Cash Investment LLC | | | 3,647,110 | | | | 448,561,630 | | | | 413,457,115 | | | | 38,751,625 | | | $ | 0 | | | $ | 0 | | | $ | 66,527 | | | $ | 38,755,500 | | | | | |
Wells Fargo Government Money Market Fund Select Class | | | 14,826,435 | | | | 215,460,715 | | | | 220,057,497 | | | | 10,229,653 | | | | 0 | | | | 0 | | | | 116,890 | | | | 10,229,653 | | | | | |
| | | | | | | | | | | | | | | | | | | | | | | | | | | | | | | | | | | | |
| | | | | | | | | | | | | | | | | | $ | 0 | | | $ | 0 | | | $ | 183,417 | | | $ | 48,985,153 | | | | 4.62 | % |
| | | | | | | | | | | | | | | | | | | | | | | | | | | | | | | | | | | | |
The accompanying notes are an integral part of these financial statements.
| | | | | | |
| Statement of assets and liabilities—July 31, 2018 | | Wells Fargo Large Cap Growth Fund | | | 15 | |
| | | | |
| | | | |
| |
Assets | | | | |
Investments in unaffiliated securities (including $37,613,036 of securities loaned), at value (cost $498,895,223) | | $ | 1,049,921,648 | |
Investments in affiliated securities, at value (cost $48,985,153) | | | 48,985,153 | |
Receivable for investments sold | | | 2,150,741 | |
Receivable for Fund shares sold | | | 207,379 | |
Receivable for dividends | | | 346,172 | |
Receivable for securities lending income | | | 5,643 | |
Prepaid expenses and other assets | | | 47,119 | |
| | | | |
Total assets | | | 1,101,663,855 | |
| | | | |
| |
Liabilities | | | | |
Payable upon receipt of securities loaned | | | 38,754,053 | |
Payable for Fund shares redeemed | | | 699,730 | |
Management fee payable | | | 513,250 | |
Payable for investments purchased | | | 422,401 | |
Administration fees payable | | | 128,293 | |
Distribution fees payable | | | 11,284 | |
Trustees’ fees and expenses payable | | | 1,388 | |
Accrued expenses and other liabilities | | | 198,003 | |
| | | | |
Total liabilities | | | 40,728,402 | |
| | | | |
Total net assets | | $ | 1,060,935,453 | |
| | | | |
| |
NET ASSETS CONSIST OF | | | | |
Paid-in capital | | $ | 345,691,827 | |
Undistributed net investment income | | | 112,534 | |
Accumulated net realized gains on investments | | | 164,104,667 | |
Net unrealized gains on investments | | | 551,026,425 | |
| | | | |
Total net assets | | $ | 1,060,935,453 | |
| | | | |
| |
COMPUTATION OF NET ASSET VALUE AND OFFERING PRICE PER SHARE | | | | |
Net assets – Class A | | $ | 534,694,073 | |
Shares outstanding – Class A1 | | | 10,281,051 | |
Net asset value per share – Class A | | | $52.01 | |
Maximum offering price per share – Class A2 | | | $55.18 | |
Net assets – Class C | | $ | 15,585,775 | |
Shares outstanding – Class C1 | | | 324,923 | |
Net asset value per share – Class C | | | $47.97 | |
Net assets – Class R | | $ | 5,660,717 | |
Shares outstanding – Class R1 | | | 111,240 | |
Net asset value per share – Class R | | | $50.89 | |
Net assets – Class R4 | | $ | 2,089,406 | |
Share outstanding – Class R41 | | | 39,251 | |
Net asset value per share – Class R4 | | | $53.23 | |
Net assets – Class R6 | | $ | 327,942,986 | |
Shares outstanding – Class R61 | | | 6,130,971 | |
Net asset value per share – Class R6 | | | $53.49 | |
Net assets – Administrator Class | | $ | 79,153,535 | |
Shares outstanding – Administrator Class1 | | | 1,506,605 | |
Net asset value per share – Administrator Class | | | $52.54 | |
Net assets – Institutional Class | | $ | 95,808,961 | |
Shares outstanding – Institutional Class1 | | | 1,797,179 | |
Net asset value per share – Institutional Class | | | $53.31 | |
| 1 | The Fund has an unlimited number of authorized shares. |
| 2 | Maximum offering price is computed as 100/94.25 of net asset value. On investments of $50,000 or more, the offering price is reduced. |
The accompanying notes are an integral part of these financial statements.
| | | | |
| 16 | | Wells Fargo Large Cap Growth Fund | | Statement of operations—year ended July 31, 2018 |
| | | | |
| | | | |
| |
Investment income | | | | |
Dividends (net of foreign withholding taxes of $17,694) | | $ | 9,773,407 | |
Income from affiliated securities | | | 183,417 | |
| | | | |
Total investment income | | | 9,956,824 | |
| | | | |
| |
Expenses | | | | |
Management fee | | | 7,439,928 | |
Administration fees | |
Class A | | | 1,092,003 | |
Class C | | | 31,919 | |
Class R | | | 12,775 | |
Class R4 | | | 941 | |
Class R6 | | | 102,800 | |
Administrator Class | | | 96,387 | |
Institutional Class | | | 165,932 | |
Shareholder servicing fees | |
Class A | | | 1,300,004 | |
Class C | | | 37,998 | |
Class R | | | 14,751 | |
Class R4 | | | 1,176 | |
Administrator Class | | | 185,360 | |
Distribution fees | | | | |
Class C | | | 113,994 | |
Class R | | | 15,208 | |
Custody and accounting fees | | | 43,534 | |
Professional fees | | | 42,760 | |
Registration fees | | | 116,044 | |
Shareholder report expenses | | | 78,234 | |
Trustees’ fees and expenses | | | 20,331 | |
Other fees and expenses | | | 26,553 | |
| | | | |
Total expenses | | | 10,938,632 | |
Less: Fee waivers and/or expense reimbursements | | | (1,119,272 | ) |
| | | | |
Net expenses | | | 9,819,360 | |
| | | | |
Net investment income | | | 137,464 | |
| | | | |
| |
REALIZED AND UNREALIZED GAINS (LOSSES) ON INVESTMENTS | | | | |
Net realized gains on investments | | | 234,857,518 | |
Net change in unrealized gains (losses) on investments | | | 33,368,008 | |
| | | | |
Net realized and unrealized gains (losses) on investments | | | 268,225,526 | |
| | | | |
Net increase in net assets resulting from operations | | $ | 268,362,990 | |
| | | | |
The accompanying notes are an integral part of these financial statements.
| | | | | | |
| Statement of changes in net assets | | Wells Fargo Large Cap Growth Fund | | | 17 | |
| | | | | | | | | | | | | | | | |
| | | Year ended
July 31, 2018 | | | Year ended
July 31, 2017 | |
| | | | |
Operations | | | | | | | | | | | | | | | | |
Net investment income | | | | | | $ | 137,464 | | | | | | | $ | 1,325,530 | |
Net realized gains on investments | | | | | | | 234,857,518 | | | | | | | | 162,163,835 | |
Net change in unrealized gains (losses) on investments | | | | | | | 33,368,008 | | | | | | | | 387,141 | |
| | | | |
Net increase in net assets resulting from operations | | | | | | | 268,362,990 | | | | | | | | 163,876,506 | |
| | | | |
| | | | |
Distributions to shareholders from | | | | | | | | | | | | | | | | |
Net investment income | | | | | | | | | | | | | | | | |
Class R4 | | | | | | | 0 | | | | | | | | (9,195 | ) |
Class R6 | | | | | | | (368,832 | ) | | | | | | | (472,646 | ) |
Administrator Class | | | | | | | 0 | | | | | | | | (63,610 | ) |
Institutional Class | | | | | | | (76,634 | ) | | | | | | | (294,392 | ) |
Net realized gains | | | | | | | | | | | | | | | | |
Class A | | | | | | | (94,299,274 | ) | | | | | | | (26,874,841 | ) |
Class C | | | | | | | (2,995,367 | ) | | | | | | | (872,051 | ) |
Class R | | | | | | | (1,226,176 | ) | | | | | | | (365,902 | ) |
Class R4 | | | | | | | (86,325 | ) | | | | | | | (424,319 | ) |
Class R6 | | | | | | | (60,525,258 | ) | | | | | | | (13,853,634 | ) |
Administrator Class | | | | | | | (12,791,477 | ) | | | | | | | (10,174,259 | ) |
Institutional Class | | | | | | | (29,516,610 | ) | | | | | | | (11,729,550 | ) |
| | | | |
Total distributions to shareholders | | | | | | | (201,885,953 | ) | | | | | | | (65,134,399 | ) |
| | | | |
| | | | |
Capital share transactions | | | Shares | | | | | | | | Shares | | | | | |
Proceeds from shares sold | | | | | | | | | | | | | | | | |
Class A | | | 350,829 | | | | 17,319,919 | | | | 426,944 | | | | 19,594,139 | |
Class C | | | 45,353 | | | | 2,068,446 | | | | 29,111 | | | | 1,256,023 | |
Class R | | | 59,909 | | | | 2,827,726 | | | | 59,408 | | | | 2,657,278 | |
Class R4 | | | 35,016 | | | | 1,707,466 | | | | 32,423 | | | | 1,499,183 | |
Class R6 | | | 1,558,098 | | | | 79,758,923 | | | | 2,266,868 | | | | 106,883,116 | |
Administrator Class | | | 200,283 | | | | 10,104,338 | | | | 538,207 | | | | 24,604,747 | |
Institutional Class | | | 238,407 | | | | 12,259,125 | | | | 757,332 | | | | 35,288,511 | |
| | | | |
| | | | | | | 126,045,943 | | | | | | | | 191,782,997 | |
| | | | |
Reinvestment of distributions | | | | | | | | | | | | | | | | |
Class A | | | 1,969,729 | | | | 89,405,992 | | | | 579,132 | | | | 25,111,167 | |
Class C | | | 60,978 | | | | 2,564,729 | | | | 17,868 | | | | 734,193 | |
Class R | | | 3,414 | | | | 151,866 | | | | 934 | | | | 39,944 | |
Class R4 | | | 1,781 | | | | 82,592 | | | | 9,844 | | | | 433,514 | |
Class R6 | | | 1,305,992 | | | | 60,875,276 | | | | 324,173 | | | | 14,326,280 | |
Administrator Class | | | 278,848 | | | | 12,776,830 | | | | 234,472 | | | | 10,234,532 | |
Institutional Class | | | 442,110 | | | | 20,540,888 | | | | 204,593 | | | | 9,023,692 | |
| | �� | | |
| | | | | | | 186,398,173 | | | | | | | | 59,903,322 | |
| | | | |
Payment for shares redeemed | | | | | | | | | | | | | | | | |
Class A | | | (2,346,522 | ) | | | (122,033,744 | ) | | | (3,218,869 | ) | | | (147,540,890 | ) |
Class C | | | (91,221 | ) | | | (4,306,948 | ) | | | (167,349 | ) | | | (7,261,013 | ) |
Class R | | | (81,531 | ) | | | (3,970,677 | ) | | | (111,516 | ) | | | (5,013,319 | ) |
Class R4 | | | (4,157 | ) | | | (212,862 | ) | | | (215,577 | ) | | | (10,318,581 | ) |
Class R6 | | | (2,739,730 | ) | | | (142,658,457 | ) | | | (1,407,477 | ) | | | (66,431,975 | ) |
Administrator Class | | | (576,443 | ) | | | (29,889,749 | ) | | | (4,298,307 | ) | | | (200,619,787 | ) |
Institutional Class | | | (2,213,468 | ) | | | (110,506,781 | ) | | | (4,398,813 | ) | | | (209,337,854 | ) |
| | | | |
| | | | | | | (413,579,218 | ) | | | | | | | (646,523,419 | ) |
| | | | |
Net decrease in net assets resulting from capital share transactions | | | | | | | (101,135,102 | ) | | | | | | | (394,837,100 | ) |
| | | | |
Total decrease in net assets | | | | | | | (34,658,065 | ) | | | | | | | (296,094,993 | ) |
| | | | |
| | | | |
Net assets | | | | | | | | | | | | | | | | |
Beginning of period | | | | | | | 1,095,593,518 | | | | | | | | 1,391,688,511 | |
| | | | |
End of period | | | | | | $ | 1,060,935,453 | | | | | | | $ | 1,095,593,518 | |
| | | | |
Undistributed net investment income | | | | | | $ | 112,534 | | | | | | | $ | 420,504 | |
| | | | |
The accompanying notes are an integral part of these financial statements.
| | | | |
| 18 | | Wells Fargo Large Cap Growth Fund | | Financial highlights |
(For a share outstanding throughout each period)
| | | | | | | | | | | | | | | | | | | | |
| | | Year ended July 31 | |
| CLASS A | | 2018 | | | 2017 | | | 2016 | | | 2015 | | | 2014 | |
Net asset value, beginning of period | | | $50.10 | | | | $46.05 | | | | $49.55 | | | | $45.30 | | | | $39.73 | |
Net investment loss | | | (0.08 | ) | | | (0.03 | )1 | | | (0.03 | )1 | | | (0.01 | )1 | | | (0.06 | ) |
Net realized and unrealized gains (losses) on investments | | | 12.56 | | | | 6.39 | | | | (0.92 | ) | | | 6.33 | | | | 7.01 | |
| | | | | | | | | | | | | | | | | | | | |
Total from investment operations | | | 12.48 | | | | 6.36 | | | | (0.95 | ) | | | 6.32 | | | | 6.95 | |
Distributions to shareholders from | | | | | | | | | | | | | | | | | | | | |
Net investment income | | | 0.00 | | | | 0.00 | | | | (0.00 | )2 | | | 0.00 | | | | 0.00 | |
Net realized gains | | | (10.57 | ) | | | (2.31 | ) | | | (2.55 | ) | | | (2.07 | ) | | | (1.38 | ) |
| | | | | | | | | | | | | | | | | | | | |
Total distributions to shareholders | | | (10.57 | ) | | | (2.31 | ) | | | (2.55 | ) | | | (2.07 | ) | | | (1.38 | ) |
Net asset value, end of period | | | $52.01 | | | | $50.10 | | | | $46.05 | | | | $49.55 | | | | $45.30 | |
Total return3 | | | 27.98 | % | | | 14.60 | % | | | (1.83 | )% | | | 14.35 | % | | | 17.69 | % |
Ratios to average net assets (annualized) | | | | | | | | | | | | | | | | | | | | |
Gross expenses | | | 1.17 | % | | | 1.17 | % | | | 1.16 | % | | | 1.20 | % | | | 1.22 | % |
Net expenses | | | 1.07 | % | | | 1.07 | % | | | 1.07 | % | | | 1.07 | % | | | 1.07 | % |
Net investment loss | | | (0.16 | )% | | | (0.06 | )% | | | (0.06 | )% | | | (0.02 | )% | | | (0.17 | )% |
Supplemental data | | | | | | | | | | | | | | | | | | | | |
Portfolio turnover rate | | | 34 | % | | | 40 | % | | | 31 | % | | | 26 | % | | | 35 | % |
Net assets, end of period (000s omitted) | | | $534,694 | | | | $516,410 | | | | $576,502 | | | | $184,504 | | | | $212,273 | |
| 1 | Calculated based upon average shares outstanding |
| 2 | Amount is less than $0.005. |
| 3 | Total return calculations do not include any sales charges. |
The accompanying notes are an integral part of these financial statements.
| | | | | | |
| Financial highlights | | Wells Fargo Large Cap Growth Fund | | | 19 | |
(For a share outstanding throughout each period)
| | | | | | | | | | | | | | | | | | | | |
| | | Year ended July 31 | |
| CLASS C | | 2018 | | | 2017 | | | 2016 | | | 2015 | | | 2014 | |
Net asset value, beginning of period | | | $47.25 | | | | $43.88 | | | | $47.68 | | | | $43.99 | | | | $38.90 | |
Net investment loss | | | (0.31 | ) | | | (0.35 | )1 | | | (0.32 | )1 | | | (0.42 | ) | | | (0.33 | ) |
Net realized and unrealized gains (losses) on investments | | | 11.60 | | | | 6.03 | | | | (0.93 | ) | | | 6.18 | | | | 6.80 | |
| | | | | | | | | | | | | | | | | | | | |
Total from investment operations | | | 11.29 | | | | 5.68 | | | | (1.25 | ) | | | 5.76 | | | | 6.47 | |
Distributions to shareholders from | | | | | | | | | | | | | | | | | | | | |
Net realized gains | | | (10.57 | ) | | | (2.31 | ) | | | (2.55 | ) | | | (2.07 | ) | | | (1.38 | ) |
Net asset value, end of period | | | $47.97 | | | | $47.25 | | | | $43.88 | | | | $47.68 | | | | $43.99 | |
Total return2 | | | 27.03 | % | | | 13.74 | % | | | (2.56 | )% | | | 13.47 | % | | | 16.81 | % |
Ratios to average net assets (annualized) | | | | | | | | | | | | | | | | | | | | |
Gross expenses | | | 1.92 | % | | | 1.91 | % | | | 1.91 | % | | | 1.95 | % | | | 1.97 | % |
Net expenses | | | 1.82 | % | | | 1.82 | % | | | 1.82 | % | | | 1.82 | % | | | 1.82 | % |
Net investment loss | | | (0.90 | )% | | | (0.81 | )% | | | (0.75 | )% | | | (0.77 | )% | | | (0.89 | )% |
Supplemental data | | | | | | | | | | | | | | | | | | | | |
Portfolio turnover rate | | | 34 | % | | | 40 | % | | | 31 | % | | | 26 | % | | | 35 | % |
Net assets, end of period (000s omitted) | | | $15,586 | | | | $14,640 | | | | $18,877 | | | | $22,839 | | | | $22,767 | |
| 1 | Calculated based upon average shares outstanding |
| 2 | Total return calculations do not include any sales charges. |
The accompanying notes are an integral part of these financial statements.
| | | | |
| 20 | | Wells Fargo Large Cap Growth Fund | | Financial highlights |
(For a share outstanding throughout each period)
| | | | | | | | | | | | | | | | | | | | |
| | | Year ended July 31 | |
| CLASS R | | 2018 | | | 2017 | | | 2016 | | | 2015 | | | 2014 | |
Net asset value, beginning of period | | | $49.34 | | | | $45.50 | | | | $49.11 | | | | $45.03 | | | | $39.59 | |
Net investment loss | | | (0.20 | )1 | | | (0.14 | )1 | | | (0.10 | )1 | | | (0.16 | )1 | | | (0.15 | ) |
Net realized and unrealized gains (losses) on investments | | | 12.32 | | | | 6.29 | | | | (0.96 | ) | | | 6.31 | | | | 6.97 | |
| | | | | | | | | | | | | | | | | | | | |
Total from investment operations | | | 12.12 | | | | 6.15 | | | | (1.06 | ) | | | 6.15 | | | | 6.82 | |
Distributions to shareholders from | | | | | | | | | | | | | | | | | | | | |
Net realized gains | | | (10.57 | ) | | | (2.31 | ) | | | (2.55 | ) | | | (2.07 | ) | | | (1.38 | ) |
Net asset value, end of period | | | $50.89 | | | | $49.34 | | | | $45.50 | | | | $49.11 | | | | $45.03 | |
Total return | | | 27.65 | % | | | 14.30 | % | | | (2.08 | )% | | | 14.05 | % | | | 17.42 | % |
Ratios to average net assets (annualized) | | | | | | | | | | | | | | | | | | | | |
Gross expenses | | | 1.42 | % | | | 1.41 | % | | | 1.41 | % | | | 1.45 | % | | | 1.47 | % |
Net expenses | | | 1.32 | % | | | 1.32 | % | | | 1.32 | % | | | 1.32 | % | | | 1.32 | % |
Net investment loss | | | (0.40 | )% | | | (0.31 | )% | | | (0.23 | )% | | | (0.28 | )% | | | (0.41 | )% |
Supplemental data | | | | | | | | | | | | | | | | | | | | |
Portfolio turnover rate | | | 34 | % | | | 40 | % | | | 31 | % | | | 26 | % | | | 35 | % |
Net assets, end of period (000s omitted) | | | $5,661 | | | | $6,387 | | | | $8,218 | | | | $12,086 | | | | $12,295 | |
| 1 | Calculated based upon average shares outstanding |
The accompanying notes are an integral part of these financial statements.
| | | | | | |
| Financial highlights | | Wells Fargo Large Cap Growth Fund | | | 21 | |
(For a share outstanding throughout each period)
| | | | | | | | | | | | | | | | | | | | |
| | | Year ended July 31 | |
| CLASS R4 | | 2018 | | | 2017 | | | 2016 | | | 2015 | | | 2014 | |
Net asset value, beginning of period | | | $50.94 | | | | $46.69 | | | | $50.23 | | | | $45.76 | | | | $40.05 | |
Net investment income | | | 0.05 | 1 | | | 0.11 | 1 | | | 0.13 | | | | 0.07 | | | | 0.08 | |
Net realized and unrealized gains (losses) on investments | | | 12.81 | | | | 6.50 | | | | (0.95 | ) | | | 6.47 | | | | 7.11 | |
| | | | | | | | | | | | | | | | | | | | |
Total from investment operations | | | 12.86 | | | | 6.61 | | | | (0.82 | ) | | | 6.54 | | | | 7.19 | |
Distributions to shareholders from | | | | | | | | | | | | | | | | | | | | |
Net investment income | | | 0.00 | | | | (0.05 | ) | | | (0.17 | ) | | | 0.00 | | | | (0.10 | ) |
Net realized gains | | | (10.57 | ) | | | (2.31 | ) | | | (2.55 | ) | | | (2.07 | ) | | | (1.38 | ) |
| | | | | | | | | | | | | | | | | | | | |
Total distributions to shareholders | | | (10.57 | ) | | | (2.36 | ) | | | (2.72 | ) | | | (2.07 | ) | | | (1.48 | ) |
Net asset value, end of period | | | $53.23 | | | | $50.94 | | | | $46.69 | | | | $50.23 | | | | $45.76 | |
Total return | | | 28.31 | % | | | 14.96 | % | | | (1.54 | )% | | | 14.69 | % | | | 18.07 | % |
Ratios to average net assets (annualized) | | | | | | | | | | | | | | | | | | | | |
Gross expenses | | | 0.90 | % | | | 0.88 | % | | | 0.88 | % | | | 0.87 | % | | | 0.89 | % |
Net expenses | | | 0.80 | % | | | 0.80 | % | | | 0.78 | % | | | 0.75 | % | | | 0.75 | % |
Net investment income | | | 0.10 | % | | | 0.25 | % | | | 0.27 | % | | | 0.17 | % | | | 0.17 | % |
Supplemental data | | | | | | | | | | | | | | | | | | | | |
Portfolio turnover rate | | | 34 | % | | | 40 | % | | | 31 | % | | | 26 | % | | | 35 | % |
Net assets, end of period (000s omitted) | | | $2,089 | | | | $337 | | | | $8,400 | | | | $7,205 | | | | $2,129 | |
| 1 | Calculated based upon average shares outstanding |
The accompanying notes are an integral part of these financial statements.
| | | | |
| 22 | | Wells Fargo Large Cap Growth Fund | | Financial highlights |
(For a share outstanding throughout each period)
| | | | | | | | | | | | | | | | | | | | |
| | | Year ended July 31 | |
| CLASS R6 | | 2018 | | | 2017 | | | 2016 | | | 2015 | | | 2014 | |
Net asset value, beginning of period | | | $51.12 | | | | $46.82 | | | | $50.34 | | | | $45.82 | | | | $40.11 | |
Net investment income | | | 0.14 | | | | 0.17 | | | | 0.22 | | | | 0.07 | 1 | | | 0.12 | |
Net realized and unrealized gains (losses) on investments | | | 12.85 | | | | 6.52 | | | | (0.97 | ) | | | 6.56 | | | | 7.11 | |
| | | | | | | | | | | | | | | | | | | | |
Total from investment operations | | | 12.99 | | | | 6.69 | | | | (0.75 | ) | | | 6.63 | | | | 7.23 | |
Distributions to shareholders from | | | | | | | | | | | | | | | | | | | | |
Net investment income | | | (0.05 | ) | | | (0.08 | ) | | | (0.22 | ) | | | (0.04 | ) | | | (0.14 | ) |
Net realized gains | | | (10.57 | ) | | | (2.31 | ) | | | (2.55 | ) | | | (2.07 | ) | | | (1.38 | ) |
| | | | | | | | | | | | | | | | | | | | |
Total distributions to shareholders | | | (10.62 | ) | | | (2.39 | ) | | | (2.77 | ) | | | (2.11 | ) | | | (1.52 | ) |
Net asset value, end of period | | | $53.49 | | | | $51.12 | | | | $46.82 | | | | $50.34 | | | | $45.82 | |
Total return | | | 28.51 | % | | | 15.09 | % | | | (1.39 | )% | | | 14.88 | % | | | 18.25 | % |
Ratios to average net assets (annualized) | | | | | | | | | | | | | | | | | | | | |
Gross expenses | | | 0.75 | % | | | 0.74 | % | | | 0.73 | % | | | 0.72 | % | | | 0.74 | % |
Net expenses | | | 0.65 | % | | | 0.65 | % | | | 0.64 | % | | | 0.60 | % | | | 0.60 | % |
Net investment income | | | 0.27 | % | | | 0.36 | % | | | 0.39 | % | | | 0.13 | % | | | 0.29 | % |
Supplemental data | | | | | | | | | | | | | | | | | | | | |
Portfolio turnover rate | | | 34 | % | | | 40 | % | | | 31 | % | | | 26 | % | | | 35 | % |
Net assets, end of period (000s omitted) | | | $327,943 | | | | $307,048 | | | | $225,805 | | | | $117,741 | | | | $5,942 | |
| 1 | Calculated based upon average shares outstanding |
The accompanying notes are an integral part of these financial statements.
| | | | | | |
| Financial highlights | | Wells Fargo Large Cap Growth Fund | | | 23 | |
(For a share outstanding throughout each period)
| | | | | | | | | | | | | | | | | | | | |
| | | Year ended July 31 | |
| ADMINISTRATOR CLASS | | 2018 | | | 2017 | | | 2016 | | | 2015 | | | 2014 | |
Net asset value, beginning of period | | | $50.46 | | | | $46.32 | | | | $49.84 | | | | $45.50 | | | | $39.86 | |
Net investment income (loss) | | | (0.01 | ) | | | 0.05 | | | | 0.05 | | | | 0.05 | | | | (0.01 | ) |
Net realized and unrealized gains (losses) on investments | | | 12.66 | | | | 6.41 | | | | (0.94 | ) | | | 6.36 | | | | 7.04 | |
| | | | | | | | | | | | | | | | | | | | |
Total from investment operations | | | 12.65 | | | | 6.46 | | | | (0.89 | ) | | | 6.41 | | | | 7.03 | |
Distributions to shareholders from | | | | | | | | | | | | | | | | | | | | |
Net investment income | | | 0.00 | | | | (0.01 | ) | | | (0.08 | ) | | | 0.00 | | | | (0.01 | ) |
Net realized gains | | | (10.57 | ) | | | (2.31 | ) | | | (2.55 | ) | | | (2.07 | ) | | | (1.38 | ) |
| | | | | | | | | | | | | | | | | | | | |
Total distributions to shareholders | | | (10.57 | ) | | | (2.32 | ) | | | (2.63 | ) | | | (2.07 | ) | | | (1.39 | ) |
Net asset value, end of period | | | $52.54 | | | | $50.46 | | | | $46.32 | | | | $49.84 | | | | $45.50 | |
Total return | | | 28.14 | % | | | 14.75 | % | | | (1.71 | )% | | | 14.48 | % | | | 17.84 | % |
Ratios to average net assets (annualized) | | | | | | | | | | | | | | | | | | | | |
Gross expenses | | | 1.09 | % | | | 1.08 | % | | | 1.08 | % | | | 1.05 | % | | | 1.06 | % |
Net expenses | | | 0.95 | % | | | 0.95 | % | | | 0.95 | % | | | 0.95 | % | | | 0.95 | % |
Net investment income (loss) | | | (0.03 | )% | | | 0.06 | % | | | 0.12 | % | | | 0.10 | % | | | (0.02 | )% |
Supplemental data | | | | | | | | | | | | | | | | | | | | |
Portfolio turnover rate | | | 34 | % | | | 40 | % | | | 31 | % | | | 26 | % | | | 35 | % |
Net assets, end of period (000s omitted) | | | $79,154 | | | | $80,937 | | | | $237,577 | | | | $262,535 | | | | $245,364 | |
The accompanying notes are an integral part of these financial statements.
| | | | |
| 24 | | Wells Fargo Large Cap Growth Fund | | Financial highlights |
(For a share outstanding throughout each period)
| | | | | | | | | | | | | | | | | | | | |
| | | Year ended July 31 | |
| INSTITUTIONAL CLASS | | 2018 | | | 2017 | | | 2016 | | | 2015 | | | 2014 | |
Net asset value, beginning of period | | | $51.00 | | | | $46.74 | | | | $50.30 | | | | $45.80 | | | | $40.11 | |
Net investment income | | | 0.10 | 1 | | | 0.12 | 1 | | | 0.17 | 1 | | | 0.19 | 1 | | | 0.11 | |
Net realized and unrealized gains (losses) on investments | | | 12.80 | | | | 6.51 | | | | (0.96 | ) | | | 6.41 | | | | 7.09 | |
| | | | | | | | | | | | | | | | | | | | |
Total from investment operations | | | 12.90 | | | | 6.63 | | | | (0.79 | ) | | | 6.60 | | | | 7.20 | |
Distributions to shareholders from | | | | | | | | | | | | | | | | | | | | |
Net investment income | | | (0.02 | ) | | | (0.06 | ) | | | (0.22 | ) | | | (0.03 | ) | | | (0.13 | ) |
Net realized gains | | | (10.57 | ) | | | (2.31 | ) | | | (2.55 | ) | | | (2.07 | ) | | | (1.38 | ) |
| | | | | | | | | | | | | | | | | | | | |
Total distributions to shareholders | | | (10.59 | ) | | | (2.37 | ) | | | (2.77 | ) | | | (2.10 | ) | | | (1.51 | ) |
Net asset value, end of period | | | $53.31 | | | | $51.00 | | | | $46.74 | | | | $50.30 | | | | $45.80 | |
Total return | | | 28.37 | % | | | 14.98 | % | | | (1.49 | )% | | | 14.82 | % | | | 18.16 | % |
Ratios to average net assets (annualized) | | | | | | | | | | | | | | | | | | | | |
Gross expenses | | | 0.84 | % | | | 0.83 | % | | | 0.83 | % | | | 0.78 | % | | | 0.79 | % |
Net expenses | | | 0.75 | % | | | 0.75 | % | | | 0.71 | % | | | 0.65 | % | | | 0.65 | % |
Net investment income | | | 0.18 | % | | | 0.27 | % | | | 0.37 | % | | | 0.40 | % | | | 0.28 | % |
Supplemental data | | | | | | | | | | | | | | | | | | | | |
Portfolio turnover rate | | | 34 | % | | | 40 | % | | | 31 | % | | | 26 | % | | | 35 | % |
Net assets, end of period (000s omitted) | | | $95,809 | | | | $169,836 | | | | $316,310 | | | | $534,975 | | | | $596,006 | |
| 1 | Calculated based upon average shares outstanding |
The accompanying notes are an integral part of these financial statements.
| | | | | | |
| Notes to financial statements | | Wells Fargo Large Cap Growth Fund | | | 25 | |
1. ORGANIZATION
Wells Fargo Funds Trust (the “Trust”), a Delaware statutory trust organized on March 10, 1999, is an open-end management investment company registered under the Investment Company Act of 1940, as amended (the “1940 Act”). As an investment company, the Trust follows the accounting and reporting guidance in Financial Accounting Standards Board Accounting Standards Codification Topic 946, Financial Services – Investment Companies. These financial statements report on the Wells Fargo Large Cap Growth Fund (the “Fund”) which is a diversified series of the Trust.
2. SIGNIFICANT ACCOUNTING POLICIES
The following significant accounting policies, which are consistently followed in the preparation of the financial statements of the Fund, are in conformity with U.S. generally accepted accounting principles which require management to make estimates and assumptions that affect the reported amounts of assets and liabilities, disclosure of contingent assets and liabilities at the date of the financial statements, and the reported amounts of revenues and expenses during the reporting period. Actual results could differ from those estimates.
Securities valuation
All investments are valued each business day as of the close of regular trading on the New York Stock Exchange (generally 4 p.m. Eastern Time), although the Fund may deviate from this calculation time under unusual or unexpected circumstances.
Equity securities that are listed on a foreign or domestic exchange or market are valued at the official closing price or, if none, the last sales price. If no sale occurs on the principal exchange or market that day, a fair value price will be determined in accordance with the Fund’s Valuation Procedures.
Investments in registered open-end investment companies are valued at net asset value. Interests in non-registered investment companies that are redeemable at net asset value are fair valued normally at net asset value.
Investments which are not valued using any of the methods discussed above are valued at their fair value, as determined in good faith by the Board of Trustees of the Fund. The Board of Trustees has established a Valuation Committee comprised of the Trustees and has delegated to it the authority to take any actions regarding the valuation of portfolio securities that the Valuation Committee deems necessary or appropriate, including determining the fair value of portfolio securities, unless the determination has been delegated to the Wells Fargo Asset Management Pricing Committee at Wells Fargo Funds Management, LLC (“Funds Management”). The Board of Trustees retains the authority to make or ratify any valuation decisions or approve any changes to the Valuation Procedures as it deems appropriate. On a quarterly basis, the Board of Trustees receives reports on any valuation actions taken by the Valuation Committee or the Wells Fargo Asset Management Pricing Committee which may include items for ratification.
Valuations of fair valued securities are compared to the next actual sales price when available, or other appropriate market values, to assess the continued appropriateness of the fair valuation methodologies used. These securities are fair valued on a day-to-day basis, taking into consideration changes to appropriate market information and any significant changes to the inputs considered in the valuation process until there is a readily available price provided on an exchange or by an independent pricing service. Valuations received from an independent pricing service or independent broker-dealer quotes are periodically validated by comparisons to most recent trades and valuations provided by other independent pricing services in addition to the review of prices by the manager and/or subadviser. Unobservable inputs used in determining fair valuations are identified based on the type of security, taking into consideration factors utilized by market participants in valuing the investment, knowledge about the issuer and the current market environment.
Foreign currency translation
The accounting records of the Fund are maintained in U.S. dollars. The values of other assets and liabilities denominated in foreign currencies are translated into U.S. dollars at rates provided by an independent foreign currency pricing source at a time each business day specified by the Wells Fargo Asset Management Pricing Committee. Purchases and sales of securities, and income and expenses are converted at the rate of exchange on the respective dates of such transactions. Net realized foreign exchange gains or losses arise from sales of foreign currencies, currency gains or losses realized between the trade and settlement dates on securities transactions, and the difference between the amounts of dividends, interest and foreign withholding taxes recorded and the U.S. dollar equivalent of the amounts actually paid or received. Net unrealized foreign exchange gains and losses arise from changes in the fair value of assets and liabilities other than investments in securities resulting from changes in exchange rates. The changes in net assets arising from changes in exchange rates of securities and the changes in net assets resulting from changes in market prices of securities are not separately presented. Such changes are included in net realized and unrealized gains or losses from investments.
Securities lending
The Fund may lend its securities from time to time in order to earn additional income in the form of fees or interest on securities received as collateral or the investment of any cash received as collateral. The Fund continues to receive interest or dividends on the securities loaned. The Fund receives collateral in the form of cash or securities with a value at
| | | | |
| 26 | | Wells Fargo Large Cap Growth Fund | | Notes to financial statements |
least equal to the value of the securities on loan. The value of the loaned securities is determined at the close of each business day and any additional required collateral is delivered to the Fund on the next business day. In a securities lending transaction, the net asset value of the Fund will be affected by an increase or decrease in the value of the securities loaned and by an increase or decrease in the value of the instrument in which collateral is invested. The amount of securities lending activity undertaken by the Fund fluctuates from time to time. In the event of default or bankruptcy by the borrower, the Fund may be prevented from recovering the loaned securities or gaining access to the collateral or may experience delays or costs in doing so. In addition, the investment of any cash collateral received may lose all or part of its value. The Fund has the right under the lending agreement to recover the securities from the borrower on demand.
The Fund lends its securities through an unaffiliated securities lending agent. Cash collateral received in connection with its securities lending transactions is invested in Securities Lending Cash Investments, LLC (the “Securities Lending Fund”). The Securities Lending Fund is exempt from registration under Section 3(c)(7) of the 1940 Act and is managed by Funds Management and is subadvised by Wells Capital Management Incorporated (“WellsCap”), an affiliate of Funds Management and an indirect wholly owned subsidiary of Wells Fargo & Company (“Wells Fargo”). Funds Management receives an advisory fee starting at 0.05% and declining to 0.01% as the average daily net assets of the Securities Lending Fund increase. All of the fees received by Funds Management are paid to WellsCap for its services as subadviser. The Securities Lending Fund seeks to provide a positive return compared to the daily Fed Funds Open Rate by investing in high-quality, U.S. dollar-denominated short-term money market instruments. Securities Lending Fund investments are valued at the evaluated bid price provided by an independent pricing service. Income earned from investment in the Securities Lending Fund, if any, is included in income from affiliated securities on the Statement of Operations.
Security transactions and income recognition
Securities transactions are recorded on a trade date basis. Realized gains or losses are recorded on the basis of identified cost.
Dividend income is recognized on the ex-dividend date. Dividend income is recorded net of foreign taxes withheld where recovery of such taxes is not assured.
Distributions to shareholders
Distributions to shareholders from net investment income and any net realized gains are recorded on the ex-dividend date and paid at least annually. Such distributions are determined in accordance with income tax regulations and may differ from U.S. generally accepted accounting principles. Dividend sources are estimated at the time of declaration. The tax character of distributions is determined as of the Fund’s fiscal year end. Therefore, a portion of the Fund’s distributions made prior to the Fund’s fiscal year end may be categorized as a tax return of capital at year end.
Federal and other taxes
The Fund intends to continue to qualify as a regulated investment company by distributing substantially all of its investment company taxable income and any net realized capital gains (after reduction for capital loss carryforwards) sufficient to relieve it from all, or substantially all, federal income taxes. Accordingly, no provision for federal income taxes was required.
The Fund’s income and federal excise tax returns and all financial records supporting those returns for the prior three fiscal years are subject to examination by the federal and Delaware revenue authorities. Management has analyzed the Fund’s tax positions taken on federal, state, and foreign tax returns for all open tax years and does not believe that there are any uncertain tax positions that require recognition of a tax liability.
As of July 31, 2018, the aggregate cost of all investments for federal income tax purposes was $549,663,235 and the unrealized gains (losses) consisted of:
| | | | |
Gross unrealized gains | | $ | 550,268,712 | |
Gross unrealized losses | | | (1,025,146 | ) |
Net unrealized gains | | $ | 549,243,566 | |
Reclassifications are made to the Fund’s capital accounts for permanent tax differences to reflect income and gains available for distribution (or available capital loss carryforwards) under federal income tax regulations. U.S. generally accepted accounting principles require that certain components of net assets be adjusted to reflect permanent differences between financial and tax reporting. These reclassifications have no effect on net assets or net asset values per share. At July 31, 2018, as a result of permanent book-to-tax differences, the following reclassification adjustments were made on the Statement of Assets and Liabilities:
| | |
Undistributed net
investment income | | Accumulated net
realized gains
on investments |
| $32 | | $(32) |
| | | | | | |
| Notes to financial statements | | Wells Fargo Large Cap Growth Fund | | | 27 | |
Class allocations
The separate classes of shares offered by the Fund differ principally in applicable sales charges, distribution, shareholder servicing, and administration fees. Class specific expenses are charged directly to that share class. Investment income, common expenses, and realized and unrealized gains (losses) on investments are allocated daily to each class of shares based on the relative proportion of net assets of each class.
3. FAIR VALUATION MEASUREMENTS
Fair value measurements of investments are determined within a framework that has established a fair value hierarchy based upon the various data inputs utilized in determining the value of the Fund’s investments. The three-level hierarchy gives the highest priority to unadjusted quoted prices in active markets for identical assets or liabilities (Level 1) and the lowest priority to unobservable inputs (Level 3). The Fund’s investments are classified within the fair value hierarchy based on the lowest level of input that is significant to the fair value measurement. The inputs are summarized into three broad levels as follows:
| ∎ | | Level 1 – quoted prices in active markets for identical securities |
| ∎ | | Level 2 – other significant observable inputs (including quoted prices for similar securities, interest rates, prepayment speeds, credit risk, etc.) |
| ∎ | | Level 3 – significant unobservable inputs (including the Fund’s own assumptions in determining the fair value of investments) |
The inputs or methodologies used for valuing investments in securities are not necessarily an indication of the risk associated with investing in those securities.
The following is a summary of the inputs used in valuing the Fund’s assets and liabilities as of July 31, 2018:
| | | | | | | | | | | | | | | | |
| | | Quoted prices (Level 1) | | | Other significant
observable inputs
(Level 2) | | | Significant
unobservable inputs (Level 3) | | | Total | |
Assets | | | | | | | | | | | | | | | | |
Investments in: | | | | | | | | | �� | | | | | | | |
| | | | |
Common stocks | | | | | | | | | | | | | | | | |
Consumer discretionary | | $ | 151,690,361 | | | $ | 0 | | | $ | 0 | | | $ | 151,690,361 | |
Consumer staples | | | 45,226,035 | | | | 0 | | | | 0 | | | | 45,226,035 | |
Energy | | | 13,680,730 | | | | 0 | | | | 0 | | | | 13,680,730 | |
Financials | | | 66,783,062 | | | | 0 | | | | 0 | | | | 66,783,062 | |
Health care | | | 85,968,175 | | | | 0 | | | | 0 | | | | 85,968,175 | |
Industrials | | | 155,231,616 | | | | 0 | | | | 0 | | | | 155,231,616 | |
Information technology | | | 499,033,715 | | | | 0 | | | | 0 | | | | 499,033,715 | |
Materials | | | 32,307,954 | | | | 0 | | | | 0 | | | | 32,307,954 | |
| | | | |
Short-term investments | | | | | | | | | | | | | | | | |
Investment companies | | | 10,229,653 | | | | 0 | | | | 0 | | | | 10,229,653 | |
Investments measured at net asset value* | | | | | | | | | | | | | | | 38,755,500 | |
Total assets | | $ | 1,060,151,301 | | | $ | 0 | | | $ | 0 | | | $ | 1,098,906,801 | |
| * | Investments that are measured at fair value using the net asset value per share (or its equivalent) as a practical expedient have not been categorized in the fair value hierarchy. The fair value amount presented in the table is intended to permit reconciliation of the fair value hierarchy to the amounts presented in the Statement of Assets and Liabilities. The Fund’s investment in Securities Lending Cash Investments, LLC valued at $38,755,500 does not have a redemption period notice, can be redeemed daily and does not have any unfunded commitments. |
The Fund recognizes transfers between levels within the fair value hierarchy at the end of the reporting period. At July 31, 2018, the Fund did not have any transfers into/out of Level 1, Level 2, or Level 3.
4. TRANSACTIONS WITH AFFILIATES
Management fee
Funds Management, an indirect wholly owned subsidiary of Wells Fargo, is the manager of the Fund and provides advisory and fund-level administrative services under an investment management agreement. Under the investment management agreement, Funds Management is responsible for, among other services, implementing the investment objectives and strategies of the Fund, supervising the subadviser and providing fund-level administrative services in
| | | | |
| 28 | | Wells Fargo Large Cap Growth Fund | | Notes to financial statements |
connection with the Fund’s operations. As compensation for its services under the investment management agreement, Funds Management is entitled to receive an annual management fee starting at 0.70% and declining to 0.505% as the average daily net assets of the Fund increase. For the year ended July 31, 2018, the management fee was equivalent to an annual rate of 0.68% of the Fund’s average daily net assets.
Funds Management has retained the services of a subadviser to provide daily portfolio management to the Fund. The fee for subadvisory services is borne by Funds Management. WellsCap is the subadviser to the Fund and is entitled to receive a fee from Funds Management at an annual rate starting at 0.30% and declining to 0.20% as the average daily net assets of the Fund increase.
Administration fees
Under a class-level administration agreement, Funds Management provides class-level administrative services to the Fund, which includes paying fees and expenses for services provided by the transfer agent, sub-transfer agents, omnibus account servicers and record-keepers. As compensation for its services under the class-level administration agreement, Funds Management receives an annual fee which is calculated based on the average daily net assets of each class as follows:
| | | | |
| | | Class-level
administration fee | |
Class A, Class C, Class R | | | 0.21 | % |
Class R4 | | | 0.08 | |
Class R6 | | | 0.03 | |
Administrator Class , Institutional Class | | | 0.13 | |
Funds Management has contractually waived and/or reimbursed management and administration fees to the extent necessary to maintain certain net operating expense ratios for the Fund. When each class of the Fund has exceeded its expense cap, Funds Management has waived fees and/or reimbursed expenses from fund level expenses on a proportionate basis and then from class specific expenses; otherwise, waivers and/or reimbursements are applied against class specific expenses before fund level expenses. Funds Management has committed through November 30, 2018 to waive fees and/or reimburse expenses to the extent necessary to cap the Fund’s expenses at 1.07% for Class A shares, 1.82% for Class C shares, 1.32% for Class R shares, 0.80% for Class R4 shares, 0.65% for Class R6 shares, 0.95% for Administrator Class shares, and 0.75% for Institutional Class shares. After this time, the cap may be increased or the commitment to maintain the cap may be terminated only with the approval of the Board of Trustees.
Distribution fees
The Trust has adopted a distribution plan for Class C and Class R shares of the Fund pursuant to Rule 12b-1 under the 1940 Act. Distribution fees are charged to Class C and Class R shares and paid to Wells Fargo Funds Distributor, LLC (“Funds Distributor”), the principal underwriter, at an annual rate of 0.75% of the average daily net assets of Class C shares and 0.25% of the average daily net assets of Class R shares.
In addition, Funds Distributor is entitled to receive the front-end sales charge from the purchase of Class A shares and a contingent deferred sales charge on the redemption of certain Class A shares. Funds Distributor is also entitled to receive the contingent deferred sales charges from redemptions of Class C shares. For the year ended July 31, 2018, Funds Distributor received $3,629 from the sale of Class A shares and $160 in contingent deferred sales charges from redemptions of Class C shares. No contingent deferred sales charges were incurred by Class A for the year ended July 31, 2018.
Shareholder servicing fees
The Trust has entered into contracts with one or more shareholder servicing agents, whereby Class A , Class C, Class R, and Administrator Class of the Fund are charged a fee at an annual rate of 0.25% of the average daily net assets of each respective class. Class R4 is charged a fee at an annual rate of 0.10% of its average daily net assets.
A portion of these total shareholder servicing fees were paid to affiliates of Wells Fargo.
Interfund transactions
The Fund may purchase or sell portfolio investment securities to certain other Wells Fargo affiliates pursuant to Rule 17a-7 under the 1940 Act and under procedures adopted by the Board of Trustees. The procedures have been designed to ensure that these interfund transactions, which do not incur broker commissions, are effected at current market prices.
| | | | | | |
| Notes to financial statements | | Wells Fargo Large Cap Growth Fund | | | 29 | |
5. INVESTMENT PORTFOLIO TRANSACTIONS
Purchases and sales of investments, excluding U.S. government obligations (if any) and short-term securities, for the year ended July 31, 2018 were $362,054,477 and $682,752,404, respectively.
6. BANK BORROWINGS
The Trust (excluding the money market funds and certain other funds) and Wells Fargo Variable Trust are parties to a $280,000,000 revolving credit agreement whereby the Fund is permitted to use bank borrowings for temporary or emergency purposes, such as to fund shareholder redemption requests. Interest under the credit agreement is charged to the Fund based on a borrowing rate equal to the higher of the Federal Funds rate in effect on that day plus 1.25% or the overnight LIBOR rate in effect on that day plus 1.25%. In addition, an annual commitment fee equal to 0.25% of the unused balance is allocated to each participating fund. Prior to August 29, 2017, the revolving credit agreement amount was $250,000,000.
For the year ended July 31, 2018, there were no borrowings by the Fund under the agreement.
7. DISTRIBUTIONS TO SHAREHOLDERS
The tax character of distributions paid during the years ended July 31, 2018 and July 31, 2017 were as follows:
| | | | | | | | |
| | | Year ended July 31 | |
| | | 2018 | | | 2017 | |
Ordinary income | | $ | 445,466 | | | $ | 839,843 | |
Long-term capital gain | | | 201,440,487 | | | | 64,294,556 | |
As of July 31, 2018, the components of distributable earnings on a tax basis were as follows:
| | | | |
Undistributed
ordinary
income | | Undistributed
long-term
gain | | Unrealized
gains |
| $137,394 | | $165,887,526 | | $549,243,566 |
8. CONCENTRATION RISK
Concentration risks result from exposure to a limited number of sectors. A fund that invests a substantial portion of its assets in any sector may be more affected by changes in that sector than would be a fund whose investments are not heavily weighted in any sector.
9. INDEMNIFICATION
Under the Trust’s organizational documents, the officers and Trustees have been granted certain indemnification rights against certain liabilities that may arise out of performance of their duties to the Trust. Additionally, in the normal course of business, the Trust may enter into contracts with service providers that contain a variety of indemnification clauses. The Trust’s maximum exposure under these arrangements is dependent on future claims that may be made against the Fund and, therefore, cannot be estimated.
| | | | |
| 30 | | Wells Fargo Large Cap Growth Fund | | Report of independent registered public accounting firm |
BOARD OF TRUSTEES AND SHAREHOLDERS OF WELLS FARGO FUNDS TRUST:
Opinion on the Financial Statements
We have audited the accompanying statement of assets and liabilities of Wells Fargo Large Cap Growth Fund (the “Fund”), one of the funds constituting Wells Fargo Funds Trust, including the portfolio of investments, as of July 31, 2018, the related statement of operations for the year then ended, the statements of changes in net assets for each of the years in the two-year period then ended, and the related notes (collectively, the “financial statements”) and the financial highlights for each of the years in the five-year period then ended. In our opinion, the financial statements and financial highlights present fairly, in all material respects, the financial position of the Fund as of July 31, 2018, the results of its operations for the year then ended, the changes in its net assets for each of the years in the two-year period then ended, and the financial highlights for each of the years in the five-year period then ended, in conformity with U.S. generally accepted accounting principles.
Basis for Opinion
These financial statements and financial highlights are the responsibility of the Fund’s management. Our responsibility is to express an opinion on these financial statements and financial highlights based on our audits. We are a public accounting firm registered with the Public Company Accounting Oversight Board (United States) (“PCAOB”) and are required to be independent with respect to the Fund in accordance with the U.S. federal securities laws and the applicable rules and regulations of the Securities and Exchange Commission and the PCAOB.
We conducted our audits in accordance with the standards of the PCAOB. Those standards require that we plan and perform the audit to obtain reasonable assurance about whether the financial statements and financial highlights are free of material misstatement, whether due to error or fraud. Our audits included performing procedures to assess the risks of material misstatement of the financial statements and financial highlights, whether due to error or fraud, and performing procedures that respond to those risks. Such procedures included examining, on a test basis, evidence regarding the amounts and disclosures in the financial statements and financial highlights. Such procedures also included confirmation of securities owned as of July 31, 2018, by correspondence with the custodian and brokers, or by other appropriate auditing procedures. Our audits also included evaluating the accounting principles used and significant estimates made by management, as well as evaluating the overall presentation of the financial statements and financial highlights. We believe that our audits provide a reasonable basis for our opinion.

We have not been able to determine the specific year that we began serving as the auditor of one or more Wells Fargo Funds investment companies, however we are aware that we have served as the auditor of one or more Wells Fargo Funds investment companies since at least 1955.
Boston, Massachusetts
September 24, 2018
| | | | | | |
| Other information (unaudited) | | Wells Fargo Large Cap Growth Fund | | | 31 | |
TAX INFORMATION
For corporate shareholders, pursuant to Section 854 of the Internal Revenue Code, 100% of ordinary income dividends qualify for the corporate dividends-received deduction for the fiscal year ended July 31, 2018.
Pursuant to Section 852 of the Internal Revenue Code, $201,440,487 was designated as a 20% rate gain distribution for the fiscal year ended July 31, 2018.
Pursuant to Section 854 of the Internal Revenue Code, $445,466 of income dividends paid during the fiscal year ended July 31, 2018 has been designated as qualified dividend income (QDI).
For the fiscal year ended July 31, 2018, $2,762 has been designated as interest-related dividends for nonresident alien shareholders pursuant to Section 871 of the Internal Revenue Code.
PROXY VOTING INFORMATION
A description of the policies and procedures that the Fund uses to determine how to vote proxies relating to portfolio securities is available, upon request, by calling 1-800-222-8222, visiting our website at wellsfargofunds.com, or visiting the SEC website at sec.gov. Information regarding how the Fund voted proxies relating to portfolio securities during the most recent 12-month period ended June 30 is available on the Fund’s website at wellsfargofunds.com or by visiting the SEC website at sec.gov.
PORTFOLIO HOLDINGS INFORMATION
The complete portfolio holdings for the Fund are publicly available monthly on the Fund’s website (wellsfargofunds.com), on a one-month delayed basis. In addition, top ten holdings information (excluding derivative positions) for the Fund is publicly available on the Fund’s website on a monthly, seven-day or more delayed basis. The Fund files its complete schedule of portfolio holdings with the SEC for the first and third quarters of each fiscal year on Form N-Q, which is available by visiting the SEC website at sec.gov. In addition, the Fund’s Form N-Q may be reviewed and copied at the SEC’s Public Reference Room in Washington, DC, and at regional offices in New York City, at 233 Broadway, and in Chicago, at 175 West Jackson Boulevard, Suite 900. Information about the Public Reference Room may be obtained by calling 1-800-SEC-0330.
| | | | |
| 32 | | Wells Fargo Large Cap Growth Fund | | Other information (unaudited) |
BOARD OF TRUSTEES AND OFFICERS
Each of the Trustees and Officers1 listed in the table below acts in identical capacities for each fund in the Wells Fargo family of funds, which consists of 154 mutual funds comprising the Wells Fargo Funds Trust, Wells Fargo Variable Trust, Wells Fargo Master Trust and four closed-end funds (collectively the “Fund Complex”). This table should be read in conjunction with the Prospectus and the Statement of Additional Information2. The mailing address of each Trustee and Officer is 525 Market Street, 12th Floor, San Francisco, CA 94105. Each Trustee and Officer serves an indefinite term, however, each Trustee serves such term until reaching the mandatory retirement age established by the Trustees.
Independent Trustees
| | | | | | |
Name and year of birth | | Position held and length of service* | | Principal occupations during past five years or longer | | Current other public company or
investment company
directorships |
| William R. Ebsworth (Born 1957) | | Trustee, since 2015 | | Retired. From 1984 to 2013, equities analyst, portfolio manager, research director and chief investment officer at Fidelity Management and Research Company in Boston, Tokyo, and Hong Kong, and retired in 2013 as Chief Investment Officer of Fidelity Strategic Advisers, Inc. where he led a team of investment professionals managing client assets. Prior thereto, Board member of Hong Kong Securities Clearing Co., Hong Kong Options Clearing Corp., the Thailand International Fund, Ltd., Fidelity Investments Life Insurance Company, and Empire Fidelity Investments Life Insurance Company. Board member of the Forté Foundation (non-profit organization) and the Vincent Memorial Hospital Endowment (non-profit organization), where he serves on the Investment Committee and as a Chair of the Audit Committee. Mr. Ebsworth is a CFA® charterholder. | | Asset Allocation Trust |
| Jane A. Freeman (Born 1953) | | Trustee, since 2015; Chair Liaison, since 2018 | | Retired. From 2012 to 2014 and 1999 to 2008, Chief Financial Officer of Scientific Learning Corporation. From 2008 to 2012, Ms. Freeman provided consulting services related to strategic business projects. Prior to 1999, Portfolio Manager at Rockefeller & Co. and Scudder, Stevens & Clark. Board member of the Harding Loevner Funds from 1996 to 2014, serving as both Lead Independent Director and chair of the Audit Committee. Board member of the Russell Exchange Traded Funds Trust from 2011 to 2012 and the chair of the Audit Committee. Ms. Freeman is a Board Member of Ruth Bancroft Garden (non-profit organization) and the Glimmerglass Festival. She is also an inactive Chartered Financial Analyst. | | Asset Allocation Trust |
| Isaiah Harris, Jr. (Born 1952) | | Trustee, since 2009 | | Retired. Chairman of the Board of CIGNA Corporation since 2009, and Director since 2005. From 2003 to 2011, Director of Deluxe Corporation. Prior thereto, President and CEO of BellSouth Advertising and Publishing Corp. from 2005 to 2007, President and CEO of BellSouth Enterprises from 2004 to 2005 and President of BellSouth Consumer Services from 2000 to 2003. Emeritus member of the Iowa State University Foundation Board of Governors. Emeritus Member of the Advisory Board of Iowa State University School of Business. Advisory Board Member, Palm Harbor Academy (charter school). Advisory Board Member, Child Evangelism Fellowship (non-profit). Mr. Harris is a certified public accountant (inactive status). | | CIGNA Corporation; Asset Allocation Trust |
| Judith M. Johnson (Born 1949) | | Trustee, since 2008; Audit Committee Chairman, since 2009 | | Retired. Prior thereto, Chief Executive Officer and Chief Investment Officer of Minneapolis Employees Retirement Fund from 1996 to 2008. Ms. Johnson is an attorney, certified public accountant and a certified managerial accountant. | | Asset Allocation Trust |
| David F. Larcker (Born 1950) | | Trustee, since 2009 | | James Irvin Miller Professor of Accounting at the Graduate School of Business, Stanford University, Director of the Corporate Governance Research Initiative and Senior Faculty of The Rock Center for Corporate Governance since 2006. From 2005 to 2008, Professor of Accounting at the Graduate School of Business, Stanford University. Prior thereto, Ernst & Young Professor of Accounting at The Wharton School, University of Pennsylvania from 1985 to 2005. | | Asset Allocation Trust |
| | | | | | |
| Other information (unaudited) | | Wells Fargo Large Cap Growth Fund | | | 33 | |
| | | | | | |
Name and year of birth | | Position held and length of service* | | Principal occupations during past five years or longer | | Current other public company or
investment company
directorships |
| Olivia S. Mitchell (Born 1953) | | Trustee, since 2006; Governance Committee Chairman, since 2018 | | International Foundation of Employee Benefit Plans Professor, Wharton School of the University of Pennsylvania since 1993. Director of Wharton’s Pension Research Council and Boettner Center on Pensions & Retirement Research, and Research Associate at the National Bureau of Economic Research. Previously, Cornell University Professor from 1978 to 1993. | | Asset Allocation Trust |
| Timothy J. Penny (Born 1951) | | Trustee, since 1996; Chairman, since 2018; Vice Chairman, from 2017 to 2018 | | President and Chief Executive Officer of Southern Minnesota Initiative Foundation, a non-profit organization, since 2007. Member of the Board of Trustees of NorthStar Education Finance, Inc., a non-profit organization, since 2007. | | Asset Allocation Trust |
| James G. Polisson (Born 1959) | | Trustee, since 2018; Advisory Board Member, from 2017 to 2018 | | Retired. Chief Marketing Officer, Source (ETF) UK Services, Ltd, from 2015 to 2017. From 2012 to 2015, Principal of The Polisson Group, LLC, a management consulting, corporate advisory and principal investing company. Chief Executive Officer and Managing Director at Russell Investments, Global Exchange Traded Funds from 2010 to 2012. Managing Director of Barclays Global Investors from 1998 to 2010 and Global Chief Marketing Officer for iShares and Barclays Global Investors from 2000 to 2010. Trustee of the San Francisco Mechanics’ Institute, a non-profit organization, from 2013 to 2015. Board member of the Russell Exchange Traded Fund Trust from 2011 to 2012. Director of Barclays Global Investors Holdings Deutschland GmbH from 2006 to 2009. Mr. Polisson is an attorney and has a retired status with the Massachusetts and District of Columbia Bar Associations. | | Asset Allocation Trust |
| Michael S. Scofield (Born 1943) | | Trustee, since 2010 | | Served on the Investment Company Institute’s Board of Governors and Executive Committee from 2008-2011 as well the Governing Council of the Independent Directors Council from 2006-2011 and the Independent Directors Council Executive Committee from 2008-2011. Trustee of the Evergreen Fund complex (and its predecessors) from 1984 to 2010. Chairman of the Evergreen Funds from 2000-2010. Former Trustee of the Mentor Funds. Retired Attorney, Law Offices of Michael S. Scofield. | | Asset Allocation Trust |
| Pamela Wheelock (Born 1959) | | Trustee, since 2018; Advisory Board Member, from 2017 to 2018 | | Chief Operating Officer, Twin Cities Habitat for Humanity, since January, 2017. Vice President of University Services, University of Minnesota from 2012 to 2017. Prior thereto, on the Board of Directors, Goverance Committee and Finance Committee for the Minnesota Philanthropy Partners (Saint Paul Foundation) from 2012 to 2018, Interim President and Chief Executive Officer of Blue Cross Blue shield of Minnesota of Minnesota from 2010 to 2011, Chairman of the Board from 2009 to 2011 and Board Director 003 to 2015. Vice President, Leadership and Community Engagement, Bush Foundation, Saint Paul, Minnesota (a private foundation) from 2009 to 2011. Executive Vice President and Chief Financial Officer, Minnesota Sports and Entertainment from 2004 to 2009 and Senior Vice President from 2002 to 2004. Commissioner of Finance, State of Minnesota, from 1999 to 2002. Currently the Board Chair of the Minnesota Wild Foundation since 2010. | | Asset Allocation Trust |
| * | Length of service dates reflect the Trustee’s commencement of service with the Trust’s predecessor entities, where applicable. |
| | | | |
| 34 | | Wells Fargo Large Cap Growth Fund | | Other information (unaudited) |
Officers
| | | | | | |
Name and year of birth | | Position held and
length of service | | Principal occupations during past five years or longer | | |
Andrew Owen (Born 1960) | | President, since 2017 | | Executive Vice President of Wells Fargo & Company and Head of Affiliated Managers, Wells Fargo Asset Management, since 2014. In addition, Mr. Owen is currently President, Chief Executive Officer and Director of Wells Fargo Funds Management, LLC since 2017. Prior thereto, Executive Vice President responsible for marketing, investments and product development for Wells Fargo Funds Management, LLC, from 2009 to 2014. | | |
| Jeremy DePalma1 (Born 1974) | | Treasurer, since 2012 | | Senior Vice President of Wells Fargo Funds Management, LLC since 2009. Senior Vice President of Evergreen Investment Management Company, LLC from 2008 to 2010 and head of the Fund Reporting and Control Team within Fund Administration from 2005 to 2010. | | |
| Alexander Kymn3 (Born 1973) | | Secretary, since 2018; Chief Legal Officer, since 2018 | | Senior Company Counsel of Wells Fargo Bank, N.A. since 2018 (previously Senior Counsel from 2007 to 2018). Vice President of Wells Fargo Funds Management, LLC from 2008 to 2014. | | |
| Michael H. Whitaker (Born 1967) | | Chief Compliance Officer, since 2016 | | Senior Vice President and Chief Compliance Officer since 2016. Senior Vice President and Chief Compliance Officer for Fidelity Investments from 2007 to 2016. | | |
David Berardi (Born 1975) | | Assistant Treasurer, since 2009 | | Vice President of Wells Fargo Funds Management, LLC since 2009. Vice President of Evergreen Investment Management Company, LLC from 2008 to 2010. Manager of Fund Reporting and Control for Evergreen Investment Management Company, LLC from 2004 to 2010. | | |
| 1 | Jeremy DePalma acts as Treasurer of 77 funds and Assistant Treasurer of 77 funds in the Fund Complex. |
| 2 | The Statement of Additional Information includes additional information about the Trustees and is available, without charge, upon request, by calling 1-800-222-8222 or by visiting the website at wellsfargofunds.com. |
| 3 | Alexander Kymn became the Secretary and Chief Legal Officer effective April 17, 2018. |
| | | | | | |
| Other information (unaudited) | | Wells Fargo Large Cap Growth Fund | | | 35 | |
BOARD CONSIDERATION OF INVESTMENT MANAGEMENT AND SUB-ADVISORY AGREEMENTS:
Wells Fargo Large Cap Growth Fund
Under the Investment Company Act of 1940 (the “1940 Act”), the Board of Trustees (the “Board”) of Wells Fargo Funds Trust (the “Trust”) must determine annually whether to approve the continuation of the Trust’s investment management and sub-advisory agreements. In this regard, at an in-person meeting held on May 22-23, 2018 (the “Meeting”), the Board, all the members of which have no direct or indirect interest in the investment management and sub-advisory agreements and are not “interested persons” of the Trust, as defined in the 1940 Act (the “Independent Trustees”), reviewed and approved for Wells Fargo Large Cap Growth Fund (the “Fund”): (i) an investment management agreement (the “Management Agreement”) with Wells Fargo Funds Management, LLC (“Funds Management”); and (ii) an investment sub-advisory agreement (the “Sub-Advisory Agreement”) with Wells Capital Management Incorporated (the “Sub-Adviser”), an affiliate of Funds Management. The Management Agreement and the Sub-Advisory Agreement are collectively referred to as the “Advisory Agreements.”
At the Meeting, the Board considered the factors and reached the conclusions described below relating to the selection of Funds Management and the Sub-Adviser and the approval of the Advisory Agreements. Prior to the Meeting, including at an in-person meeting in April 2018, the Trustees conferred extensively among themselves and with representatives of Funds Management about these matters. Also, the Board has adopted a team-based approach, with each team consisting of a sub-set of Trustees, to assist the full Board in the discharge of its duties in reviewing investment performance and other matters throughout the year. The Independent Trustees were assisted in their evaluation of the Advisory Agreements by independent legal counsel, from whom they received separate legal advice and with whom they met separately.
In providing information to the Board, Funds Management and the Sub-Adviser were guided by a detailed set of requests for information submitted to them by independent legal counsel on behalf of the Independent Trustees at the start of the Board’s annual contract renewal process earlier in 2018. In considering and approving the Advisory Agreements, the Trustees considered the information they believed relevant, including but not limited to the information discussed below. The Board considered not only the specific information presented in connection with the Meeting, but also the knowledge gained over time through interaction with Funds Management and the Sub-Adviser about various topics. In this regard, the Board reviewed reports of Funds Management at each of its quarterly meetings, which included, among other things, portfolio reviews and investment performance reports. In addition, the Board and the teams mentioned above confer with portfolio managers at various times throughout the year. The Board did not identify any particular information or consideration that was all-important or controlling, and each individual Trustee may have attributed different weights to various factors.
After its deliberations, the Board unanimously approved the continuation of the Advisory Agreements for a one-year term and determined that the compensation payable to Funds Management and the Sub-Adviser under each of the Advisory Agreements was reasonable. The Board considered the approval of the Advisory Agreements for the Fund as part of its consideration of agreements for funds across the complex, but its approvals were made on a fund-by-fund basis.
The following summarizes a number of important, but not necessarily all, factors considered by the Board in support of its approvals.
Nature, extent and quality of services
The Board received and considered various information regarding the nature, extent and quality of services provided to the Fund by Funds Management and the Sub-Adviser under the Advisory Agreements. This information included a description of the investment advisory services and Fund-level administrative services covered by the Management Agreement, as well as, among other things, a summary of the background and experience of senior management of Wells Fargo Asset Management (“WFAM”), of which Funds Management and the Sub-Adviser are a part, a summary of investments made in the business of WFAM, a summary of certain organizational and personnel changes involving Funds Management and the Sub-Adviser, and a description of Funds Management’s and the Sub-Adviser’s business continuity planning programs and of their approaches to data privacy and cybersecurity. The Board also considered the qualifications, background, tenure and responsibilities of each of the portfolio managers primarily responsible for the day-to-day portfolio management of the Fund.
The Board evaluated the ability of Funds Management and the Sub-Adviser to attract and retain qualified investment professionals, including research, advisory and supervisory personnel. The Board further considered the compliance programs and compliance records of Funds Management and the Sub-Adviser. In addition, the Board took into account the full range of services provided to the Fund by Funds Management and its affiliates.
| | | | |
| 36 | | Wells Fargo Large Cap Growth Fund | | Other information (unaudited) |
Fund investment performance and expenses
The Board considered the investment performance results for the Fund over various time periods ended December 31, 2017. The Board considered these results in comparison to the investment performance of funds in a universe that was determined by Broadridge Inc. (“Broadridge”) to be similar to the Fund (the “Universe”), and in comparison to the Fund’s benchmark index and to other comparative data. Broadridge is an independent provider of investment company data. The Board received a description of the methodology used by Broadridge to select the mutual funds in the performance Universe. The Board noted that the investment performance of the Fund (Administrator Class) was higher than the average investment performance of the Universe for the one- and ten-year periods under review, but lower than the average investment performance of the Universe for the three- and five-year periods under review. The Board also noted that the investment performance of the Fund was higher than its benchmark index, the Russell 1000 Growth Index, for the one-year period under review, but lower than its benchmark index for the three-, five- and ten-year periods under review.
The Board received information concerning, and discussed factors contributing to, the underperformance of the Fund relative to the Universe and benchmark for the periods identified above. The Board took note of the explanations for the relative underperformance during these periods, including with respect to investment decisions and market factors that affected the Fund’s investment performance.
The Board also received and considered information regarding the Fund’s net operating expense ratios and their various components, including actual management fees, custodian and other non-management fees, and Rule 12b-1 and non-Rule 12b-1 shareholder service fees. The Board considered these ratios in comparison to the median ratios of funds in class-specific expense groups that were determined by Broadridge to be similar to the Fund (the “Groups”). The Board received a description of the methodology used by Broadridge to select the mutual funds in the expense Groups and an explanation of how funds comprising expense groups and their expense ratios may vary from year-to-year. Based on the Broadridge reports, the Board noted that the net operating expense ratios of the Fund were lower than the median net operating expense ratios of the expense Groups for each share class.
The Board took into account the Fund’s investment performance and expense information provided to it among the factors considered in deciding to re-approve the Advisory Agreements.
Investment management and sub-advisory fee rates
The Board reviewed and considered the contractual fee rates payable by the Fund to Funds Management under the Management Agreement, as well as the contractual fee rates payable by the Fund to Funds Management for class-level administrative services under a Class-Level Administration Agreement, which include, among other things, class-level transfer agency and sub-transfer agency costs (collectively, the “Management Rates”). The Board also reviewed and considered the contractual investment sub-advisory fee rates that are payable by Funds Management to the Sub-Adviser for investment sub-advisory services.
Among other information reviewed by the Board was a comparison of the Fund’s Management Rates with the average contractual investment management fee rates of funds in the expense Groups at a common asset level as well as transfer agency costs of the funds in the expense Groups. The Board noted that the Management Rates of the Fund were lower than, equal to, or in range of the sum of these average rates for the Fund’s expense Groups for all share classes.
The Board also received and considered information about the portion of the total management fee that was retained by Funds Management after payment of the fee to the Sub-Adviser for sub-advisory services. In assessing the reasonableness of this amount, the Board received and evaluated information about the nature and extent of responsibilities retained and risks assumed by Funds Management and not delegated to or assumed by the Sub-Adviser, and about Funds Management’s on-going oversight services. Given the affiliation between Funds Management and the Sub-Adviser, the Board ascribed limited relevance to the allocation of fees between them.
The Board also received and considered information about the nature and extent of services offered and fee rates charged by Funds Management and the Sub-Adviser to other types of clients with investment strategies similar to those of the Fund. In this regard, the Board received information about the significantly greater scope of services, and compliance, reporting and other legal burdens and risks of managing mutual funds compared with those associated with managing assets of non-mutual fund clients such as institutional separate accounts.
Based on its consideration of the factors and information it deemed relevant, including those described here, the Board determined that the compensation payable to Funds Management under the Management Agreement and to the Sub-Adviser under the Sub-Advisory Agreement was reasonable.
| | | | | | |
| Other information (unaudited) | | Wells Fargo Large Cap Growth Fund | | | 37 | |
Profitability
The Board received and considered information concerning the profitability of Funds Management, as well as the profitability of both WFAM and Wells Fargo & Co. (“Wells Fargo”) as a whole, from providing services to the Fund and the fund family as a whole. The Board noted that the Sub-Adviser’s profitability information with respect to providing services to the Fund was subsumed in the WFAM and Wells Fargo profitability analysis.
Funds Management reported on the methodologies and estimates used in calculating profitability, including a description of the methodology used to allocate certain expenses and recent enhancements made to the methodology. Among other things, the Board noted that the levels of profitability reported on a fund-by-fund basis varied widely, depending on factors such as the size and type of fund. Based on its review, the Board did not deem the profits reported by Funds Management, WFAM or Wells Fargo from services provided to the Fund to be at a level that would prevent it from approving the continuation of the Advisory Agreements.
Economies of scale
The Board considered the extent to which Funds Management may experience economies of scale in the provision of management services, and the extent to which scale benefits, if any, would be shared with shareholders. In particular, the Board noted the existence of breakpoints in the Fund’s management fee structure, which operate generally to reduce the Fund’s expense ratios as the Fund grows in size. It considered that, for a small fund or a fund that shrinks in size, breakpoints conversely can result in higher fee levels. The Board also considered that in addition to management fee breakpoints, competitive management fee rates set at the outset without regard to breakpoints and fee waiver and expense reimbursement arrangements, as well as investments in the business intended to enhance services available to Fund shareholders, are means of sharing potential economies of scale with shareholders of the Fund.
The Board concluded that the Fund’s fee and expense arrangements, including contractual breakpoints, constituted a reasonable approach to sharing potential economies of scale with the Fund and its shareholders.
Other benefits to Funds Management and the Sub-Adviser
The Board received and considered information regarding potential “fall-out” or ancillary benefits received by Funds Management and its affiliates, including the Sub-Adviser, as a result of their relationships with the Fund. Ancillary benefits could include, among others, benefits directly attributable to other relationships with the Fund and benefits potentially derived from an increase in Funds Management’s and the Sub-Adviser’s business as a result of their relationships with the Fund. The Board noted that various affiliates of Funds Management may receive distribution-related fees, shareholder servicing payments and sub-transfer agency fees in respect of shares sold or held through them and services provided.
The Board also reviewed information about soft dollar credits earned and utilized by the Sub-Adviser, fees earned by Funds Management and the Sub-Adviser from managing a private investment vehicle for the fund family’s securities lending collateral and commissions earned by an affiliated broker from portfolio transactions.
Based on its consideration of the factors and information it deemed relevant, including those described here, the Board did not find that any ancillary benefits received by Funds Management and its affiliates, including the Sub-Adviser, were unreasonable.
Conclusion
At the Meeting, after considering the above-described factors and based on its deliberations and its evaluation of the information described above, the Board unanimously approved the continuation of the Advisory Agreements for a one-year term and determined that the compensation payable to Funds Management and the Sub-Adviser under each of the Advisory Agreements was reasonable.
| | | | |
| 38 | | Wells Fargo Large Cap Growth Fund | | Appendix A (unaudited) |
SALES CHARGE REDUCTIONS AND WAIVERS FOR CERTAIN INTERMEDIARIES
Ameriprise
Effective June 1, 2018, shareholders purchasing Fund shares through an Ameriprise Financial platform or account will be eligible only for the following Class A load waivers (front-end sales charge waivers), which may differ from those disclosed elsewhere in the Fund’s prospectus or Statement of Additional Information.
Front-end Sales Load Waivers on Class A Shares Available at Ameriprise Financial
| | • | | Employer-sponsored retirement plans (e.g., 401(k) plans, 457 plans, employer-sponsored 403(b) plans, profit sharing and money purchase pension plans and defined benefit plans). For purposes of this provision, employer-sponsored retirement plans do not include SEP IRAs, Simple IRAs or SAR-SEPs. |
| | • | | Shares purchased through an Ameriprise Financial investment advisory program (if an Advisory or similar share class for such investment advisory program is not available) |
| | • | | Shares purchased by third party investment advisors on behalf of their advisory clients through Ameriprise Financial’s platform (if an Advisory or similar share class for such investment advisory program is not available) |
| | • | | Shares purchased through reinvestment of distributions and dividend reinvestment when purchasing shares of the same Fund (but not any other fund within the same fund family) |
| | • | | Shares exchanged from Class C shares of the same fund in the month of or following the 10-year anniversary of the purchase date. To the extent that the Fund’s prospectus elsewhere provides for a waiver with respect to such shares following a shorter holding period, that waiver will apply to exchanges following such shorter period. To the extent that the Fund’s prospectus elsewhere provides for a waiver with respect to exchanges of Class C shares for load-waived shares, that waiver will also apply to such exchanges. |
| | • | | Employees and registered representatives of Ameriprise Financial or its affiliates and their immediate family members |
| | • | | Shares purchased by or through qualified accounts (including IRAs, Coverdell Education Savings Accounts, 401(k)s, 403(b) TSCAs subject to ERISA and defined benefit plans) that are held by a covered family member, defined as an Ameriprise financial advisor and/or the advisor’s spouse, advisor’s lineal ascendant (mother, father, grandmother, grandfather, great grandmother, great grandfather), advisor’s lineal descendant (son, step-son, daughter, step-daughter, grandson, granddaughter, great grandson, great granddaughter) or any spouse of a covered family member who is a lineal descendant |
| | • | | Shares purchased from the proceeds of redemptions within the same fund family, provided (1) the repurchase occurs within 90 days following the redemption, (2) the redemption and purchase occur in the same account, and (3) redeemed shares were subject to a front-end or deferred sales load (i.e. Rights of Reinstatement). Subject to the Fund’s policy regarding frequent purchases and redemptions of Fund shares, you may not be able to repurchase shares for the first 30 days after your redemption. |
Automatic Exchange of Class C Shares Available at Ameriprise Financial
| | • | | Class C shares will automatically exchange to Class A shares in the month of the 10-year anniversary of the purchase date. |
Merrill Lynch
Effective April 10, 2017, shareholders purchasing Fund shares through a Merrill Lynch platform or account will be eligible only for the following load waivers (front-end sales charge waivers and contingent deferred, or back-end, sales charge waivers) and discounts, which may differ from those disclosed elsewhere in the Fund’s prospectus or Statement of Additional Information.
Front-end Sales Load Waivers on Class A Shares available at Merrill Lynch
| | • | | Employer-sponsored retirement, deferred compensation and employee benefit plans (including health savings accounts) and trusts used to fund those plans, provided that the shares are not held in a commission-based brokerage account and shares are held for the benefit of the plan |
| | • | | Shares purchased by or through a 529 Plan |
| | • | | Shares purchased through a Merrill Lynch affiliated investment advisory program |
| | | | | | |
| Appendix A (unaudited) | | Wells Fargo Large Cap Growth Fund | | | 39 | |
| | • | | Shares purchased by third party investment advisors on behalf of their advisory clients through Merrill Lynch’s platform |
| | • | | Shares of funds purchased through the Merrill Edge Self-Directed platform (if applicable) |
| | • | | Shares purchased through reinvestment of capital gains distributions and dividend reinvestment when purchasing shares of the same fund (but not any other fund within the fund family) |
| | • | | Shares exchanged from Class C (i.e. level-load) shares of the same fund in the month of or following the 10-year anniversary of the purchase date |
| | • | | Employees and registered representatives of Merrill Lynch or its affiliates and their family members, as defined by Merrill Lynch, which may differ from the definition of family member in the Fund’s prospectus. |
| | • | | Directors or Trustees of the Fund, and employees of the Fund’s investment adviser or any of its affiliates, as described in the Fund’s prospectus |
| | • | | Shares purchased from the proceeds of redemptions within the same fund family, provided (1) the repurchase occurs within 90 days following the redemption, (2) the redemption and purchase occur in the same account, and (3) redeemed shares were subject to a front-end or deferred sales load (known as Rights of Reinstatement). Subject to the Fund’s policy regarding frequent purchases and redemptions of Fund shares, you may not be able to repurchase shares for the first 30 days after your redemption. |
CDSC Waivers on A, B and C Shares available at Merrill Lynch
| | • | | Death or disability of the shareholder |
| | • | | Shares sold as part of a systematic withdrawal plan as described in the Fund’s prospectus |
| | • | | Return of excess contributions from an IRA Account |
| | • | | Shares sold as part of a required minimum distribution for IRA and retirement accounts due to the shareholder reaching age 70½ |
| | • | | Shares sold to pay Merrill Lynch fees but only if the transaction is initiated by Merrill Lynch |
| | • | | Shares acquired through a right of reinstatement |
| | • | | Shares held in retirement brokerage accounts, that are exchanged for a lower cost share class due to transfer to certain fee based accounts or platforms (applicable to A and C shares only) |
Front-end load Discounts Available at Merrill Lynch: Breakpoints, Rights of Accumulation & Letters of Intent
| | • | | Breakpoints as described in the Fund’s prospectus |
| | • | | Rights of Accumulation (ROA) which entitle shareholders to breakpoint discounts will be automatically calculated based on the aggregated holding of fund family assets held by accounts within the purchaser’s household at Merrill Lynch. Eligible fund family assets not held at Merrill Lynch may be included in the ROA calculation only if the shareholder notifies his or her financial advisor about such assets. |
| | • | | Letters of Intent (LOI) which allow for breakpoint discounts based on anticipated purchases within a fund family, through Merrill Lynch, over a 13-month period of time (if applicable) |
Morgan Stanley
Effective on or about July 1, 2018, shareholders purchasing Fund shares through a Morgan Stanley Wealth Management transactional brokerage account will be eligible only for the following Class A load waivers (front-end sales charge waivers), which may differ from and be more limited than those disclosed in the Fund’s prospectus or Statement of Additional Information.
Front-end Sales Load Waivers on Class A Shares Available at Morgan Stanley
| | • | | Employer-sponsored retirement plans (e.g., 401(k) plans, 457 plans, employer-sponsored 403(b) plans, profit sharing and money purchase pension plans and defined benefit plans). For purposes of this provision, employer-sponsored retirement plans do not include SEP IRAs, Simple IRAs, SAR-SEPs or Keogh plans. |
| | • | | Morgan Stanley employee and employee-related accounts according to Morgan Stanley’s account linking rules |
| | • | | Shares purchased through reinvestment of dividends and capital gains distributions when purchasing shares of the same fund |
| | • | | Shares purchased through a Morgan Stanley self-directed brokerage account |
| | | | |
| 40 | | Wells Fargo Large Cap Growth Fund | | Appendix A (unaudited) |
| | • | | Class C (i.e., level-load) shares that are no longer subject to a contingent deferred sales charge and are exchanged to Class A shares of the same fund pursuant to Morgan Stanley Wealth Management’s share class exchange program. |
| | • | | Shares purchased from the proceeds of redemptions within the same fund family, provided (i) the repurchase occurs within 90 days following the redemption, (ii) the redemption and purchase occur in the same account, and (iii) redeemed shares were subject to a front-end or deferred sales charge. This waiver is subject to the Fund’s policy regarding frequent purchases and redemption of Fund shares, as discussed under “Account Information—Frequent Purchases and Redemptions of Fund Shares” in the Fund’s prospectus. |

For more information
More information about Wells Fargo Funds is available free upon request. To obtain literature, please write, email, visit the Fund’s website, or call:
Wells Fargo Funds
P.O. Box 219967
Kansas City, MO 64121-9967
Website: wellsfargofunds.com
Individual investors: 1-800-222-8222
Retail investment professionals: 1-888-877-9275
Institutional investment professionals: 1-866-765-0778
This report and the financial statements contained herein are submitted for the general information of the shareholders of the Fund. If this report is used for promotional purposes, distribution of the report must be accompanied or preceded by a current prospectus. Before investing, please consider the investment objectives, risks, charges, and expenses of the investment. For a current prospectus and, if available, a summary prospectus, containing this information, call 1-800-222-8222 or visit the Fund’s website at wellsfargofunds.com. Read the prospectus carefully before you invest or send money.
Wells Fargo Asset Management (WFAM) is the trade name for certain investment advisory/management firms owned by Wells Fargo & Company. These firms include but are not limited to Wells Capital Management Incorporated and Wells Fargo Funds Management, LLC. Certain products managed by WFAM entities are distributed by Wells Fargo Funds Distributor, LLC (a broker/dealer and Member FINRA).
This material is for general informational and educational purposes only and is NOT intended to provide investment advice or a recommendation of any kind—including a recommendation for any specific investment, strategy, or plan.
NOT FDIC INSURED ◾ NO BANK GUARANTEE ◾ MAY LOSE VALUE
© 2018 Wells Fargo Funds Management, LLC. All rights reserved.
| | |
 | | 314799 09-18 A209/AR209 07-18 |
Annual Report
July 31, 2018

Wells Fargo Large Company Value Fund


Reduce clutter. Save trees.
Sign up for electronic delivery of prospectuses and shareholder reports at wellsfargo.com/advantagedelivery
Contents
The views expressed and any forward-looking statements are as of July 31, 2018, unless otherwise noted, and are those of the Fund managers and/or Wells Fargo Funds Management, LLC. Discussions of individual securities, or the markets generally, or any Wells Fargo Fund are not intended as individual recommendations. Future events or results may vary significantly from those expressed in any forward-looking statements. The views expressed are subject to change at any time in response to changing circumstances in the market. Wells Fargo Funds Management, LLC and the Fund disclaim any obligation to publicly update or revise any views expressed or forward-looking statements.
NOT FDIC INSURED ◾ NO BANK GUARANTEE ◾ MAY LOSE VALUE
| | | | |
| 2 | | Wells Fargo Large Company Value Fund | | Letter to shareholders (unaudited) |

Andrew Owen
President
Wells Fargo Funds
After advancing during the summer and fall of 2017 in a roughly synchronized way, economic growth and stock markets globally diverged during the first seven months of 2018.
Dear Shareholder:
We are pleased to offer you this annual report for the Wells Fargo Large Company Value Fund for the 12-month period that ended July 31, 2018. After advancing during the summer and fall of 2017 in a roughly synchronized way, economic growth and stock markets globally diverged during the first seven months of 2018. For fixed-income investors, higher U.S. interest rates, rising inflation, and intensifying global geopolitical tensions tended to restrain taxable bond prices while high-yield and municipal bond investors generally enjoyed positive returns.
For the period, U.S. stocks, as measured by the S&P 500 Index,1 gained 16.24%, and international stocks, as measured by the MSCI ACWI ex USA Index (Net),2 added 5.94%. Emerging market stocks, as measured by the MSCI EM Index (Net),3 added 4.36%. In bond markets, the Bloomberg Barclays U.S. Aggregate Bond Index4 declined 0.80% while fixed-income investments outside the U.S. fell 0.27%, according to the Bloomberg Barclays Global Aggregate ex-USD Index.5 The Bloomberg Barclays Municipal Bond Index6 added 0.99%, and the ICE BofAML U.S. High Yield Index7 was up 2.49%.
Volatility increased as summer turned to fall in 2017, although data generally was favorable.
During the third quarter of 2017, investor expectations rose and fell amid shifting geopolitical tensions, particularly in Asia as North Korea’s nuclear aspirations and U.S./China trade rhetoric caused concerns. In the U.S., corporate earnings and consumer confidence improved. The U.S. Bureau of Economic Analysis reported that annualized U.S. gross domestic product (GDP) growth for the quarter was 2.8%. The rate of inflation was below the U.S. Federal Reserve’s (Fed’s) targets.
Economic momentum increased in Europe; the European Central Bank (ECB) held its rates steady at low levels and continued its quantitative easing bond-buying program with the goal of sparking economic activity. In emerging markets, many countries benefited from stronger currencies versus the U.S. dollar while commodity price increases benefited countries that rely on natural resources for exports.
| 1 | The S&P 500 Index consists of 500 stocks chosen for market size, liquidity, and industry group representation. It is a market-value-weighted index with each stock’s weight in the index proportionate to its market value. You cannot invest directly in an index. |
| 2 | The Morgan Stanley Capital International (MSCI) All Country World Index (ACWI) ex USA Index (Net) is a free-float-adjusted market-capitalization-weighted index that is designed to measure the equity market performance of developed markets, excluding the United States and Canada. Source: MSCI. MSCI makes no express or implied warranties or representations and shall have no liability whatsoever with respect to any MSCI data contained herein. The MSCI data may not be further redistributed or used as a basis for other indices or any securities or financial products. This report is not approved, reviewed, or produced by MSCI. You cannot invest directly in an index. |
| 3 | The MSCI Emerging Markets (EM) Index (Net) is a free-float-adjusted market-capitalization-weighted index that is designed to measure large- and mid-cap equity market performance of emerging markets. The MSCI EM Index (Net) consists of the following 24 emerging market country indices: Brazil, Chile, China, Colombia, Czech Republic, Egypt, Greece, Hungary, India, Indonesia, Korea, Malaysia, Mexico, Pakistan, Peru, the Philippines, Poland, Qatar, Russia, South Africa, Taiwan, Thailand, Turkey, and the United Arab Emirates. You cannot invest directly in an index. |
| 4 | The Bloomberg Barclays U.S. Aggregate Bond Index is a broad-based benchmark that measures the investment-grade, U.S. dollar-denominated, fixed-rate taxable bond market, including Treasuries, government-related and corporate securities, mortgage-backed securities (agency fixed-rate and hybrid adjustable-rate mortgage pass-throughs), asset-backed securities, and commercial mortgage-backed securities. You cannot invest directly in an index. |
| 5 | The Bloomberg Barclays Global Aggregate ex-USD Index is an unmanaged index that provides a broad-based measure of the global investment-grade fixed-income markets excluding the U.S. dollar-denominated debt market. You cannot invest directly in an index. |
| 6 | The Bloomberg Barclays Municipal Bond Index is an unmanaged index composed of long-term tax-exempt bonds with a minimum credit rating of Baa. You cannot invest directly in an index. |
| 7 | The ICE BofAML U.S. High Yield Index is a market-capitalization-weighted index of domestic and Yankee high-yield bonds. The index tracks the performance of high-yield securities traded in the U.S. bond market. You cannot invest directly in an index. Copyright 2018. ICE Data Indices, LLC. All rights reserved. |
| 8 | The Consumer Price Index For All Urban Consumers (CPI-U) measures the changes in the price of a basket of goods and services purchased by urban consumers. The urban consumer population is deemed by many as a better representative measure of the general public because most of the country’s population lives in highly populated areas, which represent close to 90% of the total population. You cannot invest directly in an index. |
| | | | | | |
| Letter to shareholders (unaudited) | | Wells Fargo Large Company Value Fund | | | 3 | |
The fourth quarter of 2017 was characterized by continued optimism in the U.S.
By the end of 2017, some observers were describing conditions as a Goldilocks economic scenario: synchronized global growth, low inflation, and healthy corporate earnings, all supported abroad by a weaker U.S. dollar.
U.S. stocks continued to rally during the fourth quarter of 2017, boosted by favorable company earnings and the potential for tax reform and industry deregulation. The Fed increased rates by 25 basis points (bps; 100 bps equal 1.00%) in December. The annualized GDP growth rate for the fourth quarter was 2.3%.
Internationally, the Bank of England (BoE) raised interest rates in November 2017 to 0.50%, the first increase in more than 10 years and a move up from the 0.25% rate put in place after the Brexit vote to leave the European Union in June 2016. The pound gained against other currencies. Meanwhile, the ECB and the Bank of Japan maintained interest rate policies and bond-buying programs intended to spur business activities and enhance the attractiveness of equity investments. The People’s Bank of China (PBOC) also continued policies that encouraged business investment. International equity markets, particularly emerging markets, continued to show strength.
Volatility reemerged during the first quarter of 2018 as economic signals were mixed.
The first quarter of 2018 began with stock market gains in January following U.S. tax reform that lowered rates for individuals and corporations and deregulation advanced in some economic sectors. Then, investor optimism was supplanted by several concerns. Trade tensions intensified, particularly between the U.S. and China. The U.S. threatened to impose tariffs on a broad range of imported products. Increasing interest rates and inflation also caused concern. During February 2018, the U.S. stock market endured a loss of more than 10% before recovering in March and April. The S&P 500 Index closed the first quarter with a negative return, the first negative quarterly return for the index since 2014.
The Fed increased the federal funds rate by 25 bps in March 2018 and the rate of inflation reached the Fed’s 2% target for the first time in a year. The unemployment rate fell to 4.1%. The third revision of first-quarter GDP growth by the U.S. Bureau of Economic Analysis released during June 2018 was lowered to 2.0%.
Overseas, investment market returns reversed the strong returns of 2017. After having gained 27.19% for the 12-month period that ended December 31, 2017, the MSCI ACWI ex USA Index (Net) fell 1.46% for the 7-month period that ended July 31, 2018. The U.S. dollar strengthened relative to local currencies, which served to restrain returns.
Global trade tensions escalated during the second quarter and into the third quarter of 2018.
Global trade tensions escalated as the second quarter of 2018 opened and equity markets fell in response before resuming upward momentum later in April. The U.S. government imposed tariffs on products and commodities imported from other markets in North America, Europe, and Asia. In retaliation, governments imposed tariffs on U.S. products and commodities. In addition, the U.S. pushed its North American neighbors to renegotiate the North American Free Trade Agreement, furthering trade tensions and investor uncertainty.
The CPI-U8 added 0.2% in May after a similar increase in April. On a year-over-year basis, the all-items index rose 2.8% for the 12 months that ended May 31, continuing its upward trend since the beginning of the year. The index for all items less food and energy rose 2.2% for the same 12-month period. Interest rates generally increased and the bond markets tended to decline.
During February 2018, the U.S. stock market endured a loss of more than 10% before recovering in March and April.
| | | | |
| 4 | | Wells Fargo Large Company Value Fund | | Letter to shareholders (unaudited) |
During June 2018, the Fed increased the federal funds rate by 25 bps. Investment markets began to anticipate two more rate increases in 2018. Long-term interest rates in the U.S. trended higher—rates on the 10-year and 30-year Treasury bonds moved from 2.46% and 2.81%, respectively, on January 1, 2018, to 2.96% and 3.08%, respectively, on July 31, 2018. While higher at the end of the period, rates were off their peak levels on May 17, 2018, of 3.11% and 3.25%, respectively. Investors became more aware of and concerned about the potential for an inverted yield curve—sometimes a recession signal—as short-term rates increased more quickly than long-term rates.
The unemployment rate fell to 3.9% in July after ticking up slightly in June from May’s 3.8% level, according to the U.S. Department of Labor. The annualized rate of GDP growth for the second quarter of 2018 was reported in July to be 4.1%, the highest level since the third quarter of 2014, according to the U.S. Bureau of Economic Analysis.
Internationally, the prospects for a smooth U.K. Brexit agreement was cast into doubt as members of Prime Minister Theresa May’s negotiating team resigned. Despite the uncertainty, the period closed with expectations that the BoE’s Monetary Policy Committee in July would announce an increase in its key interest rate to 0.75%, which it did in early August.
Meanwhile, central banks in Europe and Japan maintained low interest rates and accommodative monetary policies. Amid rising trade uncertainty, PBOC monetary policies shifted with cuts to reserve requirement ratios and implementation of supportive measures such as accelerated infrastructure spending and tax cuts for small and medium enterprises and for individuals. Nevertheless, a strengthening U.S. dollar and the tensions associated with trade policies remained headwinds for investors overseas.
Don’t let short-term uncertainty derail long-term investment goals.
Periods of investment uncertainty can present challenges, but experience has taught us that maintaining long-term investment goals can be an effective way to plan for the future. To help you create a sound strategy based on your personal goals and risk tolerance, Wells Fargo Funds offers more than 100 mutual funds spanning a wide range of asset classes and investment styles. Although diversification cannot guarantee an investment profit or prevent losses, we believe it can be an effective way to manage investment risk and potentially smooth out overall portfolio performance. We encourage investors to know their investments and to understand that appropriate levels of risk-taking may unlock opportunities.
Thank you for choosing to invest with Wells Fargo Funds. We appreciate your confidence in us and remain committed to helping you meet your financial needs.
Sincerely,

Andrew Owen
President
Wells Fargo Funds
| | | | | | |
| Letter to shareholders (unaudited) | | Wells Fargo Large Company Value Fund | | | 5 | |
Notice to shareholders
At a meeting held on August 14-15, 2018, the Board of Trustees of the Fund approved the following policy which will be effective on or about February 5, 2019:
Class C shares will convert automatically into Class A shares ten years after the initial date of purchase or, if you acquired your Class C shares through an exchange or conversion from another share class, ten years after the date you acquired your Class C shares. When Class C shares that you acquired through a purchase or exchange convert, any other Class C shares that you purchased with reinvested dividends and distributions also will convert into Class A shares on a pro rata basis. A shorter holding period may also apply depending on your intermediary. Please see “Appendix A—Sales Charge Reductions and Waivers for Certain Intermediaries” in the Fund’s prospectus or at the end of this report.
For further information about your Fund, contact your investment professional, visit our website at wellsfargofunds.com, or call us directly at 1-800-222-8222.
| | | | |
| 6 | | Wells Fargo Large Company Value Fund | | Performance highlights (unaudited) |
Investment objective
The Fund seeks long-term capital appreciation.
Manager
Wells Fargo Funds Management, LLC
Subadviser
Analytic Investors, LLC
Portfolio managers
Dennis Bein, CFA®
Ryan Brown, CFA®
Harindra de Silva, Ph.D., CFA®
Average annual total returns (%) as of July 31, 20181
| | | | | | | | | | | | | | | | | | | | | | | | | | | | | | | | | | |
| | | | | Including sales charge | | | Excluding sales charge | | | Expense ratios2 (%) | |
| | | Inception date | | 1 year | | | 5 year | | | 10 year | | | 1 year | | | 5 year | | | 10 year | | | Gross | | | Net3 | |
| Class A (WLCAX) | | 3-31-2008 | | | 3.09 | | | | 6.98 | | | | 6.68 | | | | 9.39 | | | | 8.26 | | | | 7.31 | | | | 0.94 | | | | 0.83 | |
| Class C (WFLVX) | | 3-31-2008 | | | 7.49 | | | | 7.45 | | | | 6.52 | | | | 8.49 | | | | 7.45 | | | | 6.52 | | | | 1.69 | | | | 1.58 | |
| Class R6 (WTLVX) | | 4-7-2017 | | | – | | | | – | | | | – | | | | 9.88 | | | | 8.72 | | | | 7.82 | | | | 0.51 | | | | 0.40 | |
| Administrator Class (WWIDX) | | 12-31-2001 | | | – | | | | – | | | | – | | | | 9.44 | | | | 8.43 | | | | 7.56 | | | | 0.86 | | | | 0.75 | |
| Institutional Class (WLCIX) | | 3-31-2008 | | | – | | | | – | | | | – | | | | 9.77 | | | | 8.68 | | | | 7.80 | | | | 0.61 | | | | 0.50 | |
| Russell 1000® Value Index4 | | – | | | – | | | | – | | | | – | | | | 9.54 | | | | 10.04 | | | | 8.95 | | | | – | | | | – | |
Figures quoted represent past performance, which is no guarantee of future results, and do not reflect taxes that a shareholder may pay on fund distributions or the redemption of fund shares. Investment return and principal value of an investment will fluctuate so that an investor’s shares, when redeemed, may be worth more or less than their original cost. Performance shown without sales charges would be lower if sales charges were reflected. Current performance may be lower or higher than the performance data quoted, which assumes the reinvestment of dividends and capital gains. Current month-end performance is available on the Fund’s website, wellsfargofunds.com.
Index returns do not include transaction costs associated with buying and selling securities, any mutual fund fees or expenses, or any taxes. It is not possible to invest directly in an index.
For Class A shares, the maximum front-end sales charge is 5.75%. For Class C shares, the maximum contingent deferred sales charge is 1.00%. Performance including a contingent deferred sales charge assumes the sales charge for the corresponding time period. Class R6, Administrator Class, and Institutional Class shares are sold without a front-end sales charge or contingent deferred sales charge.
Stock values fluctuate in response to the activities of individual companies and general market and economic conditions. Certain investment strategies tend to increase the total risk of an investment (relative to the broader market). The Fund is exposed to foreign investment risk. Consult the Fund’s prospectus for additional information on these and other risks.
Please see footnotes on page 7.
| | | | | | |
| Performance highlights (unaudited) | | Wells Fargo Large Company Value Fund | | | 7 | |
|
| Growth of $10,000 investment as of July 31, 20185 |
|
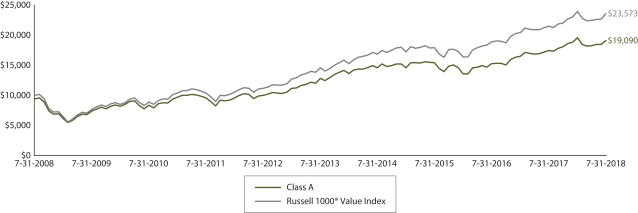 |
| 1 | Historical performance shown for the Class R6 shares prior to their inception reflects the performance of the Institutional Class shares, and is not adjusted to reflect Class R6 expenses. If these expenses had been included, returns for Class R6 shares would be higher. |
| 2 | Reflects the expense ratios as stated in the most recent prospectuses. The expense ratios shown are subject to change and may differ from the annualized expense ratios shown in the financial highlights of this report. |
| 3 | The manager has contractually committed through November 30, 2019, to waive fees and/or reimburse expenses to the extent necessary to cap the Fund’s Total Annual Fund Operating Expenses After Fee Waivers at the amounts shown. After this time, the cap may be increased or the commitment to maintain the cap may be terminated only with the approval of the Board of Trustees. Brokerage commissions, stamp duty fees, interest, taxes, acquired fund fees and expenses (if any), and extraordinary expenses are excluded from the expense cap. Without this cap, the Fund’s returns would have been lower. The expense ratio paid by an investor is the net expense ratio (the total annual fund operating expenses after fee waivers) as stated in the prospectuses. |
| 4 | The Russell 1000® Value Index measures the performance of those Russell 1000 companies with lower price/book ratios and lower forecasted growth values. You cannot invest directly in an index. |
| 5 | The chart compares the performance of Class A shares for the most recent ten years with the Russell 1000® Value Index. The chart assumes a hypothetical investment of $10,000 in Class A shares and reflects all operating expenses and assumes the maximum initial sales charge of 5.75%. |
| 6 | The ten largest holdings, excluding cash, cash equivalents and any money market funds, are calculated based on the value of the investments divided by total net assets of the Fund. Holdings are subject to change and may have changed since the date specified. |
| 7 | The Personal Consumption Expenditures (PCE) Index is the primary measure of consumer spending on goods and services in the U.S. economy. It accounts for about two-thirds of domestic final spending and is part of the personal income report issued by the Bureau of Economic Analysis of the Department of Commerce. You cannot invest directly in an index. |
| 8 | Amounts are calculated based on the total long-term investments of the Fund. These amounts are subject to change and may have changed since the date specified. |
| * | This security was no longer held at the end of the reporting period. |
| | | | |
| 8 | | Wells Fargo Large Company Value Fund | | Performance highlights (unaudited) |
MANAGER’S DISCUSSION
Fund highlights
| ∎ | | The Fund (Class A, excluding sales charges) underperformed its benchmark, the Russell 1000® Value Index, for the 12-month period that ended July 31, 2018. |
| ∎ | | The Fund’s underperformance was primarily due to poor selection within the energy sector. A modest overweight to consumer staples also negatively affected relative performance. |
| ∎ | | Stock selection within the health care and industrials sectors helped relative performance. The Fund’s underweight to the industrials sector helped as well. |
U.S. stocks delivered strong results during the reporting period.
In general, economic data released during the period was positive and upbeat. For example, gross domestic product growth for the fourth quarter of 2017 was revised up to a 2.9% annualized rate. In addition, a surprising 313,000 new jobs were added in February 2018, with another 39,000 added to the already-strong January report. The U.S. unemployment rate fell to 3.8% by the end of the period, the lowest jobless rate since April 2000, and household spending increased.
| | | | |
| Ten largest holdings (%) as of July 31, 20186 | |
JPMorgan Chase & Company | | | 4.48 | |
Exxon Mobil Corporation | | | 4.42 | |
Bank of America Corporation | | | 4.13 | |
AT&T Incorporated | | | 3.78 | |
Johnson & Johnson | | | 3.62 | |
Chevron Corporation | | | 3.14 | |
Berkshire Hathaway Incorporated Class B | | | 3.12 | |
ConocoPhillips | | | 2.66 | |
State Street Corporation | | | 2.25 | |
Wal-Mart Stores Incorporated | | | 2.15 | |
Stocks continued to climb despite increasing geopolitical risk. Escalating tension between the U.S. and North Korea, including the launch of North Korean ballistic missiles over Japan, was an example of events in the ongoing tensions between the two countries. In addition, stocks moved higher even as the U.S. Federal Reserve (Fed) raised interest rates three times during the period and six times since the 2008 financial crisis. Year-over-year inflation, as measured by the PCE Index7, hit the Fed’s 2% target in March 2018 for the first time in over a year, a sign of strengthening U.S. inflation pressures that could encourage the Fed to continue lifting interest rates this year. Although the Fed left U.S. interest rates unchanged in May 2018, the central bank also took note of rising prices and said it now expects inflation to be near its 2% target over the medium term.
Market volatility, while tame for most of the one-year period, returned in early 2018 amid worries about inflation, global trade wars, and new regulations on technology firms.
|
| Sector distribution as of July 31, 20188 |
|
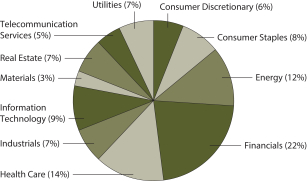 |
Detractors included stock selection within energy and modest overweights to consumer staples and real estate.
A position in Ultra Petroleum Corporation* and underweight positions to Anadarko Petroleum Corporation*, Occidental Petroleum Corporation*, and Phillips 66* were large detractors in the energy sector. By design, the investment process does not take large relative positions to benchmark weights. During the period, modest overweights to consumer staples and real estate negatively influenced relative results.
Selection within health care and industrials contributed to the Fund’s performance.
From a sector standpoint, an underweight to the industrials sector and stock selection within health care and industrials contributed to relative performance. Within industrials, an underweight position to General Electric Company* and an
Please see footnotes on page 7.
| | | | | | |
| Performance highlights (unaudited) | | Wells Fargo Large Company Value Fund | | | 9 | |
overweight position to Spirit AeroSystems Holdings, Incorporated*, were the top two individual contributors to relative performance. Within health care, overweight positions to both Biogen Incorporated* and Johnson & Johnson were top contributors to performance.
Going forward, our investment philosophy and process remain the same.
The investment philosophy employed in our value-equity strategy is that security returns are predictable based on common fundamental factors and that market inefficiencies caused by patterns of investor behavior and economic change can be exploited to earn an excess return. The stock selection model uses over 70 fundamental, technical, and proprietary factors to build a diversified portfolio that we believe is well positioned to generate excess returns over a three- to five-year market cycle.
During the period, the portfolio had an overweight exposure to the quality factors and an underweight position to risk factors in our model, which overall had a positive effect on results. In particular, an overweight exposure to the profit margin and return-on-equity quality factors were rewarded. In addition, underweighting companies with above-average cash flow and sales-per-share volatility helped as these risk factors were penalized by investors during the period. An emphasis to valuation factors negatively affected results because value factors were not rewarded during the period. For instance, an overweight exposure to the cash-flow-and-earnings-to-price factor dragged on results.
Our process is based on the fundamental belief that there is persistency in the types of characteristics investors prefer. If this holds going forward, we expect the Fund to benefit from being properly positioned toward stocks with characteristics favored by investors. We continue to emphasize stocks with certain attractive valuation characteristics, such as stocks with above-average cash-flow-to-price ratios and sales-to-price ratios. In addition, we will continue to focus on companies with strong quality metrics, such as stocks with relatively higher return-on-equity and return-on-assets factors. Finally, we will continue to deemphasize risk as investors avoid companies with above-average risk characteristics, such as above-average leverage.
Please see footnotes on page 7.
| | | | |
| 10 | | Wells Fargo Large Company Value Fund | | Fund expenses (unaudited) |
As a shareholder of the Fund, you incur two types of costs: (1) transaction costs, including sales charges (loads) on purchase payments and contingent deferred sales charges (if any) on redemptions and (2) ongoing costs, including management fees, distribution (12b-1) and/or shareholder servicing fees, and other Fund expenses. This example is intended to help you understand your ongoing costs (in dollars) of investing in the Fund and to compare these costs with the ongoing costs of investing in other mutual funds.
The example is based on an investment of $1,000 invested at the beginning of the six-month period and held for the entire period from February 1, 2018 to July 31, 2018.
Actual expenses
The “Actual” line of the table below provides information about actual account values and actual expenses. You may use the information in this line, together with the amount you invested, to estimate the expenses that you paid over the period. Simply divide your account value by $1,000 (for example, an $8,600 account value divided by $1,000 = 8.6), then multiply the result by the number in the “Actual” line under the heading entitled “Expenses paid during period” for your applicable class of shares to estimate the expenses you paid on your account during this period.
Hypothetical example for comparison purposes
The “Hypothetical” line of the table below provides information about hypothetical account values and hypothetical expenses based on the Fund’s actual expense ratio and an assumed rate of return of 5% per year before expenses, which is not the Fund’s actual return. The hypothetical account values and expenses may not be used to estimate the actual ending account balance or expenses you paid for the period. You may use this information to compare the ongoing costs of investing in the Fund and other funds. To do so, compare this 5% hypothetical example with the 5% hypothetical examples that appear in the shareholder reports of the other funds.
Please note that the expenses shown in the table are meant to highlight your ongoing costs only and do not reflect any transactional costs, such as sales charges (loads) and contingent deferred sales charges. Therefore, the “Hypothetical” line of the table is useful in comparing ongoing costs only and will not help you determine the relative total costs of owning different funds. In addition, if these transactional costs were included, your costs would have been higher.
| | | | | | | | | | | | | | | | |
| | | Beginning
account value
2-1-2018 | | | Ending
account value
7-31-2018 | | | Expenses
paid during
the period¹ | | | Annualized net
expense ratio | |
Class A | | | | | | | | | | | | | | | | |
Actual | | $ | 1,000.00 | | | $ | 973.44 | | | $ | 4.13 | | | | 0.83 | % |
Hypothetical (5% return before expenses) | | $ | 1,000.00 | | | $ | 1,021.02 | | | $ | 4.23 | | | | 0.83 | % |
Class C | | | | | | | | | | | | | | | | |
Actual | | $ | 1,000.00 | | | $ | 969.26 | | | $ | 7.84 | | | | 1.58 | % |
Hypothetical (5% return before expenses) | | $ | 1,000.00 | | | $ | 1,017.24 | | | $ | 8.03 | | | | 1.58 | % |
Class R6 | | | | | | | | | | | | | | | | |
Actual | | $ | 1,000.00 | | | $ | 975.84 | | | $ | 1.99 | | | | 0.40 | % |
Hypothetical (5% return before expenses) | | $ | 1,000.00 | | | $ | 1,023.19 | | | $ | 2.04 | | | | 0.40 | % |
Administrator Class | | | | | | | | | | | | | | | | |
Actual | | $ | 1,000.00 | | | $ | 973.81 | | | $ | 3.73 | | | | 0.75 | % |
Hypothetical (5% return before expenses) | | $ | 1,000.00 | | | $ | 1,021.42 | | | $ | 3.82 | | | | 0.75 | % |
Institutional Class | | | | | | | | | | | | | | | | |
Actual | | $ | 1,000.00 | | | $ | 974.98 | | | $ | 2.49 | | | | 0.50 | % |
Hypothetical (5% return before expenses) | | $ | 1,000.00 | | | $ | 1,022.68 | | | $ | 2.55 | | | | 0.50 | % |
| 1 | Expenses paid is equal to the annualized net expense ratio of each class multiplied by the average account value over the period, multiplied by the number of days in the most recent fiscal half-year divided by the number of days in the fiscal year (to reflect the one-half-year period). |
| | | | | | |
| Portfolio of investments—July 31, 2018 | | Wells Fargo Large Company Value Fund | | | 11 | |
| | | | | | | | | | | | | | | | |
| Security name | | | | | | | | Shares | | | Value | |
|
Common Stocks: 98.15% | |
| | | | |
Consumer Discretionary: 6.31% | | | | | | | | | | | | | | | | |
| | | | |
| Hotels, Restaurants & Leisure: 3.29% | | | | | | | | | | | | | | | | |
Royal Caribbean Cruises Limited | | | | | | | | | | | 31,322 | | | $ | 3,531,869 | |
Yum China Holdings Incorporated | | | | | | | | | | | 131,609 | | | | 4,748,453 | |
| |
| | | | 8,280,322 | |
| | | | | | | | | | | | | | | | |
| | | | |
| Household Durables: 0.40% | | | | | | | | | | | | | | | | |
Cavco Industries Incorporated † | | | | | | | | | | | 4,715 | | | | 1,001,702 | |
| | | | | | | | | | | | | | | | |
| | | | |
| Leisure Products: 0.12% | | | | | | | | | | | | | | | | |
Callaway Golf Company | | | | | | | | | | | 15,975 | | | | 307,359 | |
| | | | | | | | | | | | | | | | |
| | | | |
| Media: 2.00% | | | | | | | | | | | | | | | | |
DISH Network Corporation Class A † | | | | | | | | | | | 17,297 | | | | 545,893 | |
Meredith Corporation | | | | | | | | | | | 26,612 | | | | 1,414,428 | |
News Corporation Class A | | | | | | | | | | | 164,475 | | | | 2,478,638 | |
Twenty-First Century Fox Incorporated Class B | | | | | | | | | | | 1,064 | | | | 47,263 | |
Viacom Incorporated Class B | | | | | | | | | | | 18,552 | | | | 538,936 | |
| |
| | | | 5,025,158 | |
| | | | | | | | | | | | | | | | |
| | | | |
| Specialty Retail: 0.50% | | | | | | | | | | | | | | | | |
The Home Depot Incorporated | | | | | | | | | | | 6,328 | | | | 1,249,907 | |
| | | | | | | | | | | | | | | | |
| | | | |
Consumer Staples: 8.20% | | | | | | | | | | | | | | | | |
| | | | |
| Beverages: 0.04% | | | | | | | | | | | | | | | | |
PepsiCo Incorporated | | | | | | | | | | | 796 | | | | 91,540 | |
| | | | | | | | | | | | | | | | |
| | | | |
| Food & Staples Retailing: 3.76% | | | | | | | | | | | | | | | | |
Performance Food Group Company † | | | | | | | | | | | 30,036 | | | | 1,076,791 | |
US Foods Holding Corporation † | | | | | | | | | | | 87,777 | | | | 2,967,740 | |
Wal-Mart Stores Incorporated | | | | | | | | | | | 60,601 | | | | 5,407,427 | |
| |
| | | | 9,451,958 | |
| | | | | | | | | | | | | | | | |
| | | | |
| Food Products: 1.99% | | | | | | | | | | | | | | | | |
Ingredion Incorporated | | | | | | | | | | | 25,364 | | | | 2,569,373 | |
Tyson Foods Incorporated Class A | | | | | | | | | | | 42,293 | | | | 2,438,191 | |
| |
| | | | 5,007,564 | |
| | | | | | | | | | | | | | | | |
| | | | |
| Household Products: 1.84% | | | | | | | | | | | | | | | | |
The Procter & Gamble Company | | | | | | | | | | | 57,247 | | | | 4,630,137 | |
| | | | | | | | | | | | | | | | |
| | | | |
| Tobacco: 0.57% | | | | | | | | | | | | | | | | |
Philip Morris International Incorporated | | | | | | | | | | | 16,643 | | | | 1,436,291 | |
| | | | | | | | | | | | | | | | |
| | | | |
Energy: 11.99% | | | | | | | | | | | | | | | | |
| | | | |
| Oil, Gas & Consumable Fuels: 11.99% | | | | | | | | | | | | | | | | |
Chevron Corporation | | | | | | | | | | | 62,547 | | | | 7,897,810 | |
ConocoPhillips | | | | | | | | | | | 92,839 | | | | 6,700,191 | |
The accompanying notes are an integral part of these financial statements.
| | | | |
| 12 | | Wells Fargo Large Company Value Fund | | Portfolio of investments—July 31, 2018 |
| | | | | | | | | | | | | | | | |
| Security name | | | | | | | | Shares | | | Value | |
| | | | |
| Oil, Gas & Consumable Fuels (continued) | | | | | | | | | | | | | | | | |
EOG Resources Incorporated | | | | | | | | | | | 29,821 | | | $ | 3,845,120 | |
Exxon Mobil Corporation | | | | | | | | | | | 136,290 | | | | 11,108,998 | |
HollyFrontier Corporation | | | | | | | | | | | 8,263 | | | | 616,255 | |
| |
| | | | 30,168,374 | |
| | | | | | | | | | | | | | | | |
|
Financials: 21.95% | |
| | | | |
| Banks: 11.87% | | | | | | | | | | | | | | | | |
Bank of America Corporation | | | | | | | | | | | 336,358 | | | | 10,386,735 | |
Bank of N.T. Butterfield & Son Limited | | | | | | | | | | | 2,005 | | | | 99,167 | |
Comerica Incorporated | | | | | | | | | | | 48,761 | | | | 4,726,891 | |
JPMorgan Chase & Company | | | | | | | | | | | 98,065 | | | | 11,272,572 | |
PNC Financial Services Group Incorporated | | | | | | | | | | | 1,951 | | | | 282,563 | |
Synovus Financial Corporation | | | | | | | | | | | 5,638 | | | | 278,630 | |
US Bancorp | | | | | | | | | | | 53,084 | | | | 2,813,983 | |
| |
| | | | 29,860,541 | |
| | | | | | | | | | | | | | | | |
| | | | |
| Capital Markets: 3.88% | | | | | | | | | | | | | | | | |
Affiliated Managers Group Incorporated | | | | | | | | | | | 1,808 | | | | 289,298 | |
Ameriprise Financial Incorporated | | | | | | | | | | | 26,065 | | | | 3,796,889 | |
State Street Corporation | | | | | | | | | | | 64,170 | | | | 5,666,853 | |
| |
| | | | 9,753,040 | |
| | | | | | | | | | | | | | | | |
| | | | |
| Consumer Finance: 1.28% | | | | | | | | | | | | | | | | |
Ally Financial Incorporated | | | | | | | | | | | 46,252 | | | | 1,237,704 | |
Capital One Financial Corporation | | | | | | | | | | | 21,028 | | | | 1,983,361 | |
| |
| | | | 3,221,065 | |
| | | | | | | | | | | | | | | | |
| | | | |
| Diversified Financial Services: 3.12% | | | | | | | | | | | | | | | | |
Berkshire Hathaway Incorporated Class B † | | | | | | | | | | | 39,611 | | | | 7,837,829 | |
| | | | | | | | | | | | | | | | |
| | | | |
| Insurance: 1.76% | | | | | | | | | | | | | | | | |
CNO Financial Group Incorporated | | | | | | | | | | | 129,840 | | | | 2,642,244 | |
The Progressive Corporation | | | | | | | | | | | 5,922 | | | | 355,379 | |
Unum Group | | | | | | | | | | | 36,344 | | | | 1,443,947 | |
| |
| | | | 4,441,570 | |
| | | | | | | | | | | | | | | | |
| | | | |
| Mortgage REITs: 0.04% | | | | | | | | | | | | | | | | |
New Residential Investment Corporation | | | | | | | | | | | 5,324 | | | | 95,246 | |
| | | | | | | | | | | | | | | | |
| | | | |
Health Care: 13.65% | | | | | | | | | | | | | | | | |
| | | | |
| Biotechnology: 3.52% | | | | | | | | | | | | | | | | |
AbbVie Incorporated | | | | | | | | | | | 37,650 | | | | 3,472,460 | |
Celgene Corporation † | | | | | | | | | | | 32,390 | | | | 2,918,015 | |
Enanta Pharmaceuticals Incorporated † | | | | | | | | | | | 4,781 | | | | 466,243 | |
Gilead Sciences Incorporated | | | | | | | | | | | 18,643 | | | | 1,450,985 | |
Myriad Genetics Incorporated † | | | | | | | | | | | 12,799 | | | | 559,956 | |
| |
| | | | 8,867,659 | |
| | | | | | | | | | | | | | | | |
The accompanying notes are an integral part of these financial statements.
| | | | | | |
| Portfolio of investments—July 31, 2018 | | Wells Fargo Large Company Value Fund | | | 13 | |
| | | | | | | | | | | | | | | | |
| Security name | | | | | | | | Shares | | | Value | |
| | | | |
| Health Care Equipment & Supplies: 1.12% | | | | | | | | | | | | | | | | |
Baxter International Incorporated | | | | | | | | | | | 36,987 | | | $ | 2,679,708 | |
ICU Medical Incorporated † | | | | | | | | | | | 472 | | | | 135,370 | |
| |
| | | | 2,815,078 | |
| | | | | | | | | | | | | | | | |
| | | | |
| Health Care Providers & Services: 3.97% | | | | | | | | | | | | | | | | |
Express Scripts Holding Company † | | | | | | | | | | | 63,365 | | | | 5,034,983 | |
Humana Incorporated | | | | | | | | | | | 15,735 | | | | 4,943,622 | |
| |
| | | | 9,978,605 | |
| | | | | | | | | | | | | | | | |
| | | | |
| Life Sciences Tools & Services: 0.31% | | | | | | | | | | | | | | | | |
Agilent Technologies Incorporated | | | | | | | | | | | 11,707 | | | | 773,130 | |
| | | | | | | | | | | | | | | | |
|
| Pharmaceuticals: 4.73% | |
Johnson & Johnson | | | | | | | | | | | 68,720 | | | | 9,106,774 | |
Merck & Company Incorporated | | | | | | | | | | | 42,491 | | | | 2,798,882 | |
| |
| | | | 11,905,656 | |
| | | | | | | | | | | | | | | | |
| | | | |
Industrials: 6.55% | | | | | | | | | | | | | | | | |
| | | | |
| Aerospace & Defense: 3.47% | | | | | | | | | | | | | | | | |
Raytheon Company | | | | | | | | | | | 24,894 | | | | 4,929,759 | |
The Boeing Company | | | | | | | | | | | 10,687 | | | | 3,807,778 | |
| |
| | | | 8,737,537 | |
| | | | | | | | | | | | | | | | |
| | | | |
| Airlines: 0.23% | | | | | | | | | | | | | | | | |
Delta Air Lines Incorporated | | | | | | | | | | | 10,409 | | | | 566,458 | |
| | | | | | | | | | | | | | | | |
| | | | |
| Industrial Conglomerates: 1.24% | | | | | | | | | | | | | | | | |
Honeywell International Incorporated | | | | | | | | | | | 19,599 | | | | 3,128,980 | |
| | | | | | | | | | | | | | | | |
| | | | |
| Road & Rail: 1.61% | | | | | | | | | | | | | | | | |
CSX Corporation | | | | | | | | | | | 16,156 | | | | 1,141,906 | |
Norfolk Southern Corporation | | | | | | | | | | | 17,144 | | | | 2,897,336 | |
| |
| | | | 4,039,242 | |
| | | | | | | | | | | | | | | | |
| | | | |
Information Technology: 8.32% | | | | | | | | | | | | | | | | |
| | | | |
| Communications Equipment: 1.22% | | | | | | | | | | | | | | | | |
Cisco Systems Incorporated | | | | | | | | | | | 72,639 | | | | 3,071,903 | |
| | | | | | | | | | | | | | | | |
| | | | |
| Internet Software & Services: 2.23% | | | | | | | | | | | | | | | | |
Akamai Technologies Incorporated † | | | | | | | | | | | 3,046 | | | | 229,242 | |
Alphabet Incorporated Class A † | | | | | | | | | | | 2,049 | | | | 2,514,574 | |
Cars.com Incorporated † | | | | | | | | | | | 100,988 | | | | 2,865,030 | |
| |
| | | | 5,608,846 | |
| | | | | | | | | | | | | | | | |
| | | | |
| IT Services: 0.31% | | | | | | | | | | | | | | | | |
DXC Technology Company | | | | | | | | | | | 9,109 | | | | 771,897 | |
| | | | | | | | | | | | | | | | |
The accompanying notes are an integral part of these financial statements.
| | | | |
| 14 | | Wells Fargo Large Company Value Fund | | Portfolio of investments—July 31, 2018 |
| | | | | | | | | | | | | | | | |
| Security name | | | | | | | | Shares | | | Value | |
| | | | |
| Semiconductors & Semiconductor Equipment: 1.29% | | | | | | | | | | | | | | | | |
Intel Corporation | | | | | | | | | | | 52,506 | | | $ | 2,525,539 | |
Texas Instruments Incorporated | | | | | | | | | | | 6,561 | | | | 730,371 | |
| |
| | | | 3,255,910 | |
| | | | | | | | | | | | | | | | |
| | | | |
| Software: 2.88% | | | | | | | | | | | | | | | | |
Adobe Systems Incorporated † | | | | | | | | | | | 17,530 | | | | 4,289,240 | |
Avaya Holdings Corporation † | | | | | | | | | | | 98,530 | | | | 2,027,747 | |
Oracle Corporation | | | | | | | | | | | 19,259 | | | | 918,269 | |
| |
| | | | 7,235,256 | |
| | | | | | | | | | | | | | | | |
| | | | |
| Technology Hardware, Storage & Peripherals: 0.39% | | | | | | | | | | | | | | | | |
Hewlett Packard Enterprise Company | | | | | | | | | | | 63,769 | | | | 984,593 | |
| | | | | | | | | | | | | | | | |
| | | | |
Materials: 3.14% | | | | | | | | | | | | | | | | |
| | | | |
| Metals & Mining: 1.48% | | | | | | | | | | | | | | | | |
Freeport-McMoRan Incorporated | | | | | | | | | | | 225,983 | | | | 3,728,720 | |
| | | | | | | | | | | | | | | | |
|
| Paper & Forest Products: 1.66% | |
Louisiana-Pacific Corporation | | | | | | | | | | | 155,040 | | | | 4,173,677 | |
| | | | | | | | | | | | | | | | |
| | | | |
Real Estate: 6.84% | | | | | | | | | | | | | | | | |
| | | | |
| Equity REITs: 4.71% | | | | | | | | | | | | | | | | |
Liberty Property Trust | | | | | | | | | | | 15,483 | | | | 663,601 | |
Outfront Media Incorporated | | | | | | | | | | | 145,400 | | | | 3,089,750 | |
PS Business Parks Incorporated | | | | | | | | | | | 400 | | | | 51,108 | |
Retail Properties of America Incorporated Class A | | | | | | | | | | | 50,073 | | | | 628,416 | |
STORE Capital Corporation | | | | | | | | | | | 3,803 | | | | 104,392 | |
Weingarten Realty Investors | | | | | | | | | | | 78,327 | | | | 2,367,042 | |
Xenia Hotels & Resorts Incorporated | | | | | | | | | | | 203,265 | | | | 4,957,633 | |
| |
| | | | 11,861,942 | |
| | | | | | | | | | | | | | | | |
| | | | |
| Real Estate Management & Development: 2.13% | | | | | | | | | | | | | | | | |
CBRE Group Incorporated Class A † | | | | | | | | | | | 104,909 | | | | 5,224,468 | |
Jones Lang LaSalle Incorporated | | | | | | | | | | | 750 | | | | 128,258 | |
| |
| | | | 5,352,726 | |
| | | | | | | | | | | | | | | | |
| | | | |
Telecommunication Services: 4.59% | | | | | | | | | | | | | | | | |
| | | | |
| Diversified Telecommunication Services: 4.59% | | | | | | | | | | | | | | | | |
AT&T Incorporated | | | | | | | | | | | 297,504 | | | | 9,511,200 | |
Verizon Communications Incorporated | | | | | | | | | | | 39,495 | | | | 2,039,522 | |
| |
| | | | 11,550,722 | |
| | | | | | | | | | | | | | | | |
| | | | |
Utilities: 6.61% | | | | | | | | | | | | | | | | |
| | | | |
| Electric Utilities: 4.49% | | | | | | | | | | | | | | | | |
Avangrid Incorporated | | | | | | | | | | | 79,901 | | | | 3,999,844 | |
NextEra Energy Incorporated | | | | | | | | | | | 30,596 | | | | 5,126,054 | |
PG&E Corporation | | | | | | | | | | | 50,020 | | | | 2,154,862 | |
| |
| | | | 11,280,760 | |
| | | | | | | | | | | | | | | | |
The accompanying notes are an integral part of these financial statements.
| | | | | | |
| Portfolio of investments—July 31, 2018 | | Wells Fargo Large Company Value Fund | | | 15 | |
| | | | | | | | | | | | | | | | |
| Security name | | | | | | | | Shares | | | Value | |
| | | | |
| Independent Power & Renewable Electricity Producers: 0.62% | | | | | | | | | | | | | | | | |
Vistra Energy Corporation † | | | | | | | | | | | 69,313 | | | $ | 1,566,474 | |
| | | | | | | | | | | | | | | | |
| | | | |
| Multi-Utilities: 1.50% | | | | | | | | | | | | | | | | |
MDU Resources Group Incorporated | | | | | | | | | | | 129,935 | | | | 3,768,115 | |
| | | | | | | | | | | | | | | | |
| |
Total Common Stocks (Cost $227,343,147) | | | | 246,883,489 | |
| | | | | | | | | | | | | | | | |
| | | | |
| | | Yield | | | | | | | | | | |
| Short-Term Investments: 1.66% | |
|
| Investment Companies: 1.66% | |
Wells Fargo Government Money Market Fund Select Class (l)(u) | | | 1.83 | % | | | | | | | 4,171,660 | | | | 4,171,660 | |
| | | | | | | | | | | | | | | | |
| |
Total Short-Term Investments (Cost $4,171,660) | | | | 4,171,660 | |
| | | | | | | | | | | | | | | | |
| | | | | | | | |
| Total investments in securities (Cost $231,514,807) | | | 99.81 | % | | | 251,055,149 | |
Other assets and liabilities, net | | | 0.19 | | | | 490,143 | |
| | | | | | | | |
| Total net assets | | | 100.00 | % | | $ | 251,545,292 | |
| | | | | | | | |
| † | Non-income-earning security |
| (l) | The issuer of the security is an affiliated person of the Fund as defined in the Investment Company Act of 1940. |
| (u) | The rate represents the 7-day annualized yield at period end. |
Abbreviations:
| REIT | Real estate investment trust |
Futures Contracts
| | | | | | | | | | | | | | | | | | | | | | | | |
| Description | | Number of
contracts | | | Expiration
date | | | Notional
cost | | | Notional
value | | | Unrealized
gains | | | Unrealized
losses | |
Long | | | | | | | | | | | | | | | | | | | | | | | | |
S&P 500 E-Mini Index | | | 37 | | | | 9-21-2018 | | | $ | 5,113,024 | | | $ | 5,211,635 | | | $ | 98,611 | | | $ | 0 | |
Investments in Affiliates
An affiliated investment is an investment in which the Fund owns at least 5% of the outstanding voting shares of the issuer or as a result of other relationships, such as the Fund and the issuer having the same investment manager. Transactions with issuers that were either affiliated persons of the Fund at the beginning of the period or the end of the period were as follows:
| | | | | | | | | | | | | | | | | | | | | | | | | | | | | | | | | | | | |
| | | Shares,
beginning of
period | | | Shares
purchased | | | Shares
sold | | | Shares,
end of
period | | | Net
realized
gains
(losses) | | | Net
change in
unrealized
gains
(losses) | | | Income
from
affiliated
securities | | | Value,
end
of period | | | % of
net
assets | |
Short-Term Investments | | | | | | | | | | | | | | | | | | | | | | | | | | | | | | | | | | | | |
Investment Companies | | | | | | | | | | | | | | | | | | | | | | | | | | | | | | | | | | | | |
Wells Fargo Government Money Market Fund Select Class | | | 7,807,982 | | | | 56,996,946 | | | | 60,633,268 | | | | 4,171,660 | | | $ | 0 | | | $ | 0 | | | $ | 57,278 | | | $ | 4,171,660 | | | | 1.66 | % |
The accompanying notes are an integral part of these financial statements.
| | | | |
| 16 | | Wells Fargo Large Company Value Fund | | Statement of assets and liabilities—July 31, 2018 |
| | | | |
| | | | |
| |
Assets | | | | |
Investments in unaffiliated securities, at value (cost $227,343,147) | | $ | 246,883,489 | |
Investments in affiliated securities, at value (cost $4,171,660) | | | 4,171,660 | |
Segregated cash for futures transactions | | | 300,000 | |
Receivable for Fund shares sold | | | 6,013 | |
Receivable for dividends | | | 306,407 | |
Receivable for daily variation margin on open futures contracts | | | 25,715 | |
Prepaid expenses and other assets | | | 119,507 | |
| | | | |
Total assets | | | 251,812,791 | |
| | | | |
| |
Liabilities | | | | |
Payable for Fund shares redeemed | | | 101,925 | |
Shareholder servicing fees payable | | | 49,442 | |
Administration fees payable | | | 42,331 | |
Management fee payable | | | 37,319 | |
Professional fees payable | | | 31,187 | |
Distribution fee payable | | | 1,914 | |
Trustees’ fees and expenses payable | | | 1,342 | |
Accrued expenses and other liabilities | | | 2,039 | |
| | | | |
Total liabilities | | | 267,499 | |
| | | | |
Total net assets | | $ | 251,545,292 | |
| | | | |
| |
NET ASSETS CONSIST OF | | | | |
Paid-in capital | | $ | 209,519,132 | |
Undistributed net investment income | | | 792,952 | |
Accumulated net realized gains on investments | | | 21,594,255 | |
Net unrealized gains on investments | | | 19,638,953 | |
| | | | |
Total net assets | | $ | 251,545,292 | |
| | | | |
| |
COMPUTATION OF NET ASSET VALUE AND OFFERING PRICE PER SHARE | | | | |
Net assets – Class A | | $ | 214,246,853 | |
Shares outstanding – Class A1 | | | 14,820,779 | |
Net asset value per share – Class A | | | $14.46 | |
Maximum offering price per share – Class A2 | | | $15.34 | |
Net assets – Class C | | $ | 2,925,753 | |
Shares outstanding – Class C1 | | | 197,529 | |
Net asset value per share – Class C | | | $14.81 | |
Net assets – Class R6 | | $ | 22,593 | |
Shares outstanding – Class R61 | | | 1,549 | |
Net asset value per share – Class R6 | | | $14.59 | |
Net assets – Administrator Class | | $ | 16,743,825 | |
Shares outstanding – Administrator Class1 | | | 1,147,766 | |
Net asset value per share – Administrator Class | | | $14.59 | |
Net assets – Institutional Class | | $ | 17,606,268 | |
Shares outstanding – Institutional Class1 | | | 1,207,912 | |
Net asset value per share – Institutional Class | | | $14.58 | |
| 1 | The Fund has an unlimited number of authorized shares. |
| 2 | Maximum offering price is computed as 100/94.25 of net asset value. On investments of $50,000 or more, the offering price is reduced. |
The accompanying notes are an integral part of these financial statements.
| | | | | | |
| Statement of operations—year ended July 31, 2018 | | Wells Fargo Large Company Value Fund | | | 17 | |
| | | | |
| | | | |
| |
Investment income | | | | |
Dividends | | $ | 5,370,566 | |
Income from affiliated securities | | | 57,278 | |
| | | | |
Total investment income | | | 5,427,844 | |
| | | | |
| |
Expenses | | | | |
Management fee | | | 1,026,809 | |
Administration fees | |
Class A | | | 459,720 | |
Class C | | | 6,753 | |
Class R6 | | | 8 | |
Administrator Class | | | 22,608 | |
Institutional Class | | | 22,304 | |
Shareholder servicing fees | |
Class A | | | 547,286 | |
Class C | | | 8,039 | |
Administrator Class | | | 43,476 | |
Distribution fee | |
Class C | | | 24,117 | |
Custody and accounting fees | | | 12,977 | |
Professional fees | | | 40,420 | |
Registration fees | | | 83,274 | |
Shareholder report expenses | | | 47,563 | |
Trustees’ fees and expenses | | | 23,566 | |
Other fees and expenses | | | 9,789 | |
| | | | |
Total expenses | | | 2,378,709 | |
Less: Fee waivers and/or expense reimbursements | | | (294,601 | ) |
| | | | |
Net expenses | | | 2,084,108 | |
| | | | |
Net investment income | | | 3,343,736 | |
| | | | |
| |
REALIZED AND UNREALIZED GAINS (LOSSES) ON INVESTMENTS | | | | |
| |
Net realized gains on: | | | | |
Unaffiliated securities | | | 25,727,536 | |
Futures contracts | | | 729,223 | |
| | | | |
Net realized gains on investments | | | 26,456,759 | |
| | | | |
| |
Net change in unrealized gains (losses) on: | | | | |
Unaffiliated securities | | | (6,707,453 | ) |
Futures contracts | | | 98,611 | |
| | | | |
Net change in unrealized gains (losses) on investments | | | (6,608,842 | ) |
| | | | |
Net realized and unrealized gains (losses) on investments | | | 19,847,917 | |
| | | | |
Net increase in net assets resulting from operations | | $ | 23,191,653 | |
| | | | |
The accompanying notes are an integral part of these financial statements.
| | | | |
| 18 | | Wells Fargo Large Company Value Fund | | Statement of changes in net assets |
| | | | | | | | | | | | | | | | |
| | | Year ended
July 31, 2018 | | | Year ended
July 31, 2017 | |
| |
Operations | | | | | |
Net investment income | | | | | | $ | 3,343,736 | | | | | | | $ | 2,348,357 | |
Net realized gains on investments | | | | | | | 26,456,759 | | | | | | | | 53,375,979 | |
Net change in unrealized gains (losses) on investments | | | | | | | (6,608,842 | ) | | | | | | | (21,739,472 | ) |
| | | | |
Net increase in net assets resulting from operations | | | | | | | 23,191,653 | | | | | | | | 33,984,864 | |
| | | | |
| |
Distributions to shareholders from | | | | | |
Net investment income | |
Class A | | | | | | | (2,599,881 | ) | | | | | | | (1,529,974 | ) |
Class C | | | | | | | (11,926 | ) | | | | | | | (7,593 | ) |
Class R6 | | | | | | | (420 | ) | | | | | | | 0 | 1 |
Administrator Class | | | | | | | (218,142 | ) | | | | | | | (164,278 | ) |
Institutional Class | | | | | | | (253,844 | ) | | | | | | | (101,228 | ) |
Net realized gains | |
Class A | | | | | | | (43,429,588 | ) | | | | | | | 0 | |
Class C | | | | | | | (647,269 | ) | | | | | | | 0 | |
Class R6 | | | | | | | (6,236 | ) | | | | | | | 0 | 1 |
Administrator Class | | | | | | | (3,454,920 | ) | | | | | | | 0 | |
Institutional Class | | | | | | | (3,302,668 | ) | | | | | | | 0 | |
| | | | |
Total distributions to shareholders | | | | | | | (53,924,894 | ) | | | | | | | (1,803,073 | ) |
| | | | |
| | | | |
Capital share transactions | | | Shares | | | | | | | | Shares | | | | | |
Proceeds from shares sold | |
Class A | | | 243,128 | | | | 3,569,805 | | | | 184,685 | | | | 2,859,171 | |
Class C | | | 4,796 | | | | 75,911 | | | | 9,920 | | | | 159,103 | |
Class R6 | | | 297 | | | | 5,000 | | | | 1,549 | 1 | | | 25,000 | 1 |
Administrator Class | | | 26,318 | | | | 380,870 | | | | 52,078 | | | | 837,524 | |
Institutional Class | | | 128,944 | | | | 1,889,629 | | | | 466,653 | | | | 7,476,610 | |
| | | | |
| | | | | | | 5,921,215 | | | | | | | | 11,357,408 | |
| | | | |
Reinvestment of distributions | |
Class A | | | 3,111,809 | | | | 44,581,220 | | | | 96,773 | | | | 1,482,398 | |
Class C | | | 42,242 | | | | 618,917 | | | | 431 | | | | 6,671 | |
Class R6 | | | 72 | | | | 1,037 | | | | 0 | 1 | | | 0 | 1 |
Administrator Class | | | 250,317 | | | | 3,619,530 | | | | 9,395 | | | | 144,443 | |
Institutional Class | | | 203,584 | | | | 2,943,466 | | | | 6,282 | | | | 97,208 | |
| | | | |
| | | | | | | 51,764,170 | | | | | | | | 1,730,720 | |
| | | | |
Payment for shares redeemed | |
Class A | | | (1,908,557 | ) | | | (28,835,984 | ) | | | (1,924,557 | ) | | | (29,716,601 | ) |
Class C | | | (48,634 | ) | | | (725,165 | ) | | | (57,893 | ) | | | (914,888 | ) |
Class R6 | | | (369 | ) | | | (5,292 | ) | | | 0 | 1 | | | 0 | 1 |
Administrator Class | | | (227,193 | ) | | | (3,486,080 | ) | | | (609,704 | ) | | | (9,486,019 | ) |
Institutional Class | | | (104,675 | ) | | | (1,560,195 | ) | | | (130,275 | ) | | | (2,050,549 | ) |
| | | | |
| | | | | | | (34,612,716 | ) | | | | | | | (42,168,057 | ) |
| | | | |
Net increase (decrease) in net assets resulting from capital share transactions | | | | | | | 23,072,669 | | | | | | | | (29,079,929 | ) |
| | | | |
Total increase (decrease) in net assets | | | | | | | (7,660,572 | ) | | | | | | | 3,101,862 | |
| | | | |
| | |
Net assets | | | | | | | | |
Beginning of period | | | | | | | 259,205,864 | | | | | | | | 256,104,002 | |
| | | | |
End of period | | | | | | $ | 251,545,292 | | | | | | | $ | 259,205,864 | |
| | | | |
Undistributed net investment income | | | | | | $ | 792,952 | | | | | | | $ | 533,429 | |
| | | | |
| 1 | For the period from April 7, 2017 (commencement of class operations) to July 31, 2017 |
The accompanying notes are an integral part of these financial statements.
| | | | | | |
| Financial highlights | | Wells Fargo Large Company Value Fund | | | 19 | |
(For a share outstanding throughout each period)
| | | | | | | | | | | | | | | | | | | | |
| | | Year ended July 31 | |
| CLASS A | | 2018 | | | 2017 | | | 2016 | | | 2015 | | | 2014 | |
Net asset value, beginning of period | | | $16.54 | | | | $14.58 | | | | $16.10 | | | | $16.82 | | | | $16.39 | |
Net investment income | | | 0.19 | | | | 0.14 | | | | 0.17 | | | | 0.13 | 1 | | | 0.10 | |
Net realized and unrealized gains (losses) on investments | | | 1.29 | | | | 1.93 | | | | (0.41 | ) | | | 0.78 | | | | 2.04 | |
| | | | | | | | | | | | | | | | | | | | |
Total from investment operations | | | 1.48 | | | | 2.07 | | | | (0.24 | ) | | | 0.91 | | | | 2.14 | |
Distributions to shareholders from | | | | | | | | | | | | | | | | | | | | |
Net investment income | | | (0.18 | ) | | | (0.11 | ) | | | (0.16 | ) | | | (0.13 | ) | | | (0.09 | ) |
Net realized gains | | | (3.38 | ) | | | 0.00 | | | | (1.12 | ) | | | (1.50 | ) | | | (1.62 | ) |
| | | | | | | | | | | | | | | | | | | | |
Total distributions to shareholders | | | (3.56 | ) | | | (0.11 | ) | | | (1.28 | ) | | | (1.63 | ) | | | (1.71 | ) |
Net asset value, end of period | | | $14.46 | | | | $16.54 | | | | $14.58 | | | | $16.10 | | | | $16.82 | |
Total return2 | | | 9.39 | % | | | 14.24 | % | | | (0.98 | )% | | | 5.72 | % | | | 13.68 | % |
Ratios to average net assets (annualized) | | | | | | | | | | | | | | | | | | | | |
Gross expenses | | | 0.94 | % | | | 1.09 | % | | | 1.24 | % | | | 1.27 | % | | | 1.28 | % |
Net expenses | | | 0.83 | % | | | 0.96 | % | | | 1.10 | % | | | 1.10 | % | | | 1.10 | % |
Net investment income | | | 1.28 | % | | | 0.91 | % | | | 1.19 | % | | | 0.76 | % | | | 0.61 | % |
Supplemental data | | | | | | | | | | | | | | | | | | | | |
Portfolio turnover rate | | | 258 | % | | | 221 | % | | | 50 | % | | | 71 | % | | | 59 | % |
Net assets, end of period (000s omitted) | | | $214,247 | | | | $221,207 | | | | $218,922 | | | | $104,453 | | | | $116,398 | |
| 1 | Calculated based upon average shares outstanding |
| 2 | Total return calculations do not include any sales charges. |
The accompanying notes are an integral part of these financial statements.
| | | | |
| 20 | | Wells Fargo Large Company Value Fund | | Financial highlights |
(For a share outstanding throughout each period)
| | | | | | | | | | | | | | | | | | | | |
| | | Year ended July 31 | |
| CLASS C | | 2018 | | | 2017 | | | 2016 | | | 2015 | | | 2014 | |
Net asset value, beginning of period | | | $16.86 | | | | $14.90 | | | | $16.41 | | | | $17.12 | | | | $16.70 | |
Net investment income (loss) | | | 0.08 | | | | 0.03 | 1 | | | 0.06 | | | | 0.00 | 2 | | | (0.02 | ) |
Net realized and unrealized gains (losses) on investments | | | 1.30 | | | | 1.96 | | | | (0.40 | ) | | | 0.80 | | | | 2.07 | |
| | | | | | | | | | | | | | | | | | | | |
Total from investment operations | | | 1.38 | | | | 1.99 | | | | (0.34 | ) | | | 0.80 | | | | 2.05 | |
Distributions to shareholders from | | | | | | | | | | | | | | | | | | | | |
Net investment income | | | (0.05 | ) | | | (0.03 | ) | | | (0.05 | ) | | | (0.01 | ) | | | (0.01 | ) |
Net realized gains | | | (3.38 | ) | | | 0.00 | | | | (1.12 | ) | | | (1.50 | ) | | | (1.62 | ) |
| | | | | | | | | | | | | | | | | | | | |
Total distributions to shareholders | | | (3.43 | ) | | | (0.03 | ) | | | (1.17 | ) | | | (1.51 | ) | | | (1.63 | ) |
Net asset value, end of period | | | $14.81 | | | | $16.86 | | | | $14.90 | | | | $16.41 | | | | $17.12 | |
Total return3 | | | 8.49 | % | | | 13.40 | % | | | (1.68 | )% | | | 4.92 | % | | | 12.83 | % |
Ratios to average net assets (annualized) | | | | | | | | | | | | | | | | | | | | |
Gross expenses | | | 1.69 | % | | | 1.84 | % | | | 1.99 | % | | | 2.02 | % | | | 2.03 | % |
Net expenses | | | 1.58 | % | | | 1.72 | % | | | 1.85 | % | | | 1.85 | % | | | 1.85 | % |
Net investment income (loss) | | | 0.55 | % | | | 0.16 | % | | | 0.44 | % | | | 0.01 | % | | | (0.14 | )% |
Supplemental data | | | | | | | | | | | | | | | | | | | | |
Portfolio turnover rate | | | 258 | % | | | 221 | % | | | 50 | % | | | 71 | % | | | 59 | % |
Net assets, end of period (000s omitted) | | | $2,926 | | | | $3,356 | | | | $3,674 | | | | $4,488 | | | | $4,659 | |
| 1 | Calculated based upon average shares outstanding |
| 2 | Amount is less than $0.005. |
| 3 | Total return calculations do not include any sales charges. |
The accompanying notes are an integral part of these financial statements.
| | | | | | |
| Financial highlights | | Wells Fargo Large Company Value Fund | | | 21 | |
(For a share outstanding throughout each period)
| | | | | | | | |
| | | Year ended July 31 | |
| CLASS R6 | | 2018 | | | 20171 | |
Net asset value, beginning of period | | | $16.66 | | | | $16.14 | |
Net investment income | | | 0.26 | | | | 0.03 | 2 |
Net realized and unrealized gains (losses) on investments | | | 1.30 | | | | 0.49 | |
| | | | | | | | |
Total from investment operations | | | 1.56 | | | | 0.52 | |
Distributions to shareholders from | | | | | | | | |
Net investment income | | | (0.25 | ) | | | 0.00 | |
Net realized gains | | | (3.38 | ) | | | 0.00 | |
| | | | | | | | |
Total distributions to shareholders | | | (3.63 | ) | | | 0.00 | |
Net asset value, end of period | | | $14.59 | | | | $16.66 | |
Total return3 | | | 9.88 | % | | | 3.22 | % |
Ratios to average net assets (annualized) | | | | | | | | |
Gross expenses | | | 0.51 | % | | | 0.49 | % |
Net expenses | | | 0.40 | % | | | 0.40 | % |
Net investment income | | | 1.73 | % | | | 0.52 | % |
Supplemental data | | | | | | | | |
Portfolio turnover rate | | | 258 | % | | | 221 | % |
Net assets, end of period (000s omitted) | | | $23 | | | | $26 | |
| 1 | For the period from April 7, 2017 (commencement of class operations) to July 31, 2017 |
| 2 | Calculated based upon average shares outstanding |
| 3 | Returns for periods of less than one year are not annualized. |
The accompanying notes are an integral part of these financial statements.
| | | | |
| 22 | | Wells Fargo Large Company Value Fund | | Financial highlights |
(For a share outstanding throughout each period)
| | | | | | | | | | | | | | | | | | | | |
| | | Year ended July 31 | |
| ADMINISTRATOR CLASS | | 2018 | | | 2017 | | | 2016 | | | 2015 | | | 2014 | |
Net asset value, beginning of period | | | $16.66 | | | | $14.68 | | | | $16.20 | | | | $16.93 | | | | $16.47 | |
Net investment income | | | 0.20 | | | | 0.16 | 1 | | | 0.20 | | | | 0.17 | | | | 0.15 | |
Net realized and unrealized gains (losses) on investments | | | 1.30 | | | | 1.94 | | | | (0.41 | ) | | | 0.78 | | | | 2.05 | |
| | | | | | | | | | | | | | | | | | | | |
Total from investment operations | | | 1.50 | | | | 2.10 | | | | (0.21 | ) | | | 0.95 | | | | 2.20 | |
Distributions to shareholders from | | | | | | | | | | | | | | | | | | | | |
Net investment income | | | (0.19 | ) | | | (0.12 | ) | | | (0.19 | ) | | | (0.18 | ) | | | (0.12 | ) |
Net realized gains | | | (3.38 | ) | | | 0.00 | | | | (1.12 | ) | | | (1.50 | ) | | | (1.62 | ) |
| | | | | | | | | | | | | | | | | | | | |
Total distributions to shareholders | | | (3.57 | ) | | | (0.12 | ) | | | (1.31 | ) | | | (1.68 | ) | | | (1.74 | ) |
Net asset value, end of period | | | $14.59 | | | | $16.66 | | | | $14.68 | | | | $16.20 | | | | $16.93 | |
Total return | | | 9.44 | % | | | 14.35 | % | | | (0.79 | )% | | | 5.95 | % | | | 13.94 | % |
Ratios to average net assets (annualized) | | | | | | | | | | | | | | | | | | | | |
Gross expenses | | | 0.86 | % | | | 1.01 | % | | | 1.16 | % | | | 1.12 | % | | | 1.12 | % |
Net expenses | | | 0.75 | % | | | 0.87 | % | | | 0.93 | % | | | 0.85 | % | | | 0.85 | % |
Net investment income | | | 1.37 | % | | | 1.01 | % | | | 1.35 | % | | | 1.01 | % | | | 0.86 | % |
Supplemental data | | | | | | | | | | | | | | | | | | | | |
Portfolio turnover rate | | | 258 | % | | | 221 | % | | | 50 | % | | | 71 | % | | | 59 | % |
Net assets, end of period (000s omitted) | | | $16,744 | | | | $18,296 | | | | $24,164 | | | | $30,177 | | | | $36,002 | |
| 1 | Calculated based upon average shares outstanding |
The accompanying notes are an integral part of these financial statements.
| | | | | | |
| Financial highlights | | Wells Fargo Large Company Value Fund | | | 23 | |
(For a share outstanding throughout each period)
| | | | | | | | | | | | | | | | | | | | |
| | | Year ended July 31 | |
| INSTITUTIONAL CLASS | | 2018 | | | 2017 | | | 2016 | | | 2015 | | | 2014 | |
Net asset value, beginning of period | | | $16.65 | | | | $14.66 | | | | $16.17 | | | | $16.91 | | | | $16.44 | |
Net investment income | | | 0.24 | | | | 0.19 | 1 | | | 0.21 | 1 | | | 0.20 | 1 | | | 0.18 | 1 |
Net realized and unrealized gains (losses) on investments | | | 1.30 | | | | 1.94 | | | | (0.38 | ) | | | 0.78 | | | | 2.05 | |
| | | | | | | | | | | | | | | | | | | | |
Total from investment operations | | | 1.54 | | | | 2.13 | | | | (0.17 | ) | | | 0.98 | | | | 2.23 | |
Distributions to shareholders from | | | | | | | | | | | | | | | | | | | | |
Net investment income | | | (0.23 | ) | | | (0.14 | ) | | | (0.22 | ) | | | (0.22 | ) | | | (0.14 | ) |
Net realized gains | | | (3.38 | ) | | | 0.00 | | | | (1.12 | ) | | | (1.50 | ) | | | (1.62 | ) |
| | | | | | | | | | | | | | | | | | | | |
Total distributions to shareholders | | | (3.61 | ) | | | (0.14 | ) | | | (1.34 | ) | | | (1.72 | ) | | | (1.76 | ) |
Net asset value, end of period | | | $14.58 | | | | $16.65 | | | | $14.66 | | | | $16.17 | | | | $16.91 | |
Total return | | | 9.77 | % | | | 14.61 | % | | | (0.54 | )% | | | 6.14 | % | | | 14.16 | % |
Ratios to average net assets (annualized) | | | | | | | | | | | | | | | | | | | | |
Gross expenses | | | 0.62 | % | | | 0.74 | % | | | 0.91 | % | | | 0.85 | % | | | 0.85 | % |
Net expenses | | | 0.50 | % | | | 0.61 | % | | | 0.74 | % | | | 0.65 | % | | | 0.65 | % |
Net investment income | | | 1.60 | % | | | 1.21 | % | | | 1.52 | % | | | 1.23 | % | | | 1.10 | % |
Supplemental data | | | | | | | | | | | | | | | | | | | | |
Portfolio turnover rate | | | 258 | % | | | 221 | % | | | 50 | % | | | 71 | % | | | 59 | % |
Net assets, end of period (000s omitted) | | | $17,606 | | | | $16,321 | | | | $9,343 | | | | $1,483 | | | | $863 | |
| 1 | Calculated based upon average shares outstanding |
The accompanying notes are an integral part of these financial statements.
| | | | |
| 24 | | Wells Fargo Large Company Value Fund | | Notes to financial statements |
1. ORGANIZATION
Wells Fargo Funds Trust (the “Trust”), a Delaware statutory trust organized on March 10, 1999, is an open-end management investment company registered under the Investment Company Act of 1940, as amended (the “1940 Act”). As an investment company, the Trust follows the accounting and reporting guidance in Financial Accounting Standards Board Accounting Standards Codification Topic 946, Financial Services – Investment Companies. These financial statements report on the Wells Fargo Large Company Value Fund (the “Fund”) which is a diversified series of the Trust.
2. SIGNIFICANT ACCOUNTING POLICIES
The following significant accounting policies, which are consistently followed in the preparation of the financial statements of the Fund, are in conformity with U.S. generally accepted accounting principles which require management to make estimates and assumptions that affect the reported amounts of assets and liabilities, disclosure of contingent assets and liabilities at the date of the financial statements, and the reported amounts of revenues and expenses during the reporting period. Actual results could differ from those estimates.
Securities valuation
All investments are valued each business day as of the close of regular trading on the New York Stock Exchange (generally 4 p.m. Eastern Time), although the Fund may deviate from this calculation time under unusual or unexpected circumstances.
Equity securities and futures contracts that are listed on a foreign or domestic exchange or market are valued at the official closing price or, if none, the last sales price. If no sale occurs on the principal exchange or market that day, a fair value price will be determined in accordance with the Fund’s Valuation Procedures.
Investments in registered open-end investment companies are valued at net asset value. Interests in non-registered investment companies that are redeemable at net asset value are fair valued normally at net asset value.
Investments which are not valued using any of the methods discussed above are valued at their fair value, as determined in good faith by the Board of Trustees of the Fund. The Board of Trustees has established a Valuation Committee comprised of the Trustees and has delegated to it the authority to take any actions regarding the valuation of portfolio securities that the Valuation Committee deems necessary or appropriate, including determining the fair value of portfolio securities, unless the determination has been delegated to the Wells Fargo Asset Management Pricing Committee at Wells Fargo Funds Management, LLC (“Funds Management”). The Board of Trustees retains the authority to make or ratify any valuation decisions or approve any changes to the Valuation Procedures as it deems appropriate. On a quarterly basis, the Board of Trustees receives reports on any valuation actions taken by the Valuation Committee or the Wells Fargo Asset Management Pricing Committee which may include items for ratification.
Valuations of fair valued securities are compared to the next actual sales price when available, or other appropriate market values, to assess the continued appropriateness of the fair valuation methodologies used. These securities are fair valued on a day-to-day basis, taking into consideration changes to appropriate market information and any significant changes to the inputs considered in the valuation process until there is a readily available price provided on an exchange or by an independent pricing service. Valuations received from an independent pricing service or independent broker-dealer quotes are periodically validated by comparisons to most recent trades and valuations provided by other independent pricing services in addition to the review of prices by the manager and/or subadviser. Unobservable inputs used in determining fair valuations are identified based on the type of security, taking into consideration factors utilized by market participants in valuing the investment, knowledge about the issuer and the current market environment.
Securities lending
The Fund may lend its securities from time to time in order to earn additional income in the form of fees or interest on securities received as collateral or the investment of any cash received as collateral. The Fund continues to receive interest or dividends on the securities loaned. The Fund receives collateral in the form of cash or securities with a value at least equal to the value of the securities on loan. The value of the loaned securities is determined at the close of each business day and any additional required collateral is delivered to the Fund on the next business day. In a securities lending transaction, the net asset value of the Fund will be affected by an increase or decrease in the value of the securities loaned and by an increase or decrease in the value of the instrument in which collateral is invested. The amount of securities lending activity undertaken by the Fund fluctuates from time to time. In the event of default or bankruptcy by the borrower, the Fund may be prevented from recovering the loaned securities or gaining access to the collateral or may experience delays or costs in doing so. In addition, the investment of any cash collateral received may lose all or part of its value. The Fund has the right under the lending agreement to recover the securities from the borrower on demand.
| | | | | | |
| Notes to financial statements | | Wells Fargo Large Company Value Fund | | | 25 | |
The Fund lends its securities through an unaffiliated securities lending agent. Cash collateral received in connection with its securities lending transactions is invested in Securities Lending Cash Investments, LLC (the “Securities Lending Fund”). The Securities Lending Fund is exempt from registration under Section 3(c)(7) of the 1940 Act and is managed by Funds Management and is subadvised by Wells Capital Management Incorporated (“WellsCap”), an affiliate of Funds Management and an indirect wholly owned subsidiary of Wells Fargo & Company (“Wells Fargo”). Funds Management receives an advisory fee starting at 0.05% and declining to 0.01% as the average daily net assets of the Securities Lending Fund increase. All of the fees received by Funds Management are paid to WellsCap for its services as subadviser. The Securities Lending Fund seeks to provide a positive return compared to the daily Fed Funds Open Rate by investing in high-quality, U.S. dollar-denominated short-term money market instruments. Securities Lending Fund investments are valued at the evaluated bid price provided by an independent pricing service. Income earned from investment in the Securities Lending Fund, if any, is included in income from affiliated securities on the Statement of Operations.
Futures contracts
The Fund is subject to equity price risk in the normal course of pursuing its investment objectives. Futures contracts are agreements between the Fund and a counterparty to buy or sell a specific amount of a commodity, financial instrument or currency at specified price and on a specified date. The Fund may buy and sell futures contracts in order to gain exposure to, or protect against, changes in security values. The primary risks associated with the use of futures contracts are the imperfect correlation between changes in market values of securities held by the Fund and the prices of futures contracts, and the possibility of an illiquid market. Futures contracts are generally entered into on a regulated futures exchange and cleared through a clearinghouse associated with the exchange. With futures contracts, there is minimal counterparty risk to the Fund since futures contracts are exchange traded and the exchange’s clearinghouse, as counterparty to all exchange traded futures, guarantees the futures contracts against default.
Upon entering into a futures contracts, the Fund is required to deposit either cash or securities (initial margin) with the broker in an amount equal to a certain percentage of the contract value. Subsequent payments (variation margin) are paid to or from the broker each day equal to the daily changes in the contract value. Such payments are recorded as unrealized gains or losses and, if any, shown as variation margin receivable (payable) in the Statement of Assets and Liabilities. Should the Fund fail to make requested variation margin payments, the broker can gain access to the initial margin to satisfy the Fund’s payment obligations. When the contracts are closed, a realized gain or loss is recorded in the Statement of Operations.
Security transactions and income recognition
Securities transactions are recorded on a trade date basis. Realized gains or losses are recorded on the basis of identified cost.
Dividend income is recognized on the ex-dividend date.
Distributions to shareholders
Distributions to shareholders are recorded on the ex-dividend date and paid from net investment income quarterly and any net realized gains are paid at least annually. Such distributions are determined in accordance with income tax regulations and may differ from U.S. generally accepted accounting principles. Dividend sources are estimated at the time of declaration. The tax character of distributions is determined as of the Fund’s fiscal year end. Therefore, a portion of the Fund’s distributions made prior to the Fund’s fiscal year end may be categorized as a tax return of capital at year end
Federal and other taxes
The Fund intends to continue to qualify as a regulated investment company by distributing substantially all of its investment company taxable income and any net realized capital gains (after reduction for capital loss carryforwards) sufficient to relieve it from all, or substantially all, federal income taxes. Accordingly, no provision for federal income taxes was required.
The Fund’s income and federal excise tax returns and all financial records supporting those returns for the prior three fiscal years are subject to examination by the federal and Delaware revenue authorities. Management has analyzed the Fund’s tax positions taken on federal, state, and foreign tax returns for all open tax years and does not believe that there are any uncertain tax positions that require recognition of a tax liability.
| | | | |
| 26 | | Wells Fargo Large Company Value Fund | | Notes to financial statements |
As of July 31, 2018, the aggregate cost of all investments for federal income tax purposes was $232,760,787 and the unrealized gains (losses) consisted of:
| | | | |
Gross unrealized gains | | $ | 23,778,743 | |
Gross unrealized losses | | | (5,385,770 | ) |
Net unrealized gains | | $ | 18,392,973 | |
Class allocations
The separate classes of shares offered by the Fund differ principally in applicable sales charges, distribution, shareholder servicing, and administration fees. Class specific expenses are charged directly to that share class. Investment income, common expenses, and realized and unrealized gains (losses) on investments are allocated daily to each class of shares based on the relative proportion of net assets of each class.
3. FAIR VALUATION MEASUREMENTS
Fair value measurements of investments are determined within a framework that has established a fair value hierarchy based upon the various data inputs utilized in determining the value of the Fund’s investments. The three-level hierarchy gives the highest priority to unadjusted quoted prices in active markets for identical assets or liabilities (Level 1) and the lowest priority to unobservable inputs (Level 3). The Fund’s investments are classified within the fair value hierarchy based on the lowest level of input that is significant to the fair value measurement. The inputs are summarized into three broad levels as follows:
| ∎ | | Level 1 – quoted prices in active markets for identical securities |
| ∎ | | Level 2 – other significant observable inputs (including quoted prices for similar securities, interest rates, prepayment speeds, credit risk, etc.) |
| ∎ | | Level 3 – significant unobservable inputs (including the Fund’s own assumptions in determining the fair value of investments) |
The inputs or methodologies used for valuing investments in securities are not necessarily an indication of the risk associated with investing in those securities.
The following is a summary of the inputs used in valuing the Fund’s assets and liabilities as of July 31, 2018:
| | | | | | | | | | | | | | | | |
| | | Quoted prices
(Level 1) | | | Other significant
observable inputs
(Level 2) | | | Significant
unobservable inputs (Level 3) | | | Total | |
Assets | | | | | | | | | | | | | | | | |
Investments in: | | | | | | | | | | | | | | | | |
| | | | |
Common stocks | | | | | | | | | | | | | | | | |
Consumer discretionary | | $ | 15,864,448 | | | $ | 0 | | | $ | 0 | | | $ | 15,864,448 | |
Consumer staples | | | 20,617,490 | | | | 0 | | | | 0 | | | | 20,617,490 | |
Energy | | | 30,168,374 | | | | 0 | | | | 0 | | | | 30,168,374 | |
Financials | | | 55,209,291 | | | | 0 | | | | 0 | | | | 55,209,291 | |
Health care | | | 34,340,128 | | | | 0 | | | | 0 | | | | 34,340,128 | |
Industrials | | | 16,472,217 | | | | 0 | | | | 0 | | | | 16,472,217 | |
Information technology | | | 20,928,405 | | | | 0 | | | | 0 | | | | 20,928,405 | |
Materials | | | 7,902,397 | | | | 0 | | | | 0 | | | | 7,902,397 | |
Real estate | | | 17,214,668 | | | | 0 | | | | 0 | | | | 17,214,668 | |
Telecommunication services | | | 11,550,722 | | | | 0 | | | | 0 | | | | 11,550,722 | |
Utilities | | | 16,615,349 | | | | 0 | | | | 0 | | | | 16,615,349 | |
| | | | |
Short-term investments | | | | | | | | | | | | | | | | |
Investment companies | | | 4,171,660 | | | | 0 | | | | 0 | | | | 4,171,660 | |
| | | 251,055,149 | | | | 0 | | | | 0 | | | | 251,055,149 | |
Futures contracts | | | 98,611 | | | | 0 | | | | 0 | | | | 98,611 | |
Total assets | | $ | 251,153,760 | | | $ | 0 | | | $ | 0 | | | $ | 251,153,760 | |
| | | | | | |
| Notes to financial statements | | Wells Fargo Large Company Value Fund | | | 27 | |
Futures contracts are reported at their cumulative unrealized gains (losses) at measurement date as reported in the table following the Portfolio of Investments. The current day’s variation margin is reported on the Statement of Assets and Liabilities. All other assets and liabilities are reported at their market value at measurement date.
The Fund recognizes transfers between levels within the fair value hierarchy at the end of the reporting period. At July 31, 2018, the Fund did not have any transfers into/out of Level 1, Level 2, or Level 3.
4. TRANSACTIONS WITH AFFILIATES
Management fee
Funds Management, an indirect wholly owned subsidiary of Wells Fargo, is the manager of the Fund and provides advisory and fund-level administrative services under an investment management agreement. Under the investment management agreement, Funds Management is responsible for, among other services, implementing the investment objectives and strategies of the Fund, supervising the subadviser and providing fund-level administrative services in connection with the Fund’s operations. As compensation for its services under the investment management agreement, Funds Management is entitled to receive an annual management fee starting at 0.40% and declining to 0.33% as the average daily net assets of the Fund increase. For the year ended July 31, 2018, the management fee was equivalent to an annual rate of 0.40% of the Fund’s average daily net assets.
Funds Management has retained the services of a subadviser to provide daily portfolio management to the Fund. The fee for subadvisory services is borne by Funds Management. Analytic Investor LLC, an affiliate of Funds Management and an indirect wholly owned subsidiary of Wells Fargo, is the subadviser to the Fund and is entitled to receive a fee from Funds Management at an annual rate starting at 0.25% and declining to 0.15% as the average daily net assets of the Fund increase.
Administration fees
Under a class-level administration agreement, Funds Management provides class-level administrative services to the Fund, which includes paying fees and expenses for services provided by the transfer agent, sub-transfer agents, omnibus account servicers and record-keepers. As compensation for its services under the class-level administration agreement, Funds Management receives an annual fee which is calculated based on the average daily net assets of each class as follows:
| | | | |
| | | Class-level
administration fee | |
Class A, Class C | | | 0.21 | % |
Class R6 | | | 0.03 | |
Administrator Class, Institutional Class | | | 0.13 | |
Funds Management has contractually waived and/or reimbursed management and administration fees to the extent necessary to maintain certain net operating expense ratios for the Fund. When each class of the Fund has exceeded its expense cap, Funds Management has waived fees and/or reimbursed expenses from fund level expenses on a proportionate basis and then from class specific expenses; otherwise, waivers and/or reimbursements are applied against class specific expenses before fund level expenses. Funds Management has committed through November 30, 2019 to waive fees and/or reimburse expenses to the extent necessary to cap the Fund’s expenses at 0.83% for Class A shares, 1.58% for Class C shares, 0.40% for Class R6 shares, 0.75% for Administrator Class shares, and 0.50% for Institutional Class shares. After this time, the cap may be increased or the commitment to maintain the cap may be terminated only with the approval of the Board of Trustees.
Distribution fee
The Trust has adopted a distribution plan for Class C shares of the Fund pursuant to Rule 12b-1 under the 1940 Act. A distribution fee is charged to Class C shares and paid to Wells Fargo Funds Distributor, LLC (“Funds Distributor”), the principal underwriter, at an annual rate of 0.75% of the average daily net assets of Class C shares.
In addition, Funds Distributor is entitled to receive the front-end sales charge from the purchase of Class A shares and a contingent deferred sales charge on the redemption of certain Class A shares. Funds Distributor is also entitled to receive the contingent deferred sales charges from redemptions of Class C shares. For the year ended July 31, 2018, Funds Distributor received $2,137 from the sale of Class A shares. No contingent deferred sales charges were incurred by Class A and Class C shares for the year ended July 31, 2018.
Shareholder servicing fees
The Trust has entered into contracts with one or more shareholder servicing agents, whereby Class A, Class C, and Administrator class of the Fund are charged a fee at an annual rate of 0.25% of the average daily net assets of each respective class.
| | | | |
| 28 | | Wells Fargo Large Company Value Fund | | Notes to financial statements |
A portion of these total shareholder servicing fees were paid to affiliates of Wells Fargo.
Interfund transactions
The Fund may purchase or sell portfolio investment securities to certain other Wells Fargo affiliates pursuant to Rule 17a-7 under the 1940 Act and under procedures adopted by the Board of Trustees. The procedures have been designed to ensure that these interfund transactions, which do not incur broker commissions, are effected at current market prices.
5. INVESTMENT PORTFOLIO TRANSACTIONS
Purchases and sales of investments, excluding U.S. government obligations (if any) and short-term securities, for the year ended July 31, 2018 were $648,411,599 and $671,668,940, respectively.
6. DERIVATIVE TRANSACTIONS
During the year ended July 31, 2018, the Fund entered into futures contract to gain market exposure. The Fund had an average notional amount of $4,849,707 in long futures contracts during the year ended July 31, 2018.
On July 31, 2018, the cumulative unrealized gains on futures contracts in the amount of $98,611 are reflected in net unrealized gains on investments on the Statement of Assets and Liabilities. The receivable for daily variation margin on open futures contracts reflected in the Statement of Assets and Liabilities only represents the current day’s variation margin. The realized gains and change in unrealized gains (losses) on futures contracts are reflected in the Statement of Operations.
7. BANK BORROWINGS
The Trust (excluding the money market funds and certain other funds) and Wells Fargo Variable Trust are parties to a $280,000,000 revolving credit agreement whereby the Fund is permitted to use bank borrowings for temporary or emergency purposes, such as to fund shareholder redemption requests. Interest under the credit agreement is charged to the Fund based on a borrowing rate equal to the higher of the Federal Funds rate in effect on that day plus 1.25% or the overnight LIBOR rate in effect on that day plus 1.25%. In addition, an annual commitment fee equal to 0.25% of the unused balance is allocated to each participating fund. Prior to August 29, 2017, the revolving credit agreement amount was $250,000,000.
For the year ended July 31, 2018, there were no borrowings by the Fund under the agreement.
8. DISTRIBUTIONS TO SHAREHOLDERS
The tax character of distributions paid during the years ended July 31, 2018 and July 31, 2017 were as follows:
| | | | | | | | |
| | | Year ended July 31 | |
| | | 2018 | | | 2017 | |
Ordinary income | | $ | 6,104,081 | | | $ | 1,803,073 | |
Long-term capital gain | | | 47,820,813 | | | | 0 | |
As of July 31, 2018, the components of distributable earnings on a tax basis were as follows:
| | | | |
Undistributed ordinary income | | Undistributed long-term gain | | Unrealized gains |
| $17,490,723 | | $6,153,732 | | $18,392,973 |
9. INDEMNIFICATION
Under the Trust’s organizational documents, the officers and Trustees have been granted certain indemnification rights against certain liabilities that may arise out of performance of their duties to the Trust. Additionally, in the normal course of business, the Trust may enter into contracts with service providers that contain a variety of indemnification clauses. The Trust’s maximum exposure under these arrangements is dependent on future claims that may be made against the Fund and, therefore, cannot be estimated.
| | | | | | |
| Notes to financial statements | | Wells Fargo Large Company Value Fund | | | 29 | |
10. SUBSEQUENT DISTRIBUTIONS
On September 24, 2018, the Fund declared distributions from net investment income to shareholders of record on September 21, 2018. The per share amounts payable on September 25, 2018 were as follows:
| | | | |
| | | Net investment
income | |
Class A | | | $0.08258 | |
Class C | | | 0.01906 | |
Class R6 | | | 0.11424 | |
Administrator Class | | | 0.08859 | |
Institutional Class | | | 0.10714 | |
These distributions are not reflected in the accompanying financial statements.
| | | | |
| 30 | | Wells Fargo Large Company Value Fund | | Report of independent registered public accounting firm |
BOARD OF TRUSTEES AND SHAREHOLDERS OF WELLS FARGO FUNDS TRUST:
Opinion on the Financial Statements
We have audited the accompanying statement of assets and liabilities of Wells Fargo Large Company Value Fund (the “Fund”), one of the funds constituting Wells Fargo Funds Trust, including the portfolio of investments, as of July 31, 2018, the related statement of operations for the year then ended, the statements of changes in net assets for each of the years in the two-year period then ended, and the related notes (collectively, the “financial statements”) and the financial highlights for each of the years or periods in the five-year period then ended. In our opinion, the financial statements and financial highlights present fairly, in all material respects, the financial position of the Fund as of July 31, 2018, the results of its operations for the year then ended, the changes in its net assets for each of the years in the two-year period then ended, and the financial highlights for each of the years or periods in the five-year period then ended, in conformity with U.S. generally accepted accounting principles.
Basis for Opinion
These financial statements and financial highlights are the responsibility of the Fund’s management. Our responsibility is to express an opinion on these financial statements and financial highlights based on our audits. We are a public accounting firm registered with the Public Company Accounting Oversight Board (United States) (“PCAOB”) and are required to be independent with respect to the Fund in accordance with the U.S. federal securities laws and the applicable rules and regulations of the Securities and Exchange Commission and the PCAOB.
We conducted our audits in accordance with the standards of the PCAOB. Those standards require that we plan and perform the audit to obtain reasonable assurance about whether the financial statements and financial highlights are free of material misstatement, whether due to error or fraud. Our audits included performing procedures to assess the risks of material misstatement of the financial statements and financial highlights, whether due to error or fraud, and performing procedures that respond to those risks. Such procedures included examining, on a test basis, evidence regarding the amounts and disclosures in the financial statements and financial highlights. Such procedures also included confirmation of securities owned as of July 31, 2018, by correspondence with the custodian and brokers, or by other appropriate auditing procedures. Our audits also included evaluating the accounting principles used and significant estimates made by management, as well as evaluating the overall presentation of the financial statements and financial highlights. We believe that our audits provide a reasonable basis for our opinion.

We have not been able to determine the specific year that we began serving as the auditor of one or more Wells Fargo Funds investment companies, however we are aware that we have served as the auditor of one or more Wells Fargo Funds investment companies since at least 1955.
Boston, Massachusetts
September 24, 2018
| | | | | | |
| Other information (unaudited) | | Wells Fargo Large Company Value Fund | | | 31 | |
TAX INFORMATION
For corporate shareholders, pursuant to Section 854 of the Internal Revenue Code, 53.30% of ordinary income dividends qualify for the corporate dividends-received deduction for the fiscal year ended July 31, 2018.
Pursuant to Section 852 of the Internal Revenue Code, $47,820,813 was designated as a 20% rate gain distribution for the fiscal year ended July 31, 2018.
Pursuant to Section 854 of the Internal Revenue Code, $3,329,663 of income dividends paid during the fiscal year ended July 31, 2018 has been designated as qualified dividend income (QDI).
For the fiscal year ended July 31, 2018, $30,604 has been designated as interest-related dividends for nonresident alien shareholders pursuant to Section 871 of the Internal Revenue Code.
For the fiscal year ended July 31, 2018, $3,019,868 has been designated as short-term capital gain dividends for nonresident alien shareholders pursuant to Section 871 of the Internal Revenue Code.
PROXY VOTING INFORMATION
A description of the policies and procedures that the Fund uses to determine how to vote proxies relating to portfolio securities is available, upon request, by calling 1-800-222-8222, visiting our website at wellsfargofunds.com, or visiting the SEC website at sec.gov. Information regarding how the Fund voted proxies relating to portfolio securities during the most recent 12-month period ended June 30 is available on the Fund’s website at wellsfargofunds.com or by visiting the SEC website at sec.gov.
PORTFOLIO HOLDINGS INFORMATION
The complete portfolio holdings for the Fund are publicly available monthly on the Fund’s website (wellsfargofunds.com), on a one-month delayed basis. In addition, top ten holdings information (excluding derivative positions) for the Fund is publicly available on the Fund’s website on a monthly, seven-day or more delayed basis. The Fund files its complete schedule of portfolio holdings with the SEC for the first and third quarters of each fiscal year on Form N-Q, which is available by visiting the SEC website at sec.gov. In addition, the Fund’s Form N-Q may be reviewed and copied at the SEC’s Public Reference Room in Washington, DC, and at regional offices in New York City, at 233 Broadway, and in Chicago, at 175 West Jackson Boulevard, Suite 900. Information about the Public Reference Room may be obtained by calling 1-800-SEC-0330.
| | | | |
| 32 | | Wells Fargo Large Company Value Fund | | Other information (unaudited) |
BOARD OF TRUSTEES AND OFFICERS
Each of the Trustees and Officers1 listed in the table below acts in identical capacities for each fund in the Wells Fargo family of funds, which consists of 154 mutual funds comprising the Wells Fargo Funds Trust, Wells Fargo Variable Trust, Wells Fargo Master Trust and four closed-end funds (collectively the “Fund Complex”). This table should be read in conjunction with the Prospectus and the Statement of Additional Information2. The mailing address of each Trustee and Officer is 525 Market Street, 12th Floor, San Francisco, CA 94105. Each Trustee and Officer serves an indefinite term, however, each Trustee serves such term until reaching the mandatory retirement age established by the Trustees.
Independent Trustees
| | | | | | |
Name and
year of birth | | Position held and
length of service* | | Principal occupations during past five years or longer | | Current other
public company or
investment company
directorships |
William R. Ebsworth (Born 1957) | | Trustee, since 2015 | | Retired. From 1984 to 2013, equities analyst, portfolio manager, research director and chief investment officer at Fidelity Management and Research Company in Boston, Tokyo, and Hong Kong, and retired in 2013 as Chief Investment Officer of Fidelity Strategic Advisers, Inc. where he led a team of investment professionals managing client assets. Prior thereto, Board member of Hong Kong Securities Clearing Co., Hong Kong Options Clearing Corp., the Thailand International Fund, Ltd., Fidelity Investments Life Insurance Company, and Empire Fidelity Investments Life Insurance Company. Board member of the Forté Foundation (non-profit organization) and the Vincent Memorial Hospital Endowment (non-profit organization), where he serves on the Investment Committee and as a Chair of the Audit Committee. Mr. Ebsworth is a CFA® charterholder. | | Asset Allocation Trust |
Jane A. Freeman (Born 1953) | | Trustee, since 2015; Chair Liaison, since 2018 | | Retired. From 2012 to 2014 and 1999 to 2008, Chief Financial Officer of Scientific Learning Corporation. From 2008 to 2012, Ms. Freeman provided consulting services related to strategic business projects. Prior to 1999, Portfolio Manager at Rockefeller & Co. and Scudder, Stevens & Clark. Board member of the Harding Loevner Funds from 1996 to 2014, serving as both Lead Independent Director and chair of the Audit Committee. Board member of the Russell Exchange Traded Funds Trust from 2011 to 2012 and the chair of the Audit Committee. Ms. Freeman is a Board Member of Ruth Bancroft Garden (non-profit organization) and the Glimmerglass Festival. She is also an inactive Chartered Financial Analyst. | | Asset Allocation Trust |
Isaiah Harris, Jr. (Born 1952) | | Trustee, since 2009 | | Retired. Chairman of the Board of CIGNA Corporation since 2009, and Director since 2005. From 2003 to 2011, Director of Deluxe Corporation. Prior thereto, President and CEO of BellSouth Advertising and Publishing Corp. from 2005 to 2007, President and CEO of BellSouth Enterprises from 2004 to 2005 and President of BellSouth Consumer Services from 2000 to 2003. Emeritus member of the Iowa State University Foundation Board of Governors. Emeritus Member of the Advisory Board of Iowa State University School of Business. Advisory Board Member, Palm Harbor Academy (charter school). Advisory Board Member, Child Evangelism Fellowship (non-profit). Mr. Harris is a certified public accountant (inactive status). | | CIGNA Corporation; Asset Allocation Trust |
Judith M. Johnson (Born 1949) | | Trustee, since 2008; Audit Committee Chairman, since 2009 | | Retired. Prior thereto, Chief Executive Officer and Chief Investment Officer of Minneapolis Employees Retirement Fund from 1996 to 2008. Ms. Johnson is an attorney, certified public accountant and a certified managerial accountant. | | Asset Allocation Trust |
David F. Larcker (Born 1950) | | Trustee, since 2009 | | James Irvin Miller Professor of Accounting at the Graduate School of Business, Stanford University, Director of the Corporate Governance Research Initiative and Senior Faculty of The Rock Center for Corporate Governance since 2006. From 2005 to 2008, Professor of Accounting at the Graduate School of Business, Stanford University. Prior thereto, Ernst & Young Professor of Accounting at The Wharton School, University of Pennsylvania from 1985 to 2005. | | Asset Allocation Trust |
| | | | | | |
| Other information (unaudited) | | Wells Fargo Large Company Value Fund | | | 33 | |
| | | | | | |
Name and
year of birth | | Position held and
length of service* | | Principal occupations during past five years or longer | | Current other
public company or
investment company
directorships |
Olivia S. Mitchell (Born 1953) | | Trustee, since 2006; Governance Committee Chairman, since 2018 | | International Foundation of Employee Benefit Plans Professor, Wharton School of the University of Pennsylvania since 1993. Director of Wharton’s Pension Research Council and Boettner Center on Pensions & Retirement Research, and Research Associate at the National Bureau of Economic Research. Previously, Cornell University Professor from 1978 to 1993. | | Asset Allocation Trust |
Timothy J. Penny (Born 1951) | | Trustee, since 1996; Chairman, since 2018; Vice Chairman, from 2017 to 2018 | | President and Chief Executive Officer of Southern Minnesota Initiative Foundation, a non-profit organization, since 2007. Member of the Board of Trustees of NorthStar Education Finance, Inc., a non-profit organization, since 2007. | | Asset Allocation Trust |
James G. Polisson (Born 1959) | | Trustee, since 2018; Advisory Board Member, from 2017 to 2018 | | Retired. Chief Marketing Officer, Source (ETF) UK Services, Ltd, from 2015 to 2017. From 2012 to 2015, Principal of The Polisson Group, LLC, a management consulting, corporate advisory and principal investing company. Chief Executive Officer and Managing Director at Russell Investments, Global Exchange Traded Funds from 2010 to 2012. Managing Director of Barclays Global Investors from 1998 to 2010 and Global Chief Marketing Officer for iShares and Barclays Global Investors from 2000 to 2010. Trustee of the San Francisco Mechanics’ Institute, a non-profit organization, from 2013 to 2015. Board member of the Russell Exchange Traded Fund Trust from 2011 to 2012. Director of Barclays Global Investors Holdings Deutschland GmbH from 2006 to 2009. Mr. Polisson is an attorney and has a retired status with the Massachusetts and District of Columbia Bar Associations. | | Asset Allocation Trust |
Michael S. Scofield (Born 1943) | | Trustee, since 2010 | | Served on the Investment Company Institute’s Board of Governors and Executive Committee from 2008-2011 as well the Governing Council of the Independent Directors Council from 2006-2011 and the Independent Directors Council Executive Committee from 2008-2011. Trustee of the Evergreen Fund complex (and its predecessors) from 1984 to 2010. Chairman of the Evergreen Funds from 2000-2010. Former Trustee of the Mentor Funds. Retired Attorney, Law Offices of Michael S. Scofield. | | Asset Allocation Trust |
Pamela Wheelock (Born 1959) | | Trustee, since 2018; Advisory Board Member, from 2017 to 2018 | | Chief Operating Officer, Twin Cities Habitat for Humanity, since January, 2017. Vice President of University Services, University of Minnesota from 2012 to 2017. Prior thereto, on the Board of Directors, Goverance Committee and Finance Committee for the Minnesota Philanthropy Partners (Saint Paul Foundation) from 2012 to 2018, Interim President and Chief Executive Officer of Blue Cross Blue shield of Minnesota of Minnesota from 2010 to 2011, Chairman of the Board from 2009 to 2011 and Board Director 003 to 2015. Vice President, Leadership and Community Engagement, Bush Foundation, Saint Paul, Minnesota (a private foundation) from 2009 to 2011. Executive Vice President and Chief Financial Officer, Minnesota Sports and Entertainment from 2004 to 2009 and Senior Vice President from 2002 to 2004. Commissioner of Finance, State of Minnesota, from 1999 to 2002. Currently the Board Chair of the Minnesota Wild Foundation since 2010. | | Asset Allocation Trust |
| * | Length of service dates reflect the Trustee’s commencement of service with the Trust’s predecessor entities, where applicable. |
| | | | |
| 34 | | Wells Fargo Large Company Value Fund | | Other information (unaudited) |
Officers
| | | | | | |
Name and
year of birth | | Position held and
length of service | | Principal occupations during past five years or longer | | |
Andrew Owen (Born 1960) | | President, since 2017 | | Executive Vice President of Wells Fargo & Company and Head of Affiliated Managers, Wells Fargo Asset Management, since 2014. In addition, Mr. Owen is currently President, Chief Executive Officer and Director of Wells Fargo Funds Management, LLC since 2017. Prior thereto, Executive Vice President responsible for marketing, investments and product development for Wells Fargo Funds Management, LLC, from 2009 to 2014. | | |
Jeremy DePalma1 (Born 1974) | | Treasurer, since 2012 | | Senior Vice President of Wells Fargo Funds Management, LLC since 2009. Senior Vice President of Evergreen Investment Management Company, LLC from 2008 to 2010 and head of the Fund Reporting and Control Team within Fund Administration from 2005 to 2010. | | |
Alexander Kymn3 (Born 1973) | | Secretary, since 2018; Chief Legal Officer, since 2018 | | Senior Company Counsel of Wells Fargo Bank, N.A. since 2018 (previously Senior Counsel from 2007 to 2018). Vice President of Wells Fargo Funds Management, LLC from 2008 to 2014. | | |
Michael H. Whitaker (Born 1967) | | Chief Compliance Officer, since 2016 | | Senior Vice President and Chief Compliance Officer since 2016. Senior Vice President and Chief Compliance Officer for Fidelity Investments from 2007 to 2016. | | |
David Berardi (Born 1975) | | Assistant Treasurer, since 2009 | | Vice President of Wells Fargo Funds Management, LLC since 2009. Vice President of Evergreen Investment Management Company, LLC from 2008 to 2010. Manager of Fund Reporting and Control for Evergreen Investment Management Company, LLC from 2004 to 2010. | | |
| 1 | Jeremy DePalma acts as Treasurer of 77 funds and Assistant Treasurer of 77 funds in the Fund Complex. |
| 2 | The Statement of Additional Information includes additional information about the Trustees and is available, without charge, upon request, by calling 1-800-222-8222 or by visiting the website at wellsfargofunds.com. |
| 3 | Alexander Kymn became the Secretary and Chief Legal Officer effective April 17, 2018. |
| | | | | | |
| Other information (unaudited) | | Wells Fargo Large Company Value Fund | | | 35 | |
BOARD CONSIDERATION OF INVESTMENT MANAGEMENT AND SUB-ADVISORY AGREEMENTS:
Wells Fargo Large Company Value Fund
Under the Investment Company Act of 1940 (the “1940 Act”), the Board of Trustees (the “Board”) of Wells Fargo Funds Trust (the “Trust”) must determine annually whether to approve the continuation of the Trust’s investment management and sub-advisory agreements. In this regard, at an in-person meeting held on May 22-23, 2018 (the “Meeting”), the Board, all the members of which have no direct or indirect interest in the investment management and sub-advisory agreements and are not “interested persons” of the Trust, as defined in the 1940 Act (the “Independent Trustees”), reviewed and approved for Wells Fargo Large Company Value Fund (the “Fund”): (i) an investment management agreement (the “Management Agreement”) with Wells Fargo Funds Management, LLC (“Funds Management”); and (ii) an investment sub-advisory agreement (the “Sub-Advisory Agreement”) with Analytic Investors, LLC (the “Sub-Adviser”), an affiliate of Funds Management. The Management Agreement and the Sub-Advisory Agreement are collectively referred to as the “Advisory Agreements.”
At the Meeting, the Board considered the factors and reached the conclusions described below relating to the selection of Funds Management and the Sub-Adviser and the approval of the Advisory Agreements. Prior to the Meeting, including at an in-person meeting in April 2018, the Trustees conferred extensively among themselves and with representatives of Funds Management about these matters. Also, the Board has adopted a team-based approach, with each team consisting of a sub-set of Trustees, to assist the full Board in the discharge of its duties in reviewing investment performance and other matters throughout the year. The Independent Trustees were assisted in their evaluation of the Advisory Agreements by independent legal counsel, from whom they received separate legal advice and with whom they met separately.
In providing information to the Board, Funds Management and the Sub-Adviser were guided by a detailed set of requests for information submitted to them by independent legal counsel on behalf of the Independent Trustees at the start of the Board’s annual contract renewal process earlier in 2018. In considering and approving the Advisory Agreements, the Trustees considered the information they believed relevant, including but not limited to the information discussed below. The Board considered not only the specific information presented in connection with the Meeting, but also the knowledge gained over time through interaction with Funds Management and the Sub-Adviser about various topics. In this regard, the Board reviewed reports of Funds Management at each of its quarterly meetings, which included, among other things, portfolio reviews and investment performance reports. In addition, the Board and the teams mentioned above confer with portfolio managers at various times throughout the year. The Board did not identify any particular information or consideration that was all-important or controlling, and each individual Trustee may have attributed different weights to various factors.
After its deliberations, the Board unanimously approved the continuation of the Advisory Agreements for a one-year term and determined that the compensation payable to Funds Management and the Sub-Adviser under each of the Advisory Agreements was reasonable. The Board considered the approval of the Advisory Agreements for the Fund as part of its consideration of agreements for funds across the complex, but its approvals were made on a fund-by-fund basis. The following summarizes a number of important, but not necessarily all, factors considered by the Board in support of its approvals.
Nature, extent and quality of services
The Board received and considered various information regarding the nature, extent and quality of services provided to the Fund by Funds Management and the Sub-Adviser under the Advisory Agreements. This information included a description of the investment advisory services and Fund-level administrative services covered by the Management Agreement, as well as, among other things, a summary of the background and experience of senior management of Wells Fargo Asset Management (“WFAM”), of which Funds Management and the Sub-Adviser are a part, a summary of investments made in the business of WFAM, a summary of certain organizational and personnel changes involving Funds Management and the Sub-Adviser, and a description of Funds Management’s and the Sub-Adviser’s business continuity planning programs and of their approaches to data privacy and cybersecurity. The Board also considered the qualifications, background, tenure and responsibilities of each of the portfolio managers primarily responsible for the day-to-day portfolio management of the Fund.
The Board evaluated the ability of Funds Management and the Sub-Adviser to attract and retain qualified investment professionals, including research, advisory and supervisory personnel. The Board further considered the compliance programs and compliance records of Funds Management and the Sub-Adviser. In addition, the Board took into account the full range of services provided to the Fund by Funds Management and its affiliates.
| | | | |
| 36 | | Wells Fargo Large Company Value Fund | | Other information (unaudited) |
Fund investment performance and expenses
The Board considered the investment performance results for the Fund over various time periods ended December 31, 2017. The Board considered these results in comparison to the investment performance of funds in a universe that was determined by Broadridge Inc. (“Broadridge”) to be similar to the Fund (the “Universe”), and in comparison to the Fund’s benchmark index and to other comparative data. Broadridge is an independent provider of investment company data. The Board received a description of the methodology used by Broadridge to select the mutual funds in the performance Universe. The Board noted that the investment performance of the Fund (Administrator Class) was in range of the average investment performance of the Universe for the ten-year period under review, but lower than the average investment performance of the Universe for the one-, three- and five-year periods under review. The Board also noted that the investment performance of the Fund was higher than its benchmark index, the Russell 1000 Value Index, for the one-year period under review, but lower than its benchmark index for the three-, five- and ten-year periods under review.
The Board received information concerning, and discussed factors contributing to, the underperformance of the Fund relative to the Universe and benchmark for the periods identified above. The Board took note of the explanations for the relative underperformance during these periods, including with respect to investment decisions and market factors that affected the Fund’s investment performance.
The Board also received and considered information regarding the Fund’s net operating expense ratios and their various components, including actual management fees, custodian and other non-management fees, and Rule 12b-1 and non-Rule 12b-1 shareholder service fees. The Board considered these ratios in comparison to the median ratios of funds in class-specific expense groups that were determined by Broadridge to be similar to the Fund (the “Groups”). The Board received a description of the methodology used by Broadridge to select the mutual funds in the expense Groups and an explanation of how funds comprising expense groups and their expense ratios may vary from year-to-year. Based on the Broadridge reports, the Board noted that the net operating expense ratios of the Fund were lower than or in range of the median net operating expense ratios of the expense Groups for each share class.
The Board took into account the Fund’s investment performance and expense information provided to it among the factors considered in deciding to re-approve the Advisory Agreements.
Investment management and sub-advisory fee rates
The Board reviewed and considered the contractual fee rates payable by the Fund to Funds Management under the Management Agreement, as well as the contractual fee rates payable by the Fund to Funds Management for class-level administrative services under a Class-Level Administration Agreement, which include, among other things, class-level transfer agency and sub-transfer agency costs (collectively, the “Management Rates”). The Board also reviewed and considered the contractual investment sub-advisory fee rates that are payable by Funds Management to the Sub-Adviser for investment sub-advisory services.
Among other information reviewed by the Board was a comparison of the Fund’s Management Rates with the average contractual investment management fee rates of funds in the expense Groups at a common asset level as well as transfer agency costs of the funds in the expense Groups. The Board noted that the Management Rates of the Fund were lower than the sum of these average rates for the Fund’s expense Groups for all share classes.
The Board also received and considered information about the portion of the total management fee that was retained by Funds Management after payment of the fee to the Sub-Adviser for sub-advisory services. In assessing the reasonableness of this amount, the Board received and evaluated information about the nature and extent of responsibilities retained and risks assumed by Funds Management and not delegated to or assumed by the Sub-Adviser, and about Funds Management’s on-going oversight services. Given the affiliation between Funds Management and the Sub-Adviser, the Board ascribed limited relevance to the allocation of fees between them.
The Board also received and considered information about the nature and extent of services offered and fee rates charged by Funds Management and the Sub-Adviser to other types of clients with investment strategies similar to those of the Fund. In this regard, the Board received information about the significantly greater scope of services, and compliance, reporting and other legal burdens and risks of managing mutual funds compared with those associated with managing assets of non-mutual fund clients such as institutional separate accounts.
Based on its consideration of the factors and information it deemed relevant, including those described here, the Board determined that the compensation payable to Funds Management under the Management Agreement and to the Sub-Adviser under the Sub-Advisory Agreement was reasonable.
| | | | | | |
| Other information (unaudited) | | Wells Fargo Large Company Value Fund | | | 37 | |
Profitability
The Board received and considered information concerning the profitability of Funds Management, as well as the profitability of both WFAM and Wells Fargo & Co. (“Wells Fargo”) as a whole, from providing services to the Fund and the fund family as a whole. The Board noted that the Sub-Adviser’s profitability information with respect to providing services to the Fund was subsumed in the WFAM and Wells Fargo profitability analysis.
Funds Management reported on the methodologies and estimates used in calculating profitability, including a description of the methodology used to allocate certain expenses and recent enhancements made to the methodology. Among other things, the Board noted that the levels of profitability reported on a fund-by-fund basis varied widely, depending on factors such as the size and type of fund. Based on its review, the Board did not deem the profits reported by Funds Management, WFAM or Wells Fargo from services provided to the Fund to be at a level that would prevent it from approving the continuation of the Advisory Agreements.
Economies of scale
The Board considered the extent to which Funds Management may experience economies of scale in the provision of management services, and the extent to which scale benefits, if any, would be shared with shareholders. In particular, the Board noted the existence of breakpoints in the Fund’s management fee structure, which operate generally to reduce the Fund’s expense ratios as the Fund grows in size. It considered that, for a small fund or a fund that shrinks in size, breakpoints conversely can result in higher fee levels. The Board also considered that in addition to management fee breakpoints, competitive management fee rates set at the outset without regard to breakpoints and fee waiver and expense reimbursement arrangements, as well as investments in the business intended to enhance services available to Fund shareholders, are means of sharing potential economies of scale with shareholders of the Fund.
The Board concluded that the Fund’s fee and expense arrangements, including contractual breakpoints, constituted a reasonable approach to sharing potential economies of scale with the Fund and its shareholders.
Other benefits to Funds Management and the Sub-Adviser
The Board received and considered information regarding potential “fall-out” or ancillary benefits received by Funds Management and its affiliates, including the Sub-Adviser, as a result of their relationships with the Fund. Ancillary benefits could include, among others, benefits directly attributable to other relationships with the Fund and benefits potentially derived from an increase in Funds Management’s and the Sub-Adviser’s business as a result of their relationships with the Fund. The Board noted that various affiliates of Funds Management may receive distribution-related fees, shareholder servicing payments and sub-transfer agency fees in respect of shares sold or held through them and services provided.
The Board also reviewed information about soft dollar credits earned and utilized by the Sub-Adviser, fees earned by Funds Management from managing a private investment vehicle for the fund family’s securities lending collateral and commissions earned by an affiliated broker from portfolio transactions.
Based on its consideration of the factors and information it deemed relevant, including those described here, the Board did not find that any ancillary benefits received by Funds Management and its affiliates, including the Sub-Adviser, were unreasonable.
Conclusion
At the Meeting, after considering the above-described factors and based on its deliberations and its evaluation of the information described above, the Board unanimously approved the continuation of the Advisory Agreements for a one-year term and determined that the compensation payable to Funds Management and the Sub-Adviser under each of the Advisory Agreements was reasonable.
| | | | |
| 38 | | Wells Fargo Large Company Value Fund | | Appendix A (unaudited) |
SALES CHARGE REDUCTIONS AND WAIVERS FOR CERTAIN INTERMEDIARIES
Ameriprise
Effective June 1, 2018, shareholders purchasing Fund shares through an Ameriprise Financial platform or account will be eligible only for the following Class A load waivers (front-end sales charge waivers), which may differ from those disclosed elsewhere in the Fund’s prospectus or Statement of Additional Information.
Front-end Sales Load Waivers on Class A Shares Available at Ameriprise Financial
| | • | | Employer-sponsored retirement plans (e.g., 401(k) plans, 457 plans, employer-sponsored 403(b) plans, profit sharing and money purchase pension plans and defined benefit plans). For purposes of this provision, employer-sponsored retirement plans do not include SEP IRAs, Simple IRAs or SAR-SEPs. |
| | • | | Shares purchased through an Ameriprise Financial investment advisory program (if an Advisory or similar share class for such investment advisory program is not available) |
| | • | | Shares purchased by third party investment advisors on behalf of their advisory clients through Ameriprise Financial’s platform (if an Advisory or similar share class for such investment advisory program is not available) |
| | • | | Shares purchased through reinvestment of distributions and dividend reinvestment when purchasing shares of the same Fund (but not any other fund within the same fund family) |
| | • | | Shares exchanged from Class C shares of the same fund in the month of or following the 10-year anniversary of the purchase date. To the extent that the Fund’s prospectus elsewhere provides for a waiver with respect to such shares following a shorter holding period, that waiver will apply to exchanges following such shorter period. To the extent that the Fund’s prospectus elsewhere provides for a waiver with respect to exchanges of Class C shares for load-waived shares, that waiver will also apply to such exchanges. |
| | • | | Employees and registered representatives of Ameriprise Financial or its affiliates and their immediate family members |
| | • | | Shares purchased by or through qualified accounts (including IRAs, Coverdell Education Savings Accounts, 401(k)s, 403(b) TSCAs subject to ERISA and defined benefit plans) that are held by a covered family member, defined as an Ameriprise financial advisor and/or the advisor’s spouse, advisor’s lineal ascendant (mother, father, grandmother, grandfather, great grandmother, great grandfather), advisor’s lineal descendant (son, step-son, daughter, step-daughter, grandson, granddaughter, great grandson, great granddaughter) or any spouse of a covered family member who is a lineal descendant |
| | • | | Shares purchased from the proceeds of redemptions within the same fund family, provided (1) the repurchase occurs within 90 days following the redemption, (2) the redemption and purchase occur in the same account, and (3) redeemed shares were subject to a front-end or deferred sales load (i.e. Rights of Reinstatement). Subject to the Fund’s policy regarding frequent purchases and redemptions of Fund shares, you may not be able to repurchase shares for the first 30 days after your redemption. |
Automatic Exchange of Class C Shares Available at Ameriprise Financial
| | • | | Class C shares will automatically exchange to Class A shares in the month of the 10-year anniversary of the purchase date. |
Merrill Lynch
Effective April 10, 2017, shareholders purchasing Fund shares through a Merrill Lynch platform or account will be eligible only for the following load waivers (front-end sales charge waivers and contingent deferred, or back-end, sales charge waivers) and discounts, which may differ from those disclosed elsewhere in the Fund’s prospectus or Statement of Additional Information.
Front-end Sales Load Waivers on Class A Shares available at Merrill Lynch
| | • | | Employer-sponsored retirement, deferred compensation and employee benefit plans (including health savings accounts) and trusts used to fund those plans, provided that the shares are not held in a commission-based brokerage account and shares are held for the benefit of the plan |
| | • | | Shares purchased by or through a 529 Plan |
| | • | | Shares purchased through a Merrill Lynch affiliated investment advisory program |
| | | | | | |
| Appendix A (unaudited) | | Wells Fargo Large Company Value Fund | | | 39 | |
| | • | | Shares purchased by third party investment advisors on behalf of their advisory clients through Merrill Lynch’s platform |
| | • | | Shares of funds purchased through the Merrill Edge Self-Directed platform (if applicable) |
| | • | | Shares purchased through reinvestment of capital gains distributions and dividend reinvestment when purchasing shares of the same fund (but not any other fund within the fund family) |
| | • | | Shares exchanged from Class C (i.e. level-load) shares of the same fund in the month of or following the 10-year anniversary of the purchase date |
| | • | | Employees and registered representatives of Merrill Lynch or its affiliates and their family members, as defined by Merrill Lynch, which may differ from the definition of family member in the Fund’s prospectus. |
| | • | | Directors or Trustees of the Fund, and employees of the Fund’s investment adviser or any of its affiliates, as described in the Fund’s prospectus |
| | • | | Shares purchased from the proceeds of redemptions within the same fund family, provided (1) the repurchase occurs within 90 days following the redemption, (2) the redemption and purchase occur in the same account, and (3) redeemed shares were subject to a front-end or deferred sales load (known as Rights of Reinstatement). Subject to the Fund’s policy regarding frequent purchases and redemptions of Fund shares, you may not be able to repurchase shares for the first 30 days after your redemption. |
CDSC Waivers on A, B and C Shares available at Merrill Lynch
| | • | | Death or disability of the shareholder |
| | • | | Shares sold as part of a systematic withdrawal plan as described in the Fund’s prospectus |
| | • | | Return of excess contributions from an IRA Account |
| | • | | Shares sold as part of a required minimum distribution for IRA and retirement accounts due to the shareholder reaching age 70½ |
| | • | | Shares sold to pay Merrill Lynch fees but only if the transaction is initiated by Merrill Lynch |
| | • | | Shares acquired through a right of reinstatement |
| | • | | Shares held in retirement brokerage accounts, that are exchanged for a lower cost share class due to transfer to certain fee based accounts or platforms (applicable to A and C shares only) |
Front-end load Discounts Available at Merrill Lynch: Breakpoints, Rights of Accumulation & Letters of Intent
| | • | | Breakpoints as described in the Fund’s prospectus |
| | • | | Rights of Accumulation (ROA) which entitle shareholders to breakpoint discounts will be automatically calculated based on the aggregated holding of fund family assets held by accounts within the purchaser’s household at Merrill Lynch. Eligible fund family assets not held at Merrill Lynch may be included in the ROA calculation only if the shareholder notifies his or her financial advisor about such assets. |
| | • | | Letters of Intent (LOI) which allow for breakpoint discounts based on anticipated purchases within a fund family, through Merrill Lynch, over a 13-month period of time (if applicable) |
Morgan Stanley
Effective on or about July 1, 2018, shareholders purchasing Fund shares through a Morgan Stanley Wealth Management transactional brokerage account will be eligible only for the following Class A load waivers (front-end sales charge waivers), which may differ from and be more limited than those disclosed in the Fund’s prospectus or Statement of Additional Information.
Front-end Sales Load Waivers on Class A Shares Available at Morgan Stanley
| | • | | Employer-sponsored retirement plans (e.g., 401(k) plans, 457 plans, employer-sponsored 403(b) plans, profit sharing and money purchase pension plans and defined benefit plans). For purposes of this provision, employer-sponsored retirement plans do not include SEP IRAs, Simple IRAs, SAR-SEPs or Keogh plans. |
| | • | | Morgan Stanley employee and employee-related accounts according to Morgan Stanley’s account linking rules |
| | • | | Shares purchased through reinvestment of dividends and capital gains distributions when purchasing shares of the same fund |
| | • | | Shares purchased through a Morgan Stanley self-directed brokerage account |
| | | | |
| 40 | | Wells Fargo Large Company Value Fund | | Appendix A (unaudited) |
| | • | | Class C (i.e., level-load) shares that are no longer subject to a contingent deferred sales charge and are exchanged to Class A shares of the same fund pursuant to Morgan Stanley Wealth Management’s share class exchange program. |
| | • | | Shares purchased from the proceeds of redemptions within the same fund family, provided (i) the repurchase occurs within 90 days following the redemption, (ii) the redemption and purchase occur in the same account, and (iii) redeemed shares were subject to a front-end or deferred sales charge. This waiver is subject to the Fund’s policy regarding frequent purchases and redemption of Fund shares, as discussed under “Account Information—Frequent Purchases and Redemptions of Fund Shares” in the Fund’s prospectus. |

For more information
More information about Wells Fargo Funds is available free upon request. To obtain literature, please write, email, visit the Fund’s website, or call:
Wells Fargo Funds
P.O. Box 219967
Kansas City, MO 64121-9967
Website: wellsfargofunds.com
Individual investors: 1-800-222-8222
Retail investment professionals: 1-888-877-9275
Institutional investment professionals: 1-866-765-0778
This report and the financial statements contained herein are submitted for the general information of the shareholders of the Fund. If this report is used for promotional purposes, distribution of the report must be accompanied or preceded by a current prospectus. Before investing, please consider the investment objectives, risks, charges, and expenses of the investment. For a current prospectus and, if available, a summary prospectus, containing this information, call 1-800-222-8222 or visit the Fund’s website at wellsfargofunds.com. Read the prospectus carefully before you invest or send money.
Wells Fargo Asset Management (WFAM) is the trade name for certain investment advisory/management firms owned by Wells Fargo & Company. These firms include but are not limited to Wells Capital Management Incorporated and Wells Fargo Funds Management, LLC. Certain products managed by WFAM entities are distributed by Wells Fargo Funds Distributor, LLC (a broker/dealer and Member FINRA).
This material is for general informational and educational purposes only and is NOT intended to provide investment advice or a recommendation of any kind—including a recommendation for any specific investment, strategy, or plan.
NOT FDIC INSURED ◾ NO BANK GUARANTEE ◾ MAY LOSE VALUE
© 2018 Wells Fargo Funds Management, LLC. All rights reserved.
| | |
 | | 314800 09-18 A210/AR210 07-18 |
Annual Report
July 31, 2018

Wells Fargo Low Volatility U.S. Equity Fund


Reduce clutter. Save trees.
Sign up for electronic delivery of prospectuses and shareholder reports at wellsfargo.com/advantagedelivery
Contents
The views expressed and any forward-looking statements are as of July 31, 2018, unless otherwise noted, and are those of the Fund managers and/or Wells Fargo Funds Management, LLC. Discussions of individual securities, or the markets generally, or any Wells Fargo Fund are not intended as individual recommendations. Future events or results may vary significantly from those expressed in any forward-looking statements. The views expressed are subject to change at any time in response to changing circumstances in the market. Wells Fargo Funds Management, LLC and the Fund disclaim any obligation to publicly update or revise any views expressed or forward-looking statements.
NOT FDIC INSURED ◾ NO BANK GUARANTEE ◾ MAY LOSE VALUE
| | | | |
| 2 | | Wells Fargo Low Volatility U.S. Equity Fund | | Letter to shareholders (unaudited) |

Andrew Owen
President
Wells Fargo Funds
After advancing during the summer and fall of 2017 in a roughly synchronized way, economic growth and stock markets globally diverged during the first seven months of 2018.
Dear Shareholder:
We are pleased to offer you this annual report for the Wells Fargo Low Volatility U.S. Equity Fund for the 12-month period that ended July 31, 2018. After advancing during the summer and fall of 2017 in a roughly synchronized way, economic growth and stock markets globally diverged during the first seven months of 2018. For fixed-income investors, higher U.S. interest rates, rising inflation, and intensifying global geopolitical tensions tended to restrain taxable bond prices while high-yield and municipal bond investors generally enjoyed positive returns.
For the period, U.S. stocks, as measured by the S&P 500 Index,1 gained 16.24%, and international stocks, as measured by the MSCI ACWI ex USA Index (Net),2 added 5.94%. Emerging market stocks, as measured by the MSCI EM Index (Net),3 added 4.36%. In bond markets, the Bloomberg Barclays U.S. Aggregate Bond Index4 declined 0.80% while fixed-income investments outside the U.S. fell 0.27%, according to the Bloomberg Barclays Global Aggregate ex-USD Index.5 The Bloomberg Barclays Municipal Bond Index6 added 0.99%, and the ICE BofAML U.S. High Yield Index7 was up 2.49%.
Volatility increased as summer turned to fall in 2017, although data generally was favorable.
During the third quarter of 2017, investor expectations rose and fell amid shifting geopolitical tensions, particularly in Asia as North Korea’s nuclear aspirations and U.S./China trade rhetoric caused concerns. In the U.S., corporate earnings and consumer confidence improved. The U.S. Bureau of Economic Analysis reported that annualized U.S. gross domestic product (GDP) growth for the quarter was 2.8%. The rate of inflation was below the U.S. Federal Reserve’s (Fed’s) targets.
Economic momentum increased in Europe; the European Central Bank (ECB) held its rates steady at low levels and continued its quantitative easing bond-buying program with the goal of sparking economic activity. In emerging markets, many countries benefited from stronger currencies versus the U.S. dollar while commodity price increases benefited countries that rely on natural resources for exports.
| 1 | The S&P 500 Index consists of 500 stocks chosen for market size, liquidity, and industry group representation. It is a market-value-weighted index with each stock’s weight in the index proportionate to its market value. You cannot invest directly in an index. |
| 2 | The Morgan Stanley Capital International (MSCI) All Country World Index (ACWI) ex USA Index (Net) is a free-float-adjusted market-capitalization-weighted index that is designed to measure the equity market performance of developed markets, excluding the United States and Canada. Source: MSCI. MSCI makes no express or implied warranties or representations and shall have no liability whatsoever with respect to any MSCI data contained herein. The MSCI data may not be further redistributed or used as a basis for other indices or any securities or financial products. This report is not approved, reviewed, or produced by MSCI. You cannot invest directly in an index. |
| 3 | The MSCI Emerging Markets (EM) Index (Net) is a free-float-adjusted market-capitalization-weighted index that is designed to measure large- and mid-cap equity market performance of emerging markets. The MSCI EM Index (Net) consists of the following 24 emerging market country indices: Brazil, Chile, China, Colombia, Czech Republic, Egypt, Greece, Hungary, India, Indonesia, Korea, Malaysia, Mexico, Pakistan, Peru, the Philippines, Poland, Qatar, Russia, South Africa, Taiwan, Thailand, Turkey, and the United Arab Emirates. You cannot invest directly in an index. |
| 4 | The Bloomberg Barclays U.S. Aggregate Bond Index is a broad-based benchmark that measures the investment-grade, U.S. dollar-denominated, fixed-rate taxable bond market, including Treasuries, government-related and corporate securities, mortgage-backed securities (agency fixed-rate and hybrid adjustable-rate mortgage pass-throughs), asset-backed securities, and commercial mortgage-backed securities. You cannot invest directly in an index. |
| 5 | The Bloomberg Barclays Global Aggregate ex-USD Index is an unmanaged index that provides a broad-based measure of the global investment-grade fixed-income markets excluding the U.S. dollar-denominated debt market. You cannot invest directly in an index. |
| 6 | The Bloomberg Barclays Municipal Bond Index is an unmanaged index composed of long-term tax-exempt bonds with a minimum credit rating of Baa. You cannot invest directly in an index. |
| 7 | The ICE BofAML U.S. High Yield Index is a market-capitalization-weighted index of domestic and Yankee high-yield bonds. The index tracks the performance of high-yield securities traded in the U.S. bond market. You cannot invest directly in an index. Copyright 2018. ICE Data Indices, LLC. All rights reserved. |
| 8 | The Consumer Price Index For All Urban Consumers (CPI-U) measures the changes in the price of a basket of goods and services purchased by urban consumers. The urban consumer population is deemed by many as a better representative measure of the general public because most of the country’s population lives in highly populated areas, which represent close to 90% of the total population. You cannot invest directly in an index. |
| | | | | | |
| Letter to shareholders (unaudited) | | Wells Fargo Low Volatility U.S. Equity Fund | | | 3 | |
The fourth quarter of 2017 was characterized by continued optimism in the U.S.
By the end of 2017, some observers were describing conditions as a Goldilocks economic scenario: synchronized global growth, low inflation, and healthy corporate earnings, all supported abroad by a weaker U.S. dollar.
U.S. stocks continued to rally during the fourth quarter of 2017, boosted by favorable company earnings and the potential for tax reform and industry deregulation. The Fed increased rates by 25 basis points (bps; 100 bps equal 1.00%) in December. The annualized GDP growth rate for the fourth quarter was 2.3%.
Internationally, the Bank of England (BoE) raised interest rates in November 2017 to 0.50%, the first increase in more than 10 years and a move up from the 0.25% rate put in place after the Brexit vote to leave the European Union in June 2016. The pound gained against other currencies. Meanwhile, the ECB and the Bank of Japan maintained interest rate policies and bond-buying programs intended to spur business activities and enhance the attractiveness of equity investments. The People’s Bank of China (PBOC) also continued policies that encouraged business investment. International equity markets, particularly emerging markets, continued to show strength.
Volatility reemerged during the first quarter of 2018 as economic signals were mixed.
The first quarter of 2018 began with stock market gains in January following U.S. tax reform that lowered rates for individuals and corporations and deregulation advanced in some economic sectors. Then, investor optimism was supplanted by several concerns. Trade tensions intensified, particularly between the U.S. and China. The U.S. threatened to impose tariffs on a broad range of imported products. Increasing interest rates and inflation also caused concern. During February 2018, the U.S. stock market endured a loss of more than 10% before recovering in March and April. The S&P 500 Index closed the first quarter with a negative return, the first negative quarterly return for the index since 2014.
The Fed increased the federal funds rate by 25 bps in March 2018 and the rate of inflation reached the Fed’s 2% target for the first time in a year. The unemployment rate fell to 4.1%. The third revision of first-quarter GDP growth by the U.S. Bureau of Economic Analysis released during June 2018 was lowered to 2.0%.
Overseas, investment market returns reversed the strong returns of 2017. After having gained 27.19% for the 12-month period that ended December 31, 2017, the MSCI ACWI ex USA Index (Net) fell 1.46% for the 7-month period that ended July 31, 2018. The U.S. dollar strengthened relative to local currencies, which served to restrain returns.
Global trade tensions escalated during the second quarter and into the third quarter of 2018.
Global trade tensions escalated as the second quarter of 2018 opened and equity markets fell in response before resuming upward momentum later in April. The U.S. government imposed tariffs on products and commodities imported from other markets in North America, Europe, and Asia. In retaliation, governments imposed tariffs on U.S. products and commodities. In addition, the U.S. pushed its North American neighbors to renegotiate the North American Free Trade Agreement, furthering trade tensions and investor uncertainty.
The CPI-U8 added 0.2% in May after a similar increase in April. On a year-over-year basis, the all-items index rose 2.8% for the 12 months that ended May 31, continuing its upward trend since the beginning of the year. The index for all items less food and energy rose 2.2% for the same 12-month period. Interest rates generally increased and the bond markets tended to decline.
During February 2018, the U.S. stock market endured a loss of more than 10% before recovering in March and April.
| | | | |
| 4 | | Wells Fargo Low Volatility U.S. Equity Fund | | Letter to shareholders (unaudited) |
During June 2018, the Fed increased the federal funds rate by 25 bps. Investment markets began to anticipate two more rate increases in 2018. Long-term interest rates in the U.S. trended higher—rates on the 10-year and 30-year Treasury bonds moved from 2.46% and 2.81%, respectively, on January 1, 2018, to 2.96% and 3.08%, respectively, on July 31, 2018. While higher at the end of the period, rates were off their peak levels on May 17, 2018, of 3.11% and 3.25%, respectively. Investors became more aware of and concerned about the potential for an inverted yield curve—sometimes a recession signal—as short-term rates increased more quickly than long-term rates.
The unemployment rate fell to 3.9% in July after ticking up slightly in June from May’s 3.8% level, according to the U.S. Department of Labor. The annualized rate of GDP growth for the second quarter of 2018 was reported in July to be 4.1%, the highest level since the third quarter of 2014, according to the U.S. Bureau of Economic Analysis.
Internationally, the prospects for a smooth U.K. Brexit agreement was cast into doubt as members of Prime Minister Theresa May’s negotiating team resigned. Despite the uncertainty, the period closed with expectations that the BoE’s Monetary Policy Committee in July would announce an increase in its key interest rate to 0.75%, which it did in early August.
Meanwhile, central banks in Europe and Japan maintained low interest rates and accommodative monetary policies. Amid rising trade uncertainty, PBOC monetary policies shifted with cuts to reserve requirement ratios and implementation of supportive measures such as accelerated infrastructure spending and tax cuts for small and medium enterprises and for individuals. Nevertheless, a strengthening U.S. dollar and the tensions associated with trade policies remained headwinds for investors overseas.
Don’t let short-term uncertainty derail long-term investment goals.
Periods of investment uncertainty can present challenges, but experience has taught us that maintaining long-term investment goals can be an effective way to plan for the future. To help you create a sound strategy based on your personal goals and risk tolerance, Wells Fargo Funds offers more than 100 mutual funds spanning a wide range of asset classes and investment styles. Although diversification cannot guarantee an investment profit or prevent losses, we believe it can be an effective way to manage investment risk and potentially smooth out overall portfolio performance. We encourage investors to know their investments and to understand that appropriate levels of risk-taking may unlock opportunities.
Thank you for choosing to invest with Wells Fargo Funds. We appreciate your confidence in us and remain committed to helping you meet your financial needs.
Sincerely,

Andrew Owen
President
Wells Fargo Funds
| | | | | | |
| Letter to shareholders (unaudited) | | Wells Fargo Low Volatility U.S. Equity Fund | | | 5 | |
Notice to shareholders
At a meeting held on August 14-15, 2018, the Board of Trustees of the Fund approved the following policy which will be effective on or about February 5, 2019:
Class C shares will convert automatically into Class A shares ten years after the initial date of purchase or, if you acquired your Class C shares through an exchange or conversion from another share class, ten years after the date you acquired your Class C shares. When Class C shares that you acquired through a purchase or exchange convert, any other Class C shares that you purchased with reinvested dividends and distributions also will convert into Class A shares on a pro rata basis. A shorter holding period may also apply depending on your intermediary. Please see “Appendix A—Sales Charge Reductions and Waivers for Certain Intermediaries” in the Fund’s prospectus or at the end of this report.
For further information about your Fund, contact your investment professional, visit our website at wellsfargofunds.com, or call us directly at 1-800-222-8222.
| | | | |
| 6 | | Wells Fargo Low Volatility U.S. Equity Fund | | Performance highlights (unaudited) |
Investment objective
The Fund seeks long-term capital appreciation.
Manager
Wells Fargo Funds Management, LLC
Subadviser
Analytic Investors, LLC
Portfolio managers
Dennis Bein, CFA®
Ryan Brown, CFA®
Harindra de Silva, Ph.D., CFA®
Average annual total returns (%) as of July 31, 2018
| | | | | | | | | | | | | | | | | | | | | | | | | | |
| | | | | Including sales charge | | | Excluding sales charge | | | Expense ratios1 (%) | |
| | | | | 1 year | | | Since inception | | | 1 year | | | Since inception | | | Gross | | | Net2 | |
| Class A (WLVLX) | | 10-31-2016 | | | 0.24 | | | | 7.11 | | | | 6.32 | | | | 10.80 | | | | 1.64 | | | | 0.83 | |
| Class C (WLVKX) | | 10-31-2016 | | | 4.45 | | | | 9.94 | | | | 5.45 | | | | 9.94 | | | | 2.39 | | | | 1.58 | |
| Class R6 (WLVJX) | | 10-31-2016 | | | – | | | | – | | | | 6.70 | | | | 11.26 | | | | 1.21 | | | | 0.40 | |
| Administrator Class (WLVDX) | | 10-31-2016 | | | – | | | | – | | | | 6.36 | | | | 10.85 | | | | 1.56 | | | | 0.75 | |
| Institutional Class (WLVOX) | | 10-31-2016 | | | – | | | | – | | | | 6.64 | | | | 11.16 | | | | 1.31 | | | | 0.50 | |
| Russell 1000® Index3 | | – | | | – | | | | – | | | | 16.19 | | | | 19.79 | | | | – | | | | – | |
Figures quoted represent past performance, which is no guarantee of future results, and do not reflect taxes that a shareholder may pay on fund distributions or the redemption of fund shares. Investment return and principal value of an investment will fluctuate so that an investor’s shares, when redeemed, may be worth more or less than their original cost. Performance shown without sales charges would be lower if sales charges were reflected. Current performance may be lower or higher than the performance data quoted, which assumes the reinvestment of dividends and capital gains. Current month-end performance is available on the Fund’s website, wellsfargofunds.com.
Index returns do not include transaction costs associated with buying and selling securities, any mutual fund fees or expenses, or any taxes. It is not possible to invest directly in an index.
For Class A shares, the maximum front-end sales charge is 5.75%. For Class C shares, the maximum contingent deferred sales charge is 1.00%. Performance including a contingent deferred sales charge assumes the sales charge for the corresponding time period. Class R6, Administrator Class, and Institutional Class shares are sold without a front-end sales charge or contingent deferred sales charge.
Stock values fluctuate in response to the activities of individual companies and general market and economic conditions. Certain investment strategies tend to increase the total risk of an investment (relative to the broader market). The Fund is exposed to smaller-company securities risk. Consult the Fund’s prospectus for additional information on these and other risks.
Please see footnotes on page 7.
| | | | | | |
| Performance highlights (unaudited) | | Wells Fargo Low Volatility U.S. Equity Fund | | | 7 | |
|
| Growth of $10,000 investment as of July 31, 20184 |
|
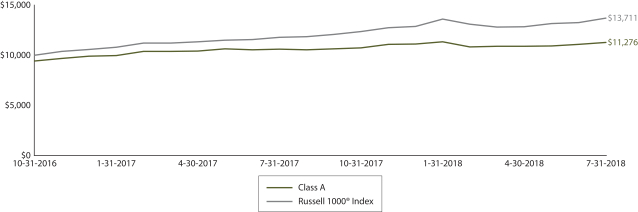 |
| 1 | Reflects the expense ratios as stated in the most recent prospectuses. The expense ratios shown are subject to change and may differ from the annualized expense ratios shown in the financial highlights of this report. |
| 2 | The manager has contractually committed through November 30, 2018, to waive fees and/or reimburse expenses to the extent necessary to cap the Fund’s Total Annual Fund Operating Expenses After Fee Waivers at the amounts shown. After this time, the cap may be increased or the commitment to maintain the cap may be terminated only with the approval of the Board of Trustees. Brokerage commissions, stamp duty fees, interest, taxes, acquired fund fees and expenses (if any), and extraordinary expenses are excluded from the expense cap. Without this cap, the Fund’s returns would have been lower. The expense ratio paid by an investor is the net expense ratio (the total annual fund operating expenses after fee waivers) as stated in the prospectuses. |
| 3 | The Russell 1000® Index measures the performance of the 1,000 largest companies in the Russell 3000® Index, which represents approximately 92% of the total market capitalization of the Russell 3000® Index. You cannot invest directly in an index. |
| 4 | The chart compares the performance of Class A shares for the most recent ten years with the Russell 1000® Index. The chart assumes a hypothetical investment of $10,000 in Class A shares and reflects all operating expenses and assumes the maximum initial sales charge of 5.75%. |
| 5 | The ten largest holdings, excluding cash, cash equivalents and any money market funds, are calculated based on the value of the investments divided by total net assets of the Fund. Holdings are subject to change and may have changed since the date specified. |
| 6 | The Personal Consumption Expenditures (PCE) Index is the primary measure of consumer spending on goods and services in the U.S. economy. It accounts for about two-thirds of domestic final spending and is part of the personal income report issued by the Bureau of Economic Analysis of the Department of Commerce. You cannot invest directly in an index. |
| 7 | Amounts are calculated based on the total long-term investments of the Fund. These amounts are subject to change and may have changed since the date specified. |
| * | This security was no longer held at the end of the reporting period. |
| | | | |
| 8 | | Wells Fargo Low Volatility U.S. Equity Fund | | Performance highlights (unaudited) |
MANAGER’S DISCUSSION
Fund highlights
| ∎ | | The Fund underperformed its benchmark, the Russell 1000® Index, for the 12-month period that ended July 31, 2018. |
| ∎ | | Primary detractors from Fund performance during the reporting period included an overweight to the consumer staples and utilities sectors, an underweight to the information technology (IT) sector, and our focus on lower-risk/lower-beta stocks, which underperformed in the rapidly rising market environment. Beta is a measure of a stock’s volatility relative to general market movements; lower-beta stocks tend to deliver lower variation in returns compared with the overall market. |
| ∎ | | Our risk management and emphasis on high-quality stocks led to lack of exposure to the struggling telecommunication services sector and favorable stock selection in the health care sector. |
U.S. stocks delivered strong results during the reporting period.
In general, economic data released during the period was positive and upbeat. For example, gross domestic product growth for the fourth quarter of 2017 was revised up to a 2.9% annualized rate. In addition, a surprising 313,000 new jobs were added in February 2018, with another 39,000 added to the already-strong January report. The U.S. unemployment rate fell to 3.8% by the end of the period, the lowest jobless rate since April 2000, and household spending increased.
| | | | |
| Ten largest holdings (%) as of July 31, 20185 | |
NextEra Energy Incorporated | | | 2.45 | |
PepsiCo Incorporated | | | 2.40 | |
The Procter & Gamble Company | | | 2.28 | |
Colgate-Palmolive Company | | | 2.27 | |
Merck & Company Incorporated | | | 2.14 | |
Waste Management Incorporated | | | 2.11 | |
Costco Wholesale Corporation | | | 2.10 | |
Raytheon Company | | | 2.09 | |
Sysco Corporation | | | 2.08 | |
Baxter International Incorporated | | | 2.06 | |
Stocks continued to climb despite increasing geopolitical risk. Escalating tension between the U.S. and North Korea, including the launch of North Korean ballistic missiles over Japan, was an example of events in the ongoing tensions between the two countries. In addition, stocks moved higher even as the U.S. Federal Reserve (Fed) raised interest rates three times during the period and six times since the 2008 financial crisis. Year-over-year inflation, as measured by the PCE Index6, hit the Fed’s 2% target in March 2018 for the first time in over a year, a sign of strengthening U.S. inflation pressures that could encourage the Fed to continue lifting interest rates this year. Although the Fed left U.S. interest rates unchanged in May 2018, the central bank also took note of rising prices and said it now expects inflation to be near its 2% target over the medium term.
Market volatility, while tame for most of the one-year period, returned in early 2018 amid worries about inflation, global trade wars, and new regulations on technology firms.
The Fund seeks to have less volatility than the overall stock market.
Our investment process focuses primarily on volatility reduction; we seek to maintain a standard deviation (variation between highest and lowest returns) that is 20% to 30% less than that of the index while delivering a similar or higher level of return over a full market cycle. Using our fundamental and statistical risk models, we construct the portfolio by quantitatively identifying companies that possess lower forecasted risks. Due to the Fund’s focus on low-beta stocks, which tend to be more defensive in nature, we were not surprised by the Fund’s recent underperformance given that the stock market climbed over 16% over the 12-month period.
Please see footnotes on page 7.
| | | | | | |
| Performance highlights (unaudited) | | Wells Fargo Low Volatility U.S. Equity Fund | | | 9 | |
|
| Sector distribution as of July 31, 20187 |
|
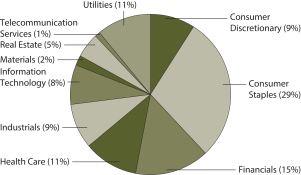 |
The Fund’s focus on low volatility can lead to sector weights and Fund holdings that result in Fund underperformance during a rapidly rising market; this was the case during the reporting period.
Due to our low-volatility emphasis, sector weights within the Fund tend to deviate meaningfully from those of the benchmark. During the period, the Fund held underweights to sectors that generally exhibited higher betas, such as IT, and overweight positions to consumer staples and utilities, sectors that are considered defensive in nature. IT was the best-performing sector in the index for the period; therefore, the Fund’s sizable underweight to IT hampered relative results. The consumer staples and utilities sectors posted
relatively weak returns and underperformed the benchmark, which caused the Fund’s large overweight to the sector to detract from Fund performance. Stock selection within utilities also negatively affected results, as overweight positions to PPL Corporation* and PG&E Corporation negatively influenced results.
Our emphases on risk management and high-quality stocks proved favorable during the reporting period.
Lack of exposure to the telecommunication services sector helped the Fund’s relative performance. The Fund lacks exposure primarily because this sector has exhibited considerably higher relative volatility in recent years.
Stock selection within the health care sector also contributed to performance, due primarily to the Fund’s investment in IDEXX Laboratories, Incorporated, which was the top contributor to relative performance. This company possesses high-quality characteristics favored by our quantitative models, such as strong earnings quality and low risk. We expect these high-quality factors may aid the Fund’s goal of providing lower volatility while retaining the Fund’s potential for appreciation.
Going forward, we will continue to favor low-beta stocks as they serve the Fund’s goal: to reduce volatility.
Using our fundamental and statistical risk models, we will quantitatively identify companies with lower forecasted risks. In addition, we will use our comprehensive alpha-prediction model when selecting lower-risk stocks. Alpha measures the excess return of an investment vehicle, such as a mutual fund, relative to the return of its index. Our process quantitatively forecasts returns using over 70 fundamental, technical, and proprietary factors, also known as alpha signals. As a result, our process not only assesses investment opportunities from a risk perspective but also from an alpha standpoint. We believe this increases the likelihood that over a full market cycle, the Fund may provide investors with lower overall portfolio risk relative to the index while delivering a similar or higher level of return.
Please see footnotes on page 7.
| | | | |
| 10 | | Wells Fargo Low Volatility U.S. Equity Fund | | Fund expenses (unaudited) |
As a shareholder of the Fund, you incur two types of costs: (1) transaction costs, including sales charges (loads) on purchase payments and contingent deferred sales charges (if any) on redemptions and (2) ongoing costs, including management fees, distribution (12b-1) and/or shareholder servicing fees, and other Fund expenses. This example is intended to help you understand your ongoing costs (in dollars) of investing in the Fund and to compare these costs with the ongoing costs of investing in other mutual funds.
The example is based on an investment of $1,000 invested at the beginning of the six-month period and held for the entire period from February 1, 2018 to July 31, 2018.
Actual expenses
The “Actual” line of the table below provides information about actual account values and actual expenses. You may use the information in this line, together with the amount you invested, to estimate the expenses that you paid over the period. Simply divide your account value by $1,000 (for example, an $8,600 account value divided by $1,000 = 8.6), then multiply the result by the number in the “Actual” line under the heading entitled “Expenses paid during period” for your applicable class of shares to estimate the expenses you paid on your account during this period.
Hypothetical example for comparison purposes
The “Hypothetical” line of the table below provides information about hypothetical account values and hypothetical expenses based on the Fund’s actual expense ratio and an assumed rate of return of 5% per year before expenses, which is not the Fund’s actual return. The hypothetical account values and expenses may not be used to estimate the actual ending account balance or expenses you paid for the period. You may use this information to compare the ongoing costs of investing in the Fund and other funds. To do so, compare this 5% hypothetical example with the 5% hypothetical examples that appear in the shareholder reports of the other funds.
Please note that the expenses shown in the table are meant to highlight your ongoing costs only and do not reflect any transactional costs, such as sales charges (loads) and contingent deferred sales charges. Therefore, the “Hypothetical” line of the table is useful in comparing ongoing costs only and will not help you determine the relative total costs of owning different funds. In addition, if these transactional costs were included, your costs would have been higher.
| | | | | | | | | | | | | | | | |
| | | Beginning
account value
2-1-2018 | | | Ending
account value
7-31-2018 | | | Expenses
paid during
the period¹ | | | Annualized net
expense ratio | |
Class A | | | | | | | | | | | | | | | | |
Actual | | $ | 1,000.00 | | | $ | 993.98 | | | $ | 4.17 | | | | 0.83 | % |
Hypothetical (5% return before expenses) | | $ | 1,000.00 | | | $ | 1,021.02 | | | $ | 4.23 | | | | 0.83 | % |
Class C | | | | | | | | | | | | | | | | |
Actual | | $ | 1,000.00 | | | $ | 989.66 | | | $ | 7.92 | | | | 1.58 | % |
Hypothetical (5% return before expenses) | | $ | 1,000.00 | | | $ | 1,017.24 | | | $ | 8.03 | | | | 1.58 | % |
Class R6 | | | | | | | | | | | | | | | | |
Actual | | $ | 1,000.00 | | | $ | 995.70 | | | $ | 2.01 | | | | 0.40 | % |
Hypothetical (5% return before expenses) | | $ | 1,000.00 | | | $ | 1,023.19 | | | $ | 2.04 | | | | 0.40 | % |
Administrator Class | | | | | | | | | | | | | | | | |
Actual | | $ | 1,000.00 | | | $ | 993.98 | | | $ | 3.77 | | | | 0.75 | % |
Hypothetical (5% return before expenses) | | $ | 1,000.00 | | | $ | 1,021.42 | | | $ | 3.82 | | | | 0.75 | % |
Institutional Class | | | | | | | | | | | | | | | | |
Actual | | $ | 1,000.00 | | | $ | 995.70 | | | $ | 2.52 | | | | 0.50 | % |
Hypothetical (5% return before expenses) | | $ | 1,000.00 | | | $ | 1,022.68 | | | $ | 2.55 | | | | 0.50 | % |
| 1 | Expenses paid is equal to the annualized net expense ratio of each class multiplied by the average account value over the period, multiplied by the number of days in the most recent fiscal half-year divided by the number of days in the fiscal year (to reflect the one-half-year period). |
| | | | | | |
| Portfolio of investments—July 31, 2018 | | Wells Fargo Low Volatility U.S. Equity Fund | | | 11 | |
| | | | | | | | | | | | | | | | |
| Security name | | | | | | | | Shares | | | Value | |
| | | | |
Common Stocks: 97.46% | | | | | | | | | | | | | | | | |
| | | | |
Consumer Discretionary: 8.45% | | | | | | | | | | | | | | | | |
| | | | |
| Auto Components: 0.69% | | | | | | | | | | | | | | | | |
Lear Corporation | | | | | | | | | | | 868 | | | $ | 156,353 | |
Visteon Corporation † | | | | | | | | | | | 915 | | | | 107,128 | |
| | | | |
| | | | | | | | | | | | | | | 263,481 | |
| | | | | | | | | | | | | | | | |
| | | | |
| Diversified Consumer Services: 0.49% | | | | | | | | | | | | | | | | |
Grand Canyon Education Incorporated † | | | | | | | | | | | 740 | | | | 86,232 | |
H&R Block Incorporated | | | | | | | | | | | 4,045 | | | | 101,772 | |
| | | | |
| | | | | | | | | | | | | | | 188,004 | |
| | | | | | | | | | | | | | | | |
| | | | |
| Hotels, Restaurants & Leisure: 3.54% | | | | | | | | | | | | | | | | |
Aramark | | | | | | | | | | | 1,264 | | | | 50,825 | |
Darden Restaurants Incorporated | | | | | | | | | | | 5,331 | | | | 570,097 | |
Hilton Grand Vacations Incorporated † | | | | | | | | | | | 14,035 | | | | 485,471 | |
McDonald’s Corporation | | | | | | | | | | | 1,594 | | | | 251,119 | |
| | | | |
| | | | | | | | | | | | | | | 1,357,512 | |
| | | | | | | | | | | | | | | | |
| | | | |
| Household Durables: 1.66% | | | | | | | | | | | | | | | | |
Garmin Limited | | | | | | | | | | | 1,965 | | | | 122,714 | |
NVR Incorporated † | | | | | | | | | | | 187 | | | | 516,013 | |
| | | | |
| | | | | | | | | | | | | | | 638,727 | |
| | | | | | | | | | | | | | | | |
| | | | |
| Media: 1.54% | | | | | | | | | | | | | | | | |
Lions Gate Entertainment Class B | | | | | | | | | | | 3,262 | | | | 74,602 | |
Sirius XM Holdings Incorporated | | | | | | | | | | | 35,539 | | | | 249,484 | |
The Madison Square Garden Company Class A † | | | | | | | | | | | 857 | | | | 267,538 | |
| | | | |
| | | | | | | | | | | | | | | 591,624 | |
| | | | | | | | | | | | | | | | |
| | | | |
| Specialty Retail: 0.53% | | | | | | | | | | | | | | | | |
Best Buy Company Incorporated | | | | | | | | | | | 1,091 | | | | 81,858 | |
ULTA Beauty Incorporated † | | | | | | | | | | | 491 | | | | 119,995 | |
| | | | |
| | | | | | | | | | | | | | | 201,853 | |
| | | | | | | | | | | | | | | | |
| | | | |
Consumer Staples: 28.45% | | | | | | | | | | | | | | | | |
| | | | |
| Beverages: 3.11% | | | | | | | | | | | | | | | | |
PepsiCo Incorporated | | | | | | | | | | | 8,020 | | | | 922,300 | |
The Coca-Cola Company | | | | | | | | | | | 5,850 | | | | 272,786 | |
| | | | |
| | | | | | | | | | | | | | | 1,195,086 | |
| | | | | | | | | | | | | | | | |
| | | | |
| Food & Staples Retailing: 6.92% | | | | | | | | | | | | | | | | |
Costco Wholesale Corporation | | | | | | | | | | | 3,693 | | | | 807,696 | |
Sysco Corporation | | | | | | | | | | | 11,852 | | | | 796,573 | |
US Foods Holding Corporation † | | | | | | | | | | | 17,331 | | | | 585,961 | |
Wal-Mart Stores Incorporated | | | | | | | | | | | 5,222 | | | | 465,959 | |
| | | | |
| | | | | | | | | | | | | | | 2,656,189 | |
| | | | | | | | | | | | | | | | |
The accompanying notes are an integral part of these financial statements.
| | | | |
| 12 | | Wells Fargo Low Volatility U.S. Equity Fund | | Portfolio of investments—July 31, 2018 |
| | | | | | | | | | | | | | | | |
| Security name | | | | | | | | Shares | | | Value | |
| | | | |
| Food Products: 7.10% | | | | | | | | | | | | | | | | |
Bunge Limited | | | | | | | | | | | 7,202 | | | $ | 497,874 | |
Flowers Foods Incorporated | | | | | | | | | | | 9,853 | | | | 201,001 | |
Ingredion Incorporated | | | | | | | | | | | 1,304 | | | | 132,095 | |
Lamb Weston Holdings Incorporated | | | | | | | | | | | 10,704 | | | | 752,170 | |
The Hershey Company | | | | | | | | | | | 6,658 | | | | 653,882 | |
Tyson Foods Incorporated Class A | | | | | | | | | | | 8,448 | | | | 487,027 | |
| | | | |
| | | | | | | | | | | | | | | 2,724,049 | |
| | | | | | | | | | | | | | | | |
| | | | |
| Household Products: 7.44% | | | | | | | | | | | | | | | | |
Colgate-Palmolive Company | | | | | | | | | | | 12,989 | | | | 870,393 | |
Kimberly-Clark Corporation | | | | | | | | | | | 6,401 | | | | 728,818 | |
The Clorox Company | | | | | | | | | | | 2,823 | | | | 381,585 | |
The Procter & Gamble Company | | | | | | | | | | | 10,825 | | | | 875,526 | |
| | | | |
| | | | | | | | | | | | | | | 2,856,322 | |
| | | | | | | | | | | | | | | | |
| | | | |
| Personal Products: 0.95% | | | | | | | | | | | | | | | | |
The Estee Lauder Companies Incorporated Class A | | | | | | | | | | | 2,694 | | | | 363,528 | |
| | | | | | | | | | | | | | | | |
| | | | |
| Tobacco: 2.93% | | | | | | | | | | | | | | | | |
Altria Group Incorporated | | | | | | | | | | | 12,379 | | | | 726,400 | |
Philip Morris International | | | | | | | | | | | 4,603 | | | | 397,239 | |
| | | | |
| | | | | | | | | | | | | | | 1,123,639 | |
| | | | | | | | | | | | | | | | |
| | | | |
Financials: 14.48% | | | | | | | | | | | | | | | | |
| | | | |
| Banks: 0.97% | | | | | | | | | | | | | | | | |
Comerica Incorporated | | | | | | | | | | | 2,680 | | | | 259,799 | |
US Bancorp | | | | | | | | | | | 2,080 | | | | 110,261 | |
| | | | |
| | | | | | | | | | | | | | | 370,060 | |
| | | | | | | | | | | | | | | | |
| | | | |
| Capital Markets: 4.23% | | | | | | | | | | | | | | | | |
CBOE Holdings Incorporated | | | | | | | | | | | 6,330 | | | | 614,833 | |
CME Group Incorporated | | | | | | | | | | | 3,719 | | | | 591,767 | |
Intercontinental Exchange Incorporated | | | | | | | | | | | 3,817 | | | | 282,114 | |
LPL Financial Holdings Incorporated | | | | | | | | | | | 1,092 | | | | 72,389 | |
Morningstar Incorporated | | | | | | | | | | | 473 | | | | 62,436 | |
| | | | |
| | | | | | | | | | | | | | | 1,623,539 | |
| | | | | | | | | | | | | | | | |
| | | | |
| Diversified Financial Services: 0.10% | | | | | | | | | | | | | | | | |
AXA Equitable Holdings Incorporated † | | | | | | | | | | | 1,771 | | | | 38,944 | |
| | | | | | | | | | | | | | | | |
| | | | |
| Insurance: 5.82% | | | | | | | | | | | | | | | | |
American Financial Group Incorporated | | | | | | | | | | | 6,364 | | | | 717,159 | |
American National Insurance Company | | | | | | | | | | | 202 | | | | 26,056 | |
Aon plc | | | | | | | | | | | 1,358 | | | | 194,941 | |
Arch Capital Group Limited † | | | | | | | | | | | 6,753 | | | | 206,372 | |
Everest Reinsurance Group Limited | | | | | | | | | | | 1,459 | | | | 318,573 | |
The Allstate Corporation | | | | | | | | | | | 383 | | | | 36,431 | |
The Progressive Corporation | | | | | | | | | | | 10,951 | | | | 657,170 | |
Unum Group | | | | | | | | | | | 1,936 | | | | 76,917 | |
| | | | |
| | | | | | | | | | | | | | | 2,233,619 | |
| | | | | | | | | | | | | | | | |
The accompanying notes are an integral part of these financial statements.
| | | | | | |
| Portfolio of investments—July 31, 2018 | | Wells Fargo Low Volatility U.S. Equity Fund | | | 13 | |
| | | | | | | | | | | | | | | | |
| Security name | | | | | | | | Shares | | | Value | |
| | | | |
| Mortgage REITs: 3.36% | | | | | | | | | | | | | | | | |
AGNC Investment Corporation | | | | | | | | | | | 15,735 | | | $ | 306,360 | |
Chimera Investment Corporation | | | | | | | | | | | 6,559 | | | | 125,277 | |
MFA Financial Incorporated | | | | | | | | | | | 42,071 | | | | 338,672 | |
New Residential Investment Corporation | | | | | | | | | | | 11,700 | | | | 209,313 | |
Starwood Property Trust Incorporated | | | | | | | | | | | 8,220 | | | | 187,745 | |
Two Harbors Investment Corporation | | | | | | | | | | | 7,828 | | | | 121,334 | |
| | | | |
| | | | | | | | | | | | | | | 1,288,701 | |
| | | | | | | | | | | | | | | | |
| | | | |
Health Care: 10.79% | | | | | | | | | | | | | | | | |
| | | | |
| Health Care Equipment & Supplies: 3.67% | | | | | | | | | | | | | | | | |
Baxter International Incorporated | | | | | | | | | | | 10,892 | | | | 789,125 | |
ICU Medical Incorporated † | | | | | | | | | | | 173 | | | | 49,616 | |
IDEXX Laboratories Incorporated † | | | | | | | | | | | 2,324 | | | | 569,217 | |
| | | | |
| | | | | | | | | | | | | | | 1,407,958 | |
| | | | | | | | | | | | | | | | |
| | | | |
| Health Care Providers & Services: 2.88% | | | | | | | | | | | | | | | | |
AmerisourceBergen Corporation | | | | | | | | | | | 2,751 | | | | 225,114 | |
Cigna Corporation | | | | | | | | | | | 228 | | | | 40,908 | |
Humana Incorporated | | | | | | | | | | | 2,500 | | | | 785,450 | |
Laboratory Corporation of America Holdings † | | | | | | | | | | | 295 | | | | 51,725 | |
| | | | |
| | | | | | | | | | | | | | | 1,103,197 | |
| | | | | | | | | | | | | | | | |
| | | | |
| Life Sciences Tools & Services: 1.83% | | | | | | | | | | | | | | | | |
Bio-Rad Laboratories Incorporated Class A † | | | | | | | | | | | 2,295 | | | | 703,762 | |
| | | | | | | | | | | | | | | | |
| | | | |
| Pharmaceuticals: 2.41% | | | | | | | | | | | | | | | | |
Merck & Company Incorporated | | | | | | | | | | | 12,440 | | | | 819,423 | |
Zoetis Incorporated | | | | | | | | | | | 1,228 | | | | 106,197 | |
| | | | |
| | | | | | | | | | | | | | | 925,620 | |
| | | | | | | | | | | | | | | | |
| | | | |
Industrials: 8.64% | | | | | | | | | | | | | | | | |
| | | | |
| Aerospace & Defense: 4.08% | | | | | | | | | | | | | | | | |
BWX Technologies Incorporated | | | | | | | | | | | 3,788 | | | | 249,099 | |
Lockheed Martin Corporation | | | | | | | | | | | 1,583 | | | | 516,216 | |
Raytheon Company | | | | | | | | | | | 4,043 | | | | 800,635 | |
| | | | |
| | | | | | | | | | | | | | | 1,565,950 | |
| | | | | | | | | | | | | | | | |
| | | | |
| Air Freight & Logistics: 1.37% | | | | | | | | | | | | | | | | |
Expeditors International of Washington Incorporated | | | | | | | | | | | 6,883 | | | | 524,278 | |
| | | | | | | | | | | | | | | | |
| | | | |
| Commercial Services & Supplies: 2.99% | | | | | | | | | | | | | | | | |
Republic Services Incorporated | | | | | | | | | | | 4,621 | | | | 334,930 | |
Waste Management Incorporated | | | | | | | | | | | 9,015 | | | | 811,350 | |
| | | | |
| | | | | | | | | | | | | | | 1,146,280 | |
| | | | | | | | | | | | | | | | |
| | | | |
| Industrial Conglomerates: 0.20% | | | | | | | | | | | | | | | | |
Carlisle Companies Incorporated | | | | | | | | | | | 637 | | | | 78,249 | |
| | | | | | | | | | | | | | | | |
The accompanying notes are an integral part of these financial statements.
| | | | |
| 14 | | Wells Fargo Low Volatility U.S. Equity Fund | | Portfolio of investments—July 31, 2018 |
| | | | | | | | | | | | | | | | |
| Security name | | | | | | | | Shares | | | Value | |
| | | | |
Information Technology: 8.21% | | | | | | | | | | | | | | | | |
| | | | |
| Communications Equipment: 1.25% | | | | | | | | | | | | | | | | |
Motorola Solutions Incorporated | | | | | | | | | | | 3,944 | | | $ | 478,407 | |
| | | | | | | | | | | | | | | | |
| | | | |
| Electronic Equipment, Instruments & Components: 0.20% | | | | | | | | | | | | | | | | |
National Instruments Corporation | | | | | | | | | | | 1,749 | | | | 76,624 | |
| | | | | | | | | | | | | | | | |
| | | | |
| Internet Software & Services: 0.46% | | | | | | | | | | | | | | | | |
IAC Corporation † | | | | | | | | | | | 1,212 | | | | 178,467 | |
| | | | | | | | | | | | | | | | |
| | | | |
| IT Services: 3.71% | | | | | | | | | | | | | | | | |
Amdocs Limited | | | | | | | | | | | 10,291 | | | | 695,466 | |
Booz Allen Hamilton Holding Corporation | | | | | | | | | | | 14,567 | | | | 688,582 | |
MasterCard Incorporated Class A | | | | | | | | | | | 208 | | | | 41,184 | |
| | | | |
| | | | | | | | | | | | | | | 1,425,232 | |
| | | | | | | | | | | | | | | | |
| | | | |
| Semiconductors & Semiconductor Equipment: 0.28% | | | | | | | | | | | | | | | | |
Maxim Integrated Products Incorporated | | | | | | | | | | | 1,743 | | | | 106,567 | |
| | | | | | | | | | | | | | | | |
| | | | |
| Software: 2.31% | | | | | | | | | | | | | | | | |
Cadence Design Systems Incorporated † | | | | | | | | | | | 4,764 | | | | 210,045 | |
CDK Global Incorporated | | | | | | | | | | | 3,840 | | | | 239,808 | |
Fortinet Incorporated † | | | | | | | | | | | 1,904 | | | | 119,781 | |
Synopsys Incorporated † | | | | | | | | | | | 3,554 | | | | 317,834 | |
| | | | |
| | | | | | | | | | | | | | | 887,468 | |
| | | | | | | | | | | | | | | | |
| | | | |
Materials: 1.66% | | | | | | | | | | | | | | | | |
| | | | |
| Chemicals: 0.16% | | | | | | | | | | | | | | | | |
Valvoline Incorporated | | | | | | | | | | | 2,680 | | | | 60,541 | |
| | | | | | | | | | | | | | | | |
| | | | |
| Containers & Packaging: 0.55% | | | | | | | | | | | | | | | | |
Avery Dennison Corporation | | | | | | | | | | | 791 | | | | 90,712 | |
Berry Global Group Incorporated † | | | | | | | | | | | 2,460 | | | | 120,171 | |
| | | | |
| | | | | | | | | | | | | | | 210,883 | |
| | | | | | | | | | | | | | | | |
| | | | |
| Metals & Mining: 0.95% | | | | | | | | | | | | | | | | |
Newmont Mining Corporation | | | | | | | | | | | 9,963 | | | | 365,443 | |
| | | | | | | | | | | | | | | | |
| | | | |
Real Estate: 4.60% | | | | | | | | | | | | | | | | |
| | | | |
| Equity REITs: 4.60% | | | | | | | | | | | | | | | | |
Apple Hospitality REIT Incorporated | | | | | | | | | | | 15,864 | | | | 285,393 | |
Equity Commonwealth † | | | | | | | | | | | 11,457 | | | | 369,374 | |
Park Hotels & Resorts Incorporated | | | | | | | | | | | 4,440 | | | | 138,883 | |
Prologis Incorporated | | | | | | | | | | | 2,127 | | | | 139,574 | |
Rayonier Incorporated | | | | | | | | | | | 5,071 | | | | 177,536 | |
SBA Communications Corporation † | | | | | | | | | | | 4,126 | | | | 652,940 | |
| | | | |
| | | | | | | | | | | | | | | 1,763,700 | |
| | | | | | | | | | | | | | | | |
| | | | |
Telecommunication Services: 1.49% | | | | | | | | | | | | | | | | |
| | | | |
| Diversified Telecommunication Services: 1.49% | | | | | | | | | | | | | | | | |
AT&T Incorporated | | | | | | | | | | | 17,848 | | | | 570,601 | |
| | | | | | | | | | | | | | | | |
The accompanying notes are an integral part of these financial statements.
| | | | | | |
| Portfolio of investments—July 31, 2018 | | Wells Fargo Low Volatility U.S. Equity Fund | | | 15 | |
| | | | | | | | | | | | | | | | |
| Security name | | | | | | | | Shares | | | Value | |
| | | | |
Utilities: 10.69% | | | | | | | | | | | | | | | | |
| | | | |
| Electric Utilities: 8.03% | | | | | | | | | | | | | | | | |
American Electric Power Company Incorporated | | | | | | | | | | | 2,997 | | | $ | 213,207 | |
Edison International | | | | | | | | | | | 1,622 | | | | 108,074 | |
Exelon Corporation | | | | | | | | | | | 7,612 | | | | 323,510 | |
Hawaiian Electric Industries Incorporated | | | | | | | | | | | 16,957 | | | | 596,378 | |
NextEra Energy Incorporated | | | | | | | | | | | 5,607 | | | | 939,397 | |
PG&E Corporation | | | | | | | | | | | 9,618 | | | | 414,343 | |
Pinnacle West Capital Corporation | | | | | | | | | | | 3,661 | | | | 294,454 | |
Xcel Energy Incorporated | | | | | | | | | | | 4,132 | | | | 193,626 | |
| | | | |
| | | | | | | | | | | | | | | 3,082,989 | |
| | | | | | | | | | | | | | | | |
| | | | |
| Gas Utilities: 0.83% | | | | | | | | | | | | | | | | |
UGI Corporation | | | | | | | | | | | 6,035 | | | | 320,700 | |
| | | | | | | | | | | | | | | | |
| | | | |
| Independent Power & Renewable Electricity Producers: 0.49% | | | | | | | | | | | | | | | | |
Vistra Energy Corporation † | | | | | | | | | | | 8,302 | | | | 187,625 | |
| | | | | | | | | | | | | | | | |
| | | | |
| Multi-Utilities: 1.34% | | | | | | | | | | | | | | | | |
CenterPoint Energy Incorporated | | | | | | | | | | | 3,700 | | | | 105,376 | |
CMS Energy Corporation | | | | | | | | | | | 7,178 | | | | 346,985 | |
MDU Resources Group Incorporated | | | | | | | | | | | 2,091 | | | | 60,639 | |
| | | | |
| | | | | | | | | | | | | | | 513,000 | |
| | | | | | | | | | | | | | | | |
| | | | |
Total Common Stocks (Cost $34,698,624) | | | | | | | | | | | | | | | 37,398,418 | |
| | | | | | | | | | | | | | | | |
| | | | |
| | | Yield | | | | | | | | | | |
| Short-Term Investments: 2.41% | | | | | | | | | | | | | | | | |
| | | | |
| Investment Companies: 2.41% | | | | | | | | | | | | | | | | |
Wells Fargo Government Money Market Fund Select Class (l)(u) | | | 1.83 | % | | | | | | | 922,225 | | | | 922,225 | |
| | | | | | | | | | | | | | | | |
| | | | |
Total Short-Term Investments (Cost $922,225) | | | | | | | | | | | | | | | 922,225 | |
| | | | | | | | | | | | | | | | |
| | | | | | | | |
| Total investments in securities (Cost $35,620,849) | | | 99.87 | % | | | 38,320,643 | |
Other assets and liabilities, net | | | 0.13 | | | | 51,221 | |
| | | | | | | | |
| Total net assets | | | 100.00 | % | | $ | 38,371,864 | |
| | | | | | | | |
| † | Non-income-earning security |
| (l) | The issuer of the security is an affiliated person of the Fund as defined in the Investment Company Act of 1940. |
| (u) | The rate represents the 7-day annualized yield at period end. |
Abbreviations:
| REIT | Real estate investment trust |
The accompanying notes are an integral part of these financial statements.
| | | | |
| 16 | | Wells Fargo Low Volatility U.S. Equity Fund | | Portfolio of investments—July 31, 2018 |
Investments in Affiliates
An affiliated investment is an investment in which the Fund owns at least 5% of the outstanding voting shares of the issuer or as a result of other relationships, such as the Fund and the issuer having the same investment manager. Transactions with issuers that were either affiliated persons of the Fund at the beginning of the period or the end of the period were as follows:
| | | | | | | | | | | | | | | | | | | | | | | | | | | | | | | | | | | | |
| | | Shares,
beginning of
period | | | Shares
purchased | | | Shares
sold | | | Shares,
end of
period | | | Net
realized
gains
(losses) | | | Net
change in
unrealized
gains
(losses) | | | Income
from
affiliated
securities | | | Value,
end
of period | | | % of
net
assets | |
Short-Term Investments | | | | | | | | | | | | | | | | | | | | | | | | | | | | | | | | | | | | |
Investment Companies | | | | | | | | | | | | | | | | | | | | | | | | | | | | | | | | | | | | |
Wells Fargo Government Money Market Fund Select Class | | | 1,095,727 | | | | 9,443,131 | | | | 9,616,633 | | | | 922,225 | | | $ | 0 | | | $ | 0 | | | $ | 12,771 | | | $ | 922,225 | | | | 2.41 | % |
The accompanying notes are an integral part of these financial statements.
| | | | | | |
| Statement of assets and liabilities—July 31, 2018 | | Wells Fargo Low Volatility U.S. Equity Fund | | | 17 | |
| | | | |
| | | | |
| |
Assets | | | | |
Investments in unaffiliated securities, at value (cost $34,698,624) | | $ | 37,398,418 | |
Investments in affiliated securities, at value (cost $922,225) | | | 922,225 | |
Receivable for dividends | | | 40,188 | |
Receivable from manager | | | 25,772 | |
Prepaid expenses and other assets | | | 72,242 | |
| | | | |
Total assets | | | 38,458,845 | |
| | | | |
| |
Liabilities | | | | |
Professional fees payable | | | 46,710 | |
Shareholder report expenses payable | | | 28,068 | |
Custodian and accounting fees payable | | | 6,396 | |
Administration fees payable | | | 4,231 | |
Trustees’ fees and expenses payable | | | 1,457 | |
Distribution fees payable | | | 119 | |
| | | | |
Total liabilities | | | 86,981 | |
| | | | |
Total net assets | | $ | 38,371,864 | |
| | | | |
| |
NET ASSETS CONSIST OF | | | | |
Paid-in capital | | $ | 33,935,348 | |
Undistributed net investment income | | | 364,175 | |
Accumulated net realized gains on investments | | | 1,372,547 | |
Net unrealized gains on investments | | | 2,699,794 | |
| | | | |
Total net assets | | $ | 38,371,864 | |
| | | | |
| |
COMPUTATION OF NET ASSET VALUE AND OFFERING PRICE PER SHARE | | | | |
Net assets – Class A | | $ | 1,312,226 | |
Shares outstanding – Class A1 | | | 113,533 | |
Net asset value per share – Class A | | | $11.56 | |
Maximum offering price per share – Class A2 | | | $12.27 | |
Net assets – Class C | | $ | 186,722 | |
Shares outstanding – Class C1 | | | 16,245 | |
Net asset value per share – Class C | | | $11.49 | |
Net assets – Class R6 | | $ | 1,163,517 | |
Shares outstanding – Class R61 | | | 100,480 | |
Net asset value per share – Class R6 | | | $11.58 | |
Net assets – Administrator Class | | $ | 116,023 | |
Shares outstanding – Administrator Class1 | | | 10,042 | |
Net asset value per share – Administrator Class | | | $11.55 | |
Net assets – Institutional Class | | $ | 35,593,376 | |
Shares outstanding – Institutional Class1 | | | 3,074,122 | |
Net asset value per share – Institutional Class | | | $11.58 | |
| 1 | The Fund has an unlimited number of authorized shares. |
| 2 | Maximum offering price is computed as 100/94.25 of net asset value. On investments of $50,000 or more, the offering price is reduced. |
The accompanying notes are an integral part of these financial statements.
| | | | |
| 18 | | Wells Fargo Low Volatility U.S. Equity Fund | | Statement of operations—year ended July 31, 2018 |
| | | | |
| | | | |
| |
Investment income | | | | |
Dividends (net of foreign withholding taxes of $101) | | $ | 892,629 | |
Income from affiliated securities | | | 12,771 | |
| | | | |
Total investment income | | | 905,400 | |
| | | | |
| |
Expenses | | | | |
Management fee | | | 153,015 | |
Administration fees | | | | |
Class A | | | 2,584 | |
Class C | | | 299 | |
Class R | | | 68 | 1 |
Class R6 | | | 342 | |
Administrator Class | | | 148 | |
Institutional Class | | | 46,275 | |
Shareholder servicing fees | | | | |
Class A | | | 3,076 | |
Class C | | | 356 | |
Class R | | | 81 | 1 |
Administrator Class | | | 284 | |
Distribution fees | | | | |
Class C | | | 1,067 | |
Class R | | | 81 | 1 |
Custody and accounting fees | | | 17,724 | |
Professional fees | | | 53,341 | |
Registration fees | | | 110,026 | |
Shareholder report expenses | | | 50,340 | |
Trustees’ fees and expenses | | | 23,307 | |
Other fees and expenses | | | 7,388 | |
| | | | |
Total expenses | | | 469,802 | |
Less: Fee waivers and/or expense reimbursements | | | (273,606 | ) |
| | | | |
Net expenses | | | 196,196 | |
| | | | |
Net investment income | | | 709,204 | |
| | | | |
| |
REALIZED AND UNREALIZED GAINS (LOSSES) ON INVESTMENTS | | | | |
Net realized gains on investments | | | 1,575,047 | |
Net change in unrealized gains (losses) on investments | | | 219,615 | |
| | | | |
Net realized and unrealized gains (losses) on investments | | | 1,794,662 | |
| | | | |
Net increase in net assets resulting from operations | | $ | 2,503,866 | |
| | | | |
| 1 | For the period from August 1, 2017 to November 13, 2017. Effective at the close of business on November 13, 2017, Class R shares were liquidated and the class was subsequently closed. Class R shares are no longer offered by the Fund. |
The accompanying notes are an integral part of these financial statements.
| | | | | | |
| Statement of changes in net assets | | Wells Fargo Low Volatility U.S. Equity Fund | | | 19 | |
| | | | | | | | | | | | | | | | |
| | | Year ended
July 31, 2018 | | | Year ended
July 31, 20171 | |
| | | |
Operations | | | | | | | | | | | | |
Net investment income | | | | | | $ | 709,204 | | | | | | | $ | 486,714 | |
Net realized gains on investments | | | | | | | 1,575,047 | | | | | | | | 426,122 | |
Net change in unrealized gains (losses) on investments | | | | | | | 219,615 | | | | | | | | 2,480,179 | |
| | | | |
Net increase in net assets resulting from operations | | | | | | | 2,503,866 | | | | | | | | 3,393,015 | |
| | | | |
| | | |
Distributions to shareholders from | | | | | | | | | | | | |
Net investment income | | | | | | | | | | | | | | | | |
Class A | | | | | | | (19,083 | ) | | | | | | | (1,837 | ) |
Class C | | | | | | | (941 | ) | | | | | | | (295 | ) |
Class R | | | | | | | 0 | 2 | | | | | | | (382 | ) |
Class R6 | | | | | | | (22,574 | ) | | | | | | | (5,028 | ) |
Administrator Class | | | | | | | (1,865 | ) | | | | | | | (441 | ) |
Institutional Class | | | | | | | (665,070 | ) | | | | | | | (114,483 | ) |
Net realized gains | | | | | | | | | | | | | | | | |
Class A | | | | | | | (20,121 | ) | | | | | | | 0 | |
Class C | | | | | | | (1,864 | ) | | | | | | | 0 | |
Class R6 | | | | | | | (18,434 | ) | | | | | | | 0 | |
Administrator Class | | | | | | | (1,842 | ) | | | | | | | 0 | |
Institutional Class | | | | | | | (586,361 | ) | | | | | | | 0 | |
| | | | |
Total distributions to shareholders | | | | | | | (1,338,155 | ) | | | | | | | (122,466 | ) |
| | | | |
| | | | |
Capital share transactions | | | Shares | | | | | | | | Shares | | | | | |
Proceeds from shares sold | | | | | | | | | | | | | | | | |
Class A | | | 36,479 | | | | 411,267 | | | | 114,026 | | | | 1,216,340 | |
Class C | | | 7,545 | | | | 83,872 | | | | 10,000 | | | | 100,000 | |
Class R | | | 0 | 2 | | | 0 | 2 | | | 10,000 | | | | 100,000 | |
Class R6 | | | 0 | | | | 0 | | | | 100,000 | | | | 1,000,000 | |
Administrator Class | | | 0 | | | | 0 | | | | 10,000 | | | | 100,000 | |
Institutional Class | | | 321,940 | | | | 3,618,353 | | | | 2,955,414 | | | | 30,144,185 | |
| | | | |
| | | | | | | 4,113,492 | | | | | | | | 32,660,525 | |
| | | | |
Reinvestment of distributions | | | | | | | | | | | | | | | | |
Class A | | | 3,092 | | | | 35,640 | | | | 175 | | | | 1,837 | |
Class C | | | 3 | | | | 37 | | | | 28 | | | | 295 | |
Class R | | | 0 | 2 | | | 0 | 2 | | | 37 | | | | 382 | |
Class R6 | | | 0 | | | | 0 | | | | 480 | | | | 5,028 | |
Administrator Class | | | 0 | | | | 0 | | | | 42 | | | | 441 | |
Institutional Class | | | 25,951 | | | | 299,171 | | | | 10,934 | | | | 114,483 | |
| | | | |
| | | | | | | 334,848 | | | | | | | | 122,466 | |
| | | | |
Payment for shares redeemed | | | | | | | | | | | | | | | | |
Class A | | | (23,744 | ) | | | (260,000 | ) | | | (16,495 | ) | | | (181,770 | ) |
Class C | | | (1,331 | ) | | | (15,125 | ) | | | 0 | | | | 0 | |
Class R | | | (10,037 | )2 | | | (114,115 | )2 | | | 0 | | | | 0 | |
Institutional Class | | | (227,303 | ) | | | (2,583,866 | ) | | | (12,814 | ) | | | (140,851 | ) |
| | | | |
| | | | | | | (2,973,106 | ) | | | | | | | (322,621 | ) |
| | | | |
Net increase in net assets resulting from capital share transactions | | | | | | | 1,475,234 | | | | | | | | 32,460,370 | |
| | | | |
Total increase in net assets | | | | | | | 2,640,945 | | | | | | | | 35,730,919 | |
| | | | |
| | |
Net assets | | | | | | | | |
Beginning of period | | | | | | | 35,730,919 | | | | | | | | 0 | |
| | | | |
End of period | | | | | | $ | 38,371,864 | | | | | | | $ | 35,730,919 | |
| | | | |
Undistributed net investment income | | | | | | $ | 364,175 | | | | | | | $ | 364,504 | |
| | | | |
| 1 | For the period from October 31, 2016 (commencement of operations) to July 31, 2017 |
| 2 | For the period from August 1, 2017 to November 13, 2017. Effective at the close of business on November 13, 2017, Class R shares were liquidated and the class was subsequently closed. Class R shares are no longer offered by the Fund. |
The accompanying notes are an integral part of these financial statements.
| | | | |
| 20 | | Wells Fargo Low Volatility U.S. Equity Fund | | Financial highlights |
(For a share outstanding throughout each period)
| | | | | | | | |
| | | Year ended July 31 | |
| CLASS A | | 2018 | | | 20171 | |
Net asset value, beginning of period | | | $11.21 | | | | $10.00 | |
Net investment income | | | 0.16 | | | | 0.13 | |
Net realized and unrealized gains (losses) on investments | | | 0.54 | | | | 1.12 | |
| | | | | | | | |
Total from investment operations | | | 0.70 | | | | 1.25 | |
Distributions to shareholders from | | | | | | | | |
Net investment income | | | (0.17 | ) | | | (0.04 | ) |
Net realized gains | | | (0.18 | ) | | | 0.00 | |
| | | | | | | | |
Total distributions to shareholders | | | (0.35 | ) | | | (0.04 | ) |
Net asset value, end of period | | | $11.56 | | | | $11.21 | |
Total return2 | | | 6.32 | % | | | 12.53 | % |
Ratios to average net assets (annualized) | | | | | | | | |
Gross expenses | | | 1.55 | % | | | 1.61 | % |
Net expenses | | | 0.83 | % | | | 0.82 | % |
Net investment income | | | 1.53 | % | | | 1.78 | % |
Supplemental data | | | | | | | | |
Portfolio turnover rate | | | 75 | % | | | 39 | % |
Net assets, end of period (000s omitted) | | | $1,312 | | | | $1,096 | |
| 1 | For the period from October 31, 2016 (commencement of class operations) to July 31, 2017 |
| 2 | Total return calculations do not include any sales charges. Returns for periods of less than one year are not annualized. |
The accompanying notes are an integral part of these financial statements.
| | | | | | |
| Financial highlights | | Wells Fargo Low Volatility U.S. Equity Fund | | | 21 | |
(For a share outstanding throughout each period)
| | | | | | | | |
| | | Year ended July 31 | |
| CLASS C | | 2018 | | | 20171 | |
Net asset value, beginning of period | | | $11.16 | | | | $10.00 | |
Net investment income | | | 0.08 | | | | 0.08 | |
Net realized and unrealized gains (losses) on investments | | | 0.52 | | | | 1.11 | |
| | | | | | | | |
Total from investment operations | | | 0.60 | | | | 1.19 | |
Distributions to shareholders from | | | | | | | | |
Net investment income | | | (0.09 | ) | | | (0.03 | ) |
Net realized gains | | | (0.18 | ) | | | 0.00 | |
| | | | | | | | |
Total distributions to shareholders | | | (0.27 | ) | | | (0.03 | ) |
Net asset value, end of period | | | $11.49 | | | | $11.16 | |
Total return2 | | | 5.45 | % | | | 11.91 | % |
Ratios to average net assets (annualized) | | | | | | | | |
Gross expenses | | | 2.31 | % | | | 2.40 | % |
Net expenses | | | 1.58 | % | | | 1.58 | % |
Net investment income | | | 0.76 | % | | | 1.01 | % |
Supplemental data | | | | | | | | |
Portfolio turnover rate | | | 75 | % | | | 39 | % |
Net assets, end of period (000s omitted) | | | $187 | | | | $112 | |
| 1 | For the period from October 31, 2016 (commencement of class operations) to July 31, 2017 |
| 2 | Total return calculations do not include any sales charges. Returns for periods of less than one year are not annualized. |
The accompanying notes are an integral part of these financial statements.
| | | | |
| 22 | | Wells Fargo Low Volatility U.S. Equity Fund | | Financial highlights |
(For a share outstanding throughout each period)
| | | | | | | | |
| | | Year ended July 31 | |
| CLASS R6 | | 2018 | | | 20171 | |
Net asset value, beginning of period | | | $11.24 | | | | $10.00 | |
Net investment income | | | 0.22 | | | | 0.18 | |
Net realized and unrealized gains (losses) on investments | | | 0.52 | | | | 1.11 | |
| | | | | | | | |
Total from investment operations | | | 0.74 | | | | 1.29 | |
Distributions to shareholders from | | | | | | | | |
Net investment income | | | (0.22 | ) | | | (0.05 | ) |
Net realized gains | | | (0.18 | ) | | | 0.00 | |
| | | | | | | | |
Total distributions to shareholders | | | (0.40 | ) | | | (0.05 | ) |
Net asset value, end of period | | | $11.58 | | | | $11.24 | |
Total return2 | | | 6.70 | % | | | 12.94 | % |
Ratios to average net assets (annualized) | | | | | | | | |
Gross expenses | | | 1.12 | % | | | 1.22 | % |
Net expenses | | | 0.40 | % | | | 0.40 | % |
Net investment income | | | 1.96 | % | | | 2.19 | % |
Supplemental data | | | | | | | | |
Portfolio turnover rate | | | 75 | % | | | 39 | % |
Net assets, end of period (000s omitted) | | | $1,164 | | | | $1,129 | |
| 1 | For the period from October 31, 2016 (commencement of class operations) to July 31, 2017 |
| 2 | Returns for periods of less than one year are not annualized. |
The accompanying notes are an integral part of these financial statements.
| | | | | | |
| Financial highlights | | Wells Fargo Low Volatility U.S. Equity Fund | | | 23 | |
(For a share outstanding throughout each period)
| | | | | | | | |
| | | Year ended July 31 | |
| ADMINISTRATOR CLASS | | 2018 | | | 20171 | |
Net asset value, beginning of period | | | $11.21 | | | | $10.00 | |
Net investment income | | | 0.18 | | | | 0.15 | |
Net realized and unrealized gains (losses) on investments | | | 0.53 | | | | 1.10 | |
| | | | | | | | |
Total from investment operations | | | 0.71 | | | | 1.25 | |
Distributions to shareholders from | | | | | | | | |
Net investment income | | | (0.19 | ) | | | (0.04 | ) |
Net realized gains | | | (0.18 | ) | | | 0.00 | |
| | | | | | | | |
Total distributions to shareholders | | | (0.37 | ) | | | (0.04 | ) |
Net asset value, end of period | | | $11.55 | | | | $11.21 | |
Total return2 | | | 6.36 | % | | | 12.57 | % |
Ratios to average net assets (annualized) | | | | | | | | |
Gross expenses | | | 1.47 | % | | | 1.57 | % |
Net expenses | | | 0.75 | % | | | 0.75 | % |
Net investment income | | | 1.61 | % | | | 1.84 | % |
Supplemental data | | | | | | | | |
Portfolio turnover rate | | | 75 | % | | | 39 | % |
Net assets, end of period (000s omitted) | | | $116 | | | | $113 | |
| 1 | For the period from October 31, 2016 (commencement of class operations) to July 31, 2017 |
| 2 | Returns for periods of less than one year are not annualized. |
The accompanying notes are an integral part of these financial statements.
| | | | |
| 24 | | Wells Fargo Low Volatility U.S. Equity Fund | | Financial highlights |
(For a share outstanding throughout each period)
| | | | | | | | |
| | | Year ended July 31 | |
| INSTITUTIONAL CLASS | | 2018 | | | 20171 | |
Net asset value, beginning of period | | | $11.23 | | | | $10.00 | |
Net investment income | | | 0.20 | | | | 0.16 | |
Net realized and unrealized gains (losses) on investments | | | 0.54 | | | | 1.12 | |
| | | | | | | | |
Total from investment operations | | | 0.74 | | | | 1.28 | |
Distributions to shareholders from | | | | | | | | |
Net investment income | | | (0.21 | ) | | | (0.05 | ) |
Net realized gains | | | (0.18 | ) | | | 0.00 | |
| | | | | | | | |
Total distributions to shareholders | | | (0.39 | ) | | | (0.05 | ) |
Net asset value, end of period | | | $11.58 | | | | $11.23 | |
Total return2 | | | 6.64 | % | | | 12.82 | % |
Ratios to average net assets (annualized) | | | | | | | | |
Gross expenses | | | 1.22 | % | | | 1.31 | % |
Net expenses | | | 0.50 | % | | | 0.50 | % |
Net investment income | | | 1.87 | % | | | 2.09 | % |
Supplemental data | | | | | | | | |
Portfolio turnover rate | | | 75 | % | | | 39 | % |
Net assets, end of period (000s omitted) | | | $35,593 | | | | $33,169 | |
| 1 | For the period from October 31, 2016 (commencement of class operations) to July 31, 2017 |
| 2 | Returns for periods of less than one year are not annualized. |
The accompanying notes are an integral part of these financial statements.
| | | | | | |
| Notes to financial statements | | Wells Fargo Low Volatility U.S. Equity Fund | | | 25 | |
1. ORGANIZATION
Wells Fargo Funds Trust (the “Trust”), a Delaware statutory trust organized on March 10, 1999, is an open-end management investment company registered under the Investment Company Act of 1940, as amended (the “1940 Act”). As an investment company, the Trust follows the accounting and reporting guidance in Financial Accounting Standards Board Accounting Standards Codification Topic 946, Financial Services – Investment Companies. These financial statements report on the Wells Fargo Low Volatility U.S. Equity Fund (the “Fund”) which is a diversified series of the Trust.
Effective at the close of business on November 13, 2017, Class R shares were liquidated and the class was subsequently closed. Class R shares are no longer offered by the Fund. Information for Class R shares reflected in the financial statements represents activity through November 13, 2017.
2. SIGNIFICANT ACCOUNTING POLICIES
The following significant accounting policies, which are consistently followed in the preparation of the financial statements of the Fund, are in conformity with U.S. generally accepted accounting principles which require management to make estimates and assumptions that affect the reported amounts of assets and liabilities, disclosure of contingent assets and liabilities at the date of the financial statements, and the reported amounts of revenues and expenses during the reporting period. Actual results could differ from those estimates.
Securities valuation
All investments are valued each business day as of the close of regular trading on the New York Stock Exchange (generally 4 p.m. Eastern Time), although the Fund may deviate from this calculation time under unusual or unexpected circumstances.
Equity securities that are listed on a foreign or domestic exchange or market are valued at the official closing price or, if none, the last sales price. If no sale occurs on the principal exchange or market that day, a fair value price will be determined in accordance with the Fund’s Valuation Procedures.
Investments in registered open-end investment companies are valued at net asset value.
Investments which are not valued using any of the methods discussed above are valued at their fair value, as determined in good faith by the Board of Trustees of the Fund. The Board of Trustees has established a Valuation Committee comprised of the Trustees and has delegated to it the authority to take any actions regarding the valuation of portfolio securities that the Valuation Committee deems necessary or appropriate, including determining the fair value of portfolio securities, unless the determination has been delegated to the Wells Fargo Asset Management Pricing Committee at Wells Fargo Funds Management, LLC (“Funds Management”). The Board of Trustees retains the authority to make or ratify any valuation decisions or approve any changes to the Valuation Procedures as it deems appropriate. On a quarterly basis, the Board of Trustees receives reports on any valuation actions taken by the Valuation Committee or the Wells Fargo Asset Management Pricing Committee which may include items for ratification.
Valuations of fair valued securities are compared to the next actual sales price when available, or other appropriate market values, to assess the continued appropriateness of the fair valuation methodologies used. These securities are fair valued on a day-to-day basis, taking into consideration changes to appropriate market information and any significant changes to the inputs considered in the valuation process until there is a readily available price provided on an exchange or by an independent pricing service. Valuations received from an independent pricing service or independent broker-dealer quotes are periodically validated by comparisons to most recent trades and valuations provided by other independent pricing services in addition to the review of prices by the manager and/or subadviser. Unobservable inputs used in determining fair valuations are identified based on the type of security, taking into consideration factors utilized by market participants in valuing the investment, knowledge about the issuer and the current market environment.
Security transactions and income recognition
Securities transactions are recorded on a trade date basis. Realized gains or losses are recorded on the basis of identified cost.
Dividend income is recognized on the ex-dividend date. Dividend income is recorded net of foreign taxes withheld where recovery of such taxes is not assured.
Distributions to shareholders
Distributions to shareholders from net investment income and any net realized gains are recorded on the ex-dividend date and paid at least annually. Such distributions are determined in accordance with income tax regulations and may differ from U.S. generally accepted accounting principles. Dividend sources are estimated at the time of declaration. The tax character of distributions is determined as of the Fund’s fiscal year end. Therefore, a portion of the Fund’s distributions made prior to the Fund’s fiscal year end may be categorized as a tax return of capital at year end.
| | | | |
| 26 | | Wells Fargo Low Volatility U.S. Equity Fund | | Notes to financial statements |
Federal and other taxes
The Fund intends to continue to qualify as a regulated investment company by distributing substantially all of its investment company taxable income and any net realized capital gains (after reduction for capital loss carryforwards) sufficient to relieve it from all, or substantially all, federal income taxes. Accordingly, no provision for federal income taxes was required.
The Fund’s income and federal excise tax returns and all financial records supporting those returns for the prior three fiscal years are subject to examination by the federal and Delaware revenue authorities. Management has analyzed the Fund’s tax positions taken on federal, state, and foreign tax returns for all open tax years and does not believe that there are any uncertain tax positions that require recognition of a tax liability.
As of July 31, 2018, the aggregate cost of all investments for federal income tax purposes was $35,662,635 and the unrealized gains (losses) consisted of:
| | | | |
Gross unrealized gains | | $ | 3,717,450 | |
Gross unrealized losses | | | (1,059,442 | ) |
Net unrealized gains | | $ | 2,658,008 | |
Class allocations
The separate classes of shares offered by the Fund differ principally in applicable sales charges, distribution, shareholder servicing, and administration fees. Class specific expenses are charged directly to that share class. Investment income, common expenses, and realized and unrealized gains (losses) on investments are allocated daily to each class of shares based on the relative proportion of net assets of each class.
3. FAIR VALUATION MEASUREMENTS
Fair value measurements of investments are determined within a framework that has established a fair value hierarchy based upon the various data inputs utilized in determining the value of the Fund’s investments. The three-level hierarchy gives the highest priority to unadjusted quoted prices in active markets for identical assets or liabilities (Level 1) and the lowest priority to unobservable inputs (Level 3). The Fund’s investments are classified within the fair value hierarchy based on the lowest level of input that is significant to the fair value measurement. The inputs are summarized into three broad levels as follows:
| ∎ | | Level 1 – quoted prices in active markets for identical securities |
| ∎ | | Level 2 – other significant observable inputs (including quoted prices for similar securities, interest rates, prepayment speeds, credit risk, etc.) |
| ∎ | | Level 3 – significant unobservable inputs (including the Fund’s own assumptions in determining the fair value of investments) |
The inputs or methodologies used for valuing investments in securities are not necessarily an indication of the risk associated with investing in those securities.
The following is a summary of the inputs used in valuing the Fund’s assets and liabilities as of July 31, 2018:
| | | | | | | | | | | | | | | | |
| | | Quoted prices
(Level 1) | | | Other significant
observable inputs
(Level 2) | | | Significant
unobservable inputs
(Level 3) | | | Total | |
Assets | | | | | | | | | | | | | | | | |
Investments in: | | | | | | | | | | | | | | | | |
| | | | |
Common stocks | | | | | | | | | | | | | | | | |
Consumer discretionary | | $ | 3,241,201 | | | $ | 0 | | | $ | 0 | | | $ | 3,241,201 | |
Consumer staples | | | 10,918,813 | | | | 0 | | | | 0 | | | | 10,918,813 | |
Financials | | | 5,554,863 | | | | 0 | | | | 0 | | | | 5,554,863 | |
Health care | | | 4,140,537 | | | | 0 | | | | 0 | | | | 4,140,537 | |
Industrials | | | 3,314,757 | | | | 0 | | | | 0 | | | | 3,314,757 | |
Information technology | | | 3,152,765 | | | | 0 | | | | 0 | | | | 3,152,765 | |
Materials | | | 636,867 | | | | 0 | | | | 0 | | | | 636,867 | |
Real estate | | | 1,763,700 | | | | 0 | | | | 0 | | | | 1,763,700 | |
Telecommunication services | | | 570,601 | | | | 0 | | | | 0 | | | | 570,601 | |
Utilities | | | 4,104,314 | | | | 0 | | | | 0 | | | | 4,104,314 | |
| | | | |
Short-term investments | | | | | | | | | | | | | | | | |
Investment companies | | | 922,225 | | | | 0 | | | | 0 | | | | 922,225 | |
Total assets | | $ | 38,320,643 | | | $ | 0 | | | $ | 0 | | | $ | 38,320,643 | |
| | | | | | |
| Notes to financial statements | | Wells Fargo Low Volatility U.S. Equity Fund | | | 27 | |
The Fund recognizes transfers between levels within the fair value hierarchy at the end of the reporting period. At July 31, 2018, the Fund did not have any transfers into/out of Level 1, Level 2, or Level 3.
4. TRANSACTIONS WITH AFFILIATES
Management fee
Funds Management, an indirect wholly owned subsidiary of Wells Fargo & Company (“Wells Fargo”), is the manager of the Fund and provides advisory and fund-level administrative services under an investment management agreement. Under the investment management agreement, Funds Management is responsible for, among other services, implementing the investment objectives and strategies of the Fund, supervising the subadviser and providing fund-level administrative services in connection with the Fund’s operations. As compensation for its services under the investment management agreement, Funds Management is entitled to receive an annual management fee starting at 0.40% and declining to 0.33% as the average daily net assets of the Fund increase. For the year ended July 31, 2018, the management fee was equivalent to an annual rate of 0.40% of the Fund’s average daily net assets.
Funds Management has retained the services of a subadviser to provide daily portfolio management to the Fund. The fee for subadvisory services is borne by Funds Management. Analytic Investors, LLC, an affiliate of Funds Management and an indirect wholly owned subsidiary of Wells Fargo, is the subadviser to the Fund and is entitled to receive a fee from Funds Management at an annual rate starting at 0.20% and declining to 0.12% as the average daily net assets of the Fund increase.
Administration fees
Under a class-level administration agreement, Funds Management provides class-level administrative services to the Fund, which includes paying fees and expenses for services provided by the transfer agent, sub-transfer agents, omnibus account servicers and record-keepers. As compensation for its services under the class-level administration agreement, Funds Management receives an annual fee which is calculated based on the average daily net assets of each class as follows:
| | | | |
| | | Class-level
administration fee | |
Class A, Class C, Class R | | | 0.21 | % |
Class R6 | | | 0.03 | |
Administrator Class, Institutional Class | | | 0.13 | |
Funds Management has contractually waived and/or reimbursed management and administration fees to the extent necessary to maintain certain net operating expense ratios for the Fund. When each class of the Fund has exceeded its expense cap, Funds Management has waived fees and/or reimbursed expenses from fund level expenses on a proportionate basis and then from class specific expenses; otherwise, waivers and/or reimbursements are applied against class specific expenses before fund level expenses. Funds Management has committed through November 30, 2018 to waive fees and/or reimburse expenses to the extent necessary to cap the Fund’s expenses at 0.83% for Class A shares, 1.58% for Class C shares, 0.40% for Class R6 shares, 0.75% for Administrator Class shares, and 0.50% for Institutional Class shares. After this time, the cap may be increased or the commitment to maintain the cap may be terminated only with the approval of the Board of Trustees.
Distribution fees
The Trust has adopted a distribution plan for Class C and Class R shares of the Fund pursuant to Rule 12b-1 under the 1940 Act. Distribution fees are charged to Class C and Class R shares and paid to Wells Fargo Funds Distributor, LLC (“Funds Distributor”), the principal underwriter, at an annual rate of 0.75% of the average daily net assets of Class C shares and 0.25% of the average daily net assets of Class R shares.
In addition, Funds Distributor is entitled to receive the front-end sales charge from the purchase of Class A shares and a contingent deferred sales charge on the redemption of certain Class A shares. Funds Distributor is also entitled to receive the contingent deferred sales charges from redemptions of Class C shares. For the year ended July 31, 2018, Funds Distributor received $99 from the sale of Class A shares. No contingent deferred sales charges were incurred by Class A and Class C shares for the year ended July 31, 2018.
Interfund transactions
The Fund may purchase or sell portfolio investment securities to certain other Wells Fargo affiliates pursuant to Rule 17a-7 under the 1940 Act and under procedures adopted by the Board of Trustees. The procedures have been designed to ensure that these interfund transactions, which do not incur broker commissions, are effected at current market prices.
| | | | |
| 28 | | Wells Fargo Low Volatility U.S. Equity Fund | | Notes to financial statements |
Shareholder servicing fees
The Trust has entered into contracts with one or more shareholder servicing agents, whereby Class A, Class C, Class R, and Administrator Class of the Fund are charged a fee at an annual rate of 0.25% of the average daily net assets of each respective class.
A portion of these total shareholder servicing fees were paid to affiliates of Wells Fargo.
5. INVESTMENT PORTFOLIO TRANSACTIONS
Purchases and sales of investments, excluding U.S. government obligations (if any) and short-term securities, for the year ended July 31, 2018 were $28,734,731 and $27,633,458, respectively.
6. BANK BORROWINGS
The Trust (excluding the money market funds and certain other funds) and Wells Fargo Variable Trust are parties to a $280,000,000 revolving credit agreement whereby the Fund is permitted to use bank borrowings for temporary or emergency purposes, such as to fund shareholder redemption requests. Interest under the credit agreement is charged to the Fund based on a borrowing rate equal to the higher of the Federal Funds rate in effect on that day plus 1.25% or the overnight LIBOR rate in effect on that day plus 1.25%. In addition, an annual commitment fee equal to 0.25% of the unused balance is allocated to each participating fund.
For the year ended July 31, 2018, there were no borrowings by the Fund under the agreement.
7. CONCENTRATION RISK
Concentration risks result from exposure to a limited number of sectors. A fund that invests a substantial portion of its assets in any sector may be more affected by changes in that sector than would be a fund whose investments are not heavily weighted in any sector.
For the year ended July 31, 2018, there were no borrowings by the Fund under the agreement.
8. DISTRIBUTIONS TO SHAREHOLDERS
The tax character of distributions paid during the years ended July 31, 2018 and July 31, 2017 were as follows:
| | | | | | | | |
| | | Year ended July 31 | |
| | | 2018 | | | 2017* | |
Ordinary income | | $ | 1,337,744 | | | $ | 122,466 | |
Long-term capital gain | | | 411 | | | | 0 | |
| * | For the period from October 31, 2016 (commencement of operations) to July 31, 2017 |
As of July 31, 2018, the components of distributable earnings on a tax basis were as follows:
| | | | |
Undistributed
ordinary
income | | Undistributed
long-term
gain | | Unrealized
gains |
| $624,973 | | $1,153,535 | | $2,658,008 |
9. INDEMNIFICATION
Under the Trust’s organizational documents, the officers and Trustees have been granted certain indemnification rights against certain liabilities that may arise out of performance of their duties to the Trust. Additionally, in the normal course of business, the Trust may enter into contracts with service providers that contain a variety of indemnification clauses. The Trust’s maximum exposure under these arrangements is dependent on future claims that may be made against the Fund and, therefore, cannot be estimated.
| | | | | | |
| Report of independent registered public accounting firm | | Wells Fargo Low Volatility U.S. Equity Fund | | | 29 | |
BOARD OF TRUSTEES AND SHAREHOLDERS OF WELLS FARGO FUNDS TRUST:
Opinion on the Financial Statements
We have audited the accompanying statement of assets and liabilities of Wells Fargo Low Volatility U.S. Equity Fund (the “Fund”), one of the funds constituting Wells Fargo Funds Trust, including the portfolio of investments, as of July 31, 2018, the related statement of operations for the year then ended, the statements of changes in net assets for the period from October 31, 2016 (commencement of operations) to July 31, 2017 and the year ended July 31, 2018, and the related notes (collectively, the “financial statements”) and the financial highlights for the period from October 31, 2016 (commencement of operations) to July 31, 2017 and the year ended July 31, 2018. In our opinion, the financial statements and financial highlights present fairly, in all material respects, the financial position of the Fund as of July 31, 2018, the results of its operations for the year then ended, and the changes in its net assets and the financial highlights for the period from October 31, 2016 (commencement of operations) to July 31, 2017 and the year ended July 31, 2018, in conformity with U.S. generally accepted accounting principles.
Basis for Opinion
These financial statements and financial highlights are the responsibility of the Fund’s management. Our responsibility is to express an opinion on these financial statements and financial highlights based on our audits. We are a public accounting firm registered with the Public Company Accounting Oversight Board (United States) (“PCAOB”) and are required to be independent with respect to the Fund in accordance with the U.S. federal securities laws and the applicable rules and regulations of the Securities and Exchange Commission and the PCAOB.
We conducted our audits in accordance with the standards of the PCAOB. Those standards require that we plan and perform the audit to obtain reasonable assurance about whether the financial statements and financial highlights are free of material misstatement, whether due to error or fraud. Our audits included performing procedures to assess the risks of material misstatement of the financial statements and financial highlights, whether due to error or fraud, and performing procedures that respond to those risks. Such procedures included examining, on a test basis, evidence regarding the amounts and disclosures in the financial statements and financial highlights. Such procedures also included confirmation of securities owned as of July 31, 2018, by correspondence with the custodian and brokers, or by other appropriate auditing procedures. Our audits also included evaluating the accounting principles used and significant estimates made by management, as well as evaluating the overall presentation of the financial statements and financial highlights. We believe that our audits provide a reasonable basis for our opinion.

We have not been able to determine the specific year that we began serving as the auditor of one or more Wells Fargo Funds investment companies, however we are aware that we have served as the auditor of one or more Wells Fargo Funds investment companies since at least 1955.
Boston, Massachusetts
September 24, 2018
| | | | |
| 30 | | Wells Fargo Low Volatility U.S. Equity Fund | | Other information (unaudited) |
TAX INFORMATION
For corporate shareholders, pursuant to Section 854 of the Internal Revenue Code, 55.56% of ordinary income dividends qualify for the corporate dividends-received deduction for the fiscal year ended July 31, 2018.
Pursuant to Section 852 of the Internal Revenue Code, $411 was designated as a 20% rate gain distribution for the fiscal year ended July 31, 2018.
Pursuant to Section 854 of the Internal Revenue Code, $808,364 of income dividends paid during the fiscal year ended July 31, 2018 has been designated as qualified dividend income (QDI).
For the fiscal year ended July 31, 2018, $8,583 has been designated as interest-related dividends for nonresident alien shareholders pursuant to Section 871 of the Internal Revenue Code.
For the fiscal year ended July 31, 2018, $628,211 has been designated as short-term capital gain dividends for nonresident alien shareholders pursuant to Section 871 of the Internal Revenue Code.
PROXY VOTING INFORMATION
A description of the policies and procedures that the Fund uses to determine how to vote proxies relating to portfolio securities is available, upon request, by calling 1-800-222-8222, visiting our website at wellsfargofunds.com, or visiting the SEC website at sec.gov. Information regarding how the Fund voted proxies relating to portfolio securities during the most recent 12-month period ended June 30 is available on the Fund’s website at wellsfargofunds.com or by visiting the SEC website at sec.gov.
PORTFOLIO HOLDINGS INFORMATION
The complete portfolio holdings for the Fund are publicly available monthly on the Fund’s website (wellsfargofunds.com), on a one-month delayed basis. In addition, top ten holdings information (excluding derivative positions) for the Fund is publicly available on the Fund’s website on a monthly, seven-day or more delayed basis. The Fund files its complete schedule of portfolio holdings with the SEC for the first and third quarters of each fiscal year on Form N-Q, which is available by visiting the SEC website at sec.gov. In addition, the Fund’s Form N-Q may be reviewed and copied at the SEC’s Public Reference Room in Washington, DC, and at regional offices in New York City, at 233 Broadway, and in Chicago, at 175 West Jackson Boulevard, Suite 900. Information about the Public Reference Room may be obtained by calling 1-800-SEC-0330.
| | | | | | |
| Other information (unaudited) | | Wells Fargo Low Volatility U.S. Equity Fund | | | 31 | |
BOARD OF TRUSTEES AND OFFICERS
Each of the Trustees and Officers1 listed in the table below acts in identical capacities for each fund in the Wells Fargo family of funds, which consists of 154 mutual funds comprising the Wells Fargo Funds Trust, Wells Fargo Variable Trust, Wells Fargo Master Trust and four closed-end funds (collectively the “Fund Complex”). This table should be read in conjunction with the Prospectus and the Statement of Additional Information2. The mailing address of each Trustee and Officer is 525 Market Street, 12th Floor, San Francisco, CA 94105. Each Trustee and Officer serves an indefinite term, however, each Trustee serves such term until reaching the mandatory retirement age established by the Trustees.
Independent Trustees
| | | | | | |
Name and
year of birth | | Position held and
length of service* | | Principal occupations during past five years or longer | | Current other
public company or
investment company
directorships |
William R. Ebsworth
(Born 1957) | | Trustee, since 2015 | | Retired. From 1984 to 2013, equities analyst, portfolio manager, research director and chief investment officer at Fidelity Management and Research Company in Boston, Tokyo, and Hong Kong, and retired in 2013 as Chief Investment Officer of Fidelity Strategic Advisers, Inc. where he led a team of investment professionals managing client assets. Prior thereto, Board member of Hong Kong Securities Clearing Co., Hong Kong Options Clearing Corp., the Thailand International Fund, Ltd., Fidelity Investments Life Insurance Company, and Empire Fidelity Investments Life Insurance Company. Board member of the Forté Foundation (non-profit organization) and the Vincent Memorial Hospital Endowment (non-profit organization), where he serves on the Investment Committee and as a Chair of the Audit Committee. Mr. Ebsworth is a CFA® charterholder. | | Asset Allocation Trust |
Jane A. Freeman
(Born 1953) | | Trustee, since 2015; Chair Liaison, since 2018 | | Retired. From 2012 to 2014 and 1999 to 2008, Chief Financial Officer of Scientific Learning Corporation. From 2008 to 2012, Ms. Freeman provided consulting services related to strategic business projects. Prior to 1999, Portfolio Manager at Rockefeller & Co. and Scudder, Stevens & Clark. Board member of the Harding Loevner Funds from 1996 to 2014, serving as both Lead Independent Director and chair of the Audit Committee. Board member of the Russell Exchange Traded Funds Trust from 2011 to 2012 and the chair of the Audit Committee. Ms. Freeman is a Board Member of Ruth Bancroft Garden (non-profit organization) and the Glimmerglass Festival. She is also an inactive Chartered Financial Analyst. | | Asset Allocation Trust |
Isaiah Harris, Jr.
(Born 1952) | | Trustee, since 2009 | | Retired. Chairman of the Board of CIGNA Corporation since 2009, and Director since 2005. From 2003 to 2011, Director of Deluxe Corporation. Prior thereto, President and CEO of BellSouth Advertising and Publishing Corp. from 2005 to 2007, President and CEO of BellSouth Enterprises from 2004 to 2005 and President of BellSouth Consumer Services from 2000 to 2003. Emeritus member of the Iowa State University Foundation Board of Governors. Emeritus Member of the Advisory Board of Iowa State University School of Business. Advisory Board Member, Palm Harbor Academy (charter school). Advisory Board Member, Child Evangelism Fellowship (non-profit). Mr. Harris is a certified public accountant (inactive status). | | CIGNA Corporation; Asset Allocation Trust |
Judith M. Johnson
(Born 1949) | | Trustee, since 2008; Audit Committee Chairman, since 2009 | | Retired. Prior thereto, Chief Executive Officer and Chief Investment Officer of Minneapolis Employees Retirement Fund from 1996 to 2008. Ms. Johnson is an attorney, certified public accountant and a certified managerial accountant. | | Asset Allocation Trust |
David F. Larcker
(Born 1950) | | Trustee, since 2009 | | James Irvin Miller Professor of Accounting at the Graduate School of Business, Stanford University, Director of the Corporate Governance Research Initiative and Senior Faculty of The Rock Center for Corporate Governance since 2006. From 2005 to 2008, Professor of Accounting at the Graduate School of Business, Stanford University. Prior thereto, Ernst & Young Professor of Accounting at The Wharton School, University of Pennsylvania from 1985 to 2005. | | Asset Allocation Trust |
| | | | |
| 32 | | Wells Fargo Low Volatility U.S. Equity Fund | | Other information (unaudited) |
| | | | | | |
Name and
year of birth | | Position held and
length of service* | | Principal occupations during past five years or longer | | Current other
public company or
investment company
directorships |
Olivia S. Mitchell
(Born 1953) | | Trustee, since 2006; Governance Committee Chairman, since 2018 | | International Foundation of Employee Benefit Plans Professor, Wharton School of the University of Pennsylvania since 1993. Director of Wharton’s Pension Research Council and Boettner Center on Pensions & Retirement Research, and Research Associate at the National Bureau of Economic Research. Previously, Cornell University Professor from 1978 to 1993. | | Asset Allocation Trust |
Timothy J. Penny
(Born 1951) | | Trustee, since 1996; Chairman, since 2018; Vice Chairman, from 2017 to 2018 | | President and Chief Executive Officer of Southern Minnesota Initiative Foundation, a non-profit organization, since 2007. Member of the Board of Trustees of NorthStar Education Finance, Inc., a non-profit organization, since 2007. | | Asset Allocation Trust |
James G. Polisson
(Born 1959) | | Trustee, since 2018; Advisory Board Member, from 2017 to 2018 | | Retired. Chief Marketing Officer, Source (ETF) UK Services, Ltd, from 2015 to 2017. From 2012 to 2015, Principal of The Polisson Group, LLC, a management consulting, corporate advisory and principal investing company. Chief Executive Officer and Managing Director at Russell Investments, Global Exchange Traded Funds from 2010 to 2012. Managing Director of Barclays Global Investors from 1998 to 2010 and Global Chief Marketing Officer for iShares and Barclays Global Investors from 2000 to 2010. Trustee of the San Francisco Mechanics’ Institute, a non-profit organization, from 2013 to 2015. Board member of the Russell Exchange Traded Fund Trust from 2011 to 2012. Director of Barclays Global Investors Holdings Deutschland GmbH from 2006 to 2009. Mr. Polisson is an attorney and has a retired status with the Massachusetts and District of Columbia Bar Associations. | | Asset Allocation Trust |
Michael S. Scofield
(Born 1943) | | Trustee, since 2010 | | Served on the Investment Company Institute’s Board of Governors and Executive Committee from 2008-2011 as well the Governing Council of the Independent Directors Council from 2006-2011 and the Independent Directors Council Executive Committee from 2008-2011. Trustee of the Evergreen Fund complex (and its predecessors) from 1984 to 2010. Chairman of the Evergreen Funds from 2000-2010. Former Trustee of the Mentor Funds. Retired Attorney, Law Offices of Michael S. Scofield. | | Asset Allocation Trust |
Pamela Wheelock
(Born 1959) | | Trustee, since 2018; Advisory Board Member, from 2017 to 2018 | | Chief Operating Officer, Twin Cities Habitat for Humanity, since January, 2017. Vice President of University Services, University of Minnesota from 2012 to 2017. Prior thereto, on the Board of Directors, Goverance Committee and Finance Committee for the Minnesota Philanthropy Partners (Saint Paul Foundation) from 2012 to 2018, Interim President and Chief Executive Officer of Blue Cross Blue shield of Minnesota of Minnesota from 2010 to 2011, Chairman of the Board from 2009 to 2011 and Board Director 003 to 2015. Vice President, Leadership and Community Engagement, Bush Foundation, Saint Paul, Minnesota (a private foundation) from 2009 to 2011. Executive Vice President and Chief Financial Officer, Minnesota Sports and Entertainment from 2004 to 2009 and Senior Vice President from 2002 to 2004. Commissioner of Finance, State of Minnesota, from 1999 to 2002. Currently the Board Chair of the Minnesota Wild Foundation since 2010. | | Asset Allocation Trust |
| * | Length of service dates reflect the Trustee’s commencement of service with the Trust’s predecessor entities, where applicable. |
| | | | | | |
| Other information (unaudited) | | Wells Fargo Low Volatility U.S. Equity Fund | | | 33 | |
Officers
| | | | | | |
Name and
year of birth | | Position held and
length of service | | Principal occupations during past five years or longer | | |
Andrew Owen
(Born 1960) | | President, since 2017 | | Executive Vice President of Wells Fargo & Company and Head of Affiliated Managers, Wells Fargo Asset Management, since 2014. In addition, Mr. Owen is currently President, Chief Executive Officer and Director of Wells Fargo Funds Management, LLC since 2017. Prior thereto, Executive Vice President responsible for marketing, investments and product development for Wells Fargo Funds Management, LLC, from 2009 to 2014. | | |
Jeremy DePalma1
(Born 1974) | | Treasurer, since 2012 | | Senior Vice President of Wells Fargo Funds Management, LLC since 2009. Senior Vice President of Evergreen Investment Management Company, LLC from 2008 to 2010 and head of the Fund Reporting and Control Team within Fund Administration from 2005 to 2010. | | |
Alexander Kymn3
(Born 1973) | | Secretary, since 2018; Chief Legal Officer, since 2018 | | Senior Company Counsel of Wells Fargo Bank, N.A. since 2018 (previously Senior Counsel from 2007 to 2018). Vice President of Wells Fargo Funds Management, LLC from 2008 to 2014. | | |
Michael H. Whitaker
(Born 1967) | | Chief Compliance Officer, since 2016 | | Senior Vice President and Chief Compliance Officer since 2016. Senior Vice President and Chief Compliance Officer for Fidelity Investments from 2007 to 2016. | | |
David Berardi
(Born 1975) | | Assistant Treasurer, since 2009 | | Vice President of Wells Fargo Funds Management, LLC since 2009. Vice President of Evergreen Investment Management Company, LLC from 2008 to 2010. Manager of Fund Reporting and Control for Evergreen Investment Management Company, LLC from 2004 to 2010. | | |
| 1 | Jeremy DePalma acts as Treasurer of 77 funds and Assistant Treasurer of 77 funds in the Fund Complex. |
| 2 | The Statement of Additional Information includes additional information about the Trustees and is available, without charge, upon request, by calling 1-800-222-8222 or by visiting the website at wellsfargofunds.com. |
| 3 | Alexander Kymn became the Secretary and Chief Legal Officer effective April 17, 2018. |
| | | | |
| 34 | | Wells Fargo Low Volatility U.S. Equity Fund | | Other information (unaudited) |
BOARD CONSIDERATION OF INVESTMENT MANAGEMENT AND SUB-ADVISORY AGREEMENTS:
Wells Fargo Low Volatility U.S. Equity Fund
Under the Investment Company Act of 1940 (the “1940 Act”), the Board of Trustees (the “Board”) of Wells Fargo Funds Trust (the “Trust”) must determine annually whether to approve the continuation of the Trust’s investment management and sub-advisory agreements. In this regard, at an in-person meeting held on May 22-23, 2018 (the “Meeting”), the Board, all the members of which have no direct or indirect interest in the investment management and sub-advisory agreements and are not “interested persons” of the Trust, as defined in the 1940 Act (the “Independent Trustees”), reviewed and approved for Wells Fargo Low Volatility U.S. Equity Fund (the “Fund”): (i) an investment management agreement (the “Management Agreement”) with Wells Fargo Funds Management, LLC (“Funds Management”); and (ii) an investment sub-advisory agreement (the “Sub-Advisory Agreement”) with Analytic Investors, LLC (the “Sub-Adviser”), an affiliate of Funds Management. The Management Agreement and the Sub-Advisory Agreement are collectively referred to as the “Advisory Agreements.”
At the Meeting, the Board considered the factors and reached the conclusions described below relating to the selection of Funds Management and the Sub-Adviser and the approval of the Advisory Agreements. Prior to the Meeting, including at an in-person meeting in April 2018, the Trustees conferred extensively among themselves and with representatives of Funds Management about these matters. Also, the Board has adopted a team-based approach, with each team consisting of a sub-set of Trustees, to assist the full Board in the discharge of its duties in reviewing investment performance and other matters throughout the year. The Independent Trustees were assisted in their evaluation of the Advisory Agreements by independent legal counsel, from whom they received separate legal advice and with whom they met separately.
In providing information to the Board, Funds Management and the Sub-Adviser were guided by a detailed set of requests for information submitted to them by independent legal counsel on behalf of the Independent Trustees at the start of the Board’s annual contract renewal process earlier in 2018. In considering and approving the Advisory Agreements, the Trustees considered the information they believed relevant, including but not limited to the information discussed below. The Board considered not only the specific information presented in connection with the Meeting, but also the knowledge gained over time through interaction with Funds Management and the Sub-Adviser about various topics. In this regard, the Board reviewed reports of Funds Management at each of its quarterly meetings, which included, among other things, portfolio reviews and investment performance reports. In addition, the Board and the teams mentioned above confer with portfolio managers at various times throughout the year. The Board did not identify any particular information or consideration that was all-important or controlling, and each individual Trustee may have attributed different weights to various factors.
After its deliberations, the Board unanimously approved the continuation of the Advisory Agreements for a one-year term and determined that the compensation payable to Funds Management and the Sub-Adviser under each of the Advisory Agreements was reasonable. The Board considered the approval of the Advisory Agreements for the Fund as part of its consideration of agreements for funds across the complex, but its approvals were made on a fund-by-fund basis. The following summarizes a number of important, but not necessarily all, factors considered by the Board in support of its approvals.
Nature, extent and quality of services
The Board received and considered various information regarding the nature, extent and quality of services provided to the Fund by Funds Management and the Sub-Adviser under the Advisory Agreements. This information included a description of the investment advisory services and Fund-level administrative services covered by the Management Agreement, as well as, among other things, a summary of the background and experience of senior management of Wells Fargo Asset Management (“WFAM”), of which Funds Management and the Sub-Adviser are a part, a summary of investments made in the business of WFAM, a summary of certain organizational and personnel changes involving Funds Management and the Sub-Adviser, and a description of Funds Management’s and the Sub-Adviser’s business continuity planning programs and of their approaches to data privacy and cybersecurity. The Board also considered the qualifications, background, tenure and responsibilities of each of the portfolio managers primarily responsible for the day-to-day portfolio management of the Fund.
The Board evaluated the ability of Funds Management and the Sub-Adviser to attract and retain qualified investment professionals, including research, advisory and supervisory personnel. The Board further considered the compliance programs and compliance records of Funds Management and the Sub-Adviser. In addition, the Board took into account the full range of services provided to the Fund by Funds Management and its affiliates.
Fund investment performance and expenses
The Board considered the investment performance results for the Fund over various time periods ended December 31, 2017. The Board considered these results in comparison to the investment performance of funds in a universe that was determined by
| | | | | | |
| Other information (unaudited) | | Wells Fargo Low Volatility U.S. Equity Fund | | | 35 | |
Broadridge Inc. (“Broadridge”) to be similar to the Fund (the “Universe”), and in comparison to the Fund’s benchmark index and to other comparative data. Broadridge is an independent provider of investment company data. The Board received a description of the methodology used by Broadridge to select the mutual funds in the performance Universe. The Board noted that the investment performance of the Fund (Administrator Class) was lower than the average investment performance of the Universe for the one-year period under review. The Board also noted that the investment performance of the Fund was lower than its benchmark index, the Russell 1000 Index, for the one-year period under review.
The Board received information concerning, and discussed factors contributing to, the underperformance of the Fund relative to the Universe and benchmark for the period identified above. The Board took note of the explanations for the relative underperformance during these periods, including with respect to investment decisions and market factors that affected the Fund’s investment performance. The Board also took note of the Fund’s short operating history.
The Board also received and considered information regarding the Fund’s net operating expense ratios and their various components, including actual management fees, custodian and other non-management fees, and Rule 12b-1 and non-Rule 12b-1 shareholder service fees. The Board considered these ratios in comparison to the median ratios of funds in class-specific expense groups that were determined by Broadridge to be similar to the Fund (the “Groups”). The Board received a description of the methodology used by Broadridge to select the mutual funds in the expense Groups and an explanation of how funds comprising expense groups and their expense ratios may vary from year-to-year. Based on the Broadridge reports, the Board noted that the net operating expense ratios of the Fund were lower than the median net operating expense ratios of the expense Groups for each share class. The Board noted that the net operating expense ratio caps for the Fund’s Class A, Class C, Administrator Class, Institutional Class and Class R6 would be reduced.
The Board took into account the Fund’s investment performance and expense information provided to it among the factors considered in deciding to re-approve the Advisory Agreements.
Investment management and sub-advisory fee rates
The Board reviewed and considered the contractual fee rates payable by the Fund to Funds Management under the Management Agreement, as well as the contractual fee rates payable by the Fund to Funds Management for class-level administrative services under a Class-Level Administration Agreement, which include, among other things, class-level transfer agency and sub-transfer agency costs (collectively, the “Management Rates”). The Board also reviewed and considered the contractual investment sub-advisory fee rates that are payable by Funds Management to the Sub-Adviser for investment sub-advisory services.
Among other information reviewed by the Board was a comparison of the Fund’s Management Rates with the average contractual investment management fee rates of funds in the expense Groups at a common asset level as well as transfer agency costs of the funds in the expense Groups. The Board noted that the Management Rates of the Fund were lower than the sum of these average rates for the Fund’s expense Groups for all share classes.
The Board also received and considered information about the portion of the total management fee that was retained by Funds Management after payment of the fee to the Sub-Adviser for sub-advisory services. In assessing the reasonableness of this amount, the Board received and evaluated information about the nature and extent of responsibilities retained and risks assumed by Funds Management and not delegated to or assumed by the Sub-Adviser, and about Funds Management’s on-going oversight services. Given the affiliation between Funds Management and the Sub-Adviser, the Board ascribed limited relevance to the allocation of fees between them.
The Board also received and considered information about the nature and extent of services offered and fee rates charged by Funds Management and the Sub-Adviser to other types of clients with investment strategies similar to those of the Fund. In this regard, the Board received information about the significantly greater scope of services, and compliance, reporting and other legal burdens and risks of managing mutual funds compared with those associated with managing assets of non-mutual fund clients such as institutional separate accounts.
Based on its consideration of the factors and information it deemed relevant, including those described here, the Board determined that the compensation payable to Funds Management under the Management Agreement and to the Sub-Adviser under the Sub-Advisory Agreement was reasonable.
Profitability
The Board received and considered information concerning the profitability of Funds Management, as well as the profitability of both WFAM and Wells Fargo & Co. (“Wells Fargo”) as a whole, from providing services to the Fund and the fund family as a whole. The Board noted that the Sub-Adviser’s profitability information with respect to providing services to the Fund was subsumed in the WFAM and Wells Fargo profitability analysis.
| | | | |
| 36 | | Wells Fargo Low Volatility U.S. Equity Fund | | Other information (unaudited) |
Funds Management reported on the methodologies and estimates used in calculating profitability, including a description of the methodology used to allocate certain expenses and recent enhancements made to the methodology. Among other things, the Board noted that the levels of profitability reported on a fund-by-fund basis varied widely, depending on factors such as the size and type of fund. Based on its review, the Board did not deem the profits reported by Funds Management, WFAM or Wells Fargo from services provided to the Fund to be at a level that would prevent it from approving the continuation of the Advisory Agreements.
Economies of scale
The Board considered the extent to which Funds Management may experience economies of scale in the provision of management services, and the extent to which scale benefits, if any, would be shared with shareholders. In particular, the Board noted the existence of breakpoints in the Fund’s management fee structure, which operate generally to reduce the Fund’s expense ratios as the Fund grows in size. It considered that, for a small fund or a fund that shrinks in size, breakpoints conversely can result in higher fee levels. The Board also considered that in addition to management fee breakpoints, competitive management fee rates set at the outset without regard to breakpoints and fee waiver and expense reimbursement arrangements, as well as investments in the business intended to enhance services available to Fund shareholders, are means of sharing potential economies of scale with shareholders of the Fund.
The Board concluded that the Fund’s fee and expense arrangements, including contractual breakpoints, constituted a reasonable approach to sharing potential economies of scale with the Fund and its shareholders.
Other benefits to Funds Management and the Sub-Adviser
The Board received and considered information regarding potential “fall-out” or ancillary benefits received by Funds Management and its affiliates, including the Sub-Adviser, as a result of their relationships with the Fund. Ancillary benefits could include, among others, benefits directly attributable to other relationships with the Fund and benefits potentially derived from an increase in Funds Management’s and the Sub-Adviser’s business as a result of their relationships with the Fund. The Board noted that various affiliates of Funds Management may receive distribution-related fees, shareholder servicing payments and sub-transfer agency fees in respect of shares sold or held through them and services provided.
The Board also reviewed information about soft dollar credits earned and utilized by the Sub-Adviser, fees earned by Funds Management from managing a private investment vehicle for the fund family’s securities lending collateral and commissions earned by an affiliated broker from portfolio transactions.
Based on its consideration of the factors and information it deemed relevant, including those described here, the Board did not find that any ancillary benefits received by Funds Management and its affiliates, including the Sub-Adviser, were unreasonable.
Conclusion
At the Meeting, after considering the above-described factors and based on its deliberations and its evaluation of the information described above, the Board unanimously approved the continuation of the Advisory Agreements for a one-year term and determined that the compensation payable to Funds Management and the Sub-Adviser under each of the Advisory Agreements was reasonable.
| | | | | | |
| Appendix A (unaudited) | | Wells Fargo Low Volatility U.S. Equity Fund | | | 37 | |
SALES CHARGE REDUCTIONS AND WAIVERS FOR CERTAIN INTERMEDIARIES
Ameriprise
Effective June 1, 2018, shareholders purchasing Fund shares through an Ameriprise Financial platform or account will be eligible only for the following Class A load waivers (front-end sales charge waivers), which may differ from those disclosed elsewhere in the Fund’s prospectus or Statement of Additional Information.
Front-end Sales Load Waivers on Class A Shares Available at Ameriprise Financial
| | • | | Employer-sponsored retirement plans (e.g., 401(k) plans, 457 plans, employer-sponsored 403(b) plans, profit sharing and money purchase pension plans and defined benefit plans). For purposes of this provision, employer-sponsored retirement plans do not include SEP IRAs, Simple IRAs or SAR-SEPs. |
| | • | | Shares purchased through an Ameriprise Financial investment advisory program (if an Advisory or similar share class for such investment advisory program is not available) |
| | • | | Shares purchased by third party investment advisors on behalf of their advisory clients through Ameriprise Financial’s platform (if an Advisory or similar share class for such investment advisory program is not available) |
| | • | | Shares purchased through reinvestment of distributions and dividend reinvestment when purchasing shares of the same Fund (but not any other fund within the same fund family) |
| | • | | Shares exchanged from Class C shares of the same fund in the month of or following the 10-year anniversary of the purchase date. To the extent that the Fund’s prospectus elsewhere provides for a waiver with respect to such shares following a shorter holding period, that waiver will apply to exchanges following such shorter period. To the extent that the Fund’s prospectus elsewhere provides for a waiver with respect to exchanges of Class C shares for load-waived shares, that waiver will also apply to such exchanges. |
| | • | | Employees and registered representatives of Ameriprise Financial or its affiliates and their immediate family members |
| | • | | Shares purchased by or through qualified accounts (including IRAs, Coverdell Education Savings Accounts, 401(k)s, 403(b) TSCAs subject to ERISA and defined benefit plans) that are held by a covered family member, defined as an Ameriprise financial advisor and/or the advisor’s spouse, advisor’s lineal ascendant (mother, father, grandmother, grandfather, great grandmother, great grandfather), advisor’s lineal descendant (son, step-son, daughter, step-daughter, grandson, granddaughter, great grandson, great granddaughter) or any spouse of a covered family member who is a lineal descendant |
| | • | | Shares purchased from the proceeds of redemptions within the same fund family, provided (1) the repurchase occurs within 90 days following the redemption, (2) the redemption and purchase occur in the same account, and (3) redeemed shares were subject to a front-end or deferred sales load (i.e. Rights of Reinstatement). Subject to the Fund’s policy regarding frequent purchases and redemptions of Fund shares, you may not be able to repurchase shares for the first 30 days after your redemption. |
Automatic Exchange of Class C Shares Available at Ameriprise Financial
| | • | | Class C shares will automatically exchange to Class A shares in the month of the 10-year anniversary of the purchase date. |
Merrill Lynch
Effective April 10, 2017, shareholders purchasing Fund shares through a Merrill Lynch platform or account will be eligible only for the following load waivers (front-end sales charge waivers and contingent deferred, or back-end, sales charge waivers) and discounts, which may differ from those disclosed elsewhere in the Fund’s prospectus or Statement of Additional Information.
Front-end Sales Load Waivers on Class A Shares available at Merrill Lynch
| | • | | Employer-sponsored retirement, deferred compensation and employee benefit plans (including health savings accounts) and trusts used to fund those plans, provided that the shares are not held in a commission-based brokerage account and shares are held for the benefit of the plan |
| | • | | Shares purchased by or through a 529 Plan |
| | • | | Shares purchased through a Merrill Lynch affiliated investment advisory program |
| | | | |
| 38 | | Wells Fargo Low Volatility U.S. Equity Fund | | Appendix A (unaudited) |
| | • | | Shares purchased by third party investment advisors on behalf of their advisory clients through Merrill Lynch’s platform |
| | • | | Shares of funds purchased through the Merrill Edge Self-Directed platform (if applicable) |
| | • | | Shares purchased through reinvestment of capital gains distributions and dividend reinvestment when purchasing shares of the same fund (but not any other fund within the fund family) |
| | • | | Shares exchanged from Class C (i.e. level-load) shares of the same fund in the month of or following the 10-year anniversary of the purchase date |
| | • | | Employees and registered representatives of Merrill Lynch or its affiliates and their family members, as defined by Merrill Lynch, which may differ from the definition of family member in the Fund’s prospectus. |
| | • | | Directors or Trustees of the Fund, and employees of the Fund’s investment adviser or any of its affiliates, as described in the Fund’s prospectus |
| | • | | Shares purchased from the proceeds of redemptions within the same fund family, provided (1) the repurchase occurs within 90 days following the redemption, (2) the redemption and purchase occur in the same account, and (3) redeemed shares were subject to a front-end or deferred sales load (known as Rights of Reinstatement). Subject to the Fund’s policy regarding frequent purchases and redemptions of Fund shares, you may not be able to repurchase shares for the first 30 days after your redemption. |
CDSC Waivers on A, B and C Shares available at Merrill Lynch
| | • | | Death or disability of the shareholder |
| | • | | Shares sold as part of a systematic withdrawal plan as described in the Fund’s prospectus |
| | • | | Return of excess contributions from an IRA Account |
| | • | | Shares sold as part of a required minimum distribution for IRA and retirement accounts due to the shareholder reaching age 70½ |
| | • | | Shares sold to pay Merrill Lynch fees but only if the transaction is initiated by Merrill Lynch |
| | • | | Shares acquired through a right of reinstatement |
| | • | | Shares held in retirement brokerage accounts, that are exchanged for a lower cost share class due to transfer to certain fee based accounts or platforms (applicable to A and C shares only) |
Front-end load Discounts Available at Merrill Lynch: Breakpoints, Rights of Accumulation & Letters of Intent
| | • | | Breakpoints as described in the Fund’s prospectus |
| | • | | Rights of Accumulation (ROA) which entitle shareholders to breakpoint discounts will be automatically calculated based on the aggregated holding of fund family assets held by accounts within the purchaser’s household at Merrill Lynch. Eligible fund family assets not held at Merrill Lynch may be included in the ROA calculation only if the shareholder notifies his or her financial advisor about such assets. |
| | • | | Letters of Intent (LOI) which allow for breakpoint discounts based on anticipated purchases within a fund family, through Merrill Lynch, over a 13-month period of time (if applicable) |
Morgan Stanley
Effective on or about July 1, 2018, shareholders purchasing Fund shares through a Morgan Stanley Wealth Management transactional brokerage account will be eligible only for the following Class A load waivers (front-end sales charge waivers), which may differ from and be more limited than those disclosed in the Fund’s prospectus or Statement of Additional Information.
Front-end Sales Load Waivers on Class A Shares Available at Morgan Stanley
| | • | | Employer-sponsored retirement plans (e.g., 401(k) plans, 457 plans, employer-sponsored 403(b) plans, profit sharing and money purchase pension plans and defined benefit plans). For purposes of this provision, employer-sponsored retirement plans do not include SEP IRAs, Simple IRAs, SAR-SEPs or Keogh plans. |
| | • | | Morgan Stanley employee and employee-related accounts according to Morgan Stanley’s account linking rules |
| | • | | Shares purchased through reinvestment of dividends and capital gains distributions when purchasing shares of the same fund |
| | • | | Shares purchased through a Morgan Stanley self-directed brokerage account |
| | | | | | |
| Appendix A (unaudited) | | Wells Fargo Low Volatility U.S. Equity Fund | | | 39 | |
| | • | | Class C (i.e., level-load) shares that are no longer subject to a contingent deferred sales charge and are exchanged to Class A shares of the same fund pursuant to Morgan Stanley Wealth Management’s share class exchange program. |
| | • | | Shares purchased from the proceeds of redemptions within the same fund family, provided (i) the repurchase occurs within 90 days following the redemption, (ii) the redemption and purchase occur in the same account, and (iii) redeemed shares were subject to a front-end or deferred sales charge. This waiver is subject to the Fund’s policy regarding frequent purchases and redemption of Fund shares, as discussed under “Account Information—Frequent Purchases and Redemptions of Fund Shares” in the Fund’s prospectus. |
This page is intentionally left blank.

For more information
More information about Wells Fargo Funds is available free upon request. To obtain literature, please write, email, visit the Fund’s website, or call:
Wells Fargo Funds
P.O. Box 219967
Kansas City, MO 64121-9967
Website: wellsfargofunds.com
Individual investors: 1-800-222-8222
Retail investment professionals: 1-888-877-9275
Institutional investment professionals: 1-866-765-0778
This report and the financial statements contained herein are submitted for the general information of the shareholders of the Fund. If this report is used for promotional purposes, distribution of the report must be accompanied or preceded by a current prospectus. Before investing, please consider the investment objectives, risks, charges, and expenses of the investment. For a current prospectus and, if available, a summary prospectus, containing this information, call 1-800-222-8222 or visit the Fund’s website at wellsfargofunds.com. Read the prospectus carefully before you invest or send money.
Wells Fargo Asset Management (WFAM) is the trade name for certain investment advisory/management firms owned by Wells Fargo & Company. These firms include but are not limited to Wells Capital Management Incorporated and Wells Fargo Funds Management, LLC. Certain products managed by WFAM entities are distributed by Wells Fargo Funds Distributor, LLC (a broker/dealer and Member FINRA).
This material is for general informational and educational purposes only and is NOT intended to provide investment advice or a recommendation of any kind—including a recommendation for any specific investment, strategy, or plan.
NOT FDIC INSURED ◾ NO BANK GUARANTEE ◾ MAY LOSE VALUE
© 2018 Wells Fargo Funds Management, LLC. All rights reserved.
| | |
 | | 314802 09-18 A270/AR270 07-18 |
Annual Report
July 31, 2018

Wells Fargo Omega Growth Fund


Reduce clutter. Save trees.
Sign up for electronic delivery of prospectuses and shareholder reports at wellsfargo.com/advantagedelivery
Contents
The views expressed and any forward-looking statements are as of July 31, 2018, unless otherwise noted, and are those of the Fund managers and/or Wells Fargo Funds Management, LLC. Discussions of individual securities, or the markets generally, or any Wells Fargo Fund are not intended as individual recommendations. Future events or results may vary significantly from those expressed in any forward-looking statements. The views expressed are subject to change at any time in response to changing circumstances in the market. Wells Fargo Funds Management, LLC and the Fund disclaim any obligation to publicly update or revise any views expressed or forward-looking statements.
NOT FDIC INSURED ◾ NO BANK GUARANTEE ◾ MAY LOSE VALUE
| | | | |
| 2 | | Wells Fargo Omega Growth Fund | | Letter to shareholders (unaudited) |

Andrew Owen
President
Wells Fargo Funds
After advancing during the summer and fall of 2017 in a roughly synchronized way, economic growth and stock markets globally diverged during the first seven months of 2018.
Dear Shareholder:
We are pleased to offer you this annual report for the Wells Fargo Omega Growth Fund for the 12-month period that ended July 31, 2018. After advancing during the summer and fall of 2017 in a roughly synchronized way, economic growth and stock markets globally diverged during the first seven months of 2018. For fixed-income investors, higher U.S. interest rates, rising inflation, and intensifying global geopolitical tensions tended to restrain taxable bond prices while high-yield and municipal bond investors generally enjoyed positive returns.
For the period, U.S. stocks, as measured by the S&P 500 Index,1 gained 16.24%, and international stocks, as measured by the MSCI ACWI ex USA Index (Net),2 added 5.94%. Emerging market stocks, as measured by the MSCI EM Index (Net),3 added 4.36%. In bond markets, the Bloomberg Barclays U.S. Aggregate Bond Index4 declined 0.80% while fixed-income investments outside the U.S. fell 0.27%, according to the Bloomberg Barclays Global Aggregate ex-USD Index.5 The Bloomberg Barclays Municipal Bond Index6 added 0.99%, and the ICE BofAML U.S. High Yield Index7 was up 2.49%.
Volatility increased as summer turned to fall in 2017, although data generally was favorable.
During the third quarter of 2017, investor expectations rose and fell amid shifting geopolitical tensions, particularly in Asia as North Korea’s nuclear aspirations and U.S./China trade rhetoric caused concerns. In the U.S., corporate earnings and consumer confidence improved. The U.S. Bureau of Economic Analysis reported that annualized U.S. gross domestic product (GDP) growth for the quarter was 2.8%. The rate of inflation was below the U.S. Federal Reserve’s (Fed’s) targets.
Economic momentum increased in Europe; the European Central Bank (ECB) held its rates steady at low levels and continued its quantitative easing bond-buying program with the goal of sparking economic activity. In emerging markets, many countries benefited from stronger currencies versus the U.S. dollar while commodity price increases benefited countries that rely on natural resources for exports.
| 1 | The S&P 500 Index consists of 500 stocks chosen for market size, liquidity, and industry group representation. It is a market-value-weighted index with each stock’s weight in the index proportionate to its market value. You cannot invest directly in an index. |
| 2 | The Morgan Stanley Capital International (MSCI) All Country World Index (ACWI) ex USA Index (Net) is a free-float-adjusted market-capitalization-weighted index that is designed to measure the equity market performance of developed markets, excluding the United States and Canada. Source: MSCI. MSCI makes no express or implied warranties or representations and shall have no liability whatsoever with respect to any MSCI data contained herein. The MSCI data may not be further redistributed or used as a basis for other indices or any securities or financial products. This report is not approved, reviewed, or produced by MSCI. You cannot invest directly in an index. |
| 3 | The MSCI Emerging Markets (EM) Index (Net) is a free-float-adjusted market-capitalization-weighted index that is designed to measure large- and mid-cap equity market performance of emerging markets. The MSCI EM Index (Net) consists of the following 24 emerging market country indices: Brazil, Chile, China, Colombia, Czech Republic, Egypt, Greece, Hungary, India, Indonesia, Korea, Malaysia, Mexico, Pakistan, Peru, the Philippines, Poland, Qatar, Russia, South Africa, Taiwan, Thailand, Turkey, and the United Arab Emirates. You cannot invest directly in an index. |
| 4 | The Bloomberg Barclays U.S. Aggregate Bond Index is a broad-based benchmark that measures the investment-grade, U.S. dollar-denominated, fixed-rate taxable bond market, including Treasuries, government-related and corporate securities, mortgage-backed securities (agency fixed-rate and hybrid adjustable-rate mortgage pass-throughs), asset-backed securities, and commercial mortgage-backed securities. You cannot invest directly in an index. |
| 5 | The Bloomberg Barclays Global Aggregate ex-USD Index is an unmanaged index that provides a broad-based measure of the global investment-grade fixed-income markets excluding the U.S. dollar-denominated debt market. You cannot invest directly in an index. |
| 6 | The Bloomberg Barclays Municipal Bond Index is an unmanaged index composed of long-term tax-exempt bonds with a minimum credit rating of Baa. You cannot invest directly in an index. |
| 7 | The ICE BofAML U.S. High Yield Index is a market-capitalization-weighted index of domestic and Yankee high-yield bonds. The index tracks the performance of high-yield securities traded in the U.S. bond market. You cannot invest directly in an index. Copyright 2018. ICE Data Indices, LLC. All rights reserved. |
| 8 | The Consumer Price Index For All Urban Consumers (CPI-U) measures the changes in the price of a basket of goods and services purchased by urban consumers. The urban consumer population is deemed by many as a better representative measure of the general public because most of the country’s population lives in highly populated areas, which represent close to 90% of the total population. You cannot invest directly in an index. |
| | | | | | |
| Letter to shareholders (unaudited) | | Wells Fargo Omega Growth Fund | | | 3 | |
The fourth quarter of 2017 was characterized by continued optimism in the U.S.
By the end of 2017, some observers were describing conditions as a Goldilocks economic scenario: synchronized global growth, low inflation, and healthy corporate earnings, all supported abroad by a weaker U.S. dollar.
U.S. stocks continued to rally during the fourth quarter of 2017, boosted by favorable company earnings and the potential for tax reform and industry deregulation. The Fed increased rates by 25 basis points (bps; 100 bps equal 1.00%) in December. The annualized GDP growth rate for the fourth quarter was 2.3%.
Internationally, the Bank of England (BoE) raised interest rates in November 2017 to 0.50%, the first increase in more than 10 years and a move up from the 0.25% rate put in place after the Brexit vote to leave the European Union in June 2016. The pound gained against other currencies. Meanwhile, the ECB and the Bank of Japan maintained interest rate policies and bond-buying programs intended to spur business activities and enhance the attractiveness of equity investments. The People’s Bank of China (PBOC) also continued policies that encouraged business investment. International equity markets, particularly emerging markets, continued to show strength.
Volatility reemerged during the first quarter of 2018 as economic signals were mixed.
The first quarter of 2018 began with stock market gains in January following U.S. tax reform that lowered rates for individuals and corporations and deregulation advanced in some economic sectors. Then, investor optimism was supplanted by several concerns. Trade tensions intensified, particularly between the U.S. and China. The U.S. threatened to impose tariffs on a broad range of imported products. Increasing interest rates and inflation also caused concern. During February 2018, the U.S. stock market endured a loss of more than 10% before recovering in March and April. The S&P 500 Index closed the first quarter with a negative return, the first negative quarterly return for the index since 2014.
The Fed increased the federal funds rate by 25 bps in March 2018 and the rate of inflation reached the Fed’s 2% target for the first time in a year. The unemployment rate fell to 4.1%. The third revision of first-quarter GDP growth by the U.S. Bureau of Economic Analysis released during June 2018 was lowered to 2.0%.
Overseas, investment market returns reversed the strong returns of 2017. After having gained 27.19% for the 12-month period that ended December 31, 2017, the MSCI ACWI ex USA Index (Net) fell 1.46% for the 7-month period that ended July 31, 2018. The U.S. dollar strengthened relative to local currencies, which served to restrain returns.
Global trade tensions escalated during the second quarter and into the third quarter of 2018.
Global trade tensions escalated as the second quarter of 2018 opened and equity markets fell in response before resuming upward momentum later in April. The U.S. government imposed tariffs on products and commodities imported from other markets in North America, Europe, and Asia. In retaliation, governments imposed tariffs on U.S. products and commodities. In addition, the U.S. pushed its North American neighbors to renegotiate the North American Free Trade Agreement, furthering trade tensions and investor uncertainty.
The CPI-U8 added 0.2% in May after a similar increase in April. On a year-over-year basis, the all-items index rose 2.8% for the 12 months that ended May 31, continuing its upward trend since the beginning of the year. The index for all items less food and energy rose 2.2% for the same 12-month period. Interest rates generally increased and the bond markets tended to decline.
During February 2018, the U.S. stock market endured a loss of more than 10% before recovering in March and April.
| | | | |
| 4 | | Wells Fargo Omega Growth Fund | | Letter to shareholders (unaudited) |
During June 2018, the Fed increased the federal funds rate by 25 bps. Investment markets began to anticipate two more rate increases in 2018. Long-term interest rates in the U.S. trended higher—rates on the 10-year and 30-year Treasury bonds moved from 2.46% and 2.81%, respectively, on January 1, 2018, to 2.96% and 3.08%, respectively, on July 31, 2018. While higher at the end of the period, rates were off their peak levels on May 17, 2018, of 3.11% and 3.25%, respectively. Investors became more aware of and concerned about the potential for an inverted yield curve—sometimes a recession signal—as short-term rates increased more quickly than long-term rates.
The unemployment rate fell to 3.9% in July after ticking up slightly in June from May’s 3.8% level, according to the U.S. Department of Labor. The annualized rate of GDP growth for the second quarter of 2018 was reported in July to be 4.1%, the highest level since the third quarter of 2014, according to the U.S. Bureau of Economic Analysis.
Internationally, the prospects for a smooth U.K. Brexit agreement was cast into doubt as members of Prime Minister Theresa May’s negotiating team resigned. Despite the uncertainty, the period closed with expectations that the BoE’s Monetary Policy Committee in July would announce an increase in its key interest rate to 0.75%, which it did in early August.
Meanwhile, central banks in Europe and Japan maintained low interest rates and accommodative monetary policies. Amid rising trade uncertainty, PBOC monetary policies shifted with cuts to reserve requirement ratios and implementation of supportive measures such as accelerated infrastructure spending and tax cuts for small and medium enterprises and for individuals. Nevertheless, a strengthening U.S. dollar and the tensions associated with trade policies remained headwinds for investors overseas.
Don’t let short-term uncertainty derail long-term investment goals.
Periods of investment uncertainty can present challenges, but experience has taught us that maintaining long-term investment goals can be an effective way to plan for the future. To help you create a sound strategy based on your personal goals and risk tolerance, Wells Fargo Funds offers more than 100 mutual funds spanning a wide range of asset classes and investment styles. Although diversification cannot guarantee an investment profit or prevent losses, we believe it can be an effective way to manage investment risk and potentially smooth out overall portfolio performance. We encourage investors to know their investments and to understand that appropriate levels of risk-taking may unlock opportunities.
Thank you for choosing to invest with Wells Fargo Funds. We appreciate your confidence in us and remain committed to helping you meet your financial needs.
Sincerely,

Andrew Owen
President
Wells Fargo Funds
| | | | | | |
| Letter to shareholders (unaudited) | | Wells Fargo Omega Growth Fund | | | 5 | |
Notice to shareholders
At a meeting held on August 14-15, 2018, the Board of Trustees of the Fund approved the following policy which will be effective on or about February 5, 2019:
Class C shares will convert automatically into Class A shares ten years after the initial date of purchase or, if you acquired your Class C shares through an exchange or conversion from another share class, ten years after the date you acquired your Class C shares. When Class C shares that you acquired through a purchase or exchange convert, any other Class C shares that you purchased with reinvested dividends and distributions also will convert into Class A shares on a pro rata basis. A shorter holding period may also apply depending on your intermediary. Please see “Appendix A—Sales Charge Reductions and Waivers for Certain Intermediaries” in the Fund’s prospectus or at the end of this report.
For further information about your Fund, contact your investment professional, visit our website at wellsfargofunds.com, or call us directly at 1-800-222-8222.
| | | | |
| 6 | | Wells Fargo Omega Growth Fund | | Performance highlights (unaudited) |
Investment objective
The Fund seeks long-term capital appreciation.
Manager
Wells Fargo Funds Management, LLC
Subadviser
Wells Capital Management Incorporated
Portfolio managers
Michael T. Smith, CFA®
Christopher J. Warner, CFA®
Average annual total returns (%) as of July 31, 20181
| | | | | | | | | | | | | | | | | | | | | | | | | | | | | | | | | | |
| | | | | Including sales charge | | | Excluding sales charge | | | Expense ratios2 (%) | |
| | | Inception date | | 1 year | | | 5 year | | | 10 year | | | 1 year | | | 5 year | | | 10 year | | | Gross | | | Net3 | |
| Class A (EKOAX) | | 4-29-1968 | | | 19.57 | | | | 12.19 | | | | 12.05 | | | | 26.86 | | | | 13.53 | | | | 12.72 | | | | 1.28 | | | | 1.28 | |
| Class C (EKOCX) | | 8-2-1993 | | | 24.88 | | | | 12.68 | | | | 11.87 | | | | 25.88 | | | | 12.68 | | | | 11.87 | | | | 2.03 | | | | 2.03 | |
| Class R (EKORX) | | 10-10-2003 | | | – | | | | – | | | | – | | | | 26.53 | | | | 13.24 | | | | 12.44 | | | | 1.53 | | | | 1.53 | |
| Administrator Class (EOMYX) | | 1-13-1997 | | | – | | | | – | | | | – | | | | 27.07 | | | | 13.77 | | | | 12.98 | | | | 1.20 | | | | 1.10 | |
| Institutional Class (EKONX) | | 7-30-2010 | | | – | | | | – | | | | – | | | | 27.39 | | | | 14.06 | | | | 13.21 | | | | 0.95 | | | | 0.85 | |
| Russell 3000® Growth Index4 | | – | | | – | | | | – | | | | – | | | | 22.86 | | | | 15.55 | | | | 12.27 | | | | – | | | | – | |
Figures quoted represent past performance, which is no guarantee of future results, and do not reflect taxes that a shareholder may pay on fund distributions or the redemption of fund shares. Investment return and principal value of an investment will fluctuate so that an investor’s shares, when redeemed, may be worth more or less than their original cost. Performance shown without sales charges would be lower if sales charges were reflected. Current performance may be lower or higher than the performance data quoted, which assumes the reinvestment of dividends and capital gains. Current month-end performance is available on the Fund’s website, wellsfargofunds.com.
Please keep in mind that high double-digit returns were primarily achieved during favorable market conditions. You should not expect that such favorable returns can be consistently achieved. A fund’s performance, especially for short time periods, should not be the sole factor in making your investment decision.
Index returns do not include transaction costs associated with buying and selling securities, any mutual fund fees or expenses, or any taxes. It is not possible to invest directly in an index.
For Class A shares, the maximum front-end sales charge is 5.75%. For Class C shares, the maximum contingent deferred sales charge is 1.00%. Performance including a contingent deferred sales charge assumes the sales charge for the corresponding time period. Class R, Administrator Class, and Institutional Class shares are sold without a front-end sales charge or contingent deferred sales charge.
Stock values fluctuate in response to the activities of individual companies and general market and economic conditions. Certain investment strategies tend to increase the total risk of an investment (relative to the broader market). The Fund is exposed to foreign investment risk and smaller-company securities risk. Consult the Fund’s prospectus for additional information on these and other risks.
Please see footnotes on page 7.
| | | | | | |
| Performance highlights (unaudited) | | Wells Fargo Omega Growth Fund | | | 7 | |
|
| Growth of $10,000 investment as of July 31, 20185 |
|
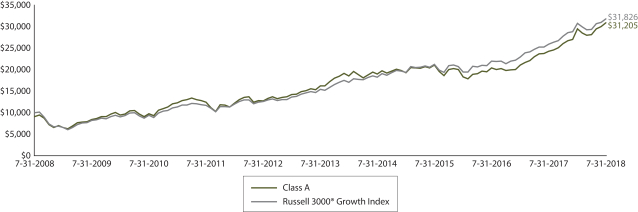
|
| 1 | Historical performance shown for Institutional Class shares prior to their inception reflects the performance of Administrator Class shares, and includes the higher expenses applicable to Administrator Class shares. If these expenses had not been included, returns for Institutional Class shares would be higher. Historical performance shown for all classes of the Fund prior to July 19, 2010, is based on the performance of the Fund’s predecessor, Evergreen Omega Fund. |
| 2 | Reflects the expense ratios as stated in the most recent prospectuses. The expense ratios shown are subject to change and may differ from the annualized expense ratios shown in the financial highlights of this report. |
| 3 | The manager has contractually committed through November 30, 2018, to waive fees and/or reimburse expenses to the extent necessary to cap the Fund’s Total Annual Fund Operating Expenses After Fee Waivers at 1.30% for Class A, 2.05% for Class C, 1.55% for Class R, 1.10% for Administrator Class, and 0.85% for Institutional Class. After this time, the cap may be increased or the commitment to maintain the cap may be terminated only with the approval of the Board of Trustees. Brokerage commissions, stamp duty fees, interest, taxes, acquired fund fees and expenses (if any), and extraordinary expenses are excluded from the expense cap. Without this cap, the Fund’s returns would have been lower. The expense ratio paid by an investor is the net expense ratio (the total annual fund operating expenses after fee waivers) as stated in the prospectuses. |
| 4 | The Russell 3000® Growth Index measures the performance of those Russell 3000® Index companies with higher price/book ratios and higher forecasted growth values. You cannot invest directly in an index. |
| 5 | The chart compares the performance of Class A shares for the most recent ten years with the Russell 3000® Growth Index. The chart assumes a hypothetical investment of $10,000 in Class A shares and reflects all operating expenses and assumes the maximum initial sales charge of 5.75%. |
| 6 | The ten largest holdings, excluding cash, cash equivalents and any money market funds, are calculated based on the value of the investments divided by total net assets of the Fund. Holdings are subject to change and may have changed since the date specified. |
| 7 | Amounts are calculated based on the total long-term investments of the Fund. These amounts are subject to change and may have changed since the date specified. |
| | | | |
| 8 | | Wells Fargo Omega Growth Fund | | Performance highlights (unaudited) |
MANAGER’S DISCUSSION
Fund highlights
| ∎ | | The Fund outperformed its benchmark, the Russell 3000® Growth Index, for the 12-month period that ended July 31, 2018. |
| ∎ | | Stock selection within the consumer discretionary and information technology (IT) sectors benefited performance. |
| ∎ | | Stock selection in the health care sector detracted from performance. |
For much of the past 12 months, bullish sentiment for U.S. equities was apparent as global growth was synchronized, corporate earnings were strong, widespread tax cuts had been passed, and deregulations were being enacted. More recently, however, a combination of crosscurrents from macro and geopolitical sources caused a downshift in growth expectations. The most significant change to outlooks came from markets outside the U.S. Arguably the biggest factor precipitating the downshift in growth came from concerns around global trade. The U.S. government expanded tariffs on goods from around the world, with a particular focus on China. This prompted retaliation from China and other trading partners, heightening fears of a possible trade war. These recent global developments highlighted a dynamic that we have long appreciated and incorporated into our portfolio positioning: true organic growth remains scarce and the firms that can make their own luck will be rewarded by investors.
| | | | |
| Ten largest holdings (%) as of July 31, 20186 | |
Amazon.com Incorporated | | | 6.49 | |
Microsoft Corporation | | | 6.40 | |
Visa Incorporated Class A | | | 4.04 | |
Alphabet Incorporated Class A | | | 3.93 | |
UnitedHealth Group Incorporated | | | 3.91 | |
First Data Corporation Class A | | | 2.53 | |
Waste Connections Incorporated | | | 2.29 | |
The Sherwin-Williams Company | | | 1.80 | |
Aptiv plc | | | 1.76 | |
Union Pacific Corporation | | | 1.73 | |
The Fund’s consumer discretionary and IT holdings contributed to relative performance.
Within the consumer discretionary sector, strength was visible among internet and direct-marketing retail holdings, and the portfolio management team’s security selection in this industry proved additive to returns. Shares of Amazon.com, Incorporated, appreciated over the past year as the company remains levered to powerful secular growth trends. Over the past 12 months, sales continued to accelerate while profits soared to a record level. The company also announced plans to increase the price of Amazon Prime subscriptions by 20%, while subscribers topped 100 million for the first time. Additionally, the company has made strategic acquisitions, such as Whole Foods Market, Incorporated. Amazon has continued to
benefit from the powerful shift to online retail spending, while Amazon Web Services (AWS) has become the dominant provider of cloud-computing services. AWS was the largest driver of profit gains during the year. We continue to be impressed with Amazon’s growing scale in a number of large market opportunities.
Within the IT sector, specific strength was visible in the IT services industry as shares of WEX Incorporated appreciated over the past year. WEX provides corporate payment solutions and has reported better-than-expected financial results across its business segments as well as raised earnings guidance over the past 12 months. The company’s fleet-management business, which accounts for the majority of company revenue, saw strong growth as WEX continues to take market share. WEX is the second-largest fuel card provider in the U.S. and, as such, typically benefits when gas prices rise, as they have over the past year. Additionally, the company has attracted new customers, as evidenced by an agreement to provide management services and fuel cards to Verizon Communications Incorporated’s 25,000-vehicle fleet. WEX’s other business segments, which provide payment solutions to online travel agencies such as Expedia, Incorporated, and payment processing for health savings accounts, also saw robust growth over the period. Finally, the recently passed tax-reform bill should provide for a meaningful reduction in the company’s effective tax rate. These factors contributed to the strength in WEX shares over the past year.
Please see footnotes on page 7.
| | | | | | |
| Performance highlights (unaudited) | | Wells Fargo Omega Growth Fund | | | 9 | |
|
| Sector distribution as of July 31, 20187 |
|
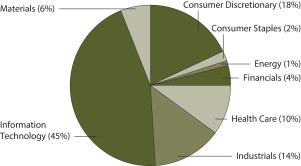 |
Stock selection in the health care sector detracted from relative performance.
Among the Fund’s health care holdings, Celgene Corporation detracted from performance. Celgene, a global biopharmaceutical company, has a strong franchise with several drugs, including Revlimid to treat multiple myeloma and Otezla to treat psoriasis. While Revlimid has been the largest contributor to the company’s recent success and expectations for growth of Revlimid remain on track, this blockbuster drug will come off patent by the middle of 2020. The company has been investing in several other drug development trials. Over the past 12 months, the stock came under pressure when
it was announced that the development of a drug to treat multiple sclerosis had its filing refused by the FDA. While Celgene intends to refile with additional data, the setback resulted in a downward revision to the company’s longer-term earnings profile.
Additionally within the health care sector, our position in Hologic, Incorporated, weighed on returns over the past year. Hologic is a medical device company that specializes in imaging, diagnostics, and gynecology surgical tools. The company, a leader in mammography, has developed a breast-imaging device that uses a new technology to produce a 3D image. This 3D screening test is the only one approved by the FDA and is considered superior to standard mammography. The stock came under pressure after the company missed revenue and earnings projections. The results were primarily the result of a slowdown in the surgical business. The other issue affecting Hologic over the past 12 months has been the company’s Cynosure business. Cynosure, which is a noninvasive body-contouring business, had been acquired by Hologic in an effort to diversify revenue sources. The integration of the acquisition has been slower than expected, prompting investor concern and weakness in the stock.
We remain somewhat cautious given geopolitical and macroeconomic uncertainties; however, we maintain confidence in the Fund’s positioning.
Looking broadly at financial markets through our lens of a bottom-up, fundamentally based investment process, we see ample reasons to maintain a cautious stance given potential factors such as trade wars, political instability, softness in China, and a hawkish U.S. Federal Reserve. We are, however, excited about companies held in the portfolio—those with organic growth and strategies that we believe are on the right side of change. Yet, with uncertainties on the rise, it may be prudent for investors to be mindful of downside risks and to moderate return expectations.
From a portfolio positioning standpoint, our strategy is to stay balanced. The portfolio includes a substantial allocation to stocks we consider to be core holdings, companies that we believe have consistent and durable fundamentals. These are businesses that our analysis suggests have profitable models, competitive advantages, and long runways of visible growth. On the other side, we own companies we consider to have idiosyncratic qualities. These are developing situations that our process finds to have unique drivers that are not yet clearly visible to other investors. These companies typically trade at reasonable valuations and, importantly, should buffer volatility if the market rotates out of momentum and high-beta factors. Finally, we are being very selective in the areas of our universe where valuations are approaching extremes, including certain cloud software, medical device, and biotechnology companies. The portfolio holds companies that we believe possess strong fundamentals and growth prospect, and yet it trades at a reasonable valuation profile. This is an attractive structure that has us excited to seek continued competitive performance for investors.
Please see footnotes on page 7.
| | | | |
| 10 | | Wells Fargo Omega Growth Fund | | Fund expenses (unaudited) |
As a shareholder of the Fund, you incur two types of costs: (1) transaction costs, including sales charges (loads) on purchase payments and contingent deferred sales charges (if any) on redemptions and (2) ongoing costs, including management fees, distribution (12b-1) and/or shareholder servicing fees, and other Fund expenses. This example is intended to help you understand your ongoing costs (in dollars) of investing in the Fund and to compare these costs with the ongoing costs of investing in other mutual funds.
The example is based on an investment of $1,000 invested at the beginning of the six-month period and held for the entire period from February 1, 2018 to July 31, 2018.
Actual expenses
The “Actual” line of the table below provides information about actual account values and actual expenses. You may use the information in this line, together with the amount you invested, to estimate the expenses that you paid over the period. Simply divide your account value by $1,000 (for example, an $8,600 account value divided by $1,000 = 8.6), then multiply the result by the number in the “Actual” line under the heading entitled “Expenses paid during period” for your applicable class of shares to estimate the expenses you paid on your account during this period.
Hypothetical example for comparison purposes
The “Hypothetical” line of the table below provides information about hypothetical account values and hypothetical expenses based on the Fund’s actual expense ratio and an assumed rate of return of 5% per year before expenses, which is not the Fund’s actual return. The hypothetical account values and expenses may not be used to estimate the actual ending account balance or expenses you paid for the period. You may use this information to compare the ongoing costs of investing in the Fund and other funds. To do so, compare this 5% hypothetical example with the 5% hypothetical examples that appear in the shareholder reports of the other funds.
Please note that the expenses shown in the table are meant to highlight your ongoing costs only and do not reflect any transactional costs, such as sales charges (loads) and contingent deferred sales charges. Therefore, the “Hypothetical” line of the table is useful in comparing ongoing costs only and will not help you determine the relative total costs of owning different funds. In addition, if these transactional costs were included, your costs would have been higher.
| | | | | | | | | | | | | | | | |
| | | Beginning
account value
2-1-2018 | | | Ending
account value
7-31-2018 | | | Expenses
paid during
the period¹ | | | Annualized net
expense ratio | |
Class A | | | | | | | | | | | | | | | | |
Actual | | $ | 1,000.00 | | | $ | 1,047.43 | | | $ | 6.59 | | | | 1.28 | % |
Hypothetical (5% return before expenses) | | $ | 1,000.00 | | | $ | 1,018.77 | | | $ | 6.50 | | | | 1.28 | % |
Class C | | | | | | | | | | | | | | | | |
Actual | | $ | 1,000.00 | | | $ | 1,043.36 | | | $ | 10.44 | | | | 2.03 | % |
Hypothetical (5% return before expenses) | | $ | 1,000.00 | | | $ | 1,014.99 | | | $ | 10.29 | | | | 2.03 | % |
Class R | | | | | | | | | | | | | | | | |
Actual | | $ | 1,000.00 | | | $ | 1,045.93 | | | $ | 7.87 | | | | 1.53 | % |
Hypothetical (5% return before expenses) | | $ | 1,000.00 | | | $ | 1,017.51 | | | $ | 7.76 | | | | 1.53 | % |
Administrator Class | | | | | | | | | | | | | | | | |
Actual | | $ | 1,000.00 | | | $ | 1,048.18 | | | $ | 5.68 | | | | 1.10 | % |
Hypothetical (5% return before expenses) | | $ | 1,000.00 | | | $ | 1,019.66 | | | $ | 5.60 | | | | 1.10 | % |
Institutional Class | | | | | | | | | | | | | | | | |
Actual | | $ | 1,000.00 | | | $ | 1,049.47 | | | $ | 4.39 | | | | 0.85 | % |
Hypothetical (5% return before expenses) | | $ | 1,000.00 | | | $ | 1,020.92 | | | $ | 4.33 | | | | 0.85 | % |
| 1 | Expenses paid is equal to the annualized net expense ratio of each class multiplied by the average account value over the period, multiplied by the number of days in the most recent fiscal half-year divided by the number of days in the fiscal year (to reflect the one-half-year period). |
| | | | | | |
| Portfolio of investments—July 31, 2018 | | Wells Fargo Omega Growth Fund | | | 11 | |
| | | | | | | | | | | | | | | | |
| Security name | | | | | | | | Shares | | | Value | |
| | | | |
Common Stocks: 99.31% | | | | | | | | | | | | | | | | |
| | | | |
Consumer Discretionary: 17.57% | | | | | | | | | | | | | | | | |
| | | | |
| Auto Components: 1.76% | | | | | | | | | | | | | | | | |
Aptiv plc | | | | | | | | | | | 147,200 | | | $ | 14,435,904 | |
| | | | | | | | | | | | | | | | |
| | | | |
| Automobiles: 0.76% | | | | | | | | | | | | | | | | |
Ferrari NV « | | | | | | | | | | | 47,100 | | | | 6,246,402 | |
| | | | | | | | | | | | | | | | |
| | | | |
| Diversified Consumer Services: 3.05% | | | | | | | | | | | | | | | | |
Adtalem Global Education Incorporated † | | | | | | | | | | | 229,500 | | | | 12,519,225 | |
Bright Horizons Family Solutions Incorporated † | | | | | | | | | | | 117,357 | | | | 12,556,025 | |
| | | | |
| | | | | | | | | | | | | | | 25,075,250 | |
| | | | | | | | | | | | | | | | |
| | | | |
| Hotels, Restaurants & Leisure: 2.37% | | | | | | | | | | | | | | | | |
Melco Crown Entertainment Limited ADR | | | | | | | | | | | 372,500 | | | | 9,632,850 | |
Vail Resorts Incorporated | | | | | | | | | | | 35,602 | | | | 9,857,126 | |
| | | | |
| | | | | | | | | | | | | | | 19,489,976 | |
| | | | | | | | | | | | | | | | |
| | | | |
| Internet & Direct Marketing Retail: 8.03% | | | | | | | | | | | | | | | | |
Amazon.com Incorporated † | | | | | | | | | | | 30,000 | | | | 53,323,200 | |
Netflix Incorporated † | | | | | | | | | | | 37,400 | | | | 12,620,630 | |
| | | | |
| | | | | | | | | | | | | | | 65,943,830 | |
| | | | | | | | | | | | | | | | |
| | | | |
| Specialty Retail: 1.60% | | | | | | | | | | | | | | | | |
The Home Depot Incorporated | | | | | | | | | | | 66,400 | | | | 13,115,328 | |
| | | | | | | | | | | | | | | | |
| | | | |
Consumer Staples: 1.54% | | | | | | | | | | | | | | | | |
| | | | |
| Food Products: 1.54% | | | | | | | | | | | | | | | | |
Lamb Weston Holdings Incorporated | | | | | | | | | | | 179,800 | | | | 12,634,546 | |
| | | | | | | | | | | | | | | | |
| | | | |
Energy: 0.72% | | | | | | | | | | | | | | | | |
| | | | |
| Oil, Gas & Consumable Fuels: 0.72% | | | | | | | | | | | | | | | | |
Pioneer Natural Resources Company | | | | | | | | | | | 31,100 | | | | 5,886,297 | |
| | | | | | | | | | | | | | | | |
| | | | |
Financials: 4.39% | | | | | | | | | | | | | | | | |
| | | | |
| Capital Markets: 3.07% | | | | | | | | | | | | | | | | |
Intercontinental Exchange Incorporated | | | | | | | | | | | 178,300 | | | | 13,178,153 | |
Raymond James Financial Incorporated | | | | | | | | | | | 131,402 | | | | 12,035,109 | |
| | | | |
| | | | | | | | | | | | | | | 25,213,262 | |
| | | | | | | | | | | | | | | | |
| | | | |
| Consumer Finance: 1.32% | | | | | | | | | | | | | | | | |
SLM Corporation † | | | | | | | | | | | 963,400 | | | | 10,876,786 | |
| | | | | | | | | | | | | | | | |
| | | | |
Health Care: 10.26% | | | | | | | | | | | | | | | | |
| | | | |
| Biotechnology: 1.81% | | | | | | | | | | | | | | | | |
Celgene Corporation † | | | | | | | | | | | 105,375 | | | | 9,493,234 | |
Exelixis Incorporated † | | | | | | | | | | | 261,500 | | | | 5,413,050 | |
| | | | |
| | | | | | | | | | | | | | | 14,906,284 | |
| | | | | | | | | | | | | | | | |
The accompanying notes are an integral part of these financial statements.
| | | | |
| 12 | | Wells Fargo Omega Growth Fund | | Portfolio of investments—July 31, 2018 |
| | | | | | | | | | | | | | | | |
| Security name | | | | | | | | Shares | | | Value | |
| | | | |
| Health Care Equipment & Supplies: 2.20% | | | | | | | | | | | | | | | | |
Baxter International Incorporated | | | | | | | | | | | 86,700 | | | $ | 6,281,415 | |
Edwards Lifesciences Corporation † | | | | | | | | | | | 53,500 | | | | 7,621,075 | |
Hologic Incorporated † | | | | | | | | | | | 96,900 | | | | 4,157,979 | |
| | | | |
| | | | | | | | | | | | | | | 18,060,469 | |
| | | | | | | | | | | | | | | | |
| | | | |
| Health Care Providers & Services: 4.69% | | | | | | | | | | | | | | | | |
Amedisys Incorporated † | | | | | | | | | | | 68,389 | | | | 6,403,262 | |
UnitedHealth Group Incorporated | | | | | | | | | | | 126,700 | | | | 32,082,974 | |
| | | | |
| | | | | | | | | | | | | | | 38,486,236 | |
| | | | | | | | | | | | | | | | |
| | | | |
| Life Sciences Tools & Services: 1.56% | | | | | | | | | | | | | | | | |
Illumina Incorporated † | | | | | | | | | | | 39,500 | | | | 12,812,220 | |
| | | | | | | | | | | | | | | | |
| | | | |
Industrials: 14.00% | | | | | | | | | | | | | | | | |
| | | | |
| Aerospace & Defense: 2.21% | | | | | | | | | | | | | | | | |
BWX Technologies Incorporated | | | | | | | | | | | 135,400 | | | | 8,903,904 | |
Mercury Computer Systems Incorporated † | | | | | | | | | | | 221,900 | | | | 9,259,887 | |
| | | | |
| | | | | | | | | | | | | | | 18,163,791 | |
| | | | | | | | | | | | | | | | |
| | | | |
| Commercial Services & Supplies: 3.99% | | | | | | | | | | | | | | | | |
Cintas Corporation | | | | | | | | | | | 68,400 | | | | 13,986,432 | |
Waste Connections Incorporated | | | | | | | | | | | 242,422 | | | | 18,814,371 | |
| | | | |
| | | | | | | | | | | | | | | 32,800,803 | |
| | | | | | | | | | | | | | | | |
| | | | |
| Electrical Equipment: 0.79% | | | | | | | | | | | | | | | | |
Rockwell Automation Incorporated | | | | | | | | | | | 34,700 | | | | 6,508,332 | |
| | | | | | | | | | | | | | | | |
| | | | |
| Machinery: 1.38% | | | | | | | | | | | | | | | | |
Evoqua Water Technologies Company † | | | | | | | | | | | 531,256 | | | | 11,337,003 | |
| | | | | | | | | | | | | | | | |
| | | | |
| Professional Services: 0.84% | | | | | | | | | | | | | | | | |
TransUnion | | | | | | | | | | | 94,735 | | | | 6,858,814 | |
| | | | | | | | | | | | | | | | |
| | | | |
| Road & Rail: 1.73% | | | | | | | | | | | | | | | | |
Union Pacific Corporation | | | | | | | | | | | 94,800 | | | | 14,209,572 | |
| | | | | | | | | | | | | | | | |
| | | | |
| Trading Companies & Distributors: 3.06% | | | | | | | | | | | | | | | | |
SiteOne Landscape Supply Incorporated Ǡ | | | | | | | | | | | 142,500 | | | | 12,705,300 | |
Univar Incorporated † | | | | | | | | | | | 452,228 | | | | 12,431,748 | |
| | | | |
| | | | | | | | | | | | | | | 25,137,048 | |
| | | | | | | | | | | | | | | | |
| | | | |
Information Technology: 44.94% | | | | | | | | | | | | | | | | |
| | | | |
| Electronic Equipment, Instruments & Components: 1.99% | | | | | | | | | | | | | | | | |
Littelfuse Incorporated | | | | | | | | | | | 29,300 | | | | 6,352,826 | |
Zebra Technologies Corporation Class A † | | | | | | | | | | | 72,600 | | | | 10,013,718 | |
| | | | |
| | | | | | | | | | | | | | | 16,366,544 | |
| | | | | | | | | | | | | | | | |
The accompanying notes are an integral part of these financial statements.
| | | | | | |
| Portfolio of investments—July 31, 2018 | | Wells Fargo Omega Growth Fund | | | 13 | |
| | | | | | | | | | | | | | | | |
| Security name | | | | | | | | Shares | | | Value | |
| | | | |
| Internet Software & Services: 10.88% | | | | | | | | | | | | | | | | |
Alibaba Group Holding Limited ADR † | | | | | | | | | | | 61,600 | | | $ | 11,533,368 | |
Alphabet Incorporated Class A † | | | | | | | | | | | 26,300 | | | | 32,275,886 | |
Alphabet Incorporated Class C † | | | | | | | | | | | 9,485 | | | | 11,545,711 | |
Facebook Incorporated Class A † | | | | | | | | | | | 40,600 | | | | 7,006,748 | |
MercadoLibre Incorporated | | | | | | | | | | | 33,900 | | | | 11,624,649 | |
Tencent Holdings Limited ADR | | | | | | | | | | | 200,300 | | | | 9,153,710 | |
Yandex NV Class A † | | | | | | | | | | | 171,500 | | | | 6,167,140 | |
| | | | |
| | | | | | | | | | | | | | | 89,307,212 | |
| | | | | | | | | | | | | | | | |
| | | | |
| IT Services: 16.03% | | | | | | | | | | | | | | | | |
Black Knight Incorporated † | | | | | | | | | | | 209,300 | | | | 10,810,345 | |
EPAM Systems Incorporated † | | | | | | | | | | | 95,041 | | | | 12,375,289 | |
Euronet Worldwide Incorporated † | | | | | | | | | | | 72,000 | | | | 6,619,680 | |
Fidelity National Information Services Incorporated | | | | | | | | | | | 68,800 | | | | 7,095,344 | |
First Data Corporation Class A † | | | | | | | | | | | 892,000 | | | | 20,747,920 | |
FleetCor Technologies Incorporated † | | | | | | | | | | | 32,900 | | | | 7,139,300 | |
Gartner Incorporated † | | | | | | | | | | | 65,600 | | | | 8,884,208 | |
PayPal Holdings Incorporated † | | | | | | | | | | | 54,500 | | | | 4,476,630 | |
Total System Services Incorporated | | | | | | | | | | | 81,000 | | | | 7,414,740 | |
Visa Incorporated Class A | | | | | | | | | | | 242,504 | | | | 33,159,997 | |
WEX Incorporated † | | | | | | | | | | | 68,002 | | | | 12,908,140 | |
| | | | |
| | | | | | | | | | | | | | | 131,631,593 | |
| | | | | | | | | | | | | | | | |
| | | | |
| Semiconductors & Semiconductor Equipment: 0.69% | | | | | | | | | | | | | | | | |
Infineon Technologies AG ADR | | | | | | | | | | | 212,800 | | | | 5,644,520 | |
| | | | | | | | | | | | | | | | |
| | | | |
| Software: 15.35% | | | | | | | | | | | | | | | | |
Activision Blizzard Incorporated | | | | | | | | | | | 113,000 | | | | 8,296,460 | |
Autodesk Incorporated † | | | | | | | | | | | 53,400 | | | | 6,858,696 | |
Microsoft Corporation | | | | | | | | | | | 495,200 | | | | 52,530,816 | |
Nintendo Company Limited | | | | | | | | | | | 203,738 | | | | 8,693,500 | |
Red Hat Incorporated † | | | | | | | | | | | 68,600 | | | | 9,688,378 | |
Salesforce.com Incorporated † | | | | | | | | | | | 102,800 | | | | 14,099,020 | |
ServiceNow Incorporated † | | | | | | | | | | | 44,100 | | | | 7,759,836 | |
Take-Two Interactive Software Incorporated † | | | | | | | | | | | 102,600 | | | | 11,595,852 | |
Ultimate Software Group Incorporated † | | | | | | | | | | | 23,700 | | | | 6,562,293 | |
| | | | |
| | | | | | | | | | | | | | | 126,084,851 | |
| | | | | | | | | | | | | | | | |
| | | | |
Materials: 5.57% | | | | | | | | | | | | | | | | |
| | | | |
| Chemicals: 4.21% | | | | | | | | | | | | | | | | |
Air Products & Chemicals Incorporated | | | | | | | | | | | 70,100 | | | | 11,508,317 | |
Albemarle Corporation | | | | | | | | | | | 87,600 | | | | 8,251,920 | |
The Sherwin-Williams Company | | | | | | | | | | | 33,600 | | | | 14,808,528 | |
| | | | |
| | | | | | | | | | | | | | | 34,568,765 | |
| | | | | | | | | | | | | | | | |
| | | | |
| Construction Materials: 1.36% | | | | | | | | | | | | | | | | |
Vulcan Materials Company | | | | | | | | | | | 99,800 | | | | 11,177,600 | |
| | | | | | | | | | | | | | | | |
The accompanying notes are an integral part of these financial statements.
| | | | |
| 14 | | Wells Fargo Omega Growth Fund | | Portfolio of investments—July 31, 2018 |
| | | | | | | | | | | | | | | | |
| Security name | | | | | | | | Shares | | | Value | |
| | | | |
Real Estate: 0.32% | | | | | | | | | | | | | | | | |
| | | | |
| Equity REITs: 0.32% | | | | | | | | | | | | | | | | |
SBA Communications Corporation † | | | | | | | | | | | 16,600 | | | $ | 2,626,950 | |
| | | | | | | | | | | | | | | | |
| | | | |
Total Common Stocks (Cost $524,690,984) | | | | | | | | | | | | | | | 815,606,188 | |
| | | | | | | | | | | | | | | | |
| | | | |
| | | Yield | | | | | | | | | | |
| Short-Term Investments: 1.48% | | | | | | | | | | | | | | | | |
| | | | |
| Investment Companies: 1.48% | | | | | | | | | | | | | | | | |
Securities Lending Cash Investment LLC (l)(r)(u) | | | 2.10 | % | | | | | | | 6,508,449 | | | | 6,509,100 | |
Wells Fargo Government Money Market Fund Select Class (l)(u) | | | 1.83 | | | | | | | | 5,594,599 | | | | 5,594,599 | |
| |
Total Short-Term Investments (Cost $12,103,699) | | | | 12,103,699 | |
| | | | | | | | | | | | | | | | |
| | | | | | | | |
| Total investments in securities (Cost $536,794,683) | | | 100.79 | % | | | 827,709,887 | |
Other assets and liabilities, net | | | (0.79 | ) | | | (6,458,871 | ) |
| | | | | | | | |
| Total net assets | | | 100.00 | % | | $ | 821,251,016 | |
| | | | | | | | |
| « | All or a portion of this security is on loan. |
| † | Non-income-earning security |
| (l) | The issuer of the security is an affiliated person of the Fund as defined in the Investment Company Act of 1940. |
| (r) | The investment is a non-registered investment company purchased with cash collateral received from securities on loan. |
| (u) | The rate represents the 7-day annualized yield at period end. |
Abbreviations:
| ADR | American depositary receipt |
| REIT | Real estate investment trust |
Investments in Affiliates
An affiliated investment is an investment in which the Fund owns at least 5% of the outstanding voting shares of the issuer or as a result of other relationships, such as the Fund and the issuer having the same investment manager. Transactions with issuers that were either affiliated persons of the Fund at the beginning of the period or the end of the period were as follows:
| | | | | | | | | | | | | | | | | | | | | | | | | | | | | | | | | | | | |
| | | Shares,
beginning of
period | | | Shares
purchased | | | Shares
sold | | | Shares,
end of
period | | | Net
realized
gains
(losses) | | | Net
change in
unrealized
gains
(losses) | | | Income
from
affiliated
securities | | | Value,
end
of period | | | % of
net
assets | |
Short-Term Investments | | | | | | | | | | | | | | | | | | | | | | | | | | | | | | | | | | | | |
Investment Companies | | | | | | | | | | | | | | | | | | | | | | | | | | | | | | | | | | | | |
Securities Lending Cash Investment LLC | | | 3,211,364 | | | | 198,547,677 | | | | 195,250,592 | | | | 6,508,449 | | | $ | 2 | | | $ | (1 | ) | | $ | 27,801 | | | $ | 6,509,100 | | | | | |
Wells Fargo Government Money Market Fund Select Class | | | 370,082 | | | | 165,268,372 | | | | 160,043,855 | | | | 5,594,599 | | | | 0 | | | | 0 | | | | 66,460 | | | | 5,594,599 | | | | | |
| | | | | | | | | | | | | | | | | | | | | | | | | | | | | | | | | | | | |
| | | | | | | | | | | | | | | | | | $ | 2 | | | $ | (1 | ) | | $ | 94,261 | | | $ | 12,103,699 | | | | 1.48 | % |
| | | | | | | | | | | | | | | | | | | | | | | | | | | | | | | | | | | | |
The accompanying notes are an integral part of these financial statements.
| | | | | | |
| Statement of assets and liabilities—July 31, 2018 | | Wells Fargo Omega Growth Fund | | | 15 | |
| | | | |
| | | | |
| |
Assets | | | | |
Investments in unaffiliated securities (including $6,489,822 of securities loaned), at value (cost $524,690,984) | | $ | 815,606,188 | |
Investments in affiliated securities, at value (cost $12,103,699) | | | 12,103,699 | |
Receivable for investments sold | | | 1,691,475 | |
Receivable for Fund shares sold | | | 234,228 | |
Receivable for dividends | | | 90,721 | |
Receivable for securities lending income | | | 435 | |
Prepaid expenses and other assets | | | 62,665 | |
| | | | |
Total assets | | | 829,789,411 | |
| | | | |
| |
Liabilities | | | | |
Payable upon receipt of securities loaned | | | 6,509,065 | |
Payable for Fund shares redeemed | | | 1,133,514 | |
Management fee payable | | | 532,493 | |
Administration fees payable | | | 141,371 | |
Distribution fees payable | | | 41,897 | |
Trustees’ fees and expenses payable | | | 1,481 | |
Accrued expenses and other liabilities | | | 178,574 | |
| | | | |
Total liabilities | | | 8,538,395 | |
| | | | |
Total net assets | | $ | 821,251,016 | |
| | | | |
| |
NET ASSETS CONSIST OF | | | | |
Paid-in capital | | $ | 455,796,831 | |
Accumulated net investment loss | | | (23,665 | ) |
Accumulated net realized gains on investments | | | 74,562,646 | |
Net unrealized gains on investments | | | 290,915,204 | |
| | | | |
Total net assets | | $ | 821,251,016 | |
| | | | |
| |
COMPUTATION OF NET ASSET VALUE AND OFFERING PRICE PER SHARE | | | | |
Net assets – Class A | | $ | 662,750,925 | |
Shares outstanding – Class A1 | | | 12,101,452 | |
Net asset value per share – Class A | | | $54.77 | |
Maximum offering price per share – Class A2 | | | $58.11 | |
Net assets – Class C | | $ | 62,074,076 | |
Shares outstanding – Class C1 | | | 1,632,577 | |
Net asset value per share – Class C | | | $38.02 | |
Net assets – Class R | | $ | 7,493,805 | |
Shares outstanding – Class R1 | | | 144,327 | |
Net asset value per share – Class R | | | $51.92 | |
Net assets – Administrator Class | | $ | 24,139,825 | |
Shares outstanding – Administrator Class1 | | | 406,429 | |
Net asset value per share – Administrator Class | | | $59.39 | |
Net assets – Institutional Class | | $ | 64,792,385 | |
Shares outstanding – Institutional Class1 | | | 1,060,420 | |
Net asset value per share – Institutional Class | | | $61.10 | |
| 1 | The Fund has an unlimited number of authorized shares. |
| 2 | Maximum offering price is computed as 100/94.25 of net asset value. On investments of $50,000 or more, the offering price is reduced. |
The accompanying notes are an integral part of these financial statements.
| | | | |
| 16 | | Wells Fargo Omega Growth Fund | | Statement of operations—year ended July 31, 2018 |
| | | | |
| | | | |
| |
Investment income | | | | |
Dividends (net of foreign withholding taxes of $38,018) | | $ | 4,951,573 | |
Income from affiliated securities | | | 94,261 | |
| | | | |
Total investment income | | | 5,045,834 | |
| | | | |
| |
Expenses | | | | |
Management fee | | | 6,073,170 | |
Administration fees | | | | |
Class A | | | 1,309,654 | |
Class C | | | 132,809 | |
Class R | | | 14,665 | |
Administrator Class | | | 27,595 | |
Institutional Class | | | 79,723 | |
Shareholder servicing fees | | | | |
Class A | | | 1,559,112 | |
Class C | | | 158,106 | |
Class R | | | 17,255 | |
Administrator Class | | | 53,068 | |
Distribution fees | | | | |
Class C | | | 474,317 | |
Class R | | | 17,458 | |
Custody and accounting fees | | | 42,417 | |
Professional fees | | | 52,177 | |
Registration fees | | | 79,578 | |
Shareholder report expenses | | | 64,769 | |
Trustees’ fees and expenses | | | 22,210 | |
Other fees and expenses | | | 18,760 | |
| | | | |
Total expenses | | | 10,196,843 | |
Less: Fee waivers and/or expense reimbursements | | | (87,516 | ) |
| | | | |
Net expenses | | | 10,109,327 | |
| | | | |
Net investment loss | | | (5,063,493 | ) |
| | | | |
| |
REALIZED AND UNREALIZED GAINS (LOSSES) ON INVESTMENTS | | | | |
| |
Net realized gains on: | | | | |
Unaffiliated securities | | | 102,987,064 | |
Affiliated securities | | | 2 | |
| | | | |
Net realized gains on investments | | | 102,987,066 | |
| | | | |
| |
Net change in unrealized gains (losses) on: | | | | |
Unaffiliated securities | | | 85,525,119 | |
Affiliated securities | | | (1 | ) |
| | | | |
Net change in unrealized gains (losses) on investments | | | 85,525,118 | |
| | | | |
Net realized and unrealized gains (losses) on investments | | | 188,512,184 | |
| | | | |
Net increase in net assets resulting from operations | | $ | 183,448,691 | |
| | | | |
The accompanying notes are an integral part of these financial statements.
| | | | | | |
| Statement of changes in net assets | | Wells Fargo Omega Growth Fund | | | 17 | |
| | | | | | | | | | | | | | | | |
| | | Year ended
July 31, 2018 | | | Year ended
July 31, 2017 | |
| | | |
Operations | | | | | | | | | | | | |
Net investment loss | | | | | | $ | (5,063,493 | ) | | | | | | $ | (3,775,501 | ) |
Net realized gains on investments | | | | | | | 102,987,066 | | | | | | | | 105,143,718 | |
Net change in unrealized gains (losses) on investments | | | | | | | 85,525,118 | | | | | | | | 20,481,932 | |
| | | | |
Net increase in net assets resulting from operations | | | | | | | 183,448,691 | | | | | | | | 121,850,149 | |
| | | | |
| | | |
Distributions to shareholders from | | | | | | | | | | | | |
Net realized gains | | | | | | | | | | | | | | | | |
Class A | | | | | | | (78,031,973 | ) | | | | | | | (14,517,010 | ) |
Class B | | | | | | | N/A | | | | | | | | (74,045 | )1 |
Class C | | | | | | | (10,985,719 | ) | | | | | | | (2,315,756 | ) |
Class R | | | | | | | (974,995 | ) | | | | | | | (182,366 | ) |
Administrator Class | | | | | | | (2,304,666 | ) | | | | | | | (492,743 | ) |
Institutional Class | | | | | | | (6,956,178 | ) | | | | | | | (1,888,610 | ) |
| | | | |
Total distributions to shareholders | | | | | | | (99,253,531 | ) | | | | | | | (19,470,530 | ) |
| | | | |
| | | | |
Capital share transactions | | | Shares | | | | | | | | Shares | | | | | |
Proceeds from shares sold | | | | | | | | | | | | | | | | |
Class A | | | 362,012 | | | | 18,469,654 | | | | 386,109 | | | | 17,173,940 | |
Class B | | | N/A | | | | N/A | | | | 11 | 1 | | | 310 | 1 |
Class C | | | 55,872 | | | | 2,013,265 | | | | 78,754 | | | | 2,557,877 | |
Class R | | | 59,297 | | | | 2,898,358 | | | | 32,485 | | | | 1,390,762 | |
Administrator Class | | | 59,693 | | | | 3,308,304 | | | | 29,254 | | | | 1,389,488 | |
Institutional Class | | | 204,162 | | | | 11,775,351 | | | | 660,341 | | | | 31,392,598 | |
| | | | |
| | | | | | | 38,464,932 | | | | | | | | 53,904,975 | |
| | | | |
Reinvestment of distributions | | | | | | | | | | | | | | | | |
Class A | | | 1,554,465 | | | | 74,101,364 | | | | 328,215 | | | | 13,634,032 | |
Class B | | | N/A | | | | N/A | | | | 2,395 | 1 | | | 73,511 | 1 |
Class C | | | 318,920 | | | | 10,604,105 | | | | 68,889 | | | | 2,121,773 | |
Class R | | | 11,375 | | | | 514,829 | | | | 1,939 | | | | 77,183 | |
Administrator Class | | | 39,989 | | | | 2,065,019 | | | | 10,178 | | | | 452,700 | |
Institutional Class | | | 123,732 | | | | 6,562,759 | | | | 40,190 | | | | 1,825,826 | |
| | | | |
| | | | | | | 93,848,076 | | | | | | | | 18,185,025 | |
| | | | |
Payment for shares redeemed | | | | | | | | | | | | | | | | |
Class A | | | (1,588,303 | ) | | | (81,411,378 | ) | | | (2,356,992 | ) | | | (103,241,366 | ) |
Class B | | | N/A | | | | N/A | | | | (111,214 | )1 | | | (3,587,613 | )1 |
Class C | | | (456,893 | ) | | | (16,729,771 | ) | | | (751,077 | ) | | | (24,503,753 | ) |
Class R | | | (59,515 | ) | | | (2,895,636 | ) | | | (147,893 | ) | | | (6,089,364 | ) |
Administrator Class | | | (66,020 | ) | | | (3,608,448 | ) | | | (500,001 | ) | | | (22,798,416 | ) |
Institutional Class | | | (429,386 | ) | | | (24,161,795 | ) | | | (1,192,233 | ) | | | (56,958,674 | ) |
| | | | |
| | | | | | | (128,807,028 | ) | | | | | | | (217,179,186 | ) |
| | | | |
Net increase (decrease) in net assets resulting from capital share transactions | | | | | | | 3,505,980 | | | | | | | | (145,089,186 | ) |
| | | | |
Total increase (decrease) in net assets | | | | | | | 87,701,140 | | | | | | | | (42,709,567 | ) |
| | | | |
| | |
Net assets | | | | | | | | |
Beginning of period | | | | | | | 733,549,876 | | | | | | | | 776,259,443 | |
| | | | |
End of period | | | | | | $ | 821,251,016 | | | | | | | $ | 733,549,876 | |
| | | | |
Accumulated net investment loss | | | | | | $ | (23,665 | ) | | | | | | $ | (2,688,066 | ) |
| | | | |
| 1 | For the period from August 1, 2016 to May 5, 2017. Effective at the close of business on May 5, 2017, Class B shares were converted to Class A shares and are no longer offered by the Fund. |
The accompanying notes are an integral part of these financial statements.
| | | | |
| 18 | | Wells Fargo Omega Growth Fund | | Financial highlights |
(For a share outstanding throughout each period)
| | | | | | | | | | | | | | | | | | | | |
| | | Year ended July 31 | |
| CLASS A | | 2018 | | | 2017 | | | 2016 | | | 2015 | | | 2014 | |
Net asset value, beginning of period | | | $49.43 | | | | $42.73 | | | | $48.29 | | | | $49.99 | | | | $47.97 | |
Net investment loss | | | (0.32 | )1 | | | (0.22 | )1 | | | (0.19 | )1 | | | (0.28 | )1 | | | (0.49 | ) |
Net realized and unrealized gains (losses) on investments | | | 12.57 | | | | 8.07 | | | | (1.44 | ) | | | 5.12 | | | | 8.28 | |
| | | | | | | | | | | | | | | | | | | | |
Total from investment operations | | | 12.25 | | | | 7.85 | | | | (1.63 | ) | | | 4.84 | | | | 7.79 | |
Distributions to shareholders from | | | | | | | | | | | | | | | | | | | | |
Net realized gains | | | (6.91 | ) | | | (1.15 | ) | | | (3.93 | ) | | | (6.54 | ) | | | (5.77 | ) |
Net asset value, end of period | | | $54.77 | | | | $49.43 | | | | $42.73 | | | | $48.29 | | | | $49.99 | |
Total return2 | | | 26.86 | % | | | 18.88 | % | | | (3.07 | )% | | | 10.65 | % | | | 16.58 | % |
Ratios to average net assets (annualized) | | | | | | | | | | | | | | | | | | | | |
Gross expenses | | | 1.28 | % | | | 1.28 | % | | | 1.28 | % | | | 1.32 | % | | | 1.32 | % |
Net expenses | | | 1.28 | % | | | 1.28 | % | | | 1.28 | % | | | 1.30 | % | | | 1.30 | % |
Net investment loss | | | (0.63 | )% | | | (0.50 | )% | | | (0.47 | )% | | | (0.58 | )% | | | (0.84 | )% |
Supplemental data | | | | | | | | | | | | | | | | | | | | |
Portfolio turnover rate | | | 48 | % | | | 76 | % | | | 84 | % | | | 94 | % | | | 101 | % |
Net assets, end of period (000s omitted) | | | $662,751 | | | | $581,967 | | | | $573,304 | | | | $685,005 | | | | $724,071 | |
| 1 | Calculated based upon average shares outstanding |
| 2 | Total return calculations do not include any sales charges. |
The accompanying notes are an integral part of these financial statements.
| | | | | | |
| Financial highlights | | Wells Fargo Omega Growth Fund | | | 19 | |
(For a share outstanding throughout each period)
| | | | | | | | | | | | | | | | | | | | |
| | | Year ended July 31 | |
| CLASS C | | 2018 | | | 2017 | | | 2016 | | | 2015 | | | 2014 | |
Net asset value, beginning of period | | | $36.47 | | | | $32.07 | | | | $37.55 | | | | $40.56 | | | | $40.15 | |
Net investment loss | | | (0.50 | )1 | | | (0.41 | )1 | | | (0.39 | )1 | | | (0.51 | )1 | | | (0.65 | )1 |
Net realized and unrealized gains (losses) on investments | | | 8.96 | | | | 5.96 | | | | (1.16 | ) | | | 4.04 | | | | 6.83 | |
| | | | | | | | | | | | | | | | | | | | |
Total from investment operations | | | 8.46 | | | | 5.55 | | | | (1.55 | ) | | | 3.53 | | | | 6.18 | |
Distributions to shareholders from | | | | | | | | | | | | | | | | | | | | |
Net realized gains | | | (6.91 | ) | | | (1.15 | ) | | | (3.93 | ) | | | (6.54 | ) | | | (5.77 | ) |
Net asset value, end of period | | | $38.02 | | | | $36.47 | | | | $32.07 | | | | $37.55 | | | | $40.56 | |
Total return2 | | | 25.88 | % | | | 18.00 | % | | | (3.75 | )% | | | 9.79 | % | | | 15.73 | % |
Ratios to average net assets (annualized) | | | | | | | | | | | | | | | | | | | | |
Gross expenses | | | 2.03 | % | | | 2.03 | % | | | 2.03 | % | | | 2.07 | % | | | 2.07 | % |
Net expenses | | | 2.03 | % | | | 2.03 | % | | | 2.03 | % | | | 2.05 | % | | | 2.05 | % |
Net investment loss | | | (1.38 | )% | | | (1.24 | )% | | | (1.22 | )% | | | (1.33 | )% | | | (1.59 | )% |
Supplemental data | | | | | | | | | | | | | | | | | | | | |
Portfolio turnover rate | | | 48 | % | | | 76 | % | | | 84 | % | | | 94 | % | | | 101 | % |
Net assets, end of period (000s omitted) | | | $62,074 | | | | $62,543 | | | | $74,337 | | | | $99,100 | | | | $108,073 | |
| 1 | Calculated based upon average shares outstanding |
| 2 | Total return calculations do not include any sales charges. |
The accompanying notes are an integral part of these financial statements.
| | | | |
| 20 | | Wells Fargo Omega Growth Fund | | Financial highlights |
(For a share outstanding throughout each period)
| | | | | | | | | | | | | | | | | | | | |
| | | Year ended July 31 | |
| CLASS R | | 2018 | | | 2017 | | | 2016 | | | 2015 | | | 2014 | |
Net asset value, beginning of period | | | $47.30 | | | | $41.04 | | | | $46.66 | | | | $48.62 | | | | $46.90 | |
Net investment loss | | | (0.43 | )1 | | | (0.30 | )1 | | | (0.29 | )1 | | | (0.39 | )1 | | | (0.53 | )1 |
Net realized and unrealized gains (losses) on investments | | | 11.96 | | | | 7.71 | | | | (1.40 | ) | | | 4.97 | | | | 8.02 | |
| | | | | | | | | | | | | | | | | | | | |
Total from investment operations | | | 11.53 | | | | 7.41 | | | | (1.69 | ) | | | 4.58 | | | | 7.49 | |
Distributions to shareholders from | | | | | | | | | | | | | | | | | | | | |
Net realized gains | | | (6.91 | ) | | | (1.15 | ) | | | (3.93 | ) | | | (6.54 | ) | | | (5.77 | ) |
Net asset value, end of period | | | $51.92 | | | | $47.30 | | | | $41.04 | | | | $46.66 | | | | $48.62 | |
Total return | | | 26.53 | % | | | 18.58 | % | | | (3.30 | )% | | | 10.38 | % | | | 16.30 | % |
Ratios to average net assets (annualized) | | | | | | | | | | | | | | | | | | | | |
Gross expenses | | | 1.53 | % | | | 1.53 | % | | | 1.53 | % | | | 1.57 | % | | | 1.57 | % |
Net expenses | | | 1.53 | % | | | 1.53 | % | | | 1.53 | % | | | 1.55 | % | | | 1.55 | % |
Net investment loss | | | (0.88 | )% | | | (0.72 | )% | | | (0.71 | )% | | | (0.83 | )% | | | (1.09 | )% |
Supplemental data | | | | | | | | | | | | | | | | | | | | |
Portfolio turnover rate | | | 48 | % | | | 76 | % | | | 84 | % | | | 94 | % | | | 101 | % |
Net assets, end of period (000s omitted) | | | $7,494 | | | | $6,298 | | | | $10,122 | | | | $17,199 | | | | $20,095 | |
| 1 | Calculated based upon average shares outstanding |
The accompanying notes are an integral part of these financial statements.
| | | | | | |
| Financial highlights | | Wells Fargo Omega Growth Fund | | | 21 | |
(For a share outstanding throughout each period)
| | | | | | | | | | | | | | | | | | | | |
| | | Year ended July 31 | |
| ADMINISTRATOR CLASS | | 2018 | | | 2017 | | | 2016 | | | 2015 | | | 2014 | |
Net asset value, beginning of period | | | $52.99 | | | | $45.65 | | | | $51.20 | | | | $52.50 | | | | $50.00 | |
Net investment loss | | | (0.25 | )1 | | | (0.12 | )1 | | | (0.12 | )1 | | | (0.17 | )1 | | | (0.31 | )1 |
Net realized and unrealized gains (losses) on investments | | | 13.56 | | | | 8.61 | | | | (1.50 | ) | | | 5.41 | | | | 8.58 | |
| | | | | | | | | | | | | | | | | | | | |
Total from investment operations | | | 13.31 | | | | 8.49 | | | | (1.62 | ) | | | 5.24 | | | | 8.27 | |
Distributions to shareholders from | | | | | | | | | | | | | | | | | | | | |
Net realized gains | | | (6.91 | ) | | | (1.15 | ) | | | (3.93 | ) | | | (6.54 | ) | | | (5.77 | ) |
Net asset value, end of period | | | $59.39 | | | | $52.99 | | | | $45.65 | | | | $51.20 | | | | $52.50 | |
Total return | | | 27.07 | % | | | 19.08 | % | | | (2.84 | )% | | | 10.91 | % | | | 16.89 | % |
Ratios to average net assets (annualized) | | | | | | | | | | | | | | | | | | | | |
Gross expenses | | | 1.20 | % | | | 1.20 | % | | | 1.19 | % | | | 1.15 | % | | | 1.15 | % |
Net expenses | | | 1.10 | % | | | 1.10 | % | | | 1.08 | % | | | 1.05 | % | | | 1.05 | % |
Net investment loss | | | (0.45 | )% | | | (0.25 | )% | | | (0.27 | )% | | | (0.33 | )% | | | (0.59 | )% |
Supplemental data | | | | | | | | | | | | | | | | | | | | |
Portfolio turnover rate | | | 48 | % | | | 76 | % | | | 84 | % | | | 94 | % | | | 101 | % |
Net assets, end of period (000s omitted) | | | $24,140 | | | | $19,754 | | | | $38,039 | | | | $86,756 | | | | $115,281 | |
| 1 | Calculated based upon average shares outstanding |
The accompanying notes are an integral part of these financial statements.
| | | | |
| 22 | | Wells Fargo Omega Growth Fund | | Financial highlights |
(For a share outstanding throughout each period)
| | | | | | | | | | | | | | | | | | | | |
| | | Year ended July 31 | |
| INSTITUTIONAL CLASS | | 2018 | | | 2017 | | | 2016 | | | 2015 | | | 2014 | |
Net asset value, beginning of period | | | $54.21 | | | | $46.55 | | | | $52.01 | | | | $53.10 | | | | $50.40 | |
Net investment loss | | | (0.11 | )1 | | | (0.03 | )1 | | | (0.00 | )2 | | | (0.04 | )1 | | | (0.24 | ) |
Net realized and unrealized gains (losses) on investments | | | 13.91 | | | | 8.84 | | | | (1.53 | ) | | | 5.49 | | | | 8.71 | |
| | | | | | | | | | | | | | | | | | | | |
Total from investment operations | | | 13.80 | | | | 8.81 | | | | (1.53 | ) | | | 5.45 | | | | 8.47 | |
Distributions to shareholders from | | | | | | | | | | | | | | | | | | | | |
Net realized gains | | | (6.91 | ) | | | (1.15 | ) | | | (3.93 | ) | | | (6.54 | ) | | | (5.77 | ) |
Net asset value, end of period | | | $61.10 | | | | $54.21 | | | | $46.55 | | | | $52.01 | | | | $53.10 | |
Total return | | | 27.39 | % | | | 19.40 | % | | | (2.61 | )% | | | 11.20 | % | | | 17.17 | % |
Ratios to average net assets (annualized) | | | | | | | | | | | | | | | | | | | | |
Gross expenses | | | 0.95 | % | | | 0.95 | % | | | 0.95 | % | | | 0.90 | % | | | 0.89 | % |
Net expenses | | | 0.85 | % | | | 0.85 | % | | | 0.83 | % | | | 0.80 | % | | | 0.80 | % |
Net investment loss | | | (0.20 | )% | | | (0.06 | )% | | | (0.01 | )% | | | (0.09 | )% | | | (0.36 | )% |
Supplemental data | | | | | | | | | | | | | | | | | | | | |
Portfolio turnover rate | | | 48 | % | | | 76 | % | | | 84 | % | | | 94 | % | | | 101 | % |
Net assets, end of period (000s omitted) | | | $64,792 | | | | $62,987 | | | | $76,980 | | | | $87,085 | | | | $49,960 | |
| 1 | Calculated based upon average shares outstanding |
| 2 | Amount is less than $0.005. |
The accompanying notes are an integral part of these financial statements.
| | | | | | |
| Notes to financial statements | | Wells Fargo Omega Growth Fund | | | 23 | |
1. ORGANIZATION
Wells Fargo Funds Trust (the “Trust”), a Delaware statutory trust organized on March 10, 1999, is an open-end management investment company registered under the Investment Company Act of 1940, as amended (the “1940 Act”). As an investment company, the Trust follows the accounting and reporting guidance in Financial Accounting Standards Board Accounting Standards Codification Topic 946, Financial Services – Investment Companies. These financial statements report on the Wells Fargo Omega Growth Fund (the “Fund”) which is a diversified series of the Trust.
Effective at the close of business on May 5, 2017, Class B shares were converted to Class A shares and are no longer offered by the Fund. Information for Class B shares reflected in the financial statements represents activity through May 5, 2017.
2. SIGNIFICANT ACCOUNTING POLICIES
The following significant accounting policies, which are consistently followed in the preparation of the financial statements of the Fund, are in conformity with U.S. generally accepted accounting principles which require management to make estimates and assumptions that affect the reported amounts of assets and liabilities, disclosure of contingent assets and liabilities at the date of the financial statements, and the reported amounts of revenues and expenses during the reporting period. Actual results could differ from those estimates.
Securities valuation
All investments are valued each business day as of the close of regular trading on the New York Stock Exchange (generally 4 p.m. Eastern Time), although the Fund may deviate from this calculation time under unusual or unexpected circumstances.
Equity securities that are listed on a foreign or domestic exchange or market are valued at the official closing price or, if none, the last sales price. If no sale occurs on the principal exchange or market that day, a fair value price will be determined in accordance with the Fund’s Valuation Procedures.
Investments in registered open-end investment companies are valued at net asset value. Interests in non-registered investment companies that are redeemable at net asset value are fair valued normally at net asset value.
Investments which are not valued using any of the methods discussed above are valued at their fair value, as determined in good faith by the Board of Trustees of the Fund. The Board of Trustees has established a Valuation Committee comprised of the Trustees and has delegated to it the authority to take any actions regarding the valuation of portfolio securities that the Valuation Committee deems necessary or appropriate, including determining the fair value of portfolio securities, unless the determination has been delegated to the Wells Fargo Asset Management Pricing Committee at Wells Fargo Funds Management, LLC (“Funds Management”). The Board of Trustees retains the authority to make or ratify any valuation decisions or approve any changes to the Valuation Procedures as it deems appropriate. On a quarterly basis, the Board of Trustees receives reports on any valuation actions taken by the Valuation Committee or the Wells Fargo Asset Management Pricing Committee which may include items for ratification.
Valuations of fair valued securities are compared to the next actual sales price when available, or other appropriate market values, to assess the continued appropriateness of the fair valuation methodologies used. These securities are fair valued on a day-to-day basis, taking into consideration changes to appropriate market information and any significant changes to the inputs considered in the valuation process until there is a readily available price provided on an exchange or by an independent pricing service. Valuations received from an independent pricing service or independent broker-dealer quotes are periodically validated by comparisons to most recent trades and valuations provided by other independent pricing services in addition to the review of prices by the manager and/or subadviser. Unobservable inputs used in determining fair valuations are identified based on the type of security, taking into consideration factors utilized by market participants in valuing the investment, knowledge about the issuer and the current market environment.
Foreign currency translation
The accounting records of the Fund are maintained in U.S. dollars. The values of other assets and liabilities denominated in foreign currencies are translated into U.S. dollars at rates provided by an independent foreign currency pricing source at a time each business day specified by the Wells Fargo Asset Management Pricing Committee. Purchases and sales of securities, and income and expenses are converted at the rate of exchange on the respective dates of such transactions. Net realized foreign exchange gains or losses arise from sales of foreign currencies, currency gains or losses realized between the trade and settlement dates on securities transactions, and the difference between the amounts of dividends, interest and foreign withholding taxes recorded and the U.S. dollar equivalent of the amounts actually paid or received. Net unrealized foreign exchange gains and losses arise from changes in the fair value of assets and liabilities other than investments in securities resulting from changes in exchange rates. The changes in net assets arising from changes in exchange rates of securities and the changes in net assets resulting from changes in market prices of securities are not separately presented. Such changes are included in net realized and unrealized gains or losses from investments.
| | | | |
| 24 | | Wells Fargo Omega Growth Fund | | Notes to financial statements |
Security lending
The Fund may lend its securities from time to time in order to earn additional income in the form of fees or interest on securities received as collateral or the investment of any cash received as collateral. The Fund continues to receive interest or dividends on the securities loaned. The Fund receives collateral in the form of cash or securities with a value at least equal to the value of the securities on loan. The value of the loaned securities is determined at the close of each business day and any additional required collateral is delivered to the Fund on the next business day. In a securities lending transaction, the net asset value of the Fund will be affected by an increase or decrease in the value of the securities loaned and by an increase or decrease in the value of the instrument in which collateral is invested. The amount of securities lending activity undertaken by the Fund fluctuates from time to time. In the event of default or bankruptcy by the borrower, the Fund may be prevented from recovering the loaned securities or gaining access to the collateral or may experience delays or costs in doing so. In addition, the investment of any cash collateral received may lose all or part of its value. The Fund has the right under the lending agreement to recover the securities from the borrower on demand.
The Fund lends its securities through an unaffiliated securities lending agent. Cash collateral received in connection with its securities lending transactions is invested in Securities Lending Cash Investments, LLC (the “Securities Lending Fund”). The Securities Lending Fund is exempt from registration under Section 3(c)(7) of the 1940 Act and is managed by Funds Management and is subadvised by Wells Capital Management Incorporated (“WellsCap”), an affiliate of Funds Management and an indirect wholly owned subsidiary of Wells Fargo & Company (“Wells Fargo”). Funds Management receives an advisory fee starting at 0.05% and declining to 0.01% as the average daily net assets of the Securities Lending Fund increase. All of the fees received by Funds Management are paid to WellsCap for its services as subadviser. The Securities Lending Fund seeks to provide a positive return compared to the daily Fed Funds Open Rate by investing in high-quality, U.S. dollar-denominated short-term money market instruments. Securities Lending Fund investments are valued at the evaluated bid price provided by an independent pricing service. Income earned from investment in the Securities Lending Fund, if any, is included in income from affiliated securities on the Statement of Operations.
Security transactions and income recognition
Securities transactions are recorded on a trade date basis. Realized gains or losses are recorded on the basis of identified cost.
Dividend income is recognized on the ex-dividend date. Dividend income is recorded net of foreign taxes withheld where recovery of such taxes is not assured.
Distributions to shareholders
Distributions to shareholders from net investment income and any net realized gains are recorded on the ex-dividend date and paid at least annually. Such distributions are determined in accordance with income tax regulations and may differ from U.S. generally accepted accounting principles. Dividend sources are estimated at the time of declaration. The tax character of distributions is determined as of the Fund’s fiscal year end. Therefore, a portion of the Fund’s distributions made prior to the Fund’s fiscal year end may be categorized as a tax return of capital at year end.
Federal and other taxes
The Fund intends to continue to qualify as a regulated investment company by distributing substantially all of its investment company taxable income and any net realized capital gains (after reduction for capital loss carryforwards) sufficient to relieve it from all, or substantially all, federal income taxes. Accordingly, no provision for federal income taxes was required.
The Fund’s income and federal excise tax returns and all financial records supporting those returns for the prior three fiscal years are subject to examination by the federal and Delaware revenue authorities. Management has analyzed the Fund’s tax positions taken on federal, state, and foreign tax returns for all open tax years and does not believe that there are any uncertain tax positions that require recognition of a tax liability.
As of July 31, 2018, the aggregate cost of all investments for federal income tax purposes was $537,584,459 and the unrealized gains (losses) consisted of:
| | | | |
Gross unrealized gains | | $ | 298,407,596 | |
Gross unrealized losses | | | (8,282,168 | ) |
Net unrealized gains | | $ | 290,125,428 | |
Reclassifications are made to the Fund’s capital accounts for permanent tax differences to reflect income and gains available for distribution (or available capital loss carryforwards) under federal income tax regulations. U.S. generally accepted accounting principles require that certain components of net assets be adjusted to reflect permanent differences between
| | | | | | |
| Notes to financial statements | | Wells Fargo Omega Growth Fund | | | 25 | |
financial and tax reporting. These reclassifications have no effect on net assets or net asset values per share. The primary permanent difference causing such reclassification is due to net operating losses. At July 31, 2018, as a result of permanent book-to-tax differences, the following reclassification adjustments were made on the Statement of Assets and Liabilities:
| | |
Accumulated net
investment loss | | Accumulated net
realized gains
on investments |
| $7,727,894 | | $(7,727,894) |
Class allocations
The separate classes of shares offered by the Fund differ principally in applicable sales charges, distribution, shareholder servicing, and administration fees. Class specific expenses are charged directly to that share class. Investment income, common expenses, and realized and unrealized gains (losses) on investments are allocated daily to each class of shares based on the relative proportion of net assets of each class.
3. FAIR VALUATION MEASUREMENTS
Fair value measurements of investments are determined within a framework that has established a fair value hierarchy based upon the various data inputs utilized in determining the value of the Fund’s investments. The three-level hierarchy gives the highest priority to unadjusted quoted prices in active markets for identical assets or liabilities (Level 1) and the lowest priority to unobservable inputs (Level 3). The Fund’s investments are classified within the fair value hierarchy based on the lowest level of input that is significant to the fair value measurement. The inputs are summarized into three broad levels as follows:
| ∎ | | Level 1 – quoted prices in active markets for identical securities |
| ∎ | | Level 2 – other significant observable inputs (including quoted prices for similar securities, interest rates, prepayment speeds, credit risk, etc.) |
| ∎ | | Level 3 – significant unobservable inputs (including the Fund’s own assumptions in determining the fair value of investments) |
The inputs or methodologies used for valuing investments in securities are not necessarily an indication of the risk associated with investing in those securities.
The following is a summary of the inputs used in valuing the Fund’s assets and liabilities as of July 31, 2018:
| | | | | | | | | | | | | | | | |
| | | Quoted prices
(Level 1) | | | Other significant
observable inputs
(Level 2) | | | Significant
unobservable inputs (Level 3) | | | Total | |
Assets | | | | | | | | | | | | | | | | |
Investments in: | | | | | | | | | | | | | | | | |
| | | | |
Common stocks | | | | | | | | | | | | | | | | |
Consumer discretionary | | $ | 144,306,690 | | | $ | 0 | | | $ | 0 | | | $ | 144,306,690 | |
Consumer staples | | | 12,634,546 | | | | 0 | | | | 0 | | | | 12,634,546 | |
Energy | | | 5,886,297 | | | | 0 | | | | 0 | | | | 5,886,297 | |
Financials | | | 36,090,048 | | | | 0 | | | | 0 | | | | 36,090,048 | |
Health care | | | 84,265,209 | | | | 0 | | | | 0 | | | | 84,265,209 | |
Industrials | | | 115,015,363 | | | | 0 | | | | 0 | | | | 115,015,363 | |
Information technology | | | 369,034,720 | | | | 0 | | | | 0 | | | | 369,034,720 | |
Materials | | | 45,746,365 | | | | 0 | | | | 0 | | | | 45,746,365 | |
Real estate | | | 2,626,950 | | | | 0 | | | | 0 | | | | 2,626,950 | |
| | | | |
Short-term investments | | | | | | | | | | | | | | | | |
Investment companies | | | 5,594,599 | | | | 0 | | | | 0 | | | | 5,594,599 | |
Investments measured at net asset value* | | | | | | | | | | | | | | | 6,509,100 | |
Total assets | | $ | 821,200,787 | | | $ | 0 | | | $ | 0 | | | $ | 827,709,887 | |
| * | Investments that are measured at fair value using the net asset value per share (or its equivalent) as a practical expedient have not been categorized in the fair value hierarchy. The fair value amount presented in the table is intended to permit reconciliation of the fair value hierarchy to the amounts presented in the Statement of Assets and Liabilities. The Fund’s investment in Securities Lending Cash Investments, LLC valued at $6,509,100 does not have a redemption period notice, can be redeemed daily and does not have any unfunded commitments. |
| | | | |
| 26 | | Wells Fargo Omega Growth Fund | | Notes to financial statements |
The Fund recognizes transfers between levels within the fair value hierarchy at the end of the reporting period. At July 31, 2018, the Fund did not have any transfers into/out of Level 1, Level 2, or Level 3.
4. TRANSACTIONS WITH AFFILIATES
Management fee
Funds Management, an indirect wholly owned subsidiary of Wells Fargo, is the manager of the Fund and provides advisory and fund-level administrative services under an investment management agreement. Under the investment management agreement, Funds Management is responsible for, among other services, implementing the investment objectives and strategies of the Fund, supervising the subadviser and providing fund-level administrative services in connection with the Fund’s operations. As compensation for its services under the investment management agreement, Funds Management is entitled to receive an annual management fee starting at 0.80% and declining to 0.555% as the average daily net assets of the Fund increase. For the year ended July 31, 2018, the management fee was equivalent to an annual rate of 0.78% of the Fund’s average daily net assets.
Funds Management has retained the services of a subadviser to provide daily portfolio management to the Fund. The fee for subadvisory services is borne by Funds Management. WellsCap is the subadviser to the Fund and is entitled to receive a fee from Funds Management at an annual rate starting at 0.45% and declining to 0.30% as the average daily net assets of the Fund increase.
Administration fees
Under a class-level administration agreement, Funds Management provides class-level administrative services to the Fund, which includes paying fees and expenses for services provided by the transfer agent, sub-transfer agents, omnibus account servicers and record-keepers. As compensation for its services under the class-level administration agreement, Funds Management receives an annual fee which is calculated based on the average daily net assets of each class as follows:
| | | | |
| | | Class-level
administration fee | |
Class A, Class C, Class R | | | 0.21 | % |
Administrator Class, Institutional Class | | | 0.13 | |
Funds Management has contractually waived and/or reimbursed management and administration fees to the extent necessary to maintain certain net operating expense ratios for the Fund. When each class of the Fund has exceeded its expense cap, Funds Management has waived fees and/or reimbursed expenses from fund level expenses on a proportionate basis and then from class specific expenses; otherwise, waivers and/or reimbursements are applied against class specific expenses before fund level expenses. Funds Management has committed through November 30, 2018 to waive fees and/or reimburse expenses to the extent necessary to cap the Fund’s expenses at 1.30% for Class A shares, 2.05% for Class C shares, 1.55% for Class R shares, 1.10% for Administrator Class shares, and 0.85% for Institutional Class. After this time, the cap may be increased or the commitment to maintain the cap may be terminated only with the approval of the Board of Trustees.
Distribution fees
The Trust has adopted a distribution plan for Class C and Class R shares of the Fund pursuant to Rule 12b-1 under the 1940 Act. Distribution fees are charged to Class C and Class R shares and paid to Wells Fargo Funds Distributor, LLC (“Funds Distributor”), the principal underwriter, at an annual rate of 0.75% of the average daily net assets of Class C shares and 0.25% of the average daily net assets of Class R shares.
In addition, Funds Distributor is entitled to receive the front-end sales charge from the purchase of Class A shares and a contingent deferred sales charge on the redemption of certain Class A shares. Funds Distributor is also entitled to receive the contingent deferred sales charges from redemptions of Class C shares. For the year ended July 31, 2018, Funds Distributor received $17,100 from the sale of Class A shares and $123 in contingent deferred sales charges from redemptions of Class C shares. No contingent deferred sales charges were incurred by Class A for the year ended July 31, 2018.
Shareholder servicing fees
The Trust has entered into contracts with one or more shareholder servicing agents, whereby Class A, Class C, Class R and Administrator Class of the Fund are charged a fee at an annual rate of 0.25% of the average daily net assets of each respective class.
A portion of these total shareholder servicing fees were paid to affiliates of Wells Fargo.
| | | | | | |
| Notes to financial statements | | Wells Fargo Omega Growth Fund | | | 27 | |
Interfund transactions
The Fund may purchase or sell portfolio investment securities to certain other Wells Fargo affiliates pursuant to Rule 17a-7 under the 1940 Act and under procedures adopted by the Board of Trustees. The procedures have been designed to ensure that these interfund transactions, which do not incur broker commissions, are effected at current market prices.
5. INVESTMENT PORTFOLIO TRANSACTIONS
Purchases and sales of investments, excluding U.S. government obligations (if any) and short-term securities, for the year ended July 31, 2018 were $367,526,299 and $822,115,288, respectively
6. BANK BORROWINGS
The Trust (excluding the money market funds and certain other funds) and Wells Fargo Variable Trust are parties to a $280,000,000 revolving credit agreement whereby the Fund is permitted to use bank borrowings for temporary or emergency purposes, such as to fund shareholder redemption requests. Interest under the credit agreement is charged to the Fund based on a borrowing rate equal to the higher of the Federal Funds rate in effect on that day plus 1.25% or the overnight LIBOR rate in effect on that day plus 1.25%. In addition, an annual commitment fee equal to 0.25% of the unused balance is allocated to each participating fund. Prior to August 29, 2017, the revolving credit agreement amount was $250,000,000.
For the year ended July 31, 2018, there were no borrowings by the Fund under the agreement.
7. DISTRIBUTIONS TO SHAREHOLDERS
The tax character of distributions paid was $99,253,531 and $19,470,530 of long-term capital gain for the years ended July 31, 2018 and July 31, 2017, respectively.
As of July 31, 2018, the components of distributable earnings on a tax basis were as follows:
| | | | |
Undistributed
ordinary
income | | Undistributed
long-term
gain | | Unrealized
gains |
| $12,379,292 | | $62,973,130 | | $290,125,428 |
8. CONCENTRATION RISK
Concentration risks result from exposure to a limited number of sectors. A fund that invests a substantial portion of its assets in any sector may be more affected by changes in that sector than would be a fund whose investments are not heavily weighted in any sector.
9. INDEMNIFICATION
Under the Trust’s organizational documents, the officers and Trustees have been granted certain indemnification rights against certain liabilities that may arise out of performance of their duties to the Trust. Additionally, in the normal course of business, the Trust may enter into contracts with service providers that contain a variety of indemnification clauses. The Trust’s maximum exposure under these arrangements is dependent on future claims that may be made against the Fund and, therefore, cannot be estimated.
| | | | |
| 28 | | Wells Fargo Omega Growth Fund | | Report of independent registered public accounting firm |
BOARD OF TRUSTEES AND SHAREHOLDERS OF WELLS FARGO FUNDS TRUST:
Opinion on the Financial Statements
We have audited the accompanying statement of assets and liabilities of Wells Fargo Omega Growth Fund (the “Fund”), one of the funds constituting Wells Fargo Funds Trust, including the portfolio of investments, as of July 31, 2018, the related statement of operations for the year then ended, the statements of changes in net assets for each of the years in the two-year period then ended, and the related notes (collectively, the “financial statements”) and the financial highlights for each of the years in the five-year period then ended. In our opinion, the financial statements and financial highlights present fairly, in all material respects, the financial position of the Fund as of July 31, 2018, the results of its operations for the year then ended, the changes in its net assets for each of the years in the two-year period then ended, and the financial highlights for each of the years in the five-year period then ended, in conformity with U.S. generally accepted accounting principles.
Basis for Opinion
These financial statements and financial highlights are the responsibility of the Fund’s management. Our responsibility is to express an opinion on these financial statements and financial highlights based on our audits. We are a public accounting firm registered with the Public Company Accounting Oversight Board (United States) (“PCAOB”) and are required to be independent with respect to the Fund in accordance with the U.S. federal securities laws and the applicable rules and regulations of the Securities and Exchange Commission and the PCAOB.
We conducted our audits in accordance with the standards of the PCAOB. Those standards require that we plan and perform the audit to obtain reasonable assurance about whether the financial statements and financial highlights are free of material misstatement, whether due to error or fraud. Our audits included performing procedures to assess the risks of material misstatement of the financial statements and financial highlights, whether due to error or fraud, and performing procedures that respond to those risks. Such procedures included examining, on a test basis, evidence regarding the amounts and disclosures in the financial statements and financial highlights. Such procedures also included confirmation of securities owned as of July 31, 2018, by correspondence with the custodian and brokers, or by other appropriate auditing procedures. Our audits also included evaluating the accounting principles used and significant estimates made by management, as well as evaluating the overall presentation of the financial statements and financial highlights. We believe that our audits provide a reasonable basis for our opinion.

We have not been able to determine the specific year that we began serving as the auditor of one or more Wells Fargo Funds investment companies, however we are aware that we have served as the auditor of one or more Wells Fargo Funds investment companies since at least 1955.
Boston, Massachusetts
September 24, 2018
| | | | | | |
| Other information (unaudited) | | Wells Fargo Omega Growth Fund | | | 29 | |
TAX INFORMATION
Pursuant to Section 852 of the Internal Revenue Code, $99,253,531 was designated as a 20% rate gain distribution for the fiscal year ended July 31, 2018.
PROXY VOTING INFORMATION
A description of the policies and procedures that the Fund uses to determine how to vote proxies relating to portfolio securities is available, upon request, by calling 1-800-222-8222, visiting our website at wellsfargofunds.com, or visiting the SEC website at sec.gov. Information regarding how the Fund voted proxies relating to portfolio securities during the most recent 12-month period ended June 30 is available on the Fund’s website at wellsfargofunds.com or by visiting the SEC website at sec.gov.
PORTFOLIO HOLDINGS INFORMATION
The complete portfolio holdings for the Fund are publicly available monthly on the Fund’s website (wellsfargofunds.com), on a one-month delayed basis. In addition, top ten holdings information (excluding derivative positions) for the Fund is publicly available on the Fund’s website on a monthly, seven-day or more delayed basis. The Fund files its complete schedule of portfolio holdings with the SEC for the first and third quarters of each fiscal year on Form N-Q, which is available by visiting the SEC website at sec.gov. In addition, the Fund’s Form N-Q may be reviewed and copied at the SEC’s Public Reference Room in Washington, DC, and at regional offices in New York City, at 233 Broadway, and in Chicago, at 175 West Jackson Boulevard, Suite 900. Information about the Public Reference Room may be obtained by calling 1-800-SEC-0330.
| | | | |
| 30 | | Wells Fargo Omega Growth Fund | | Other information (unaudited) |
BOARD OF TRUSTEES AND OFFICERS
Each of the Trustees and Officers1 listed in the table below acts in identical capacities for each fund in the Wells Fargo family of funds, which consists of 154 mutual funds comprising the Wells Fargo Funds Trust, Wells Fargo Variable Trust, Wells Fargo Master Trust and four closed-end funds (collectively the “Fund Complex”). This table should be read in conjunction with the Prospectus and the Statement of Additional Information2. The mailing address of each Trustee and Officer is 525 Market Street, 12th Floor, San Francisco, CA 94105. Each Trustee and Officer serves an indefinite term, however, each Trustee serves such term until reaching the mandatory retirement age established by the Trustees.
Independent Trustees
| | | | | | |
Name and year of birth | | Position held and length of service* | | Principal occupations during past five years or longer | | Current other
public company or
investment company
directorships |
William R. Ebsworth (Born 1957) | | Trustee, since 2015 | | Retired. From 1984 to 2013, equities analyst, portfolio manager, research director and chief investment officer at Fidelity Management and Research Company in Boston, Tokyo, and Hong Kong, and retired in 2013 as Chief Investment Officer of Fidelity Strategic Advisers, Inc. where he led a team of investment professionals managing client assets. Prior thereto, Board member of Hong Kong Securities Clearing Co., Hong Kong Options Clearing Corp., the Thailand International Fund, Ltd., Fidelity Investments Life Insurance Company, and Empire Fidelity Investments Life Insurance Company. Board member of the Forté Foundation (non-profit organization) and the Vincent Memorial Hospital Endowment (non-profit organization), where he serves on the Investment Committee and as a Chair of the Audit Committee. Mr. Ebsworth is a CFA® charterholder. | | Asset Allocation Trust |
Jane A. Freeman (Born 1953) | | Trustee, since 2015; Chair Liaison, since 2018 | | Retired. From 2012 to 2014 and 1999 to 2008, Chief Financial Officer of Scientific Learning Corporation. From 2008 to 2012, Ms. Freeman provided consulting services related to strategic business projects. Prior to 1999, Portfolio Manager at Rockefeller & Co. and Scudder, Stevens & Clark. Board member of the Harding Loevner Funds from 1996 to 2014, serving as both Lead Independent Director and chair of the Audit Committee. Board member of the Russell Exchange Traded Funds Trust from 2011 to 2012 and the chair of the Audit Committee. Ms. Freeman is a Board Member of Ruth Bancroft Garden (non-profit organization) and the Glimmerglass Festival. She is also an inactive Chartered Financial Analyst. | | Asset Allocation Trust |
Isaiah Harris, Jr. (Born 1952) | | Trustee, since 2009 | | Retired. Chairman of the Board of CIGNA Corporation since 2009, and Director since 2005. From 2003 to 2011, Director of Deluxe Corporation. Prior thereto, President and CEO of BellSouth Advertising and Publishing Corp. from 2005 to 2007, President and CEO of BellSouth Enterprises from 2004 to 2005 and President of BellSouth Consumer Services from 2000 to 2003. Emeritus member of the Iowa State University Foundation Board of Governors. Emeritus Member of the Advisory Board of Iowa State University School of Business. Advisory Board Member, Palm Harbor Academy (charter school). Advisory Board Member, Child Evangelism Fellowship (non-profit). Mr. Harris is a certified public accountant (inactive status). | | CIGNA Corporation: Asset Allocation Trust |
Judith M. Johnson (Born 1949) | | Trustee, since 2008; Audit Committee Chairman, since 2009 | | Retired. Prior thereto, Chief Executive Officer and Chief Investment Officer of Minneapolis Employees Retirement Fund from 1996 to 2008. Ms. Johnson is an attorney, certified public accountant and a certified managerial accountant. | | Asset Allocation Trust |
David F. Larcker (Born 1950) | | Trustee, since 2009 | | James Irvin Miller Professor of Accounting at the Graduate School of Business, Stanford University, Director of the Corporate Governance Research Initiative and Senior Faculty of The Rock Center for Corporate Governance since 2006. From 2005 to 2008, Professor of Accounting at the Graduate School of Business, Stanford University. Prior thereto, Ernst & Young Professor of Accounting at The Wharton School, University of Pennsylvania from 1985 to 2005. | | Asset Allocation Trust |
| | | | | | |
| Other information (unaudited) | | Wells Fargo Omega Growth Fund | | | 31 | |
| | | | | | |
Name and year of birth | | Position held and length of service* | | Principal occupations during past five years or longer | | Current other
public company or
investment company
directorships |
Olivia S. Mitchell (Born 1953) | | Trustee, since 2006; Governance Committee Chairman, since 2018 | | International Foundation of Employee Benefit Plans Professor, Wharton School of the University of Pennsylvania since 1993. Director of Wharton’s Pension Research Council and Boettner Center on Pensions & Retirement Research, and Research Associate at the National Bureau of Economic Research. Previously, Cornell University Professor from 1978 to 1993. | | Asset Allocation Trust |
Timothy J. Penny (Born 1951) | | Trustee, since 1996; Chairman, since 2018; Vice Chairman, from 2017 to 2018 | | President and Chief Executive Officer of Southern Minnesota Initiative Foundation, a non-profit organization, since 2007. Member of the Board of Trustees of NorthStar Education Finance, Inc., a non-profit organization, since 2007. | | Asset Allocation Trust |
James G. Polisson (Born 1959) | | Trustee, since 2018; Advisory Board Member, from 2017 to 2018 | | Retired. Chief Marketing Officer, Source (ETF) UK Services, Ltd, from 2015 to 2017. From 2012 to 2015, Principal of The Polisson Group, LLC, a management consulting, corporate advisory and principal investing company. Chief Executive Officer and Managing Director at Russell Investments, Global Exchange Traded Funds from 2010 to 2012. Managing Director of Barclays Global Investors from 1998 to 2010 and Global Chief Marketing Officer for iShares and Barclays Global Investors from 2000 to 2010. Trustee of the San Francisco Mechanics’ Institute, a non-profit organization, from 2013 to 2015. Board member of the Russell Exchange Traded Fund Trust from 2011 to 2012. Director of Barclays Global Investors Holdings Deutschland GmbH from 2006 to 2009. Mr. Polisson is an attorney and has a retired status with the Massachusetts and District of Columbia Bar Associations. | | Asset Allocation Trust |
Michael S. Scofield (Born 1943) | | Trustee, since 2010 | | Served on the Investment Company Institute’s Board of Governors and Executive Committee from 2008-2011 as well the Governing Council of the Independent Directors Council from 2006-2011 and the Independent Directors Council Executive Committee from 2008-2011. Trustee of the Evergreen Fund complex (and its predecessors) from 1984 to 2010. Chairman of the Evergreen Funds from 2000-2010. Former Trustee of the Mentor Funds. Retired Attorney, Law Offices of Michael S. Scofield. | | Asset Allocation Trust |
Pamela Wheelock (Born 1959) | | Trustee, since 2018; Advisory Board Member, from 2017 to 2018 | | Chief Operating Officer, Twin Cities Habitat for Humanity, since January, 2017. Vice President of University Services, University of Minnesota from 2012 to 2017. Prior thereto, on the Board of Directors, Goverance Committee and Finance Committee for the Minnesota Philanthropy Partners (Saint Paul Foundation) from 2012 to 2018, Interim President and Chief Executive Officer of Blue Cross Blue shield of Minnesota of Minnesota from 2010 to 2011, Chairman of the Board from 2009 to 2011 and Board Director 003 to 2015. Vice President, Leadership and Community Engagement, Bush Foundation, Saint Paul, Minnesota (a private foundation) from 2009 to 2011. Executive Vice President and Chief Financial Officer, Minnesota Sports and Entertainment from 2004 to 2009 and Senior Vice President from 2002 to 2004. Commissioner of Finance, State of Minnesota, from 1999 to 2002. Currently the Board Chair of the Minnesota Wild Foundation since 2010. | | Asset Allocation Trust |
| * | Length of service dates reflect the Trustee’s commencement of service with the Trust’s predecessor entities, where applicable. |
| | | | |
| 32 | | Wells Fargo Omega Growth Fund | | Other information (unaudited) |
Officers
| | | | | | |
Name and year of birth | | Position held and
length of service | | Principal occupations during past five years or longer | | |
Andrew Owen (Born 1960) | | President, since 2017 | | Executive Vice President of Wells Fargo & Company and Head of Affiliated Managers, Wells Fargo Asset Management, since 2014. In addition, Mr. Owen is currently President, Chief Executive Officer and Director of Wells Fargo Funds Management, LLC since 2017. Prior thereto, Executive Vice President responsible for marketing, investments and product development for Wells Fargo Funds Management, LLC, from 2009 to 2014. | | |
Jeremy DePalma1 (Born 1974) | | Treasurer, since 2012 | | Senior Vice President of Wells Fargo Funds Management, LLC since 2009. Senior Vice President of Evergreen Investment Management Company, LLC from 2008 to 2010 and head of the Fund Reporting and Control Team within Fund Administration from 2005 to 2010. | | |
Alexander Kymn3 (Born 1973) | | Secretary, since 2018; Chief Legal Officer, since 2018 | | Senior Company Counsel of Wells Fargo Bank, N.A. since 2018 (previously Senior Counsel from 2007 to 2018). Vice President of Wells Fargo Funds Management, LLC from 2008 to 2014. | | |
Michael H. Whitaker (Born 1967) | | Chief Compliance Officer, since 2016 | | Senior Vice President and Chief Compliance Officer since 2016. Senior Vice President and Chief Compliance Officer for Fidelity Investments from 2007 to 2016. | | |
David Berardi (Born 1975) | | Assistant Treasurer, since 2009 | | Vice President of Wells Fargo Funds Management, LLC since 2009. Vice President of Evergreen Investment Management Company, LLC from 2008 to 2010. Manager of Fund Reporting and Control for Evergreen Investment Management Company, LLC from 2004 to 2010. | | |
| 1 | Jeremy DePalma acts as Treasurer of 77 funds and Assistant Treasurer of 77 funds in the Fund Complex. |
| 2 | The Statement of Additional Information includes additional information about the Trustees and is available, without charge, upon request, by calling 1-800-222-8222 or by visiting the website at wellsfargofunds.com. |
| 3 | Alexander Kymn became the Secretary and Chief Legal Officer effective April 17, 2018. |
| | | | | | |
| Other information (unaudited) | | Wells Fargo Omega Growth Fund | | | 33 | |
BOARD CONSIDERATION OF INVESTMENT MANAGEMENT AND SUB-ADVISORY AGREEMENTS:
Wells Fargo Omega Growth Fund
Under the Investment Company Act of 1940 (the “1940 Act”), the Board of Trustees (the “Board”) of Wells Fargo Funds Trust (the “Trust”) must determine annually whether to approve the continuation of the Trust’s investment management and sub-advisory agreements. In this regard, at an in-person meeting held on May 22-23, 2018 (the “Meeting”), the Board, all the members of which have no direct or indirect interest in the investment management and sub-advisory agreements and are not “interested persons” of the Trust, as defined in the 1940 Act (the “Independent Trustees”), reviewed and approved for Wells Fargo Omega Growth Fund (the “Fund”): (i) an investment management agreement (the “Management Agreement”) with Wells Fargo Funds Management, LLC (“Funds Management”); and (ii) an investment sub-advisory agreement (the “Sub-Advisory Agreement”) with Wells Capital Management Incorporated (the “Sub-Adviser”), an affiliate of Funds Management. The Management Agreement and the Sub-Advisory Agreement are collectively referred to as the “Advisory Agreements.”
At the Meeting, the Board considered the factors and reached the conclusions described below relating to the selection of Funds Management and the Sub-Adviser and the approval of the Advisory Agreements. Prior to the Meeting, including at an in-person meeting in April 2018, the Trustees conferred extensively among themselves and with representatives of Funds Management about these matters. Also, the Board has adopted a team-based approach, with each team consisting of a sub-set of Trustees, to assist the full Board in the discharge of its duties in reviewing investment performance and other matters throughout the year. The Independent Trustees were assisted in their evaluation of the Advisory Agreements by independent legal counsel, from whom they received separate legal advice and with whom they met separately.
In providing information to the Board, Funds Management and the Sub-Adviser were guided by a detailed set of requests for information submitted to them by independent legal counsel on behalf of the Independent Trustees at the start of the Board’s annual contract renewal process earlier in 2018. In considering and approving the Advisory Agreements, the Trustees considered the information they believed relevant, including but not limited to the information discussed below. The Board considered not only the specific information presented in connection with the Meeting, but also the knowledge gained over time through interaction with Funds Management and the Sub-Adviser about various topics. In this regard, the Board reviewed reports of Funds Management at each of its quarterly meetings, which included, among other things, portfolio reviews and investment performance reports. In addition, the Board and the teams mentioned above confer with portfolio managers at various times throughout the year. The Board did not identify any particular information or consideration that was all-important or controlling, and each individual Trustee may have attributed different weights to various factors.
After its deliberations, the Board unanimously approved the continuation of the Advisory Agreements for a one-year term and determined that the compensation payable to Funds Management and the Sub-Adviser under each of the Advisory Agreements was reasonable. The Board considered the approval of the Advisory Agreements for the Fund as part of its consideration of agreements for funds across the complex, but its approvals were made on a fund-by-fund basis. The following summarizes a number of important, but not necessarily all, factors considered by the Board in support of its approvals.
Nature, extent and quality of services
The Board received and considered various information regarding the nature, extent and quality of services provided to the Fund by Funds Management and the Sub-Adviser under the Advisory Agreements. This information included a description of the investment advisory services and Fund-level administrative services covered by the Management Agreement, as well as, among other things, a summary of the background and experience of senior management of Wells Fargo Asset Management (“WFAM”), of which Funds Management and the Sub-Adviser are a part, a summary of investments made in the business of WFAM, a summary of certain organizational and personnel changes involving Funds Management and the Sub-Adviser, and a description of Funds Management’s and the Sub-Adviser’s business continuity planning programs and of their approaches to data privacy and cybersecurity. The Board also considered the qualifications, background, tenure and responsibilities of each of the portfolio managers primarily responsible for the day-to-day portfolio management of the Fund.
The Board evaluated the ability of Funds Management and the Sub-Adviser to attract and retain qualified investment professionals, including research, advisory and supervisory personnel. The Board further considered the compliance programs and compliance records of Funds Management and the Sub-Adviser. In addition, the Board took into account the full range of services provided to the Fund by Funds Management and its affiliates.
Fund investment performance and expenses
The Board considered the investment performance results for the Fund over various time periods ended December 31, 2017. The Board considered these results in comparison to the investment performance of funds in a universe that was determined by
| | | | |
| 34 | | Wells Fargo Omega Growth Fund | | Other information (unaudited) |
Broadridge Inc. (“Broadridge”) to be similar to the Fund (the “Universe”), and in comparison to the Fund’s benchmark index and to other comparative data. Broadridge is an independent provider of investment company data. The Board received a description of the methodology used by Broadridge to select the mutual funds in the performance Universe. The Board noted that the investment performance of the Fund (Administrator Class) was higher than or in range of the average investment performance of the Universe for all periods under review. The Board also noted that the investment performance of the Fund was higher than its benchmark index, the Russell 3000 Growth Index, for the one- and ten-year periods under review, but lower than its benchmark index for the three- and five-year periods under review.
The Board received information concerning, and discussed factors contributing to, the underperformance of the Fund relative to the Universe and benchmark for the periods identified above. The Board took note of the explanations for the relative underperformance during these periods, including with respect to investment decisions and market factors that affected the Fund’s investment performance. The Board also took note of the Fund’s outperformance relative to the Universe and benchmark over the more recent time periods under review.
The Board also received and considered information regarding the Fund’s net operating expense ratios and their various components, including actual management fees, custodian and other non-management fees, and Rule 12b-1 and non-Rule 12b-1 shareholder service fees. The Board considered these ratios in comparison to the median ratios of funds in class-specific expense groups that were determined by Broadridge to be similar to the Fund (the “Groups”). The Board received a description of the methodology used by Broadridge to select the mutual funds in the expense Groups and an explanation of how funds comprising expense groups and their expense ratios may vary from year-to-year. Based on the Broadridge reports, the Board noted that the net operating expense ratios of the Fund were lower than or in range of the median net operating expense ratios of the expense Groups for each share class.
The Board took into account the Fund’s investment performance and expense information provided to it among the factors considered in deciding to re-approve the Advisory Agreements.
Investment management and sub-advisory fee rates
The Board reviewed and considered the contractual fee rates payable by the Fund to Funds Management under the Management Agreement, as well as the contractual fee rates payable by the Fund to Funds Management for class-level administrative services under a Class-Level Administration Agreement, which include, among other things, class-level transfer agency and sub-transfer agency costs (collectively, the “Management Rates”). The Board also reviewed and considered the contractual investment sub-advisory fee rates that are payable by Funds Management to the Sub-Adviser for investment sub-advisory services.
Among other information reviewed by the Board was a comparison of the Fund’s Management Rates with the average contractual investment management fee rates of funds in the expense Groups at a common asset level as well as transfer agency costs of the funds in the expense Groups. The Board noted that the Management Rates of the Fund were lower than or in range of the sum of these average rates for the Fund’s expense Groups for each share class except Class A and Institutional Class. However, the Board noted that the net operating expense ratios of the Fund were lower than or in range of the median net operating expense ratios of the expense Groups for each share class, including Class A and Institutional Class.
The Board also received and considered information about the portion of the total management fee that was retained by Funds Management after payment of the fee to the Sub-Adviser for sub-advisory services. In assessing the reasonableness of this amount, the Board received and evaluated information about the nature and extent of responsibilities retained and risks assumed by Funds Management and not delegated to or assumed by the Sub-Adviser, and about Funds Management’s on-going oversight services. Given the affiliation between Funds Management and the Sub-Adviser, the Board ascribed limited relevance to the allocation of fees between them.
The Board also received and considered information about the nature and extent of services offered and fee rates charged by Funds Management and the Sub-Adviser to other types of clients with investment strategies similar to those of the Fund. In this regard, the Board received information about the significantly greater scope of services, and compliance, reporting and other legal burdens and risks of managing mutual funds compared with those associated with managing assets of non-mutual fund clients such as institutional separate accounts.
Based on its consideration of the factors and information it deemed relevant, including those described here, the Board determined that the compensation payable to Funds Management under the Management Agreement and to the Sub-Adviser under the Sub-Advisory Agreement was reasonable.
| | | | | | |
| Other information (unaudited) | | Wells Fargo Omega Growth Fund | | | 35 | |
Profitability
The Board received and considered information concerning the profitability of Funds Management, as well as the profitability of both WFAM and Wells Fargo & Co. (“Wells Fargo”) as a whole, from providing services to the Fund and the fund family as a whole. The Board noted that the Sub-Adviser’s profitability information with respect to providing services to the Fund was subsumed in the WFAM and Wells Fargo profitability analysis.
Funds Management reported on the methodologies and estimates used in calculating profitability, including a description of the methodology used to allocate certain expenses and recent enhancements made to the methodology. Among other things, the Board noted that the levels of profitability reported on a fund-by-fund basis varied widely, depending on factors such as the size and type of fund. Based on its review, the Board did not deem the profits reported by Funds Management, WFAM or Wells Fargo from services provided to the Fund to be at a level that would prevent it from approving the continuation of the Advisory Agreements.
Economies of scale
The Board considered the extent to which Funds Management may experience economies of scale in the provision of management services, and the extent to which scale benefits, if any, would be shared with shareholders. In particular, the Board noted the existence of breakpoints in the Fund’s management fee structure, which operate generally to reduce the Fund’s expense ratios as the Fund grows in size. It considered that, for a small fund or a fund that shrinks in size, breakpoints conversely can result in higher fee levels. The Board also considered that in addition to management fee breakpoints, competitive management fee rates set at the outset without regard to breakpoints and fee waiver and expense reimbursement arrangements, as well as investments in the business intended to enhance services available to Fund shareholders, are means of sharing potential economies of scale with shareholders of the Fund.
The Board concluded that the Fund’s fee and expense arrangements, including contractual breakpoints, constituted a reasonable approach to sharing potential economies of scale with the Fund and its shareholders.
Other benefits to Funds Management and the Sub-Adviser
The Board received and considered information regarding potential “fall-out” or ancillary benefits received by Funds Management and its affiliates, including the Sub-Adviser, as a result of their relationships with the Fund. Ancillary benefits could include, among others, benefits directly attributable to other relationships with the Fund and benefits potentially derived from an increase in Funds Management’s and the Sub-Adviser’s business as a result of their relationships with the Fund. The Board noted that various affiliates of Funds Management may receive distribution-related fees, shareholder servicing payments and sub-transfer agency fees in respect of shares sold or held through them and services provided.
The Board also reviewed information about soft dollar credits earned and utilized by the Sub-Adviser, fees earned by Funds Management and the Sub-Adviser from managing a private investment vehicle for the fund family’s securities lending collateral and commissions earned by an affiliated broker from portfolio transactions.
Based on its consideration of the factors and information it deemed relevant, including those described here, the Board did not find that any ancillary benefits received by Funds Management and its affiliates, including the Sub-Adviser, were unreasonable.
Conclusion
At the Meeting, after considering the above-described factors and based on its deliberations and its evaluation of the information described above, the Board unanimously approved the continuation of the Advisory Agreements for a one-year term and determined that the compensation payable to Funds Management and the Sub-Adviser under each of the Advisory Agreements was reasonable.
| | | | |
| 36 | | Wells Fargo Omega Growth Fund | | Appendix A (unaudited) |
SALES CHARGE REDUCTIONS AND WAIVERS FOR CERTAIN INTERMEDIARIES
Ameriprise
Effective June 1, 2018, shareholders purchasing Fund shares through an Ameriprise Financial platform or account will be eligible only for the following Class A load waivers (front-end sales charge waivers), which may differ from those disclosed elsewhere in the Fund’s prospectus or Statement of Additional Information.
Front-end Sales Load Waivers on Class A Shares Available at Ameriprise Financial
| | • | | Employer-sponsored retirement plans (e.g., 401(k) plans, 457 plans, employer-sponsored 403(b) plans, profit sharing and money purchase pension plans and defined benefit plans). For purposes of this provision, employer-sponsored retirement plans do not include SEP IRAs, Simple IRAs or SAR-SEPs. |
| | • | | Shares purchased through an Ameriprise Financial investment advisory program (if an Advisory or similar share class for such investment advisory program is not available) |
| | • | | Shares purchased by third party investment advisors on behalf of their advisory clients through Ameriprise Financial’s platform (if an Advisory or similar share class for such investment advisory program is not available) |
| | • | | Shares purchased through reinvestment of distributions and dividend reinvestment when purchasing shares of the same Fund (but not any other fund within the same fund family) |
| | • | | Shares exchanged from Class C shares of the same fund in the month of or following the 10-year anniversary of the purchase date. To the extent that the Fund’s prospectus elsewhere provides for a waiver with respect to such shares following a shorter holding period, that waiver will apply to exchanges following such shorter period. To the extent that the Fund’s prospectus elsewhere provides for a waiver with respect to exchanges of Class C shares for load-waived shares, that waiver will also apply to such exchanges. |
| | • | | Employees and registered representatives of Ameriprise Financial or its affiliates and their immediate family members |
| | • | | Shares purchased by or through qualified accounts (including IRAs, Coverdell Education Savings Accounts, 401(k)s, 403(b) TSCAs subject to ERISA and defined benefit plans) that are held by a covered family member, defined as an Ameriprise financial advisor and/or the advisor’s spouse, advisor’s lineal ascendant (mother, father, grandmother, grandfather, great grandmother, great grandfather), advisor’s lineal descendant (son, step-son, daughter, step-daughter, grandson, granddaughter, great grandson, great granddaughter) or any spouse of a covered family member who is a lineal descendant |
| | • | | Shares purchased from the proceeds of redemptions within the same fund family, provided (1) the repurchase occurs within 90 days following the redemption, (2) the redemption and purchase occur in the same account, and (3) redeemed shares were subject to a front-end or deferred sales load (i.e. Rights of Reinstatement). Subject to the Fund’s policy regarding frequent purchases and redemptions of Fund shares, you may not be able to repurchase shares for the first 30 days after your redemption. |
Automatic Exchange of Class C Shares Available at Ameriprise Financial
| | • | | Class C shares will automatically exchange to Class A shares in the month of the 10-year anniversary of the purchase date. |
Merrill Lynch
Effective April 10, 2017, shareholders purchasing Fund shares through a Merrill Lynch platform or account will be eligible only for the following load waivers (front-end sales charge waivers and contingent deferred, or back-end, sales charge waivers) and discounts, which may differ from those disclosed elsewhere in the Fund’s prospectus or Statement of Additional Information.
Front-end Sales Load Waivers on Class A Shares available at Merrill Lynch
| | • | | Employer-sponsored retirement, deferred compensation and employee benefit plans (including health savings accounts) and trusts used to fund those plans, provided that the shares are not held in a commission-based brokerage account and shares are held for the benefit of the plan |
| | • | | Shares purchased by or through a 529 Plan |
| | • | | Shares purchased through a Merrill Lynch affiliated investment advisory program |
| | | | | | |
| Appendix A (unaudited) | | Wells Fargo Omega Growth Fund | | | 37 | |
| | • | | Shares purchased by third party investment advisors on behalf of their advisory clients through Merrill Lynch’s platform |
| | • | | Shares of funds purchased through the Merrill Edge Self-Directed platform (if applicable) |
| | • | | Shares purchased through reinvestment of capital gains distributions and dividend reinvestment when purchasing shares of the same fund (but not any other fund within the fund family) |
| | • | | Shares exchanged from Class C (i.e. level-load) shares of the same fund in the month of or following the 10-year anniversary of the purchase date |
| | • | | Employees and registered representatives of Merrill Lynch or its affiliates and their family members, as defined by Merrill Lynch, which may differ from the definition of family member in the Fund’s prospectus. |
| | • | | Directors or Trustees of the Fund, and employees of the Fund’s investment adviser or any of its affiliates, as described in the Fund’s prospectus |
| | • | | Shares purchased from the proceeds of redemptions within the same fund family, provided (1) the repurchase occurs within 90 days following the redemption, (2) the redemption and purchase occur in the same account, and (3) redeemed shares were subject to a front-end or deferred sales load (known as Rights of Reinstatement). Subject to the Fund’s policy regarding frequent purchases and redemptions of Fund shares, you may not be able to repurchase shares for the first 30 days after your redemption. |
CDSC Waivers on A, B and C Shares available at Merrill Lynch
| | • | | Death or disability of the shareholder |
| | • | | Shares sold as part of a systematic withdrawal plan as described in the Fund’s prospectus |
| | • | | Return of excess contributions from an IRA Account |
| | • | | Shares sold as part of a required minimum distribution for IRA and retirement accounts due to the shareholder reaching age 70½ |
| | • | | Shares sold to pay Merrill Lynch fees but only if the transaction is initiated by Merrill Lynch |
| | • | | Shares acquired through a right of reinstatement |
| | • | | Shares held in retirement brokerage accounts, that are exchanged for a lower cost share class due to transfer to certain fee based accounts or platforms (applicable to A and C shares only) |
Front-end load Discounts Available at Merrill Lynch: Breakpoints, Rights of Accumulation & Letters of Intent
| | • | | Breakpoints as described in the Fund’s prospectus |
| | • | | Rights of Accumulation (ROA) which entitle shareholders to breakpoint discounts will be automatically calculated based on the aggregated holding of fund family assets held by accounts within the purchaser’s household at Merrill Lynch. Eligible fund family assets not held at Merrill Lynch may be included in the ROA calculation only if the shareholder notifies his or her financial advisor about such assets. |
| | • | | Letters of Intent (LOI) which allow for breakpoint discounts based on anticipated purchases within a fund family, through Merrill Lynch, over a 13-month period of time (if applicable) |
Morgan Stanley
Effective on or about July 1, 2018, shareholders purchasing Fund shares through a Morgan Stanley Wealth Management transactional brokerage account will be eligible only for the following Class A load waivers (front-end sales charge waivers), which may differ from and be more limited than those disclosed in the Fund’s prospectus or Statement of Additional Information.
Front-end Sales Load Waivers on Class A Shares Available at Morgan Stanley
| | • | | Employer-sponsored retirement plans (e.g., 401(k) plans, 457 plans, employer-sponsored 403(b) plans, profit sharing and money purchase pension plans and defined benefit plans). For purposes of this provision, employer-sponsored retirement plans do not include SEP IRAs, Simple IRAs, SAR-SEPs or Keogh plans. |
| | • | | Morgan Stanley employee and employee-related accounts according to Morgan Stanley’s account linking rules |
| | • | | Shares purchased through reinvestment of dividends and capital gains distributions when purchasing shares of the same fund |
| | • | | Shares purchased through a Morgan Stanley self-directed brokerage account |
| | | | |
| 38 | | Wells Fargo Omega Growth Fund | | Appendix A (unaudited) |
| | • | | Class C (i.e., level-load) shares that are no longer subject to a contingent deferred sales charge and are exchanged to Class A shares of the same fund pursuant to Morgan Stanley Wealth Management’s share class exchange program. |
| | • | | Shares purchased from the proceeds of redemptions within the same fund family, provided (i) the repurchase occurs within 90 days following the redemption, (ii) the redemption and purchase occur in the same account, and (iii) redeemed shares were subject to a front-end or deferred sales charge. This waiver is subject to the Fund’s policy regarding frequent purchases and redemption of Fund shares, as discussed under “Account Information—Frequent Purchases and Redemptions of Fund Shares” in the Fund’s prospectus. |
This page is intentionally left blank.
This page is intentionally left blank.

For more information
More information about Wells Fargo Funds is available free upon request. To obtain literature, please write, email, visit the Fund’s website, or call:
Wells Fargo Funds
P.O. Box 219967
Kansas City, MO 64121-9967
Website: wellsfargofunds.com
Individual investors: 1-800-222-8222
Retail investment professionals: 1-888-877-9275
Institutional investment professionals: 1-866-765-0778
This report and the financial statements contained herein are submitted for the general information of the shareholders of the Fund. If this report is used for promotional purposes, distribution of the report must be accompanied or preceded by a current prospectus. Before investing, please consider the investment objectives, risks, charges, and expenses of the investment. For a current prospectus and, if available, a summary prospectus, containing this information, call 1-800-222-8222 or visit the Fund’s website at wellsfargofunds.com. Read the prospectus carefully before you invest or send money.
Wells Fargo Asset Management (WFAM) is the trade name for certain investment advisory/management firms owned by Wells Fargo & Company. These firms include but are not limited to Wells Capital Management Incorporated and Wells Fargo Funds Management, LLC. Certain products managed by WFAM entities are distributed by Wells Fargo Funds Distributor, LLC (a broker/dealer and Member FINRA).
This material is for general informational and educational purposes only and is NOT intended to provide investment advice or a recommendation of any kind—including a recommendation for any specific investment, strategy, or plan.
NOT FDIC INSURED ◾ NO BANK GUARANTEE ◾ MAY LOSE VALUE
© 2018 Wells Fargo Funds Management, LLC. All rights reserved.
| | |
 | | 314803 09-18 A211/AR211 07-18 |
Annual Report
July 31, 2018

Wells Fargo
Premier Large Company Growth Fund


Reduce clutter. Save trees.
Sign up for electronic delivery of prospectuses and shareholder reports at wellsfargo.com/advantagedelivery
Contents
The views expressed and any forward-looking statements are as of July 31, 2018, unless otherwise noted, and are those of the Fund managers and/or Wells Fargo Funds Management, LLC. Discussions of individual securities, or the markets generally, or any Wells Fargo Fund are not intended as individual recommendations. Future events or results may vary significantly from those expressed in any forward-looking statements. The views expressed are subject to change at any time in response to changing circumstances in the market. Wells Fargo Funds Management, LLC and the Fund disclaim any obligation to publicly update or revise any views expressed or forward-looking statements.
NOT FDIC INSURED ◾ NO BANK GUARANTEE ◾ MAY LOSE VALUE
| | | | |
| 2 | | Wells Fargo Premier Large Company Growth Fund | | Letter to shareholders (unaudited) |

Andrew Owen
President
Wells Fargo Funds
After advancing during the summer and fall of 2017 in a roughly synchronized way, economic growth and stock markets globally diverged during the first seven months of 2018.
Dear Shareholder:
We are pleased to offer you this annual report for the Wells Fargo Premier Large Company Growth Fund for the 12-month period that ended July 31, 2018. After advancing during the summer and fall of 2017 in a roughly synchronized way, economic growth and stock markets globally diverged during the first seven months of 2018. For fixed-income investors, higher U.S. interest rates, rising inflation, and intensifying global geopolitical tensions tended to restrain taxable bond prices while high-yield and municipal bond investors generally enjoyed positive returns.
For the period, U.S. stocks, as measured by the S&P 500 Index,1 gained 16.24%, and international stocks, as measured by the MSCI ACWI ex USA Index (Net),2 added 5.94%. Emerging market stocks, as measured by the MSCI EM Index (Net),3 added 4.36%. In bond markets, the Bloomberg Barclays U.S. Aggregate Bond Index4 declined 0.80% while fixed-income investments outside the U.S. fell 0.27%, according to the Bloomberg Barclays Global Aggregate ex-USD Index.5 The Bloomberg Barclays Municipal Bond Index6 added 0.99%, and the ICE BofAML U.S. High Yield Index7 was up 2.49%.
Volatility increased as summer turned to fall in 2017, although data generally was favorable.
During the third quarter of 2017, investor expectations rose and fell amid shifting geopolitical tensions, particularly in Asia as North Korea’s nuclear aspirations and U.S./China trade rhetoric caused concerns. In the U.S., corporate earnings and consumer confidence improved. The U.S. Bureau of Economic Analysis reported that annualized U.S. gross domestic product (GDP) growth for the quarter was 2.8%. The rate of inflation was below the U.S. Federal Reserve’s (Fed’s) targets.
Economic momentum increased in Europe; the European Central Bank (ECB) held its rates steady at low levels and continued its quantitative easing bond-buying program with the goal of sparking economic activity. In emerging markets, many countries benefited from stronger currencies versus the U.S. dollar while commodity price increases benefited countries that rely on natural resources for exports.
| 1 | The S&P 500 Index consists of 500 stocks chosen for market size, liquidity, and industry group representation. It is a market-value-weighted index with each stock’s weight in the index proportionate to its market value. You cannot invest directly in an index. |
| 2 | The Morgan Stanley Capital International (MSCI) All Country World Index (ACWI) ex USA Index (Net) is a free-float-adjusted market-capitalization-weighted index that is designed to measure the equity market performance of developed markets, excluding the United States and Canada. Source: MSCI. MSCI makes no express or implied warranties or representations and shall have no liability whatsoever with respect to any MSCI data contained herein. The MSCI data may not be further redistributed or used as a basis for other indices or any securities or financial products. This report is not approved, reviewed, or produced by MSCI. You cannot invest directly in an index. |
| 3 | The MSCI Emerging Markets (EM) Index (Net) is a free-float-adjusted market-capitalization-weighted index that is designed to measure large- and mid-cap equity market performance of emerging markets. The MSCI EM Index (Net) consists of the following 24 emerging market country indices: Brazil, Chile, China, Colombia, Czech Republic, Egypt, Greece, Hungary, India, Indonesia, Korea, Malaysia, Mexico, Pakistan, Peru, the Philippines, Poland, Qatar, Russia, South Africa, Taiwan, Thailand, Turkey, and the United Arab Emirates. You cannot invest directly in an index. |
| 4 | The Bloomberg Barclays U.S. Aggregate Bond Index is a broad-based benchmark that measures the investment-grade, U.S. dollar-denominated, fixed-rate taxable bond market, including Treasuries, government-related and corporate securities, mortgage-backed securities (agency fixed-rate and hybrid adjustable-rate mortgage pass-throughs), asset-backed securities, and commercial mortgage-backed securities. You cannot invest directly in an index. |
| 5 | The Bloomberg Barclays Global Aggregate ex-USD Index is an unmanaged index that provides a broad-based measure of the global investment-grade fixed-income markets excluding the U.S. dollar-denominated debt market. You cannot invest directly in an index. |
| 6 | The Bloomberg Barclays Municipal Bond Index is an unmanaged index composed of long-term tax-exempt bonds with a minimum credit rating of Baa. You cannot invest directly in an index. |
| 7 | The ICE BofAML U.S. High Yield Index is a market-capitalization-weighted index of domestic and Yankee high-yield bonds. The index tracks the performance of high-yield securities traded in the U.S. bond market. You cannot invest directly in an index. Copyright 2018. ICE Data Indices, LLC. All rights reserved. |
| 8 | The Consumer Price Index For All Urban Consumers (CPI-U) measures the changes in the price of a basket of goods and services purchased by urban consumers. The urban consumer population is deemed by many as a better representative measure of the general public because most of the country’s population lives in highly populated areas, which represent close to 90% of the total population. You cannot invest directly in an index. |
| | | | | | |
| Letter to shareholders (unaudited) | | Wells Fargo Premier Large Company Growth Fund | | | 3 | |
The fourth quarter of 2017 was characterized by continued optimism in the U.S.
By the end of 2017, some observers were describing conditions as a Goldilocks economic scenario: synchronized global growth, low inflation, and healthy corporate earnings, all supported abroad by a weaker U.S. dollar.
U.S. stocks continued to rally during the fourth quarter of 2017, boosted by favorable company earnings and the potential for tax reform and industry deregulation. The Fed increased rates by 25 basis points (bps; 100 bps equal 1.00%) in December. The annualized GDP growth rate for the fourth quarter was 2.3%.
Internationally, the Bank of England (BoE) raised interest rates in November 2017 to 0.50%, the first increase in more than 10 years and a move up from the 0.25% rate put in place after the Brexit vote to leave the European Union in June 2016. The pound gained against other currencies. Meanwhile, the ECB and the Bank of Japan maintained interest rate policies and bond-buying programs intended to spur business activities and enhance the attractiveness of equity investments. The People’s Bank of China (PBOC) also continued policies that encouraged business investment. International equity markets, particularly emerging markets, continued to show strength.
Volatility reemerged during the first quarter of 2018 as economic signals were mixed.
The first quarter of 2018 began with stock market gains in January following U.S. tax reform that lowered rates for individuals and corporations and deregulation advanced in some economic sectors. Then, investor optimism was supplanted by several concerns. Trade tensions intensified, particularly between the U.S. and China. The U.S. threatened to impose tariffs on a broad range of imported products. Increasing interest rates and inflation also caused concern. During February 2018, the U.S. stock market endured a loss of more than 10% before recovering in March and April. The S&P 500 Index closed the first quarter with a negative return, the first negative quarterly return for the index since 2014.
The Fed increased the federal funds rate by 25 bps in March 2018 and the rate of inflation reached the Fed’s 2% target for the first time in a year. The unemployment rate fell to 4.1%. The third revision of first-quarter GDP growth by the U.S. Bureau of Economic Analysis released during June 2018 was lowered to 2.0%.
Overseas, investment market returns reversed the strong returns of 2017. After having gained 27.19% for the 12-month period that ended December 31, 2017, the MSCI ACWI ex USA Index (Net) fell 1.46% for the 7-month period that ended July 31, 2018. The U.S. dollar strengthened relative to local currencies, which served to restrain returns.
Global trade tensions escalated during the second quarter and into the third quarter of 2018.
Global trade tensions escalated as the second quarter of 2018 opened and equity markets fell in response before resuming upward momentum later in April. The U.S. government imposed tariffs on products and commodities imported from other markets in North America, Europe, and Asia. In retaliation, governments imposed tariffs on U.S. products and commodities. In addition, the U.S. pushed its North American neighbors to renegotiate the North American Free Trade Agreement, furthering trade tensions and investor uncertainty.
The CPI-U8 added 0.2% in May after a similar increase in April. On a year-over-year basis, the all-items index rose 2.8% for the 12 months that ended May 31, continuing its upward trend since the beginning of the year. The index for all items less food and energy rose 2.2% for the same 12-month period. Interest rates generally increased and the bond markets tended to decline.
During February 2018, the U.S. stock market endured a loss of more than 10% before recovering in March and April.
| | | | |
| 4 | | Wells Fargo Premier Large Company Growth Fund | | Letter to shareholders (unaudited) |
During June 2018, the Fed increased the federal funds rate by 25 bps. Investment markets began to anticipate two more rate increases in 2018. Long-term interest rates in the U.S. trended higher—rates on the 10-year and 30-year Treasury bonds moved from 2.46% and 2.81%, respectively, on January 1, 2018, to 2.96% and 3.08%, respectively, on July 31, 2018. While higher at the end of the period, rates were off their peak levels on May 17, 2018, of 3.11% and 3.25%, respectively. Investors became more aware of and concerned about the potential for an inverted yield curve—sometimes a recession signal—as short-term rates increased more quickly than long-term rates.
The unemployment rate fell to 3.9% in July after ticking up slightly in June from May’s 3.8% level, according to the U.S. Department of Labor. The annualized rate of GDP growth for the second quarter of 2018 was reported in July to be 4.1%, the highest level since the third quarter of 2014, according to the U.S. Bureau of Economic Analysis.
Internationally, the prospects for a smooth U.K. Brexit agreement was cast into doubt as members of Prime Minister Theresa May’s negotiating team resigned. Despite the uncertainty, the period closed with expectations that the BoE’s Monetary Policy Committee in July would announce an increase in its key interest rate to 0.75%, which it did in early August.
Meanwhile, central banks in Europe and Japan maintained low interest rates and accommodative monetary policies. Amid rising trade uncertainty, PBOC monetary policies shifted with cuts to reserve requirement ratios and implementation of supportive measures such as accelerated infrastructure spending and tax cuts for small and medium enterprises and for individuals. Nevertheless, a strengthening U.S. dollar and the tensions associated with trade policies remained headwinds for investors overseas.
Don’t let short-term uncertainty derail long-term investment goals.
Periods of investment uncertainty can present challenges, but experience has taught us that maintaining long-term investment goals can be an effective way to plan for the future. To help you create a sound strategy based on your personal goals and risk tolerance, Wells Fargo Funds offers more than 100 mutual funds spanning a wide range of asset classes and investment styles. Although diversification cannot guarantee an investment profit or prevent losses, we believe it can be an effective way to manage investment risk and potentially smooth out overall portfolio performance. We encourage investors to know their investments and to understand that appropriate levels of risk-taking may unlock opportunities.
Thank you for choosing to invest with Wells Fargo Funds. We appreciate your confidence in us and remain committed to helping you meet your financial needs.
Sincerely,

Andrew Owen
President
Wells Fargo Funds
| | | | | | |
| Letter to shareholders (unaudited) | | Wells Fargo Premier Large Company Growth Fund | | | 5 | |
Notice to shareholders
At a meeting held on August 14-15, 2018, the Board of Trustees of the Fund approved the following policy which will be effective on or about February 5, 2019:
Class C shares will convert automatically into Class A shares ten years after the initial date of purchase or, if you acquired your Class C shares through an exchange or conversion from another share class, ten years after the date you acquired your Class C shares. When Class C shares that you acquired through a purchase or exchange convert, any other Class C shares that you purchased with reinvested dividends and distributions also will convert into Class A shares on a pro rata basis. A shorter holding period may also apply depending on your intermediary. Please see “Appendix A—Sales Charge Reductions and Waivers for Certain Intermediaries” in the Fund’s prospectus or at the end of this report.
For further information about your Fund, contact your investment professional, visit our website at wellsfargofunds.com, or call us directly at 1-800-222-8222.
| | | | |
| 6 | | Wells Fargo Premier Large Company Growth Fund | | Performance highlights (unaudited) |
Investment objective
The Fund seeks long-term capital appreciation.
Manager
Wells Fargo Funds Management, LLC
Subadviser
Wells Capital Management Incorporated
Portfolio managers
Joseph M. Eberhardy, CFA®, CPA
Robert Gruendyke, CFA®‡
Thomas C. Ognar, CFA®
Average annual total returns (%) as of July 31, 20181
| | | | | | | | | | | | | | | | | | | | | | | | | | | | | | | | | | |
| | | | | Including sales charge | | | Excluding sales charge | | | Expense ratios2 (%) | |
| | | Inception date | | 1 year | | | 5 year | | | 10 year | | | 1 year | | | 5 year | | | 10 year | | | Gross | | | Net3 | |
| Class A (EKJAX) | | 1-20-1998 | | | 19.24 | | | | 11.95 | | | | 11.62 | | | | 26.54 | | | | 13.29 | | | | 12.29 | | | | 1.14 | | | | 1.11 | |
| Class C (EKJCX) | | 1-22-1998 | | | 24.68 | | | | 12.45 | | | | 11.45 | | | | 25.68 | | | | 12.45 | | | | 11.45 | | | | 1.89 | | | | 1.86 | |
| Class R4 (EKJRX) | | 11-30-2012 | | | – | | | | – | | | | – | | | | 27.06 | | | | 13.66 | | | | 12.64 | | | | 0.86 | | | | 0.80 | |
| Class R6 (EKJFX) | | 11-30-2012 | | | – | | | | – | | | | – | | | | 27.27 | | | | 13.82 | | | | 12.74 | | | | 0.71 | | | | 0.65 | |
| Administrator Class (WFPDX) | | 7-16-2010 | | | – | | | | – | | | | – | | | | 26.70 | | | | 13.45 | | | | 12.43 | | | | 1.06 | | | | 1.00 | |
| Institutional Class (EKJYX) | | 6-30-1999 | | | – | | | | – | | | | – | | | | 27.17 | | | | 13.77 | | | | 12.71 | | | | 0.81 | | | | 0.70 | |
| Russell 1000® Growth Index4 | | – | | | – | | | | – | | | | – | | | | 22.84 | | | | 15.83 | | | | 12.37 | | | | – | | | | – | |
Figures quoted represent past performance, which is no guarantee of future results, and do not reflect taxes that a shareholder may pay on fund distributions or the redemption of fund shares. Investment return and principal value of an investment will fluctuate so that an investor’s shares, when redeemed, may be worth more or less than their original cost. Performance shown without sales charges would be lower if sales charges were reflected. Current performance may be lower or higher than the performance data quoted, which assumes the reinvestment of dividends and capital gains. Current month-end performance is available on the Fund’s website, wellsfargofunds.com.
Please keep in mind that high double-digit returns were primarily achieved during favorable market conditions. You should not expect that such favorable returns can be consistently achieved. A fund’s performance, especially for short time periods, should not be the sole factor in making your investment decision.
Index returns do not include transaction costs associated with buying and selling securities, any mutual fund fees or expenses, or any taxes. It is not possible to invest directly in an index.
For Class A shares, the maximum front-end sales charge is 5.75%. For Class C shares, the maximum contingent deferred sales charge is 1.00%. Performance including a contingent deferred sales charge assumes the sales charge for the corresponding time period. Class R4, Class R6, Administrator Class, and Institutional Class shares are sold without a front-end sales charge or contingent deferred sales charge.
Stock values fluctuate in response to the activities of individual companies and general market and economic conditions. Certain investment strategies tend to increase the total risk of an investment (relative to the broader market). The Fund is exposed to foreign investment risk. Consult the Fund’s prospectus for additional information on these and other risks.
Please see footnotes on page 7.
| | | | | | |
| Performance highlights (unaudited) | | Wells Fargo Premier Large Company Growth Fund | | | 7 | |
|
Growth of $10,000 investment as of July 31, 20185 |
|
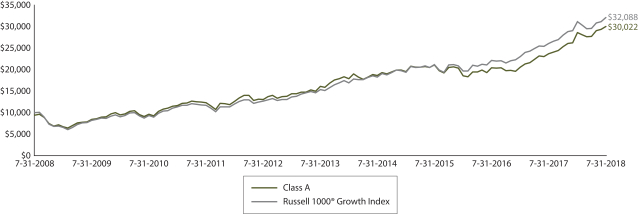 |
| ‡ | Mr. Gruendyke became a portfolio manager of the Fund on December 1, 2017. |
| 1 | Historical performance shown for Class R4 shares prior to their inception reflects the performance of Institutional Class shares, adjusted to reflect the higher expenses applicable to Class R4 shares. Historical performance shown for Class R6 shares prior to their inception reflects the performance of Institutional Class shares, and includes the higher expenses applicable to Institutional Class shares. If these expenses had not been included, returns for Class R6 shares would be higher. Historical performance shown for Administrator Class shares prior to their inception reflects the performance of Institutional Class shares, adjusted to reflect the higher expenses applicable to Administrator Class shares. Historical performance shown for all classes of the Fund prior to July 19, 2010, is based on the performance of the Fund’s predecessor, Evergreen Large Company Growth Fund. |
| 2 | Reflects the expense ratios as stated in the most recent prospectuses. The expense ratios shown are subject to change and may differ from the annualized expense ratios shown in the financial highlights of this report. |
| 3 | The manager has contractually committed through November 30, 2018, to waive fees and/or reimburse expenses to the extent necessary to cap the Fund’s Total Annual Fund Operating Expenses After Fee Waivers at the amounts shown. After this time, the cap may be increased or the commitment to maintain the cap may be terminated only with the approval of the Board of Trustees. Brokerage commissions, stamp duty fees, interest, taxes, acquired fund fees and expenses (if any), and extraordinary expenses are excluded from the expense cap. Without this cap, the Fund’s returns would have been lower. The expense ratio paid by an investor is the net expense ratio (the total annual fund operating expenses after fee waivers) as stated in the prospectuses. |
| 4 | The Russell 1000® Growth Index measures the performance of those Russell 1000 companies with higher price/book ratios and higher forecasted growth values. You cannot invest directly in an index. |
| 5 | The chart compares the performance of Class A shares for the most recent ten years with the Russell 1000® Growth Index. The chart assumes a hypothetical investment of $10,000 in Class A shares and reflects all operating expenses and assumes the maximum initial sales charge of 5.75%. |
| 6 | The ten largest holdings, excluding cash, cash equivalents and any money market funds, are calculated based on the value of the investments divided by total net assets of the Fund. Holdings are subject to change and may have changed since the date specified. |
| 7 | Amounts are calculated based on the total long-term investments of the Fund. These amounts are subject to change and may have changed since the date specified. |
| | | | |
| 8 | | Wells Fargo Premier Large Company Growth Fund | | Performance highlights (unaudited) |
MANAGER’S DISCUSSION
Fund highlights
| ∎ | | The Fund outperformed its benchmark, the Russell 1000® Growth Index, for the 12-month period that ended July 31, 2018. |
| ∎ | | Holdings within consumer discretionary, industrials, information technology (IT), and materials and an underweight to consumer staples aided the Fund’s performance for the period. |
| ∎ | | The Fund’s performance was inhibited by stocks within the health care sector. |
The equity market has remained buoyant over the trailing one-year period as strong economic fundamentals have outweighed a series of geopolitical issues, many of which were exacerbated during the first half of 2018. Strong equity performance largely has been an earnings story as robust profits have supported the market, particularly companies benefiting from secular growth drivers. For example, the success of many of our holdings in gaining share in their respective rapidly growing vertical markets has led to strong growth in revenues, cash flow, and earnings for these companies. Despite the increased volatility that emerged during the beginning of 2018, we have managed to navigate the volatility in the market well, trading around the valuation gap of many of our holdings to generate outperformance. With monetary policy expected to tighten, we believe that a tempered rise in rates is beneficial to faster-growth equities as it mollifies the bond proxy trade that has been a headwind to our investing style in recent years.
| | | | |
| Ten largest holdings (%) as of July 31, 20186 | |
Amazon.com Incorporated | | | 7.44 | |
Alphabet Incorporated Class A | | | 6.23 | |
Microsoft Corporation | | | 4.06 | |
Visa Incorporated Class A | | | 3.95 | |
Facebook Incorporated Class A | | | 3.69 | |
Microchip Technology Incorporated | | | 2.91 | |
MasterCard Incorporated Class A | | | 2.82 | |
PayPal Holdings Incorporated | | | 2.53 | |
The Home Depot Incorporated | | | 2.12 | |
Texas Instruments Incorporated | | | 2.00 | |
Performance of consumer discretionary holdings benefited Fund performance.
Select holdings within the consumer discretionary sector were the best-performing area of the Fund. Robust e-commerce and retail sales were driven by strong spending data, which aided companies like Amazon.com, Incorporated, as well as discount retailers like Burlington Stores, Incorporated, with differentiated concepts that offer low prices, convenience, fresh inventory, and economies of scale that cater to a distinct demographic. In addition, select railroad holdings from the industrials sector contributed to performance as firms like Norfolk Southern Corporation reported strong rail volumes and effective cost discipline, which boosted its bottom line.
We remain overweight railroad companies due to their cost efficiencies and environmental benefits of shipping goods across the country.
|
| Sector distribution as of July 31, 20187 |
|
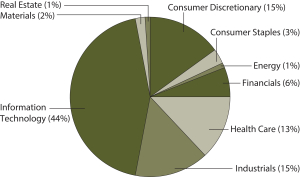 |
Other areas of the Fund that performed well were the high growth areas such as payment processing and software-as-a-service industries within IT that generated market-share penetration and margin expansion in their respective vertical markets. Within the payment space, the movement toward e-commerce has had a positive effect on overall demand as more consumers are moving from cash to digital payments. Within software, demand remained strong as corporate spending continued to rise, coupled with next-generation cloud computing platforms that garnered a disproportionate share of new business at the expense of legacy solutions in recent years. The Fund’s underweight to consumer staples
also added to relative performance as many high-dividend-yielding equities have struggled in conjunction with a rise in fixed-income yields.
Please see footnotes on page 7.
| | | | | | |
| Performance highlights (unaudited) | | Wells Fargo Premier Large Company Growth Fund | | | 9 | |
Certain health care holdings detracted from performance.
Select holdings in the health care sector inhibited relative returns during the period. Biotechnology stocks like Alexion Pharmaceuticals, Incorporated, retraced prior price gains after reporting less-than-inspiring earnings results, with increasing competition impending on some of their key drugs. Throughout the course of the period, we reduced our exposure to the health care sector and the biotechnology industry within it. Although we believe that the industry remains innovative, many larger biopharma companies are facing questions around competition in existing core franchises and sustainability of growth after the future loss of exclusivity in key drugs.
Our view of faster-growth stocks is positive.
We are very positive on the outlook for faster-growth stocks, a core focus of our investment process. Many of these companies are trading at attractive valuations relative to the rest of the market. Additionally, many of our portfolio companies have continued to deliver strong revenue, cash flow, and earnings growth, which were rewarded by the market during the period. We believe that market leadership by growth stocks has been influenced by strong earnings fundamentals over the past several quarters. We also contend that growth companies should benefit from tax reform, influenced by their ability to retain much of the additional post-tax-reform profits. This is in contrast to many cyclical value-oriented names where, in our analysis, the tax benefits have been largely arbitraged away. Going forward, the faster-growing stocks emphasized in our investment process should continue to drive robust growth through pricing power and strong customer demand in an environment of slightly increased costs and uneven global growth trends.
| | | | |
| 10 | | Wells Fargo Premier Large Company Growth Fund | | Fund expenses (unaudited) |
As a shareholder of the Fund, you incur two types of costs: (1) transaction costs, including sales charges (loads) on purchase payments and contingent deferred sales charges (if any) on redemptions and (2) ongoing costs, including management fees, distribution (12b-1) and/or shareholder servicing fees, and other Fund expenses. This example is intended to help you understand your ongoing costs (in dollars) of investing in the Fund and to compare these costs with the ongoing costs of investing in other mutual funds.
The example is based on an investment of $1,000 invested at the beginning of the six-month period and held for the entire period from February 1, 2018 to July 31, 2018.
Actual expenses
The “Actual” line of the table below provides information about actual account values and actual expenses. You may use the information in this line, together with the amount you invested, to estimate the expenses that you paid over the period. Simply divide your account value by $1,000 (for example, an $8,600 account value divided by $1,000 = 8.6), then multiply the result by the number in the “Actual” line under the heading entitled “Expenses paid during period” for your applicable class of shares to estimate the expenses you paid on your account during this period.
Hypothetical example for comparison purposes
The “Hypothetical” line of the table below provides information about hypothetical account values and hypothetical expenses based on the Fund’s actual expense ratio and an assumed rate of return of 5% per year before expenses, which is not the Fund’s actual return. The hypothetical account values and expenses may not be used to estimate the actual ending account balance or expenses you paid for the period. You may use this information to compare the ongoing costs of investing in the Fund and other funds. To do so, compare this 5% hypothetical example with the 5% hypothetical examples that appear in the shareholder reports of the other funds.
Please note that the expenses shown in the table are meant to highlight your ongoing costs only and do not reflect any transactional costs, such as sales charges (loads) and contingent deferred sales charges. Therefore, the “Hypothetical” line of the table is useful in comparing ongoing costs only and will not help you determine the relative total costs of owning different funds. In addition, if these transactional costs were included, your costs would have been higher.
| | | | | | | | | | | | | | | | |
| | | Beginning
account value
2-1-2018 | | | Ending
account value
7-31-2018 | | | Expenses
paid during
the period¹ | | | Annualized net
expense ratio | |
Class A | | | | | | | | | | | | | | | | |
Actual | | $ | 1,000.00 | | | $ | 1,049.34 | | | $ | 5.73 | | | | 1.11 | % |
Hypothetical (5% return before expenses) | | $ | 1,000.00 | | | $ | 1,019.61 | | | $ | 5.65 | | | | 1.11 | % |
Class C | | | | | | | | | | | | | | | | |
Actual | | $ | 1,000.00 | | | $ | 1,045.81 | | | $ | 9.59 | | | | 1.86 | % |
Hypothetical (5% return before expenses) | | $ | 1,000.00 | | | $ | 1,015.83 | | | $ | 9.45 | | | | 1.86 | % |
Class R4 | | | | | | | | | | | | | | | | |
Actual | | $ | 1,000.00 | | | $ | 1,051.61 | | | $ | 4.14 | | | | 0.80 | % |
Hypothetical (5% return before expenses) | | $ | 1,000.00 | | | $ | 1,021.17 | | | $ | 4.08 | | | | 0.80 | % |
Class R6 | | | | | | | | | | | | | | | | |
Actual | | $ | 1,000.00 | | | $ | 1,052.39 | | | $ | 3.36 | | | | 0.65 | % |
Hypothetical (5% return before expenses) | | $ | 1,000.00 | | | $ | 1,021.93 | | | $ | 3.31 | | | | 0.65 | % |
Administrator Class | | | | | | | | | | | | | | | | |
Actual | | $ | 1,000.00 | | | $ | 1,049.93 | | | $ | 5.17 | | | | 1.00 | % |
Hypothetical (5% return before expenses) | | $ | 1,000.00 | | | $ | 1,020.16 | | | $ | 5.09 | | | | 1.00 | % |
Institutional Class | | | | | | | | | | | | | | | | |
Actual | | $ | 1,000.00 | | | $ | 1,051.86 | | | $ | 3.62 | | | | 0.70 | % |
Hypothetical (5% return before expenses) | | $ | 1,000.00 | | | $ | 1,021.68 | | | $ | 3.57 | | | | 0.70 | % |
| 1 | Expenses paid is equal to the annualized net expense ratio of each class multiplied by the average account value over the period, multiplied by the number of days in the most recent fiscal half-year divided by the number of days in the fiscal year (to reflect the one-half-year period). |
| | | | | | |
| Portfolio of investments—July 31, 2018 | | Wells Fargo Premier Large Company Growth Fund | | | 11 | |
| | | | | | | | | | | | | | | | |
| Security name | | | | | | | | Shares | | | Value | |
| | | |
Common Stocks: 99.71% | | | | | | | | | | | | | |
| | | | |
Consumer Discretionary: 15.56% | | | | | | | | | | | | | | | | |
|
| Hotels, Restaurants & Leisure: 0.89% | |
Royal Caribbean Cruises Limited | | | | | | | | | | | 200,320 | | | $ | 22,588,083 | |
| | | | | | | | | | | | | | | | |
|
| Internet & Direct Marketing Retail: 7.92% | |
Amazon.com Incorporated † | | | | | | | | | | | 106,800 | | | | 189,830,592 | |
Netflix Incorporated † | | | | | | | | | | | 36,610 | | | | 12,354,045 | |
| | | | |
| | | | | | | | | | | | | | | 202,184,637 | |
| | | | | | | | | | | | | | | | |
|
| Media: 0.99% | |
Live Nation Incorporated † | | | | | | | | | | | 513,510 | | | | 25,305,773 | |
| | | | | | | | | | | | | | | | |
|
| Multiline Retail: 0.73% | |
Dollar Tree Incorporated † | | | | | | | | | | | 203,850 | | | | 18,607,428 | |
| | | | | | | | | | | | | | | | |
|
| Specialty Retail: 5.03% | |
Burlington Stores Incorporated † | | | | | | | | | | | 218,420 | | | | 33,376,760 | |
O’Reilly Automotive Incorporated † | | | | | | | | | | | 73,650 | | | | 22,536,900 | |
The Home Depot Incorporated | | | | | | | | | | | 273,640 | | | | 54,049,373 | |
ULTA Beauty Incorporated † | | | | | | | | | | | 75,400 | | | | 18,427,006 | |
| | | | |
| | | | | | | | | | | | | | | 128,390,039 | |
| | | | | | | | | | | | | | | | |
|
Consumer Staples: 3.44% | |
|
| Beverages: 1.55% | |
Constellation Brands Incorporated Class A | | | | | | | | | | | 113,150 | | | | 23,787,525 | |
The Coca-Cola Company | | | | | | | | | | | 336,490 | | | | 15,690,529 | |
| | | | |
| | | | | | | | | | | | | | | 39,478,054 | |
| | | | | | | | | | | | | | | | |
|
| Food & Staples Retailing: 1.13% | |
Costco Wholesale Corporation | | | | | | | | | | | 131,590 | | | | 28,780,049 | |
| | | | | | | | | | | | | | | | |
|
| Personal Products: 0.76% | |
The Estee Lauder Companies Incorporated Class A | | | | | | | | | | | 144,370 | | | | 19,481,288 | |
| | | | | | | | | | | | | | | | |
|
Energy: 1.08% | |
|
| Oil, Gas & Consumable Fuels: 1.08% | |
Concho Resources Incorporated † | | | | | | | | | | | 188,470 | | | | 27,488,350 | |
| | | | | | | | | | | | | | | | |
|
Financials: 5.71% | |
|
| Capital Markets: 5.71% | |
CME Group Incorporated | | | | | | | | | | | 226,810 | | | | 36,090,007 | |
E*TRADE Financial Corporation † | | | | | | | | | | | 170,100 | | | | 10,173,681 | |
MarketAxess Holdings Incorporated | | | | | | | | | | | 159,610 | | | | 30,927,630 | |
Raymond James Financial Incorporated | | | | | | | | | | | 287,646 | | | | 26,345,497 | |
TD Ameritrade Holding Corporation | | | | | | | | | | | 222,760 | | | | 12,730,734 | |
The Charles Schwab Corporation | | | | | | | | | | | 575,610 | | | | 29,390,647 | |
| | | | |
| | | | | | | | | | | | | | | 145,658,196 | |
| | | | | | | | | | | | | | | | |
The accompanying notes are an integral part of these financial statements.
| | | | |
| 12 | | Wells Fargo Premier Large Company Growth Fund | | Portfolio of investments—July 31, 2018 |
| | | | | | | | | | | | | | | | |
| Security name | | | | | | | | Shares | | | Value | |
|
Health Care: 12.73% | |
|
| Biotechnology: 4.71% | |
Agios Pharmaceuticals Incorporated † | | | | | | | | | | | 118,820 | | | $ | 10,267,236 | |
Alexion Pharmaceuticals Incorporated † | | | | | | | | | | | 158,940 | | | | 21,132,662 | |
BioMarin Pharmaceutical Incorporated † | | | | | | | | | | | 52,200 | | | | 5,249,232 | |
Neurocrine Biosciences Incorporated † | | | | | | | | | | | 232,900 | | | | 23,404,121 | |
Sage Therapeutics Incorporated † | | | | | | | | | | | 80,050 | | | | 11,552,816 | |
Vertex Pharmaceuticals Incorporated † | | | | | | | | | | | 277,930 | | | | 48,651,647 | |
| | | | |
| | | | | | | | | | | | | | | 120,257,714 | |
| | | | | | | | | | | | | | | | |
|
| Health Care Equipment & Supplies: 2.82% | |
Abbott Laboratories | | | | | | | | | | | 299,600 | | | | 19,635,784 | |
Boston Scientific Corporation † | | | | | | | | | | | 991,750 | | | | 33,332,718 | |
Edwards Lifesciences Corporation † | | | | | | | | | | | 27,810 | | | | 3,961,535 | |
Intuitive Surgical Incorporated † | | | | | | | | | | | 29,360 | | | | 14,920,458 | |
| | | | |
| | | | | | | | | | | | | | | 71,850,495 | |
| | | | | | | | | | | | | | | | |
|
| Health Care Providers & Services: 0.86% | |
Centene Corporation † | | | | | | | | | | | 169,160 | | | | 22,046,623 | |
| | | | | | | | | | | | | | | | |
|
| Health Care Technology: 0.66% | |
Veeva Systems Incorporated Class A † | | | | | | | | | | | 223,930 | | | | 16,935,826 | |
| | | | | | | | | | | | | | | | |
|
| Life Sciences Tools & Services: 2.08% | |
Agilent Technologies Incorporated | | | | | | | | | | | 336,290 | | | | 22,208,592 | |
PRA Health Sciences Incorporated † | | | | | | | | | | | 293,900 | | | | 30,900,646 | |
| | | | |
| | | | | | | | | | | | | | | 53,109,238 | |
| | | | | | | | | | | | | | | | |
|
| Pharmaceuticals: 1.60% | |
Zoetis Incorporated | | | | | | | | | | | 470,298 | | | | 40,671,371 | |
| | | | | | | | | | | | | | | | |
|
Industrials:14.61% | |
|
| Aerospace & Defense: 2.51% | |
HEICO Corporation | | | | | | | | | | | 225,733 | | | | 17,239,153 | |
The Boeing Company | | | | | | | | | | | 131,220 | | | | 46,753,686 | |
| | | | |
| | | | | | | | | | | | | | | 63,992,839 | |
| | | | | | | | | | | | | | | | |
|
| Air Freight & Logistics: 1.08% | |
FedEx Corporation | | | | | | | | | | | 5,780 | | | | 1,421,129 | |
XPO Logistics Incorporated † | | | | | | | | | | | 262,010 | | | | 26,127,637 | |
| | | | |
| | | | | | | | | | | | | | | 27,548,766 | |
| | | | | | | | | | | | | | | | |
|
| Airlines: 0.88% | |
Southwest Airlines Company | | | | | | | | | | | 387,450 | | | | 22,534,092 | |
| | | | | | | | | | | | | | | | |
|
| Commercial Services & Supplies: 2.69% | |
KAR Auction Services Incorporated | | | | | | | | | | | 497,287 | | | | 29,563,712 | |
Waste Connections Incorporated | | | | | | | | | | | 504,155 | | | | 39,127,470 | |
| | | | |
| | | | | | | | | | | | | | | 68,691,182 | |
| | | | | | | | | | | | | | | | |
The accompanying notes are an integral part of these financial statements.
| | | | | | |
| Portfolio of investments—July 31, 2018 | | Wells Fargo Premier Large Company Growth Fund | | | 13 | |
| | | | | | | | | | | | | | | | |
| Security name | | | | | | | | Shares | | | Value | |
|
| Construction & Engineering: 0.51% | |
MasTec Incorporated † | | | | | | | | | | | 279,310 | | | $ | 13,001,881 | |
| | | | | | | | | | | | | | | | |
|
| Industrial Conglomerates: 1.08% | |
Honeywell International Incorporated | | | | | | | | | | | 173,400 | | | | 27,683,310 | |
| | | | | | | | | | | | | | | | |
|
| Machinery: 1.04% | |
Fortive Corporation | | | | | | | | | | | 322,065 | | | | 26,435,095 | |
| | | | | | | | | | | | | | | | |
|
| Professional Services: 1.85% | |
CoStar Group Incorporated † | | | | | | | | | | | 79,290 | | | | 32,972,747 | |
TransUnion | | | | | | | | | | | 196,640 | | | | 14,236,736 | |
| | | | |
| | | | | | | | | | | | | | | 47,209,483 | |
| | | | | | | | | | | | | | | | |
|
| Road & Rail: 2.97% | |
CSX Corporation | | | | | | | | | | | 150,930 | | | | 10,667,732 | |
Norfolk Southern Corporation | | | | | | | | | | | 139,960 | | | | 23,653,240 | |
Union Pacific Corporation | | | | | | | | | | | 276,160 | | | | 41,393,622 | |
| | | | |
| | | | | | | | | | | | | | | 75,714,594 | |
| | | | | | | | | | | | | | | | |
|
Information Technology: 43.98% | |
|
| Electronic Equipment, Instruments & Components: 1.04% | |
TE Connectivity Limited | | | | | | | | | | | 282,890 | | | | 26,470,017 | |
| | | | | | | | | | | | | | | | |
|
| Internet Software & Services: 12.28% | |
Alibaba Group Holding Limited ADR † | | | | | | | | | | | 40,690 | | | | 7,618,389 | |
Alphabet Incorporated Class A † | | | | | | | | | | | 129,560 | | | | 158,998,623 | |
Alphabet Incorporated Class C † | | | | | | | | | | | 20,588 | | | | 25,060,949 | |
Facebook Incorporated Class A † | | | | | | | | | | | 545,430 | | | | 94,130,309 | |
Match Group Incorporated †« | | | | | | | | | | | 230,890 | | | | 8,339,747 | |
MercadoLibre Incorporated | | | | | | | | | | | 21,310 | | | | 7,307,412 | |
Shopify Incorporated Class A †« | | | | | | | | | | | 85,200 | | | | 11,775,492 | |
| | | | |
| | | | | | | | | | | | | | | 313,230,921 | |
| | | | | | | | | | | | | | | | |
|
| IT Services: 10.85% | |
Euronet Worldwide Incorporated † | | | | | | | | | | | 20,656 | | | | 1,899,113 | |
Global Payments Incorporated | | | | | | | | | | | 160,410 | | | | 18,057,354 | |
MasterCard Incorporated Class A | | | | | | | | | | | 363,890 | | | | 72,050,220 | |
PayPal Holdings Incorporated † | | | | | | | | | | | 785,080 | | | | 64,486,471 | |
Square Incorporated Class A † | | | | | | | | | | | 300,570 | | | | 19,431,851 | |
Visa Incorporated Class A | | | | | | | | | | | 737,720 | | | | 100,875,833 | |
| | | | |
| | | | | | | | | | | | | | | 276,800,842 | |
| | | | | | | | | | | | | | | | |
|
| Semiconductors & Semiconductor Equipment: 6.73% | |
Broadcom Incorporated | | | | | | | | | | | 3,703 | | | | 821,214 | |
Microchip Technology Incorporated « | | | | | | | | | | | 794,130 | | | | 74,195,566 | |
Monolithic Power Systems Incorporated | | | | | | | | | | | 95,010 | | | | 12,605,927 | |
NVIDIA Corporation | | | | | | | | | | | 134,500 | | | | 32,933,670 | |
Texas Instruments Incorporated | | | | | | | | | | | 458,390 | | | | 51,027,975 | |
| | | | |
| | | | | | | | | | | | | | | 171,584,352 | |
| | | | | | | | | | | | | | | | |
The accompanying notes are an integral part of these financial statements.
| | | | |
| 14 | | Wells Fargo Premier Large Company Growth Fund | | Portfolio of investments—July 31, 2018 |
| | | | | | | | | | | | | | | | |
| Security name | | | | | | | | Shares | | | Value | |
|
| Software: 12.55% | |
Activision Blizzard Incorporated | | | | | | | | | | | 303,230 | | | $ | 22,263,147 | |
Adobe Systems Incorporated † | | | | | | | | | | | 167,499 | | | | 40,983,655 | |
Microsoft Corporation | | | | | | | | | | | 976,740 | | | | 103,612,579 | |
Pivotal Software Incorporated Class A † | | | | | | | | | | | 454,456 | | | | 10,429,765 | |
Proofpoint Incorporated † | | | | | | | | | | | 181,080 | | | | 20,652,174 | |
RealPage Incorporated † | | | | | | | | | | | 232,480 | | | | 12,809,648 | |
salesforce.com Incorporated † | | | | | | | | | | | 304,300 | | | | 41,734,745 | |
ServiceNow Incorporated † | | | | | | | | | | | 142,800 | | | | 25,127,088 | |
Splunk Incorporated † | | | | | | | | | | | 51,055 | | | | 4,906,386 | |
Take-Two Interactive Software Incorporated † | | | | | | | | | | | 185,870 | | | | 21,007,027 | |
Ultimate Software Group Incorporated † | | | | | | | | | | | 60,522 | | | | 16,757,937 | |
| | | | |
| | | | | | | | | | | | | | | 320,284,151 | |
| | | | | | | | | | | | | | | | |
|
| Technology Hardware, Storage & Peripherals: 0.53% | |
Apple Incorporated | | | | | | | | 71,630 | | | | 13,630,473 | |
| | | | | | | | | | | | | | | | |
|
Materials: 1.89% | |
|
| Chemicals: 1.89% | |
Praxair Incorporated | | | | | | | | 287,200 | | | | 48,106,000 | |
| | | | | | | | | | | | | | | | |
|
Real Estate: 0.71% | |
|
| Real Estate Management & Development: 0.71% | |
CBRE Group Incorporated Class A † | | | | | | | | 363,770 | | | | 18,115,740 | |
| | | | | | | | | | | | | | | | |
| |
Total Common Stocks (Cost $1,363,382,252) | | | | 2,543,866,902 | |
| | | | | | | | | | | | | | | | |
| | | | |
| | | Yield | | | | | | | | | | |
| Short-Term Investments: 4.08% | |
|
| Investment Companies: 4.08% | |
Securities Lending Cash Investment LLC (l)(r)(u) | | | 2.10 | % | | | | | | | 94,411,945 | | | | 94,421,386 | |
Wells Fargo Government Money Market Fund Select Class (l)(u) | | | 1.83 | | | | | | | | 9,566,578 | | | | 9,566,578 | |
| |
Total Short-Term Investments (Cost $103,987,964) | | | | 103,987,964 | |
| | | | | | | | | | | | | | | | |
| | | | | | | | |
| Total investments in securities (Cost $1,467,370,216) | | | 103.79 | % | | | 2,647,854,866 | |
Other assets and liabilities, net | | | (3.79 | ) | | | (96,681,440 | ) |
| | | | | | | | |
| Total net assets | | | 100.00 | % | | $ | 2,551,173,426 | |
| | | | | | | | |
| † | Non-income-earning security |
| « | All or a portion of this security is on loan. |
| (l) | The issuer of the security is an affiliated person of the Fund as defined in the Investment Company Act of 1940. |
| (r) | The investment is a non-registered investment company purchased with cash collateral received from securities on loan. |
| (u) | The rate represents the 7-day annualized yield at period end. |
Abbreviations:
| ADR | American depositary receipt |
The accompanying notes are an integral part of these financial statements.
| | | | | | |
| Portfolio of investments—July 31, 2018 | | Wells Fargo Premier Large Company Growth Fund | | | 15 | |
Investments in Affiliates
An affiliated investment is an investment in which the Fund owns at least 5% of the outstanding voting shares of the issuer or as a result of other relationships, such as the Fund and the issuer having the same investment manager. Transactions with issuers that were either affiliated persons of the Fund at the beginning of the period or the end of the period were as follows:
| | | | | | | | | | | | | | | | | | | | | | | | | | | | | | | | | | | | |
| | | Shares, beginning of period | | | Shares purchased | | | Shares sold | | | Shares, end of period | | | Net
realized
gains
(losses) | | | Net
change in
unrealized
gains
(losses) | | | Income
from
affiliated
securities | | | Value, end of period | | | % of net
assets | |
Short-Term Investments | | | | | | | | | | | | | | | | | | | | | | | | | | | | | | | | | | | | |
Investment Companies | | | | | | | | | | | | | | | | | | | | | | | | | | | | | | | | | | | | |
Securities Lending Cash Investment LLC | | | 46,026,258 | | | | 631,669,909 | | | | 583,284,222 | | | | 94,411,945 | | | $ | 1,715 | | | $ | (1,715 | ) | | $ | 140,280 | | | $ | 94,421,386 | | | | | |
Wells Fargo Government Money Market Fund Select Class | | | 9,162,823 | | | | 574,522,273 | | | | 574,118,518 | | | | 9,566,578 | | | | 0 | | | | 0 | | | | 156,115 | | | | 9,566,578 | | | | | |
| | | | | | | | | | | | | | | | | | | | | | | | | | | | | | | | | | | | |
| | | | | | | | | | | | | | | | | | $ | 1,715 | | | $ | (1,715 | ) | | $ | 296,395 | | | $ | 103,987,964 | | | | 4.08 | % |
| | | | | | | | | | | | | | | | | | | | | | | | | | | | | | | | | | | | |
The accompanying notes are an integral part of these financial statements.
| | | | |
| 16 | | Wells Fargo Premier Large Company Growth Fund | | Statement of assets and liabilities—July 31, 2018 |
| | | | |
| | | | |
| |
Assets | | | | |
Investments in unaffiliated securities (including $91,945,385 of securities loaned, at value (cost $1,363,382,252) | | $ | 2,543,866,902 | |
Investments in affiliated securities, at value (cost $103,987,964) | | | 103,987,964 | |
Cash | | | 38 | |
Receivable for investments sold | | | 15,545,635 | |
Receivable for Fund shares sold | | | 1,599,202 | |
Receivable for dividends | | | 478,945 | |
Receivable for securities lending income | | | 22,811 | |
Prepaid expenses and other assets | | | 104,121 | |
| | | | |
Total assets | | | 2,665,605,618 | |
| | | | |
| |
Liabilities | | | | |
Payable upon receipt of securities loaned | | | 94,418,425 | |
Payable for investments purchased | | | 14,421,218 | |
Payable for Fund shares redeemed | | | 3,207,839 | |
Management fee payable | | | 1,307,273 | |
Administration fees payable | | | 355,724 | |
Distribution fee payable | | | 130,403 | |
Trustees’ fees and expenses payable | | | 1,489 | |
Accrued expenses and other liabilities | | | 589,821 | |
| | | | |
Total liabilities | | | 114,432,192 | |
| | | | |
Total net assets | | $ | 2,551,173,426 | |
| | | | |
| |
NET ASSETS CONSIST OF | | | | |
Paid-in capital | | $ | 1,075,065,830 | |
Accumulated net investment loss | | | (18,243 | ) |
Accumulated net realized gains on investments | | | 295,641,189 | |
Net unrealized gains on investments | | | 1,180,484,650 | |
| | | | |
Total net assets | | $ | 2,551,173,426 | |
| | | | |
| |
COMPUTATION OF NET ASSET VALUE AND OFFERING PRICE PER SHARE | | | | |
Net assets – Class A | | $ | 1,048,631,839 | |
Shares outstanding – Class A1 | | | 69,423,043 | |
Net asset value per share – Class A | | | $15.10 | |
Maximum offering price per share – Class A2 | | | $16.02 | |
Net assets – Class C | | $ | 201,137,668 | |
Shares outstanding – Class C1 | | | 16,943,609 | |
Net asset value per share – Class C | | | $11.87 | |
Net assets – Class R4 | | $ | 3,726,719 | |
Share outstanding – Class R41 | | | 237,561 | |
Net asset value per share – Class R4 | | | $15.69 | |
Net assets – Class R6 | | $ | 196,933,849 | |
Shares outstanding – Class R61 | | | 12,412,947 | |
Net asset value per share – Class R6 | | | $15.87 | |
Net assets – Administrator Class | | $ | 57,582,196 | |
Shares outstanding – Administrator Class1 | | | 3,750,597 | |
Net asset value per share – Administrator Class | | | $15.35 | |
Net assets – Institutional Class | | $ | 1,043,161,155 | |
Shares outstanding – Institutional Class1 | | | 65,941,880 | |
Net asset value per share – Institutional Class | | | $15.82 | |
| 1 | The Fund has an unlimited number of authorized shares. |
| 2 | Maximum offering price is computed as 100/94.25 of net asset value. On investments of $50,000 or more, the offering price is reduced. |
The accompanying notes are an integral part of these financial statements.
| | | | | | |
| Statement of operations—year ended July 31, 2018 | | Wells Fargo Premier Large Company Growth Fund | | | 17 | |
| | | | |
| | | | |
| |
Investment income | | | | |
Dividends (net of foreign withholding taxes of $39,501) | | $ | 18,690,844 | |
Income from affiliated securities | | | 296,395 | |
| | | | |
Total investment income | | | 18,987,239 | |
| | | | |
| |
Expenses | | | | |
Management fee | | | 16,327,413 | |
Administration fees | | | | |
Class A | | | 2,158,740 | |
Class C | | | 427,230 | |
Class R4 | | | 2,912 | |
Class R6 | | | 53,784 | |
Administrator Class | | | 94,117 | |
Institutional Class | | | 1,281,353 | |
Shareholder servicing fees | | | | |
Class A | | | 2,569,929 | |
Class C | | | 508,607 | |
Class R4 | | | 3,640 | |
Administrator Class | | | 180,725 | |
Distribution fee | | | | |
Class C | | | 1,525,821 | |
Custody and accounting fees | | | 162,714 | |
Professional fees | | | 53,951 | |
Registration fees | | | 130,254 | |
Shareholder report expenses | | | 216,101 | |
Trustees’ fees and expenses | | | 22,229 | |
Other fees and expenses | | | 76,635 | |
| | | | |
Total expenses | | | 25,796,155 | |
Less: Fee waivers and/or expense reimbursements | | | (1,783,639 | ) |
| | | | |
Net expenses | | | 24,012,516 | |
| | | | |
Net investment loss | | | (5,025,277 | ) |
| | | | |
| |
REALIZED AND UNREALIZED GAINS (LOSSES) ON INVESTMENTS | | | | |
| |
Net realized gains on: | | | | |
Unaffiliated securities | | | 395,032,523 | |
Affiliated securities | | | 1,715 | |
| | | | |
Net realized gains on investments | | | 395,034,238 | |
| | | | |
| |
Net change in unrealized gains (losses) on: | | | | |
Unaffiliated securities | | | 194,198,557 | |
Affiliated securities | | | (1,715 | ) |
| | | | |
Net change in unrealized gains (losses) on investments | | | 194,196,842 | |
| | | | |
Net realized and unrealized gains (losses) on investments | | | 589,231,080 | |
| | | | |
Net increase in net assets resulting from operations | | $ | 584,205,803 | |
| | | | |
The accompanying notes are an integral part of these financial statements.
| | | | |
| 18 | | Wells Fargo Premier Large Company Growth Fund | | Statement of changes in net assets |
| | | | | | | | | | | | | | | | |
| | | Year ended
July 31, 2018 | | | Year ended
July 31, 2017 | |
| | | | |
Operations | | | | | | | | | | | | | | | | |
Net investment loss | | | | | | $ | (5,025,277 | ) | | | | | | $ | (2,578,112 | ) |
Net realized gains on investments | | | | | | | 395,034,238 | | | | | | | | 573,282,638 | |
Net change in unrealized gains (losses) on investments | | | | | | | 194,196,842 | | | | | | | | (214,116,686 | ) |
| | | | |
Net increase in net assets resulting from operations | | | | | | | 584,205,803 | | | | | | | | 356,587,840 | |
| | | | |
| | | | |
Distributions to shareholders from | | | | | | | | | | | | | | | | |
Net realized gains | | | | | | | | | | | | | | | | |
Class A | | | | | | | (227,679,727 | ) | | | | | | | (141,609,478 | ) |
Class B | | | | | | | N/A | | | | | | | | (64,503 | )1 |
Class C | | | | | | | (54,543,209 | ) | | | | | | | (28,218,921 | ) |
Class R4 | | | | | | | (746,155 | ) | | | | | | | (356,581 | ) |
Class R6 | | | | | | | (37,680,602 | ) | | | | | | | (14,601,788 | ) |
Administrator Class | | | | | | | (18,099,486 | ) | | | | | | | (11,817,935 | ) |
Institutional Class | | | | | | | (222,234,431 | ) | | | | | | | (94,245,557 | ) |
| | | | |
Total distributions to shareholders | | | | | | | (560,983,610 | ) | | | | | | | (290,914,763 | ) |
| | | | |
| | | | |
Capital share transactions | | | Shares | | | | | | | | Shares | | | | | |
Proceeds from shares sold | | | | | | | | | | | | | | | | |
Class A | | | 3,267,334 | | | | 47,146,306 | | | | 6,001,464 | | | | 83,780,770 | |
Class B | | | N/A | | | | N/A | | | | 657 | 1 | | | 7,221 | 1 |
Class C | | | 1,584,503 | | | | 17,609,853 | | | | 1,164,251 | | | | 13,390,566 | |
Class R4 | | | 75,453 | | | | 1,179,600 | | | | 67,177 | | | | 939,076 | |
Class R6 | | | 1,545,725 | | | | 24,664,037 | | | | 1,591,648 | | | | 23,787,894 | |
Administrator Class | | | 561,343 | | | | 8,469,670 | | | | 991,894 | | | | 14,305,839 | |
Institutional Class | | | 13,231,358 | | | | 209,203,798 | | | | 28,960,656 | | | | 420,855,765 | |
| | | | |
| | | | | | | 308,273,264 | | | | | | | | 557,067,131 | |
| | | | |
Reinvestment of distributions | |
Class A | | | 15,972,127 | | | | 209,554,313 | | | | 10,164,417 | | | | 132,137,425 | |
Class B | | | N/A | | | | N/A | | | | 4,868 | 1 | | | 53,503 | 1 |
Class C | | | 4,459,739 | | | | 46,202,895 | | | | 2,029,580 | | | | 22,223,900 | |
Class R4 | | | 54,558 | | | | 741,983 | | | | 26,770 | | | | 356,581 | |
Class R6 | | | 2,631,345 | | | | 36,154,683 | | | | 1,045,350 | | | | 14,018,149 | |
Administrator Class | | | 1,320,910 | | | | 17,607,730 | | | | 870,110 | | | | 11,433,242 | |
Institutional Class | | | 14,695,591 | | | | 201,476,557 | | | | 5,849,310 | | | | 78,322,263 | |
| | | | |
| | | | | | | 511,738,161 | | | | | | | | 258,545,063 | |
| | | | |
Payment for shares redeemed | |
Class A | | | (14,159,720 | ) | | | (208,175,400 | ) | | | (67,446,125 | ) | | | (941,219,557 | ) |
Class B | | | N/A | | | | N/A | | | | (74,169 | )1 | | | (895,170 | )1 |
Class C | | | (5,118,687 | ) | | | (60,638,200 | ) | | | (10,665,863 | ) | | | (126,947,986 | ) |
Class R4 | | | (118,356 | ) | | | (1,890,437 | ) | | | (133,927 | ) | | | (1,970,170 | ) |
Class R6 | | | (2,515,229 | ) | | | (39,250,052 | ) | | | (3,768,974 | ) | | | (55,499,096 | ) |
Administrator Class | | | (3,480,442 | ) | | | (50,915,269 | ) | | | (16,274,337 | ) | | | (233,767,928 | ) |
Institutional Class | | | (21,905,645 | ) | | | (330,565,468 | ) | | | (47,785,920 | ) | | | (691,184,624 | ) |
| | | | |
| | | | | | | (691,434,826 | ) | | | | | | | (2,051,484,531 | ) |
| | | | |
Net increase (decrease) in net assets resulting from capital share transactions | | | | | | | 128,576,599 | | | | | | | | (1,235,872,337 | ) |
| | | | |
Total increase (decrease) in net assets | | | | | | | 151,798,792 | | | | | | | | (1,170,199,260 | ) |
| | | | |
| | | | |
Net assets | | | | | | | | | | | | | | | | |
Beginning of period | | | | | | | 2,399,374,634 | | | | | | | | 3,569,573,894 | |
| | | | |
End of period | | | | | | $ | 2,551,173,426 | | | | | | | $ | 2,399,374,634 | |
| | | | |
Accumulated net investment loss | | | | | | $ | (18,243 | ) | | | | | | $ | (1,838,979 | ) |
| | | | |
| 1 | For the period from August 1, 2016 to May 5, 2017. Effective at the close of business on May 5, 2017, Class B shares were converted to Class A shares and are no longer offered by the Fund. |
The accompanying notes are an integral part of these financial statements.
| | | | | | |
| Financial highlights | | Wells Fargo Premier Large Company Growth Fund | | | 19 | |
(For a share outstanding throughout each period)
| | | | | | | | | | | | | | | | | | | | |
| | | Year ended July 31 | |
| CLASS A | | 2018 | | | 2017 | | | 2016 | | | 2015 | | | 2014 | |
Net asset value, beginning of period | | | $15.34 | | | | $14.68 | | | | $16.28 | | | | $14.55 | | | | $12.57 | |
Net investment loss | | | (0.05 | ) | | | (0.03 | )1 | | | (0.03 | ) | | | (0.03 | ) | | | (0.05 | ) |
Net realized and unrealized gains (losses) on investments | | | 3.56 | | | | 2.12 | | | | (0.52 | ) | | | 1.97 | | | | 2.03 | |
| | | | | | | | | | | | | | | | | | | | |
Total from investment operations | | | 3.51 | | | | 2.09 | | | | (0.55 | ) | | | 1.94 | | | | 1.98 | |
Distributions to shareholders from | | | | | | | | | | | | | | | | | | | | |
Net realized gains | | | (3.75 | ) | | | (1.43 | ) | | | (1.05 | ) | | | (0.21 | ) | | | 0.00 | |
Net asset value, end of period | | | $15.10 | | | | $15.34 | | | | $14.68 | | | | $16.28 | | | | $14.55 | |
Total return2 | | | 26.54 | % | | | 16.01 | % | | | (3.22 | )% | | | 13.46 | % | | | 15.75 | % |
Ratios to average net assets (annualized) | | | | | | | | | | | | | | | | | | | | |
Gross expenses | | | 1.15 | % | | | 1.14 | % | | | 1.13 | % | | | 1.16 | % | | | 1.17 | % |
Net expenses | | | 1.11 | % | | | 1.11 | % | | | 1.11 | % | | | 1.12 | % | | | 1.12 | % |
Net investment loss | | | (0.34 | )% | | | (0.20 | )% | | | (0.17 | )% | | | (0.18 | )% | | | (0.36 | )% |
Supplemental data | | | | | | | | | | | | | | | | | | | | |
Portfolio turnover rate | | | 45 | % | | | 65 | % | | | 47 | % | | | 44 | % | | | 37 | % |
Net assets, end of period (000s omitted) | | | $1,048,632 | | | | $986,791 | | | | $1,697,746 | | | | $2,280,107 | | | | $1,908,455 | |
| 1 | Calculated based upon average shares outstanding |
| 2 | Total return calculations do not include any sales charges. |
The accompanying notes are an integral part of these financial statements.
| | | | |
| 20 | | Wells Fargo Premier Large Company Growth Fund | | Financial highlights |
(For a share outstanding throughout each period)
| | | | | | | | | | | | | | | | | | | | |
| | | Year ended July 31 | |
| CLASS C | | 2018 | | | 2017 | | | 2016 | | | 2015 | | | 2014 | |
Net asset value, beginning of period | | | $12.86 | | | | $12.64 | | | | $14.27 | | | | $12.87 | | | | $11.20 | |
Net investment loss | | | (0.13 | )1 | | | (0.12 | )1 | | | (0.12 | )1 | | | (0.13 | )1 | | | (0.14 | )1 |
Net realized and unrealized gains (losses) on investments | | | 2.89 | | | | 1.77 | | | | (0.46 | ) | | | 1.74 | | | | 1.81 | |
| | | | | | | | | | | | | | | | | | | | |
Total from investment operations | | | 2.76 | | | | 1.65 | | | | (0.58 | ) | | | 1.61 | | | | 1.67 | |
Distributions to shareholders from | | | | | | | | | | | | | | | | | | | | |
Net realized gains | | | (3.75 | ) | | | (1.43 | ) | | | (1.05 | ) | | | (0.21 | ) | | | 0.00 | |
Net asset value, end of period | | | $11.87 | | | | $12.86 | | | | $12.64 | | | | $14.27 | | | | $12.87 | |
Total return2 | | | 25.68 | % | | | 15.05 | % | | | (3.92 | )% | | | 12.65 | % | | | 14.91 | % |
Ratios to average net assets (annualized) | | | | | | | | | | | | | | | | | | | | |
Gross expenses | | | 1.90 | % | | | 1.89 | % | | | 1.88 | % | | | 1.91 | % | | | 1.92 | % |
Net expenses | | | 1.86 | % | | | 1.86 | % | | | 1.86 | % | | | 1.87 | % | | | 1.87 | % |
Net investment loss | | | (1.09 | )% | | | (0.95 | )% | | | (0.92 | )% | | | (0.93 | )% | | | (1.11 | )% |
Supplemental data | | | | | | | | | | | | | | | | | | | | |
Portfolio turnover rate | | | 45 | % | | | 65 | % | | | 47 | % | | | 44 | % | | | 37 | % |
Net assets, end of period (000s omitted) | | | $201,138 | | | | $206,026 | | | | $296,896 | | | | $388,290 | | | | $374,136 | |
| 1 | Calculated based upon average shares outstanding |
| 2 | Total return calculations do not include any sales charges. |
The accompanying notes are an integral part of these financial statements.
| | | | | | |
| Financial highlights | | Wells Fargo Premier Large Company Growth Fund | | | 21 | |
(For a share outstanding throughout each period)
| | | | | | | | | | | | | | | | | | | | |
| | | Year ended July 31 | |
| CLASS R4 | | 2018 | | | 2017 | | | 2016 | | | 2015 | | | 2014 | |
Net asset value, beginning of period | | | $15.75 | | | | $15.00 | | | | $16.56 | | | | $14.75 | | | | $12.70 | |
Net investment income (loss) | | | (0.00 | )1,2 | | | 0.01 | 1 | | | 0.02 | 1 | | | 0.02 | | | | (0.01 | ) |
Net realized and unrealized gains (losses) on investments | | | 3.69 | | | | 2.17 | | | | (0.53 | ) | | | 2.00 | | | | 2.06 | |
| | | | | | | �� | | | | | | | | | | | | | |
Total from investment operations | | | 3.69 | | | | 2.18 | | | | (0.51 | ) | | | 2.02 | | | | 2.05 | |
Distributions to shareholders from | | | | | | | | | | | | | | | | | | | | |
Net realized gains | | | (3.75 | ) | | | (1.43 | ) | | | (1.05 | ) | | | (0.21 | ) | | | 0.00 | |
Net asset value, end of period | | | $15.69 | | | | $15.75 | | | | $15.00 | | | | $16.56 | | | | $14.75 | |
Total return | | | 27.06 | % | | | 16.30 | % | | | (2.91 | )% | | | 13.82 | % | | | 16.14 | % |
Ratios to average net assets (annualized) | | | | | | | | | | | | | | | | | | | | |
Gross expenses | | | 0.87 | % | | | 0.86 | % | | | 0.85 | % | | | 0.83 | % | | | 0.84 | % |
Net expenses | | | 0.80 | % | | | 0.80 | % | | | 0.80 | % | | | 0.80 | % | | | 0.80 | % |
Net investment income (loss) | | | (0.02 | )% | | | 0.09 | % | | | 0.13 | % | | | 0.13 | % | | | (0.11 | )% |
Supplemental data | | | | | | | | | | | | | | | | | | | | |
Portfolio turnover rate | | | 45 | % | | | 65 | % | | | 47 | % | | | 44 | % | | | 37 | % |
Net assets, end of period (000s omitted) | | | $3,727 | | | | $3,559 | | | | $3,988 | | | | $2,129 | | | | $765 | |
| 1 | Calculated based upon average shares outstanding |
| 2 | Amount is more than $(0.005). |
The accompanying notes are an integral part of these financial statements.
| | | | |
| 22 | | Wells Fargo Premier Large Company Growth Fund | | Financial highlights |
(For a share outstanding throughout each period)
| | | | | | | | | | | | | | | | | | | | |
| | | Year ended July 31 | |
| CLASS R6 | | 2018 | | | 2017 | | | 2016 | | | 2015 | | | 2014 | |
Net asset value, beginning of period | | | $15.87 | | | | $15.08 | | | | $16.62 | | | | $14.77 | | | | $12.71 | |
Net investment income | | | 0.02 | 1 | | | 0.03 | 1 | | | 0.04 | 1 | | | 0.05 | | | | 0.01 | |
Net realized and unrealized gains (losses) on investments | | | 3.73 | | | | 2.19 | | | | (0.53 | ) | | | 2.01 | | | | 2.05 | |
| | | | | | | | | | | | | | | | | | | | |
Total from investment operations | | | 3.75 | | | | 2.22 | | | | (0.49 | ) | | | 2.06 | | | | 2.06 | |
Distributions to shareholders from | | | | | | | | | | | | | | | | | | | | |
Net realized gains | | | (3.75 | ) | | | (1.43 | ) | | | (1.05 | ) | | | (0.21 | ) | | | 0.00 | |
Net asset value, end of period | | | $15.87 | | | | $15.87 | | | | $15.08 | | | | $16.62 | | | | $14.77 | |
Total return | | | 27.27 | % | | | 16.48 | % | | | (2.78 | )% | | | 14.00 | % | | | 16.29 | % |
Ratios to average net assets (annualized) | | | | | | | | | | | | | | | | | | | | |
Gross expenses | | | 0.72 | % | | | 0.71 | % | | | 0.70 | % | | | 0.68 | % | | | 0.69 | % |
Net expenses | | | 0.65 | % | | | 0.65 | % | | | 0.65 | % | | | 0.65 | % | | | 0.65 | % |
Net investment income | | | 0.12 | % | | | 0.25 | % | | | 0.28 | % | | | 0.29 | % | | | 0.09 | % |
Supplemental data | | | | | | | | | | | | | | | | | | | | |
Portfolio turnover rate | | | 45 | % | | | 65 | % | | | 47 | % | | | 44 | % | | | 37 | % |
Net assets, end of period (000s omitted) | | | $196,934 | | | | $170,657 | | | | $179,198 | | | | $166,768 | | | | $163,871 | |
| 1 | Calculated based upon average shares outstanding |
The accompanying notes are an integral part of these financial statements.
| | | | | | |
| Financial highlights | | Wells Fargo Premier Large Company Growth Fund | | | 23 | |
(For a share outstanding throughout each period)
| | | | | | | | | | | | | | | | | | | | |
| | | Year ended July 31 | |
| ADMINISTRATOR CLASS | | 2018 | | | 2017 | | | 2016 | | | 2015 | | | 2014 | |
Net asset value, beginning of period | | | $15.52 | | | | $14.82 | | | | $16.41 | | | | $14.63 | | | | $12.62 | |
Net investment loss | | | (0.03 | )1 | | | (0.01 | )1 | | | (0.00 | )1,2 | | | (0.00 | )2 | | | (0.02 | ) |
Net realized and unrealized gains (losses) on investments | | | 3.61 | | | | 2.14 | | | | (0.54 | ) | | | 1.99 | | | | 2.03 | |
| | | | | | | | | | | | | | | | | | | | |
Total from investment operations | | | 3.58 | | | | 2.13 | | | | (0.54 | ) | | | 1.99 | | | | 2.01 | |
Distributions to shareholders from | | | | | | | | | | | | | | | | | | | | |
Net realized gains | | | (3.75 | ) | | | (1.43 | ) | | | (1.05 | ) | | | (0.21 | ) | | | 0.00 | |
Net asset value, end of period | | | $15.35 | | | | $15.52 | | | | $14.82 | | | | $16.41 | | | | $14.63 | |
Total return | | | 26.70 | % | | | 16.14 | % | | | (3.13 | )% | | | 13.73 | % | | | 15.93 | % |
Ratios to average net assets (annualized) | | | | | | | | | | | | | | | | | | | | |
Gross expenses | | | 1.07 | % | | | 1.06 | % | | | 1.04 | % | | | 1.00 | % | | | 1.00 | % |
Net expenses | | | 1.00 | % | | | 1.00 | % | | | 0.98 | % | | | 0.95 | % | | | 0.95 | % |
Net investment loss | | | (0.22 | )% | | | (0.06 | )% | | | (0.02 | )% | | | (0.01 | )% | | | (0.19 | )% |
Supplemental data | | | | | | | | | | | | | | | | | | | | |
Portfolio turnover rate | | | 45 | % | | | 65 | % | | | 47 | % | | | 44 | % | | | 37 | % |
Net assets, end of period (000s omitted) | | | $57,582 | | | | $82,998 | | | | $292,900 | | | | $1,129,970 | | | | $1,325,864 | |
| 1 | Calculated based upon average shares outstanding |
| 2 | Amount is more than $(0.005). |
The accompanying notes are an integral part of these financial statements.
| | | | |
| 24 | | Wells Fargo Premier Large Company Growth Fund | | Financial highlights |
(For a share outstanding throughout each period)
| | | | | | | | | | | | | | | | | | | | |
| | | Year ended July 31 | |
| INSTITUTIONAL CLASS | | 2018 | | | 2017 | | | 2016 | | | 2015 | | | 2014 | |
Net asset value, beginning of period | | | $15.84 | | | | $15.06 | | | | $16.61 | | | | $14.77 | | | | $12.71 | |
Net investment income | | | 0.01 | 1 | | | 0.02 | 1 | | | 0.03 | 1 | | | 0.03 | | | | 0.01 | 1 |
Net realized and unrealized gains (losses) on investments | | | 3.72 | | | | 2.19 | | | | (0.53 | ) | | | 2.02 | | | | 2.05 | |
| | | | | | | | | | | | | | | | | | | | |
Total from investment operations | | | 3.73 | | | | 2.21 | | | | (0.50 | ) | | | 2.05 | | | | 2.06 | |
Distributions to shareholders from | | | | | | | | | | | | | | | | | | | | |
Net realized gains | | | (3.75 | ) | | | (1.43 | ) | | | (1.05 | ) | | | (0.21 | ) | | | 0.00 | |
Net asset value, end of period | | | $15.82 | | | | $15.84 | | | | $15.06 | | | | $16.61 | | | | $14.77 | |
Total return | | | 27.17 | % | | | 16.44 | % | | | (2.85 | )% | | | 14.01 | % | | | 16.21 | % |
Ratios to average net assets (annualized) | | | | | | | | | | | | | | | | | | | | |
Gross expenses | | | 0.82 | % | | | 0.81 | % | | | 0.80 | % | | | 0.74 | % | | | 0.74 | % |
Net expenses | | | 0.70 | % | | | 0.70 | % | | | 0.70 | % | | | 0.70 | % | | | 0.70 | % |
Net investment income | | | 0.07 | % | | | 0.19 | % | | | 0.23 | % | | | 0.23 | % | | | 0.07 | % |
Supplemental data | | | | | | | | | | | | | | | | | | | | |
Portfolio turnover rate | | | 45 | % | | | 65 | % | | | 47 | % | | | 44 | % | | | 37 | % |
Net assets, end of period (000s omitted) | | | $1,043,161 | | | | $949,344 | | | | $1,097,976 | | | | $1,313,281 | | | | $1,031,979 | |
| 1 | Calculated based upon average shares outstanding |
The accompanying notes are an integral part of these financial statements.
| | | | | | |
| Notes to financial statements | | Wells Fargo Premier Large Company Growth Fund | | | 25 | |
1. ORGANIZATION
Wells Fargo Funds Trust (the “Trust”), a Delaware statutory trust organized on March 10, 1999, is an open-end management investment company registered under the Investment Company Act of 1940, as amended (the “1940 Act”). As an investment company, the Trust follows the accounting and reporting guidance in Financial Accounting Standards Board Accounting Standards Codification Topic 946, Financial Services – Investment Companies. These financial statements report on the Wells Fargo Premier Large Company Growth Fund (the “Fund”) which is a diversified series of the Trust.
Effective at the close of business on May 5, 2017, Class B shares were converted to Class A shares and are no longer offered by the Fund. Information for Class B shares reflected in the financial statements represents activity through May 5, 2017.
2. SIGNIFICANT ACCOUNTING POLICIES
The following significant accounting policies, which are consistently followed in the preparation of the financial statements of the Fund, are in conformity with U.S. generally accepted accounting principles which require management to make estimates and assumptions that affect the reported amounts of assets and liabilities, disclosure of contingent assets and liabilities at the date of the financial statements, and the reported amounts of revenues and expenses during the reporting period. Actual results could differ from those estimates.
Securities valuation
All investments are valued each business day as of the close of regular trading on the New York Stock Exchange (generally 4 p.m. Eastern Time), although the Fund may deviate from this calculation time under unusual or unexpected circumstances.
Equity securities that are listed on a foreign or domestic exchange or market are valued at the official closing price or, if none, the last sales price. If no sale occurs on the principal exchange or market that day, a fair value price will be determined in accordance with the Fund’s Valuation Procedures.
Investments in registered open-end investment companies are valued at net asset value. Interests in non-registered investment companies that are redeemable at net asset value are fair valued normally at net asset value.
Investments which are not valued using any of the methods discussed above are valued at their fair value, as determined in good faith by the Board of Trustees of the Fund. The Board of Trustees has established a Valuation Committee comprised of the Trustees and has delegated to it the authority to take any actions regarding the valuation of portfolio securities that the Valuation Committee deems necessary or appropriate, including determining the fair value of portfolio securities, unless the determination has been delegated to the Wells Fargo Asset Management Pricing Committee at Wells Fargo Funds Management, LLC (“Funds Management”). The Board of Trustees retains the authority to make or ratify any valuation decisions or approve any changes to the Valuation Procedures as it deems appropriate. On a quarterly basis, the Board of Trustees receives reports on any valuation actions taken by the Valuation Committee or the Wells Fargo Asset Management Pricing Committee which may include items for ratification.
Valuations of fair valued securities are compared to the next actual sales price when available, or other appropriate market values, to assess the continued appropriateness of the fair valuation methodologies used. These securities are fair valued on a day-to-day basis, taking into consideration changes to appropriate market information and any significant changes to the inputs considered in the valuation process until there is a readily available price provided on an exchange or by an independent pricing service. Valuations received from an independent pricing service or independent broker-dealer quotes are periodically validated by comparisons to most recent trades and valuations provided by other independent pricing services in addition to the review of prices by the manager and/or subadviser. Unobservable inputs used in determining fair valuations are identified based on the type of security, taking into consideration factors utilized by market participants in valuing the investment, knowledge about the issuer and the current market environment.
Foreign currency translation
The accounting records of the Fund are maintained in U.S. dollars. The values of other assets and liabilities denominated in foreign currencies are translated into U.S. dollars at rates provided by an independent foreign currency pricing source at a time each business day specified by the Wells Fargo Asset Management Pricing Committee. Purchases and sales of securities, and income and expenses are converted at the rate of exchange on the respective dates of such transactions. Net realized foreign exchange gains or losses arise from sales of foreign currencies, currency gains or losses realized between the trade and settlement dates on securities transactions, and the difference between the amounts of dividends, interest and foreign withholding taxes recorded and the U.S. dollar equivalent of the amounts actually paid or received. Net unrealized foreign exchange gains and losses arise from changes in the fair value of assets and liabilities other than investments in securities resulting from changes in exchange rates. The changes in net assets arising from changes in exchange rates of securities and the changes in net assets resulting from changes in market prices of securities are not separately presented. Such changes are included in net realized and unrealized gains or losses from investments.
| | | | |
| 26 | | Wells Fargo Premier Large Company Growth Fund | | Notes to financial statements |
Securities lending
The Fund may lend its securities from time to time in order to earn additional income in the form of fees or interest on securities received as collateral or the investment of any cash received as collateral. The Fund continues to receive interest or dividends on the securities loaned. The Fund receives collateral in the form of cash or securities with a value at least equal to the value of the securities on loan. The value of the loaned securities is determined at the close of each business day and any additional required collateral is delivered to the Fund on the next business day. In a securities lending transaction, the net asset value of the Fund will be affected by an increase or decrease in the value of the securities loaned and by an increase or decrease in the value of the instrument in which collateral is invested. The amount of securities lending activity undertaken by the Fund fluctuates from time to time. In the event of default or bankruptcy by the borrower, the Fund may be prevented from recovering the loaned securities or gaining access to the collateral or may experience delays or costs in doing so. In addition, the investment of any cash collateral received may lose all or part of its value. The Fund has the right under the lending agreement to recover the securities from the borrower on demand.
The Fund lends its securities through an unaffiliated securities lending agent. Cash collateral received in connection with its securities lending transactions is invested in Securities Lending Cash Investments, LLC (the “Securities Lending Fund”). The Securities Lending Fund is exempt from registration under Section 3(c)(7) of the 1940 Act and is managed by Funds Management and is subadvised by Wells Capital Management Incorporated (“WellsCap”), an affiliate of Funds Management and an indirect wholly owned subsidiary of Wells Fargo & Company (“Wells Fargo”). Funds Management receives an advisory fee starting at 0.05% and declining to 0.01% as the average daily net assets of the Securities Lending Fund increase. All of the fees received by Funds Management are paid to WellsCap for its services as subadviser. The Securities Lending Fund seeks to provide a positive return compared to the daily Fed Funds Open Rate by investing in high-quality, U.S. dollar-denominated short-term money market instruments. Securities Lending Fund investments are valued at the evaluated bid price provided by an independent pricing service. Income earned from investment in the Securities Lending Fund, if any, is included in income from affiliated securities on the Statement of Operations.
Security transactions and income recognition
Securities transactions are recorded on a trade date basis. Realized gains or losses are recorded on the basis of identified cost.
Dividend income is recognized on the ex-dividend date. Dividend income is recorded net of foreign taxes withheld where recovery of such taxes is not assured.
Distributions to shareholders
Distributions to shareholders from net investment income and any net realized gains are recorded on the ex-dividend date and paid at least annually. Such distributions are determined in accordance with income tax regulations and may differ from U.S. generally accepted accounting principles. Dividend sources are estimated at the time of declaration. The tax character of distributions is determined as of the Fund’s fiscal year end. Therefore, a portion of the Fund’s distributions made prior to the Fund’s fiscal year end may be categorized as a tax return of capital at year end.
Federal and other taxes
The Fund intends to continue to qualify as a regulated investment company by distributing substantially all of its investment company taxable income and any net realized capital gains (after reduction for capital loss carryforwards) sufficient to relieve it from all, or substantially all, federal income taxes. Accordingly, no provision for federal income taxes was required.
The Fund’s income and federal excise tax returns and all financial records supporting those returns for the prior three fiscal years are subject to examination by the federal and Delaware revenue authorities. Management has analyzed the Fund’s tax positions taken on federal, state, and foreign tax returns for all open tax years and does not believe that there are any uncertain tax positions that require recognition of a tax liability.
As of July 31, 2018, the aggregate cost of all investments for federal income tax purposes was $1,469,270,495 and the unrealized gains (losses) consisted of:
| | | | |
Gross unrealized gains | | $ | 1,187,035,754 | |
Gross unrealized losses | | | (8,451,383 | ) |
Net unrealized gains | | $ | 1,178,584,371 | |
Reclassifications are made to the Fund’s capital accounts for permanent tax differences to reflect income and gains available for distribution (or available capital loss carryforwards) under federal income tax regulations. U.S. generally accepted accounting principles require that certain components of net assets be adjusted to reflect permanent differences between financial and tax reporting. These reclassifications have no effect on net assets or net asset values per share. The primary
| | | | | | |
| Notes to financial statements | | Wells Fargo Premier Large Company Growth Fund | | | 27 | |
permanent difference causing such reclassification is due net operating losses. At July 31, 2018, as a result of permanent book-to-tax differences, the following reclassification adjustments were made on the Statement of Assets and Liabilities:
| | |
Accumulated net
investment loss | | Accumulated net
realized gains
on investments |
| $6,846,013 | | $(6,846,013) |
Class allocations
The separate classes of shares offered by the Fund differ principally in applicable sales charges, distribution, shareholder servicing, and administration fees. Class specific expenses are charged directly to that share class. Investment income, common expenses, and realized and unrealized gains (losses) on investments are allocated daily to each class of shares based on the relative proportion of net assets of each class.
3. FAIR VALUATION MEASUREMENTS
Fair value measurements of investments are determined within a framework that has established a fair value hierarchy based upon the various data inputs utilized in determining the value of the Fund’s investments. The three-level hierarchy gives the highest priority to unadjusted quoted prices in active markets for identical assets or liabilities (Level 1) and the lowest priority to unobservable inputs (Level 3). The Fund’s investments are classified within the fair value hierarchy based on the lowest level of input that is significant to the fair value measurement. The inputs are summarized into three broad levels as follows:
| ∎ | | Level 1 – quoted prices in active markets for identical securities |
| ∎ | | Level 2 – other significant observable inputs (including quoted prices for similar securities, interest rates, prepayment speeds, credit risk, etc.) |
| ∎ | | Level 3 – significant unobservable inputs (including the Fund’s own assumptions in determining the fair value of investments) |
The inputs or methodologies used for valuing investments in securities are not necessarily an indication of the risk associated with investing in those securities.
The following is a summary of the inputs used in valuing the Fund’s assets and liabilities as of July 31, 2018:
| | | | | | | | | | | | | | | | |
| | | Quoted prices
(Level 1) | | | Other significant
observable inputs
(Level 2) | | | Significant
unobservable inputs (Level 3) | | | Total | |
Assets | | | | | | | | | | | | | | | | |
Investments in: | | | | | | | | | | | | | | | | |
| | | | |
Common stocks | | | | | | | | | | | | | | | | |
Consumer discretionary | | $ | 397,075,960 | | | $ | 0 | | | $ | 0 | | | $ | 397,075,960 | |
Consumer staples | | | 87,739,391 | | | | 0 | | | | 0 | | | | 87,739,391 | |
Energy | | | 27,488,350 | | | | 0 | | | | 0 | | | | 27,488,350 | |
Financials | | | 145,658,196 | | | | 0 | | | | 0 | | | | 145,658,196 | |
Health care | | | 324,871,267 | | | | 0 | | | | 0 | | | | 324,871,267 | |
Industrials | | | 372,811,242 | | | | 0 | | | | 0 | | | | 372,811,242 | |
Information technology | | | 1,122,000,756 | | | | 0 | | | | 0 | | | | 1,122,000,756 | |
Materials | | | 48,106,000 | | | | 0 | | | | 0 | | | | 48,106,000 | |
Real estate | | | 18,115,740 | | | | 0 | | | | 0 | | | | 18,115,740 | |
| | | | |
Short-term investments | | | | | | | | | | | | | | | | |
Investment companies | | | 9,566,578 | | | | 0 | | | | 0 | | | | 9,566,578 | |
Investments measured at net asset value* | | | | | | | | | | | | | | | 94,421,386 | |
Total assets | | $ | 2,553,433,480 | | | $ | 0 | | | $ | 0 | | | $ | 2,647,854,866 | |
| * | Investments that are measured at fair value using the net asset value per share (or its equivalent) as a practical expedient have not been categorized in the fair value hierarchy. The fair value amount presented in the table is intended to permit reconciliation of the fair value hierarchy to the amounts presented in the Statement of Assets and Liabilities. The Fund’s investment in Securities Lending Cash Investments, LLC valued at $94,421,386 does not have a redemption period notice, can be redeemed daily and does not have any unfunded commitments. |
| | | | |
| 28 | | Wells Fargo Premier Large Company Growth Fund | | Notes to financial statements |
The Fund recognizes transfers between levels within the fair value hierarchy at the end of the reporting period. At July 31, 2018, the Fund did not have any transfers into/out of Level 1, Level 2, or Level 3.
4. TRANSACTIONS WITH AFFILIATES
Management fee
Funds Management, an indirect wholly owned subsidiary of Wells Fargo, is the manager of the Fund and provides advisory and fund-level administrative services under an investment management agreement. Under the investment management agreement, Funds Management is responsible for, among other services, implementing the investment objectives and strategies of the Fund, supervising the subadviser and providing fund-level administrative services in connection with the Fund’s operations. As compensation for its services under the investment management agreement, Funds Management is entitled to receive an annual management fee starting at 0.70% and declining to 0.505% as the average daily net assets of the Fund increase. For the year ended July 31, 2018, the management fee was equivalent to an annual rate of 0.66% of the Fund’s average daily net assets.
Funds Management has retained the services of a subadviser to provide daily portfolio management to the Fund. The fee for subadvisory services is borne by Funds Management. WellsCap is the subadviser to the Fund and is entitled to receive a fee from Funds Management at an annual rate starting at 0.35% and declining to 0.275% as the average daily net assets of the Fund increase.
Administration fees
Under a class-level administration agreement, Funds Management provides class-level administrative services to the Fund, which includes paying fees and expenses for services provided by the transfer agent, sub-transfer agents, omnibus account servicers and record-keepers. As compensation for its services under the class-level administration agreement, Funds Management receives an annual fee which is calculated based on the average daily net assets of each class as follows:
| | | | |
| | | Class-level
administration fee | |
Class A, Class C | | | 0.21 | % |
Class R4 | | | 0.08 | |
Class R6 | | | 0.03 | |
Administrator Class, Institutional Class | | | 0.13 | |
Funds Management has contractually waived and/or reimbursed management and administration fees to the extent necessary to maintain certain net operating expense ratios for the Fund. When each class of the Fund has exceeded its expense cap, Funds Management has waived fees and/or reimbursed expenses from fund level expenses on a proportionate basis and then from class specific expenses; otherwise, waivers and/or reimbursements are applied against class specific expenses before fund level expenses. Funds Management has committed through November 30, 2018 to waive fees and/or reimburse expenses to the extent necessary to cap the Fund’s expenses at 1.11% for Class A shares, 1.86% for Class C shares, 0.80% for Class R4 shares, 0.65% for Class R6 shares, 1.00% for Administrator Class, and 0.70% for Institutional Class shares. After this time, the cap may be increased or the commitment to maintain the cap may be terminated only with the approval of the Board of Trustees.
Distribution fee
The Trust has adopted a distribution plan for Class C shares of the Fund pursuant to Rule 12b-1 under the 1940 Act. A distribution fee is charged to Class C shares and paid to Wells Fargo Funds Distributor, LLC (“Funds Distributor”), the principal underwriter, at an annual rate of 0.75% of the average daily net assets of Class C shares.
In addition, Funds Distributor is entitled to receive the front-end sales charge from the purchase of Class A shares and a contingent deferred sales charge on the redemption of certain Class A shares. Funds Distributor is also entitled to receive the contingent deferred sales charges from redemptions of Class C shares. For the year ended July 31, 2018, Funds Distributor received $30,345 from the sale of Class A shares and $142 in contingent deferred sales charges from redemptions of Class C shares. No contingent deferred sales charges were incurred by Class A shares for the year ended July 31, 2018.
| | | | | | |
| Notes to financial statements | | Wells Fargo Premier Large Company Growth Fund | | | 29 | |
Shareholder servicing fees
The Trust has entered into contracts with one or more shareholder servicing agents, whereby Class A, Class C, and Administrator Class of the Fund are charged a fee at an annual rate of 0.25% of the average daily net assets of each respective class. Class R4 is charged a fee at an annual rate of 0.10% of its average daily net assets.
A portion of these total shareholder servicing fees were paid to affiliates of Wells Fargo.
Interfund transactions
The Fund may purchase or sell portfolio investment securities to certain other Wells Fargo affiliates pursuant to Rule 17a-7 under the 1940 Act and under procedures adopted by the Board of Trustees. The procedures have been designed to ensure that these interfund transactions, which do not incur broker commissions, are effected at current market prices.
5. INVESTMENT PORTFOLIO TRANSACTIONS
Purchases and sales of investments, excluding U.S. government obligations (if any) and short-term securities, for the year ended July 31, 2018 were $1,106,477,895 and $1,558,117,543, respectively.
6. BANK BORROWINGS
The Trust (excluding the money market funds and certain other funds) and Wells Fargo Variable Trust are parties to a $280,000,000 revolving credit agreement whereby the Fund is permitted to use bank borrowings for temporary or emergency purposes, such as to fund shareholder redemption requests. Interest under the credit agreement is charged to the Fund based on a borrowing rate equal to the higher of the Federal Funds rate in effect on that day plus 1.25% or the overnight LIBOR rate in effect on that day plus 1.25%. In addition, an annual commitment fee equal to 0.25% of the unused balance is allocated to each participating fund. Prior to August 29, 2017, the revolving credit agreement amount was $250,000,000.
For the year ended July 31, 2018, there were no borrowings by the Fund under the agreement.
7. DISTRIBUTIONS TO SHAREHOLDERS
The tax character of distributions paid was $560,983,610 and $290,914,763 of long-term capital gain for the years ended July 31, 2018 and July 31, 2017, respectively.
As of July 31, 2018, the components of distributable earnings on a tax basis were as follows:
| | | | |
Undistributed
ordinary
income | | Undistributed
long-term
gain | | Unrealized
gains |
| $2,032,129 | | $295,509,339 | | $1,178,584,371 |
8. CONCENTRATION RISK
Concentration risks result from exposure to a limited number of sectors. A fund that invests a substantial portion of its assets in any sector may be more affected by changes in that sector than would be a fund whose investments are not heavily weighted in any sector.
9. INDEMNIFICATION
Under the Trust’s organizational documents, the officers and Trustees have been granted certain indemnification rights against certain liabilities that may arise out of performance of their duties to the Trust. Additionally, in the normal course of business, the Trust may enter into contracts with service providers that contain a variety of indemnification clauses. The Trust’s maximum exposure under these arrangements is dependent on future claims that may be made against the Fund and, therefore, cannot be estimated.
| | | | |
| 30 | | Wells Fargo Premier Large Company Growth Fund | | Report of independent registered public accounting firm |
BOARD OF TRUSTEES AND SHAREHOLDERS OF WELLS FARGO FUNDS TRUST:
Opinion on the Financial Statements
We have audited the accompanying statement of assets and liabilities of Wells Fargo Premier Large Company Growth Fund (the “Fund”), one of the funds constituting Wells Fargo Funds Trust, including the portfolio of investments, as of July 31, 2018, the related statement of operations for the year then ended, the statements of changes in net assets for each of the years in the two-year period then ended, and the related notes (collectively, the “financial statements”) and the financial highlights for each of the years in the five-year period then ended. In our opinion, the financial statements and financial highlights present fairly, in all material respects, the financial position of the Fund as of July 31, 2018, the results of its operations for the year then ended, the changes in its net assets for each of the years in the two-year period then ended, and the financial highlights for each of the years in the five-year period then ended, in conformity with U.S. generally accepted accounting principles.
Basis for Opinion
These financial statements and financial highlights are the responsibility of the Fund’s management. Our responsibility is to express an opinion on these financial statements and financial highlights based on our audits. We are a public accounting firm registered with the Public Company Accounting Oversight Board (United States) (“PCAOB”) and are required to be independent with respect to the Fund in accordance with the U.S. federal securities laws and the applicable rules and regulations of the Securities and Exchange Commission and the PCAOB.
We conducted our audits in accordance with the standards of the PCAOB. Those standards require that we plan and perform the audit to obtain reasonable assurance about whether the financial statements and financial highlights are free of material misstatement, whether due to error or fraud. Our audits included performing procedures to assess the risks of material misstatement of the financial statements and financial highlights, whether due to error or fraud, and performing procedures that respond to those risks. Such procedures included examining, on a test basis, evidence regarding the amounts and disclosures in the financial statements and financial highlights. Such procedures also included confirmation of securities owned as of July 31, 2018, by correspondence with the custodian and brokers, or by other appropriate auditing procedures. Our audits also included evaluating the accounting principles used and significant estimates made by management, as well as evaluating the overall presentation of the financial statements and financial highlights. We believe that our audits provide a reasonable basis for our opinion.

We have not been able to determine the specific year that we began serving as the auditor of one or more Wells Fargo Funds investment companies, however we are aware that we have served as the auditor of one or more Wells Fargo Funds investment companies since at least 1955.
Boston, Massachusetts
September 24, 2018
| | | | | | |
| Other information (unaudited) | | Wells Fargo Premier Large Company Growth Fund | | | 31 | |
TAX INFORMATION
Pursuant to Section 852 of the Internal Revenue Code, $560,983,610 was designated as a 20% rate gain distribution for the fiscal year ended July 31, 2018.
PROXY VOTING INFORMATION
A description of the policies and procedures that the Fund uses to determine how to vote proxies relating to portfolio securities is available, upon request, by calling 1-800-222-8222, visiting our website at wellsfargofunds.com, or visiting the SEC website at sec.gov. Information regarding how the Fund voted proxies relating to portfolio securities during the most recent 12-month period ended June 30 is available on the Fund’s website at wellsfargofunds.com or by visiting the SEC website at sec.gov.
PORTFOLIO HOLDINGS INFORMATION
The complete portfolio holdings for the Fund are publicly available monthly on the Fund’s website (wellsfargofunds.com), on a one-month delayed basis. In addition, top ten holdings information (excluding derivative positions) for the Fund is publicly available on the Fund’s website on a monthly, seven-day or more delayed basis. The Fund files its complete schedule of portfolio holdings with the SEC for the first and third quarters of each fiscal year on Form N-Q, which is available by visiting the SEC website at sec.gov. In addition, the Fund’s Form N-Q may be reviewed and copied at the SEC’s Public Reference Room in Washington, DC, and at regional offices in New York City, at 233 Broadway, and in Chicago, at 175 West Jackson Boulevard, Suite 900. Information about the Public Reference Room may be obtained by calling 1-800-SEC-0330.
| | | | |
| 32 | | Wells Fargo Premier Large Company Growth Fund | | Other information (unaudited) |
BOARD OF TRUSTEES AND OFFICERS
Each of the Trustees and Officers1 listed in the table below acts in identical capacities for each fund in the Wells Fargo family of funds, which consists of 154 mutual funds comprising the Wells Fargo Funds Trust, Wells Fargo Variable Trust, Wells Fargo Master Trust and four closed-end funds (collectively the “Fund Complex”). This table should be read in conjunction with the Prospectus and the Statement of Additional Information2. The mailing address of each Trustee and Officer is 525 Market Street, 12th Floor, San Francisco, CA 94105. Each Trustee and Officer serves an indefinite term, however, each Trustee serves such term until reaching the mandatory retirement age established by the Trustees.
Independent Trustees
| | | | | | |
Name and year of birth | | Position held and length of service* | | Principal occupations during past five years or longer | | Current other public company or
investment company
directorships |
| William R. Ebsworth (Born 1957) | | Trustee, since 2015 | | Retired. From 1984 to 2013, equities analyst, portfolio manager, research director and chief investment officer at Fidelity Management and Research Company in Boston, Tokyo, and Hong Kong, and retired in 2013 as Chief Investment Officer of Fidelity Strategic Advisers, Inc. where he led a team of investment professionals managing client assets. Prior thereto, Board member of Hong Kong Securities Clearing Co., Hong Kong Options Clearing Corp., the Thailand International Fund, Ltd., Fidelity Investments Life Insurance Company, and Empire Fidelity Investments Life Insurance Company. Board member of the Forté Foundation (non-profit organization) and the Vincent Memorial Hospital Endowment (non-profit organization), where he serves on the Investment Committee and as a Chair of the Audit Committee. Mr. Ebsworth is a CFA® charterholder. | | Asset Allocation Trust |
| Jane A. Freeman (Born 1953) | | Trustee, since 2015; Chair Liaison, since 2018 | | Retired. From 2012 to 2014 and 1999 to 2008, Chief Financial Officer of Scientific Learning Corporation. From 2008 to 2012, Ms. Freeman provided consulting services related to strategic business projects. Prior to 1999, Portfolio Manager at Rockefeller & Co. and Scudder, Stevens & Clark. Board member of the Harding Loevner Funds from 1996 to 2014, serving as both Lead Independent Director and chair of the Audit Committee. Board member of the Russell Exchange Traded Funds Trust from 2011 to 2012 and the chair of the Audit Committee. Ms. Freeman is a Board Member of Ruth Bancroft Garden (non-profit organization) and the Glimmerglass Festival. She is also an inactive Chartered Financial Analyst. | | Asset Allocation Trust |
| Isaiah Harris, Jr. (Born 1952) | | Trustee, since 2009 | | Retired. Chairman of the Board of CIGNA Corporation since 2009, and Director since 2005. From 2003 to 2011, Director of Deluxe Corporation. Prior thereto, President and CEO of BellSouth Advertising and Publishing Corp. from 2005 to 2007, President and CEO of BellSouth Enterprises from 2004 to 2005 and President of BellSouth Consumer Services from 2000 to 2003. Emeritus member of the Iowa State University Foundation Board of Governors. Emeritus Member of the Advisory Board of Iowa State University School of Business. Advisory Board Member, Palm Harbor Academy (charter school). Advisory Board Member, Child Evangelism Fellowship (non-profit). Mr. Harris is a certified public accountant (inactive status). | | CIGNA Corporation; Asset Allocation Trust |
| Judith M. Johnson (Born 1949) | | Trustee, since 2008; Audit Committee Chairman, since 2009 | | Retired. Prior thereto, Chief Executive Officer and Chief Investment Officer of Minneapolis Employees Retirement Fund from 1996 to 2008. Ms. Johnson is an attorney, certified public accountant and a certified managerial accountant. | | Asset Allocation Trust |
| David F. Larcker (Born 1950) | | Trustee, since 2009 | | James Irvin Miller Professor of Accounting at the Graduate School of Business, Stanford University, Director of the Corporate Governance Research Initiative and Senior Faculty of The Rock Center for Corporate Governance since 2006. From 2005 to 2008, Professor of Accounting at the Graduate School of Business, Stanford University. Prior thereto, Ernst & Young Professor of Accounting at The Wharton School, University of Pennsylvania from 1985 to 2005. | | Asset Allocation Trust |
| | | | | | |
| Other information (unaudited) | | Wells Fargo Premier Large Company Growth Fund | | | 33 | |
| | | | | | |
Name and year of birth | | Position held and length of service* | | Principal occupations during past five years or longer | | Current other public company or
investment company
directorships |
| Olivia S. Mitchell (Born 1953) | | Trustee, since 2006; Governance Committee Chairman, since 2018 | | International Foundation of Employee Benefit Plans Professor, Wharton School of the University of Pennsylvania since 1993. Director of Wharton’s Pension Research Council and Boettner Center on Pensions & Retirement Research, and Research Associate at the National Bureau of Economic Research. Previously, Cornell University Professor from 1978 to 1993. | | Asset Allocation Trust |
| Timothy J. Penny (Born 1951) | | Trustee, since 1996; Chairman, since 2018; Vice Chairman, from 2017 to 2018 | | President and Chief Executive Officer of Southern Minnesota Initiative Foundation, a non-profit organization, since 2007. Member of the Board of Trustees of NorthStar Education Finance, Inc., a non-profit organization, since 2007. | | Asset Allocation Trust |
| James G. Polisson (Born 1959) | | Trustee, since 2018; Advisory Board Member, from 2017 to 2018 | | Retired. Chief Marketing Officer, Source (ETF) UK Services, Ltd, from 2015 to 2017. From 2012 to 2015, Principal of The Polisson Group, LLC, a management consulting, corporate advisory and principal investing company. Chief Executive Officer and Managing Director at Russell Investments, Global Exchange Traded Funds from 2010 to 2012. Managing Director of Barclays Global Investors from 1998 to 2010 and Global Chief Marketing Officer for iShares and Barclays Global Investors from 2000 to 2010. Trustee of the San Francisco Mechanics’ Institute, a non-profit organization, from 2013 to 2015. Board member of the Russell Exchange Traded Fund Trust from 2011 to 2012. Director of Barclays Global Investors Holdings Deutschland GmbH from 2006 to 2009. Mr. Polisson is an attorney and has a retired status with the Massachusetts and District of Columbia Bar Associations. | | Asset Allocation Trust |
| Michael S. Scofield (Born 1943) | | Trustee, since 2010 | | Served on the Investment Company Institute’s Board of Governors and Executive Committee from 2008-2011 as well the Governing Council of the Independent Directors Council from 2006-2011 and the Independent Directors Council Executive Committee from 2008-2011. Trustee of the Evergreen Fund complex (and its predecessors) from 1984 to 2010. Chairman of the Evergreen Funds from 2000-2010. Former Trustee of the Mentor Funds. Retired Attorney, Law Offices of Michael S. Scofield. | | Asset Allocation Trust |
| Pamela Wheelock (Born 1959) | | Trustee, since 2018; Advisory Board Member, from 2017 to 2018 | | Chief Operating Officer, Twin Cities Habitat for Humanity, since January, 2017. Vice President of University Services, University of Minnesota from 2012 to 2017. Prior thereto, on the Board of Directors, Goverance Committee and Finance Committee for the Minnesota Philanthropy Partners (Saint Paul Foundation) from 2012 to 2018, Interim President and Chief Executive Officer of Blue Cross Blue shield of Minnesota of Minnesota from 2010 to 2011, Chairman of the Board from 2009 to 2011 and Board Director 003 to 2015. Vice President, Leadership and Community Engagement, Bush Foundation, Saint Paul, Minnesota (a private foundation) from 2009 to 2011. Executive Vice President and Chief Financial Officer, Minnesota Sports and Entertainment from 2004 to 2009 and Senior Vice President from 2002 to 2004. Commissioner of Finance, State of Minnesota, from 1999 to 2002. Currently the Board Chair of the Minnesota Wild Foundation since 2010. | | Asset Allocation Trust |
| * | Length of service dates reflect the Trustee’s commencement of service with the Trust’s predecessor entities, where applicable. |
| | | | |
| 34 | | Wells Fargo Premier Large Company Growth Fund | | Other information (unaudited) |
Officers
| | | | | | |
Name and year of birth | | Position held and
length of service | | Principal occupations during past five years or longer | | |
Andrew Owen (Born 1960) | | President, since 2017 | | Executive Vice President of Wells Fargo & Company and Head of Affiliated Managers, Wells Fargo Asset Management, since 2014. In addition, Mr. Owen is currently President, Chief Executive Officer and Director of Wells Fargo Funds Management, LLC since 2017. Prior thereto, Executive Vice President responsible for marketing, investments and product development for Wells Fargo Funds Management, LLC, from 2009 to 2014. | | |
| Jeremy DePalma1 (Born 1974) | | Treasurer, since 2012 | | Senior Vice President of Wells Fargo Funds Management, LLC since 2009. Senior Vice President of Evergreen Investment Management Company, LLC from 2008 to 2010 and head of the Fund Reporting and Control Team within Fund Administration from 2005 to 2010. | | |
| Alexander Kymn3 (Born 1973) | | Secretary, since 2018; Chief Legal Officer, since 2018 | | Senior Company Counsel of Wells Fargo Bank, N.A. since 2018 (previously Senior Counsel from 2007 to 2018). Vice President of Wells Fargo Funds Management, LLC from 2008 to 2014. | | |
| Michael H. Whitaker (Born 1967) | | Chief Compliance Officer, since 2016 | | Senior Vice President and Chief Compliance Officer since 2016. Senior Vice President and Chief Compliance Officer for Fidelity Investments from 2007 to 2016. | | |
David Berardi (Born 1975) | | Assistant Treasurer, since 2009 | | Vice President of Wells Fargo Funds Management, LLC since 2009. Vice President of Evergreen Investment Management Company, LLC from 2008 to 2010. Manager of Fund Reporting and Control for Evergreen Investment Management Company, LLC from 2004 to 2010. | | |
| 1 | Jeremy DePalma acts as Treasurer of 77 funds and Assistant Treasurer of 77 funds in the Fund Complex. |
| 2 | The Statement of Additional Information includes additional information about the Trustees and is available, without charge, upon request, by calling 1-800-222-8222 or by visiting the website at wellsfargofunds.com. |
| 3 | Alexander Kymn became the Secretary and Chief Legal Officer effective April 17, 2018. |
| | | | | | |
| Other information (unaudited) | | Wells Fargo Premier Large Company Growth Fund | | | 35 | |
BOARD CONSIDERATION OF INVESTMENT MANAGEMENT AND SUB-ADVISORY AGREEMENTS:
Wells Fargo Premier Large Company Growth Fund
Under the Investment Company Act of 1940 (the “1940 Act”), the Board of Trustees (the “Board”) of Wells Fargo Funds Trust (the “Trust”) must determine annually whether to approve the continuation of the Trust’s investment management and sub-advisory agreements. In this regard, at an in-person meeting held on May 22-23, 2018 (the “Meeting”), the Board, all the members of which have no direct or indirect interest in the investment management and sub-advisory agreements and are not “interested persons” of the Trust, as defined in the 1940 Act (the “Independent Trustees”), reviewed and approved for Wells Fargo Premier Large Company Growth Fund (the “Fund”): (i) an investment management agreement (the “Management Agreement”) with Wells Fargo Funds Management, LLC (“Funds Management”); and (ii) an investment sub-advisory agreement (the “Sub-Advisory Agreement”) with Wells Capital Management Incorporated (the “Sub-Adviser”), an affiliate of Funds Management. The Management Agreement and the Sub-Advisory Agreement are collectively referred to as the “Advisory Agreements.”
At the Meeting, the Board considered the factors and reached the conclusions described below relating to the selection of Funds Management and the Sub-Adviser and the approval of the Advisory Agreements. Prior to the Meeting, including at an in-person meeting in April 2018, the Trustees conferred extensively among themselves and with representatives of Funds Management about these matters. Also, the Board has adopted a team-based approach, with each team consisting of a sub-set of Trustees, to assist the full Board in the discharge of its duties in reviewing investment performance and other matters throughout the year. The Independent Trustees were assisted in their evaluation of the Advisory Agreements by independent legal counsel, from whom they received separate legal advice and with whom they met separately.
In providing information to the Board, Funds Management and the Sub-Adviser were guided by a detailed set of requests for information submitted to them by independent legal counsel on behalf of the Independent Trustees at the start of the Board’s annual contract renewal process earlier in 2018. In considering and approving the Advisory Agreements, the Trustees considered the information they believed relevant, including but not limited to the information discussed below. The Board considered not only the specific information presented in connection with the Meeting, but also the knowledge gained over time through interaction with Funds Management and the Sub-Adviser about various topics. In this regard, the Board reviewed reports of Funds Management at each of its quarterly meetings, which included, among other things, portfolio reviews and investment performance reports. In addition, the Board and the teams mentioned above confer with portfolio managers at various times throughout the year. The Board did not identify any particular information or consideration that was all-important or controlling, and each individual Trustee may have attributed different weights to various factors.
After its deliberations, the Board unanimously approved the continuation of the Advisory Agreements for a one-year term and determined that the compensation payable to Funds Management and the Sub-Adviser under each of the Advisory Agreements was reasonable. The Board considered the approval of the Advisory Agreements for the Fund as part of its consideration of agreements for funds across the complex, but its approvals were made on a fund-by-fund basis. The following summarizes a number of important, but not necessarily all, factors considered by the Board in support of its approvals.
Nature, extent and quality of services
The Board received and considered various information regarding the nature, extent and quality of services provided to the Fund by Funds Management and the Sub-Adviser under the Advisory Agreements. This information included a description of the investment advisory services and Fund-level administrative services covered by the Management Agreement, as well as, among other things, a summary of the background and experience of senior management of Wells Fargo Asset Management (“WFAM”), of which Funds Management and the Sub-Adviser are a part, a summary of investments made in the business of WFAM, a summary of certain organizational and personnel changes involving Funds Management and the Sub-Adviser, and a description of Funds Management’s and the Sub-Adviser’s business continuity planning programs and of their approaches to data privacy and cybersecurity. The Board also considered the qualifications, background, tenure and responsibilities of each of the portfolio managers primarily responsible for the day-to-day portfolio management of the Fund.
The Board evaluated the ability of Funds Management and the Sub-Adviser to attract and retain qualified investment professionals, including research, advisory and supervisory personnel. The Board further considered the compliance programs and compliance records of Funds Management and the Sub-Adviser. In addition, the Board took into account the full range of services provided to the Fund by Funds Management and its affiliates.
| | | | |
| 36 | | Wells Fargo Premier Large Company Growth Fund | | Other information (unaudited) |
Fund investment performance and expenses
The Board considered the investment performance results for the Fund over various time periods ended December 31, 2017. The Board considered these results in comparison to the investment performance of funds in a universe that was determined by Broadridge Inc. (“Broadridge”) to be similar to the Fund (the “Universe”), and in comparison to the Fund’s benchmark index and to other comparative data. Broadridge is an independent provider of investment company data. The Board received a description of the methodology used by Broadridge to select the mutual funds in the performance Universe. The Board noted that the investment performance of the Fund (Class A) was higher than the average investment performance of the Universe for the one- and ten-year periods under review, but lower than the average investment performance of the Universe for the three- and five-year periods under review. The Board also noted that the investment performance of the Fund was higher than its benchmark index, the Russell 1000 Growth Index, for the one- and ten-year periods under review, but lower than its benchmark for the three- and five-year periods under review.
The Board received information concerning, and discussed factors contributing to, the underperformance of the Fund relative to the Universe and benchmark for the periods identified above. The Board took note of the explanations for the relative underperformance during these periods, including with respect to investment decisions and market factors that affected the Fund’s investment performance. The Board noted that the Fund experienced a portfolio manager change in 2018.
The Board also received and considered information regarding the Fund’s net operating expense ratios and their various components, including actual management fees, custodian and other non-management fees, and Rule 12b-1 and non-Rule 12b-1 shareholder service fees. The Board considered these ratios in comparison to the median ratios of funds in class-specific expense groups that were determined by Broadridge to be similar to the Fund (the “Groups”). The Board received a description of the methodology used by Broadridge to select the mutual funds in the expense Groups and an explanation of how funds comprising expense groups and their expense ratios may vary from year-to-year. Based on the Broadridge reports, the Board noted that the net operating expense ratios of the Fund were lower than or in range of the median net operating expense ratios of the expense Groups for each share class.
The Board took into account the Fund’s investment performance and expense information provided to it among the factors considered in deciding to re-approve the Advisory Agreements.
Investment management and sub-advisory fee rates
The Board reviewed and considered the contractual fee rates payable by the Fund to Funds Management under the Management Agreement, as well as the contractual fee rates payable by the Fund to Funds Management for class-level administrative services under a Class-Level Administration Agreement, which include, among other things, class-level transfer agency and sub-transfer agency costs (collectively, the “Management Rates”). The Board also reviewed and considered the contractual investment sub-advisory fee rates that are payable by Funds Management to the Sub-Adviser for investment sub-advisory services.
Among other information reviewed by the Board was a comparison of the Fund’s Management Rates with the average contractual investment management fee rates of funds in the expense Groups at a common asset level as well as transfer agency costs of the funds in the expense Groups. The Board noted that the Management Rates of the Fund were lower than or in range of the sum of these average rates for the Fund’s expense Groups for all share classes.
The Board also received and considered information about the portion of the total management fee that was retained by Funds Management after payment of the fee to the Sub-Adviser for sub-advisory services. In assessing the reasonableness of this amount, the Board received and evaluated information about the nature and extent of responsibilities retained and risks assumed by Funds Management and not delegated to or assumed by the Sub-Adviser, and about Funds Management’s on-going oversight services. Given the affiliation between Funds Management and the Sub-Adviser, the Board ascribed limited relevance to the allocation of fees between them.
The Board also received and considered information about the nature and extent of services offered and fee rates charged by Funds Management and the Sub-Adviser to other types of clients with investment strategies similar to those of the Fund. In this regard, the Board received information about the significantly greater scope of services, and compliance, reporting and other legal burdens and risks of managing mutual funds compared with those associated with managing assets of non-mutual fund clients such as institutional separate accounts.
Based on its consideration of the factors and information it deemed relevant, including those described here, the Board determined that the compensation payable to Funds Management under the Management Agreement and to the Sub-Adviser under the Sub-Advisory Agreement was reasonable.
| | | | | | |
| Other information (unaudited) | | Wells Fargo Premier Large Company Growth Fund | | | 37 | |
Profitability
The Board received and considered information concerning the profitability of Funds Management, as well as the profitability of both WFAM and Wells Fargo & Co. (“Wells Fargo”) as a whole, from providing services to the Fund and the fund family as a whole. The Board noted that the Sub-Adviser’s profitability information with respect to providing services to the Fund was subsumed in the WFAM and Wells Fargo profitability analysis.
Funds Management reported on the methodologies and estimates used in calculating profitability, including a description of the methodology used to allocate certain expenses and recent enhancements made to the methodology. Among other things, the Board noted that the levels of profitability reported on a fund-by-fund basis varied widely, depending on factors such as the size and type of fund. Based on its review, the Board did not deem the profits reported by Funds Management, WFAM or Wells Fargo from services provided to the Fund to be at a level that would prevent it from approving the continuation of the Advisory Agreements.
Economies of scale
The Board considered the extent to which Funds Management may experience economies of scale in the provision of management services, and the extent to which scale benefits, if any, would be shared with shareholders. In particular, the Board noted the existence of breakpoints in the Fund’s management fee structure, which operate generally to reduce the Fund’s expense ratios as the Fund grows in size. It considered that, for a small fund or a fund that shrinks in size, breakpoints conversely can result in higher fee levels. The Board also considered that in addition to management fee breakpoints, competitive management fee rates set at the outset without regard to breakpoints and fee waiver and expense reimbursement arrangements, as well as investments in the business intended to enhance services available to Fund shareholders, are means of sharing potential economies of scale with shareholders of the Fund.
The Board concluded that the Fund’s fee and expense arrangements, including contractual breakpoints, constituted a reasonable approach to sharing potential economies of scale with the Fund and its shareholders.
Other benefits to Funds Management and the Sub-Adviser
The Board received and considered information regarding potential “fall-out” or ancillary benefits received by Funds Management and its affiliates, including the Sub-Adviser, as a result of their relationships with the Fund. Ancillary benefits could include, among others, benefits directly attributable to other relationships with the Fund and benefits potentially derived from an increase in Funds Management’s and the Sub-Adviser’s business as a result of their relationships with the Fund. The Board noted that various affiliates of Funds Management may receive distribution-related fees, shareholder servicing payments and sub-transfer agency fees in respect of shares sold or held through them and services provided.
The Board also reviewed information about soft dollar credits earned and utilized by the Sub-Adviser, fees earned by Funds Management and the Sub-Adviser from managing a private investment vehicle for the fund family’s securities lending collateral and commissions earned by an affiliated broker from portfolio transactions.
Based on its consideration of the factors and information it deemed relevant, including those described here, the Board did not find that any ancillary benefits received by Funds Management and its affiliates, including the Sub-Adviser, were unreasonable.
Conclusion
At the Meeting, after considering the above-described factors and based on its deliberations and its evaluation of the information described above, the Board unanimously approved the continuation of the Advisory Agreements for a one-year term and determined that the compensation payable to Funds Management and the Sub-Adviser under each of the Advisory Agreements was reasonable.
| | | | |
| 38 | | Wells Fargo Premier Large Company Growth Fund | | Appendix A (unaudited) |
SALES CHARGE REDUCTIONS AND WAIVERS FOR CERTAIN INTERMEDIARIES
Ameriprise
Effective June 1, 2018, shareholders purchasing Fund shares through an Ameriprise Financial platform or account will be eligible only for the following Class A load waivers (front-end sales charge waivers), which may differ from those disclosed elsewhere in the Fund’s prospectus or Statement of Additional Information.
Front-end Sales Load Waivers on Class A Shares Available at Ameriprise Financial
| | • | | Employer-sponsored retirement plans (e.g., 401(k) plans, 457 plans, employer-sponsored 403(b) plans, profit sharing and money purchase pension plans and defined benefit plans). For purposes of this provision, employer-sponsored retirement plans do not include SEP IRAs, Simple IRAs or SAR-SEPs. |
| | • | | Shares purchased through an Ameriprise Financial investment advisory program (if an Advisory or similar share class for such investment advisory program is not available) |
| | • | | Shares purchased by third party investment advisors on behalf of their advisory clients through Ameriprise Financial’s platform (if an Advisory or similar share class for such investment advisory program is not available) |
| | • | | Shares purchased through reinvestment of distributions and dividend reinvestment when purchasing shares of the same Fund (but not any other fund within the same fund family) |
| | • | | Shares exchanged from Class C shares of the same fund in the month of or following the 10-year anniversary of the purchase date. To the extent that the Fund’s prospectus elsewhere provides for a waiver with respect to such shares following a shorter holding period, that waiver will apply to exchanges following such shorter period. To the extent that the Fund’s prospectus elsewhere provides for a waiver with respect to exchanges of Class C shares for load-waived shares, that waiver will also apply to such exchanges. |
| | • | | Employees and registered representatives of Ameriprise Financial or its affiliates and their immediate family members |
| | • | | Shares purchased by or through qualified accounts (including IRAs, Coverdell Education Savings Accounts, 401(k)s, 403(b) TSCAs subject to ERISA and defined benefit plans) that are held by a covered family member, defined as an Ameriprise financial advisor and/or the advisor’s spouse, advisor’s lineal ascendant (mother, father, grandmother, grandfather, great grandmother, great grandfather), advisor’s lineal descendant (son, step-son, daughter, step-daughter, grandson, granddaughter, great grandson, great granddaughter) or any spouse of a covered family member who is a lineal descendant |
| | • | | Shares purchased from the proceeds of redemptions within the same fund family, provided (1) the repurchase occurs within 90 days following the redemption, (2) the redemption and purchase occur in the same account, and (3) redeemed shares were subject to a front-end or deferred sales load (i.e. Rights of Reinstatement). Subject to the Fund’s policy regarding frequent purchases and redemptions of Fund shares, you may not be able to repurchase shares for the first 30 days after your redemption. |
Automatic Exchange of Class C Shares Available at Ameriprise Financial
| | • | | Class C shares will automatically exchange to Class A shares in the month of the 10-year anniversary of the purchase date. |
Merrill Lynch
Effective April 10, 2017, shareholders purchasing Fund shares through a Merrill Lynch platform or account will be eligible only for the following load waivers (front-end sales charge waivers and contingent deferred, or back-end, sales charge waivers) and discounts, which may differ from those disclosed elsewhere in the Fund’s prospectus or Statement of Additional Information.
Front-end Sales Load Waivers on Class A Shares available at Merrill Lynch
| | • | | Employer-sponsored retirement, deferred compensation and employee benefit plans (including health savings accounts) and trusts used to fund those plans, provided that the shares are not held in a commission-based brokerage account and shares are held for the benefit of the plan |
| | • | | Shares purchased by or through a 529 Plan |
| | • | | Shares purchased through a Merrill Lynch affiliated investment advisory program |
| | | | | | |
| Appendix A (unaudited) | | Wells Fargo Premier Large Company Growth Fund | | | 39 | |
| | • | | Shares purchased by third party investment advisors on behalf of their advisory clients through Merrill Lynch’s platform |
| | • | | Shares of funds purchased through the Merrill Edge Self-Directed platform (if applicable) |
| | • | | Shares purchased through reinvestment of capital gains distributions and dividend reinvestment when purchasing shares of the same fund (but not any other fund within the fund family) |
| | • | | Shares exchanged from Class C (i.e. level-load) shares of the same fund in the month of or following the 10-year anniversary of the purchase date |
| | • | | Employees and registered representatives of Merrill Lynch or its affiliates and their family members, as defined by Merrill Lynch, which may differ from the definition of family member in the Fund’s prospectus. |
| | • | | Directors or Trustees of the Fund, and employees of the Fund’s investment adviser or any of its affiliates, as described in the Fund’s prospectus |
| | • | | Shares purchased from the proceeds of redemptions within the same fund family, provided (1) the repurchase occurs within 90 days following the redemption, (2) the redemption and purchase occur in the same account, and (3) redeemed shares were subject to a front-end or deferred sales load (known as Rights of Reinstatement). Subject to the Fund’s policy regarding frequent purchases and redemptions of Fund shares, you may not be able to repurchase shares for the first 30 days after your redemption. |
CDSC Waivers on A, B and C Shares available at Merrill Lynch
| | • | | Death or disability of the shareholder |
| | • | | Shares sold as part of a systematic withdrawal plan as described in the Fund’s prospectus |
| | • | | Return of excess contributions from an IRA Account |
| | • | | Shares sold as part of a required minimum distribution for IRA and retirement accounts due to the shareholder reaching age 70½ |
| | • | | Shares sold to pay Merrill Lynch fees but only if the transaction is initiated by Merrill Lynch |
| | • | | Shares acquired through a right of reinstatement |
| | • | | Shares held in retirement brokerage accounts, that are exchanged for a lower cost share class due to transfer to certain fee based accounts or platforms (applicable to A and C shares only) |
Front-end load Discounts Available at Merrill Lynch: Breakpoints, Rights of Accumulation & Letters of Intent
| | • | | Breakpoints as described in the Fund’s prospectus |
| | • | | Rights of Accumulation (ROA) which entitle shareholders to breakpoint discounts will be automatically calculated based on the aggregated holding of fund family assets held by accounts within the purchaser’s household at Merrill Lynch. Eligible fund family assets not held at Merrill Lynch may be included in the ROA calculation only if the shareholder notifies his or her financial advisor about such assets. |
| | • | | Letters of Intent (LOI) which allow for breakpoint discounts based on anticipated purchases within a fund family, through Merrill Lynch, over a 13-month period of time (if applicable) |
Morgan Stanley
Effective on or about July 1, 2018, shareholders purchasing Fund shares through a Morgan Stanley Wealth Management transactional brokerage account will be eligible only for the following Class A load waivers (front-end sales charge waivers), which may differ from and be more limited than those disclosed in the Fund’s prospectus or Statement of Additional Information.
Front-end Sales Load Waivers on Class A Shares Available at Morgan Stanley
| | • | | Employer-sponsored retirement plans (e.g., 401(k) plans, 457 plans, employer-sponsored 403(b) plans, profit sharing and money purchase pension plans and defined benefit plans). For purposes of this provision, employer-sponsored retirement plans do not include SEP IRAs, Simple IRAs, SAR-SEPs or Keogh plans. |
| | • | | Morgan Stanley employee and employee-related accounts according to Morgan Stanley’s account linking rules |
| | • | | Shares purchased through reinvestment of dividends and capital gains distributions when purchasing shares of the same fund |
| | • | | Shares purchased through a Morgan Stanley self-directed brokerage account |
| | | | |
| 40 | | Wells Fargo Premier Large Company Growth Fund | | Appendix A (unaudited) |
| | • | | Class C (i.e., level-load) shares that are no longer subject to a contingent deferred sales charge and are exchanged to Class A shares of the same fund pursuant to Morgan Stanley Wealth Management’s share class exchange program. |
| | • | | Shares purchased from the proceeds of redemptions within the same fund family, provided (i) the repurchase occurs within 90 days following the redemption, (ii) the redemption and purchase occur in the same account, and (iii) redeemed shares were subject to a front-end or deferred sales charge. This waiver is subject to the Fund’s policy regarding frequent purchases and redemption of Fund shares, as discussed under “Account Information—Frequent Purchases and Redemptions of Fund Shares” in the Fund’s prospectus. |

For more information
More information about Wells Fargo Funds is available free upon request. To obtain literature, please write, email, visit the Fund’s website, or call:
Wells Fargo Funds
P.O. Box 219967
Kansas City, MO 64121-9967
Website: wellsfargofunds.com
Individual investors: 1-800-222-8222
Retail investment professionals: 1-888-877-9275
Institutional investment professionals:
1-866-765-0778
This report and the financial statements contained herein are submitted for the general information of the shareholders of the Fund. If this report is used for promotional purposes, distribution of the report must be accompanied or preceded by a current prospectus. Before investing, please consider the investment objectives, risks, charges, and expenses of the investment. For a current prospectus and, if available, a summary prospectus, containing this information, call 1-800-222-8222 or visit the Fund’s website at wellsfargofunds.com. Read the prospectus carefully before you invest or send money.
Wells Fargo Asset Management (WFAM) is the trade name for certain investment advisory/management firms owned by Wells Fargo & Company. These firms include but are not limited to Wells Capital Management Incorporated and Wells Fargo Funds Management, LLC. Certain products managed by WFAM entities are distributed by Wells Fargo Funds Distributor, LLC (a broker/dealer and Member FINRA).
This material is for general informational and educational purposes only and is NOT intended to provide investment advice or a recommendation of any kind—including a recommendation for any specific investment, strategy, or plan.
NOT FDIC INSURED ◾ NO BANK GUARANTEE ◾ MAY LOSE VALUE
© 2018 Wells Fargo Funds Management, LLC. All rights reserved.
| | |
 | | 314804 09-18 A212/AR212 07-18 |
ITEM 2. CODE OF ETHICS
(a) As of the end of the period covered by the report, Wells Fargo Funds Trust has adopted a code of ethics that applies to its President and Treasurer. A copy of the code of ethics is filed as an exhibit to this Form N-CSR.
(c) During the period covered by this report, there were no amendments to the provisions of the code of ethics adopted in Item 2(a) above.
(d) During the period covered by this report, there were no implicit or explicit waivers to the provisions of the code of ethics adopted in Item 2(a) above.
ITEM 3. AUDIT COMMITTEE FINANCIAL EXPERT
The Board of Trustees of Wells Fargo Funds Trust has determined that Judith Johnson is an audit committee financial expert, as defined in Item 3 of Form N-CSR. Mrs. Johnson is independent for purposes of Item 3 of Form N-CSR.
ITEM 4. PRINCIPAL ACCOUNTANT FEES AND SERVICES
(a), (b), (c), (d) The following table presents aggregate fees billed in each of the last two fiscal years for services rendered to the Registrant by the Registrant’s principal accountant. These fees were billed to the registrant and were approved by
the Registrant’s audit committee.
| | | | | | | | |
| | | Fiscal
year ended
July 31, 2018 | | | Fiscal
year ended
July 31, 2017 | |
Audit fees | | $ | 347,729 | | | $ | 336,286 | |
Audit-related fees | | | — | | | | — | |
Tax fees (1) | | | 46,695 | | | | 43,220 | |
All other fees | | | — | | | | — | |
| | | | | | | | |
| | $ | 394,424 | | | $ | 379,506 | |
| | | | | | | | |
| (1) | Tax fees consist of fees for tax compliance, tax advice, tax planning and excise tax. |
(e) The Chairman of the Audit Committees is authorized to pre-approve: (1) audit services for the mutual funds of Wells Fargo Funds Trust; (2) non-audit tax or compliance consulting or training services provided to the Funds by the independent auditors (“Auditors”) if the fees for any particular engagement are not anticipated to exceed $50,000; and (3) non-audit tax or compliance consulting or training services provided by the Auditors to a Fund’s investment adviser and its controlling entities (where pre-approval is required because the engagement relates directly to the operations and financial reporting of the Fund) if the fee to the Auditors for any particular engagement is not anticipated to exceed $50,000. For any such pre-approval sought from the Chairman, Management shall prepare a brief description of the proposed services. If the Chairman approves of such service, he or she shall sign the statement prepared by Management. Such written statement shall be presented to the full Committees at their next regularly scheduled meetings.
(f) Not applicable
(g) Not applicable
(h) Not applicable
ITEM 5. AUDIT COMMITTEE OF LISTED REGISTRANTS
Not applicable.
ITEM 6. INVESTMENTS
A Portfolio of Investments for each series of Wells Fargo Funds Trust is included as part of the report to shareholders filed under Item 1 of this Form.
ITEM 7. DISCLOSURE OF PROXY VOTING POLICIES AND PROCEDURES FOR CLOSED-END MANAGEMENT INVESTMENT COMPANIES
Not applicable.
ITEM 8. PORTFOLIO MANAGERS OF CLOSED-END MANAGEMENT INVESTMENT COMPANIES
Not applicable.
ITEM 9. PURCHASES OF EQUITY SECURITIES BY CLOSED-END MANAGEMENT INVESTMENT COMPANY AND AFFILIATED PURCHASERS
Not applicable.
ITEM 10. SUBMISSION OF MATTERS TO A VOTE OF SECURITY HOLDERS
There have been no material changes to the procedures by which shareholders may recommend nominees to the registrant’s Board of Trustees that have been implemented since the registrant’s last provided disclosure in response to the requirements of this Item.
ITEM 11. CONTROLS AND PROCEDURES
(a) The President and Treasurer have concluded that the Wells Fargo Funds Trust (the “Trust”) disclosure controls and procedures (as defined in Rule 30a-3(c) under the Investment Company Act of 1940) provide reasonable assurances that material information relating to the Trust is made known to them by the appropriate persons based on their evaluation of these controls and procedures as of a date within 90 days of the filing of this report.
(b) There were no significant changes in the Trust’s internal controls over financial reporting (as defined in Rule 30a-3(d) under the Investment Company Act of 1940) that occurred during the second fiscal quarter of the period covered by this report that materially affected, or is reasonably likely to materially affect, the registrant’s internal control over financial reporting.
ITEM 12. EXHIBITS
(a)(1) Code of Ethics pursuant to Item 2 of Form N-CSR is filed and attached hereto as Exhibit COE.
(a)(2) Certification pursuant to Rule 30a-2(a) under the Investment Company Act of 1940 (17 CFR 270.30a-2(a)) is filed and attached hereto as Exhibit 99.CERT.
(a)(3) Not applicable.
(b) Certification pursuant to Rule 30a-2(b) under the Investment Company Act of 1940 (17 CFR 270.30a-2(b)) is filed and attached hereto as Exhibit 99.906CERT.
SIGNATURES
Pursuant to the requirements of the Securities Exchange Act of 1934 and the Investment Company Act of 1940, the registrant has duly caused this report to be signed on its behalf by the undersigned, thereunto duly authorized.
| | |
| Wells Fargo Funds Trust |
| |
| By: | | |
| |
| | /s/ Andrew Owen |
| |
| | Andrew Owen |
| | President |
| |
| Date: | | September 24, 2018 |
Pursuant to the requirements of the Securities Exchange Act of 1934 and the Investment Company Act of 1940, this report has been signed below by the following persons on behalf of the registrant and in the capacities and on the date indicated.
| | |
| Wells Fargo Funds Trust |
| |
| By: | | |
| |
| | /s/ Andrew Owen |
| |
| | Andrew Owen |
| | President |
| |
| Date: | | September 24, 2018 |
| |
| By: | | |
| |
| | /s/ Jeremy DePalma |
| |
| | Jeremy DePalma |
| | Treasurer |
| |
| Date: | | September 24, 2018 |