
UNITED STATES
SECURITIES AND EXCHANGE COMMISSION
Washington, D.C. 20549
FORM N-CSR
CERTIFIED SHAREHOLDER REPORT OF REGISTERED
MANAGEMENT INVESTMENT COMPANIES
Investment Company Act file number: 811-09253
Wells Fargo Funds Trust
(Exact name of registrant as specified in charter)
525 Market St., San Francisco, CA 94105
(Address of principal executive offices) (Zip code)
Alexander Kymn
Wells Fargo Funds Management, LLC
525 Market St., San Francisco, CA 94105
(Name and address of agent for service)
Registrant’s telephone number, including area code: 800-222-8222
Date of fiscal year end: October 31
Registrant is making a filing for 7 of its series:
Wells Fargo Asia Pacific Fund, Wells Fargo Diversified International Fund, Wells Fargo Emerging Markets Equity Fund, Wells Fargo Emerging Markets Equity Income Fund, Wells Fargo Global Small Cap Fund, Wells Fargo International Equity Fund, and Wells Fargo Intrinsic World Equity Fund.
Date of reporting period: October 31, 2018
ITEM 1. REPORT TO STOCKHOLDERS
Annual Report
October 31, 2018

Wells Fargo Asia Pacific Fund

Beginning on January 1, 2021, as permitted by new regulations adopted by the Securities and Exchange Commission, paper copies of the Fund’s annual and semi-annual shareholder reports will no longer be sent by mail, unless you specifically request paper copies of the reports. Instead, the reports will be made available on the Fund’s website, and you will be notified by mail each time a report is posted and provided with a website address to access the report.
If you already elected to receive shareholder reports electronically, you will not be affected by this change and you need not take any action. You may elect to receive shareholder reports and other communications from the Fund electronically at any time by contacting your financial intermediary (such as a broker-dealer or bank) or, if you are a direct investor, by calling 1-800-222-8222 or by enrolling at wellsfargo.com/advantagedelivery.
You may elect to receive all future reports in paper free of charge. If you invest through a financial intermediary, you can contact your financial intermediary to request that you continue to receive paper copies of your shareholder reports; if you invest directly with the Fund, you can call 1-800-222-8222. Your election to receive reports in paper will apply to all Wells Fargo Funds held in your account with your financial intermediary or, if you are a direct investor, to all Wells Fargo Funds that you hold.

Reduce clutter. Save trees.
Sign up for electronic delivery of prospectuses and shareholder reports at wellsfargo.com/advantagedelivery
Contents
The views expressed and any forward-looking statements are as of October 31, 2018, unless otherwise noted, and are those of the Fund managers and/or Wells Fargo Funds Management, LLC. Discussions of individual securities, or the markets generally, or any Wells Fargo Fund are not intended as individual recommendations. Future events or results may vary significantly from those expressed in any forward-looking statements. The views expressed are subject to change at any time in response to changing circumstances in the market. Wells Fargo Funds Management, LLC and the Fund disclaim any obligation to publicly update or revise any views expressed or forward-looking statements.
NOT FDIC INSURED ◾ NO BANK GUARANTEE ◾ MAY LOSE VALUE
| | | | |
| 2 | | Wells Fargo Asia Pacific Fund | | Letter to shareholders (unaudited) |

Andrew Owen
President
Wells Fargo Funds
The early months of the reporting period were characterized by strong performance for equity and fixed-income markets. The remainder of the reporting period generated economic, business, and investing data that were decidedly more mixed and volatile relative to the prior year.
Dear Shareholder:
We are pleased to offer you this annual report for the Wells Fargo Asia Pacific Fund for the 12-month period that ended October 31, 2018. The early months of the reporting period were characterized by strong performance for equity and fixed-income markets. The remainder of the reporting period generated economic, business, and investing data that were decidedly more mixed and volatile relative to the prior year.
For the period, U.S. stocks, as measured by the S&P 500 Index,1 gained 7.35% and international stocks, as measured by the MSCI ACWI ex USA Index (Net),2 declined 8.24%. Based on the MSCI EM Index (Net),3 emerging market stocks lost 12.52%. For bond investors, the Bloomberg Barclays U.S. Aggregate Bond Index4 declined 2.05% while the Bloomberg Barclays Global Aggregate ex-USD Index5 fell 2.09%. The Bloomberg Barclays Municipal Bond Index6 dropped 0.51%, and the ICE BofAML U.S. High Yield Index7 was up 0.86%.
Optimism continued to shape markets as 2017 closed and 2018 opened.
Economic conditions in late 2017 were characterized by synchronized global growth, low inflation, healthy corporate earnings, growing consumer confidence, declining unemployment, and a weaker U.S. dollar that supported international growth. The U.S. Bureau of Economic Analysis reported that U.S. gross domestic product (GDP) growth on an annualized basis for the fourth quarter of 2017 was 2.9% and inflation remained below U.S. Federal Reserve (Fed) targets.
Economic momentum continued in Europe. The Bank of England (BOE) raised interest rates in November 2017 to 0.50%, the first increase in more than 10 years, indicating confidence in the economy’s growth potential. Meanwhile, the European Central Bank (ECB) and the Bank of Japan (BOJ) kept interest rates low to spur business activities and bought bonds in an effort to encourage equity investments. The People’s Bank of China (PBOC) also sought to stimulate economic growth. Many emerging market economies benefited from stronger currencies versus the U.S. dollar, while commodity price increases benefited countries that rely on natural resources for exports.
| 1 | The S&P 500 Index consists of 500 stocks chosen for market size, liquidity, and industry group representation. It is a market-value-weighted index with each stock’s weight in the index proportionate to its market value. You cannot invest directly in an index. |
| 2 | The Morgan Stanley Capital International (MSCI) All Country World Index (ACWI) ex USA Index (Net) is a free-float-adjusted market-capitalization-weighted index that is designed to measure the equity market performance of developed markets, excluding the United States and Canada. Source: MSCI. MSCI makes no express or implied warranties or representations and shall have no liability whatsoever with respect to any MSCI data contained herein. The MSCI data may not be further redistributed or used as a basis for other indices or any securities or financial products. This report is not approved, reviewed, or produced by MSCI. You cannot invest directly in an index. |
| 3 | The MSCI Emerging Markets (EM) Index (Net) is a free-float-adjusted market-capitalization-weighted index that is designed to measure large- and mid-cap equity market performance of emerging markets. The MSCI EM Index (Net) consists of the following 24 emerging market country indices: Brazil, Chile, China, Colombia, Czech Republic, Egypt, Greece, Hungary, India, Indonesia, Korea, Malaysia, Mexico, Pakistan, Peru, the Philippines, Poland, Qatar, Russia, South Africa, Taiwan, Thailand, Turkey, and the United Arab Emirates. You cannot invest directly in an index. |
| 4 | The Bloomberg Barclays U.S. Aggregate Bond Index is a broad-based benchmark that measures the investment-grade, U.S. dollar-denominated, fixed-rate taxable bond market, including Treasuries, government-related and corporate securities, mortgage-backed securities (agency fixed-rate and hybrid adjustable-rate mortgage pass-throughs), asset-backed securities, and commercial mortgage-backed securities. You cannot invest directly in an index. |
| 5 | The Bloomberg Barclays Global Aggregate ex-USD Index is an unmanaged index that provides a broad-based measure of the global investment-grade fixed-income markets excluding the U.S. dollar-denominated debt market. You cannot invest directly in an index. |
| 6 | The Bloomberg Barclays Municipal Bond Index is an unmanaged index composed of long-term tax-exempt bonds with a minimum credit rating of Baa. You cannot invest directly in an index. |
| 7 | The ICE BofAML U.S. High Yield Index is a market-capitalization-weighted index of domestic and Yankee high-yield bonds. The index tracks the performance of high-yield securities traded in the U.S. bond market. You cannot invest directly in an index. Copyright 2018. ICE Data Indices, LLC. All rights reserved. |
| | | | | | |
| Letter to shareholders (unaudited) | | Wells Fargo Asia Pacific Fund | | | 3 | |
Volatility reemerged during the early months of 2018.
In February 2018, investor concerns arose about inflation and trade, particularly between the U.S. and China. The Fed followed its 25-basis-point (bp; 100 bps equal 1.00%) federal funds rate increase in December 2017 with a further 25-bp increase in March 2018. The inflation rate in March reached the Fed’s 2% target for the first time in a year. The S&P 500 Index closed the first quarter with a negative return, the first negative quarterly return for the index since 2014.
Overseas, investment markets fell, hurt by a stronger U.S. dollar and mounting trade and diplomatic tensions. The MSCI ACWI ex USA Index (Net) declined 1.81% for the quarter that ended March 31, 2018.
Global trade tensions prompted investor concerns.
Global trade tensions escalated during the second quarter of 2018. The U.S. government’s decision to impose tariffs on a wide range of products manufactured overseas drew retaliatory responses from foreign governments, which punished U.S. commodity producers and product manufacturers. Investors were left to wonder about next steps in what appeared to be an escalating divergence in global economic policies and growth prospects.
Inflation trended higher. The CPI-U8 added 0.1% in June after an increase of 0.2% in both April and May. On a year-over-year basis, the all-items index rose 2.9% for the 12 months that ended June 30, 2018. The index for all items less food and energy rose 2.3% for the same 12-month period.
U.S. stocks gained following positive economic data while international stocks and bonds declined.
During the summer months, the U.S. economy strengthened. Revised second-quarter GDP data released in August showed the U.S. economy growing at a 4.2% rate. The unemployment rate in the U.S. was 3.7% by the end of September, according to the U.S. Department of Labor. Wages showed more consistent growth, and consumer confidence remained strong. Several U.S. equity market indices reached records during August, with the S&P 500 Index gaining 7.20% for the three-month period that ended September 30, 2018. In contrast, the MSCI ACWI ex USA Index (Net) gained 0.71% while the MSCI EM Index (Net) declined 1.09% during the same three-month period.
In June, the Fed increased the target range for the federal funds rate to range from 1.75% to 2.00%. It raised the range again in September to range from 2.00% to 2.25%. Long-term interest rates in the U.S. remained at higher levels relative from the prior 10 years. Rates on 10-year and 30-year Treasury bonds—2.46% and 2.81%, respectively, on January 1, 2018—were 3.15% and 3.39%, respectively, on October 31, 2018. Investor concerns about an inverted yield curve waned, only to be replaced by concerns about the potentially negative influence of higher interest rates on economic activity.
October proved to be a difficult month for stock markets globally.
As interest rates and bond yields gained during October, stock markets struggled. For the month, the S&P 500 Index fell 6.84%, the MSCI ACWI ex USA Index (Net) dropped 8.13%, and the MSCI EM Index (Net) lost 8.71%. The Bureau of Economic Analysis released its first estimate of third-quarter GDP, which, at an annualized 3.5% rate, indicated growth may be slowing compared with the second quarter. Readings on consumer sentiment and business spending were mixed.
The S&P 500 Index closed the first quarter with a negative return, the first negative quarterly return for the index since 2014.
| 8 | The Consumer Price Index for All Urban Consumers (CPI-U) measures the changes in the price of a basket of goods and services purchased by urban consumers. The urban consumer population is deemed by many as a better representative measure of the general public because close to 90% of the country’s population lives in highly populated areas. You cannot invest directly in an index. |
| | | | |
| 4 | | Wells Fargo Asia Pacific Fund | | Letter to shareholders (unaudited) |
Economic signals overseas also were mixed as the third quarter ended and the fourth quarter began. In early August, the BOE’s Monetary Policy Committee increased its key interest rate to 0.75%. The ECB and BOJ maintained low interest rates and accommodative monetary policies. Amid rising trade uncertainty, the PBOC cut reserve requirement ratios and accelerated infrastructure spending and tax cuts for business enterprises and individuals. Nevertheless, a strengthening U.S. dollar and the trade tensions remained headwinds for investors overseas.
Don’t let short-term uncertainty derail long-term investment goals.
Periods of investment uncertainty can present challenges, but experience has taught us that maintaining long-term investment goals can be an effective way to plan for the future. To help you create a sound strategy based on your personal goals and risk tolerance, Wells Fargo Funds offers more than 100 mutual funds spanning a wide range of asset classes and investment styles. Although diversification cannot guarantee an investment profit or prevent losses, we believe it can be an effective way to manage investment risk and potentially smooth out overall portfolio performance. We encourage investors to know their investments and to understand that appropriate levels of risk-taking may unlock opportunities.
Thank you for choosing to invest with Wells Fargo Funds. We appreciate your confidence in us and remain committed to helping you meet your financial needs.
Sincerely,

Andrew Owen
President
Wells Fargo Funds
Notice to shareholders
At a meeting held on August 14-15, 2018, the Board of Trustees of the Fund approved the following policy which will be effective on or about February 5, 2019:
Class C shares will convert automatically into Class A shares ten years after the initial date of purchase or, if you acquired your Class C shares through an exchange or conversion from another share class, ten years after the date you acquired your Class C shares. When Class C shares that you acquired through a purchase or exchange convert, any other Class C shares that you purchased with reinvested dividends and distributions also will convert into Class A shares on a pro rata basis. A shorter holding period may also apply depending on your intermediary. Please see “Appendix A—Sales Charge Reductions and Waivers for Certain Intermediaries” in the Fund’s prospectus or at the end of this report.
For further information about your Fund, contact your investment professional, visit our website at wellsfargofunds.com, or call us directly at 1-800-222-8222.
This page is intentionally left blank.
| | | | |
| 6 | | Wells Fargo Asia Pacific Fund | | Performance highlights (unaudited) |
Investment objective
The Fund seeks long-term capital appreciation.
Manager
Wells Fargo Funds Management, LLC
Subadviser
Wells Capital Management Incorporated
Portfolio managers
Alison Shimada
Elaine Tse‡
Average annual total returns (%) as of October 31, 20181
| | | | | | | | | | | | | | | | | | | | | | | | | | | | | | | | | | |
| | | | | Including sales charge | | | Excluding sales charge | | | Expense ratios2 (%) | |
| | | Inception date | | 1 year | | | 5 year | | | 10 year | | | 1 year | | | 5 year | | | 10 year | | | Gross | | | Net3 | |
| Class A (WFAAX) | | 7-31-2007 | | | (17.77 | ) | | | 2.48 | | | | 8.45 | | | | (12.74 | ) | | | 3.71 | | | | 9.09 | | | | 1.66 | | | | 1.60 | |
| Class C (WFCAX) | | 7-31-2007 | | | (14.41 | ) | | | 2.92 | | | | 8.27 | | | | (13.41 | ) | | | 2.92 | | | | 8.27 | | | | 2.41 | | | | 2.35 | |
| Administrator Class (WFADX) | | 7-30-2010 | | | – | | | | – | | | | – | | | | (12.60 | ) | | | 3.84 | | | | 9.23 | | | | 1.58 | | | | 1.50 | |
| Institutional Class (WFPIX) | | 7-30-2010 | | | – | | | | – | | | | – | | | | (12.43 | ) | | | 4.06 | | | | 9.40 | | | | 1.33 | | | | 1.25 | |
| MSCI AC Asia Pacific Index (Net)4 | | – | | | – | | | | – | | | | – | | | | (8.88 | ) | | | 3.44 | | | | 8.31 | | | | – | | | | – | |
Figures quoted represent past performance, which is no guarantee of future results, and do not reflect taxes that a shareholder may pay on fund distributions or the redemption of fund shares. Investment return and principal value of an investment will fluctuate so that an investor’s shares, when redeemed, may be worth more or less than their original cost. Performance shown without sales charges would be lower if sales charges were reflected. Current performance may be lower or higher than the performance data quoted, which assumes the reinvestment of dividends and capital gains. Current month-end performance is available on the Fund’s website, wellsfargofunds.com.
Index returns do not include transaction costs associated with buying and selling securities, any mutual fund fees or expenses, or any taxes. It is not possible to invest directly in an index.
For Class A shares, the maximum front-end sales charge is 5.75%. For Class C shares, the maximum contingent deferred sales charge is 1.00%. Performance including a contingent deferred sales charge assumes the sales charge for the corresponding time period. Administrator Class and Institutional Class shares are sold without a front-end sales charge or contingent deferred sales charge.
Stock values fluctuate in response to the activities of individual companies and general market and economic conditions. Foreign investments are especially volatile and can rise or fall dramatically due to differences in the political and economic conditions of the host country. These risks are generally intensified in emerging markets. The use of derivatives may reduce returns and/or increase volatility. Certain investment strategies tend to increase the total risk of an investment (relative to the broader market). The Fund is exposed to geographic risk and smaller-company securities risk. Consult the Fund’s prospectus for additional information on these and other risks.
Please see footnotes on page 7.
| | | | | | |
| Performance highlights (unaudited) | | Wells Fargo Asia Pacific Fund | | | 7 | |
|
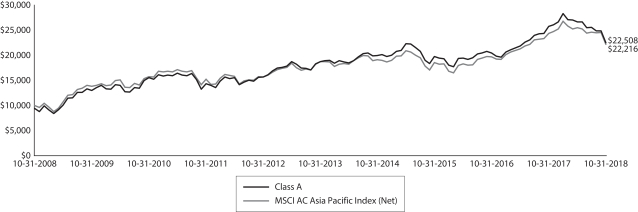
| Growth of $10,000 investment as of October 31, 20185 |
|
 |
| ‡ | Ms. Tse became a portfolio manager of the Fund on April 13, 2018. |
| 1 | Historical performance shown for Administrator and Institutional Class shares prior to their inception reflects the performance of Class A shares, and includes the higher expenses applicable to Class A shares. If these expenses had not been included, returns for Administrator and Institutional Class shares would be higher. |
| 2 | Reflects the expense ratios as stated in the most recent prospectuses. The expense ratios shown are subject to change and may differ from the annualized expense ratios shown in the financial highlights of this report. |
| 3 | The manager has contractually committed through February 28, 2019 to waive fees and/or reimburse expenses to the extent necessary to cap the Fund’s Total Annual Operating Expenses After Fee Waivers at the amounts shown. After this time, the cap may be increased or the commitment to maintain the cap may be terminated only with the approval of the Board of Trustees. Brokerage commissions, stamp duty fees, interest, taxes, acquired fees and expenses (if any), and extraordinary expenses are excluded from the expense cap. Without this cap, the Fund’s returns would have been lower. The expense ratio paid by an investor is the net expense ratio (the total annual fund operating expenses after fee waivers) as stated in the prospectuses. |
| 4 | The Morgan Stanley Capital International (MSCI) All Country (AC) Asia Pacific Index (Net) is a free-float-adjusted market-capitalization-weighted index that is designed to measure the equity market performance of the developed and emerging markets in the Pacific region. The MSCI AC Asia Pacific Index (Net) consists of the following 13 developed and emerging markets countries: Australia, China, Hong Kong, India, Indonesia, Japan, Korea, Malaysia, New Zealand, the Philippines, Singapore, Taiwan, and Thailand. Source: MSCI. MSCI makes no express or implied warranties or representations and shall have no liability whatsoever with respect to any MSCI data contained herein. The MSCI data may not be further redistributed or used as a basis for other indexes or any securities or financial products. This report is not approved, reviewed, or produced by MSCI. You cannot invest directly in an index. |
| 5 | The chart compares the performance of Class A shares for the most recent ten years with the MSCI AC Asia Pacific Index (Net). The chart assumes a hypothetical investment of $10,000 in Class A shares and reflects all operating expenses and assumes the maximum initial sales charge of 5.75%. |
| 6 | The ten largest holdings, excluding cash, cash equivalents and any money market funds, are calculated based on the value of the investments divided by total net assets of the Fund. Holdings are subject to change and may have changed since the date specified. |
| 7 | Amounts are calculated based on the total long-term investments of the Fund. These amounts are subject to change and may have changed since the date specified. |
| 8 | The China Securities Index (CSI) 300 Index is a capitalization-weighted stock market index designed to replicate the performance of the top 300 stocks traded in the Shanghai and Shenzhen stock exchanges. You cannot invest directly in an index. |
| 9 | The MSCI China Index is a free-float-adjusted market-capitalization-weighted index that is designed to measure equity market performance in China. You cannot invest directly in an index. |
| * | This security was no longer held at the end of the reporting period. |
| | | | |
| 8 | | Wells Fargo Asia Pacific Fund | | Performance highlights (unaudited) |
MANAGER’S DISCUSSION
Fund highlights
| ∎ | | The Fund underperformed its benchmark, the MSCI AC Asia Pacific Index (Net), for the 12-month period that ended October 31, 2018. |
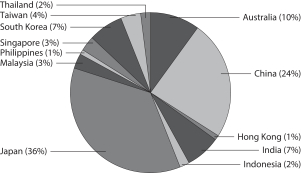
| ∎ | | Negative security selection in Japan and Taiwan restrained performance, offsetting the positive effects of country allocation, which contributed to relative returns for the period, led by overweights to Singapore and Vietnam and an underweight to Korea. |
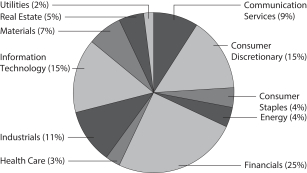
| ∎ | | Allocation at the sector level was also positive, including an underweight to communication services and an overweight to energy, but was offset by negative stock selection in the health care and utilities sectors. |
| | | | |
| Ten largest holdings (%) as of October 31, 20186 | |
Mitsubishi UFJ Financial Group Incorporated | | | 2.34 | |
Tencent Holdings Limited | | | 2.02 | |
Taiwan Semiconductor Manufacturing Company Limited | | | 1.98 | |
Samsung Electronics Company Limited | | | 1.78 | |
BHP Billiton Limited | | | 1.68 | |
Toyota Motor Corporation | | | 1.63 | |
Sony Corporation | | | 1.51 | |
Hitachi Limited | | | 1.50 | |
Alibaba Group Holding Limited ADR | | | 1.47 | |
SoftBank Group Corporation | | | 1.44 | |
|
| Sector distribution as of October 31, 20187 |
|
|
The Fund underperformed its benchmark during a volatile market.
During the period, returns in the Asia Pacific region declined, reversing course from the previous year as volatility increased due to the uncertainty of a trade war between the U.S. and China, a strong dollar, and election cycles. Eight out of eleven sectors posted negative returns during the period, including information technology, communication services, and consumer discretionary, whereas energy, health care, and consumer staples stocks advanced. The majority of countries represented in the index also declined during the period, including Pakistan, Korea, and the Philippines, while Thailand, New Zealand, and Malaysia advanced.
Against this backdrop, the portfolio underperformed the index due to negative stock selection, particularly in Japan and Taiwan. Within Japan, the communication services sector was the leading detractor from relative returns given holdings in Macromill, Incorporated; Nintendo Company, Limited; and Nippon Telegraph and Telephone Corporation. Taiwan Paiho Limited*, a manufacturer and distributor of textile tapes and related products for the production of shoe, garment, and medical materials in the consumer discretionary sector, was the leading relative detractor in Taiwan.
Negative relative returns were partially offset by positive stock selection in Korea, where Samsung SDI Company, Limited, reported strong growth in energy storage system revenue and is expected to benefit from the Korean government’s announcement of the Renewable Portfolio Standard and Renewable Energy Credit plan, which is supportive of ESS (energy storage system) battery growth.
Stock selection in China/Hong Kong also contributed to relative returns, particularly in the materials space where China Resources Cement Holdings Limited* saw an increase in its average sales price due to increased demand from infrastructure projects in the Guangdong/Guangxi region as well as continued supply-side discipline.
The team increased exposure to Australia, Singapore, and Malaysia, particularly within the financials sector given the prospect for rising rates, expansion of net interest margins, and higher investment portfolio returns in the case of insurance companies. On the other hand, we reduced exposure to China/Hong Kong, India, and Taiwan and the consumer discretionary sector, in particular, for stock-specific reasons as well as a downdraft in consumption illustrated by a decline in Chinese retail year-over-year sales growth from 10.1% in March to below 9.0% from May through August.
Please see footnotes on page 7.
| | | | | | |
| Performance highlights (unaudited) | | Wells Fargo Asia Pacific Fund | | | 9 | |
|
| Country allocation as of October 31, 20187 |
|
 |
Our investment outlook on the Asia Pacific region remains constructive, but volatility is expected to persist.
China’s real gross domestic product (GDP) growth could slow down to approximately 6.5% in 2018 from 6.9% in 2017 and further decelerate to about 6.0% in 2019. The deceleration is due to deleveraging and, more recently, the escalating U.S./China trade war. Monetary policy has turned accommodative, with policy interest rate changes on hold and more required reserve rate cuts to come. Supportive fiscal measures such as tax cuts for corporations and individuals and accelerating infrastructure spending will play a more important role for the remainder of 2018
and 2019. Industry-specific policies could be announced to promote consumption, which has been the main GDP growth contributor year to date. Reforms will move forward to ensure sustainable economic development. In the short term, market volatility could continue. From a long-term perspective, the equity valuation is reasonable with the CSI 300 Index8 and the MSCI China Index9 trading at about 11x and 12x forward price/earnings, respectively. The renminbi could face further depreciation pressure but a large downward adjustment is unlikely, in our view.
In Taiwan, our view of the overall semiconductor sector has turned more cautious given elevating semiconductor inventory and maturing of the semiconductor cycle. However, we continue to believe that, in the long run, companies will benefit from semiconductor-content growth in the fields of artificial intelligence, autonomous driving, and the internet of things. We also retain a cautious bias toward the Apple Incorporated smartphone supply chain given uncertainties about reception for the new iPhone, the effects of potential tariffs on smartphones, and the possibility of Apple shifting production back to the U.S. On the other hand, we expect the financials sector to benefit from rising interest rates and the petrochemical sector to perform on supply-side reform coupled with higher oil prices. Korean earnings forecasts have been revised down by over 5% since the beginning of the year but still are expected to grow at least in the mid-single digits. The market should grow with earnings, and there is potential for an upside surprise from companies increasing dividends and improving shareholder returns. Valuations are not demanding, at discounts of approximately 20% to 30% to the region, and concerns over South Korean President Moon Jae-in’s populist policies are well known with manageable impact on corporate profitability.
Notwithstanding our long-term structural bullish view on India, the market is facing multiple headwinds in the near term: higher oil prices and a worsening current account deficit, weakening political rhetoric with the Bharatiya Janata Party’s recent surprise loss in the state of Uttar Pradesh, and state-owned-enterprise (SOE) banking woes and tighter liquidity for the nonbanking financial companies. The market’s leadership has been narrow year to date, with large caps outperforming the small- to mid-cap space. While there are challenges, we find opportunities amidst them. First, we are overweight private banks, whose market share gains should accelerate amidst the SOE banking woes. Second, we are well positioned on rural plays, as there is pressing need for the central government to step up on rural spending ahead of the 2019 elections.
In Japan, policies are in motion to address labor shortages, competitiveness, financial market participation, boosting regional economies, and consumption overall. We maintain a combination of domestic and export investments in value-added industries. We are focusing on domestic demand over exporters, as the domestic economy may continue to recover for the next couple of years with improved wage growth and support from foreign visitors. We like restructuring stories and increasing capital efficiency as well as strong brand stories with international expansion potential. We hope to leverage ideas that are based upon differentiated innovation, particularly in the areas of energy-saving systems, manufacturing automation, and services that simplify the consumer experience, particularly in the health care, financial services, and retail sectors.
In Australia and New Zealand, earnings season has been mixed and, as in other markets, stocks have reacted to any weakness in operational execution. Highly valued stocks are still vulnerable, and there remains some derating risk for stocks. Therefore, we will remain selective about Australian exposure while searching for ideas opportunistically with earnings visibility going into 2019. The mining and energy sectors have demonstrated reasonably good capital efficiency in this cycle that should lead to relative outperformance. We expect to see some repricing of risk in the banking sector due to excessive lending competition thus far. The Australian consumer is under pressure from higher costs and high residential real estate prices. Supply and demand in office property is more attractive. In New Zealand, we are waiting to see better signs of relative value, but being a defensive market this year, valuations are not as supportive of the fundamentals at this stage.
Please see footnotes on page 7.
| | | | |
| 10 | | Wells Fargo Asia Pacific Fund | | Fund expenses (unaudited) |
As a shareholder of the Fund, you incur two types of costs: (1) transaction costs, including sales charges (loads) on purchase payments and contingent deferred sales charges (if any) on redemptions and (2) ongoing costs, including management fees, distribution (12b-1) and/or shareholder servicing fees, and other Fund expenses. This example is intended to help you understand your ongoing costs (in dollars) of investing in the Fund and to compare these costs with the ongoing costs of investing in other mutual funds.
The example is based on an investment of $1,000 invested at the beginning of the six-month period and held for the entire period from May 1, 2018 to October 31, 2018.
Actual expenses
The “Actual” line of the table below provides information about actual account values and actual expenses. You may use the information in this line, together with the amount you invested, to estimate the expenses that you paid over the period. Simply divide your account value by $1,000 (for example, an $8,600 account value divided by $1,000 = 8.6), then multiply the result by the number in the “Actual” line under the heading entitled “Expenses paid during period” for your applicable class of shares to estimate the expenses you paid on your account during this period.
Hypothetical example for comparison purposes
The “Hypothetical” line of the table below provides information about hypothetical account values and hypothetical expenses based on the Fund’s actual expense ratio and an assumed rate of return of 5% per year before expenses, which is not the Fund’s actual return. The hypothetical account values and expenses may not be used to estimate the actual ending account balance or expenses you paid for the period. You may use this information to compare the ongoing costs of investing in the Fund and other funds. To do so, compare this 5% hypothetical example with the 5% hypothetical examples that appear in the shareholder reports of the other funds.
Please note that the expenses shown in the table are meant to highlight your ongoing costs only and do not reflect any transactional costs, such as sales charges (loads) and contingent deferred sales charges. Therefore, the “Hypothetical” line of the table is useful in comparing ongoing costs only and will not help you determine the relative total costs of owning different funds. In addition, if these transactional costs were included, your costs would have been higher.
| | | | | | | | | | | | | | | | |
| | | Beginning
account value
5-1-2018 | | | Ending
account value
10-31-2018 | | | Expenses
paid during
the period¹ | | | Annualized net
expense ratio | |
Class A | | | | | | | | | | | | | | | | |
Actual | | $ | 1,000.00 | | | $ | 842.68 | | | $ | 7.43 | | | | 1.60 | % |
Hypothetical (5% return before expenses) | | $ | 1,000.00 | | | $ | 1,017.14 | | | $ | 8.13 | | | | 1.60 | % |
Class C | | | | | | | | | | | | | | | | |
Actual | | $ | 1,000.00 | | | $ | 839.35 | | | $ | 10.89 | | | | 2.35 | % |
Hypothetical (5% return before expenses) | | $ | 1,000.00 | | | $ | 1,013.36 | | | $ | 11.93 | | | | 2.35 | % |
Administrator Class | | | | | | | | | | | | | | | | |
Actual | | $ | 1,000.00 | | | $ | 843.03 | | | $ | 6.91 | | | | 1.49 | % |
Hypothetical (5% return before expenses) | | $ | 1,000.00 | | | $ | 1,017.70 | | | $ | 7.57 | | | | 1.49 | % |
Institutional Class | | | | | | | | | | | | | | | | |
Actual | | $ | 1,000.00 | | | $ | 843.98 | | | $ | 5.81 | | | | 1.25 | % |
Hypothetical (5% return before expenses) | | $ | 1,000.00 | | | $ | 1,018.90 | | | $ | 6.36 | | | | 1.25 | % |
| 1 | Expenses paid is equal to the annualized net expense ratio of each class multiplied by the average account value over the period, multiplied by the number of days in the most recent fiscal half-year divided by the number of days in the fiscal year (to reflect the one-half-year period). |
| | | | | | |
| Portfolio of investments—October 31, 2018 | | Wells Fargo Asia Pacific Fund | | | 11 | |
| | | | | | | | | | | | | | | | |
| Security name | | | | | | | | Shares | | | Value | |
| | | | |
Common Stocks: 94.58% | | | | | | | | | | | | | | | | |
| | | | |
| Australia: 9.28% | | | | | | | | | | | | | | | | |
Aristocrat Leisure Limited (Consumer Discretionary, Hotels, Restaurants & Leisure) | | | | | | | | | | | 31,435 | | | $ | 589,909 | |
Australia & New Zealand Banking Group Limited (Financials, Banks) | | | | | | | | | | | 52,572 | | | | 965,345 | |
BHP Billiton Limited (Materials, Metals & Mining) | | | | | | | | | | | 94,991 | | | | 2,166,699 | |
IOOF Holdings Limited (Financials, Capital Markets) | | | | | | | | | | | 180,593 | | | | 870,910 | |
Medibank Private Limited (Financials, Insurance) | | | | | | | | | | | 306,927 | | | | 606,408 | |
Mirvac Group (Real Estate, Equity REITs) | | | | | | | | | | | 473,701 | | | | 727,930 | |
Northern Star Resources Limited (Materials, Metals & Mining) | | | | | | | | | | | 156,286 | | | | 971,717 | |
Orocobre Limited (Materials, Metals & Mining) Ǡ | | | | | | | | | | | 348,277 | | | | 821,286 | |
Qantas Airways Limited (Industrials, Airlines) | | | | | | | | | | | 164,616 | | | | 637,653 | |
Rio Tinto Limited (Materials, Metals & Mining) | | | | | | | | | | | 23,047 | | | | 1,246,904 | |
Suncorp Group Limited (Financials, Insurance) | | | | | | | | | | | 176,004 | | | | 1,746,168 | |
Woodside Petroleum Limited (Energy, Oil, Gas & Consumable Fuels) | | | | | | | | | | | 25,252 | | | | 623,195 | |
| | | | |
| | | | | | | | | | | | | | | 11,974,124 | |
| | | | | | | | | | | | | | | | |
| | | | |
| China: 22.40% | | | | | | | | | | | | | | | | |
Alibaba Group Holding Limited ADR (Consumer Discretionary, Internet & Direct Marketing Retail) † | | | | | | | | | | | 13,350 | | | | 1,899,438 | |
Ascletis Pharma Incorporated (Health Care, Biotechnology) † | | | | | | | | | | | 990,000 | | | | 718,329 | |
AviChina Industry & Technology Company Limited H Shares (Industrials, Aerospace & Defense) | | | | | | | | | | | 1,265,000 | | | | 842,048 | |
Baidu Incorporated ADR (Communication Services, Interactive Media & Services) † | | | | | | | | | | | 3,351 | | | | 636,891 | |
Bank of China Limited H Shares (Financials, Banks) | | | | | | | | | | | 2,682,000 | | | | 1,142,303 | |
Beijing Enterprises Water Group Limited (Utilities, Water Utilities) | | | | | | | | | | | 2,664,000 | | | | 1,355,449 | |
BTG Hotels Group Company Limited Class A (Consumer Discretionary, Hotels, Restaurants & Leisure) | | | | | | | | | | | 287,117 | | | | 681,348 | |
China Communications Construction Company Limited H Shares (Industrials, Construction & Engineering) | | | | | | | | | | | 406,000 | | | | 371,211 | |
China Construction Bank H Shares (Financials, Banks) | | | | | | | | | | | 1,943,000 | | | | 1,541,129 | |
China Everbright International Limited (Industrials, Commercial Services & Supplies) | | | | | | | | | | | 793,444 | | | | 632,371 | |
China Mobile Limited (Communication Services, Wireless Telecommunication Services) | | | | | | | | | | | 111,500 | | | | 1,042,209 | |
China Overseas Land & Investment Limited (Real Estate, Real Estate Management & Development) | | | | | | | | | | | 426,000 | | | | 1,333,635 | |
China Petroleum & Chemical Corporation H Shares (Energy, Oil, Gas & Consumable Fuels) | | | | | | | | | | | 742,000 | | | | 601,779 | |
China Vanke Company Limited H Shares (Real Estate, Real Estate Management & Development) | | | | | | | | | | | 269,500 | | | | 829,950 | |
Chinasoft International Limited (Information Technology, IT Services) | | | | | | | | | | | 1,028,000 | | | | 603,013 | |
CNOOC Limited (Energy, Oil, Gas & Consumable Fuels) | | | | | | | | | | | 539,000 | | | | 925,145 | |
COSCO Shipping Ports Limited (Industrials, Transportation Infrastructure) | | | | | | | | | | | 638,635 | | | | 651,506 | |
GoerTek Incorporated Class A (Information Technology, Electronic Equipment, Instruments & Components) | | | | | | | | | | | 598,100 | | | | 623,476 | |
Huaneng Renewables Corporation Limited H Shares (Utilities, Independent Power & Renewable Electricity Producers) | | | | | | | | | | | 2,448,000 | | | | 627,456 | |
Industrial & Commercial Bank of China Limited H Shares (Financials, Banks) | | | | | | | | | | | 2,107,000 | | | | 1,424,021 | |
Lenovo Group Limited (Information Technology, Technology Hardware, Storage & Peripherals) | | | | | | | | | | | 1,070,000 | | | | 680,864 | |
Maanshan Iron and Steel Company H Shares (Materials, Metals & Mining) | | | | | | | | | | | 1,394,000 | | | | 746,600 | |
PetroChina Company Limited H Shares (Energy, Oil, Gas & Consumable Fuels) | | | | | | | | | | | 1,222,000 | | | | 894,456 | |
PICC Property and Casualty Company Limited H Shares (Financials, Insurance) | | | | | | | | | | | 855,000 | | | | 828,620 | |
Ping An Insurance Group Company of China Limited H Shares (Financials, Insurance) | | | | | | | | | | | 148,000 | | | | 1,393,760 | |
Sands China Limited (Consumer Discretionary, Hotels, Restaurants & Leisure) | | | | | | | | | | | 144,400 | | | | 568,986 | |
Shanghai Fosun Pharmaceutical Company Limited H Shares (Health Care, Pharmaceuticals) | | | | | | | | | | | 235,000 | | | | 704,225 | |
Tencent Holdings Limited (Communication Services, Interactive Media & Services) | | | | | | | | | | | 76,400 | | | | 2,601,241 | |
Tsingtao Brewery Company Limited H Shares (Consumer Staples, Beverages) | | | | | | | | | | | 156,000 | | | | 615,689 | |
Xiaomi Corporation Class B (Information Technology, Technology Hardware, Storage & Peripherals) «144A† | | | | | | | | | | | 393,800 | | | | 611,644 | |
Zijin Mining Group Company Limited H Shares (Materials, Metals & Mining) | | | | | | | | | | | 2,036,000 | | | | 755,521 | |
| | | | |
| | | | | | | | | | | | | | | 28,884,313 | |
| | | | | | | | | | | | | | | | |
The accompanying notes are an integral part of these financial statements.
| | | | |
| 12 | | Wells Fargo Asia Pacific Fund | | Portfolio of investments—October 31, 2018 |
| | | | | | | | | | | | | | | | |
| Security name | | | | | | | | Shares | | | Value | |
| | | | |
| Hong Kong: 0.97% | | | | | | | | | | | | | | | | |
Chow Tai Fook Jewellery Company Limited (Consumer Discretionary, Specialty Retail) | | | | | | | | | | | 806,800 | | | $ | 706,803 | |
Xinyi Glass Holdings Limited (Consumer Discretionary, Auto Components) | | | | | | | | | | | 544,000 | | | | 538,315 | |
| | | | |
| | | | | | | | | | | | | | | 1,245,118 | |
| | | | | | | | | | | | | | | | |
| | | | |
| India: 6.56% | | | | | | | | | | | | | | | | |
Gail India Limited (Utilities, Gas Utilities) | | | | | | | | | | | 136,006 | | | | 688,353 | |
HDFC Bank Limited (Financials, Banks) | | | | | | | | | | | 38,900 | | | | 1,005,708 | |
Hindalco Industries Limited (Materials, Metals & Mining) | | | | | | | | | | | 349,057 | | | | 1,040,397 | |
ICICI Bank Limited (Financials, Banks) | | | | | | | | | | | 251,045 | | | | 1,205,233 | |
Indian Hotels Company Limited (Consumer Discretionary, Hotels, Restaurants & Leisure) | | | | | | | | | | | 410,322 | | | | 714,713 | |
Infosys Limited SP ADR (Information Technology, IT Services) | | | | | | | | | | | 107,000 | | | | 1,013,290 | |
Larsen & Toubro Limited (Industrials, Construction & Engineering) | | | | | | | | | | | 57,653 | | | | 1,011,627 | |
Reliance Industries Limited (Energy, Oil, Gas & Consumable Fuels) | | | | | | | | | | | 69,546 | | | | 998,116 | |
Sterlite Technologies Limited (Information Technology, Communications Equipment) | | | | | | | | | | | 151,891 | | | | 783,129 | |
| | | | |
| | | | | | | | | | | | | | | 8,460,566 | |
| | | | | | | | | | | | | | | | |
| | | | |
| Indonesia: 1.58% | | | | | | | | | | | | | | | | |
PT Bank Rakyat Indonesia Tbk (Financials, Banks) | | | | | | | | | | | 4,047,000 | | | | 838,550 | |
PT Cikarang Listrindo Tbk (Utilities, Independent Power & Renewable Electricity Producers) | | | | | | | | | | | 6,279,300 | | | | 369,674 | |
PT Telekomunikasi Indonesia Persero Tbk (Communication Services, Diversified Telecommunication Services) | | | | | | | | | | | 3,282,000 | | | | 831,159 | |
| | | | |
| | | | | | | | | | | | | | | 2,039,383 | |
| | | | | | | | | | | | | | | | |
| | | | |
| Japan: 34.70% | | | | | | | | | | | | | | | | |
Advantage Risk Management Company Limited (Health Care, Health Care Providers & Services) « | | | | | | | | | | | 79,100 | | | | 710,838 | |
Ezaki Glico Company Limited (Consumer Staples, Food Products) | | | | | | | | | | | 14,900 | | | | 742,128 | |
FANUC Corporation (Industrials, Machinery) | | | | | | | | | | | 4,500 | | | | 787,056 | |
Hitachi Limited (Information Technology, Electronic Equipment, Instruments & Components) | | | | | | | | | | | 63,200 | | | | 1,939,100 | |
Honda Motor Company Limited (Consumer Discretionary, Automobiles) | | | | | | | | | | | 26,100 | | | | 749,680 | |
Inpex Holdings Incorporated (Energy, Oil, Gas & Consumable Fuels) | | | | | | | | | | | 54,200 | | | | 624,211 | |
J.Front Retailing Company Limited (Consumer Discretionary, Multiline Retail) | | | | | | | | | | | 97,900 | | | | 1,284,973 | |
Japan Airlines Company Limited (Industrials, Airlines) | | | | | | | | | | | 48,600 | | | | 1,730,192 | |
Kao Corporation (Consumer Staples, Personal Products) | | | | | | | | | | | 13,500 | | | | 901,037 | |
Keyence Corporation (Information Technology, Electronic Equipment, Instruments & Components) | | | | | | | | | | | 2,000 | | | | 980,192 | |
KOSE Corporation (Consumer Staples, Personal Products) | | | | | | | | | | | 5,200 | | | | 777,454 | |
Kubota Corporation (Industrials, Machinery) | | | | | | | | | | | 96,500 | | | | 1,524,022 | |
Kura Corporation (Consumer Discretionary, Hotels, Restaurants & Leisure) | | | | | | | | | | | 16,900 | | | | 979,536 | |
Kyushu Railway Company (Industrials, Road & Rail) | | | | | | | | | | | 37,200 | | | | 1,140,710 | |
Macromill Incorporated (Communication Services, Media) | | | | | | | | | | | 33,700 | | | | 669,012 | |
Matsumotokiyoshi Holdings Company Limited (Consumer Staples, Food & Staples Retailing) | | | | | | | | | | | 46,200 | | | | 1,666,451 | |
Mitsubishi UFJ Financial Group Incorporated (Financials, Banks) | | | | | | | | | | | 496,700 | | | | 3,014,492 | |
Mitsui Fudosan Company Limited (Real Estate, Real Estate Management & Development) | | | | | | | | | | | 73,800 | | | | 1,663,909 | |
Nintendo Company Limited (Communication Services, Entertainment) | | | | | | | | | | | 3,800 | | | | 1,184,101 | |
Nippon Telegraph & Telephone Corporation (Communication Services, Diversified Telecommunication Services) | | | | | | | | | | | 38,300 | | | | 1,612,310 | |
Obayashi Corporation (Industrials, Construction & Engineering) | | | | | | | | | | | 76,000 | | | | 671,529 | |
Open House Company Limited (Real Estate, Real Estate Management & Development) | | | | | | | | | | | 28,400 | | | | 1,116,267 | |
ORIX Corporation (Financials, Diversified Financial Services) | | | | | | | | | | | 109,800 | | | | 1,791,481 | |
Otsuka Corporation (Information Technology, IT Services) | | | | | | | | | | | 29,300 | | | | 973,767 | |
Panasonic Corporation (Consumer Discretionary, Household Durables) | | | | | | | | | | | 149,200 | | | | 1,652,195 | |
Recruit Holdings Company Limited (Industrials, Professional Services) | | | | | | | | | | | 56,100 | | | | 1,509,958 | |
The accompanying notes are an integral part of these financial statements.
| | | | | | |
| Portfolio of investments—October 31, 2018 | | Wells Fargo Asia Pacific Fund | | | 13 | |
| | | | | | | | | | | | | | | | |
| Security name | | | | | | | | Shares | | | Value | |
| | | | |
| Japan (continued) | | | | | | | | | | | | | | | | |
Ryohin Keikaku Company Limited (Consumer Discretionary, Multiline Retail) | | | | | | | | | | | 3,500 | | | $ | 924,669 | |
Santen Pharmaceutical Company Limited (Health Care, Pharmaceuticals) | | | | | | | | | | | 45,400 | | | | 673,949 | |
SoftBank Group Corporation (Communication Services, Wireless Telecommunication Services) | | | | | | | | | | | 23,200 | | | | 1,860,359 | |
Sony Corporation (Consumer Discretionary, Household Durables) | | | | | | | | | | | 35,800 | | | | 1,948,083 | |
Sumitomo Mitsui Trust Holdings Incorporated (Financials, Banks) | | | | | | | | | | | 43,400 | | | | 1,728,538 | |
Suzuki Motor Corporation (Consumer Discretionary, Automobiles) | | | | | | | | | | | 14,900 | | | | 746,089 | |
Tokyo Electron Limited (Information Technology, Semiconductors & Semiconductor Equipment) | | | | | | | | | | | 9,400 | | | | 1,306,678 | |
Toyota Motor Corporation (Consumer Discretionary, Automobiles) | | | | | | | | | | | 35,800 | | | | 2,098,790 | |
Tsukui Corporation (Health Care, Health Care Providers & Services) | | | | | | | | | | | 125,200 | | | | 1,077,407 | |
| | | | |
| | | | | | | | | | | | | | | 44,761,163 | |
| | | | | | | | | | | | | | | | |
| | | | |
| Malaysia: 2.88% | | | | | | | | | | | | | | | | |
Bursa Malaysia Bhd (Financials, Capital Markets) | | | | | | | | | | | 515,100 | | | | 901,071 | |
CIMB Group Holdings Bhd (Financials, Banks) | | | | | | | | | | | 546,800 | | | | 747,448 | |
Genting Malaysia Bhd (Consumer Discretionary, Hotels, Restaurants & Leisure) | | | | | | | | | | | 515,300 | | | | 552,921 | |
Public Bank Bhd (Financials, Banks) | | | | | | | | | | | 144,300 | | | | 848,316 | |
Sime Darby Bhd (Industrials, Industrial Conglomerates) | | | | | | | | | | | 1,268,200 | | | | 666,756 | |
| | | | |
| | | | | | | | | | | | | | | 3,716,512 | |
| | | | | | | | | | | | | | | | |
| | | | |
| Philippines: 0.79% | | | | | | | | | | | | | | | | |
Bank of the Philippine Islands (Financials, Banks) | | | | | | | | | | | 660,893 | | | | 1,014,716 | |
| | | | | | | | | | | | | | | | |
| | | | |
| Singapore: 2.64% | | | | | | | | | | | | | | | | |
DBS Group Holdings Limited (Financials, Banks) | | | | | | | | | | | 98,300 | | | | 1,664,887 | |
Genting Singapore Limited (Consumer Discretionary, Hotels, Restaurants & Leisure) | | | | | | | | | | | 739,200 | | | | 469,621 | |
Keppel Corporation Limited (Industrials, Industrial Conglomerates) | | | | | | | | | | | 135,400 | | | | 606,057 | |
Oversea-Chinese Banking Corporation Limited (Financials, Banks) | | | | | | | | | | | 85,700 | | | | 664,490 | |
| | | | |
| | | | | | | | | | | | | | | 3,405,055 | |
| | | | | | | | | | | | | | | | |
| | | | |
| South Korea: 6.63% | | | | | | | | | | | | | | | | |
Hana Financial Group Incorporated (Financials, Banks) | | | | | | | | | | | 16,945 | | | | 569,517 | |
Hyundai Motor Company (Consumer Discretionary, Automobiles) | | | | | | | | | | | 5,860 | | | | 547,664 | |
KB Financial Group Incorporated (Financials, Banks) | | | | | | | | | | | 14,871 | | | | 618,565 | |
LG Chem Limited (Materials, Chemicals) | | | | | | | | | | | 3,049 | | | | 928,439 | |
NH Investment & Securities Company Limited (Financials, Capital Markets) | | | | | | | | | | | 57,673 | | | | 614,915 | |
Samsung Electronics Company Limited (Information Technology, Technology Hardware, Storage & Peripherals) | | | | | | | | | | | 61,550 | | | | 2,290,132 | |
Samsung Fire & Marine Insurance (Financials, Insurance) | | | | | | | | | | | 2,574 | | | | 629,072 | |
Samsung SDI Company Limited (Information Technology, Electronic Equipment, Instruments & Components) | | | | | | | | | | | 6,952 | | | | 1,436,704 | |
SK Telecom Company Limited (Communication Services, Wireless Telecommunication Services) | | | | | | | | | | | 3,874 | | | | 911,089 | |
| | | | |
| | | | | | | | | | | | | | | 8,546,097 | |
| | | | | | | | | | | | | | | | |
| | | | |
| Taiwan: 4.38% | | | | | | | | | | | | | | | | |
Acer Incorporated (Information Technology, Technology Hardware, Storage & Peripherals) | | | | | | | | | | | 1,036,000 | | | | 726,536 | |
Cathay Financial Holding Company (Financials, Insurance) | | | | | | | | | | | 456,000 | | | | 722,102 | |
Hon Hai Precision Industry (Information Technology, Electronic Equipment, Instruments & Components) | | | | | | | | | | | 352,868 | | | | 898,620 | |
Mediatek Incorporated (Information Technology, Semiconductors & Semiconductor Equipment) | | | | | | | | | | | 102,000 | | | | 749,927 | |
Taiwan Semiconductor Manufacturing Company Limited (Information Technology, Semiconductors & Semiconductor Equipment) | | | | | | | | | | | 338,000 | | | | 2,556,055 | |
| | | | |
| | | | | | | | | | | | | | | 5,653,240 | |
| | | | | | | | | | | | | | | | |
The accompanying notes are an integral part of these financial statements.
| | | | |
| 14 | | Wells Fargo Asia Pacific Fund | | Portfolio of investments—October 31, 2018 |
| | | | | | | | | | | | | | | | |
| Security name | | | | | | | | Shares | | | Value | |
| | | | |
| Thailand: 1.77% | | | | | | | | | | | | | | | | |
Bangkok Bank PCL (Financials, Banks) | | | | | | | | | | | 152,200 | | | $ | 973,345 | |
Kasikornbank PCL (Financials, Banks) | | | | | | | | | | | 129,400 | | | | 778,742 | |
Thai Beverage PCL (Consumer Staples, Beverages) | | | | | | | | | | | 1,179,300 | | | | 532,117 | |
| | | | |
| | | | | | | | | | | | | | | 2,284,204 | |
| | | | | | | | | | | | | | | | |
| | | | |
Total Common Stocks (Cost $118,098,311) | | | | | | | | | | | | | | | 121,984,491 | |
| | | | | | | | | | | | | | | | |
| | | | |
| | | | | | Expiration date | | | | | | | |
| Participation Notes: 1.42% | | | | | | | | | | | | | | | | |
| | | | |
| China: 1.42% | | | | | | | | | | | | | | | | |
HSBC Bank plc (Ningbo Joyson Electronic Corporation) (Consumer Discretionary, Auto Components) †(a) | | | | | | | 12-2-2019 | | | | 169,874 | | | | 555,710 | |
HSBC Bank plc (Siasun Robot & Automation Company Limited Class A) (Industrials, Machinery) †(a) | | | | | | | 11-23-2021 | | | | 276,974 | | | | 563,811 | |
HSBC Bank plc (Songcheng Performance Development Company Limited Class A) (Consumer Discretionary, Hotels, Restaurants & Leisure) †(a) | | | | | | | 10-12-2020 | | | | 235,952 | | | | 716,062 | |
| | |
Total Participation Notes (Cost $2,436,325) | | | | | | | | 1,835,583 | |
| | | | | | | | | | | | | | | | |
| | |
| | | Yield | | | | |
| Short-Term Investments: 4.33% | | | | | | | | | | | | | | | | |
| | | | |
| Investment Companies: 4.33% | | | | | | | | | | | | | | | | |
Securities Lending Cash Investments LLC (l)(r)(u) | | | 2.33 | % | | | | | | | 1,444,919 | | | | 1,445,064 | |
Wells Fargo Government Money Market Fund Select Class (l)(u) | | | 2.07 | | | | | | | | 4,143,878 | | | | 4,143,878 | |
| | |
Total Short-Term Investments (Cost $5,588,942) | | | | | | | | 5,588,942 | |
| | | | | | | | | | | | | | | | |
| | | | | | | | |
| Total investments in securities (Cost $126,123,578) | | | 100.33 | % | | | 129,409,016 | |
Other assets and liabilities, net | | | (0.33 | ) | | | (429,714 | ) |
| | | | | | | | |
| Total net assets | | | 100.00 | % | | $ | 128,979,302 | |
| | | | | | | | |
| « | All or a portion of this security is on loan. |
| † | Non-income-earning security |
| 144A | The security may be resold in transactions exempt from registration, normally to qualified institutional buyers, pursuant to Rule 144A under the Securities Act of 1933. |
| (a) | The security is fair valued in accordance with procedures approved by the Board of Trustees. |
| (l) | The issuer of the security is an affiliated person of the Fund as defined in the Investment Company Act of 1940. |
| (r) | The investment is a non-registered investment company purchased with cash collateral received from securities on loan. |
| (u) | The rate represents the 7-day annualized yield at period end. |
Abbreviations:
| ADR | American depositary receipt |
| REIT | Real estate investment trust |
The accompanying notes are an integral part of these financial statements.
| | | | | | |
| Portfolio of investments—October 31, 2018 | | Wells Fargo Asia Pacific Fund | | | 15 | |
Investments in Affiliates
An affiliated investment is an investment in which the Fund owns at least 5% of the outstanding voting shares of the issuer or as a result of other relationships, such as the Fund and the issuer having the same investment manager. Transactions with issuers that were either affiliated persons of the Fund at the beginning of the period or the end of the period were as follows:
| | | | | | | | | | | | | | | | | | | | | | | | | | | | | | | | | | | | |
| | | Shares,
beginning of
period | | | Shares
purchased | | | Shares
sold | | | Shares,
end of
period | | | Net
realized
gains
(losses) | | | Net
change in
unrealized
gains
(losses) | | | Income
from
affiliated
securities | | | Value,
end
of period | | | % of
net
assets | |
Short-Term Investments | | | | | | | | | | | | | | | | | | | | | | | | | | | | | | | | | | | | |
Investment Companies | | | | | | | | | | | | | | | | | | | | | | | | | | | | | | | | | | | | |
Securities Lending Cash Investments LLC | | | 993,151 | | | | 22,808,793 | | | | 22,357,025 | | | | 1,444,919 | | | $ | (293 | ) | | $ | 0 | | | $ | 60,614 | | | $ | 1,445,064 | | | | | |
Wells Fargo Government Money Market Fund Select Class | | | 1,050,305 | | | | 61,939,824 | | | | 58,846,251 | | | | 4,143,878 | | | | 0 | | | | 0 | | | | 45,158 | | | | 4,143,878 | | | | | |
| | | | | | | | | | | | | | | | | | | | | | | | | | | | | | | | | | | | |
| | | | | | | | | | | | | | | | | | $ | (293 | ) | | $ | 0 | | | $ | 105,772 | | | $ | 5,588,942 | | | | 4.33 | % |
| | | | | | | | | | | | | | | | | | | | | | | | | | | | | | | | | | | | |
The accompanying notes are an integral part of these financial statements.
| | | | |
| 16 | | Wells Fargo Asia Pacific Fund | | Statement of assets and liabilities—October 31, 2018 |
| | | | |
| | | | |
| |
Assets | | | | |
Investments in unaffiliated securities (including $1,369,849 of securities loaned), at value (cost $120,534,636) | | $ | 123,820,074 | |
Investments in affiliated securities, at value (cost $5,588,942) | | | 5,588,942 | |
Foreign currency, at value (cost $717,844) | | | 712,948 | |
Receivable for Fund shares sold | | | 96,295 | |
Receivable for dividends | | | 414,742 | |
Receivable for securities lending income | | | 8,394 | |
Prepaid expenses and other assets | | | 28,951 | |
| | | | |
Total assets | | | 130,670,346 | |
| | | | |
| |
Liabilities | | | | |
Payable upon receipt of securities loaned | | | 1,445,357 | |
Management fee payable | | | 92,045 | |
Payable for Fund shares redeemed | | | 37,003 | |
Administration fees payable | | | 21,919 | |
Distribution fee payable | | | 1,158 | |
Trustees’ fees and expenses payable | | | 846 | |
Accrued expenses and other liabilities | | | 92,716 | |
| | | | |
Total liabilities | | | 1,691,044 | |
| | | | |
Total net assets | | $ | 128,979,302 | |
| | | | |
| |
NET ASSETS CONSIST OF | | | | |
Paid-in capital | | $ | 111,460,672 | |
Total distributable earnings | | | 17,518,630 | |
| | | | |
Total net assets | | $ | 128,979,302 | |
| | | | |
| |
COMPUTATION OF NET ASSET VALUE AND OFFERING PRICE PER SHARE | | | | |
Net assets – Class A | | $ | 99,077,708 | |
Shares outstanding – Class A1 | | | 7,580,654 | |
Net asset value per share – Class A | | | $13.07 | |
Maximum offering price per share – Class A2 | | | $13.87 | |
Net assets – Class C | | $ | 1,743,650 | |
Shares outstanding – Class C1 | | | 141,386 | |
Net asset value per share – Class C | | | $12.33 | |
Net assets – Administrator Class | | $ | 1,290,063 | |
Shares outstanding – Administrator Class1 | | | 100,084 | |
Net asset value per share – Administrator Class | | | $12.89 | |
Net assets – Institutional Class | | $ | 26,867,881 | |
Shares outstanding – Institutional Class1 | | | 2,095,098 | |
Net asset value per share – Institutional Class | | | $12.82 | |
| 1 | The Fund has an unlimited number of authorized shares. |
| 2 | Maximum offering price is computed as 100/94.25 of net asset value. On investments of $50,000 or more, the offering price is reduced. |
The accompanying notes are an integral part of these financial statements.
| | | | | | |
| Statement of operations—year ended October 31, 2018 | | Wells Fargo Asia Pacific Fund | | | 17 | |
| | | | |
| | | | |
| |
Investment income | | | | |
Dividends (net of foreign withholding taxes of $295,095) | | $ | 3,661,366 | |
Income from affiliated securities | | | 105,772 | |
| | | | |
Total investment income | | | 3,767,138 | |
| | | | |
| |
Expenses | | | | |
Management fee | | | 1,597,842 | |
Administration fees | | | | |
Class A | | | 257,126 | |
Class C | | | 4,622 | |
Administrator Class | | | 2,383 | |
Institutional Class | | | 43,302 | |
Shareholder servicing fees | | | | |
Class A | | | 306,102 | |
Class C | | | 5,503 | |
Administrator Class | | | 4,337 | |
Distribution fee | | | | |
Class C | | | 16,508 | |
Custody and accounting fees | | | 147,761 | |
Professional fees | | | 51,866 | |
Registration fees | | | 81,992 | |
Shareholder report expenses | | | 39,951 | |
Trustees’ fees and expenses | | | 23,670 | |
Other fees and expenses | | | 25,801 | |
| | | | |
Total expenses | | | 2,608,766 | |
Less: Fee waivers and/or expense reimbursements | | | (154,224 | ) |
| | | | |
Net expenses | | | 2,454,542 | |
| | | | |
Net investment income | | | 1,312,596 | |
| | | | |
| |
REALIZED AND UNREALIZED GAINS (LOSSES) ON INVESTMENTS | | | | |
| |
Net realized gains (losses) on: | | | | |
Unaffiliated securities | | | 13,610,544 | |
Affiliated securities | | | (293 | ) |
Forward foreign currency contracts | | | (221 | ) |
| | | | |
Net realized gains on investments | | | 13,610,030 | |
Net change in unrealized gains (losses) on investments | | | (33,372,381 | ) |
| | | | |
Net realized and unrealized gains (losses) on investments | | | (19,762,351 | ) |
| | | | |
Net decrease in net assets resulting from operations | | $ | (18,449,755 | ) |
| | | | |
The accompanying notes are an integral part of these financial statements.
| | | | |
| 18 | | Wells Fargo Asia Pacific Fund | | Statement of changes in net assets |
| | | | | | | | | | | | | | | | |
| | | Year ended
October 31, 2018 | | | Year ended
October 31, 20171 | |
| | | | |
Operations | | | | | | | | | | | | | | | | |
Net investment income | | | | | | $ | 1,312,596 | | | | | | | $ | 961,220 | |
Net realized gains on investments | | | | | | | 13,610,030 | | | | | | | | 4,252,860 | |
Net change in unrealized gains (losses) on investments | | | | | | | (33,372,381 | ) | | | | | | | 29,328,681 | |
| | | | |
Net increase (decrease) in net assets resulting from operations | | | | | | | (18,449,755 | ) | | | | | | | 34,542,761 | |
| | | | |
| | | | |
Distributions to shareholders from net investment income and net realized gains | | | | | | | | | | | | | | | | |
Class A | | | | | | | (536,729 | ) | | | | | | | (1,463,867 | ) |
Class C | | | | | | | 0 | | | | | | | | (6,107 | ) |
Administrator Class | | | | | | | (4,325 | ) | | | | | | | (50,069 | ) |
Institutional Class | | | | | | | (271,596 | ) | | | | | | | (295,073 | ) |
| | | | |
Total distributions to shareholders | | | | | | | (812,650 | ) | | | | | | | (1,815,116 | ) |
| | | | |
| | | | |
Capital share transactions | | | Shares | | | | | | | | Shares | | | | | |
Proceeds from shares sold | | | | | | | | | | | | | | | | |
Class A | | | 417,591 | | | | 6,403,383 | | | | 620,409 | | | | 7,822,027 | |
Class C | | | 8,393 | | | | 121,862 | | | | 5,243 | | | | 62,877 | |
Administrator Class | | | 2,010 | | | | 31,448 | | | | 60,384 | | | | 741,557 | |
Institutional Class | | | 670,855 | | | | 10,138,476 | | | | 1,809,183 | | | | 22,286,904 | |
| | | | |
| | | | | | | 16,695,169 | | | | | | | | 30,913,365 | |
| | | | |
Reinvestment of distributions | | | | | | | | | | | | | | | | |
Class A | | | 33,563 | | | | 518,552 | | | | 124,042 | | | | 1,419,041 | |
Class C | | | 0 | | | | 0 | | | | 449 | | | | 4,899 | |
Administrator Class | | | 251 | | | | 3,829 | | | | 4,266 | | | | 47,951 | |
Institutional Class | | | 17,523 | | | | 264,942 | | | | 25,127 | | | | 281,166 | |
| | | | |
| | | | | | | 787,323 | | | | | | | | 1,753,057 | |
| | | | |
Payment for shares redeemed | | | | | | | | | | | | | | | | |
Class A | | | (1,266,646 | ) | | | (19,208,805 | ) | | | (2,264,628 | ) | | | (28,673,054 | ) |
Class C | | | (29,154 | ) | | | (417,293 | ) | | | (37,870 | ) | | | (444,028 | ) |
Administrator Class | | | (37,442 | ) | | | (547,922 | ) | | | (885,130 | ) | | | (10,601,230 | ) |
Institutional Class | | | (899,101 | ) | | | (13,662,192 | ) | | | (389,294 | ) | | | (5,004,838 | ) |
| | | | |
| | | | | | | (33,836,212 | ) | | | | | | | (44,723,150 | ) |
| | | | |
Net decrease in net assets resulting from capital share transactions | | | | | | | (16,353,720 | ) | | | | | | | (12,056,728 | ) |
| | | | |
Total increase (decrease) in net assets | | | | | | | (35,616,125 | ) | | | | | | | 20,670,917 | |
| | | | |
| | | | |
Net assets | | | | | | | | | | | | | | | | |
Beginning of period | | | | | | | 164,595,427 | | | | | | | | 143,924,510 | |
| | | | |
End of period | | | | | | $ | 128,979,302 | | | | | | | $ | 164,595,427 | |
| | | | |
| 1 | Effective for all filings after November 4, 2018, the SEC prospectively eliminated the requirement to parenthetically disclose undistributed net investment income at the end of the period and permitted the aggregation of distributions, with the exception of tax basis returns of capital. Undistributed net investment income at October 31, 2017 was $516,058. The disaggregated distributions information for the year ended October 31, 2017 is included in Note 8, Distributions to Shareholders, in the notes to the financial statements. |
The accompanying notes are an integral part of these financial statements.
| | | | | | |
| Financial highlights | | Wells Fargo Asia Pacific Fund | | | 19 | |
(For a share outstanding throughout each period)
| | | | | | | | | | | | | | | | | | | | |
| | | Year ended October 31 | |
| CLASS A | | 2018 | | | 2017 | | | 2016 | | | 2015 | | | 2014 | |
Net asset value, beginning of period | | | $15.04 | | | | $12.11 | | | | $11.92 | | | | $12.18 | | | | $11.72 | |
Net investment income | | | 0.11 | 1 | | | 0.08 | | | | 0.11 | 1 | | | 0.04 | 1 | | | 0.09 | 1 |
Net realized and unrealized gains (losses) on investments | | | (2.02 | ) | | | 3.00 | | | | 0.29 | | | | (0.16 | ) | | | 0.67 | |
| | | | | | | | | | | | | | | | | | | | |
Total from investment operations | | | (1.91 | ) | | | 3.08 | | | | 0.40 | | | | (0.12 | ) | | | 0.76 | |
Distributions to shareholders from | | | | | | | | | | | | | | | | | | | | |
Net investment income | | | (0.06 | ) | | | (0.15 | ) | | | (0.21 | ) | | | (0.14 | ) | | | (0.30 | ) |
Net asset value, end of period | | | $13.07 | | | | $15.04 | | | | $12.11 | | | | $11.92 | | | | $12.18 | |
Total return2 | | | (12.74 | )% | | | 25.84 | % | | | 3.47 | % | | | (0.95 | )% | | | 6.61 | % |
Ratios to average net assets (annualized) | | | | | | | | | | | | | | | | | | | | |
Gross expenses | | | 1.69 | % | | | 1.66 | % | | | 1.69 | % | | | 1.72 | % | | | 1.71 | % |
Net expenses | | | 1.60 | % | | | 1.60 | % | | | 1.60 | % | | | 1.60 | % | | | 1.60 | % |
Net investment income | | | 0.76 | % | | | 0.58 | % | | | 0.97 | % | | | 0.34 | % | | | 0.80 | % |
Supplemental data | | | | | | | | | | | | | | | | | | | | |
Portfolio turnover rate | | | 50 | % | | | 63 | % | | | 52 | % | | | 113 | % | | | 113 | % |
Net assets, end of period (000s omitted) | | | $99,078 | | | | $126,265 | | | | $120,108 | | | | $137,578 | | | | $6,755 | |
| 1 | Calculated based upon average shares outstanding |
| 2 | Total return calculations do not include any sales charges. |
The accompanying notes are an integral part of these financial statements.
| | | | |
| 20 | | Wells Fargo Asia Pacific Fund | | Financial highlights |
(For a share outstanding throughout each period)
| | | | | | | | | | | | | | | | | | | | |
| | | Year ended October 31 | |
| CLASS C | | 2018 | | | 2017 | | | 2016 | | | 2015 | | | 2014 | |
Net asset value, beginning of period | | | $14.24 | | | | $11.44 | | | | $11.29 | | | | $11.57 | | | | $11.15 | |
Net investment income (loss) | | | (0.00 | )1,2 | | | (0.02 | )1 | | | 0.02 | 1 | | | (0.00 | )1,2 | | | 0.01 | 1 |
Net realized and unrealized gains (losses) on investments | | | (1.91 | ) | | | 2.85 | | | | 0.28 | | | | (0.20 | ) | | | 0.63 | |
| | | | | | | | | | | | | �� | | | | | | | |
Total from investment operations | | | (1.91 | ) | | | 2.83 | | | | 0.30 | | | | (0.20 | ) | | | 0.64 | |
Distributions to shareholders from | | | | | | | | | | | | | | | | | | | | |
Net investment income | | | 0.00 | | | | (0.03 | ) | | | (0.15 | ) | | | (0.08 | ) | | | (0.22 | ) |
Net asset value, end of period | | | $12.33 | | | | $14.24 | | | | $11.44 | | | | $11.29 | | | | $11.57 | |
Total return3 | | | (13.41 | )% | | | 24.86 | % | | | 2.75 | % | | | (1.71 | )% | | | 5.76 | % |
Ratios to average net assets (annualized) | | | | | | | | | | | | | | | | | | | | |
Gross expenses | | | 2.44 | % | | | 2.41 | % | | | 2.44 | % | | | 2.46 | % | | | 2.46 | % |
Net expenses | | | 2.35 | % | | | 2.35 | % | | | 2.35 | % | | | 2.35 | % | | | 2.35 | % |
Net investment income (loss) | | | (0.01 | )% | | | (0.17 | )% | | | 0.14 | % | | | (0.01 | )% | | | 0.12 | % |
Supplemental data | | | | | | | | | | | | | | | | | | | | |
Portfolio turnover rate | | | 50 | % | | | 63 | % | | | 52 | % | | | 113 | % | | | 113 | % |
Net assets, end of period (000s omitted) | | | $1,744 | | | | $2,309 | | | | $2,223 | | | | $3,495 | | | | $2,427 | |
| 1 | Calculated based upon average shares outstanding |
| 2 | Amount is more than $(0.005). |
| 3 | Total return calculations do not include any sales charges. |
The accompanying notes are an integral part of these financial statements.
| | | | | | |
| Financial highlights | | Wells Fargo Asia Pacific Fund | | | 21 | |
(For a share outstanding throughout each period)
| | | | | | | | | | | | | | | | | | | | |
| | | Year ended October 31 | |
| ADMINISTRATOR CLASS | | 2018 | | | 2017 | | | 2016 | | | 2015 | | | 2014 | |
Net asset value, beginning of period | | | $14.79 | | | | $11.88 | | | | $11.72 | | | | $11.99 | | | | $11.54 | |
Net investment income | | | 0.12 | 1 | | | 0.04 | 1 | | | 0.12 | | | | 0.11 | 1 | | | 0.12 | 1 |
Net realized and unrealized gains (losses) on investments | | | (1.99 | ) | | | 3.00 | | | | 0.29 | | | | (0.21 | ) | | | 0.65 | |
| | | | | | | | | | | | | | | | | | | | |
Total from investment operations | | | (1.87 | ) | | | 3.04 | | | | 0.41 | | | | (0.10 | ) | | | 0.77 | |
Distributions to shareholders from | | | | | | | | | | | | | | | | | | | | |
Net investment income | | | (0.03 | ) | | | (0.13 | ) | | | (0.25 | ) | | | (0.17 | ) | | | (0.32 | ) |
Net asset value, end of period | | | $12.89 | | | | $14.79 | | | | $11.88 | | | | $11.72 | | | | $11.99 | |
Total return | | | (12.60 | )% | | | 25.83 | % | | | 3.60 | % | | | (0.83 | )% | | | 6.86 | % |
Ratios to average net assets (annualized) | | | | | | | | | | | | | | | | | | | | |
Gross expenses | | | 1.60 | % | | | 1.58 | % | | | 1.61 | % | | | 1.56 | % | | | 1.52 | % |
Net expenses | | | 1.49 | % | | | 1.50 | % | | | 1.47 | % | | | 1.40 | % | | | 1.40 | % |
Net investment income | | | 0.83 | % | | | 0.36 | % | | | 1.07 | % | | | 0.87 | % | | | 1.04 | % |
Supplemental data | | | | | | | | | | | | | | | | | | | | |
Portfolio turnover rate | | | 50 | % | | | 63 | % | | | 52 | % | | | 113 | % | | | 113 | % |
Net assets, end of period (000s omitted) | | | $1,290 | | | | $2,000 | | | | $11,357 | | | | $14,048 | | | | $13,956 | |
| 1 | Calculated based upon average shares outstanding |
The accompanying notes are an integral part of these financial statements.
| | | | |
| 22 | | Wells Fargo Asia Pacific Fund | | Financial highlights |
(For a share outstanding throughout each period)
| | | | | | | | | | | | | | | | | | | | |
| | | Year ended October 31 | |
| INSTITUTIONAL CLASS | | 2018 | | | 2017 | | | 2016 | | | 2015 | | | 2014 | |
Net asset value, beginning of period | | | $14.75 | | | | $11.89 | | | | $11.73 | | | | $12.00 | | | | $11.55 | |
Net investment income | | | 0.16 | | | | 0.21 | | | | 0.13 | | | | 0.15 | 1 | | | 0.14 | 1 |
Net realized and unrealized gains (losses) on investments | | | (1.98 | ) | | | 2.85 | | | | 0.30 | | | | (0.23 | ) | | | 0.65 | |
| | | | | | | | | | | | | | | | | | | | |
Total from investment operations | | | (1.82 | ) | | | 3.06 | | | | 0.43 | | | | (0.08 | ) | | | 0.79 | |
Distributions to shareholders from | | | | | | | | | | | | | | | | | | | | |
Net investment income | | | (0.11 | ) | | | (0.20 | ) | | | (0.27 | ) | | | (0.19 | ) | | | (0.34 | ) |
Net asset value, end of period | | | $12.82 | | | | $14.75 | | | | $11.89 | | | | $11.73 | | | | $12.00 | |
Total return | | | (12.43 | )% | | | 26.25 | % | | | 3.83 | % | | | (0.65 | )% | | | 6.99 | % |
Ratios to average net assets (annualized) | | | | | | | | | | | | | | | | | | | | |
Gross expenses | | | 1.36 | % | | | 1.33 | % | | | 1.36 | % | | | 1.36 | % | | | 1.27 | % |
Net expenses | | | 1.25 | % | | | 1.25 | % | | | 1.25 | % | | | 1.25 | % | | | 1.25 | % |
Net investment income | | | 1.12 | % | | | 1.11 | % | | | 1.28 | % | | | 1.27 | % | | | 1.15 | % |
Supplemental data | | | | | | | | | | | | | | | | | | | | |
Portfolio turnover rate | | | 50 | % | | | 63 | % | | | 52 | % | | | 113 | % | | | 113 | % |
Net assets, end of period (000s omitted) | | | $26,868 | | | | $34,022 | | | | $10,237 | | | | $11,034 | | | | $502 | |
| 1 | Calculated based upon average shares outstanding |
The accompanying notes are an integral part of these financial statements.
| | | | | | |
| Notes to financial statements | | Wells Fargo Asia Pacific Fund | | | 23 | |
1. ORGANIZATION
Wells Fargo Funds Trust (the “Trust”), a Delaware statutory trust organized on March 10, 1999, is an open-end management investment company registered under the Investment Company Act of 1940, as amended (the “1940 Act”). As an investment company, the Trust follows the accounting and reporting guidance in Financial Accounting Standards Board (“FASB”) Accounting Standards Codification Topic 946, Financial Services – Investment Companies. These financial statements report on the Wells Fargo Asia Pacific Fund (the “Fund”) which is a diversified series of the Trust.
2. SIGNIFICANT ACCOUNTING POLICIES
The following significant accounting policies, which are consistently followed in the preparation of the financial statements of the Fund, are in conformity with U.S. generally accepted accounting principles which require management to make estimates and assumptions that affect the reported amounts of assets and liabilities, disclosure of contingent assets and liabilities at the date of the financial statements, and the reported amounts of revenues and expenses during the reporting period. Actual results could differ from those estimates.
Securities valuation
All investments are valued each business day as of the close of regular trading on the New York Stock Exchange (generally 4 p.m. Eastern Time), although the Fund may deviate from this calculation time under unusual or unexpected circumstances.
Equity securities that are listed on a foreign or domestic exchange or market are valued at the official closing price or, if none, the last sales price. If no sale occurs on the principal exchange or market that day, a fair value price will be determined in accordance with the Fund’s Valuation Procedures.
The values of securities denominated in foreign currencies are translated into U.S. dollars at rates provided by an independent foreign currency pricing source at a time each business day specified by the Wells Fargo Asset Management Pricing Committee at Wells Fargo Funds Management, LLC (“Funds Management”).
Many securities markets and exchanges outside the U.S. close prior to the close of the New York Stock Exchange and therefore may not fully reflect trading or events that occur after the close of the principal exchange in which the foreign securities are traded, but before the close of the New York Stock Exchange. If such trading or events are expected to materially affect the value of such securities, then fair value pricing procedures approved by the Board of Trustees of the Fund are applied. These procedures take into account multiple factors including movements in U.S. securities markets after foreign exchanges close. Foreign securities that are fair valued under these procedures are categorized as Level 2 and the application of these procedures may result in transfers between Level 1 and Level 2. Depending on market activity, such fair valuations may be frequent. Such fair value pricing may result in net asset values that are higher or lower than net asset values based on the last reported sales price or latest quoted bid price. On October 31, 2018, such fair value pricing was not used in pricing foreign securities.
Investments in registered open-end investment companies are valued at net asset value. Interests in non-registered investment companies that are redeemable at net asset value are fair valued normally at net asset value.
Investments which are not valued using any of the methods discussed above are valued at their fair value, as determined in good faith by the Board of Trustees. The Board of Trustees has established a Valuation Committee comprised of the Trustees and has delegated to it the authority to take any actions regarding the valuation of portfolio securities that the Valuation Committee deems necessary or appropriate, including determining the fair value of portfolio securities, unless the determination has been delegated to the Wells Fargo Asset Management Pricing Committee. The Board of Trustees retains the authority to make or ratify any valuation decisions or approve any changes to the Valuation Procedures as it deems appropriate. On a quarterly basis, the Board of Trustees receives reports on any valuation actions taken by the Valuation Committee or the Wells Fargo Asset Management Pricing Committee which may include items for ratification.
Foreign currency translation
The accounting records of the Fund are maintained in U.S. dollars. The values of other assets and liabilities denominated in foreign currencies are translated into U.S. dollars at rates provided by an independent foreign currency pricing source at a time each business day specified by the Wells Fargo Asset Management Pricing Committee. Purchases and sales of securities, and income and expenses are converted at the rate of exchange on the respective dates of such transactions. Net realized foreign exchange gains or losses arise from sales of foreign currencies, currency gains or losses realized between the trade and settlement dates on securities transactions, and the difference between the amounts of dividends, interest and foreign withholding taxes recorded and the U.S. dollar equivalent of the amounts actually paid or received. Net unrealized foreign exchange gains and losses arise from changes in the fair value of assets and liabilities
| | | | |
| 24 | | Wells Fargo Asia Pacific Fund | | Notes to financial statements |
other than investments in securities resulting from changes in exchange rates. The changes in net assets arising from changes in exchange rates of securities and the changes in net assets resulting from changes in market prices of securities are not separately presented. Such changes are included in net realized and unrealized gains or losses from investments.
Participation notes
The Fund may invest in participation notes to gain exposure to securities in certain foreign markets. Participation notes are issued by banks or broker-dealers and are designed to offer a return linked to a particular underlying foreign security. Participation notes involve transaction costs, which may be higher than those applicable to the underlying foreign security. The holder of the participation note is entitled to receive from the bank or broker-dealer, an amount equal to the dividend paid by the issuer of the underlying foreign security; however, the holder is not entitled to the same rights (i.e. voting rights) as an owner of the underlying foreign security. Investments in participation notes involve risks beyond those normally associated with a direct investment in an underlying security. The Fund has no rights against the issuer of the underlying foreign security and participation notes expose the Fund to counterparty risk in the event the counterparty does not perform. There is also no assurance there will be a secondary trading market for the participation note or that the trading price of the participation note will equal the underlying value of the foreign security that it seeks to replicate.
Forward foreign currency contracts
The Fund is subject to foreign currency risk in the normal course of pursuing its investment objectives. A forward foreign currency contract is an agreement between two parties to purchase or sell a specific currency for an agreed-upon price at a future date. The Fund enters into forward foreign currency contracts to facilitate transactions in foreign-denominated securities and to attempt to minimize the risk to the Fund from adverse changes in the relationship between currencies. Forward foreign currency contracts are recorded at the forward rate and marked-to-market daily. When the contracts are closed, realized gains and losses arising from such transactions are recorded as realized gains or losses on forward foreign currency contracts. The Fund could be exposed to risks if the counterparties to the contracts are unable to meet the terms of their contracts or if the value of the foreign currency changes unfavorably. The Fund’s maximum risk of loss from counterparty credit risk is the unrealized gains on the contracts. This risk may be mitigated if there is a master netting arrangement between the Fund and the counterparty.
Securities lending
The Fund may lend its securities from time to time in order to earn additional income in the form of fees or interest on securities received as collateral or the investment of any cash received as collateral. The Fund continues to receive interest or dividends on the securities loaned. The Fund receives collateral in the form of cash or securities with a value at least equal to the value of the securities on loan. The value of the loaned securities is determined at the close of each business day and any additional required collateral is delivered to the Fund on the next business day. In a securities lending transaction, the net asset value of the Fund will be affected by an increase or decrease in the value of the securities loaned and by an increase or decrease in the value of the instrument in which collateral is invested. The amount of securities lending activity undertaken by the Fund fluctuates from time to time. In the event of default or bankruptcy by the borrower, the Fund may be prevented from recovering the loaned securities or gaining access to the collateral or may experience delays or costs in doing so. In addition, the investment of any cash collateral received may lose all or part of its value. The Fund has the right under the lending agreement to recover the securities from the borrower on demand.
The Fund lends its securities through an unaffiliated securities lending agent. Cash collateral received in connection with its securities lending transactions is invested in Securities Lending Cash Investments, LLC (the “Securities Lending Fund”). The Securities Lending Fund is exempt from registration under Section 3(c)(7) of the 1940 Act and is managed by Funds Management and is subadvised by Wells Capital Management Incorporated (“WellsCap”), an affiliate of Funds Management and an indirect wholly owned subsidiary of Wells Fargo & Company (“Wells Fargo”). Funds Management receives an advisory fee starting at 0.05% and declining to 0.01% as the average daily net assets of the Securities Lending Fund increase. All of the fees received by Funds Management are paid to WellsCap for its services as subadviser. The Securities Lending Fund seeks to provide a positive return compared to the daily Fed Funds Open Rate by investing in high-quality, U.S. dollar-denominated short-term money market instruments. Securities Lending Fund investments are valued at the evaluated bid price provided by an independent pricing service. Income earned from investment in the Securities Lending Fund, if any, is included in income from affiliated securities on the Statement of Operations.
Security transactions and income recognition
Securities transactions are recorded on a trade date basis. Realized gains or losses are recorded on the basis of identified cost.
| | | | | | |
| Notes to financial statements | | Wells Fargo Asia Pacific Fund | | | 25 | |
Dividend income is recognized on the ex-dividend date, except for certain dividends from foreign securities, which are recorded as soon as the custodian verifies the ex-dividend date. Dividend income from foreign securities is recorded net of foreign taxes withheld where recovery of such taxes is not assured.
Distributions to shareholders
Distributions to shareholders from net investment income and any net realized gains are recorded on the ex-dividend date and paid at least annually. Such distributions are determined in accordance with income tax regulations and may differ from U.S. generally accepted accounting principles. Dividend sources are estimated at the time of declaration. The tax character of distributions is determined as of the Fund’s fiscal year end. Therefore, a portion of the Fund’s distributions made prior to the Fund’s fiscal year end may be categorized as a tax return of capital at year end.
Federal and other taxes
The Fund intends to continue to qualify as a regulated investment company by distributing substantially all of its investment company taxable income and any net realized capital gains (after reduction for capital loss carryforwards) sufficient to relieve it from all, or substantially all, federal income taxes. Accordingly, no provision for federal income taxes was required.
The Fund’s income and federal excise tax returns and all financial records supporting those returns for the prior three fiscal years are subject to examination by the federal and Delaware revenue authorities. Management has analyzed the Fund’s tax positions taken on federal, state, and foreign tax returns for all open tax years and does not believe that there are any uncertain tax positions that require recognition of a tax liability.
As of October 31, 2018, the aggregate cost of all investments for federal income tax purposes was $126,468,828 and the unrealized gains (losses) consisted of:
| | | | |
Gross unrealized gains | | $ | 14,343,820 | |
Gross unrealized losses | | | (11,403,632 | ) |
Net unrealized gains | | $ | 2,940,188 | |
Class allocations
The separate classes of shares offered by the Fund differ principally in applicable sales charges, distribution, shareholder servicing, and administration fees. Class specific expenses are charged directly to that share class. Investment income, common expenses, and realized and unrealized gains (losses) on investments are allocated daily to each class of shares based on the relative proportion of net assets of each class.
3. FAIR VALUATION MEASUREMENTS
Fair value measurements of investments are determined within a framework that has established a fair value hierarchy based upon the various data inputs utilized in determining the value of the Fund’s investments. The three-level hierarchy gives the highest priority to unadjusted quoted prices in active markets for identical assets or liabilities (Level 1) and the lowest priority to unobservable inputs (Level 3). The Fund’s investments are classified within the fair value hierarchy based on the lowest level of input that is significant to the fair value measurement. The inputs are summarized into three broad levels as follows:
| ∎ | | Level 1 – quoted prices in active markets for identical securities |
| ∎ | | Level 2 – other significant observable inputs (including quoted prices for similar securities, interest rates, prepayment speeds, credit risk, etc.) |
| ∎ | | Level 3 – significant unobservable inputs (including the Fund’s own assumptions in determining the fair value of investments) |
The inputs or methodologies used for valuing investments in securities are not necessarily an indication of the risk associated with investing in those securities.
| | | | |
| 26 | | Wells Fargo Asia Pacific Fund | | Notes to financial statements |
The following is a summary of the inputs used in valuing the Fund’s assets and liabilities as of October 31, 2018:
| | | | | | | | | | | | | | | | |
| | | Quoted prices (Level 1) | | | Other significant
observable inputs
(Level 2) | | | Significant
unobservable inputs (Level 3) | | | Total | |
Assets | | | | | | | | | | | | | | | | |
Investments in: | | | | | | | | | | | | | | | | |
| | | | |
Common stocks | | | | | | | | | | | | | | | | |
Australia | | $ | 11,974,124 | | | $ | 0 | | | $ | 0 | | | $ | 11,974,124 | |
China | | | 28,884,313 | | | | 0 | | | | 0 | | | | 28,884,313 | |
Hong Kong | | | 1,245,118 | | | | 0 | | | | 0 | | | | 1,245,118 | |
India | | | 8,460,566 | | | | 0 | | | | 0 | | | | 8,460,566 | |
Indonesia | | | 1,669,709 | | | | 369,674 | | | | 0 | | | | 2,039,383 | |
Japan | | | 44,761,163 | | | | 0 | | | | 0 | | | | 44,761,163 | |
Malaysia | | | 3,716,512 | | | | 0 | | | | 0 | | | | 3,716,512 | |
Philippines | | | 1,014,716 | | | | 0 | | | | 0 | | | | 1,014,716 | |
Singapore | | | 3,405,055 | | | | 0 | | | | 0 | | | | 3,405,055 | |
South Korea | | | 8,546,097 | | | | 0 | | | | 0 | | | | 8,546,097 | |
Taiwan | | | 5,653,240 | | | | 0 | | | | 0 | | | | 5,653,240 | |
Thailand | | | 2,284,204 | | | | 0 | | | | 0 | | | | 2,284,204 | |
| | | | |
Participation notes | | | | | | | | | | | | | | | | |
China | | | 0 | | | | 1,835,583 | | | | 0 | | | | 1,835,583 | |
| | | | |
Short-term investments | | | | | | | | | | | | | | | | |
Investment companies | | | 4,143,878 | | | | 1,445,064 | | | | 0 | | | | 5,588,942 | |
Total assets | | $ | 125,758,695 | | | $ | 3,650,321 | | | $ | 0 | | | $ | 129,409,016 | |
Additional sector, industry or geographic detail is included in the Portfolio of Investments.
At October 31, 2018, the Fund did not have any transfers into/out of Level 3.
4. TRANSACTIONS WITH AFFILIATES
Management fee
Funds Management, an indirect wholly owned subsidiary of Wells Fargo, is the manager of the Fund and provides advisory and fund-level administrative services under an investment management agreement. Under the investment management agreement, Funds Management is responsible for, among other services, implementing the investment objectives and strategies of the Fund, supervising the subadviser and providing fund-level administrative services in connection with the Fund’s operations. As compensation for its services under the investment management agreement, Funds Management is entitled to receive an annual management fee starting at 1.00% and declining to 0.83% as the average daily net assets of the Fund increase. For the year ended October 31, 2018, the management fee was equivalent to an annual rate of 1.00% of the Fund’s average daily net assets.
Funds Management has retained the services of a subadviser to provide daily portfolio management to the Fund. The fee for subadvisory services is borne by Funds Management. WellsCap is the subadviser to the Fund and is entitled to receive a fee from Funds Management at an annual rate starting at 0.65% and declining to 0.45% as the average daily net assets of the Fund increase.
Administration fees
Under a class-level administration agreement, Funds Management provides class-level administrative services to the Fund, which includes paying fees and expenses for services provided by the transfer agent, sub-transfer agents, omnibus
| | | | | | |
| Notes to financial statements | | Wells Fargo Asia Pacific Fund | | | 27 | |
account servicers and record-keepers. As compensation for its services under the class-level administration agreement, Funds Management receives an annual fee which is calculated based on the average daily net assets of each class as follows:
| | | | |
| | | Class-level
administration fee | |
Class A, Class C | | | 0.21 | % |
Administrator Class, Institutional Class | | | 0.13 | |
Funds Management has contractually waived and/or reimbursed management and administration fees to the extent necessary to maintain certain net operating expense ratios for the Fund. When each class of the Fund has exceeded its expense cap, Funds Management has waived fees and/or reimbursed expenses from fund level expenses on a proportionate basis and then from class specific expenses; otherwise, waivers and/or reimbursements are applied against class specific expenses before fund level expenses. Funds Management has committed through February 28, 2019 to waive fees and/or reimburse expenses to the extent necessary to cap the Fund’s expenses at 1.60% for Class A shares, 2.35% for Class C shares, 1.50% for Administrator Class shares, and 1.25% for Institutional Class shares. After this time, the cap may be increased or the commitment to maintain the cap may be terminated only with the approval of the Board of Trustees.
Distribution fee
The Trust has adopted a distribution plan for Class C shares of the Fund pursuant to Rule 12b-1 under the 1940 Act. A distribution fee is charged to Class C shares and paid to Wells Fargo Funds Distributor, LLC (“Funds Distributor”), the principal underwriter, at an annual rate of 0.75% of the average daily net assets of Class C shares.
In addition, Funds Distributor is entitled to receive the front-end sales charge from the purchase of Class A shares and a contingent deferred sales charge on the redemption of certain Class A shares. Funds Distributor is also entitled to receive the contingent deferred sales charges from redemptions of Class C shares. For the year ended October 31, 2018, Funds Distributor received $1,807 from the sale of Class A shares and $22 in contingent deferred sales charges from redemptions of Class C shares. No contingent deferred sales charges were incurred by Class A shares for the year ended October 31, 2018.
Shareholder servicing fees
The Trust has entered into contracts with one or more shareholder servicing agents, whereby Class A, Class C, and Administrator Class of the Fund are charged a fee at an annual rate of 0.25% of the average daily net assets of each respective class.
A portion of these total shareholder servicing fees were paid to affiliates of Wells Fargo.
Interfund transactions
The Fund may purchase or sell portfolio investment securities to certain other Wells Fargo affiliates pursuant to Rule 17a-7 under the 1940 Act and under procedures adopted by the Board of Trustees. The procedures have been designed to ensure that these interfund transactions, which do not incur broker commissions, are effected at current market prices.
5. INVESTMENT PORTFOLIO TRANSACTIONS
Purchases and sales of investments, excluding U.S. government obligations (if any) and short-term securities, for the year ended October 31, 2018 were $78,060,196 and $96,888,944, respectively.
6. DERIVATIVE TRANSACTIONS
During the year ended October 31, 2018, the Fund entered into forward foreign currency contracts for hedging purposes. The Fund had average contract amounts of $2,512 in forward foreign currency contracts to buy during the year ended October 31, 2018.
7. BANK BORROWINGS
The Trust (excluding the money market funds), Wells Fargo Master Trust and Wells Fargo Variable Trust are parties to a $280,000,000 revolving credit agreement whereby the Fund is permitted to use bank borrowings for temporary or emergency purposes, such as to fund shareholder redemption requests. Interest under the credit agreement is charged to the Fund based on a borrowing rate equal to the higher of the Federal Funds rate in effect on that day plus 1.25% or the overnight LIBOR rate in effect on that day plus 1.25%. In addition, an annual commitment fee equal to 0.25% of the unused balance is allocated to each participating fund.
For the year ended October 31, 2018, there were no borrowings by the Fund under the agreement.
| | | | |
| 28 | | Wells Fargo Asia Pacific Fund | | Notes to financial statements |
8. DISTRIBUTIONS TO SHAREHOLDERS
The tax character of distributions paid was $812,650 and $1,815,116 of ordinary income for the years ended October 31, 2018 and October 31, 2017, respectively.
As of October 31, 2018, the components of distributable earnings on a tax basis were as follows:
| | | | |
Undistributed
ordinary income | | Undistributed
long-term
gain | | Unrealized
gains |
| $3,701,104 | | $10,882,777 | | $2,934,749 |
Effective for all filings after November 4, 2018 the Securities and Exchange Commission eliminated the requirement to separately state the components of distributions to shareholders. The amounts of distributions to shareholders for the year ended October 31, 2017 were as follows:
| | | | |
| | | Net investment
income | |
Class A | | | $1,463,867 | |
Class C | | | 6,107 | |
Administrator Class | | | 50,069 | |
Institutional Class | | | 295,073 | |
9. CONCENTRATION RISKS
Concentration risks result from exposure to a limited number of sectors or geographic regions. A fund that invest a substantial portion of their assets in any sector or geographic region may be more affected by changes in that sector or geographic region than would be a fund whose investments are not heavily weighted in any sector or geographic region.
10. INDEMNIFICATION
Under the Trust’s organizational documents, the officers and Trustees have been granted certain indemnification rights against certain liabilities that may arise out of performance of their duties to the Trust. Additionally, in the normal course of business, the Trust may enter into contracts with service providers that contain a variety of indemnification clauses. The Trust’s maximum exposure under these arrangements is dependent on future claims that may be made against the Fund and, therefore, cannot be estimated.
11. NEW ACCOUNTING PRONOUNCEMENT
In August 2018, FASB issued Accounting Standards Update (“ASU”) No. 2018-13, Fair Value Measurement (Topic 820) Disclosure Framework—Changes to the Disclosure Requirements for Fair Value Measurement. ASU 2018-13 updates the disclosure requirements for fair value measurements by modifying or removing certain disclosures and adding certain new disclosures. The amendments are effective for fiscal years, and interim periods within those fiscal years, beginning after December 15, 2019. Early adoption is permitted. Management has adopted the removal and modification of disclosures early, as permitted, and will adopt the additional new disclosures at the effective date.
12. SUBSEQUENT DISTRIBUTIONS
On December 10, 2018, the Fund declared distributions from short-term capital gains and long-term capital gains to shareholders of record on December 7, 2018. The per share amounts payable on December 11, 2018, were as follows:
| | | | | | | | |
| | | Short-term
capital gains | | | Long-term
capital gains | |
Class A | | | $0.26748 | | | | $1.10825 | |
Class C | | | 0.26748 | | | | 1.10825 | |
Administrator Class | | | 0.26748 | | | | 1.10825 | |
Institutional Class | | | 0.26748 | | | | 1.10825 | |
These distributions are not reflected in the accompanying financial statements.
| | | | | | |
| Report of independent registered public accounting firm | | Wells Fargo Asia Pacific Fund | | | 29 | |
BOARD OF TRUSTEES AND SHAREHOLDERS OF WELLS FARGO FUNDS TRUST:
Opinion on the Financial Statements
We have audited the accompanying statement of assets and liabilities of Wells Fargo Asia Pacific Fund (the “Fund”), one of the funds constituting Wells Fargo Funds Trust, including the portfolio of investments, as of October 31, 2018, the related statement of operations for the year then ended, the statements of changes in net assets for each of the years in the two-year period then ended, and the related notes (collectively, the “financial statements”) and the financial highlights for each of the years in the five-year period then ended. In our opinion, the financial statements and financial highlights present fairly, in all material respects, the financial position of the Fund as of October 31, 2018, the results of its operations for the year then ended, the changes in its net assets for each of the years in the two-year period then ended, and the financial highlights for each of the years in the five-year period then ended, in conformity with U.S. generally accepted accounting principles.
Basis for Opinion
These financial statements and financial highlights are the responsibility of the Fund’s management. Our responsibility is to express an opinion on these financial statements and financial highlights based on our audits. We are a public accounting firm registered with the Public Company Accounting Oversight Board (United States) (“PCAOB”) and are required to be independent with respect to the Fund in accordance with the U.S. federal securities laws and the applicable rules and regulations of the Securities and Exchange Commission and the PCAOB.
We conducted our audits in accordance with the standards of the PCAOB. Those standards require that we plan and perform the audit to obtain reasonable assurance about whether the financial statements and financial highlights are free of material misstatement, whether due to error or fraud. Our audits included performing procedures to assess the risks of material misstatement of the financial statements and financial highlights, whether due to error or fraud, and performing procedures that respond to those risks. Such procedures included examining, on a test basis, evidence regarding the amounts and disclosures in the financial statements and financial highlights. Such procedures also included confirmation of securities owned as of October 31, 2018, by correspondence with the custodian and brokers, or by other appropriate auditing procedures. Our audits also included evaluating the accounting principles used and significant estimates made by management, as well as evaluating the overall presentation of the financial statements and financial highlights. We believe that our audits provide a reasonable basis for our opinion.

We have not been able to determine the specific year that we began serving as the auditor of one or more Wells Fargo Funds investment companies, however we are aware that we have served as the auditor of one or more Wells Fargo Funds investment companies since at least 1955.
Boston, Massachusetts
December 21, 2018
| | | | |
| 30 | | Wells Fargo Asia Pacific Fund | | Other information (unaudited) |
TAX INFORMATION
Pursuant to Section 854 of the Internal Revenue Code, $812,650 of income dividends paid during the fiscal year ended October 31, 2018 has been designated as qualified dividend income (QDI).
Pursuant to Section 853 of the Internal Revenue Code, the Fund expects to designate amounts as foreign taxes paid for the fiscal year ended October 31, 2018. Additional details will be available in the semiannual report.
PROXY VOTING INFORMATION
A description of the policies and procedures that the Fund uses to determine how to vote proxies relating to portfolio securities is available, upon request, by calling 1-800-222-8222, visiting our website at wellsfargofunds.com, or visiting the SEC website at sec.gov. Information regarding how the Fund voted proxies relating to portfolio securities during the most recent 12-month period ended June 30 is available on the Fund’s website at wellsfargofunds.com or by visiting the SEC website at sec.gov.
PORTFOLIO HOLDINGS INFORMATION
The complete portfolio holdings for the Fund are publicly available monthly on the Fund’s website (wellsfargofunds.com), on a one-month delayed basis. In addition, top ten holdings information (excluding derivative positions) for the Fund is publicly available on the Fund’s website on a monthly, seven-day or more delayed basis. The Fund files its complete schedule of portfolio holdings with the SEC for the first and third quarters of each fiscal year on Form N-Q, which is available by visiting the SEC website at sec.gov. In addition, the Fund’s Form N-Q may be reviewed and copied at the SEC’s Public Reference Room in Washington, DC, and at regional offices in New York City, at 233 Broadway, and in Chicago, at 175 West Jackson Boulevard, Suite 900. Information about the Public Reference Room may be obtained by calling 1-800-SEC-0330.
| | | | | | |
| Other information (unaudited) | | Wells Fargo Asia Pacific Fund | | | 31 | |
BOARD OF TRUSTEES AND OFFICERS
Each of the Trustees and Officers1 listed in the table below acts in identical capacities for each fund in the Wells Fargo family of funds, which consists of 152 mutual funds comprising the Wells Fargo Funds Trust, Wells Fargo Variable Trust, Wells Fargo Master Trust and four closed-end funds (collectively the “Fund Complex”). This table should be read in conjunction with the Prospectus and the Statement of Additional Information2. The mailing address of each Trustee and Officer is 525 Market Street, 12th Floor, San Francisco, CA 94105. Each Trustee and Officer serves an indefinite term, however, each Trustee serves such term until reaching the mandatory retirement age established by the Trustees.
Independent Trustees
| | | | | | |
Name and year of birth | | Position held and length of service* | | Principal occupations during past five years or longer | | Current other public company or investment company
directorships |
William R. Ebsworth (Born 1957) | | Trustee, since 2015 | | Retired. From 1984 to 2013, equities analyst, portfolio manager, research director and chief investment officer at Fidelity Management and Research Company in Boston, Tokyo, and Hong Kong, and retired in 2013 as Chief Investment Officer of Fidelity Strategic Advisers, Inc. where he led a team of investment professionals managing client assets. Prior thereto, Board member of Hong Kong Securities Clearing Co., Hong Kong Options Clearing Corp., the Thailand International Fund, Ltd., Fidelity Investments Life Insurance Company, and Empire Fidelity Investments Life Insurance Company. Board member of the Vincent Memorial Hospital Endowment (non-profit organization), where he serves on the Investment Committee and as a Chair of the Audit Committee. Mr. Ebsworth is a CFA® charterholder. | | N/A |
Jane A. Freeman (Born 1953) | | Trustee, since 2015; Chair Liaison, since 2018 | | Retired. From 2012 to 2014 and 1999 to 2008, Chief Financial Officer of Scientific Learning Corporation. From 2008 to 2012, Ms. Freeman provided consulting services related to strategic business projects. Prior to 1999, Portfolio Manager at Rockefeller & Co. and Scudder, Stevens & Clark. Board member of the Harding Loevner Funds from 1996 to 2014, serving as both Lead Independent Director and chair of the Audit Committee. Board member of the Russell Exchange Traded Funds Trust from 2011 to 2012 and the chair of the Audit Committee. Ms. Freeman is a Board Member of The Ruth Bancroft Garden (non-profit organization). She is also an inactive Chartered Financial Analyst. | | N/A |
Isaiah Harris, Jr.3 (Born 1952) | | Trustee, since 2009 | | Retired. Chairman of the Board of CIGNA Corporation since 2009, and Director since 2005. From 2003 to 2011, Director of Deluxe Corporation. Prior thereto, President and CEO of BellSouth Advertising and Publishing Corp. from 2005 to 2007, President and CEO of BellSouth Enterprises from 2004 to 2005 and President of BellSouth Consumer Services from 2000 to 2003. Emeritus member of the Iowa State University Foundation Board of Governors. Emeritus Member of the Advisory Board of Iowa State University School of Business. Advisory Board Member, Palm Harbor Academy (private school). Advisory Board Member, Child Evangelism Fellowship (non-profit). Mr. Harris is a certified public accountant (inactive status). | | CIGNA Corporation |
Judith M. Johnson3 (Born 1949) | | Trustee, since 2008; Audit Committee Chairman, since 2009 | | Retired. Prior thereto, Chief Executive Officer and Chief Investment Officer of Minneapolis Employees Retirement Fund from 1996 to 2008. Ms. Johnson is an attorney, certified public accountant and a certified managerial accountant. | | N/A |
David F. Larcker (Born 1950) | | Trustee, since 2009 | | James Irvin Miller Professor of Accounting at the Graduate School of Business, Stanford University, Director of the Corporate Governance Research Initiative and Senior Faculty of The Rock Center for Corporate Governance since 2006. From 2005 to 2008, Professor of Accounting at the Graduate School of Business, Stanford University. Prior thereto, Ernst & Young Professor of Accounting at The Wharton School, University of Pennsylvania from 1985 to 2005. | | N/A |
| | | | |
| 32 | | Wells Fargo Asia Pacific Fund | | Other information (unaudited) |
| | | | | | |
Name and year of birth | | Position held and length of service* | | Principal occupations during past five years or longer | | Current other public company or investment company
directorships |
Olivia S. Mitchell (Born 1953) | | Trustee, since 2006; Nominating and Governance Committee Chairman, since 2018 | | International Foundation of Employee Benefit Plans Professor, Wharton School of the University of Pennsylvania since 1993. Director of Wharton’s Pension Research Council and Boettner Center on Pensions & Retirement Research, and Research Associate at the National Bureau of Economic Research. Previously, Cornell University Professor from 1978 to 1993. | | N/A |
Timothy J. Penny (Born 1951) | | Trustee, since 1996; Chairman, since 2018; Vice Chairman, from 2017 to 2018 | | President and Chief Executive Officer of Southern Minnesota Initiative Foundation, a non-profit organization, since 2007. Member of the Board of Trustees of NorthStar Education Finance, Inc., a non-profit organization, since 2007. | | N/A |
James G. Polisson (Born 1959) | | Trustee, since 2018; Advisory Board Member, from 2017 to 2018 | | Retired. Chief Marketing Officer, Source (ETF) UK Services, Ltd, from 2015 to 2017. From 2012 to 2015, Principal of The Polisson Group, LLC, a management consulting, corporate advisory and principal investing company. Chief Executive Officer and Managing Director at Russell Investments, Global Exchange Traded Funds from 2010 to 2012. Managing Director of Barclays Global Investors from 1998 to 2010 and Global Chief Marketing Officer for iShares and Barclays Global Investors from 2000 to 2010. Trustee of the San Francisco Mechanics’ Institute, a non-profit organization, from 2013 to 2015. Board member of the Russell Exchange Traded Fund Trust from 2011 to 2012. Director of Barclays Global Investors Holdings Deutschland GmbH from 2006 to 2009. Mr. Polisson is an attorney and has a retired status with the Massachusetts and District of Columbia Bar Associations. | | N/A |
Michael S. Scofield4 (Born 1943) | | Trustee, since 2010 | | Served on the Investment Company Institute’s Board of Governors and Executive Committee from 2008-2011 as well the Governing Council of the Independent Directors Council from 2006-2011 and the Independent Directors Council Executive Committee from 2008-2011. Trustee of the Evergreen Fund complex (and its predecessors) from 1984 to 2010. Chairman of the Evergreen Funds from 2000-2010. Former Trustee of the Mentor Funds. Retired Attorney, Law Offices of Michael S. Scofield. | | N/A |
Pamela Wheelock (Born 1959) | | Trustee, since 2018; Advisory Board Member, from 2017 to 2018 | | Chief Operating Officer, Twin Cities Habitat for Humanity, since January, 2017. Vice President of University Services, University of Minnesota from 2012 to 2017. Prior thereto, on the Board of Directors, Governance Committee and Finance Committee for the Minnesota Philanthropy Partners (Saint Paul Foundation) from 2012 to 2018, Interim President and Chief Executive Officer of Blue Cross Blue Shield of Minnesota from 2010 to 2011, Chairman of the Board from 2009 to 2011 and Board Director from 2003 to 2015. Vice President, Leadership and Community Engagement, Bush Foundation, Saint Paul, Minnesota (a private foundation) from 2009 to 2011. Executive Vice President and Chief Financial Officer, Minnesota Sports and Entertainment from 2004 to 2009 and Senior Vice President from 2002 to 2004. Commissioner of Finance, State of Minnesota, from 1999 to 2002. Currently the Board Chair of the Minnesota Wild Foundation since 2010. | | N/A |
| * | Length of service dates reflect the Trustee’s commencement of service with the Trust’s predecessor entities, where applicable. |
| | | | | | |
| Other information (unaudited) | | Wells Fargo Asia Pacific Fund | | | 33 | |
Officers
| | | | | | |
Name and year of birth | | Position held and length of service | | Principal occupations during past five years or longer | | |
Andrew Owen (Born 1960) | | President, since 2017 | | Executive Vice President of Wells Fargo & Company and Head of Affiliated Managers, Wells Fargo Asset Management, since 2014. In addition, Mr. Owen is currently President, Chief Executive Officer and Director of Wells Fargo Funds Management, LLC since 2017. Prior thereto, Executive Vice President responsible for marketing, investments and product development for Wells Fargo Funds Management, LLC, from 2009 to 2014. | | |
Jeremy DePalma1 (Born 1974) | | Treasurer, since 2012 | | Senior Vice President of Wells Fargo Funds Management, LLC since 2009. Senior Vice President of Evergreen Investment Management Company, LLC from 2008 to 2010 and head of the Fund Reporting and Control Team within Fund Administration from 2005 to 2010. | | |
Alexander Kymn (Born 1973) | | Secretary, since 2018; Chief Legal Officer, since 2018 | | Senior Company Counsel of Wells Fargo Bank, N.A. since 2018 (previously Senior Counsel from 2007 to 2018). Vice President of Wells Fargo Funds Management, LLC from 2008 to 2014. | | |
Michael H. Whitaker (Born 1967) | | Chief Compliance Officer, since 2016 | | Senior Vice President and Chief Compliance Officer since 2016. Senior Vice President and Chief Compliance Officer for Fidelity Investments from 2007 to 2016. | | |
David Berardi (Born 1975) | | Assistant Treasurer, since 2009 | | Vice President of Wells Fargo Funds Management, LLC since 2009. Vice President of Evergreen Investment Management Company, LLC from 2008 to 2010. Manager of Fund Reporting and Control for Evergreen Investment Management Company, LLC from 2004 to 2010. | | |
| 1 | Jeremy DePalma acts as Treasurer of 76 funds and Assistant Treasurer of 76 funds in the Fund Complex. |
| 2 | The Statement of Additional Information includes additional information about the Trustees and is available, without charge, upon request, by calling 1-800-222-8222 or by visiting the website at wellsfargofunds.com. |
| 3 | Mr. Harris will replace Ms. Johnson as the Chairman of the Audit Committee effective January 1, 2019. |
| 4 | Mr. Scofield is expected to retire on December 31, 2018. |
| | | | |
| 34 | | Wells Fargo Asia Pacific Fund | | Other information (unaudited) |
BOARD CONSIDERATION OF INVESTMENT MANAGEMENT AND SUB-ADVISORY AGREEMENTS:
Wells Fargo Asia Pacific Fund
Under the Investment Company Act of 1940 (the “1940 Act”), the Board of Trustees (the “Board”) of Wells Fargo Funds Trust (the “Trust”) must determine annually whether to approve the continuation of the Trust’s investment management and sub-advisory agreements. In this regard, at an in-person meeting held on May 22-23, 2018 (the “Meeting”), the Board, all the members of which have no direct or indirect interest in the investment management and sub-advisory agreements and are not “interested persons” of the Trust, as defined in the 1940 Act (the “Independent Trustees”), reviewed and approved for Wells Fargo Asia Pacific Fund (the “Fund”): (i) an investment management agreement (the “Management Agreement”) with Wells Fargo Funds Management, LLC (“Funds Management”); and (ii) an investment sub-advisory agreement (the “Sub-Advisory Agreement”) with Wells Capital Management Incorporated (the “Sub-Adviser”), an affiliate of Funds Management. The Management Agreement and the Sub-Advisory Agreement are collectively referred to as the “Advisory Agreements.”
At the Meeting, the Board considered the factors and reached the conclusions described below relating to the selection of Funds Management and the Sub-Adviser and the approval of the Advisory Agreements. Prior to the Meeting, including at an in-person meeting in April 2018, the Trustees conferred extensively among themselves and with representatives of Funds Management about these matters. Also, the Board has adopted a team-based approach, with each team consisting of a sub-set of Trustees, to assist the full Board in the discharge of its duties in reviewing investment performance and other matters throughout the year. The Independent Trustees were assisted in their evaluation of the Advisory Agreements by independent legal counsel, from whom they received separate legal advice and with whom they met separately.
In providing information to the Board, Funds Management and the Sub-Adviser were guided by a detailed set of requests for information submitted to them by independent legal counsel on behalf of the Independent Trustees at the start of the Board’s annual contract renewal process earlier in 2018. In considering and approving the Advisory Agreements, the Trustees considered the information they believed relevant, including but not limited to the information discussed below. The Board considered not only the specific information presented in connection with the Meeting, but also the knowledge gained over time through interaction with Funds Management and the Sub-Adviser about various topics. In this regard, the Board reviewed reports of Funds Management at each of its quarterly meetings, which included, among other things, portfolio reviews and investment performance reports. In addition, the Board and the teams mentioned above confer with portfolio managers at various times throughout the year. The Board did not identify any particular information or consideration that was all-important or controlling, and each individual Trustee may have attributed different weights to various factors.
After its deliberations, the Board unanimously approved the continuation of the Advisory Agreements for a one-year term and determined that the compensation payable to Funds Management and the Sub-Adviser under each of the Advisory Agreements was reasonable. The Board considered the approval of the Advisory Agreements for the Fund as part of its consideration of agreements for funds across the complex, but its approvals were made on a fund-by-fund basis. The following summarizes a number of important, but not necessarily all, factors considered by the Board in support of its approvals.
Nature, extent and quality of services
The Board received and considered various information regarding the nature, extent and quality of services provided to the Fund by Funds Management and the Sub-Adviser under the Advisory Agreements. This information included a description of the investment advisory services and Fund-level administrative services covered by the Management Agreement, as well as, among other things, a summary of the background and experience of senior management of Wells Fargo Asset Management (“WFAM”), of which Funds Management and the Sub-Adviser are a part, a summary of investments made in the business of WFAM, a summary of certain organizational and personnel changes involving Funds Management and the Sub-Adviser, and a description of Funds Management’s and the Sub-Adviser’s business continuity planning programs and of their approaches to data privacy and cybersecurity. The Board also considered the qualifications, background, tenure and responsibilities of each of the portfolio managers primarily responsible for the day-to-day portfolio management of the Fund.
The Board evaluated the ability of Funds Management and the Sub-Adviser to attract and retain qualified investment professionals, including research, advisory and supervisory personnel. The Board further considered the compliance programs and compliance records of Funds Management and the Sub-Adviser. In addition, the Board took into account the full range of services provided to the Fund by Funds Management and its affiliates.
| | | | | | |
| Other information (unaudited) | | Wells Fargo Asia Pacific Fund | | | 35 | |
Fund investment performance and expenses
The Board considered the investment performance results for the Fund over various time periods ended December 31, 2017. The Board considered these results in comparison to the investment performance of funds in a universe that was determined by Broadridge Inc. (“Broadridge”) to be similar to the Fund (the “Universe”), and in comparison to the Fund’s benchmark index and to other comparative data. Broadridge is an independent provider of investment company data. The Board received a description of the methodology used by Broadridge to select the mutual funds in the performance Universe. The Board noted that the investment performance of the Fund (Class A) was higher than or in range of the average investment performance of the Universe for the one-, three, and five- year periods under review, but lower than the average investment performance of the Universe for the ten-year period under review. The Board also noted that the investment performance of the Fund was higher than or in range of its benchmark index, the MSCI All Country Asia Pacific Index, for the one-, three, and five- year periods under review, but lower than its benchmark for the ten-year period under review.
The Board received information concerning, and discussed factors contributing to, the underperformance of the Fund relative to the Universe and benchmark for the periods identified above. The Board took note of the explanations for the relative underperformance during these periods, including with respect to investment decisions and market factors that affected the Fund’s investment performance. The Board also took note of the Fund’s outperformance relative to the Universe and benchmark over the more recent time periods under review.
The Board also received and considered information regarding the Fund’s net operating expense ratios and their various components, including actual management fees, custodian and other non-management fees, and Rule 12b-1 and non-Rule 12b-1 shareholder service fees. The Board considered these ratios in comparison to the median ratios of funds in class-specific expense groups that were determined by Broadridge to be similar to the Fund (the “Groups”). The Board received a description of the methodology used by Broadridge to select the mutual funds in the expense Groups and an explanation of how funds comprising expense groups and their expense ratios may vary from year-to-year. Based on the Broadridge reports, the Board noted that the net operating expense ratios of the Fund were lower than or equal to the median net operating expense ratios of the expense Groups for each share class.
The Board took into account the Fund’s investment performance and expense information provided to it among the factors considered in deciding to re-approve the Advisory Agreements.
Investment management and sub-advisory fee rates
The Board reviewed and considered the contractual fee rates payable by the Fund to Funds Management under the Management Agreement, as well as the contractual fee rates payable by the Fund to Funds Management for class-level administrative services under a Class-Level Administration Agreement, which include, among other things, class-level transfer agency and sub-transfer agency costs (collectively, the “Management Rates”). The Board also reviewed and considered the contractual investment sub-advisory fee rates that are payable by Funds Management to the Sub-Adviser for investment sub-advisory services.
Among other information reviewed by the Board was a comparison of the Fund’s Management Rates with the average contractual investment management fee rates of funds in the expense Groups at a common asset level as well as transfer agency costs of the funds in the expense Groups. The Board noted that the Management Rates of the Fund were higher than the sum of these average rates for the Fund’s expense Groups for Class A and Institutional Class, but in range of the sum of these average rates for the Administrator Class. The Board noted that the net operating expense ratios of all of the Fund’s share classes were lower than or equal to the median net operating expense ratios of their expense Groups.
The Board also received and considered information about the portion of the total management fee that was retained by Funds Management after payment of the fee to the Sub-Adviser for sub-advisory services. In assessing the reasonableness of this amount, the Board received and evaluated information about the nature and extent of responsibilities retained and risks assumed by Funds Management and not delegated to or assumed by the Sub-Adviser, and about Funds Management’s on-going oversight services. Given the affiliation between Funds Management and the Sub-Adviser, the Board ascribed limited relevance to the allocation of fees between them.
The Board also received and considered information about the nature and extent of services offered and fee rates charged by Funds Management and the Sub-Adviser to other types of clients with investment strategies similar to those of the Fund. In this regard, the Board received information about the significantly greater scope of services, and compliance, reporting and other legal burdens and risks of managing mutual funds compared with those associated with managing assets of non-mutual fund clients such as institutional separate accounts.
| | | | |
| 36 | | Wells Fargo Asia Pacific Fund | | Other information (unaudited) |
Based on its consideration of the factors and information it deemed relevant, including those described here, the Board determined that the compensation payable to Funds Management under the Management Agreement and to the Sub-Adviser under the Sub-Advisory Agreement was reasonable.
Profitability
The Board received and considered information concerning the profitability of Funds Management, as well as the profitability of both WFAM and Wells Fargo & Co. (“Wells Fargo”) as a whole, from providing services to the Fund and the fund family as a whole. The Board noted that the Sub-Adviser’s profitability information with respect to providing services to the Fund was subsumed in the WFAM and Wells Fargo profitability analysis.
Funds Management reported on the methodologies and estimates used in calculating profitability, including a description of the methodology used to allocate certain expenses and recent enhancements made to the methodology. Among other things, the Board noted that the levels of profitability reported on a fund-by-fund basis varied widely, depending on factors such as the size and type of fund. Based on its review, the Board did not deem the profits reported by Funds Management, WFAM or Wells Fargo from services provided to the Fund to be at a level that would prevent it from approving the continuation of the Advisory Agreements.
Economies of scale
The Board considered the extent to which Funds Management may experience economies of scale in the provision of management services, and the extent to which scale benefits, if any, would be shared with shareholders. In particular, the Board noted the existence of breakpoints in the Fund’s management fee structure, which operate generally to reduce the Fund’s expense ratios as the Fund grows in size. It considered that, for a small fund or a fund that shrinks in size, breakpoints conversely can result in higher fee levels. The Board also considered that in addition to management fee breakpoints, competitive management fee rates set at the outset without regard to breakpoints and fee waiver and expense reimbursement arrangements, as well as investments in the business intended to enhance services available to Fund shareholders, are means of sharing potential economies of scale with shareholders of the Fund.
The Board concluded that the Fund’s fee and expense arrangements, including contractual breakpoints, constituted a reasonable approach to sharing potential economies of scale with the Fund and its shareholders.
Other benefits to Funds Management and the Sub-Adviser
The Board received and considered information regarding potential “fall-out” or ancillary benefits received by Funds Management and its affiliates, including the Sub-Adviser, as a result of their relationships with the Fund. Ancillary benefits could include, among others, benefits directly attributable to other relationships with the Fund and benefits potentially derived from an increase in Funds Management’s and the Sub-Adviser’s business as a result of their relationships with the Fund. The Board noted that various affiliates of Funds Management may receive distribution-related fees, shareholder servicing payments and sub-transfer agency fees in respect of shares sold or held through them and services provided.
The Board also reviewed information about soft dollar credits earned and utilized by the Sub-Adviser, fees earned by Funds Management and the Sub-Adviser from managing a private investment vehicle for the fund family’s securities lending collateral and commissions earned by an affiliated broker from portfolio transactions.
Based on its consideration of the factors and information it deemed relevant, including those described here, the Board did not find that any ancillary benefits received by Funds Management and its affiliates, including the Sub-Adviser, were unreasonable.
Conclusion
At the Meeting, after considering the above-described factors and based on its deliberations and its evaluation of the information described above, the Board unanimously approved the continuation of the Advisory Agreements for a one-year term and determined that the compensation payable to Funds Management and the Sub-Adviser under each of the Advisory Agreements was reasonable.
| | | | | | |
| Appendix A (unaudited) | | Wells Fargo Asia Pacific Fund | | | 37 | |
SALES CHARGE REDUCTIONS AND WAIVERS FOR CERTAIN INTERMEDIARIES
Raymond James & Associates, Inc., Raymond James Financial Services & Raymond James affiliates (“Raymond James”)
Effective on or about March 1, 2019, shareholders purchasing Fund shares through a Raymond James platform or account will be eligible only for the following load waivers (front-end sales charge waivers and contingent deferred, or back-end, sales charge waivers) and discounts, which may differ from those disclosed elsewhere in the Fund’s Prospectus or SAI.
Front-end Sales Load Waivers on Class A shares Available at Raymond James
| | • | | Shares purchased in an investment advisory program. |
| | • | | Shares purchased through reinvestment of capital gains distributions and dividend reinvestment when purchasing shares of the same fund (but not any other fund within the fund family). |
| | • | | Employees and registered representatives of Raymond James or its affiliates and their family members as designated by Raymond James. |
| | • | | Shares purchased from the proceeds of redemptions within the same fund family, provided (1) the repurchase occurs within 90 days following the redemption, (2) the redemption and purchase occur in the same account, and (3) redeemed shares were subject to a front-end or deferred sales load (known as Rights of Reinstatement). |
| | • | | A shareholder in the fund’s Class C shares will have their shares automatically exchanged at net asset value to Class A shares (or the appropriate share class) of the fund if the shares are no longer subject to a CDSC and the exchange is in line with the policies and procedures of Raymond James. |
CDSC Waivers on Class A and C Shares Available at Raymond James
| | • | | Death or disability of the shareholder. |
| | • | | Shares sold as part of a systematic withdrawal plan as described in the Fund’s Prospectus. |
| | • | | Return of excess contributions from an IRA Account. |
| | • | | Shares sold as part of a required minimum distribution for IRA and retirement accounts due to the shareholder reaching age 70½ as described in the Fund’s prospectus. |
| | • | | Shares sold to pay Raymond James fees but only if the transaction is initiated by Raymond James. |
| | • | | Shares acquired through a right of reinstatement. |
Front-end Load Discounts Available at Raymond James: Breakpoints, and/or Rights of Accumulation
| | • | | Breakpoints as described in the Fund’s Prospectus. |
| | • | | Rights of accumulation which entitle shareholders to breakpoint discounts will be automatically calculated based on the aggregated holding of fund family assets held by accounts within the purchaser’s household at Raymond James. Eligible fund family assets not held at Raymond James may be included in the rights of accumulation calculation only if the shareholder notifies his or her financial advisor about such assets. |
This page is intentionally left blank.
This page is intentionally left blank.
This page is intentionally left blank.

For more information
More information about Wells Fargo Funds is available free upon request. To obtain literature, please write, visit the Fund’s website, or call:
Wells Fargo Funds
P.O. Box 219967
Kansas City, MO 64121-9967
Website: wellsfargofunds.com
Individual investors: 1-800-222-8222
Retail investment professionals: 1-888-877-9275
Institutional investment professionals:
1-866-765-0778
This report and the financial statements contained herein are submitted for the general information of the shareholders of the Fund. If this report is used for promotional purposes, distribution of the report must be accompanied or preceded by a current prospectus. Before investing, please consider the investment objectives, risks, charges, and expenses of the investment. For a current prospectus and, if available, a summary prospectus, containing this information, call 1-800-222-8222 or visit the Fund’s website at wellsfargofunds.com. Read the prospectus carefully before you invest or send money.
Wells Fargo Asset Management (WFAM) is the trade name for certain investment advisory/management firms owned by Wells Fargo & Company. These firms include but are not limited to Wells Capital Management Incorporated and Wells Fargo Funds Management, LLC. Certain products managed by WFAM entities are distributed by Wells Fargo Funds Distributor, LLC (a broker/dealer and Member FINRA).
This material is for general informational and educational purposes only and is NOT intended to provide investment advice or a recommendation of any kind—including a recommendation for any specific investment, strategy, or plan.
NOT FDIC INSURED ◾ NO BANK GUARANTEE ◾ MAY LOSE VALUE
© 2018 Wells Fargo Funds Management, LLC. All rights reserved.
| | |
 | | 318242 12-18 A236/AR236 10-18 |
Annual Report
October 31, 2018

Wells Fargo Diversified International Fund

Beginning on January 1, 2021, as permitted by new regulations adopted by the Securities and Exchange Commission, paper copies of the Fund’s annual and semi-annual shareholder reports will no longer be sent by mail, unless you specifically request paper copies of the reports. Instead, the reports will be made available on the Fund’s website, and you will be notified by mail each time a report is posted and provided with a website address to access the report.
If you already elected to receive shareholder reports electronically, you will not be affected by this change and you need not take any action. You may elect to receive shareholder reports and other communications from the Fund electronically at any time by contacting your financial intermediary (such as a broker-dealer or bank) or, if you are a direct investor, by calling 1-800-222-8222 or by enrolling at wellsfargo.com/advantagedelivery.
You may elect to receive all future reports in paper free of charge. If you invest through a financial intermediary, you can contact your financial intermediary to request that you continue to receive paper copies of your shareholder reports; if you invest directly with the Fund, you can call 1-800-222-8222. Your election to receive reports in paper will apply to all Wells Fargo Funds held in your account with your financial intermediary or, if you are a direct investor, to all Wells Fargo Funds that you hold.

Reduce clutter. Save trees.
Sign up for electronic delivery of prospectuses and shareholder reports at wellsfargo.com/advantagedelivery
Contents
The views expressed and any forward-looking statements are as of October 31, 2018, unless otherwise noted, and are those of the Fund managers and/or Wells Fargo Funds Management, LLC. Discussions of individual securities, or the markets generally, or any Wells Fargo Fund are not intended as individual recommendations. Future events or results may vary significantly from those expressed in any forward-looking statements. The views expressed are subject to change at any time in response to changing circumstances in the market. Wells Fargo Funds Management, LLC and the Fund disclaim any obligation to publicly update or revise any views expressed or forward-looking statements.
NOT FDIC INSURED ◾ NO BANK GUARANTEE ◾ MAY LOSE VALUE
| | | | |
| 2 | | Wells Fargo Diversified International Fund | | Letter to shareholders (unaudited) |

Andrew Owen
President
Wells Fargo Funds
The early months of the reporting period were characterized by strong performance for equity and fixed-income markets. The remainder of the reporting period generated economic, business, and investing data that were decidedly more mixed and volatile relative to the prior year.
Dear Shareholder:
We are pleased to offer you this annual report for the Wells Fargo Diversified International Fund for the 12-month period that ended October 31, 2018. The early months of the reporting period were characterized by strong performance for equity and fixed-income markets. The remainder of the reporting period generated economic, business, and investing data that were decidedly more mixed and volatile relative to the prior year.
For the period, U.S. stocks, as measured by the S&P 500 Index,1 gained 7.35% and international stocks, as measured by the MSCI ACWI ex USA Index (Net),2 declined 8.24%. Based on the MSCI EM Index (Net),3 emerging market stocks lost 12.52%. For bond investors, the Bloomberg Barclays U.S. Aggregate Bond Index4 declined 2.05% while the Bloomberg Barclays Global Aggregate ex-USD Index5 fell 2.09%. The Bloomberg Barclays Municipal Bond Index6 dropped 0.51%, and the ICE BofAML U.S. High Yield Index7 was up 0.86%.
Optimism continued to shape markets as 2017 closed and 2018 opened.
Economic conditions in late 2017 were characterized by synchronized global growth, low inflation, healthy corporate earnings, growing consumer confidence, declining unemployment, and a weaker U.S. dollar that supported international growth. The U.S. Bureau of Economic Analysis reported that U.S. gross domestic product (GDP) growth on an annualized basis for the fourth quarter of 2017 was 2.9% and inflation remained below U.S. Federal Reserve (Fed) targets.
Economic momentum continued in Europe. The Bank of England (BOE) raised interest rates in November 2017 to 0.50%, the first increase in more than 10 years, indicating confidence in the economy’s growth potential. Meanwhile, the European Central Bank (ECB) and the Bank of Japan (BOJ) kept interest rates low to spur business activities and bought bonds in an effort to encourage equity investments. The People’s Bank of China (PBOC) also sought to stimulate economic growth. Many emerging market economies benefited from stronger currencies versus the U.S. dollar, while commodity price increases benefited countries that rely on natural resources for exports.
| 1 | The S&P 500 Index consists of 500 stocks chosen for market size, liquidity, and industry group representation. It is a market-value-weighted index with each stock’s weight in the index proportionate to its market value. You cannot invest directly in an index. |
| 2 | The Morgan Stanley Capital International (MSCI) All Country World Index (ACWI) ex USA Index (Net) is a free-float-adjusted market-capitalization-weighted index that is designed to measure the equity market performance of developed markets, excluding the United States and Canada. Source: MSCI. MSCI makes no express or implied warranties or representations and shall have no liability whatsoever with respect to any MSCI data contained herein. The MSCI data may not be further redistributed or used as a basis for other indices or any securities or financial products. This report is not approved, reviewed, or produced by MSCI. You cannot invest directly in an index. |
| 3 | The MSCI Emerging Markets (EM) Index (Net) is a free-float-adjusted market-capitalization-weighted index that is designed to measure large- and mid-cap equity market performance of emerging markets. The MSCI EM Index (Net) consists of the following 24 emerging market country indices: Brazil, Chile, China, Colombia, Czech Republic, Egypt, Greece, Hungary, India, Indonesia, Korea, Malaysia, Mexico, Pakistan, Peru, the Philippines, Poland, Qatar, Russia, South Africa, Taiwan, Thailand, Turkey, and the United Arab Emirates. You cannot invest directly in an index. |
| 4 | The Bloomberg Barclays U.S. Aggregate Bond Index is a broad-based benchmark that measures the investment-grade, U.S. dollar-denominated, fixed-rate taxable bond market, including Treasuries, government-related and corporate securities, mortgage-backed securities (agency fixed-rate and hybrid adjustable-rate mortgage pass-throughs), asset-backed securities, and commercial mortgage-backed securities. You cannot invest directly in an index. |
| 5 | The Bloomberg Barclays Global Aggregate ex-USD Index is an unmanaged index that provides a broad-based measure of the global investment-grade fixed-income markets excluding the U.S. dollar-denominated debt market. You cannot invest directly in an index. |
| 6 | The Bloomberg Barclays Municipal Bond Index is an unmanaged index composed of long-term tax-exempt bonds with a minimum credit rating of Baa. You cannot invest directly in an index. |
| 7 | The ICE BofAML U.S. High Yield Index is a market-capitalization-weighted index of domestic and Yankee high-yield bonds. The index tracks the performance of high-yield securities traded in the U.S. bond market. You cannot invest directly in an index. Copyright 2018. ICE Data Indices, LLC. All rights reserved. |
| | | | | | |
| Letter to shareholders (unaudited) | | Wells Fargo Diversified International Fund | | | 3 | |
Volatility reemerged during the early months of 2018.
In February 2018, investor concerns arose about inflation and trade, particularly between the U.S. and China. The Fed followed its 25-basis-point (bp; 100 bps equal 1.00%) federal funds rate increase in December 2017 with a further 25-bp increase in March 2018. The inflation rate in March reached the Fed’s 2% target for the first time in a year. The S&P 500 Index closed the first quarter with a negative return, the first negative quarterly return for the index since 2014.
Overseas, investment markets fell, hurt by a stronger U.S. dollar and mounting trade and diplomatic tensions. The MSCI ACWI ex USA Index (Net) declined 1.81% for the quarter that ended March 31, 2018.
Global trade tensions prompted investor concerns.
Global trade tensions escalated during the second quarter of 2018. The U.S. government’s decision to impose tariffs on a wide range of products manufactured overseas drew retaliatory responses from foreign governments, which punished U.S. commodity producers and product manufacturers. Investors were left to wonder about next steps in what appeared to be an escalating divergence in global economic policies and growth prospects.
Inflation trended higher. The CPI-U8 added 0.1% in June after an increase of 0.2% in both April and May. On a year-over-year basis, the all-items index rose 2.9% for the 12 months that ended June 30, 2018. The index for all items less food and energy rose 2.3% for the same 12-month period.
U.S. stocks gained following positive economic data while international stocks and bonds declined.
During the summer months, the U.S. economy strengthened. Revised second-quarter GDP data released in August showed the U.S. economy growing at a 4.2% rate. The unemployment rate in the U.S. was 3.7% by the end of September, according to the U.S. Department of Labor. Wages showed more consistent growth, and consumer confidence remained strong. Several U.S. equity market indices reached records during August, with the S&P 500 Index gaining 7.20% for the three-month period that ended September 30, 2018. In contrast, the MSCI ACWI ex USA Index (Net) gained 0.71% while the MSCI EM Index (Net) declined 1.09% during the same three-month period.
In June, the Fed increased the target range for the federal funds rate to range from 1.75% to 2.00%. It raised the range again in September to range from 2.00% to 2.25%. Long-term interest rates in the U.S. remained at higher levels relative from the prior 10 years. Rates on 10-year and 30-year Treasury bonds—2.46% and 2.81%, respectively, on January 1, 2018—were 3.15% and 3.39%, respectively, on October 31, 2018. Investor concerns about an inverted yield curve waned, only to be replaced by concerns about the potentially negative influence of higher interest rates on economic activity.
October proved to be a difficult month for stock markets globally.
As interest rates and bond yields gained during October, stock markets struggled. For the month, the S&P 500 Index fell 6.84%, the MSCI ACWI ex USA Index (Net) dropped 8.13%, and the MSCI EM Index (Net) lost 8.71%. The Bureau of Economic Analysis released its first estimate of third-quarter GDP, which, at an annualized 3.5% rate, indicated growth may be slowing compared with the second quarter. Readings on consumer sentiment and business spending were mixed.
The S&P 500 Index closed the first quarter with a negative return, the first negative quarterly return for the index since 2014.
| 8 | The Consumer Price Index for All Urban Consumers (CPI-U) measures the changes in the price of a basket of goods and services purchased by urban consumers. The urban consumer population is deemed by many as a better representative measure of the general public because close to 90% of the country’s population lives in highly populated areas. You cannot invest directly in an index. |
| | | | |
| 4 | | Wells Fargo Diversified International Fund | | Letter to shareholders (unaudited) |
Economic signals overseas also were mixed as the third quarter ended and the fourth quarter began. In early August, the BOE’s Monetary Policy Committee increased its key interest rate to 0.75%. The ECB and BOJ maintained low interest rates and accommodative monetary policies. Amid rising trade uncertainty, the PBOC cut reserve requirement ratios and accelerated infrastructure spending and tax cuts for business enterprises and individuals. Nevertheless, a strengthening U.S. dollar and the trade tensions remained headwinds for investors overseas.
Don’t let short-term uncertainty derail long-term investment goals.
Periods of investment uncertainty can present challenges, but experience has taught us that maintaining long-term investment goals can be an effective way to plan for the future. To help you create a sound strategy based on your personal goals and risk tolerance, Wells Fargo Funds offers more than 100 mutual funds spanning a wide range of asset classes and investment styles. Although diversification cannot guarantee an investment profit or prevent losses, we believe it can be an effective way to manage investment risk and potentially smooth out overall portfolio performance. We encourage investors to know their investments and to understand that appropriate levels of risk-taking may unlock opportunities.
Thank you for choosing to invest with Wells Fargo Funds. We appreciate your confidence in us and remain committed to helping you meet your financial needs.
Sincerely,

Andrew Owen
President
Wells Fargo Funds
Notice to shareholders
At a meeting held on August 14-15, 2018, the Board of Trustees of the Fund approved the following policy which will be effective on or about February 5, 2019:
Class C shares will convert automatically into Class A shares ten years after the initial date of purchase or, if you acquired your Class C shares through an exchange or conversion from another share class, ten years after the date you acquired your Class C shares. When Class C shares that you acquired through a purchase or exchange convert, any other Class C shares that you purchased with reinvested dividends and distributions also will convert into Class A shares on a pro rata basis. A shorter holding period may also apply depending on your intermediary. Please see “Appendix A—Sales Charge Reductions and Waivers for Certain Intermediaries” in the Fund’s prospectus or at the end of this report.
For further information about your Fund, contact your investment professional, visit our website at wellsfargofunds.com, or call us directly at 1-800-222-8222.
This page is intentionally left blank.
| | | | |
| 6 | | Wells Fargo Diversified International Fund | | Performance highlights (unaudited) |
Investment objective
The Fund seeks long-term capital appreciation.
Manager
Wells Fargo Funds Management, LLC
Subadvisers
Artisan Partners Limited Partnership
LSV Asset Management
Wells Capital Management Incorporated
Portfolio managers
Josef Lakonishok, Ph.D.
Venkateshwar (Venk) Lal
Puneet Mansharamani, CFA®
Menno Vermeulen, CFA®
Dale A. Winner, CFA®
Mark L. Yockey, CFA®
Average annual total returns (%) as of October 31, 20181
| | | | | | | | | | | | | | | | | | | | | | | | | | | | | | | | | | |
| | | | | Including sales charge | | | Excluding sales charge | | | Expense ratios2 (%) | |
| | | Inception date | | 1 year | | | 5 year | | | 10 year | | | 1 year | | | 5 year | | | 10 year | | | Gross | | | Net3 | |
| Class A (SILAX) | | 9-24-1997 | | | (12.37 | ) | | | 0.51 | | | | 6.15 | | | | (7.00 | ) | | | 1.71 | | | | 6.78 | | | | 1.79 | | | | 1.36 | |
| Class C (WFECX) | | 4-1-1998 | | | (8.76 | ) | | | 0.94 | | | | 6.02 | | | | (7.76 | ) | | | 0.94 | | | | 6.02 | | | | 2.54 | | | | 2.11 | |
| Class R6 (WDIRX) | | 9-30-2015 | | | – | | | | – | | | | – | | | | (6.61 | ) | | | 2.04 | | | | 7.07 | | | | 1.36 | | | | 0.90 | |
| Administrator Class (WFIEX) | | 11-8-1999 | | | – | | | | – | | | | – | | | | (6.94 | ) | | | 1.83 | | | | 6.95 | | | | 1.71 | | | | 1.26 | |
| Institutional Class (WFISX) | | 8-31-2006 | | | – | | | | – | | | | – | | | | (6.68 | ) | | | 2.10 | | | | 7.18 | | | | 1.46 | | | | 1.00 | |
| MSCI EAFE Index (Net)4 | | – | | | – | | | | – | | | | – | | | | (6.85 | ) | | | 2.02 | | | | 6.89 | | | | – | | | | – | |
Figures quoted represent past performance, which is no guarantee of future results, and do not reflect taxes that a shareholder may pay on fund distributions or the redemption of fund shares. Investment return and principal value of an investment will fluctuate so that an investor’s shares, when redeemed, may be worth more or less than their original cost. Performance shown without sales charges would be lower if sales charges were reflected. Current performance may be lower or higher than the performance data quoted, which assumes the reinvestment of dividends and capital gains. Current month-end performance is available on the Fund’s website, wellsfargofunds.com.
Index returns do not include transaction costs associated with buying and selling securities, any mutual fund fees or expenses, or any taxes. It is not possible to invest directly in an index.
For Class A shares, the maximum front-end sales charge is 5.75%. For Class C shares, the maximum contingent deferred sales charge is 1.00%. Performance including a contingent deferred sales charge assumes the sales charge for the corresponding time period. Class R6, Administrator Class, and Institutional Class shares are sold without a front-end sales charge or contingent deferred sales charge.
Stock values fluctuate in response to the activities of individual companies and general market and economic conditions. Foreign investments are especially volatile and can rise or fall dramatically due to differences in the political and economic conditions of the host country. These risks are generally intensified in emerging markets. The use of derivatives may reduce returns and/or increase volatility. Certain investment strategies tend to increase the total risk of an investment (relative to the broader market). The Fund is exposed to smaller-company securities risk. Consult the Fund’s prospectus for additional information on these and other risks.
Please see footnotes on page 7.
| | | | | | |
| Performance highlights (unaudited) | | Wells Fargo Diversified International Fund | | | 7 | |
|
| Growth of $10,000 investment as of October 31, 20185 |
|
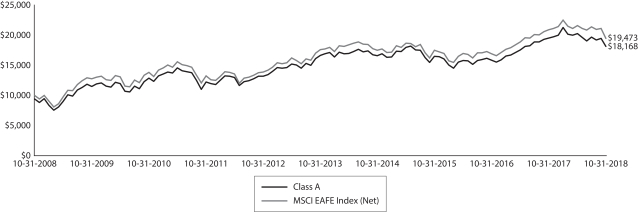 |
| 1 | Historical performance shown for the Class R6 shares prior to their inception reflects the performance of the Administrator Class shares, and includes the higher expenses applicable to Administrator Class shares. If these expenses had not been included, returns for Class R6 shares would be higher. |
| 2 | Reflects the expense ratios as stated in the most recent prospectuses, which include the impact of 0.01% in acquired fund fees and expenses. The expense ratios shown are subject to change and may differ from the annualized expense ratios shown in the financial highlights of this report, which do not include acquired fund fees and expenses. |
| 3 | The manager has contractually committed through February 28, 2019, to waive fees and/or reimburse expenses to the extent necessary to cap the Fund’s Total Annual Operating Expenses After Fee Waivers at 1.35% for Class A, 2.10% for Class C, 0.89% for Class R6, 1.25% for Administrator Class, and 0.99% Institutional Class. After this time, the cap may be increased or the commitment to maintain the cap may be terminated only with the approval of the Board of Trustees. Brokerage commissions, stamp duty fees, interest, taxes, acquired fund fees and expenses (if any), and extraordinary expenses are excluded from the expense cap. Without this cap, the Fund’s returns would have been lower. The expense ratio paid by an investor is the net expense ratio (the total annual fund operating expenses after fee waivers) as stated in the prospectuses. |
| 4 | The Morgan Stanley Capital International (MSCI) Europe, Australasia, and Far East (EAFE) Index (Net) is a free-float-adjusted market-capitalization-weighted index that is designed to measure the equity market performance of developed markets, excluding the United States and Canada. The MSCI EAFE Index (Net) consists of the following 21 developed markets country indices: Australia, Austria, Belgium, Denmark, Finland, France, Germany, Hong Kong, Ireland, Israel, Italy, Japan, the Netherlands, New Zealand, Norway, Portugal, Singapore, Spain, Sweden, Switzerland, and the United Kingdom. Source: MSCI. MSCI makes no express or implied warranties or representations and shall have no liability whatsoever with respect to any MSCI data contained herein. The MSCI data may not be further redistributed or used as a basis for other indices or any securities or financial products. This report is not approved, reviewed, or produced by MSCI. You cannot invest directly in an index. |
| 5 | The chart compares the performance of Class A shares for the most recent ten years with the MSCI EAFE Index (Net). The chart assumes a hypothetical investment of $10,000 in Class A shares and reflects all operating expenses and assumes the maximum initial sales charge of 5.75%. |
| 6 | The MSCI EAFE Value Index is a free-float-adjusted market-capitalization-weighted index that is designed to measure the equity market performance of value securities within developed equity markets, excluding the United States and Canada. The MSCI EAFE Value Index consists of the following 21 developed markets country indices: Australia, Austria, Belgium, Denmark, Finland, France, Germany, Hong Kong, Ireland, Israel, Italy, Japan, the Netherlands, New Zealand, Norway, Portugal, Singapore, Spain, Sweden, Switzerland, and the United Kingdom. You cannot invest directly in an index. |
| 7 | The MSCI EAFE Growth Index is a free-float-adjusted market-capitalization-weighted index that is designed to measure the equity market performance of growth securities within developed equity markets, excluding the United States and Canada. The MSCI EAFE Growth Index consists of the following 21 developed markets country indices: Australia, Austria, Belgium, Denmark, Finland, France, Germany, Hong Kong, Ireland, Israel, Italy, Japan, the Netherlands, New Zealand, Norway, Portugal, Singapore, Spain, Sweden, Switzerland, and the United Kingdom. You cannot invest directly in an index. |
| 8 | The ten largest holdings, excluding cash, cash equivalents and any money markets, are calculated based on the value of the investments divided by total net assets of the Fund. Holdings are subject to change and may have changed since the date specified. |
| 9 | Amounts are calculated based on the total long-term investments of the Fund. These amounts are subject to change and may have changed since the date specified. |
| 10 | The Purchasing Managers’ Index (PMI) is an indicator of economic health for manufacturing and service sectors. The purpose of the PMI is to provide information about current business conditions to company decision makers, analysts and purchasing managers. You cannot invest directly in an index. |
| 11 | The Citigroup Economic Surprise Indices are objective and quantitative measures of economic news. They are defined as weighted historical standard deviations of data surprises (actual releases vs Bloomberg survey median). A positive reading of the Economic Surprise Index suggests that economic releases have on balance been beating consensus. The indices are calculated daily in a rolling three-month window. The weights of economic indicators are derived from relative high-frequency spot FX impacts of 1 standard deviation data surprises. The indices also employ a time decay function to replicate the limited memory of markets. You cannot invest directly in an index. |
| * | This security was no longer held at the end of the reporting period. |
| | | | |
| 8 | | Wells Fargo Diversified International Fund | | Performance highlights (unaudited) |
MANAGERS’ DISCUSSION
Fund highlights
| ∎ | | The Fund (Class A, excluding sales charges) underperformed its benchmark, the MSCI EAFE Index (Net), for the 12-month period that ended October 31, 2018. |
| ∎ | | Value stocks underperformed growth stocks during the reporting period, creating a more challenging investment climate for two of the three subadvisors—LSV Asset Management (LSV) and Wells Capital Management (WellsCap). Investments in the health care sector detracted from relative performance, and the most significant detractor was Bayer AG. Shares of the German chemical and pharmaceutical company declined late in the year, after completing a merger with Monsanto Company; the benefits of the merger are not projected to occur for many years. Additionally, Monsanto (now Bayer) recently lost a product liability court case, which concerned investors. |
| ∎ | | Investments in the financials sector were significant contributors, led by an investment in Deutsche Boerse AG. Shares of the German stock exchange company benefited from a cyclical uplift due to higher equity market volatility and higher interest rates in the U.S. Investments in the information technology (IT) and energy sectors also supported relative performance. |
Developed international equity markets began the period on a positive note gaining nearly 10% through mid-February. The investment outlook turned cloudier later in the reporting period. Global earnings growth and corporate fundamentals, in general, remained healthy; however, investor sentiment in international equities waned as macroeconomic and geopolitical issues surfaced. Developed international markets as measured by the MSCI EAFE Index (Net) finished in negative territory for the 12- month period ended October 31, 2018 declining 6.85%. Value stocks lagged growth stocks in the period as the MSCI EAFE Value Index6 declined 7.69% while the MSCI EAFE Growth Index7 was down just 6.04%.
Emerging markets also showed underperformance versus domestic U.S. equities. This past year’s market performance was underpinned by volatility across global capital markets, particularly in international equity and currency markets, with continued unsettled crosscurrents geopolitically and in domestic national politics. Under this backdrop of uncertainty, over the last quarter the U.S. dollar’s strength was apparent across cross rates—exchange rates between two currencies not including the U.S. dollar—in many developed markets and, especially, emerging markets. Commodity-market volatility remained high with Brent oil prices approaching $85 per barrel and gold prices stabilizing but copper and metals prices remaining weak.
| | | | |
| Ten largest holdings (%) as of October 31, 20188 | |
Linde plc | | | 2.24 | |
Deutsche Boerse AG | | | 2.02 | |
Wirecard AG | | | 1.88 | |
BP plc | | | 1.64 | |
Muenchener Rueckversicherungs Gesellschaft AG | | | 1.60 | |
Novartis AG | | | 1.44 | |
Mitsubishi UFJ Financial Group Incorporated | | | 1.43 | |
Airbus SE | | | 1.34 | |
Medtronic plc | | | 1.31 | |
Nestle SA | | | 1.28 | |
WellsCap
WellsCap maintains a blend equity style that emphasizes bottom-up stock selection based on rigorous, in-depth fundamental company research and incorporates consideration of top-down factors and developments as they affect market and economic activity within regions, countries, and sectors.
Over the past year, WellsCap witnessed a reversal for international equity market returns, with emerging markets as well as developed markets showing underperformance versus domestic U.S. equities. WellsCap continued to implement a fundamental research process as it sought to maximize attractive long-term international opportunities, seeking nonconsensus values worldwide and maintaining a
focus on investment-risk management by marrying fundamental stock picking with macroeconomic and risk research in an environment of sustained volatility across capital markets and continued differentiation between international developed and emerging equity markets versus U.S.-domiciled equities.
While political and macroeconomic considerations affected broad market behavior this past quarter, WellsCap implemented an investment and risk management process of finding nonconsensus undervalued equities, marrying core micro stock picking with macro risk management in each region of the globe. Notable exposures included undervalued financials in Europe and Asia, undervalued cyclicals with self-help catalysts globally, and undervalued telecommunications companies that have generated high levels of cash, particularly in emerging markets.
Please see footnotes on page 7.
| | | | | | |
| Performance highlights (unaudited) | | Wells Fargo Diversified International Fund | | | 9 | |
Portfolio currency hedges remain on the lower end of the strategy’s historical size range given more economic recoveries around the world, raising those currencies’ forward interest rate differentials, and unlike in 2012 to 2016, WellsCap believes that currently there is less of a strong U.S.-dollar policy articulated by a U.S. administration speaking with a single voice. As such, the strategy currently has partial hedges of British pound exposure (net pound exposure below benchmark weight) and limited hedges versus the euro (net euro exposure exceeds benchmark weight).
Top positive international country performance contributors included the Netherlands, the U.K., South Africa, South Korea, Hong Kong/China, Israel, and Malaysia. These gains were offset by holdings in Germany, Japan, Canada, France, and Australia.
|
| Sector distribution as of October 31, 20189 |
|
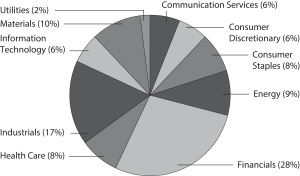
|
The year’s sector performance reflected strong stock selection across several sectors. The communication services sector overweight had a number of top performers ranging from global business information services provider UBM Financial Corporation to domestically facing SK Telecom Company, Limited, and China Mobile Limited. UBM delivered strong results, benefiting from self-help restructuring as it transformed into a pure-play events organizing business with the 2015 sale of its PR Newswire unit to Cision Limited and its acquisition of Allworld Exhibitions, a privately owned Asian exhibitions business, in 2016. UBM was acquired by Informa PLC in 2018.
Financials also contributed to relative performance with holdings in companies ranging from insurers, including NN Group N.V., Munich Re Group,* and Zurich Insurance Group Limited*, to diversified financials companies, including Daiwa Securities Group Incorporated and Mitsubishi UFJ Financial Group, Incorporated, to banks, including CIMB Group Holdings Berhad and DNB ASA.* NN Group, a well-capitalized European life insurance company, performed on strong cash flow generation and management commitment to return excess capital to shareholders via dividends and stock buybacks. Materials sector performers included a number of self-help restructuring companies, such as OCI N.V. and Sasol Limited. OCI, a top-five global producer of nitrogen fertilizers, methanol, and other natural gas–based products for agricultural and industrial customers, appreciated as cash flow reached an inflection point. Sasol, a South African integrated chemicals and energy company, outperformed due to self-help and cyclical catalysts as its Lake Charles Chemical Project continues to be de-risked and as Brent traded above the three-year average.
Underperforming holdings over the course of last year included stocks in the industrials and health care sectors. Industrials stocks accounted for sector weakness, primarily in Europe, including Compagnie de Saint-Gobain S.A., Prysmian S.p.A., Siemens AG, and Rheinmetall AG. A large position in Compagnie de Saint-Gobain, a French building products company, suffered due to a number of headwinds in the first half of the year, including issues with its float glass and automotive plants as well as unfavorable currency movements. Stocks in the health care sector also underperformed, including holdings in Bayer and Shanghai Pharmaceuticals Holding Company, Limited. Bayer underperformed, and the team trimmed the position based on a change in thesis post-disclosure of liabilities associated with recently acquired Monsanto’s legal risks surrounding Roundup weed killer.
WellsCap regularly maintains and updates short-term outlooks out approximately two quarters and long-term outlooks out at least two years—pointing to a neutral outlook for the short term and long term. WellsCap’s investment approach is driven primarily by the stock-specific characteristics of individual securities that guide selection and portfolio construction, complementing the team’s micro view with a macroeconomic crosscheck to maintain consistent high conviction and high active-share concentrations.
The team’s short-term outlook remains neutral with offsetting immediate tailwinds and headwinds during a generally volatile seasonal period for equity markets. First, even though some leading economic indicators (Purchasing Managers’ Indices10 mixed, Citi Economic Surprise Indices11 weak) have adjusted downward in recent months, WellsCap continues to find signs of reasonable growth rebounding across some developed and emerging economies. Second, despite some valuation multiple compression in both international and domestic equity sectors, corporate earnings outlooks remain firm, although vulnerable (particularly in emerging markets) to downward revisions should global trade volatility
Please see footnotes on page 7.
| | | | |
| 10 | | Wells Fargo Diversified International Fund | | Performance highlights (unaudited) |
escalate. And third, while business optimism continues to be supported by self-help restructuring and positive cyclical changes in commodities and financial sectors overseas, WellsCap is carefully tracking the effects of rising credit costs as reflected in rising sovereign interest rates and yield curves and overall inflationary pressures as reflected in rising wages and commodity prices.
WellsCap’s longer-term international outlook has recently moved from constructive to neutral for a number of reasons. First, while global economies have been recovering from the depths of the period from 2013 to 2015 with divergences between the U.S. at a relatively late stage of recovery compared with European, Japanese, and multiple emerging market countries, signs of the passage of peak synchronized global growth are starting to appear across the largest growth drivers. Second, while international central banks and public policy guidance continue to be accommodative, WellsCap recognizes that in the U.S., monetary policy recently moved to tightening financial conditions and the European Central Bank and Bank of Japan quantitative easing programs are maturing with coincident increases in forward sovereign bond yields. Third, valuations have rerated positively, particularly within the U.S. While there is room for greater international equity market valuation normalizations relative to those regions’ official sovereign and policy interest rates, WellsCap expects that rising tensions surrounding global trade and global public policy collaboration will underscore the importance of carefully selecting mispriced value around the world. The team will continue to favor companies that can propel attractive appreciation in shareholder total return through micro self-help rather than depending on any macro tailwinds to uplift broad sector and regional valuations.
Looking at long-term investment cycles globally, WellsCap believes that global capital markets are at the early stages of a rotation, and ultimately a reversal, of long cyclical trends that have favored growth and momentum stock investing at the expense of nonconsensus value investing, especially as the world benefits from added growth and experiences signs of inflation from firming employment, wage metrics, commodity prices, and, ultimately, elevated sovereign interest rate volatility. WellsCap looks forward to deploying a disciplined and flexible investment process, recognizing that market volatility witnessed in recent months is likely a harbinger of capital-market behavior for many quarters to come.
Artisan Partners
Artisan Partners invests in what the team considers to be dominant, high-quality companies that are exposed to positive secular growth trends or themes at reasonable valuations.
Artisan’s biggest shifts in sector exposure were an increase in materials and a decrease in consumer discretionary. As always, sector positioning is a residual of bottom-up stock decisions. In materials, the portfolio manager added to industrial gases exposures, purchasing Air Liquide S.A. and increasing the portfolio sleeve’s position in Linde AG. In the consumer discretionary sector, Artisan sold e-commerce leaders Amazon.com, Incorporated, and Alibaba Group Holding Limited as valuations became demanding.
Contributions due to strong stock selection were realized in several sectors, particularly among IT, materials, and energy holdings. Top contributors in these sectors included Wirecard AG, a payments-processing company; Linde, an industrial gases supplier; and Petroleo Brasileiro S.A., a Brazilian oil and gas company.
On the downside, consumer staples, health care, and financials holdings detracted from relative results. Detractors in these sectors were ING Groep N.V., a financial services provider; Anheuser-Busch InBev, a beverages company; and Genmab A/S, a biotechnology company.
Looking forward, Artisan remains cautiously optimistic about the prospects for additional equity gains. There are plenty of uncertainties. Foremost are slowing global growth, the U.S./China trade war, and rising interest rates. In addition, margins are at risk as commodities prices and labor costs rise. In its experience, investing over several market cycles has taught Artisan the importance of focusing on those firms with dominant or growing market positions and attractive earnings outlooks. Consequently, management of the portfolio sleeve remains focused on themes that have led the manager to believe assets are invested in a portfolio of companies that can weather a changing political and economic environment.
LSV
LSV seeks to add value through a quantitative selection process that favors deep-value stocks.
The manager’s overweight to energy stocks and exposure to oil and gas companies in the emerging markets added value. From a sector allocation standpoint, the energy overweight was offset by the manager’s underweight to health
Please see footnotes on page 7.
| | | | | | |
| Performance highlights (unaudited) | | Wells Fargo Diversified International Fund | | | 11 | |
care and overweight to financials. Stock selection within financials contributed to performance as stock selection among banks and insurance holdings added value. The manager’s stock selection within the consumer discretionary and materials sectors had a negative impact on performance.
Changes to the Fund tend to be gradual given the manager’s low-turnover strategy. Over the past 12 months, the manager increased the exposure to energy stocks, adding to integrated oil and gas holdings, and decreased the weights to the IT and utilities sectors. The manager will overweight those sectors where it finds the most attractive stocks. The LSV portion of the Fund is overweight the energy, financials, and consumer discretionary sectors while underweight consumer staples, IT, health care, and real estate. Portfolio valuations in the LSV portion of the Fund remain attractive. The manager calculates that the LSV portion of the Fund is trading at less than 10 times forward earnings estimates and below 6 times cash flow, both significant discounts to the overall market.
|
| Country allocation as of October 31, 20189 |
|
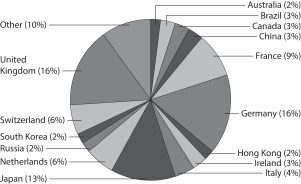
|
Please see footnotes on page 7.
| | | | |
| 12 | | Wells Fargo Diversified International Fund | | Fund expenses (unaudited) |
As a shareholder of the Fund, you incur two types of costs: (1) transaction costs, including sales charges (loads) on purchase payments and contingent deferred sales charges (if any) on redemptions and (2) ongoing costs, including management fees, distribution (12b-1) and/or shareholder servicing fees, and other Fund expenses. This example is intended to help you understand your ongoing costs (in dollars) of investing in the Fund and to compare these costs with the ongoing costs of investing in other mutual funds.
The example is based on an investment of $1,000 invested at the beginning of the six-month period and held for the entire period from May 1, 2018 to October 31, 2018.
Actual expenses
The “Actual” line of the table below provides information about actual account values and actual expenses. You may use the information in this line, together with the amount you invested, to estimate the expenses that you paid over the period. Simply divide your account value by $1,000 (for example, an $8,600 account value divided by $1,000 = 8.6), then multiply the result by the number in the “Actual” line under the heading entitled “Expenses paid during period” for your applicable class of shares to estimate the expenses you paid on your account during this period.
Hypothetical example for comparison purposes
The “Hypothetical” line of the table below provides information about hypothetical account values and hypothetical expenses based on the Fund’s actual expense ratio and an assumed rate of return of 5% per year before expenses, which is not the Fund’s actual return. The hypothetical account values and expenses may not be used to estimate the actual ending account balance or expenses you paid for the period. You may use this information to compare the ongoing costs of investing in the Fund and other funds. To do so, compare this 5% hypothetical example with the 5% hypothetical examples that appear in the shareholder reports of the other funds.
Please note that the expenses shown in the table are meant to highlight your ongoing costs only and do not reflect any transactional costs, such as sales charges (loads) and contingent deferred sales charges. Therefore, the “Hypothetical” line of the table is useful in comparing ongoing costs only and will not help you determine the relative total costs of owning different funds. In addition, if these transactional costs were included, your costs would have been higher.
| | | | | | | | | | | | | | | | |
| | | Beginning
account value
5-1-2018 | | | Ending
account value
10-31-2018 | | | Expenses
paid during
the period¹ | | | Annualized net
expense ratio | |
Class A | | | | | | | | | | | | | | | | |
Actual | | $ | 1,000.00 | | | $ | 895.36 | | | $ | 6.45 | | | | 1.35 | % |
Hypothetical (5% return before expenses) | | $ | 1,000.00 | | | $ | 1,018.40 | | | $ | 6.87 | | | | 1.35 | % |
Class C | | | | | | | | | | | | | | | | |
Actual | | $ | 1,000.00 | | | $ | 892.46 | | | $ | 10.02 | | | | 2.10 | % |
Hypothetical (5% return before expenses) | | $ | 1,000.00 | | | $ | 1,014.62 | | | $ | 10.66 | | | | 2.10 | % |
Class R6 | | | | | | | | | | | | | | | | |
Actual | | $ | 1,000.00 | | | $ | 897.12 | | | $ | 4.26 | | | | 0.89 | % |
Hypothetical (5% return before expenses) | | $ | 1,000.00 | | | $ | 1,020.72 | | | $ | 4.53 | | | | 0.89 | % |
Administrator Class | | | | | | | | | | | | | | | | |
Actual | | $ | 1,000.00 | | | $ | 895.80 | | | $ | 5.97 | | | | 1.25 | % |
Hypothetical (5% return before expenses) | | $ | 1,000.00 | | | $ | 1,018.90 | | | $ | 6.36 | | | | 1.25 | % |
Institutional Class | | | | | | | | | | | | | | | | |
Actual | | $ | 1,000.00 | | | $ | 897.60 | | | $ | 4.74 | | | | 0.99 | % |
Hypothetical (5% return before expenses) | | $ | 1,000.00 | | | $ | 1,020.21 | | | $ | 5.04 | | | | 0.99 | % |
| 1 | Expenses paid is equal to the annualized net expense ratio of each class multiplied by the average account value over the period, multiplied by the number of days in the most recent fiscal half-year divided by the number of days in the fiscal year (to reflect the one-half-year period). |
| | | | | | |
| Portfolio of investments—October 31, 2018 | | Wells Fargo Diversified International Fund | | | 13 | |
| | | | | | | | | | | | | | | | |
| Security name | | | | | | | | Shares | | | Value | |
| | | | |
Common Stocks: 95.22% | | | | | | | | | | | | | | | | |
| | | | |
| Australia: 1.34% | | | | | | | | | | | | | | | | |
Automotive Holdings Group Limited (Consumer Discretionary, Specialty Retail) | | | | | | | | | | | 29,300 | | | $ | 37,452 | |
Bendigo Bank Limited (Financials, Banks) | | | | | | | | | | | 26,100 | | | | 189,078 | |
Coca-Cola Amatil Limited (Consumer Staples, Beverages) | | | | | | | | | | | 29,100 | | | | 204,217 | |
CSR Limited (Materials, Construction Materials) | | | | | | | | | | | 59,900 | | | | 149,736 | |
Harvey Norman Holdings Limited (Consumer Discretionary, Multiline Retail) « | | | | | | | | | | | 43,900 | | | | 99,170 | |
Lendlease Corporation Limited (Real Estate, Real Estate Management & Development) | | | | | | | | | | | 11,600 | | | | 144,576 | |
Metcash Limited (Consumer Staples, Food & Staples Retailing) | | | | | | | | | | | 28,500 | | | | 55,501 | |
Mineral Resources Limited (Materials, Metals & Mining) | | | | | | | | | | | 14,900 | | | | 150,358 | |
Origin Energy Limited (Energy, Oil, Gas & Consumable Fuels) † | | | | | | | | | | | 18,916 | | | | 97,652 | |
Qantas Airways Limited (Industrials, Airlines) | | | | | | | | | | | 59,300 | | | | 229,703 | |
| | | | |
| | | | | | | | | | | | | | | 1,357,443 | |
| | | | | | | | | | | | | | | | |
| | | | |
| Austria: 0.41% | | | | | | | | | | | | | | | | |
OMV AG (Energy, Oil, Gas & Consumable Fuels) | | | | | | | | | | | 4,800 | | | | 267,106 | |
Voestalpine AG (Materials, Metals & Mining) | | | | | | | | | | | 4,300 | | | | 152,882 | |
| | | | |
| | | | | | | | | | | | | | | 419,988 | |
| | | | | | | | | | | | | | | | |
| | | | |
| Belgium: 0.65% | | | | | | | | | | | | | | | | |
Anheuser-Busch InBev NV (Consumer Staples, Beverages) | | | | | | | | | | | 8,959 | | | | 661,003 | |
| | | | | | | | | | | | | | | | |
| | | | |
| Brazil: 2.16% | | | | | | | | | | | | | | | | |
B3 Brasil Bolsa Balcao SA (Financials, Capital Markets) | | | | | | | | | | | 15,205 | | | | 108,435 | |
Banco de Brasil SA (Financials, Banks) | | | | | | | | | | | 19,000 | | | | 218,259 | |
Companhia de Saneamento de Minas Gerais SA (Utilities, Water Utilities) | | | | | | | | | | | 5,300 | | | | 73,059 | |
Cosan Limited Class A (Energy, Oil, Gas & Consumable Fuels) | | | | | | | | | | | 94,116 | | | | 785,869 | |
JBS SA (Consumer Staples, Food Products) | | | | | | | | | | | 67,500 | | | | 185,913 | |
Petroleo Brasileiro SA ADR (Energy, Oil, Gas & Consumable Fuels) | | | | | | | | | | | 50,585 | | | | 822,006 | |
| | | | |
| | | | | | | | | | | | | | | 2,193,541 | |
| | | | | | | | | | | | | | | | |
| | | | |
| Canada: 2.75% | | | | | | | | | | | | | | | | |
Canadian National Railway Company (Industrials, Road & Rail) | | | | | | | | | | | 3,987 | | | | 340,809 | |
Canadian Pacific Railway Limited (Industrials, Road & Rail) | | | | | | | | | | | 2,417 | | | | 495,485 | |
Home Capital Group Incorporated (Financials, Thrifts & Mortgage Finance) Ǡ | | | | | | | | | | | 51,800 | | | | 513,495 | |
Loblaw Companies Limited (Consumer Staples, Food & Staples Retailing) | | | | | | | | | | | 3,900 | | | | 195,052 | |
Lundin Mining Corporation (Materials, Metals & Mining) | | | | | | | | | | | 183,308 | | | | 753,311 | |
Magna International Incorporated (Consumer Discretionary, Auto Components) | | | | | | | | | | | 7,300 | | | | 359,385 | |
WestJet Airlines Limited (Industrials, Airlines) | | | | | | | | | | | 9,200 | | | | 134,039 | |
| | | | |
| | | | | | | | | | | | | | | 2,791,576 | |
| | | | | | | | | | | | | | | | |
| | | | |
| China: 3.24% | | | | | | | | | | | | | | | | |
China Communications Services Corporation Limited H Shares (Communication Services, Diversified Telecommunication Services) | | | | | | | | | | | 144,000 | | | | 116,420 | |
China Everbright Limited (Financials, Capital Markets) | | | | | | | | | | | 180,000 | | | | 318,135 | |
China Mobile Limited (Communication Services, Wireless Telecommunication Services) | | | | | | | | | | | 94,000 | | | | 878,634 | |
China Petroleum & Chemical Corporation H Shares (Energy, Oil, Gas & Consumable Fuels) | | | | | | | | | | | 218,000 | | | | 176,803 | |
China Railway Construction Corporation Limited H Shares (Industrials, Construction & Engineering) | | | | | | | | | | | 141,500 | | | | 178,996 | |
China Resources Cement Holdings Limited (Materials, Construction Materials) | | | | | | | | | | | 168,000 | | | | 148,035 | |
China Telecom Corporation Limited (Communication Services, Diversified Telecommunication Services) | | | | | | | | | | | 344,000 | | | | 162,307 | |
The accompanying notes are an integral part of these financial statements.
| | | | |
| 14 | | Wells Fargo Diversified International Fund | | Portfolio of investments—October 31, 2018 |
| | | | | | | | | | | | | | | | |
| Security name | | | | | | | | Shares | | | Value | |
| | | | |
| China (continued) | | | | | | | | | | | | | | | | |
Dongfeng Motor Group Company Limited H Shares (Consumer Discretionary, Automobiles) | | | | | | | | | | | 106,000 | | | $ | 104,352 | |
HollySys Automation Technologies Limited (Information Technology, Electronic Equipment, Instruments & Components) | | | | | | | | | | | 19,771 | | | | 379,999 | |
PICC Property and Casualty Company Limited H Shares (Financials, Insurance) | | | | | | | | | | | 103,500 | | | | 100,307 | |
Shanghai Pharmaceuticals Holding Company Limited H Shares (Health Care, Health Care Providers & Services) | | | | | | | | | | | 261,400 | | | | 577,337 | |
Shenzhen International Holdings Limited H Shares (Industrials, Transportation Infrastructure) | | | | | | | | | | | 49,500 | | | | 94,683 | |
Yantai Changyu Pioneer Wine Company Limited Class B (Consumer Staples, Beverages) | | | | | | | | | | | 23,400 | | | | 49,653 | |
| | | | |
| | | | | | | | | | | | | | | 3,285,661 | |
| | | | | | | | | | | | | | | | |
| | | | |
| Denmark: 0.79% | | | | | | | | | | | | | | | | |
Danske Bank AS (Financials, Banks) | | | | | | | | | | | 9,300 | | | | 178,393 | |
Genmab AS (Health Care, Biotechnology) † | | | | | | | | | | | 3,858 | | | | 528,543 | |
Sydbank AS (Financials, Banks) | | | | | | | | | | | 4,000 | | | | 92,487 | |
| | | | |
| | | | | | | | | | | | | | | 799,423 | |
| | | | | | | | | | | | | | | | |
| | | | |
| Finland: 0.47% | | | | | | | | | | | | | | | | |
Fortum Oyj (Utilities, Electric Utilities) | | | | | | | | | | | 16,368 | | | | 344,737 | |
Nordea Bank AB (Financials, Banks) | | | | | | | | | | | 15,000 | | | | 130,459 | |
| | | | |
| | | | | | | | | | | | | | | 475,196 | |
| | | | | | | | | | | | | | | | |
| | | | |
| France: 8.54% | | | | | | | | | | | | | | | | |
Air Liquide SA (Materials, Chemicals) | | | | | | | | | | | 6,782 | | | | 821,935 | |
Arkema SA (Materials, Chemicals) | | | | | | | | | | | 910 | | | | 95,629 | |
AXA SA (Financials, Insurance) | | | | | | | | | | | 9,200 | | | | 230,707 | |
BNP Paribas SA (Financials, Banks) | | | | | | | | | | | 13,410 | | | | 700,661 | |
Compagnie de Saint-Gobain SA (Industrials, Building Products) | | | | | | | | | | | 28,450 | | | | 1,071,123 | |
Compagnie Generale des Etablissements Michelin SCA (Consumer Discretionary, Auto Components) | | | | | | | | | | | 2,200 | | | | 226,109 | |
Credit Agricole SA (Financials, Banks) | | | | | | | | | | | 13,900 | | | | 178,346 | |
Eiffage SA (Industrials, Construction & Engineering) | | | | | | | | | | | 4,559 | | | | 446,252 | |
Engie SA (Utilities, Multi-Utilities) | | | | | | | | | | | 13,300 | | | | 177,382 | |
Groupe Danone SA (Consumer Staples, Food Products) | | | | | | | | | | | 2,793 | | | | 197,971 | |
Natixis SA (Financials, Capital Markets) | | | | | | | | | | | 27,500 | | | | 160,910 | |
Orange SA (Communication Services, Diversified Telecommunication Services) | | | | | | | | | | | 83,154 | | | | 1,301,629 | |
Renault SA (Consumer Discretionary, Automobiles) | | | | | | | | | | | 3,100 | | | | 231,986 | |
Safran SA (Industrials, Aerospace & Defense) | | | | | | | | | | | 3,234 | | | | 417,764 | |
Sanofi SA (Health Care, Pharmaceuticals) | | | | | | | | | | | 8,600 | | | | 767,964 | |
Schneider Electric SE (Industrials, Electrical Equipment) | | | | | | | | | | | 2,349 | | | | 170,172 | |
SCOR SE (Financials, Insurance) | | | | | | | | | | | 6,100 | | | | 282,378 | |
Societe Generale SA (Financials, Banks) | | | | | | | | | | | 3,700 | | | | 136,117 | |
Total SA (Energy, Oil, Gas & Consumable Fuels) | | | | | | | | | | | 9,700 | | | | 570,869 | |
Vinci SA (Industrials, Construction & Engineering) | | | | | | | | | | | 5,405 | | | | 482,901 | |
| | | | |
| | | | | | | | | | | | | | | 8,668,805 | |
| | | | | | | | | | | | | | | | |
| | | | |
| Germany: 15.49% | | | | | | | | | | | | | | | | |
Allianz AG (Financials, Insurance) | | | | | | | | | | | 5,803 | | | | 1,212,281 | |
Aurubis AG (Materials, Metals & Mining) | | | | | | | | | | | 1,600 | | | | 97,281 | |
BASF SE (Materials, Chemicals) | | | | | | | | | | | 2,900 | | | | 223,457 | |
Bayer AG (Health Care, Pharmaceuticals) | | | | | | | | | | | 2,196 | | | | 168,589 | |
Bayerische Motoren Werke AG (Consumer Discretionary, Automobiles) | | | | | | | | | | | 2,200 | | | | 189,952 | |
Beiersdorf AG (Consumer Staples, Personal Products) | | | | | | | | | | | 5,920 | | | | 612,864 | |
The accompanying notes are an integral part of these financial statements.
| | | | | | |
| Portfolio of investments—October 31, 2018 | | Wells Fargo Diversified International Fund | | | 15 | |
| | | | | | | | | | | | | | | | |
| Security name | | | | | | | | Shares | | | Value | |
| | | | |
| Germany (continued) | | | | | | | | | | | | | | | | |
Ceconomy AG (Consumer Discretionary, Specialty Retail) | | | | | | | | | | | 10,130 | | | $ | 51,838 | |
Daimler AG (Consumer Discretionary, Automobiles) | | | | | | | | | | | 5,300 | | | | 314,320 | |
Deutsche Boerse AG (Financials, Capital Markets) | | | | | | | | | | | 16,153 | | | | 2,046,374 | |
Deutsche Post AG (Industrials, Air Freight & Logistics) | | | | | | | | | | | 37,059 | | | | 1,173,198 | |
Hannover Rueck SE (Financials, Insurance) | | | | | | | | | | | 1,200 | | | | 161,878 | |
Linde AG (Materials, Chemicals) | | | | | | | | | | | 104 | | | | 22,475 | |
Linde plc (Materials, Chemicals) | | | | | | | | | | | 13,888 | | | | 2,278,480 | |
Metro AG (Consumer Staples, Food & Staples Retailing) | | | | | | | | | | | 41,234 | | | | 621,159 | |
Muenchener Rueckversicherungs Gesellschaft AG (Financials, Insurance) | | | | | | | | | | | 7,564 | | | | 1,627,371 | |
Rheinmetall AG (Industrials, Industrial Conglomerates) | | | | | | | | | | | 6,628 | | | | 574,602 | |
SAP SE (Information Technology, Software) | | | | | | | | | | | 6,318 | | | | 677,395 | |
Siemens AG (Industrials, Industrial Conglomerates) | | | | | | | | | | | 9,464 | | | | 1,090,377 | |
Symrise AG (Materials, Chemicals) | | | | | | | | | | | 4,852 | | | | 407,555 | |
Volkswagen AG (Consumer Discretionary, Automobiles) | | | | | | | | | | | 1,600 | | | | 264,225 | |
Wirecard AG (Information Technology, IT Services) | | | | | | | | | | | 10,210 | | | | 1,912,745 | |
| | | | |
| | | | | | | | | | | | | | | 15,728,416 | |
| | | | | | | | | | | | | | | | |
| | | | |
| Hong Kong: 1.97% | | | | | | | | | | | | | | | | |
AIA Group Limited (Financials, Insurance) | | | | | | | | | | | 123,400 | | | | 933,925 | |
Kingboard Laminates Holdings Limited (Information Technology, Electronic Equipment, Instruments & Components) | | | | | | | | | | | 109,500 | | | | 83,780 | |
Nine Dragons Paper Holdings Limited (Materials, Paper & Forest Products) | | | | | | | | | | | 104,000 | | | | 99,200 | |
Skyworth Digital Holdings Limited (Consumer Discretionary, Household Durables) | | | | | | | | | | | 320,000 | | | | 73,859 | |
Wheelock & Company Limited (Real Estate, Real Estate Management & Development) | | | | | | | | | | | 22,000 | | | | 117,407 | |
Xinyi Glass Holdings Limited (Consumer Discretionary, Auto Components) | | | | | | | | | | | 586,000 | | | | 579,876 | |
Yue Yuen Industrial Holdings Limited (Consumer Discretionary, Textiles, Apparel & Luxury Goods) | | | | | | | | | | | 42,000 | | | | 114,882 | |
| | | | |
| | | | | | | | | | | | | | | 2,002,929 | |
| | | | | | | | | | | | | | | | |
| | | | |
| Hungary: 0.06% | | | | | | | | | | | | | | | | |
Richter Gedeon (Health Care, Pharmaceuticals) | | | | | | | | | | | 3,500 | | | | 65,079 | |
| | | | | | | | | | | | | | | | |
| | | | |
| India: 0.67% | | | | | | | | | | | | | | | | |
Housing Development Finance Corporation Limited (Financials, Thrifts & Mortgage Finance) | | | | | | | | | | | 28,637 | | | | 685,185 | |
| | | | | | | | | | | | | | | | |
| | | | |
| Indonesia: 0.36% | | | | | | | | | | | | | | | | |
PT Bank Rakyat Indonesia Tbk (Financials, Banks) | | | | | | | | | | | 1,015,900 | | | | 210,497 | |
PT Indofood Sukses Makmur Tbk (Consumer Staples, Food Products) | | | | | | | | | | | 401,600 | | | | 157,840 | |
| | | | |
| | | | | | | | | | | | | | | 368,337 | |
| | | | | | | | | | | | | | | | |
| | | | |
| Ireland: 2.78% | | | | | | | | | | | | | | | | |
C&C Group plc (Consumer Staples, Beverages) | | | | | | | | | | | 18,600 | | | | 69,101 | |
Greencore Group plc (Consumer Staples, Food Products) | | | | | | | | | | | 384,308 | | | | 929,393 | |
Medtronic plc (Health Care, Health Care Equipment & Supplies) | | | | | | | | | | | 14,796 | | | | 1,328,977 | |
Smurfit Kappa Group plc (Materials, Containers & Packaging) | | | | | | | | | | | 4,300 | | | | 140,170 | |
Willis Towers Watson plc (Financials, Insurance) | | | | | | | | | | | 2,523 | | | | 361,193 | |
| | | | |
| | | | | | | | | | | | | | | 2,828,834 | |
| | | | | | | | | | | | | | | | |
| | | | |
| Israel: 1.08% | | | | | | | | | | | | | | | | |
Bank Hapoalim Limited (Financials, Banks) | | | | | | | | | | | 24,000 | | | | 162,587 | |
Check Point Software Technologies Limited (Information Technology, Software) † | | | | | | | | | | | 8,374 | | | | 929,514 | |
| | | | |
| | | | | | | | | | | | | | | 1,092,101 | |
| | | | | | | | | | | | | | | | |
The accompanying notes are an integral part of these financial statements.
| | | | |
| 16 | | Wells Fargo Diversified International Fund | | Portfolio of investments—October 31, 2018 |
| | | | | | | | | | | | | | | | |
| Security name | | | | | | | | Shares | | | Value | |
| | | | |
| Italy: 3.74% | | | | | | | | | | | | | | | | |
A2A SpA (Utilities, Multi-Utilities) | | | | | | | | | | | 104,600 | | | $ | 168,768 | |
Assicurazioni Generali SpA (Financials, Insurance) | | | | | | | | | | | 40,585 | | | | 656,432 | |
Enel SpA (Utilities, Electric Utilities) | | | | | | | | | | | 94,000 | | | | 461,437 | |
Eni SpA (Energy, Oil, Gas & Consumable Fuels) | | | | | | | | | | | 36,221 | | | | 644,350 | |
Intesa Sanpaolo SpA (Financials, Banks) | | | | | | | | | | | 214,162 | | | | 473,741 | |
Leonardo-Finmeccanica SpA (Industrials, Aerospace & Defense) | | | | | | | | | | | 9,300 | | | | 101,018 | |
Mediobanca SpA (Financials, Banks) | | | | | | | | | | | 23,400 | | | | 205,459 | |
Prysmian SpA (Industrials, Electrical Equipment) | | | | | | | | | | | 45,817 | | | | 890,512 | |
UniCredit SpA (Financials, Banks) | | | | | | | | | | | 15,628 | | | | 200,305 | |
| | | | |
| | | | | | | | | | | | | | | 3,802,022 | |
| | | | | | | | | | | | | | | | |
| | | | |
| Japan: 12.90% | | | | | | | | | | | | | | | | |
Adeka Corporation (Materials, Chemicals) | | | | | | | | | | | 13,000 | | | | 193,211 | |
Aisin Seiki Company Limited (Consumer Discretionary, Auto Components) | | | | | | | | | | | 3,300 | | | | 129,707 | |
Aoyama Trading Company Limited (Consumer Discretionary, Specialty Retail) | | | | | | | | | | | 1,000 | | | | 30,310 | |
Asahi Glass Company Limited (Industrials, Building Products) | | | | | | | | | | | 4,900 | | | | 161,111 | |
CALBEE Incorporated (Consumer Staples, Food Products) | | | | | | | | | | | 13,500 | | | | 448,664 | |
Central Glass Company Limited (Industrials, Building Products) | | | | | | | | | | | 6,800 | | | | 147,047 | |
Daiwa Securities Group Incorporated (Financials, Capital Markets) | | | | | | | | | | | 190,100 | | | | 1,089,872 | |
DCM Holdings Company Limited (Consumer Discretionary, Specialty Retail) | | | | | | | | | | | 14,100 | | | | 136,958 | |
Denka Company Limited (Materials, Chemicals) | | | | | | | | | | | 6,300 | | | | 205,468 | |
DIC Incorporated (Materials, Chemicals) | | | | | | | | | | | 5,300 | | | | 156,649 | |
Dowa Mining Company Limited (Materials, Metals & Mining) | | | | | | | | | | | 6,000 | | | | 175,212 | |
Fujikura Limited (Industrials, Electrical Equipment) | | | | | | | | | | | 25,000 | | | | 107,901 | |
Hitachi Limited (Information Technology, Electronic Equipment, Instruments & Components) | | | | | | | | | | | 34,200 | | | | 1,049,323 | |
Isuzu Motors Limited (Consumer Discretionary, Automobiles) | | | | | | | | | | | 16,500 | | | | 216,715 | |
Itochu Corporation (Industrials, Trading Companies & Distributors) | | | | | | | | | | | 14,600 | | | | 271,077 | |
Japan Airlines Company Limited (Industrials, Airlines) | | | | | | | | | | | 6,300 | | | | 224,284 | |
Japan Exchange Group Incorporated (Financials, Capital Markets) | | | | | | | | | | | 10,000 | | | | 179,554 | |
Kaken Pharmaceutical Company Limited (Health Care, Pharmaceuticals) | | | | | | | | | | | 3,000 | | | | 150,485 | |
KDDI Corporation (Communication Services, Wireless Telecommunication Services) | | | | | | | | | | | 20,000 | | | | 498,870 | |
Maeda Road Construction Company Limited (Industrials, Construction & Engineering) | | | | | | | | | | | 8,800 | | | | 160,581 | |
Marubeni Corporation (Industrials, Trading Companies & Distributors) | | | | | | | | | | | 30,300 | | | | 246,057 | |
Mazda Motor Corporation (Consumer Discretionary, Automobiles) | | | | | | | | | | | 12,000 | | | | 130,172 | |
Mitsubishi Gas Chemical Company Incorporated (Materials, Chemicals) | | | | | | | | | | | 6,100 | | | | 102,770 | |
Mitsubishi UFJ Financial Group Incorporated (Financials, Banks) | | | | | | | | | | | 238,900 | | | | 1,449,894 | |
Mitsubishi UFJ Lease & Finance Company Limited (Financials, Diversified Financial Services) | | | | | | | | | | | 37,300 | | | | 192,062 | |
Mitsui Chemicals Incorporated (Materials, Chemicals) | | | | | | | | | | | 9,500 | | | | 213,431 | |
Mizuho Financial Group Incorporated (Financials, Banks) | | | | | | | | | | | 171,600 | | | | 295,036 | |
Nippon Shinyaku Company Limited (Health Care, Pharmaceuticals) | | | | | | | | | | | 3,700 | | | | 213,471 | |
Nippon Telegraph & Telephone Corporation (Communication Services, Diversified Telecommunication Services) | | | | | | | | | | | 12,500 | | | | 526,211 | |
Nissan Motor Company Limited (Consumer Discretionary, Automobiles) | | | | | | | | | | | 32,200 | | | | 293,220 | |
Nisshinbo Holdings Incorporated (Industrials, Industrial Conglomerates) | | | | | | | | | | | 12,400 | | | | 137,039 | |
Nomura Holdings Incorporated (Financials, Capital Markets) | | | | | | | | | | | 237,400 | | | | 1,151,917 | |
ORIX Corporation (Financials, Diversified Financial Services) | | | | | | | | | | | 16,500 | | | | 269,212 | |
Resona Holdings Incorporated (Financials, Banks) | | | | | | | | | | | 62,600 | | | | 330,101 | |
Rohm Company Limited (Information Technology, Semiconductors & Semiconductor Equipment) | | | | | | | | | | | 2,700 | | | | 189,994 | |
Sawai Pharmaceutical Company Limited (Health Care, Pharmaceuticals) | | | | | | | | | | | 2,100 | | | | 106,642 | |
Sojitz Corporation (Industrials, Trading Companies & Distributors) | | | | | | | | | | | 77,400 | | | | 260,664 | |
Sumitomo Heavy Industries Limited (Industrials, Machinery) | | | | | | | | | | | 6,000 | | | | 189,569 | |
The accompanying notes are an integral part of these financial statements.
| | | | | | |
| Portfolio of investments—October 31, 2018 | | Wells Fargo Diversified International Fund | | | 17 | |
| | | | | | | | | | | | | | | | |
| Security name | | | | | | | | Shares | | | Value | |
| | | | |
| Japan (continued) | | | | | | | | | | | | | | | | |
Sumitomo Mitsui Financial Group Incorporated (Financials, Banks) | | | | | | | | | | | 8,000 | | | $ | 312,953 | |
Sumitomo Osaka Cement Company (Materials, Construction Materials) | | | | | | | | | | | 1,700 | | | | 63,278 | |
Taiyo Nippon Sanso Corporation (Materials, Chemicals) | | | | | | | | | | | 6,200 | | | | 99,840 | |
The Yokohama Rubber Company Limited (Consumer Discretionary, Auto Components) | | | | | | | | | | | 7,600 | | | | 147,642 | |
Toyo Ink SC Holding Company Limited (Materials, Chemicals) | | | | | | | | | | | 7,360 | | | | 171,484 | |
Toyo Tire & Rubber Company Limited (Consumer Discretionary, Auto Components) | | | | | | | | | | | 5,900 | | | | 98,826 | |
UBE Industries Limited (Materials, Chemicals) | | | | | | | | | | | 7,900 | | | | 172,794 | |
| | | | |
| | | | | | | | | | | | | | | 13,097,278 | |
| | | | | | | | | | | | | | | | |
| | | | |
| Luxembourg: 0.09% | | | | | | | | | | | | | | | | |
Spotify Technology SA (Consumer Services, Entertainment) † | | | | | | | | | | | 629 | | | | 94,155 | |
| | | | | | | | | | | | | | | | |
| | | | |
| Malaysia: 0.50% | | | | | | | | | | | | | | | | |
CIMB Group Holdings Bhd (Financials, Banks) | | | | | | | | | | | 371,423 | | | | 507,716 | |
| | | | | | | | | | | | | | | | |
| | | | |
| Netherlands: 6.18% | | | | | | | | | | | | | | | | |
Aegon NV (Financials, Insurance) | | | | | | | | | | | 23,200 | | | | 142,634 | |
Airbus SE (Industrials, Aerospace & Defense) | | | | | | | | | | | 12,308 | | | | 1,362,142 | |
Akzo Nobel NV (Materials, Chemicals) | | | | | | | | | | | 2,552 | | | | 214,708 | |
ASML Holding NV (Information Technology, Semiconductors & Semiconductor Equipment) | | | | | | | | | | | 1,412 | | | | 241,367 | |
BE Semiconductor Industries NV (Information Technology, Semiconductors & Semiconductor Equipment) | | | | | | | | | | | 4,600 | | | | 98,629 | |
ING Groep NV (Financials, Banks) | | | | | | | | | | | 104,535 | | | | 1,240,849 | |
Koninklijke Ahold Delhaize NV (Consumer Staples, Food & Staples Retailing) | | | | | | | | | | | 14,600 | | | | 334,537 | |
Koninklijke DSM NV (Materials, Chemicals) | | | | | | | | | | | 4,921 | | | | 431,299 | |
Koninklijke Philips NV (Industrials, Industrial Conglomerates) | | | | | | | | | | | 18,263 | | | | 680,970 | |
NN Group NV (Financials, Insurance) | | | | | | | | | | | 18,573 | | | | 799,395 | |
OCI NV (Materials, Chemicals) † | | | | | | | | | | | 25,189 | | | | 717,252 | |
X5 Retail Group NV GDR (Consumer Staples, Food & Staples Retailing) | | | | | | | | | | | 700 | | | | 16,450 | |
| | | | |
| | | | | | | | | | | | | | | 6,280,232 | |
| | | | | | | | | | | | | | | | |
| | | | |
| Norway: 1.09% | | | | | | | | | | | | | | | | |
Den Norske Bank ASA (Financials, Banks) | | | | | | | | | | | 53,341 | | | | 965,286 | |
Marine Harvest ASA (Consumer Staples, Food Products) | | | | | | | | | | | 6,000 | | | | 145,199 | |
| | | | |
| | | | | | | | | | | | | | | 1,110,485 | |
| | | | | | | | | | | | | | | | |
| | | | |
| Russia: 1.39% | | | | | | | | | | | | | | | | |
Gazprom Neft Sponsored ADR (Energy, Oil, Gas & Consumable Fuels) | | | | | | | | | | | 10,500 | | | | 310,800 | |
LUKOIL OAO ADR (Energy, Oil, Gas & Consumable Fuels) | | | | | | | | | | | 4,200 | | | | 313,488 | |
MMC Norilsk Nickel PJSC ADR (Materials, Metals & Mining) | | | | | | | | | | | 24,582 | | | | 407,570 | |
Mobile TeleSystems PJSC ADR (Communication Services, Wireless Telecommunication Services) | | | | | | | | | | | 46,793 | | | | 374,812 | |
| | | | |
| | | | | | | | | | | | | | | 1,406,670 | |
| | | | | | | | | | | | | | | | |
| | | | |
| Singapore: 1.01% | | | | | | | | | | | | | | | | |
DBS Group Holdings Limited (Financials, Banks) | | | | | | | | | | | 6,400 | | | | 108,395 | |
Keppel Corporation Limited (Industrials, Industrial Conglomerates) | | | | | | | | | | | 162,100 | | | | 725,568 | |
United Overseas Bank Limited (Financials, Banks) | | | | | | | | | | | 10,700 | | | | 188,331 | |
| | | | |
| | | | | | | | | | | | | | | 1,022,294 | |
| | | | | | | | | | | | | | | | |
The accompanying notes are an integral part of these financial statements.
| | | | |
| 18 | | Wells Fargo Diversified International Fund | | Portfolio of investments—October 31, 2018 |
| | | | | | | | | | | | | | | | |
| Security name | | | | | | | | Shares | | | Value | |
| | | | |
| South Africa: 0.74% | | | | | | | | | | | | | | | | |
Absa Group Limited (Financials, Banks) | | | | | | | | | | | 12,600 | | | $ | 127,354 | |
Imperial Holdings Limited (Consumer Discretionary, Distributors) | | | | | | | | | | | 5,500 | | | | 60,736 | |
Old Mutual Limited (Financials, Insurance) | | | | | | | | | | | 59,600 | | | | 89,893 | |
Omnia Holdings Limited (Materials, Chemicals) | | | | | | | | | | | 7,600 | | | | 59,862 | |
Sasol Limited (Materials, Chemicals) | | | | | | | | | | | 12,727 | | | | 417,547 | |
| | | | |
| | | | | | | | | | | | | | | 755,392 | |
| | | | | | | | | | | | | | | | |
| | | | |
| South Korea: 1.81% | | | | | | | | | | | | | | | | |
BNK Financial Group Incorporated (Financials, Banks) | | | | | | | | | | | 1,018 | | | | 6,780 | |
Hana Financial Group Incorporated (Financials, Banks) | | | | | | | | | | | 6,710 | | | | 225,521 | |
Industrial Bank of Korea (Financials, Banks) | | | | | | | | | | | 16,600 | | | | 216,322 | |
JB Financial Group Company Limited (Financials, Banks) | | | | | | | | | | | 1,964 | | | | 9,463 | |
KT&G Corporation (Consumer Staples, Tobacco) | | | | | | | | | | | 2,300 | | | | 204,862 | |
Samsung Electronics Company Limited GDR (Information Technology, Technology Hardware, Storage & Peripherals) 144A | | | | | | | | | | | 233 | | | | 217,389 | |
SK Telecom Company Limited (Communication Services, Wireless Telecommunication Services) | | | | | | | | | | | 3,496 | | | | 822,192 | |
Woori Bank (Financials, Banks) | | | | | | | | | | | 9,800 | | | | 135,448 | |
| | | | |
| | | | | | | | | | | | | | | 1,837,977 | |
| | | | | | | | | | | | | | | | |
| | | | |
| Spain: 0.59% | | | | | | | | | | | | | | | | |
Banco Santander Central Hispano SA (Financials, Banks) | | | | | | | | | | | 29,500 | | | | 140,168 | |
Distribuidora Internacional SA (Consumer Staples, Food & Staples Retailing) | | | | | | | | | | | 33,900 | | | | 25,595 | |
International Consolidated Airlines Group SA (Industrials, Airlines) | | | | | | | | | | | 17,900 | | | | 138,057 | |
Repsol YPF SA (Energy, Oil, Gas & Consumable Fuels) | | | | | | | | | | | 16,200 | | | | 290,372 | |
| | | | |
| | | | | | | | | | | | | | | 594,192 | |
| | | | | | | | | | | | | | | | |
| | | | |
| Sweden: 0.50% | | | | | | | | | | | | | | | | |
Boliden AB (Materials, Metals & Mining) | | | | | | | | | | | 6,700 | | | | 153,129 | |
Volvo AB Class B (Industrials, Machinery) | | | | | | | | | | | 23,600 | | | | 352,795 | |
| | | | |
| | | | | | | | | | | | | | | 505,924 | |
| | | | | | | | | | | | | | | | |
| | | | |
| Switzerland: 6.14% | | | | | | | | | | | | | | | | |
Baloise Holding AG (Financials, Insurance) | | | | | | | | | | | 1,400 | | | | 200,447 | |
Idorsia Limited (Health Care, Biotechnology) † | | | | | | | | | | | 3,410 | | | | 66,057 | |
Lonza Group AG (Health Care, Life Sciences Tools & Services) | | | | | | | | | | | 1,676 | | | | 527,021 | |
Nestle SA (Consumer Staples, Food Products) | | | | | | | | | | | 15,407 | | | | 1,302,134 | |
Novartis AG (Health Care, Pharmaceuticals) | | | | | | | | | | | 16,706 | | | | 1,463,672 | |
Roche Holding AG (Health Care, Pharmaceuticals) | | | | | | | | | | | 2,960 | | | | 720,346 | |
Sonova Holding AG (Health Care, Health Care Equipment & Supplies) | | | | | | | | | | | 2,346 | | | | 383,294 | |
Swiss Life Holding AG (Financials, Insurance) | | | | | | | | | | | 1,300 | | | | 490,751 | |
Swiss Reinsurance AG (Financials, Insurance) | | | | | | | | | | | 3,900 | | | | 352,226 | |
UBS Group AG (Financials, Capital Markets) | | | | | | | | | | | 10,600 | | | | 148,294 | |
Valiant Holding AG (Financials, Banks) | | | | | | | | | | | 1,400 | | | | 158,189 | |
Zurich Insurance Group AG (Financials, Insurance) | | | | | | | | | | | 1,364 | | | | 424,172 | |
| | | | |
| | | | | | | | | | | | | | | 6,236,603 | |
| | | | | | | | | | | | | | | | |
| | | | |
| Taiwan: 0.33% | | | | | | | | | | | | | | | | |
Pegatron Corporation (Information Technology, Technology Hardware, Storage & Peripherals) | | | | | | | | | | | 52,000 | | | | 94,613 | |
Powertech Technology Incorporated (Information Technology, Semiconductors & Semiconductor Equipment) | | | | | | | | | | | 51,000 | | | | 111,418 | |
Zhen Ding Technology Holding (Information Technology, Electronic Equipment, Instruments & Components) | | | | | | | | | | | 55,000 | | | | 125,667 | |
| | | | |
| | | | | | | | | | | | | | | 331,698 | |
| | | | | | | | | | | | | | | | |
The accompanying notes are an integral part of these financial statements.
| | | | | | |
| Portfolio of investments—October 31, 2018 | | Wells Fargo Diversified International Fund | | | 19 | |
| | | | | | | | | | | | | | | | |
| Security name | | | | | | | | Shares | | | Value | |
| | | | |
| Thailand: 0.32% | | | | | | | | | | | | | | | | |
Bangchak Corporation PCL (Energy, Oil, Gas & Consumable Fuels) | | | | | | | | | | | 135,400 | | | $ | 134,787 | |
Thai Oil PCL (Energy, Oil, Gas & Consumable Fuels) | | | | | | | | | | | 75,100 | | | | 191,998 | |
| | | | |
| | | | | | | | | | | | | | | 326,785 | |
| | | | | | | | | | | | | | | | |
| | | | |
| United Kingdom: 15.03% | | | | | | | | | | | | | | | | |
3i Group plc (Financials, Capital Markets) | | | | | | | | | | | 21,200 | | | | 237,973 | |
Anglo American plc (Materials, Metals & Mining) | | | | | | | | | | | 11,100 | | | | 237,678 | |
Aon plc (Financials, Insurance) | | | | | | | | | | | 6,065 | | | | 947,232 | |
Aviva plc (Financials, Insurance) | | | | | | | | | | | 22,000 | | | | 120,496 | |
BAE Systems plc (Industrials, Aerospace & Defense) | | | | | | | | | | | 51,500 | | | | 346,120 | |
Barratt Developments plc (Consumer Discretionary, Household Durables) | | | | | | | | | | | 23,400 | | | | 153,737 | |
Bellway plc (Consumer Discretionary, Household Durables) | | | | | | | | | | | 4,200 | | | | 154,128 | |
Bovis Homes Group plc (Consumer Discretionary, Household Durables) | | | | | | | | | | | 8,600 | | | | 106,518 | |
BP plc (Energy, Oil, Gas & Consumable Fuels) | | | | | | | | | | | 229,696 | | | | 1,665,579 | |
British American Tobacco plc (Consumer Staples, Tobacco) | | | | | | | | | | | 5,219 | | | | 226,378 | |
BT Group plc (Communication Services, Diversified Telecommunication Services) | | | | | | | | | | | 33,500 | | | | 103,003 | |
Centrica plc (Utilities, Multi-Utilities) | | | | | | | | | | | 68,900 | | | | 129,636 | |
ConvaTec Limited (Health Care, Health Care Equipment & Supplies) 144A | | | | | | | | | | | 170,121 | | | | 352,267 | |
Crest Nicholson Holdings plc (Consumer Discretionary, Household Durables) | | | | | | | | | | | 20,500 | | | | 89,300 | |
Debenhams plc (Consumer Discretionary, Multiline Retail) | | | | | | | | | | | 93,500 | | | | 10,660 | |
Experian Group Limited plc (Industrials, Professional Services) | | | | | | | | | | | 16,354 | | | | 376,789 | |
Ferguson plc (Industrials, Trading Companies & Distributors) | | | | | | | | | | | 9,864 | | | | 666,090 | |
Galliford Try plc (Industrials, Construction & Engineering) | | | | | | | | | | | 8,666 | | | | 96,812 | |
GlaxoSmithKline plc (Health Care, Pharmaceuticals) | | | | | | | | | | | 32,300 | | | | 623,912 | |
Glencore International plc (Materials, Metals & Mining) | | | | | | | | | | | 97,466 | | | | 397,227 | |
HSBC Holdings plc (Financials, Banks) | | | | | | | | | | | 44,151 | | | | 363,942 | |
Inchcape plc (Consumer Discretionary, Distributors) | | | | | | | | | | | 19,900 | | | | 137,610 | |
J Sainsbury plc (Consumer Staples, Food & Staples Retailing) | | | | | | | | | | | 70,800 | | | | 281,625 | |
John Wood Group plc (Energy, Energy Equipment & Services) | | | | | | | | | | | 112,605 | | | | 1,027,961 | |
Kingfisher plc (Consumer Discretionary, Specialty Retail) | | | | | | | | | | | 365,439 | | | | 1,189,714 | |
Lloyds Banking Group plc (Financials, Banks) | | | | | | | | | | | 134,900 | | | | 98,664 | |
London Stock Exchange Group plc (Financials, Capital Markets) | | | | | | | | | | | 7,136 | | | | 393,581 | |
Man Group plc (Financials, Capital Markets) | | | | | | | | | | | 334,323 | | | | 664,287 | |
Marks & Spencer Group plc (Consumer Discretionary, Multiline Retail) | | | | | | | | | | | 44,100 | | | | 166,851 | |
QinetiQ Group plc (Industrials, Aerospace & Defense) | | | | | | | | | | | 47,700 | | | | 169,314 | |
Redrow plc (Consumer Discretionary, Household Durables) | | | | | | | | | | | 24,200 | | | | 163,478 | |
Rentokil Initial plc (Industrials, Commercial Services & Supplies) | | | | | | | | | | | 84,282 | | | | 340,640 | |
Royal Dutch Shell plc Class B (Energy, Oil, Gas & Consumable Fuels) | | | | | | | | | | | 21,300 | | | | 698,338 | |
Royal Mail plc (Industrials, Air Freight & Logistics) | | | | | | | | | | | 20,900 | | | | 95,905 | |
Sensata Technologies Holding plc (Industrials, Electrical Equipment) † | | | | | | | | | | | 17,324 | | | | 812,496 | |
Smiths Group plc (Industrials, Industrial Conglomerates) | | | | | | | | | | | 38,922 | | | | 695,258 | |
Tate & Lyle plc (Consumer Staples, Food Products) | | | | | | | | | | | 15,700 | | | | 135,096 | |
The Berkeley Group Holdings plc (Consumer Discretionary, Household Durables) | | | | | | | | | | | 3,600 | | | | 161,099 | |
Vodafone Group plc (Communication Services, Wireless Telecommunication Services) | | | | | | | | | | | 331,543 | | | | 626,426 | |
| | | | |
| | | | | | | | | | | | | | | 15,263,820 | |
| | | | | | | | | | | | | | | | |
| | | | |
| United States: 0.10% | | | | | | | | | | | | | | | | |
WABCO Holdings Incorporated (Industrials, Machinery) † | | | | | | | | | | | 937 | | | | 100,681 | |
| | | | | | | | | | | | | | | | |
| | | | |
Total Common Stocks (Cost $90,922,718) | | | | | | | | | | | | | | | 96,697,441 | |
| | | | | | | | | | | | | | | | |
The accompanying notes are an integral part of these financial statements.
| | | | |
| 20 | | Wells Fargo Diversified International Fund | | Portfolio of investments—October 31, 2018 |
| | | | | | | | | | | | | | | | |
| Security name | | Dividend yield | | | | | | Shares | | | Value | |
| | | | |
Preferred Stocks: 1.38% | | | | | | | | | | | | | | | | |
| | | | |
| Brazil: 0.87% | | | | | | | | | | | | | | | | |
Companhia Energetica de Minas Gerais SA (Utilities, Electric Utilities) | | | 4.76 | % | | | | | | | 13,600 | | | $ | 40,308 | |
Petroleo Brasileiro SA (Energy, Oil, Gas & Consumable Fuels) | | | 0.30 | | | | | | | | 113,717 | | | | 843,978 | |
| | | | |
| | | | | | | | | | | | | | | 884,286 | |
| | | | | | | | | | | | | | | | |
| | | | |
| Germany: 0.51% | | | | | | | | | | | | | | | | |
Henkel AG & Company KGaA (Consumer Staples, Household Products) | | | 1.98 | | | | | | | | 4,766 | | | | 521,359 | |
| | | | | | | | | | | | | | | | |
| | | | |
Total Preferred Stocks (Cost $1,242,305) | | | | | | | | | | | | | | | 1,405,645 | |
| | | | | | | | | | | | | | | | |
| | | | |
| | | | | | Expiration date | | | | | | | |
| Rights: 0.00% | | | | | | | | | | | | | | | | |
| | | | |
| Spain: 0.00% | | | | | | | | | | | | | | | | |
Banco Santander SA (Financials, Banks) † | | | | | | | 01-30-2019 | | | | 29,500 | | | | 1,146 | |
| | | | | | | | | | | | | | | | |
| | | | |
Total Rights (Cost $1,188) | | | | | | | | | | | | | | | 1,146 | |
| | | | | | | | | | | | | | | | |
| | | | |
Warrants: 0.54% | | | | | | | | | | | | | | | | |
| | | | |
| United Kingdom: 0.54% | | | | | | | | | | | | | | | | |
HSBC Bank plc (Financials, Banks) †(a) | | | | | | | 10-29-2019 | | | | 40,387 | | | | 545,705 | |
| | | | | | | | | | | | | | | | |
| | | | |
Total Warrants (Cost $570,474) | | | | | | | | | | | | | | | 545,705 | |
| | | | | | | | | | | | | | | | |
| | | | |
| | | Yield | | | | | | | | | | |
| Short-Term Investments: 3.19% | | | | | | | | | | | | | | | | |
| | | | |
| Investment Companies: 3.19% | | | | | | | | | | | | | | | | |
Securities Lending Cash Investments LLC (l)(r)(u) | | | 2.33 | | | | | | | | 592,358 | | | | 592,418 | |
Wells Fargo Government Money Market Fund Select Class (l)(u) | | | 2.07 | | | | | | | | 2,648,395 | | | | 2,648,395 | |
| | | | |
Total Short-Term Investments (Cost $3,240,811) | | | | | | | | | | | | | | | 3,240,813 | |
| | | | | | | | | | | | | | | | |
| | | | | | | | |
| Total investments in securities (Cost $95,977,496) | | | 100.33 | % | | | 101,890,750 | |
Other assets and liabilities, net | | | (0.33 | ) | | | (339,393 | ) |
| | | | | | | | |
| Total net assets | | | 100.00 | % | | $ | 101,551,357 | |
| | | | | | | | |
| « | All or a portion of this security is on loan. |
| † | Non-income-earning security |
| 144A | The security may be resold in transactions exempt from registration, normally to qualified institutional buyers, pursuant to Rule 144A under the Securities Act of 1933. |
| (a) | The security is fair valued in accordance with procedures approved by the Board of Trustees. |
| (l) | The issuer of the security is an affiliated person of the Fund as defined in the Investment Company Act of 1940. |
| (r) | The investment is a non-registered investment company purchased with cash collateral received from securities on loan. |
| (u) | The rate represents the 7-day annualized yield at period end. |
Abbreviations:
| ADR | American depositary receipt |
| GDR | Global depositary receipt |
The accompanying notes are an integral part of these financial statements.
| | | | | | |
| Portfolio of investments—October 31, 2018 | | Wells Fargo Diversified International Fund | | | 21 | |
Forward Foreign Currency Contracts
| | | | | | | | | | | | | | |
Currency to be
received | | Currency to be
delivered | | Counterparty | | Settlement date | | Unrealized
gains | | | Unrealized
losses | |
| 2,040,244 USD | | 1,743,000 EUR | | Goldman Sachs | | 12-5-2018 | | $ | 60,861 | | | $ | 0 | |
| 2,541,786 USD | | 1,966,000 GBP | | Morgan Stanley | | 12-5-2018 | | | 25,164 | | | | 0 | |
| | | | | | | | | | | | | | |
| | | | | | | | $ | 86,025 | | | $ | 0 | |
| | | | | | | | | | | | | | |
Investments in Affiliates
An affiliated investment is an investment in which the Fund owns at least 5% of the outstanding voting shares of the issuer or as a result of other relationships, such as the Fund and the issuer having the same investment manager. Transactions with issuers that were either affiliated persons of the Fund at the beginning of the period or the end of the period were as follows:
| | | | | | | | | | | | | | | | | | | | | | | | | | | | | | | | | | | | |
| | | Shares,
beginning of
period | | | Shares
purchased | | | Shares
sold | | | Shares,
end of
period | | | Net
realized
gains
(losses) | | | Net
change in
unrealized
gains
(losses) | | | Income
from
affiliated
securities | | | Value,
end
of period | | | % of
net
assets | |
Short-Term Investments | | | | | | | | | | | | | | | | | | | | | | | | | | | | | | | | | | | | |
Investment Companies | | | | | | | | | | | | | | | | | | | | | | | | | | | | | | | | | | | | |
Securities Lending Cash Investments LLC | | | 798,430 | | | | 29,236,962 | | | | 29,443,034 | | | | 592,358 | | | $ | 615 | | | $ | 0 | | | $ | 51,422 | | | $ | 592,418 | | | | | |
Wells Fargo Government Money Market Fund Select Class | | | 2,773,394 | | | | 35,654,835 | | | | 35,779,834 | | | | 2,648,395 | | | | 0 | | | | 0 | | | | 53,483 | | | | 2,648,395 | | | | | |
| | | | | | | | | | | | | | | | | | | | | | | | | | | | | | | | | | | | |
| | | | | | | | | | | | | | | | | | $ | 615 | | | $ | 0 | | | $ | 104,905 | | | $ | 3,240,813 | | | | 3.19 | % |
| | | | | | | | | | | | | | | | | | | | | | | | | | | | | | | | | | | | |
The accompanying notes are an integral part of these financial statements.
| | | | |
| 22 | | Wells Fargo Diversified International Fund | | Statement of assets and liabilities—October 31, 2018 |
| | | | |
| | | | |
| |
Assets | | | | |
Investments in unaffiliated securities (including $563,144 of securities loaned), at value (cost $92,736,685) | | $ | 98,649,937 | |
Investments in affiliated securities, at value (cost $3,240,811) | | | 3,240,813 | |
Cash | | | 25,085 | |
Foreign currency, at value (cost $422,072) | | | 413,980 | |
Receivable for investments sold | | | 162,865 | |
Receivable for Fund shares sold | | | 21,096 | |
Receivable for dividends | | | 445,808 | |
Receivable for securities lending income | | | 152 | |
Unrealized gains on forward foreign currency contracts | | | 86,025 | |
Prepaid expenses and other assets | | | 39,520 | |
| | | | |
Total assets | | | 103,085,281 | |
| | | | |
| |
Liabilities | | | | |
Payable upon receipt of securities loaned | | | 591,768 | |
Payable for investments purchased | | | 499,622 | |
Custodian and accounting fees payable | | | 228,721 | |
Payable for Fund shares redeemed | | | 98,850 | |
Management fee payable | | | 43,832 | |
Administration fees payable | | | 13,086 | |
Distribution fees payable | | | 1,561 | |
Trustees’ fees and expenses payable | | | 812 | |
Accrued expenses and other liabilities | | | 55,672 | |
| | | | |
Total liabilities | | | 1,533,924 | |
| | | | |
Total net assets | | $ | 101,551,357 | |
| | | | |
| |
NET ASSETS CONSIST OF | | | | |
Paid-in capital | | $ | 101,495,292 | |
Total distributable earnings | | | 56,065 | |
| | | | |
Total net assets | | $ | 101,551,357 | |
| | | | |
| |
COMPUTATION OF NET ASSET VALUE AND OFFERING PRICE PER SHARE | | | | |
Net assets – Class A | | $ | 54,357,658 | |
Shares outstanding – Class A1 | | | 4,474,478 | |
Net asset value per share – Class A | | | $12.15 | |
Maximum offering price per share – Class A2 | | | $12.89 | |
Net assets – Class C | | $ | 2,340,458 | |
Shares outstanding – Class C1 | | | 210,481 | |
Net asset value per share – Class C | | | $11.12 | |
Net assets – Class R6 | | $ | 27,692,490 | |
Shares outstanding – Class R61 | | | 2,219,999 | |
Net asset value per share – Class R6 | | | $12.47 | |
Net assets – Administrator Class | | $ | 12,557,135 | |
Shares outstanding – Administrator Class1 | | | 1,014,233 | |
Net asset value per share – Administrator Class | | | $12.38 | |
Net assets – Institutional Class | | $ | 4,603,616 | |
Shares outstanding – Institutional Class1 | | | 398,006 | |
Net asset value per share – Institutional Class | | | $11.57 | |
| 1 | The Fund has an unlimited number of authorized shares. |
| 2 | Maximum offering price is computed as 100/94.25 of net asset value. On investments of $50,000 or more, the offering price is reduced. |
The accompanying notes are an integral part of these financial statements.
| | | | | | |
| Statement of operations—year ended October 31, 2018 | | Wells Fargo Diversified International Fund | | | 23 | |
| | | | |
| | | | |
| |
Investment income | | | | |
Dividends (net of foreign withholding taxes of $377,018) | | $ | 3,472,689 | |
Income from affiliated securities | | | 104,905 | |
| | | | |
Total investment income | | | 3,577,594 | |
| | | | |
| |
Expenses | | | | |
Management fee | | | 1,022,357 | |
Administration fees | | | | |
Class A | | | 130,622 | |
Class C | | | 7,193 | |
Class R | | | 2 | 1 |
Class R6 | | | 10,104 | |
Administrator Class | | | 18,134 | |
Institutional Class | | | 9,125 | |
Shareholder servicing fees | | | | |
Class A | | | 155,502 | |
Class C | | | 8,563 | |
Class R | | | 3 | 1 |
Administrator Class | | | 34,874 | |
Distribution fees | | | | |
Class C | | | 25,689 | |
Class R | | | 3 | 1 |
Custody and accounting fees | | | 214,595 | |
Professional fees | | | 48,049 | |
Registration fees | | | 102,312 | |
Shareholder report expenses | | | 52,175 | |
Trustees’ fees and expenses | | | 22,082 | |
Other fees and expenses | | | 40,031 | |
| | | | |
Total expenses | | | 1,901,415 | |
Less: Fee waivers and/or expense reimbursements | | | (446,130 | ) |
| | | | |
Net expenses | | | 1,455,285 | |
| | | | |
Net investment income | | | 2,122,309 | |
| | | | |
| |
REALIZED AND UNREALIZED GAINS (LOSSES) ON INVESTMENTS | | | | |
| |
Net realized gains on: | | | | |
Unaffiliated securities | | | 5,432,901 | |
Affiliated securities | | | 615 | |
Forward foreign currency contracts | | | 120,580 | |
| | | | |
Net realized gains on investments | | | 5,554,096 | |
| | | | |
| |
Net change in unrealized gains (losses) on: | | | | |
Unaffiliated securities | | | (15,136,226 | ) |
Forward foreign currency contracts | | | 71,044 | |
| | | | |
Net change in unrealized gains (losses) on investments | | | (15,065,182 | ) |
| | | | |
Net realized and unrealized gains (losses) on investments | | | (9,511,086 | ) |
| | | | |
Net decrease in net assets resulting from operations | | $ | (7,388,777 | ) |
| | | | |
| 1 | For the period from November 1, 2017 to November 13, 2017. Effective at the close of business on November 13, 2017, Class R shares were liquidated and the class was subsequently closed. Class R shares are no longer offered by the Fund. |
The accompanying notes are an integral part of these financial statements.
| | | | |
| 24 | | Wells Fargo Diversified International Fund | | Statement of changes in net assets |
| | | | | | | | | | | | | | | | |
| | | Year ended
October 31, 2018 | | | Year ended
October 31, 20171 | |
| | | | |
Operations | | | | | | | | | | | | | | | | |
Net investment income | | | | | | $ | 2,122,309 | | | | | | | $ | 2,082,375 | |
Net realized gains on investments | | | | | | | 5,554,096 | | | | | | | | 2,921,588 | |
Net change in unrealized gains (losses) on investments | | | | | | | (15,065,182 | ) | | | | | | | 19,371,292 | |
| | | | |
Net increase (decrease) in net assets resulting from operations | | | | | | | (7,388,777 | ) | | | | | | | 24,375,255 | |
| | | | |
| | | | |
Distributions to shareholders from net investment income and net realized gains | | | | | | | | | | | | | | | | |
Class A | | | | | | | (1,577,710 | ) | | | | | | | (1,161,061 | ) |
Class C | | | | | | | (73,033 | ) | | | | | | | (54,176 | ) |
Class R | | | | | | | 0 | 2 | | | | | | | (434 | ) |
Class R6 | | | | | | | (864,807 | ) | | | | | | | (131,270 | ) |
Administrator Class | | | | | | | (347,079 | ) | | | | | | | (197,876 | ) |
Institutional Class | | | | | | | (286,387 | ) | | | | | | | (625,514 | ) |
| | | | |
Total distributions to shareholders | | | | | | | (3,149,016 | ) | | | | | | | (2,170,331 | ) |
| | | | |
| | | | |
Capital share transactions | | | Shares | | | | | | | | Shares | | | | | |
Proceeds from shares sold | | | | | | | | | | | | | | | | |
Class A | | | 108,681 | | | | 1,454,360 | | | | 135,356 | | | | 1,651,415 | |
Class C | | | 31,556 | | | | 401,935 | | | | 59,340 | | | | 667,474 | |
Class R6 | | | 322,912 | | | | 4,341,223 | | | | 2,005,822 | | | | 25,485,197 | |
Administrator Class | | | 204,027 | | | | 2,787,392 | | | | 381,177 | | | | 4,685,042 | |
Institutional Class | | | 48,181 | | | | 616,951 | | | | 807,153 | | | | 8,925,286 | |
| | | | |
| | | | | | | 9,601,861 | | | | | | | | 41,414,414 | |
| | | | |
Reinvestment of distributions | | | | | | | | | | | | | | | | |
Class A | | | 115,936 | | | | 1,551,227 | | | | 104,664 | | | | 1,141,882 | |
Class C | | | 5,516 | | | | 67,961 | | | | 5,009 | | | | 50,389 | |
Class R | | | 0 | 2 | | | 0 | 2 | | | 40 | | | | 434 | |
Class R6 | | | 63,155 | | | | 863,957 | | | | 11,794 | | | | 131,270 | |
Administrator Class | | | 25,476 | | | | 346,979 | | | | 12,354 | | | | 137,133 | |
Institutional Class | | | 22,284 | | | | 283,005 | | | | 59,475 | | | | 619,734 | |
| | | | |
| | | | | | | 3,113,129 | | | | | | | | 2,080,842 | |
| | | | |
Payment for shares redeemed | | | | | | | | | | | | | | | | |
Class A | | | (555,196 | ) | | | (7,393,677 | ) | | | (945,211 | ) | | | (11,188,195 | ) |
Class B | | | N/A | | | | N/A | | | | (870 | )3 | | | (9,339 | )3 |
Class C | | | (157,841 | ) | | | (1,925,792 | ) | | | (161,156 | ) | | | (1,827,608 | ) |
Class R | | | (2,309 | )2 | | | (31,119 | )2 | | | 0 | | | | 0 | |
Class R6 | | | (623,428 | ) | | | (8,441,251 | ) | | | (47,567 | ) | | | (608,453 | ) |
Administrator Class | | | (220,724 | ) | | | (2,992,288 | ) | | | (481,500 | ) | | | (5,617,290 | ) |
Institutional Class | | | (306,981 | ) | | | (3,843,466 | ) | | | (2,524,974 | ) | | | (30,049,009 | ) |
| | | | |
| | | | | | | (24,627,593 | ) | | | | | | | (49,299,894 | ) |
| | | | |
Net decrease in net assets resulting from capital share transactions | | | | | | | (11,912,603 | ) | | | | | | | (5,804,638 | ) |
| | | | |
Total increase (decrease) in net assets | | | | | | | (22,450,396 | ) | | | | | | | 16,400,286 | |
| | | | |
| | | | |
Net assets | | | | | | | | | | | | | | | | |
Beginning of period | | | | | | | 124,001,753 | | | | | | | | 107,601,467 | |
| | | | |
End of period | | | | | | $ | 101,551,357 | | | | | | | $ | 124,001,753 | |
| | | | |
| 1 | Effective for all filings after November 4, 2018, the SEC prospectively eliminated the requirements to parenthetically disclose undistributed net investment income at the end of the period and permitted the aggregation of distributions, with the exception of tax basis returns of capital. Undistributed net investment income at October 31, 2017 was $2,927,725. The disaggregated distributions information for the year ended October 31, 2017 is included in Note 8, Distributions to Shareholders, in the notes to the financial statements. |
| 2 | For the period from November 1, 2017 to November 13, 2017. Effective at the close of business on November 13, 2017, Class R shares were liquidated and the class was subsequently closed. Class R shares are no longer offered by the Fund. |
| 3 | For the period from November 1, 2016 to December 5, 2016. Effective at the close of business on December 5, 2016, Class B shares were converted to Class A shares and are no longer offered by the Fund. |
The accompanying notes are an integral part of these financial statements.
| | | | | | |
| Financial highlights | | Wells Fargo Diversified International Fund | | | 25 | |
(For a share outstanding throughout each period)
| | | | | | | | | | | | | | | | | | | | |
| | | Year ended October 31 | |
| CLASS A | | 2018 | | | 2017 | | | 2016 | | | 2015 | | | 2014 | |
Net asset value, beginning of period | | | $13.39 | | | | $11.08 | | | | $11.65 | | | | $12.01 | | | | $12.25 | |
Net investment income | | | 0.21 | | | | 0.19 | | | | 0.17 | | | | 0.13 | 1 | | | 0.24 | 1 |
Net realized and unrealized gains (losses) on investments | | | (1.12 | ) | | | 2.34 | | | | (0.63 | ) | | | (0.21 | ) | | | (0.29 | ) |
| | | | | | | | | | | | | | | | | | | | |
Total from investment operations | | | (0.91 | ) | | | 2.53 | | | | (0.46 | ) | | | (0.08 | ) | | | (0.05 | ) |
Distributions to shareholders from | | | | | | | | | | | | | | | | | | | | |
Net investment income | | | (0.33 | ) | | | (0.22 | ) | | | (0.11 | ) | | | (0.28 | ) | | | (0.19 | ) |
Net asset value, end of period | | | $12.15 | | | | $13.39 | | | | $11.08 | | | | $11.65 | | | | $12.01 | |
Total return2 | | | (7.00 | )% | | | 23.27 | % | | | (3.96 | )% | | | (0.66 | )% | | | (0.49 | )% |
Ratios to average net assets (annualized) | | | | | | | | | | | | | | | | | | | | |
Gross expenses | | | 1.71 | % | | | 1.80 | % | | | 1.79 | % | | | 1.85 | % | | | 1.76 | % |
Net expenses | | | 1.35 | % | | | 1.35 | % | | | 1.35 | % | | | 1.40 | % | | | 1.41 | % |
Net investment income | | | 1.61 | % | | | 1.64 | % | | | 1.67 | % | | | 1.07 | % | | | 1.93 | % |
Supplemental data | | | | | | | | | | | | | | | | | | | | |
Portfolio turnover rate | | | 39 | % | | | 42 | % | | | 50 | % | | | 31 | % | | | 33 | % |
Net assets, end of period (000s omitted) | | | $54,358 | | | | $64,347 | | | | $61,031 | | | | $73,891 | | | | $24,921 | |
| 1 | Calculated based upon average shares outstanding |
| 2 | Total return calculations do not include any sales charges. |
The accompanying notes are an integral part of these financial statements.
| | | | |
| 26 | | Wells Fargo Diversified International Fund | | Financial highlights |
(For a share outstanding throughout each period)
| | | | | | | | | | | | | | | | | | | | |
| | | Year ended October 31 | |
| CLASS C | | 2018 | | | 2017 | | | 2016 | | | 2015 | | | 2014 | |
Net asset value, beginning of period | | | $12.27 | | | | $10.16 | | | | $10.74 | | | | $11.08 | | | | $11.35 | |
Net investment income | | | 0.10 | 1 | | | 0.10 | 1 | | | 0.10 | 1 | | | 0.04 | 1 | | | 0.13 | 1 |
Net realized and unrealized gains (losses) on investments | | | (1.02 | ) | | | 2.15 | | | | (0.60 | ) | | | (0.20 | ) | | | (0.27 | ) |
| | | | | | | | | | | | | | | | | | | | |
Total from investment operations | | | (0.92 | ) | | | 2.25 | | | | (0.50 | ) | | | (0.16 | ) | | | (0.14 | ) |
Distributions to shareholders from | | | | | | | | | | | | | | | | | | | | |
Net investment income | | | (0.23 | ) | | | (0.14 | ) | | | (0.08 | ) | | | (0.18 | ) | | | (0.13 | ) |
Net asset value, end of period | | | $11.12 | | | | $12.27 | | | | $10.16 | | | | $10.74 | | | | $11.08 | |
Total return2 | | | (7.76 | )% | | | 22.51 | % | | | (4.72 | )% | | | (1.44 | )% | | | (1.24 | )% |
Ratios to average net assets (annualized) | | | | | | | | | | | | | | | | | | | | |
Gross expenses | | | 2.46 | % | | | 2.55 | % | | | 2.54 | % | | | 2.60 | % | | | 2.51 | % |
Net expenses | | | 2.10 | % | | | 2.10 | % | | | 2.10 | % | | | 2.15 | % | | | 2.16 | % |
Net investment income | | | 0.81 | % | | | 0.92 | % | | | 1.01 | % | | | 0.33 | % | | | 1.15 | % |
Supplemental data | | | | | | | | | | | | | | | | | | | | |
Portfolio turnover rate | | | 39 | % | | | 42 | % | | | 50 | % | | | 31 | % | | | 33 | % |
Net assets, end of period (000s omitted) | | | $2,340 | | | | $4,066 | | | | $4,351 | | | | $3,573 | | | | $1,616 | |
| 1 | Calculated based upon average shares outstanding |
| 2 | Total return calculations do not include any sales charges. |
The accompanying notes are an integral part of these financial statements.
| | | | | | |
| Financial highlights | | Wells Fargo Diversified International Fund | | | 27 | |
(For a share outstanding throughout each period)
| | | | | | | | | | | | | | | | |
| | | Year ended October 31 | |
| CLASS R6 | | 2018 | | | 2017 | | | 2016 | | | 20151 | |
Net asset value, beginning of period | | | $13.71 | | | | $11.33 | | | | $11.87 | | | | $11.13 | |
Net investment income | | | 0.31 | | | | 0.30 | 2 | | | 0.26 | 2 | | | 0.00 | 3 |
Net realized and unrealized gains (losses) on investments | | | (1.18 | ) | | | 2.34 | | | | (0.68 | ) | | | 0.74 | |
| | | | | | | | | | | | | | | | |
Total from investment operations | | | (0.87 | ) | | | 2.64 | | | | (0.42 | ) | | | 0.74 | |
Distributions to shareholders from | | | | | | | | | | | | | | | | |
Net investment income | | | (0.37 | ) | | | (0.26 | ) | | | (0.12 | ) | | | 0.00 | |
Net asset value, end of period | | | $12.47 | | | | $13.71 | | | | $11.33 | | | | $11.87 | |
Total return4 | | | (6.61 | )% | | | 23.88 | % | | | (3.55 | )% | | | 6.65 | % |
Ratios to average net assets (annualized) | | | | | | | | | | | | | | | | |
Gross expenses | | | 1.28 | % | | | 1.34 | % | | | 1.36 | % | | | 1.46 | % |
Net expenses | | | 0.89 | % | | | 0.89 | % | | | 0.89 | % | | | 0.89 | % |
Net investment income | | | 2.11 | % | | | 2.37 | % | | | 2.30 | % | | | 0.05 | % |
Supplemental data | | | | | | | | | | | | | | | | |
Portfolio turnover rate | | | 39 | % | | | 42 | % | | | 50 | % | | | 31 | % |
Net assets, end of period (000s omitted) | | | $27,692 | | | | $33,698 | | | | $5,523 | | | | $27 | |
| 1 | For the period from September 30, 2015 (commencement of class operations) to October 31, 2015 |
| 2 | Calculated based upon average shares outstanding |
| 3 | Amount is less than $0.005. |
| 4 | Returns for periods of less than one year are not annualized. |
The accompanying notes are an integral part of these financial statements.
| | | | |
| 28 | | Wells Fargo Diversified International Fund | | Financial highlights |
(For a share outstanding throughout each period)
| | | | | | | | | | | | | | | | | | | | |
| | | Year ended October 31 | |
| ADMINISTRATOR CLASS | | 2018 | | | 2017 | | | 2016 | | | 2015 | | | 2014 | |
Net asset value, beginning of period | | | $13.64 | | | | $11.28 | | | | $11.87 | | | | $12.23 | | | | $12.47 | |
Net investment income | | | 0.23 | 1 | | | 0.22 | 1 | | | 0.20 | 1 | | | 0.16 | 1 | | | 0.26 | 1 |
Net realized and unrealized gains (losses) on investments | | | (1.15 | ) | | | 2.37 | | | | (0.66 | ) | | | (0.22 | ) | | | (0.30 | ) |
| | | | | | | | | | | | | | | | | | | | |
Total from investment operations | | | (0.92 | ) | | | 2.59 | | | | (0.46 | ) | | | (0.06 | ) | | | (0.04 | ) |
Distributions to shareholders from | | | | | | | | | | | | | | | | | | | | |
Net investment income | | | (0.34 | ) | | | (0.23 | ) | | | (0.13 | ) | | | (0.30 | ) | | | (0.20 | ) |
Net asset value, end of period | | | $12.38 | | | | $13.64 | | | | $11.28 | | | | $11.87 | | | | $12.23 | |
Total return | | | (6.94 | )% | | | 23.46 | % | | | (3.90 | )% | | | (0.46 | )% | | | (0.39 | )% |
Ratios to average net assets (annualized) | | | | | | | | | | | | | | | | | | | | |
Gross expenses | | | 1.63 | % | | | 1.72 | % | | | 1.71 | % | | | 1.72 | % | | | 1.60 | % |
Net expenses | | | 1.25 | % | | | 1.25 | % | | | 1.25 | % | | | 1.25 | % | | | 1.25 | % |
Net investment income | | | 1.73 | % | | | 1.79 | % | | | 1.83 | % | | | 1.31 | % | | | 2.10 | % |
Supplemental data | | | | | | | | | | | | | | | | | | | | |
Portfolio turnover rate | | | 39 | % | | | 42 | % | | | 50 | % | | | 31 | % | | | 33 | % |
Net assets, end of period (000s omitted) | | | $12,557 | | | | $13,714 | | | | $12,334 | | | | $10,540 | | | | $7,283 | |
| 1 | Calculated based upon average shares outstanding |
The accompanying notes are an integral part of these financial statements.
| | | | | | |
| Financial highlights | | Wells Fargo Diversified International Fund | | | 29 | |
(For a share outstanding throughout each period)
| | | | | | | | | | | | | | | | | | | | |
| | | Year ended October 31 | |
| INSTITUTIONAL CLASS | | 2018 | | | 2017 | | | 2016 | | | 2015 | | | 2014 | |
Net asset value, beginning of period | | | $12.84 | | | | $10.61 | | | | $11.14 | | | | $11.50 | | | | $11.79 | |
Net investment income | | | 0.25 | 1 | | | 0.23 | 1 | | | 0.23 | 1 | | | 0.17 | 1 | | | 0.26 | 1 |
Net realized and unrealized gains (losses) on investments | | | (1.07 | ) | | | 2.25 | | | | (0.63 | ) | | | (0.20 | ) | | | (0.27 | ) |
| | | | | | | | | | | | | | | | | | | | |
Total from investment operations | | | (0.82 | ) | | | 2.48 | | | | (0.40 | ) | | | (0.03 | ) | | | (0.01 | ) |
Distributions to shareholders from | | | | | | | | | | | | | | | | | | | | |
Net investment income | | | (0.45 | ) | | | (0.25 | ) | | | (0.13 | ) | | | (0.33 | ) | | | (0.28 | ) |
Net asset value, end of period | | | $11.57 | | | | $12.84 | | | | $10.61 | | | | $11.14 | | | | $11.50 | |
Total return | | | (6.68 | )% | | | 23.91 | % | | | (3.63 | )% | | | (0.23 | )% | | | (0.18 | )% |
Ratios to average net assets (annualized) | | | | | | | | | | | | | | | | | | | | |
Gross expenses | | | 1.38 | % | | | 1.49 | % | | | 1.46 | % | | | 1.47 | % | | | 1.33 | % |
Net expenses | | | 0.99 | % | | | 0.99 | % | | | 0.99 | % | | | 0.99 | % | | | 0.99 | % |
Net investment income | | | 1.97 | % | | | 2.02 | % | | | 2.16 | % | | | 1.45 | % | | | 2.23 | % |
Supplemental data | | | | | | | | | | | | | | | | | | | | |
Portfolio turnover rate | | | 39 | % | | | 42 | % | | | 50 | % | | | 31 | % | | | 33 | % |
Net assets, end of period (000s omitted) | | | $4,604 | | | | $8,146 | | | | $24,328 | | | | $7,106 | | | | $2,683 | |
| 1 | Calculated based upon average shares outstanding |
The accompanying notes are an integral part of these financial statements.
| | | | |
| 30 | | Wells Fargo Diversified International Fund | | Notes to financial statements |
1. ORGANIZATION
Wells Fargo Funds Trust (the “Trust”), a Delaware statutory trust organized on March 10, 1999, is an open-end management investment company registered under the Investment Company Act of 1940, as amended (the “1940 Act”). As an investment company, the Trust follows the accounting and reporting guidance in Financial Accounting Standards Board Accounting (“FASB”) Standards Codification Topic 946, Financial Services – Investment Companies. These financial statements report on the Wells Fargo Diversified International Fund (the “Fund”) which is a diversified series of the Trust.
Effective at the close of business on December 5, 2016, Class B shares were converted to Class A shares and are no longer offered by the Fund. Information for Class B shares reflected in the financial statements represents activity through December 5, 2016.
Effective at the close of business on November 13, 2017, Class R shares were liquidated and the class was subsequently closed. Class R shares are no longer offered by the Fund. Information for Class R shares reflected in the financial statements represents activity through November 13, 2017.
2. SIGNIFICANT ACCOUNTING POLICIES
The following significant accounting policies, which are consistently followed in the preparation of the financial statements of the Fund, are in conformity with U.S. generally accepted accounting principles which require management to make estimates and assumptions that affect the reported amounts of assets and liabilities, disclosure of contingent assets and liabilities at the date of the financial statements, and the reported amounts of revenues and expenses during the reporting period. Actual results could differ from those estimates.
Securities valuation
All investments are valued each business day as of the close of regular trading on the New York Stock Exchange (generally 4 p.m. Eastern Time), although the Fund may deviate from this calculation time under unusual or unexpected circumstances.
Equity securities that are listed on a foreign or domestic exchange or market are valued at the official closing price or, if none, the last sales price. If no sale occurs on the principal exchange or market that day, a fair value price will be determined in accordance with the Fund’s Valuation Procedures.
The values of securities denominated in foreign currencies are translated into U.S. dollars at rates provided by an independent foreign currency pricing source at a time each business day specified by the Wells Fargo Asset Management Pricing Committee at Wells Fargo Funds Management, LLC (“Funds Management”).
Many securities markets and exchanges outside the U.S. close prior to the close of the New York Stock Exchange and therefore may not fully reflect trading or events that occur after the close of the principal exchange in which the foreign securities are traded, but before the close of the New York Stock Exchange. If such trading or events are expected to materially affect the value of such securities, then fair value pricing procedures approved by the Board of Trustees of the Fund are applied. These procedures take into account multiple factors including movements in U.S. securities markets after foreign exchanges close. Foreign securities that are fair valued under these procedures are categorized as Level 2 and the application of these procedures may result in transfers between Level 1 and Level 2. Depending on market activity, such fair valuations may be frequent. Such fair value pricing may result in net asset values that are higher or lower than net asset values based on the last reported sales price or latest quoted bid price. On October 31, 2018, such fair value pricing was not used in pricing foreign securities.
Investments in registered open-end investment companies are valued at net asset value. Interests in non-registered investment companies that are redeemable at net asset value are fair valued normally at net asset value.
Investments which are not valued using any methods discussed above are valued at their fair value, as determined in good faith by the Board of Trustees. The Board of Trustees has established a Valuation Committee comprised of the Trustees and has delegated to it the authority to take any actions regarding the valuation of portfolio securities that the Valuation Committee deems necessary or appropriate, including determining the fair value of portfolio securities, unless the determination has been delegated to the Wells Fargo Asset Management Pricing Committee. The Board of Trustees retains the authority to make or ratify any valuation decisions or approve any changes to the Valuation Procedures as it deems appropriate. On a quarterly basis, the Board of Trustees receives reports on any valuation actions taken by the Valuation Committee or the Wells Fargo Asset Management Pricing Committee which may include items for ratification.
Foreign currency translation
The accounting records of the Fund are maintained in U.S. dollars. The values of other assets and liabilities denominated in foreign currencies are translated into U.S. dollars at rates provided by an independent foreign currency pricing source
| | | | | | |
| Notes to financial statements | | Wells Fargo Diversified International Fund | | | 31 | |
at a time each business day specified by the Wells Fargo Asset Management Pricing Committee. Purchases and sales of securities, and income and expenses are converted at the rate of exchange on the respective dates of such transactions. Net realized foreign exchange gains or losses arise from sales of foreign currencies, currency gains or losses realized between the trade and settlement dates on securities transactions, and the difference between the amounts of dividends, interest and foreign withholding taxes recorded and the U.S. dollar equivalent of the amounts actually paid or received. Net unrealized foreign exchange gains and losses arise from changes in the fair value of assets and liabilities other than investments in securities resulting from changes in exchange rates. The changes in net assets arising from changes in exchange rates of securities and the changes in net assets resulting from changes in market prices of securities are not separately presented. Such changes are included in net realized and unrealized gains or losses from investments.
Participation notes
The Fund may invest in participation notes to gain exposure to securities in certain foreign markets. Participation notes are issued by banks or broker-dealers and are designed to offer a return linked to a particular underlying foreign security. Participation notes involve transaction costs, which may be higher than those applicable to the underlying foreign security. The holder of the participation note is entitled to receive from the bank or broker-dealer, an amount equal to the dividend paid by the issuer of the underlying foreign security; however, the holder is not entitled to the same rights (i.e. voting rights) as an owner of the underlying foreign security. Investments in participation notes involve risks beyond those normally associated with a direct investment in an underlying security. The Fund has no rights against the issuer of the underlying foreign security and participation notes expose the Fund to counterparty risk in the event the counterparty does not perform. There is also no assurance there will be a secondary trading market for the participation note or that the trading price of the participation note will equal the underlying value of the foreign security that it seeks to replicate.
Forward foreign currency contracts
The Fund is subject to foreign currency risk in the normal course of pursuing its investment objectives. A forward foreign currency contract is an agreement between two parties to purchase or sell a specific currency for an agreed-upon price at a future date. The Fund enters into forward foreign currency contracts to facilitate transactions in foreign-denominated securities and to attempt to minimize the risk to the Fund from adverse changes in the relationship between currencies. Forward foreign currency contracts are recorded at the forward rate and marked-to-market daily. When the contracts are closed, realized gains and losses arising from such transactions are recorded as realized gains or losses on forward foreign currency contracts. The Fund could be exposed to risks if the counterparties to the contracts are unable to meet the terms of their contracts or if the value of the foreign currency changes unfavorably. The Fund’s maximum risk of loss from counterparty credit risk is the unrealized gains on the contracts. This risk may be mitigated if there is a master netting arrangement between the Fund and the counterparty.
Securities lending
The Fund may lend its securities from time to time in order to earn additional income in the form of fees or interest on securities received as collateral or the investment of any cash received as collateral. The Fund continues to receive interest or dividends on the securities loaned. The Fund receives collateral in the form of cash or securities with a value at least equal to the value of the securities on loan. The value of the loaned securities is determined at the close of each business day and any additional required collateral is delivered to the Fund on the next business day. In a securities lending transaction, the net asset value of the Fund will be affected by an increase or decrease in the value of the securities loaned and by an increase or decrease in the value of the instrument in which collateral is invested. The amount of securities lending activity undertaken by the Fund fluctuates from time to time. In the event of default or bankruptcy by the borrower, the Fund may be prevented from recovering the loaned securities or gaining access to the collateral or may experience delays or costs in doing so. In addition, the investment of any cash collateral received may lose all or part of its value. The Fund has the right under the lending agreement to recover the securities from the borrower on demand.
The Fund lends its securities through an unaffiliated securities lending agent. Cash collateral received in connection with its securities lending transactions is invested in Securities Lending Cash Investments, LLC (the “Securities Lending Fund”). The Securities Lending Fund is exempt from registration under Section 3(c)(7) of the 1940 Act and is managed by Funds Management and is subadvised by Wells Capital Management Incorporated (“WellsCap”), an affiliate of Funds Management and an indirect wholly owned subsidiary of Wells Fargo & Company (“Wells Fargo”). Funds Management receives an advisory fee starting at 0.05% and declining to 0.01% as the average daily net assets of the Securities Lending Fund increase. All of the fees received by Funds Management are paid to WellsCap for its services as subadviser. The Securities Lending Fund seeks to provide a positive return compared to the daily Fed Funds Open Rate by investing in high-quality, U.S. dollar-denominated short-term money market instruments. Securities Lending Fund investments are
| | | | |
| 32 | | Wells Fargo Diversified International Fund | | Notes to financial statements |
valued at the evaluated bid price provided by an independent pricing service. Income earned from investment in the Securities Lending Fund, if any, is included in income from affiliated securities on the Statement of Operations.
Security transactions and income recognition
Securities transactions are recorded on a trade date basis. Realized gains or losses are recorded on the basis of identified cost.
Dividend income is recognized on the ex-dividend date, except for certain dividends from foreign securities, which are recorded as soon as the custodian verifies the ex-dividend date. Dividend income from foreign securities is recorded net of foreign taxes withheld where recovery of such taxes is not assured.
Distributions to shareholders
Distributions to shareholders from net investment income and any net realized gains are recorded on the ex-dividend date and paid at least annually. Such distributions are determined in accordance with income tax regulations and may differ from U.S. generally accepted accounting principles. Dividend sources are estimated at the time of declaration. The tax character of distributions is determined as of the Fund’s fiscal year end. Therefore, a portion of the Fund’s distributions made prior to the Fund’s fiscal year end may be categorized as a tax return of capital at year end.
Federal and other taxes
The Fund intends to continue to qualify as a regulated investment company by distributing substantially all of its investment company taxable income and any net realized capital gains (after reduction for capital loss carryforwards) sufficient to relieve it from all, or substantially all, federal income taxes. Accordingly, no provision for federal income taxes was required.
The Fund’s income and federal excise tax returns and all financial records supporting those returns for the prior three fiscal years are subject to examination by the federal and Delaware revenue authorities. Management has analyzed the Fund’s tax positions taken on federal, state, and foreign tax returns for all open tax years and does not believe that there are any uncertain tax positions that require recognition of a tax liability.
As of October 31, 2018, the aggregate cost of all investments for federal income tax purposes was $97,392,079 and the unrealized gains (losses) consisted of:
| | | | |
Gross unrealized gains | | $ | 13,779,947 | |
Gross unrealized losses | | | (9,195,251 | ) |
Net unrealized gains | | $ | 4,584,696 | |
As of October 31, 2018, the Fund had capital loss carryforwards which consist of $6,769,927 in short-term capital losses.
Class allocations
The separate classes of shares offered by the Fund differ principally in applicable sales charges, distribution, shareholder servicing, and administration fees. Class specific expenses are charged directly to that share class. Investment income, common expenses, and realized and unrealized gains (losses) on investments are allocated daily to each class of shares based on the relative proportion of net assets of each class.
3. FAIR VALUATION MEASUREMENTS
Fair value measurements of investments are determined within a framework that has established a fair value hierarchy based upon the various data inputs utilized in determining the value of the Fund’s investments. The three-level hierarchy gives the highest priority to unadjusted quoted prices in active markets for identical assets or liabilities (Level 1) and the lowest priority to unobservable inputs (Level 3). The Fund’s investments are classified within the fair value hierarchy based on the lowest level of input that is significant to the fair value measurement. The inputs are summarized into three broad levels as follows:
| ∎ | | Level 1 – quoted prices in active markets for identical securities |
| ∎ | | Level 2 – other significant observable inputs (including quoted prices for similar securities, interest rates, prepayment speeds, credit risk, etc.) |
| ∎ | | Level 3 – significant unobservable inputs (including the Fund’s own assumptions in determining the fair value of investments) |
| | | | | | |
| Notes to financial statements | | Wells Fargo Diversified International Fund | | | 33 | |
The inputs or methodologies used for valuing investments in securities are not necessarily an indication of the risk associated with investing in those securities.
The following is a summary of the inputs used in valuing the Fund’s assets and liabilities as of October 31, 2018:
| | | | | | | | | | | | | | | | |
| | | Quoted prices
(Level 1) | | | Other significant
observable inputs
(Level 2) | | | Significant
unobservable inputs (Level 3) | | | Total | |
Assets | | | | | | | | | | | | | | | | |
Investments in: | | | | | | | | | | | | | | | | |
| | | | |
Common stocks | | | | | | | | | | | | | | | | |
Australia | | $ | 1,357,443 | | | $ | 0 | | | $ | 0 | | | $ | 1,357,443 | |
Austria | | | 419,988 | | | | 0 | | | | 0 | | | | 419,988 | |
Belgium | | | 661,003 | | | | 0 | | | | 0 | | | | 661,003 | |
Brazil | | | 2,193,541 | | | | 0 | | | | 0 | | | | 2,193,541 | |
Canada | | | 2,791,576 | | | | 0 | | | | 0 | | | | 2,791,576 | |
China | | | 3,285,661 | | | | 0 | | | | 0 | | | | 3,285,661 | |
Denmark | | | 799,423 | | | | 0 | | | | 0 | | | | 799,423 | |
Finland | | | 475,196 | | | | 0 | | | | 0 | | | | 475,196 | |
France | | | 8,668,805 | | | | 0 | | | | 0 | | | | 8,668,805 | |
Germany | | | 15,728,416 | | | | 0 | | | | 0 | | | | 15,728,416 | |
Hong Kong | | | 2,002,929 | | | | 0 | | | | 0 | | | | 2,002,929 | |
Hungary | | | 65,079 | | | | 0 | | | | 0 | | | | 65,079 | |
India | | | 685,185 | | | | 0 | | | | 0 | | | | 685,185 | |
Indonesia | | | 368,337 | | | | 0 | | | | 0 | | | | 368,337 | |
Ireland | | | 2,828,834 | | | | 0 | | | | 0 | | | | 2,828,834 | |
Israel | | | 1,092,101 | | | | 0 | | | | 0 | | | | 1,092,101 | |
Italy | | | 3,802,022 | | | | 0 | | | | 0 | | | | 3,802,022 | |
Japan | | | 13,097,278 | | | | 0 | | | | 0 | | | | 13,097,278 | |
Luxembourg | | | 94,155 | | | | 0 | | | | 0 | | | | 94,155 | |
Malaysia | | | 507,716 | | | | 0 | | | | 0 | | | | 507,716 | |
Netherlands | | | 6,280,232 | | | | 0 | | | | 0 | | | | 6,280,232 | |
Norway | | | 1,110,485 | | | | 0 | | | | 0 | | | | 1,110,485 | |
Russia | | | 1,406,670 | | | | 0 | | | | 0 | | | | 1,406,670 | |
Singapore | | | 1,022,294 | | | | 0 | | | | 0 | | | | 1,022,294 | |
South Africa | | | 755,392 | | | | 0 | | | | 0 | | | | 755,392 | |
South Korea | | | 1,837,977 | | | | 0 | | | | 0 | | | | 1,837,977 | |
Spain | | | 594,192 | | | | 0 | | | | 0 | | | | 594,192 | |
Sweden | | | 505,924 | | | | 0 | | | | 0 | | | | 505,924 | |
Switzerland | | | 6,236,603 | | | | 0 | | | | 0 | | | | 6,236,603 | |
Taiwan | | | 331,698 | | | | 0 | | | | 0 | | | | 331,698 | |
Thailand | | | 326,785 | | | | 0 | | | | 0 | | | | 326,785 | |
United Kingdom | | | 15,263,820 | | | | 0 | | | | 0 | | | | 15,263,820 | |
United States | | | 100,681 | | | | 0 | | | | 0 | | | | 100,681 | |
| | | | |
Preferred stocks | | | | | | | | | | | | | | | | |
Brazil | | | 884,286 | | | | 0 | | | | 0 | | | | 884,286 | |
Germany | | | 521,359 | | | | 0 | | | | 0 | | | | 521,359 | |
| | | | |
Rights | | | | | | | | | | | | | | | | |
Spain | | | 0 | | | | 1,146 | | | | 0 | | | | 1,146 | |
| | | | |
Warrants | | | | | | | | | | | | | | | | |
United Kingdom | | | 0 | | | | 545,705 | | | | 0 | | | | 545,705 | |
| | | | |
Short-term investments | | | | | | | | | | | | | | | | |
Investment companies | | | 2,648,395 | | | | 592,418 | | | | 0 | | | | 3,240,813 | |
| | | 100,751,481 | | | | 1,139,269 | | | | 0 | | | | 101,890,750 | |
Forward foreign currency contracts | | | 0 | | | | 86,025 | | | | 0 | | | | 86,025 | |
Total assets | | $ | 100,751,481 | | | $ | 1,225,294 | | | $ | 0 | | | $ | 101,976,775 | |
| | | | |
| 34 | | Wells Fargo Diversified International Fund | | Notes to financial statements |
Additional sector, industry or geographic detail is included in the Portfolio of Investments.
Forward foreign currency contracts are reported at their cumulative unrealized gains (losses) at measurement date as reported in the table following the Portfolio of investments. All other assets and liabilities are reported at their market value at measurement date.
At October 31, 2018, the Fund did not have any transfers into/out of Level 3.
4. TRANSACTIONS WITH AFFILIATES AND OTHER EXPENSES
Management fee
Funds Management, an indirect wholly owned subsidiary of Wells Fargo, is the manager of the Fund and provides advisory and fund-level administrative services under an investment management agreement. Under the investment management agreement, Funds Management is responsible for, among other services, implementing the investment objectives and strategies of the Fund, supervising the applicable subadvisers and providing fund-level administrative services in connection with the Fund’s operations. As compensation for its services under the investment management agreement, Funds Management is entitled to receive an annual management fee starting at 0.85% and declining to 0.68% as the average daily net assets of the Fund increase. For the year ended October 31, 2018, the management fee was equivalent to an annual rate of 0.85% of the Fund’s average daily net assets.
Funds Management has retained the services of certain subadvisers to provide daily portfolio management to the Fund. The fee for subadvisory services is borne by Funds Management. Artisan Partners Limited Partnership, LSV Asset Management, and WellsCap are the subadvisers to the Fund and are each entitled to receive a fee from Funds Management which is calculated based on the average daily net assets of the Fund as follows. Artisan Partners Limited Partnership and LSV Asset Management are not affiliates of Funds Management.
| | | | | | | | |
| | | Annual subadvisory fee | |
| | | starting at | | | declining to | |
Artisan Partners Limited Partnership | | | 0.80 | % | | | 0.50 | % |
LSV Asset Management | | | 0.35 | | | | 0.30 | |
WellsCap | | | 0.45 | | | | 0.40 | |
Administration fees
Under a class-level administration agreement, Funds Management provides class-level administrative services to the Fund, which includes paying fees and expenses for services provided by the transfer agent, sub-transfer agents, omnibus account servicers and record-keepers. As compensation for its services under the class-level administration agreement, Funds Management receives an annual fee which is calculated based on the average daily net assets of each class as follows:
| | | | |
| | | Class-level
administration fee | |
Class A, Class C, Class R | | | 0.21 | % |
Class R6 | | | 0.03 | |
Administrator Class, Institutional Class | | | 0.13 | |
Funds Management has contractually waived and/or reimbursed management and administration fees to the extent necessary to maintain certain net operating expense ratios for the Fund. When each class of the Fund has exceeded its expense cap, Funds Management has waived fees and/or reimbursed expenses from fund level expenses on a proportionate basis and then from class specific expenses; otherwise, waivers and/or reimbursements are applied against class specific expenses before fund level expenses. Funds Management has committed through February 28, 2019 to waive fees and/or reimburse expenses to the extent necessary to cap the Fund’s expenses at 1.35% for Class A shares, 2.10% for Class C shares, 0.89% for Class R6 shares, 1.25% for Administrator Class shares, and 0.99% for Institutional Class shares. After this time, the cap may be increased or the commitment to maintain the cap may be terminated only with the approval of the Board of Trustees.
Distribution fees
The Trust has adopted a distribution plan for Class C and Class R shares of the Fund pursuant to Rule 12b-1 under the 1940 Act. Distribution fees are charged to Class C and Class R shares and paid to Wells Fargo Funds Distributor, LLC (“Funds Distributor”), the principal underwriter, at an annual rate of 0.75% of the average daily net assets of Class C shares and 0.25% of the average daily net assets of Class R shares.
| | | | | | |
| Notes to financial statements | | Wells Fargo Diversified International Fund | | | 35 | |
In addition, Funds Distributor is entitled to receive the front-end sales charge from the purchase of Class A shares and a contingent deferred sales charge on the redemption of certain Class A shares. Funds Distributor is also entitled to receive the contingent deferred sales charges from redemptions of Class C shares. For the year ended October 31, 2018, Funds Distributor received $667 from the sale of Class A shares. No contingent deferred sales charges were incurred by Class A and Class C shares for the year ended October 31, 2018.
Shareholder servicing fees
The Trust has entered into contracts with one or more shareholder servicing agents, whereby Class A, Class C, Class R, and Administrator Class of the Fund are charged a fee at an annual rate of 0.25% of the average daily net assets of each respective class.
A portion of these total shareholder servicing fees were paid to affiliates of Wells Fargo.
Interfund transactions
The Fund may purchase or sell portfolio investment securities to certain other Wells Fargo affiliates pursuant to Rule 17a-7 under the 1940 Act and under procedures adopted by the Board of Trustees. The procedures have been designed to ensure that these interfund transactions, which do not incur broker commissions, are effected at current market prices.
5. INVESTMENT PORTFOLIO TRANSACTIONS
Purchases and sales of investments, excluding U.S. government obligations (if any) and short-term securities, for the year ended October 31, 2018 were $45,543,938 and $57,146,849, respectively.
6. DERIVATIVE TRANSACTIONS
During the year ended October 31, 2018, the Fund entered into forward foreign currency contracts for economic hedging purposes. The Fund had average contract amounts of $326,735 and $4,585,738 in forward foreign currency contracts to buy and forward foreign currency contracts to sell, respectively, during the year ended October 31, 2018.
The fair value, realized gains or losses and change in unrealized gains or losses, if any, on derivative instruments are reflected in the corresponding financial statement captions.
For certain types of derivative transactions, the Fund has entered into International Swaps and Derivatives Association, Inc. master agreements (“ISDA Master Agreements”) or similar agreements with approved counterparties. The ISDA Master Agreements or similar agreements may have requirements to deliver/deposit securities or cash to/with an exchange or broker-dealer as collateral and allows the Fund to offset, with each counterparty, certain derivative financial instrument’s assets and/or liabilities with collateral held or pledged. Collateral requirements differ by type of derivative. Collateral or margin requirements are set by the broker or exchange clearinghouse for exchange traded derivatives while collateral terms are contract specific for over-the-counter traded derivatives. Cash collateral that has been pledged to cover obligations of the Fund under ISDA Master Agreements or similar agreements, if any, are reported separately in the Statement of Assets and Liabilities. Securities pledged as collateral, if any, are noted in the Portfolio of Investments. With respect to balance sheet offsetting, absent an event of default by the counterparty or a termination of the agreement, the reported amounts of financial assets and financial liabilities in the Statement of Assets and Liabilities are not offset across transactions between the Fund and the applicable counterparty. A reconciliation of the gross amounts on the Statement of Assets and Liabilities to the net amounts by counterparty, including any collateral exposure, is as follows:
| | | | | | | | | | | | | | | | |
| Counterparty | | Gross amounts
of assets in the
Statement of
Assets and
Liabilities | | | Amounts
subject to
netting
agreements | | | Collateral
received | | | Net amount
of assets | |
Goldman Sachs | | $ | 60,861 | | | $ | 0 | | | $ | 0 | | | $ | 60,861 | |
Morgan Stanley | | | 25,164 | | | | 0 | | | | 0 | | | | 25,164 | |
7. BANK BORROWINGS
The Trust (excluding the money market funds), Wells Fargo Master Trust and Wells Fargo Variable Trust are parties to a $280,000,000 revolving credit agreement whereby the Fund is permitted to use bank borrowings for temporary or emergency purposes, such as to fund shareholder redemption requests. Interest under the credit agreement is charged to the Fund based on a borrowing rate equal to the higher of the Federal Funds rate in effect on that day plus 1.25% or the overnight LIBOR rate in effect on that day plus 1.25%. In addition, an annual commitment fee equal to 0.25% of the unused balance is allocated to each participating fund.
| | | | |
| 36 | | Wells Fargo Diversified International Fund | | Notes to financial statements |
For the year ended October 31, 2018, there were no borrowings by the Fund under the agreement.
8. DISTRIBUTIONS TO SHAREHOLDERS
The tax character of distributions paid was $3,149,016 and $2,170,331 of ordinary income for the years ended October 31, 2018 and October 31, 2017, respectively.
As of October 31, 2018, the components of distributable earnings on a tax basis were as follows:
| | | | |
Undistributed
ordinary
income | | Unrealized
gains | | Capital loss
carryforward |
$2,254,899 | | $4,571,093 | | $(6,769,927) |
Effective for all filings after November 4, 2018, the Securities and Exchange Commission eliminated the requirement to separately state the components of distributions to shareholders. The amounts of distributions to shareholders for the year ended October 31, 2017 were as follows:
| | | | |
| | | Net investment
income | |
Class A | | | $1,161,061 | |
Class C | | | 54,176 | |
Class R | | | 434 | |
Class R6 | | | 131,270 | |
Administrator Class | | | 197,876 | |
Institutional Class | | | 625,514 | |
9. CONCENTRATION RISK
Concentration risk result from exposure to a limited number of sectors. A fund that invests a substantial portion of its assets in any sector may be more affected by changes in that sector than would be a fund whose investments are not heavily weighted in any sector.
10. INDEMNIFICATION
Under the Trust’s organizational documents, the officers and Trustees have been granted certain indemnification rights against certain liabilities that may arise out of performance of their duties to the Trust. Additionally, in the normal course of business, the Trust may enter into contracts with service providers that contain a variety of indemnification clauses. The Trust’s maximum exposure under these arrangements is dependent on future claims that may be made against the Fund and, therefore, cannot be estimated.
11. NEW ACCOUNTING PRONOUNCEMENT
In August 2018, FASB issued Accounting Standards Update (“ASU”) No. 2018-13, Fair Value Measurement (Topic 820) Disclosure Framework—Changes to the Disclosure Requirements for Fair Value Measurement. ASU 2018-13 updates the disclosure requirements for fair value measurements by modifying or removing certain disclosures and adding certain new disclosures. The amendments are effective for fiscal years, and interim periods within those fiscal years, beginning after December 15, 2019. Early adoption is permitted. Management has adopted the removal and modification of disclosures early, as permitted, and will adopt the additional new disclosures at the effective date.
| | | | | | |
| Report of independent registered public accounting firm | | Wells Fargo Diversified International Fund | | | 37 | |
BOARD OF TRUSTEES AND SHAREHOLDERS OF WELLS FARGO FUNDS TRUST:
Opinion on the Financial Statements
We have audited the accompanying statement of assets and liabilities of Wells Fargo Diversified International Fund (the “Fund”), one of the funds constituting Wells Fargo Funds Trust, including the portfolio of investments, as of October 31, 2018, the related statement of operations for the year then ended, the statements of changes in net assets for each of the years in the two-year period then ended, and the related notes (collectively, the “financial statements”) and the financial highlights for each of the years or periods in the five-year period then ended. In our opinion, the financial statements and financial highlights present fairly, in all material respects, the financial position of the Fund as of October 31, 2018, the results of its operations for the year then ended, the changes in its net assets for each of the years in the two-year period then ended, and the financial highlights for each of the years or periods in the five-year period then ended, in conformity with U.S. generally accepted accounting principles.
Basis for Opinion
These financial statements and financial highlights are the responsibility of the Fund’s management. Our responsibility is to express an opinion on these financial statements and financial highlights based on our audits. We are a public accounting firm registered with the Public Company Accounting Oversight Board (United States) (“PCAOB”) and are required to be independent with respect to the Fund in accordance with the U.S. federal securities laws and the applicable rules and regulations of the Securities and Exchange Commission and the PCAOB.
We conducted our audits in accordance with the standards of the PCAOB. Those standards require that we plan and perform the audit to obtain reasonable assurance about whether the financial statements and financial highlights are free of material misstatement, whether due to error or fraud. Our audits included performing procedures to assess the risks of material misstatement of the financial statements and financial highlights, whether due to error or fraud, and performing procedures that respond to those risks. Such procedures included examining, on a test basis, evidence regarding the amounts and disclosures in the financial statements and financial highlights. Such procedures also included confirmation of securities owned as of October 31, 2018, by correspondence with the custodian and brokers, or by other appropriate auditing procedures. Our audits also included evaluating the accounting principles used and significant estimates made by management, as well as evaluating the overall presentation of the financial statements and financial highlights. We believe that our audits provide a reasonable basis for our opinion.

We have not been able to determine the specific year that we began serving as the auditor of one or more Wells Fargo Funds investment companies, however we are aware that we have served as the auditor of one or more Wells Fargo Funds investment companies since at least 1955.
Boston, Massachusetts
December 21, 2018
| | | | |
| 38 | | Wells Fargo Diversified International Fund | | Other information (unaudited) |
TAX INFORMATION
For corporate shareholders, pursuant to Section 854 of the Internal Revenue Code, 2.17% of ordinary income dividends qualify for the corporate dividends-received deduction for the fiscal year ended October 31, 2018.
Pursuant to Section 854 of the Internal Revenue Code, $3,149,016 of income dividends paid during the fiscal year ended October 31, 2018 has been designated as qualified dividend income (QDI).
Pursuant to Section 853 of the Internal Revenue Code, the Fund expects to designate amounts as foreign taxes paid for the fiscal year ended October 31, 2018. Additional details will be available in the semiannual report.
PROXY VOTING INFORMATION
A description of the policies and procedures that the Fund uses to determine how to vote proxies relating to portfolio securities is available, upon request, by calling 1-800-222-8222, visiting our website at wellsfargofunds.com, or visiting the SEC website at sec.gov. Information regarding how the Fund voted proxies relating to portfolio securities during the most recent 12-month period ended June 30 is available on the Fund’s website at wellsfargofunds.com or by visiting the SEC website at sec.gov.
PORTFOLIO HOLDINGS INFORMATION
The complete portfolio holdings for the Fund are publicly available monthly on the Fund’s website (wellsfargofunds.com), on a one-month delayed basis. In addition, top ten holdings information (excluding derivative positions) for the Fund is publicly available on the Fund’s website on a monthly, seven-day or more delayed basis. The Fund files its complete schedule of portfolio holdings with the SEC for the first and third quarters of each fiscal year on Form N-Q, which is available by visiting the SEC website at sec.gov. In addition, the Fund’s Form N-Q may be reviewed and copied at the SEC’s Public Reference Room in Washington, DC, and at regional offices in New York City, at 233 Broadway, and in Chicago, at 175 West Jackson Boulevard, Suite 900. Information about the Public Reference Room may be obtained by calling 1-800-SEC-0330.
| | | | | | |
| Other information (unaudited) | | Wells Fargo Diversified International Fund | | | 39 | |
BOARD OF TRUSTEES AND OFFICERS
Each of the Trustees and Officers1 listed in the table below acts in identical capacities for each fund in the Wells Fargo family of funds, which consists of 152 mutual funds comprising the Wells Fargo Funds Trust, Wells Fargo Variable Trust, Wells Fargo Master Trust and four closed-end funds (collectively the “Fund Complex”). This table should be read in conjunction with the Prospectus and the Statement of Additional Information2. The mailing address of each Trustee and Officer is 525 Market Street, 12th Floor, San Francisco, CA 94105. Each Trustee and Officer serves an indefinite term, however, each Trustee serves such term until reaching the mandatory retirement age established by the Trustees.
Independent Trustees
| | | | | | |
Name and
year of birth | | Position held and
length of service* | | Principal occupations during past five years or longer | | Current other
public company or
investment company
directorships |
William R. Ebsworth (Born 1957) | | Trustee, since 2015 | | Retired. From 1984 to 2013, equities analyst, portfolio manager, research director and chief investment officer at Fidelity Management and Research Company in Boston, Tokyo, and Hong Kong, and retired in 2013 as Chief Investment Officer of Fidelity Strategic Advisers, Inc. where he led a team of investment professionals managing client assets. Prior thereto, Board member of Hong Kong Securities Clearing Co., Hong Kong Options Clearing Corp., the Thailand International Fund, Ltd., Fidelity Investments Life Insurance Company, and Empire Fidelity Investments Life Insurance Company. Board member of the Vincent Memorial Hospital Endowment (non-profit organization), where he serves on the Investment Committee and as a Chair of the Audit Committee. Mr. Ebsworth is a CFA® charterholder. | | N/A |
Jane A. Freeman (Born 1953) | | Trustee, since 2015; Chair Liaison, since 2018 | | Retired. From 2012 to 2014 and 1999 to 2008, Chief Financial Officer of Scientific Learning Corporation. From 2008 to 2012, Ms. Freeman provided consulting services related to strategic business projects. Prior to 1999, Portfolio Manager at Rockefeller & Co. and Scudder, Stevens & Clark. Board member of the Harding Loevner Funds from 1996 to 2014, serving as both Lead Independent Director and chair of the Audit Committee. Board member of the Russell Exchange Traded Funds Trust from 2011 to 2012 and the chair of the Audit Committee. Ms. Freeman is a Board Member of The Ruth Bancroft Garden (non-profit organization). She is also an inactive Chartered Financial Analyst. | | N/A |
Isaiah Harris, Jr.3 (Born 1952) | | Trustee, since 2009 | | Retired. Chairman of the Board of CIGNA Corporation since 2009, and Director since 2005. From 2003 to 2011, Director of Deluxe Corporation. Prior thereto, President and CEO of BellSouth Advertising and Publishing Corp. from 2005 to 2007, President and CEO of BellSouth Enterprises from 2004 to 2005 and President of BellSouth Consumer Services from 2000 to 2003. Emeritus member of the Iowa State University Foundation Board of Governors. Emeritus Member of the Advisory Board of Iowa State University School of Business. Advisory Board Member, Palm Harbor Academy (private school). Advisory Board Member, Child Evangelism Fellowship (non-profit). Mr. Harris is a certified public accountant (inactive status). | | CIGNA Corporation |
Judith M. Johnson3 (Born 1949) | | Trustee, since 2008; Audit Committee Chairman, since 2009 | | Retired. Prior thereto, Chief Executive Officer and Chief Investment Officer of Minneapolis Employees Retirement Fund from 1996 to 2008. Ms. Johnson is an attorney, certified public accountant and a certified managerial accountant. | | N/A |
David F. Larcker (Born 1950) | | Trustee, since 2009 | | James Irvin Miller Professor of Accounting at the Graduate School of Business, Stanford University, Director of the Corporate Governance Research Initiative and Senior Faculty of The Rock Center for Corporate Governance since 2006. From 2005 to 2008, Professor of Accounting at the Graduate School of Business, Stanford University. Prior thereto, Ernst & Young Professor of Accounting at The Wharton School, University of Pennsylvania from 1985 to 2005. | | N/A |
| | | | |
| 40 | | Wells Fargo Diversified International Fund | | Other information (unaudited) |
| | | | | | |
Name and
year of birth | | Position held and
length of service* | | Principal occupations during past five years or longer | | Current other
public company or
investment company
directorships |
Olivia S. Mitchell (Born 1953) | | Trustee, since 2006; Nominating and Governance Committee Chairman, since 2018 | | International Foundation of Employee Benefit Plans Professor, Wharton School of the University of Pennsylvania since 1993. Director of Wharton’s Pension Research Council and Boettner Center on Pensions & Retirement Research, and Research Associate at the National Bureau of Economic Research. Previously, Cornell University Professor from 1978 to 1993. | | N/A |
Timothy J. Penny (Born 1951) | | Trustee, since 1996; Chairman, since 2018; Vice Chairman, from 2017 to 2018 | | President and Chief Executive Officer of Southern Minnesota Initiative Foundation, a non-profit organization, since 2007. Member of the Board of Trustees of NorthStar Education Finance, Inc., a non-profit organization, since 2007. | | N/A |
James G. Polisson (Born 1959) | | Trustee, since 2018; Advisory Board Member, from 2017 to 2018 | | Retired. Chief Marketing Officer, Source (ETF) UK Services, Ltd, from 2015 to 2017. From 2012 to 2015, Principal of The Polisson Group, LLC, a management consulting, corporate advisory and principal investing company. Chief Executive Officer and Managing Director at Russell Investments, Global Exchange Traded Funds from 2010 to 2012. Managing Director of Barclays Global Investors from 1998 to 2010 and Global Chief Marketing Officer for iShares and Barclays Global Investors from 2000 to 2010. Trustee of the San Francisco Mechanics’ Institute, a non-profit organization, from 2013 to 2015. Board member of the Russell Exchange Traded Fund Trust from 2011 to 2012. Director of Barclays Global Investors Holdings Deutschland GmbH from 2006 to 2009. Mr. Polisson is an attorney and has a retired status with the Massachusetts and District of Columbia Bar Associations. | | N/A |
Michael S. Scofield4 (Born 1943) | | Trustee, since 2010 | | Served on the Investment Company Institute’s Board of Governors and Executive Committee from 2008-2011 as well the Governing Council of the Independent Directors Council from 2006-2011 and the Independent Directors Council Executive Committee from 2008-2011. Trustee of the Evergreen Fund complex (and its predecessors) from 1984 to 2010. Chairman of the Evergreen Funds from 2000-2010. Former Trustee of the Mentor Funds. Retired Attorney, Law Offices of Michael S. Scofield. | | N/A |
Pamela Wheelock (Born 1959) | | Trustee, since 2018; Advisory Board Member, from 2017 to 2018 | | Chief Operating Officer, Twin Cities Habitat for Humanity, since January, 2017. Vice President of University Services, University of Minnesota from 2012 to 2017. Prior thereto, on the Board of Directors, Governance Committee and Finance Committee for the Minnesota Philanthropy Partners (Saint Paul Foundation) from 2012 to 2018, Interim President and Chief Executive Officer of Blue Cross Blue Shield of Minnesota from 2010 to 2011, Chairman of the Board from 2009 to 2011 and Board Director from 2003 to 2015. Vice President, Leadership and Community Engagement, Bush Foundation, Saint Paul, Minnesota (a private foundation) from 2009 to 2011. Executive Vice President and Chief Financial Officer, Minnesota Sports and Entertainment from 2004 to 2009 and Senior Vice President from 2002 to 2004. Commissioner of Finance, State of Minnesota, from 1999 to 2002. Currently the Board Chair of the Minnesota Wild Foundation since 2010. | | N/A |
| * | Length of service dates reflect the Trustee’s commencement of service with the Trust’s predecessor entities, where applicable. |
| | | | | | |
| Other information (unaudited) | | Wells Fargo Diversified International Fund | | | 41 | |
Officers
| | | | | | |
Name and year of birth | | Position held and
length of service | | Principal occupations during past five years or longer | | |
Andrew Owen (Born 1960) | | President, since 2017 | | Executive Vice President of Wells Fargo & Company and Head of Affiliated Managers, Wells Fargo Asset Management, since 2014. In addition, Mr. Owen is currently President, Chief Executive Officer and Director of Wells Fargo Funds Management, LLC since 2017. Prior thereto, Executive Vice President responsible for marketing, investments and product development for Wells Fargo Funds Management, LLC, from 2009 to 2014. | | |
Jeremy DePalma1 (Born 1974) | | Treasurer, since 2012 | | Senior Vice President of Wells Fargo Funds Management, LLC since 2009. Senior Vice President of Evergreen Investment Management Company, LLC from 2008 to 2010 and head of the Fund Reporting and Control Team within Fund Administration from 2005 to 2010. | | |
Alexander Kymn (Born 1973) | | Secretary, since 2018; Chief Legal Officer, since 2018 | | Senior Company Counsel of Wells Fargo Bank, N.A. since 2018 (previously Senior Counsel from 2007 to 2018). Vice President of Wells Fargo Funds Management, LLC from 2008 to 2014. | | |
Michael H. Whitaker (Born 1967) | | Chief Compliance Officer, since 2016 | | Senior Vice President and Chief Compliance Officer since 2016. Senior Vice President and Chief Compliance Officer for Fidelity Investments from 2007 to 2016. | | |
David Berardi (Born 1975) | | Assistant Treasurer, since 2009 | | Vice President of Wells Fargo Funds Management, LLC since 2009. Vice President of Evergreen Investment Management Company, LLC from 2008 to 2010. Manager of Fund Reporting and Control for Evergreen Investment Management Company, LLC from 2004 to 2010. | | |
| 1 | Jeremy DePalma acts as Treasurer of 76 funds and Assistant Treasurer of 76 funds in the Fund Complex. |
| 2 | The Statement of Additional Information includes additional information about the Trustees and is available, without charge, upon request, by calling 1-800-222-8222 or by visiting the website at wellsfargofunds.com. |
| 3 | Mr. Harris will replace Ms. Johnson as the Chairman of the Audit Committee effective January 1, 2019. |
| 4 | Mr. Scofield is expected to retire on December 31, 2018. |
| | | | |
| 42 | | Wells Fargo Diversified International Fund | | Other information (unaudited) |
BOARD CONSIDERATION OF INVESTMENT MANAGEMENT AND SUB-ADVISORY AGREEMENTS:
Wells Fargo Diversified International Fund
Under the Investment Company Act of 1940 (the “1940 Act”), the Board of Trustees (the “Board”) of Wells Fargo Funds Trust (the “Trust”) must determine annually whether to approve the continuation of the Trust’s investment management and sub-advisory agreements. In this regard, at an in-person meeting held on May 22-23, 2018 (the “Meeting”), the Board, all the members of which have no direct or indirect interest in the investment management and sub-advisory agreements and are not “interested persons” of the Trust, as defined in the 1940 Act (the “Independent Trustees”), reviewed and approved for Wells Fargo Diversified International Fund (the “Fund”): (i) an investment management agreement (the “Management Agreement”) with Wells Fargo Funds Management, LLC (“Funds Management”); (ii) an investment sub-advisory agreement with Wells Capital Management Incorporated (“WellsCap”), an affiliate of Funds Management; (iii) an investment sub-advisory agreement with Artisan Partners Limited Partnership (“Artisan”); and (iv) an investment sub-advisory agreement with LSV Asset Management (“LSV”). The sub-advisory agreements with WellsCap, Artisan and LSV (the “Sub-Advisers”) are collectively referred to as the “Sub-Advisory Agreements,” and the Management Agreement and the Sub-Advisory Agreements are collectively referred to as the “Advisory Agreements.”
At the Meeting, the Board considered the factors and reached the conclusions described below relating to the selection of Funds Management and the Sub-Advisers and the approval of the Advisory Agreements. Prior to the Meeting, including at an in-person meeting in April 2018, the Trustees conferred extensively among themselves and with representatives of Funds Management about these matters. Also, the Board has adopted a team-based approach, with each team consisting of a sub-set of Trustees, to assist the full Board in the discharge of its duties in reviewing investment performance and other matters throughout the year. The Independent Trustees were assisted in their evaluation of the Advisory Agreements by independent legal counsel, from whom they received separate legal advice and with whom they met separately.
In providing information to the Board, Funds Management and the Sub-Advisers were guided by a detailed set of requests for information submitted to them by independent legal counsel on behalf of the Independent Trustees at the start of the Board’s annual contract renewal process earlier in 2018. In considering and approving the Advisory Agreements, the Trustees considered the information they believed relevant, including but not limited to the information discussed below. The Board considered not only the specific information presented in connection with the Meeting, but also the knowledge gained over time through interaction with Funds Management and the Sub-Advisers about various topics. In this regard, the Board reviewed reports of Funds Management at each of its quarterly meetings, which included, among other things, portfolio reviews and investment performance reports. In addition, the Board and the teams mentioned above confer with portfolio managers at various times throughout the year. The Board did not identify any particular information or consideration that was all-important or controlling, and each individual Trustee may have attributed different weights to various factors.
After its deliberations, the Board unanimously approved the continuation of the Advisory Agreements for a one-year term and determined that the compensation payable to Funds Management and the Sub-Advisers under each of the Advisory Agreements was reasonable. The Board considered the approval of the Advisory Agreements for the Fund as part of its consideration of agreements for funds across the complex, but its approvals were made on a fund-by-fund basis. The following summarizes a number of important, but not necessarily all, factors considered by the Board in support of its approvals.
Nature, extent and quality of services
The Board received and considered various information regarding the nature, extent and quality of services provided to the Fund by Funds Management and the Sub-Advisers under the Advisory Agreements. This information included a description of the investment advisory services and Fund-level administrative services covered by the Management Agreement, as well as, among other things, a summary of the background and experience of senior management of Wells Fargo Asset Management (“WFAM”), of which Funds Management and WellsCap are a part, a summary of investments made in the business of WFAM, a summary of certain organizational and personnel changes involving Funds Management, and a description of Funds Management’s and the Sub-Advisers’ business continuity planning programs and of their approaches to data privacy and cybersecurity. The Board also considered the qualifications, background, tenure and responsibilities of each of the portfolio managers primarily responsible for the day-to-day portfolio management of the Fund.
| | | | | | |
| Other information (unaudited) | | Wells Fargo Diversified International Fund | | | 43 | |
The Board evaluated the ability of Funds Management and the Sub-Advisers to attract and retain qualified investment professionals, including research, advisory and supervisory personnel. The Board further considered the compliance programs and compliance records of Funds Management and the Sub-Advisers. In addition, the Board took into account the full range of services provided to the Fund by Funds Management and its affiliates.
Fund investment performance and expenses
The Board considered the investment performance results for the Fund over various time periods ended December 31, 2017. The Board considered these results in comparison to the investment performance of funds in a universe that was determined by Broadridge Inc. (“Broadridge”) to be similar to the Fund (the “Universe”), and in comparison to the Fund’s benchmark index and to other comparative data. Broadridge is an independent provider of investment company data. The Board received a description of the methodology used by Broadridge to select the mutual funds in the performance Universe. The Board noted that the investment performance of the Fund (Administrator Class) was higher than or in range of the average investment performance of the Universe for all periods under review except the three-year period. The Board also noted that the investment performance of the Fund was higher than or in range of its benchmark index, the MSCI EAFE Index (Net), for all periods under review except the three-year period.
The Board received information concerning, and discussed factors contributing to, the underperformance of the Fund relative to the Universe and benchmark for the three-year period under review. The Board took note of the explanations for the relative underperformance during this period, including with respect to investment decisions and market factors that affected the Fund’s investment performance.
The Board also received and considered information regarding the Fund’s net operating expense ratios and their various components, including actual management fees, custodian and other non-management fees, and Rule 12b-1 and non-Rule 12b-1 shareholder service fees. The Board considered these ratios in comparison to the median ratios of funds in class-specific expense groups that were determined by Broadridge to be similar to the Fund (the “Groups”). The Board received a description of the methodology used by Broadridge to select the mutual funds in the expense Groups and an explanation of how funds comprising expense groups and their expense ratios may vary from year-to-year. Based on the Broadridge reports, the Board noted that the net operating expense ratios of the Fund were equal to or in range of the median net operating expense ratios of the expense Groups for all share classes.
The Board took into account the Fund’s investment performance and expense information provided to it among the factors considered in deciding to re-approve the Advisory Agreements.
Investment management and sub-advisory fee rates
The Board reviewed and considered the contractual fee rates payable by the Fund to Funds Management under the Management Agreement, as well as the contractual fee rates payable by the Fund to Funds Management for class-level administrative services under a Class-Level Administration Agreement, which include, among other things, class-level transfer agency and sub-transfer agency costs (collectively, the “Management Rates”). The Board also reviewed and considered the contractual investment sub-advisory fee rates that are payable by Funds Management to each of the Sub-Advisers for investment sub-advisory services.
Among other information reviewed by the Board was a comparison of the Fund’s Management Rates with the average contractual investment management fee rates of funds in the expense Groups at a common asset level as well as transfer agency costs of the other funds in the expense Groups. The Board noted that the Management Rates of the Fund were higher than the sum of these average rates for the Fund’s expense Groups for all share classes except Class A. However, the Board noted that the net operating expense ratios of the Fund were equal to or in range of the median net operating expense ratios of the expense Groups for all share classes.
The Board also received and considered information about the portion of the total management fee that was retained by Funds Management after payment of the fee to the Sub-Advisers for sub-advisory services. The Board considered this amount in comparison to the median amount retained by advisers to funds in a sub-advised expense universe that was determined by Broadridge to be similar to the Fund. In assessing the reasonableness of this amount, the Board received and evaluated information about the nature and extent of responsibilities retained and risks assumed by Funds Management and not delegated to or assumed by the Sub-Advisers, and about Funds Management’s on-going oversight services. Given the affiliation between Funds Management and WellsCap, the Board ascribed limited relevance to the allocation of fees between them. The Board also considered that the sub-advisory fees paid to Artisan and LSV had been negotiated by Funds Management on an arm’s length basis.
| | | | |
| 44 | | Wells Fargo Diversified International Fund | | Other information (unaudited) |
The Board also received and considered information about the nature and extent of services offered and fee rates charged by Funds Management and the Sub-Advisers to other types of clients with investment strategies similar to those of the Fund. In this regard, the Board received information about the significantly greater scope of services, and compliance, reporting and other legal burdens and risks of managing mutual funds compared with those associated with managing assets of non-mutual fund clients such as collective funds or institutional separate accounts.
Based on its consideration of the factors and information it deemed relevant, including those described here, the Board determined that the compensation payable to Funds Management under the Management Agreement and to the Sub-Advisers under the Sub-Advisory Agreements was reasonable.
Profitability
The Board received and considered information concerning the profitability of Funds Management, as well as the profitability of both WFAM and Wells Fargo & Co. (“Wells Fargo”) as a whole, from providing services to the Fund and the fund family as a whole. The Board noted that WellsCap’s profitability information with respect to providing services to the Fund was subsumed in the WFAM and Wells Fargo profitability analysis. The Board did not consider profitability with respect to Artisan or LSV, as the sub-advisory fees paid to the Artisan and LSV had been negotiated by Funds Management on an arm’s-length basis.
Funds Management reported on the methodologies and estimates used in calculating profitability, including a description of the methodology used to allocate certain expenses and recent enhancements made to the methodology. Among other things, the Board noted that the levels of profitability reported on a fund-by-fund basis varied widely, depending on factors such as the size and type of fund. Based on its review, the Board did not deem the profits reported by Funds Management, WFAM or Wells Fargo from services provided to the Fund to be at a level that would prevent it from approving the continuation of the Advisory Agreements.
Economies of scale
The Board considered the extent to which Funds Management may experience economies of scale in the provision of management services, and the extent to which scale benefits, if any, would be shared with shareholders. In particular, the Board noted the existence of breakpoints in the Fund’s management fee structure, which operate generally to reduce the Fund’s expense ratios as the Fund grows in size. It considered that, for a small fund or a fund that shrinks in size, breakpoints conversely can result in higher fee levels. The Board also considered that in addition to management fee breakpoints, competitive management fee rates set at the outset without regard to breakpoints and fee waiver and expense reimbursement arrangements, as well as investments in the business intended to enhance services available to Fund shareholders, are means of sharing potential economies of scale with shareholders of the Fund.
The Board concluded that the Fund’s fee and expense arrangements, including contractual breakpoints, constituted a reasonable approach to sharing potential economies of scale with the Fund and its shareholders.
Other benefits to Funds Management and the Sub-Advisers
The Board received and considered information regarding potential “fall-out” or ancillary benefits received by Funds Management and its affiliates including WellsCap, and Artisan and LSV, as a result of their relationships with the Fund. Ancillary benefits could include, among others, benefits directly attributable to other relationships with the Fund and benefits potentially derived from an increase in Funds Management’s and the Sub-Advisers’ business as a result of their relationships with the Fund. The Board noted that various affiliates of Funds Management may receive distribution-related fees, shareholder servicing payments and sub-transfer agency fees in respect of shares sold or held through them and services provided.
The Board also reviewed information about soft dollar credits earned and utilized by WellsCap and Artisan, fees earned by Funds Management and WellsCap from managing a private investment vehicle for the fund family’s securities lending collateral and commissions earned by an affiliated broker from portfolio transactions.
Based on its consideration of the factors and information it deemed relevant, including those described here, the Board did not find that any ancillary benefits received by Funds Management and its affiliates, including WellsCap, or either Artisan or LSV were unreasonable.
Conclusion
At the Meeting, after considering the above-described factors and based on its deliberations and its evaluation of the information described above, the Board unanimously approved the continuation of the Advisory Agreements for a one-year term and determined that the compensation payable to Funds Management and the Sub-Advisers under each of the Advisory Agreements was reasonable.
| | | | | | |
| Appendix A (unaudited) | | Wells Fargo Diversified International Fund | | | 45 | |
SALES CHARGE REDUCTIONS AND WAIVERS FOR CERTAIN INTERMEDIARIES
Raymond James & Associates, Inc., Raymond James Financial Services & Raymond James affiliates (“Raymond James”)
Effective on or about March 1, 2019, shareholders purchasing Fund shares through a Raymond James platform or account will be eligible only for the following load waivers (front-end sales charge waivers and contingent deferred, or back-end, sales charge waivers) and discounts, which may differ from those disclosed elsewhere in the Fund’s Prospectus or SAI.
Front-end Sales Load Waivers on Class A shares Available at Raymond James
| | • | | Shares purchased in an investment advisory program. |
| | • | | Shares purchased through reinvestment of capital gains distributions and dividend reinvestment when purchasing shares of the same fund (but not any other fund within the fund family). |
| | • | | Employees and registered representatives of Raymond James or its affiliates and their family members as designated by Raymond James. |
| | • | | Shares purchased from the proceeds of redemptions within the same fund family, provided (1) the repurchase occurs within 90 days following the redemption, (2) the redemption and purchase occur in the same account, and (3) redeemed shares were subject to a front-end or deferred sales load (known as Rights of Reinstatement). |
| | • | | A shareholder in the fund’s Class C shares will have their shares automatically exchanged at net asset value to Class A shares (or the appropriate share class) of the fund if the shares are no longer subject to a CDSC and the exchange is in line with the policies and procedures of Raymond James. |
CDSC Waivers on Class A and C Shares Available at Raymond James
| | • | | Death or disability of the shareholder. |
| | • | | Shares sold as part of a systematic withdrawal plan as described in the Fund’s Prospectus. |
| | • | | Return of excess contributions from an IRA Account. |
| | • | | Shares sold as part of a required minimum distribution for IRA and retirement accounts due to the shareholder reaching age 70½ as described in the Fund’s prospectus. |
| | • | | Shares sold to pay Raymond James fees but only if the transaction is initiated by Raymond James. |
| | • | | Shares acquired through a right of reinstatement. |
Front-end Load Discounts Available at Raymond James: Breakpoints, and/or Rights of Accumulation
| | • | | Breakpoints as described in the Fund’s Prospectus. |
| | • | | Rights of accumulation which entitle shareholders to breakpoint discounts will be automatically calculated based on the aggregated holding of fund family assets held by accounts within the purchaser’s household at Raymond James. Eligible fund family assets not held at Raymond James may be included in the rights of accumulation calculation only if the shareholder notifies his or her financial advisor about such assets. |

For more information
More information about Wells Fargo Funds is available free upon request. To obtain literature, please write, visit the Fund’s website, or call:
Wells Fargo Funds
P.O. Box 219967
Kansas City, MO 64121-9967
Website: wellsfargofunds.com
Individual investors: 1-800-222-8222
Retail investment professionals: 1-888-877-9275
Institutional investment professionals: 1-866-765-0778
This report and the financial statements contained herein are submitted for the general information of the shareholders of the Fund. If this report is used for promotional purposes, distribution of the report must be accompanied or preceded by a current prospectus. Before investing, please consider the investment objectives, risks, charges, and expenses of the investment. For a current prospectus and, if available, a summary prospectus, containing this information, call 1-800-222-8222 or visit the Fund’s website at wellsfargofunds.com. Read the prospectus carefully before you invest or send money.
Wells Fargo Asset Management (WFAM) is the trade name for certain investment advisory/management firms owned by Wells Fargo & Company. These firms include but are not limited to Wells Capital Management Incorporated and Wells Fargo Funds Management, LLC. Certain products managed by WFAM entities are distributed by Wells Fargo Funds Distributor, LLC (a broker/dealer and Member FINRA).
This material is for general informational and educational purposes only and is NOT intended to provide investment advice or a recommendation of any kind—including a recommendation for any specific investment, strategy, or plan.
NOT FDIC INSURED ◾ NO BANK GUARANTEE ◾ MAY LOSE VALUE
© 2018 Wells Fargo Funds Management, LLC. All rights reserved.
| | |
 | | 318243 12-18 A237/AR237 10-18 |
Annual Report
October 31, 2018

Wells Fargo Emerging Markets Equity Fund

Beginning on January 1, 2021, as permitted by new regulations adopted by the Securities and Exchange Commission, paper copies of the Fund’s annual and semi-annual shareholder reports will no longer be sent by mail, unless you specifically request paper copies of the reports. Instead, the reports will be made available on the Fund’s website, and you will be notified by mail each time a report is posted and provided with a website address to access the report.
If you already elected to receive shareholder reports electronically, you will not be affected by this change and you need not take any action. You may elect to receive shareholder reports and other communications from the Fund electronically at any time by contacting your financial intermediary (such as a broker-dealer or bank) or, if you are a direct investor, by calling 1-800-222-8222 or by enrolling at wellsfargo.com/advantagedelivery.
You may elect to receive all future reports in paper free of charge. If you invest through a financial intermediary, you can contact your financial intermediary to request that you continue to receive paper copies of your shareholder reports; if you invest directly with the Fund, you can call 1-800-222-8222. Your election to receive reports in paper will apply to all Wells Fargo Funds held in your account with your financial intermediary or, if you are a direct investor, to all Wells Fargo Funds that you hold.

Reduce clutter. Save trees.
Sign up for electronic delivery of prospectuses and shareholder reports at wellsfargo.com/advantagedelivery
Contents
The views expressed and any forward-looking statements are as of October 31, 2018, unless otherwise noted, and are those of the Fund managers and/or Wells Fargo Funds Management, LLC. Discussions of individual securities, or the markets generally, or any Wells Fargo Fund are not intended as individual recommendations. Future events or results may vary significantly from those expressed in any forward-looking statements. The views expressed are subject to change at any time in response to changing circumstances in the market. Wells Fargo Funds Management, LLC and the Fund disclaim any obligation to publicly update or revise any views expressed or forward-looking statements.
NOT FDIC INSURED ◾ NO BANK GUARANTEE ◾ MAY LOSE VALUE
| | | | |
| 2 | | Wells Fargo Emerging Markets Equity Fund | | Letter to shareholders (unaudited) |

Andrew Owen
President
Wells Fargo Funds
The early months of the reporting period were characterized by strong performance for equity and fixed-income markets. The remainder of the reporting period generated economic, business, and investing data that were decidedly more mixed and volatile relative to the prior year.
Dear Shareholder:
We are pleased to offer you this annual report for the Wells Fargo Emerging Markets Equity Fund for the 12-month period that ended October 31, 2018. The early months of the reporting period were characterized by strong performance for equity and fixed-income markets. The remainder of the reporting period generated economic, business, and investing data that were decidedly more mixed and volatile relative to the prior year.
For the period, U.S. stocks, as measured by the S&P 500 Index,1 gained 7.35% and international stocks, as measured by the MSCI ACWI ex USA Index (Net),2 declined 8.24%. Based on the MSCI EM Index (Net),3 emerging market stocks lost 12.52%. For bond investors, the Bloomberg Barclays U.S. Aggregate Bond Index4 declined 2.05% while the Bloomberg Barclays Global Aggregate ex-USD Index5 fell 2.09%. The Bloomberg Barclays Municipal Bond Index6 dropped 0.51%, and the ICE BofAML U.S. High Yield Index7 was up 0.86%.
Optimism continued to shape markets as 2017 closed and 2018 opened.
Economic conditions in late 2017 were characterized by synchronized global growth, low inflation, healthy corporate earnings, growing consumer confidence, declining unemployment, and a weaker U.S. dollar that supported international growth. The U.S. Bureau of Economic Analysis reported that U.S. gross domestic product (GDP) growth on an annualized basis for the fourth quarter of 2017 was 2.9% and inflation remained below U.S. Federal Reserve (Fed) targets.
Economic momentum continued in Europe. The Bank of England (BOE) raised interest rates in November 2017 to 0.50%, the first increase in more than 10 years, indicating confidence in the economy’s growth potential. Meanwhile, the European Central Bank (ECB) and the Bank of Japan (BOJ) kept interest rates low to spur business activities and bought bonds in an effort to encourage equity investments. The People’s Bank of China (PBOC) also sought to stimulate economic growth. Many emerging market economies benefited from stronger currencies versus the U.S. dollar, while commodity price increases benefited countries that rely on natural resources for exports.
| 1 | The S&P 500 Index consists of 500 stocks chosen for market size, liquidity, and industry group representation. It is a market-value-weighted index with each stock’s weight in the index proportionate to its market value. You cannot invest directly in an index. |
| 2 | The Morgan Stanley Capital International (MSCI) All Country World Index (ACWI) ex USA Index (Net) is a free-float-adjusted market-capitalization-weighted index that is designed to measure the equity market performance of developed markets, excluding the United States and Canada. Source: MSCI. MSCI makes no express or implied warranties or representations and shall have no liability whatsoever with respect to any MSCI data contained herein. The MSCI data may not be further redistributed or used as a basis for other indices or any securities or financial products. This report is not approved, reviewed, or produced by MSCI. You cannot invest directly in an index. |
| 3 | The MSCI Emerging Markets (EM) Index (Net) is a free-float-adjusted market-capitalization-weighted index that is designed to measure large- and mid-cap equity market performance of emerging markets. The MSCI EM Index (Net) consists of the following 24 emerging market country indices: Brazil, Chile, China, Colombia, Czech Republic, Egypt, Greece, Hungary, India, Indonesia, Korea, Malaysia, Mexico, Pakistan, Peru, the Philippines, Poland, Qatar, Russia, South Africa, Taiwan, Thailand, Turkey, and the United Arab Emirates. You cannot invest directly in an index. |
| 4 | The Bloomberg Barclays U.S. Aggregate Bond Index is a broad-based benchmark that measures the investment-grade, U.S. dollar-denominated, fixed-rate taxable bond market, including Treasuries, government-related and corporate securities, mortgage-backed securities (agency fixed-rate and hybrid adjustable-rate mortgage pass-throughs), asset-backed securities, and commercial mortgage-backed securities. You cannot invest directly in an index. |
| 5 | The Bloomberg Barclays Global Aggregate ex-USD Index is an unmanaged index that provides a broad-based measure of the global investment-grade fixed-income markets excluding the U.S. dollar-denominated debt market. You cannot invest directly in an index. |
| 6 | The Bloomberg Barclays Municipal Bond Index is an unmanaged index composed of long-term tax-exempt bonds with a minimum credit rating of Baa. You cannot invest directly in an index. |
| 7 | The ICE BofAML U.S. High Yield Index is a market-capitalization-weighted index of domestic and Yankee high-yield bonds. The index tracks the performance of high-yield securities traded in the U.S. bond market. You cannot invest directly in an index. Copyright 2018. ICE Data Indices, LLC. All rights reserved. |
| | | | | | |
| Letter to shareholders (unaudited) | | Wells Fargo Emerging Markets Equity Fund | | | 3 | |
Volatility reemerged during the early months of 2018.
In February 2018, investor concerns arose about inflation and trade, particularly between the U.S. and China. The Fed followed its 25-basis-point (bp; 100 bps equal 1.00%) federal funds rate increase in December 2017 with a further 25-bp increase in March 2018. The inflation rate in March reached the Fed’s 2% target for the first time in a year. The S&P 500 Index closed the first quarter with a negative return, the first negative quarterly return for the index since 2014.
Overseas, investment markets fell, hurt by a stronger U.S. dollar and mounting trade and diplomatic tensions. The MSCI ACWI ex USA Index (Net) declined 1.81% for the quarter that ended March 31, 2018.
Global trade tensions prompted investor concerns.
Global trade tensions escalated during the second quarter of 2018. The U.S. government’s decision to impose tariffs on a wide range of products manufactured overseas drew retaliatory responses from foreign governments, which punished U.S. commodity producers and product manufacturers. Investors were left to wonder about next steps in what appeared to be an escalating divergence in global economic policies and growth prospects.
Inflation trended higher. The CPI-U8 added 0.1% in June after an increase of 0.2% in both April and May. On a year-over-year basis, the all-items index rose 2.9% for the 12 months that ended June 30, 2018. The index for all items less food and energy rose 2.3% for the same 12-month period.
U.S. stocks gained following economic data while international stocks and bonds declined.
During the summer months, the U.S. economy strengthened. Revised second-quarter GDP data released in August showed the U.S. economy growing at a 4.2% rate. The unemployment rate in the U.S. was 3.7% by the end of September, according to the U.S. Department of Labor. Wages showed more consistent growth, and consumer confidence remained strong. Several U.S. equity market indices reached records during August, with the S&P 500 Index gaining 7.20% for the three-month period that ended September 30, 2018. In contrast, the MSCI ACWI ex USA Index (Net) gained 0.71% while the MSCI EM Index (Net) declined 1.09% during the same three-month period.
In June, the Fed increased the target range for the federal funds rate to range from 1.75% to 2.00%. It raised the range again in September to range from 2.00% to 2.25%. Long-term interest rates in the U.S. remained at higher levels relative to the prior 10 years. Rates on 10-year and 30-year Treasury bonds—2.46% and 2.81%, respectively, on January 1, 2018—were 3.15% and 3.39%, respectively, on October 31, 2018. Investor concerns about an inverted yield curve waned, only to be replaced by concerns about the potentially negative influence of higher interest rates on economic activity.
October proved to be a difficult month for stock markets globally.
As interest rates and bond yields gained during October, stock markets struggled. For the month, the S&P 500 Index fell 6.84%, the MSCI ACWI ex USA Index (Net) dropped 8.13%, and the MSCI EM Index (Net) lost 8.71%. The Bureau of Economic Analysis released its first estimate of third-quarter GDP, which, at an annualized 3.5% rate, indicated growth may be slowing compared with the second quarter. Readings on consumer sentiment and business spending were mixed.
The S&P 500 Index closed the first quarter with a negative return, the first negative quarterly return for the index since 2014.
| 8 | The Consumer Price Index for All Urban Consumers (CPI-U) measures the changes in the price of a basket of goods and services purchased by urban consumers. The urban consumer population is deemed by many as a better representative measure of the general public because close to 90% of the country’s population lives in highly populated areas. You cannot invest directly in an index. |
| | | | |
| 4 | | Wells Fargo Emerging Markets Equity Fund | | Letter to shareholders (unaudited) |
Economic signals overseas also were mixed as the third quarter ended and the fourth quarter began. In early August, the BOE’s Monetary Policy Committee increased its key interest rate to 0.75%. The ECB and BOJ maintained low interest rates and accommodative monetary policies. Amid rising trade uncertainty, the PBOC cut reserve requirement ratios and accelerated infrastructure spending and tax cuts for business enterprises and individuals. Nevertheless, a strengthening U.S. dollar and the trade tensions remained headwinds for investors overseas.
Don’t let short-term uncertainty derail long-term investment goals.
Periods of investment uncertainty can present challenges, but experience has taught us that maintaining long-term investment goals can be an effective way to plan for the future. To help you create a sound strategy based on your personal goals and risk tolerance, Wells Fargo Funds offers more than 100 mutual funds spanning a wide range of asset classes and investment styles. Although diversification cannot guarantee an investment profit or prevent losses, we believe it can be an effective way to manage investment risk and potentially smooth out overall portfolio performance. We encourage investors to know their investments and to understand that appropriate levels of risk-taking may unlock opportunities.
Thank you for choosing to invest with Wells Fargo Funds. We appreciate your confidence in us and remain committed to helping you meet your financial needs.
Sincerely,

Andrew Owen
President
Wells Fargo Funds
Notice to shareholders
At a meeting held on August 14-15, 2018, the Board of Trustees of the Fund approved the following policy which will be effective on or about February 5, 2019:
Class C shares will convert automatically into Class A shares ten years after the initial date of purchase or, if you acquired your Class C shares through an exchange or conversion from another share class, ten years after the date you acquired your Class C shares. When Class C shares that you acquired through a purchase or exchange convert, any other Class C shares that you purchased with reinvested dividends and distributions also will convert into Class A shares on a pro rata basis. A shorter holding period may also apply depending on your intermediary. Please see “Appendix A—Sales Charge Reductions and Waivers for Certain Intermediaries” in the Fund’s prospectus or at the end of this report.
For further information about your Fund, contact your investment professional, visit our website at wellsfargofunds.com, or call us directly at 1-800-222-8222.
This page is intentionally left blank.
| | | | |
| 6 | | Wells Fargo Emerging Markets Equity Fund | | Performance highlights (unaudited) |
Investment objective
The Fund seeks long-term capital appreciation.
Manager
Wells Fargo Funds Management, LLC
Subadviser
Wells Capital Management Incorporated
Portfolio managers
Derrick Irwin, CFA®
Richard Peck, CFA®
Yi (Jerry) Zhang, Ph.D., CFA®
Average annual total returns (%) as of October 31, 20181
| | | | | | | | | | | | | | | | | | | | | | | | | | | | | | | | | | |
| | | | | Including sales charge | | | Excluding sales charge | | | Expense ratios2 (%) | |
| | | Inception date | | 1 year | | | 5 year | | | 10 year | | | 1 year | | | 5 year | | | 10 year | | | Gross | | | Net3 | |
| Class A (EMGAX) | | 9-6-1994 | | | (19.55 | ) | | | (1.32 | ) | | | 6.83 | | | | (14.65 | ) | | | (0.14 | ) | | | 7.46 | | | | 1.56 | | | | 1.56 | |
| Class C (EMGCX) | | 9-6-1994 | | | (16.34 | ) | | | (0.90 | ) | | | 6.66 | | | | (15.34 | ) | | | (0.90 | ) | | | 6.66 | | | | 2.31 | | | | 2.31 | |
| Class R6 (EMGDX) | | 6-28-2013 | | | – | | | | – | | | | – | | | | (14.33 | ) | | | 0.30 | | | | 7.91 | | | | 1.13 | | | | 1.13 | |
| Administrator Class (EMGYX) | | 9-6-1994 | | | – | | | | – | | | | – | | | | (14.57 | ) | | | (0.03 | ) | | | 7.64 | | | | 1.48 | | | | 1.47 | |
| Institutional Class (EMGNX) | | 7-30-2010 | | | – | | | | – | | | | – | | | | (14.35 | ) | | | 0.25 | | | | 7.88 | | | | 1.23 | | | | 1.20 | |
| MSCI EM Index (Net)4 | | – | | | – | | | | – | | | | – | | | | (12.52 | ) | | | 0.78 | | | | 7.84 | | | | – | | | | – | |
Figures quoted represent past performance, which is no guarantee of future results, and do not reflect taxes that a shareholder may pay on fund distributions or the redemption of fund shares. Investment return and principal value of an investment will fluctuate so that an investor’s shares, when redeemed, may be worth more or less than their original cost. Performance shown without sales charges would be lower if sales charges were reflected. Current performance may be lower or higher than the performance data quoted, which assumes the reinvestment of dividends and capital gains. Current month-end performance is available on the Fund’s website, wellsfargofunds.com.
Index returns do not include transaction costs associated with buying and selling securities, any mutual fund fees or expenses, or any taxes. It is not possible to invest directly in an index.
For Class A shares, the maximum front-end sales charge is 5.75%. For Class C shares, the maximum contingent deferred sales charge is 1.00%. Performance including a contingent deferred sales charge assumes the sales charge for the corresponding time period. Class R6, Administrator Class, and Institutional Class shares are sold without a front-end sales charge or contingent deferred sales charge.
Stock values fluctuate in response to the activities of individual companies and general market and economic conditions. Foreign investments are especially volatile and can rise or fall dramatically due to differences in the political and economic conditions of the host country. These risks are generally intensified in emerging markets. The use of derivatives may reduce returns and/or increase volatility. Certain investment strategies tend to increase the total risk of an investment (relative to the broader market). The Fund is exposed to smaller-company securities risk. Consult the Fund’s prospectus for additional information on these and other risks.
Please see footnotes on page 7.
| | | | | | |
| Performance highlights (unaudited) | | Wells Fargo Emerging Markets Equity Fund | | | 7 | |
|
| Growth of $10,000 investment as of October 31, 20185 |
|
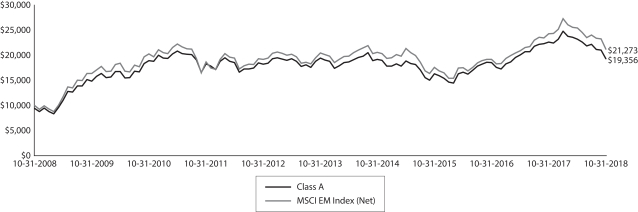 |
| 1 | Historical performance shown for Class R6 shares prior to their inception reflects the performance of Institutional Class shares and includes the higher expenses applicable to Institutional Class shares. If these expenses had not been included, returns for Class R6 shares would have been higher. Historical performance shown for Institutional Class shares prior to their inception reflects the performance of Administrator Class shares and includes the higher expenses applicable to Administrator Class shares. If these expenses had not been included, returns for Institutional Class shares would be higher. Historical performance shown for all classes of the Fund prior to July 19, 2010, is based on the performance of the Fund’s predecessor, Evergreen Emerging Markets Growth Fund. |
| 2 | Reflects the expense ratios as stated in the most recent prospectuses, which include the impact of 0.01% in acquired fund fees and expenses. The expense ratios shown are subject to change and may differ from the annualized expense ratios shown in the financial highlights of this report, which do not include acquired fund fees and expenses. |
| 3 | The manager has contractually committed through February 28, 2019, to waive fees and/or reimburse expenses to the extent necessary to cap the Fund’s Total Annual Operating Expenses After Fee Waivers at 1.58% for Class A, 2.33% for Class C, 1.15% for Class R6, 1.46% for Administrator Class, and 1.19% for Institutional Class. After this time, the cap may be increased or the commitment to maintain the cap may be terminated only with the approval of the Board of Trustees. Brokerage commissions, stamp duty fees, interest, taxes, acquired fund fees and expenses (if any), and extraordinary expenses are excluded from the expense cap. Without this cap, the Fund’s returns would have been lower. The expense ratio paid by an investor is the net expense ratio (the total annual fund operating expenses after fee waivers) as stated in the prospectuses. |
| 4 | The Morgan Stanley Capital International (MSCI) Emerging Markets (EM) Index (Net) is a free-float-adjusted market-capitalization-weighted index that is designed to measure large and mid-cap equity market performance of emerging markets. The MSCI EM Index (Net) consists of the following 24 emerging markets country indexes: Brazil, Chile, China, Colombia, Czech Republic, Egypt, Greece, Hungary, India, Indonesia, Korea, Malaysia, Mexico, Pakistan, Peru, the Philippines, Poland, Qatar, Russia, South Africa, Taiwan, Thailand, Turkey, and United Arab Emirates. Source: MSCI. MSCI makes no express or implied warranties or representations and shall have no liability whatsoever with respect to any MSCI data contained herein. The MSCI data may not be further redistributed or used as a basis for other indexes or any securities or financial products. This report is not approved, reviewed, or produced by MSCI. You cannot invest directly in an index. |
| 5 | The chart compares the performance of Class A shares for the most recent ten years with the MSCI EM Index (Net). The chart assumes a hypothetical investment of $10,000 in Class A shares and reflects all operating expenses and assumes the maximum initial sales charge of 5.75%. |
| 6 | The ten largest holdings, excluding cash, cash equivalents and any money market funds, are calculated based on the value of the investments divided by total net assets of the Fund. Holdings are subject to change and may have changed since the date specified. |
| 7 | Amounts are calculated based on the total long-term investments of the Fund. These amounts are subject to change and may have changed since the date specified. |
| | | | |
| 8 | | Wells Fargo Emerging Markets Equity Fund | | Performance highlights (unaudited) |
MANAGER’S DISCUSSION
Fund highlights
| ∎ | | The Fund underperformed its benchmark, the MSCI EM Index (Net), for the 12-month period that ended October 31, 2018. |
| ∎ | | Top detracting sectors included financials, materials, and energy. Among countries, detractors included China/Hong Kong and Russia. |
| ∎ | | The largest relative contributors among sectors included consumer discretionary, health care, and real estate. Taiwan and Turkey were among the most notable contributors on a country basis. |
Emerging market equities declined for most of the period.
Emerging market equities advanced through the end of calendar-year 2017 and well into January 2018 before reversing sharply for the remainder of the period. By the end of October 2018 they had fallen over 23% from their January high.
The strong equity market in late 2017 and early 2018 was a continuation of the uptrend that had been in place since early 2016, as earnings continued to improve and return on capital recovered from its 2015 trough. However, as the bull market wore on, market leadership became concentrated in a handful of companies. These were primarily large technology names in China, Taiwan, and Korea. We were underweight some of these companies due to valuation concerns.
In late January, investors became concerned that rising interest rates in the U.S. and a strong U.S. dollar would weigh on emerging market growth. Further, some companies and some governments in the emerging markets had taken on a significant amount of U.S.-dollar-denominated debt, raising concerns about potential defaults if the dollar rose too far. A further source of concern was the increasing trade tensions between the U.S., China, and a number of other countries. Increased sanctions pressure on Russia further weighed on the markets. As a result, earnings expectations, which had been rising for two years, began to soften and the market sagged.
| | | | |
| Ten largest holdings (%) as of October 31, 20186 | |
Samsung Electronics Company Limited | | | 4.84 | |
China Mobile Limited | | | 3.51 | |
Taiwan Semiconductor Manufacturing Company Limited ADR | | | 3.19 | |
Tencent Holdings Limited | | | 2.67 | |
Uni-President Enterprises Company | | | 2.18 | |
AIA Group Limited | | | 2.00 | |
Reliance Industries Limited GDR | | | 1.99 | |
Taiwan Semiconductor Manufacturing Company Limited | | | 1.81 | |
Fomento Economico Mexicano SAB de CV ADR | | | 1.75 | |
Alibaba Group Holding Limited ADR | | | 1.74 | |
We continued to emphasize high-quality companies in the Fund.
We continued to make changes in the Fund to ensure that it owned companies of the highest quality and to take advantage of valuation opportunities. Key new positions included China’s Xiaomi Corporation; iQIYI, Incorporated; and Meituan Dianping and Brazil’s Petrobras Distribuidora S.A. and BK Brasil Operacao e Assessoria a Restaurantes SA. Among the larger positions eliminated from the Fund were South Africa’s Clicks Group Limited and China’s Sogou Incorporated.
Please see footnotes on page 7.
| | | | | | |
| Performance highlights (unaudited) | | Wells Fargo Emerging Markets Equity Fund | | | 9 | |
|
| Sector distribution as of October 31, 20187 |
|
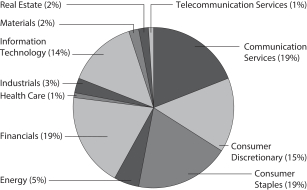 |
|
| Country allocation as of October 31, 20187 |
|
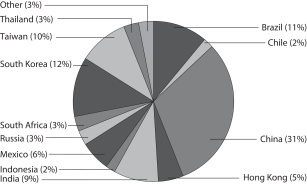
|
In the Fund, positive stock selection in Taiwan, Chile, and the Philippines was offset by weaker results among stocks in China, Russia, and Brazil. Underweight positioning in Turkey helped performance, while allocation in Russia was a drag. In Taiwan, the Fund benefited from strong performances from companies such as Uni-President Enterprises Corporation and President Chain Store Corporation. In China, our biggest challenges were related to the Fund’s position in SINA Corporation, China Life Insurance Company Limited, and WH Group Limited. In Russia, the underperformance of Magnit PJSC was the main detractor from performance.
Among sectors, consumer discretionary was a key performance driver, led by Brazil’s B2W Companhia Digital; MercadoLibre, Incorporated; and China’s Li Ning Company Limited. Our underweight position in China’s Alibaba Group Holding Limited also contributed. We were underweight the relatively weak health care sector, which contributed to our relative performance. The Fund lagged in the financials sector, as both China Life Insurance and Samsung Life Insurance Company Limited lagged. Our underweight in the materials sector, coupled with the underperformance of a number of Indian cement companies, also affected performance.
The stronger U.S. dollar, higher interest rates, and receding global liquidity, combined with trade sanctions and tariff wars, took the gloss off the near-term prospects for emerging market assets. We agree that a dose of caution is warranted, but as we survey the landscape, we find that these risks are increasingly reflected in the market and there is reason for optimism.
After several months of adjustment following the market highs in January, we currently consider the risks in emerging markets to be well balanced. In the near term, we are wary of tighter financial conditions and trade tension volatility. But as investors return to examining company fundamentals, we are confident that our disciplined and process-driven strategy, based on investing in companies that have the potential to create long-term shareholder value and are trading at attractive levels, will help insulate the Fund’s holdings from unforeseen shocks while allowing the Fund to potentially benefit from the underlying growth dynamic in emerging markets.
Please see footnotes on page 7.
| | | | |
| 10 | | Wells Fargo Emerging Markets Equity Fund | | Fund expenses (unaudited) |
As a shareholder of the Fund, you incur two types of costs: (1) transaction costs, including sales charges (loads) on purchase payments and contingent deferred sales charges (if any) on redemptions and (2) ongoing costs, including management fees, distribution (12b-1) and/or shareholder servicing fees, and other Fund expenses. This example is intended to help you understand your ongoing costs (in dollars) of investing in the Fund and to compare these costs with the ongoing costs of investing in other mutual funds.
The example is based on an investment of $1,000 invested at the beginning of the six-month period and held for the entire period from May 1, 2018 to October 31, 2018.
Actual expenses
The “Actual” line of the table below provides information about actual account values and actual expenses. You may use the information in this line, together with the amount you invested, to estimate the expenses that you paid over the period. Simply divide your account value by $1,000 (for example, an $8,600 account value divided by $1,000 = 8.6), then multiply the result by the number in the “Actual” line under the heading entitled “Expenses paid during period” for your applicable class of shares to estimate the expenses you paid on your account during this period.
Hypothetical example for comparison purposes
The “Hypothetical” line of the table below provides information about hypothetical account values and hypothetical expenses based on the Fund’s actual expense ratio and an assumed rate of return of 5% per year before expenses, which is not the Fund’s actual return. The hypothetical account values and expenses may not be used to estimate the actual ending account balance or expenses you paid for the period. You may use this information to compare the ongoing costs of investing in the Fund and other funds. To do so, compare this 5% hypothetical example with the 5% hypothetical examples that appear in the shareholder reports of the other funds.
Please note that the expenses shown in the table are meant to highlight your ongoing costs only and do not reflect any transactional costs, such as sales charges (loads) and contingent deferred sales charges. Therefore, the “Hypothetical” line of the table is useful in comparing ongoing costs only and will not help you determine the relative total costs of owning different funds. In addition, if these transactional costs were included, your costs would have been higher.
| | | | | | | | | | | | | | | | |
| | | Beginning
account value
5-1-2018 | | | Ending
account value
10-31-2018 | | | Expenses
paid during
the period¹ | | | Annualized net
expense ratio | |
Class A | | | | | | | | | | | | | | | | |
Actual | | $ | 1,000.00 | | | $ | 832.42 | | | $ | 7.30 | | | | 1.58 | % |
Hypothetical (5% return before expenses) | | $ | 1,000.00 | | | $ | 1,017.24 | | | $ | 8.03 | | | | 1.58 | % |
Class C | | | | | | | | | | | | | | | | |
Actual | | $ | 1,000.00 | | | $ | 829.12 | | | $ | 10.74 | | | | 2.33 | % |
Hypothetical (5% return before expenses) | | $ | 1,000.00 | | | $ | 1,013.46 | | | $ | 11.82 | | | | 2.33 | % |
Class R6 | | | | | | | | | | | | | | | | |
Actual | | $ | 1,000.00 | | | $ | 833.96 | | | $ | 5.32 | | | | 1.15 | % |
Hypothetical (5% return before expenses) | | $ | 1,000.00 | | | $ | 1,019.41 | | | $ | 5.85 | | | | 1.15 | % |
Administrator Class | | | | | | | | | | | | | | | | |
Actual | | $ | 1,000.00 | | | $ | 832.90 | | | $ | 6.75 | | | | 1.46 | % |
Hypothetical (5% return before expenses) | | $ | 1,000.00 | | | $ | 1,017.85 | | | $ | 7.43 | | | | 1.46 | % |
Institutional Class | | | | | | | | | | | | | | | | |
Actual | | $ | 1,000.00 | | | $ | 834.28 | | | $ | 5.50 | | | | 1.19 | % |
Hypothetical (5% return before expenses) | | $ | 1,000.00 | | | $ | 1,019.21 | | | $ | 6.06 | | | | 1.19 | % |
| 1 | Expenses paid is equal to the annualized net expense ratio of each class multiplied by the average account value over the period, multiplied by the number of days in the most recent fiscal half-year divided by the number of days in the fiscal year (to reflect the one-half-year period). |
| | | | | | |
| Portfolio of investments—October 31, 2018 | | Wells Fargo Emerging Markets Equity Fund | | | 11 | |
| | | | | | | | | | | | | | | | |
| Security name | | | | | | | | Shares | | | Value | |
| | | | |
Common Stocks: 93.88% | | | | | | | | | | | | | | | | |
| | | | |
| Argentina: 0.51% | | | | | | | | | | | | | | | | |
MercadoLibre Incorporated (Consumer Discretionary, Internet & Direct Marketing Retail) | | | | | | | | | | | 54,600 | | | $ | 17,717,700 | |
| | | | | | | | | | | | | | | | |
| | | | |
| Brazil: 8.57% | | | | | | | | | | | | | | | | |
Ambev SA ADR (Consumer Staples, Beverages) | | | | | | | | | | | 4,477,000 | | | | 19,385,410 | |
Atacadao Distribuicao Comercio e Industria Limitada (Consumer Staples, Food & Staples Retailing) | | | | | | | | | | | 5,690,000 | | | | 23,301,250 | |
B2W Companhia Digital (Consumer Discretionary, Internet & Direct Marketing Retail) † | | | | | | | | | | | 4,304,333 | | | | 39,903,127 | |
B3 SA Brasil Bolsa Balcao (Financials, Capital Markets) | | | | | | | | | | | 6,823,005 | | | | 48,658,485 | |
Banco Bradesco SA ADR (Financials, Banks) | | | | | | | | | | | 3,611,245 | | | | 33,115,117 | |
BK Brasil Operacao e Assessoria a Restaurantes SA (Consumer Discretionary, Hotels, Restaurants & Leisure) † | | | | | | | | | | | 3,215,794 | | | | 13,894,926 | |
BRF Brazil Foods SA ADR (Consumer Staples, Food Products) Ǡ | | | | | | | | | | | 4,618,092 | | | | 27,339,105 | |
Hapvida Participacoes e Investimentos SA (Health Care, Health Care Providers & Services) 144A† | | | | | | | | | | | 1,243,107 | | | | 8,511,183 | |
IRB-Brasil Resseguros SA (Financials, Insurance) | | | | | | | | | | | 895,669 | | | | 17,439,252 | |
Lojas Renner SA (Consumer Discretionary, Multiline Retail) | | | | | | | | | | | 3,014,250 | | | | 30,454,333 | |
Multiplan Empreendimentos Imobiliarios SA (Real Estate, Real Estate Management & Development) | | | | | | | | | | | 2,281,906 | | | | 14,102,872 | |
Petrobras Distribuidora SA (Consumer Discretionary, Specialty Retail) | | | | | | | | | | | 1,247,300 | | | | 8,037,150 | |
Raia Drogasil SA (Consumer Staples, Food & Staples Retailing) | | | | | | | | | | | 791,600 | | | | 13,362,438 | |
| | | | |
| | | | | | | | | | | | | | | 297,504,648 | |
| | | | | | | | | | | | | | | | |
| | | | |
| Chile: 1.85% | | | | | | | | | | | | | | | | |
AES Gener SA (Utilities, Independent Power & Renewable Electricity Producers) | | | | | | | | | | | 15,613,250 | | | | 4,425,966 | |
Banco Santander Chile SA ADR (Financials, Banks) | | | | | | | | | | | 1,068,392 | | | | 31,474,828 | |
SACI Falabella (Consumer Discretionary, Multiline Retail) | | | | | | | | | | | 3,737,228 | | | | 28,216,943 | |
| | | | |
| | | | | | | | | | | | | | | 64,117,737 | |
| | | | | | | | | | | | | | | | |
| | | | |
| China: 29.70% | | | | | | | | | | | | | | | | |
51job Incorporated ADR (Industrials, Professional Services) † | | | | | | | | | | | 539,441 | | | | 33,127,072 | |
A Living Services Company Limited H Shares (Industrials, Commercial Services & Supplies) † | | | | | | | | | | | 4,233,295 | | | | 5,128,355 | |
Alibaba Group Holding Limited ADR (Consumer Discretionary, Internet & Direct Marketing Retail) † | | | | | | | | | | | 424,037 | | | | 60,331,984 | |
Baidu Incorporated ADR (Communication Services, Interactive Media & Services) † | | | | | | | | | | | 131,540 | | | | 25,000,492 | |
Best Incorporated ADR (Industrials, Air Freight & Logistics) Ǡ | | | | | | | | | | | 3,445,781 | | | | 21,673,962 | |
Bilibili Incorporated ADR (Information Technology, Software) Ǡ | | | | | | | | | | | 1,757,845 | | | | 23,730,908 | |
China Distance Education ADR (Consumer Discretionary, Diversified Consumer Services) | | | | | | | | | | | 973,710 | | | | 7,039,923 | |
China Life Insurance Company Limited H shares (Financials, Insurance) | | | | | | | | | | | 29,418,290 | | | | 58,596,866 | |
China Literature Limited (Consumer Discretionary, Internet & Direct Marketing Retail) «144A† | | | | | | | | | | | 1,052,768 | | | | 5,685,413 | |
China MeiDong Auto Holdings Limited (Consumer Discretionary, Specialty Retail) | | | | | | | | | | | 17,644,000 | | | | 6,974,847 | |
China Mobile Limited (Communication Services, Wireless Telecommunication Services) | | | | | | | | | | | 13,050,165 | | | | 121,982,045 | |
China Rapid Finance Limited ADR (Financials, Consumer Finance) Ǡ | | | | | | | | | | | 1,326,299 | | | | 3,302,485 | |
CNOOC Limited (Energy, Oil, Gas & Consumable Fuels) | | | | | | | | | | | 26,974,000 | | | | 46,298,439 | |
Ctrip.com International Limited ADR (Consumer Discretionary, Internet & Direct Marketing Retail) † | | | | | | | | | | | 1,263,132 | | | | 42,037,033 | |
Greentree Hospitality Group Limited (Consumer Discretionary, Hotels, Restaurants & Leisure) † | | | | | | | | | | | 1,224,841 | | | | 12,309,652 | |
Gridsum Holding Incorporated ADR (Information Technology, Software) † | | | | | | | | | | | 501,040 | | | | 2,690,585 | |
Hengan International Group Company Limited (Consumer Staples, Personal Products) | | | | | | | | | | | 5,017,000 | | | | 39,729,366 | |
Hua Medicine Limited (Health Care, Pharmaceuticals) 144A† | | | | | | | | | | | 7,244,736 | | | | 6,429,952 | |
Huami Corporation ADR (Information Technology, Electronic Equipment, Instruments & Components) † | | | | | | | | | | | 1,253,313 | | | | 11,705,943 | |
iQIYI Incorporated ADR (Information Technology, Internet Software & Services) Ǡ | | | | | | | | | | | 797,083 | | | | 15,654,710 | |
Jianpu Technology Incorporated ADR (Financials, Consumer Finance) † | | | | | | | | | | | 2,623,740 | | | | 13,066,225 | |
Li Ning Company Limited (Consumer Discretionary, Textiles, Apparel & Luxury Goods) † | | | | | | | | | | | 30,984,207 | | | | 29,000,960 | |
Meituan Dianping (Consumer Discretionary, Internet & Direct Marketing Retail) Ǡ | | | | | | | | | | | 1,780,700 | | | | 11,512,633 | |
The accompanying notes are an integral part of these financial statements.
| | | | |
| 12 | | Wells Fargo Emerging Markets Equity Fund | | Portfolio of investments—October 31, 2018 |
| | | | | | | | | | | | | | | | |
| Security name | | | | | | | | Shares | | | Value | |
| | | | |
| China (continued) | | | | | | | | | | | | | | | | |
New Oriental Education & Technology Group Incorporated ADR (Consumer Discretionary, Diversified Consumer Services) † | | | | | | | | | | | 974,913 | | | $ | 57,042,160 | |
Pinduoduo Incorporated ADR (Consumer Discretionary, Internet & Direct Marketing Retail) Ǡ | | | | | | | | | | | 143,141 | | | | 2,526,439 | |
PPDAI Group Incorporated ADR (Financials, Consumer Finance) † | | | | | | | | | | | 2,864,705 | | | | 16,357,466 | |
Shandong Weigao Group Medical Polymer Company Limited H Shares (Health Care, Health Care Equipment & Supplies) | | | | | | | | | | | 18,024,000 | | | | 16,111,840 | |
SINA Corporation (Information Technology, Internet Software & Services) † | | | | | | | | | | | 919,907 | | | | 58,239,312 | |
Tencent Holdings Limited (Communication Services, Interactive Media & Services) | | | | | | | | | | | 2,723,800 | | | | 92,739,000 | |
Tsingtao Brewery Company Limited H Shares (Consumer Staples, Beverages) | | | | | | | | | | | 7,600,000 | | | | 29,995,091 | |
Vipshop Holdings Limited ADR (Consumer Discretionary, Internet & Direct Marketing Retail) † | | | | | | | | | | | 6,124,738 | | | | 29,766,227 | |
Want Want China Holdings Limited (Consumer Staples, Food Products) | | | | | | | | | | | 50,204,000 | | | | 35,851,083 | |
Weibo Corporation ADR (Information Technology, Internet Software & Services) Ǡ | | | | | | | | | | | 652,376 | | | | 38,496,708 | |
Wise Talent Information Technology Company Limited (Information Technology, Internet Software & Services) † | | | | | | | | | | | 1,648,460 | | | | 5,391,899 | |
Xiaomi Corporation Class B (Information Technology, Technology Hardware, Storage & Peripherals) «144A† | | | | | | | | | | | 20,689,400 | | | | 32,134,468 | |
Zhou Hei Ya International Holding Company Limited (Consumer Staples, Food Products) « | | | | | | | | | | | 25,803,626 | | | | 13,260,555 | |
| | | | |
| | | | | | | | | | | | | | | 1,030,922,098 | |
| | | | | | | | | | | | | | | | |
| | | | |
| Colombia: 0.47% | | | | | | | | | | | | | | | | |
Bancolombia SA ADR (Financials, Banks) | | | | | | | | | | | 442,400 | | | | 16,342,256 | |
| | | | | | | | | | | | | | | | |
| | | | |
| Hong Kong: 4.76% | | | | | | | | | | | | | | | | |
AIA Group Limited (Financials, Insurance) | | | | | | | | | | | 9,156,400 | | | | 69,298,113 | |
Johnson Electric Holdings Limited (Industrials, Electrical Equipment) | | | | | | | | | | | 4,214,250 | | | | 9,436,713 | |
Sun Art Retail Group Limited (Consumer Staples, Food & Staples Retailing) | | | | | | | | | | | 24,590,500 | | | | 26,873,493 | |
WH Group Limited (Consumer Staples, Food Products) 144A | | | | | | | | | | | 85,155,500 | | | | 59,615,745 | |
| | | | |
| | | | | | | | | | | | | | | 165,224,064 | |
| | | | | | | | | | | | | | | | |
| | | | |
| India: 8.60% | | | | | | | | | | | | | | | | |
AU Small Finance Bank Limited (Financials, Consumer Finance) 144A | | | | | | | | | | | 451,041 | | | | 3,388,983 | |
Bajaj Finance Limited (Financials, Consumer Finance) | | | | | | | | | | | 420,281 | | | | 13,541,693 | |
Bandhan Bank Limited (Financials, Banks) 144A | | | | | | | | | | | 1,416,131 | | | | 7,473,732 | |
Bharti Airtel Limited (Telecommunication Services, Wireless Telecommunication Services) | | | | | | | | | | | 2,618,728 | | | | 10,353,440 | |
Bharti Infratel Limited (Telecommunication Services, Diversified Telecommunication Services) | | | | | | | | | | | 2,873,851 | | | | 10,464,323 | |
Dalmia Bharat Limited (Materials, Construction Materials) | | | | | | | | | | | 312,329 | | | | 8,872,940 | |
Fortis Healthcare Limited (Health Care, Health Care Providers & Services) † | | | | | | | | | | | 5,634,970 | | | | 10,695,355 | |
HDFC Bank Limited ADR (Financials, Banks) | | | | | | | | | | | 123,826 | | | | 11,009,370 | |
Housing Development Finance Corporation Limited (Financials, Thrifts & Mortgage Finance) | | | | | | | | | | | 1,115,700 | | | | 26,694,871 | |
ICICI Bank Limited ADR (Financials, Banks) | | | | | | | | | | | 2,121,952 | | | | 20,137,324 | |
Indusind Bank Limited (Financials, Banks) | | | | | | | | | | | 817,217 | | | | 15,749,759 | |
ITC Limited (Consumer Staples, Tobacco) | | | | | | | | | | | 9,678,960 | | | | 36,663,421 | |
Kotak Mahindra Bank Limited (Financials, Banks) | | | | | | | | | | | 1,057,262 | | | | 16,001,552 | |
Laurus Labs Limited (Health Care, Pharmaceuticals) 144A | | | | | | | | | | | 455,595 | | | | 2,100,068 | |
Max Financial Services Limited (Financials, Insurance) | | | | | | | | | | | 925,389 | | | | 4,720,491 | |
Oberoi Realty Limited (Real Estate, Real Estate Management & Development) | | | | | | | | | | | 1,064,750 | | | | 6,095,908 | |
PNB Housing Finance Limited (Financials, Thrifts & Mortgage Finance) 144A | | | | | | | | | | | 191,606 | | | | 2,073,734 | |
Reliance Industries Limited GDR (Energy, Oil, Gas & Consumable Fuels) 144A | | | | | | | | | | | 2,413,174 | | | | 68,896,118 | |
SBI Life Insurance Company Limited (Financials, Insurance) 144A | | | | | | | | | | | 914,273 | | | | 6,928,915 | |
SH Kelkar & Company Limited (Materials, Chemicals) | | | | | | | | | | | 1,314,144 | | | | 2,991,013 | |
Ultra Tech Cement Limited (Materials, Construction Materials) | | | | | | | | | | | 286,000 | | | | 13,534,768 | |
| | | | |
| | | | | | | | | | | | | | | 298,387,778 | |
| | | | | | | | | | | | | | | | |
The accompanying notes are an integral part of these financial statements.
| | | | | | |
| Portfolio of investments—October 31, 2018 | | Wells Fargo Emerging Markets Equity Fund | | | 13 | |
| | | | | | | | | | | | | | | | |
| Security name | | | | | | | | Shares | | | Value | |
| | | | |
| Indonesia: 2.01% | | | | | | | | | | | | | | | | |
PT Astra International Tbk (Consumer Discretionary, Automobiles) | | | | | | | | | | | 19,151,000 | | | $ | 9,951,843 | |
PT Bank Central Asia Tbk (Financials, Banks) | | | | | | | | | | | 11,349,500 | | | | 17,656,022 | |
PT Blue Bird Tbk (Industrials, Road & Rail) | | | | | | | | | | | 13,605,309 | | | | 2,550,576 | |
PT Link Net Tbk (Telecommunication Services, Diversified Telecommunication Services) | | | | | | | | | | | 38,278,161 | | | | 11,053,519 | |
PT Matahari Department Store Tbk (Consumer Discretionary, Multiline Retail) | | | | | | | | | | | 10,474,600 | | | | 3,341,675 | |
PT Telekomunikasi Indonesia Persero Tbk ADR (Telecommunication Services, Diversified Telecommunication Services) « | | | | | | | | | | | 997,754 | | | | 25,143,401 | |
| | | | |
| | | | | | | | | | | | | | | 69,697,036 | |
| | | | | | | | | | | | | | | | |
| | | | |
| Luxembourg: 0.27% | | | | | | | | | | | | | | | | |
Biotoscana Investments SA (Health Care, Biotechnology) † | | | | | | | | | | | 1,156,551 | | | | 2,980,337 | |
PLAY Communications SA (Telecommunication Services, Wireless Telecommunication Services) | | | | | | | | | | | 1,473,299 | | | | 6,335,284 | |
| | | | |
| | | | | | | | | | | | | | | 9,315,621 | |
| | | | | | | | | | | | | | | | |
| | | | |
| Malaysia: 0.89% | | | | | | | | | | | | | | | | |
Genting Bhd (Consumer Discretionary, Hotels, Restaurants & Leisure) | | | | | | | | | | | 8,780,900 | | | | 15,402,511 | |
Genting Malaysia Bhd (Consumer Discretionary, Hotels, Restaurants & Leisure) | | | | | | | | | | | 14,496,300 | | | | 15,554,639 | |
| | | | |
| | | | | | | | | | | | | | | 30,957,150 | |
| | | | | | | | | | | | | | | | |
| | | | |
| Mexico: 5.55% | | | | | | | | | | | | | | | | |
America Movil SAB de CV ADR (Telecommunication Services, Wireless Telecommunication Services) | | | | | | | | | | | 1,537,320 | | | | 22,122,035 | |
Banco Santander Mexico ADR (Financials, Banks) | | | | | | | | | | | 2,095,333 | | | | 13,158,691 | |
Becle SAB de CV ADR (Consumer Staples, Beverages) | | | | | | | | | | | 12,913,925 | | | | 15,887,117 | |
Cemex SAB de CV ADR (Materials, Construction Materials) † | | | | | | | | | | | 2,111,848 | | | | 10,643,714 | |
Fibra Uno Administracion SAB de CV (Real Estate, Equity REITs) | | | | | | | | | | | 35,186,872 | | | | 37,675,629 | |
Fomento Economico Mexicano SAB de CV ADR (Consumer Staples, Beverages) | | | | | | | | | | | 713,120 | | | | 60,665,118 | |
Grupo Financiero Banorte SAB de CV (Financials, Banks) | | | | | | | | | | | 3,123,188 | | | | 17,218,605 | |
Wal-Mart de Mexico SAB de CV (Consumer Staples, Food & Staples Retailing) | | | | | | | | | | | 5,967,100 | | | | 15,257,587 | |
| | | | |
| | | | | | | | | | | | | | | 192,628,496 | |
| | | | | | | | | | | | | | | | |
| | | | |
| Peru: 0.43% | | | | | | | | | | | | | | | | |
Compania de Minas Buenaventura SA ADR (Materials, Metals & Mining) | | | | | | | | | | | 1,082,495 | | | | 14,981,731 | |
| | | | | | | | | | | | | | | | |
| | | | |
| Philippines: 0.91% | | | | | | | | | | | | | | | | |
Ayala Corporation (Financials, Diversified Financial Services) | | | | | | | | | | | 727,624 | | | | 12,511,243 | |
San Miguel Food And Beverage Incorporated (Consumer Staples, Food Products) | | | | | | | | | | | 3,495,810 | | | | 5,553,572 | |
SM Investments Corporation (Industrials, Industrial Conglomerates) | | | | | | | | | | | 812,873 | | | | 13,673,221 | |
| | | | |
| | | | | | | | | | | | | | | 31,738,036 | |
| | | | | | | | | | | | | | | | |
| | | | |
| Russia: 2.81% | | | | | | | | | | | | | | | | |
Lukoil PJSC ADR (Energy, Oil, Gas & Consumable Fuels) | | | | | | | | | | | 461,249 | | | | 34,455,300 | |
Magnit (Consumer Staples, Food & Staples Retailing) (a) | | | | | | | | | | | 150,816 | | | | 8,218,548 | |
Sberbank PJSC ADR (Financials, Banks) | | | | | | | | | | | 1,461,195 | | | | 17,242,101 | |
Yandex NV Class A (Communication Services, Interactive Media & Services) † | | | | | | | | | | | 1,245,106 | | | | 37,515,044 | |
| | | | |
| | | | | | | | | | | | | | | 97,430,993 | |
| | | | | | | | | | | | | | | | |
| | | | |
| Singapore: 0.18% | | | | | | | | | | | | | | | | |
Sea Limited ADR (Information Technology, Software) Ǡ | | | | | | | | | | | 469,342 | | | | 6,124,913 | |
| | | | | | | | | | | | | | | | |
The accompanying notes are an integral part of these financial statements.
| | | | |
| 14 | | Wells Fargo Emerging Markets Equity Fund | | Portfolio of investments—October 31, 2018 |
| | | | | | | | | | | | | | | | |
| Security name | | | | | | | | Shares | | | Value | |
| | | | |
| South Africa: 2.94% | | | | | | | | | | | | | | | | |
AngloGold Ashanti Limited ADR (Materials, Metals & Mining) « | | | | | | | | | | | 958,071 | | | $ | 9,015,448 | |
MTN Group Limited (Telecommunication Services, Wireless Telecommunication Services) | | | | | | | | | | | 3,062,643 | | | | 17,749,939 | |
Shoprite Holdings Limited (Consumer Staples, Food & Staples Retailing) | | | | | | | | | | | 2,598,100 | | | | 31,753,088 | |
Standard Bank Group Limited (Financials, Banks) | | | | | | | | | | | 1,660,190 | | | | 18,380,534 | |
Tiger Brands Limited (Consumer Staples, Food Products) | | | | | | | | | | | 1,405,333 | | | | 25,108,807 | |
| | | | |
| | | | | | | | | | | | | | | 102,007,816 | |
| | | | | | | | | | | | | | | | |
| | | | |
| South Korea: 11.00% | | | | | | | | | | | | | | | | |
KT Corporation ADR (Telecommunication Services, Diversified Telecommunication Services) | | | | | | | | | | | 3,674,813 | | | | 50,859,412 | |
KT&G Corporation (Consumer Staples, Tobacco) | | | | | | | | | | | 234,091 | | | | 20,850,543 | |
Naver Corporation (Information Technology, Internet Software & Services) | | | | | | | | | | | 505,000 | | | | 50,741,521 | |
Netmarble Games Corporation (Information Technology, Software) 144A | | | | | | | | | | | 23,102 | | | | 2,270,566 | |
Samsung Electronics Company Limited (Information Technology, Technology Hardware, Storage & Peripherals) | | | | | | | | | | | 4,511,800 | | | | 167,873,564 | |
Samsung Life Insurance Company Limited (Financials, Insurance) | | | | | | | | | | | 625,337 | | | | 50,485,722 | |
SK Hynix Incorporated (Information Technology, Semiconductors & Semiconductor Equipment) | | | | | | | | | | | 643,500 | | | | 38,512,307 | |
| | | | |
| | | | | | | | | | | | | | | 381,593,635 | |
| | | | | | | | | | | | | | | | |
| | | | |
| Taiwan: 9.13% | | | | | | | | | | | | | | | | |
104 Corporation (Industrials, Professional Services) | | | | | | | | | | | 1,655,000 | | | | 8,183,272 | |
Mediatek Incorporated (Information Technology, Semiconductors & Semiconductor Equipment) | | | | | | | | | | | 4,479,881 | | | | 32,937,108 | |
President Chain Store Corporation (Consumer Staples, Food & Staples Retailing) | | | | | | | | | | | 2,400,000 | | | | 27,069,127 | |
Taiwan Semiconductor Manufacturing Company Limited (Information Technology, Semiconductors & Semiconductor Equipment) | | | | | | | | | | | 8,285,224 | | | | 62,655,283 | |
Taiwan Semiconductor Manufacturing Company Limited ADR (Information Technology, Semiconductors & Semiconductor Equipment) | | | | | | | | | | | 2,902,852 | | | | 110,598,661 | |
Uni-President Enterprises Company (Consumer Staples, Food Products) | | | | | | | | | | | 31,212,368 | | | | 75,552,027 | |
| | | | |
| | | | | | | | | | | | | | | 316,995,478 | |
| | | | | | | | | | | | | | | | |
| | | | |
| Thailand: 2.61% | | | | | | | | | | | | | | | | |
PTT Exploration & Production PCL (Energy, Oil, Gas & Consumable Fuels) | | | | | | | | | | | 2,533,139 | | | | 10,659,816 | |
PTT PCL (Energy, Oil, Gas & Consumable Fuels) | | | | | | | | | | | 14,459,000 | | | | 21,699,405 | |
Siam Commercial Bank PCL (Financials, Banks) | | | | | | | | | | | 7,805,100 | | | | 32,374,095 | |
Thai Beverage PCL (Consumer Staples, Beverages) | | | | | | | | | | | 56,927,000 | | | | 25,686,294 | |
| | | | |
| | | | | | | | | | | | | | | 90,419,610 | |
| | | | | | | | | | | | | | | | |
| | | | |
| Turkey: 0.07% | | | | | | | | | | | | | | | | |
Avivasa Emeklilik Ve Hayat AS (Financials, Insurance) | | | | | | | | | | | 1,246,853 | | | | 2,587,572 | |
| | | | | | | | | | | | | | | | |
| | | | |
| United Arab Emirates: 0.05% | | | | | | | | | | | | | | | | |
Emaar Malls Group (Real Estate, Real Estate Management & Development) | | | | | | | | | | | 3,773,147 | | | | 1,879,820 | |
| | | | | | | | | | | | | | | | |
| | | | |
| United Kingdom: 0.57% | | | | | | | | | | | | | | | | |
Standard Chartered plc (Financials, Banks) | | | | | | | | | | | 2,805,244 | | | | 19,703,222 | |
| | | | | | | | | | | | | | | | |
| | | | |
Total Common Stocks (Cost $2,957,632,739) | | | | | | | | | | | | | | | 3,258,277,410 | |
| | | | | | | | | | | | | | | | |
The accompanying notes are an integral part of these financial statements.
| | | | | | |
| Portfolio of investments—October 31, 2018 | | Wells Fargo Emerging Markets Equity Fund | | | 15 | |
| | | | | | | | | | | | | | | | |
| Security name | | Interest rate | | | Maturity date | | | Principal | | | Value | |
| | | | |
Convertible Debentures: 0.00% | | | | | | | | | | | | | | | | |
| | | | |
| Brazil: 0.00% | | | | | | | | | | | | | | | | |
Lupatech SA (Energy, Energy Equipment & Services) †(a) | | | 6.50 | % | | | 4-15-2018 | | | $ | 303,000 | | | $ | 0 | |
| | | | | | | | | | | | | | | | |
| | | | |
Total Convertible Debentures (Cost $160,691) | | | | | | | | | | | | | | | 0 | |
| | | | | | | | | | | | | | | | |
| | | | |
| | | Dividend yield | | | | | | Shares | | | | |
| Preferred Stocks: 1.54% | | | | | | | | | | | | | | | | |
| | | | |
| Brazil: 1.54% | | | | | | | | | | | | | | | | |
Lojas Americanas SA (Consumer Discretionary, Multiline Retail) | | | 0.46 | | | | | | | | 10,600,093 | | | | 53,548,770 | |
| | | | | | | | | | | | | | | | |
| | | | |
Total Preferred Stocks (Cost $43,843,242) | | | | | | | | | | | | | | | 53,548,770 | |
| | | | | | | | | | | | | | | | |
| | | | |
| | | | | | Expiration date | | | | | | | |
| Rights: 0.00% | | | | | | | | | | | | | | | | |
| | | | |
| Chile: 0.00% | | | | | | | | | | | | | | | | |
Saci Falabella Right (Consumer Discretionary, Multiline Retail) † | | | | | | | 11-17-2018 | | | | 129,458 | | | | 13,020 | |
| | | | | | | | | | | | | | | | |
| | | | |
Total Rights (Cost $0) | | | | | | | | | | | | | | | 13,020 | |
| | | | | | | | | | | | | | | | |
| | | | |
| | | Yield | | | | | | | | | | |
| Short-Term Investments: 9.76% | | | | | | | | | | | | | | | | |
| | | | |
| Investment Companies: 9.76% | | | | | | | | | | | | | | | | |
Securities Lending Cash Investments LLC (l)(r)(u) | | | 2.33 | | | | | | | | 175,500,204 | | | | 175,517,754 | |
Wells Fargo Government Money Market Fund Select Class (l)(u) | | | 2.07 | | | | | | | | 163,110,726 | | | | 163,110,726 | |
| | | | |
Total Short-Term Investments (Cost $338,628,480) | | | | | | | | | | | | | | | 338,628,480 | |
| | | | | | | | | | | | | | | | |
| | | | | | | | |
| Total investments in securities (Cost $3,340,265,152) | | | 105.18 | % | | | 3,650,467,680 | |
Other assets and liabilities, net | | | (5.18 | ) | | | (179,907,456 | ) |
| | | | | | | | |
| Total net assets | | | 100.00 | % | | $ | 3,470,560,224 | |
| | | | | | | | |
| † | Non-income-earning security |
| « | All or a portion of this security is on loan. |
| 144A | The security may be resold in transactions exempt from registration, normally to qualified institutional buyers, pursuant to Rule 144A under the Securities Act of 1933. |
| (a) | The security is fair valued in accordance with procedures approved by the Board of Trustees. |
| (l) | The issuer of the security is an affiliated person of the Fund as defined in the Investment Company Act of 1940. |
| (u) | The rate represents the 7-day annualized yield at period end. |
| (r) | The investment is a non-registered investment company purchased with cash collateral received from securities on loan. |
Abbreviations:
| ADR | American depositary receipt |
| GDR | Global depositary receipt |
| REIT | Real estate investment trust |
The accompanying notes are an integral part of these financial statements.
| | | | |
| 16 | | Wells Fargo Emerging Markets Equity Fund | | Portfolio of investments—October 31, 2018 |
Investments in Affiliates
An affiliated investment is an investment in which the Fund owns at least 5% of the outstanding voting shares of the issuer or as a result of other relationships, such as the Fund and the issuer having the same investment manager. Transactions with issuers that were either affiliated persons of the Fund at the beginning of the period or the end of the period were as follows:
| | | | | | | | | | | | | | | | | | | | | | | | | | | | | | | | | | | | |
| | | Shares,
beginning of
period | | | Shares
purchased | | | Shares
sold | | | Shares,
end of
period | | | Net
realized
gains
(losses) | | | Net
change in
unrealized
gains
(losses) | | | Income
from
affiliated
securities | | | Value,
end
of period | | | % of
net
assets | |
Short-Term Investments | | | | | | | | | | | | | | | | | | | | | | | | | | | | | | | | | | | | |
Investment Companies | | | | | | | | | | | | | | | | | | | | | | | | | | | | | | | | | | | | |
Securities Lending Cash Investments LLC | | | 123,189,507 | | | | 1,180,335,560 | | | | 1,128,024,863 | | | | 175,500,204 | | | $ | (1,445 | ) | | $ | (248 | ) | | $ | 4,001,006 | | | $ | 175,517,754 | | | | | |
Wells Fargo Government Money Market Fund Select Class | | | 263,185,940 | | | | 570,153,291 | | | | 670,228,505 | | | | 163,110,726 | | | | 0 | | | | 0 | | | | 2,508,169 | | | | 163,110,726 | | | | | |
| | | | | | | | | | | | | | | | | | | | | | | | | | | | | | | | | | | | |
| | | | | | | | | | | | | | | | | | $ | (1,445 | ) | | $ | (248 | ) | | $ | 6,509,175 | | | $ | 338,628,480 | | | | 9.76 | % |
| | | | | | | | | | | | | | | | | | | | | | | | | | | | | | | | | | | | |
The accompanying notes are an integral part of these financial statements.
| | | | | | |
| Statement of assets and liabilities—October 31, 2018 | | Wells Fargo Emerging Markets Equity Fund | | | 17 | |
| | | | |
| | | | |
| |
Assets | | | | |
Investments in unaffiliated securities (including $170,991,492 of securities loaned), at value (cost $3,001,636,672) | | $ | 3,311,839,200 | |
Investments in affiliated securities, at value (cost $338,628,480) | | | 338,628,480 | |
Foreign currency, at value (cost $2,654,558) | | | 1,672,712 | |
Receivable for investments sold | | | 3,988,881 | |
Receivable for Fund shares sold | | | 6,513,776 | |
Receivable for dividends | | | 1,860,615 | |
Receivable for securities lending income | | | 623,755 | |
Prepaid expenses and other assets | | | 96,162 | |
| | | | |
Total assets | | | 3,665,223,581 | |
| | | | |
| |
Liabilities | | | | |
Payable upon receipt of securities loaned | | | 175,508,680 | |
Payable for investments purchased | | | 10,020,497 | |
Payable for Fund shares redeemed | | | 3,597,784 | |
Management fee payable | | | 2,902,320 | |
Administration fees payable | | | 385,182 | |
Distribution fee payable | | | 32,781 | |
Trustees’ fees and expenses payable | | | 835 | |
Accrued expenses and other liabilities | | | 2,215,278 | |
| | | | |
Total liabilities | | | 194,663,357 | |
| | | | |
Total net assets | | $ | 3,470,560,224 | |
| | | | |
| |
NET ASSETS CONSIST OF | | | | |
Paid-in capital | | $ | 3,378,908,297 | |
Total distributable earnings | | | 91,651,927 | |
| | | | |
Total net assets | | $ | 3,470,560,224 | |
| | | | |
| |
COMPUTATION OF NET ASSET VALUE AND OFFERING PRICE PER SHARE | | | | |
Net assets – Class A | | $ | 201,515,165 | |
Shares outstanding – Class A1 | | | 9,525,008 | |
Net asset value per share – Class A | | | $21.16 | |
Maximum offering price per share – Class A2 | | | $22.45 | |
Net assets – Class C | | $ | 49,102,595 | |
Shares outstanding – Class C1 | | | 2,772,128 | |
Net asset value per share – Class C | | | $17.71 | |
Net assets – Class R6 | | $ | 326,130,983 | |
Shares outstanding – Class R61 | | | 14,755,111 | |
Net asset value per share – Class R6 | | | $22.10 | |
Net assets – Administrator Class | | $ | 103,740,100 | |
Shares outstanding – Administrator Class1 | | | 4,677,481 | |
Net asset value per share – Administrator Class | | | $22.18 | |
Net assets – Institutional Class | | $ | 2,790,071,381 | |
Shares outstanding – Institutional Class1 | | | 126,257,882 | |
Net asset value per share – Institutional Class | | | $22.10 | |
| 1 | The Fund has an unlimited number of authorized shares. |
| 2 | Maximum offering price is computed as 100/94.25 of net asset value. On investments of $50,000 or more, the offering price is reduced. |
The accompanying notes are an integral part of these financial statements.
| | | | |
| 18 | | Wells Fargo Emerging Markets Equity Fund | | Statement of operations—year ended October 31, 2018 |
| | | | |
| | | | |
| |
Investment income | | | | |
Dividends (net of foreign withholding taxes of $10,022,819) | | $ | 71,382,543 | |
Securities lending income from affiliates, net | | | 4,001,006 | |
Income from affiliated securities | | | 2,508,169 | |
| | | | |
Total investment income | | | 77,891,718 | |
| | | | |
| |
Expenses | | | | |
Management fee | | | 40,667,655 | |
Administration fees | | | | |
Class A | | | 537,845 | |
Class C | | | 137,303 | |
Class R6 | | | 99,488 | |
Administrator Class | | | 175,686 | |
Institutional Class | | | 4,167,652 | |
Shareholder servicing fees | | | | |
Class A | | | 640,292 | |
Class C | | | 163,457 | |
Administrator Class | | | 336,484 | |
Distribution fee | | | | |
Class C | | | 490,370 | |
Custody and accounting fees | | | 2,859,920 | |
Professional fees | | | 64,479 | |
Registration fees | | | 188,467 | |
Shareholder report expenses | | | 1,026,617 | |
Trustees’ fees and expenses | | | 23,125 | |
Other fees and expenses | | | 104,225 | |
| | | | |
Total expenses | | | 51,683,065 | |
Less: Fee waivers and/or expense reimbursements | | | (2,215,448 | ) |
| | | | |
Net expenses | | | 49,467,617 | |
| | | | |
Net investment income | | | 28,424,101 | |
| | | | |
| |
REALIZED AND UNREALIZED GAINS (LOSSES) ON INVESTMENTS | | | | |
| |
Net realized gains (losses) on: | | | | |
Unaffiliated securities | | | 133,905,560 | |
Affiliated securities | | | (1,445 | ) |
| | | | |
Net realized gains on investments | | | 133,904,115 | |
| | | | |
| |
Net change in unrealized gains (losses) on: | | | | |
Unaffiliated securities | | | (726,816,495 | ) |
Affiliated securities | | | (248 | ) |
| | | | |
Net change in unrealized gains (losses) on investments | | | (726,816,743 | ) |
| | | | |
Net realized and unrealized gains (losses) on investments | | | (592,912,628 | ) |
| | | | |
Net decrease in net assets resulting from operations | | $ | (564,488,527 | ) |
| | | | |
The accompanying notes are an integral part of these financial statements.
| | | | | | |
| Statement of changes in net assets | | Wells Fargo Emerging Markets Equity Fund | | | 19 | |
| | | | | | | | | | | | | | | | |
| | | Year ended
October 31, 2018 | | | Year ended
October 31, 20171 | |
| | | | |
Operations | | | | | | | | | | | | | | | | |
Net investment income | | | | | | $ | 28,424,101 | | | | | | | $ | 21,306,015 | |
Net realized gains (losses) on investments | | | | | | | 133,904,115 | | | | | | | | (18,464,395 | ) |
Net change in unrealized gains (losses) on investments | | | | | | | (726,816,743 | ) | | | | | | | 680,820,622 | |
| | | | |
Net increase (decrease) in net assets resulting from operations | | | | | | | (564,488,527 | ) | | | | | | | 683,662,242 | |
| | | | |
| | | | |
Distributions to shareholders from net investment income and net realized gains | | | | | | | | | | | | | | | | |
Class A | | | | | | | (404,835 | ) | | | | | | | (5,313,014 | ) |
Class R6 | | | | | | | (1,790,475 | ) | | | | | | | (2,098,471 | ) |
Administrator Class | | | | | | | (661,746 | ) | | | | | | | (1,140,541 | ) |
Institutional Class | | | | | | | (25,196,461 | ) | | | | | | | (18,026,382 | ) |
| | | | |
Total distributions to shareholders | | | | | | | (28,053,517 | ) | | | | | | | (26,578,408 | ) |
| | | | |
| | | | |
Capital share transactions | | | Shares | | | | | | | | Shares | | | | | |
Proceeds from shares sold | | | | | | | | | | | | | | | | |
Class A | | | 1,350,584 | | | | 33,600,538 | | | | 6,942,787 | | | | 140,950,802 | |
Class C | | | 291,733 | | | | 6,178,273 | | | | 442,470 | | | | 8,292,373 | |
Class R6 | | | 10,252,838 | | | | 266,424,444 | | | | 3,436,746 | | | | 79,020,347 | |
Administrator Class | | | 1,081,213 | | | | 28,234,197 | | | | 1,621,779 | | | | 36,816,903 | |
Institutional Class | | | 34,959,495 | | | | 889,495,518 | | | | 71,588,783 | | | | 1,652,655,030 | |
| | | | |
| | | | | | | 1,223,932,970 | | | | | | | | 1,917,735,455 | |
| | | | |
Reinvestment of distributions | | | | | | | | | | | | | | | | |
Class A | | | 14,491 | | | | 366,464 | | | | 274,903 | | | | 5,190,176 | |
Class R6 | | | 67,570 | | | | 1,778,432 | | | | 105,864 | | | | 2,085,516 | |
Administrator Class | | | 24,247 | | | | 642,315 | | | | 54,161 | | | | 1,073,463 | |
Institutional Class | | | 911,147 | | | | 23,990,497 | | | | 841,119 | | | | 16,578,453 | |
| | | | |
| | | | | | | 26,777,708 | | | | | | | | 24,927,608 | |
| | | | |
Payment for shares redeemed | | | | | | | | | | | | | | | | |
Class A | | | (2,647,031 | ) | | | (64,505,596 | ) | | | (39,090,896 | ) | | | (823,196,611 | ) |
Class B | | | N/A | | | | N/A | | | | (34,219 | )2 | | | (614,939 | )2 |
Class C | | | (858,659 | ) | | | (17,586,266 | ) | | | (1,264,603 | ) | | | (23,051,252 | ) |
Class R6 | | | (2,986,490 | ) | | | (77,195,964 | ) | | | (5,032,929 | ) | | | (110,185,480 | ) |
Administrator Class | | | (1,964,822 | ) | | | (50,914,883 | ) | | | (3,599,740 | ) | | | (80,342,148 | ) |
Institutional Class | | | (41,331,810 | ) | | | (1,076,350,034 | ) | | | (25,803,379 | ) | | | (588,537,786 | ) |
| | | | |
| | | | | | | (1,286,552,743 | ) | | | | | | | (1,625,928,216 | ) |
| | | | |
Net increase (decrease) in net assets resulting from capital share transactions | | | | | | | (35,842,065 | ) | | | | | | | 316,734,847 | |
| | | | |
Total increase (decrease) in net assets | | | | | | | (628,384,109 | ) | | | | | | | 973,818,681 | |
| | | | |
| | | | |
Net assets | | | | | | | | | | | | | | | | |
Beginning of period | | | | | | | 4,098,944,333 | | | | | | | | 3,125,125,652 | |
| | | | |
End of period | | | | | | $ | 3,470,560,224 | | | | | | | $ | 4,098,944,333 | |
| | | | |
| 1 | Effective for all filings after November 4, 2018, the SEC prospectively eliminated the requirement to parenthetically disclose undistributed net investment income at the end of the period and permitted the aggregation of distributions, with the exception of tax basis returns of capital. Undistributed net investment income at October 31, 2017 was $13,070,041. The disaggregated distributions information for the year ended October 31, 2017 is included in Note 7, Distributions to Shareholders, in the notes to the financial statements. |
| 2 | For the period from November 1, 2016 to May 5, 2017. Effective at the close of business on May 5, 2017, Class B shares were converted to Class A shares and are no longer offered by the Fund. |
The accompanying notes are an integral part of these financial statements.
| | | | |
| 20 | | Wells Fargo Emerging Markets Equity Fund | | Financial highlights |
(For a share outstanding throughout each period)
| | | | | | | | | | | | | | | | | | | | |
| | | Year ended October 31 | |
| CLASS A | | 2018 | | | 2017 | | | 2016 | | | 2015 | | | 2014 | |
Net asset value, beginning of period | | | $24.83 | | | | $20.49 | | | | $18.09 | | | | $21.44 | | | | $21.77 | |
Net investment income (loss) | | | 0.07 | | | | (0.03 | )1 | | | 0.12 | | | | 0.08 | | | | 0.07 | |
Net realized and unrealized gains (losses) on investments | | | (3.70 | ) | | | 4.50 | | | | 2.38 | | | | (3.29 | ) | | | (0.40 | ) |
| | | | | | | | | | | | | | | | | | | | |
Total from investment operations | | | (3.63 | ) | | | 4.47 | | | | 2.50 | | | | (3.21 | ) | | | (0.33 | ) |
Distributions to shareholders from | | | | | | | | | | | | | | | | | | | | |
Net investment income | | | (0.04 | ) | | | (0.13 | ) | | | (0.10 | ) | | | (0.14 | ) | | | 0.00 | |
Net asset value, end of period | | | $21.16 | | | | $24.83 | | | | $20.49 | | | | $18.09 | | | | $21.44 | |
Total return2 | | | (14.65 | )% | | | 21.99 | % | | | 13.93 | % | | | (15.02 | )% | | | (1.52 | )% |
Ratios to average net assets (annualized) | | | | | | | | | | | | | | | | | | | | |
Gross expenses | | | 1.58 | % | | | 1.58 | % | | | 1.64 | % | | | 1.64 | % | | | 1.64 | % |
Net expenses | | | 1.57 | % | | | 1.58 | % | | | 1.60 | % | | | 1.64 | % | | | 1.64 | % |
Net investment income (loss) | | | 0.38 | % | | | (0.13 | )% | | | 0.64 | % | | | 0.37 | % | | | 0.36 | % |
Supplemental data | | | | | | | | | | | | | | | | | | | | |
Portfolio turnover rate | | | 11 | % | | | 13 | % | | | 8 | % | | | 8 | % | | | 7 | % |
Net assets, end of period (000s omitted) | | | $201,515 | | | | $268,384 | | | | $874,625 | | | | $873,992 | | | | $1,502,597 | |
| 1 | Calculated based upon average shares outstanding |
| 2 | Total return calculations do not include any sales charges. |
The accompanying notes are an integral part of these financial statements.
| | | | | | |
| Financial highlights | | Wells Fargo Emerging Markets Equity Fund | | | 21 | |
(For a share outstanding throughout each period)
| | | | | | | | | | | | | | | | | | | | |
| | | Year ended October 31 | |
| CLASS C | | 2018 | | | 2017 | | | 2016 | | | 2015 | | | 2014 | |
Net asset value, beginning of period | | | $20.92 | | | | $17.28 | | | | $15.28 | | | | $18.11 | | | | $18.53 | |
Net investment loss | | | (0.08 | )1 | | | (0.08 | )1 | | | (0.02 | )1 | | | (0.06 | )1 | | | (0.08 | )1 |
Net realized and unrealized gains (losses) on investments | | | (3.13 | ) | | | 3.72 | | | | 2.02 | | | | (2.77 | ) | | | (0.34 | ) |
| | | | | | | | | | | | | | | | | | | | |
Total from investment operations | | | (3.21 | ) | | | 3.64 | | | | 2.00 | | | | (2.83 | ) | | | (0.42 | ) |
Net asset value, end of period | | | $17.71 | | | | $20.92 | | | | $17.28 | | | | $15.28 | | | | $18.11 | |
Total return2 | | | (15.34 | )% | | | 21.06 | % | | | 13.09 | % | | | (15.63 | )% | | | (2.27 | )% |
Ratios to average net assets (annualized) | | | | | | | | | | | | | | | | | | | | |
Gross expenses | | | 2.33 | % | | | 2.31 | % | | | 2.39 | % | | | 2.39 | % | | | 2.39 | % |
Net expenses | | | 2.32 | % | | | 2.31 | % | | | 2.35 | % | | | 2.39 | % | | | 2.39 | % |
Net investment loss | | | (0.38 | )% | | | (0.43 | )% | | | (0.12 | )% | | | (0.39 | )% | | | (0.42 | )% |
Supplemental data | | | | | | | | | | | | | | | | | | | | |
Portfolio turnover rate | | | 11 | % | | | 13 | % | | | 8 | % | | | 8 | % | | | 7 | % |
Net assets, end of period (000s omitted) | | | $49,103 | | | | $69,845 | | | | $71,900 | | | | $84,004 | | | | $138,169 | |
| 1 | Calculated based upon average shares outstanding |
| 2 | Total return calculations do not include any sales charges. |
The accompanying notes are an integral part of these financial statements.
| | | | |
| 22 | | Wells Fargo Emerging Markets Equity Fund | | Financial highlights |
(For a share outstanding throughout each period)
| | | | | | | | | | | | | | | | | | | | |
| | | Year ended October 31 | |
| CLASS R6 | | 2018 | | | 2017 | | | 2016 | | | 2015 | | | 2014 | |
Net asset value, beginning of period | | | $26.00 | | | | $21.46 | | | | $19.00 | | | | $22.53 | | | | $22.86 | |
Net investment income | | | 0.23 | 1 | | | 0.17 | 1 | | | 0.23 | 1 | | | 0.19 | | | | 0.21 | |
Net realized and unrealized gains (losses) on investments | | | (3.92 | ) | | | 4.59 | | | | 2.46 | | | | (3.46 | ) | | | (0.44 | ) |
| | | | | | | | | | | | | | | | | | | | |
Total from investment operations | | | (3.69 | ) | | | 4.76 | | | | 2.69 | | | | (3.27 | ) | | | (0.23 | ) |
Distributions to shareholders from | | | | | | | | | | | | | | | | | | | | |
Net investment income | | | (0.21 | ) | | | (0.22 | ) | | | (0.23 | ) | | | (0.26 | ) | | | (0.10 | ) |
Net asset value, end of period | | | $22.10 | | | | $26.00 | | | | $21.46 | | | | $19.00 | | | | $22.53 | |
Total return | | | (14.33 | )% | | | 22.53 | % | | | 14.43 | % | | | (14.61 | )% | | | (1.01 | )% |
Ratios to average net assets (annualized) | | | | | | | | | | | | | | | | | | | | |
Gross expenses | | | 1.16 | % | | | 1.14 | % | | | 1.20 | % | | | 1.19 | % | | | 1.17 | % |
Net expenses | | | 1.15 | % | | | 1.14 | % | | | 1.17 | % | | | 1.18 | % | | | 1.17 | % |
Net investment income | | | 0.90 | % | | | 0.76 | % | | | 1.16 | % | | | 0.84 | % | | | 0.88 | % |
Supplemental data | | | | | | | | | | | | | | | | | | | | |
Portfolio turnover rate | | | 11 | % | | | 13 | % | | | 8 | % | | | 8 | % | | | 7 | % |
Net assets, end of period (000s omitted) | | | $326,131 | | | | $192,929 | | | | $191,250 | | | | $95,190 | | | | $35,967 | |
| 1 | Calculated based upon average shares outstanding |
The accompanying notes are an integral part of these financial statements.
| | | | | | |
| Financial highlights | | Wells Fargo Emerging Markets Equity Fund | | | 23 | |
(For a share outstanding throughout each period)
| | | | | | | | | | | | | | | | | | | | |
| | | Year ended October 31 | |
| ADMINISTRATOR CLASS | | 2018 | | | 2017 | | | 2016 | | | 2015 | | | 2014 | |
Net asset value, beginning of period | | | $26.08 | | | | $21.53 | | | | $18.99 | | | | $22.44 | | | | $22.79 | |
Net investment income | | | 0.12 | 1 | | | 0.10 | 1 | | | 0.15 | 1 | | | 0.12 | 1 | | | 0.13 | 1 |
Net realized and unrealized gains (losses) on investments | | | (3.90 | ) | | | 4.61 | | | | 2.50 | | | | (3.46 | ) | | | (0.44 | ) |
| | | | | | | | | | | | | | | | | | | | |
Total from investment operations | | | (3.78 | ) | | | 4.71 | | | | 2.65 | | | | (3.34 | ) | | | (0.31 | ) |
Distributions to shareholders from | | | | | | | | | | | | | | | | | | | | |
Net investment income | | | (0.12 | ) | | | (0.16 | ) | | | (0.11 | ) | | | (0.11 | ) | | | (0.04 | ) |
Net asset value, end of period | | | $22.18 | | | | $26.08 | | | | $21.53 | | | | $18.99 | | | | $22.44 | |
Total return | | | (14.57 | )% | | | 22.10 | % | | | 14.07 | % | | | (14.91 | )% | | | (1.36 | )% |
Ratios to average net assets (annualized) | | | | | | | | | | | | | | | | | | | | |
Gross expenses | | | 1.50 | % | | | 1.48 | % | | | 1.56 | % | | | 1.49 | % | | | 1.48 | % |
Net expenses | | | 1.46 | % | | | 1.46 | % | | | 1.49 | % | | | 1.48 | % | | | 1.48 | % |
Net investment income | | | 0.48 | % | | | 0.42 | % | | | 0.76 | % | | | 0.58 | % | | | 0.57 | % |
Supplemental data | | | | | | | | | | | | | | | | | | | | |
Portfolio turnover rate | | | 11 | % | | | 13 | % | | | 8 | % | | | 8 | % | | | 7 | % |
Net assets, end of period (000s omitted) | | | $103,740 | | | | $144,421 | | | | $160,657 | | | | $181,224 | | | | $464,135 | |
| 1 | Calculated based upon average shares outstanding |
The accompanying notes are an integral part of these financial statements.
| | | | |
| 24 | | Wells Fargo Emerging Markets Equity Fund | | Financial highlights |
(For a share outstanding throughout each period)
| | | | | | | | | | | | | | | | | | | | |
| | | Year ended October 31 | |
| INSTITUTIONAL CLASS | | 2018 | | | 2017 | | | 2016 | | | 2015 | | | 2014 | |
Net asset value, beginning of period | | | $25.99 | | | | $21.46 | �� | | | $18.99 | | | | $22.52 | | | | $22.86 | |
Net investment income | | | 0.19 | | | | 0.19 | 1 | | | 0.20 | 1 | | | 0.17 | | | | 0.15 | |
Net realized and unrealized gains (losses) on investments | | | (3.89 | ) | | | 4.55 | | | | 2.49 | | | | (3.45 | ) | | | (0.40 | ) |
| | | | | | | | | | | | | | | | | | | | |
Total from investment operations | | | (3.70 | ) | | | 4.74 | | | | 2.69 | | | | (3.28 | ) | | | (0.25 | ) |
Distributions to shareholders from | | | | | | | | | | | | | | | | | | | | |
Net investment income | | | (0.19 | ) | | | (0.21 | ) | | | (0.22 | ) | | | (0.25 | ) | | | (0.09 | ) |
Net asset value, end of period | | | $22.10 | | | | $25.99 | | | | $21.46 | | | | $18.99 | | | | $22.52 | |
Total return | | | (14.35 | )% | | | 22.42 | % | | | 14.40 | % | | | (14.66 | )% | | | (1.09 | )% |
Ratios to average net assets (annualized) | | | | | | | | | | | | | | | | | | | | |
Gross expenses | | | 1.25 | % | | | 1.23 | % | | | 1.31 | % | | | 1.24 | % | | | 1.21 | % |
Net expenses | | | 1.19 | % | | | 1.20 | % | | | 1.22 | % | | | 1.22 | % | | | 1.21 | % |
Net investment income | | | 0.75 | % | | | 0.82 | % | | | 1.04 | % | | | 0.82 | % | | | 0.77 | % |
Supplemental data | | | | | | | | | | | | | | | | | | | | |
Portfolio turnover rate | | | 11 | % | | | 13 | % | | | 8 | % | | | 8 | % | | | 7 | % |
Net assets, end of period (000s omitted) | | | $2,790,071 | | | | $3,423,366 | | | | $1,826,097 | | | | $2,146,675 | | | | $2,900,353 | |
| 1 | Calculated based upon average shares outstanding |
The accompanying notes are an integral part of these financial statements.
| | | | | | |
| Notes to financial statements | | Wells Fargo Emerging Markets Equity Fund | | | 25 | |
1. ORGANIZATION
Wells Fargo Funds Trust (the “Trust”), a Delaware statutory trust organized on March 10, 1999, is an open-end management investment company registered under the Investment Company Act of 1940, as amended (the “1940 Act”). As an investment company, the Trust follows the accounting and reporting guidance in Financial Accounting Standards Board (“FASB”) Accounting Standards Codification Topic 946, Financial Services – Investment Companies. These financial statements report on the Wells Fargo Emerging Markets Equity Fund (the “Fund”) which is a diversified series of the Trust.
Effective at the close of business on May 5, 2017, Class B shares were converted to Class A shares and are no longer offered by the Fund. Information for Class B shares reflected in the financial statements represents activity through May 5, 2017.
2. SIGNIFICANT ACCOUNTING POLICIES
The following significant accounting policies, which are consistently followed in the preparation of the financial statements of the Fund, are in conformity with U.S. generally accepted accounting principles which require management to make estimates and assumptions that affect the reported amounts of assets and liabilities, disclosure of contingent assets and liabilities at the date of the financial statements, and the reported amounts of revenues and expenses during the reporting period. Actual results could differ from those estimates.
Securities valuation
All investments are valued each business day as of the close of regular trading on the New York Stock Exchange (generally 4 p.m. Eastern Time), although the Fund may deviate from this calculation time under unusual or unexpected circumstances.
Equity securities that are listed on a foreign or domestic exchange or market are valued at the official closing price or, if none, the last sales price. If no sale occurs on the principal exchange or market that day, a fair value price will be determined in accordance with the Fund’s Valuation Procedures.
The values of securities denominated in foreign currencies are translated into U.S. dollars at rates provided by an independent foreign currency pricing source at a time each business day specified by the Wells Fargo Asset Management Pricing Committee at Wells Fargo Funds Management, LLC (“Funds Management”).
Many securities markets and exchanges outside the U.S. close prior to the close of the New York Stock Exchange and therefore may not fully reflect trading or events that occur after the close of the principal exchange in which the foreign securities are traded, but before the close of the New York Stock Exchange. If such trading or events are expected to materially affect the value of such securities, then fair value pricing procedures approved by the Board of Trustees of the Fund are applied. These procedures take into account multiple factors including movements in U.S. securities markets after foreign exchanges close. Foreign securities that are fair valued under these procedures are categorized as Level 2 and the application of these procedures may result in transfers between Level 1 and Level 2. Depending on market activity, such fair valuations may be frequent. Such fair value pricing may result in net asset values that are higher or lower than net asset values based on the last reported sales price or latest quoted bid price. On October 31, 2018, such fair value pricing was not used in pricing foreign securities
Debt securities are valued at the evaluated bid price provided by an independent pricing service (e.g. taking into account various factors, including yields, maturities, or credit ratings) or, if a reliable price is not available, the quoted bid price from an independent broker-dealer.
Investments in registered open-end investment companies are valued at net asset value. Interests in non-registered investment companies that are redeemable at net asset value are fair valued normally at net asset value.
Investments which are not valued using any of the methods discussed above are valued at their fair value, as determined in good faith by the Board of Trustees. The Board of Trustees has established a Valuation Committee comprised of the Trustees and has delegated to it the authority to take any actions regarding the valuation of portfolio securities that the Valuation Committee deems necessary or appropriate, including determining the fair value of portfolio securities, unless the determination has been delegated to the Wells Fargo Asset Management Pricing Committee. The Board of Trustees retains the authority to make or ratify any valuation decisions or approve any changes to the Valuation Procedures as it deems appropriate. On a quarterly basis, the Board of Trustees receives reports on any valuation actions taken by the Valuation Committee or the Wells Fargo Asset Management Pricing Committee which may include items for ratification.
Foreign currency translation
The accounting records of the Fund are maintained in U.S. dollars. The values of other assets and liabilities denominated in foreign currencies are translated into U.S. dollars at rates provided by an independent foreign currency pricing source at a
| | | | |
| 26 | | Wells Fargo Emerging Markets Equity Fund | | Notes to financial statements |
time each business day specified by the Management Valuation Team. Purchases and sales of securities, and income and expenses are converted at the rate of exchange on the respective dates of such transactions. Net realized foreign exchange gains or losses arise from sales of foreign currencies, currency gains or losses realized between the trade and settlement dates on securities transactions, and the difference between the amounts of dividends, interest and foreign withholding taxes recorded and the U.S. dollar equivalent of the amounts actually paid or received. Net unrealized foreign exchange gains and losses arise from changes in the fair value of assets and liabilities other than investments in securities resulting from changes in exchange rates. The changes in net assets arising from changes in exchange rates of securities and the changes in net assets resulting from changes in market prices of securities are not separately presented. Such changes are included in net realized and unrealized gains or losses from investments.
Forward foreign currency contracts
The Fund is subject to foreign currency risk in the normal course of pursuing its investment objectives. A forward foreign currency contract is an agreement between two parties to purchase or sell a specific currency for an agreed-upon price at a future date. The Fund enters into forward foreign currency contracts to facilitate transactions in foreign-denominated securities and to attempt to minimize the risk to the Fund from adverse changes in the relationship between currencies. Forward foreign currency contracts are recorded at the forward rate and marked-to-market daily. When the contracts are closed, realized gains and losses arising from such transactions are recorded as realized gains or losses on forward foreign currency contract transactions. The Fund could be exposed to risks if the counterparties to the contracts are unable to meet the terms of their contracts or if the value of the foreign currency changes unfavorably. The Fund’s maximum risk of loss from counterparty credit risk is the unrealized gains on the contracts. This risk may be mitigated if there is a master netting arrangement between the Fund and the counterparty.
Securities lending
The Fund may lend its securities from time to time in order to earn additional income in the form of fees or interest on securities received as collateral or the investment of any cash received as collateral. The Fund continues to receive interest or dividends on the securities loaned. The Fund receives collateral in the form of cash or securities with a value at least equal to the value of the securities on loan. The value of the loaned securities is determined at the close of each business day and any additional required collateral is delivered to the Fund on the next business day. In a securities lending transaction, the net asset value of the Fund will be affected by an increase or decrease in the value of the securities loaned and by an increase or decrease in the value of the instrument in which collateral is invested. The amount of securities lending activity undertaken by the Fund fluctuates from time to time. In the event of default or bankruptcy by the borrower, the Fund may be prevented from recovering the loaned securities or gaining access to the collateral or may experience delays or costs in doing so. In addition, the investment of any cash collateral received may lose all or part of its value. The Fund has the right under the lending agreement to recover the securities from the borrower on demand.
The Fund lends its securities through an unaffiliated securities lending agent. Cash collateral received in connection with its securities lending transactions is invested in Securities Lending Cash Investments, LLC (the “Securities Lending Fund”). The Securities Lending Fund is exempt from registration under Section 3(c)(7) of the 1940 Act and is managed by Funds Management and is subadvised by Wells Capital Management Incorporated (“WellsCap”), an affiliate of Funds Management and an indirect wholly owned subsidiary of Wells Fargo & Company (“Wells Fargo”). Funds Management receives an advisory fee starting at 0.05% and declining to 0.01% as the average daily net assets of the Securities Lending Fund increase. All of the fees received by Funds Management are paid to WellsCap for its services as subadviser. The Securities Lending Fund seeks to provide a positive return compared to the daily Fed Funds Open Rate by investing in high-quality, U.S. dollar-denominated short-term money market instruments. Securities Lending Fund investments are valued at the evaluated bid price provided by an independent pricing service. Income earned from investment in the Securities Lending Fund is included in securities lending income from affiliates (net of fees and rebates) on the Statement of Operations.
Security transactions and income recognition
Securities transactions are recorded on a trade date basis. Realized gains or losses are recorded on the basis of identified cost.
Dividend income is recognized on the ex-dividend date, except for certain dividends from foreign securities, which are recorded as soon as the custodian verifies the ex-dividend date. Dividend income from foreign securities is recorded net of foreign taxes withheld where recovery of such taxes is not assured.
Interest income is accrued daily and bond discounts are accreted and premiums are amortized daily. To the extent debt obligations are placed on non-accrual status, any related interest income may be reduced by writing off interest receivables when the collection of all or a portion of interest has been determined to be doubtful based on consistently
| | | | | | |
| Notes to financial statements | | Wells Fargo Emerging Markets Equity Fund | | | 27 | |
applied procedures and the fair value has decreased. If the issuer subsequently resumes interest payments or when the collectability of interest is reasonably assured, the debt obligation is removed from non-accrual status.
Distributions to shareholders
Distributions to shareholders from net investment income and any net realized gains are recorded on the ex-dividend date and paid at least annually. Such distributions are determined in accordance with income tax regulations and may differ from U.S. generally accepted accounting principles. Dividend sources are estimated at the time of declaration. The tax character of distributions is determined as of the Fund’s fiscal year end. Therefore, a portion of the Fund’s distributions made prior to the Fund’s fiscal year end may be categorized as a tax return of capital at year end.
Federal and other taxes
The Fund intends to continue to qualify as a regulated investment company by distributing substantially all of its investment company taxable income and any net realized capital gains (after reduction for capital loss carryforwards) sufficient to relieve it from all, or substantially all, federal income taxes. Accordingly, no provision for federal income taxes was required.
The Fund’s income and federal excise tax returns and all financial records supporting those returns for the prior three fiscal years are subject to examination by the federal and Delaware revenue authorities. Management has analyzed the Fund’s tax positions taken on federal, state, and foreign tax returns for all open tax years and does not believe that there are any uncertain tax positions that require recognition of a tax liability.
As of October 31, 2018, the aggregate cost of all investments for federal income tax purposes was $3,362,742,172 and the unrealized gains (losses) consisted of:
| | | | |
Gross unrealized gains | | $ | 795,611,640 | |
Gross unrealized losses | | | (507,886,132 | ) |
Net unrealized gains | | $ | 287,725,508 | |
As of October 31, 2018, the Fund had capital loss carryforwards which consist of $4,461,268 in short-term capital losses and $218,660,038 in long-term capital losses.
Class allocations
The separate classes of shares offered by the Fund differ principally in applicable sales charges, distribution, shareholder servicing, and administration fees. Class specific expenses are charged directly to that share class. Investment income, common expenses, and realized and unrealized gains (losses) on investments are allocated daily to each class of shares based on the relative proportion of net assets of each class.
3. FAIR VALUATION MEASUREMENTS
Fair value measurements of investments are determined within a framework that has established a fair value hierarchy based upon the various data inputs utilized in determining the value of the Fund’s investments. The three-level hierarchy gives the highest priority to unadjusted quoted prices in active markets for identical assets or liabilities (Level 1) and the lowest priority to unobservable inputs (Level 3). The Fund’s investments are classified within the fair value hierarchy based on the lowest level of input that is significant to the fair value measurement. The inputs are summarized into three broad levels as follows:
| ∎ | | Level 1 – quoted prices in active markets for identical securities |
| ∎ | | Level 2 – other significant observable inputs (including quoted prices for similar securities, interest rates, prepayment speeds, credit risk, etc.) |
| ∎ | | Level 3 – significant unobservable inputs (including the Fund’s own assumptions in determining the fair value of investments) |
The inputs or methodologies used for valuing investments in securities are not necessarily an indication of the risk associated with investing in those securities.
| | | | |
| 28 | | Wells Fargo Emerging Markets Equity Fund | | Notes to financial statements |
The following is a summary of the inputs used in valuing the Fund’s assets and liabilities as of October 31, 2018:
| | | | | | | | | | | | | | | | |
| | | Quoted prices
(Level 1) | | | Other significant
observable inputs
(Level 2) | | | Significant
unobservable inputs (Level 3) | | | Total | |
Assets | | | | | | | | | | | | | | | | |
Investments in: | | | | | | | | | | | | | | | | |
| | | | |
Common stocks | | | | | | | | | | | | | | | | |
Argentina | | $ | 17,717,700 | | | $ | 0 | | | $ | 0 | | | $ | 17,717,700 | |
Brazil | | | 297,504,648 | | | | 0 | | | | 0 | | | | 297,504,648 | |
Chile | | | 64,117,737 | | | | 0 | | | | 0 | | | | 64,117,737 | |
China | | | 1,030,922,098 | | | | 0 | | | | 0 | | | | 1,030,922,098 | |
Colombia | | | 16,342,256 | | | | 0 | | | | 0 | | | | 16,342,256 | |
Hong Kong | | | 165,224,064 | | | | 0 | | | | 0 | | | | 165,224,064 | |
India | | | 298,387,778 | | | | 0 | | | | 0 | | | | 298,387,778 | |
Indonesia | | | 69,697,036 | | | | 0 | | | | 0 | | | | 69,697,036 | |
Luxembourg | | | 9,315,621 | | | | 0 | | | | 0 | | | | 9,315,621 | |
Malaysia | | | 30,957,150 | | | | 0 | | | | 0 | | | | 30,957,150 | |
Mexico | | | 192,628,496 | | | | 0 | | | | 0 | | | | 192,628,496 | |
Peru | | | 14,981,731 | | | | 0 | | | | 0 | | | | 14,981,731 | |
Philippines | | | 31,738,036 | | | | 0 | | | | 0 | | | | 31,738,036 | |
Russia | | | 89,212,445 | | | | 8,218,548 | | | | 0 | | | | 97,430,993 | |
Singapore | | | 6,124,913 | | | | 0 | | | | 0 | | | | 6,124,913 | |
South Africa | | | 102,007,816 | | | | 0 | | | | 0 | | | | 102,007,816 | |
South Korea | | | 381,593,635 | | | | 0 | | | | 0 | | | | 381,593,635 | |
Taiwan | | | 316,995,478 | | | | 0 | | | | 0 | | | | 316,995,478 | |
Thailand | | | 90,419,610 | | | | 0 | | | | 0 | | | | 90,419,610 | |
Turkey | | | 2,587,572 | | | | 0 | | | | 0 | | | | 2,587,572 | |
United Arab Emirates | | | 1,879,820 | | | | 0 | | | | 0 | | | | 1,879,820 | |
United Kingdom | | | 19,703,222 | | | | 0 | | | | 0 | | | | 19,703,222 | |
| | | | |
Convertible debentures | | | 0 | | | | 0 | | | | 0 | | | | 0 | |
| | | | |
Preferred stocks | | | | | | | | | | | | | | | | |
Brazil | | | 53,548,770 | | | | 0 | | | | 0 | | | | 53,548,770 | |
| | | | |
Rights | | | | | | | | | | | | | | | | |
Chile | | | 0 | | | | 13,020 | | | | 0 | | | | 13,020 | |
| | | | |
Short-term investments | | | | | | | | | | | | | | | | |
Investment companies | | | 163,110,726 | | | | 175,517,754 | | | | 0 | | | | 338,628,480 | |
Total assets | | $ | 3,466,718,358 | | | $ | 183,749,322 | | | $ | 0 | | | $ | 3,650,467,680 | |
Additional sector, industry or geographic detail is included in the Portfolio of Investments.
At October 31, 2018, the Fund did not have any transfers into/out of Level 3.
4. TRANSACTIONS WITH AFFILIATES
Management fee
Funds Management, an indirect wholly owned subsidiary of Wells Fargo, is the manager of the Fund and provides advisory and fund-level administrative services under an investment management agreement. Under the investment management agreement, Funds Management is responsible for, among other services, implementing the investment objectives and strategies of the Fund, supervising the subadviser and providing fund-level administrative services in connection with the Fund’s operations. As compensation for its services under the investment management agreement, Funds Management is entitled to receive an annual management fee starting at 1.05% and declining to 0.945% as the average daily net assets of the Fund increase. For the year ended October 31, 2018, the management fee was equivalent to an annual rate of 1.02% of the Fund’s average daily net assets.
| | | | | | |
| Notes to financial statements | | Wells Fargo Emerging Markets Equity Fund | | | 29 | |
Funds Management has retained the services of a subadviser to provide daily portfolio management to the Fund. The fee for subadvisory services is borne by Funds Management. WellsCap is the subadviser to the Fund and is entitled to receive a fee from Funds Management at an annual rate starting at 0.65% and declining to 0.45% as the average daily net assets of the Fund increase.
Administration fees
Under a class-level administration agreement, Funds Management provides class-level administrative services to the Fund, which includes paying fees and expenses for services provided by the transfer agent, sub-transfer agents, omnibus account servicers and record-keepers. As compensation for its services under the class-level administration agreement, Funds Management receives an annual fee which is calculated based on the average daily net assets of each class as follows:
| | | | |
| | | Class-level
administration fee | |
Class A, Class C | | | 0.21 | % |
Class R6 | | | 0.03 | |
Administrator Class, Institutional Class | | | 0.13 | |
Funds Management has contractually waived and/or reimbursed management and administration fees to the extent necessary to maintain certain net operating expense ratios for the Fund. When each class of the Fund has exceeded its expense cap, Funds Management has waived fees and/or reimbursed expenses from fund level expenses on a proportionate basis and then from class specific expenses; otherwise, waivers and/or reimbursements are applied against class specific expenses before fund level expenses. Funds Management has committed through February 28, 2019 to waive fees and/or reimburse expenses to the extent necessary to cap the Fund’s expenses at 1.58% for Class A shares, 2.33% for Class C shares, 1.15% for Class R6 shares, 1.46% for Administrator Class shares, and 1.19% for Institutional Class shares. After this time, the cap may be increased or the commitment to maintain the cap may be terminated only with the approval of the Board of Trustees.
Distribution fee
The Trust has adopted a distribution plan Class C shares of the Fund pursuant to Rule 12b-1 under the 1940 Act. A distribution fee is charged to Class C shares and paid to Wells Fargo Funds Distributor, LLC (“Funds Distributor”), the principal underwriter, at an annual rate of 0.75% of the average daily net assets of Class C shares.
In addition, Funds Distributor is entitled to receive the front-end sales charge from the purchase of Class A shares and a contingent deferred sales charge on the redemption of certain Class A shares. Funds Distributor is also entitled to receive the contingent deferred sales charges from redemptions of Class C shares. For the year ended October 31, 2018, Funds Distributor received $26,261 from the sale of Class A shares and $82 in contingent deferred sales charges from redemptions of Class C. No contingent deferred sales charges were incurred by Class A shares for the year ended October 31, 2018.
Shareholder servicing fees
The Trust has entered into contracts with one or more shareholder servicing agents, whereby Class A, Class C, and Administrator Class of the Fund are charged a fee at an annual rate of 0.25% of the average daily net assets of each respective class.
A portion of these total shareholder servicing fees were paid to affiliates of Wells Fargo.
Interfund transactions
The Fund may purchase or sell portfolio investment securities to certain other Wells Fargo affiliates pursuant to Rule 17a-7 of the 1940 Act and under procedures adopted by the Board of Trustees. The procedures have been designed to ensure that these interfund transactions, which do not incur broker commissions, are effected at current market prices.
5. INVESTMENT PORTFOLIO TRANSACTIONS
Purchases and sales of investments, excluding U.S. government obligations (if any) and short-term securities, for the year ended October 31, 2018 were $483,355,978 and $416,857,824, respectively.
6. BANK BORROWINGS
The Trust (excluding the money market funds), Wells Fargo Master Trust and Wells Fargo Variable Trust are parties to a $280,000,000 revolving credit agreement whereby the Fund is permitted to use bank borrowings for temporary or
| | | | |
| 30 | | Wells Fargo Emerging Markets Equity Fund | | Notes to financial statements |
emergency purposes, such as to fund shareholder redemption requests. Interest under the credit agreement is charged to the Fund based on a borrowing rate equal to the higher of the Federal Funds rate in effect on that day plus 1.25% or the overnight LIBOR rate in effect on that day plus 1.25%. In addition, an annual commitment fee equal to 0.25% of the unused balance is allocated to each participating fund.
For the year ended October 31, 2018, there were no borrowings by the Fund under the agreement.
7. DISTRIBUTIONS TO SHAREHOLDERS
The tax character of distributions paid was $28,053,517 and $26,578,408 of ordinary income for the years ended October 31, 2018 and October 31, 2017, respectively.
As of October 31, 2018, the components of distributable earnings on a tax basis were as follows:
| | | | |
Undistributed
ordinary
income | | Unrealized
gains | | Capital loss
carryforward |
| $28,090,110 | | $286,691,822 | | $(223,121,306) |
Effective for all filings after November 4, 2018, the Securities and Exchange Commission eliminated the requirement to separately state the components of distributions to shareholders. The amounts of distributions to shareholders for the year ended October 31, 2017 were as follows:
| | | | |
| | | Net investment
income | |
Class A | | | $5,313,014 | |
Class R6 | | | 2,098,471 | |
Administrator Class | | | 1,140,541 | |
Institutional Class | | | 18,026,382 | |
8. CONCENTRATION RISKS
Concentration risks result from exposure to a limited number of sectors or geographic regions. A fund that invest a substantial portion of their assets in any sector or geographic region may be more affected by changes in that sector or geographic region than would be a fund whose investments are not heavily weighted in any sector or geographic region.
9. INDEMNIFICATION
Under the Trust’s organizational documents, the officers and Trustees have been granted certain indemnification rights against certain liabilities that may arise out of performance of their duties to the Trust. Additionally, in the normal course of business, the Trust may enter into contracts with service providers that contain a variety of indemnification clauses. The Trust’s maximum exposure under these arrangements is dependent on future claims that may be made against the Fund and, therefore, cannot be estimated.
10. NEW ACCOUNTING PRONOUNCEMENT
In August 2018, FASB issued Accounting Standards Update (“ASU”) No. 2018-13, Fair Value Measurement (Topic 820) Disclosure Framework—Changes to the Disclosure Requirements for Fair Value Measurement. ASU 2018-13 updates the disclosure requirements for fair value measurements by modifying or removing certain disclosures and adding certain new disclosures. The amendments are effective for fiscal years, and interim periods within those fiscal years, beginning after December 15, 2019. Early adoption is permitted. Management has adopted the removal and modification of disclosures early, as permitted, and will adopt the additional new disclosures at the effective date.
| | | | | | |
| Report of independent registered public accounting firm | | Wells Fargo Emerging Markets Equity Fund | | | 31 | |
BOARD OF TRUSTEES AND SHAREHOLDERS OF WELLS FARGO FUNDS TRUST:
Opinion on the Financial Statements
We have audited the accompanying statement of assets and liabilities of Wells Fargo Emerging Markets Equity Fund (the “Fund”), one of the funds constituting Wells Fargo Funds Trust, including the portfolio of investments, as of October 31, 2018, the related statement of operations for the year then ended, the statements of changes in net assets for each of the years in the two-year period then ended, and the related notes (collectively, the “financial statements”) and the financial highlights for each of the years in the five-year period then ended. In our opinion, the financial statements and financial highlights present fairly, in all material respects, the financial position of the Fund as of October 31, 2018, the results of its operations for the year then ended, the changes in its net assets for each of the years in the two-year period then ended, and the financial highlights for each of the years in the five-year period then ended, in conformity with U.S. generally accepted accounting principles.
Basis for Opinion
These financial statements and financial highlights are the responsibility of the Fund’s management. Our responsibility is to express an opinion on these financial statements and financial highlights based on our audits. We are a public accounting firm registered with the Public Company Accounting Oversight Board (United States) (“PCAOB”) and are required to be independent with respect to the Fund in accordance with the U.S. federal securities laws and the applicable rules and regulations of the Securities and Exchange Commission and the PCAOB.
We conducted our audits in accordance with the standards of the PCAOB. Those standards require that we plan and perform the audit to obtain reasonable assurance about whether the financial statements and financial highlights are free of material misstatement, whether due to error or fraud. Our audits included performing procedures to assess the risks of material misstatement of the financial statements and financial highlights, whether due to error or fraud, and performing procedures that respond to those risks. Such procedures included examining, on a test basis, evidence regarding the amounts and disclosures in the financial statements and financial highlights. Such procedures also included confirmation of securities owned as of October 31, 2018, by correspondence with the custodian and brokers, or by other appropriate auditing procedures. Our audits also included evaluating the accounting principles used and significant estimates made by management, as well as evaluating the overall presentation of the financial statements and financial highlights. We believe that our audits provide a reasonable basis for our opinion.

We have not been able to determine the specific year that we began serving as the auditor of one or more Wells Fargo Funds investment companies, however we are aware that we have served as the auditor of one or more Wells Fargo Funds investment companies since at least 1955.
Boston, Massachusetts
December 21, 2018
| | | | |
| 32 | | Wells Fargo Emerging Markets Equity Fund | | Other information (unaudited) |
TAX INFORMATION
Pursuant to Section 854 of the Internal Revenue Code, $28,053,516 of income dividends paid during the fiscal year ended October 31, 2018 has been designated as qualified dividend income (QDI).
For the fiscal year ended October 31, 2018, $354,772 has been designated as interest-related dividends for nonresident alien shareholders pursuant to Section 871 of the Internal Revenue Code.
Pursuant to Section 853 of the Internal Revenue Code, the Fund expects to designate amounts as foreign taxes paid for the fiscal year ended October 31, 2018. Additional details will be available in the semiannual report.
PROXY VOTING INFORMATION
A description of the policies and procedures that the Fund uses to determine how to vote proxies relating to portfolio securities is available, upon request, by calling 1-800-222-8222, visiting our website at wellsfargofunds.com, or visiting the SEC website at sec.gov. Information regarding how the Fund voted proxies relating to portfolio securities during the most recent 12-month period ended June 30 is available on the Fund’s website at wellsfargofunds.com or by visiting the SEC website at sec.gov.
PORTFOLIO HOLDINGS INFORMATION
The complete portfolio holdings for the Fund are publicly available monthly on the Fund’s website (wellsfargofunds.com), on a one-month delayed basis. In addition, top ten holdings information (excluding derivative positions) for the Fund is publicly available on the Fund’s website on a monthly, seven-day or more delayed basis. The Fund files its complete schedule of portfolio holdings with the SEC for the first and third quarters of each fiscal year on Form N-Q, which is available by visiting the SEC website at sec.gov. In addition, the Fund’s Form N-Q may be reviewed and copied at the SEC’s Public Reference Room in Washington, DC, and at regional offices in New York City, at 233 Broadway, and in Chicago, at 175 West Jackson Boulevard, Suite 900. Information about the Public Reference Room may be obtained by calling 1-800-SEC-0330.
| | | | | | |
| Other information (unaudited) | | Wells Fargo Emerging Markets Equity Fund | | | 33 | |
BOARD OF TRUSTEES AND OFFICERS
Each of the Trustees and Officers1 listed in the table below acts in identical capacities for each fund in the Wells Fargo family of funds, which consists of 152 mutual funds comprising the Wells Fargo Funds Trust, Wells Fargo Variable Trust, Wells Fargo Master Trust and four closed-end funds (collectively the “Fund Complex”). This table should be read in conjunction with the Prospectus and the Statement of Additional Information2. The mailing address of each Trustee and Officer is 525 Market Street, 12th Floor, San Francisco, CA 94105. Each Trustee and Officer serves an indefinite term, however, each Trustee serves such term until reaching the mandatory retirement age established by the Trustees.
Independent Trustees
| | | | | | |
Name and
year of birth | | Position held and
length of service* | | Principal occupations during past five years or longer | | Current other
public company or
investment company
directorships |
William R. Ebsworth (Born 1957) | | Trustee, since 2015 | | Retired. From 1984 to 2013, equities analyst, portfolio manager, research director and chief investment officer at Fidelity Management and Research Company in Boston, Tokyo, and Hong Kong, and retired in 2013 as Chief Investment Officer of Fidelity Strategic Advisers, Inc. where he led a team of investment professionals managing client assets. Prior thereto, Board member of Hong Kong Securities Clearing Co., Hong Kong Options Clearing Corp., the Thailand International Fund, Ltd., Fidelity Investments Life Insurance Company, and Empire Fidelity Investments Life Insurance Company. Board member of the Vincent Memorial Hospital Endowment (non-profit organization), where he serves on the Investment Committee and as a Chair of the Audit Committee. Mr. Ebsworth is a CFA® charterholder. | | N/A |
Jane A. Freeman (Born 1953) | | Trustee, since 2015; Chair Liaison, since 2018 | | Retired. From 2012 to 2014 and 1999 to 2008, Chief Financial Officer of Scientific Learning Corporation. From 2008 to 2012, Ms. Freeman provided consulting services related to strategic business projects. Prior to 1999, Portfolio Manager at Rockefeller & Co. and Scudder, Stevens & Clark. Board member of the Harding Loevner Funds from 1996 to 2014, serving as both Lead Independent Director and chair of the Audit Committee. Board member of the Russell Exchange Traded Funds Trust from 2011 to 2012 and the chair of the Audit Committee. Ms. Freeman is a Board Member of The Ruth Bancroft Garden (non-profit organization). She is also an inactive Chartered Financial Analyst. | | N/A |
Isaiah Harris, Jr.3
(Born 1952) | | Trustee, since 2009 | | Retired. Chairman of the Board of CIGNA Corporation since 2009, and Director since 2005. From 2003 to 2011, Director of Deluxe Corporation. Prior thereto, President and CEO of BellSouth Advertising and Publishing Corp. from 2005 to 2007, President and CEO of BellSouth Enterprises from 2004 to 2005 and President of BellSouth Consumer Services from 2000 to 2003. Emeritus member of the Iowa State University Foundation Board of Governors. Emeritus Member of the Advisory Board of Iowa State University School of Business. Advisory Board Member, Palm Harbor Academy (private school). Advisory Board Member, Child Evangelism Fellowship (non-profit). Mr. Harris is a certified public accountant (inactive status). | | CIGNA Corporation |
Judith M. Johnson3
(Born 1949) | | Trustee, since 2008; Audit Committee Chairman, since 2009 | | Retired. Prior thereto, Chief Executive Officer and Chief Investment Officer of Minneapolis Employees Retirement Fund from 1996 to 2008. Ms. Johnson is an attorney, certified public accountant and a certified managerial accountant. | | N/A |
David F. Larcker (Born 1950) | | Trustee, since 2009 | | James Irvin Miller Professor of Accounting at the Graduate School of Business, Stanford University, Director of the Corporate Governance Research Initiative and Senior Faculty of The Rock Center for Corporate Governance since 2006. From 2005 to 2008, Professor of Accounting at the Graduate School of Business, Stanford University. Prior thereto, Ernst & Young Professor of Accounting at The Wharton School, University of Pennsylvania from 1985 to 2005. | | N/A |
| | | | |
| 34 | | Wells Fargo Emerging Markets Equity Fund | | Other information (unaudited) |
| | | | | | |
Name and
year of birth | | Position held and
length of service* | | Principal occupations during past five years or longer | | Current other
public company or
investment company
directorships |
Olivia S. Mitchell (Born 1953) | | Trustee, since 2006; Nominating and Governance Committee Chairman, since 2018 | | International Foundation of Employee Benefit Plans Professor, Wharton School of the University of Pennsylvania since 1993. Director of Wharton’s Pension Research Council and Boettner Center on Pensions & Retirement Research, and Research Associate at the National Bureau of Economic Research. Previously, Cornell University Professor from 1978 to 1993. | | N/A |
Timothy J. Penny (Born 1951) | | Trustee, since 1996; Chairman, since 2018; Vice Chairman, from 2017 to 2018 | | President and Chief Executive Officer of Southern Minnesota Initiative Foundation, a non-profit organization, since 2007. Member of the Board of Trustees of NorthStar Education Finance, Inc., a non-profit organization, since 2007. | | N/A |
James G. Polisson (Born 1959) | | Trustee, since 2018; Advisory Board Member, from 2017 to 2018 | | Retired. Chief Marketing Officer, Source (ETF) UK Services, Ltd, from 2015 to 2017. From 2012 to 2015, Principal of The Polisson Group, LLC, a management consulting, corporate advisory and principal investing company. Chief Executive Officer and Managing Director at Russell Investments, Global Exchange Traded Funds from 2010 to 2012. Managing Director of Barclays Global Investors from 1998 to 2010 and Global Chief Marketing Officer for iShares and Barclays Global Investors from 2000 to 2010. Trustee of the San Francisco Mechanics’ Institute, a non-profit organization, from 2013 to 2015. Board member of the Russell Exchange Traded Fund Trust from 2011 to 2012. Director of Barclays Global Investors Holdings Deutschland GmbH from 2006 to 2009. Mr. Polisson is an attorney and has a retired status with the Massachusetts and District of Columbia Bar Associations. | | N/A |
Michael S. Scofield4
(Born 1943) | | Trustee, since 2010 | | Served on the Investment Company Institute’s Board of Governors and Executive Committee from 2008-2011 as well the Governing Council of the Independent Directors Council from 2006-2011 and the Independent Directors Council Executive Committee from 2008-2011. Trustee of the Evergreen Fund complex (and its predecessors) from 1984 to 2010. Chairman of the Evergreen Funds from 2000-2010. Former Trustee of the Mentor Funds. Retired Attorney, Law Offices of Michael S. Scofield. | | N/A |
Pamela Wheelock (Born 1959) | | Trustee, since 2018; Advisory Board Member, from 2017 to 2018 | | Chief Operating Officer, Twin Cities Habitat for Humanity, since January, 2017. Vice President of University Services, University of Minnesota from 2012 to 2017. Prior thereto, on the Board of Directors, Governance Committee and Finance Committee for the Minnesota Philanthropy Partners (Saint Paul Foundation) from 2012 to 2018, Interim President and Chief Executive Officer of Blue Cross Blue Shield of Minnesota from 2010 to 2011, Chairman of the Board from 2009 to 2011 and Board Director from 2003 to 2015. Vice President, Leadership and Community Engagement, Bush Foundation, Saint Paul, Minnesota (a private foundation) from 2009 to 2011. Executive Vice President and Chief Financial Officer, Minnesota Sports and Entertainment from 2004 to 2009 and Senior Vice President from 2002 to 2004. Commissioner of Finance, State of Minnesota, from 1999 to 2002. Currently the Board Chair of the Minnesota Wild Foundation since 2010. | | N/A |
| * | Length of service dates reflect the Trustee’s commencement of service with the Trust’s predecessor entities, where applicable. |
| | | | | | |
| Other information (unaudited) | | Wells Fargo Emerging Markets Equity Fund | | | 35 | |
Officers
| | | | | | |
Name and
year of birth | | Position held and
length of service | | Principal occupations during past five years or longer | | |
Andrew Owen (Born 1960) | | President, since 2017 | | Executive Vice President of Wells Fargo & Company and Head of Affiliated Managers, Wells Fargo Asset Management, since 2014. In addition, Mr. Owen is currently President, Chief Executive Officer and Director of Wells Fargo Funds Management, LLC since 2017. Prior thereto, Executive Vice President responsible for marketing, investments and product development for Wells Fargo Funds Management, LLC, from 2009 to 2014. | | |
Jeremy DePalma1 (Born 1974) | | Treasurer, since 2012 | | Senior Vice President of Wells Fargo Funds Management, LLC since 2009. Senior Vice President of Evergreen Investment Management Company, LLC from 2008 to 2010 and head of the Fund Reporting and Control Team within Fund Administration from 2005 to 2010. | | |
Alexander Kymn (Born 1973) | | Secretary, since 2018; Chief Legal Officer, since 2018 | | Senior Company Counsel of Wells Fargo Bank, N.A. since 2018 (previously Senior Counsel from 2007 to 2018). Vice President of Wells Fargo Funds Management, LLC from 2008 to 2014. | | |
Michael H. Whitaker (Born 1967) | | Chief Compliance Officer, since 2016 | | Senior Vice President and Chief Compliance Officer since 2016. Senior Vice President and Chief Compliance Officer for Fidelity Investments from 2007 to 2016. | | |
David Berardi (Born 1975) | | Assistant Treasurer, since 2009 | | Vice President of Wells Fargo Funds Management, LLC since 2009. Vice President of Evergreen Investment Management Company, LLC from 2008 to 2010. Manager of Fund Reporting and Control for Evergreen Investment Management Company, LLC from 2004 to 2010. | | |
| 1 | Jeremy DePalma acts as Treasurer of 76 funds and Assistant Treasurer of 76 funds in the Fund Complex. |
| 2 | The Statement of Additional Information includes additional information about the Trustees and is available, without charge, upon request, by calling 1-800-222-8222 or by visiting the website at wellsfargofunds.com. |
| 3 | Mr. Harris will replace Ms. Johnson as the Chairman of the Audit Committee effective January 1, 2019. |
| 4 | Mr. Scofield is expected to retire on December 31, 2018. |
| | | | |
| 36 | | Wells Fargo Emerging Markets Equity Fund | | Other information (unaudited) |
BOARD CONSIDERATION OF INVESTMENT MANAGEMENT AND SUB-ADVISORY AGREEMENTS:
Wells Fargo Emerging Markets Equity Fund
Under the Investment Company Act of 1940 (the “1940 Act”), the Board of Trustees (the “Board”) of Wells Fargo Funds Trust (the “Trust”) must determine annually whether to approve the continuation of the Trust’s investment management and sub-advisory agreements. In this regard, at an in-person meeting held on May 22-23, 2018 (the “Meeting”), the Board, all the members of which have no direct or indirect interest in the investment management and sub-advisory agreements and are not “interested persons” of the Trust, as defined in the 1940 Act (the “Independent Trustees”), reviewed and approved for Wells Fargo Emerging Markets Equity Fund (the “Fund”): (i) an investment management agreement (the “Management Agreement”) with Wells Fargo Funds Management, LLC (“Funds Management”); and (ii) an investment sub-advisory agreement (the “Sub-Advisory Agreement”) with Wells Capital Management Incorporated (the “Sub-Adviser”), an affiliate of Funds Management. The Management Agreement and the Sub-Advisory Agreement are collectively referred to as the “Advisory Agreements.”
At the Meeting, the Board considered the factors and reached the conclusions described below relating to the selection of Funds Management and the Sub-Adviser and the approval of the Advisory Agreements. Prior to the Meeting, including at an in-person meeting in April 2018, the Trustees conferred extensively among themselves and with representatives of Funds Management about these matters. Also, the Board has adopted a team-based approach, with each team consisting of a sub-set of Trustees, to assist the full Board in the discharge of its duties in reviewing investment performance and other matters throughout the year. The Independent Trustees were assisted in their evaluation of the Advisory Agreements by independent legal counsel, from whom they received separate legal advice and with whom they met separately.
In providing information to the Board, Funds Management and the Sub-Adviser were guided by a detailed set of requests for information submitted to them by independent legal counsel on behalf of the Independent Trustees at the start of the Board’s annual contract renewal process earlier in 2018. In considering and approving the Advisory Agreements, the Trustees considered the information they believed relevant, including but not limited to the information discussed below. The Board considered not only the specific information presented in connection with the Meeting, but also the knowledge gained over time through interaction with Funds Management and the Sub-Adviser about various topics. In this regard, the Board reviewed reports of Funds Management at each of its quarterly meetings, which included, among other things, portfolio reviews and investment performance reports. In addition, the Board and the teams mentioned above confer with portfolio managers at various times throughout the year. The Board did not identify any particular information or consideration that was all-important or controlling, and each individual Trustee may have attributed different weights to various factors.
After its deliberations, the Board unanimously approved the continuation of the Advisory Agreements for a one-year term and determined that the compensation payable to Funds Management and the Sub-Adviser under each of the Advisory Agreements was reasonable. The Board considered the approval of the Advisory Agreements for the Fund as part of its consideration of agreements for funds across the complex, but its approvals were made on a fund-by-fund basis. The following summarizes a number of important, but not necessarily all, factors considered by the Board in support of its approvals.
Nature, extent and quality of services
The Board received and considered various information regarding the nature, extent and quality of services provided to the Fund by Funds Management and the Sub-Adviser under the Advisory Agreements. This information included a description of the investment advisory services and Fund-level administrative services covered by the Management Agreement, as well as, among other things, a summary of the background and experience of senior management of Wells Fargo Asset Management (“WFAM”), of which Funds Management and the Sub-Adviser are a part, a summary of investments made in the business of WFAM, a summary of certain organizational and personnel changes involving Funds Management and the Sub-Adviser, and a description of Funds Management’s and the Sub-Adviser’s business continuity planning programs and of their approaches to data privacy and cybersecurity. The Board also considered the qualifications, background, tenure and responsibilities of each of the portfolio managers primarily responsible for the day-to-day portfolio management of the Fund.
The Board evaluated the ability of Funds Management and the Sub-Adviser to attract and retain qualified investment professionals, including research, advisory and supervisory personnel. The Board further considered the compliance programs and compliance records of Funds Management and the Sub-Adviser. In addition, the Board took into account the full range of services provided to the Fund by Funds Management and its affiliates.
| | | | | | |
| Other information (unaudited) | | Wells Fargo Emerging Markets Equity Fund | | | 37 | |
Fund investment performance and expenses
The Board considered the investment performance results for the Fund over various time periods ended December 31, 2017. The Board considered these results in comparison to the investment performance of funds in a universe that was determined by Broadridge Inc. (“Broadridge”) to be similar to the Fund (the “Universe”), and in comparison to the Fund’s benchmark index and to other comparative data. Broadridge is an independent provider of investment company data. The Board received a description of the methodology used by Broadridge to select the mutual funds in the performance Universe. The Board noted that the investment performance of the Fund (Administrator Class) was higher than or in range of the average investment performance of the Universe for all periods under review. The Board also noted that the investment performance of the Fund was higher than or in range of its benchmark index, the MSCI Emerging Markets Index, for the three, five-and ten- year periods under review, but lower than its benchmark index for the one-year period under review.
The Board also received and considered information regarding the Fund’s net operating expense ratios and their various components, including actual management fees, custodian and other non-management fees, and Rule 12b-1 and non-Rule 12b-1 shareholder service fees. The Board considered these ratios in comparison to the median ratios of funds in class-specific expense groups that were determined by Broadridge to be similar to the Fund (the “Groups”). The Board received a description of the methodology used by Broadridge to select the mutual funds in the expense Groups and an explanation of how funds comprising expense groups and their expense ratios may vary from year-to-year. Based on the Broadridge reports, the Board noted that the net operating expense ratios of the Fund were in range of the median net operating expense ratios of the expense Groups for each share class.
The Board took into account the Fund’s investment performance and expense information provided to it among the factors considered in deciding to re-approve the Advisory Agreements.
Investment management and sub-advisory fee rates
The Board reviewed and considered the contractual fee rates payable by the Fund to Funds Management under the Management Agreement, as well as the contractual fee rates payable by the Fund to Funds Management for class-level administrative services under a Class-Level Administration Agreement, which include, among other things, class-level transfer agency and sub-transfer agency costs (collectively, the “Management Rates”). The Board also reviewed and considered the contractual investment sub-advisory fee rates that are payable by Funds Management to the Sub-Adviser for investment sub-advisory services.
Among other information reviewed by the Board was a comparison of the Fund’s Management Rates with the average contractual investment management fee rates of funds in the expense Groups at a common asset level as well as transfer agency costs of the funds in the expense Groups. The Board noted that the Management Rates of the Fund were in the range of the sum of these average rates for the expense Groups for Class A, Institutional Class and Class R6, but higher than the sum of these average rates for the expense Group for Administrator Class. The Board noted that the net operating expense ratios of the Fund were in range of the median net operating expense ratios of the expense Groups for each share class, including Administrator Class.
The Board also received and considered information about the portion of the total management fee that was retained by Funds Management after payment of the fee to the Sub-Adviser for sub-advisory services. In assessing the reasonableness of this amount, the Board received and evaluated information about the nature and extent of responsibilities retained and risks assumed by Funds Management and not delegated to or assumed by the Sub-Adviser, and about Funds Management’s on-going oversight services. Given the affiliation between Funds Management and the Sub-Adviser, the Board ascribed limited relevance to the allocation of fees between them.
The Board also received and considered information about the nature and extent of services offered and fee rates charged by Funds Management and the Sub-Adviser to other types of clients with investment strategies similar to those of the Fund. In this regard, the Board received information about the significantly greater scope of services, and compliance, reporting and other legal burdens and risks of managing mutual funds compared with those associated with managing assets of non-mutual fund clients such as institutional separate accounts.
Based on its consideration of the factors and information it deemed relevant, including those described here, the Board determined that the compensation payable to Funds Management under the Management Agreement and to the Sub-Adviser under the Sub-Advisory Agreement was reasonable.
| | | | |
| 38 | | Wells Fargo Emerging Markets Equity Fund | | Other information (unaudited) |
Profitability
The Board received and considered information concerning the profitability of Funds Management, as well as the profitability of both WFAM and Wells Fargo & Co. (“Wells Fargo”) as a whole, from providing services to the Fund and the fund family as a whole. The Board noted that the Sub-Adviser’s profitability information with respect to providing services to the Fund was subsumed in the WFAM and Wells Fargo profitability analysis.
Funds Management reported on the methodologies and estimates used in calculating profitability, including a description of the methodology used to allocate certain expenses and recent enhancements made to the methodology. Among other things, the Board noted that the levels of profitability reported on a fund-by-fund basis varied widely, depending on factors such as the size and type of fund. Based on its review, the Board did not deem the profits reported by Funds Management, WFAM or Wells Fargo from services provided to the Fund to be at a level that would prevent it from approving the continuation of the Advisory Agreements.
Economies of scale
The Board considered the extent to which Funds Management may experience economies of scale in the provision of management services, and the extent to which scale benefits, if any, would be shared with shareholders. In particular, the Board noted the existence of breakpoints in the Fund’s management fee structure, which operate generally to reduce the Fund’s expense ratios as the Fund grows in size. It considered that, for a small fund or a fund that shrinks in size, breakpoints conversely can result in higher fee levels. The Board also considered that in addition to management fee breakpoints, competitive management fee rates set at the outset without regard to breakpoints and fee waiver and expense reimbursement arrangements, as well as investments in the business intended to enhance services available to Fund shareholders, are means of sharing potential economies of scale with shareholders of the Fund.
The Board concluded that the Fund’s fee and expense arrangements, including contractual breakpoints, constituted a reasonable approach to sharing potential economies of scale with the Fund and its shareholders.
Other benefits to Funds Management and the Sub-Adviser
The Board received and considered information regarding potential “fall-out” or ancillary benefits received by Funds Management and its affiliates, including the Sub-Adviser, as a result of their relationships with the Fund. Ancillary benefits could include, among others, benefits directly attributable to other relationships with the Fund and benefits potentially derived from an increase in Funds Management’s and the Sub-Adviser’s business as a result of their relationships with the Fund. The Board noted that various affiliates of Funds Management may receive distribution-related fees, shareholder servicing payments and sub-transfer agency fees in respect of shares sold or held through them and services provided.
The Board also reviewed information about soft dollar credits earned and utilized by the Sub-Adviser, fees earned by Funds Management and the Sub-Adviser from managing a private investment vehicle for the fund family’s securities lending collateral and commissions earned by an affiliated broker from portfolio transactions.
Based on its consideration of the factors and information it deemed relevant, including those described here, the Board did not find that any ancillary benefits received by Funds Management and its affiliates, including the Sub-Adviser, were unreasonable.
Conclusion
At the Meeting, after considering the above-described factors and based on its deliberations and its evaluation of the information described above, the Board unanimously approved the continuation of the Advisory Agreements for a one-year term and determined that the compensation payable to Funds Management and the Sub-Adviser under each of the Advisory Agreements was reasonable.
| | | | | | |
| Appendix A (unaudited) | | Wells Fargo Emerging Markets Equity Fund | | | 39 | |
SALES CHARGE REDUCTIONS AND WAIVERS FOR CERTAIN INTERMEDIARIES
Raymond James & Associates, Inc., Raymond James Financial Services & Raymond James affiliates (“Raymond James”)
Effective on or about March 1, 2019, shareholders purchasing Fund shares through a Raymond James platform or account will be eligible only for the following load waivers (front-end sales charge waivers and contingent deferred, or back-end, sales charge waivers) and discounts, which may differ from those disclosed elsewhere in the Fund’s Prospectus or SAI.
Front-end Sales Load Waivers on Class A shares Available at Raymond James
| | • | | Shares purchased in an investment advisory program. |
| | • | | Shares purchased through reinvestment of capital gains distributions and dividend reinvestment when purchasing shares of the same fund (but not any other fund within the fund family). |
| | • | | Employees and registered representatives of Raymond James or its affiliates and their family members as designated by Raymond James. |
| | • | | Shares purchased from the proceeds of redemptions within the same fund family, provided (1) the repurchase occurs within 90 days following the redemption, (2) the redemption and purchase occur in the same account, and (3) redeemed shares were subject to a front-end or deferred sales load (known as Rights of Reinstatement). |
| | • | | A shareholder in the fund’s Class C shares will have their shares automatically exchanged at net asset value to Class A shares (or the appropriate share class) of the fund if the shares are no longer subject to a CDSC and the exchange is in line with the policies and procedures of Raymond James. |
CDSC Waivers on Class A and C Shares Available at Raymond James
| | • | | Death or disability of the shareholder. |
| | • | | Shares sold as part of a systematic withdrawal plan as described in the Fund’s Prospectus. |
| | • | | Return of excess contributions from an IRA Account. |
| | • | | Shares sold as part of a required minimum distribution for IRA and retirement accounts due to the shareholder reaching age 70½ as described in the Fund’s prospectus. |
| | • | | Shares sold to pay Raymond James fees but only if the transaction is initiated by Raymond James. |
| | • | | Shares acquired through a right of reinstatement. |
Front-end Load Discounts Available at Raymond James: Breakpoints, and/or Rights of Accumulation
| | • | | Breakpoints as described in the Fund’s Prospectus. |
| | • | | Rights of accumulation which entitle shareholders to breakpoint discounts will be automatically calculated based on the aggregated holding of fund family assets held by accounts within the purchaser’s household at Raymond James. Eligible fund family assets not held at Raymond James may be included in the rights of accumulation calculation only if the shareholder notifies his or her financial advisor about such assets. |
This page is intentionally left blank.

For more information
More information about Wells Fargo Funds is available free upon request. To obtain literature, please write, visit the Fund’s website, or call:
Wells Fargo Funds
P.O. Box 219967
Kansas City, MO 64121-9967
Website: wellsfargofunds.com
Individual investors: 1-800-222-8222
Retail investment professionals: 1-888-877-9275
Institutional investment professionals:
1-866-765-0778
This report and the financial statements contained herein are submitted for the general information of the shareholders of the Fund. If this report is used for promotional purposes, distribution of the report must be accompanied or preceded by a current prospectus. Before investing, please consider the investment objectives, risks, charges, and expenses of the investment. For a current prospectus and, if available, a summary prospectus, containing this information, call 1-800-222-8222 or visit the Fund’s website at wellsfargofunds.com. Read the prospectus carefully before you invest or send money.
Wells Fargo Asset Management (WFAM) is the trade name for certain investment advisory/management firms owned by Wells Fargo & Company. These firms include but are not limited to Wells Capital Management Incorporated and Wells Fargo Funds Management, LLC. Certain products managed by WFAM entities are distributed by Wells Fargo Funds Distributor, LLC (a broker/dealer and Member FINRA).
This material is for general informational and educational purposes only and is NOT intended to provide investment advice or a recommendation of any kind—including a recommendation for any specific investment, strategy, or plan.
NOT FDIC INSURED ◾ NO BANK GUARANTEE ◾ MAY LOSE VALUE
© 2018 Wells Fargo Funds Management, LLC. All rights reserved.
| | |
 | | 318244 12-18 A238/AR238 10-18 |
Annual Report
October 31, 2018

Wells Fargo
Emerging Markets Equity Income Fund

Beginning on January 1, 2021, as permitted by new regulations adopted by the Securities and Exchange Commission, paper copies of the Fund’s annual and semi-annual shareholder reports will no longer be sent by mail, unless you specifically request paper copies of the reports. Instead, the reports will be made available on the Fund’s website, and you will be notified by mail each time a report is posted and provided with a website address to access the report.
If you already elected to receive shareholder reports electronically, you will not be affected by this change and you need not take any action. You may elect to receive shareholder reports and other communications from the Fund electronically at any time by contacting your financial intermediary (such as a broker-dealer or bank) or, if you are a direct investor, by calling 1-800-222-8222 or by enrolling at wellsfargo.com/advantagedelivery.
You may elect to receive all future reports in paper free of charge. If you invest through a financial intermediary, you can contact your financial intermediary to request that you continue to receive paper copies of your shareholder reports; if you invest directly with the Fund, you can call 1-800-222-8222. Your election to receive reports in paper will apply to all Wells Fargo Funds held in your account with your financial intermediary or, if you are a direct investor, to all Wells Fargo Funds that you hold.

Reduce clutter. Save trees.
Sign up for electronic delivery of prospectuses and shareholder reports at wellsfargo.com/advantagedelivery
Contents
The views expressed and any forward-looking statements are as of October 31, 2018, unless otherwise noted, and are those of the Fund managers and/or Wells Fargo Funds Management, LLC. Discussions of individual securities, or the markets generally, or any Wells Fargo Fund are not intended as individual recommendations. Future events or results may vary significantly from those expressed in any forward-looking statements. The views expressed are subject to change at any time in response to changing circumstances in the market. Wells Fargo Funds Management, LLC and the Fund disclaim any obligation to publicly update or revise any views expressed or forward-looking statements.
NOT FDIC INSURED ◾ NO BANK GUARANTEE ◾ MAY LOSE VALUE
| | | | |
| 2 | | Wells Fargo Emerging Markets Equity Income Fund | | Letter to shareholders (unaudited) |

Andrew Owen
President
Wells Fargo Funds
The early months of the reporting period were characterized by strong performance for equity and fixed-income markets. The remainder of the reporting period generated economic, business, and investing data that were decidedly more mixed and volatile relative to the prior year.
Dear Shareholder:
We are pleased to offer you this annual report for the Wells Fargo Emerging Markets Equity Income Fund for the 12-month period that ended October 31, 2018. The early months of the reporting period were characterized by strong performance for equity and fixed-income markets. The remainder of the reporting period generated economic, business, and investing data that were decidedly more mixed and volatile relative to the prior year.
For the period, U.S. stocks, as measured by the S&P 500 Index,1 gained 7.35% and international stocks, as measured by the MSCI ACWI ex USA Index (Net),2 declined 8.24%. Based on the MSCI EM Index (Net),3 emerging market stocks lost 12.52%. For bond investors, the Bloomberg Barclays U.S. Aggregate Bond Index4 declined 2.05% while the Bloomberg Barclays Global Aggregate ex-USD Index5 fell 2.09%. The Bloomberg Barclays Municipal Bond Index6 dropped 0.51%, and the ICE BofAML U.S. High Yield Index7 was up 0.86%.
Optimism continued to shape markets as 2017 closed and 2018 opened.
Economic conditions in late 2017 were characterized by synchronized global growth, low inflation, healthy corporate earnings, growing consumer confidence, declining unemployment, and a weaker U.S. dollar that supported international growth. The U.S. Bureau of Economic Analysis reported that U.S. gross domestic product (GDP) growth on an annualized basis for the fourth quarter of 2017 was 2.9% and inflation remained below U.S. Federal Reserve (Fed) targets.
Economic momentum continued in Europe. The Bank of England (BOE) raised interest rates in November 2017 to 0.50%, the first increase in more than 10 years, indicating confidence in the economy’s growth potential. Meanwhile, the European Central Bank (ECB) and the Bank of Japan (BOJ) kept interest rates low to spur business activities and bought bonds in an effort to encourage equity investments. The People’s Bank of China (PBOC) also sought to stimulate economic growth. Many emerging market economies benefited from stronger currencies versus the U.S. dollar, while commodity price increases benefited countries that rely on natural resources for exports.
| 1 | The S&P 500 Index consists of 500 stocks chosen for market size, liquidity, and industry group representation. It is a market-value-weighted index with each stock’s weight in the index proportionate to its market value. You cannot invest directly in an index. |
| 2 | The Morgan Stanley Capital International (MSCI) All Country World Index (ACWI) ex USA Index (Net) is a free-float-adjusted market-capitalization-weighted index that is designed to measure the equity market performance of developed markets, excluding the United States and Canada. Source: MSCI. MSCI makes no express or implied warranties or representations and shall have no liability whatsoever with respect to any MSCI data contained herein. The MSCI data may not be further redistributed or used as a basis for other indices or any securities or financial products. This report is not approved, reviewed, or produced by MSCI. You cannot invest directly in an index. |
| 3 | The MSCI Emerging Markets (EM) Index (Net) is a free-float-adjusted market-capitalization-weighted index that is designed to measure large- and mid-cap equity market performance of emerging markets. The MSCI EM Index (Net) consists of the following 24 emerging market country indices: Brazil, Chile, China, Colombia, Czech Republic, Egypt, Greece, Hungary, India, Indonesia, Korea, Malaysia, Mexico, Pakistan, Peru, the Philippines, Poland, Qatar, Russia, South Africa, Taiwan, Thailand, Turkey, and the United Arab Emirates. You cannot invest directly in an index. |
| 4 | The Bloomberg Barclays U.S. Aggregate Bond Index is a broad-based benchmark that measures the investment-grade, U.S. dollar-denominated, fixed-rate taxable bond market, including Treasuries, government-related and corporate securities, mortgage-backed securities (agency fixed-rate and hybrid adjustable-rate mortgage pass-throughs), asset-backed securities, and commercial mortgage-backed securities. You cannot invest directly in an index. |
| 5 | The Bloomberg Barclays Global Aggregate ex-USD Index is an unmanaged index that provides a broad-based measure of the global investment-grade fixed-income markets excluding the U.S. dollar-denominated debt market. You cannot invest directly in an index. |
| 6 | The Bloomberg Barclays Municipal Bond Index is an unmanaged index composed of long-term tax-exempt bonds with a minimum credit rating of Baa. You cannot invest directly in an index. |
| 7 | The ICE BofAML U.S. High Yield Index is a market-capitalization-weighted index of domestic and Yankee high-yield bonds. The index tracks the performance of high-yield securities traded in the U.S. bond market. You cannot invest directly in an index. Copyright 2018. ICE Data Indices, LLC. All rights reserved. |
| | | | | | |
| Letter to shareholders (unaudited) | | Wells Fargo Emerging Markets Equity Income Fund | | | 3 | |
Volatility reemerged during the early months of 2018.
In February 2018, investor concerns arose about inflation and trade, particularly between the U.S. and China. The Fed followed its 25-basis-point (bp; 100 bps equal 1.00%) federal funds rate increase in December 2017 with a further 25-bp increase in March 2018. The inflation rate in March reached the Fed’s 2% target for the first time in a year. The S&P 500 Index closed the first quarter with a negative return, the first negative quarterly return for the index since 2014.
Overseas, investment markets fell, hurt by a stronger U.S. dollar and mounting trade and diplomatic tensions. The MSCI ACWI ex USA Index (Net) declined 1.81% for the quarter that ended March 31, 2018.
Global trade tensions prompted investor concerns.
Global trade tensions escalated during the second quarter of 2018. The U.S. government’s decision to impose tariffs on a wide range of products manufactured overseas drew retaliatory responses from foreign governments, which punished U.S. commodity producers and product manufacturers. Investors were left to wonder about next steps in what appeared to be an escalating divergence in global economic policies and growth prospects.
Inflation trended higher. The CPI-U8 added 0.1% in June after an increase of 0.2% in both April and May. On a year-over-year basis, the all-items index rose 2.9% for the 12 months that ended June 30, 2018. The index for all items less food and energy rose 2.3% for the same 12-month period.
U.S. stocks gained following positive economic data while international stocks and bonds declined.
During the summer months, the U.S. economy strengthened. Revised second-quarter GDP data released in August showed the U.S. economy growing at a 4.2% rate. The unemployment rate in the U.S. was 3.7% by the end of September, according to the U.S. Department of Labor. Wages showed more consistent growth, and consumer confidence remained strong. Several U.S. equity market indices reached records during August, with the S&P 500 Index gaining 7.20% for the three-month period that ended September 30, 2018. In contrast, the MSCI ACWI ex USA Index (Net) gained 0.71% while the MSCI EM Index (Net) declined 1.09% during the same three-month period.
In June, the Fed increased the target range for the federal funds rate to range from 1.75% to 2.00%. It raised the range again in September to range from 2.00% to 2.25%. Long-term interest rates in the U.S. remained at higher levels relative from the prior 10 years. Rates on 10-year and 30-year Treasury bonds—2.46% and 2.81%, respectively, on January 1, 2018—were 3.15% and 3.39%, respectively, on October 31, 2018. Investor concerns about an inverted yield curve waned, only to be replaced by concerns about the potentially negative influence of higher interest rates on economic activity.
October proved to be a difficult month for stock markets globally.
As interest rates and bond yields gained during October, stock markets struggled. For the month, the S&P 500 Index fell 6.84%, the MSCI ACWI ex USA Index (Net) dropped 8.13%, and the MSCI EM Index (Net) lost 8.71%. The Bureau of Economic Analysis released its first estimate of third-quarter GDP, which, at an annualized 3.5% rate, indicated growth may be slowing compared with the second quarter. Readings on consumer sentiment and business spending were mixed.
The S&P 500 Index closed the first quarter with a negative return, the first negative quarterly return for the index since 2014.
| 8 | The Consumer Price Index for All Urban Consumers (CPI-U) measures the changes in the price of a basket of goods and services purchased by urban consumers. The urban consumer population is deemed by many as a better representative measure of the general public because close to 90% of the country’s population lives in highly populated areas. You cannot invest directly in an index. |
| | | | |
| 4 | | Wells Fargo Emerging Markets Equity Income Fund | | Letter to shareholders (unaudited) |
Economic signals overseas also were mixed as the third quarter ended and the fourth quarter began. In early August, the BOE’s Monetary Policy Committee increased its key interest rate to 0.75%. The ECB and BOJ maintained low interest rates and accommodative monetary policies. Amid rising trade uncertainty, the PBOC cut reserve requirement ratios and accelerated infrastructure spending and tax cuts for business enterprises and individuals. Nevertheless, a strengthening U.S. dollar and the trade tensions remained headwinds for investors overseas.
Don’t let short-term uncertainty derail long-term investment goals.
Periods of investment uncertainty can present challenges, but experience has taught us that maintaining long-term investment goals can be an effective way to plan for the future. To help you create a sound strategy based on your personal goals and risk tolerance, Wells Fargo Funds offers more than 100 mutual funds spanning a wide range of asset classes and investment styles. Although diversification cannot guarantee an investment profit or prevent losses, we believe it can be an effective way to manage investment risk and potentially smooth out overall portfolio performance. We encourage investors to know their investments and to understand that appropriate levels of risk-taking may unlock opportunities.
Thank you for choosing to invest with Wells Fargo Funds. We appreciate your confidence in us and remain committed to helping you meet your financial needs.
Sincerely,

Andrew Owen
President
Wells Fargo Funds
Notice to shareholders
At a meeting held on August 14-15, 2018, the Board of Trustees of the Fund approved the following policy which will be effective on or about February 5, 2019:
Class C shares will convert automatically into Class A shares ten years after the initial date of purchase or, if you acquired your Class C shares through an exchange or conversion from another share class, ten years after the date you acquired your Class C shares. When Class C shares that you acquired through a purchase or exchange convert, any other Class C shares that you purchased with reinvested dividends and distributions also will convert into Class A shares on a pro rata basis. A shorter holding period may also apply depending on your intermediary. Please see “Appendix A—Sales Charge Reductions and Waivers for Certain Intermediaries” in the Fund’s prospectus or at the end of this report.
For further information about your Fund, contact your investment professional, visit our website at wellsfargofunds.com, or call us directly at 1-800-222-8222.
This page is intentionally left blank.
| | | | |
| 6 | | Wells Fargo Emerging Markets Equity Income Fund | | Performance highlights (unaudited) |
Investment objective
The Fund seeks to achieve long-term capital appreciation and current income.
Manager
Wells Fargo Funds Management, LLC
Subadviser
Wells Capital Management Incorporated
Portfolio managers
Alison Shimada
Elaine Tse‡
Average annual total returns (%) as of October 31, 20181
| | | | | | | | | | | | | | | | | | | | | | | | | | | | | | | | | | |
| | | | | Including sales charge | | | Excluding sales charge | | | Expense ratios2 (%) | |
| | | Inception date | | 1 year | | | 5 year | | | Since inception | | | 1 year | | | 5 year | | | Since inception | | | Gross | | | Net3 | |
| Class A (EQIAX) | | 5-31-2012 | | | (14.65 | ) | | | (0.98 | ) | | | 2.76 | | | | (9.47 | ) | | | 0.20 | | | | 3.72 | | | | 1.65 | | | | 1.63 | |
| Class C (EQICX) | | 5-31-2012 | | | (11.20 | ) | | | (0.55 | ) | | | 2.94 | | | | (10.20 | ) | | | (0.55 | ) | | | 2.94 | | | | 2.40 | | | | 2.38 | |
| Class R (EQIHX) | | 9-30-2015 | | | – | | | | – | | | | – | | | | (9.70 | ) | | | (0.05 | ) | | | 3.46 | | | | 1.90 | | | | 1.88 | |
| Class R6 (EQIRX) | | 9-30-2015 | | | – | | | | – | | | | – | | | | (9.05 | ) | | | 0.65 | | | | 4.16 | | | | 1.22 | | | | 1.18 | |
| Administrator Class (EQIDX) | | 5-31-2012 | | | – | | | | – | | | | – | | | | (9.29 | ) | | | 0.42 | | | | 3.94 | | | | 1.57 | | | | 1.46 | |
| Institutional Class (EQIIX) | | 5-31-2012 | | | – | | | | – | | | | – | | | | (9.11 | ) | | | 0.61 | | | | 4.13 | | | | 1.32 | | | | 1.23 | |
| MSCI EM Index (Net)4 | | – | | | – | | | | – | | | | – | | | | (12.52 | ) | | | 0.78 | | | | 3.30 | | | | – | | | | – | |
Figures quoted represent past performance, which is no guarantee of future results, and do not reflect taxes that a shareholder may pay on fund distributions or the redemption of fund shares. Investment return and principal value of an investment will fluctuate so that an investor’s shares, when redeemed, may be worth more or less than their original cost. Performance shown without sales charges would be lower if sales charges were reflected. Current performance may be lower or higher than the performance data quoted, which assumes the reinvestment of dividends and capital gains. Current month-end performance is available on the Fund’s website, wellsfargofunds.com.
Index returns do not include transaction costs associated with buying and selling securities, any mutual fund fees or expenses, or any taxes. It is not possible to invest directly in an index.
For Class A shares, the maximum front-end sales charge is 5.75%. For Class C shares, the maximum contingent deferred sales charge is 1.00%. Performance including a contingent deferred sales charge assumes the sales charge for the corresponding time period. Class R, Class R6, Administrator Class, and Institutional Class shares are sold without a front-end sales charge or contingent deferred sales charge.
Stock values fluctuate in response to the activities of individual companies and general market and economic conditions. Foreign investments are especially volatile and can rise or fall dramatically due to differences in the political and economic conditions of the host country. These risks are generally intensified in emerging markets. The use of derivatives may reduce returns and/or increase volatility. Certain investment strategies tend to increase the total risk of investment (relative to the broader market). The Fund is exposed to smaller-company securities risk. Consult the Fund’s prospectus for additional information on these and other risks.
Please see footnotes on page 7.
| | | | | | |
| Performance highlights (unaudited) | | Wells Fargo Emerging Markets Equity Income Fund | | | 7 | |
|
| Growth of $10,000 investment as of October 31, 20185 |
|
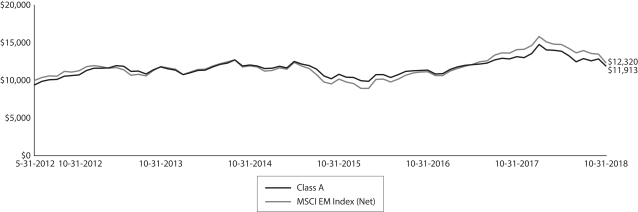 |
| ‡ | Ms. Tse became a portfolio manager of the Fund on April 13, 2018. |
| 1 | Historical performance shown for the Class R shares prior to their inception reflects the performance of the Administrator Class shares, adjusted to reflect the higher expenses applicable to Class R shares. Historical performance shown for the Class R6 shares prior to their inception reflects the performance of the Institutional Class shares, and includes the higher expenses applicable to Institutional Class shares. If these expenses had not been included, returns for Class R6 shares would be higher. |
| 2 | Reflects the expense ratios as stated in the most recent prospectuses, which include the impact of 0.01% in acquired fund fees and expenses. The expense ratios shown are subject to change and may differ from the annualized expense ratios shown in the financial highlights of this report, which do not include acquired fund fees and expenses. |
| 3 | The manager has contractually committed through February 28, 2019, to waive fees and/or reimburse expenses to the extent necessary to cap the Fund’s Total Annual Operating Expenses After Fee Waivers at 1.62% for Class A, 2.37% for Class C, 1.87% for Class R, 1.17% for Class R6, 1.45% for Administrator Class, and 1.22% for Institutional Class. After this time, the cap may be increased or the commitment to maintain the cap may be terminated only with the approval of the Board of Trustees. Brokerage commissions, stamp duty fees, interest, taxes, acquired fund fees and expenses (if any), and extraordinary expenses are excluded from the expense cap. Without this cap, the Fund’s returns would have been lower. The expense ratio paid by an investor is the net expense ratio (the total annual fund operating expenses after fee waivers) as stated in the prospectuses. |
| 4 | The Morgan Stanley Capital International (MSCI) Emerging Markets (EM) Index (Net) is a free-float-adjusted market-capitalization-weighted index that is designed to measure large and mid-cap equity market performance of emerging markets. The MSCI EM Index (Net) consists of the following 24 emerging markets country indexes: Brazil, Chile, China, Colombia, Czech Republic, Egypt, Greece, Hungary, India, Indonesia, Korea, Malaysia, Mexico, Pakistan, Peru, the Philippines, Poland, Qatar, Russia, South Africa, Taiwan, Thailand, Turkey, and United Arab Emirates. Source: MSCI. MSCI makes no express or implied warranties or representations and shall have no liability whatsoever with respect to any MSCI data contained herein. The MSCI data may not be further redistributed or used as a basis for other indexes or any securities or financial products. This report is not approved, reviewed, or produced by MSCI. You cannot invest directly in an index. |
| 5 | The chart compares the performance of Class A shares since its inception with the MSCI EM Index (Net). The chart assumes a hypothetical investment of $10,000 in Class A shares and reflects all operating expenses and assumes the maximum initial sales charge of 5.75%. |
| 6 | The ten largest holdings, excluding cash, cash equivalents and any money market funds, are calculated based on the value of the investments divided by total net assets of the Fund. Holdings are subject to change and may have changed since the date specified. |
| 7 | Amounts are calculated based on the total long-term investments of the Fund. These amounts are subject to change and may have changed since the date specified. |
| * | This security was no longer held at the end of the reporting period. |
| | | | |
| 8 | | Wells Fargo Emerging Markets Equity Income Fund | | Performance highlights (unaudited) |
MANAGER’S DISCUSSION
Fund highlights
| ∎ | | The Fund outperformed its benchmark, the MSCI EM Index (Net), for the 12-month period that ended October 31, 2018. |
| ∎ | | Stock selection within China/Hong Kong, Brazil, and South Africa drove outperformance during the period and was partially offset by positioning in India, Argentina, and Qatar. |
| ∎ | | Stock selection within communication services, consumer discretionary, and information technology was also strong but partially offset by unfavorable stock selection within the industrials, financials, and energy sectors. |
The Fund outperformed its benchmark during a weak absolute return market.
During the period, returns in emerging markets declined, reversing course from the previous year as volatility increased due to the uncertainty of a trade war between the U.S. and China, a strong dollar, and election cycles. Ten out of eleven sectors posted negative returns during the period, including consumer discretionary, real estate, and communication services. Energy was the only sector that advanced during the period, posting a 14.5% return. The majority of countries also declined during the period, including Turkey, Greece, and Pakistan. Qatar, Russia, and Peru advanced.
Against this backdrop, the portfolio outperformed the index due to strong stock selection, particularly in China/Hong Kong, Brazil, and South Africa. Within China/Hong Kong, the communication services sector was the leading contributor to relative returns given holdings in China Communications Services Corporation Limited and China Telecom Corporation Limited. The portfolio did not hold Tencent Holdings Limited or Baidu, Incorporated, as neither is eligible for inclusion in the portfolio due to below-average dividend yields, which was positive to relative returns as they declined 23.9% and 22.1%, respectively, during the period. Positive relative returns were offset by negative allocation and stock selection effects in India, Argentina, and Qatar. Bharat Petroleum Corporation Limited (India), Vedanta Limited (India), and Banco Macro S.A. (Argentina)* were among the leading detractors. In Qatar, we held no investments while the country led the index with a 37.3% return.
| | | | |
| Ten largest holdings (%) as of October 31, 20186 | |
Taiwan Semiconductor Manufacturing Company Limited | | | 3.86 | |
Samsung Electronics Company Limited | | | 3.48 | |
China Construction Bank H Shares | | | 2.72 | |
Industrial & Commercial Bank of China Limited H Shares | | | 2.42 | |
China Mobile Limited | | | 1.74 | |
Lukoil PJSC ADR | | | 1.72 | |
B3 SA | | | 1.66 | |
Vale SA | | | 1.57 | |
Banco Bradesco SA | | | 1.53 | |
Infosys Limited | | | 1.51 | |
|
| Sector distribution as of October 31, 20187 |
|
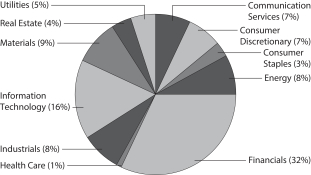
|
Please see footnotes on page 7.
| | | | | | |
| Performance highlights (unaudited) | | Wells Fargo Emerging Markets Equity Income Fund | | | 9 | |
|
| Country allocation as of October 31, 20187 |
|
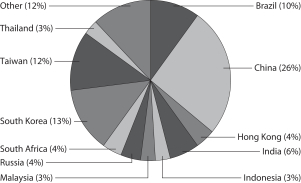 |
The team increased its exposure to South Korea, Malaysia, and Poland, particularly within the financials sector given the prospect for rising rates, expansion of net interest margins, and higher investment portfolio returns in the case of insurance companies. On the other hand, we reduced exposure to Singapore, China/Hong Kong, and the Philippines as well as the consumer discretionary sector, particularly within China/Hong Kong for stock-specific reasons as well as a downdraft in consumption illustrated by a decline in retail year-over-year sales growth from 10.1% in March to below 9% from May through August.
Our investment outlook on the emerging market region remains constructive but volatility is expected to persist.
Given limited visibility into future potential corporate results, investors are focused on the certainty of earnings. Interest remained in the internet sector through the first half of 2018 on the strength of the U.S. economy and sustained performance of large U.S. technology companies. Performance became more balanced between growth and value stocks starting in the second half of the period, as we had expected. Concern over China’s world bargaining position has led us to take profit in certain stocks as trade tensions further escalated.
Volatility does provide opportunity and it is important to stay focused on the long-term growth prospects for emerging markets. Markets becoming oversold present attractive buy opportunities. We are positioned more defensively on a country basis, which gives us the opportunity to reconfirm our level of conviction on major holdings. Some themes we see going forward include state-owned enterprise and financial reform in China, rising internet penetration and e-commerce, environmental protection, and better-than-expected consumer spending despite uncertainty. Easing in China should support domestic liquidity and the overall economy, which, in turn, should support equity markets. Corporates are demonstrating disciplined and efficient capital allocation at this point in the cycle rather than chasing growth at any cost. Predictable inflation and interest rates, even if both increase, should be manageable for companies.
Dividends should help buffer against increasing volatility in the global markets and still comprise 30% to 40% of total
return in emerging markets over the long term. Dividend payouts have been low in emerging markets but have been steadily rising due to disciplined capital expenditures, an improvement in business sentiment, changes in government policy, shareholder demand, and improvements in fundamentals. We also consider share buybacks in the equation of total shareholder returns. We reiterate that stock selectivity based on company specifics is critical as we move into 2019.
Please see footnotes on page 7.
| | | | |
| 10 | | Wells Fargo Emerging Markets Equity Income Fund | | Fund expenses (unaudited) |
As a shareholder of the Fund, you incur two types of costs: (1) transaction costs, including sales charges (loads) on purchase payments and contingent deferred sales charges (if any) on redemptions and (2) ongoing costs, including management fees, distribution (12b-1) and/or shareholder servicing fees, and other Fund expenses. This example is intended to help you understand your ongoing costs (in dollars) of investing in the Fund and to compare these costs with the ongoing costs of investing in other mutual funds.
The example is based on an investment of $1,000 invested at the beginning of the six-month period and held for the entire period from May 1, 2018 to October 31, 2018.
Actual expenses
The “Actual” line of the table below provides information about actual account values and actual expenses. You may use the information in this line, together with the amount you invested, to estimate the expenses that you paid over the period. Simply divide your account value by $1,000 (for example, an $8,600 account value divided by $1,000 = 8.6), then multiply the result by the number in the “Actual” line under the heading entitled “Expenses paid during period” for your applicable class of shares to estimate the expenses you paid on your account during this period.
Hypothetical example for comparison purposes
The “Hypothetical” line of the table below provides information about hypothetical account values and hypothetical expenses based on the Fund’s actual expense ratio and an assumed rate of return of 5% per year before expenses, which is not the Fund’s actual return. The hypothetical account values and expenses may not be used to estimate the actual ending account balance or expenses you paid for the period. You may use this information to compare the ongoing costs of investing in the Fund and other funds. To do so, compare this 5% hypothetical example with the 5% hypothetical examples that appear in the shareholder reports of the other funds.
Please note that the expenses shown in the table are meant to highlight your ongoing costs only and do not reflect any transactional costs, such as sales charges (loads) and contingent deferred sales charges. Therefore, the “Hypothetical” line of the table is useful in comparing ongoing costs only and will not help you determine the relative total costs of owning different funds. In addition, if these transactional costs were included, your costs would have been higher.
| | | | | | | | | | | | | | | | |
| | | Beginning
account value
5-1-2018 | | | Ending
account value
10-31-2018 | | | Expenses
paid during
the period¹ | | | Annualized net
expense ratio | |
Class A | | | | | | | | | | | | | | | | |
Actual | | $ | 1,000.00 | | | $ | 859.59 | | | $ | 7.59 | | | | 1.62 | % |
Hypothetical (5% return before expenses) | | $ | 1,000.00 | | | $ | 1,017.04 | | | $ | 8.24 | | | | 1.62 | % |
Class C | | | | | | | | | | | | | | | | |
Actual | | $ | 1,000.00 | | | $ | 856.24 | | | $ | 11.09 | | | | 2.37 | % |
Hypothetical (5% return before expenses) | | $ | 1,000.00 | | | $ | 1,013.26 | | | $ | 12.03 | | | | 2.37 | % |
Class R | | | | | | | | | | | | | | | | |
Actual | | $ | 1,000.00 | | | $ | 858.09 | | | $ | 8.76 | | | | 1.87 | % |
Hypothetical (5% return before expenses) | | $ | 1,000.00 | | | $ | 1,015.78 | | | $ | 9.50 | | | | 1.87 | % |
Class R6 | | | | | | | | | | | | | | | | |
Actual | | $ | 1,000.00 | | | $ | 861.65 | | | $ | 5.49 | | | | 1.17 | % |
Hypothetical (5% return before expenses) | | $ | 1,000.00 | | | $ | 1,019.31 | | | $ | 5.96 | | | | 1.17 | % |
Administrator Class | | | | | | | | | | | | | | | | |
Actual | | $ | 1,000.00 | | | $ | 860.16 | | | $ | 6.78 | | | | 1.45 | % |
Hypothetical (5% return before expenses) | | $ | 1,000.00 | | | $ | 1,017.90 | | | $ | 7.35 | | | | 1.45 | % |
Institutional Class | | | | | | | | | | | | | | | | |
Actual | | $ | 1,000.00 | | | $ | 861.35 | | | $ | 5.72 | | | | 1.22 | % |
Hypothetical (5% return before expenses) | | $ | 1,000.00 | | | $ | 1,019.06 | | | $ | 6.21 | | | | 1.22 | % |
| 1 | Expenses paid is equal to the annualized net expense ratio of each class multiplied by the average account value over the period, multiplied by the number of days in the most recent fiscal half-year divided by the number of days in the fiscal year (to reflect the one-half-year period). |
| | | | | | |
| Portfolio of investments—October 31, 2018 | | Wells Fargo Emerging Markets Equity Income Fund | | | 11 | |
| | | | | | | | | | | | | | | | |
| Security name | | | | | | | | Shares | | | Value | |
| | | | |
Common Stocks: 87.83% | | | | | | | | | | | | | | | | |
| | | | |
| Brazil: 4.84% | | | | | | | | | | | | | | | | |
B3 SA (Financials, Capital Markets) | | | | | | | | | | | 1,231,000 | | | $ | 8,778,917 | |
BB Seguridade Participacoes SA (Financials, Insurance) | | | | | | | | | | | 568,796 | | | | 4,047,217 | |
Petrobras Distribuidora SA (Consumer Discretionary, Specialty Retail) | | | | | | | | | | | 690,000 | | | | 4,446,110 | |
Vale SA (Materials, Metals & Mining) | | | | | | | | | | | 541,974 | | | | 8,258,859 | |
| | | | |
| | | | | | | | | | | | | | | 25,531,103 | |
| | | | | | | | | | | | | | | | |
| | | | |
| Cambodia: 0.49% | | | | | | | | | | | | | | | | |
NagaCorp Limited (Consumer Discretionary, Hotels, Restaurants & Leisure) | | | | | | | | | | | 2,828,000 | | | | 2,582,072 | |
| | | | | | | | | | | | | | | | |
| | | | |
| Chile: 0.96% | | | | | | | | | | | | | | | | |
Enel Americas SA ADR (Utilities, Electric Utilities) | | | | | | | | | | | 644,907 | | | | 5,081,867 | |
| | | | | | | | | | | | | | | | |
| | | | |
| China: 24.44% | | | | | | | | | | | | | | | | |
Agricultural Bank of China Limited H Shares (Financials, Banks) | | | | | | | | | | | 9,327,000 | | | | 4,091,442 | |
Agricultural Bank of China Limited Class A (Financials, Banks) | | | | | | | | | | | 205,600 | | | | 114,090 | |
Bank of China Limited H Shares (Financials, Banks) | | | | | | | | | | | 15,849,000 | | | | 6,750,318 | |
Beijing Enterprises Water Group Limited (Utilities, Water Utilities) | | | | | | | | | | | 5,416,000 | | | | 2,755,672 | |
China Communications Construction Company Limited H Shares (Industrials, Construction & Engineering) | | | | | | | | | | | 4,823,000 | | | | 4,409,734 | |
China Communications Services Corporation Limited H Shares (Communication Services, Diversified Telecommunication Services) | | | | 7,892,000 | | | | 6,380,464 | |
China Construction Bank H Shares (Financials, Banks) | | | | | | | | | | | 18,088,000 | | | | 14,346,860 | |
China Everbright International Limited (Industrials, Commercial Services & Supplies) | | | | | | | | | | | 3,310,000 | | | | 2,638,056 | |
China Lesso Group Holdings Limited Class L (Industrials, Building Products) | | | | | | | | | | | 6,342,000 | | | | 3,340,044 | |
China Life Insurance Company H Shares (Financials, Insurance) | | | | | | | | | | | 1,086,000 | | | | 2,163,151 | |
China Mobile Limited (Communication Services, Wireless Telecommunication Services) | | | | | | | | | | | 981,500 | | | | 9,174,242 | |
China Overseas Land & Investment Limited (Real Estate, Real Estate Management & Development) | | | | | | | | | | | 1,316,000 | | | | 4,119,868 | |
China Petroleum & Chemical Corporation H Shares (Energy, Oil, Gas & Consumable Fuels) | | | | | | | | | | | 4,507,600 | | | | 3,655,766 | |
China Resources Land Limited (Real Estate, Real Estate Management & Development) | | | | | | | | | | | 1,696,000 | | | | 5,752,855 | |
China State Construction Engineering Corporation Limited Class A (Industrials, Construction & Engineering) | | | | | | | | | | | 79,800 | | | | 61,560 | |
China State Construction International Holdings (Industrials, Construction & Engineering) | | | | | | | | | | | 4,408,000 | | | | 3,142,167 | |
China Telecom Corporation Limited H Shares (Communication Services, Diversified Telecommunication Services) | | | | | | | | | | | 10,316,000 | | | | 4,867,310 | |
CNOOC Limited (Energy, Oil, Gas & Consumable Fuels) | | | | | | | | | | | 3,021,000 | | | | 5,185,274 | |
CRRC Corporation Limited H Shares (Industrials, Machinery) | | | | | | | | | | | 4,640,000 | | | | 4,070,824 | |
Huaneng Power International Incorporated H Shares (Utilities, Independent Power & Renewable Electricity Producers) | | | | | | | | | | | 4,598,000 | | | | 2,562,279 | |
Huayu Automotive Systems Company Limited Class A (Consumer Discretionary, Auto Components) | | | | | | | | | | | 39,865 | | | | 99,632 | |
Industrial & Commercial Bank of China Limited H Shares (Financials, Banks) | | | | | | | | | | | 18,898,000 | | | | 12,772,257 | |
Inner Mongolia Yili Industrial Group Company Limited Class A (Consumer Staples, Food Products) | | | | | | | | | | | 25,500 | | | | 80,733 | |
Lenovo Group Limited (Information Technology, Technology Hardware, Storage & Peripherals) | | | | | | | | | | | 8,222,000 | | | | 5,231,834 | |
Maanshan Iron and Steel Company H Shares (Materials, Metals & Mining) | | | | | | | | | | | 5,464,000 | | | | 2,926,415 | |
PetroChina Company Limited H Shares (Energy, Oil, Gas & Consumable Fuels) | | | | | | | | | | | 7,408,000 | | | | 5,422,366 | |
PICC Property and Casualty Company Limited H Shares (Financials, Insurance) | | | | | | | | | | | 7,545,000 | | | | 7,312,212 | |
Ping An Insurance Group Company H Shares (Financials, Insurance) | | | | | | | | | | | 320,500 | | | | 3,018,245 | |
Sands China Limited (Consumer Discretionary, Hotels, Restaurants & Leisure) | | | | | | | | | | | 636,000 | | | | 2,506,060 | |
| | | | |
| | | | | | | | | | | | | | | 128,951,730 | |
| | | | | | | | | | | | | | | | |
| | | | |
| Hong Kong: 1.76% | | | | | | | | | | | | | | | | |
China Merchants Port Holdings Company Limited (Industrials, Transportation Infrastructure) | | | | | | | | | | | 1,452,000 | | | | 2,470,008 | |
Chow Tai Fook Jewellery Company Limited (Consumer Discretionary, Specialty Retail) | | | | | | | | | | | 4,938,200 | | | | 4,326,148 | |
Xinyi Glass Holdings Limited (Consumer Discretionary, Auto Components) | | | | | | | | | | | 2,510,000 | | | | 2,483,770 | |
| | | | |
| | | | | | | | | | | | | | | 9,279,926 | |
| | | | | | | | | | | | | | | | |
The accompanying notes are an integral part of these financial statements.
| | | | |
| 12 | | Wells Fargo Emerging Markets Equity Income Fund | | Portfolio of investments—October 31, 2018 |
| | | | | | | | | | | | | | | | |
| Security name | | | | | | | | Shares | | | Value | |
| | | | |
| India: 5.67% | | | | | | | | | �� | | | | | | | |
Bharat Petroleum Corporation Limited (Energy, Oil, Gas & Consumable Fuels) | | | | | | | | | | | 504,333 | | | $ | 1,876,287 | |
Bharti Infratel Limited (Communication Services, Diversified Telecommunication Services) | | | | | | | | | | | 695,991 | | | | 2,534,256 | |
Care Ratings Limited (Financials, Capital Markets) | | | | | | | | | | | 19,818 | | | | 287,843 | |
Gail India Limited (Utilities, Gas Utilities) | | | | | | | | | | | 1,088,115 | | | | 5,507,161 | |
HCL Technologies Limited (Information Technology, IT Services) | | | | | | | | | | | 205,293 | | | | 2,930,655 | |
Hero Honda Motors Limited (Consumer Discretionary, Automobiles) | | | | | | | | | | | 94,860 | | | | 3,543,668 | |
Infosys Limited (Information Technology, IT Services) | | | | | | | | | | | 858,968 | | | | 7,973,435 | |
NTPC Limited (Utilities, Independent Power & Renewable Electricity Producers) | | | | | | | | | | | 1,267,079 | | | | 2,735,671 | |
Vedanta Limited (Materials, Metals & Mining) | | | | | | | | | | | 891,821 | | | | 2,546,596 | |
| | | | |
| | | | | | | | | | | | | | | 29,935,572 | |
| | | | | | | | | | | | | | | | |
| | | | |
| Indonesia: 2.80% | | | | | | | | | | | | | | | | |
PT Bank Rakyat Indonesia Tbk (Financials, Banks) | | | | | | | | | | | 30,198,700 | | | | 6,257,254 | |
PT Cikarang Listrindo Tbk (Utilities, Independent Power & Renewable Electricity Producers) | | | | | | | | | | | 20,298,200 | | | | 1,194,994 | |
PT Telekomunikasi Indonesia Persero Tbk (Communication Services, Diversified Telecommunication Services) | | | | | | | | | | | 28,886,100 | | | | 7,315,342 | |
| | | | |
| | | | | | | | | | | | | | | 14,767,590 | |
| | | | | | | | | | | | | | | | |
| | | | |
| Luxembourg: 0.80% | | | | | | | | | | | | | | | | |
Ternium SA (Materials, Metals & Mining) | | | | | | | | | | | 132,093 | | | | 4,205,841 | |
| | | | | | | | | | | | | | | | |
| | | | |
| Malaysia: 3.26% | | | | | | | | | | | | | | | | |
Bursa Malaysia Bhd (Financials, Capital Markets) | | | | | | | | | | | 1,697,900 | | | | 2,970,158 | |
CIMB Group Holdings Bhd (Financials, Banks) | | | | | | | | | | | 2,884,700 | | | | 3,943,239 | |
Genting Malaysia Bhd (Consumer Discretionary, Hotels, Restaurants & Leisure) | | | | | | | | | | | 2,511,700 | | | | 2,695,073 | |
Public Bank Bhd (Financials, Banks) | | | | | | | | | | | 632,900 | | | | 3,720,717 | |
Sime Darby Bhd (Industrials, Industrial Conglomerates) | | | | | | | | | | | 7,337,900 | | | | 3,857,899 | |
| | | | |
| | | | | | | | | | | | | | | 17,187,086 | |
| | | | | | | | | | | | | | | | |
| | | | |
| Mexico: 2.17% | | | | | | | | | | | | | | | | |
Grupo Aeroportuario del Pacific SAB de CV (Industrials, Transportation Infrastructure) | | | | | | | | | | | 475,094 | | | | 3,951,233 | |
Grupo Financiero Banorte SAB de CV (Financials, Banks) | | | | | | | | | | | 473,700 | | | | 2,611,579 | |
Wal-Mart de Mexico SAB de CV (Consumer Staples, Food & Staples Retailing) | | | | | | | | | | | 1,901,328 | | | | 4,861,604 | |
| | | | |
| | | | | | | | | | | | | | | 11,424,416 | |
| | | | | | | | | | | | | | | | |
| | | | |
| Peru: 1.07% | | | | | | | | | | | | | | | | |
Credicorp Limited (Financials, Banks) | | | | | | | | | | | 25,095 | | | | 5,664,192 | |
| | | | | | | | | | | | | | | | |
| | | | |
| Poland: 1.14% | | | | | | | | | | | | | | | | |
Powszechny Zaklad Ubezpieczen SA (Financials, Insurance) | | | | | | | | | | | 588,448 | | | | 6,008,468 | |
| | | | | | | | | | | | | | | | |
| | | | |
| Russia: 3.42% | | | | | | | | | | | | | | | | |
Lukoil PJSC ADR (Energy, Oil, Gas & Consumable Fuels) | | | | | | | | | | | 121,178 | | | | 9,051,997 | |
Magnitogorsk Iron and Steel Works (Materials, Metals & Mining) (a) | | | | | | | | | | | 3,981,725 | | | | 2,897,796 | |
Moscow Exchange (Financials, Capital Markets) (a) | | | | | | | | | | | 2,220,004 | | | | 2,962,074 | |
Sberbank of Russia ADR (Financials, Banks) | | | | | | | | | | | 266,617 | | | | 3,146,081 | |
| | | | |
| | | | | | | | | | | | | | | 18,057,948 | |
| | | | | | | | | | | | | | | | |
The accompanying notes are an integral part of these financial statements.
| | | | | | |
| Portfolio of investments—October 31, 2018 | | Wells Fargo Emerging Markets Equity Income Fund | | | 13 | |
| | | | | | | | | | | | | | | | |
| Security name | | | | | | | | Shares | | | Value | |
| | | | |
| Singapore: 1.35% | | | | | | | | | | | | | | | | |
BOC Aviation Limited (Industrials, Trading Companies & Distributors) 144A | | | | | | | | | | | 637,700 | | | $ | 4,557,933 | |
CapitaLand Retail China Trust (Real Estate, Equity REITs) | | | | | | | | | | | 2,609,257 | | | | 2,580,718 | |
| | | | |
| | | | | | | | | | | | | | | 7,138,651 | |
| | | | | | | | | | | | | | | | |
| | | | |
| South Africa: 3.70% | | | | | | | | | | | | | | | | |
Absa Group Limited (Financials, Banks) | | | | | | | | | | | 368,250 | | | | 3,722,065 | |
Growthpoint Properties Limited (Real Estate, Equity REITs) | | | | | | | | | | | 3,105,474 | | | | 4,767,937 | |
Life Healthcare Group Holding Limited (Health Care, Health Care Providers & Services) | | | | | | | | | | | 1,581,540 | | | | 2,626,520 | |
Mr Price Group Limited (Consumer Discretionary, Specialty Retail) | | | | | | | | | | | 182,015 | | | | 2,849,687 | |
Sanlam Limited (Financials, Insurance) | | | | | | | | | | | 573,015 | | | | 2,884,399 | |
The Bidvest Group Limited (Industrials, Industrial Conglomerates) | | | | | | | | | | | 214,164 | | | | 2,667,813 | |
| | | | |
| | | | | | | | | | | | | | | 19,518,421 | |
| | | | | | | | | | | | | | | | |
| | | | |
| South Korea: 12.86% | | | | | | | | | | | | | | | | |
Coway Company Limited (Consumer Discretionary, Household Durables) | | | | | | | | | | | 55,318 | | | | 3,412,624 | |
Hana Financial Group Incorporated (Financials, Banks) | | | | | | | | | | | 67,632 | | | | 2,273,095 | |
Hyundai Motor Company (Consumer Discretionary, Automobiles) | | | | | | | | | | | 52,991 | | | | 4,952,430 | |
Hyundai Robotics Company Limited (Industrials, Machinery) † | | | | | | | | | | | 7,689 | | | | 2,405,448 | |
KB Financial Group Incorporated (Financials, Banks) | | | | | | | | | | | 123,868 | | | | 5,152,335 | |
Korea Electric Power Corporation (Utilities, Electric Utilities) | | | | | | | | | | | 103,139 | | | | 2,452,781 | |
Korean Reinsurance Company (Financials, Insurance) | | | | | | | | | | | 484,164 | | | | 4,117,019 | |
NH Investment & Securities Company Limited (Financials, Capital Markets) | | | | | | | | | | | 228,849 | | | | 2,440,012 | |
POSCO (Materials, Metals & Mining) | | | | | | | | | | | 14,056 | | | | 3,182,351 | |
S-Oil Corporation (Energy, Oil, Gas & Consumable Fuels) | | | | | | | | | | | 24,694 | | | | 2,687,075 | |
Samsung Electronics Company Limited (Information Technology, Technology Hardware, Storage & Peripherals) | | | | | | | | | | | 493,304 | | | | 18,354,692 | |
Samsung Fire & Marine Insurance (Financials, Insurance) | | | | | | | | | | | 13,385 | | | | 3,271,223 | |
SK Innovation Company Limited (Energy, Oil, Gas & Consumable Fuels) | | | | | | | | | | | 29,824 | | | | 5,587,665 | |
SK Telecom Company Limited (Communication Services, Wireless Telecommunication Services) | | | | | | | | | | | 32,189 | | | | 7,570,227 | |
| | | | |
| | | | | | | | | | | | | | | 67,858,977 | |
| | | | | | | | | | | | | | | | |
| | | | |
| Taiwan: 11.28% | | | | | | | | | | | | | | | | |
Advantech Company Limited (Information Technology, Technology Hardware, Storage & Peripherals) | | | | | | | | | | | 736,000 | | | | 5,066,347 | |
Asustek Computer Incorporated (Information Technology, Technology Hardware, Storage & Peripherals) | | | | | | | | | | | 375,000 | | | | 2,775,264 | |
Cathay Financial Holding Company (Financials, Insurance) | | | | | | | | | | | 2,472,000 | | | | 3,914,553 | |
Chicony Electronics Company Limited (Information Technology, Technology Hardware, Storage & Peripherals) | | | | | | | | | | | 1,172,603 | | | | 2,345,737 | |
CTBC Financial Holding Company Limited (Financials, Banks) | | | | | | | | | | | 5,124,130 | | | | 3,419,619 | |
Delta Electronics Incorporated (Information Technology, Electronic Equipment, Instruments & Components) | | | | | | | | | | | 742,000 | | | | 3,117,345 | |
Formosa Plastics Corporation (Materials, Chemicals) | | | | | | | | | | | 1,084,000 | | | | 3,538,248 | |
Hon Hai Precision Industry Company Limited (Information Technology, Electronic Equipment, Instruments & Components) | | | | | | | | | | | 1,811,704 | | | | 4,613,718 | |
Mediatek Incorporated (Information Technology, Semiconductors & Semiconductor Equipment) | | | | | | | | | | | 571,000 | | | | 4,198,122 | |
Taiwan Semiconductor Manufacturing Company Limited (Information Technology, Semiconductors & Semiconductor Equipment) | | | | | | | | | | | 2,692,000 | | | | 20,357,690 | |
TECO Electric & Machinery Company Limited (Industrials, Electrical Equipment) | | | | | | | | | | | 4,342,000 | | | | 2,490,725 | |
Uni-President Enterprises Company (Consumer Staples, Food Products) | | | | | | | | | | | 1,518,000 | | | | 3,674,440 | |
| | | | |
| | | | | | | | | | | | | | | 59,511,808 | |
| | | | | | | | | | | | | | | | |
The accompanying notes are an integral part of these financial statements.
| | | | |
| 14 | | Wells Fargo Emerging Markets Equity Income Fund | | Portfolio of investments—October 31, 2018 |
| | | | | | | | | | | | | | | | |
| Security name | | | | | | | | Shares | | | Value | |
| | | | |
| Thailand: 2.96% | | | | | | | | | | | | | | | | |
Bangkok Bank PCL (Financials, Banks) | | | | | | | | | | | 1,063,400 | | | $ | 6,800,627 | |
Land & Houses PCL (Real Estate, Real Estate Management & Development) | | | | | | | | | | | 8,386,900 | | | | 2,605,884 | |
PTT PCL (Energy, Oil, Gas & Consumable Fuels) | | | | | | | | | | | 1,969,500 | | | | 2,955,735 | |
Thai Beverage PCL (Consumer Staples, Beverages) | | | | | | | | | | | 7,274,100 | | | | 3,282,181 | |
| | | | |
| | | | | | | | | | | | | | | 15,644,427 | |
| | | | | | | | | | | | | | | | |
| | | | |
| United Arab Emirates: 0.74% | | | | | | | | | | | | | | | | |
First Abu Dhabi Bank PJSC (Financials, Banks) | | | | | | | | | | | 1,038,469 | | | | 3,907,175 | |
| | | | | | | | | | | | | | | | |
| | | | |
| United Kingdom: 2.12% | | | | | | | | | | | | | | | | |
Anglo American plc (Materials, Metals & Mining) | | | | | | | | | | | 143,222 | | | | 3,066,728 | |
Mondi plc (Materials, Paper & Forest Products) | | | | | | | | | | | 225,403 | | | | 5,314,192 | |
Polymetal International plc (Materials, Metals & Mining) | | | | | | | | | | | 303,344 | | | | 2,807,972 | |
| | | | |
| | | | | | | | | | | | | | | 11,188,892 | |
| | | | | | | | | | | | | | | | |
| | | | |
Total Common Stocks (Cost $476,989,642) | | | | | | | | | | | | | | | 463,446,162 | |
| | | | | | | | | | | | | | | | |
| | | | |
| | | | | | Expiration date | | | | | | | |
| Participation Notes: 2.84% | | | | | | | | | | | | | | | | |
| | | | |
| China: 2.84% | | | | | | | | | | | | | | | | |
HSBC Bank plc (China State Construction Engineering Corporation Limited) (Industrials, Construction & Engineering) (a)† | | | | | | | 4-11-2019 | | | | 3,133,200 | | | | 2,416,443 | |
HSBC Bank plc (Huayu Automotive Systems Company Limited) (Consumer Discretionary, Auto Components) (a)† | | | | | | | 3-28-2019 | | | | 859,439 | | | | 2,147,427 | |
HSBC Bank plc (Inner Mongolia Yili Industrial Group Company Limited Class A) (Consumer Staples, Food Products) (a)† | | | | | | | 4-26-2019 | | | | 666,000 | | | | 2,108,042 | |
HSBC Bank plc (Inner Mongolia Yili Industrial Group Company Limited) (Consumer Staples, Food Products) (a)† | | | | | | | 4-26-2019 | | | | 318,047 | | | | 1,006,691 | |
UBS AG (Agricultural Bank of China Limited) (Financials, Banks) (a)† | | | | 3-26-2019 | | | | 8,082,900 | | | | 4,484,191 | |
UBS AG (Poly Real Estate Group Company Limited) (Real Estate, Real Estate Management & Development) (a)† | | | | | | | 4-16-2019 | | | | 1,569,539 | | | | 2,834,970 | |
| | | | |
Total Participation Notes (Cost $16,721,786) | | | | | | | | | | | | | | | 14,997,764 | |
| | | | | | | | | | | | | | | | |
| | | | |
| | | Dividend yield | | | | | | | | | | |
| Preferred Stocks: 6.18% | | | | | | | | | | | | | | | | |
| | | | |
| Brazil: 5.18% | | | | | | | | | | | | | | | | |
Banco Bradesco SA (Financials, Banks) | | | 3.55 | % | | | | | | | 873,783 | | | | 8,053,408 | |
Companhia Energetica de Minas Gerais SA (Utilities, Electric Utilities) | | | 1.28 | | | | | | | | 1,638,800 | | | | 4,857,172 | |
Itausa Investimentos Itau (Financials, Banks) | | | 9.19 | | | | | | | | 2,425,719 | | | | 7,326,369 | |
Petroleo Brasil SP ADR (Energy, Oil, Gas & Consumable Fuels) | | | 0.15 | | | | | | | | 479,326 | | | | 7,103,611 | |
| | | | |
| | | | | | | | | | | | | | | 27,340,560 | |
| | | | | | | | | | | | | | | | |
| | | | |
| Chile: 1.00% | | | | | | | | | | | | | | | | |
Sociedad Quimica y Minera de Chile SA Class B (Materials, Chemicals) | | | 1.18 | | | | | | | | 121,502 | | | | 5,254,575 | |
| | | | | | | | | | | | | | | | |
| | | | |
Total Preferred Stocks (Cost $24,457,860) | | | | | | | | | | | | | | | 32,595,135 | |
| | | | | | | | | | | | | | | | |
The accompanying notes are an integral part of these financial statements.
| | | | | | |
| Portfolio of investments—October 31, 2018 | | Wells Fargo Emerging Markets Equity Income Fund | | | 15 | |
| | | | | | | | | | | | | | | | |
| Security name | | Yield | | | | | | Shares | | | Value | |
| | | | |
Short-Term Investments: 1.80% | | | | | | | | | | | | | | | | |
| | | | |
| Investment Companies: 1.80% | | | | | | | | | | | | | | | | |
Wells Fargo Government Money Market Fund Select Class (l)(u) | | | 2.07 | % | | | | | | | 9,497,532 | | | $ | 9,497,532 | |
| | | | | | | | | | | | | | | | |
| | | | |
Total Short-Term Investments (Cost $9,497,532) | | | | | | | | | | | | | | | 9,497,532 | |
| | | | | | | | | | | | | | | | |
| | | | | | | | |
| Total investments in securities (Cost $527,666,820) | | | 98.65 | % | | | 520,536,593 | |
Other assets and liabilities, net | | | 1.35 | | | | 7,141,386 | |
| | | | | | | | |
| Total net assets | | | 100.00 | % | | $ | 527,677,979 | |
| | | | | | | | |
| (a) | The security is fair valued in accordance with procedures approved by the Board of Trustees. |
| 144A | The security may be resold in transactions exempt from registration, normally to qualified institutional buyers, pursuant to Rule 144A under the Securities Act of 1933. |
| † | Non-income-earning security |
| (l) | The issuer of the security is an affiliated person of the Fund as defined in the Investment Company Act of 1940. |
| (u) | The rate represents the 7-day annualized yield at period end. |
Abbreviations:
| ADR | American depositary receipt |
| REIT | Real estate investment trust |
Investments in Affiliates
An affiliated investment is an investment in which the Fund owns at least 5% of the outstanding voting shares of the issuer or as a result of other relationships, such as the Fund and the issuer having the same investment manager. Transactions with issuers that were either affiliated persons of the Fund at the beginning of the period or the end of the period were as follows:
| | | | | | | | | | | | | | | | | | | | | | | | | | | | | | | | | | | | |
| | | Shares,
beginning of
period | | | Shares
purchased | | | Shares
sold | | | Shares,
end of
period | | | Net
realized
gains
(losses) | | | Net
change in
unrealized
gains
(losses) | | | Income
from
affiliated
securities | | | Value,
end
of period | | | % of
net
assets | |
Short-Term Investments | | | | | | | | | | | | | | | | | | | | | | | | | | | | | | | | | | | | |
Investment Companies | | | | | | | | | | | | | | | | | | | | | | | | | | | | | | | | | | | | |
Wells Fargo Government Money Market Fund Select Class | | | 38,470,174 | | | | 235,255,069 | | | | 264,227,711 | | | | 9,497,532 | | | $ | 0 | | | $ | 0 | | | $ | 259,988 | | | $ | 9,497,532 | | | | 1.80 | % |
The accompanying notes are an integral part of these financial statements.
| | | | |
| 16 | | Wells Fargo Emerging Markets Equity Income Fund | | Statement of assets and liabilities—October 31, 2018 |
| | | | |
| | | | |
| |
Assets | | | | |
Investments in unaffiliated securities, at value (cost $518,169,288) | | $ | 511,039,061 | |
Investments in affiliated securities, at value (cost $9,497,532) | | | 9,497,532 | |
Foreign currency, at value (cost $1,241,986) | | | 1,238,104 | |
Receivable for investments sold | | | 6,362,689 | |
Receivable for Fund shares sold | | | 988,096 | |
Receivable for dividends | | | 245,896 | |
Prepaid expenses and other assets | | | 54,415 | |
| | | | |
Total assets | | | 529,425,793 | |
| | | | |
| |
Liabilities | | | | |
Payable for Fund shares redeemed | | | 926,769 | |
Management fee payable | | | 407,190 | |
Custodian and accounting fees payable | | | 245,958 | |
Payable for investments purchased | | | 70,021 | |
Administration fees payable | | | 59,396 | |
Distribution fees payable | | | 9,265 | |
Trustees’ fees and expenses payable | | | 948 | |
Accrued expenses and other liabilities | | | 28,267 | |
| | | | |
Total liabilities | | | 1,747,814 | |
| | | | |
Total net assets | | $ | 527,677,979 | |
| | | | |
| |
NET ASSETS CONSIST OF | | | | |
Paid-in capital | | $ | 543,074,180 | |
Total distributable loss | | | (15,396,201 | ) |
| | | | |
Total net assets | | $ | 527,677,979 | |
| | | | |
| |
COMPUTATION OF NET ASSET VALUE AND OFFERING PRICE PER SHARE | | | | |
Net assets – Class A | | $ | 19,684,448 | |
Shares outstanding – Class A1 | | | 1,905,867 | |
Net asset value per share – Class A | | | $10.33 | |
Maximum offering price per share – Class A2 | | | $10.96 | |
Net assets – Class C | | $ | 13,896,371 | |
Shares outstanding – Class C1 | | | 1,352,611 | |
Net asset value per share – Class C | | | $10.27 | |
Net assets – Class R | | $ | 92,250 | |
Shares outstanding – Class R1 | | | 8,921 | |
Net asset value per share – Class R | | | $10.34 | |
Net assets – Class R6 | | $ | 36,596,869 | |
Shares outstanding – Class R61 | | | 3,538,525 | |
Net asset value per share – Class R6 | | | $10.34 | |
Net assets – Administrator Class | | $ | 4,758,320 | |
Shares outstanding – Administrator Class1 | | | 457,010 | |
Net asset value per share – Administrator Class | | | $10.41 | |
Net assets – Institutional Class | | $ | 452,649,721 | |
Shares outstanding – Institutional Class1 | | | 43,720,675 | |
Net asset value per share – Institutional Class | | | $10.35 | |
| 1 | The Fund has an unlimited number of authorized shares. |
| 2 | Maximum offering price is computed as 100/94.25 of net asset value. On investments of $50,000 or more, the offering price is reduced. |
The accompanying notes are an integral part of these financial statements.
| | | | | | |
| Statement of operations—year ended October 31, 2018 | | Wells Fargo Emerging Markets Equity Income Fund | | | 17 | |
| | | | |
| | | | |
| |
Investment income | | | | |
Dividends (net of foreign withholding taxes of $2,503,587) | | $ | 24,001,383 | |
Income from affiliated securities | | | 259,988 | |
| | | | |
Total investment income | | | 24,261,371 | |
| | | | |
| |
Expenses | | | | |
Management fee | | | 6,496,005 | |
Administration fees | | | | |
Class A | | | 49,641 | |
Class C | | | 35,465 | |
Class R | | | 138 | |
Class R6 | | | 12,867 | |
Administrator Class | | | 12,794 | |
Institutional Class | | | 682,945 | |
Shareholder servicing fees | | | | |
Class A | | | 59,096 | |
Class C | | | 42,220 | |
Class R | | | 165 | |
Administrator Class | | | 23,105 | |
Distribution fees | | | | |
Class C | | | 126,659 | |
Class R | | | 165 | |
Custody and accounting fees | | | 731,060 | |
Professional fees | | | 47,793 | |
Registration fees | | | 82,881 | |
Shareholder report expenses | | | 97,240 | |
Trustees’ fees and expenses | | | 22,306 | |
Other fees and expenses | | | 32,039 | |
| | | | |
Total expenses | | | 8,554,584 | |
Less: Fee waivers and/or expense reimbursements | | | (716,975 | ) |
| | | | |
Net expenses | | | 7,837,609 | |
| | | | |
Net investment income | | | 16,423,762 | |
| | | | |
| |
REALIZED AND UNREALIZED GAINS (LOSSES) ON INVESTMENTS | | | | |
Net realized gains on investments | | | 14,541,219 | |
Net change in unrealized gains (losses) on investments | | | (86,709,764 | ) |
| | | | |
Net realized and unrealized gains (losses) on investments | | | (72,168,545 | ) |
| | | | |
Net decrease in net assets resulting from operations | | $ | (55,744,783 | ) |
| | | | |
The accompanying notes are an integral part of these financial statements.
| | | | |
| 18 | | Wells Fargo Emerging Markets Equity Income Fund | | Statement of changes in net assets |
| | | | | | | | | | | | | | | | |
| | | Year ended
October 31, 2018 | | | Year ended
October 31, 20171 | |
| | | |
Operations | | | | | | | | | | | | |
Net investment income | | | | | | $ | 16,423,762 | | | | | | | $ | 11,597,405 | |
Net realized gains (losses) on investments | | | | | | | 14,541,219 | | | | | | | | (3,636,299 | ) |
Net change in unrealized gains (losses) on investments | | | | | | | (86,709,764 | ) | | | | | | | 62,981,538 | |
| | | | |
Net increase (decrease) in net assets resulting from operations | | | | | | | (55,744,783 | ) | | | | | | | 70,942,644 | |
| | | | |
| | | |
Distributions to shareholders from net investment income and net realized gains | | | | | | | | | | | | |
Class A | | | | | | | (525,457 | ) | | | | | | | (390,251 | ) |
Class C | | | | | | | (266,035 | ) | | | | | | | (158,747 | ) |
Class R | | | | | | | (1,773 | ) | | | | | | | (467 | ) |
Class R6 | | | | | | | (1,110,103 | ) | | | | | | | (855,755 | ) |
Administrator Class | | | | | | | (176,274 | ) | | | | | | | (225,230 | ) |
Institutional Class | | | | | | | (13,821,796 | ) | | | | | | | (9,529,261 | ) |
| | | | |
Total distributions to shareholders | | | | | | | (15,901,438 | ) | | | | | | | (11,159,711 | ) |
| | | | |
| | | | |
Capital share transactions | | | Shares | | | | | | | | Shares | | | | | |
Proceeds from shares sold | | | | | | | | | | | | | | | | |
Class A | | | 1,055,482 | | | | 12,458,892 | | | | 1,340,340 | | | | 14,361,130 | |
Class C | | | 290,851 | | | | 3,426,780 | | | | 485,274 | | | | 5,275,730 | |
Class R | | | 6,119 | | | | 72,995 | | | | 0 | | | | 0 | |
Class R6 | | | 544,426 | | | | 5,989,376 | | | | 4,641,082 | | | | 50,565,308 | |
Administrator Class | | | 365,539 | | | | 4,353,033 | | | | 420,223 | | | | 4,491,827 | |
Institutional Class | | | 15,709,830 | | | | 185,993,163 | | | | 25,669,078 | | | | 273,448,732 | |
| | | | |
| | | | | | | 212,294,239 | | | | | | | | 348,142,727 | |
| | | | |
Reinvestment of distributions | | | | | | | | | | | | | | | | |
Class A | | | 45,302 | | | | 509,928 | | | | 34,360 | | | | 371,140 | |
Class C | | | 20,786 | | | | 230,960 | | | | 12,373 | | | | 135,828 | |
Class R | | | 100 | | | | 1,107 | | | | 37 | | | | 406 | |
Class R6 | | | 71,439 | | | | 811,863 | | | | 75,780 | | | | 855,656 | |
Administrator Class | | | 14,654 | | | | 170,162 | | | | 19,897 | | | | 220,679 | |
Institutional Class | | | 1,130,762 | | | | 12,805,195 | | | | 786,082 | | | | 8,603,349 | |
| | | | |
| | | | | | | 14,529,215 | | | | | | | | 10,187,058 | |
| | | | |
Payment for shares redeemed | | | | | | | | | | | | | | | | |
Class A | | | (1,144,886 | ) | | | (13,380,105 | ) | | | (1,999,905 | ) | | | (21,197,128 | ) |
Class C | | | (412,291 | ) | | | (4,734,240 | ) | | | (346,875 | ) | | | (3,692,327 | ) |
Class R | | | (36 | ) | | | (414 | ) | | | 0 | | | | 0 | |
Class R6 | | | (2,016,811 | ) | | | (23,813,908 | ) | | | (29,306 | ) | | | (331,724 | ) |
Administrator Class | | | (1,108,398 | ) | | | (13,334,749 | ) | | | (4,195,059 | ) | | | (40,979,767 | ) |
Institutional Class | | | (17,094,623 | ) | | | (198,267,648 | ) | | | (23,935,891 | ) | | | (246,056,781 | ) |
| | | | |
| | | | | | | (253,531,064 | ) | | | | | | | (312,257,727 | ) |
| | | | |
Net increase (decrease) in net assets resulting from capital share transactions | | | | | | | (26,707,610 | ) | | | | | | | 46,072,058 | |
| | | | |
Total increase (decrease) in net assets | | | | | | | (98,353,831 | ) | | | | | | | 108,854,991 | |
| | | | |
| | |
Net assets | | | | | | | | |
Beginning of period | | | | | | | 626,031,810 | | | | | | | | 520,176,819 | |
| | | | |
End of period | | | | | | $ | 527,677,979 | | | | | | | $ | 626,031,810 | |
| | | | |
| 1 | Effective for all filings after November 4, 2018, the SEC prospectively eliminated the requirement to parenthetically disclose undistributed net investment income at the end of the period and permitted the aggregation of distributions, with the exception of tax basis returns of capital. Undistributed net investment income at October 31, 2017 was $824,494. The disaggregated distributions information for the year ended October 31, 2017 is included in Note 7, Distributions to Shareholders, in the notes to the financial statements. |
The accompanying notes are an integral part of these financial statements.
| | | | | | |
| Financial highlights | | Wells Fargo Emerging Markets Equity Income Fund | | | 19 | |
(For a share outstanding throughout each period)
| | | | | | | | | | | | | | | | | | | | |
| | | Year ended October 31 | |
| CLASS A | | 2018 | | | 2017 | | | 2016 | | | 2015 | | | 2014 | |
Net asset value, beginning of period | | | $11.68 | | | | $10.27 | | | | $9.97 | | | | $11.33 | | | | $11.79 | |
Net investment income | | | 0.27 | | | | 0.18 | 1 | | | 0.23 | 1 | | | 0.20 | | | | 0.33 | |
Net realized and unrealized gains (losses) on investments | | | (1.36 | ) | | | 1.43 | | | | 0.29 | | | | (1.36 | ) | | | (0.11 | ) |
| | | | | | | | | | | | | | | | | | | | |
Total from investment operations | | | (1.09 | ) | | | 1.61 | | | | 0.52 | | | | (1.16 | ) | | | 0.22 | |
Distributions to shareholders from | | | | | | | | | | | | | | | | | | | | |
Net investment income | | | (0.26 | ) | | | (0.20 | ) | | | (0.22 | ) | | | (0.20 | ) | | | (0.31 | ) |
Net realized gains | | | 0.00 | | | | 0.00 | | | | 0.00 | | | | 0.00 | | | | (0.37 | ) |
| | | | | | | | | | | | | | | | | | | | |
Total distributions to shareholders | | | (0.26 | ) | | | (0.20 | ) | | | (0.22 | ) | | | (0.20 | ) | | | (0.68 | ) |
Net asset value, end of period | | | $10.33 | | | | $11.68 | | | | $10.27 | | | | $9.97 | | | | $11.33 | |
Total return2 | | | (9.47 | )% | | | 15.79 | % | | | 5.29 | % | | | (10.34 | )% | | | 2.05 | % |
Ratios to average net assets (annualized) | | | | | | | | | | | | | | | | | | | | |
Gross expenses | | | 1.67 | % | | | 1.68 | % | | | 1.79 | % | | | 1.89 | % | | | 2.09 | % |
Net expenses | | | 1.62 | % | | | 1.63 | % | | | 1.65 | % | | | 1.65 | % | | | 1.65 | % |
Net investment income | | | 2.30 | % | | | 1.72 | % | | | 2.34 | % | | | 2.22 | % | | | 3.12 | % |
Supplemental data | | | | | | | | | | | | | | | | | | | | |
Portfolio turnover rate | | | 69 | % | | | 80 | % | | | 64 | % | | | 84 | % | | | 91 | % |
Net assets, end of period (000s omitted) | | | $19,684 | | | | $22,774 | | | | $26,459 | | | | $22,866 | | | | $14,010 | |
| 1 | Calculated based upon average shares outstanding. |
| 2 | Total return calculations do not include any sales charges. |
The accompanying notes are an integral part of these financial statements.
| | | | |
| 20 | | Wells Fargo Emerging Markets Equity Income Fund | | Financial highlights |
(For a share outstanding throughout each period)
| | | | | | | | | | | | | | | | | | | | |
| | | Year ended October 31 | |
| CLASS C | | 2018 | | | 2017 | | | 2016 | | | 2015 | | | 2014 | |
Net asset value, beginning of period | | | $11.63 | | | | $10.23 | | | | $9.94 | | | | $11.32 | | | | $11.79 | |
Net investment income | | | 0.18 | | | | 0.13 | | | | 0.16 | 1 | | | 0.14 | | | | 0.23 | |
Net realized and unrealized gains (losses) on investments | | | (1.35 | ) | | | 1.39 | | | | 0.28 | | | | (1.38 | ) | | | (0.08 | ) |
| | | | | | | | | | | | | | | | | | | | |
Total from investment operations | | | (1.17 | ) | | | 1.52 | | | | 0.44 | | | | (1.24 | ) | | | 0.15 | |
Distributions to shareholders from | | | | | | | | | | | | | | | | | | | | |
Net investment income | | | (0.19 | ) | | | (0.12 | ) | | | (0.15 | ) | | | (0.14 | ) | | | (0.25 | ) |
Net realized gains | | | 0.00 | | | | 0.00 | | | | 0.00 | | | | 0.00 | | | | (0.37 | ) |
| | | | | | | | | | | | | | | | | | | | |
Total distributions to shareholders | | | (0.19 | ) | | | (0.12 | ) | | | (0.15 | ) | | | (0.14 | ) | | | (0.62 | ) |
Net asset value, end of period | | | $10.27 | | | | $11.63 | | | | $10.23 | | | | $9.94 | | | | $11.32 | |
Total return2 | | | (10.20 | )% | | | 14.91 | % | | | 4.53 | % | | | (10.95 | )% | | | 1.27 | % |
Ratios to average net assets (annualized) | | | | | | | | | | | | | | | | | | | | |
Gross expenses | | | 2.42 | % | | | 2.42 | % | | | 2.54 | % | | | 2.64 | % | | | 2.83 | % |
Net expenses | | | 2.37 | % | | | 2.38 | % | | | 2.40 | % | | | 2.40 | % | | | 2.40 | % |
Net investment income | | | 1.53 | % | | | 1.18 | % | | | 1.62 | % | | | 1.45 | % | | | 2.17 | % |
Supplemental data | | | | | | | | | | | | | | | | | | | | |
Portfolio turnover rate | | | 69 | % | | | 80 | % | | | 64 | % | | | 84 | % | | | 91 | % |
Net assets, end of period (000s omitted) | | | $13,896 | | | | $16,898 | | | | $13,327 | | | | $10,190 | | | | $6,390 | |
| 1 | Calculated based upon average shares outstanding. |
| 2 | Total return calculations do not include any sales charges. |
The accompanying notes are an integral part of these financial statements.
| | | | | | |
| Financial highlights | | Wells Fargo Emerging Markets Equity Income Fund | | | 21 | |
(For a share outstanding throughout each period)
| | | | | | | | | | | | | | | | |
| | | Year ended October 31 | |
| CLASS R | | 2018 | | | 2017 | | | 2016 | | | 20151 | |
Net asset value, beginning of period | | | $11.71 | | | | $10.30 | | | | $9.99 | | | | $9.44 | |
Net investment income (loss) | | | 0.24 | | | | 0.18 | | | | 0.20 | 2 | | | (0.01 | )2 |
Net realized and unrealized gains (losses) on investments | | | (1.37 | ) | | | 1.40 | | | | 0.30 | | | | 0.56 | |
| | | | | | | | | | | | | | | | |
Total from investment operations | | | (1.13 | ) | | | 1.58 | | | | 0.50 | | | | 0.55 | |
Distributions to shareholders from | | | | | | | | | | | | | | | | |
Net investment income | | | (0.24 | ) | | | (0.17 | ) | | | (0.19 | ) | | | (0.00 | )3 |
Net asset value, end of period | | | $10.34 | | | | $11.71 | | | | $10.30 | | | | $9.99 | |
Total return4 | | | (9.70 | )% | | | 15.39 | % | | | 5.13 | % | | | 5.87 | % |
Ratios to average net assets (annualized) | | | | | | | | | | | | | | | | |
Gross expenses | | | 1.94 | % | | | 1.91 | % | | | 2.04 | % | | | 2.10 | % |
Net expenses | | | 1.87 | % | | | 1.87 | % | | | 1.90 | % | | | 1.90 | % |
Net investment income (loss) | | | 2.64 | % | | | 1.69 | % | | | 2.08 | % | | | (0.90 | )% |
Supplemental data | | | | | | | | | | | | | | | | |
Portfolio turnover rate | | | 69 | % | | | 80 | % | | | 64 | % | | | 84 | % |
Net assets, end of period (000s omitted) | | | $92 | | | | $32 | | | | $28 | | | | $26 | |
| 1 | For the period from September 30, 2015 (commencement of class operations) to October 31, 2015 |
| 2 | Calculated based upon average shares outstanding |
| 3 | Amount is less than $0.005. |
| 4 | Returns for periods of less than one year are not annualized. |
The accompanying notes are an integral part of these financial statements.
| | | | |
| 22 | | Wells Fargo Emerging Markets Equity Income Fund | | Financial highlights |
(For a share outstanding throughout each period)
| | | | | | | | | | | | | | | | |
| | | Year ended October 31 | |
| CLASS R6 | | 2018 | | | 2017 | | | 2016 | | | 20151 | |
Net asset value, beginning of period | | | $11.69 | | | | $10.29 | | | | $9.97 | | | | $9.42 | |
Net investment income (loss) | | | 0.32 | | | | 0.33 | 2 | | | 0.30 | 2 | | | (0.00 | )2,3 |
Net realized and unrealized gains (losses) on investments | | | (1.35 | ) | | | 1.32 | | | | 0.27 | | | | 0.56 | |
| | | | | | | | | | | | | | | | |
Total from investment operations | | | (1.03 | ) | | | 1.65 | | | | 0.57 | | | | 0.56 | |
Distributions to shareholders from | | | | | | | | | | | | | | | | |
Net investment income | | | (0.32 | ) | | | (0.25 | ) | | | (0.25 | ) | | | (0.01 | ) |
Net asset value, end of period | | | $10.34 | | | | $11.69 | | | | $10.29 | | | | $9.97 | |
Total return4 | | | (9.05 | )% | | | 16.25 | % | | | 5.90 | % | | | 5.91 | % |
Ratios to average net assets (annualized) | | | | | | | | | | | | | | | | |
Gross expenses | | | 1.24 | % | | | 1.20 | % | | | 1.36 | % | | | 1.40 | % |
Net expenses | | | 1.17 | % | | | 1.17 | % | | | 1.20 | % | | | 1.20 | % |
Net investment income (loss) | | | 2.58 | % | | | 2.96 | % | | | 3.03 | % | | | (0.19 | )% |
Supplemental data | | | | | | | | | | | | | | | | |
Portfolio turnover rate | | | 69 | % | | | 80 | % | | | 64 | % | | | 84 | % |
Net assets, end of period (000s omitted) | | | $36,597 | | | | $57,765 | | | | $2,592 | | | | $26 | |
| 1 | For the period from September 30, 2015 (commencement of class operations) to October 31, 2015 |
| 2 | Calculated based upon average shares outstanding |
| 3 | Amount is more than $(0.005). |
| 4 | Returns for periods of less than one year are not annualized. |
The accompanying notes are an integral part of these financial statements.
| | | | | | |
| Financial highlights | | Wells Fargo Emerging Markets Equity Income Fund | | | 23 | |
(For a share outstanding throughout each period)
| | | | | | | | | | | | | | | | | | | | |
| | | Year ended October 31 | |
| ADMINISTRATOR CLASS | | 2018 | | | 2017 | | | 2016 | | | 2015 | | | 2014 | |
Net asset value, beginning of period | | | $11.76 | | | | $10.32 | | | | $10.00 | | | | $11.35 | | | | $11.80 | |
Net investment income | | | 0.22 | 1 | | | 0.18 | 1 | | | 0.25 | 1 | | | 0.23 | | | | 0.33 | 1 |
Net realized and unrealized gains (losses) on investments | | | (1.29 | ) | | | 1.46 | | | | 0.29 | | | | (1.37 | ) | | | (0.08 | ) |
| | | | | | | | | | | | | | | | | | | | |
Total from investment operations | | | (1.07 | ) | | | 1.64 | | | | 0.54 | | | | (1.14 | ) | | | 0.25 | |
Distributions to shareholders from | | | | | | | | | | | | | | | | | | | | |
Net investment income | | | (0.28 | ) | | | (0.20 | ) | | | (0.22 | ) | | | (0.21 | ) | | | (0.33 | ) |
Net realized gains | | | 0.00 | | | | 0.00 | | | | 0.00 | | | | 0.00 | | | | (0.37 | ) |
| | | | | | | | | | | | | | | | | | | | |
Total distributions to shareholders | | | (0.28 | ) | | | (0.20 | ) | | | (0.22 | ) | | | (0.21 | ) | | | (0.70 | ) |
Net asset value, end of period | | | $10.41 | | | | $11.76 | | | | $10.32 | | | | $10.00 | | | | $11.35 | |
Total return | | | (9.29 | )% | | | 15.99 | % | | | 5.56 | % | | | (10.12 | )% | | | 2.30 | % |
Ratios to average net assets (annualized) | | | | | | | | | | | | | | | | | | | | |
Gross expenses | | | 1.57 | % | | | 1.58 | % | | | 1.71 | % | | | 1.76 | % | | | 1.91 | % |
Net expenses | | | 1.45 | % | | | 1.45 | % | | | 1.45 | % | | | 1.45 | % | | | 1.45 | % |
Net investment income | | | 1.86 | % | | | 1.73 | % | | | 2.54 | % | | | 2.38 | % | | | 2.89 | % |
Supplemental data | | | | | | | | | | | | | | | | | | | | |
Portfolio turnover rate | | | 69 | % | | | 80 | % | | | 64 | % | | | 84 | % | | | 91 | % |
Net assets, end of period (000s omitted) | | | $4,758 | | | | $13,940 | | | | $50,970 | | | | $43,928 | | | | $52,896 | |
| 1 | Calculated based upon average shares outstanding. |
The accompanying notes are an integral part of these financial statements.
| | | | |
| 24 | | Wells Fargo Emerging Markets Equity Income Fund | | Financial highlights |
(For a share outstanding throughout each period)
| | | | | | | | | | | | | | | | | | | | |
| | | Year ended October 31 | |
| INSTITUTIONAL CLASS | | 2018 | | | 2017 | | | 2016 | | | 2015 | | | 2014 | |
Net asset value, beginning of period | | | $11.70 | | | | $10.30 | | | | $9.98 | | | | $11.34 | | | | $11.79 | |
Net investment income | | | 0.32 | | | | 0.25 | | | | 0.27 | 1 | | | 0.25 | 1 | | | 0.35 | |
Net realized and unrealized gains (losses) on investments | | | (1.36 | ) | | | 1.39 | | | | 0.30 | | | | (1.36 | ) | | | (0.07 | ) |
| | | | | | | | | | | | | | | | | | | | |
Total from investment operations | | | (1.04 | ) | | | 1.64 | | | | 0.57 | | | | (1.11 | ) | | | 0.28 | |
Distributions to shareholders from | | | | | | | | | | | | | | | | | | | | |
Net investment income | | | (0.31 | ) | | | (0.24 | ) | | | (0.25 | ) | | | (0.25 | ) | | | (0.36 | ) |
Net realized gains | | | 0.00 | | | | 0.00 | | | | 0.00 | | | | 0.00 | | | | (0.37 | ) |
| | | | | | | | | | | | | | | | | | | | |
Total distributions to shareholders | | | (0.31 | ) | | | (0.24 | ) | | | (0.25 | ) | | | (0.25 | ) | | | (0.73 | ) |
Net asset value, end of period | | | $10.35 | | | | $11.70 | | | | $10.30 | | | | $9.98 | | | | $11.34 | |
Total return | | | (9.11 | )% | | | 16.11 | % | | | 5.84 | % | | | (9.95 | )% | | | 2.52 | % |
Ratios to average net assets (annualized) | | | | | | | | | | | | | | | | | | | | |
Gross expenses | | | 1.34 | % | | | 1.33 | % | | | 1.45 | % | | | 1.51 | % | | | 1.62 | % |
Net expenses | | | 1.22 | % | | | 1.23 | % | | | 1.25 | % | | | 1.25 | % | | | 1.25 | % |
Net investment income | | | 2.73 | % | | | 2.32 | % | | | 2.75 | % | | | 2.41 | % | | | 3.69 | % |
Supplemental data | | | | | | | | | | | | | | | | | | | | |
Portfolio turnover rate | | | 69 | % | | | 80 | % | | | 64 | % | | | 84 | % | | | 91 | % |
Net assets, end of period (000s omitted) | | | $452,650 | | | | $514,624 | | | | $426,801 | | | | $132,918 | | | | $35,114 | |
| 1 | Calculated based upon average shares outstanding. |
The accompanying notes are an integral part of these financial statements.
| | | | | | |
| Notes to financial statements | | Wells Fargo Emerging Markets Equity Income Fund | | | 25 | |
1. ORGANIZATION
Wells Fargo Funds Trust (the “Trust”), a Delaware statutory trust organized on March 10, 1999, is an open-end management investment company registered under the Investment Company Act of 1940, as amended (the “1940 Act”). As an investment company, the Trust follows the accounting and reporting guidance in Financial Accounting Standards Board (“FASB”) Accounting Standards Codification Topic 946, Financial Services – Investment Companies. These financial statements report on the Wells Fargo Emerging Markets Equity Income Fund (the “Fund”) which is a diversified series of the Trust.
2. SIGNIFICANT ACCOUNTING POLICIES
The following significant accounting policies, which are consistently followed in the preparation of the financial statements of the Fund, are in conformity with U.S. generally accepted accounting principles which require management to make estimates and assumptions that affect the reported amounts of assets and liabilities, disclosure of contingent assets and liabilities at the date of the financial statements, and the reported amounts of revenues and expenses during the reporting period. Actual results could differ from those estimates.
Securities valuation
All investments are valued each business day as of the close of regular trading on the New York Stock Exchange (generally 4 p.m. Eastern Time), although the Fund may deviate from this calculation time under unusual or unexpected circumstances.
Equity securities that are listed on a foreign or domestic exchange or market are valued at the official closing price or, if none, the last sales price. If no sale occurs on the principal exchange or market that day, a fair value price will be determined in accordance with the Fund’s Valuation Procedures.
The values of securities denominated in foreign currencies are translated into U.S. dollars at rates provided by an independent foreign currency pricing source at a time each business day specified by the Wells Fargo Asset Management Pricing Committee at Wells Fargo Funds Management, LLC (“Funds Management”).
Many securities markets and exchanges outside the U.S. close prior to the close of the New York Stock Exchange and therefore may not fully reflect trading or events that occur after the close of the principal exchange in which the foreign securities are traded, but before the close of the New York Stock Exchange. If such trading or events are expected to materially affect the value of such securities, then fair value pricing procedures approved by the Board of Trustees of the Fund are applied. These procedures take into account multiple factors including movements in U.S. securities markets after foreign exchanges close. Foreign securities that are fair valued under these procedures are categorized as Level 2 and the application of these procedures may result in transfers between Level 1 and Level 2. Depending on market activity, such fair valuations may be frequent. Such fair value pricing may result in net asset values that are higher or lower than net asset values based on the last reported sales price or latest quoted bid price. On October 31, 2018, such fair value pricing was not used in pricing foreign securities.
Investments in registered open-end investment companies are valued at net asset value.
Investments which are not valued using any of the methods discussed above are valued at their fair value, as determined in good faith by the Board of Trustees. The Board of Trustees has established a Valuation Committee comprised of the Trustees and has delegated to it the authority to take any actions regarding the valuation of portfolio securities that the Valuation Committee deems necessary or appropriate, including determining the fair value of portfolio securities, unless the determination has been delegated to the Wells Fargo Asset Management Pricing Committee. The Board of Trustees retains the authority to make or ratify any valuation decisions or approve any changes to the Valuation Procedures as it deems appropriate. On a quarterly basis, the Board of Trustees receives reports on any valuation actions taken by the Valuation Committee or the Wells Fargo Asset Management Pricing Committee which may include items for ratification.
Foreign currency translation
The accounting records of the Fund are maintained in U.S. dollars. The values of other assets and liabilities denominated in foreign currencies are translated into U.S. dollars at rates provided by an independent foreign currency pricing source at a time each business day specified by the Wells Fargo Asset Management Pricing Committee. Purchases and sales of securities, and income and expenses are converted at the rate of exchange on the respective dates of such transactions. Net realized foreign exchange gains or losses arise from sales of foreign currencies, currency gains or losses realized between the trade and settlement dates on securities transactions, and the difference between the amounts of dividends, interest and foreign withholding taxes recorded and the U.S. dollar equivalent of the amounts actually paid or received. Net unrealized foreign exchange gains and losses arise from changes in the fair value of assets and liabilities other than investments in securities resulting from changes in exchange rates. The changes in net assets arising from
| | | | |
| 26 | | Wells Fargo Emerging Markets Equity Income Fund | | Notes to financial statements |
changes in exchange rates of securities and the changes in net assets resulting from changes in market prices of securities are not separately presented. Such changes are included in net realized and unrealized gains or losses from investments.
Participation notes
The Fund may invest in participation notes to gain exposure to securities in certain foreign markets. Participation notes are issued by banks or broker-dealers and are designed to offer a return linked to a particular underlying foreign security. Participation notes involve transaction costs, which may be higher than those applicable to the underlying foreign security. The holder of the participation note is entitled to receive from the bank or broker-dealer, an amount equal to the dividend paid by the issuer of the underlying foreign security; however, the holder is not entitled to the same rights (i.e. voting rights) as an owner of the underlying foreign security. Investments in participation notes involve risks beyond those normally associated with a direct investment in an underlying security. The Fund has no rights against the issuer of the underlying foreign security and participation notes expose the Fund to counterparty risk in the event the counterparty does not perform. There is also no assurance there will be a secondary trading market for the participation note or that the trading price of the participation note will equal the underlying value of the foreign security that it seeks to replicate.
Forward foreign currency contracts
The Fund is subject to foreign currency risk in the normal course of pursuing its investment objectives. A forward foreign currency contract is an agreement between two parties to purchase or sell a specific currency for an agreed-upon price at a future date. The Fund enters into forward foreign currency contracts to facilitate transactions in foreign-denominated securities and to attempt to minimize the risk to the Fund from adverse changes in the relationship between currencies. Forward foreign currency contracts are recorded at the forward rate and marked-to-market daily. When the contracts are closed, realized gains and losses arising from such transactions are recorded as realized gains or losses on forward foreign currency contracts. The Fund could be exposed to risks if the counterparties to the contracts are unable to meet the terms of their contracts or if the value of the foreign currency changes unfavorably. The Fund’s maximum risk of loss from counterparty credit risk is the unrealized gains on the contracts. This risk may be mitigated if there is a master netting arrangement between the Fund and the counterparty.
Security transactions and income recognition
Securities transactions are recorded on a trade date basis. Realized gains or losses are recorded on the basis of identified cost.
Dividend income is recognized on the ex-dividend date, except for certain dividends from foreign securities, which are recorded as soon as the custodian verifies the ex-dividend date. Dividend income from foreign securities is recorded net of foreign taxes withheld where recovery of such taxes is not assured.
Distributions to shareholders
Distributions to shareholders are recorded on the ex-dividend date and paid from net investment income monthly and any net realized gains are paid at least annually. Such distributions are determined in accordance with income tax regulations and may differ from U.S. generally accepted accounting principles. Dividend sources are estimated at the time of declaration. The tax character of distributions is determined as of the Fund’s fiscal year end. Therefore, a portion of the Fund’s distributions made prior to the Fund’s fiscal year end may be categorized as a tax return of capital at year end.
Federal and other taxes
The Fund intends to continue to qualify as a regulated investment company by distributing substantially all of its investment company taxable income and any net realized capital gains (after reduction for capital loss carryforwards) sufficient to relieve it from all, or substantially all, federal income taxes. Accordingly, no provision for federal income taxes was required.
The Fund’s income and federal excise tax returns and all financial records supporting those returns for the prior three fiscal years are subject to examination by the federal and Delaware revenue authorities. Management has analyzed the Fund’s tax positions taken on federal, state, and foreign tax returns for all open tax years and does not believe that there are any uncertain tax positions that require recognition of a tax liability.
As of October 31, 2018, the aggregate cost of all investments for federal income tax purposes was $529,142,994 and the unrealized gains (losses) consisted of:
| | | | |
Gross unrealized gains | | $ | 45,228,882 | |
Gross unrealized losses | | | (53,835,283 | ) |
Net unrealized losses | | $ | (8,606,401 | ) |
| | | | | | |
| Notes to financial statements | | Wells Fargo Emerging Markets Equity Income Fund | | | 27 | |
As of October 31, 2018, the Fund had capital loss carryforwards which consist of $5,125,846 in short-term capital losses and $2,449,878 in long-term capital losses.
Class allocations
The separate classes of shares offered by the Fund differ principally in applicable sales charges, distribution, shareholder servicing, and administration fees. Class specific expenses are charged directly to that share class. Investment income, common expenses, and realized and unrealized gains (losses) on investments are allocated daily to each class of shares based on the relative proportion of net assets of each class.
3. FAIR VALUATION MEASUREMENTS
Fair value measurements of investments are determined within a framework that has established a fair value hierarchy based upon the various data inputs utilized in determining the value of the Fund’s investments. The three-level hierarchy gives the highest priority to unadjusted quoted prices in active markets for identical assets or liabilities (Level 1) and the lowest priority to unobservable inputs (Level 3). The Fund’s investments are classified within the fair value hierarchy based on the lowest level of input that is significant to the fair value measurement. The inputs are summarized into three broad levels as follows:
| ∎ | | Level 1 – quoted prices in active markets for identical securities |
| ∎ | | Level 2 – other significant observable inputs (including quoted prices for similar securities, interest rates, prepayment speeds, credit risk, etc.) |
| ∎ | | Level 3 – significant unobservable inputs (including the Fund’s own assumptions in determining the fair value of investments) |
The inputs or methodologies used for valuing investments in securities are not necessarily an indication of the risk associated with investing in those securities.
| | | | |
| 28 | | Wells Fargo Emerging Markets Equity Income Fund | | Notes to financial statements |
The following is a summary of the inputs used in valuing the Fund’s assets and liabilities as of October 31, 2018:
| | | | | | | | | | | | | | | | |
| | | Quoted prices
(Level 1) | | | Other significant
observable inputs
(Level 2) | | | Significant
unobservable inputs (Level 3) | | | Total | |
Assets | | | | | | | | | | | | | | | | |
Investments in: | | | | | | | | | | | | | | | | |
| | | | |
Common stocks | | | | | | | | | | | | | | | | |
Brazil | | $ | 25,531,103 | | | $ | 0 | | | $ | 0 | | | $ | 25,531,103 | |
Cambodia | | | 2,582,072 | | | | 0 | | | | 0 | | | | 2,582,072 | |
Chile | | | 5,081,867 | | | | 0 | | | | 0 | | | | 5,081,867 | |
China | | | 128,951,730 | | | | 0 | | | | 0 | | | | 128,951,730 | |
Hong Kong | | | 9,279,926 | | | | 0 | | | | 0 | | | | 9,279,926 | |
India | | | 29,935,572 | | | | 0 | | | | 0 | | | | 29,935,572 | |
Indonesia | | | 13,572,596 | | | | 1,194,994 | | | | 0 | | | | 14,767,590 | |
Luxembourg | | | 4,205,841 | | | | 0 | | | | 0 | | | | 4,205,841 | |
Malaysia | | | 17,187,086 | | | | 0 | | | | 0 | | | | 17,187,086 | |
Mexico | | | 11,424,416 | | | | 0 | | | | 0 | | | | 11,424,416 | |
Peru | | | 5,664,192 | | | | 0 | | | | 0 | | | | 5,664,192 | |
Poland | | | 6,008,468 | | | | 0 | | | | 0 | | | | 6,008,468 | |
Russia | | | 12,198,078 | | | | 5,859,870 | | | | 0 | | | | 18,057,948 | |
Singapore | | | 7,138,651 | | | | 0 | | | | 0 | | | | 7,138,651 | |
South Africa | | | 19,518,421 | | | | 0 | | | | 0 | | | | 19,518,421 | |
South Korea | | | 67,858,977 | | | | 0 | | | | 0 | | | | 67,858,977 | |
Taiwan | | | 59,511,808 | | | | 0 | | | | 0 | | | | 59,511,808 | |
Thailand | | | 15,644,427 | | | | 0 | | | | 0 | | | | 15,644,427 | |
United Arab Emirates | | | 3,907,175 | | | | 0 | | | | 0 | | | | 3,907,175 | |
United Kingdom | | | 11,188,892 | | | | 0 | | | | 0 | | | | 11,188,892 | |
| | | | |
Participation notes | | | 0 | | | | 14,997,764 | | | | 0 | | | | 14,997,764 | |
China |
| | | | |
Preferred stocks | | | | | | | | | | | | | | | | |
Brazil | | | 27,340,560 | | | | 0 | | | | 0 | | | | 27,340,560 | |
Chile | | | 5,254,575 | | | | 0 | | | | 0 | | | | 5,254,575 | |
| | | | |
Short-term investments | | | | | | | | | | | | | | | | |
Investment companies | | | 9,497,532 | | | | 0 | | | | 0 | | | | 9,497,532 | |
Total assets | | $ | 498,483,965 | | | $ | 22,052,628 | | | $ | 0 | | | $ | 520,536,593 | |
Additional sector, industry or geographic detail is included in the Portfolio of Investments.
At October 31, 2018, the Fund did not have any transfers into/out of Level 3.
4. TRANSACTIONS WITH AFFILIATES
Management fee
Funds Management, an indirect wholly owned subsidiary of Wells Fargo & Company (“Wells Fargo”), is the manager of the Fund and provides advisory and fund-level administrative services under an investment management agreement. Under the investment management agreement, Funds Management is responsible for, among other services, implementing the investment objectives and strategies of the Fund, supervising the subadviser and providing fund-level administrative services in connection with the Fund’s operations. As compensation for its services under the investment management agreement, Funds Management is entitled to receive an annual management fee starting at 1.05% and declining to 0.945% as the average daily net assets of the Fund increase. For the year ended October 31, 2018, the management fee was equivalent to an annual rate of 1.05% of the Fund’s average daily net assets.
Funds Management has retained the services of a subadviser to provide daily portfolio management to the Fund. The fee for subadvisory services is borne by Funds Management. Wells Capital Management Incorporated, an affiliate of Funds Management and an indirect wholly owned subsidiary of Wells Fargo, is the subadviser to the Fund and is entitled to receive a fee from Funds Management at an annual rate starting at 0.65% and declining to 0.45% as the average daily net assets of the Fund increase.
| | | | | | |
| Notes to financial statements | | Wells Fargo Emerging Markets Equity Income Fund | | | 29 | |
Administration fees
Under a class-level administration agreement, Funds Management provides class-level administrative services to the Fund, which includes paying fees and expenses for services provided by the transfer agent, sub-transfer agents, omnibus account servicers and record-keepers. As compensation for its services under the class-level administration agreement, Funds Management receives an annual fee which is calculated based on the average daily net assets of each class as follows:
| | | | |
| | | Class-level
administration fee | |
Class A, Class C, Class R | | | 0.21 | % |
Class R6 | | | 0.03 | |
Administrator Class, Institutional Class | | | 0.13 | |
Funds Management has contractually waived and/or reimbursed management and administration fees to the extent necessary to maintain certain net operating expense ratios for the Fund. When each class of the Fund has exceeded its expense cap, Funds Management has waived fees and/or reimbursed expenses from fund level expenses on a proportionate basis and then from class specific expenses; otherwise, waivers and/or reimbursements are applied against class specific expenses before fund level expenses. Funds Management has committed through February 28, 2019 to waive fees and/or reimburse expenses to the extent necessary to cap the Fund’s expenses at 1.62% for Class A shares, 2.37% for Class C shares, 1.87% for Class R shares, 1.17% for Class R6 shares, 1.45% for Administrator Class shares, and 1.22% for Institutional Class shares. After this time, the cap may be increased or the commitment to maintain the cap may be terminated only with the approval of the Board of Trustees.
Distribution fees
The Trust has adopted a distribution plan for Class C and Class R shares of the Fund pursuant to Rule 12b-1 under the 1940 Act. Distribution fees are charged to Class C and Class R shares and paid to Wells Fargo Funds Distributor, LLC (“Funds Distributor”), the principal underwriter, at an annual rate of 0.75% of the average daily net assets of Class C shares and 0.25% of the average daily net assets of Class R shares.
In addition, Funds Distributor is entitled to receive the front-end sales charge from the purchase of Class A shares and a contingent deferred sales charge on the redemption of certain Class A shares. Funds Distributor is also entitled to receive the contingent deferred sales charges from redemptions of Class C shares. For the year ended October 31, 2018, Funds Distributor received $14,717 from the sale of Class A shares. No contingent deferred sales charges were incurred by Class A and Class C shares for the year ended October 31, 2018.
Shareholder servicing fees
The Trust has entered into contracts with one or more shareholder servicing agents, whereby Class A, Class C, Class R and Administrator Class of the Fund are charged a fee at an annual rate of 0.25% of the average daily net assets of each respective class.
A portion of these total shareholder servicing fees were paid to affiliates of Wells Fargo.
Interfund transactions
The Fund may purchase or sell portfolio investment securities to certain other Wells Fargo affiliates pursuant to Rule 17a-7 under the 1940 Act and under procedures adopted by the Board of Trustees. The procedures have been designed to ensure that these interfund transactions, which do not incur broker commissions, are effected at current market prices.
5. INVESTMENT PORTFOLIO TRANSACTIONS
Purchases and sales of investments, excluding U.S. government obligations (if any) and short-term securities, for the year ended October 31, 2018 were $410,784,162 and $428,382,682, respectively.
6. BANK BORROWINGS
The Trust (excluding the money market funds), Wells Fargo Master Trust and Wells Fargo Variable Trust are parties to a $280,000,000 revolving credit agreement whereby the Fund is permitted to use bank borrowings for temporary or emergency purposes, such as to fund shareholder redemption requests. Interest under the credit agreement is charged to the Fund based on a borrowing rate equal to the higher of the Federal Funds rate in effect on that day plus 1.25% or the overnight LIBOR rate in effect on that day plus 1.25%. In addition, an annual commitment fee equal to 0.25% of the unused balance is allocated to each participating fund.
| | | | |
| 30 | | Wells Fargo Emerging Markets Equity Income Fund | | Notes to financial statements |
For the year ended October 31, 2018, there were no borrowings by the Fund under the agreement.
7. DISTRIBUTIONS TO SHAREHOLDERS
The tax character of distributions paid was $15,901,438 and $11,159,711 of ordinary income for the years ended October 31, 2018 and October 31, 2017, respectively.
As of October 31, 2018, the components of distributable earnings on a tax basis were as follows:
| | | | |
Undistributed
ordinary
income | | Unrealized
losses | | Capital loss
carryforward |
$794,903 | | $(8,615,380) | | $(7,575,724) |
Effective for all filings after November 4, 2018, the Securities and Exchange Commission eliminated the requirement to separately state the components of distributions to shareholders. The amounts of distributions to shareholders for the year ended October 31, 2017 were as follows:
| | | | |
| | | Net investment income | |
Class A | | $ | 390,251 | |
Class C | | | 158,747 | |
Class R | | | 467 | |
Class R6 | | | 855,755 | |
Administrator Class | | | 225,230 | |
Institutional Class | | | 9,529,261 | |
8. CONCENTRATION RISKS
Concentration risks result from exposure to a limited number of sectors or geographic regions. A fund that invest a substantial portion of their assets in any sector or geographic region may be more affected by changes in that sector or geographic region than would be a fund whose investments are not heavily weighted in any sector or geographic region.
9. INDEMNIFICATION
Under the Trust’s organizational documents, the officers and Trustees have been granted certain indemnification rights against certain liabilities that may arise out of performance of their duties to the Trust. Additionally, in the normal course of business, the Trust may enter into contracts with service providers that contain a variety of indemnification clauses. The Trust’s maximum exposure under these arrangements is dependent on future claims that may be made against the Fund and, therefore, cannot be estimated.
10. NEW ACCOUNTING PRONOUNCEMENT
In August 2018, FASB issued Accounting Standards Update (“ASU”) No. 2018-13, Fair Value Measurement (Topic 820) Disclosure Framework—Changes to the Disclosure Requirements for Fair Value Measurement. ASU 2018-13 updates the disclosure requirements for fair value measurements by modifying or removing certain disclosures and adding certain new disclosures. The amendments are effective for fiscal years, and interim periods within those fiscal years, beginning after December 15, 2019. Early adoption is permitted. Management has adopted the removal and modification of disclosures early, as permitted, and will adopt the additional new disclosures at the effective date.
| | | | | | |
| Report of independent registered public accounting firm | | Wells Fargo Emerging Markets Equity Income Fund | | | 31 | |
BOARD OF TRUSTEES AND SHAREHOLDERS OF WELLS FARGO FUNDS TRUST:
Opinion on the Financial Statements
We have audited the accompanying statement of assets and liabilities of Wells Fargo Emerging Markets Equity Income Fund (the “Fund”), one of the funds constituting Wells Fargo Funds Trust, including the portfolio of investments, as of October 31, 2018, the related statement of operations for the year then ended, the statements of changes in net assets for each of the years in the two-year period then ended, and the related notes (collectively, the “financial statements”) and the financial highlights for each of the years or periods in the five-year period then ended. In our opinion, the financial statements and financial highlights present fairly, in all material respects, the financial position of the Fund as of October 31, 2018, the results of its operations for the year then ended, the changes in its net assets for each of the years in the two-year period then ended, and the financial highlights for each of the years or periods in the five-year period then ended, in conformity with U.S. generally accepted accounting principles.
Basis for Opinion
These financial statements and financial highlights are the responsibility of the Fund’s management. Our responsibility is to express an opinion on these financial statements and financial highlights based on our audits. We are a public accounting firm registered with the Public Company Accounting Oversight Board (United States) (“PCAOB”) and are required to be independent with respect to the Fund in accordance with the U.S. federal securities laws and the applicable rules and regulations of the Securities and Exchange Commission and the PCAOB.
We conducted our audits in accordance with the standards of the PCAOB. Those standards require that we plan and perform the audit to obtain reasonable assurance about whether the financial statements and financial highlights are free of material misstatement, whether due to error or fraud. Our audits included performing procedures to assess the risks of material misstatement of the financial statements and financial highlights, whether due to error or fraud, and performing procedures that respond to those risks. Such procedures included examining, on a test basis, evidence regarding the amounts and disclosures in the financial statements and financial highlights. Such procedures also included confirmation of securities owned as of October 31, 2018, by correspondence with the custodian and brokers, or by other appropriate auditing procedures. Our audits also included evaluating the accounting principles used and significant estimates made by management, as well as evaluating the overall presentation of the financial statements and financial highlights. We believe that our audits provide a reasonable basis for our opinion.

We have not been able to determine the specific year that we began serving as the auditor of one or more Wells Fargo Funds investment companies, however we are aware that we have served as the auditor of one or more Wells Fargo Funds investment companies since at least 1955.
Boston, Massachusetts
December 21, 2018
| | | | |
| 32 | | Wells Fargo Emerging Markets Equity Income Fund | | Other information (unaudited) |
TAX INFORMATION
Pursuant to Section 854 of the Internal Revenue Code, $15,839,184 of income dividends paid during the fiscal year ended October 31, 2018 has been designated as qualified dividend income (QDI).
For the fiscal year ended October 31, 2018, $173,015 has been designated as interest-related dividends for nonresident alien shareholders pursuant to Section 871 of the Internal Revenue Code.
Pursuant to Section 853 of the Internal Revenue Code, the Fund expects to designate amounts as foreign taxes paid for the fiscal year ended October 31, 2018. Additional details will be available in the semiannual report.
PROXY VOTING INFORMATION
A description of the policies and procedures that the Fund uses to determine how to vote proxies relating to portfolio securities is available, upon request, by calling 1-800-222-8222, visiting our website at wellsfargofunds.com, or visiting the SEC website at sec.gov. Information regarding how the Fund voted proxies relating to portfolio securities during the most recent 12-month period ended June 30 is available on the Fund’s website at wellsfargofunds.com or by visiting the SEC website at sec.gov.
PORTFOLIO HOLDINGS INFORMATION
The complete portfolio holdings for the Fund are publicly available monthly on the Fund’s website (wellsfargofunds.com), on a one-month delayed basis. In addition, top ten holdings information (excluding derivative positions) for the Fund is publicly available on the Fund’s website on a monthly, seven-day or more delayed basis. The Fund files its complete schedule of portfolio holdings with the SEC for the first and third quarters of each fiscal year on Form N-Q, which is available by visiting the SEC website at sec.gov. In addition, the Fund’s Form N-Q may be reviewed and copied at the SEC’s Public Reference Room in Washington, DC, and at regional offices in New York City, at 233 Broadway, and in Chicago, at 175 West Jackson Boulevard, Suite 900. Information about the Public Reference Room may be obtained by calling 1-800-SEC-0330.
| | | | | | |
| Other information (unaudited) | | Wells Fargo Emerging Markets Equity Income Fund | | | 33 | |
BOARD OF TRUSTEES AND OFFICERS
Each of the Trustees and Officers1 listed in the table below acts in identical capacities for each fund in the Wells Fargo family of funds, which consists of 152 mutual funds comprising the Wells Fargo Funds Trust, Wells Fargo Variable Trust, Wells Fargo Master Trust and four closed-end funds (collectively the “Fund Complex”). This table should be read in conjunction with the Prospectus and the Statement of Additional Information2. The mailing address of each Trustee and Officer is 525 Market Street, 12th Floor, San Francisco, CA 94105. Each Trustee and Officer serves an indefinite term, however, each Trustee serves such term until reaching the mandatory retirement age established by the Trustees.
Independent Trustees
| | | | | | |
Name and
year of birth | | Position held and
length of service* | | Principal occupations during past five years or longer | | Current other
public company or
investment company
directorships |
William R. Ebsworth
(Born 1957) | | Trustee, since 2015 | | Retired. From 1984 to 2013, equities analyst, portfolio manager, research director and chief investment officer at Fidelity Management and Research Company in Boston, Tokyo, and Hong Kong, and retired in 2013 as Chief Investment Officer of Fidelity Strategic Advisers, Inc. where he led a team of investment professionals managing client assets. Prior thereto, Board member of Hong Kong Securities Clearing Co., Hong Kong Options Clearing Corp., the Thailand International Fund, Ltd., Fidelity Investments Life Insurance Company, and Empire Fidelity Investments Life Insurance Company. Board member of the Vincent Memorial Hospital Endowment (non-profit organization), where he serves on the Investment Committee and as a Chair of the Audit Committee. Mr. Ebsworth is a CFA® charterholder. | | N/A |
Jane A. Freeman
(Born 1953) | | Trustee, since 2015; Chair Liaison, since 2018 | | Retired. From 2012 to 2014 and 1999 to 2008, Chief Financial Officer of Scientific Learning Corporation. From 2008 to 2012, Ms. Freeman provided consulting services related to strategic business projects. Prior to 1999, Portfolio Manager at Rockefeller & Co. and Scudder, Stevens & Clark. Board member of the Harding Loevner Funds from 1996 to 2014, serving as both Lead Independent Director and chair of the Audit Committee. Board member of the Russell Exchange Traded Funds Trust from 2011 to 2012 and the chair of the Audit Committee. Ms. Freeman is a Board Member of The Ruth Bancroft Garden (non-profit organization). She is also an inactive Chartered Financial Analyst. | | N/A |
Isaiah Harris, Jr.3 (Born 1952) | | Trustee, since 2009 | | Retired. Chairman of the Board of CIGNA Corporation since 2009, and Director since 2005. From 2003 to 2011, Director of Deluxe Corporation. Prior thereto, President and CEO of BellSouth Advertising and Publishing Corp. from 2005 to 2007, President and CEO of BellSouth Enterprises from 2004 to 2005 and President of BellSouth Consumer Services from 2000 to 2003. Emeritus member of the Iowa State University Foundation Board of Governors. Emeritus Member of the Advisory Board of Iowa State University School of Business. Advisory Board Member, Palm Harbor Academy (private school). Advisory Board Member, Child Evangelism Fellowship (non-profit). Mr. Harris is a certified public accountant (inactive status). | | CIGNA Corporation |
Judith M. Johnson3 (Born 1949) | | Trustee, since 2008; Audit Committee Chairman, since 2009 | | Retired. Prior thereto, Chief Executive Officer and Chief Investment Officer of Minneapolis Employees Retirement Fund from 1996 to 2008. Ms. Johnson is an attorney, certified public accountant and a certified managerial accountant. | | N/A |
David F. Larcker
(Born 1950) | | Trustee, since 2009 | | James Irvin Miller Professor of Accounting at the Graduate School of Business, Stanford University, Director of the Corporate Governance Research Initiative and Senior Faculty of The Rock Center for Corporate Governance since 2006. From 2005 to 2008, Professor of Accounting at the Graduate School of Business, Stanford University. Prior thereto, Ernst & Young Professor of Accounting at The Wharton School, University of Pennsylvania from 1985 to 2005. | | N/A |
| | | | |
| 34 | | Wells Fargo Emerging Markets Equity Income Fund | | Other information (unaudited) |
| | | | | | |
Name and
year of birth | | Position held and
length of service* | | Principal occupations during past five years or longer | | Current other
public company or
investment company
directorships |
Olivia S. Mitchell
(Born 1953) | | Trustee, since 2006; Nominating and Governance Committee Chairman, since 2018 | | International Foundation of Employee Benefit Plans Professor, Wharton School of the University of Pennsylvania since 1993. Director of Wharton’s Pension Research Council and Boettner Center on Pensions & Retirement Research, and Research Associate at the National Bureau of Economic Research. Previously, Cornell University Professor from 1978 to 1993. | | N/A |
Timothy J. Penny
(Born 1951) | | Trustee, since 1996; Chairman, since 2018; Vice Chairman, from 2017 to 2018 | | President and Chief Executive Officer of Southern Minnesota Initiative Foundation, a non-profit organization, since 2007. Member of the Board of Trustees of NorthStar Education Finance, Inc., a non-profit organization, since 2007. | | N/A |
James G. Polisson
(Born 1959) | | Trustee, since 2018; Advisory Board Member, from 2017 to 2018 | | Retired. Chief Marketing Officer, Source (ETF) UK Services, Ltd, from 2015 to 2017. From 2012 to 2015, Principal of The Polisson Group, LLC, a management consulting, corporate advisory and principal investing company. Chief Executive Officer and Managing Director at Russell Investments, Global Exchange Traded Funds from 2010 to 2012. Managing Director of Barclays Global Investors from 1998 to 2010 and Global Chief Marketing Officer for iShares and Barclays Global Investors from 2000 to 2010. Trustee of the San Francisco Mechanics’ Institute, a non-profit organization, from 2013 to 2015. Board member of the Russell Exchange Traded Fund Trust from 2011 to 2012. Director of Barclays Global Investors Holdings Deutschland GmbH from 2006 to 2009. Mr. Polisson is an attorney and has a retired status with the Massachusetts and District of Columbia Bar Associations. | | N/A |
Michael S. Scofield4 (Born 1943) | | Trustee, since 2010 | | Served on the Investment Company Institute’s Board of Governors and Executive Committee from 2008-2011 as well the Governing Council of the Independent Directors Council from 2006-2011 and the Independent Directors Council Executive Committee from 2008-2011. Trustee of the Evergreen Fund complex (and its predecessors) from 1984 to 2010. Chairman of the Evergreen Funds from 2000-2010. Former Trustee of the Mentor Funds. Retired Attorney, Law Offices of Michael S. Scofield. | | N/A |
| Pamela Wheelock (Born 1959) | | Trustee, since 2018; Advisory Board Member, from 2017 to 2018 | | Chief Operating Officer, Twin Cities Habitat for Humanity, since January, 2017. Vice President of University Services, University of Minnesota from 2012 to 2017. Prior thereto, on the Board of Directors, Governance Committee and Finance Committee for the Minnesota Philanthropy Partners (Saint Paul Foundation) from 2012 to 2018, Interim President and Chief Executive Officer of Blue Cross Blue Shield of Minnesota from 2010 to 2011, Chairman of the Board from 2009 to 2011 and Board Director from 2003 to 2015. Vice President, Leadership and Community Engagement, Bush Foundation, Saint Paul, Minnesota (a private foundation) from 2009 to 2011. Executive Vice President and Chief Financial Officer, Minnesota Sports and Entertainment from 2004 to 2009 and Senior Vice President from 2002 to 2004. Commissioner of Finance, State of Minnesota, from 1999 to 2002. Currently the Board Chair of the Minnesota Wild Foundation since 2010. | | N/A |
| * | Length of service dates reflect the Trustee’s commencement of service with the Trust’s predecessor entities, where applicable. |
| | | | | | |
| Other information (unaudited) | | Wells Fargo Emerging Markets Equity Income Fund | | | 35 | |
Officers
| | | | | | |
Name and
year of birth | | Position held and
length of service | | Principal occupations during past five years or longer | | |
Andrew Owen
(Born 1960) | | President, since 2017 | | Executive Vice President of Wells Fargo & Company and Head of Affiliated Managers, Wells Fargo Asset Management, since 2014. In addition, Mr. Owen is currently President, Chief Executive Officer and Director of Wells Fargo Funds Management, LLC since 2017. Prior thereto, Executive Vice President responsible for marketing, investments and product development for Wells Fargo Funds Management, LLC, from 2009 to 2014. | | |
Jeremy DePalma1
(Born 1974) | | Treasurer, since 2012 | | Senior Vice President of Wells Fargo Funds Management, LLC since 2009. Senior Vice President of Evergreen Investment Management Company, LLC from 2008 to 2010 and head of the Fund Reporting and Control Team within Fund Administration from 2005 to 2010. | | |
Alexander Kymn
(Born 1973) | | Secretary, since 2018; Chief Legal Officer, since 2018 | | Senior Company Counsel of Wells Fargo Bank, N.A. since 2018 (previously Senior Counsel from 2007 to 2018). Vice President of Wells Fargo Funds Management, LLC from 2008 to 2014. | | |
Michael H. Whitaker
(Born 1967) | | Chief Compliance Officer, since 2016 | | Senior Vice President and Chief Compliance Officer since 2016. Senior Vice President and Chief Compliance Officer for Fidelity Investments from 2007 to 2016. | | |
David Berardi
(Born 1975) | | Assistant Treasurer, since 2009 | | Vice President of Wells Fargo Funds Management, LLC since 2009. Vice President of Evergreen Investment Management Company, LLC from 2008 to 2010. Manager of Fund Reporting and Control for Evergreen Investment Management Company, LLC from 2004 to 2010. | | |
| 1 | Jeremy DePalma acts as Treasurer of 76 funds and Assistant Treasurer of 76 funds in the Fund Complex. |
| 2 | The Statement of Additional Information includes additional information about the Trustees and is available, without charge, upon request, by calling 1-800-222-8222 or by visiting the website at wellsfargofunds.com. |
| 3 | Mr. Harris will replace Ms. Johnson as the Chairman of the Audit Committee effective January 1, 2019. |
| 4 | Mr. Scofield is expected to retire on December 31, 2018. |
| | | | |
| 36 | | Wells Fargo Emerging Markets Equity Income Fund | | Other information (unaudited) |
BOARD CONSIDERATION OF INVESTMENT MANAGEMENT AND SUB-ADVISORY AGREEMENTS:
Wells Fargo Emerging Markets Equity Income Fund
Under the Investment Company Act of 1940 (the “1940 Act”), the Board of Trustees (the “Board”) of Wells Fargo Funds Trust (the “Trust”) must determine annually whether to approve the continuation of the Trust’s investment management and sub-advisory agreements. In this regard, at an in-person meeting held on May 22-23, 2018 (the “Meeting”), the Board, all the members of which have no direct or indirect interest in the investment management and sub-advisory agreements and are not “interested persons” of the Trust, as defined in the 1940 Act (the “Independent Trustees”), reviewed and approved for Wells Fargo Emerging Markets Equity Income Fund (the “Fund”): (i) an investment management agreement (the “Management Agreement”) with Wells Fargo Funds Management, LLC (“Funds Management”); and (ii) an investment sub-advisory agreement (the “Sub-Advisory Agreement”) with Wells Capital Management Incorporated (the “Sub-Adviser”), an affiliate of Funds Management. The Management Agreement and the Sub-Advisory Agreement are collectively referred to as the “Advisory Agreements.”
At the Meeting, the Board considered the factors and reached the conclusions described below relating to the selection of Funds Management and the Sub-Adviser and the approval of the Advisory Agreements. Prior to the Meeting, including at an in-person meeting in April 2018, the Trustees conferred extensively among themselves and with representatives of Funds Management about these matters. Also, the Board has adopted a team-based approach, with each team consisting of a sub-set of Trustees, to assist the full Board in the discharge of its duties in reviewing investment performance and other matters throughout the year. The Independent Trustees were assisted in their evaluation of the Advisory Agreements by independent legal counsel, from whom they received separate legal advice and with whom they met separately.
In providing information to the Board, Funds Management and the Sub-Adviser were guided by a detailed set of requests for information submitted to them by independent legal counsel on behalf of the Independent Trustees at the start of the Board’s annual contract renewal process earlier in 2018. In considering and approving the Advisory Agreements, the Trustees considered the information they believed relevant, including but not limited to the information discussed below. The Board considered not only the specific information presented in connection with the Meeting, but also the knowledge gained over time through interaction with Funds Management and the Sub-Adviser about various topics. In this regard, the Board reviewed reports of Funds Management at each of its quarterly meetings, which included, among other things, portfolio reviews and investment performance reports. In addition, the Board and the teams mentioned above confer with portfolio managers at various times throughout the year. The Board did not identify any particular information or consideration that was all-important or controlling, and each individual Trustee may have attributed different weights to various factors.
After its deliberations, the Board unanimously approved the continuation of the Advisory Agreements for a one-year term and determined that the compensation payable to Funds Management and the Sub-Adviser under each of the Advisory Agreements was reasonable. The Board considered the approval of the Advisory Agreements for the Fund as part of its consideration of agreements for funds across the complex, but its approvals were made on a fund-by-fund basis. The following summarizes a number of important, but not necessarily all, factors considered by the Board in support of its approvals.
Nature, extent and quality of services
The Board received and considered various information regarding the nature, extent and quality of services provided to the Fund by Funds Management and the Sub-Adviser under the Advisory Agreements. This information included a description of the investment advisory services and Fund-level administrative services covered by the Management Agreement, as well as, among other things, a summary of the background and experience of senior management of Wells Fargo Asset Management (“WFAM”), of which Funds Management and the Sub-Adviser are a part, a summary of investments made in the business of WFAM, a summary of certain organizational and personnel changes involving Funds Management and the Sub-Adviser, and a description of Funds Management’s and the Sub-Adviser’s business continuity planning programs and of their approaches to data privacy and cybersecurity. The Board also considered the qualifications, background, tenure and responsibilities of each of the portfolio managers primarily responsible for the day-to-day portfolio management of the Fund.
The Board evaluated the ability of Funds Management and the Sub-Adviser to attract and retain qualified investment professionals, including research, advisory and supervisory personnel. The Board further considered the compliance programs and compliance records of Funds Management and the Sub-Adviser. In addition, the Board took into account the full range of services provided to the Fund by Funds Management and its affiliates.
| | | | | | |
| Other information (unaudited) | | Wells Fargo Emerging Markets Equity Income Fund | | | 37 | |
Fund investment performance and expenses
The Board considered the investment performance results for the Fund over various time periods ended December 31, 2017. The Board considered these results in comparison to the investment performance of funds in a universe that was determined by Broadridge Inc. (“Broadridge”) to be similar to the Fund (the “Universe”), and in comparison to the Fund’s benchmark index and to other comparative data. Broadridge is an independent provider of investment company data. The Board received a description of the methodology used by Broadridge to select the mutual funds in the performance Universe. The Board noted that the investment performance of the Fund (Administrator Class) was in range of the average investment performance of the Universe for the five- year period under review, but lower than the average investment performance of the Universe for the one- and three-year periods under review. The Board also noted that the investment performance of the Fund was in range of its benchmark index, the MSCI Emerging Markets Index, for the five- year period under review, but lower than its benchmark for the one- and three-year periods under review.
The Board received information concerning, and discussed factors contributing to, the underperformance of the Fund relative to the Universe and benchmark for the periods identified above. The Board took note of the explanations for the relative underperformance during these periods, including with respect to investment decisions and market factors that affected the Fund’s investment performance. The Board also took note of the Fund’s outperformance relative to the Universe and benchmark over the longer time periods under review.
The Board also received and considered information regarding the Fund’s net operating expense ratios and their various components, including actual management fees, custodian and other non-management fees, and Rule 12b-1 and non-Rule 12b-1 shareholder service fees. The Board considered these ratios in comparison to the median ratios of funds in class-specific expense groups that were determined by Broadridge to be similar to the Fund (the “Groups”). The Board received a description of the methodology used by Broadridge to select the mutual funds in the expense Groups and an explanation of how funds comprising expense groups and their expense ratios may vary from year-to-year. Based on the Broadridge reports, the Board noted that the net operating expense ratios of the Fund were lower than, equal to, or in range of the median net operating expense ratios of the expense Groups for each share class.
The Board took into account the Fund’s investment performance and expense information provided to it among the factors considered in deciding to re-approve the Advisory Agreements.
Investment management and sub-advisory fee rates
The Board reviewed and considered the contractual fee rates payable by the Fund to Funds Management under the Management Agreement, as well as the contractual fee rates payable by the Fund to Funds Management for class-level administrative services under a Class-Level Administration Agreement, which include, among other things, class-level transfer agency and sub-transfer agency costs (collectively, the “Management Rates”). The Board also reviewed and considered the contractual investment sub-advisory fee rates that are payable by Funds Management to the Sub-Adviser for investment sub-advisory services.
Among other information reviewed by the Board was a comparison of the Fund’s Management Rates with the average contractual investment management fee rates of funds in the expense Groups at a common asset level as well as transfer agency costs of the funds in the expense Groups. The Board noted that the Management Rates of the Fund were lower than, equal to or in the range of the sum of these average rates for the Fund’s expense Groups for all share classes.
The Board also received and considered information about the portion of the total management fee that was retained by Funds Management after payment of the fee to the Sub-Adviser for sub-advisory services. In assessing the reasonableness of this amount, the Board received and evaluated information about the nature and extent of responsibilities retained and risks assumed by Funds Management and not delegated to or assumed by the Sub-Adviser, and about Funds Management’s on-going oversight services. Given the affiliation between Funds Management and the Sub-Adviser, the Board ascribed limited relevance to the allocation of fees between them.
The Board also received and considered information about the nature and extent of services offered and fee rates charged by Funds Management and the Sub-Adviser to other types of clients with investment strategies similar to those of the Fund. In this regard, the Board received information about the significantly greater scope of services, and compliance, reporting and other legal burdens and risks of managing mutual funds compared with those associated with managing assets of non-mutual fund clients such as institutional separate accounts.
Based on its consideration of the factors and information it deemed relevant, including those described here, the Board determined that the compensation payable to Funds Management under the Management Agreement and to the Sub-Adviser under the Sub-Advisory Agreement was reasonable.
| | | | |
| 38 | | Wells Fargo Emerging Markets Equity Income Fund | | Other information (unaudited) |
Profitability
The Board received and considered information concerning the profitability of Funds Management, as well as the profitability of both WFAM and Wells Fargo & Co. (“Wells Fargo”) as a whole, from providing services to the Fund and the fund family as a whole. The Board noted that the Sub-Adviser’s profitability information with respect to providing services to the Fund was subsumed in the WFAM and Wells Fargo profitability analysis.
Funds Management reported on the methodologies and estimates used in calculating profitability, including a description of the methodology used to allocate certain expenses and recent enhancements made to the methodology. Among other things, the Board noted that the levels of profitability reported on a fund-by-fund basis varied widely, depending on factors such as the size and type of fund. Based on its review, the Board did not deem the profits reported by Funds Management, WFAM or Wells Fargo from services provided to the Fund to be at a level that would prevent it from approving the continuation of the Advisory Agreements.
Economies of scale
The Board considered the extent to which Funds Management may experience economies of scale in the provision of management services, and the extent to which scale benefits, if any, would be shared with shareholders. In particular, the Board noted the existence of breakpoints in the Fund’s management fee structure, which operate generally to reduce the Fund’s expense ratios as the Fund grows in size. It considered that, for a small fund or a fund that shrinks in size, breakpoints conversely can result in higher fee levels. The Board also considered that in addition to management fee breakpoints, competitive management fee rates set at the outset without regard to breakpoints and fee waiver and expense reimbursement arrangements, as well as investments in the business intended to enhance services available to Fund shareholders, are means of sharing potential economies of scale with shareholders of the Fund.
The Board concluded that the Fund’s fee and expense arrangements, including contractual breakpoints, constituted a reasonable approach to sharing potential economies of scale with the Fund and its shareholders.
Other benefits to Funds Management and the Sub-Adviser
The Board received and considered information regarding potential “fall-out” or ancillary benefits received by Funds Management and its affiliates, including the Sub-Adviser, as a result of their relationships with the Fund. Ancillary benefits could include, among others, benefits directly attributable to other relationships with the Fund and benefits potentially derived from an increase in Funds Management’s and the Sub-Adviser’s business as a result of their relationships with the Fund. The Board noted that various affiliates of Funds Management may receive distribution-related fees, shareholder servicing payments and sub-transfer agency fees in respect of shares sold or held through them and services provided.
The Board also reviewed information about soft dollar credits earned and utilized by the Sub-Adviser, fees earned by Funds Management and the Sub-Adviser from managing a private investment vehicle for the fund family’s securities lending collateral and commissions earned by an affiliated broker from portfolio transactions.
Based on its consideration of the factors and information it deemed relevant, including those described here, the Board did not find that any ancillary benefits received by Funds Management and its affiliates, including the Sub-Adviser, were unreasonable.
Conclusion
At the Meeting, after considering the above-described factors and based on its deliberations and its evaluation of the information described above, the Board unanimously approved the continuation of the Advisory Agreements for a one-year term and determined that the compensation payable to Funds Management and the Sub-Adviser under each of the Advisory Agreements was reasonable.
| | | | | | |
| Appendix A (unaudited) | | Wells Fargo Emerging Markets Equity Income Fund | | | 39 | |
SALES CHARGE REDUCTIONS AND WAIVERS FOR CERTAIN INTERMEDIARIES
Raymond James & Associates, Inc., Raymond James Financial Services & Raymond James affiliates (“Raymond James”)
Effective on or about March 1, 2019, shareholders purchasing Fund shares through a Raymond James platform or account will be eligible only for the following load waivers (front-end sales charge waivers and contingent deferred, or back-end, sales charge waivers) and discounts, which may differ from those disclosed elsewhere in the Fund’s Prospectus or SAI.
Front-end Sales Load Waivers on Class A shares Available at Raymond James
| | • | | Shares purchased in an investment advisory program. |
| | • | | Shares purchased through reinvestment of capital gains distributions and dividend reinvestment when purchasing shares of the same fund (but not any other fund within the fund family). |
| | • | | Employees and registered representatives of Raymond James or its affiliates and their family members as designated by Raymond James. |
| | • | | Shares purchased from the proceeds of redemptions within the same fund family, provided (1) the repurchase occurs within 90 days following the redemption, (2) the redemption and purchase occur in the same account, and (3) redeemed shares were subject to a front-end or deferred sales load (known as Rights of Reinstatement). |
| | • | | A shareholder in the fund’s Class C shares will have their shares automatically exchanged at net asset value to Class A shares (or the appropriate share class) of the fund if the shares are no longer subject to a CDSC and the exchange is in line with the policies and procedures of Raymond James. |
CDSC Waivers on Class A and C Shares Available at Raymond James
| | • | | Death or disability of the shareholder. |
| | • | | Shares sold as part of a systematic withdrawal plan as described in the Fund’s Prospectus. |
| | • | | Return of excess contributions from an IRA Account. |
| | • | | Shares sold as part of a required minimum distribution for IRA and retirement accounts due to the shareholder reaching age 70½ as described in the Fund’s prospectus. |
| | • | | Shares sold to pay Raymond James fees but only if the transaction is initiated by Raymond James. |
| | • | | Shares acquired through a right of reinstatement. |
Front-end Load Discounts Available at Raymond James: Breakpoints, and/or Rights of Accumulation
| | • | | Breakpoints as described in the Fund’s Prospectus. |
| | • | | Rights of accumulation which entitle shareholders to breakpoint discounts will be automatically calculated based on the aggregated holding of fund family assets held by accounts within the purchaser’s household at Raymond James. Eligible fund family assets not held at Raymond James may be included in the rights of accumulation calculation only if the shareholder notifies his or her financial advisor about such assets. |

For more information
More information about Wells Fargo Funds is available free upon request. To obtain literature, please write, visit the Fund’s website, or call:
Wells Fargo Funds
P.O. Box 219967
Kansas City, MO 64121-9967
Website: wellsfargofunds.com
Individual investors: 1-800-222-8222
Retail investment professionals: 1-888-877-9275
Institutional investment professionals:
1-866-765-0778
This report and the financial statements contained herein are submitted for the general information of the shareholders of the Fund. If this report is used for promotional purposes, distribution of the report must be accompanied or preceded by a current prospectus. Before investing, please consider the investment objectives, risks, charges, and expenses of the investment. For a current prospectus and, if available, a summary prospectus, containing this information, call 1-800-222-8222 or visit the Fund’s website at wellsfargofunds.com. Read the prospectus carefully before you invest or send money.
Wells Fargo Asset Management (WFAM) is the trade name for certain investment advisory/management firms owned by Wells Fargo & Company. These firms include but are not limited to Wells Capital Management Incorporated and Wells Fargo Funds Management, LLC. Certain products managed by WFAM entities are distributed by Wells Fargo Funds Distributor, LLC (a broker/dealer and Member FINRA).
This material is for general informational and educational purposes only and is NOT intended to provide investment advice or a recommendation of any kind—including a recommendation for any specific investment, strategy, or plan.
NOT FDIC INSURED ◾ NO BANK GUARANTEE ◾ MAY LOSE VALUE
© 2018 Wells Fargo Funds Management, LLC. All rights reserved.
| | |
 | | 318245 12-18 A262/AR262 10-18 |
Annual Report
October 31, 2018

Wells Fargo Global Small Cap Fund

Beginning on January 1, 2021, as permitted by new regulations adopted by the Securities and Exchange Commission, paper copies of the Fund’s annual and semi-annual shareholder reports will no longer be sent by mail, unless you specifically request paper copies of the reports. Instead, the reports will be made available on the Fund’s website, and you will be notified by mail each time a report is posted and provided with a website address to access the report.
If you already elected to receive shareholder reports electronically, you will not be affected by this change and you need not take any action. You may elect to receive shareholder reports and other communications from the Fund electronically at any time by contacting your financial intermediary (such as a broker-dealer or bank) or, if you are a direct investor, by calling 1-800-222-8222 or by enrolling at wellsfargo.com/advantagedelivery.
You may elect to receive all future reports in paper free of charge. If you invest through a financial intermediary, you can contact your financial intermediary to request that you continue to receive paper copies of your shareholder reports; if you invest directly with the Fund, you can call 1-800-222-8222. Your election to receive reports in paper will apply to all Wells Fargo Funds held in your account with your financial intermediary or, if you are a direct investor, to all Wells Fargo Funds that you hold.

Reduce clutter. Save trees.
Sign up for electronic delivery of prospectuses and shareholder reports at wellsfargo.com/advantagedelivery
Contents
The views expressed and any forward-looking statements are as of October 31, 2018, unless otherwise noted, and are those of the Fund managers and/or Wells Fargo Funds Management, LLC. Discussions of individual securities, or the markets generally, or any Wells Fargo Fund are not intended as individual recommendations. Future events or results may vary significantly from those expressed in any forward-looking statements. The views expressed are subject to change at any time in response to changing circumstances in the market. Wells Fargo Funds Management, LLC and the Fund disclaim any obligation to publicly update or revise any views expressed or forward-looking statements.
NOT FDIC INSURED ◾ NO BANK GUARANTEE ◾ MAY LOSE VALUE
| | | | |
| 2 | | Wells Fargo Global Small Cap Fund | | Letter to shareholders (unaudited) |

Andrew Owen
President
Wells Fargo Funds
The early months of the reporting period were characterized by strong performance for equity and fixed-income markets. The remainder of the reporting period generated economic, business, and investing data that were decidedly more mixed and volatile relative to the prior year.
Dear Shareholder:
We are pleased to offer you this annual report for the Wells Fargo Global Small Cap Fund for the 12-month period that ended October 31, 2018. The early months of the reporting period were characterized by strong performance for equity and fixed-income markets. The remainder of the reporting period generated economic, business, and investing data that were decidedly more mixed and volatile relative to the prior year.
For the period, U.S. stocks, as measured by the S&P 500 Index,1 gained 7.35% and international stocks, as measured by the MSCI ACWI ex USA Index (Net),2 declined 8.24%. Based on the MSCI EM Index (Net),3 emerging market stocks lost 12.52%. For bond investors, the Bloomberg Barclays U.S. Aggregate Bond Index4 declined 2.05% while the Bloomberg Barclays Global Aggregate ex-USD Index5 fell 2.09%. The Bloomberg Barclays Municipal Bond Index6 dropped 0.51%, and the ICE BofAML U.S. High Yield Index7 was up 0.86%.
Optimism continued to shape markets as 2017 closed and 2018 opened.
Economic conditions in late 2017 were characterized by synchronized global growth, low inflation, healthy corporate earnings, growing consumer confidence, declining unemployment, and a weaker U.S. dollar that supported international growth. The U.S. Bureau of Economic Analysis reported that U.S. gross domestic product (GDP) growth on an annualized basis for the fourth quarter of 2017 was 2.9% and inflation remained below U.S. Federal Reserve (Fed) targets.
Economic momentum continued in Europe. The Bank of England (BOE) raised interest rates in November 2017 to 0.50%, the first increase in more than 10 years, indicating confidence in the economy’s growth potential. Meanwhile, the European Central Bank (ECB) and the Bank of Japan (BOJ) kept interest rates low to spur business activities and bought bonds in an effort to encourage equity investments. The People’s Bank of China (PBOC) also sought to stimulate economic growth. Many emerging market economies benefited from stronger currencies versus the U.S. dollar, while commodity price increases benefited countries that rely on natural resources for exports.
| 1 | The S&P 500 Index consists of 500 stocks chosen for market size, liquidity, and industry group representation. It is a market-value-weighted index with each stock’s weight in the index proportionate to its market value. You cannot invest directly in an index. |
| 2 | The Morgan Stanley Capital International (MSCI) All Country World Index (ACWI) ex USA Index (Net) is a free-float-adjusted market-capitalization-weighted index that is designed to measure the equity market performance of developed markets, excluding the United States and Canada. Source: MSCI. MSCI makes no express or implied warranties or representations and shall have no liability whatsoever with respect to any MSCI data contained herein. The MSCI data may not be further redistributed or used as a basis for other indices or any securities or financial products. This report is not approved, reviewed, or produced by MSCI. You cannot invest directly in an index. |
| 3 | The MSCI Emerging Markets (EM) Index (Net) is a free-float-adjusted market-capitalization-weighted index that is designed to measure large- and mid-cap equity market performance of emerging markets. The MSCI EM Index (Net) consists of the following 24 emerging market country indices: Brazil, Chile, China, Colombia, Czech Republic, Egypt, Greece, Hungary, India, Indonesia, Korea, Malaysia, Mexico, Pakistan, Peru, the Philippines, Poland, Qatar, Russia, South Africa, Taiwan, Thailand, Turkey, and the United Arab Emirates. You cannot invest directly in an index. |
| 4 | The Bloomberg Barclays U.S. Aggregate Bond Index is a broad-based benchmark that measures the investment-grade, U.S. dollar-denominated, fixed-rate taxable bond market, including Treasuries, government-related and corporate securities, mortgage-backed securities (agency fixed-rate and hybrid adjustable-rate mortgage pass-throughs), asset-backed securities, and commercial mortgage-backed securities. You cannot invest directly in an index. |
| 5 | The Bloomberg Barclays Global Aggregate ex-USD Index is an unmanaged index that provides a broad-based measure of the global investment-grade fixed-income markets excluding the U.S. dollar-denominated debt market. You cannot invest directly in an index. |
| 6 | The Bloomberg Barclays Municipal Bond Index is an unmanaged index composed of long-term tax-exempt bonds with a minimum credit rating of Baa. You cannot invest directly in an index. |
| 7 | The ICE BofAML U.S. High Yield Index is a market-capitalization-weighted index of domestic and Yankee high-yield bonds. The index tracks the performance of high-yield securities traded in the U.S. bond market. You cannot invest directly in an index. Copyright 2018. ICE Data Indices, LLC. All rights reserved. |
| | | | | | |
| Letter to shareholders (unaudited) | | Wells Fargo Global Small Cap Fund | | | 3 | |
Volatility reemerged during the early months of 2018.
In February 2018, investor concerns arose about inflation and trade, particularly between the U.S. and China. The Fed followed its 25-basis-point (bp; 100 bps equal 1.00%) federal funds rate increase in December 2017 with a further 25-bp increase in March 2018. The inflation rate in March reached the Fed’s 2% target for the first time in a year. The S&P 500 Index closed the first quarter with a negative return, the first negative quarterly return for the index since 2014.
Overseas, investment markets fell, hurt by a stronger U.S. dollar and mounting trade and diplomatic tensions. The MSCI ACWI ex USA Index (Net) declined 1.81% for the quarter that ended March 31, 2018.
Global trade tensions prompted investor concerns.
Global trade tensions escalated during the second quarter of 2018. The U.S. government’s decision to impose tariffs on a wide range of products manufactured overseas drew retaliatory responses from foreign governments, which punished U.S. commodity producers and product manufacturers. Investors were left to wonder about next steps in what appeared to be an escalating divergence in global economic policies and growth prospects.
Inflation trended higher. The CPI-U8 added 0.1% in June after an increase of 0.2% in both April and May. On a year-over-year basis, the all-items index rose 2.9% for the 12 months that ended June 30, 2018. The index for all items less food and energy rose 2.3% for the same 12-month period.
U.S. stocks gained following positive economic data while international stocks and bonds declined.
During the summer months, the U.S. economy strengthened. Revised second-quarter GDP data released in August showed the U.S. economy growing at a 4.2% rate. The unemployment rate in the U.S. was 3.7% by the end of September, according to the U.S. Department of Labor. Wages showed more consistent growth, and consumer confidence remained strong. Several U.S. equity market indices reached records during August, with the S&P 500 Index gaining 7.20% for the three-month period that ended September 30, 2018. In contrast, the MSCI ACWI ex USA Index (Net) gained 0.71% while the MSCI EM Index (Net) declined 1.09% during the same three-month period.
In June, the Fed increased the target range for the federal funds rate to range from 1.75% to 2.00%. It raised the range again in September to range from 2.00% to 2.25%. Long-term interest rates in the U.S. remained at higher levels relative to the prior 10 years. Rates on 10-year and 30-year Treasury bonds—2.46% and 2.81%, respectively, on January 1, 2018—were 3.15% and 3.39%, respectively, on October 31, 2018. Investor concerns about an inverted yield curve waned, only to be replaced by concerns about the potentially negative influence of higher interest rates on economic activity.
October proved to be a difficult month for stock markets globally.
As interest rates and bond yields gained during October, stock markets struggled. For the month, the S&P 500 Index fell 6.84%, the MSCI ACWI ex USA Index (Net) dropped 8.13%, and the MSCI EM Index (Net) lost 8.71%. The Bureau of Economic Analysis released its first estimate of third-quarter GDP, which, at an annualized 3.5% rate, indicated growth may be slowing compared with the second quarter. Readings on consumer sentiment and business spending were mixed.
The S&P 500 Index closed the first quarter with a negative return, the first negative quarterly return for the index since 2014.
| 8 | The Consumer Price Index for All Urban Consumers (CPI-U) measures the changes in the price of a basket of goods and services purchased by urban consumers. The urban consumer population is deemed by many as a better representative measure of the general public because close to 90% of the country’s population lives in highly populated areas. You cannot invest directly in an index. |
| | | | |
| 4 | | Wells Fargo Global Small Cap Fund | | Letter to shareholders (unaudited) |
Economic signals overseas also were mixed as the third quarter ended and the fourth quarter began. In early August, the BOE’s Monetary Policy Committee increased its key interest rate to 0.75%. The ECB and BOJ maintained low interest rates and accommodative monetary policies. Amid rising trade uncertainty, the PBOC cut reserve requirement ratios and accelerated infrastructure spending and tax cuts for business enterprises and individuals. Nevertheless, a strengthening U.S. dollar and the trade tensions remained headwinds for investors overseas.
Don’t let short-term uncertainty derail long-term investment goals.
Periods of investment uncertainty can present challenges, but experience has taught us that maintaining long-term investment goals can be an effective way to plan for the future. To help you create a sound strategy based on your personal goals and risk tolerance, Wells Fargo Funds offers more than 100 mutual funds spanning a wide range of asset classes and investment styles. Although diversification cannot guarantee an investment profit or prevent losses, we believe it can be an effective way to manage investment risk and potentially smooth out overall portfolio performance. We encourage investors to know their investments and to understand that appropriate levels of risk-taking may unlock opportunities.
Thank you for choosing to invest with Wells Fargo Funds. We appreciate your confidence in us and remain committed to helping you meet your financial needs.
Sincerely,

Andrew Owen
President
Wells Fargo Funds
Notice to shareholders
At a meeting held on August 14-15, 2018, the Board of Trustees of the Fund approved the following policy which will be effective on or about February 5, 2019:
Class C shares will convert automatically into Class A shares ten years after the initial date of purchase or, if you acquired your Class C shares through an exchange or conversion from another share class, ten years after the date you acquired your Class C shares. When Class C shares that you acquired through a purchase or exchange convert, any other Class C shares that you purchased with reinvested dividends and distributions also will convert into Class A shares on a pro rata basis. A shorter holding period may also apply depending on your intermediary. Please see “Appendix A—Sales Charge Reductions and Waivers for Certain Intermediaries” in the Fund’s prospectus or at the end of this report.
For further information about your Fund, contact your investment professional, visit our website at wellsfargofunds.com, or call us directly at 1-800-222-8222.
This page is intentionally left blank.
| | | | |
| 6 | | Wells Fargo Global Small Cap Fund | | Performance highlights (unaudited) |
Investment objective
The Fund seeks long-term capital appreciation.
Manager
Wells Fargo Funds Management, LLC
Subadviser
Wells Capital Management Incorporated
Portfolio managers
Oleg Makhorine
Robert Rifkin, CFA®
James M. Tringas, CFA®
Bryant VanCronkhite, CFA®, CPA
Average annual total returns (%) as of October 31, 20181
| | | | | | | | | | | | | | | | | | | | | | | | | | | | | | | | | | |
| | | | | Including sales charge | | | Excluding sales charge | | | Expense ratios2 (%) | |
| | | Inception date | | 1 year | | | 5 year | | | 10 year | | | 1 year | | | 5 year | | | 10 year | | | Gross | | | Net3 | |
| Class A (EKGAX) | | 3-16-1988 | | | (7.47 | ) | | | 5.96 | | | | 10.58 | | | | (1.82 | ) | | | 7.22 | | | | 11.24 | | | | 1.55 | | | | 1.55 | |
| Class C (EKGCX) | | 2-1-1993 | | | (3.56 | ) | | | 6.42 | | | | 10.40 | | | | (2.56 | ) | | | 6.42 | | | | 10.40 | | | | 2.30 | | | | 2.30 | |
| Administrator Class (EKGYX) | | 1-13-1997 | | | – | | | | – | | | | – | | | | (1.68 | ) | | | 7.37 | | | | 11.43 | | | | 1.47 | | | | 1.41 | |
| Institutional Class (EKGIX) | | 7-30-2010 | | | – | | | | – | | | | – | | | | (1.45 | ) | | | 7.64 | | | | 11.66 | | | | 1.22 | | | | 1.16 | |
| S&P Developed SmallCap Index4 | | – | | | – | | | | – | | | | – | | | | (2.04 | ) | | | 6.81 | | | | 12.46 | | | | – | | | | – | |
Figures quoted represent past performance, which is no guarantee of future results, and do not reflect taxes that a shareholder may pay on fund distributions or the redemption of fund shares. Investment return and principal value of an investment will fluctuate so that an investor’s shares, when redeemed, may be worth more or less than their original cost. Performance shown without sales charges would be lower if sales charges were reflected. Current performance may be lower or higher than the performance data quoted, which assumes the reinvestment of dividends and capital gains. Current month-end performance is available on the Fund’s website, wellsfargofunds.com.
Index returns do not include transaction costs associated with buying and selling securities, any mutual fund fees or expenses, or any taxes. It is not possible to invest directly in an index.
For Class A shares, the maximum front-end sales charge is 5.75%. For Class C shares, the maximum contingent deferred sales charge is 1.00%. Performance including a contingent deferred sales charge assumes the sales charge for the corresponding time period. Administrator Class and Institutional Class shares are sold without a front-end sales charge or contingent deferred sales charge.
Stock values fluctuate in response to the activities of individual companies and general market and economic conditions. Foreign investments are especially volatile and can rise or fall dramatically due to differences in the political and economic conditions of the host country. These risks are generally intensified in emerging markets. The use of derivatives may reduce returns and/or increase volatility. Certain investment strategies tend to increase the total risk of an investment (relative to the broader market). The Fund is exposed to geographic risk and smaller-company securities risk. Consult the Fund’s prospectus for additional information on these and other risks.
Please see footnotes on page 7.
| | | | | | |
| Performance highlights (unaudited) | | Wells Fargo Global Small Cap Fund | | | 7 | |
|
| Growth of $10,000 investment as of October 31, 20185 |
|
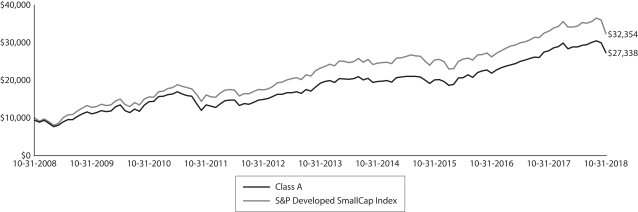 |
| 1 | Historical performance shown for Institutional Class shares prior to their inception reflects the performance of Administrator Class shares, and includes the higher expenses applicable to Administrator Class shares. If these expenses had not been included, returns for Institutional Class shares would be higher. Historical performance shown for all classes of the Fund prior to July 19, 2010, is based on the performance of the Fund’s predecessor, Evergreen Global Opportunities Fund. |
| 2 | Reflects the expense ratios as stated in the most recent prospectuses, which include the impact of 0.01% in acquired fund fees and expenses. The expense ratios shown are subject to change and may differ from the annualized expense ratios shown in the financial highlights of this report, which do not include acquired fund fees and expenses. |
| 3 | The manager has contractually committed through February 28, 2019, to waive fees and/or reimburse expenses to the extent necessary to cap the Fund’s Total Annual Operating Expenses After Fee Waivers at 1.55% for Class A, 2.30% for Class C, 1.40% for Administrator Class, and 1.15% for Institutional Class. After this time, the cap may be increased or the commitment to maintain the cap may be terminated only with the approval of the Board of Trustees. Brokerage commissions, stamp duty fees, interest, taxes, acquired fund fees and expenses (if any), and extraordinary expenses are excluded from the expense cap. Without this cap, the Fund’s returns would have been lower. The expense ratio paid by an investor is the net expense ratio (the total annual fund operating expenses after fee waivers) as stated in the prospectuses. |
| 4 | The S&P Developed SmallCap Index is a float-adjusted market-capitalization-weighted index designed to measure the equity market performance of small-capitalization companies located in developed markets. The index is composed of companies within the bottom 15% of the cumulative market capitalization in developed markets. The index covers all publicly listed equities with float-adjusted market values of U.S. $100 million or more and annual dollar value traded of at least U.S. $50 million in all included countries. You cannot invest directly in an index. |
| 5 | The chart compares the performance of Class A shares for the most recent ten years with the S&P Developed SmallCap Index. The chart assumes a hypothetical investment of $10,000 in Class A shares and reflects all operating expenses and assumes the maximum initial sales charge of 5.75%. |
| 6 | The ten largest holdings, excluding cash, cash equivalents and any money market funds, are calculated based on the value of the investments divided by total net assets of the Fund. Holdings are subject to change and may have changed since the date specified. |
| 7 | Amounts are calculated based on the total long-term investments of the Fund. These amounts are subject to change and may have changed since the date specified. |
| | | | |
| 8 | | Wells Fargo Global Small Cap Fund | | Performance highlights (unaudited) |
MANAGER’S DISCUSSION
Fund highlights
| ∎ | | The Fund (Class A excluding sales charges) outperformed its benchmark, the S&P Developed SmallCap Index, for the 12-month period that ended October 31, 2018. |
| ∎ | | Stock selection in the consumer discretionary and materials sectors contributed to relative performance. |
| ∎ | | These gains were partly offset by stock selection in the industrials and financials sectors. |
| ∎ | | Geographically, security selection in Europe, Canada, Asia ex-Japan, and Japan were all positive contributors. Security selection in the U.K. and U.S. detracted. |
Investors grew concerned during the period that global growth was slowing
The 2.04% loss of the S&P Developed SmallCap Index over the period was largely a reflection of concerns that global economic growth may have peaked in early 2018 and the pace of growth may slow going forward. The U.S. was the only region to post a positive return over the period as markets throughout the rest of the world proved to be more risk focused. In Europe and the U.K., equity markets were negatively affected by the pending Brexit and Italian budget negotiations. The Fund’s developed market focus proved beneficial as emerging market volatility increased substantially in 2018.
During the period, the team made modest changes to sector and regional exposures within the Fund based on our bottom-up reward-to-risk valuation process. As is typical of our process, security selection drove the Fund’s outperformance. As bottom-up investors, we evaluate how global macroeconomic events might affect the Fund’s holdings but we do not try to forecast the outcomes. The Fund’s security selection within Europe proved to be the largest contributor to relative returns. We aim to use market volatility opportunistically. We will seek to use any future volatility to the advantage of our bottom-up stock selection process.
| | | | |
| Ten largest holdings (%) as of October 31, 20186 | |
Denny’s Corporation | | | 2.17 | |
Dine Brands Global Incorporated | | | 1.86 | |
Nomad Foods Limited | | | 1.79 | |
Novanta Incorporated | | | 1.69 | |
MGE Energy Incorporated | | | 1.68 | |
Aeon Delight Company Limited | | | 1.63 | |
Jack in the Box Incorporated | | | 1.62 | |
AptarGroup Incorporated | | | 1.61 | |
BMC Stock Holdings Incorporated | | | 1.54 | |
CSW Industrials Incorporated | | | 1.54 | |
Stock selection in consumer discretionary and materials contributed to relative performance.
In the consumer discretionary sector, Denny’s Corporation contributed to performance. Shares of the U.S.-based operator of full-service restaurants rose as the company reported several quarters of strong same-store sales growth. The shares also benefited from increasing its franchise royalty fee during the year and the announcement that it would sell between 90 and 125 company-owned restaurants. This transaction should further strengthen the balance sheet and improve visibility of future cash flows.
Security selection in the materials sector contributed to relative performance. Metsa Board Corporation, a packaging producer in Scandinavia, made several
investments in recent years to upgrade its capabilities and transform itself from a paper producer to a higher-margin, faster-growing carton board producer. We viewed the capital redeployment as a great way to stabilize and increase free cash flows. After the stock appreciated materially during the period, we chose to exit the position and reallocate the capital to more attractive reward-to-risk opportunities.
Stock selection in industrials and financials detracted from relative performance.
Industrial holding Quanex Building Products Corporation, a manufacturer of components sold to original equipment manufacturers in the building products and windows industries, detracted from performance. The stock was under pressure due to increasing input costs and heightened fears of slower building activity in the U.S. We have since sold our shares as we found more attractive opportunities in the industrials space elsewhere.
Within the financials sector, U.K.-based insurance and reinsurance provider Lancashire Holdings Limited detracted from relative performance. The stock was under pressure during the period as 2017 was one of the most expensive years on record for natural catastrophe underwriting losses. The stock stabilized as investors saw an opportunity for improved
Please see footnotes on page 7.
| | | | | | |
| Performance highlights (unaudited) | | Wells Fargo Global Small Cap Fund | | | 9 | |
catastrophe pricing following recent events. We have adjusted our position size. However, continue to own the stock given the company’s excellent track record of delivering strong underwriting results, making accretive acquisitions and a shareholder-friendly distribution policy.
|
| Sector distribution as of October 31, 20187 |
|
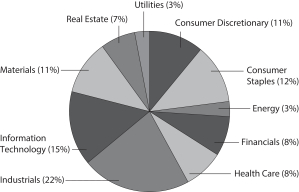
|
|
| Country allocation as of October 31, 20187 |
|
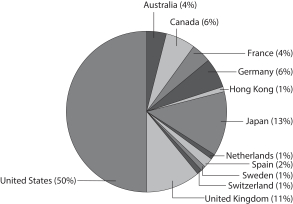 |
Our investment philosophy focuses on company-specific factors rather than on headline-dominating macroeconomic events.
As we look toward the end of 2018 and beyond, we see numerous market forces at play that could bring further volatility. Market participants should continue to watch the pace of global economic growth, political developments, inflation data, and central bank actions. We are not experts in forecasting macro or political events. However, we believe it is always prudent to protect downside risks and be opportunistic when short-term macro or political events create valuation dislocations from a company’s long-term fundamentals.
We believe our fundamental analysis, risk management, and active investment process are well suited to take advantage of new opportunities as the equity market evolves. While volatility may increase, the strong balance sheets and stable cash flow of the companies in our portfolio should support consistent long-term performance.
Please see footnotes on page 7.
| | | | |
| 10 | | Wells Fargo Global Small Cap Fund | | Fund expenses (unaudited) |
As a shareholder of the Fund, you incur two types of costs: (1) transaction costs, including sales charges (loads) on purchase payments and contingent deferred sales charges (if any) on redemptions and (2) ongoing costs, including management fees, distribution (12b-1) and/or shareholder servicing fees, and other Fund expenses. This example is intended to help you understand your ongoing costs (in dollars) of investing in the Fund and to compare these costs with the ongoing costs of investing in other mutual funds.
The example is based on an investment of $1,000 invested at the beginning of the six-month period and held for the entire period from May 1, 2018 to October 31, 2018.
Actual expenses
The “Actual” line of the table below provides information about actual account values and actual expenses. You may use the information in this line, together with the amount you invested, to estimate the expenses that you paid over the period. Simply divide your account value by $1,000 (for example, an $8,600 account value divided by $1,000 = 8.6), then multiply the result by the number in the “Actual” line under the heading entitled “Expenses paid during period” for your applicable class of shares to estimate the expenses you paid on your account during this period.
Hypothetical example for comparison purposes
The “Hypothetical” line of the table below provides information about hypothetical account values and hypothetical expenses based on the Fund’s actual expense ratio and an assumed rate of return of 5% per year before expenses, which is not the Fund’s actual return. The hypothetical account values and expenses may not be used to estimate the actual ending account balance or expenses you paid for the period. You may use this information to compare the ongoing costs of investing in the Fund and other funds. To do so, compare this 5% hypothetical example with the 5% hypothetical examples that appear in the shareholder reports of the other funds.
Please note that the expenses shown in the table are meant to highlight your ongoing costs only and do not reflect any transactional costs, such as sales charges (loads) and contingent deferred sales charges. Therefore, the “Hypothetical” line of the table is useful in comparing ongoing costs only and will not help you determine the relative total costs of owning different funds. In addition, if these transactional costs were included, your costs would have been higher.
| | | | | | | | | | | | | | | | |
| | | Beginning
account value
5-1-2018 | | | Ending
account value
10-31-2018 | | | Expenses
paid during
the period¹ | | | Annualized net
expense ratio | |
Class A | | | | | | | | | | | | | | | | |
Actual | | $ | 1,000.00 | | | $ | 945.59 | | | $ | 7.52 | | | | 1.53 | % |
Hypothetical (5% return before expenses) | | $ | 1,000.00 | | | $ | 1,017.48 | | | $ | 7.79 | | | | 1.53 | % |
Class C | | | | | | | | | | | | | | | | |
Actual | | $ | 1,000.00 | | | $ | 942.17 | | | $ | 11.17 | | | | 2.28 | % |
Hypothetical (5% return before expenses) | | $ | 1,000.00 | | | $ | 1,013.70 | | | $ | 11.58 | | | | 2.28 | % |
Administrator Class | | | | | | | | | | | | | | | | |
Actual | | $ | 1,000.00 | | | $ | 946.25 | | | $ | 6.87 | | | | 1.40 | % |
Hypothetical (5% return before expenses) | | $ | 1,000.00 | | | $ | 1,018.15 | | | $ | 7.12 | | | | 1.40 | % |
Institutional Class | | | | | | | | | | | | | | | | |
Actual | | $ | 1,000.00 | | | $ | 947.42 | | | $ | 5.64 | | | | 1.15 | % |
Hypothetical (5% return before expenses) | | $ | 1,000.00 | | | $ | 1,019.41 | | | $ | 5.85 | | | | 1.15 | % |
| 1 | Expenses paid is equal to the annualized net expense ratio of each class multiplied by the average account value over the period, multiplied by the number of days in the most recent fiscal half-year divided by the number of days in the fiscal year (to reflect the one-half-year period). |
| | | | | | |
| Portfolio of investments—October 31, 2018 | | Wells Fargo Global Small Cap Fund | | | 11 | |
| | | | | | | | | | | | | | | | |
| Security name | | | | | | | | Shares | | | Value | |
| | | | |
Common Stocks: 94.25% | | | | | | | | | | | | | | | | |
| | | | |
| Australia: 3.47% | | | | | | | | | | | | | | | | |
Ansell Limited (Health Care, Health Care Equipment & Supplies) | | | | | | | | | | | 264,824 | | | $ | 4,347,065 | |
Domino’s Pizza Enterprises Limited (Consumer Discretionary, Hotels, Restaurants & Leisure) | | | | | | | | | | | 86,722 | | | | 3,316,873 | |
Inghams Group Limited (Consumer Staples, Food Products) « | | | | | | | | | | | 705,250 | | | | 1,947,749 | |
Nufarm Limited (Materials, Chemicals) | | | | | | | | | | | 246,969 | | | | 996,879 | |
| | | | |
| | | | | | | | | | | | | | | 10,608,566 | |
| | | | | | | | | | | | | | | | |
| | | | |
| Austria: 0.56% | | | | | | | | | | | | | | | | |
Mayr-Melnhof Karton AG (Materials, Containers & Packaging) | | | | | | | | | | | 13,485 | | | | 1,707,610 | |
| | | | | | | | | | | | | | | | |
| | | | |
| Canada: 5.90% | | | | | | | | | | | | | | | | |
Cott Corporation (Consumer Staples, Beverages) | | | | | | | | | | | 183,235 | | | | 2,758,721 | |
Maple Leaf Foods Incorporated (Consumer Staples, Food Products) | | | | | | | | | | | 122,525 | | | | 2,786,584 | |
Mullen Group Limited (Energy, Energy Equipment & Services) | | | | | | | | | | | 159,591 | | | | 1,660,828 | |
Novanta Incorporated (Information Technology, Electronic Equipment, Instruments & Components) † | | | | | | | | | | | 88,903 | | | | 5,175,044 | |
Parex Resources Incorporated (Energy, Oil, Gas & Consumable Fuels) † | | | | | | | | | | | 83,236 | | | | 1,212,073 | |
Source Energy Services Limited (Energy, Energy Equipment & Services) † | | | | | | | | | | | 125,000 | | | | 225,037 | |
Stantec Incorporated (Industrials, Professional Services) | | | | | | | | | | | 106,100 | | | | 2,761,203 | |
Western Forest Products Incorporated (Materials, Paper & Forest Products) | | | | | | | | | | | 1,089,217 | | | | 1,456,206 | |
| | | | |
| | | | | | | | | | | | | | | 18,035,696 | |
| | | | | | | | | | | | | | | | |
| | | | |
| France: 3.92% | | | | | | | | | | | | | | | | |
ALTEN SA (Information Technology, IT Services) | | | | | | | | | | | 43,715 | | | | 4,216,101 | |
M6 Metropole Television SA (Communication Services, Media) | | | | | | | | | | | 208,317 | | | | 4,037,110 | |
Mersen SA (Industrials, Electrical Equipment) | | | | | | | | | | | 30,398 | | | | 1,003,643 | |
Tarkett SA (Industrials, Building Products) | | | | | | | | | | | 33,314 | | | | 734,286 | |
Vicat SA (Materials, Construction Materials) | | | | | | | | | | | 37,168 | | | | 1,999,672 | |
| | | | |
| | | | | | | | | | | | | | | 11,990,812 | |
| | | | | | | | | | | | | | | | |
| | | | |
| Germany: 5.31% | | | | | | | | | | | | | | | | |
Cancom SE (Information Technology, IT Services) | | | | | | | | | | | 32,689 | | | | 1,335,869 | |
Gerresheimer AG (Health Care, Life Sciences Tools & Services) | | | | | | | | | | | 63,637 | | | | 4,486,885 | |
Krones AG (Industrials, Machinery) | | | | | | | | | | | 22,485 | | | | 2,013,217 | |
Nemetschek SE (Information Technology, Software) | | | | | | | | | | | 12,342 | | | | 1,622,982 | |
SMA Solar Technology AG (Information Technology, Semiconductors & Semiconductor Equipment) « | | | | | | | | | | | 52,603 | | | | 1,227,365 | |
TAG Immobilien AG (Real Estate, Real Estate Management & Development) | | | | | | | | | | | 107,636 | | | | 2,460,223 | |
TLG Immobilien AG (Real Estate, Real Estate Management & Development) | | | | | | | | | | | 121,716 | | | | 3,093,616 | |
| | | | |
| | | | | | | | | | | | | | | 16,240,157 | |
| | | | | | | | | | | | | | | | |
| | | | |
| Hong Kong: 0.94% | | | | | | | | | | | | | | | | |
Sunlight REIT (Real Estate, Equity REITs) | | | | | | | | | | | 4,760,000 | | | | 2,865,002 | |
| | | | | | | | | | | | | | | | |
| | | | |
| Ireland: 0.49% | | | | | | | | | | | | | | | | |
Irish Residential Properties REIT plc (Real Estate, Equity REITs) | | | | | | | | | | | 921,930 | | | | 1,484,887 | |
| | | | | | | | | | | | | | | | |
| | | | |
| Italy: 0.37% | | | | | | | | | | | | | | | | |
Autogrill SpA (Consumer Discretionary, Hotels, Restaurants & Leisure) | | | | | | | | | | | 113,897 | | | | 1,121,703 | |
| | | | | | | | | | | | | | | | |
The accompanying notes are an integral part of these financial statements.
| | | | |
| 12 | | Wells Fargo Global Small Cap Fund | | Portfolio of investments—October 31, 2018 |
| | | | | | | | | | | | | | | | |
| Security name | | | | | | | | Shares | | | Value | |
| | | | |
| Japan: 12.18% | | | | | | | | | | | | | | | | |
Aeon Delight Company Limited (Industrials, Commercial Services & Supplies) | | | | | | | | | | | 148,600 | | | $ | 4,978,136 | |
Daiseki Company Limited (Industrials, Commercial Services & Supplies) | | | | | | | | | | | 30,500 | | | | 722,799 | |
DTS Corporation (Information Technology, IT Services) | | | | | | | | | | | 93,900 | | | | 3,262,179 | |
Fuji Seal International Incorporated (Materials, Containers & Packaging) | | | | | | | | | | | 105,400 | | | | 3,199,318 | |
Horiba Limited (Information Technology, Electronic Equipment, Instruments & Components) | | | | | | | | | | | 44,700 | | | | 2,099,614 | |
Meitec Corporation (Industrials, Professional Services) | | | | | | | | | | | 95,400 | | | | 3,999,131 | |
Nihon Parkerizing Company Limited (Materials, Chemicals) | | | | | | | | | | | 301,900 | | | | 3,646,827 | |
ORIX JREIT Incorporated (Real Estate, Equity REITs) | | | | | | | | | | | 2,844 | | | | 4,350,374 | |
OSG Corporation (Industrials, Machinery) | | | | | | | | | | | 106,400 | | | | 2,200,892 | |
Paramount Bed Holdings Company Limited (Health Care, Health Care Equipment & Supplies) | | | | | | | | | | | 31,400 | | | | 1,323,233 | |
San-A Company Limited (Consumer Staples, Food & Staples Retailing) | | | | | | | | | | | 50,700 | | | | 2,141,051 | |
Sumitomo Warehouse Company Limited (Industrials, Transportation Infrastructure) | | | | | | | | | | | 220,500 | | | | 2,593,198 | |
Taikisha Limited (Industrials, Construction & Engineering) | | | | | | | | | | | 95,600 | | | | 2,702,743 | |
| | | | |
| | | | | | | | | | | | | | | 37,219,495 | |
| | | | | | | | | | | | | | | | |
| | | | |
| Netherlands: 0.90% | | | | | | | | | | | | | | | | |
BE Semiconductor Industries NV (Information Technology, Semiconductors & Semiconductor Equipment) | | | | | | | | | | | 57,086 | | | | 1,223,985 | |
Brunel International NV (Industrials, Professional Services) | | | | | | | | | | | 123,130 | | | | 1,527,122 | |
| | | | |
| | | | | | | | | | | | | | | 2,751,107 | |
| | | | | | | | | | | | | | | | |
| | | | |
| Spain: 1.75% | | | | | | | | | | | | | | | | |
Almirall SA (Health Care, Pharmaceuticals) | | | | | | | | | | | 66,843 | | | | 1,212,113 | |
Prosegur Compania de Seguridad SA (Industrials, Commercial Services & Supplies) | | | | | | | | | | | 210,834 | | | | 1,172,036 | |
Viscofan SA (Consumer Staples, Food Products) | | | | | | | | | | | 49,436 | | | | 2,956,467 | |
| | | | |
| | | | | | | | | | | | | | | 5,340,616 | |
| | | | | | | | | | | | | | | | |
| | | | |
| Sweden: 0.62% | | | | | | | | | | | | | | | | |
Hexpol AB (Materials, Chemicals) | | | | | | | | | | | 206,070 | | | | 1,907,315 | |
| | | | | | | | | | | | | | | | |
| | | | |
| Switzerland: 0.86% | | | | | | | | | | | | | | | | |
Bucher Industries AG (Industrials, Machinery) | | | | | | | | | | | 6,525 | | | | 1,801,072 | |
OC Oerlikon Corporation AG (Information Technology, Electronic Equipment, Instruments & Components) | | | | | | | | | | | 69,071 | | | | 822,282 | |
| | | | |
| | | | | | | | | | | | | | | 2,623,354 | |
| | | | | | | | | | | | | | | | |
| | | | |
| United Kingdom: 10.12% | | | | | | | | | | | | | | | | |
BrightSphere Investment Group Incorporated (Financials, Capital Markets) | | | | | | | | | | | 145,400 | | | | 1,657,560 | |
Britvic plc (Consumer Staples, Beverages) | | | | | | | | | | | 302,643 | | | | 3,059,892 | |
Consort Medical plc (Health Care, Health Care Equipment & Supplies) | | | | | | | | | | | 48,655 | | | | 691,562 | |
Domino’s Pizza Group plc (Consumer Discretionary, Hotels, Restaurants & Leisure) | | | | | | | | | | | 696,564 | | | | 2,522,357 | |
Elementis plc (Materials, Chemicals) | | | | | | | | | | | 743,823 | | | | 1,949,047 | |
Hunting plc (Energy, Energy Equipment & Services) | | | | | | | | | | | 172,463 | | | | 1,487,985 | |
IMI plc (Industrials, Machinery) | | | | | | | | | | | 157,130 | | | | 1,997,390 | |
Jupiter Fund Management plc (Financials, Capital Markets) | | | | | | | | | | | 307,063 | | | | 1,322,685 | |
Lancashire Holdings Limited (Financials, Insurance) | | | | | | | | | | | 237,065 | | | | 1,792,343 | |
Mears Group plc (Industrials, Commercial Services & Supplies) | | | | | | | | | | | 286,158 | | | | 1,298,474 | |
Metro Bank plc (Financials, Banks) † | | | | | | | | | | | 17,908 | | | | 509,074 | |
Morgan Advanced Materials plc (Industrials, Machinery) | | | | | | | | | | | 440,744 | | | | 1,554,871 | |
NCC Group plc (Information Technology, IT Services) | | | | | | | | | | | 1,181,888 | | | | 2,970,016 | |
Nomad Foods Limited (Consumer Staples, Food Products) † | | | | | | | | | | | 287,190 | | | | 5,485,329 | |
Savills plc (Real Estate, Real Estate Management & Development) | | | | | | | | | | | 170,963 | | | | 1,584,306 | |
Spectris plc (Information Technology, Electronic Equipment, Instruments & Components) | | | | | | | | | | | 38,784 | | | | 1,062,860 | |
| | | | |
| | | | | | | | | | | | | | | 30,945,751 | |
| | | | | | | | | | | | | | | | |
The accompanying notes are an integral part of these financial statements.
| | | | | | |
| Portfolio of investments—October 31, 2018 | | Wells Fargo Global Small Cap Fund | | | 13 | |
| | | | | | | | | | | | | | | | |
| Security name | | | | | | | | Shares | | | Value | |
| | | | |
| United States: 46.86% | | | | | | | | | | | | | | | | |
ACI Worldwide Incorporated (Information Technology, Software) † | | | | | | | | | | | 184,500 | | | $ | 4,629,105 | |
ALLETE Incorporated (Utilities, Electric Utilities) | | | | | | | | | | | 35,900 | | | | 2,656,600 | |
AptarGroup Incorporated (Materials, Containers & Packaging) | | | | | | | | | | | 48,200 | | | | 4,914,472 | |
Atkore International Incorporated (Industrials, Electrical Equipment) † | | | | | | | | | | | 145,900 | | | | 2,810,034 | |
Belden Incorporated (Information Technology, Electronic Equipment, Instruments & Components) | | | | | | | | | | | 68,300 | | | | 3,691,615 | |
Berkshire Hills Bancorp Incorporated (Financials, Banks) | | | | | | | | | | | 114,938 | | | | 3,835,481 | |
BMC Stock Holdings Incorporated (Industrials, Trading Companies & Distributors) † | | | | | | | | | | | 282,000 | | | | 4,720,680 | |
Casey’s General Stores Incorporated (Consumer Staples, Food & Staples Retailing) | | | | | | | | | | | 21,799 | | | | 2,749,072 | |
Central Garden & Pet Company Class A (Consumer Staples, Household Products) † | | | | | | | | | | | 129,900 | | | | 3,851,535 | |
Cohen & Steers Incorporated (Financials, Capital Markets) | | | | | | | | | | | 82,685 | | | | 3,174,277 | |
CSW Industrials Incorporated (Industrials, Building Products) † | | | | | | | | | | | 102,215 | | | | 4,704,956 | |
Denny’s Corporation (Consumer Discretionary, Hotels, Restaurants & Leisure) † | | | | | | | | | | | 383,000 | | | | 6,645,050 | |
Dine Brands Global Incorporated (Consumer Discretionary, Hotels, Restaurants & Leisure) | | | | | | | | | | | 70,250 | | | | 5,693,060 | |
Douglas Dynamics Incorporated (Industrials, Machinery) | | | | | | | | | | | 68,542 | | | | 2,974,037 | |
Eagle Materials Incorporated (Materials, Construction Materials) | | | | | | | | | | | 38,800 | | | | 2,864,992 | |
Euronet Worldwide Incorporated (Information Technology, IT Services) † | | | | | | | | | | | 38,600 | | | | 4,291,548 | |
Forward Air Corporation (Industrials, Air Freight & Logistics) | | | | | | | | | | | 50,200 | | | | 3,011,498 | |
Gibraltar Industries Incorporated (Industrials, Building Products) † | | | | | | | | | | | 92,500 | | | | 3,296,700 | |
Global Brass & Copper Holdings Incorporated (Industrials, Machinery) | | | | | | | | | | | 103,853 | | | | 3,283,832 | |
Helen of Troy Limited (Consumer Discretionary, Household Durables) † | | | | | | | | | | | 23,795 | | | | 2,953,435 | |
Horace Mann Educators Corporation (Financials, Insurance) | | | | | | | | | | | 58,100 | | | | 2,282,168 | |
Hostess Brands Incorporated (Consumer Staples, Food Products) † | | | | | | | | | | | 383,200 | | | | 3,985,280 | |
Innoviva Incorporated (Health Care, Pharmaceuticals) † | | | | | | | | | | | 298,208 | | | | 4,162,984 | |
Invacare Corporation (Health Care, Health Care Equipment & Supplies) | | | | | | | | | | | 93,200 | | | | 1,204,144 | |
Jack in the Box Incorporated (Consumer Discretionary, Hotels, Restaurants & Leisure) | | | | | | | | | | | 62,570 | | | | 4,938,650 | |
Keane Group Incorporated (Energy, Energy Equipment & Services) † | | | | | | | | | | | 229,274 | | | | 2,881,974 | |
Lantheus Holdings Incorporated (Health Care, Health Care Equipment & Supplies) † | | | | | | | | | | | 90,700 | | | | 1,267,079 | |
LogMeIn Incorporated (Information Technology, Software) | | | | | | | | | | | 18,300 | | | | 1,575,996 | |
Lydall Incorporated (Industrials, Machinery) † | | | | | | | | | | | 45,980 | | | | 1,373,423 | |
MGE Energy Incorporated (Utilities, Electric Utilities) | | | | | | | | | | | 82,000 | | | | 5,123,360 | |
MKS Instruments Incorporated (Information Technology, Semiconductors & Semiconductor Equipment) | | | | | | | | | | | 30,300 | | | | 2,232,807 | |
Mueller Industries Incorporated (Industrials, Machinery) | | | | | | | | | | | 94,900 | | | | 2,310,815 | |
Natus Medical Incorporated (Health Care, Health Care Equipment & Supplies) † | | | | | | | | | | | 77,900 | | | | 2,327,652 | |
Neenah Paper Incorporated (Materials, Paper & Forest Products) | | | | | | | | | | | 50,937 | | | | 4,098,391 | |
NN Incorporated (Industrials, Machinery) | | | | | | | | | | | 148,400 | | | | 1,721,440 | |
Pacific Premier Bancorp Incorporated (Financials, Banks) † | | | | | | | | | | | 82,500 | | | | 2,411,475 | |
Prestige Brands Holdings Incorporated (Health Care, Pharmaceuticals) † | | | | | | | | | | | 91,999 | | | | 3,326,684 | |
Progress Software Corporation (Information Technology, Software) | | | | | | | | | | | 65,269 | | | | 2,097,746 | |
Retail Value Incorporated (Real Estate, Equity REITs) † | | | | | | | | | | | 97,100 | | | | 2,719,771 | |
Sealed Air Corporation (Materials, Containers & Packaging) | | | | | | | | | | | 46,800 | | | | 1,514,448 | |
Spectrum Brands Holdings Incorporated (Consumer Staples, Household Products) | | | | | | | | | | | 53,000 | | | | 3,442,350 | |
The Bancorp Incorporated (Financials, Banks) † | | | | | | | | | | | 208,600 | | | | 2,190,300 | |
Thermon Group Holdings Incorporated (Industrials, Electrical Equipment) † | | | | | | | | | | | 67,290 | | | | 1,452,118 | |
Weingarten Realty Investors (Real Estate, Equity REITs) | | | | | | | | | | | 92,800 | | | | 2,609,536 | |
Westwood Holdings Group Incorporated (Financials, Capital Markets) | | | | | | | | | | | 76,350 | | | | 3,233,422 | |
| | | | |
| | | | | | | | | | | | | | | 143,235,992 | |
| | | | | | | | | | | | | | | | |
| | | | |
Total Common Stocks (Cost $276,154,467) | | | | | | | | | | | | | | | 288,078,063 | |
| | | | | | | | | | | | | | | | |
The accompanying notes are an integral part of these financial statements.
| | | | |
| 14 | | Wells Fargo Global Small Cap Fund | | Portfolio of investments—October 31, 2018 |
| | | | | | | | | | | | | | | | |
| Security name | | Yield | | | | | | Shares | | | Value | |
| | | | |
Short-Term Investments: 6.14% | | | | | | | | | | | | | | | | |
| | | | |
| Investment Companies: 6.14% | | | | | | | | | | | | | | | | |
Securities Lending Cash Investments LLC (l)(r)(u) | | | 2.33 | % | | | | | | | 2,683,969 | | | $ | 2,684,237 | |
Wells Fargo Government Money Market Fund Select Class (l)(u) | | | 2.07 | | | | | | | | 16,091,244 | | | | 16,091,244 | |
| | | | |
Total Short-Term Investments (Cost $18,775,481) | | | | | | | | | | | | | | | 18,775,481 | |
| | | | | | | | | | | | | | | | |
| | | | | | | | |
| Total investments in securities (Cost $294,929,948) | | | 100.39 | % | | | 306,853,544 | |
Other assets and liabilities, net | | | (0.39 | ) | | | (1,189,977 | ) |
| | | | | | | | |
| Total net assets | | | 100.00 | % | | $ | 305,663,567 | |
| | | | | | | | |
| « | All or a portion of this security is on loan. |
| † | Non-income-earning security |
| (l) | The issuer of the security is an affiliated person of the Fund as defined in the Investment Company Act of 1940. |
| (r) | The investment is a non-registered investment company purchased with cash collateral received from securities on loan. |
| (u) | The rate represents the 7-day annualized yield at period end. |
Abbreviations:
| REIT | Real estate investment trust |
Investments in Affiliates
An affiliated investment is an investment in which the Fund owns at least 5% of the outstanding voting shares of the issuer or as a result of other relationships, such as the Fund and the issuer having the same investment manager. Transactions with issuers that were either affiliated persons of the Fund at the beginning of the period or the end of the period were as follows:
| | | | | | | | | | | | | | | | | | | | | | | | | | | | | | | | | | | | |
| | | Shares,
beginning of
period | | | Shares
purchased | | | Shares
sold | | | Shares,
end of
period | | | Net
realized
gains
(losses) | | | Net
change in
unrealized
gains
(losses) | | | Income
from
affiliated
securities | | | Value,
end
of period | | | % of
net
assets | |
Short-Term Investments | | | | | | | | | | | | | | | | | | | | | | | | | | | | | | | | | | | | |
Investment Companies | | | | | | | | | | | | | | | | | | | | | | | | | | | | | | | | | | | | |
Securities Lending Cash Investments LLC | | | 17,584,369 | | | | 162,357,519 | | | | 177,257,919 | | | | 2,683,969 | | | $ | 2,589 | | | $ | 0 | | | $ | 245,131 | | | $ | 2,684,237 | | | | | |
Wells Fargo Government Money Market Fund Select Class | | | 16,552,450 | | | | 171,130,993 | | | | 171,592,199 | | | | 16,091,244 | | | | 0 | | | | 0 | | | | 272,220 | | | | 16,091,244 | | | | | |
| | | | | | | | | | | | | | | | | | | | | | | | | | | | | | | | | | | | |
| | | | | | | | | | | | | | | | | | $ | 2,589 | | | $ | 0 | | | $ | 517,351 | | | $ | 18,775,481 | | | | 6.14 | % |
| | | | | | | | | | | | | | | | | | | | | | | | | | | | | | | | | | | | |
The accompanying notes are an integral part of these financial statements.
| | | | | | |
| Statement of assets and liabilities—October 31, 2018 | | Wells Fargo Global Small Cap Fund | | | 15 | |
| | | | |
| | | | |
| |
Assets | | | | |
Investments in unaffiliated securities (including $2,549,585 of securities loaned), at value (cost $276,154,467) | | $ | 288,078,063 | |
Investments in affiliated securities, at value (cost $18,775,481) | | | 18,775,481 | |
Foreign currency, at value (cost $28,916) | | | 28,998 | |
Receivable for investments sold | | | 2,457,231 | |
Receivable for Fund shares sold | | | 202,515 | |
Receivable for dividends | | | 552,410 | |
Receivable for securities lending income | | | 12,939 | |
Prepaid expenses and other assets | | | 39,190 | |
| | | | |
Total assets | | | 310,146,827 | |
| | | | |
| |
Liabilities | | | | |
Payable upon receipt of securities loaned | | | 2,680,515 | |
Payable for investments purchased | | | 941,439 | |
Payable for Fund shares redeemed | | | 349,073 | |
Management fee payable | | | 250,993 | |
Administration fees payable | | | 46,646 | |
Distribution fee payable | | | 17,360 | |
Trustees’ fees and expenses payable | | | 1,587 | |
Accrued expenses and other liabilities | | | 195,647 | |
| | | | |
Total liabilities | | | 4,483,260 | |
| | | | |
Total net assets | | $ | 305,663,567 | |
| | | | |
| |
NET ASSETS CONSIST OF | | | | |
Paid-in capital | | $ | 269,320,042 | |
Total distributable earnings | | | 36,343,525 | |
| | | | |
Total net assets | | $ | 305,663,567 | |
| | | | |
| |
COMPUTATION OF NET ASSET VALUE AND OFFERING PRICE PER SHARE | | | | |
Net assets – Class A | | $ | 132,905,862 | |
Shares outstanding – Class A1 | | | 3,325,079 | |
Net asset value per share – Class A | | | $39.97 | |
Maximum offering price per share – Class A2 | | | $42.41 | |
Net assets – Class C | | $ | 26,167,321 | |
Shares outstanding – Class C1 | | | 933,868 | |
Net asset value per share – Class C | | | $28.02 | |
Net assets – Administrator Class | | $ | 27,964,985 | |
Shares outstanding – Administrator Class1 | | | 667,389 | |
Net asset value per share – Administrator Class | | | $41.90 | |
Net assets – Institutional Class | | $ | 118,625,399 | |
Shares outstanding – Institutional Class1 | | | 2,837,637 | |
Net asset value per share – Institutional Class | | | $41.80 | |
| 1 | The Fund has an unlimited number of authorized shares. |
| 2 | Maximum offering price is computed as 100/94.25 of net asset value. On investments of $50,000 or more, the offering price is reduced. |
The accompanying notes are an integral part of these financial statements.
| | | | |
| 16 | | Wells Fargo Global Small Cap Fund | | Statement of operations—year ended October 31, 2018 |
| | | | |
| | | | |
| |
Investment income | | | | |
Dividends (net of foreign withholding taxes of $257,972) | | $ | 4,563,293 | |
Income from affiliated securities | | | 517,351 | |
| | | | |
Total investment income | | | 5,080,644 | |
| | | | |
| |
Expenses | | | | |
Management fee | | | 2,845,163 | |
Administration fees | | | | |
Class A | | | 318,993 | |
Class C | | | 64,072 | |
Administrator Class | | | 40,070 | |
Institutional Class | | | 112,132 | |
Shareholder servicing fees | | | | |
Class A | | | 379,754 | |
Class C | | | 76,277 | |
Administrator Class | | | 76,832 | |
Distribution fee | | | | |
Class C | | | 228,830 | |
Custody and accounting fees | | | 106,245 | |
Professional fees | | | 52,990 | |
Registration fees | | | 114,936 | |
Shareholder report expenses | | | 63,551 | |
Trustees’ fees and expenses | | | 22,944 | |
Other fees and expenses | | | 38,382 | |
| | | | |
Total expenses | | | 4,541,171 | |
Less: Fee waivers and/or expense reimbursements | | | (79,943 | ) |
| | | | |
Net expenses | | | 4,461,228 | |
| | | | |
Net investment income | | | 619,416 | |
| | | | |
| |
REALIZED AND UNREALIZED GAINS (LOSSES) ON INVESTMENTS | | | | |
| |
Net realized gains on: | | | | |
Unaffiliated securities | | | 26,016,730 | |
Affiliated securities | | | 2,589 | |
| | | | |
Net realized gains on investments | | | 26,019,319 | |
Net change in unrealized gains (losses) on investments | | | (35,532,667 | ) |
| | | | |
Net realized and unrealized gains (losses) on investments | | | (9,513,348 | ) |
| | | | |
Net decrease in net assets resulting from operations | | $ | (8,893,932 | ) |
| | | | |
The accompanying notes are an integral part of these financial statements.
| | | | | | |
| Statement of changes in net assets | | Wells Fargo Global Small Cap Fund | | | 17 | |
| | | | | | | | | | | | | | | | |
| | | Year ended
October 31, 2018 | | | Year ended
October 31, 20171 | |
| | | | |
Operations | | | | | | | | | | | | | | | | |
Net investment income | | | | | | $ | 619,416 | | | | | | | $ | 1,206,966 | |
Net realized gains on investments | | | | | | | 26,019,319 | | | | | | | | 28,953,116 | |
Net change in unrealized gains (losses) on investments | | | | | | | (35,532,667 | ) | | | | | | | 26,443,633 | |
| | | | |
Net increase (decrease) in net assets resulting from operations | | | | | | | (8,893,932 | ) | | | | | | | 56,603,715 | |
| | | | |
| | | | |
Distributions to shareholders from net investment income and net realized gains | | | | | | | | | | | | | | | | |
Class A | | | | | | | (17,602,533 | ) | | | | | | | (9,624,693 | ) |
Class B | | | | | | | N/A | | | | | | | | (64,415 | )2 |
Class C | | | | | | | (4,638,012 | ) | | | | | | | (2,714,722 | ) |
Administrator Class | | | | | | | (3,376,252 | ) | | | | | | | (1,684,117 | ) |
Institutional Class | | | | | | | (4,852,851 | ) | | | | | | | (1,350,215 | ) |
| | | | |
Total distributions to shareholders | | | | | | | (30,469,648 | ) | | | | | | | (15,438,162 | ) |
| | | | |
| | | | |
Capital share transactions | | | Shares | | | | | | | | Shares | | | | | |
Proceeds from shares sold | | | | | | | | | | | | | | | | |
Class A | | | 233,179 | | | | 10,125,839 | | | | 498,285 | | | | 20,496,273 | |
Class C | | | 90,405 | | | | 2,760,784 | | | | 85,049 | | | | 2,534,837 | |
Administrator Class | | | 126,648 | | | | 5,751,220 | | | | 169,243 | | | | 7,216,769 | |
Institutional Class | | | 2,462,395 | | | | 110,967,613 | | | | 864,023 | | | | 36,105,981 | |
| | | | |
| | | | | | | 129,605,456 | | | | | | | | 66,353,860 | |
| | | | |
Reinvestment of distributions | | | | | | | | | | | | | | | | |
Class A | | | 383,761 | | | | 16,051,908 | | | | 229,395 | | | | 8,959,763 | |
Class B | | | N/A | | | | N/A | | | | 2,242 | 2 | | | 64,035 | 2 |
Class C | | | 151,690 | | | | 4,452,102 | | | | 79,166 | | | | 2,276,848 | |
Administrator Class | | | 75,455 | | | | 3,309,823 | | | | 39,320 | | | | 1,601,354 | |
Institutional Class | | | 103,060 | | | | 4,511,956 | | | | 30,428 | | | | 1,235,167 | |
| | | | |
| | | | | | | 28,325,789 | | | | | | | | 14,137,167 | |
| | | | |
Payment for shares redeemed | | | | | | | | | | | | | | | | |
Class A | | | (693,625 | ) | | | (29,950,836 | ) | | | (921,309 | ) | | | (37,540,409 | ) |
Class B | | | N/A | | | | N/A | | | | (33,102 | )2 | | | (985,857 | )2 |
Class C | | | (243,976 | ) | | | (7,443,741 | ) | | | (362,621 | ) | | | (11,022,329 | ) |
Administrator Class | | | (169,400 | ) | | | (7,661,211 | ) | | | (341,822 | ) | | | (14,495,540 | ) |
Institutional Class | | | (589,541 | ) | | | (26,577,364 | ) | | | (345,420 | ) | | | (14,803,205 | ) |
| | | | |
| | | | | | | (71,633,152 | ) | | | | | | | (78,847,340 | ) |
| | | | |
Net increase in net assets resulting from capital share transactions | | | | | | | 86,298,093 | | | | | | | | 1,643,687 | |
| | | | |
Total increase in net assets | | | | | | | 46,934,513 | | | | | | | | 42,809,240 | |
| | | | |
| | | | |
Net assets | | | | | | | | | | | | | | | | |
Beginning of period | | | | | | | 258,729,054 | | | | | | | | 215,919,814 | |
| | | | |
End of period | | | | | | $ | 305,663,567 | | | | | | | $ | 258,729,054 | |
| | | | |
| 1 | Effective for all filings after November 4, 2018, the SEC prospectively eliminated the requirements to parenthetically disclose undistributed net investment income at the end of the period and permitted the aggregation of distributions, with the exception of tax basis returns of capital. Undistributed net investment income at October 31, 2017 was $1,427,489. The disaggregated distributions information for the year ended October 31, 2017 is included in Note 7, Distributions to Shareholders, in the notes to the financial statements. |
| 2 | For the period from November 1, 2016 to May 5, 2017. Effective at the close of business on May 5, 2017, Class B shares were converted to Class A shares and are no longer offered by the Fund. |
The accompanying notes are an integral part of these financial statements.
| | | | |
| 18 | | Wells Fargo Global Small Cap Fund | | Financial highlights |
(For a share outstanding throughout each period)
| | | | | | | | | | | | | | | | | | | | |
| | | Year ended October 31 | |
| CLASS A | | 2018 | | | 2017 | | | 2016 | | | 2015 | | | 2014 | |
Net asset value, beginning of period | | | $45.81 | | | | $38.61 | | | | $37.23 | | | | $43.26 | | | | $42.68 | |
Net investment income | | | 0.10 | | | | 0.21 | 1 | | | 0.26 | 1 | | | 0.10 | 1 | | | 0.03 | 1 |
Net realized and unrealized gains (losses) on investments | | | (0.72 | ) | | | 9.68 | | | | 2.92 | | | | 0.64 | | | | 0.86 | |
| | | | | | | | | | | | | | | | | | | | |
Total from investment operations | | | (0.62 | ) | | | 9.89 | | | | 3.18 | | | | 0.74 | | | | 0.89 | |
Distributions to shareholders from | | | | | | | | | | | | | | | | | | | | |
Net investment income | | | (0.22 | ) | | | (0.34 | ) | | | (0.21 | ) | | | (0.03 | ) | | | (0.31 | ) |
Net realized gains | | | (5.00 | ) | | | (2.35 | ) | | | (1.59 | ) | | | (6.74 | ) | | | 0.00 | |
| | | | | | | | | | | | | | | | | | | | |
Total distributions to shareholders | | | (5.22 | ) | | | (2.69 | ) | | | (1.80 | ) | | | (6.77 | ) | | | (0.31 | ) |
Net asset value, end of period | | | $39.97 | | | | $45.81 | | | | $38.61 | | | | $37.23 | | | | $43.26 | |
Total return2 | | | (1.82 | )% | | | 26.90 | % | | | 9.12 | % | | | 2.12 | % | | | 2.07 | % |
Ratios to average net assets (annualized) | | | | | | | | | | | | | | | | | | | | |
Gross expenses | | | 1.54 | % | | | 1.54 | % | | | 1.55 | % | | | 1.57 | % | | | 1.57 | % |
Net expenses | | | 1.54 | % | | | 1.54 | % | | | 1.55 | % | | | 1.55 | % | | | 1.55 | % |
Net investment income | | | 0.16 | % | | | 0.52 | % | | | 0.73 | % | | | 0.27 | % | | | 0.06 | % |
Supplemental data | | | | | | | | | | | | | | | | | | | | |
Portfolio turnover rate | | | 51 | % | | | 70 | % | | | 70 | % | | | 42 | % | | | 66 | % |
Net assets, end of period (000s omitted) | | | $132,906 | | | | $155,828 | | | | $138,805 | | | | $151,740 | | | | $167,166 | |
| 1 | Calculated based upon average shares outstanding |
| 2 | Total return calculations do not include any sales charges. |
The accompanying notes are an integral part of these financial statements.
| | | | | | |
| Financial highlights | | Wells Fargo Global Small Cap Fund | | | 19 | |
(For a share outstanding throughout each period)
| | | | | | | | | | | | | | | | | | | | |
| | | Year ended October 31 | |
| CLASS C | | 2018 | | | 2017 | | | 2016 | | | 2015 | | | 2014 | |
Net asset value, beginning of period | | | $33.65 | | | | $28.98 | | | | $28.39 | | | | $34.80 | | | | $34.36 | |
Net investment loss | | | (0.20 | ) | | | (0.06 | )1 | | | (0.01 | )1 | | | (0.14 | )1 | | | (0.24 | )1 |
Net realized and unrealized gains (losses) on investments | | | (0.43 | ) | | | 7.15 | | | | 2.19 | | | | 0.47 | | | | 0.69 | |
| | | | | | | | | | | | | | | | | | | | |
Total from investment operations | | | (0.63 | ) | | | 7.09 | | | | 2.18 | | | | 0.33 | | | | 0.45 | |
Distributions to shareholders from | | | | | | | | | | | | | | | | | | | | |
Net investment income | | | 0.00 | | | | (0.07 | ) | | | 0.00 | | | | 0.00 | | | | (0.01 | ) |
Net realized gains | | | (5.00 | ) | | | (2.35 | ) | | | (1.59 | ) | | | (6.74 | ) | | | 0.00 | |
| | | | | | | | | | | | | | | | | | | | |
Total distributions to shareholders | | | (5.00 | ) | | | (2.42 | ) | | | (1.59 | ) | | | (6.74 | ) | | | (0.01 | ) |
Net asset value, end of period | | | $28.02 | | | | $33.65 | | | | $28.98 | | | | $28.39 | | | | $34.80 | |
Total return2 | | | (2.56 | )% | | | 25.95 | % | | | 8.31 | % | | | 1.34 | % | | | 1.32 | % |
Ratios to average net assets (annualized) | | | | | | | | | | | | | | | | | | | | |
Gross expenses | | | 2.29 | % | | | 2.29 | % | | | 2.30 | % | | | 2.32 | % | | | 2.32 | % |
Net expenses | | | 2.29 | % | | | 2.29 | % | | | 2.30 | % | | | 2.30 | % | | | 2.30 | % |
Net investment loss | | | (0.59 | )% | | | (0.20 | )% | | | (0.02 | )% | | | (0.48 | )% | | | (0.69 | )% |
Supplemental data | | | | | | | | | | | | | | | | | | | | |
Portfolio turnover rate | | | 51 | % | | | 70 | % | | | 70 | % | | | 42 | % | | | 66 | % |
Net assets, end of period (000s omitted) | | | $26,167 | | | | $31,487 | | | | $32,863 | | | | $36,215 | | | | $41,792 | |
| 1 | Calculated based upon average shares outstanding |
| 2 | Total return calculations do not include any sales charges. |
The accompanying notes are an integral part of these financial statements.
| | | | |
| 20 | | Wells Fargo Global Small Cap Fund | | Financial highlights |
(For a share outstanding throughout each period)
| | | | | | | | | | | | | | | | | | | | |
| | | Year ended October 31 | |
| ADMINISTRATOR CLASS | | 2018 | | | 2017 | | | 2016 | | | 2015 | | | 2014 | |
Net asset value, beginning of period | | | $47.78 | | | | $40.15 | | | | $38.65 | | | | $44.60 | | | | $44.00 | |
Net investment income | | | 0.14 | 1 | | | 0.29 | 1 | | | 0.41 | | | | 0.16 | 1 | | | 0.09 | |
Net realized and unrealized gains (losses) on investments | | | (0.73 | ) | | | 10.07 | | | | 2.95 | | | | 0.66 | | | | 0.90 | |
| | | | | | | | | | | | | | | | | | | | |
Total from investment operations | | | (0.59 | ) | | | 10.36 | | | | 3.36 | | | | 0.82 | | | | 0.99 | |
Distributions to shareholders from | | | | | | | | | | | | | | | | | | | | |
Net investment income | | | (0.29 | ) | | | (0.38 | ) | | | (0.27 | ) | | | (0.03 | ) | | | (0.39 | ) |
Net realized gains | | | (5.00 | ) | | | (2.35 | ) | | | (1.59 | ) | | | (6.74 | ) | | | 0.00 | |
| | | | | | | | | | | | | | | | | | | | |
Total distributions to shareholders | | | (5.29 | ) | | | (2.73 | ) | | | (1.86 | ) | | | (6.77 | ) | | | (0.39 | ) |
Net asset value, end of period | | | $41.90 | | | | $47.78 | | | | $40.15 | | | | $38.65 | | | | $44.60 | |
Total return | | | (1.68 | )% | | | 27.04 | % | | | 9.30 | % | | | 2.27 | % | | | 2.22 | % |
Ratios to average net assets (annualized) | | | | | | | | | | | | | | | | | | | | |
Gross expenses | | | 1.46 | % | | | 1.46 | % | | | 1.47 | % | | | 1.43 | % | | | 1.41 | % |
Net expenses | | | 1.40 | % | | | 1.40 | % | | | 1.40 | % | | | 1.40 | % | | | 1.40 | % |
Net investment income | | | 0.30 | % | | | 0.68 | % | | | 0.90 | % | | | 0.41 | % | | | 0.22 | % |
Supplemental data | | | | | | | | | | | | | | | | | | | | |
Portfolio turnover rate | | | 51 | % | | | 70 | % | | | 70 | % | | | 42 | % | | | 66 | % |
Net assets, end of period (000s omitted) | | | $27,965 | | | | $30,327 | | | | $30,832 | | | | $31,765 | | | | $53,966 | |
| 1 | Calculated based upon average shares outstanding |
The accompanying notes are an integral part of these financial statements.
| | | | | | |
| Financial highlights | | Wells Fargo Global Small Cap Fund | | | 21 | |
(For a share outstanding throughout each period)
| | | | | | | | | | | | | | | | | | | | |
| | | Year ended October 31 | |
| INSTITUTIONAL CLASS | | 2018 | | | 2017 | | | 2016 | | | 2015 | | | 2014 | |
Net asset value, beginning of period | | | $47.68 | | | | $40.08 | | | | $38.63 | | | | $44.67 | | | | $44.05 | |
Net investment income | | | 0.25 | | | | 0.38 | | | | 0.45 | | | | 0.20 | | | | 0.15 | |
Net realized and unrealized gains (losses) on investments | | | (0.74 | ) | | | 10.06 | | | | 3.00 | | | | 0.72 | | | | 0.96 | |
| | | | | | | | | | | | | | | | | | | | |
Total from investment operations | | | (0.49 | ) | | | 10.44 | | | | 3.45 | | | | 0.92 | | | | 1.11 | |
Distributions to shareholders from | | | | | | | | | | | | | | | | | | | | |
Net investment income | | | (0.39 | ) | | | (0.49 | ) | | | (0.41 | ) | | | (0.22 | ) | | | (0.49 | ) |
Net realized gains | | | (5.00 | ) | | | (2.35 | ) | | | (1.59 | ) | | | (6.74 | ) | | | 0.00 | |
| | | | | | | | | | | | | | | | | | | | |
Total distributions to shareholders | | | (5.39 | ) | | | (2.84 | ) | | | (2.00 | ) | | | (6.96 | ) | | | (0.49 | ) |
Net asset value, end of period | | | $41.80 | | | | $47.68 | | | | $40.08 | | | | $38.63 | | | | $44.67 | |
Total return | | | (1.45 | )% | | | 27.38 | % | | | 9.56 | % | | | 2.53 | % | | | 2.48 | % |
Ratios to average net assets (annualized) | | | | | | | | | | | | | | | | | | | | |
Gross expenses | | | 1.21 | % | | | 1.21 | % | | | 1.22 | % | | | 1.18 | % | | | 1.14 | % |
Net expenses | | | 1.15 | % | | | 1.15 | % | | | 1.15 | % | | | 1.15 | % | | | 1.14 | % |
Net investment income | | | 0.54 | % | | | 1.01 | % | | | 1.20 | % | | | 0.66 | % | | | 0.47 | % |
Supplemental data | | | | | | | | | | | | | | | | | | | | |
Portfolio turnover rate | | | 51 | % | | | 70 | % | | | 70 | % | | | 42 | % | | | 66 | % |
Net assets, end of period (000s omitted) | | | $118,625 | | | | $41,087 | | | | $12,531 | | | | $10,369 | | | | $5,284 | |
The accompanying notes are an integral part of these financial statements.
| | | | |
| 22 | | Wells Fargo Global Small Cap Fund | | Notes to financial statements |
1. ORGANIZATION
Wells Fargo Funds Trust (the “Trust”), a Delaware statutory trust organized on March 10, 1999, is an open-end management investment company registered under the Investment Company Act of 1940, as amended (the “1940 Act”). As an investment company, the Trust follows the accounting and reporting guidance in Financial Accounting Standards Board (“FASB”) Accounting Standards Codification Topic 946, Financial Services – Investment Companies. These financial statements report on the Wells Fargo Global Small Cap Fund (the “Fund”) which is a diversified series of the Trust.
Effective at the close of business on May 5, 2017, Class B shares were converted to Class A shares and are no longer offered by the Fund. Information for Class B shares reflected in the financial statements represents activity through May 5, 2017.
2. SIGNIFICANT ACCOUNTING POLICIES
The following significant accounting policies, which are consistently followed in the preparation of the financial statements of the Fund, are in conformity with U.S. generally accepted accounting principles which require management to make estimates and assumptions that affect the reported amounts of assets and liabilities, disclosure of contingent assets and liabilities at the date of the financial statements, and the reported amounts of revenues and expenses during the reporting period. Actual results could differ from those estimates.
Securities valuation
All investments are valued each business day as of the close of regular trading on the New York Stock Exchange (generally 4 p.m. Eastern Time), although the Fund may deviate from this calculation time under unusual or unexpected circumstances.
Equity securities that are listed on a foreign or domestic exchange or market are valued at the official closing price or, if none, the last sales price. If no sale occurs on the principal exchange or market that day, a fair value price will be determined in accordance with the Fund’s Valuation Procedures.
The values of securities denominated in foreign currencies are translated into U.S. dollars at rates provided by an independent foreign currency pricing source at a time each business day specified by the Wells Fargo Asset Management Pricing Committee at Wells Fargo Funds Management, LLC (“Funds Management”).
Many securities markets and exchanges outside the U.S. close prior to the close of the New York Stock Exchange and therefore may not fully reflect trading or events that occur after the close of the principal exchange in which the foreign securities are traded, but before the close of the New York Stock Exchange. If such trading or events are expected to materially affect the value of such securities, then fair value pricing procedures approved by the Board of Trustees of the Fund are applied. These procedures take into account multiple factors including movements in U.S. securities markets after foreign exchanges close. Foreign securities that are fair valued under these procedures are categorized as Level 2 and the application of these procedures may result in transfers between Level 1 and Level 2. Depending on market activity, such fair valuations may be frequent. Such fair value pricing may result in net asset values that are higher or lower than net asset values based on the last reported sales price or latest quoted bid price. On October 31, 2018, such fair value pricing was not used in pricing foreign securities.
Investments in registered open-end investment companies are valued at net asset value. Interests in non-registered investment companies that are redeemable at net asset value are fair valued normally at net asset value.
Investments which are not valued using any of the methods discussed above are valued at their fair value, as determined in good faith by the Board of Trustees. The Board of Trustees has established a Valuation Committee comprised of the Trustees and has delegated to it the authority to take any actions regarding the valuation of portfolio securities that the Valuation Committee deems necessary or appropriate, including determining the fair value of portfolio securities, unless the determination has been delegated to the Wells Fargo Asset Management Pricing Committee. The Board of Trustees retains the authority to make or ratify any valuation decisions or approve any changes to the Valuation Procedures as it deems appropriate. On a quarterly basis, the Board of Trustees receives reports on any valuation action taken by the Valuation Committee or the Wells Fargo Asset Management Pricing Committee which may include items for ratification.
Foreign currency translation
The accounting records of the Fund are maintained in U.S. dollars. The values of other assets and liabilities denominated in foreign currencies are translated into U.S. dollars at rates provided by an independent foreign currency pricing source at a time each business day specified by the Wells Fargo Asset Management Pricing Committee. Purchases and sales of securities, and income and expenses are converted at the rate of exchange on the respective dates of such transactions. Net realized foreign exchange gains or losses arise from sales of foreign currencies, currency gains or losses realized
| | | | | | |
| Notes to financial statements | | Wells Fargo Global Small Cap Fund | | | 23 | |
between the trade and settlement dates on securities transactions, and the difference between the amounts of dividends, interest and foreign withholding taxes recorded and the U.S. dollar equivalent of the amounts actually paid or received. Net unrealized foreign exchange gains and losses arise from changes in the fair value of assets and liabilities other than investments in securities resulting from changes in exchange rates. The changes in net assets arising from changes in exchange rates of securities and the changes in net assets resulting from changes in market prices of securities are not separately presented. Such changes are included in net realized and unrealized gains or losses from investments.
Forward foreign currency contracts
The Fund is subject to foreign currency risk in the normal course of pursuing its investment objectives. A forward foreign currency contract is an agreement between two parties to purchase or sell a specific currency for an agreed-upon price at a future date. The Fund enters into forward foreign currency contracts to facilitate transactions in foreign-denominated securities and to attempt to minimize the risk to the Fund from adverse changes in the relationship between currencies. Forward foreign currency contracts are recorded at the forward rate and marked-to-market daily. When the contracts are closed, realized gains and losses arising from such transactions are recorded as realized gains or losses on forward foreign currency contracts. The Fund could be exposed to risks if the counterparties to the contracts are unable to meet the terms of their contracts or if the value of the foreign currency changes unfavorably. The Fund’s maximum risk of loss from counterparty credit risk is the unrealized gains on the contracts. This risk may be mitigated if there is a master netting arrangement between the Fund and the counterparty.
Securities lending
The Fund may lend its securities from time to time in order to earn additional income in the form of fees or interest on securities received as collateral or the investment of any cash received as collateral. The Fund continues to receive interest or dividends on the securities loaned. The Fund receives collateral in the form of cash or securities with a value at least equal to the value of the securities on loan. The value of the loaned securities is determined at the close of each business day and any additional required collateral is delivered to the Fund on the next business day. In a securities lending transaction, the net asset value of the Fund will be affected by an increase or decrease in the value of the securities loaned and by an increase or decrease in the value of the instrument in which collateral is invested. The amount of securities lending activity undertaken by the Fund fluctuates from time to time. In the event of default or bankruptcy by the borrower, the Fund may be prevented from recovering the loaned securities or gaining access to the collateral or may experience delays or costs in doing so. In addition, the investment of any cash collateral received may lose all or part of its value. The Fund has the right under the lending agreement to recover the securities from the borrower on demand.
The Fund lends its securities through an unaffiliated securities lending agent. Cash collateral received in connection with its securities lending transactions is invested in Securities Lending Cash Investments, LLC (the “Securities Lending Fund”). The Securities Lending Fund is exempt from registration under Section 3(c) (7) of the 1940 Act and is managed by Funds Management and is subadvised by Wells Capital Management Incorporated (“WellsCap”), an affiliate of Funds Management and an indirect wholly owned subsidiary of Wells Fargo & Company (“Wells Fargo”). Funds Management receives an advisory fee starting at 0.05% and declining to 0.01% as the average daily net assets of the Securities Lending Fund increase. All of the fees received by Funds Management are paid to WellsCap for its services as subadviser. The Securities Lending Fund seeks to provide a positive return compared to the daily Fed Funds Open Rate by investing in high-quality, U.S. dollar-denominated short-term money market instruments. Securities Lending Fund investments are valued at the evaluated bid price provided by an independent pricing service. Income earned from investment in the Securities Lending Fund, if any, is included in income from affiliated securities on the Statement of Operations.
Security transactions and income recognition
Securities transactions are recorded on a trade date basis. Realized gains or losses are recorded on the basis of identified cost.
Dividend income is recognized on the ex-dividend date, except for certain dividends from foreign securities, which are recorded as soon as the custodian verifies the ex-dividend date. Dividend income from foreign securities is recorded net of foreign taxes withheld where recovery of such taxes is not assured.
Distributions to shareholders
Distributions to shareholders from net investment income and any net realized gains are recorded on the ex-dividend date and paid at least annually. Such distributions are determined in accordance with income tax regulations and may differ from U.S. generally accepted accounting principles. Dividend sources are estimated at the time of declaration. The tax character of distributions is determined as of the Fund’s fiscal year end. Therefore, a portion of the Fund’s distributions made prior to the Fund’s fiscal year end may be categorized as a tax return of capital at year end.
| | | | |
| 24 | | Wells Fargo Global Small Cap Fund | | Notes to financial statements |
Federal and other taxes
The Fund intends to continue to qualify as a regulated investment company by distributing substantially all of its investment company taxable income and any net realized capital gains (after reduction for capital loss carryforwards) sufficient to relieve it from all, or substantially all, federal income taxes. Accordingly, no provision for federal income taxes was required.
The Fund’s income and federal excise tax returns and all financial records supporting those returns for the prior three fiscal years are subject to examination by the federal and Delaware revenue authorities. Management has analyzed the Fund’s tax positions taken on federal, state, and foreign tax returns for all open tax years and does not believe that there are any uncertain tax positions that require recognition of a tax liability.
As of October 31, 2018, the aggregate cost of all investments for federal income tax purposes was $296,911,346 and the unrealized gains (losses) consisted of:
| | | | |
Gross unrealized gains | | $ | 32,202,408 | |
Gross unrealized losses | | | (22,260,210 | ) |
Net unrealized gains | | $ | 9,942,198 | |
Class allocations
The separate classes of shares offered by the Fund differ principally in applicable sales charges, distribution, shareholder servicing, and administration fees. Class specific expenses are charged directly to that share class. Investment income, common expenses, and realized and unrealized gains (losses) on investments are allocated daily to each class of shares based on the relative proportion of net assets of each class.
3. FAIR VALUATION MEASUREMENTS
Fair value measurements of investments are determined within a framework that has established a fair value hierarchy based upon the various data inputs utilized in determining the value of the Fund’s investments. The three-level hierarchy gives the highest priority to unadjusted quoted prices in active markets for identical assets or liabilities (Level 1) and the lowest priority to unobservable inputs (Level 3). The Fund’s investments are classified within the fair value hierarchy based on the lowest level of input that is significant to the fair value measurement. The inputs are summarized into three broad levels as follows:
| ∎ | | Level 1 – quoted prices in active markets for identical securities |
| ∎ | | Level 2 – other significant observable inputs (including quoted prices for similar securities, interest rates, prepayment speeds, credit risk, etc.) |
| ∎ | | Level 3 – significant unobservable inputs (including the Fund’s own assumptions in determining the fair value of investments) |
The inputs or methodologies used for valuing investments in securities are not necessarily an indication of the risk associated with investing in those securities.
| | | | | | |
| Notes to financial statements | | Wells Fargo Global Small Cap Fund | | | 25 | |
The following is a summary of the inputs used in valuing the Fund’s assets and liabilities as of October 31, 2018:
| | | | | | | | | | | | | | | | |
| | | Quoted prices
(Level 1) | | | Other significant
observable inputs
(Level 2) | | | Significant
unobservable inputs (Level 3) | | | Total | |
Assets | | | | | | | | | | | | | | | | |
Investments in: | | | | | | | | | | | | | | | | |
| | | | |
Common stocks | | | | | | | | | | | | | | | | |
Australia | | $ | 10,608,566 | | | $ | 0 | | | $ | 0 | | | $ | 10,608,566 | |
Austria | | | 1,707,610 | | | | 0 | | | | 0 | | | | 1,707,610 | |
Canada | | | 18,035,696 | | | | 0 | | | | 0 | | | | 18,035,696 | |
France | | | 11,990,812 | | | | 0 | | | | 0 | | | | 11,990,812 | |
Germany | | | 16,240,157 | | | | 0 | | | | 0 | | | | 16,240,157 | |
Hong Kong | | | 2,865,002 | | | | 0 | | | | 0 | | | | 2,865,002 | |
Ireland | | | 1,484,887 | | | | 0 | | | | 0 | | | | 1,484,887 | |
Italy | | | 1,121,703 | | | | 0 | | | | 0 | | | | 1,121,703 | |
Japan | | | 37,219,495 | | | | 0 | | | | 0 | | | | 37,219,495 | |
Netherlands | | | 2,751,107 | | | | 0 | | | | 0 | | | | 2,751,107 | |
Spain | | | 5,340,616 | | | | 0 | | | | 0 | | | | 5,340,616 | |
Sweden | | | 1,907,315 | | | | 0 | | | | 0 | | | | 1,907,315 | |
Switzerland | | | 2,623,354 | | | | 0 | | | | 0 | | | | 2,623,354 | |
United Kingdom | | | 30,945,751 | | | | 0 | | | | 0 | | | | 30,945,751 | |
United States | | | 143,235,992 | | | | 0 | | | | 0 | | | | 143,235,992 | |
| | | | |
Short-term investments | | | | | | | | | | | | | | | | |
Investment companies | | | 16,091,244 | | | | 2,684,237 | | | | 0 | | | | 18,775,481 | |
Total assets | | $ | 304,169,307 | | | $ | 2,684,237 | | | $ | 0 | | | $ | 306,853,544 | |
Additional sector, industry or geographic detail is included in the Portfolio of Investments.
At October 31, 2018, the Fund did not have any transfers into/out Level 3.
4. TRANSACTIONS WITH AFFILIATES
Management fee
Funds Management, an indirect wholly owned subsidiary of Wells Fargo, is the manager of the Fund and provides advisory and fund-level administrative services under an investment management agreement. Under the investment management agreement, Funds Management is responsible for, among other services, implementing the investment objectives and strategies of the Fund, supervising the subadviser and providing fund-level administrative services in connection with the Fund’s operations. As compensation for its services under the investment management agreement, Funds Management is entitled to receive an annual management fee starting at 0.95% and declining to 0.83% as the average daily net assets of the Fund increase. For the year ended October 31, 2018, the management fee was equivalent to an annual rate of 0.95% of the Fund’s average daily net assets.
Funds Management has retained the services of a subadviser to provide daily portfolio management to the Fund. The fee for subadvisory services is borne by Funds Management. WellsCap is the subadviser to the Fund and is entitled to receive a fee from Funds Management at an annual rate starting at 0.55% and declining to 0.40% as the average daily net assets of the Fund increase.
Administration fees
Under a class-level administration agreement, Funds Management provides class-level administrative services to the Fund, which includes paying fees and expenses for services provided by the transfer agent, sub-transfer agents, omnibus account servicers and record-keepers. As compensation for its services under the class-level administration agreement, Funds Management receives an annual fee which is calculated based on the average daily net assets of each class as follows:
| | | | |
| | | Class-level
administration fee | |
Class A, Class C | | | 0.21 | % |
Administrator Class, Institutional Class | | | 0.13 | |
| | | | |
| 26 | | Wells Fargo Global Small Cap Fund | | Notes to financial statements |
Funds Management has contractually waived and/or reimbursed management and administration fees to the extent necessary to maintain certain net operating expense ratios for the Fund. When each class of the Fund has exceeded its expense cap, Funds Management has waived fees and/or reimbursed expenses from fund level expenses on a proportionate basis and then from class specific expenses; otherwise, waivers and/or reimbursements are applied against class specific expenses before fund level expenses. Funds Management has committed through February 28, 2019 to waive fees and/or reimburse expenses to the extent necessary to cap the Fund’s expenses at 1.55% for Class A shares, 2.30% for Class C shares, 1.40% for Administrator Class shares, and 1.15% for Institutional Class. After this time, the cap may be increased or the commitment to maintain the cap may be terminated only with the approval of the Board of Trustees.
Distribution fee
The Trust has adopted a distribution plan for Class C shares of the Fund pursuant to Rule 12b-1 under the 1940 Act. A distribution fee is charged to Class C shares and paid to Wells Fargo Funds Distributor, LLC (“Funds Distributor”), the principal underwriter, at an annual rate of 0.75% of the average daily net assets of Class C shares.
In addition, Funds Distributor is entitled to receive the front-end sales charge from the purchase of Class A shares and a contingent deferred sales charge on the redemption of certain Class A shares. Funds Distributor is also entitled to receive the contingent deferred sales charges from redemptions of Class C shares. For the year ended October 31, 2018, Funds Distributor received $6,564 from the sale of Class A shares and $58 in contingent deferred sales charges from redemptions of Class C shares. No contingent deferred sales charges were incurred by Class A for the year ended October 31, 2018.
Shareholder servicing fees
The Trust has entered into contracts with one or more shareholder servicing agents, whereby Class A, Class C, and Administrator Class of the Fund are charged a fee at an annual rate of 0.25% of the average daily net assets of each respective class.
A portion of these total shareholder servicing fees were paid to affiliates of Wells Fargo.
Interfund transactions
The Fund may purchase or sell portfolio investment securities to certain other Wells Fargo affiliates pursuant to Rule 17a-7 under the 1940 Act and under procedures adopted by the Board of Trustees. The procedures have been designed to ensure that these interfund transactions, which do not incur broker commissions, are effected at current market prices. Pursuant to these procedures, the Fund had $3,240,480 and $14,971,287 in interfund purchases and sales, respectively, during the year ended October 31, 2018.
5. INVESTMENT PORTFOLIO TRANSACTIONS
Purchases and sales of investments, excluding U.S. government obligations (if any) and short-term securities, for the year ended October 31, 2018 were $214,241,893 and $142,807,506, respectively.
6. BANK BORROWINGS
The Trust (excluding the money market funds), Wells Fargo Master Trust and Wells Fargo Variable Trust are parties to a $280,000,000 revolving credit agreement whereby the Fund is permitted to use bank borrowings for temporary or emergency purposes, such as to fund shareholder redemption requests. Interest under the credit agreement is charged to the Fund based on a borrowing rate equal to the higher of the Federal Funds rate in effect on that day plus 1.25% or the overnight LIBOR rate in effect on that day plus 1.25%. In addition, an annual commitment fee equal to 0.25% of the unused balance is allocated to each participating fund.
For the year ended October 31, 2018, there were no borrowings by the Fund under the agreement.
7. DISTRIBUTIONS TO SHAREHOLDERS
The tax character of distributions paid during the years ended October 31, 2018 and October 31, 2017 were as follows:
| | | | | | | | |
| | | Year ended October 31 | |
| | | 2018 | | | 2017 | |
Ordinary income | | $ | 8,131,894 | | | $ | 4,472,432 | |
Long-term capital gain | | | 22,337,754 | | | | 10,965,730 | |
| | | | | | |
| Notes to financial statements | | Wells Fargo Global Small Cap Fund | | | 27 | |
As of October 31, 2018, the components of distributable earnings on a tax basis were as follows:
| | | | |
Undistributed
ordinary
income | | Undistributed
long-term
gain | | Unrealized
gains |
| $4,835,580 | | $21,579,262 | | $9,935,740 |
Effective for all filings after November 4, 2018, the Securities and Exchange Commission eliminated the requirement to separately state the components of distributions to shareholders. The amounts of distributions to shareholders for the year ended October 31, 2017 were as follows:
| | | | | | | | |
| | | Net
investment
income | | | Net
realized
gains | |
Class A | | $ | 1,253,803 | | | $ | 8,370,890 | |
Class B | | | 0 | | | | 64,415 | |
Class C | | | 83,983 | | | | 2,630,739 | |
Administrator Class | | | 242,326 | | | | 1,441,791 | |
Institutional Class | | | 251,541 | | | | 1,098,674 | |
8. INDEMNIFICATION
Under the Trust’s organizational documents, the officers and Trustees have been granted certain indemnification rights against certain liabilities that may arise out of performance of their duties to the Trust. Additionally, in the normal course of business, the Trust may enter into contracts with service providers that contain a variety of indemnification clauses. The Trust’s maximum exposure under these arrangements is dependent on future claims that may be made against the Fund and, therefore, cannot be estimated.
9. NEW ACCOUNTING PRONOUNCEMENT
In August 2018, FASB issued Accounting Standards Update (“ASU”) No. 2018-13, Fair Value Measurement (Topic 820) Disclosure Framework—Changes to the Disclosure Requirements for Fair Value Measurement. ASU 2018-13 updates the disclosure requirements for fair value measurements by modifying or removing certain disclosures and adding certain new disclosures. The amendments are effective for fiscal years, and interim periods within those fiscal years, beginning after December 15, 2019. Early adoption is permitted. Management has adopted the removal and modification of disclosures early, as permitted, and will adopt the additional new disclosures at the effective date.
10. SUBSEQUENT DISTRIBUTIONS
On December 10, 2018, the Fund declared distributions from short-term capital gains and long-term capital gains to shareholders of record on December 7, 2018. The per share amounts payable on December 11, 2018 were as follows:
| | | | | | | | |
| | | Short-term
capital gains | | | Long-term
capital gains | |
Class A | | $ | 0.53787 | | | $ | 2.86980 | |
Class C | | | 0.53787 | | | | 2.86980 | |
Administrator Class | | | 0.53787 | | | | 2.86980 | |
Institutional Class | | | 0.53787 | | | | 2.86980 | |
These distributions are not reflected in the accompanying financial statements.
| | | | |
| 28 | | Wells Fargo Global Small Cap Fund | | Report of independent registered public accounting firm |
BOARD OF TRUSTEES AND SHAREHOLDERS OF WELLS FARGO FUNDS TRUST:
Opinion on the Financial Statements
We have audited the accompanying statement of assets and liabilities of Wells Fargo Global Small Cap Fund (the “Fund”), one of the funds constituting Wells Fargo Funds Trust, including the portfolio of investments, as of October 31, 2018, the related statements of operations for the year then ended, the statements of changes in net assets for each of the years in the two-year period then ended, and the related notes (collectively, the “financial statements”) and the financial highlights for each of the years in the five-year period then ended. In our opinion, the financial statements and financial highlights present fairly, in all material respects, the financial position of the Fund as of October 31, 2018, the results of its operations for the year then ended, the changes in its net assets for each of the years in the two-year period then ended, and the financial highlights for each of the years in the five-year period then ended, in conformity with U.S. generally accepted accounting principles.
Basis for Opinion
These financial statements and financial highlights are the responsibility of the Fund’s management. Our responsibility is to express an opinion on these financial statements and financial highlights based on our audits. We are a public accounting firm registered with the Public Company Accounting Oversight Board (United States) (“PCAOB”) and are required to be independent with respect to the Fund in accordance with the U.S. federal securities laws and the applicable rules and regulations of the Securities and Exchange Commission and the PCAOB.
We conducted our audits in accordance with the standards of the PCAOB. Those standards require that we plan and perform the audit to obtain reasonable assurance about whether the financial statements and financial highlights are free of material misstatement, whether due to error or fraud. Our audits included performing procedures to assess the risks of material misstatement of the financial statements and financial highlights, whether due to error or fraud, and performing procedures that respond to those risks. Such procedures included examining, on a test basis, evidence regarding the amounts and disclosures in the financial statements and financial highlights. Such procedures also included confirmation of securities owned as of October 31, 2018, by correspondence with the custodian and brokers, or by other appropriate auditing procedures. Our audits also included evaluating the accounting principles used and significant estimates made by management, as well as evaluating the overall presentation of the financial statements and financial highlights. We believe that our audits provide a reasonable basis for our opinion.

We have not been able to determine the specific year that we began serving as the auditor of one or more Wells Fargo Funds investment companies, however we are aware that we have served as the auditor of one or more Wells Fargo Funds investment companies since at least 1955.
Boston, Massachusetts
December 21, 2018
| | | | | | |
| Other information (unaudited) | | Wells Fargo Global Small Cap Fund | | | 29 | |
TAX INFORMATION
For corporate shareholders, pursuant to Section 854 of the Internal Revenue Code, 20.41% of ordinary income dividends qualify for the corporate dividends-received deduction for the fiscal year ended October 31, 2018.
Pursuant to Section 852 of the Internal Revenue Code, $22,337,754 was designated as a 20% rate gain distribution for the fiscal year ended October 31, 2018.
Pursuant to Section 854 of the Internal Revenue Code, $3,662,660 of income dividends paid during the fiscal year ended October 31, 2018 has been designated as qualified dividend income (QDI).
For the fiscal year ended October 31, 2018, $20,667 has been designated as interest-related dividends for nonresident alien shareholders pursuant to Section 871 of the Internal Revenue Code.
For the fiscal year ended October 31, 2018, $6,696,862 has been designated as short-term capital gain dividends for nonresident alien shareholders pursuant to Section 871 of the Internal Revenue Code.
PROXY VOTING INFORMATION
A description of the policies and procedures that the Fund uses to determine how to vote proxies relating to portfolio securities is available, upon request, by calling 1-800-222-8222, visiting our website at wellsfargofunds.com, or visiting the SEC website at sec.gov. Information regarding how the Fund voted proxies relating to portfolio securities during the most recent 12-month period ended June 30 is available on the Fund’s website at wellsfargofunds.com or by visiting the SEC website at sec.gov.
PORTFOLIO HOLDINGS INFORMATION
The complete portfolio holdings for the Fund are publicly available monthly on the Fund’s website (wellsfargofunds.com), on a one-month delayed basis. In addition, top ten holdings information (excluding derivative positions) for the Fund is publicly available on the Fund’s website on a monthly, seven-day or more delayed basis. The Fund files its complete schedule of portfolio holdings with the SEC for the first and third quarters of each fiscal year on Form N-Q, which is available by visiting the SEC website at sec.gov. In addition, the Fund’s Form N-Q may be reviewed and copied at the SEC’s Public Reference Room in Washington, DC, and at regional offices in New York City, at 233 Broadway, and in Chicago, at 175 West Jackson Boulevard, Suite 900. Information about the Public Reference Room may be obtained by calling 1-800-SEC-0330.
| | | | |
| 30 | | Wells Fargo Global Small Cap Fund | | Other information (unaudited) |
BOARD OF TRUSTEES AND OFFICERS
Each of the Trustees and Officers1 listed in the table below acts in identical capacities for each fund in the Wells Fargo family of funds, which consists of 152 mutual funds comprising the Wells Fargo Funds Trust, Wells Fargo Variable Trust, Wells Fargo Master Trust and four closed-end funds (collectively the “Fund Complex”). This table should be read in conjunction with the Prospectus and the Statement of Additional Information2. The mailing address of each Trustee and Officer is 525 Market Street, 12th Floor, San Francisco, CA 94105. Each Trustee and Officer serves an indefinite term, however, each Trustee serves such term until reaching the mandatory retirement age established by the Trustees.
Independent Trustees
| | | | | | |
Name and year of birth | | Position held and length of service* | | Principal occupations during past five years or longer | | Current other public company or investment company directorships |
William R. Ebsworth (Born 1957) | | Trustee, since 2015 | | Retired. From 1984 to 2013, equities analyst, portfolio manager, research director and chief investment officer at Fidelity Management and Research Company in Boston, Tokyo, and Hong Kong, and retired in 2013 as Chief Investment Officer of Fidelity Strategic Advisers, Inc. where he led a team of investment professionals managing client assets. Prior thereto, Board member of Hong Kong Securities Clearing Co., Hong Kong Options Clearing Corp., the Thailand International Fund, Ltd., Fidelity Investments Life Insurance Company, and Empire Fidelity Investments Life Insurance Company. Board member of the Vincent Memorial Hospital Endowment (non-profit organization), where he serves on the Investment Committee and as a Chair of the Audit Committee. Mr. Ebsworth is a CFA® charterholder. | | N/A |
Jane A. Freeman (Born 1953) | | Trustee, since 2015; Chair Liaison, since 2018 | | Retired. From 2012 to 2014 and 1999 to 2008, Chief Financial Officer of Scientific Learning Corporation. From 2008 to 2012, Ms. Freeman provided consulting services related to strategic business projects. Prior to 1999, Portfolio Manager at Rockefeller & Co. and Scudder, Stevens & Clark. Board member of the Harding Loevner Funds from 1996 to 2014, serving as both Lead Independent Director and chair of the Audit Committee. Board member of the Russell Exchange Traded Funds Trust from 2011 to 2012 and the chair of the Audit Committee. Ms. Freeman is a Board Member of The Ruth Bancroft Garden (non-profit organization). She is also an inactive Chartered Financial Analyst. | | N/A |
Isaiah Harris, Jr.3 (Born 1952) | | Trustee, since 2009 | | Retired. Chairman of the Board of CIGNA Corporation since 2009, and Director since 2005. From 2003 to 2011, Director of Deluxe Corporation. Prior thereto, President and CEO of BellSouth Advertising and Publishing Corp. from 2005 to 2007, President and CEO of BellSouth Enterprises from 2004 to 2005 and President of BellSouth Consumer Services from 2000 to 2003. Emeritus member of the Iowa State University Foundation Board of Governors. Emeritus Member of the Advisory Board of Iowa State University School of Business. Advisory Board Member, Palm Harbor Academy (private school). Advisory Board Member, Child Evangelism Fellowship (non-profit). Mr. Harris is a certified public accountant (inactive status). | | CIGNA Corporation |
Judith M. Johnson3 (Born 1949) | | Trustee, since 2008; Audit Committee Chairman, since 2009 | | Retired. Prior thereto, Chief Executive Officer and Chief Investment Officer of Minneapolis Employees Retirement Fund from 1996 to 2008. Ms. Johnson is an attorney, certified public accountant and a certified managerial accountant. | | N/A |
David F. Larcker (Born 1950) | | Trustee, since 2009 | | James Irvin Miller Professor of Accounting at the Graduate School of Business, Stanford University, Director of the Corporate Governance Research Initiative and Senior Faculty of The Rock Center for Corporate Governance since 2006. From 2005 to 2008, Professor of Accounting at the Graduate School of Business, Stanford University. Prior thereto, Ernst & Young Professor of Accounting at The Wharton School, University of Pennsylvania from 1985 to 2005. | | N/A |
| | | | | | |
| Other information (unaudited) | | Wells Fargo Global Small Cap Fund | | | 31 | |
| | | | | | |
Name and year of birth | | Position held and length of service* | | Principal occupations during past five years or longer | | Current other public company or investment company directorships |
Olivia S. Mitchell (Born 1953) | | Trustee, since 2006; Nominating and Governance Committee Chairman, since 2018 | | International Foundation of Employee Benefit Plans Professor, Wharton School of the University of Pennsylvania since 1993. Director of Wharton’s Pension Research Council and Boettner Center on Pensions & Retirement Research, and Research Associate at the National Bureau of Economic Research. Previously, Cornell University Professor from 1978 to 1993. | | N/A |
Timothy J. Penny (Born 1951) | | Trustee, since 1996; Chairman, since 2018; Vice Chairman, from 2017 to 2018 | | President and Chief Executive Officer of Southern Minnesota Initiative Foundation, a non-profit organization, since 2007. Member of the Board of Trustees of NorthStar Education Finance, Inc., a non-profit organization, since 2007. | | N/A |
James G. Polisson (Born 1959) | | Trustee, since 2018; Advisory Board Member, from 2017 to 2018 | | Retired. Chief Marketing Officer, Source (ETF) UK Services, Ltd, from 2015 to 2017. From 2012 to 2015, Principal of The Polisson Group, LLC, a management consulting, corporate advisory and principal investing company. Chief Executive Officer and Managing Director at Russell Investments, Global Exchange Traded Funds from 2010 to 2012. Managing Director of Barclays Global Investors from 1998 to 2010 and Global Chief Marketing Officer for iShares and Barclays Global Investors from 2000 to 2010. Trustee of the San Francisco Mechanics’ Institute, a non-profit organization, from 2013 to 2015. Board member of the Russell Exchange Traded Fund Trust from 2011 to 2012. Director of Barclays Global Investors Holdings Deutschland GmbH from 2006 to 2009. Mr. Polisson is an attorney and has a retired status with the Massachusetts and District of Columbia Bar Associations. | | N/A |
Michael S. Scofield4 (Born 1943) | | Trustee, since 2010 | | Served on the Investment Company Institute’s Board of Governors and Executive Committee from 2008-2011 as well the Governing Council of the Independent Directors Council from 2006-2011 and the Independent Directors Council Executive Committee from 2008-2011. Trustee of the Evergreen Fund complex (and its predecessors) from 1984 to 2010. Chairman of the Evergreen Funds from 2000-2010. Former Trustee of the Mentor Funds. Retired Attorney, Law Offices of Michael S. Scofield. | | N/A |
Pamela Wheelock (Born 1959) | | Trustee, since 2018; Advisory Board Member, from 2017 to 2018 | | Chief Operating Officer, Twin Cities Habitat for Humanity, since January, 2017. Vice President of University Services, University of Minnesota from 2012 to 2017. Prior thereto, on the Board of Directors, Governance Committee and Finance Committee for the Minnesota Philanthropy Partners (Saint Paul Foundation) from 2012 to 2018, Interim President and Chief Executive Officer of Blue Cross Blue Shield of Minnesota from 2010 to 2011, Chairman of the Board from 2009 to 2011 and Board Director from 2003 to 2015. Vice President, Leadership and Community Engagement, Bush Foundation, Saint Paul, Minnesota (a private foundation) from 2009 to 2011. Executive Vice President and Chief Financial Officer, Minnesota Sports and Entertainment from 2004 to 2009 and Senior Vice President from 2002 to 2004. Commissioner of Finance, State of Minnesota, from 1999 to 2002. Currently the Board Chair of the Minnesota Wild Foundation since 2010. | | N/A |
| * | Length of service dates reflect the Trustee’s commencement of service with the Trust’s predecessor entities, where applicable. |
| | | | |
| 32 | | Wells Fargo Global Small Cap Fund | | Other information (unaudited) |
Officers
| | | | | | |
Name and year of birth | | Position held and length of service | | Principal occupations during past five years or longer | | |
Andrew Owen (Born 1960) | | President, since 2017 | | Executive Vice President of Wells Fargo & Company and Head of Affiliated Managers, Wells Fargo Asset Management, since 2014. In addition, Mr. Owen is currently President, Chief Executive Officer and Director of Wells Fargo Funds Management, LLC since 2017. Prior thereto, Executive Vice President responsible for marketing, investments and product development for Wells Fargo Funds Management, LLC, from 2009 to 2014. | | |
Jeremy DePalma1 (Born 1974) | | Treasurer, since 2012 | | Senior Vice President of Wells Fargo Funds Management, LLC since 2009. Senior Vice President of Evergreen Investment Management Company, LLC from 2008 to 2010 and head of the Fund Reporting and Control Team within Fund Administration from 2005 to 2010. | | |
Alexander Kymn (Born 1973) | | Secretary, since 2018; Chief Legal Officer, since 2018 | | Senior Company Counsel of Wells Fargo Bank, N.A. since 2018 (previously Senior Counsel from 2007 to 2018). Vice President of Wells Fargo Funds Management, LLC from 2008 to 2014. | | |
Michael H. Whitaker (Born 1967) | | Chief Compliance Officer, since 2016 | | Senior Vice President and Chief Compliance Officer since 2016. Senior Vice President and Chief Compliance Officer for Fidelity Investments from 2007 to 2016. | | |
David Berardi (Born 1975) | | Assistant Treasurer, since 2009 | | Vice President of Wells Fargo Funds Management, LLC since 2009. Vice President of Evergreen Investment Management Company, LLC from 2008 to 2010. Manager of Fund Reporting and Control for Evergreen Investment Management Company, LLC from 2004 to 2010. | | |
| 1 | Jeremy DePalma acts as Treasurer of 76 funds and Assistant Treasurer of 76 funds in the Fund Complex. |
| 2 | The Statement of Additional Information includes additional information about the Trustees and is available, without charge, upon request, by calling 1-800-222-8222 or by visiting the website at wellsfargofunds.com. |
| 3 | Mr. Harris will replace Ms. Johnson as the Chairman of the Audit Committee effective January 1, 2019. |
| 4 | Mr. Scofield is expected to retire on December 31, 2018. |
| | | | | | |
| Other information (unaudited) | | Wells Fargo Global Small Cap Fund | | | 33 | |
BOARD CONSIDERATION OF INVESTMENT MANAGEMENT AND SUB-ADVISORY AGREEMENTS:
Wells Fargo Global Small Cap Fund
Under the Investment Company Act of 1940 (the “1940 Act”), the Board of Trustees (the “Board”) of Wells Fargo Funds Trust (the “Trust”) must determine annually whether to approve the continuation of the Trust’s investment management and sub-advisory agreements. In this regard, at an in-person meeting held on May 22-23, 2018 (the “Meeting”), the Board, all the members of which have no direct or indirect interest in the investment management and sub-advisory agreements and are not “interested persons” of the Trust, as defined in the 1940 Act (the “Independent Trustees”), reviewed and approved for Wells Fargo Global Small Cap Fund (the “Fund”): (i) an investment management agreement (the “Management Agreement”) with Wells Fargo Funds Management, LLC (“Funds Management”); and (ii) an investment sub-advisory agreement (the “Sub-Advisory Agreement”) with Wells Capital Management Incorporated (the “Sub-Adviser”), an affiliate of Funds Management. The Management Agreement and the Sub-Advisory Agreement are collectively referred to as the “Advisory Agreements.”
At the Meeting, the Board considered the factors and reached the conclusions described below relating to the selection of Funds Management and the Sub-Adviser and the approval of the Advisory Agreements. Prior to the Meeting, including at an in-person meeting in April 2018, the Trustees conferred extensively among themselves and with representatives of Funds Management about these matters. Also, the Board has adopted a team-based approach, with each team consisting of a sub-set of Trustees, to assist the full Board in the discharge of its duties in reviewing investment performance and other matters throughout the year. The Independent Trustees were assisted in their evaluation of the Advisory Agreements by independent legal counsel, from whom they received separate legal advice and with whom they met separately.
In providing information to the Board, Funds Management and the Sub-Adviser were guided by a detailed set of requests for information submitted to them by independent legal counsel on behalf of the Independent Trustees at the start of the Board’s annual contract renewal process earlier in 2018. In considering and approving the Advisory Agreements, the Trustees considered the information they believed relevant, including but not limited to the information discussed below. The Board considered not only the specific information presented in connection with the Meeting, but also the knowledge gained over time through interaction with Funds Management and the Sub-Adviser about various topics. In this regard, the Board reviewed reports of Funds Management at each of its quarterly meetings, which included, among other things, portfolio reviews and investment performance reports. In addition, the Board and the teams mentioned above confer with portfolio managers at various times throughout the year. The Board did not identify any particular information or consideration that was all-important or controlling, and each individual Trustee may have attributed different weights to various factors.
After its deliberations, the Board unanimously approved the continuation of the Advisory Agreements for a one-year term and determined that the compensation payable to Funds Management and the Sub-Adviser under each of the Advisory Agreements was reasonable. The Board considered the approval of the Advisory Agreements for the Fund as part of its consideration of agreements for funds across the complex, but its approvals were made on a fund-by-fund basis. The following summarizes a number of important, but not necessarily all, factors considered by the Board in support of its approvals.
Nature, extent and quality of services
The Board received and considered various information regarding the nature, extent and quality of services provided to the Fund by Funds Management and the Sub-Adviser under the Advisory Agreements. This information included a description of the investment advisory services and Fund-level administrative services covered by the Management Agreement, as well as, among other things, a summary of the background and experience of senior management of Wells Fargo Asset Management (“WFAM”), of which Funds Management and the Sub-Adviser are a part, a summary of investments made in the business of WFAM, a summary of certain organizational and personnel changes involving Funds Management and the Sub-Adviser, and a description of Funds Management’s and the Sub-Adviser’s business continuity planning programs and of their approaches to data privacy and cybersecurity. The Board also considered the qualifications, background, tenure and responsibilities of each of the portfolio managers primarily responsible for the day-to-day portfolio management of the Fund.
The Board evaluated the ability of Funds Management and the Sub-Adviser to attract and retain qualified investment professionals, including research, advisory and supervisory personnel. The Board further considered the compliance programs and compliance records of Funds Management and the Sub-Adviser. In addition, the Board took into account the full range of services provided to the Fund by Funds Management and its affiliates.
| | | | |
| 34 | | Wells Fargo Global Small Cap Fund | | Other information (unaudited) |
Fund investment performance and expenses
The Board considered the investment performance results for the Fund over various time periods ended December 31, 2017. The Board considered these results in comparison to the investment performance of funds in a universe that was determined by Broadridge Inc. (“Broadridge”) to be similar to the Fund (the “Universe”), and in comparison to the Fund’s benchmark index and to other comparative data. Broadridge is an independent provider of investment company data. The Board received a description of the methodology used by Broadridge to select the mutual funds in the performance Universe. The Board noted that the investment performance of the Fund (Administrator Class) was higher than the average investment performance of the Universe for the three, five- and ten-year periods under review, but lower than the average investment performance of the Universe for the one-year period under review. The Board also noted that the investment performance of the Fund was higher than or in range of its benchmark index, the S&P Developed Small Cap Index, for the one-, three-, and five-year periods under review, but lower than its benchmark for the ten-year period under review.
The Board also received and considered information regarding the Fund’s net operating expense ratios and their various components, including actual management fees, custodian and other non-management fees, and Rule 12b-1 and non-Rule 12b-1 shareholder service fees. The Board considered these ratios in comparison to the median ratios of funds in class-specific expense groups that were determined by Broadridge to be similar to the Fund (the “Groups”). The Board received a description of the methodology used by Broadridge to select the mutual funds in the expense Groups and an explanation of how funds comprising expense groups and their expense ratios may vary from year-to-year. Based on the Broadridge reports, the Board noted that the net operating expense ratios of the Fund were lower than, equal to, or in range of the median net operating expense ratios of the expense Groups for each share class.
The Board took into account the Fund’s investment performance and expense information provided to it among the factors considered in deciding to re-approve the Advisory Agreements.
Investment management and sub-advisory fee rates
The Board reviewed and considered the contractual fee rates payable by the Fund to Funds Management under the Management Agreement, as well as the contractual fee rates payable by the Fund to Funds Management for class-level administrative services under a Class-Level Administration Agreement, which include, among other things, class-level transfer agency and sub-transfer agency costs (collectively, the “Management Rates”). The Board also reviewed and considered the contractual investment sub-advisory fee rates that are payable by Funds Management to the Sub-Adviser for investment sub-advisory services.
Among other information reviewed by the Board was a comparison of the Fund’s Management Rates with the average contractual investment management fee rates of funds in the expense Groups at a common asset level as well as transfer agency costs of the funds in the expense Groups. The Board noted that the Management Rates of the Fund were lower than or in range of the sum of these average rates for the Fund’s expense Groups for all share classes.
The Board also received and considered information about the portion of the total management fee that was retained by Funds Management after payment of the fee to the Sub-Adviser for sub-advisory services. In assessing the reasonableness of this amount, the Board received and evaluated information about the nature and extent of responsibilities retained and risks assumed by Funds Management and not delegated to or assumed by the Sub-Adviser, and about Funds Management’s on-going oversight services. Given the affiliation between Funds Management and the Sub-Adviser, the Board ascribed limited relevance to the allocation of fees between them.
The Board also received and considered information about the nature and extent of services offered and fee rates charged by Funds Management and the Sub-Adviser to other types of clients with investment strategies similar to those of the Fund. In this regard, the Board received information about the significantly greater scope of services, and compliance, reporting and other legal burdens and risks of managing mutual funds compared with those associated with managing assets of non-mutual fund clients such as institutional separate accounts.
Based on its consideration of the factors and information it deemed relevant, including those described here, the Board determined that the compensation payable to Funds Management under the Management Agreement and to the Sub-Adviser under the Sub-Advisory Agreement was reasonable.
Profitability
The Board received and considered information concerning the profitability of Funds Management, as well as the profitability of both WFAM and Wells Fargo & Co. (“Wells Fargo”) as a whole, from providing services to the Fund and the fund family as a whole. The Board noted that the Sub-Adviser’s profitability information with respect to providing services to the Fund was subsumed in the WFAM and Wells Fargo profitability analysis.
| | | | | | |
| Other information (unaudited) | | Wells Fargo Global Small Cap Fund | | | 35 | |
Funds Management reported on the methodologies and estimates used in calculating profitability, including a description of the methodology used to allocate certain expenses and recent enhancements made to the methodology. Among other things, the Board noted that the levels of profitability reported on a fund-by-fund basis varied widely, depending on factors such as the size and type of fund. Based on its review, the Board did not deem the profits reported by Funds Management, WFAM or Wells Fargo from services provided to the Fund to be at a level that would prevent it from approving the continuation of the Advisory Agreements.
Economies of scale
The Board considered the extent to which Funds Management may experience economies of scale in the provision of management services, and the extent to which scale benefits, if any, would be shared with shareholders. In particular, the Board noted the existence of breakpoints in the Fund’s management fee structure, which operate generally to reduce the Fund’s expense ratios as the Fund grows in size. It considered that, for a small fund or a fund that shrinks in size, breakpoints conversely can result in higher fee levels. The Board also considered that in addition to management fee breakpoints, competitive management fee rates set at the outset without regard to breakpoints and fee waiver and expense reimbursement arrangements, as well as investments in the business intended to enhance services available to Fund shareholders, are means of sharing potential economies of scale with shareholders of the Fund.
The Board concluded that the Fund’s fee and expense arrangements, including contractual breakpoints, constituted a reasonable approach to sharing potential economies of scale with the Fund and its shareholders.
Other benefits to Funds Management and the Sub-Adviser
The Board received and considered information regarding potential “fall-out” or ancillary benefits received by Funds Management and its affiliates, including the Sub-Adviser, as a result of their relationships with the Fund. Ancillary benefits could include, among others, benefits directly attributable to other relationships with the Fund and benefits potentially derived from an increase in Funds Management’s and the Sub-Adviser’s business as a result of their relationships with the Fund. The Board noted that various affiliates of Funds Management may receive distribution-related fees, shareholder servicing payments and sub-transfer agency fees in respect of shares sold or held through them and services provided.
The Board also reviewed information about soft dollar credits earned and utilized by the Sub-Adviser, fees earned by Funds Management and the Sub-Adviser from managing a private investment vehicle for the fund family’s securities lending collateral and commissions earned by an affiliated broker from portfolio transactions.
Based on its consideration of the factors and information it deemed relevant, including those described here, the Board did not find that any ancillary benefits received by Funds Management and its affiliates, including the Sub-Adviser, were unreasonable.
Conclusion
At the Meeting, after considering the above-described factors and based on its deliberations and its evaluation of the information described above, the Board unanimously approved the continuation of the Advisory Agreements for a one-year term and determined that the compensation payable to Funds Management and the Sub-Adviser under each of the Advisory Agreements was reasonable.
| | | | |
| 36 | | Wells Fargo Global Small Cap Fund | | Appendix A (unaudited) |
SALES CHARGE REDUCTIONS AND WAIVERS FOR CERTAIN INTERMEDIARIES
Raymond James & Associates, Inc., Raymond James Financial Services & Raymond James affiliates (“Raymond James”)
Effective on or about March 1, 2019, shareholders purchasing Fund shares through a Raymond James platform or account will be eligible only for the following load waivers (front-end sales charge waivers and contingent deferred, or back-end, sales charge waivers) and discounts, which may differ from those disclosed elsewhere in the Fund’s Prospectus or SAI.
Front-end Sales Load Waivers on Class A shares Available at Raymond James
| | • | | Shares purchased in an investment advisory program. |
| | • | | Shares purchased through reinvestment of capital gains distributions and dividend reinvestment when purchasing shares of the same fund (but not any other fund within the fund family). |
| | • | | Employees and registered representatives of Raymond James or its affiliates and their family members as designated by Raymond James. |
| | • | | Shares purchased from the proceeds of redemptions within the same fund family, provided (1) the repurchase occurs within 90 days following the redemption, (2) the redemption and purchase occur in the same account, and (3) redeemed shares were subject to a front-end or deferred sales load (known as Rights of Reinstatement). |
| | • | | A shareholder in the fund’s Class C shares will have their shares automatically exchanged at net asset value to Class A shares (or the appropriate share class) of the fund if the shares are no longer subject to a CDSC and the exchange is in line with the policies and procedures of Raymond James. |
CDSC Waivers on Class A and C Shares Available at Raymond James
| | • | | Death or disability of the shareholder. |
| | • | | Shares sold as part of a systematic withdrawal plan as described in the Fund’s Prospectus. |
| | • | | Return of excess contributions from an IRA Account. |
| | • | | Shares sold as part of a required minimum distribution for IRA and retirement accounts due to the shareholder reaching age 70½ as described in the Fund’s prospectus. |
| | • | | Shares sold to pay Raymond James fees but only if the transaction is initiated by Raymond James. |
| | • | | Shares acquired through a right of reinstatement. |
Front-end Load Discounts Available at Raymond James: Breakpoints, and/or Rights of Accumulation
| | • | | Breakpoints as described in the Fund’s Prospectus. |
| | • | | Rights of accumulation which entitle shareholders to breakpoint discounts will be automatically calculated based on the aggregated holding of fund family assets held by accounts within the purchaser’s household at Raymond James. Eligible fund family assets not held at Raymond James may be included in the rights of accumulation calculation only if the shareholder notifies his or her financial advisor about such assets. |

For more information
More information about Wells Fargo Funds is available free upon request. To obtain literature, please write, visit the Fund’s website, or call:
Wells Fargo Funds
P.O. Box 219967
Kansas City, MO 64121-9967
Website: wellsfargofunds.com
Individual investors: 1-800-222-8222
Retail investment professionals: 1-888-877-9275
Institutional investment professionals:
1-866-765-0778
This report and the financial statements contained herein are submitted for the general information of the shareholders of the Fund. If this report is used for promotional purposes, distribution of the report must be accompanied or preceded by a current prospectus. Before investing, please consider the investment objectives, risks, charges, and expenses of the investment. For a current prospectus and, if available, a summary prospectus, containing this information, call 1-800-222-8222 or visit the Fund’s website at wellsfargofunds.com. Read the prospectus carefully before you invest or send money.
Wells Fargo Asset Management (WFAM) is the trade name for certain investment advisory/management firms owned by Wells Fargo & Company. These firms include but are not limited to Wells Capital Management Incorporated and Wells Fargo Funds Management, LLC. Certain products managed by WFAM entities are distributed by Wells Fargo Funds Distributor, LLC (a broker/dealer and Member FINRA).
This material is for general informational and educational purposes only and is NOT intended to provide investment advice or a recommendation of any kind—including a recommendation for any specific investment, strategy, or plan.
NOT FDIC INSURED ◾ NO BANK GUARANTEE ◾ MAY LOSE VALUE
© 2018 Wells Fargo Funds Management, LLC. All rights reserved.
| | |
 | | 318246 12-18 A239/AR239 10-18 |
Annual Report
October 31, 2018

Wells Fargo International Equity Fund

Beginning on January 1, 2021, as permitted by new regulations adopted by the Securities and Exchange Commission, paper copies of the Fund’s annual and semi-annual shareholder reports will no longer be sent by mail, unless you specifically request paper copies of the reports. Instead, the reports will be made available on the Fund’s website, and you will be notified by mail each time a report is posted and provided with a website address to access the report.
If you already elected to receive shareholder reports electronically, you will not be affected by this change and you need not take any action. You may elect to receive shareholder reports and other communications from the Fund electronically at any time by contacting your financial intermediary (such as a broker-dealer or bank) or, if you are a direct investor, by calling 1-800-222-8222 or by enrolling at wellsfargo.com/advantagedelivery.
You may elect to receive all future reports in paper free of charge. If you invest through a financial intermediary, you can contact your financial intermediary to request that you continue to receive paper copies of your shareholder reports; if you invest directly with the Fund, you can call 1-800-222-8222. Your election to receive reports in paper will apply to all Wells Fargo Funds held in your account with your financial intermediary or, if you are a direct investor, to all Wells Fargo Funds that you hold.

Reduce clutter. Save trees.
Sign up for electronic delivery of prospectuses and shareholder reports at wellsfargo.com/advantagedelivery
Contents
The views expressed and any forward-looking statements are as of October 31, 2018, unless otherwise noted, and are those of the Fund managers and/or Wells Fargo Funds Management, LLC. Discussions of individual securities, or the markets generally, or any Wells Fargo Fund are not intended as individual recommendations. Future events or results may vary significantly from those expressed in any forward-looking statements. The views expressed are subject to change at any time in response to changing circumstances in the market. Wells Fargo Funds Management, LLC and the Fund disclaim any obligation to publicly update or revise any views expressed or forward-looking statements.
NOT FDIC INSURED ◾ NO BANK GUARANTEE ◾ MAY LOSE VALUE
| | | | |
| 2 | | Wells Fargo International Equity Fund | | Letter to shareholders (unaudited) |

Andrew Owen
President
Wells Fargo Funds
The early months of the reporting period were characterized by strong performance for equity and fixed-income markets. The remainder of the reporting period generated economic, business, and investing data that were decidedly more mixed and volatile relative to the prior year.
Dear Shareholder:
We are pleased to offer you this annual report for the Wells Fargo International Equity Fund for the 12-month period that ended October 31, 2018. The early months of the reporting period were characterized by strong performance for equity and fixed-income markets. The remainder of the reporting period generated economic, business, and investing data that were decidedly more mixed and volatile relative to the prior year.
For the period, U.S. stocks, as measured by the S&P 500 Index,1 gained 7.35% and international stocks, as measured by the MSCI ACWI ex USA Index (Net),2 declined 8.24%. Based on the MSCI EM Index (Net),3 emerging market stocks lost 12.52%. For bond investors, the Bloomberg Barclays U.S. Aggregate Bond Index4 declined 2.05% while the Bloomberg Barclays Global Aggregate ex-USD Index5 fell 2.09%. The Bloomberg Barclays Municipal Bond Index6 dropped 0.51%, and the ICE BofAML U.S. High Yield Index7 was up 0.86%.
Optimism continued to shape markets as 2017 closed and 2018 opened.
Economic conditions in late 2017 were characterized by synchronized global growth, low inflation, healthy corporate earnings, growing consumer confidence, declining unemployment, and a weaker U.S. dollar that supported international growth. The U.S. Bureau of Economic Analysis reported that U.S. gross domestic product (GDP) growth on an annualized basis for the fourth quarter of 2017 was 2.9% and inflation remained below U.S. Federal Reserve (Fed) targets.
Economic momentum continued in Europe. The Bank of England (BOE) raised interest rates in November 2017 to 0.50%, the first increase in more than 10 years, indicating confidence in the economy’s growth potential. Meanwhile, the European Central Bank (ECB) and the Bank of Japan (BOJ) kept interest rates low to spur business activities and bought bonds in an effort to encourage equity investments. The People’s Bank of China (PBOC) also sought to stimulate economic growth. Many emerging market economies benefited from stronger currencies versus the U.S. dollar, while commodity price increases benefited countries that rely on natural resources for exports.
| 1 | The S&P 500 Index consists of 500 stocks chosen for market size, liquidity, and industry group representation. It is a market-value-weighted index with each stock’s weight in the index proportionate to its market value. You cannot invest directly in an index. |
| 2 | The Morgan Stanley Capital International (MSCI) All Country World Index (ACWI) ex USA Index (Net) is a free-float-adjusted market-capitalization-weighted index that is designed to measure the equity market performance of developed markets, excluding the United States and Canada. Source: MSCI. MSCI makes no express or implied warranties or representations and shall have no liability whatsoever with respect to any MSCI data contained herein. The MSCI data may not be further redistributed or used as a basis for other indices or any securities or financial products. This report is not approved, reviewed, or produced by MSCI. You cannot invest directly in an index. |
| 3 | The MSCI Emerging Markets (EM) Index (Net) is a free-float-adjusted market-capitalization-weighted index that is designed to measure large- and mid-cap equity market performance of emerging markets. The MSCI EM Index (Net) consists of the following 24 emerging market country indices: Brazil, Chile, China, Colombia, Czech Republic, Egypt, Greece, Hungary, India, Indonesia, Korea, Malaysia, Mexico, Pakistan, Peru, the Philippines, Poland, Qatar, Russia, South Africa, Taiwan, Thailand, Turkey, and the United Arab Emirates. You cannot invest directly in an index. |
| 4 | The Bloomberg Barclays U.S. Aggregate Bond Index is a broad-based benchmark that measures the investment-grade, U.S. dollar-denominated, fixed-rate taxable bond market, including Treasuries, government-related and corporate securities, mortgage-backed securities (agency fixed-rate and hybrid adjustable-rate mortgage pass-throughs), asset-backed securities, and commercial mortgage-backed securities. You cannot invest directly in an index. |
| 5 | The Bloomberg Barclays Global Aggregate ex-USD Index is an unmanaged index that provides a broad-based measure of the global investment-grade fixed-income markets excluding the U.S. dollar-denominated debt market. You cannot invest directly in an index. |
| 6 | The Bloomberg Barclays Municipal Bond Index is an unmanaged index composed of long-term tax-exempt bonds with a minimum credit rating of Baa. You cannot invest directly in an index. |
| 7 | The ICE BofAML U.S. High Yield Index is a market-capitalization-weighted index of domestic and Yankee high-yield bonds. The index tracks the performance of high-yield securities traded in the U.S. bond market. You cannot invest directly in an index. Copyright 2018. ICE Data Indices, LLC. All rights reserved. |
| | | | | | |
| Letter to shareholders (unaudited) | | Wells Fargo International Equity Fund | | | 3 | |
Volatility reemerged during the early months of 2018.
In February 2018, investor concerns arose about inflation and trade, particularly between the U.S. and China. The Fed followed its 25-basis-point (bp; 100 bps equal 1.00%) federal funds rate increase in December 2017 with a further 25-bp increase in March 2018. The inflation rate in March reached the Fed’s 2% target for the first time in a year. The S&P 500 Index closed the first quarter with a negative return, the first negative quarterly return for the index since 2014.
Overseas, investment markets fell, hurt by a stronger U.S. dollar and mounting trade and diplomatic tensions. The MSCI ACWI ex USA Index (Net) declined 1.81% for the quarter that ended March 31, 2018.
Global trade tensions prompted investor concerns.
Global trade tensions escalated during the second quarter of 2018. The U.S. government’s decision to impose tariffs on a wide range of products manufactured overseas drew retaliatory responses from foreign governments, which punished U.S. commodity producers and product manufacturers. Investors were left to wonder about next steps in what appeared to be an escalating divergence in global economic policies and growth prospects.
Inflation trended higher. The CPI-U8 added 0.1% in June after an increase of 0.2% in both April and May. On a year-over-year basis, the all-items index rose 2.9% for the 12 months that ended June 30, 2018. The index for all items less food and energy rose 2.3% for the same 12-month period.
U.S. stocks gained following economic data while international stocks and bonds declined.
During the summer months, the U.S. economy strengthened. Revised second-quarter GDP data released in August showed the U.S. economy growing at a 4.2% rate. The unemployment rate in the U.S. was 3.7% by the end of September, according to the U.S. Department of Labor. Wages showed more consistent growth, and consumer confidence remained strong. Several U.S. equity market indices reached records during August, with the S&P 500 Index gaining 7.20% for the three-month period that ended September 30, 2018. In contrast, the MSCI ACWI ex USA Index (Net) gained 0.71% while the MSCI EM Index declined 1.09% during the same three-month period.
In June, the Fed increased the target range for the federal funds rate to range from 1.75% to 2.00%. It raised the range again in September to range from 2.00% to 2.25%. Long-term interest rates in the U.S. remained at higher levels relative from the prior 10 years. Rates on 10-year and 30-year Treasury bonds—2.46% and 2.81%, respectively, on January 1, 2018—were 3.15% and 3.39%, respectively, on October 31, 2018. Investor concerns about an inverted yield curve waned, only to be replaced by concerns about the potentially negative influence of higher interest rates on economic activity.
October proved to be a difficult month for stock markets globally.
As interest rates and bond yields gained during October, stock markets struggled. For the month, the S&P 500 Index fell 6.84%, the MSCI ACWI ex USA Index (Net) dropped 8.13%, and the MSCI EM Index (Net) lost 8.71%. The Bureau of Economic Analysis released its first estimate of third-quarter GDP, which, at an annualized 3.5% rate, indicated growth may be slowing compared with the second quarter. Readings on consumer sentiment and business spending were mixed.
The S&P 500 Index closed the first quarter with a negative return, the first negative quarterly return for the index since 2014.
| 8 | The Consumer Price Index for All Urban Consumers (CPI-U) measures the changes in the price of a basket of goods and services purchased by urban consumers. The urban consumer population is deemed by many as a better representative measure of the general public because close to 90% of the country’s population lives in highly populated areas. You cannot invest directly in an index. |
| | | | |
| 4 | | Wells Fargo International Equity Fund | | Letter to shareholders (unaudited) |
Economic signals overseas also were mixed as the third quarter ended and the fourth quarter began. In early August, the BOE’s Monetary Policy Committee increased its key interest rate to 0.75%. The ECB and BOJ maintained low interest rates and accommodative monetary policies. Amid rising trade uncertainty, the PBOC cut reserve requirement ratios and accelerated infrastructure spending and tax cuts for business enterprises and individuals. Nevertheless, a strengthening U.S. dollar and the trade tensions remained headwinds for investors overseas.
Don’t let short-term uncertainty derail long-term investment goals.
Periods of investment uncertainty can present challenges, but experience has taught us that maintaining long-term investment goals can be an effective way to plan for the future. To help you create a sound strategy based on your personal goals and risk tolerance, Wells Fargo Funds offers more than 100 mutual funds spanning a wide range of asset classes and investment styles. Although diversification cannot guarantee an investment profit or prevent losses, we believe it can be an effective way to manage investment risk and potentially smooth out overall portfolio performance. We encourage investors to know their investments and to understand that appropriate levels of risk-taking may unlock opportunities.
Thank you for choosing to invest with Wells Fargo Funds. We appreciate your confidence in us and remain committed to helping you meet your financial needs.
Sincerely,

Andrew Owen
President
Wells Fargo Funds
Notice to shareholders
At a meeting held on August 14-15, 2018, the Board of Trustees of the Fund approved the following policy which will be effective on or about February 5, 2019:
Class C shares will convert automatically into Class A shares ten years after the initial date of purchase or, if you acquired your Class C shares through an exchange or conversion from another share class, ten years after the date you acquired your Class C shares. When Class C shares that you acquired through a purchase or exchange convert, any other Class C shares that you purchased with reinvested dividends and distributions also will convert into Class A shares on a pro rata basis. A shorter holding period may also apply depending on your intermediary. Please see “Appendix A—Sales Charge Reductions and Waivers for Certain Intermediaries” in the Fund’s prospectus or at the end of this report.
For further information about your Fund, contact your investment professional, visit our website at wellsfargofunds.com, or call us directly at 1-800-222-8222.
This page is intentionally left blank.
| | | | |
| 6 | | Wells Fargo International Equity Fund | | Performance highlights (unaudited) |
Investment objective
The Fund seeks long-term capital appreciation.
Manager
Wells Fargo Funds Management, LLC
Subadviser
Wells Capital Management Incorporated
Portfolio managers
Dale A. Winner, CFA®
Venkateshwar (Venk) Lal
Average annual total returns (%) as of October 31, 20181
| | | | | | | | | | | | | | | | | | |
| | | | | Including sales charge | | Excluding sales charge | | Expense ratios2 (%) |
| | | Inception date | | 1 year | | 5 year | | 10 year | | 1 year | | 5 year | | 10 year | | Gross | | Net3 |
| Class A (WFEAX) | | 1-20-1998 | | (14.06) | | 1.43 | | 5.33 | | (8.81) | | 2.64 | | 5.95 | | 1.46 | | 1.15 |
| Class C (WFEFX) | | 3-6-1998 | | (10.47) | | 1.87 | | 5.16 | | (9.47) | | 1.87 | | 5.16 | | 2.21 | | 1.90 |
| Class R (WFERX) | | 10-10-2003 | | – | | – | | – | | (9.03) | | 2.37 | | 5.66 | | 1.71 | | 1.40 |
| Class R6 (WFEHX) | | 9-30-2015 | | – | | – | | – | | (8.57) | | 2.89 | | 6.16 | | 1.03 | | 0.85 |
| Administrator Class (WFEDX) | | 7-16-2010 | | – | | – | | – | | (8.79) | | 2.64 | | 5.98 | | 1.38 | | 1.15 |
| Institutional Class (WFENX) | | 3-9-1998 | | – | | – | | – | | (8.56) | | 2.89 | | 6.20 | | 1.13 | | 0.90 |
| MSCI ACWI ex USA Index (Net)4 | | – | | – | | – | | – | | (8.24) | | 1.63 | | 6.92 | | – | | – |
Figures quoted represent past performance, which is no guarantee of future results, and do not reflect taxes that a shareholder may pay on fund distributions or the redemption of fund shares. Investment return and principal value of an investment will fluctuate so that an investor’s shares, when redeemed, may be worth more or less than their original cost. Performance shown without sales charges would be lower if sales charges were reflected. Current performance may be lower or higher than the performance data quoted, which assumes the reinvestment of dividends and capital gains. Current month-end performance is available on the Fund’s website, wellsfargofunds.com.
Index returns do not include transaction costs associated with buying and selling securities, any mutual fund fees or expenses, or any taxes. It is not possible to invest directly in an index.
For Class A shares, the maximum front-end sales charge is 5.75%. For Class C shares, the maximum contingent deferred sales charge is 1.00%. Performance including a contingent deferred sales charge assumes the sales charge for the corresponding time period. Class R, Class R6, Administrator Class, and Institutional Class shares are sold without a front-end sales charge or contingent deferred sales charge.
Stock values fluctuate in response to the activities of individual companies and general market and economic conditions. Foreign investments are especially volatile and can rise or fall dramatically due to differences in the political and economic conditions of the host country. These risks are generally intensified in emerging markets. The use of derivatives may reduce returns and/or increase volatility. Certain investment strategies tend to increase the total risk of an investment (relative to the broader market). The Fund is exposed to smaller-company securities risk. Consult the Fund’s prospectus for additional information on these and other risks.
Please see footnotes on page 7.
| | | | | | |
| Performance highlights (unaudited) | | Wells Fargo International Equity Fund | | | 7 | |
|
| Growth of $10,000 investment as of October 31, 20185 |
|
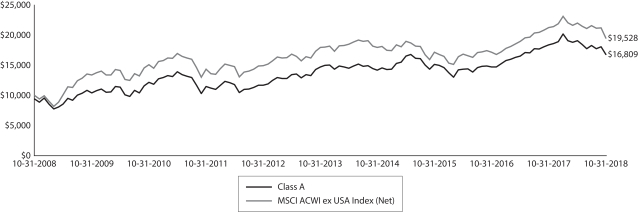 |
| 1 | Historical performance shown for Class R6 shares prior to their inception reflects the performance of Institutional Class shares and includes the higher expenses applicable to Institutional Class shares. If these expenses had not been included, returns for Class R6 shares would be higher. Historical performance shown for Administrator Class shares prior to their inception reflects the performance of Institutional Class shares and has been adjusted to reflect the higher expenses applicable to Administrator Class shares. Historical performance shown for all classes of the Fund prior to July 19, 2010 is based on the performance of the Fund’s predecessor, Evergreen International Equity Fund. |
| 2 | Reflects the expense ratios as stated in the most recent prospectuses, which include the impact of 0.01% in acquired fund fees and expenses. The expense ratios shown are subject to change and may differ from the annualized expense ratios shown in the financial highlights of this report, which do not include acquired fund fees and expenses. |
| 3 | The manager has contractually committed through February 28, 2019, to waive fees and/or reimburse expenses to the extent necessary to cap the Fund’s Total Annual Operating Expenses After Fee Waivers at 1.14% for Cass A, 1.89% for Class C, 1.39% for Class R, 0.84% for Class R6, 1.14% for Administrator Class, and 0.89% for Institutional Class. After this time, the cap may be increased or the commitment to maintain the cap may be terminated only with the approval of the Board of Trustees. Brokerage commissions, stamp duty fees, interest, taxes, acquired fund fees and expenses (if any), and extraordinary expenses are excluded from the expense cap. Without this cap, the Fund’s returns would have been lower. The expense ratio paid by an investor is the net expense ratio (the total annual fund operating expenses after fee waivers) as stated in the prospectuses. |
| 4 | The Morgan Stanley Capital International (MSCI) All Country World Index (ACWI) ex USA Index (Net) is a free-float-adjusted market-capitalization-weighted index that is designed to measure the equity market performance of developed markets, excluding the Unites States and Canada. Source: MSCI. MSCI makes no express or implied warranties or representations and shall have no liability whatsoever with respect to any MSCI data contained herein. The MSCI data may not be further redistributed or used as a basis for other indexes or any securities or financial products. This report is not approved, reviewed, or produced by MSCI. You cannot invest directly in an index. |
| 5 | The chart compares the performance of Class A shares for the most recent ten years with the MSCI ACWI ex USA Index (Net). The chart assumes a hypothetical investment of $10,000 in Class A shares and reflects all operating expenses and assumes the maximum initial sales charge of 5.75%. |
| 6 | The ten largest holdings, excluding cash, cash equivalents and any money market funds, are calculated based on the value of the investments divided by total net assets of the Fund. Holdings are subject to change and may have changed since the date specified. |
| 7 | Amounts are calculated based on the total long-term investments of the Fund. These amounts are subject to change and may have changed since the date specified. |
| 8 | The Purchasing Managers’ Index (PMI) is an indicator of economic health for manufacturing and service sectors. The purpose of the PMI is to provide information about current business conditions to company decision makers, analysts and purchasing managers. You cannot invest directly in an index. |
| 9 | The Citigroup Economic Surprise Indices are objective and quantitative measures of economic news. They are defined as weighted historical standard deviations of data surprises (actual releases vs Bloomberg survey median). A positive reading of the Economic Surprise Index suggests that economic releases have on balance [been] beating consensus. The indices are calculated daily in a rolling three-month window. The weights of economic indicators are derived from relative high-frequency spot FX impacts of 1 standard deviation data surprises. The indices also employ a time decay function to replicate the limited memory of markets. You cannot invest directly in an index. |
| * | This security was no longer held at the end of the reporting period. |
| | | | |
| 8 | | Wells Fargo International Equity Fund | | Performance highlights (unaudited) |
MANAGER’S DISCUSSION
Fund highlights
| ∎ | | The Fund underperformed the MSCI ACWI ex USA Index (Net), for the 12-month period that ended October 31, 2018. |
| ∎ | | Industrials, health care, and consumer discretionary stocks were relative performance laggards. Communication services, financials, materials, and energy stocks were notable positive contributors to performance. |
| ∎ | | The Fund remained overweight Europe, including overweights to Germany, the Netherlands, Italy, and Norway, which were offset by average underweights to Spain, Sweden, Switzerland, and France. The Fund was underweight Asia on a regional basis, including underweights to Japan, Australia, and Taiwan, offset by overweights to Malaysia, Hong Kong/China, and South Korea. |
Emerging and developed international markets underperformed versus U.S. equities.
Over the past year, we have witnessed a reversal for international equity market returns, with emerging markets as well as developed markets showing underperformance versus domestic U.S. equities. We continued to implement our fundamental research process that seeks to maximize attractive long-term international opportunities. Through our process we pursue nonconsensus values worldwide. We also focus on investment-risk management by marrying fundamental stock picking with macroeconomic and risk research. Our risk management approach is particularly important in an environment of sustained volatility across capital markets and continued differentiation between international developed and emerging equity markets versus U.S.-domiciled equities.
This past year’s market performance was underpinned by volatility across global capital markets, particularly in international equity and currency markets, with continued unsettled crosscurrents geopolitically and in domestic national politics. Under this backdrop of uncertainty, over the past quarter the U.S. dollar’s strength was apparent across cross rates—exchange rates between two currencies not including the U.S. dollar—in many developed markets and, especially, emerging markets. U.S. Treasury yields continued to appreciate with 10-year Treasury yields comfortably surpassing 3%. Commodity-market volatility remained high with Brent oil prices approaching $85 per barrel and gold prices stabilizing but copper and metals prices remaining weak.
| | | | |
| Ten largest holdings (%) as of October 31, 20186 | |
iShares MSCI ACWI ex US ETF | | | 4.01 | |
Muenchener Rueckversicherungs Gesellschaft AG | | | 3.70 | |
China Mobile Limited | | | 3.69 | |
Mitsubishi UFJ Financial Group Incorporated | | | 3.38 | |
Nomura Holdings Incorporated | | | 3.26 | |
Novartis AG | | | 3.26 | |
Cosan Limited Class A | | | 3.24 | |
John Wood Group plc | | | 3.19 | |
Orange SA | | | 3.19 | |
Daiwa Securities Group Incorporated | | | 3.14 | |
|
| Sector distribution as of October 31, 20187 |
|
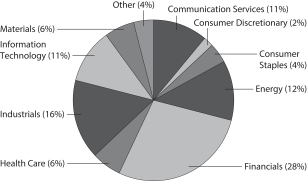
|
While political and macroeconomic considerations affected broad market behavior this past quarter, we continued to implement our investment and risk management process of finding nonconsensus undervalued equities, marrying core micro stock picking with macro risk management in each region of the globe. Notable exposures included undervalued financials in Europe and Asia, undervalued stocks of cyclical companies globally that are undertaking self-help measures to improve operations and results, and undervalued telecommunications companies that generate high levels of cash, particularly in emerging markets.
Portfolio currency hedges remain low relative to recent past periods because more economies around the world are recovering which is raising the potential future value of their currencies relative to others. Unlike in 2012 to 2016, we believe that currently there is less of a strong-U.S.-dollar policy. As such, the strategy currently has partial hedges of British pound exposure (net pound exposure below benchmark weight) and limited hedges versus the euro (net euro exposure exceeds benchmark weight).
Please see footnotes on page 7.
| | | | | | |
| Performance highlights (unaudited) | | Wells Fargo International Equity Fund | | | 9 | |
|
| Country allocation as of October 31, 20187 |
|
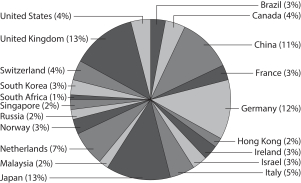
|
Top positive international country performance contributors included the Netherlands, the U.K., South Africa, South Korea, Hong Kong/China, Israel, and Malaysia. These gains were offset by holdings in Germany, Japan, Canada, France, and Australia.
The year’s sector performance reflected strong stock selection across several sectors. The communication services sector overweight had a number of top performers ranging from global business information services provider UBM Financial Corporation to domestically facing telecoms SK Telecom Company, Limited, and China Mobile Limited. UBM delivered strong results, benefiting from self-help restructuring as it transformed into a pure-play events
organizing business with the 2015 sale of its PR Newswire unit to Cision Limited and its acquisition of Allworld Exhibitions, a privately owned Asian exhibitions business, in 2016. UBM was acquired by Informa PLC in 2018.
Financials also contributed to relative performance with holdings in companies ranging from insurers, including NN Group N.V., Munich Re Group*, and Zurich Insurance Group Limited, to diversified financials companies, including Daiwa Securities Group Incorporated and Mitsubishi UFJ Financial Group, Incorporated, to banks, including CIMB Group Holdings Berhad and DNB ASA*. NN Group, a well-capitalized European life insurance company, performed on strong cash flow generation and management commitment to return excess capital to shareholders via dividends and stock buybacks. Materials sector performers included a number of self-help restructuring companies, such as OCI N.V. and Sasol Limited. OCI, a top-five global producer of nitrogen fertilizers, methanol, and other natural gas–based products for agricultural and industrial customers, appreciated as cash flow reached an inflection point. Sasol, a South African integrated chemicals and energy company, outperformed due to self-help and cyclical catalysts as its Lake Charles Chemical Project continues to be de-risked and as Brent traded above the three-year average.
Underperforming holdings over the course of last year included stocks in the industrials and health care sectors. Industrials stocks accounted for sector weakness, primarily in Europe, including Compagnie de Saint-Gobain S.A.*, Prysmian S.p.A., Siemens AG, and Rheinmetall AG. A large position in Compagnie de Saint-Gobain, a French building products company, suffered due to a number of headwinds in the first half of the year, including issues with its float glass and automotive plants as well as unfavorable currency movements. Stocks in the health care sector also underperformed, including holdings in Bayer AG and Shanghai Pharmaceuticals Holding Company, Limited. Bayer underperformed, and we trimmed the position based on a change in thesis post-disclosure of liabilities associated with recently acquired Monsanto Company’s legal risks surrounding Roundup weed killer.
We regularly maintain and update short-term outlooks out approximately two quarters and long-term outlooks out at least two years—pointing to a neutral outlook for the short-term and long-term. Our short-term outlook remains neutral with offsetting immediate tailwinds and headwinds during a period that is generally characterized by volatile equity markets. First, some leading economic indicators (PMI8 mixed, Citi Economic Surprise Indices9 weak) have adjusted downward in recent months. We continue to find signs of reasonable growth rebounding across selected developed and emerging economies. Second, while some key stock price ratios have narrowed in international and domestic equity sectors, the outlook for corporate earnings remains firm although earnings projections remain vulnerable to downward revisions should global trade volatility escalate, particularly in emerging markets. And third, business optimism continues to be supported by companies employing self-help strategies to improve operations and results and benefiting from positive cyclical changes in commodities and financial sectors overseas. We carefully track the effects of rising credit costs as reflected in rising sovereign interest rates and yield curves, and overall inflationary pressures as reflected in rising wages and commodity prices.
Our longer-term international outlook has recently moved from constructive to neutral for a number of reasons. First, global economies have been recovering from the depths of the 2013 to 2015 period, generally, although there are divergences between the U.S.—which is at a relatively late stage of recovery—compared with European, Japanese, and several emerging market countries. Signs of the passage of peak synchronized global growth are starting to appear. Second, while international central banks and public policy guidance continue to be accommodative, we recognize that U.S. monetary policy moved to tightening financial conditions while the quantitative easing programs of the European
Please see footnotes on page 7.
| | | | |
| 10 | | Wells Fargo International Equity Fund | | Performance highlights (unaudited) |
Central Bank and Bank of Japan are maturing with coincident increases in forward sovereign bond yields. Third, stock valuations have adjusted positively, particularly within the U.S. There is room for greater market valuation normalizations in international equity markets relative to their official sovereign and policy interest rates. We expect that rising tensions surrounding global trade and global public policy collaboration will underscore the importance of carefully selecting mispriced stocks that can achieve appreciation in shareholder total return through micro-level, company self-help initiatives.
Looking at long-term investment cycles globally, we believe that global capital markets are at the early stages of a rotation—and, ultimately, a reversal of long cyclical trends that have favored growth and momentum stock investing at the expense of nonconsensus value investing. We believe this to be especially true as the world benefits from added growth and experiences signs of inflation from firming employment, wage metrics, commodity prices, and, elevated sovereign interest rate volatility. We look forward to deploying a disciplined and flexible investment process, recognizing that the market volatility of recent months may be a harbinger of capital-market behavior for many quarters to come.
Please see footnotes on page 7.
| | | | | | |
| Fund expenses (unaudited) | | Wells Fargo International Equity Fund | | | 11 | |
As a shareholder of the Fund, you incur two types of costs: (1) transaction costs, including sales charges (loads) on purchase payments and contingent deferred sales charges (if any) on redemptions and (2) ongoing costs, including management fees, distribution (12b-1) and/or shareholder servicing fees, and other Fund expenses. This example is intended to help you understand your ongoing costs (in dollars) of investing in the Fund and to compare these costs with the ongoing costs of investing in other mutual funds.
The example is based on an investment of $1,000 invested at the beginning of the six-month period and held for the entire period from May 1, 2018 to October 31, 2018.
Actual expenses
The “Actual” line of the table below provides information about actual account values and actual expenses. You may use the information in this line, together with the amount you invested, to estimate the expenses that you paid over the period. Simply divide your account value by $1,000 (for example, an $8,600 account value divided by $1,000 = 8.6), then multiply the result by the number in the “Actual” line under the heading entitled “Expenses paid during period” for your applicable class of shares to estimate the expenses you paid on your account during this period.
Hypothetical example for comparison purposes
The “Hypothetical” line of the table below provides information about hypothetical account values and hypothetical expenses based on the Fund’s actual expense ratio and an assumed rate of return of 5% per year before expenses, which is not the Fund’s actual return. The hypothetical account values and expenses may not be used to estimate the actual ending account balance or expenses you paid for the period. You may use this information to compare the ongoing costs of investing in the Fund and other funds. To do so, compare this 5% hypothetical example with the 5% hypothetical examples that appear in the shareholder reports of the other funds.
Please note that the expenses shown in the table are meant to highlight your ongoing costs only and do not reflect any transactional costs, such as sales charges (loads) and contingent deferred sales charges. Therefore, the “Hypothetical” line of the table is useful in comparing ongoing costs only and will not help you determine the relative total costs of owning different funds. In addition, if these transactional costs were included, your costs would have been higher.
| | | | | | | | | | | | | | | | |
| | | Beginning
account value
5-1-2018 | | | Ending
account value
10-31-2018 | | | Expenses
paid during
the period¹ | | | Annualized net
expense ratio | |
Class A | | | | | | | | | | | | | | | | |
Actual | | $ | 1,000.00 | | | $ | 879.74 | | | $ | 5.40 | | | | 1.14 | % |
Hypothetical (5% return before expenses) | | $ | 1,000.00 | | | $ | 1,019.46 | | | $ | 5.80 | | | | 1.14 | % |
Class C | | | | | | | | | | | | | | | | |
Actual | | $ | 1,000.00 | | | $ | 876.52 | | | $ | 8.94 | | | | 1.89 | % |
Hypothetical (5% return before expenses) | | $ | 1,000.00 | | | $ | 1,015.68 | | | $ | 9.60 | | | | 1.89 | % |
Class R | | | | | | | | | | | | | | | | |
Actual | | $ | 1,000.00 | | | $ | 878.35 | | | $ | 6.58 | | | | 1.39 | % |
Hypothetical (5% return before expenses) | | $ | 1,000.00 | | | $ | 1,018.20 | | | $ | 7.07 | | | | 1.39 | % |
Class R6 | | | | | | | | | | | | | | | | |
Actual | | $ | 1,000.00 | | | $ | 880.70 | | | $ | 3.98 | | | | 0.84 | % |
Hypothetical (5% return before expenses) | | $ | 1,000.00 | | | $ | 1,020.97 | | | $ | 4.28 | | | | 0.84 | % |
Administrator Class | | | | | | | | | | | | | | | | |
Actual | | $ | 1,000.00 | | | $ | 879.60 | | | $ | 5.40 | | | | 1.14 | % |
Hypothetical (5% return before expenses) | | $ | 1,000.00 | | | $ | 1,019.46 | | | $ | 5.80 | | | | 1.14 | % |
Institutional Class | | | | | | | | | | | | | | | | |
Actual | | $ | 1,000.00 | | | $ | 880.70 | | | $ | 4.22 | | | | 0.89 | % |
Hypothetical (5% return before expenses) | | $ | 1,000.00 | | | $ | 1,020.72 | | | $ | 4.53 | | | | 0.89 | % |
| 1 | Expenses paid is equal to the annualized net expense ratio of each class multiplied by the average account value over the period, multiplied by the number of days in the most recent fiscal half-year divided by the number of days in the fiscal year (to reflect the one-half-year period). |
| | | | |
| 12 | | Wells Fargo International Equity Fund | | Portfolio of investments—October 31, 2018 |
| | | | | | | | | | | | | | | | |
| Security name | | | | | | | | Shares | | | Value | |
| | | | |
Common Stocks: 93.61% | | | | | | | | | | | | | | | | |
| | | | |
| Australia: 0.30% | | | | | | | | | | | | | | | | |
Origin Energy Limited (Energy, Oil, Gas & Consumable Fuels) † | | | | | | | | | | | 247,557 | | | $ | 1,277,992 | |
| | | | | | | | | | | | | | | | |
| | | | |
| Brazil: 3.24% | | | | | | | | | | | | | | | | |
Cosan Limited Class A (Energy, Oil, Gas & Consumable Fuels) | | | | | | | | | | | 1,660,751 | | | | 13,867,271 | |
| | | | | | | | | | | | | | | | |
| | | | |
| Canada: 3.96% | | | | | | | | | | | | | | | | |
Home Capital Group Incorporated (Financials, Thrifts & Mortgage Finance) †« | | | | | | | | | | | 658,700 | | | | 6,529,709 | |
Lundin Mining Corporation (Materials, Metals & Mining) | | | | | | | | | | | 2,526,045 | | | | 10,380,875 | |
| | | | |
| | | | | | | | | | | | | | | 16,910,584 | |
| | | | | | | | | | | | | | | | |
| | | | |
| China: 10.41% | | | | | | | | | | | | | | | | |
China Everbright Limited (Financials, Capital Markets) | | | | | | | | | | | 5,244,000 | | | | 9,268,338 | |
China Mobile Limited (Communication Services, Wireless Telecommunication Services) | | | | | | | | | | | 1,687,500 | | | | 15,773,341 | |
HollySys Automation Technologies Limited (Information Technology, Electronic Equipment, Instruments & Components) | | | | | | | | | | | 535,730 | | | | 10,296,731 | |
Shanghai Pharmaceuticals Holding Company Limited H Shares (Health Care, Health Care Providers & Services) | | | | | | | | | | | 4,140,200 | | | | 9,144,188 | |
| | | | |
| | | | | | | | | | | | | | | 44,482,598 | |
| | | | | | | | | | | | | | | | |
| | | | |
| France: 3.19% | | | | | | | | | | | | | | | | |
Orange SA (Communication Services, Diversified Telecommunication Services) | | | | | | | | | | | 870,537 | | | | 13,626,714 | |
| | | | | | | | | | | | | | | | |
| | | | |
| Germany: 11.48% | | | | | | | | | | | | | | | | |
Bayer AG (Health Care, Pharmaceuticals) | | | | | | | | | | | 27,667 | | | | 2,124,024 | |
Ceconomy AG (Consumer Discretionary, Specialty Retail) | | | | | | | | | | | 132,413 | | | | 677,599 | |
Metro AG (Consumer Staples, Food & Staples Retailing) | | | | | | | | | | | 370,413 | | | | 5,579,994 | |
Muenchener Rueckversicherungs Gesellschaft AG (Financials, Insurance) | | | | | | | | | | | 73,530 | | | | 15,819,754 | |
Rheinmetall AG (Industrials, Industrial Conglomerates) | | | | | | | | | | | 84,942 | | | | 7,363,882 | |
SAP SE (Information Technology, Software) | | | | | | | | | | | 71,606 | | | | 7,677,358 | |
Siemens AG (Industrials, Industrial Conglomerates) | | | | | | | | | | | 85,240 | | | | 9,820,773 | |
| | | | |
| | | | | | | | | | | | | | | 49,063,384 | |
| | | | | | | | | | | | | | | | |
| | | | |
| Hong Kong: 1.59% | | | | | | | | | | | | | | | | |
Xinyi Glass Holdings Limited (Consumer Discretionary, Auto Components) | | | | | | | | | | | 6,890,000 | | | | 6,817,998 | |
| | | | | | | | | | | | | | | | |
| | | | |
| Ireland: 2.79% | | | | | | | | | | | | | | | | |
Greencore Group plc (Consumer Staples, Food Products) | | | | | | | | | | | 4,925,296 | | | | 11,911,114 | |
| | | | | | | | | | | | | | | | |
| | | | |
| Israel: 2.80% | | | | | | | | | | | | | | | | |
Check Point Software Technologies Limited (Information Technology, Software) † | | | | | | | | | | | 107,657 | | | | 11,949,927 | |
| | | | | | | | | | | | | | | | |
| | | | |
| Italy: 4.67% | | | | | | | | | | | | | | | | |
Eni SpA (Energy, Oil, Gas & Consumable Fuels) | | | | | | | | | | | 456,097 | | | | 8,113,695 | |
Prysmian SpA (Industrials, Electrical Equipment) | | | | | | | | | | | 587,240 | | | | 11,413,761 | |
UniCredit SpA (Financials, Banks) | | | | | | | | | | | 33,732 | | | | 432,345 | |
| | | | |
| | | | | | | | | | | | | | | 19,959,801 | |
| | | | | | | | | | | | | | | | |
| | | | |
| Japan: 12.90% | | | | | | | | | | | | | | | | |
Daiwa Securities Group Incorporated (Financials, Capital Markets) | | | | | | | | | | | 2,343,800 | | | | 13,437,357 | |
Hitachi Limited (Information Technology, Electronic Equipment, Instruments & Components) | | | | | | | | | | | 433,000 | | | | 13,285,293 | |
Mitsubishi UFJ Financial Group Incorporated (Financials, Banks) | | | | | | | | | | | 2,383,600 | | | | 14,466,161 | |
Nomura Holdings Incorporated (Financials, Capital Markets) | | | | | | | | | | | 2,874,000 | | | | 13,945,274 | |
| | | | |
| | | | | | | | | | | | | | | 55,134,085 | |
| | | | | | | | | | | | | | | | |
The accompanying notes are an integral part of these financial statements.
| | | | | | |
| Portfolio of investments—October 31, 2018 | | Wells Fargo International Equity Fund | | | 13 | |
| | | | | | | | | | | | | | | | |
| Security name | | | | | | | | Shares | | | Value | |
| | | | |
| Malaysia: 1.92% | | | | | | | | | | | | | | | | |
CIMB Group Holdings Bhd (Financials, Banks) | | | | | | | | | | | 6,014,742 | | | $ | 8,221,848 | |
| | | | | | | | | | | | | | | | |
| | | | |
| Netherlands: 6.67% | | | | | | | | | | | | | | | | |
Koninklijke Philips NV (Industrials, Industrial Conglomerates) | | | | | | | | | | | 241,843 | | | | 9,017,564 | |
NN Group NV (Financials, Insurance) | | | | | | | | | | | 241,877 | | | | 10,410,559 | |
OCI NV (Materials, Chemicals) †« | | | | | | | | | | | 318,146 | | | | 9,059,153 | |
| | | | |
| | | | | | | | | | | | | | | 28,487,276 | |
| | | | | | | | | | | | | | | | |
| | | | |
| Norway: 2.46% | | | | | | | | | | | | | | | | |
Den Norske Bank ASA (Financials, Banks) | | | | | | | | | | | 581,852 | | | | 10,529,493 | |
| | | | | | | | | | | | | | | | |
| | | | |
| Russia: 1.83% | | | | | | | | | | | | | | | | |
Mobile TeleSystems PJSC ADR (Communication Services, Wireless Telecommunication Services) | | | | | | | | | | | 977,442 | | | | 7,829,310 | |
| | | | | | | | | | | | | | | | |
| | | | |
| Singapore: 2.19% | | | | | | | | | | | | | | | | |
Keppel Corporation Limited (Industrials, Industrial Conglomerates) | | | | | | | | | | | 2,093,700 | | | | 9,371,505 | |
| | | | | | | | | | | | | | | | |
| | | | |
| South Africa: 1.27% | | | | | | | | | | | | | | | | |
Sasol Limited (Materials, Chemicals) | | | | | | | | | | | 165,109 | | | | 5,416,896 | |
| | | | | | | | | | | | | | | | |
| | | | |
| South Korea: 3.33% | | | | | | | | | | | | | | | | |
Hana Financial Group Incorporated (Financials, Banks) | | | | | | | | | | | 85,143 | | | | 2,861,636 | |
Samsung Electronics Company Limited GDR (Information Technology, Technology Hardware, Storage & Peripherals) 144A | | | | | | | | | | | 2,549 | | | | 2,378,217 | |
SK Telecom Company Limited (Communication Services, Wireless Telecommunication Services) | | | | | | | | | | | 38,292 | | | | 9,005,532 | |
| | | | |
| | | | | | | | | | | | | | | 14,245,385 | |
| | | | | | | | | | | | | | | | |
| | | | |
| Switzerland: 3.79% | | | | | | | | | | | | | | | | |
Novartis AG (Health Care, Pharmaceuticals) | | | | | | | | | | | 159,112 | | | | 13,940,369 | |
Zurich Insurance Group AG (Financials, Insurance) | | | | | | | | | | | 7,236 | | | | 2,250,226 | |
| | | | |
| | | | | | | | | | | | | | | 16,190,595 | |
| | | | | | | | | | | | | | | | |
| | | | |
| United Kingdom: 12.82% | | | | | | | | | | | | | | | | |
BP plc (Energy, Oil, Gas & Consumable Fuels) | | | | | | | | | | | 1,738,495 | | | | 12,606,228 | |
John Wood Group plc (Energy, Energy Equipment & Services) | | | | | | | | | | | 1,492,903 | | | | 13,628,572 | |
Man Group plc (Financials, Capital Markets) | | | | | | | | | | | 4,242,452 | | | | 8,429,592 | |
Sensata Technologies Holding plc (Industrials, Electrical Equipment) † | | | | | | | | | | | 222,248 | | | | 10,423,431 | |
Smiths Group plc (Industrials, Industrial Conglomerates) | | | | | | | | | | | 495,920 | | | | 8,858,544 | |
Vodafone Group plc (Communication Services, Wireless Telecommunication Services) | | | | | | | | | | | 437,546 | | | | 826,715 | |
| | | | |
| | | | | | | | | | | | | | | 54,773,082 | |
| | | | | | | | | | | | | | | | |
| | | | |
Total Common Stocks (Cost $383,202,815) | | | | | | | | | | | | | | | 400,066,858 | |
| | | | | | | | | | | | | | | | |
| | | | |
Exchange-Traded Funds: 4.01% | | | | | | | | | | | | | | | | |
| | | | |
| United States: 4.01% | | | | | | | | | | | | | | | | |
iShares MSCI ACWI ex US ETF « | | | | | | | | | | | 390,400 | | | | 17,134,656 | |
| | | | | | | | | | | | | | | | |
| | | | |
Total Exchange-Traded Funds (Cost $16,970,331) | | | | | | | | | | | | | | | 17,134,656 | |
| | | | | | | | | | | | | | | | |
The accompanying notes are an integral part of these financial statements.
| | | | |
| 14 | | Wells Fargo International Equity Fund | | Portfolio of investments—October 31, 2018 |
| | | | | | | | | | | | | | | | |
| Security name | | Yield | | | | | | Shares | | | Value | |
| | | | |
Short-Term Investments: 7.25% | | | | | | | | | | | | | | | | |
| | | | |
| Investment Companies: 7.25% | | | | | | | | | | | | | | | | |
Securities Lending Cash Investments LLC (l)(r)(u) | | | 2.33 | % | | | | | | | 20,988,148 | | | $ | 20,990,246 | |
Wells Fargo Government Money Market Fund Select Class (l)(u) | | | 2.07 | | | | | | | | 10,009,651 | | | | 10,009,651 | |
| | | | |
Total Short-Term Investments (Cost $30,999,882) | | | | | | | | | | | | | | | 30,999,897 | |
| | | | | | | | | | | | | | | | |
| | | | | | | | |
| Total investments in securities (Cost $431,173,028) | | | 104.87 | % | | | 448,201,411 | |
Other assets and liabilities, net | | | (4.87 | ) | | | (20,827,360 | ) |
| | | | | | | | |
| Total net assets | | | 100.00 | % | | $ | 427,374,051 | |
| | | | | | | | |
| † | Non-income-earning security |
| « | All or a portion of this security is on loan. |
| 144A | The security may be resold in transactions exempt from registration, normally to qualified institutional buyers, pursuant to Rule 144A under the Securities Act of 1933. |
| (l) | The issuer of the security is an affiliated person of the Fund as defined in the Investment Company Act of 1940. |
| (r) | The investment is a non-registered investment company purchased with cash collateral received from securities on loan. |
| (u) | The rate represents the 7-day annualized yield at period end. |
Abbreviations:
| ADR | American depositary receipt |
| GDR | Global depositary receipt |
Forward Foreign Currency Contracts
| | | | | | | | | | | | | | |
Currency to be
received | | Currency to be
delivered | | Counterparty | | Settlement date | | Unrealized
gains | | | Unrealized
losses | |
| 22,989,327 USD | | 19,640,000 EUR | | Goldman Sachs | | 12-5-2018 | | $ | 685,773 | | | $ | 0 | |
| 28,831,041 USD | | 22,300,000 GBP | | Morgan Stanley | | 12-5-2018 | | | 285,436 | | | | 0 | |
| | | | | | | | | | | | | | |
| | | | | | | | $ | 971,209 | | | $ | 0 | |
| | | | | | | | | | | | | | |
Investments in Affiliates
An affiliated investment is an investment in which the Fund owns at least 5% of the outstanding voting shares of the issuer or as a result of other relationships, such as the Fund and the issuer having the same investment manager. Transactions with issuers that were either affiliated persons of the Fund at the beginning of the period or the end of the period were as follows:
| | | | | | | | | | | | | | | | | | | | | | | | | | | | | | | | | | | | |
| | | Shares,
beginning of
period | | | Shares
purchased | | | Shares
sold | | | Shares,
end of
period | | | Net
realized
gains
(losses) | | | Net
change in
unrealized
gains
(losses) | | | Income
from
affiliated
securities | | | Value,
end
of period | | | % of
net
assets | |
Short-Term Investments | | | | | | | | | | | | | | | | | | | | | | | | | | | | | | | | | | | | |
Investment Companies | | | | | | | | | | | | | | | | | | | | | | | | | | | | | | | | | | | | |
Securities Lending Cash Investments LLC | | | 2,149,231 | | | | 296,058,359 | | | | 277,219,442 | | | | 20,988,148 | | | $ | 13,554 | | | $ | 0 | | | $ | 502,727 | | | $ | 20,990,246 | | | | | |
Wells Fargo Government Money Market Fund Select Class | | | 32,495,353 | | | | 2,053,623,034 | | | | 2,076,108,736 | | | | 10,009,651 | | | | 0 | | | | 0 | | | | 276,077 | | | | 10,009,651 | | | | | |
| | | | | | | | | | | | | | | | | | | | | | | | | | | | | | | | | | | | |
| | | | | | | | | | | | | | | | | | $ | 13,554 | | | $ | 0 | | | $ | 778,804 | | | $ | 30,999,897 | | | | 7.25 | % |
| | | | | | | | | | | | | | | | | | | | | | | | | | | | | | | | | | | | |
The accompanying notes are an integral part of these financial statements.
| | | | | | |
| Statement of assets and liabilities—October 31, 2018 | | Wells Fargo International Equity Fund | | | 15 | |
| | | | |
| | | | |
| |
Assets | | | | |
Investments in unaffiliated securities (including $20,697,805 of securities loaned), at value (cost $400,173,146) | | $ | 417,201,514 | |
Investments in affiliated securities, at value (cost $30,999,882) | | | 30,999,897 | |
Foreign currency, at value (cost $409,143) | | | 403,688 | |
Receivable for investments sold | | | 3,279,883 | |
Receivable for Fund shares sold | | | 150,301 | |
Receivable for dividends | | | 1,965,826 | |
Receivable for securities lending income | | | 11,786 | |
Unrealized gains on forward foreign currency contracts | | | 971,209 | |
Prepaid expenses and other assets | | | 10,368 | |
| | | | |
Total assets | | | 454,994,472 | |
| | | | |
| |
Liabilities | | | | |
Payable upon receipt of securities loaned | | | 20,976,387 | |
Payable for investments purchased | | | 4,434,472 | |
Cash collateral due to broker | | | 1,030,000 | |
Payable for Fund shares redeemed | | | 432,888 | |
Management fee payable | | | 255,719 | |
Due to custodian bank | | | 190,000 | |
Administration fees payable | | | 52,047 | |
Distribution fees payable | | | 15,598 | |
Trustees’ fees and expenses payable | | | 558 | |
Accrued expenses and other liabilities | | | 232,752 | |
| | | | |
Total liabilities | | | 27,620,421 | |
| | | | |
Total net assets | | $ | 427,374,051 | |
| | | | |
| |
NET ASSETS CONSIST OF | | | | |
Paid-in capital | | $ | 406,585,359 | |
Total distributable earnings | | | 20,788,692 | |
| | | | |
Total net assets | | $ | 427,374,051 | |
| | | | |
| |
COMPUTATION OF NET ASSET VALUE AND OFFERING PRICE PER SHARE | | | | |
Net assets – Class A | | $ | 91,206,232 | |
Shares outstanding – Class A1 | | | 7,722,578 | |
Net asset value per share – Class A | | | $11.81 | |
Maximum offering price per share – Class A2 | | | $12.53 | |
Net assets – Class C | | $ | 22,962,618 | |
Shares outstanding – Class C1 | | | 1,984,842 | |
Net asset value per share – Class C | | | $11.57 | |
Net assets – Class R | | $ | 1,403,795 | |
Shares outstanding – Class R1 | | | 117,140 | |
Net asset value per share – Class R | | | $11.98 | |
Net assets – Class R6 | | $ | 63,414,074 | |
Shares outstanding – Class R61 | | | 5,376,905 | |
Net asset value per share – Class R6 | | | $11.79 | |
Net assets – Administrator Class | | $ | 5,152,261 | |
Shares outstanding – Administrator Class1 | | | 443,472 | |
Net asset value per share – Administrator Class | | | $11.62 | |
Net assets – Institutional Class | | $ | 243,235,071 | |
Shares outstanding – Institutional Class1 | | | 20,684,582 | |
Net asset value per share – Institutional Class | | | $11.76 | |
| 1 | The Fund has an unlimited number of authorized shares. |
| 2 | Maximum offering price is computed as 100/94.25 of net asset value. On investments of $50,000 or more, the offering price is reduced. |
The accompanying notes are an integral part of these financial statements.
| | | | |
| 16 | | Wells Fargo International Equity Fund | | Statement of operations—year ended October 31, 2018 |
| | | | |
| | | | |
| |
Investment income | | | | |
Dividends (net of foreign withholding taxes of $1,564,566) | | $ | 14,842,967 | |
Income from affiliated securities | | | 778,804 | |
| | | | |
Total investment income | | | 15,621,771 | |
| | | | |
| |
Expenses | | | | |
Management fee | | | 4,218,333 | |
Administration fees | | | | |
Class A | | | 227,891 | |
Class C | | | 60,615 | |
Class R | | | 3,949 | |
Class R6 | | | 20,985 | |
Administrator Class | | | 13,042 | |
Institutional Class | | | 360,866 | |
Shareholder servicing fees | | | | |
Class A | | | 271,298 | |
Class C | | | 72,160 | |
Class R | | | 4,701 | |
Administrator Class | | | 24,878 | |
Distribution fees | | | | |
Class C | | | 216,481 | |
Class R | | | 4,701 | |
Custody and accounting fees | | | 152,104 | |
Professional fees | | | 63,483 | |
Registration fees | | | 59,292 | |
Shareholder report expenses | | | 82,154 | |
Trustees’ fees and expenses | | | 22,663 | |
Other fees and expenses | | | 27,977 | |
| | | | |
Total expenses | | | 5,907,573 | |
Less: Fee waivers and/or expense reimbursements | | | (926,289 | ) |
| | | | |
Net expenses | | | 4,981,284 | |
| | | | |
Net investment income | | | 10,640,487 | |
| | | | |
| |
REALIZED AND UNREALIZED GAINS (LOSSES) ON INVESTMENTS | | | | |
| |
Net realized gains on: | | | | |
Unaffiliated securities | | | 9,147,726 | |
Affiliated securities | | | 13,554 | |
Forward foreign currency contracts | | | 1,618,568 | |
| | | | |
Net realized gains on investments | | | 10,779,848 | |
| | | | |
| |
Net change in unrealized gains (losses) on: | | | | |
Unaffiliated securities | | | (66,615,076 | ) |
Forward foreign currency contracts | | | 812,960 | |
| | | | |
Net change in unrealized gains (losses) on investments | | | (65,802,116 | ) |
| | | | |
Net realized and unrealized gains (losses) on investments | | | (55,022,268 | ) |
| | | | |
Net decrease in net assets resulting from operations | | $ | (44,381,781 | ) |
| | | | |
The accompanying notes are an integral part of these financial statements.
| | | | | | |
| Statement of changes in net assets | | Wells Fargo International Equity Fund | | | 17 | |
| | | | | | | | | | | | | | | | |
| | | Year ended
October 31, 2018 | | | Year ended
October 31, 20171 | |
| | | | |
Operations | | | | | | | | | | | | | | | | |
Net investment income | | | | | | $ | 10,640,487 | | | | | | | $ | 9,055,721 | |
Net realized gains on investments | | | | | | | 10,779,848 | | | | | | | | 22,026,162 | |
Net change in unrealized gains (losses) on investments | | | | | | | (65,802,116 | ) | | | | | | | 60,571,970 | |
| | | | |
Net increase (decrease) in net assets resulting from operations | | | | | | | (44,381,781 | ) | | | | | | | 91,653,853 | |
| | | | |
| | | | |
Distributions to shareholders from net investment income and net realized gains | | | | | | | | | | | | | | | | |
Class A | | | | | | | (3,952,000 | ) | | | | | | | (3,419,346 | ) |
Class B | | | | | | | N/A | | | | | | | | (8,853 | )2 |
Class C | | | | | | | (814,322 | ) | | | | | | | (543,400 | ) |
Class R | | | | | | | (59,089 | ) | | | | | | | (49,858 | ) |
Class R6 | | | | | | | (2,906,201 | ) | | | | | | | (681,611 | ) |
Administrator Class | | | | | | | (602,675 | ) | | | | | | | (583,495 | ) |
Institutional Class | | | | | | | (10,478,098 | ) | | | | | | | (6,175,331 | ) |
| | | | |
Total distributions to shareholders | | | | | | | (18,812,385 | ) | | | | | | | (11,461,894 | ) |
| | | | |
| | | | |
Capital share transactions | | | Shares | | | | | | | | Shares | | | | | |
Proceeds from shares sold | | | | | | | | | | | | | | | | |
Class A | | | 1,152,774 | | | | 15,432,689 | | | | 1,631,046 | | | | 19,984,132 | |
Class C | | | 341,521 | | | | 4,529,729 | | | | 398,900 | | | | 4,843,542 | |
Class R | | | 20,290 | | | | 272,361 | | | | 34,029 | | | | 414,621 | |
Class R6 | | | 706,610 | | | | 9,064,153 | | | | 5,473,610 | | | | 65,619,194 | |
Administrator Class | | | 84,981 | | | | 1,114,286 | | | | 659,302 | | | | 7,618,280 | |
Institutional Class | | | 9,238,916 | | | | 123,655,558 | | | | 10,000,651 | | | | 119,901,457 | |
| | | | |
| | | | | | | 154,068,776 | | | | | | | | 218,381,226 | |
| | | | |
Reinvestment of distributions | | | | | | | | | | | | | | | | |
Class A | | | 271,234 | | | | 3,601,626 | | | | 289,214 | | | | 3,207,383 | |
Class B | | | N/A | | | | N/A | | | | 801 | 2 | | | 8,812 | 2 |
Class C | | | 57,378 | | | | 751,083 | | | | 43,293 | | | | 472,331 | |
Class R | | | 889 | | | | 12,001 | | | | 1,205 | | | | 13,541 | |
Class R6 | | | 209,719 | | | | 2,777,828 | | | | 61,573 | | | | 681,611 | |
Administrator Class | | | 45,884 | | | | 600,531 | | | | 53,401 | | | | 582,070 | |
Institutional Class | | | 609,296 | | | | 8,034,503 | | | | 436,449 | | | | 4,818,398 | |
| | | | |
| | | | | | | 15,777,572 | | | | | | | | 9,784,146 | |
| | | | |
Payment for shares redeemed | | | | | | | | | | | | | | | | |
Class A | | | (1,867,405 | ) | | | (24,377,062 | ) | | | (4,793,391 | ) | | | (56,593,909 | ) |
Class B | | | N/A | | | | N/A | | | | (88,742 | )2 | | | (1,021,023 | )2 |
Class C | | | (616,504 | ) | | | (7,877,466 | ) | | | (782,261 | ) | | | (9,154,193 | ) |
Class R | | | (50,948 | ) | | | (658,133 | ) | | | (69,529 | ) | | | (831,199 | ) |
Class R6 | | | (1,076,925 | ) | | | (14,183,411 | ) | | | (59 | ) | | | (691 | ) |
Administrator Class | | | (1,064,217 | ) | | | (14,013,356 | ) | | | (2,647,963 | ) | | | (29,828,261 | ) |
Institutional Class | | | (6,845,893 | ) | | | (88,264,185 | ) | | | (9,276,734 | ) | | | (112,265,403 | ) |
| | | | |
| | | | | | | (149,373,613 | ) | | | | | | | (209,694,679 | ) |
| | | | |
Net increase in net assets resulting from capital share transactions | | | | | | | 20,472,735 | | | | | | | | 18,470,693 | |
| | | | |
Total increase (decrease) in net assets | | | | | | | (42,721,431 | ) | | | | | | | 98,662,652 | |
| | | | |
| | | | |
Net assets | | | | | | | | | | | | | | | | |
Beginning of period | | | | | | | 470,095,482 | | | | | | | | 371,432,830 | |
| | | | |
End of period | | | | | | $ | 427,374,051 | | | | | | | $ | 470,095,482 | |
| | | | |
| 1 | Effective for all filings after November 4, 2018, the SEC prospectively eliminated the requirement to parenthetically disclose undistributed net investment income at the end of the period and permitted the aggregation of distributions, with the exception of tax basis returns of capital. Undistributed net investment income at October 31, 2017 was $16,241,700. The disaggregated distributions information for the year ended October 31, 2017 is included in Note 8, Distributions to Shareholders, in the notes to the financial statements |
| 2 | For the period from November 1, 2016 to May 5, 2017. Effective at the close of business on May 5, 2017, Class B shares were converted to Class A shares and are no longer offered by the Fund. |
The accompanying notes are an integral part of these financial statements.
| | | | |
| 18 | | Wells Fargo International Equity Fund | | Financial highlights |
(For a share outstanding throughout each period)
| | | | | | | | | | | | | | | | | | | | |
| | | Year ended October 31 | |
| CLASS A | | 2018 | | | 2017 | | | 2016 | | | 2015 | | | 2014 | |
Net asset value, beginning of period | | | $13.43 | | | | $11.07 | | | | $11.53 | | | | $11.28 | | | | $11.98 | |
Net investment income | | | 0.27 | | | | 0.22 | | | | 0.22 | | | | 0.18 | 1 | | | 0.37 | 1 |
Net realized and unrealized gains (losses) on investments | | | (1.40 | ) | | | 2.47 | | | | (0.54 | ) | | | 0.57 | | | | (0.81 | ) |
| | | | | | | | | | | | | | | | | | | | |
Total from investment operations | | | (1.13 | ) | | | 2.69 | | | | (0.32 | ) | | | 0.75 | | | | (0.44 | ) |
Distributions to shareholders from | | | | | | | | | | | | | | | | | | | | |
Net investment income | | | (0.49 | ) | | | (0.33 | ) | | | (0.14 | ) | | | (0.50 | ) | | | (0.26 | ) |
Net asset value, end of period | | | $11.81 | | | | $13.43 | | | | $11.07 | | | | $11.53 | | | | $11.28 | |
Total return2 | | | (8.81 | )% | | | 24.91 | % | | | (2.76 | )% | | | 6.85 | % | | | (3.77 | )% |
Ratios to average net assets (annualized) | | | | | | | | | | | | | | | | | | | | |
Gross expenses | | | 1.39 | % | | | 1.47 | % | | | 1.47 | % | | | 1.53 | % | | | 1.53 | % |
Net expenses | | | 1.14 | % | | | 1.14 | % | | | 1.12 | % | | | 1.09 | % | | | 1.09 | % |
Net investment income | | | 1.97 | % | | | 1.82 | % | | | 2.04 | % | | | 1.50 | % | | | 3.14 | % |
Supplemental data | | | | | | | | | | | | | | | | | | | | |
Portfolio turnover rate | | | 62 | % | | | 59 | % | | | 65 | % | | | 27 | % | | | 32 | % |
Net assets, end of period (000s omitted) | | | $91,206 | | | | $109,655 | | | | $122,248 | | | | $145,654 | | | | $97,640 | |
| 1 | Calculated based upon average shares outstanding |
| 2 | Total return calculations do not include any sales charges. |
The accompanying notes are an integral part of these financial statements.
| | | | | | |
| Financial highlights | | Wells Fargo International Equity Fund | | | 19 | |
(For a share outstanding throughout each period)
| | | | | | | | | | | | | | | | | | | | |
| | | Year ended October 31 | |
| CLASS C | | 2018 | | | 2017 | | | 2016 | | | 2015 | | | 2014 | |
Net asset value, beginning of period | | | $13.13 | | | | $10.82 | | | | $11.30 | | | | $11.06 | | | | $11.75 | |
Net investment income | | | 0.15 | | | | 0.14 | | | | 0.14 | | | | 0.08 | 1 | | | 0.27 | 1 |
Net realized and unrealized gains (losses) on investments | | | (1.35 | ) | | | 2.40 | | | | (0.53 | ) | | | 0.57 | | | | (0.79 | ) |
| | | | | | | | | | | | | | | | | | | | |
Total from investment operations | | | (1.20 | ) | | | 2.54 | | | | (0.39 | ) | | | 0.65 | | | | (0.52 | ) |
Distributions to shareholders from | | | | | | | | | | | | | | | | | | | | |
Net investment income | | | (0.36 | ) | | | (0.23 | ) | | | (0.09 | ) | | | (0.41 | ) | | | (0.17 | ) |
Net asset value, end of period | | | $11.57 | | | | $13.13 | | | | $10.82 | | | | $11.30 | | | | $11.06 | |
Total return2 | | | (9.47 | )% | | | 23.91 | % | | | (3.43 | )% | | | 6.03 | % | | | (4.49 | )% |
Ratios to average net assets (annualized) | | | | | | | | | | | | | | | | | | | | |
Gross expenses | | | 2.14 | % | | | 2.22 | % | | | 2.22 | % | | | 2.28 | % | | | 2.28 | % |
Net expenses | | | 1.89 | % | | | 1.89 | % | | | 1.87 | % | | | 1.84 | % | | | 1.84 | % |
Net investment income | | | 1.22 | % | | | 1.26 | % | | | 1.33 | % | | | 0.72 | % | | | 2.37 | % |
Supplemental data | | | | | | | | | | | | | | | | | | | | |
Portfolio turnover rate | | | 62 | % | | | 59 | % | | | 65 | % | | | 27 | % | | | 32 | % |
Net assets, end of period (000s omitted) | | | $22,963 | | | | $28,919 | | | | $27,508 | | | | $29,080 | | | | $16,346 | |
| 1 | Calculated based upon average shares outstanding |
| 2 | Total return calculations do not include any sales charges. |
The accompanying notes are an integral part of these financial statements.
| | | | |
| 20 | | Wells Fargo International Equity Fund | | Financial highlights |
(For a share outstanding throughout each period)
| | | | | | | | | | | | | | | | | | | | |
| | | Year ended October 31 | |
| CLASS R | | 2018 | | | 2017 | | | 2016 | | | 2015 | | | 2014 | |
Net asset value, beginning of period | | | $13.58 | | | | $11.20 | | | | $11.66 | | | | $11.40 | | | | $11.96 | |
Net investment income | | | 0.23 | 1 | | | 0.20 | 1 | | | 0.19 | 1 | | | 0.15 | 1 | | | 0.32 | 1 |
Net realized and unrealized gains (losses) on investments | | | (1.41 | ) | | | 2.48 | | | | (0.53 | ) | | | 0.57 | | | | (0.79 | ) |
| | | | | | | | | | | | | | | | | | | | |
Total from investment operations | | | (1.18 | ) | | | 2.68 | | | | (0.34 | ) | | | 0.72 | | | | (0.47 | ) |
Distributions to shareholders from | | | | | | | | | | | | | | | | | | | | |
Net investment income | | | (0.42 | ) | | | (0.30 | ) | | | (0.12 | ) | | | (0.46 | ) | | | (0.09 | ) |
Net asset value, end of period | | | $11.98 | | | | $13.58 | | | | $11.20 | | | | $11.66 | | | | $11.40 | |
Total return | | | (9.03 | )% | | | 24.47 | % | | | (2.94 | )% | | | 6.53 | % | | | (4.00 | )% |
Ratios to average net assets (annualized) | | | | | | | | | | | | | | | | | | | | |
Gross expenses | | | 1.64 | % | | | 1.72 | % | | | 1.72 | % | | | 1.78 | % | | | 1.78 | % |
Net expenses | | | 1.39 | % | | | 1.39 | % | | | 1.37 | % | | | 1.34 | % | | | 1.34 | % |
Net investment income | | | 1.72 | % | | | 1.66 | % | | | 1.77 | % | | | 1.23 | % | | | 2.71 | % |
Supplemental data | | | | | | | | | | | | | | | | | | | | |
Portfolio turnover rate | | | 62 | % | | | 59 | % | | | 65 | % | | | 27 | % | | | 32 | % |
Net assets, end of period (000s omitted) | | | $1,404 | | | | $1,996 | | | | $2,029 | | | | $2,147 | | | | $1,576 | |
| 1 | Calculated based upon average shares outstanding |
The accompanying notes are an integral part of these financial statements.
| | | | | | |
| Financial highlights | | Wells Fargo International Equity Fund | | | 21 | |
(For a share outstanding throughout each period)
| | | | | | | | | | | | | | | | |
| | | Year ended October 31 | |
| CLASS R6 | | 2018 | | | 2017 | | | 2016 | | | 20151 | |
Net asset value, beginning of period | | | $13.44 | | | | $11.06 | | | | $11.49 | | | | $10.89 | |
Net investment income | | | 0.31 | | | | 0.45 | 2 | | | 0.24 | | | | 0.00 | 3 |
Net realized and unrealized gains (losses) on investments | | | (1.40 | ) | | | 2.27 | | | | (0.52 | ) | | | 0.60 | |
| | | | | | | | | | | | | | | | |
Total from investment operations | | | (1.09 | ) | | | 2.72 | | | | (0.28 | ) | | | 0.60 | |
Distributions to shareholders from | | | | | | | | | | | | | | | | |
Net investment income | | | (0.56 | ) | | | (0.34 | ) | | | (0.15 | ) | | | 0.00 | |
Net asset value, end of period | | | $11.79 | | | | $13.44 | | | | $11.06 | | | | $11.49 | |
Total return4 | | | (8.57 | )% | | | 25.30 | % | | | (2.46 | )% | | | 5.51 | % |
Ratios to average net assets (annualized) | | | | | | | | | | | | | | | | |
Gross expenses | | | 0.96 | % | | | 1.03 | % | | | 1.04 | % | | | 1.05 | % |
Net expenses | | | 0.84 | % | | | 0.84 | % | | | 0.85 | % | | | 0.88 | % |
Net investment income | | | 2.23 | % | | | 3.55 | % | | | 2.31 | % | | | 0.23 | % |
Supplemental data | | | | | | | | | | | | | | | | |
Portfolio turnover rate | | | 62 | % | | | 59 | % | | | 65 | % | | | 27 | % |
Net assets, end of period (000s omitted) | | | $63,414 | | | | $74,405 | | | | $26 | | | | $26 | |
| 1 | For the period from September 30, 2015 (commencement of class operations) to October 31, 2015 |
| 2 | Calculated based upon average shares outstanding |
| 3 | Amount is less than $0.005. |
| 4 | Returns for periods of less than one year are not annualized. |
The accompanying notes are an integral part of these financial statements.
| | | | |
| 22 | | Wells Fargo International Equity Fund | | Financial highlights |
(For a share outstanding throughout each period)
| | | | | | | | | | | | | | | | | | | | |
| | | Year ended October 31 | |
| ADMINISTRATOR CLASS | | 2018 | | | 2017 | | | 2016 | | | 2015 | | | 2014 | |
Net asset value, beginning of period | | | $13.20 | | | | $10.88 | | | | $11.33 | | | | $11.09 | | | | $11.79 | |
Net investment income | | | 0.20 | 1 | | | 0.21 | 1 | | | 0.22 | | | | 0.17 | 1 | | | 0.37 | 1 |
Net realized and unrealized gains (losses) on investments | | | (1.31 | ) | | | 2.43 | | | | (0.53 | ) | | | 0.57 | | | | (0.80 | ) |
| | | | | | | | | | | | | | | | | | | | |
Total from investment operations | | | (1.11 | ) | | | 2.64 | | | | (0.31 | ) | | | 0.74 | | | | (0.43 | ) |
Distributions to shareholders from | | | | | | | | | | | | | | | | | | | | |
Net investment income | | | (0.47 | ) | | | (0.32 | ) | | | (0.14 | ) | | | (0.50 | ) | | | (0.27 | ) |
Net asset value, end of period | | | $11.62 | | | | $13.20 | | | | $10.88 | | | | $11.33 | | | | $11.09 | |
Total return | | | (8.79 | )% | | | 24.84 | % | | | (2.71 | )% | | | 6.89 | % | | | (3.82 | )% |
Ratios to average net assets (annualized) | | | | | | | | | | | | | | | | | | | | |
Gross expenses | | | 1.31 | % | | | 1.39 | % | | | 1.38 | % | | | 1.40 | % | | | 1.37 | % |
Net expenses | | | 1.14 | % | | | 1.14 | % | | | 1.12 | % | | | 1.09 | % | | | 1.09 | % |
Net investment income | | | 1.53 | % | | | 1.79 | % | | | 1.93 | % | | | 1.44 | % | | | 3.21 | % |
Supplemental data | | | | | | | | | | | | | | | | | | | | |
Portfolio turnover rate | | | 62 | % | | | 59 | % | | | 65 | % | | | 27 | % | | | 32 | % |
Net assets, end of period (000s omitted) | | | $5,152 | | | | $18,174 | | | | $36,032 | | | | $52,469 | | | | $12,962 | |
| 1 | Calculated based upon average shares outstanding |
The accompanying notes are an integral part of these financial statements.
| | | | | | |
| Financial highlights | | Wells Fargo International Equity Fund | | | 23 | |
(For a share outstanding throughout each period)
| | | | | | | | | | | | | | | | | | | | |
| | | Year ended October 31 | |
| INSTITUTIONAL CLASS | | 2018 | | | 2017 | | | 2016 | | | 2015 | | | 2014 | |
Net asset value, beginning of period | | | $13.40 | | | | $11.05 | | | | $11.49 | | | | $11.25 | | | | $11.96 | |
Net investment income | | | 0.30 | 1 | | | 0.28 | 1 | | | 0.23 | | | | 0.19 | 1 | | | 0.37 | 1 |
Net realized and unrealized gains (losses) on investments | | | (1.39 | ) | | | 2.43 | | | | (0.52 | ) | | | 0.58 | | | | (0.77 | ) |
| | | | | | | | | | | | | | | | | | | | |
Total from investment operations | | | (1.09 | ) | | | 2.71 | | | | (0.29 | ) | | | 0.77 | | | | (0.40 | ) |
Distributions to shareholders from | | | | | | | | | | | | | | | | | | | | |
Net investment income | | | (0.55 | ) | | | (0.36 | ) | | | (0.15 | ) | | | (0.53 | ) | | | (0.31 | ) |
Net asset value, end of period | | | $11.76 | | | | $13.40 | | | | $11.05 | | | | $11.49 | | | | $11.25 | |
Total return | | | (8.56 | )% | | | 25.21 | % | | | (2.48 | )% | | | 7.07 | % | | | (3.53 | )% |
Ratios to average net assets (annualized) | | | | | | | | | | | | | | | | | | | | |
Gross expenses | | | 1.06 | % | | | 1.14 | % | | | 1.14 | % | | | 1.15 | % | | | 1.10 | % |
Net expenses | | | 0.89 | % | | | 0.89 | % | | | 0.87 | % | | | 0.84 | % | | | 0.84 | % |
Net investment income | | | 2.31 | % | | | 2.28 | % | | | 2.27 | % | | | 1.67 | % | | | 3.18 | % |
Supplemental data | | | | | | | | | | | | | | | | | | | | |
Portfolio turnover rate | | | 62 | % | | | 59 | % | | | 65 | % | | | 27 | % | | | 32 | % |
Net assets, end of period (000s omitted) | | | $243,235 | | | | $236,946 | | | | $182,639 | | | | $192,799 | | | | $63,766 | |
| 1 | Calculated based upon average shares outstanding |
The accompanying notes are an integral part of these financial statements.
| | | | |
| 24 | | Wells Fargo International Equity Fund | | Notes to financial statements |
1. ORGANIZATION
Wells Fargo Funds Trust (the “Trust”), a Delaware statutory trust organized on March 10, 1999, is an open-end management investment company registered under the Investment Company Act of 1940, as amended (the “1940 Act”). As an investment company, the Trust follows the accounting and reporting guidance in Financial Accounting Standards Board (“FASB”) Accounting Standards Codification Topic 946, Financial Services – Investment Companies. These financial statements report on the Wells Fargo International Equity Fund (the “Fund”) which is a diversified series of the Trust.
Effective at the close of business on May 5, 2017, Class B shares were converted to Class A shares and are no longer offered by the Fund. Information for Class B shares reflected in the financial statements represents activity through May 5, 2017.
2. SIGNIFICANT ACCOUNTING POLICIES
The following significant accounting policies, which are consistently followed in the preparation of the financial statements of the Fund, are in conformity with U.S. generally accepted accounting principles which require management to make estimates and assumptions that affect the reported amounts of assets and liabilities, disclosure of contingent assets and liabilities at the date of the financial statements, and the reported amounts of revenues and expenses during the reporting period. Actual results could differ from those estimates.
Securities valuation
All investments are valued each business day as of the close of regular trading on the New York Stock Exchange (generally 4 p.m. Eastern Time), although the Fund may deviate from this calculation time under unusual or unexpected circumstances.
Equity securities that are listed on a foreign or domestic exchange or market are valued at the official closing price or, if none, the last sales price. If no sale occurs on the principal exchange or market that day, a fair value price will be determined in accordance with the Fund’s Valuation Procedures.
The values of securities denominated in foreign currencies are translated into U.S. dollars at rates provided by an independent foreign currency pricing source at a time each business day specified by the Wells Fargo Asset Management Pricing Committee at Wells Fargo Funds Management, LLC (“Funds Management”).
Many securities markets and exchanges outside the U.S. close prior to the close of the New York Stock Exchange and therefore may not fully reflect trading or events that occur after the close of the principal exchange in which the foreign securities are traded, but before the close of the New York Stock Exchange. If such trading or events are expected to materially affect the value of such securities, then fair value pricing procedures approved by the Board of Trustees of the Fund are applied. These procedures take into account multiple factors including movements in U.S. securities markets after foreign exchanges close. Foreign securities that are fair valued under these procedures are categorized as Level 2 and the application of these procedures may result in transfers between Level 1 and Level 2. Depending on market activity, such fair valuations may be frequent. Such fair value pricing may result in net asset values that are higher or lower than net asset values based on the last reported sales price or latest quoted bid price. On October 31, 2018, such fair value pricing was not used in pricing foreign securities.
Investments in registered open-end investment companies are valued at net asset value. Interests in non-registered investment companies that are redeemable at net asset value are fair valued normally at net asset value.
Investments which are not valued using any of the methods discussed above are valued at their fair value, as determined in good faith by the Board of Trustees. The Board of Trustees has established a Valuation Committee comprised of the Trustees and has delegated to it the authority to take any actions regarding the valuation of portfolio securities that the Valuation Committee deems necessary or appropriate, including determining the fair value of portfolio securities, unless the determination has been delegated to the Wells Fargo Asset Management Pricing Committee. The Board of Trustees retains the authority to make or ratify any valuation decisions or approve any changes to the Valuation Procedures as it deems appropriate. On a quarterly basis, the Board of Trustees receives reports on any valuation actions taken by the Valuation Committee or the Wells Fargo Asset Management Pricing Committee which may include items for ratification.
Foreign currency translation
The accounting records of the Fund are maintained in U.S. dollars. The values of other assets and liabilities denominated in foreign currencies are translated into U.S. dollars at rates provided by an independent foreign currency pricing source at a time each business day specified by the Wells Fargo Asset Management Pricing Committee. Purchases and sales of securities, and income and expenses are converted at the rate of exchange on the respective dates of such transactions. Net realized foreign exchange gains or losses arise from sales of foreign currencies, currency gains or losses realized between the
| | | | | | |
| Notes to financial statements | | Wells Fargo International Equity Fund | | | 25 | |
trade and settlement dates on securities transactions, and the difference between the amounts of dividends, interest and foreign withholding taxes recorded and the U.S. dollar equivalent of the amounts actually paid or received. Net unrealized foreign exchange gains and losses arise from changes in the fair value of assets and liabilities other than investments in securities resulting from changes in exchange rates. The changes in net assets arising from changes in exchange rates of securities and the changes in net assets resulting from changes in market prices of securities are not separately presented. Such changes are included in net realized and unrealized gains or losses from investments.
Forward foreign currency contracts
The Fund is subject to foreign currency risk in the normal course of pursuing its investment objectives. A forward foreign currency contract is an agreement between two parties to purchase or sell a specific currency for an agreed-upon price at a future date. The Fund enters into forward foreign currency contracts to facilitate transactions in foreign-denominated securities and to attempt to minimize the risk to the Fund from adverse changes in the relationship between currencies. Forward foreign currency contracts are recorded at the forward rate and marked-to-market daily. When the contracts are closed, realized gains and losses arising from such transactions are recorded as realized gains or losses on forward foreign currency contracts. The Fund could be exposed to risks if the counterparties to the contracts are unable to meet the terms of their contracts or if the value of the foreign currency changes unfavorably. The Fund’s maximum risk of loss from counterparty credit risk is the unrealized gains on the contracts. This risk may be mitigated if there is a master netting arrangement between the Fund and the counterparty.
Securities lending
The Fund may lend its securities from time to time in order to earn additional income in the form of fees or interest on securities received as collateral or the investment of any cash received as collateral. The Fund continues to receive interest or dividends on the securities loaned. The Fund receives collateral in the form of cash or securities with a value at least equal to the value of the securities on loan. The value of the loaned securities is determined at the close of each business day and any additional required collateral is delivered to the Fund on the next business day. In a securities lending transaction, the net asset value of the Fund will be affected by an increase or decrease in the value of the securities loaned and by an increase or decrease in the value of the instrument in which collateral is invested. The amount of securities lending activity undertaken by the Fund fluctuates from time to time. In the event of default or bankruptcy by the borrower, the Fund may be prevented from recovering the loaned securities or gaining access to the collateral or may experience delays or costs in doing so. In addition, the investment of any cash collateral received may lose all or part of its value. The Fund has the right under the lending agreement to recover the securities from the borrower on demand.
The Fund lends its securities through an unaffiliated securities lending agent. Cash collateral received in connection with its securities lending transactions is invested in Securities Lending Cash Investments, LLC (the “Securities Lending Fund”). The Securities Lending Fund is exempt from registration under Section 3(c)(7) of the 1940 Act and is managed by Funds Management and is subadvised by Wells Capital Management Incorporated (“WellsCap”), an affiliate of Funds Management and an indirect wholly owned subsidiary of Wells Fargo & Company (“Wells Fargo”). Funds Management receives an advisory fee starting at 0.05% and declining to 0.01% as the average daily net assets of the Securities Lending Fund increase. All of the fees received by Funds Management are paid to WellsCap for its services as subadviser. The Securities Lending Fund seeks to provide a positive return compared to the daily Fed Funds Open Rate by investing in high-quality, U.S. dollar-denominated short-term money market instruments. Securities Lending Fund investments are valued at the evaluated bid price provided by an independent pricing service. Income earned from investment in the Securities Lending Fund, if any, is included in income from affiliated securities on the Statement of Operations.
Security transactions and income recognition
Securities transactions are recorded on a trade date basis. Realized gains or losses are recorded on the basis of identified cost.
Dividend income is recognized on the ex-dividend date, except for certain dividends from foreign securities, which are recorded as soon as the custodian verifies the ex-dividend date. Dividend income from foreign securities is recorded net of foreign taxes withheld where recovery of such taxes is not assured.
Income dividends and capital gain distributions from investment companies are recorded on the ex-dividend date. Capital gain distributions from investment companies are treated as realized gains.
Distributions to shareholders
Distributions to shareholders are recorded on the ex-dividend date and paid from net investment income quarterly and any net realized gains are paid at least annually. Such distributions are determined in accordance with income tax regulations and may differ from U.S. generally accepted accounting principles. Dividend sources are estimated at the
| | | | |
| 26 | | Wells Fargo International Equity Fund | | Notes to financial statements |
time of declaration. The tax character of distributions is determined as of the Fund’s fiscal year end. Therefore, a portion of the Fund’s distributions made prior to the Fund’s fiscal year end may be categorized as a tax return of capital at year end.
Federal and other taxes
The Fund intends to continue to qualify as a regulated investment company by distributing substantially all of its investment company taxable income and any net realized capital gains (after reduction for capital loss carryforwards) sufficient to relieve it from all, or substantially all, federal income taxes. Accordingly, no provision for federal income taxes was required.
The Fund’s income and federal excise tax returns and all financial records supporting those returns for the prior three fiscal years are subject to examination by the federal and Delaware revenue authorities. Management has analyzed the Fund’s tax positions taken on federal, state, and foreign tax returns for all open tax years and does not believe that there are any uncertain tax positions that require recognition of a tax liability.
As of October 31, 2018, the aggregate cost of all investments for federal income tax purposes was $437,758,551 and the unrealized gains (losses) consisted of:
| | | | |
Gross unrealized gains | | $ | 31,752,576 | |
Gross unrealized losses | | | (20,338,507 | ) |
Net unrealized gains | | $ | 11,414,069 | |
As of October 31, 2018, the Fund had capital loss carryforwards which consist of $1,038,637 in short-term capital losses.
Class allocations
The separate classes of shares offered by the Fund differ principally in applicable sales charges, distribution, shareholder servicing, and administration fees. Class specific expenses are charged directly to that share class. Investment income, common expenses, and realized and unrealized gains (losses) on investments are allocated daily to each class of shares based on the relative proportion of net assets of each class.
3. FAIR VALUATION MEASUREMENTS
Fair value measurements of investments are determined within a framework that has established a fair value hierarchy based upon the various data inputs utilized in determining the value of the Fund’s investments. The three-level hierarchy gives the highest priority to unadjusted quoted prices in active markets for identical assets or liabilities (Level 1) and the lowest priority to unobservable inputs (Level 3). The Fund’s investments are classified within the fair value hierarchy based on the lowest level of input that is significant to the fair value measurement. The inputs are summarized into three broad levels as follows:
| ∎ | | Level 1 – quoted prices in active markets for identical securities |
| ∎ | | Level 2 – other significant observable inputs (including quoted prices for similar securities, interest rates, prepayment speeds, credit risk, etc.) |
| ∎ | | Level 3 – significant unobservable inputs (including the Fund’s own assumptions in determining the fair value of investments) |
The inputs or methodologies used for valuing investments in securities are not necessarily an indication of the risk associated with investing in those securities.
| | | | | | |
| Notes to financial statements | | Wells Fargo International Equity Fund | | | 27 | |
The following is a summary of the inputs used in valuing the Fund’s assets and liabilities as of October 31, 2018:
| | | | | | | | | | | | | | | | |
| | | Quoted prices
(Level 1) | | | Other significant
observable inputs
(Level 2) | | | Significant
unobservable inputs
(Level 3) | | | Total | |
Assets | | | | | | | | | | | | | | | | |
Investments in: | | | | | | | | | | | | | | | | |
| | | | |
Common stocks | | | | | | | | | | | | | | | | |
Australia | | $ | 1,277,992 | | | $ | 0 | | | $ | 0 | | | $ | 1,277,992 | |
Brazil | | | 13,867,271 | | | | 0 | | | | 0 | | | | 13,867,271 | |
Canada | | | 16,910,584 | | | | 0 | | | | 0 | | | | 16,910,584 | |
China | | | 44,482,598 | | | | 0 | | | | 0 | | | | 44,482,598 | |
France | | | 13,626,714 | | | | 0 | | | | 0 | | | | 13,626,714 | |
Germany | | | 49,063,384 | | | | 0 | | | | 0 | | | | 49,063,384 | |
Hong Kong | | | 6,817,998 | | | | 0 | | | | 0 | | | | 6,817,998 | |
Ireland | | | 11,911,114 | | | | 0 | | | | 0 | | | | 11,911,114 | |
Israel | | | 11,949,927 | | | | 0 | | | | 0 | | | | 11,949,927 | |
Italy | | | 19,959,801 | | | | 0 | | | | 0 | | | | 19,959,801 | |
Japan | | | 55,134,085 | | | | 0 | | | | 0 | | | | 55,134,085 | |
Malaysia | | | 8,221,848 | | | | 0 | | | | 0 | | | | 8,221,848 | |
Netherlands | | | 28,487,276 | | | | 0 | | | | 0 | | | | 28,487,276 | |
Norway | | | 10,529,493 | | | | 0 | | | | 0 | | | | 10,529,493 | |
Russia | | | 7,829,310 | | | | 0 | | | | 0 | | | | 7,829,310 | |
Singapore | | | 9,371,505 | | | | 0 | | | | 0 | | | | 9,371,505 | |
South Africa | | | 5,416,896 | | | | 0 | | | | 0 | | | | 5,416,896 | |
South Korea | | | 14,245,385 | | | | 0 | | | | 0 | | | | 14,245,385 | |
Switzerland | | | 16,190,595 | | | | 0 | | | | 0 | | | | 16,190,595 | |
United Kingdom | | | 54,773,082 | | | | 0 | | | | 0 | | | | 54,773,082 | |
| | | | |
Exchange-traded funds | | | | | | | | | | | | | | | | |
United States | | | 17,134,656 | | | | 0 | | | | 0 | | | | 17,134,656 | |
| | | | |
Short-term investments | | | | | | | | | | | | | | | | |
Investment companies | | | 10,009,651 | | | | 20,990,246 | | | | 0 | | | | 30,999,897 | |
| | | | |
| | | 427,211,165 | | | | 20,990,246 | | | | 0 | | | | 448,201,411 | |
Forward foreign currency contracts | | | 0 | | | | 971,209 | | | | 0 | | | | 971,209 | |
Total assets | | $ | 427,211,165 | | | $ | 21,961,455 | | | $ | 0 | | | $ | 449,172,620 | |
Additional sector, industry or geographic detail is included in the Portfolio of Investments.
Forward foreign currency contracts are reported at their cumulative unrealized gains (losses) at measurement date as reported in the table following the Portfolio of Investments. All other assets and liabilities are reported at their market value at measurement date.
At October 31, 2018, the Fund did not have any transfers into/out of Level 3.
4. TRANSACTIONS WITH AFFILIATES
Management fee
Funds Management, an indirect wholly owned subsidiary of Wells Fargo, is the manager of the Fund and provides advisory and fund-level administrative services under an investment management agreement. Under the investment management agreement, Funds Management is responsible for, among other services, implementing the investment objectives and strategies of the Fund, supervising the subadviser and providing fund-level administrative services in connection with the Fund’s operations. As compensation for its services under the investment management agreement, Funds Management is entitled to receive an annual management fee starting at 0.85% and declining to 0.68% as the average daily net assets of the Fund increase. For the year ended October 31, 2018, the management fee was equivalent to an annual rate of 0.85% of the Fund’s average daily net assets.
Funds Management has retained the services of a subadviser to provide daily portfolio management to the Fund. The fee for subadvisory services is borne by Funds Management. WellsCap is the subadviser to the Fund and is entitled to receive a fee from Funds Management at an annual rate starting at 0.45% and declining to 0.40% as the average daily net assets of the Fund increase.
| | | | |
| 28 | | Wells Fargo International Equity Fund | | Notes to financial statements |
Administration fees
Under a class-level administration agreement, Funds Management provides class-level administrative services to the Fund, which includes paying fees and expenses for services provided by the transfer agent, sub-transfer agents, omnibus account servicers and record-keepers. As compensation for its services under the class-level administration agreement, Funds Management receives an annual fee which is calculated based on the average daily net assets of each class as follows:
| | | | |
| | | Class-level
administration fee | |
Class A, Class C, Class R | | | 0.21 | % |
Class R6 | | | 0.03 | |
Administrator Class, Institutional Class | | | 0.13 | |
Funds Management has contractually waived and/or reimbursed management and administration fees to the extent necessary to maintain certain net operating expense ratios for the Fund. When each class of the Fund has exceeded its expense cap, Funds Management has waived fees and/or reimbursed expenses from fund level expenses on a proportionate basis and then from class specific expenses; otherwise, waivers and/or reimbursements are applied against class specific expenses before fund level expenses. Funds Management has committed through February 28, 2019 to waive fees and/or reimburse expenses to the extent necessary to cap the Fund’s expenses at 1.14% for Class A shares, 1.89% for Class C shares, 1.39% for Class R shares, 0.84% for Class R6 shares, 1.14% for Administrator Class shares, and 0.89% for Institutional Class shares. After this time, the cap may be increased or the commitment to maintain the cap may be terminated only with the approval of the Board of Trustees.
Distribution fees
The Trust has adopted a distribution plan for Class C and Class R shares of the Fund pursuant to Rule 12b-1 under the 1940 Act. Distribution fees are charged to Class C and Class R shares and paid to Wells Fargo Funds Distributor, LLC (“Funds Distributor”), the principal underwriter, at an annual rate of 0.75% of the average daily net assets of Class C shares and 0.25% of the average daily net assets of Class R shares.
In addition, Funds Distributor is entitled to receive the front-end sales charge from the purchase of Class A shares and a contingent deferred sales charge on the redemption of certain Class A shares. Funds Distributor is also entitled to receive the contingent deferred sales charges from redemptions of Class C shares. For the year ended October 31, 2018, Funds Distributor received $14,842 from the sale of Class A shares and $272 in contingent deferred sales charges from redemptions of Class C shares. No contingent deferred sales charges were incurred by Class A shares for the year ended October 31, 2018.
Shareholder servicing fees
The Trust has entered into contracts with one or more shareholder servicing agents, whereby Class A, Class C, Class R and Administrator Class of the Fund are charged a fee at an annual rate of 0.25% of the average daily net assets of each respective class.
A portion of these total shareholder servicing fees were paid to affiliates of Wells Fargo.
Interfund transactions
The Fund may purchase or sell portfolio investment securities to certain other Wells Fargo affiliates pursuant to Rule 17a-7 under the 1940 Act and under procedures adopted by the Board of Trustees. The procedures have been designed to ensure that these interfund transactions, which do not incur broker commissions, are effected at current market prices.
5. INVESTMENT PORTFOLIO TRANSACTIONS
Purchases and sales of investments, excluding U.S. government obligations (if any) and short-term securities, for the year ended October 31, 2018 were $337,901,918 and $291,122,643, respectively.
6. DERIVATIVE TRANSACTIONS
During the year ended October 31, 2018, the Fund entered into forward foreign currency contracts for economic hedging purposes. The Fund had average contract amounts of $4,085,710 and $52,725,367 in forward foreign currency contracts to buy and forward foreign currency contracts to sell, respectively, during the year ended October 31, 2018.
The fair value, realized gains or losses and change in unrealized gains or losses, if any, on derivative instruments are reflected in the corresponding financial statement captions.
| | | | | | |
| Notes to financial statements | | Wells Fargo International Equity Fund | | | 29 | |
For certain types of derivative transactions, the Fund has entered into International Swaps and Derivatives Association, Inc. master agreements (“ISDA Master Agreements”) or similar agreements with approved counterparties. The ISDA Master Agreements or similar agreements may have requirements to deliver/deposit securities or cash to/with an exchange or broker-dealer as collateral and allows the Fund to offset, with each counterparty, certain derivative financial instrument’s assets and/or liabilities with collateral held or pledged. Collateral requirements differ by type of derivative. Collateral or margin requirements are set by the broker or exchange clearinghouse for exchange traded derivatives while collateral terms are contract specific for over-the-counter traded derivatives. Cash collateral that has been pledged to cover obligations of the Fund under ISDA Master Agreements or similar agreements, if any, are reported separately in the Statement of Assets and Liabilities. Securities pledged as collateral, if any, are noted in the Portfolio of Investments. With respect to balance sheet offsetting, absent an event of default by the counterparty or a termination of the agreement, the reported amounts of financial assets and financial liabilities in the Statement of Assets and Liabilities are not offset across transactions between the Fund and the applicable counterparty. A reconciliation of the gross amounts on the Statement of Assets and Liabilities to the net amounts by counterparty, including any collateral exposure, is as follows:
| | | | | | | | | | | | | | | | |
| Counterparty | | Gross amounts
of assets in the
Statement of
Assets and
Liabilities | | | Amounts
subject to
netting
agreements | | | Collateral
received | | | Net amount
of assets | |
Goldman Sachs | | | $685,773 | | | | $0 | | | $ | (560,000 | ) | | $ | 125,773 | |
Morgan Stanley | | | 285,436 | | | | 0 | | | | (285,436 | ) | | | 0 | |
7. BANK BORROWINGS
The Trust (excluding the money market funds), Wells Fargo Master Trust and Wells Fargo Variable Trust are parties to a $280,000,000 revolving credit agreement whereby the Fund is permitted to use bank borrowings for temporary or emergency purposes, such as to fund shareholder redemption requests. Interest under the credit agreement is charged to the Fund based on a borrowing rate equal to the higher of the Federal Funds rate in effect on that day plus 1.25% or the overnight LIBOR rate in effect on that day plus 1.25%. In addition, an annual commitment fee equal to 0.25% of the unused balance is allocated to each participating fund.
For the year ended October 31, 2018, there were no borrowings by the Fund under the agreement.
8. DISTRIBUTIONS TO SHAREHOLDERS
The tax character of distributions paid was $18,812,385 and $11,461,894 of ordinary income for the years ended October 31, 2018 and October 31, 2017, respectively.
As of October 31, 2018, the components of distributable earnings on a tax basis were as follows:
| | | | |
Undistributed ordinary income | | Unrealized gains | | Capital loss carryforward |
| $10,482,251 | | $11,383,182 | | $(1,038,637) |
Effective for all filings after November 4, 2018, the Securities and Exchange Commission eliminated the requirement to separately state the components of distributions to shareholders. The amounts of distributions to shareholders for the year ended October 31, 2017 were as follows:
| | | | |
| | | Net investment
income | |
Class A | | | $3,419,346 | |
Class B | | | 8,853 | * |
Class C | | | 543,400 | |
Class R | | | 49,858 | |
Class R6 | | | 681,611 | |
Administrator Class | | | 583,495 | |
Institutional Class | | | 6,175,331 | |
| * | For the period from November 1, 2016 to May 5, 2017. Effective at the close of business on May 5, 2017, Class B shares were converted to Class A shares and are no longer offered by the Fund. |
| | | | |
| 30 | | Wells Fargo International Equity Fund | | Notes to financial statements |
9. CONCENTRATION RISK
Concentration risk result from exposure to a limited number of sectors. A fund that invests a substantial portion of its assets in any sector may be more affected by changes in that sector than would be a fund whose investments are not heavily weighted in any sector.
10. INDEMNIFICATION
Under the Trust’s organizational documents, the officers and Trustees have been granted certain indemnification rights against certain liabilities that may arise out of performance of their duties to the Trust. Additionally, in the normal course of business, the Trust may enter into contracts with service providers that contain a variety of indemnification clauses. The Trust’s maximum exposure under these arrangements is dependent on future claims that may be made against the Fund and, therefore, cannot be estimated.
11. NEW ACCOUNTING PRONOUNCEMENT
In August 2018, FASB issued Accounting Standards Update (“ASU”) No. 2018-13, Fair Value Measurement (Topic 820) Disclosure Framework—Changes to the Disclosure Requirements for Fair Value Measurement. ASU 2018-13 updates the disclosure requirements for fair value measurements by modifying or removing certain disclosures and adding certain new disclosures. The amendments are effective for fiscal years, and interim periods within those fiscal years, beginning after December 15, 2019. Early adoption is permitted. Management has adopted the removal and modification of disclosures early, as permitted, and will adopt the additional new disclosures at the effective date.
| | | | | | |
| Report of independent registered public accounting firm | | Wells Fargo International Equity Fund | | | 31 | |
BOARD OF TRUSTEES AND SHAREHOLDERS OF WELLS FARGO FUNDS TRUST:
Opinion on the Financial Statements
We have audited the accompanying statement of assets and liabilities of Wells Fargo International Equity Fund (the “Fund”), one of the funds constituting Wells Fargo Funds Trust, including the portfolio of investments, as of October 31, 2018, the related statements of operations for the year then ended, the statements of changes in net assets for each of the years in the two-year period then ended, and the related notes (collectively, the “financial statements”) and the financial highlights for each of the years or periods in the five-year period then ended. In our opinion, the financial statements and financial highlights present fairly, in all material respects, the financial position of the Fund as of October 31, 2018, the results of its operations for the year then ended, the changes in its net assets for each of the years in the two-year period then ended, and the financial highlights for each of the years or periods in the five-year period then ended, in conformity with U.S. generally accepted accounting principles.
Basis for Opinion
These financial statements and financial highlights are the responsibility of the Fund’s management. Our responsibility is to express an opinion on these financial statements and financial highlights based on our audits. We are a public accounting firm registered with the Public Company Accounting Oversight Board (United States) (“PCAOB”) and are required to be independent with respect to the Fund in accordance with the U.S. federal securities laws and the applicable rules and regulations of the Securities and Exchange Commission and the PCAOB.
We conducted our audits in accordance with the standards of the PCAOB. Those standards require that we plan and perform the audit to obtain reasonable assurance about whether the financial statements and financial highlights are free of material misstatement, whether due to error or fraud. Our audits included performing procedures to assess the risks of material misstatement of the financial statements and financial highlights, whether due to error or fraud, and performing procedures that respond to those risks. Such procedures included examining, on a test basis, evidence regarding the amounts and disclosures in the financial statements and financial highlights. Such procedures also included confirmation of securities owned as of October 31, 2018, by correspondence with the custodian and brokers, or by other appropriate auditing procedures. Our audits also included evaluating the accounting principles used and significant estimates made by management, as well as evaluating the overall presentation of the financial statements and financial highlights. We believe that our audits provide a reasonable basis for our opinion.

We have not been able to determine the specific year that we began serving as the auditor of one or more Wells Fargo Funds investment companies, however we are aware that we have served as the auditor of one or more Wells Fargo Funds investment companies since at least 1955.
Boston, Massachusetts
December 21, 2018
| | | | |
| 32 | | Wells Fargo International Equity Fund | | Other information (unaudited) |
TAX INFORMATION
For corporate shareholders, pursuant to Section 854 of the Internal Revenue Code, 3.83% of ordinary income dividends qualify for the corporate dividends-received deduction for the fiscal year ended October 31, 2018.
Pursuant to Section 854 of the Internal Revenue Code, $12,755,801 of income dividends paid during the fiscal year ended October 31, 2018 has been designated as qualified dividend income (QDI).
For the fiscal year ended October 31, 2018, $365,340 has been designated as interest-related dividends for nonresident alien shareholders pursuant to Section 871 of the Internal Revenue Code.
Pursuant to Section 853 of the Internal Revenue Code, the Fund expects to designate amounts as foreign taxes paid for the fiscal year ended October 31, 2018. Additional details will be available in the semiannual report.
PROXY VOTING INFORMATION
A description of the policies and procedures that the Fund uses to determine how to vote proxies relating to portfolio securities is available, upon request, by calling 1-800-222-8222, visiting our website at wellsfargofunds.com, or visiting the SEC website at sec.gov. Information regarding how the Fund voted proxies relating to portfolio securities during the most recent 12-month period ended June 30 is available on the Fund’s website at wellsfargofunds.com or by visiting the SEC website at sec.gov.
PORTFOLIO HOLDINGS INFORMATION
The complete portfolio holdings for the Fund are publicly available monthly on the Fund’s website (wellsfargofunds.com), on a one-month delayed basis. In addition, top ten holdings information (excluding derivative positions) for the Fund is publicly available on the Fund’s website on a monthly, seven-day or more delayed basis. The Fund files its complete schedule of portfolio holdings with the SEC for the first and third quarters of each fiscal year on Form N-Q, which is available by visiting the SEC website at sec.gov. In addition, the Fund’s Form N-Q may be reviewed and copied at the SEC’s Public Reference Room in Washington, DC, and at regional offices in New York City, at 233 Broadway, and in Chicago, at 175 West Jackson Boulevard, Suite 900. Information about the Public Reference Room may be obtained by calling 1-800-SEC-0330.
| | | | | | |
| Other information (unaudited) | | Wells Fargo International Equity Fund | | | 33 | |
BOARD OF TRUSTEES AND OFFICERS
Each of the Trustees and Officers1 listed in the table below acts in identical capacities for each fund in the Wells Fargo family of funds, which consists of 152 mutual funds comprising the Wells Fargo Funds Trust, Wells Fargo Variable Trust, Wells Fargo Master Trust and four closed-end funds (collectively the “Fund Complex”). This table should be read in conjunction with the Prospectus and the Statement of Additional Information2. The mailing address of each Trustee and Officer is 525 Market Street, 12th Floor, San Francisco, CA 94105. Each Trustee and Officer serves an indefinite term, however, each Trustee serves such term until reaching the mandatory retirement age established by the Trustees.
Independent Trustees
| | | | | | |
Name and year of birth | | Position held and length of service* | | Principal occupations during past five years or longer | | Current other
public company or
investment company
directorships |
William R. Ebsworth (Born 1957) | | Trustee, since 2015 | | Retired. From 1984 to 2013, equities analyst, portfolio manager, research director and chief investment officer at Fidelity Management and Research Company in Boston, Tokyo, and Hong Kong, and retired in 2013 as Chief Investment Officer of Fidelity Strategic Advisers, Inc. where he led a team of investment professionals managing client assets. Prior thereto, Board member of Hong Kong Securities Clearing Co., Hong Kong Options Clearing Corp., the Thailand International Fund, Ltd., Fidelity Investments Life Insurance Company, and Empire Fidelity Investments Life Insurance Company. Board member of the Vincent Memorial Hospital Endowment (non-profit organization), where he serves on the Investment Committee and as a Chair of the Audit Committee. Mr. Ebsworth is a CFA® charterholder. | | N/A |
Jane A. Freeman (Born 1953) | | Trustee, since 2015; Chair Liaison, since 2018 | | Retired. From 2012 to 2014 and 1999 to 2008, Chief Financial Officer of Scientific Learning Corporation. From 2008 to 2012, Ms. Freeman provided consulting services related to strategic business projects. Prior to 1999, Portfolio Manager at Rockefeller & Co. and Scudder, Stevens & Clark. Board member of the Harding Loevner Funds from 1996 to 2014, serving as both Lead Independent Director and chair of the Audit Committee. Board member of the Russell Exchange Traded Funds Trust from 2011 to 2012 and the chair of the Audit Committee. Ms. Freeman is a Board Member of The Ruth Bancroft Garden (non-profit organization). She is also an inactive Chartered Financial Analyst. | | N/A |
Isaiah Harris, Jr.3 (Born 1952) | | Trustee, since 2009 | | Retired. Chairman of the Board of CIGNA Corporation since 2009, and Director since 2005. From 2003 to 2011, Director of Deluxe Corporation. Prior thereto, President and CEO of BellSouth Advertising and Publishing Corp. from 2005 to 2007, President and CEO of BellSouth Enterprises from 2004 to 2005 and President of BellSouth Consumer Services from 2000 to 2003. Emeritus member of the Iowa State University Foundation Board of Governors. Emeritus Member of the Advisory Board of Iowa State University School of Business. Advisory Board Member, Palm Harbor Academy (private school). Advisory Board Member, Child Evangelism Fellowship (non-profit). Mr. Harris is a certified public accountant (inactive status). | | CIGNA Corporation |
Judith M. Johnson3 (Born 1949) | | Trustee, since 2008; Audit Committee Chairman, since 2009 | | Retired. Prior thereto, Chief Executive Officer and Chief Investment Officer of Minneapolis Employees Retirement Fund from 1996 to 2008. Ms. Johnson is an attorney, certified public accountant and a certified managerial accountant. | | N/A |
David F. Larcker (Born 1950) | | Trustee, since 2009 | | James Irvin Miller Professor of Accounting at the Graduate School of Business, Stanford University, Director of the Corporate Governance Research Initiative and Senior Faculty of The Rock Center for Corporate Governance since 2006. From 2005 to 2008, Professor of Accounting at the Graduate School of Business, Stanford University. Prior thereto, Ernst & Young Professor of Accounting at The Wharton School, University of Pennsylvania from 1985 to 2005. | | N/A |
| | | | |
| 34 | | Wells Fargo International Equity Fund | | Other information (unaudited) |
| | | | | | |
Name and year of birth | | Position held and length of service* | | Principal occupations during past five years or longer | | Current other
public company or
investment company
directorships |
Olivia S. Mitchell (Born 1953) | | Trustee, since 2006; Nominating and Governance Committee Chairman, since 2018 | | International Foundation of Employee Benefit Plans Professor, Wharton School of the University of Pennsylvania since 1993. Director of Wharton’s Pension Research Council and Boettner Center on Pensions & Retirement Research, and Research Associate at the National Bureau of Economic Research. Previously, Cornell University Professor from 1978 to 1993. | | N/A |
Timothy J. Penny (Born 1951) | | Trustee, since 1996; Chairman, since 2018; Vice Chairman, from 2017 to 2018 | | President and Chief Executive Officer of Southern Minnesota Initiative Foundation, a non-profit organization, since 2007. Member of the Board of Trustees of NorthStar Education Finance, Inc., a non-profit organization, since 2007. | | N/A |
James G. Polisson (Born 1959) | | Trustee, since 2018; Advisory Board Member, from 2017 to 2018 | | Retired. Chief Marketing Officer, Source (ETF) UK Services, Ltd, from 2015 to 2017. From 2012 to 2015, Principal of The Polisson Group, LLC, a management consulting, corporate advisory and principal investing company. Chief Executive Officer and Managing Director at Russell Investments, Global Exchange Traded Funds from 2010 to 2012. Managing Director of Barclays Global Investors from 1998 to 2010 and Global Chief Marketing Officer for iShares and Barclays Global Investors from 2000 to 2010. Trustee of the San Francisco Mechanics’ Institute, a non-profit organization, from 2013 to 2015. Board member of the Russell Exchange Traded Fund Trust from 2011 to 2012. Director of Barclays Global Investors Holdings Deutschland GmbH from 2006 to 2009. Mr. Polisson is an attorney and has a retired status with the Massachusetts and District of Columbia Bar Associations. | | N/A |
Michael S. Scofield4 (Born 1943) | | Trustee, since 2010 | | Served on the Investment Company Institute’s Board of Governors and Executive Committee from 2008-2011 as well the Governing Council of the Independent Directors Council from 2006-2011 and the Independent Directors Council Executive Committee from 2008-2011. Trustee of the Evergreen Fund complex (and its predecessors) from 1984 to 2010. Chairman of the Evergreen Funds from 2000-2010. Former Trustee of the Mentor Funds. Retired Attorney, Law Offices of Michael S. Scofield. | | N/A |
Pamela Wheelock (Born 1959) | | Trustee, since 2018; Advisory Board Member, from 2017 to 2018 | | Chief Operating Officer, Twin Cities Habitat for Humanity, since January, 2017. Vice President of University Services, University of Minnesota from 2012 to 2017. Prior thereto, on the Board of Directors, Governance Committee and Finance Committee for the Minnesota Philanthropy Partners (Saint Paul Foundation) from 2012 to 2018, Interim President and Chief Executive Officer of Blue Cross Blue Shield of Minnesota from 2010 to 2011, Chairman of the Board from 2009 to 2011 and Board Director from 2003 to 2015. Vice President, Leadership and Community Engagement, Bush Foundation, Saint Paul, Minnesota (a private foundation) from 2009 to 2011. Executive Vice President and Chief Financial Officer, Minnesota Sports and Entertainment from 2004 to 2009 and Senior Vice President from 2002 to 2004. Commissioner of Finance, State of Minnesota, from 1999 to 2002. Currently the Board Chair of the Minnesota Wild Foundation since 2010. | | N/A |
| * | Length of service dates reflect the Trustee’s commencement of service with the Trust’s predecessor entities, where applicable. |
| | | | | | |
| Other information (unaudited) | | Wells Fargo International Equity Fund | | | 35 | |
Officers
| | | | | | |
Name and year of birth | | Position held and
length of service | | Principal occupations during past five years or longer | | |
Andrew Owen (Born 1960) | | President, since 2017 | | Executive Vice President of Wells Fargo & Company and Head of Affiliated Managers, Wells Fargo Asset Management, since 2014. In addition, Mr. Owen is currently President, Chief Executive Officer and Director of Wells Fargo Funds Management, LLC since 2017. Prior thereto, Executive Vice President responsible for marketing, investments and product development for Wells Fargo Funds Management, LLC, from 2009 to 2014. | | |
Jeremy DePalma1 (Born 1974) | | Treasurer, since 2012 | | Senior Vice President of Wells Fargo Funds Management, LLC since 2009. Senior Vice President of Evergreen Investment Management Company, LLC from 2008 to 2010 and head of the Fund Reporting and Control Team within Fund Administration from 2005 to 2010. | | |
Alexander Kymn (Born 1973) | | Secretary, since 2018; Chief Legal Officer, since 2018 | | Senior Company Counsel of Wells Fargo Bank, N.A. since 2018 (previously Senior Counsel from 2007 to 2018). Vice President of Wells Fargo Funds Management, LLC from 2008 to 2014. | | |
Michael H. Whitaker (Born 1967) | | Chief Compliance Officer, since 2016 | | Senior Vice President and Chief Compliance Officer since 2016. Senior Vice President and Chief Compliance Officer for Fidelity Investments from 2007 to 2016. | | |
David Berardi (Born 1975) | | Assistant Treasurer, since 2009 | | Vice President of Wells Fargo Funds Management, LLC since 2009. Vice President of Evergreen Investment Management Company, LLC from 2008 to 2010. Manager of Fund Reporting and Control for Evergreen Investment Management Company, LLC from 2004 to 2010. | | |
| 1 | Jeremy DePalma acts as Treasurer of 76 funds and Assistant Treasurer of 76 funds in the Fund Complex. |
| 2 | The Statement of Additional Information includes additional information about the Trustees and is available, without charge, upon request, by calling 1-800-222-8222 or by visiting the website at wellsfargofunds.com. |
| 3 | Mr. Harris will replace Ms. Johnson as the Chairman of the Audit Committee effective January 1, 2019. |
| 4 | Mr. Scofield is expected to retire on December 31, 2018. |
| | | | |
| 36 | | Wells Fargo International Equity Fund | | Other information (unaudited) |
BOARD CONSIDERATION OF INVESTMENT MANAGEMENT AND SUB-ADVISORY AGREEMENTS:
Wells Fargo International Equity Fund
Under the Investment Company Act of 1940 (the “1940 Act”), the Board of Trustees (the “Board”) of Wells Fargo Funds Trust (the “Trust”) must determine annually whether to approve the continuation of the Trust’s investment management and sub-advisory agreements. In this regard, at an in-person meeting held on May 22-23, 2018 (the “Meeting”), the Board, all the members of which have no direct or indirect interest in the investment management and sub-advisory agreements and are not “interested persons” of the Trust, as defined in the 1940 Act (the “Independent Trustees”), reviewed and approved for Wells Fargo International Equity Fund (the “Fund”): (i) an investment management agreement (the “Management Agreement”) with Wells Fargo Funds Management, LLC (“Funds Management”); and (ii) an investment sub-advisory agreement (the “Sub-Advisory Agreement”) with Wells Capital Management Incorporated (the “Sub-Adviser”), an affiliate of Funds Management. The Management Agreement and the Sub-Advisory Agreement are collectively referred to as the “Advisory Agreements.”
At the Meeting, the Board considered the factors and reached the conclusions described below relating to the selection of Funds Management and the Sub-Adviser and the approval of the Advisory Agreements. Prior to the Meeting, including at an in-person meeting in April 2018, the Trustees conferred extensively among themselves and with representatives of Funds Management about these matters. Also, the Board has adopted a team-based approach, with each team consisting of a sub-set of Trustees, to assist the full Board in the discharge of its duties in reviewing investment performance and other matters throughout the year. The Independent Trustees were assisted in their evaluation of the Advisory Agreements by independent legal counsel, from whom they received separate legal advice and with whom they met separately.
In providing information to the Board, Funds Management and the Sub-Adviser were guided by a detailed set of requests for information submitted to them by independent legal counsel on behalf of the Independent Trustees at the start of the Board’s annual contract renewal process earlier in 2018. In considering and approving the Advisory Agreements, the Trustees considered the information they believed relevant, including but not limited to the information discussed below. The Board considered not only the specific information presented in connection with the Meeting, but also the knowledge gained over time through interaction with Funds Management and the Sub-Adviser about various topics. In this regard, the Board reviewed reports of Funds Management at each of its quarterly meetings, which included, among other things, portfolio reviews and investment performance reports. In addition, the Board and the teams mentioned above confer with portfolio managers at various times throughout the year. The Board did not identify any particular information or consideration that was all-important or controlling, and each individual Trustee may have attributed different weights to various factors.
After its deliberations, the Board unanimously approved the continuation of the Advisory Agreements for a one-year term and determined that the compensation payable to Funds Management and the Sub-Adviser under each of the Advisory Agreements was reasonable. The Board considered the approval of the Advisory Agreements for the Fund as part of its consideration of agreements for funds across the complex, but its approvals were made on a fund-by-fund basis. The following summarizes a number of important, but not necessarily all, factors considered by the Board in support of its approvals.
Nature, extent and quality of services
The Board received and considered various information regarding the nature, extent and quality of services provided to the Fund by Funds Management and the Sub-Adviser under the Advisory Agreements. This information included a description of the investment advisory services and Fund-level administrative services covered by the Management Agreement, as well as, among other things, a summary of the background and experience of senior management of Wells Fargo Asset Management (“WFAM”), of which Funds Management and the Sub-Adviser are a part, a summary of investments made in the business of WFAM, a summary of certain organizational and personnel changes involving Funds Management and the Sub-Adviser, and a description of Funds Management’s and the Sub-Adviser’s business continuity planning programs and of their approaches to data privacy and cybersecurity. The Board also considered the qualifications, background, tenure and responsibilities of each of the portfolio managers primarily responsible for the day-to-day portfolio management of the Fund.
The Board evaluated the ability of Funds Management and the Sub-Adviser to attract and retain qualified investment professionals, including research, advisory and supervisory personnel. The Board further considered the compliance programs and compliance records of Funds Management and the Sub-Adviser. In addition, the Board took into account the full range of services provided to the Fund by Funds Management and its affiliates.
| | | | | | |
| Other information (unaudited) | | Wells Fargo International Equity Fund | | | 37 | |
Fund investment performance and expenses
The Board considered the investment performance results for the Fund over various time periods ended December 31, 2017. The Board considered these results in comparison to the investment performance of funds in a universe that was determined by Broadridge Inc. (“Broadridge”) to be similar to the Fund (the “Universe”), and in comparison to the Fund’s benchmark index and to other comparative data. Broadridge is an independent provider of investment company data. The Board received a description of the methodology used by Broadridge to select the mutual funds in the performance Universe. The Board noted that the investment performance of the Fund (Class A) was higher than the average investment performance of the Universe for all periods under review. The Board also noted that the investment performance of the Fund was higher than or in range of its benchmark index, the MSCI ACWI Index, for the three-, five-, and ten-year periods under review, but lower than its benchmark for the one-year period under review.
The Board also received and considered information regarding the Fund’s net operating expense ratios and their various components, including actual management fees, custodian and other non-management fees, and Rule 12b-1 and non-Rule 12b-1 shareholder service fees. The Board considered these ratios in comparison to the median ratios of funds in class-specific expense groups that were determined by Broadridge to be similar to the Fund (the “Groups”). The Board received a description of the methodology used by Broadridge to select the mutual funds in the expense Groups and an explanation of how funds comprising expense groups and their expense ratios may vary from year-to-year. Based on the Broadridge reports, the Board noted that the net operating expense ratios of the Fund were lower than or in range of the median net operating expense ratios of the expense Groups for each share class. The Board noted that the net operating expense ratio caps for the Fund’s Institutional Class and Class R6 would be reduced.
The Board took into account the Fund’s investment performance and expense information provided to it among the factors considered in deciding to re-approve the Advisory Agreements.
Investment management and sub-advisory fee rates
The Board reviewed and considered the contractual fee rates payable by the Fund to Funds Management under the Management Agreement, as well as the contractual fee rates payable by the Fund to Funds Management for class-level administrative services under a Class-Level Administration Agreement, which include, among other things, class-level transfer agency and sub-transfer agency costs (collectively, the “Management Rates”). The Board also reviewed and considered the contractual investment sub-advisory fee rates that are payable by Funds Management to the Sub-Adviser for investment sub-advisory services.
Among other information reviewed by the Board was a comparison of the Fund’s Management Rates with the average contractual investment management fee rates of funds in the expense Groups at a common asset level as well as transfer agency costs of the funds in the expense Groups. The Board noted that the Management Rates of the Fund were in the range of the sum of these average rates for the Fund’s expense Groups for Class A, Administrator Class, Institutional Class and Class R6, but that the Management Rate for Class R was higher than the sum of the average rate for the Class R. The Board noted that the net operating expense ratios of the Fund were lower than or in range of the median net operating expense ratios of the expense Groups for each share class, including Class R.
The Board also received and considered information about the portion of the total management fee that was retained by Funds Management after payment of the fee to the Sub-Adviser for sub-advisory services. In assessing the reasonableness of this amount, the Board received and evaluated information about the nature and extent of responsibilities retained and risks assumed by Funds Management and not delegated to or assumed by the Sub-Adviser, and about Funds Management’s on-going oversight services. Given the affiliation between Funds Management and the Sub-Adviser, the Board ascribed limited relevance to the allocation of fees between them.
The Board also received and considered information about the nature and extent of services offered and fee rates charged by Funds Management and the Sub-Adviser to other types of clients with investment strategies similar to those of the Fund. In this regard, the Board received information about the significantly greater scope of services, and compliance, reporting and other legal burdens and risks of managing mutual funds compared with those associated with managing assets of non-mutual fund clients such as institutional separate accounts.
Based on its consideration of the factors and information it deemed relevant, including those described here, the Board determined that the compensation payable to Funds Management under the Management Agreement and to the Sub-Adviser under the Sub-Advisory Agreement was reasonable.
Profitability
The Board received and considered information concerning the profitability of Funds Management, as well as the profitability of both WFAM and Wells Fargo & Co. (“Wells Fargo”) as a whole, from providing services to the Fund and the
| | | | |
| 38 | | Wells Fargo International Equity Fund | | Other information (unaudited) |
fund family as a whole. The Board noted that the Sub-Adviser’s profitability information with respect to providing services to the Fund was subsumed in the WFAM and Wells Fargo profitability analysis.
Funds Management reported on the methodologies and estimates used in calculating profitability, including a description of the methodology used to allocate certain expenses and recent enhancements made to the methodology. Among other things, the Board noted that the levels of profitability reported on a fund-by-fund basis varied widely, depending on factors such as the size and type of fund. Based on its review, the Board did not deem the profits reported by Funds Management, WFAM or Wells Fargo from services provided to the Fund to be at a level that would prevent it from approving the continuation of the Advisory Agreements.
Economies of scale
The Board considered the extent to which Funds Management may experience economies of scale in the provision of management services, and the extent to which scale benefits, if any, would be shared with shareholders. In particular, the Board noted the existence of breakpoints in the Fund’s management fee structure, which operate generally to reduce the Fund’s expense ratios as the Fund grows in size. It considered that, for a small fund or a fund that shrinks in size, breakpoints conversely can result in higher fee levels. The Board also considered that in addition to management fee breakpoints, competitive management fee rates set at the outset without regard to breakpoints and fee waiver and expense reimbursement arrangements, as well as investments in the business intended to enhance services available to Fund shareholders, are means of sharing potential economies of scale with shareholders of the Fund.
The Board concluded that the Fund’s fee and expense arrangements, including contractual breakpoints, constituted a reasonable approach to sharing potential economies of scale with the Fund and its shareholders.
Other benefits to Funds Management and the Sub-Adviser
The Board received and considered information regarding potential “fall-out” or ancillary benefits received by Funds Management and its affiliates, including the Sub-Adviser, as a result of their relationships with the Fund. Ancillary benefits could include, among others, benefits directly attributable to other relationships with the Fund and benefits potentially derived from an increase in Funds Management’s and the Sub-Adviser’s business as a result of their relationships with the Fund. The Board noted that various affiliates of Funds Management may receive distribution-related fees, shareholder servicing payments and sub-transfer agency fees in respect of shares sold or held through them and services provided.
The Board also reviewed information about soft dollar credits earned and utilized by the Sub-Adviser, fees earned by Funds Management and the Sub-Adviser from managing a private investment vehicle for the fund family’s securities lending collateral and commissions earned by an affiliated broker from portfolio transactions.
Based on its consideration of the factors and information it deemed relevant, including those described here, the Board did not find that any ancillary benefits received by Funds Management and its affiliates, including the Sub-Adviser, were unreasonable.
Conclusion
At the Meeting, after considering the above-described factors and based on its deliberations and its evaluation of the information described above, the Board unanimously approved the continuation of the Advisory Agreements for a one-year term and determined that the compensation payable to Funds Management and the Sub-Adviser under each of the Advisory Agreements was reasonable.
| | | | | | |
| Appendix A (unaudited) | | Wells Fargo International Equity Fund | | | 39 | |
SALES CHARGE REDUCTIONS AND WAIVERS FOR CERTAIN INTERMEDIARIES
Raymond James & Associates, Inc., Raymond James Financial Services & Raymond James affiliates (“Raymond James”)
Effective on or about March 1, 2019, shareholders purchasing Fund shares through a Raymond James platform or account will be eligible only for the following load waivers (front-end sales charge waivers and contingent deferred, or back-end, sales charge waivers) and discounts, which may differ from those disclosed elsewhere in the Fund’s Prospectus or SAI.
Front-end Sales Load Waivers on Class A shares Available at Raymond James
| | • | | Shares purchased in an investment advisory program. |
| | • | | Shares purchased through reinvestment of capital gains distributions and dividend reinvestment when purchasing shares of the same fund (but not any other fund within the fund family). |
| | • | | Employees and registered representatives of Raymond James or its affiliates and their family members as designated by Raymond James. |
| | • | | Shares purchased from the proceeds of redemptions within the same fund family, provided (1) the repurchase occurs within 90 days following the redemption, (2) the redemption and purchase occur in the same account, and (3) redeemed shares were subject to a front-end or deferred sales load (known as Rights of Reinstatement). |
| | • | | A shareholder in the fund’s Class C shares will have their shares automatically exchanged at net asset value to Class A shares (or the appropriate share class) of the fund if the shares are no longer subject to a CDSC and the exchange is in line with the policies and procedures of Raymond James. |
CDSC Waivers on Class A and C Shares Available at Raymond James
| | • | | Death or disability of the shareholder. |
| | • | | Shares sold as part of a systematic withdrawal plan as described in the Fund’s Prospectus. |
| | • | | Return of excess contributions from an IRA Account. |
| | • | | Shares sold as part of a required minimum distribution for IRA and retirement accounts due to the shareholder reaching age 70½ as described in the Fund’s prospectus. |
| | • | | Shares sold to pay Raymond James fees but only if the transaction is initiated by Raymond James. |
| | • | | Shares acquired through a right of reinstatement. |
Front-end Load Discounts Available at Raymond James: Breakpoints, and/or Rights of Accumulation
| | • | | Breakpoints as described in the Fund’s Prospectus. |
| | • | | Rights of accumulation which entitle shareholders to breakpoint discounts will be automatically calculated based on the aggregated holding of fund family assets held by accounts within the purchaser’s household at Raymond James. Eligible fund family assets not held at Raymond James may be included in the rights of accumulation calculation only if the shareholder notifies his or her financial advisor about such assets. |
This page is intentionally left blank.

For more information
More information about Wells Fargo Funds is available free upon request. To obtain literature, please write, visit the Fund’s website, or call:
Wells Fargo Funds
P.O. Box 219967
Kansas City, MO 64121-9967
Website: wellsfargofunds.com
Individual investors: 1-800-222-8222
Retail investment professionals: 1-888-877-9275
Institutional investment professionals:
1-866-765-0778
This report and the financial statements contained herein are submitted for the general information of the shareholders of the Fund. If this report is used for promotional purposes, distribution of the report must be accompanied or preceded by a current prospectus. Before investing, please consider the investment objectives, risks, charges, and expenses of the investment. For a current prospectus and, if available, a summary prospectus, containing this information, call 1-800-222-8222 or visit the Fund’s website at wellsfargofunds.com. Read the prospectus carefully before you invest or send money.
Wells Fargo Asset Management (WFAM) is the trade name for certain investment advisory/management firms owned by Wells Fargo & Company. These firms include but are not limited to Wells Capital Management Incorporated and Wells Fargo Funds Management, LLC. Certain products managed by WFAM entities are distributed by Wells Fargo Funds Distributor, LLC (a broker/dealer and Member FINRA).
This material is for general informational and educational purposes only and is NOT intended to provide investment advice or a recommendation of any kind—including a recommendation for any specific investment, strategy, or plan.
NOT FDIC INSURED ◾ NO BANK GUARANTEE ◾ MAY LOSE VALUE
© 2018 Wells Fargo Funds Management, LLC. All rights reserved.
| | |
 | | 318247 12-18 A240/AR240 10-18 |
Annual Report
October 31, 2018

Wells Fargo Intrinsic World Equity Fund

Beginning on January 1, 2021, as permitted by new regulations adopted by the Securities and Exchange Commission, paper copies of the Fund’s annual and semi-annual shareholder reports will no longer be sent by mail, unless you specifically request paper copies of the reports. Instead, the reports will be made available on the Fund’s website, and you will be notified by mail each time a report is posted and provided with a website address to access the report.
If you already elected to receive shareholder reports electronically, you will not be affected by this change and you need not take any action. You may elect to receive shareholder reports and other communications from the Fund electronically at any time by contacting your financial intermediary (such as a broker-dealer or bank) or, if you are a direct investor, by calling 1-800-222-8222 or by enrolling at wellsfargo.com/advantagedelivery.
You may elect to receive all future reports in paper free of charge. If you invest through a financial intermediary, you can contact your financial intermediary to request that you continue to receive paper copies of your shareholder reports; if you invest directly with the Fund, you can call 1-800-222-8222. Your election to receive reports in paper will apply to all Wells Fargo Funds held in your account with your financial intermediary or, if you are a direct investor, to all Wells Fargo Funds that you hold.

Reduce clutter. Save trees.
Sign up for electronic delivery of prospectuses and shareholder reports at wellsfargo.com/advantagedelivery
Contents
The views expressed and any forward-looking statements are as of October 31, 2018, unless otherwise noted, and are those of the Fund managers and/or Wells Fargo Funds Management, LLC. Discussions of individual securities, or the markets generally, or any Wells Fargo Fund are not intended as individual recommendations. Future events or results may vary significantly from those expressed in any forward-looking statements. The views expressed are subject to change at any time in response to changing circumstances in the market. Wells Fargo Funds Management, LLC and the Fund disclaim any obligation to publicly update or revise any views expressed or forward-looking statements.
NOT FDIC INSURED ◾ NO BANK GUARANTEE ◾ MAY LOSE VALUE
| | | | |
| 2 | | Wells Fargo Intrinsic World Equity Fund | | Letter to shareholders (unaudited) |

Andrew Owen
President
Wells Fargo Funds
The early months of the reporting period were characterized by strong performance for equity and fixed-income markets. The remainder of the reporting period generated economic, business, and investing data that were decidedly more mixed and volatile relative to the prior year.
Dear Shareholder:
We are pleased to offer you this annual report for the Wells Fargo Intrinsic World Equity Fund for the 12-month period that ended October 31, 2018. The early months of the reporting period were characterized by strong performance for equity and fixed-income markets. The remainder of the reporting period generated economic, business, and investing data that were decidedly more mixed and volatile relative to the prior year.
For the period, U.S. stocks, as measured by the S&P 500 Index,1 gained 7.35% and international stocks, as measured by the MSCI ACWI ex USA Index (Net),2 declined 8.24%. Based on the MSCI EM Index (Net),3 emerging market stocks lost 12.52%. For bond investors, the Bloomberg Barclays U.S. Aggregate Bond Index4 declined 2.05% while the Bloomberg Barclays Global Aggregate ex-USD Index5 fell 2.09%. The Bloomberg Barclays Municipal Bond Index6 dropped 0.51%, and the ICE BofAML U.S. High Yield Index7 was up 0.86%.
Optimism continued to shape markets as 2017 closed and 2018 opened.
Economic conditions in late 2017 were characterized by synchronized global growth, low inflation, healthy corporate earnings, growing consumer confidence, declining unemployment, and a weaker U.S. dollar that supported international growth. The U.S. Bureau of Economic Analysis reported that U.S. gross domestic product (GDP) growth on an annualized basis for the fourth quarter of 2017 was 2.9% and inflation remained below U.S. Federal Reserve (Fed) targets.
Economic momentum continued in Europe. The Bank of England (BOE) raised interest rates in November 2017 to 0.50%, the first increase in more than 10 years, indicating confidence in the economy’s growth potential. Meanwhile, the European Central Bank (ECB) and the Bank of Japan (BOJ) kept interest rates low to spur business activities and bought bonds in an effort to encourage equity investments. The People’s Bank of China (PBOC) also sought to stimulate economic growth. Many emerging market economies benefited from stronger currencies versus the U.S. dollar, while commodity price increases benefited countries that rely on natural resources for exports.
| 1 | The S&P 500 Index consists of 500 stocks chosen for market size, liquidity, and industry group representation. It is a market-value-weighted index with each stock’s weight in the index proportionate to its market value. You cannot invest directly in an index. |
| 2 | The Morgan Stanley Capital International (MSCI) All Country World Index (ACWI) ex USA Index (Net) is a free-float-adjusted market-capitalization-weighted index that is designed to measure the equity market performance of developed markets, excluding the United States and Canada. Source: MSCI. MSCI makes no express or implied warranties or representations and shall have no liability whatsoever with respect to any MSCI data contained herein. The MSCI data may not be further redistributed or used as a basis for other indices or any securities or financial products. This report is not approved, reviewed, or produced by MSCI. You cannot invest directly in an index. |
| 3 | The MSCI Emerging Markets (EM) Index (Net) is a free-float-adjusted market-capitalization-weighted index that is designed to measure large- and mid-cap equity market performance of emerging markets. The MSCI EM Index (Net) consists of the following 24 emerging market country indices: Brazil, Chile, China, Colombia, Czech Republic, Egypt, Greece, Hungary, India, Indonesia, Korea, Malaysia, Mexico, Pakistan, Peru, the Philippines, Poland, Qatar, Russia, South Africa, Taiwan, Thailand, Turkey, and the United Arab Emirates. You cannot invest directly in an index. |
| 4 | The Bloomberg Barclays U.S. Aggregate Bond Index is a broad-based benchmark that measures the investment-grade, U.S. dollar-denominated, fixed-rate taxable bond market, including Treasuries, government-related and corporate securities, mortgage-backed securities (agency fixed-rate and hybrid adjustable-rate mortgage pass-throughs), asset-backed securities, and commercial mortgage-backed securities. You cannot invest directly in an index. |
| 5 | The Bloomberg Barclays Global Aggregate ex-USD Index is an unmanaged index that provides a broad-based measure of the global investment-grade fixed-income markets excluding the U.S. dollar-denominated debt market. You cannot invest directly in an index. |
| 6 | The Bloomberg Barclays Municipal Bond Index is an unmanaged index composed of long-term tax-exempt bonds with a minimum credit rating of Baa. You cannot invest directly in an index. |
| 7 | The ICE BofAML U.S. High Yield Index is a market-capitalization-weighted index of domestic and Yankee high-yield bonds. The index tracks the performance of high-yield securities traded in the U.S. bond market. You cannot invest directly in an index. Copyright 2018. ICE Data Indices, LLC. All rights reserved. |
| | | | | | |
| Letter to shareholders (unaudited) | | Wells Fargo Intrinsic World Equity Fund | | | 3 | |
Volatility reemerged during the early months of 2018.
In February 2018, investor concerns arose about inflation and trade, particularly between the U.S. and China. The Fed followed its 25-basis-point (bp; 100 bps equal 1.00%) federal funds rate increase in December 2017 with a further 25-bp increase in March 2018. The inflation rate in March reached the Fed’s 2% target for the first time in a year. The S&P 500 Index closed the first quarter with a negative return, the first negative quarterly return for the index since 2014.
Overseas, investment markets fell, hurt by a stronger U.S. dollar and mounting trade and diplomatic tensions. The MSCI ACWI ex USA Index (Net) declined 1.81% for the quarter that ended March 31, 2018.
Global trade tensions prompted investor concerns.
Global trade tensions escalated during the second quarter of 2018. The U.S. government’s decision to impose tariffs on a wide range of products manufactured overseas drew retaliatory responses from foreign governments, which punished U.S. commodity producers and product manufacturers. Investors were left to wonder about next steps in what appeared to be an escalating divergence in global economic policies and growth prospects.
Inflation trended higher. The CPI-U8 added 0.1% in June after an increase of 0.2% in both April and May. On a year-over-year basis, the all-items index rose 2.9% for the 12 months that ended June 30, 2018. The index for all items less food and energy rose 2.3% for the same 12-month period.
U.S. stocks gained following positive economic data while international stocks and bonds declined.
During the summer months, the U.S. economy strengthened. Revised second-quarter GDP data released in August showed the U.S. economy growing at a 4.2% rate. The unemployment rate in the U.S. was 3.7% by the end of September, according to the U.S. Department of Labor. Wages showed more consistent growth, and consumer confidence remained strong. Several U.S. equity market indices reached records during August, with the S&P 500 Index gaining 7.20% for the three-month period that ended September 30, 2018. In contrast, the MSCI ACWI ex USA Index (Net) gained 0.71% while the MSCI EM Index (Net) declined 1.09% during the same three-month period.
In June, the Fed increased the range for the federal funds rate to range from 1.75% to 2.00%. It raised the range again in September to range from 2.00% to 2.25%. Long-term interest rates in the U.S. remained at higher levels relative from the prior 10 years. Rates on 10-year and 30-year Treasury bonds—2.46% and 2.81%, respectively, on January 1, 2018—were 3.15% and 3.39%, respectively, on October 31, 2018. Investor concerns about an inverted yield curve waned, only to be replaced by concerns about the potentially negative influence of higher interest rates on economic activity.
October proved to be a difficult month for stock markets globally.
As interest rates and bond yields gained during October, stock markets struggled. For the month, the S&P 500 Index fell 6.84%, the MSCI ACWI ex USA Index (Net) dropped 8.13%, and the MSCI EM Index (Net) lost 8.71%. The Bureau of Economic Analysis released its first estimate of third-quarter GDP, which, at an annualized 3.5% rate, indicated growth may be slowing compared with the second quarter. Readings on consumer sentiment and business spending were mixed.
The S&P 500 Index closed the first quarter with a negative return, the first negative quarterly return for the index since 2014.
| 8 | The Consumer Price Index for All Urban Consumers (CPI-U) measures the changes in the price of a basket of goods and services purchased by urban consumers. The urban consumer population is deemed by many as a better representative measure of the general public because close to 90% of the country’s population lives in highly populated areas. You cannot invest directly in an index. |
| | | | |
| 4 | | Wells Fargo Intrinsic World Equity Fund | | Letter to shareholders (unaudited) |
Economic signals overseas also were mixed as the third quarter ended and the fourth quarter began. In early August, the BOE’s Monetary Policy Committee increased its key interest rate to 0.75%. The ECB and BOJ maintained low interest rates and accommodative monetary policies. Amid rising trade uncertainty, the PBOC cut reserve requirement ratios and accelerated infrastructure spending and tax cuts for business enterprises and individuals. Nevertheless, a strengthening U.S. dollar and the trade tensions remained headwinds for investors overseas.
Don’t let short-term uncertainty derail long-term investment goals.
Periods of investment uncertainty can present challenges, but experience has taught us that maintaining long-term investment goals can be an effective way to plan for the future. To help you create a sound strategy based on your personal goals and risk tolerance, Wells Fargo Funds offers more than 100 mutual funds spanning a wide range of asset classes and investment styles. Although diversification cannot guarantee an investment profit or prevent losses, we believe it can be an effective way to manage investment risk and potentially smooth out overall portfolio performance. We encourage investors to know their investments and to understand that appropriate levels of risk-taking may unlock opportunities.
Thank you for choosing to invest with Wells Fargo Funds. We appreciate your confidence in us and remain committed to helping you meet your financial needs.
Sincerely,

Andrew Owen
President
Wells Fargo Funds
Notice to shareholders
At a meeting held on August 14-15, 2018, the Board of Trustees of the Fund approved the following policy which will be effective on or about February 5, 2019:
Class C shares will convert automatically into Class A shares ten years after the initial date of purchase or, if you acquired your Class C shares through an exchange or conversion from another share class, ten years after the date you acquired your Class C shares. When Class C shares that you acquired through a purchase or exchange convert, any other Class C shares that you purchased with reinvested dividends and distributions also will convert into Class A shares on a pro rata basis. A shorter holding period may also apply depending on your intermediary. Please see “Appendix A—Sales Charge Reductions and Waivers for Certain Intermediaries” in the Fund’s prospectus or at the end of this report.
For further information about your Fund, contact your investment professional, visit our website at wellsfargofunds.com, or call us directly at 1-800-222-8222.
This page is intentionally left blank.
| | | | |
| 6 | | Wells Fargo Intrinsic World Equity Fund | | Performance highlights (unaudited) |
Investment objective
The Fund seeks long-term capital appreciation.
Manager
Wells Fargo Funds Management, LLC
Subadviser
Wells Capital Management Incorporated
Portfolio managers
Amit Kumar
Jean-Baptiste Nadal, CFA®
Jen Robertson, CFA®
Average annual total returns (%) as of October 31, 20181
| | | | | | | | | | | | | | | | | | | | | | | | | | | | | | | | | | |
| | | | | Including sales charge | | | Excluding sales charge | | | Expense ratios2 (%) | |
| | | Inception date | | 1 year | | | 5 year | | | 10 year | | | 1 year | | | 5 year | | | 10 year | | | Gross | | | Net3 | |
| Class A (EWEAX) | | 4-30-1996 | | | (3.77 | ) | | | 4.88 | | | | 10.08 | | | | 2.10 | | | | 6.12 | | | | 10.73 | | | | 1.47 | | | | 1.35 | |
| Class C (EWECX) | | 5-18-2007 | | | 0.33 | | | | 5.32 | | | | 9.90 | | | | 1.33 | | | | 5.32 | | | | 9.90 | | | | 2.22 | | | | 2.10 | |
| Administrator Class (EWEIX) | | 5-18-2007 | | | – | | | | – | | | | – | | | | 2.22 | | | | 6.31 | | | | 10.96 | | | | 1.39 | | | | 1.25 | |
| Institutional Class (EWENX) | | 7-30-2010 | | | – | | | | – | | | | – | | | | 2.52 | | | | 6.57 | | | | 11.17 | | | | 1.14 | | | | 0.95 | |
| MSCI World Index (Net)4 | | – | | | – | | | | – | | | | – | | | | 1.16 | | | | 6.81 | | | | 10.02 | | | | – | | | | – | |
Figures quoted represent past performance, which is no guarantee of future results, and do not reflect taxes that a shareholder may pay on fund distributions or the redemption of fund shares. Investment return and principal value of an investment will fluctuate so that an investor’s shares, when redeemed, may be worth more or less than their original cost. Performance shown without sales charges would be lower if sales charges were reflected. Current performance may be lower or higher than the performance data quoted, which assumes the reinvestment of dividends and capital gains. Current month-end performance is available on the Fund’s website, wellsfargofunds.com.
Index returns do not include transaction costs associated with buying and selling securities, any mutual fund fees or expenses, or any taxes. It is not possible to invest directly in an index.
For Class A shares, the maximum front-end sales charge is 5.75%. For Class C shares, the maximum contingent deferred sales charge is 1.00%. Performance including a contingent deferred sales charge assumes the sales charge for the corresponding time period. Administrator Class and Institutional Class shares are sold without a front-end sales charge or contingent deferred sales charge.
Stock values fluctuate in response to the activities of individual companies and general market and economic conditions. Foreign investments are especially volatile and can rise or fall dramatically due to differences in the political and economic conditions of the host country. These risks are generally intensified in emerging markets. The use of derivatives may reduce returns and/or increase volatility. Certain investment strategies tend to increase the total risk of an investment (relative to the broader market). The Fund is exposed to focused portfolio risk, geographic risk, and smaller company securities risk. Consult the Fund’s prospectus for additional information on these and other risks.
Please see footnotes on page 7.
| | | | | | |
| Performance highlights (unaudited) | | Wells Fargo Intrinsic World Equity Fund | | | 7 | |
|
| Growth of $10,000 investment as of October 31, 20185 |
|
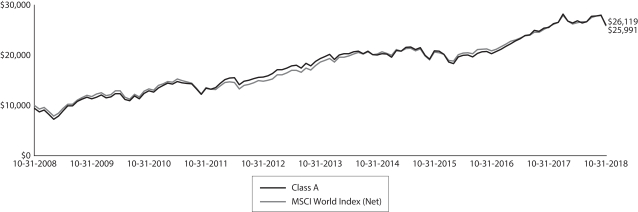 |
| 1 | Historical performance shown for Institutional Class shares prior to their inception reflects the performance of Administrator Class shares, and includes the higher expenses applicable to Administrator Class shares. If these expenses had not been included, returns for Institutional Class shares would be higher. Historical performance shown for all classes of the Fund prior to July 19, 2010, is based on the performance of the Fund’s predecessor, Evergreen Intrinsic World Equity Fund. |
| 2 | Reflects the expense ratios as stated in the most recent prospectuses. The expense ratios shown are subject to change and may differ from the annualized expense ratios shown in the financial highlights of this report. |
| 3 | The manager has contractually committed through February 28, 2019, to waive fees and/or reimburse expenses to the extent necessary to cap the Fund’s Total Annual Operating Expenses After Fee Waivers at the amounts shown. After this time, the cap may be increased or the commitment to maintain the cap may be terminated only with the approval of the Board of Trustees. Brokerage commissions, stamp duty fees, interest, taxes, acquired fund fees and expenses (if any), and extraordinary expenses are excluded from the expense cap. Without this cap, the Fund’s returns would have been lower. The expense ratio paid by an investor is the net expense ratio (the total annual fund operating expenses after fee waivers) as stated in the prospectuses. |
| 4 | The Morgan Stanley Capital International (MSCI) World Index (Net) is a free-float-adjusted market-capitalization-weighted index that is designed to measure the equity market performance of developed markets. The MSCI World Index (Net) consists of the following 23 developed markets country indices: Australia, Austria, Belgium, Canada, Denmark, Finland, France, Germany, Hong Kong, Ireland, Israel, Italy, Japan, the Netherlands, New Zealand, Norway, Portugal, Singapore, Spain, Sweden, Switzerland, the United Kingdom, and the United States. Source: MSCI. MSCI makes no express or implied warranties or representations and shall have no liability whatsoever with respect to any MSCI data contained herein. The MSCI data may not be further redistributed or used as a basis for other indices or any securities or financial products. This report is not approved, reviewed, or produced by MSCI. You cannot invest directly in an index. |
| 5 | The chart compares the performance of Class A shares for the most recent ten years with the MSCI World Index (Net). The chart assumes a hypothetical investment of $10,000 in Class A shares and reflects all operating expenses and assumes the maximum initial sales charge of 5.75%. |
| 6 | The ten largest holdings, excluding cash and cash equivalents and any money market funds, are calculated based on the value of the investments divided by total net assets of the Fund. Holdings are subject to change and may have changed since the date specified. |
| 7 | Amounts are calculated based on the total long-term investments of the Fund. These amounts are subject to change and may have changed since the date specified. |
| | | | |
| 8 | | Wells Fargo Intrinsic World Equity Fund | | Performance highlights (unaudited) |
MANAGER’S DISCUSSION
Fund highlights
| ∎ | | The Fund outperformed its benchmark, the MSCI World Index (Net), for the 12-month period that ended October 31, 2018. |
| ∎ | | The Fund’s outperformance was driven primarily by stock selection, especially in the consumer discretionary and health care sectors. Relative sector weightings, which are a by-product of our bottom-up stock selection process, also had a minor net-positive effect. |
| ∎ | | Stock selection in and an overweight to the worst-performing financials sector detracted from the Fund’s relative return. |
Global markets were mixed during the period.
The Fund outperformed its benchmark in a global stock market driven by worldwide economic growth, tightening monetary policies, and normalizing interest rates. Stocks in the U.S. produced strong, positive returns during the period. By contrast, in non-U.S. equity markets, investors were less sanguine as weakening economic growth in Europe, trade and tariff pressures, and reduced earnings growth dampened enthusiasm.
We adhered to the same intrinsic value investment philosophy and process and consistently applied it to investment selection for the Fund. We define intrinsic value as the present discounted value of future cash streams. Our fundamental analysis involves identifying the stocks that we believe are high-quality, value-creating businesses selling at a discount to our estimate of intrinsic or true value and that possess what we believe are identifiable catalysts that could close the valuation gap over our investment time horizon. Over the long term, we seek to add value primarily through stock selection due to our research-intensive, bottom-up investment process.
| | | | |
| Ten largest holdings (%) as of October 31, 20186 | |
Advance Auto Parts Incorporated | | | 3.02 | |
Microsoft Corporation | | | 2.96 | |
Merck & Company Incorporated | | | 2.84 | |
Motorola Solutions Incorporated | | | 2.76 | |
Visa Incorporated Class A | | | 2.70 | |
Cigna Corporation | | | 2.59 | |
Alphabet Incorporated Class C | | | 2.57 | |
Capgemini SA | | | 2.56 | |
Comcast Corporation Class A | | | 2.40 | |
Air Liquide SA | | | 2.37 | |
Our long-term investment process typically has resulted in low portfolio turnover as we seek to invest in businesses over a three- to five-year investment horizon. During the reporting period, we sold the Fund’s positions in eight companies across five sectors and added positions in six new companies across three sectors. Positions sold from the Fund during the period included Honda Motor Company, Limited, in the consumer discretionary sector; Heineken N.V., and Kao Corporation in the consumer staples sector; CaixaBank, S.A., The Charles Schwab Corporation, and The Goldman Sachs Group, Incorporated, in the financials sector; Sensata Technologies Holding N.V., in the industrials sector; and Oracle Corporation in the information technology (IT) sector. Positions added to the Fund included Comcast
Corporation and Dollar Tree, Incorporated, in the consumer discretionary sector; American International Group, Incorporated, Aon plc, and Intercontinental Exchange, Incorporated, in the financials sector; and Renesas Electronics Corporation in the IT sector. All buy and sell decisions were driven by company-specific, fundamental analysis rather than top-down, sector allocation decisions.
Please see footnotes on page 7.
| | | | | | |
| Performance highlights (unaudited) | | Wells Fargo Intrinsic World Equity Fund | | | 9 | |
|
| Sector distribution as of October 31, 20187 |
|
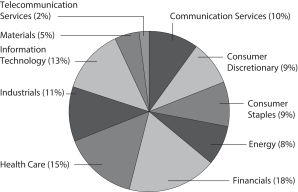 |
|
| Country allocation as of October 31, 20187 |
|
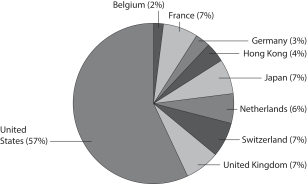
|
Stock selection in a number of sectors largely drove the Fund’s outperformance of the index.
Stock selection in the consumer discretionary and health care sectors contributed to relative performance. In consumer discretionary, Advance Auto Parts, Incorporated—a major North American retailer and distributor of automotive parts to consumers and professional installers—was the top contributor. In the health care sector, pharmaceutical companies Eli Lilly and Company and Merck & Company, Incorporated, were top performers.
Stock selection in and an overweight to the worst-performing financials sector hindered Fund performance.
The Fund’s relative weakness in the financials sector for the period was hurt by one of Europe’s largest financial services organizations, Société Générale S.A., and Affiliated Managers Group, Incorporated, a company that owns stakes in a number of boutique investment management firms.
We remain confident in our investment process.
In our view, the 12-month period that ended October 31, 2018, demonstrated the continued positive impact on our intrinsic value approach of an improving global economy, strong corporate earnings growth, and rising interest rates. The increase in market volatility should be another boost to the team’s approach as valuation dislocations swell and the total return potential surges. Finally, non-U.S. companies possess attractive valuations and may be several years behind their U.S. peers, providing a compelling case for broad global diversification.
The intrinsic value philosophy and process reflect our willingness to buy a high-quality company’s intrinsic value at a substantive discount and where we can identify internally driven catalysts that will close this value gap over a long time horizon. Our primary focus is allowing company management teams to identify the most appropriate uses of this free cash. These uses may include balance sheet restructuring, share repurchases, new products, acquisitions, or marketing. We believe company management teams have superior knowledge of their markets, competitors, and customers, enabling them to identify the most effective uses of free cash.
There are some potential risks in the market, such as tariffs and trade wars morphing from negotiation to actualization, overleverage in China dampening economic growth and causing deflation, new U.S. foreign policymakers, and geopolitical events—including eurozone populism, Iran sanctions, North Korea, the 2018 U.S. midterm elections, economic growth accelerating, and faster-than-expected inflation. We believe the Fund is well positioned to benefit from normalizing interest rates, accelerating global economic growth, corporate cash repatriation, increasing market volatility, and an outperformance in value sectors—energy, materials, and financials—versus the relatively rich growth sector of IT.
Please see footnotes on page 7.
| | | | |
| 10 | | Wells Fargo Intrinsic World Equity Fund | | Fund expenses (unaudited) |
As a shareholder of the Fund, you incur two types of costs: (1) transaction costs, including sales charges (loads) on purchase payments and contingent deferred sales charges (if any) on redemptions and (2) ongoing costs, including management fees, distribution (12b-1) and/or shareholder servicing fees, and other Fund expenses. This example is intended to help you understand your ongoing costs (in dollars) of investing in the Fund and to compare these costs with the ongoing costs of investing in other mutual funds.
The example is based on an investment of $1,000 invested at the beginning of the six-month period and held for the entire period from May 1, 2018 to October 31, 2018.
Actual expenses
The “Actual” line of the table below provides information about actual account values and actual expenses. You may use the information in this line, together with the amount you invested, to estimate the expenses that you paid over the period. Simply divide your account value by $1,000 (for example, an $8,600 account value divided by $1,000 = 8.6), then multiply the result by the number in the “Actual” line under the heading entitled “Expenses paid during period” for your applicable class of shares to estimate the expenses you paid on your account during this period.
Hypothetical example for comparison purposes
The “Hypothetical” line of the table below provides information about hypothetical account values and hypothetical expenses based on the Fund’s actual expense ratio and an assumed rate of return of 5% per year before expenses, which is not the Fund’s actual return. The hypothetical account values and expenses may not be used to estimate the actual ending account balance or expenses you paid for the period. You may use this information to compare the ongoing costs of investing in the Fund and other funds. To do so, compare this 5% hypothetical example with the 5% hypothetical examples that appear in the shareholder reports of the other funds.
Please note that the expenses shown in the table are meant to highlight your ongoing costs only and do not reflect any transactional costs, such as sales charges (loads) and contingent deferred sales charges. Therefore, the “Hypothetical” line of the table is useful in comparing ongoing costs only and will not help you determine the relative total costs of owning different funds. In addition, if these transactional costs were included, your costs would have been higher.
| | | | | | | | | | | | | | | | |
| | | Beginning
account value
5-1-2018 | | | Ending
account value
10-31-2018 | | | Expenses
paid during
the period¹ | | | Annualized net
expense ratio | |
Class A | | | | | | | | | | | | | | | | |
Actual | | $ | 1,000.00 | | | $ | 970.48 | | | $ | 6.71 | | | | 1.35 | % |
Hypothetical (5% return before expenses) | | $ | 1,000.00 | | | $ | 1,018.40 | | | $ | 6.87 | | | | 1.35 | % |
Class C | | | | | | | | | | | | | | | | |
Actual | | $ | 1,000.00 | | | $ | 966.90 | | | $ | 10.41 | | | | 2.10 | % |
Hypothetical (5% return before expenses) | | $ | 1,000.00 | | | $ | 1,014.62 | | | $ | 10.66 | | | | 2.10 | % |
Administrator Class | | | | | | | | | | | | | | | | |
Actual | | $ | 1,000.00 | | | $ | 971.22 | | | $ | 6.19 | | | | 1.25 | % |
Hypothetical (5% return before expenses) | | $ | 1,000.00 | | | $ | 1,018.93 | | | $ | 6.34 | | | | 1.25 | % |
Institutional Class | | | | | | | | | | | | | | | | |
Actual | | $ | 1,000.00 | | | $ | 972.21 | | | $ | 4.72 | | | | 0.95 | % |
Hypothetical (5% return before expenses) | | $ | 1,000.00 | | | $ | 1,020.42 | | | $ | 4.84 | | | | 0.95 | % |
| 1 | Expenses paid is equal to the annualized net expense ratio of each class multiplied by the average account value over the period, multiplied by the number of days in the most recent fiscal half-year divided by the number of days in the fiscal year (to reflect the one-half-year period). |
| | | | | | |
| Portfolio of investments—October 31, 2018 | | Wells Fargo Intrinsic World Equity Fund | | | 11 | |
| | | | | | | | | | | | | | | | |
| Security name | | | | | | | | Shares | | | Value | |
| | | | |
Common Stocks: 99.63% | | | | | | | | | | | | | | | | |
| | | | |
| Belgium: 1.65% | | | | | | | | | | | | | | | | |
Anheuser-Busch InBev NV ADR (Consumer Staples, Beverages) « | | | | | | | | | | | 32,800 | | | $ | 2,426,544 | |
| | | | | | | | | | | | | | | | |
| | | | |
| France: 6.68% | | | | | | | | | | | | | | | | |
Air Liquide SA (Materials, Chemicals) | | | | | | | | | | | 28,700 | | | | 3,478,256 | |
Capgemini SA (Information Technology, IT Services) | | | | | | | | | | | 30,700 | | | | 3,755,415 | |
Societe Generale SA (Financials, Banks) | | | | | | | | | | | 69,900 | | | | 2,571,515 | |
| | | | |
| | | | | | | | | | | | | | | 9,805,186 | |
| | | | | | | | | | | | | | | | |
| | | | |
| Germany: 2.93% | | | | | | | | | | | | | | | | |
Bayer AG (Health Care, Pharmaceuticals) | | | | | | | | | | | 17,800 | | | | 1,366,525 | |
Deutsche Telekom AG (Telecommunication Services, Diversified Telecommunication Services) | | | | | | | | | | | 178,700 | | | | 2,933,855 | |
| | | | |
| | | | | | | | | | | | | | | 4,300,380 | |
| | | | | | | | | | | | | | | | |
| | | | |
| Hong Kong: 4.02% | | | | | | | | | | | | | | | | |
AIA Group Limited (Financials, Insurance) | | | | | | | | | | | 377,000 | | | | 2,853,238 | |
Samsonite International SA (Consumer Discretionary, Textiles, Apparel & Luxury Goods) | | | | | | | | | | | 1,063,290 | | | | 3,050,775 | |
| | | | |
| | | | | | | | | | | | | | | 5,904,013 | |
| | | | | | | | | | | | | | | | |
| | | | |
| Japan: 7.29% | | | | | | | | | | | | | | | | |
Nidec Corporation (Industrials, Electrical Equipment) | | | | | | | | | | | 23,000 | | | | 2,953,605 | |
ORIX Corporation (Financials, Diversified Financial Services) | | | | | | | | | | | 167,200 | | | | 2,728,012 | |
Renesas Electronics Corporation (Information Technology, Semiconductors & Semiconductor Equipment) † | | | | | | | | | | | 361,000 | | | | 1,913,218 | |
Sony Corporation (Consumer Discretionary, Household Durables) | | | | | | | | | | | 57,240 | | | | 3,114,757 | |
| | | | |
| | | | | | | | | | | | | | | 10,709,592 | |
| | | | | | | | | | | | | | | | |
| | | | |
| Netherlands: 5.59% | | | | | | | | | | | | | | | | |
AerCap Holdings NV (Industrials, Trading Companies & Distributors) † | | | | | | | | | | | 66,900 | | | | 3,350,352 | |
Airbus SE (Industrials, Aerospace & Defense) | | | | | | | | | | | 16,600 | | | | 1,837,143 | |
Unilever NV (Consumer Staples, Personal Products) | | | | | | | | | | | 56,100 | | | | 3,017,058 | |
| | | | |
| | | | | | | | | | | | | | | 8,204,553 | |
| | | | | | | | | | | | | | | | |
| | | | |
| Switzerland: 7.22% | | | | | | | | | | | | | | | | |
Nestle SA (Consumer Staples, Food Products) | | | | | | | | | | | 32,100 | | | | 2,712,954 | |
Novartis AG ADR (Health Care, Pharmaceuticals) | | | | | | | | | | | 33,800 | | | | 2,956,148 | |
Roche Holding AG (Health Care, Pharmaceuticals) | | | | | | | | | | | 9,600 | | | | 2,336,256 | |
UBS Group AG (Financials, Capital Markets) | | | | | | | | | | | 186,300 | | | | 2,606,332 | |
| | | | |
| | | | | | | | | | | | | | | 10,611,690 | |
| | | | | | | | | | | | | | | | |
| | | | |
| United Kingdom: 6.98% | | | | | | | | | | | | | | | | |
Aon plc (Financials, Insurance) | | | | | | | | | | | 21,700 | | | | 3,389,106 | |
Diageo plc (Consumer Staples, Beverages) | | | | | | | | | | | 42,700 | | | | 1,478,276 | |
Royal Dutch Shell plc Class A (Energy, Oil, Gas & Consumable Fuels) | | | | | | | | | | | 97,000 | | | | 3,093,857 | |
Vodafone Group plc (Communication Services, Wireless Telecommunication Services) | | | | | | | | | | | 1,212,300 | | | | 2,290,563 | |
| | | | |
| | | | | | | | | | | | | | | 10,251,802 | |
| | | | | | | | | | | | | | | | |
The accompanying notes are an integral part of these financial statements.
| | | | |
| 12 | | Wells Fargo Intrinsic World Equity Fund | | Portfolio of investments—October 31, 2018 |
| | | | | | | | | | | | | | | | |
| Security name | | | | | | | | Shares | | | Value | |
| | | | |
| United States: 57.27% | | | | | | | | | | | | | | | | |
Abbott Laboratories (Health Care, Health Care Equipment & Supplies) | | | | | | | | | | | 37,600 | | | $ | 2,592,144 | |
Advance Auto Parts Incorporated (Consumer Discretionary, Specialty Retail) | | | | | | | | | | | 27,800 | | | | 4,441,328 | |
Affiliated Managers Group Incorporated (Financials, Capital Markets) | | | | | | | | | | | 17,000 | | | | 1,932,220 | |
Alphabet Incorporated Class C (Communication Services, Interactive Media & Services) † | | | | | | | | | | | 3,500 | | | | 3,768,695 | |
American International Group Incorporated (Financials, Insurance) | | | | | | | | | | | 57,800 | | | | 2,386,562 | |
Apple Incorporated (Information Technology, Technology Hardware, Storage & Peripherals) | | | | | | | | | | | 7,200 | | | | 1,575,792 | |
BB&T Corporation (Financials, Banks) | | | | | | | | | | | 58,800 | | | | 2,890,608 | |
Chevron Corporation (Energy, Oil, Gas & Consumable Fuels) | | | | | | | | | | | 25,200 | | | | 2,813,580 | |
Cigna Corporation (Health Care, Health Care Providers & Services) | | | | | | | | | | | 17,800 | | | | 3,805,818 | |
CIT Group Incorporated (Financials, Banks) | | | | | | | | | | | 68,600 | | | | 3,250,268 | |
Comcast Corporation Class A (Communication Services, Media) | | | | | | | | | | | 92,400 | | | | 3,524,136 | |
Dollar Tree Incorporated (Consumer Discretionary, Multiline Retail) † | | | | | | | | | | | 37,150 | | | | 3,131,745 | |
Eli Lilly & Company (Health Care, Pharmaceuticals) | | | | | | | | | | | 26,600 | | | | 2,884,504 | |
EOG Resources Incorporated (Energy, Oil, Gas & Consumable Fuels) | | | | | | | | | | | 30,000 | | | | 3,160,200 | |
General Dynamics Corporation (Industrials, Aerospace & Defense) | | | | | | | | | | | 10,500 | | | | 1,812,090 | |
Gilead Sciences Incorporated (Health Care, Biotechnology) | | | | | | | | | | | 32,300 | | | | 2,202,214 | |
Honeywell International Incorporated (Industrials, Industrial Conglomerates) | | | | | | | | | | | 20,400 | | | | 2,954,328 | |
Intercontinental Exchange Incorporated (Financials, Capital Markets) | | | | | | | | | | | 21,800 | | | | 1,679,472 | |
Merck & Company Incorporated (Health Care, Pharmaceuticals) | | | | | | | | | | | 56,600 | | | | 4,166,326 | |
Microsoft Corporation (Information Technology, Software) | | | | | | | | | | | 40,700 | | | | 4,347,167 | |
Mondelez International Incorporated Class A (Consumer Staples, Food Products) | | | | | | | | | | | 78,400 | | | | 3,291,232 | |
Motorola Solutions Incorporated (Information Technology, Communications Equipment) | | | | | | | | | | | 33,100 | | | | 4,056,736 | |
Resideo Technologies Incorporated (Industrials, Building Products) † | | | | | | | | | | | 3,400 | | | | 71,570 | |
Schlumberger Limited (Energy, Energy Equipment & Services) | | | | | | | | | | | 44,600 | | | | 2,288,426 | |
The Walt Disney Company (Communication Services, Entertainment) | | | | | | | | | | | 22,800 | | | | 2,618,124 | |
United Parcel Service Incorporated Class B (Industrials, Air Freight & Logistics) | | | | | | | | | | | 21,900 | | | | 2,333,226 | |
Verizon Communications Incorporated (Communication Services, Diversified Telecommunication Services) | | | | | | | | | | | 52,200 | | | | 2,980,098 | |
Visa Incorporated Class A (Information Technology, IT Services) | | | | | | | | | | | 28,800 | | | | 3,970,080 | |
Vulcan Materials Company (Materials, Construction Materials) | | | | | | | | | | | 31,300 | | | | 3,165,682 | |
| | | | |
| | | | | | | | | | | | | | | 84,094,371 | |
| | | | | | | | | | | | | | | | |
| | | | |
Total Common Stocks (Cost $120,570,776) | | | | | | | | | | | | | | | 146,308,131 | |
| | | | | | | | | | | | | | | | |
| | | | |
| | | Yield | | | | | | | | | | |
| Short-Term Investments: 2.00% | | | | | | | | | | | | | | | | |
| | | | |
| Investment Companies: 2.00% | | | | | | | | | | | | | | | | |
Securities Lending Cash Investments LLC (l)(r)(u) | | | 2.33 | % | | | | | | | 2,363,341 | | | | 2,363,577 | |
Wells Fargo Government Money Market Fund Select Class (l)(u) | | | 2.07 | | | | | | | | 564,878 | | | | 564,878 | |
| | | | | | | | | | | | | | | | |
| |
Total Short-Term Investments (Cost $2,928,455) | | | | 2,928,455 | |
| | | | | | | | | | | | | | | | |
| | | | | | | | |
| Total investments in securities (Cost $123,499,231) | | | 101.63 | % | | | 149,236,586 | |
Other assets and liabilities, net | | | (1.63 | ) | | | (2,389,143 | ) |
| | | | | | | | |
| Total net assets | | | 100.00 | % | | $ | 146,847,443 | |
| | | | | | | | |
The accompanying notes are an integral part of these financial statements.
| | | | | | |
| Portfolio of investments—October 31, 2018 | | Wells Fargo Intrinsic World Equity Fund | | | 13 | |
| « | All or a portion of this security is on loan. |
| † | Non-income-earning security |
| (l) | The issuer of the security is an affiliated person of the Fund as defined in the Investment Company Act of 1940. |
| (r) | The investment is a non-registered investment company purchased with cash collateral received from securities on loan. |
| (u) | The rate represents the 7-day annualized yield at period end. |
Abbreviations:
| ADR | American depositary receipt |
Investments in Affiliates
An affiliated investment is an investment in which the Fund owns at least 5% of the outstanding voting shares of the issuer or as a result of other relationships, such as the Fund and the issuer having the same investment manager. Transactions with issuers that were either affiliated persons of the Fund at the beginning of the period or the end of the period were as follows:
| | | | | | | | | | | | | | | | | | | | | | | | | | | | | | | | | | | | |
| | | Shares,
beginning of
period | | | Shares
purchased | | | Shares
sold | | | Shares,
end of
period | | | Net
realized
gains
(losses) | | | Net
change in
unrealized
gains
(losses) | | | Income
from
affiliated
securities | | | Value,
end
of period | | | % of
net
assets | |
Short-Term Investments | | | | | | | | | | | | | | | | | | | | | | | | | | | | | | | | | | | | |
Investment Companies | | | | | | | | | | | | | | | | | | | | | | | | | | | | | | | | | | | | |
Securities Lending Cash Investments LLC | | | 1,478,852 | | | | 72,580,916 | | | | 71,696,427 | | | | 2,363,341 | | | $ | (23 | ) | | $ | 0 | | | $ | 22,600 | | | $ | 2,363,577 | | | | | |
Wells Fargo Government Money Market Fund Select Class | | | 763,828 | | | | 24,360,156 | | | | 24,559,106 | | | | 564,878 | | | | 0 | | | | 0 | | | | 10,159 | | | | 564,878 | | | | | |
| | | | | | | | | | | | | | | | | | | | | | | | | | | | | | | | | | | | |
| | | | | | | | | | | | | | | | | | ($ | 23 | ) | | $ | 0 | | | $ | 32,759 | | | $ | 2,928,455 | | | | 2.00 | % |
| | | | | | | | | | | | | | | | | | | | | | | | | | | | | | | | | | | | |
The accompanying notes are an integral part of these financial statements.
| | | | |
| 14 | | Wells Fargo Intrinsic World Equity Fund | | Statement of assets and liabilities—October 31, 2018 |
| | | | |
| | | | |
| |
Assets | | | | |
Investments in unaffiliated securities (including $2,300,778 of securities loaned), at value (cost $120,570,776) | | $ | 146,308,131 | |
Investments in affiliated securities, at value (cost $2,928,455) | | | 2,928,455 | |
Foreign currency, at value (cost $30) | | | 27 | |
Receivable for Fund shares sold | | | 38,338 | |
Receivable for dividends | | | 236,624 | |
Receivable for securities lending income | | | 1,704 | |
Prepaid expenses and other assets | | | 27,368 | |
| | | | |
Total assets | | | 149,540,647 | |
| | | | |
| |
Liabilities | | | | |
Payable upon receipt of securities loaned | | | 2,363,600 | |
Payable for Fund shares redeemed | | | 98,246 | |
Management fee payable | | | 92,651 | |
Administration fees payable | | | 26,429 | |
Distribution fee payable | | | 3,747 | |
Trustees’ fees and expenses payable | | | 839 | |
Accrued expenses and other liabilities | | | 107,692 | |
| | | | |
Total liabilities | | | 2,693,204 | |
| | | | |
Total net assets | | $ | 146,847,443 | |
| | | | |
| |
NET ASSETS CONSIST OF | | | | |
Paid-in capital | | $ | 105,931,588 | |
Total distributable earnings | | | 40,915,855 | |
| | | | |
Total net assets | | $ | 146,847,443 | |
| | | | |
| |
COMPUTATION OF NET ASSET VALUE AND OFFERING PRICE PER SHARE | | | | |
Net assets – Class A | | $ | 132,207,025 | |
Shares outstanding – Class A1 | | | 6,092,242 | |
Net asset value per share – Class A | | | $21.70 | |
Maximum offering price per share – Class A2 | | | $23.02 | |
Net assets – Class C | | $ | 5,556,330 | |
Shares outstanding – Class C1 | | | 267,900 | |
Net asset value per share – Class C | | | $20.74 | |
Net assets – Administrator Class | | $ | 1,627,743 | |
Shares outstanding – Administrator Class1 | | | 75,374 | |
Net asset value per share – Administrator Class | | | $21.60 | |
Net assets – Institutional Class | | $ | 7,456,345 | |
Shares outstanding – Institutional Class1 | | | 343,701 | |
Net asset value per share – Institutional Class | | | $21.69 | |
| 1 | The Fund has an unlimited number of authorized shares. |
| 2 | Maximum offering price is computed as 100/94.25 of net asset value. On investments of $50,000 or more, the offering price is reduced. |
The accompanying notes are an integral part of these financial statements.
| | | | | | |
| Statement of operations—year ended October 31, 2018 | | Wells Fargo Intrinsic World Equity Fund | | | 15 | |
| | | | |
| | | | |
| |
Investment income | | | | |
Dividends (net of foreign withholding taxes of $234,145) | | $ | 3,288,027 | |
Income from affiliated securities | | | 32,759 | |
| | | | |
Total investment income | | | 3,320,786 | |
| | | | |
| |
Expenses | | | | |
Management fee | | | 1,357,021 | |
Administration fees | | | | |
Class A | | | 300,174 | |
Class C | | | 13,904 | |
Administrator Class | | | 3,802 | |
Institutional Class | | | 9,314 | |
Shareholder servicing fees | | | | |
Class A | | | 357,350 | |
Class C | | | 16,552 | |
Administrator Class | | | 6,943 | |
Distribution fee | | | | |
Class C | | | 49,656 | |
Custody and accounting fees | | | 39,869 | |
Professional fees | | | 52,098 | |
Registration fees | | | 81,706 | |
Shareholder report expenses | | | 49,585 | |
Trustees’ fees and expenses | | | 22,999 | |
Other fees and expenses | | | 13,640 | |
| | | | |
Total expenses | | | 2,374,613 | |
Less: Fee waivers and/or expense reimbursements | | | (201,307 | ) |
| | | | |
Net expenses | | | 2,173,306 | |
| | | | |
Net investment income | | | 1,147,480 | |
| | | | |
| |
REALIZED AND UNREALIZED GAINS (LOSSES) ON INVESTMENTS | | | | |
| |
Net realized gains (losses) on: | | | | |
Unaffiliated securities | | | 14,917,139 | |
Affiliated securities | | | (23 | ) |
| | | | |
Net realized gains on investments | | | 14,917,116 | |
Net change in unrealized gains (losses) on investments | | | (12,122,849 | ) |
| | | | |
Net realized and unrealized gains (losses) on investments | | | 2,794,267 | |
| | | | |
Net increase in net assets resulting from operations | | $ | 3,941,747 | |
| | | | |
The accompanying notes are an integral part of these financial statements.
| | | | |
| 16 | | Wells Fargo Intrinsic World Equity Fund | | Statement of changes in net assets |
| | | | | | | | | | | | | | | | |
| | | Year ended
October 31, 2018 | | | Year ended
October 31, 20171 | |
| |
Operations | | | | | |
Net investment income | | | | | | $ | 1,147,480 | | | | | | | $ | 1,323,996 | |
Net realized gains on investments | | | | | | | 14,917,116 | | | | | | | | 11,579,814 | |
Net change in unrealized gains (losses) on investments | | | | | | | (12,122,849 | ) | | | | | | | 21,512,782 | |
| | | | |
Net increase in net assets resulting from operations | | | | | | | 3,941,747 | | | | | | | | 34,416,592 | |
| | | | |
| | | |
Distributions to shareholders from net investment income and net realized gains | | | | | | | | | | | | |
Class A | | | | | | | (11,590,920 | ) | | | | | | | (7,661,028 | ) |
Class C | | | | | | | (529,503 | ) | | | | | | | (393,634 | ) |
Administrator Class | | | | | | | (407,346 | ) | | | | | | | (232,813 | ) |
Institutional Class | | | | | | | (567,484 | ) | | | | | | | (329,265 | ) |
| | | | |
Total distributions to shareholders | | | | | | | (13,095,253 | ) | | | | | | | (8,616,740 | ) |
| | | | |
| | | | |
Capital share transactions | | | Shares | | | | | | | | Shares | | | | | |
Proceeds from shares sold | | | | | | | | | | | | | | | | |
Class A | | | 97,619 | | | | 2,206,319 | | | | 91,775 | | | | 1,943,663 | |
Class C | | | 8,983 | | | | 196,235 | | | | 11,239 | | | | 230,175 | |
Administrator Class | | | 27,473 | | | | 617,360 | | | | 61,599 | | | | 1,310,161 | |
Institutional Class | | | 109,895 | | | | 2,482,208 | | | | 141,316 | | | | 2,903,861 | |
| | | | |
| | | | | | | 5,502,122 | | | | | | | | 6,387,860 | |
| | | | |
Reinvestment of distributions | | | | | | | | | | | | | | | | |
Class A | | | 506,636 | | | | 11,262,955 | | | | 382,200 | | | | 7,440,005 | |
Class C | | | 23,586 | | | | 501,242 | | | | 19,294 | | | | 360,925 | |
Administrator Class | | | 17,906 | | | | 396,209 | | | | 11,665 | | | | 225,913 | |
Institutional Class | | | 21,129 | | | | 469,058 | | | | 14,333 | | | | 278,253 | |
| | | | |
| | | | | | | 12,629,464 | | | | | | | | 8,305,096 | |
| | | | |
Payment for shares redeemed | | | | | | | | | | | | | | | | |
Class A | | | (657,430 | ) | | | (14,893,411 | ) | | | (854,675 | ) | | | (17,932,087 | ) |
Class C | | | (81,421 | ) | | | (1,774,406 | ) | | | (100,134 | ) | | | (2,025,420 | ) |
Administrator Class | | | (175,686 | ) | | | (3,971,356 | ) | | | (111,252 | ) | | | (2,222,251 | ) |
Institutional Class | | | (77,116 | ) | | | (1,745,497 | ) | | | (89,219 | ) | | | (1,831,803 | ) |
| | | | |
| | | | | | | (22,384,670 | ) | | | | | | | (24,011,561 | ) |
| | | | |
Net decrease in net assets resulting from capital share transactions | | | | | | | (4,253,084 | ) | | | | | | | (9,318,605 | ) |
| | | | |
Total increase (decrease) in net assets | | | | | | | (13,406,590 | ) | | | | | | | 16,481,247 | |
| | | | |
| | |
Net assets | | | | | | | | |
Beginning of period | | | | | | | 160,254,033 | | | | | | | | 143,772,786 | |
| | | | |
End of period | | | | | | $ | 146,847,443 | | | | | | | $ | 160,254,033 | |
| | | | |
| 1 | Effective for all filings after November 4, 2018, the SEC prospectively eliminated the requirements to parenthetically disclose undistributed net investment income at the end of the period and permitted the aggregation of distributions, with the exception of tax basis returns of capital. Undistributed net investment income at October 31, 2017 was $747,677. The disaggregated distributions information for the year ended October 31, 2017 is included in Note 7, Distributions to Shareholders, in the notes to the financial statements. |
The accompanying notes are an integral part of these financial statements.
| | | | | | |
| Financial highlights | | Wells Fargo Intrinsic World Equity Fund | | | 17 | |
(For a share outstanding throughout each period)
| | | | | | | | | | | | | | | | | | | | |
| | | Year ended October 31 | |
| CLASS A | | 2018 | | | 2017 | | | 2016 | | | 2015 | | | 2014 | |
Net asset value, beginning of period | | | $23.08 | | | | $19.53 | | | | $22.82 | | | | $22.39 | | | | $21.88 | |
Net investment income | | | 0.16 | | | | 0.19 | | | | 0.20 | | | | 0.19 | | | | 0.17 | |
Net realized and unrealized gains (losses) on investments | | | 0.35 | | | | 4.54 | | | | (0.83 | ) | | | 0.73 | | | | 0.59 | |
| | | | | | | | | | | | | | | | | | | | |
Total from investment operations | | | 0.51 | | | | 4.73 | | | | (0.63 | ) | | | 0.92 | | | | 0.76 | |
Distributions to shareholders from | | | | | | | | | | | | | | | | | | | | |
Net investment income | | | (0.20 | ) | | | (0.23 | ) | | | (0.20 | ) | | | (0.12 | ) | | | (0.25 | ) |
Net realized gains | | | (1.69 | ) | | | (0.95 | ) | | | (2.46 | ) | | | (0.37 | ) | | | 0.00 | |
| | | | | | | | | | | | | | | | | | | | |
Total distributions to shareholders | | | (1.89 | ) | | | (1.18 | ) | | | (2.66 | ) | | | (0.49 | ) | | | (0.25 | ) |
Net asset value, end of period | | | $21.70 | | | | $23.08 | | | | $19.53 | | | | $22.82 | | | | $22.39 | |
Total return1 | | | 2.10 | % | | | 25.44 | % | | | (2.54 | )% | | | 4.23 | % | | | 3.45 | % |
Ratios to average net assets (annualized) | | | | | | | | | | | | | | | | | | | | |
Gross expenses | | | 1.47 | % | | | 1.47 | % | | | 1.46 | % | | | 1.48 | % | | | 1.47 | % |
Net expenses | | | 1.35 | % | | | 1.35 | % | | | 1.37 | % | | | 1.40 | % | | | 1.40 | % |
Net investment income | | | 0.73 | % | | | 0.88 | % | | | 1.09 | % | | | 0.79 | % | | | 0.70 | % |
Supplemental data | | | | | | | | | | | | | | | | | | | | |
Portfolio turnover rate | | | 20 | % | | | 21 | % | | | 23 | % | | | 32 | % | | | 23 | % |
Net assets, end of period (000s omitted) | | | $132,207 | | | | $141,831 | | | | $127,428 | | | | $149,492 | | | | $157,061 | |
| 1 | Total return calculations do not include any sales charges. |
The accompanying notes are an integral part of these financial statements.
| | | | |
| 18 | | Wells Fargo Intrinsic World Equity Fund | | Financial highlights |
(For a share outstanding throughout each period)
| | | | | | | | | | | | | | | | | | | | |
| | | Year ended October 31 | |
| CLASS C | | 2018 | | | 2017 | | | 2016 | | | 2015 | | | 2014 | |
Net asset value, beginning of period | | | $22.15 | | | | $18.77 | | | | $21.99 | | | | $21.64 | | | | $21.19 | |
Net investment income (loss) | | | (0.00 | )1,2 | | | 0.03 | 1 | | | 0.05 | | | | 0.01 | 1 | | | (0.02 | ) |
Net realized and unrealized gains (losses) on investments | | | 0.33 | | | | 4.38 | | | | (0.80 | ) | | | 0.71 | | | | 0.58 | |
| | | | | | | | | | | | | | | | | | | | |
Total from investment operations | | | 0.33 | | | | 4.41 | | | | (0.75 | ) | | | 0.72 | | | | 0.56 | |
Distributions to shareholders from | | | | | | | | | | | | | | | | | | | | |
Net investment income | | | (0.05 | ) | | | (0.08 | ) | | | (0.01 | ) | | | 0.00 | | | | (0.11 | ) |
Net realized gains | | | (1.69 | ) | | | (0.95 | ) | | | (2.46 | ) | | | (0.37 | ) | | | 0.00 | |
| | | | | | | | | | | | | | | | | | | | |
Total distributions to shareholders | | | (1.74 | ) | | | (1.03 | ) | | | (2.47 | ) | | | (0.37 | ) | | | (0.11 | ) |
Net asset value, end of period | | | $20.74 | | | | $22.15 | | | | $18.77 | | | | $21.99 | | | | $21.64 | |
Total return3 | | | 1.33 | % | | | 24.54 | % | | | (3.26 | )% | | | 3.41 | % | | | 2.65 | % |
Ratios to average net assets (annualized) | | | | | | | | | | | | | | | | | | | | |
Gross expenses | | | 2.22 | % | | | 2.22 | % | | | 2.21 | % | | | 2.23 | % | | | 2.22 | % |
Net expenses | | | 2.10 | % | | | 2.10 | % | | | 2.12 | % | | | 2.15 | % | | | 2.15 | % |
Net investment income (loss) | | | (0.01 | )% | | | 0.13 | % | | | 0.32 | % | | | 0.05 | % | | | (0.06 | )% |
Supplemental data | | | | | | | | | | | | | | | | | | | | |
Portfolio turnover rate | | | 20 | % | | | 21 | % | | | 23 | % | | | 32 | % | | | 23 | % |
Net assets, end of period (000s omitted) | | | $5,556 | | | | $7,015 | | | | $7,252 | | | | $8,958 | | | | $9,788 | |
| 1 | Calculated based upon average shares outstanding |
| 2 | Amount is more than $(0.005). |
| 3 | Total return calculations do not include any sales charges. |
The accompanying notes are an integral part of these financial statements.
| | | | | | |
| Financial highlights | | Wells Fargo Intrinsic World Equity Fund | | | 19 | |
(For a share outstanding throughout each period)
| | | | | | | | | | | | | | | | | | | | |
| | | Year ended October 31 | |
| ADMINISTRATOR CLASS | | 2018 | | | 2017 | | | 2016 | | | 2015 | | | 2014 | |
Net asset value, beginning of period | | | $22.98 | | | | $19.43 | | | | $22.76 | | | | $22.33 | | | | $21.81 | |
Net investment income | | | 0.15 | 1 | | | 0.20 | 1 | | | 0.24 | 1 | | | 0.23 | 1 | | | 0.22 | 1 |
Net realized and unrealized gains (losses) on investments | | | 0.39 | | | | 4.54 | | | | (0.84 | ) | | | 0.75 | | | | 0.59 | |
| | | | | | | | | | | | | | | | | | | | |
Total from investment operations | | | 0.54 | | | | 4.74 | | | | (0.60 | ) | | | 0.98 | | | | 0.81 | |
Distributions to shareholders from | | | | | | | | | | | | | | | | | | | | |
Net investment income | | | (0.23 | ) | | | (0.24 | ) | | | (0.27 | ) | | | (0.18 | ) | | | (0.29 | ) |
Net realized gains | | | (1.69 | ) | | | (0.95 | ) | | | (2.46 | ) | | | (0.37 | ) | | | 0.00 | |
| | | | | | | | | | | | | | | | | | | | |
Total distributions to shareholders | | | (1.92 | ) | | | (1.19 | ) | | | (2.73 | ) | | | (0.55 | ) | | | (0.29 | ) |
Net asset value, end of period | | | $21.60 | | | | $22.98 | | | | $19.43 | | | | $22.76 | | | | $22.33 | |
Total return | | | 2.22 | % | | | 25.60 | % | | | (2.43 | )% | | | 4.51 | % | | | 3.70 | % |
Ratios to average net assets (annualized) | | | | | | | | | | | | | | | | | | | | |
Gross expenses | | | 1.38 | % | | | 1.38 | % | | | 1.37 | % | | | 1.34 | % | | | 1.29 | % |
Net expenses | | | 1.25 | % | | | 1.25 | % | | | 1.22 | % | | | 1.15 | % | | | 1.15 | % |
Net investment income | | | 0.65 | % | | | 0.95 | % | | | 1.27 | % | | | 1.01 | % | | | 0.96 | % |
Supplemental data | | | | | | | | | | | | | | | | | | | | |
Portfolio turnover rate | | | 20 | % | | | 21 | % | | | 23 | % | | | 32 | % | | | 23 | % |
Net assets, end of period (000s omitted) | | | $1,628 | | | | $4,727 | | | | $4,735 | | | | $6,239 | | | | $7,327 | |
| 1 | Calculated based upon average shares outstanding |
The accompanying notes are an integral part of these financial statements.
| | | | |
| 20 | | Wells Fargo Intrinsic World Equity Fund | | Financial highlights |
(For a share outstanding throughout each period)
| | | | | | | | | | | | | | | | | | | | |
| | | Year ended October 31 | |
| INSTITUTIONAL CLASS | | 2018 | | | 2017 | | | 2016 | | | 2015 | | | 2014 | |
Net asset value, beginning of period | | | $23.05 | | | | $19.51 | | | | $22.83 | | | | $22.40 | | | | $21.87 | |
Net investment income | | | 0.25 | 1 | | | 0.27 | | | | 0.26 | | | | 0.28 | | | | 0.25 | 1 |
Net realized and unrealized gains (losses) on investments | | | 0.35 | | | | 4.53 | | | | (0.80 | ) | | | 0.75 | | | | 0.60 | |
| | | | | | | | | | | | | | | | | | | | |
Total from investment operations | | | 0.60 | | | | 4.80 | | | | (0.54 | ) | | | 1.03 | | | | 0.85 | |
Distributions to shareholders from | | | | | | | | | | | | | | | | | | | | |
Net investment income | | | (0.27 | ) | | | (0.31 | ) | | | (0.32 | ) | | | (0.23 | ) | | | (0.32 | ) |
Net realized gains | | | (1.69 | ) | | | (0.95 | ) | | | (2.46 | ) | | | (0.37 | ) | | | 0.00 | |
| | | | | | | | | | | | | | | | | | | | |
Total distributions to shareholders | | | (1.96 | ) | | | (1.26 | ) | | | (2.78 | ) | | | (0.60 | ) | | | (0.32 | ) |
Net asset value, end of period | | | $21.69 | | | | $23.05 | | | | $19.51 | | | | $22.83 | | | | $22.40 | |
Total return | | | 2.52 | % | | | 25.92 | % | | | (2.13 | )% | | | 4.72 | % | | | 3.90 | % |
Ratios to average net assets (annualized) | | | | | | | | | | | | | | | | | | | | |
Gross expenses | | | 1.14 | % | | | 1.14 | % | | | 1.13 | % | | | 1.09 | % | | | 1.04 | % |
Net expenses | | | 0.95 | % | | | 0.95 | % | | | 0.95 | % | | | 0.95 | % | | | 0.95 | % |
Net investment income | | | 1.10 | % | | | 1.28 | % | | | 1.47 | % | | | 1.23 | % | | | 1.11 | % |
Supplemental data | | | | | | | | | | | | | | | | | | | | |
Portfolio turnover rate | | | 20 | % | | | 21 | % | | | 23 | % | | | 32 | % | | | 23 | % |
Net assets, end of period (000s omitted) | | | $7,456 | | | | $6,681 | | | | $4,357 | | | | $5,058 | | | | $3,179 | |
| 1 | Calculated based upon average shares outstanding |
The accompanying notes are an integral part of these financial statements.
| | | | | | |
| Notes to financial statements | | Wells Fargo Intrinsic World Equity Fund | | | 21 | |
1. ORGANIZATION
Wells Fargo Funds Trust (the “Trust”), a Delaware statutory trust organized on March 10, 1999, is an open-end management investment company registered under the Investment Company Act of 1940, as amended (the “1940 Act”). As an investment company, the Trust follows the accounting and reporting guidance in Financial Accounting Standards Board (“FASB”) Accounting Standards Codification Topic 946, Financial Services – Investment Companies. These financial statements report on the Wells Fargo Intrinsic World Equity Fund (the “Fund”) which is a diversified series of the Trust.
2. SIGNIFICANT ACCOUNTING POLICIES
The following significant accounting policies, which are consistently followed in the preparation of the financial statements of the Fund, are in conformity with U.S. generally accepted accounting principles which require management to make estimates and assumptions that affect the reported amounts of assets and liabilities, disclosure of contingent assets and liabilities at the date of the financial statements, and the reported amounts of revenues and expenses during the reporting period. Actual results could differ from those estimates.
Securities valuation
All investments are valued each business day as of the close of regular trading on the New York Stock Exchange (generally 4 p.m. Eastern Time), although the Fund may deviate from this calculation time under unusual or unexpected circumstances.
Equity securities that are listed on a foreign or domestic exchange or market are valued at the official closing price or, if none, the last sales price. If no sale occurs on the principal exchange or market that day, a fair value price will be determined in accordance with the Fund’s Valuation Procedures.
The values of securities denominated in foreign currencies are translated into U.S. dollars at rates provided by an independent foreign currency pricing source at a time each business day specified by the Wells Fargo Asset Management Pricing Committee at Wells Fargo Funds Management, LLC (“Funds Management”).
Many securities markets and exchanges outside the U.S. close prior to the close of the New York Stock Exchange and therefore may not fully reflect trading or events that occur after the close of the principal exchange in which the foreign securities are traded, but before the close of the New York Stock Exchange. If such trading or events are expected to materially affect the value of such securities, then fair value pricing procedures approved by the Board of Trustees of the Fund are applied. These procedures take into account multiple factors including movements in U.S. securities markets after foreign exchanges close. Foreign securities that are fair valued under these procedures are categorized as Level 2 and the application of these procedures may result in transfers between Level 1 and Level 2. Depending on market activity, such fair valuations may be frequent. Such fair value pricing may result in net asset values that are higher or lower than net asset values based on the last reported sales price or latest quoted bid price. On October 31, 2018, such fair value pricing was not used in pricing foreign securities.
Investments in registered open-end investment companies are valued at net asset value. Interests in non-registered investment companies that are redeemable at net asset value are fair valued normally at net asset value.
Investments which are not valued using any of the methods discussed above are valued at their fair value, as determined in good faith by the Board of Trustees. The Board of Trustees has established a Valuation Committee comprised of the Trustees and has delegated to it the authority to take any actions regarding the valuation of portfolio securities that the Valuation Committee deems necessary or appropriate, including determining the fair value of portfolio securities, unless the determination has been delegated to the Wells Fargo Asset Management Pricing Committee. The Board of Trustees retains the authority to make or ratify any valuation decisions or approve any changes to the Valuation Procedures as it deems appropriate. On a quarterly basis, the Board of Trustees receives reports on any valuation actions taken by the Valuation Committee or the Wells Fargo Asset Management Pricing Committee which may include items for ratification.
Foreign currency translation
The accounting records of the Fund are maintained in U.S. dollars. The values of other assets and liabilities denominated in foreign currencies are translated into U.S. dollars at rates provided by an independent foreign currency pricing source at a time each business day specified by the Wells Fargo Asset Management Pricing Committee. Purchases and sales of securities, and income and expenses are converted at the rate of exchange on the respective dates of such transactions. Net realized foreign exchange gains or losses arise from sales of foreign currencies, currency gains or losses realized between the trade and settlement dates on securities transactions, and the difference between the amounts of dividends, interest and foreign withholding taxes recorded and the U.S. dollar equivalent of the amounts actually paid or received. Net unrealized foreign exchange gains and losses arise from changes in the fair value of assets and liabilities
| | | | |
| 22 | | Wells Fargo Intrinsic World Equity Fund | | Notes to financial statements |
other than investments in securities resulting from changes in exchange rates. The changes in net assets arising from changes in exchange rates of securities and the changes in net assets resulting from changes in market prices of securities are not separately presented. Such changes are included in net realized and unrealized gains or losses from investments.
Securities lending
The Fund may lend its securities from time to time in order to earn additional income in the form of fees or interest on securities received as collateral or the investment of any cash received as collateral. The Fund continues to receive interest or dividends on the securities loaned. The Fund receives collateral in the form of cash or securities with a value at least equal to the value of the securities on loan. The value of the loaned securities is determined at the close of each business day and any additional required collateral is delivered to the Fund on the next business day. In a securities lending transaction, the net asset value of the Fund will be affected by an increase or decrease in the value of the securities loaned and by an increase or decrease in the value of the instrument in which collateral is invested. The amount of securities lending activity undertaken by the Fund fluctuates from time to time. In the event of default or bankruptcy by the borrower, the Fund may be prevented from recovering the loaned securities or gaining access to the collateral or may experience delays or costs in doing so. In addition, the investment of any cash collateral received may lose all or part of its value. The Fund has the right under the lending agreement to recover the securities from the borrower on demand.
The Fund lends its securities through an unaffiliated securities lending agent. Cash collateral received in connection with its securities lending transactions is invested in Securities Lending Cash Investments, LLC (the “Securities Lending Fund”). The Securities Lending Fund is exempt from registration under Section 3(c)(7) of the 1940 Act and is managed by Funds Management and is subadvised by Wells Capital Management Incorporated (“WellsCap”), an affiliate of Funds Management and an indirect wholly owned subsidiary of Wells Fargo & Company (“Wells Fargo”). Funds Management receives an advisory fee starting at 0.05% and declining to 0.01% as the average daily net assets of the Securities Lending Fund increase. All of the fees received by Funds Management are paid to WellsCap for its services as subadviser. The Securities Lending Fund seeks to provide a positive return compared to the daily Fed Funds Open Rate by investing in high-quality, U.S. dollar-denominated short-term money market instruments. Securities Lending Fund investments are valued at the evaluated bid price provided by an independent pricing service. Income earned from investment in the Securities Lending Fund, if any, is included in income from affiliated securities on the Statement of Operations.
Security transactions and income recognition
Securities transactions are recorded on a trade date basis. Realized gains or losses are recorded on the basis of identified cost.
Dividend income is recognized on the ex-dividend date, except for certain dividends from foreign securities, which are recorded as soon as the custodian verifies the ex-dividend date. Dividend income from foreign securities is recorded net of foreign taxes withheld where recovery of such taxes is not assured.
Distributions to shareholders
Distributions to shareholders from net investment income and any net realized gains are recorded on the ex-dividend date and paid at least annually. Such distributions are determined in accordance with income tax regulations and may differ from U.S. generally accepted accounting principles. Dividend sources are estimated at the time of declaration. The tax character of distributions is determined as of the Fund’s fiscal year end. Therefore, a portion of the Fund’s distributions made prior to the Fund’s fiscal year end may be categorized as a tax return of capital at year end.
Federal and other taxes
The Fund intends to continue to qualify as a regulated investment company by distributing substantially all of its investment company taxable income and any net realized capital gains (after reduction for capital loss carryforwards) sufficient to relieve it from all, or substantially all, federal income taxes. Accordingly, no provision for federal income taxes was required.
The Fund’s income and federal excise tax returns and all financial records supporting those returns for the prior three fiscal years are subject to examination by the federal and Delaware revenue authorities. Management has analyzed the Fund’s tax positions taken on federal, state, and foreign tax returns for all open tax years and does not believe that there are any uncertain tax positions that require recognition of a tax liability.
| | | | | | |
| Notes to financial statements | | Wells Fargo Intrinsic World Equity Fund | | | 23 | |
As of October 31, 2018, the aggregate cost of all investments for federal income tax purposes was $124,285,175 and the unrealized gains (losses) consisted of:
| | | | |
Gross unrealized gains | | $ | 34,824,249 | |
Gross unrealized losses | | | (9,872,838 | ) |
Net unrealized gains | | $ | 24,951,411 | |
Class allocations
The separate classes of shares offered by the Fund differ principally in applicable sales charges, distribution, shareholder servicing, and administration fees. Class specific expenses are charged directly to that share class. Investment income, common expenses, and realized and unrealized gains (losses) on investments are allocated daily to each class of shares based on the relative proportion of net assets of each class.
3. FAIR VALUATION MEASUREMENTS
Fair value measurements of investments are determined within a framework that has established a fair value hierarchy based upon the various data inputs utilized in determining the value of the Fund’s investments. The three-level hierarchy gives the highest priority to unadjusted quoted prices in active markets for identical assets or liabilities (Level 1) and the lowest priority to unobservable inputs (Level 3). The Fund’s investments are classified within the fair value hierarchy based on the lowest level of input that is significant to the fair value measurement. The inputs are summarized into three broad levels as follows:
| ∎ | | Level 1 – quoted prices in active markets for identical securities |
| ∎ | | Level 2 – other significant observable inputs (including quoted prices for similar securities, interest rates, prepayment speeds, credit risk, etc.) |
| ∎ | | Level 3 – significant unobservable inputs (including the Fund’s own assumptions in determining the fair value of investments) |
The inputs or methodologies used for valuing investments in securities are not necessarily an indication of the risk associated with investing in those securities.
The following is a summary of the inputs used in valuing the Fund’s assets and liabilities as of October 31, 2018:
| | | | | | | | | | | | | | | | |
| | | Quoted prices
(Level 1) | | | Other significant
observable inputs
(Level 2) | | | Significant
unobservable inputs (Level 3) | | | Total | |
Assets | | | | | | | | | | | | | | | | |
Investments in: | | | | | | | | | | | | | | | | |
| | | | |
Common stocks | | | | | | | | | | | | | | | | |
Belgium | | $ | 2,426,544 | | | $ | 0 | | | $ | 0 | | | $ | 2,426,544 | |
France | | | 9,805,186 | | | | 0 | | | | 0 | | | | 9,805,186 | |
Germany | | | 4,300,380 | | | | 0 | | | | 0 | | | | 4,300,380 | |
Hong Kong | | | 5,904,013 | | | | 0 | | | | 0 | | | | 5,904,013 | |
Japan | | | 10,709,592 | | | | 0 | | | | 0 | | | | 10,709,592 | |
Netherlands | | | 8,204,553 | | | | 0 | | | | 0 | | | | 8,204,553 | |
Switzerland | | | 10,611,690 | | | | 0 | | | | 0 | | | | 10,611,690 | |
United Kingdom | | | 10,251,802 | | | | 0 | | | | 0 | | | | 10,251,802 | |
United States | | | 84,094,371 | | | | 0 | | | | 0 | | | | 84,094,371 | |
| | | | |
Short-term investments | | | | | | | | | | | | | | | | |
Investment companies | | | 564,878 | | | | 2,363,577 | | | | 0 | | | | 2,928,455 | |
Total assets | | $ | 146,873,009 | | | $ | 2,363,577 | | | $ | 0 | | | $ | 149,236,586 | |
Additional sector, industry or geographic detail is included in the Portfolio of Investments.
At October 31, 2018, the Fund did not have any transfers into/out of Level 3.
| | | | |
| 24 | | Wells Fargo Intrinsic World Equity Fund | | Notes to financial statements |
4. TRANSACTIONS WITH AFFILIATES
Management fee
Funds Management, an indirect wholly owned subsidiary of Wells Fargo, is the manager of the Fund and provides advisory and fund-level administrative services under an investment management agreement. Under the investment management agreement, Funds Management is responsible for, among other services, implementing the investment objectives and strategies of the Fund, supervising the subadviser and providing fund-level administrative services in connection with the Fund’s operations. As compensation for its services under the investment management agreement, Funds Management is entitled to receive an annual management fee starting at 0.85% and declining to 0.68% as the average daily net assets of the Fund increase. For the year ended October 31, 2018, the management fee was equivalent to an annual rate of 0.85% of the Fund’s average daily net assets.
Funds Management has retained the services of a subadviser to provide daily portfolio management to the Fund. The fee for subadvisory services is borne by Funds Management. WellsCap is the subadviser to the Fund and is entitled to receive a fee from Funds Management at an annual rate starting at 0.35% and declining to 0.20% as the average daily net assets of the Fund increase.
Administration fees
Under a class-level administration agreement, Funds Management provides class-level administrative services to the Fund, which includes paying fees and expenses for services provided by the transfer agent, sub-transfer agents, omnibus account servicers and record-keepers. As compensation for its services under the class-level administration agreement, Funds Management receives an annual fee which is calculated based on the average daily net assets of each class as follows:
| | | | |
| | | Class-level
administration fee | |
Class A, Class C | | | 0.21 | % |
Administrator Class, Institutional Class | | | 0.13 | |
Funds Management has contractually waived and/or reimbursed management and administration fees to the extent necessary to maintain certain net operating expense ratios for the Fund. When each class of the Fund has exceeded its expense cap, Funds Management has waived fees and/or reimbursed expenses from fund level expenses on a proportionate basis and then from class specific expenses; otherwise, waivers and/or reimbursements are applied against class specific expenses before fund level expenses. Funds Management has committed through February 28, 2019 to waive fees and/or reimburse expenses to the extent necessary to cap the Fund’s expenses at 1.35% for Class A shares, 2.10% for Class C shares, 1.25% for Administrator Class shares, and 0.95% for Institutional Class shares. After this time, the cap may be increased or the commitment to maintain the cap may be terminated only with the approval of the Board of Trustees.
Distribution fee
The Trust has adopted a distribution plan for Class C shares of the Fund pursuant to Rule 12b-1 under the 1940 Act. A distribution fee is charged to Class C shares and paid to Wells Fargo Funds Distributor, LLC (“Funds Distributor”), the principal underwriter, at an annual rate of 0.75% of the average daily net assets of Class C shares.
In addition, Funds Distributor is entitled to receive the front-end sales charge from the purchase of Class A shares and a contingent deferred sales charge on the redemption of certain Class A shares. Funds Distributor is also entitled to receive the contingent deferred sales charges from redemptions of Class C shares. For the year ended October 31, 2018, Funds Distributor received $2,143 from the sale of Class A shares. No contingent deferred sales charges were incurred by Class A and Class C shares for the year ended October 31, 2018.
Shareholder servicing fees
The Trust has entered into contracts with one or more shareholder servicing agents, whereby Class A, Class C, and Administrator Class of the Fund are charged a fee at an annual rate of 0.25% of the average daily net assets of each respective class.
A portion of these total shareholder servicing fees were paid to affiliates of Wells Fargo.
| | | | | | |
| Notes to financial statements | | Wells Fargo Intrinsic World Equity Fund | | | 25 | |
Interfund transactions
The Fund may purchase or sell portfolio investment securities to certain other Wells Fargo affiliates pursuant to Rule 17a-7 under the 1940 Act and under procedures adopted by the Board of Trustees. The procedures have been designed to ensure that these interfund transactions, which do not incur broker commissions, are effected at current market prices.
5. INVESTMENT PORTFOLIO TRANSACTIONS
Purchases and sales of investments, excluding U.S. government obligations (if any) and short-term securities, for the year ended October 31, 2018 were $31,655,266 and $47,595,872, respectively.
6. BANK BORROWINGS
The Trust (excluding the money market funds), Wells Fargo Master Trust and Wells Fargo Variable Trust are parties to a $280,000,000 revolving credit agreement whereby the Fund is permitted to use bank borrowings for temporary or emergency purposes, such as to fund shareholder redemption requests. Interest under the credit agreement is charged to the Fund based on a borrowing rate equal to the higher of the Federal Funds rate in effect on that day plus 1.25% or the overnight LIBOR rate in effect on that day plus 1.25%. In addition, an annual commitment fee equal to 0.25% of the unused balance is allocated to each participating fund.
For the year ended October 31, 2018, there were no borrowings by the Fund under the agreement.
7. DISTRIBUTIONS TO SHAREHOLDERS
The tax character of distributions paid during the years ended October 31, 2018 and October 31, 2017 were as follows:
| | | | | | | | |
| | | Year ended October 31 | |
| | | 2018 | | | 2017 | |
Ordinary income | | | $1,951,186 | | | | $1,716,402 | |
Long-term capital gain | | | 11,144,067 | | | | 6,900,338 | |
As of October 31, 2018, the components of distributable earnings on a tax basis were as follows:
| | | | |
Undistributed
ordinary
income | | Undistributed
long-term
gain | | Unrealized
gains |
| $1,598,526 | | $14,375,986 | | $24,949,958 |
Effective for all filings after November 4, 2018, the Securities and Exchange Commission eliminated the requirement to separately state the components of distributions to shareholders. The amounts of distributions to shareholders for the year ended October 31, 2017 were as follows:
| | | | | | | | |
| | | Net investment
income | | | Net realized
gains | |
Class A | | | $1,555,768 | | | | $6,105,260 | |
Class C | | | 31,841 | | | | 361,793 | |
Administrator Class | | | 46,398 | | | | 186,415 | |
Institutional Class | | | 82,395 | | | | 246,870 | |
8. INDEMNIFICATION
Under the Trust’s organizational documents, the officers and Trustees have been granted certain indemnification rights against certain liabilities that may arise out of performance of their duties to the Trust. Additionally, in the normal course of business, the Trust may enter into contracts with service providers that contain a variety of indemnification clauses. The Trust’s maximum exposure under these arrangements is dependent on future claims that may be made against the Fund and, therefore, cannot be estimated.
| | | | |
| 26 | | Wells Fargo Intrinsic World Equity Fund | | Notes to financial statements |
9. NEW ACCOUNTING PRONOUNCEMENT
In August 2018, FASB issued Accounting Standards Update (“ASU”) No. 2018-13, Fair Value Measurement (Topic 820) Disclosure Framework—Changes to the Disclosure Requirements for Fair Value Measurement. ASU 2018-13 updates the disclosure requirements for fair value measurements by modifying or removing certain disclosures and adding certain new disclosures. The amendments are effective for fiscal years, and interim periods within those fiscal years, beginning after December 15, 2019. Early adoption is permitted. Management has adopted the removal and modification of disclosures early, as permitted, and will adopt the additional new disclosures at the effective date.
10. SUBSEQUENT DISTRIBUTIONS
On December 10, 2018, the Fund declared distributions from short-term capital gains and long-term capital gains to shareholders of record on December 7, 2018. The per share amounts payable on December 11, 2018 were as follows:
| | | | | | | | |
| | | Short-term
capital gains | | | Long-term
capital gains | |
Class A | | | $0.08065 | | | | $2.13367 | |
Class C | | | 0.08065 | | | | 2.13367 | |
Administrator Class | | | 0.08065 | | | | 2.13367 | |
Institutional Class | | | 0.08065 | | | | 2.13367 | |
These distributions are not reflected in the accompanying financial statements.
| | | | | | |
| Report of independent registered public accounting firm | | Wells Fargo Intrinsic World Equity Fund | | | 27 | |
BOARD OF TRUSTEES AND SHAREHOLDERS OF WELLS FARGO FUNDS TRUST:
Opinion on the Financial Statements
We have audited the accompanying statement of assets and liabilities of Wells Fargo Intrinsic World Equity Fund (the “Fund”), one of the funds constituting Wells Fargo Funds Trust, including the portfolio of investments, as of October 31, 2018, the related statements of operations for the year then ended, the statements of changes in net assets for each of the years in the two-year period then ended, and the related notes (collectively, the “financial statements”) and the financial highlights for each of the years in the five-year period then ended. In our opinion, the financial statements and financial highlights present fairly, in all material respects, the financial position of the Fund as of October 31, 2018, the results of its operations for the year then ended, the changes in its net assets for each of the years in the two-year period then ended, and the financial highlights for each of the years in the five-year period then ended, in conformity with U.S. generally accepted accounting principles.
Basis for Opinion
These financial statements and financial highlights are the responsibility of the Fund’s management. Our responsibility is to express an opinion on these financial statements and financial highlights based on our audits. We are a public accounting firm registered with the Public Company Accounting Oversight Board (United States) (“PCAOB”) and are required to be independent with respect to the Fund in accordance with the U.S. federal securities laws and the applicable rules and regulations of the Securities and Exchange Commission and the PCAOB.
We conducted our audits in accordance with the standards of the PCAOB. Those standards require that we plan and perform the audit to obtain reasonable assurance about whether the financial statements and financial highlights are free of material misstatement, whether due to error or fraud. Our audits included performing procedures to assess the risks of material misstatement of the financial statements and financial highlights, whether due to error or fraud, and performing procedures that respond to those risks. Such procedures included examining, on a test basis, evidence regarding the amounts and disclosures in the financial statements and financial highlights. Such procedures also included confirmation of securities owned as of October 31, 2018, by correspondence with the custodian and brokers, or by other appropriate auditing procedures. Our audits also included evaluating the accounting principles used and significant estimates made by management, as well as evaluating the overall presentation of the financial statements and financial highlights. We believe that our audits provide a reasonable basis for our opinion.

We have not been able to determine the specific year that we began serving as the auditor of one or more Wells Fargo Funds investment companies, however we are aware that we have served as the auditor of one or more Wells Fargo Funds investment companies since at least 1955.
Boston, Massachusetts
December 21, 2018
| | | | |
| 28 | | Wells Fargo Intrinsic World Equity Fund | | Other information (unaudited) |
TAX INFORMATION
For corporate shareholders, pursuant to Section 854 of the Internal Revenue Code, 69.90% of ordinary income dividends qualify for the corporate dividends-received deduction for the fiscal year ended October 31, 2018.
Pursuant to Section 852 of the Internal Revenue Code, $11,144,067 was designated as a 20% rate gain distribution for the fiscal year ended October 31, 2018.
Pursuant to Section 854 of the Internal Revenue Code, $1,951,186 of income dividends paid during the fiscal year ended October 31, 2018 has been designated as qualified dividend income (QDI).
For the fiscal year ended October 31, 2018, $481,709 has been designated as short-term capital gain dividends for nonresident alien shareholders pursuant to Section 871 of the Internal Revenue Code.
PROXY VOTING INFORMATION
A description of the policies and procedures that the Fund uses to determine how to vote proxies relating to portfolio securities is available, upon request, by calling 1-800-222-8222, visiting our website at wellsfargofunds.com, or visiting the SEC website at sec.gov. Information regarding how the Fund voted proxies relating to portfolio securities during the most recent 12-month period ended June 30 is available on the Fund’s website at wellsfargofunds.com or by visiting the SEC website at sec.gov.
PORTFOLIO HOLDINGS INFORMATION
The complete portfolio holdings for the Fund are publicly available monthly on the Fund’s website (wellsfargofunds.com), on a one-month delayed basis. In addition, top ten holdings information (excluding derivative positions) for the Fund is publicly available on the Fund’s website on a monthly, seven-day or more delayed basis. The Fund files its complete schedule of portfolio holdings with the SEC for the first and third quarters of each fiscal year on Form N-Q, which is available by visiting the SEC website at sec.gov. In addition, the Fund’s Form N-Q may be reviewed and copied at the SEC’s Public Reference Room in Washington, DC, and at regional offices in New York City, at 233 Broadway, and in Chicago, at 175 West Jackson Boulevard, Suite 900. Information about the Public Reference Room may be obtained by calling 1-800-SEC-0330.
| | | | | | |
| Other information (unaudited) | | Wells Fargo Intrinsic World Equity Fund | | | 29 | |
BOARD OF TRUSTEES AND OFFICERS
Each of the Trustees and Officers1 listed in the table below acts in identical capacities for each fund in the Wells Fargo family of funds, which consists of 152 mutual funds comprising the Wells Fargo Funds Trust, Wells Fargo Variable Trust, Wells Fargo Master Trust and four closed-end funds (collectively the “Fund Complex”). This table should be read in conjunction with the Prospectus and the Statement of Additional Information2. The mailing address of each Trustee and Officer is 525 Market Street, 12th Floor, San Francisco, CA 94105. Each Trustee and Officer serves an indefinite term, however, each Trustee serves such term until reaching the mandatory retirement age established by the Trustees.
Independent Trustees
| | | | | | |
Name and
year of birth | | Position held and
length of service* | | Principal occupations during past five years or longer | | Current other
public company or
investment company
directorships |
William R. Ebsworth
(Born 1957) | | Trustee, since 2015 | | Retired. From 1984 to 2013, equities analyst, portfolio manager, research director and chief investment officer at Fidelity Management and Research Company in Boston, Tokyo, and Hong Kong, and retired in 2013 as Chief Investment Officer of Fidelity Strategic Advisers, Inc. where he led a team of investment professionals managing client assets. Prior thereto, Board member of Hong Kong Securities Clearing Co., Hong Kong Options Clearing Corp., the Thailand International Fund, Ltd., Fidelity Investments Life Insurance Company, and Empire Fidelity Investments Life Insurance Company. Board member of the Vincent Memorial Hospital Endowment (non-profit organization), where he serves on the Investment Committee and as a Chair of the Audit Committee. Mr. Ebsworth is a CFA® charterholder. | | N/A |
Jane A. Freeman
(Born 1953) | | Trustee, since 2015; Chair Liaison, since 2018 | | Retired. From 2012 to 2014 and 1999 to 2008, Chief Financial Officer of Scientific Learning Corporation. From 2008 to 2012, Ms. Freeman provided consulting services related to strategic business projects. Prior to 1999, Portfolio Manager at Rockefeller & Co. and Scudder, Stevens & Clark. Board member of the Harding Loevner Funds from 1996 to 2014, serving as both Lead Independent Director and chair of the Audit Committee. Board member of the Russell Exchange Traded Funds Trust from 2011 to 2012 and the chair of the Audit Committee. Ms. Freeman is a Board Member of The Ruth Bancroft Garden (non-profit organization). She is also an inactive Chartered Financial Analyst. | | N/A |
Isaiah Harris, Jr.3
(Born 1952) | | Trustee, since 2009 | | Retired. Chairman of the Board of CIGNA Corporation since 2009, and Director since 2005. From 2003 to 2011, Director of Deluxe Corporation. Prior thereto, President and CEO of BellSouth Advertising and Publishing Corp. from 2005 to 2007, President and CEO of BellSouth Enterprises from 2004 to 2005 and President of BellSouth Consumer Services from 2000 to 2003. Emeritus member of the Iowa State University Foundation Board of Governors. Emeritus Member of the Advisory Board of Iowa State University School of Business. Advisory Board Member, Palm Harbor Academy (private school). Advisory Board Member, Child Evangelism Fellowship (non-profit). Mr. Harris is a certified public accountant (inactive status). | | CIGNA Corporation |
Judith M. Johnson3
(Born 1949) | | Trustee, since 2008; Audit Committee Chairman, since 2009 | | Retired. Prior thereto, Chief Executive Officer and Chief Investment Officer of Minneapolis Employees Retirement Fund from 1996 to 2008. Ms. Johnson is an attorney, certified public accountant and a certified managerial accountant. | | N/A |
David F. Larcker
(Born 1950) | | Trustee, since 2009 | | James Irvin Miller Professor of Accounting at the Graduate School of Business, Stanford University, Director of the Corporate Governance Research Initiative and Senior Faculty of The Rock Center for Corporate Governance since 2006. From 2005 to 2008, Professor of Accounting at the Graduate School of Business, Stanford University. Prior thereto, Ernst & Young Professor of Accounting at The Wharton School, University of Pennsylvania from 1985 to 2005. | | N/A |
| | | | |
| 30 | | Wells Fargo Intrinsic World Equity Fund | | Other information (unaudited) |
| | | | | | |
Name and
year of birth | | Position held and
length of service* | | Principal occupations during past five years or longer | | Current other
public company or
investment company
directorships |
Olivia S. Mitchell
(Born 1953) | | Trustee, since 2006; Nominating and Governance Committee Chairman, since 2018 | | International Foundation of Employee Benefit Plans Professor, Wharton School of the University of Pennsylvania since 1993. Director of Wharton’s Pension Research Council and Boettner Center on Pensions & Retirement Research, and Research Associate at the National Bureau of Economic Research. Previously, Cornell University Professor from 1978 to 1993. | | N/A |
Timothy J. Penny
(Born 1951) | | Trustee, since 1996; Chairman, since 2018; Vice Chairman, from 2017 to 2018 | | President and Chief Executive Officer of Southern Minnesota Initiative Foundation, a non-profit organization, since 2007. Member of the Board of Trustees of NorthStar Education Finance, Inc., a non-profit organization, since 2007. | | N/A |
James G. Polisson
(Born 1959) | | Trustee, since 2018; Advisory Board Member, from 2017 to 2018 | | Retired. Chief Marketing Officer, Source (ETF) UK Services, Ltd, from 2015 to 2017. From 2012 to 2015, Principal of The Polisson Group, LLC, a management consulting, corporate advisory and principal investing company. Chief Executive Officer and Managing Director at Russell Investments, Global Exchange Traded Funds from 2010 to 2012. Managing Director of Barclays Global Investors from 1998 to 2010 and Global Chief Marketing Officer for iShares and Barclays Global Investors from 2000 to 2010. Trustee of the San Francisco Mechanics’ Institute, a non-profit organization, from 2013 to 2015. Board member of the Russell Exchange Traded Fund Trust from 2011 to 2012. Director of Barclays Global Investors Holdings Deutschland GmbH from 2006 to 2009. Mr. Polisson is an attorney and has a retired status with the Massachusetts and District of Columbia Bar Associations. | | N/A |
Michael S. Scofield4
(Born 1943) | | Trustee, since 2010 | | Served on the Investment Company Institute’s Board of Governors and Executive Committee from 2008-2011 as well the Governing Council of the Independent Directors Council from 2006-2011 and the Independent Directors Council Executive Committee from 2008-2011. Trustee of the Evergreen Fund complex (and its predecessors) from 1984 to 2010. Chairman of the Evergreen Funds from 2000-2010. Former Trustee of the Mentor Funds. Retired Attorney, Law Offices of Michael S. Scofield. | | N/A |
Pamela Wheelock
(Born 1959) | | Trustee, since 2018; Advisory Board Member, from 2017 to 2018 | | Chief Operating Officer, Twin Cities Habitat for Humanity, since January, 2017. Vice President of University Services, University of Minnesota from 2012 to 2017. Prior thereto, on the Board of Directors, Governance Committee and Finance Committee for the Minnesota Philanthropy Partners (Saint Paul Foundation) from 2012 to 2018, Interim President and Chief Executive Officer of Blue Cross Blue Shield of Minnesota from 2010 to 2011, Chairman of the Board from 2009 to 2011 and Board Director from 2003 to 2015. Vice President, Leadership and Community Engagement, Bush Foundation, Saint Paul, Minnesota (a private foundation) from 2009 to 2011. Executive Vice President and Chief Financial Officer, Minnesota Sports and Entertainment from 2004 to 2009 and Senior Vice President from 2002 to 2004. Commissioner of Finance, State of Minnesota, from 1999 to 2002. Currently the Board Chair of the Minnesota Wild Foundation since 2010. | | N/A |
| * | Length of service dates reflect the Trustee’s commencement of service with the Trust’s predecessor entities, where applicable. |
| | | | | | |
| Other information (unaudited) | | Wells Fargo Intrinsic World Equity Fund | | | 31 | |
Officers
| | | | | | |
Name and
year of birth | | Position held and
length of service | | Principal occupations during past five years or longer | | |
Andrew Owen (Born 1960) | | President, since 2017 | | Executive Vice President of Wells Fargo & Company and Head of Affiliated Managers, Wells Fargo Asset Management, since 2014. In addition, Mr. Owen is currently President, Chief Executive Officer and Director of Wells Fargo Funds Management, LLC since 2017. Prior thereto, Executive Vice President responsible for marketing, investments and product development for Wells Fargo Funds Management, LLC, from 2009 to 2014. | | |
Jeremy DePalma1 (Born 1974) | | Treasurer, since 2012 | | Senior Vice President of Wells Fargo Funds Management, LLC since 2009. Senior Vice President of Evergreen Investment Management Company, LLC from 2008 to 2010 and head of the Fund Reporting and Control Team within Fund Administration from 2005 to 2010. | | |
Alexander Kymn (Born 1973) | | Secretary, since 2018; Chief Legal Officer, since 2018 | | Senior Company Counsel of Wells Fargo Bank, N.A. since 2018 (previously Senior Counsel from 2007 to 2018). Vice President of Wells Fargo Funds Management, LLC from 2008 to 2014. | | |
Michael H. Whitaker (Born 1967) | | Chief Compliance Officer, since 2016 | | Senior Vice President and Chief Compliance Officer since 2016. Senior Vice President and Chief Compliance Officer for Fidelity Investments from 2007 to 2016. | | |
David Berardi (Born 1975) | | Assistant Treasurer, since 2009 | | Vice President of Wells Fargo Funds Management, LLC since 2009. Vice President of Evergreen Investment Management Company, LLC from 2008 to 2010. Manager of Fund Reporting and Control for Evergreen Investment Management Company, LLC from 2004 to 2010. | | |
| 1 | Jeremy DePalma acts as Treasurer of 76 funds and Assistant Treasurer of 76 funds in the Fund Complex. |
| 2 | The Statement of Additional Information includes additional information about the Trustees and is available, without charge, upon request, by calling 1-800-222-8222 or by visiting the website at wellsfargofunds.com. |
| 3 | Mr. Harris will replace Ms. Johnson as the Chairman of the Audit Committee effective January 1, 2019. |
| 4 | Mr. Scofield is expected to retire on December 31, 2018. |
| | | | |
| 32 | | Wells Fargo Intrinsic World Equity Fund | | Other information (unaudited) |
BOARD CONSIDERATION OF INVESTMENT MANAGEMENT AND SUB-ADVISORY AGREEMENTS:
Wells Fargo Intrinsic World Equity Fund
Under the Investment Company Act of 1940 (the “1940 Act”), the Board of Trustees (the “Board”) of Wells Fargo Funds Trust (the “Trust”) must determine annually whether to approve the continuation of the Trust’s investment management and sub-advisory agreements. In this regard, at an in-person meeting held on May 22-23, 2018 (the “Meeting”), the Board, all the members of which have no direct or indirect interest in the investment management and sub-advisory agreements and are not “interested persons” of the Trust, as defined in the 1940 Act (the “Independent Trustees”), reviewed and approved for Wells Fargo Intrinsic World Equity Fund (the “Fund”): (i) an investment management agreement (the “Management Agreement”) with Wells Fargo Funds Management, LLC (“Funds Management”); and (ii) an investment sub-advisory agreement (the “Sub-Advisory Agreement”) with Wells Capital Management Incorporated (the “Sub-Adviser”), an affiliate of Funds Management. The Management Agreement and the Sub-Advisory Agreement are collectively referred to as the “Advisory Agreements.”
At the Meeting, the Board considered the factors and reached the conclusions described below relating to the selection of Funds Management and the Sub-Adviser and the approval of the Advisory Agreements. Prior to the Meeting, including at an in-person meeting in April 2018, the Trustees conferred extensively among themselves and with representatives of Funds Management about these matters. Also, the Board has adopted a team-based approach, with each team consisting of a sub-set of Trustees, to assist the full Board in the discharge of its duties in reviewing investment performance and other matters throughout the year. The Independent Trustees were assisted in their evaluation of the Advisory Agreements by independent legal counsel, from whom they received separate legal advice and with whom they met separately.
In providing information to the Board, Funds Management and the Sub-Adviser were guided by a detailed set of requests for information submitted to them by independent legal counsel on behalf of the Independent Trustees at the start of the Board’s annual contract renewal process earlier in 2018. In considering and approving the Advisory Agreements, the Trustees considered the information they believed relevant, including but not limited to the information discussed below. The Board considered not only the specific information presented in connection with the Meeting, but also the knowledge gained over time through interaction with Funds Management and the Sub-Adviser about various topics. In this regard, the Board reviewed reports of Funds Management at each of its quarterly meetings, which included, among other things, portfolio reviews and investment performance reports. In addition, the Board and the teams mentioned above confer with portfolio managers at various times throughout the year. The Board did not identify any particular information or consideration that was all-important or controlling, and each individual Trustee may have attributed different weights to various factors.
After its deliberations, the Board unanimously approved the continuation of the Advisory Agreements for a one-year term and determined that the compensation payable to Funds Management and the Sub-Adviser under each of the Advisory Agreements was reasonable. The Board considered the approval of the Advisory Agreements for the Fund as part of its consideration of agreements for funds across the complex, but its approvals were made on a fund-by-fund basis. The following summarizes a number of important, but not necessarily all, factors considered by the Board in support of its approvals.
Nature, extent and quality of services
The Board received and considered various information regarding the nature, extent and quality of services provided to the Fund by Funds Management and the Sub-Adviser under the Advisory Agreements. This information included a description of the investment advisory services and Fund-level administrative services covered by the Management Agreement, as well as, among other things, a summary of the background and experience of senior management of Wells Fargo Asset Management (“WFAM”), of which Funds Management and the Sub-Adviser are a part, a summary of investments made in the business of WFAM, a summary of certain organizational and personnel changes involving Funds Management and the Sub-Adviser, and a description of Funds Management’s and the Sub-Adviser’s business continuity planning programs and of their approaches to data privacy and cybersecurity. The Board also considered the qualifications, background, tenure and responsibilities of each of the portfolio managers primarily responsible for the day-to-day portfolio management of the Fund.
The Board evaluated the ability of Funds Management and the Sub-Adviser to attract and retain qualified investment professionals, including research, advisory and supervisory personnel. The Board further considered the compliance programs and compliance records of Funds Management and the Sub-Adviser. In addition, the Board took into account the full range of services provided to the Fund by Funds Management and its affiliates.
| | | | | | |
| Other information (unaudited) | | Wells Fargo Intrinsic World Equity Fund | | | 33 | |
Fund investment performance and expenses
The Board considered the investment performance results for the Fund over various time periods ended December 31, 2017. The Board considered these results in comparison to the investment performance of funds in a universe that was determined by Broadridge Inc. (“Broadridge”) to be similar to the Fund (the “Universe”), and in comparison to the Fund’s benchmark index and to other comparative data. Broadridge is an independent provider of investment company data. The Board received a description of the methodology used by Broadridge to select the mutual funds in the performance Universe. The Board noted that the investment performance of the Fund (Administrator Class) was higher than the average investment performance of the Universe for all periods under review. The Board also noted that the investment performance of the Fund was higher than its benchmark index, the MSCI World Index, for the one-, three, and ten- year periods under review, but lower than its benchmark index for the five-year period under review.
The Board received information concerning, and discussed factors contributing to, the underperformance of the Fund relative to the benchmark for the period identified above. The Board took note of the explanations for the relative underperformance during this period, including with respect to investment decisions and market factors that affected the Fund’s investment performance.
The Board also received and considered information regarding the Fund’s net operating expense ratios and their various components, including actual management fees, custodian and other non-management fees, and Rule 12b-1 and non-Rule 12b-1 shareholder service fees. The Board considered these ratios in comparison to the median ratios of funds in class-specific expense groups that were determined by Broadridge to be similar to the Fund (the “Groups”). The Board received a description of the methodology used by Broadridge to select the mutual funds in the expense Groups and an explanation of how funds comprising expense groups and their expense ratios may vary from year-to-year. Based on the Broadridge reports, the Board noted that the net operating expense ratios of the Fund were lower than the median net operating expense ratios of the expense Groups for each share class.
The Board took into account the Fund’s investment performance and expense information provided to it among the factors considered in deciding to re-approve the Advisory Agreements.
Investment management and sub-advisory fee rates
The Board reviewed and considered the contractual fee rates payable by the Fund to Funds Management under the Management Agreement, as well as the contractual fee rates payable by the Fund to Funds Management for class-level administrative services under a Class-Level Administration Agreement, which include, among other things, class-level transfer agency and sub-transfer agency costs (collectively, the “Management Rates”). The Board also reviewed and considered the contractual investment sub-advisory fee rates that are payable by Funds Management to the Sub-Adviser for investment sub-advisory services.
Among other information reviewed by the Board was a comparison of the Fund’s Management Rates with the average contractual investment management fee rates of funds in the expense Groups at a common asset level as well as transfer agency costs of the funds in the expense Groups. The Board noted that the Management Rates of the Fund were lower than, equal to or in range of the sum of these average rates for the Fund’s expense Groups for all share classes.
The Board also received and considered information about the portion of the total management fee that was retained by Funds Management after payment of the fee to the Sub-Adviser for sub-advisory services. In assessing the reasonableness of this amount, the Board received and evaluated information about the nature and extent of responsibilities retained and risks assumed by Funds Management and not delegated to or assumed by the Sub-Adviser, and about Funds Management’s on-going oversight services. Given the affiliation between Funds Management and the Sub-Adviser, the Board ascribed limited relevance to the allocation of fees between them.
The Board also received and considered information about the nature and extent of services offered and fee rates charged by Funds Management and the Sub-Adviser to other types of clients with investment strategies similar to those of the Fund. In this regard, the Board received information about the significantly greater scope of services, and compliance, reporting and other legal burdens and risks of managing mutual funds compared with those associated with managing assets of non-mutual fund clients such as institutional separate accounts.
Based on its consideration of the factors and information it deemed relevant, including those described here, the Board determined that the compensation payable to Funds Management under the Management Agreement and to the Sub-Adviser under the Sub-Advisory Agreement was reasonable.
| | | | |
| 34 | | Wells Fargo Intrinsic World Equity Fund | | Other information (unaudited) |
Profitability
The Board received and considered information concerning the profitability of Funds Management, as well as the profitability of both WFAM and Wells Fargo & Co. (“Wells Fargo”) as a whole, from providing services to the Fund and the fund family as a whole. The Board noted that the Sub-Adviser’s profitability information with respect to providing services to the Fund was subsumed in the WFAM and Wells Fargo profitability analysis.
Funds Management reported on the methodologies and estimates used in calculating profitability, including a description of the methodology used to allocate certain expenses and recent enhancements made to the methodology. Among other things, the Board noted that the levels of profitability reported on a fund-by-fund basis varied widely, depending on factors such as the size and type of fund. Based on its review, the Board did not deem the profits reported by Funds Management, WFAM or Wells Fargo from services provided to the Fund to be at a level that would prevent it from approving the continuation of the Advisory Agreements.
Economies of scale
The Board considered the extent to which Funds Management may experience economies of scale in the provision of management services, and the extent to which scale benefits, if any, would be shared with shareholders. In particular, the Board noted the existence of breakpoints in the Fund’s management fee structure, which operate generally to reduce the Fund’s expense ratios as the Fund grows in size. It considered that, for a small fund or a fund that shrinks in size, breakpoints conversely can result in higher fee levels. The Board also considered that in addition to management fee breakpoints, competitive management fee rates set at the outset without regard to breakpoints and fee waiver and expense reimbursement arrangements, as well as investments in the business intended to enhance services available to Fund shareholders, are means of sharing potential economies of scale with shareholders of the Fund.
The Board concluded that the Fund’s fee and expense arrangements, including contractual breakpoints, constituted a reasonable approach to sharing potential economies of scale with the Fund and its shareholders.
Other benefits to Funds Management and the Sub-Adviser
The Board received and considered information regarding potential “fall-out” or ancillary benefits received by Funds Management and its affiliates, including the Sub-Adviser, as a result of their relationships with the Fund. Ancillary benefits could include, among others, benefits directly attributable to other relationships with the Fund and benefits potentially derived from an increase in Funds Management’s and the Sub-Adviser’s business as a result of their relationships with the Fund. The Board noted that various affiliates of Funds Management may receive distribution-related fees, shareholder servicing payments and sub-transfer agency fees in respect of shares sold or held through them and services provided.
The Board also reviewed information about soft dollar credits earned and utilized by the Sub-Adviser, fees earned by Funds Management and the Sub-Adviser from managing a private investment vehicle for the fund family’s securities lending collateral and commissions earned by an affiliated broker from portfolio transactions.
Based on its consideration of the factors and information it deemed relevant, including those described here, the Board did not find that any ancillary benefits received by Funds Management and its affiliates, including the Sub-Adviser, were unreasonable.
Conclusion
At the Meeting, after considering the above-described factors and based on its deliberations and its evaluation of the information described above, the Board unanimously approved the continuation of the Advisory Agreements for a one-year term and determined that the compensation payable to Funds Management and the Sub-Adviser under each of the Advisory Agreements was reasonable.
| | | | | | |
| Appendix A (unaudited) | | Wells Fargo Intrinsic World Equity Fund | | | 35 | |
SALES CHARGE REDUCTIONS AND WAIVERS FOR CERTAIN INTERMEDIARIES
Raymond James & Associates, Inc., Raymond James Financial Services & Raymond James affiliates (“Raymond James”)
Effective on or about March 1, 2019, shareholders purchasing Fund shares through a Raymond James platform or account will be eligible only for the following load waivers (front-end sales charge waivers and contingent deferred, or back-end, sales charge waivers) and discounts, which may differ from those disclosed elsewhere in the Fund’s Prospectus or SAI.
Front-end Sales Load Waivers on Class A shares Available at Raymond James
| | • | | Shares purchased in an investment advisory program. |
| | • | | Shares purchased through reinvestment of capital gains distributions and dividend reinvestment when purchasing shares of the same fund (but not any other fund within the fund family). |
| | • | | Employees and registered representatives of Raymond James or its affiliates and their family members as designated by Raymond James. |
| | • | | Shares purchased from the proceeds of redemptions within the same fund family, provided (1) the repurchase occurs within 90 days following the redemption, (2) the redemption and purchase occur in the same account, and (3) redeemed shares were subject to a front-end or deferred sales load (known as Rights of Reinstatement). |
| | • | | A shareholder in the fund’s Class C shares will have their shares automatically exchanged at net asset value to Class A shares (or the appropriate share class) of the fund if the shares are no longer subject to a CDSC and the exchange is in line with the policies and procedures of Raymond James. |
CDSC Waivers on Class A and C Shares Available at Raymond James
| | • | | Death or disability of the shareholder. |
| | • | | Shares sold as part of a systematic withdrawal plan as described in the Fund’s Prospectus. |
| | • | | Return of excess contributions from an IRA Account. |
| | • | | Shares sold as part of a required minimum distribution for IRA and retirement accounts due to the shareholder reaching age 70½ as described in the Fund’s prospectus. |
| | • | | Shares sold to pay Raymond James fees but only if the transaction is initiated by Raymond James. |
| | • | | Shares acquired through a right of reinstatement. |
Front-end Load Discounts Available at Raymond James: Breakpoints, and/or Rights of Accumulation
| | • | | Breakpoints as described in the Fund’s Prospectus. |
| | • | | Rights of accumulation which entitle shareholders to breakpoint discounts will be automatically calculated based on the aggregated holding of fund family assets held by accounts within the purchaser’s household at Raymond James. Eligible fund family assets not held at Raymond James may be included in the rights of accumulation calculation only if the shareholder notifies his or her financial advisor about such assets. |
This page is intentionally left blank.

For more information
More information about Wells Fargo Funds is available free upon request. To obtain literature, please write, visit the Fund’s website, or call:
Wells Fargo Funds
P.O. Box 219967
Kansas City, MO 64121-9967
Website: wellsfargofunds.com
Individual investors: 1-800-222-8222
Retail investment professionals: 1-888-877-9275
Institutional investment professionals:
1-866-765-0778
This report and the financial statements contained herein are submitted for the general information of the shareholders of the Fund. If this report is used for promotional purposes, distribution of the report must be accompanied or preceded by a current prospectus. Before investing, please consider the investment objectives, risks, charges, and expenses of the investment. For a current prospectus and, if available, a summary prospectus, containing this information, call 1-800-222-8222 or visit the Fund’s website at wellsfargofunds.com. Read the prospectus carefully before you invest or send money.
Wells Fargo Asset Management (WFAM) is the trade name for certain investment advisory/management firms owned by Wells Fargo & Company. These firms include but are not limited to Wells Capital Management Incorporated and Wells Fargo Funds Management, LLC. Certain products managed by WFAM entities are distributed by Wells Fargo Funds Distributor, LLC (a broker/dealer and Member FINRA).
This material is for general informational and educational purposes only and is NOT intended to provide investment advice or a recommendation of any kind—including a recommendation for any specific investment, strategy, or plan.
NOT FDIC INSURED ◾ NO BANK GUARANTEE ◾ MAY LOSE VALUE
© 2018 Wells Fargo Funds Management, LLC. All rights reserved.
| | |
 | | 318248 12-18 A241/AR241 10-18 |
ITEM 2. CODE OF ETHICS
(a) As of the end of the period covered by the report, Wells Fargo Funds Trust has adopted a code of ethics that applies to its President and Treasurer. A copy of the code of ethics is filed as an exhibit to this Form N-CSR.
(c) During the period covered by this report, there were no amendments to the provisions of the code of ethics adopted in Item 2(a) above.
(d) During the period covered by this report, there were no implicit or explicit waivers to the provisions of the code of ethics adopted in Item 2(a) above.
ITEM 3. AUDIT COMMITTEE FINANCIAL EXPERT
The Board of Trustees of Wells Fargo Funds Trust has determined that Judith Johnson is an audit committee financial expert, as defined in Item 3 of Form N-CSR. Mrs. Johnson is independent for purposes of Item 3 of Form N-CSR.
ITEM 4. PRINCIPAL ACCOUNTANT FEES AND SERVICES
(a), (b), (c), (d) The following table presents aggregate fees billed in each of the last two fiscal years for services rendered to the Registrant by the Registrant’s principal accountant. These fees were billed to the registrant and were approved by the Registrant’s audit committee.
| | | | | | | | |
| | | Fiscal
year ended
October 31, 2018 | | | Fiscal
year ended
October 31, 2017 | |
Audit fees | | $ | 254,758 | | | $ | 246,756 | |
Audit-related fees | | | — | | | | — | |
Tax fees (1) | | | 37,560 | | | | 36,790 | |
All other fees | | | — | | | | — | |
| | | | | | | | |
| | $ | 292,318 | | | $ | 283,546 | |
| | | | | | | | |
| (1) | Tax fees consist of fees for tax compliance, tax advice, tax planning and excise tax. |
(e) The Chairman of the Audit Committees is authorized to pre-approve: (1) audit services for the mutual funds of Wells Fargo Funds Trust; (2) non-audit tax or compliance consulting or training services provided to the Funds by the independent auditors (“Auditors”) if the fees for any particular engagement are not anticipated to exceed $50,000; and (3) non-audit tax or compliance consulting or training services provided by the Auditors to a Fund’s investment adviser and its controlling entities (where pre-approval is required because the engagement relates directly to the operations and financial reporting of the Fund) if the fee to the Auditors for any particular engagement is not anticipated to exceed $50,000. For any such pre-approval sought from the Chairman, Management shall prepare a brief description of the proposed services. If the Chairman approves of such service, he or she shall sign the statement prepared by Management. Such written statement shall be presented to the full Committees at their next regularly scheduled meetings.
(f) Not applicable
(g) Not applicable
(h) Not applicable
ITEM 5. AUDIT COMMITTEE OF LISTED REGISTRANTS
Not applicable.
ITEM 6. INVESTMENTS
A Portfolio of Investments for each series of Wells Fargo Funds Trust is included as part of the report to shareholders filed under Item 1 of this Form.
ITEM 7. DISCLOSURE OF PROXY VOTING POLICIES AND PROCEDURES FOR CLOSED-END MANAGEMENT INVESTMENT COMPANIES
Not applicable.
ITEM 8. PORTFOLIO MANAGERS OF CLOSED-END MANAGEMENT INVESTMENT COMPANIES
Not applicable.
ITEM 9. PURCHASES OF EQUITY SECURITIES BY CLOSED-END MANAGEMENT INVESTMENT COMPANY AND AFFILIATED PURCHASERS
Not applicable.
ITEM 10. SUBMISSION OF MATTERS TO A VOTE OF SECURITY HOLDERS
There have been no material changes to the procedures by which shareholders may recommend nominees to the registrant’s Board of Trustees that have been implemented since the registrant’s last provided disclosure in response to the requirements of this Item.
ITEM 11. CONTROLS AND PROCEDURES
(a) The President and Treasurer have concluded that the Wells Fargo Funds Trust (the “Trust”) disclosure controls and procedures (as defined in Rule 30a-3(c) under the Investment Company Act of 1940) provide reasonable assurances that material information relating to the Trust is made known to them by the appropriate persons based on their evaluation of these controls and procedures as of a date within 90 days of the filing of this report.
(b) There were no significant changes in the Trust’s internal controls over financial reporting (as defined in Rule 30a-3(d) under the Investment Company Act of 1940) that occurred during the second fiscal quarter of the period covered by this report that materially affected, or is reasonably likely to materially affect, the registrant’s internal control over financial reporting.
ITEM 12. EXHIBITS
(a)(1) Code of Ethics pursuant to Item 2 of Form N-CSR is filed and attached hereto as Exhibit COE.
(a)(2) Certification pursuant to Rule 30a-2(a) under the Investment Company Act of 1940 (17 CFR 270.30a-2(a)) is filed and attached hereto as Exhibit 99.CERT.
(a)(3) Not applicable.
(b) Certification pursuant to Rule 30a-2(b) under the Investment Company Act of 1940 (17 CFR 270.30a-2(b)) is filed and attached hereto as Exhibit 99.906CERT.
SIGNATURES
Pursuant to the requirements of the Securities Exchange Act of 1934 and the Investment Company Act of 1940, the registrant has duly caused this report to be signed on its behalf by the undersigned, thereunto duly authorized.
| | |
| Wells Fargo Funds Trust |
| |
| By: | | |
| | /s/ Andrew Owen |
| |
| | Andrew Owen |
| | President |
| |
| Date: | | December 21, 2018 |
Pursuant to the requirements of the Securities Exchange Act of 1934 and the Investment Company Act of 1940, this report has been signed below by the following persons on behalf of the registrant and in the capacities and on the date indicated.
| | |
| Wells Fargo Funds Trust |
| |
| By: | | |
| | /s/ Andrew Owen |
| |
| | Andrew Owen |
| | President |
| |
| Date: | | December 21, 2018 |
| |
| By: | | |
| | /s/ Jeremy DePalma |
| |
| | Jeremy DePalma |
| | Treasurer |
| |
| Date: | | December 21, 2018 |