
UNITED STATES
SECURITIES AND EXCHANGE COMMISSION
Washington, D.C. 20549
FORM N-CSR
CERTIFIED SHAREHOLDER REPORT OF REGISTERED
MANAGEMENT INVESTMENT COMPANIES
Investment Company Act file number: 811-09253
Wells Fargo Funds Trust
(Exact name of registrant as specified in charter)
525 Market St., San Francisco, CA 94105
(Address of principal executive offices) (Zip code)
Alexander Kymn
Wells Fargo Funds Management, LLC
525 Market St., San Francisco, CA 94105
(Name and address of agent for service)
Registrant’s telephone number, including area code: 800-222-8222
Date of fiscal year end: August 31
Registrant is making a filing for 9 of its series:
Wells Fargo Adjustable Rate Government Fund, Wells Fargo Conservative Income Fund, Wells Fargo Government Securities Fund, Wells Fargo High Yield Bond Fund, Wells Fargo Core Plus Bond Fund, Wells Fargo Short Duration Government Bond Fund, Wells Fargo Short-Term Bond Fund, Wells Fargo Short-Term High Yield Bond Fund, and Wells Fargo Ultra Short-Term Income Fund.
Date of reporting period: August 31, 2018
ITEM 1. REPORT TO STOCKHOLDERS
Annual Report
August 31, 2018

Wells Fargo Adjustable Rate Government Fund


Reduce clutter. Save trees.
Sign up for electronic delivery of prospectuses and shareholder reports at wellsfargo.com/advantagedelivery
Contents
The views expressed and any forward-looking statements are as of August 31, 2018, unless otherwise noted, and are those of the Fund managers and/or Wells Fargo Funds Management, LLC. Discussions of individual securities, or the markets generally, or any Wells Fargo Fund are not intended as individual recommendations. Future events or results may vary significantly from those expressed in any forward-looking statements. The views expressed are subject to change at any time in response to changing circumstances in the market. Wells Fargo Funds Management, LLC and the Fund disclaim any obligation to publicly update or revise any views expressed or forward-looking statements.
NOT FDIC INSURED ◾ NO BANK GUARANTEE ◾ MAY LOSE VALUE
| | | | |
| 2 | | Wells Fargo Adjustable Rate Government Fund | | Letter to shareholders (unaudited) |

Andrew Owen
President
Wells Fargo Funds
After advancing during 2017, economic growth and stock markets globally diverged during the first eight months of 2018.
Dear Shareholder:
We are pleased to offer you this annual report for the Wells Fargo Adjustable Rate Government Fund for the 12-month period that ended August 31, 2018. After advancing during 2017, economic growth and stock markets globally diverged during the first eight months of 2018. For fixed-income investors, taxable bond returns suffered and high-yield and municipal bond returns were positive.
For the period, U.S. stocks, as measured by the S&P 500 Index,1 gained 19.66%, and international stocks, as measured by the MSCI ACWI ex USA Index (Net),2 added 3.18%. Based on the MSCI EM Index (Net),3 emerging market stocks lost 0.68%. For bond investors, the Bloomberg Barclays U.S. Aggregate Bond Index4 declined 1.05% while the Bloomberg Barclays Global Aggregate ex-USD Index5 fell 1.64%. The Bloomberg Barclays Municipal Bond Index6 added 0.49%, and the ICE BofAML U.S. High Yield Index7 was up 3.26%.
Continued optimism in the U.S. characterized the fourth quarter of 2017.
Some observers described economic conditions in late 2017 as a Goldilocks scenario: synchronized global growth, low inflation, healthy corporate earnings, and a weaker U.S. dollar that supported international growth. During the quarter, the U.S. Bureau of Economic Analysis reported that annualized U.S. gross domestic product (GDP) growth for the third quarter of 2017 was 2.8% and inflation remained below U.S. Federal Reserve (Fed) targets. U.S. corporate earnings and consumer confidence improved.
Economic momentum increased in Europe. The Bank of England (BOE) raised interest rates in November 2017 to 0.50%, the first increase in more than 10 years, indicating confidence in the economy’s growth potential. Meanwhile, the European Central Bank and the Bank of Japan kept interest rates low to spur business activities and bought bonds in an effort to encourage equity investments. The People’s Bank of China’s (PBOC’s) policies sought to stimulate business. Many emerging market economies benefited from stronger currencies versus the U.S. dollar, while commodity price increases benefited countries that rely on natural resources for exports.
| 1 | The S&P 500 Index consists of 500 stocks chosen for market size, liquidity, and industry group representation. It is a market-value-weighted index with each stock’s weight in the index proportionate to its market value. You cannot invest directly in an index. |
| 2 | The Morgan Stanley Capital International (MSCI) All Country World Index (ACWI) ex USA Index (Net) is a free-float-adjusted market-capitalization-weighted index that is designed to measure the equity market performance of developed markets, excluding the United States and Canada. Source: MSCI. MSCI makes no express or implied warranties or representations and shall have no liability whatsoever with respect to any MSCI data contained herein. The MSCI data may not be further redistributed or used as a basis for other indices or any securities or financial products. This report is not approved, reviewed, or produced by MSCI. You cannot invest directly in an index. |
| 3 | The MSCI Emerging Markets (EM) Index (Net) is a free-float-adjusted market-capitalization-weighted index that is designed to measure large- and mid-cap equity market performance of emerging markets. The MSCI EM Index (Net) consists of the following 24 emerging market country indices: Brazil, Chile, China, Colombia, Czech Republic, Egypt, Greece, Hungary, India, Indonesia, Korea, Malaysia, Mexico, Pakistan, Peru, the Philippines, Poland, Qatar, Russia, South Africa, Taiwan, Thailand, Turkey, and the United Arab Emirates. You cannot invest directly in an index. |
| 4 | The Bloomberg Barclays U.S. Aggregate Bond Index is a broad-based benchmark that measures the investment-grade, U.S. dollar-denominated, fixed-rate taxable bond market, including Treasuries, government-related and corporate securities, mortgage-backed securities (agency fixed-rate and hybrid adjustable-rate mortgage pass-throughs), asset-backed securities, and commercial mortgage-backed securities. You cannot invest directly in an index. |
| 5 | The Bloomberg Barclays Global Aggregate ex-USD Index is an unmanaged index that provides a broad-based measure of the global investment-grade fixed-income markets excluding the U.S. dollar-denominated debt market. You cannot invest directly in an index. |
| 6 | The Bloomberg Barclays Municipal Bond Index is an unmanaged index composed of long-term tax-exempt bonds with a minimum credit rating of Baa. You cannot invest directly in an index. |
| 7 | The ICE BofAML U.S. High Yield Index is a market-capitalization-weighted index of domestic and Yankee high-yield bonds. The index tracks the performance of high-yield securities traded in the U.S. bond market. You cannot invest directly in an index. Copyright 2018. ICE Data Indices, LLC. All rights reserved. |
| | | | | | |
| Letter to shareholders (unaudited) | | Wells Fargo Adjustable Rate Government Fund | | | 3 | |
Volatility reemerged during the first quarter of 2018 as global tensions and inflation fears increased.
Stock market gains in January 2018 followed the passage of lower U.S. tax rates. Some investors then grew concerned about trade, particularly between the U.S. and China, and the specter of inflation. The Fed followed its 25-basis-point (bp; 100 bps equal 1.00%) federal funds rate increase in December 2017 with a further 25-bp increase in March 2018. The inflation rate in March reached the Fed’s 2% target for the first time in a year.
The S&P 500 Index closed the first quarter with a negative return, the first negative quarterly return for the index since 2014. Overseas investment markets reversed strong returns in 2017, hurt by a stronger U.S. dollar and mounting trade and diplomatic tensions. After gaining 27.19% for the 12-month period that ended December 31, 2017, the MSCI ACWI ex USA Index (Net) declined 1.81% for the quarter that ended March 31, 2018.
Global trade tensions escalated during the second quarter.
Global trade tensions escalated throughout the second quarter of 2018. The U.S. government imposed tariffs, and foreign governments in North America, Europe, and Asia retaliated. The escalating tensions chilled investment activity as observers awaited signals of next steps.
Meanwhile, inflation continued an upward trend. The CPI-U8 added 0.1% in June after increases of 0.2% in both April and May. On a year-over-year basis, the all-items index rose 2.9% for the 12 months that ended June 30, 2018. The index for all items less food and energy rose 2.3% for the same 12-month period.
U.S. stocks gained while international stocks and bonds declined during the summer of 2018.
The U.S. economy strengthened during the summer months. Revised second-quarter GDP data released in August showed the U.S. economy growing at a 4.2% rate. After ticking up slightly in June, the unemployment rate in the U.S. was 3.9% in July and August, according to the U.S. Department of Labor. Wages showed more consistent growth than they had in recent quarters, and consumer confidence remained strong.
Several U.S. equity market indices reached records during August, with the S&P 500 Index gaining 7.76% for the three-month period that ended August 31, 2018. International stock values continued to suffer under the effects of a strong U.S. dollar and continuing trade tensions. The MSCI ACWI ex USA Index (Net) and the MSCI EM Index (Net) were down 4.70% and 1.64%, respectively, during the same three-month period.
The Fed increased the federal funds rate in June, and expectations grew that two more rate increases were in the offing in 2018. Long-term interest rates in the U.S. remained at higher levels relative to the prior 10 years. Rates on 10-year and 30-year Treasury bonds—2.46% and 2.81%, respectively, on January 1, 2018—were 2.86% and 3.02%, respectively, on August 31, off their peak levels on May 17, 2018, of 3.11% and 3.25%, respectively. Some investors became more aware of and concerned about the potential for an inverted yield curve—sometimes a recession signal—as short-term rates increased more quickly than long-term rates. The Fed decided to forgo an interest rate increase at its August meeting.
The S&P 500 Index closed the first quarter with a negative return, the first negative quarterly return for the index since 2014.
| 8 | The Consumer Price Index for All Urban Consumers (CPI-U) measures the changes in the price of a basket of goods and services purchased by urban consumers. The urban consumer population is deemed by many as a better representative measure of the general public because close to 90% of the country’s population lives in highly populated areas. You cannot invest directly in an index. |
| | | | |
| 4 | | Wells Fargo Adjustable Rate Government Fund | | Letter to shareholders (unaudited) |
Internationally, members of Prime Minister Theresa May’s U.K./Brexit negotiating team resigned amid unproductive negotiations. In early August, the BOE’s Monetary Policy Committee increased its key interest rate to 0.75%. Central banks in Europe and Japan maintained low interest rates and accommodative monetary policies. Amid rising trade uncertainty, the PBOC cut reserve requirement ratios and accelerated infrastructure spending and tax cuts for business enterprises and individuals. Nevertheless, a strengthening U.S. dollar and the trade tensions remained headwinds for investors overseas.
Don’t let short-term uncertainty derail long-term investment goals.
Periods of investment uncertainty can present challenges, but experience has taught us that maintaining long-term investment goals can be an effective way to plan for the future. To help you create a sound strategy based on your personal goals and risk tolerance, Wells Fargo Funds offers more than 100 mutual funds spanning a wide range of asset classes and investment styles. Although diversification cannot guarantee an investment profit or prevent losses, we believe it can be an effective way to manage investment risk and potentially smooth out overall portfolio performance. We encourage investors to know their investments and to understand that appropriate levels of risk-taking may unlock opportunities.
Thank you for choosing to invest with Wells Fargo Funds. We appreciate your confidence in us and remain committed to helping you meet your financial needs.
Sincerely,

Andrew Owen
President
Wells Fargo Funds
Notice to shareholders
| | ∎ | | At a meeting held on May 22-23, 2018, the Board of Trustees of the Fund approved changes to the Fund’s Class A sales charge schedule, effective August 1, 2018. In connection with this change, the net asset value (NAV) breakpoint was lowered from $500,000 to $250,000 and NAV purchases of $250,000 or more redeemed within 12 months of purchase are assessed a contingent deferred sales charge (CDSC) of 0.40%. There is no change for purchase amounts below this breakpoint. Beginning August 1, 2018, any purchases made by a shareholder with an active Letter of Intent (LOI) are subject to the terms of the new load schedule. | |
| | ∎ | | At a meeting held on August 14-15, 2018, the Board of Trustees of the Fund approved the following policy which will be effective on or about February 5, 2019: | |
Class C shares will convert automatically into Class A shares ten years after the initial date of purchase or, if you acquired your Class C shares through an exchange or conversion from another share class, ten years after the date you acquired your Class C shares. When Class C shares that you acquired through a purchase or exchange convert, any other Class C shares that you purchased with reinvested dividends and distributions also will convert into Class A shares on a pro rata basis. A shorter holding period may also apply depending on your intermediary. Please see “Appendix A—Sales Charge Reductions and Waivers for Certain Intermediaries” in the Fund’s prospectus or at the end of this report.
For further information about your Fund, contact your investment professional, visit our website at wellsfargofunds.com, or call us directly at 1-800-222-8222.
This page is intentionally left blank.
| | | | |
| 6 | | Wells Fargo Adjustable Rate Government Fund | | Performance highlights (unaudited) |
Investment objective
The Fund seeks current income consistent with capital preservation.
Manager
Wells Fargo Funds Management, LLC
Subadviser
Wells Capital Management Incorporated
Portfolio managers
Christopher Y. Kauffman, CFA®
Michal Stanczyk
Average annual total returns (%) as of August 31, 20181
| | | | | | | | | | | | | | | | | | | | | | | | | | | | | | | | | | |
| | | | | Including sales charge | | | Excluding sales charge | | | Expense ratios2 (%) | |
| | | Inception date | | 1 year | | | 5 year | | | 10 year | | | 1 year | | | 5 year | | | 10 year | | | Gross | | | Net3 | |
| Class A (ESAAX) | | 6-30-2000 | | | (1.01 | ) | | | 0.02 | | | | 1.00 | | | | 0.98 | | | | 0.43 | | | | 1.21 | | | | 0.80 | | | | 0.74 | |
| Class C (ESACX) | | 6-30-2000 | | | (0.77 | ) | | | (0.32 | ) | | | 0.45 | | | | 0.23 | | | | (0.32 | ) | | | 0.45 | | | | 1.55 | | | | 1.49 | |
| Administrator Class (ESADX) | | 7-30-2010 | | | – | | | | – | | | | – | | | | 1.12 | | | | 0.57 | | | | 1.35 | | | | 0.74 | | | | 0.60 | |
| Institutional Class (EKIZX) | | 10-1-1991 | | | – | | | | – | | | | – | | | | 1.26 | | | | 0.71 | | | | 1.48 | | | | 0.47 | | | | 0.46 | |
| Bloomberg Barclays 6-Month Treasury Bill Index4 | | – | | | – | | | | – | | | | – | | | | 1.51 | | | | 0.65 | | | | 0.63 | | | | – | | | | – | |
Figures quoted represent past performance, which is no guarantee of future results, and do not reflect taxes that a shareholder may pay on fund distributions or the redemption of fund shares. Investment return and principal value of an investment will fluctuate so that an investor’s shares, when redeemed, may be worth more or less than their original cost. Performance shown without sales charges would be lower if sales charges were reflected. Current performance may be lower or higher than the performance data quoted, which assumes the reinvestment of dividends and capital gains. Current month-end performance is available on the Fund’s website, wellsfargofunds.com.
Index returns do not include transaction costs associated with buying and selling securities, any mutual fund fees or expenses, or any taxes. It is not possible to invest directly in an index.
For Class A shares, the maximum front-end sales charge is 2.00%. For Class C shares, the maximum contingent deferred sales charge is 1.00%. Performance including a contingent deferred sales charge assumes the sales charge for the corresponding time period. Administrator Class and Institutional Class shares are sold without a front-end sales charge or contingent deferred sales charge.
Bond values fluctuate in response to the financial condition of individual issuers, general market and economic conditions, and changes in interest rates. Changes in market conditions and government policies may lead to periods of heightened volatility in the bond market and reduced liquidity for certain bonds held by the Fund. In general, when interest rates rise, bond values fall and investors may lose principal value. Interest rate changes and their impact on the Fund and its share price can be sudden and unpredictable. The use of derivatives may reduce returns and/or increase volatility. Securities issued by U.S. government agencies or government-sponsored entities may not be guaranteed by the U.S. Treasury. Certain investment strategies tend to increase the total risk of an investment (relative to the broader market). The Fund is exposed to mortgage- and asset-backed securities risk. The U.S. government guarantee applies to certain underlying securities and not to shares of the Fund. Consult the Fund’s prospectus for additional information on these and other risks.
Please see footnotes on page 7.
| | | | | | |
| Performance highlights (unaudited) | | Wells Fargo Adjustable Rate Government Fund | | | 7 | |
|
| Growth of $10,000 investment as of August 31, 20185 |
|
 |
| 1 | Historical performance shown for Administrator Class shares prior to their inception reflects the performance of Institutional Class shares, adjusted to reflect the higher expenses applicable to Administrator Class shares. Historical performance shown for all classes of the Fund prior to July 12, 2010, is based on the performance of the Fund’s predecessor, Evergreen Adjustable Rate Fund. |
| 2 | Reflects the expense ratios as stated in the most recent prospectuses. The expense ratios shown are subject to change and may differ from the annualized expense ratios shown in the financial highlights of this report. |
| 3 | The manager has contractually committed through December 31, 2018, to waive fees and/or reimburse expenses to the extent necessary to cap the Fund’s Total Annual Fund Operating Expenses After Fee Waivers at the amounts shown. After this time, the cap may be increased or the commitment to maintain the cap may be terminated only with the approval of the Board of Trustees. Brokerage commissions, stamp duty fees, interest, taxes, acquired fund fees and expenses (if any), and extraordinary expenses are excluded from the expense cap. Without this cap, the Fund’s returns would have been lower. The expense ratio paid by an investor is the net expense ratio (the total annual fund operating expenses after fee waivers) as stated in the prospectuses. |
| 4 | The Bloomberg Barclays 6-Month Treasury Bill Index tracks the performance and attributes of recently issued 6-Month U.S. Treasury bills. The index follows Bloomberg Barclays’ monthly rebalancing conventions. You cannot invest directly in an index. |
| 5 | The chart compares the performance of Class A shares for the most recent ten years with the performance of the Bloomberg Barclays 6-Month Treasury Bill Index. The chart assumes a hypothetical investment of $10,000 in Class A shares and reflects all operating expenses and assumes the maximum initial sales charge of 2.00%. |
| 6 | The ten largest holdings, excluding cash, cash equivalents and any money market funds, are calculated based on the value of the investments divided by total net assets of the Fund. Holdings are subject to change and may have changed since the date specified. |
| 7 | The Consumer Price Index (CPI) is a measure of the average change over time in the prices paid by urban consumers for a market basket of consumer goods and services. You cannot invest directly in an index. |
| 8 | Amounts are calculated based on the total long-term investments of the Fund. These amounts are subject to change and may have changed since the date specified. |
| | | | |
| 8 | | Wells Fargo Adjustable Rate Government Fund | | Performance highlights (unaudited) |
MANAGER’S DISCUSSION
Fund highlights
| ∎ | | The Fund underperformed its benchmark, the Bloomberg Barclays 6-Month Treasury Bill Index, for the 12-month period that ended August 31, 2018. |
| ∎ | | The significant increase in short-term interest rates and flattening of the yield curve over the reporting period caused market expectations for adjustable-rate mortgage (ARM) prepayments to increase, which resulted in widening spreads. This resulted in negative price performance, which detracted from the Fund’s performance. |
| ∎ | | The Fund’s focus on seasoned ARMs that have already had rate-adjustment resets and an increased allocation to lower-dollar-price floating-rate collateralized mortgage obligations (CMOs) mitigated some of the underperformance. Seasoned ARM securities generally exhibited slower, more stable prepayments compared with ARMs with rate-adjustment resets still pending. |
| ∎ | | The Fund’s duration during the period remained roughly unchanged at 0.7 years. |
| | | | |
| Ten largest holdings (%) as of August 31, 20186 | |
FNMA Series 2002-66 Class A3, 4.09%, 4-25-2042 | | | 2.00 | |
FNMA Series 2004-W15 Class 3A, 3.96%, 6-25-2044 | | | 1.49 | |
GNMA Series 2017-H11 Class FE, 2.84%, 5-20-2067 | | | 1.26 | |
FHLMC Series T-67 Class 1A1C, 3.67%, 3-25-2036 | | | 1.22 | |
FNMA Series 2006-W01 Class 3A, 3.59%, 10-25-2045 | | | 1.21 | |
FNMA Series 2004-W12 Class 2A, 4.02%, 6-25-2044 | | | 1.17 | |
FNMA Series 2001-T12 Class A4, 4.23%, 8-25-2041 | | | 1.08 | |
FNMA Series 2003-W18 Class 2A, 4.04%, 6-25-2043 | | | 0.97 | |
FHLMC Series T-67 Class 2A1C, 3.43%, 3-25-2036 | | | 0.95 | |
FHLMC Series T-62 Class 1A1, 2.95%, 10-25-2044 | | | 0.89 | |
Economic growth accelerated and policy normalization continued.
Over the past four quarters, U.S. gross domestic product (GDP) grew by 2.9% in real terms, which was above the post-financial-crisis average. Business investment was a significant source of strength, rising 4.8% for the 12 months that ended June 30, 2018. Consumer spending was a net contributor to growth, although it failed to keep pace with the business sector. Inventories were a net detractor from GDP growth, while trade and government spending were modestly positive factors.
The labor market generally was healthy over the past 12 months. Nonfarm payrolls expanded by an average of 194,000 jobs per month over the period, while the
unemployment rate declined to 3.9% at the end of August 2018 from 4.4% a year earlier. Also encouraging was a 0.2% rise in the employment/population ratio since August 2017, reflecting both the fall in unemployment and a modest increase in the labor force participation rate. Wage gains of about 2.9% over the past 12 months were sufficient to support consumption growth without sparking fears of rising inflation. The CPI7 also rose 2.9% over the past year, which accelerated due in part to higher energy prices.
The U.S. Federal Reserve’s (Fed’s) rate-setting committee, the Federal Open Market Committee (FOMC), raised the federal funds rate three times over the past 12 months by a total of 0.75% reflecting the continuation of its gradual approach to hiking interest rates.
In line with the FOMC’s policy moves, interest rates had an upward bias over the past 12 months, particularly in shorter-term maturity instruments. Yields on 2-year Treasuries rose by 130 basis points (bps; 100 bps equal 1.00%) during the period, while 10-year Treasuries were about 75 bps higher. Investment-grade credit spreads tightened rapidly into the start of 2018 after the corporate tax cut was enacted in the U.S. but ended the period slightly wider after trade tensions and heavy supply took their toll on bond prices.
Please see footnotes on page 7.
| | | | | | |
| Performance highlights (unaudited) | | Wells Fargo Adjustable Rate Government Fund | | | 9 | |
|
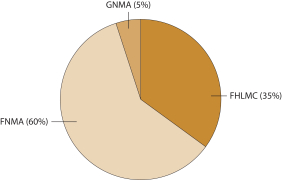
| Portfolio allocation as of August 31, 20188 |
|
|
The Fund was predominantly invested in adjustable-rate residential mortgage securities.
The Fund remains defensively positioned with a significant out-of-benchmark allocation to ARMs and floating-rate CMOs that have frequent rate resets and are predominately indexed to the 1-Year Treasury Constant Maturity Rate and the 12-month London Interbank Offered Rate. Performance during the period lagged the benchmark due to the Fund’s heavy allocation to post-reset ARMs, which underperformed U.S. Treasuries. Spreads in the sector came under pressure as an increase in short-term interest rates combined with a flattening yield curve caused investors to anticipate that prepayments could accelerate as adjustable-rate mortgage holders refinanced into fixed-rate mortgages.
The Fund’s duration remained within a narrow band of 0.65 to 0.75 years during the reporting period. We continued to see value in seasoned ARMs that have already had their rates reset with favorable prepayment characteristics. We also increased the Fund’s positioning in floating-rate CMOs.
We expect modestly above-trend economic growth to continue.
We expect macroeconomic trends to remain relatively consistent in the coming quarters, aided by fiscal stimulus and looser regulations. Real GDP growth in the area of 3% is likely to persist for a period of time, barring some external shock. The biggest risks to the outlook include an escalation in trade tensions and a larger-than-expected slowdown in the Chinese economy.
Please see footnotes on page 7.
| | | | |
| 10 | | Wells Fargo Adjustable Rate Government Fund | | Fund expenses (unaudited) |
As a shareholder of the Fund, you incur two types of costs: (1) transaction costs, including sales charges (loads) on purchase payments and contingent deferred sales charges (if any) on redemptions and (2) ongoing costs, including management fees, distribution (12b-1) and/or shareholder servicing fees, and other Fund expenses. This example is intended to help you understand your ongoing costs (in dollars) of investing in the Fund and to compare these costs with the ongoing costs of investing in other mutual funds.
The example is based on an investment of $1,000 invested at the beginning of the six-month period and held for the entire period from March 1, 2018 to August 31, 2018.
Actual expenses
The “Actual” line of the table below provides information about actual account values and actual expenses. You may use the information in this line, together with the amount you invested, to estimate the expenses that you paid over the period. Simply divide your account value by $1,000 (for example, an $8,600 account value divided by $1,000 = 8.6), then multiply the result by the number in the “Actual” line under the heading entitled “Expenses paid during period” for your applicable class of shares to estimate the expenses you paid on your account during this period.
Hypothetical example for comparison purposes
The “Hypothetical” line of the table below provides information about hypothetical account values and hypothetical expenses based on the Fund’s actual expense ratio and an assumed rate of return of 5% per year before expenses, which is not the Fund’s actual return. The hypothetical account values and expenses may not be used to estimate the actual ending account balance or expenses you paid for the period. You may use this information to compare the ongoing costs of investing in the Fund and other funds. To do so, compare this 5% hypothetical example with the 5% hypothetical examples that appear in the shareholder reports of the other funds.
Please note that the expenses shown in the table are meant to highlight your ongoing costs only and do not reflect any transactional costs, such as sales charges (loads) and contingent deferred sales charges. Therefore, the “Hypothetical” line of the table is useful in comparing ongoing costs only and will not help you determine the relative total costs of owning different funds. In addition, if these transactional costs were included, your costs would have been higher.
| | | | | | | | | | | | | | | | |
| | | Beginning
account value
3-1-2018 | | | Ending
account value
8-31-2018 | | | Expenses
paid during
the period¹ | | | Annualized net
expense ratio | |
Class A | | | | | | | | | | | | | | | | |
Actual | | $ | 1,000.00 | | | $ | 1,006.25 | | | $ | 3.74 | | | | 0.74 | % |
Hypothetical (5% return before expenses) | | $ | 1,000.00 | | | $ | 1,021.48 | | | $ | 3.77 | | | | 0.74 | % |
Class C | | | | | | | | | | | | | | | | |
Actual | | $ | 1,000.00 | | | $ | 1,002.45 | | | $ | 7.52 | | | | 1.49 | % |
Hypothetical (5% return before expenses) | | $ | 1,000.00 | | | $ | 1,017.69 | | | $ | 7.58 | | | | 1.49 | % |
Administrator Class | | | | | | | | | | | | | | | | |
Actual | | $ | 1,000.00 | | | $ | 1,005.82 | | | $ | 3.03 | | | | 0.60 | % |
Hypothetical (5% return before expenses) | | $ | 1,000.00 | | | $ | 1,022.18 | | | $ | 3.06 | | | | 0.60 | % |
Institutional Class | | | | | | | | | | | | | | | | |
Actual | | $ | 1,000.00 | | | $ | 1,006.54 | | | $ | 2.33 | | | | 0.46 | % |
Hypothetical (5% return before expenses) | | $ | 1,000.00 | | | $ | 1,022.89 | | | $ | 2.35 | | | | 0.46 | % |
| 1 | Expenses paid is equal to the annualized net expense ratio of each class multiplied by the average account value over the period, multiplied by the number of days in the most recent fiscal half-year divided by the number of days in the fiscal year (to reflect the one-half-year period). |
| | | | | | |
| Portfolio of investments—August 31, 2018 | | Wells Fargo Adjustable Rate Government Fund | | | 11 | |
| | | | | | | | | | | | | | | | |
| Security name | | Interest rate | | | Maturity date | | | Principal | | | Value | |
|
Agency Securities: 95.53% | |
FDIC Series 2010-S2 Class 3A (1 Month LIBOR +0.70%) 144A± | | | 2.78 | % | | | 12-29-2045 | | | $ | 365,448 | | | $ | 366,240 | |
FHLMC (11th District Cost of Funds +1.25%) ± | | | 2.00 | | | | 5-1-2019 | | | | 1,326 | | | | 1,321 | |
FHLMC (10 Year Treasury Constant Maturity -0.85%) ± | | | 2.01 | | | | 3-15-2024 | | | | 384,036 | | | | 381,291 | |
FHLMC (11th District Cost of Funds +1.25%) ± | | | 2.06 | | | | 1-1-2030 | | | | 2,914 | | | | 2,866 | |
FHLMC (11th District Cost of Funds +1.25%) ± | | | 2.06 | | | | 1-1-2030 | | | | 2,421 | | | | 2,396 | |
FHLMC (11th District Cost of Funds +1.25%) ± | | | 2.06 | | | | 7-1-2030 | | | | 145,528 | | | | 143,553 | |
FHLMC (11th District Cost of Funds +1.25%) ± | | | 2.13 | | | | 9-1-2018 | | | | 11 | | | | 11 | |
FHLMC (11th District Cost of Funds +1.25%) ± | | | 2.15 | | | | 2-1-2019 | | | | 841 | | | | 838 | |
FHLMC (11th District Cost of Funds +1.25%) ± | | | 2.15 | | | | 2-1-2035 | | | | 178,420 | | | | 176,207 | |
FHLMC (11th District Cost of Funds +1.44%) ± | | | 2.17 | | | | 6-1-2020 | | | | 6,579 | | | | 6,548 | |
FHLMC (11th District Cost of Funds +1.36%) ± | | | 2.17 | | | | 10-1-2030 | | | | 4,900 | | | | 4,877 | |
FHLMC (11th District Cost of Funds +1.76%) ± | | | 2.51 | | | | 1-1-2022 | | | | 3,847 | | | | 3,840 | |
FHLMC (1 Year Treasury Constant Maturity +0.71%) ± | | | 2.61 | | | | 4-1-2030 | | | | 56,102 | | | | 56,309 | |
FHLMC (11th District Cost of Funds +1.88%) ± | | | 2.64 | | | | 6-1-2019 | | | | 12,737 | | | | 12,706 | |
FHLMC (11th District Cost of Funds +1.25%) ± | | | 2.69 | | | | 11-1-2030 | | | | 138,763 | | | | 139,424 | |
FHLMC (11th District Cost of Funds +1.86%) ± | | | 2.72 | | | | 3-1-2025 | | | | 97,867 | | | | 97,827 | |
FHLMC (11th District Cost of Funds +2.05%) ± | | | 2.81 | | | | 6-1-2029 | | | | 105,676 | | | | 106,635 | |
FHLMC (11th District Cost of Funds +2.25%) ± | | | 3.00 | | | | 8-1-2019 | | | | 4,820 | | | | 4,820 | |
FHLMC (11th District Cost of Funds +1.53%) ± | | | 3.03 | | | | 6-1-2019 | | | | 1,467 | | | | 1,467 | |
FHLMC (12 Month Treasury Average +1.90%) ± | | | 3.12 | | | | 5-1-2028 | | | | 214,530 | | | | 221,434 | |
FHLMC (3 Year Treasury Constant Maturity +2.27%) ± | | | 3.19 | | | | 4-1-2032 | | | | 86,398 | | | | 87,768 | |
FHLMC (11th District Cost of Funds +2.39%) ± | | | 3.20 | | | | 6-1-2021 | | | | 38,751 | | | | 38,906 | |
FHLMC (1 Year Treasury Constant Maturity +1.99%) ± | | | 3.24 | | | | 11-1-2034 | | | | 295,921 | | | | 309,915 | |
FHLMC (1 Year Treasury Constant Maturity +2.01%) ± | | | 3.26 | | | | 6-1-2020 | | | | 250 | | | | 249 | |
FHLMC (1 Year Treasury Constant Maturity +2.03%) ± | | | 3.36 | | | | 3-1-2025 | | | | 46,463 | | | | 47,871 | |
FHLMC (1 Year Treasury Constant Maturity +1.88%) ± | | | 3.37 | | | | 5-1-2035 | | | | 301,090 | | | | 314,214 | |
FHLMC (1 Year Treasury Constant Maturity +2.02%) ± | | | 3.39 | | | | 5-1-2020 | | | | 109 | | | | 109 | |
FHLMC (1 Year Treasury Constant Maturity +2.17%) ± | | | 3.45 | | | | 8-1-2034 | | | | 876,937 | | | | 922,672 | |
FHLMC (1 Year Treasury Constant Maturity +2.22%) ± | | | 3.46 | | | | 10-1-2033 | | | | 297,077 | | | | 313,905 | |
FHLMC (1 Year Treasury Constant Maturity +2.22%) ± | | | 3.47 | | | | 10-1-2033 | | | | 1,144,278 | | | | 1,206,303 | |
FHLMC (1 Year Treasury Constant Maturity +2.22%) ± | | | 3.47 | | | | 10-1-2033 | | | | 692,345 | | | | 731,557 | |
FHLMC (12 Month LIBOR +1.73%) ± | | | 3.48 | | | | 1-1-2035 | | | | 414,413 | | | | 436,476 | |
FHLMC (1 Year Treasury Constant Maturity +2.25%) ± | | | 3.48 | | | | 9-1-2033 | | | | 178,091 | | | | 187,921 | |
FHLMC (1 Year Treasury Constant Maturity +2.22%) ± | | | 3.48 | | | | 12-1-2033 | | | | 496,930 | | | | 518,044 | |
FHLMC (12 Month LIBOR +1.74%) ± | | | 3.49 | | | | 12-1-2036 | | | | 381,669 | | | | 399,965 | |
FHLMC (1 Year Treasury Constant Maturity +2.25%) ± | | | 3.50 | | | | 10-1-2034 | | | | 1,425,000 | | | | 1,508,425 | |
FHLMC (1 Year Treasury Constant Maturity +2.27%) ± | | | 3.52 | | | | 5-1-2025 | | | | 66,177 | | | | 66,964 | |
FHLMC (1 Year Treasury Constant Maturity +2.27%) ± | | | 3.52 | | | | 11-1-2029 | | | | 40,245 | | | | 40,779 | |
FHLMC (12 Month LIBOR +1.78%) ± | | | 3.53 | | | | 11-1-2035 | | | | 398,029 | | | | 419,111 | |
FHLMC (1 Year Treasury Constant Maturity +2.25%) ± | | | 3.53 | | | | 5-1-2034 | | | | 84,192 | | | | 89,047 | |
FHLMC (1 Year Treasury Constant Maturity +2.24%) ± | | | 3.55 | | | | 1-1-2036 | | | | 1,355,502 | | | | 1,428,683 | |
FHLMC (3 Year Treasury Constant Maturity +2.44%) ± | | | 3.58 | | | | 5-1-2031 | | | | 112,648 | | | | 117,656 | |
FHLMC (1 Year Treasury Constant Maturity +2.25%) ± | | | 3.58 | | | | 1-1-2037 | | | | 144,168 | | | | 151,636 | |
FHLMC (1 Year Treasury Constant Maturity +2.28%) ± | | | 3.59 | | | | 1-1-2035 | | | | 343,617 | | | | 360,910 | |
FHLMC (1 Year Treasury Constant Maturity +2.25%) ± | | | 3.59 | | | | 4-1-2036 | | | | 495,040 | | | | 519,572 | |
FHLMC (1 Year Treasury Constant Maturity +2.20%) ± | | | 3.60 | | | | 12-1-2034 | | | | 426,784 | | | | 447,676 | |
FHLMC (1 Year Treasury Constant Maturity +2.05%) ± | | | 3.61 | | | | 1-1-2030 | | | | 16,846 | | | | 17,345 | |
FHLMC (1 Year Treasury Constant Maturity +2.29%) ± | | | 3.61 | | | | 11-1-2029 | | | | 155,452 | | | | 159,711 | |
FHLMC (1 Year Treasury Constant Maturity +2.02%) ± | | | 3.62 | | | | 5-1-2020 | | | | 48 | | | | 47 | |
FHLMC (1 Year Treasury Constant Maturity +2.18%) ± | | | 3.62 | | | | 6-1-2036 | | | | 942,713 | | | | 991,432 | |
The accompanying notes are an integral part of these financial statements.
| | | | |
| 12 | | Wells Fargo Adjustable Rate Government Fund | | Portfolio of investments—August 31, 2018 |
| | | | | | | | | | | | | | | | |
| Security name | | Interest rate | | | Maturity date | | | Principal | | | Value | |
|
Agency Securities (continued) | |
FHLMC (1 Year Treasury Constant Maturity +2.25%) ± | | | 3.64 | % | | | 11-1-2022 | | | $ | 80,789 | | | $ | 82,639 | |
FHLMC (2 Year Treasury Constant Maturity +2.44%) ± | | | 3.64 | | | | 8-1-2029 | | | | 100,825 | | | | 103,403 | |
FHLMC (12 Month LIBOR +1.75%) ± | | | 3.65 | | | | 2-1-2037 | | | | 213,074 | | | | 223,925 | |
FHLMC (1 Year Treasury Constant Maturity +2.22%) ± | | | 3.65 | | | | 1-1-2033 | | | | 496,193 | | | | 518,025 | |
FHLMC (1 Year Treasury Constant Maturity +2.30%) ± | | | 3.66 | | | | 11-1-2035 | | | | 1,101,631 | | | | 1,164,135 | |
FHLMC (11th District Cost of Funds +2.26%) ± | | | 3.66 | | | | 12-1-2025 | | | | 20,910 | | | | 21,073 | |
FHLMC (12 Month LIBOR +1.67%) ± | | | 3.67 | | | | 8-1-2035 | | | | 143,536 | | | | 146,213 | |
FHLMC (12 Month Treasury Average +2.37%) ± | | | 3.67 | | | | 6-1-2028 | | | | 93,036 | | | | 94,975 | |
FHLMC (1 Year Treasury Constant Maturity +2.27%) ± | | | 3.69 | | | | 2-1-2034 | | | | 1,432,989 | | | | 1,512,787 | |
FHLMC (1 Year Treasury Constant Maturity +2.23%) ± | | | 3.69 | | | | 7-1-2034 | | | | 136,609 | | | | 144,094 | |
FHLMC (1 Year Treasury Constant Maturity +2.32%) ± | | | 3.69 | | | | 7-1-2031 | | | | 175,921 | | | | 185,422 | |
FHLMC (1 Year Treasury Constant Maturity +2.41%) ± | | | 3.69 | | | | 12-1-2032 | | | | 279,147 | | | | 292,293 | |
FHLMC (1 Year Treasury Constant Maturity +2.29%) ± | | | 3.70 | | | | 11-1-2027 | | | | 462,586 | | | | 483,685 | |
FHLMC (1 Year Treasury Constant Maturity +2.25%) ± | | | 3.70 | | | | 2-1-2036 | | | | 891,554 | | | | 935,807 | |
FHLMC (1 Year Treasury Constant Maturity +2.05%) ± | | | 3.70 | | | | 8-1-2033 | | | | 1,413,955 | | | | 1,466,962 | |
FHLMC (12 Month LIBOR +1.76%) ± | | | 3.70 | | | | 5-1-2037 | | | | 1,181,184 | | | | 1,237,368 | |
FHLMC (5 Year Treasury Constant Maturity +2.13%) ± | | | 3.71 | | | | 8-1-2029 | | | | 9,062 | | | | 9,002 | |
FHLMC (1 Year Treasury Constant Maturity +2.23%) ± | | | 3.71 | | | | 2-1-2034 | | | | 949,244 | | | | 989,129 | |
FHLMC (12 Month LIBOR +1.98%) ± | | | 3.73 | | | | 11-1-2032 | | | | 114,608 | | | | 116,678 | |
FHLMC (1 Year Treasury Constant Maturity +2.23%) ± | | | 3.73 | | | | 2-1-2034 | | | | 480,613 | | | | 504,331 | |
FHLMC (1 Year Treasury Constant Maturity +2.33%) ± | | | 3.73 | | | | 9-1-2033 | | | | 773,567 | | | | 816,330 | |
FHLMC (1 Year Treasury Constant Maturity +2.25%) ± | | | 3.75 | | | | 2-1-2034 | | | | 571,153 | | | | 604,106 | |
FHLMC (1 Year Treasury Constant Maturity +2.16%) ± | | | 3.76 | | | | 6-1-2033 | | | | 462,537 | | | | 482,262 | |
FHLMC (1 Year Treasury Constant Maturity +2.10%) ± | | | 3.77 | | | | 10-1-2037 | | | | 1,183,138 | | | | 1,239,838 | |
FHLMC (1 Year Treasury Constant Maturity +2.21%) ± | | | 3.77 | | | | 1-1-2037 | | | | 1,038,254 | | | | 1,092,490 | |
FHLMC (1 Year Treasury Constant Maturity +2.36%) ± | | | 3.77 | | | | 2-1-2035 | | | | 970,621 | | | | 1,028,364 | |
FHLMC (12 Month LIBOR +1.87%) ± | | | 3.78 | | | | 9-1-2036 | | | | 633,925 | | | | 667,944 | |
FHLMC (1 Year Treasury Constant Maturity +2.25%) ± | | | 3.78 | | | | 2-1-2036 | | | | 1,031,272 | | | | 1,083,714 | |
FHLMC (1 Year Treasury Constant Maturity +2.22%) ± | | | 3.79 | | | | 7-1-2036 | | | | 303,431 | | | | 324,774 | |
FHLMC (1 Year Treasury Constant Maturity +2.28%) ± | | | 3.79 | | | | 10-1-2036 | | | | 396,346 | | | | 417,374 | |
FHLMC (1 Year Treasury Constant Maturity +2.28%) ± | | | 3.79 | | | | 2-1-2036 | | | | 733,581 | | | | 773,746 | |
FHLMC (1 Year Treasury Constant Maturity +2.24%) ± | | | 3.79 | | | | 10-1-2036 | | | | 410,632 | | | | 432,075 | |
FHLMC (1 Year Treasury Constant Maturity +2.55%) ± | | | 3.80 | | | | 9-1-2029 | | | | 126,869 | | | | 128,307 | |
FHLMC (1 Year Treasury Constant Maturity +2.26%) ± | | | 3.81 | | | | 9-1-2038 | | | | 621,177 | | | | 644,798 | |
FHLMC (5 Year Treasury Constant Maturity +2.44%) ± | | | 3.82 | | | | 8-1-2027 | | | | 34,943 | | | | 34,966 | |
FHLMC (1 Year Treasury Constant Maturity +2.44%) ± | | | 3.82 | | | | 2-1-2029 | | | | 2,226 | | | | 2,217 | |
FHLMC (1 Year Treasury Constant Maturity +2.48%) ± | | | 3.82 | | | | 6-1-2030 | | | | 31,567 | | | | 32,073 | |
FHLMC (1 Year Treasury Constant Maturity +2.40%) ± | | | 3.82 | | | | 9-1-2031 | | | | 67,074 | | | �� | 67,949 | |
FHLMC (1 Year Treasury Constant Maturity +1.55%) ± | | | 3.82 | | | | 7-1-2030 | | | | 3,794 | | | | 3,781 | |
FHLMC (1 Year Treasury Constant Maturity +2.32%) ± | | | 3.82 | | | | 6-1-2035 | | | | 993,565 | | | | 1,049,216 | |
FHLMC (1 Year Treasury Constant Maturity +2.25%) ± | | | 3.82 | | | | 8-1-2035 | | | | 430,528 | | | | 452,696 | |
FHLMC (12 Month LIBOR +1.81%) ± | | | 3.82 | | | | 5-1-2039 | | | | 788,100 | | | | 826,203 | |
FHLMC (1 Year Treasury Constant Maturity +2.25%) ± | | | 3.83 | | | | 11-1-2036 | | | | 903,793 | | | | 951,198 | |
FHLMC (6 Month LIBOR +1.66%) ± | | | 3.84 | | | | 6-1-2037 | | | | 406,629 | | | | 419,212 | |
FHLMC (1 Year Treasury Constant Maturity +2.21%) ± | | | 3.84 | | | | 11-1-2036 | | | | 989,761 | | | | 1,041,770 | |
FHLMC (12 Month Treasury Average +2.46%) ± | | | 3.85 | | | | 10-1-2029 | | | | 101,528 | | | | 103,434 | |
FHLMC (1 Year Treasury Constant Maturity +2.36%) ± | | | 3.85 | | | | 1-1-2028 | | | | 17,518 | | | | 18,235 | |
FHLMC (1 Year Treasury Constant Maturity +2.02%) ± | | | 3.86 | | | | 12-1-2035 | | | | 539,586 | | | | 562,854 | |
FHLMC (1 Year Treasury Constant Maturity +2.23%) ± | | | 3.87 | | | | 3-1-2034 | | | | 695,000 | | | | 725,931 | |
FHLMC (12 Month LIBOR +1.93%) ± | | | 3.87 | | | | 4-1-2035 | | | | 940,293 | | | | 992,824 | |
The accompanying notes are an integral part of these financial statements.
| | | | | | |
| Portfolio of investments—August 31, 2018 | | Wells Fargo Adjustable Rate Government Fund | | | 13 | |
| | | | | | | | | | | | | | | | |
| Security name | | Interest rate | | | Maturity date | | | Principal | | | Value | |
|
Agency Securities (continued) | |
FHLMC (1 Year Treasury Constant Maturity +2.24%) ± | | | 3.87 | % | | | 3-1-2027 | | | $ | 91,475 | | | $ | 92,789 | |
FHLMC (6 Month LIBOR +1.70%) ± | | | 3.87 | | | | 1-1-2037 | | | | 1,092,781 | | | | 1,135,782 | |
FHLMC (1 Year Treasury Constant Maturity +2.24%) ± | | | 3.88 | | | | 4-1-2037 | | | | 519,246 | | | | 546,273 | |
FHLMC (1 Year Treasury Constant Maturity +2.32%) ± | | | 3.88 | | | | 10-1-2033 | | | | 1,712,992 | | | | 1,798,299 | |
FHLMC (6 Month LIBOR +1.42%) ± | | | 3.88 | | | | 2-1-2037 | | | | 6,160 | | | | 6,338 | |
FHLMC (1 Year Treasury Constant Maturity +2.36%) ± | | | 3.89 | | | | 4-1-2034 | | | | 434,353 | | | | 450,841 | |
FHLMC (12 Month LIBOR +1.84%) ± | | | 3.89 | | | | 4-1-2035 | | | | 1,352,416 | | | | 1,425,072 | |
FHLMC (3 Year Treasury Constant Maturity +2.44%) ± | | | 3.89 | | | | 5-1-2032 | | | | 211,675 | | | | 209,254 | |
FHLMC (1 Year Treasury Constant Maturity +2.30%) ± | | | 3.90 | | | | 3-1-2037 | | | | 321,212 | | | | 337,302 | |
FHLMC (1 Year Treasury Constant Maturity +2.35%) ± | | | 3.90 | | | | 6-1-2035 | | | | 489,904 | | | | 518,172 | |
FHLMC (1 Year Treasury Constant Maturity +2.23%) ± | | | 3.91 | | | | 3-1-2034 | | | | 766,536 | | | | 799,950 | |
FHLMC (1 Year Treasury Constant Maturity +2.31%) ± | | | 3.91 | | | | 7-1-2038 | | | | 606,867 | | | | 640,356 | |
FHLMC (1 Year Treasury Constant Maturity +2.37%) ± | | | 3.92 | | | | 1-1-2037 | | | | 1,558,443 | | | | 1,646,660 | |
FHLMC (1 Year Treasury Constant Maturity +2.24%) ± | | | 3.94 | | | | 2-1-2036 | | | | 1,003,122 | | | | 1,056,496 | |
FHLMC (1 Year Treasury Constant Maturity +2.24%) ± | | | 3.94 | | | | 7-1-2037 | | | | 499,132 | | | | 525,973 | |
FHLMC (1 Year Treasury Constant Maturity +2.25%) ± | | | 3.94 | | | | 4-1-2038 | | | | 991,222 | | | | 1,042,984 | |
FHLMC (1 Year Treasury Constant Maturity +2.28%) ± | | | 3.94 | | | | 7-1-2031 | | | | 968,600 | | | | 996,950 | |
FHLMC (1 Year Treasury Constant Maturity +2.30%) ± | | | 3.95 | | | | 1-1-2036 | | | | 543,383 | | | | 573,235 | |
FHLMC (1 Year Treasury Constant Maturity +2.23%) ± | | | 3.95 | | | | 5-1-2038 | | | | 851,926 | | | | 893,737 | |
FHLMC (1 Year Treasury Constant Maturity +2.25%) ± | | | 3.96 | | | | 8-1-2035 | | | | 1,680,952 | | | | 1,771,917 | |
FHLMC (1 Year Treasury Constant Maturity +2.18%) ± | | | 3.96 | | | | 4-1-2023 | | | | 176,189 | | | | 176,778 | |
FHLMC (12 Month LIBOR +1.99%) ± | | | 3.97 | | | | 7-1-2036 | | | | 707,251 | | | | 741,017 | |
FHLMC (1 Year Treasury Constant Maturity +2.23%) ± | | | 3.97 | | | | 1-1-2034 | | | | 745,025 | | | | 780,318 | |
FHLMC (1 Year Treasury Constant Maturity +2.26%) ± | | | 3.98 | | | | 5-1-2034 | | | | 1,359,071 | | | | 1,427,159 | |
FHLMC (1 Year Treasury Constant Maturity +2.23%) ± | | | 3.98 | | | | 9-1-2035 | | | | 1,356,575 | | | | 1,427,290 | |
FHLMC (1 Year Treasury Constant Maturity +2.24%) ± | | | 3.98 | | | | 8-1-2027 | | | | 5,226 | | | | 5,268 | |
FHLMC (US Treasury H15 Treasury Bill 6 Month Auction High Discount +1.75%) ± | | | 3.98 | | | | 1-1-2023 | | | | 21,883 | | | | 22,810 | |
FHLMC (12 Month LIBOR +1.87%) ± | | | 3.99 | | | | 4-1-2037 | | | | 529,433 | | | | 556,216 | |
FHLMC (1 Year Treasury Constant Maturity +2.23%) ± | | | 3.99 | | | | 5-1-2038 | | | | 1,100,975 | | | | 1,155,622 | |
FHLMC (1 Year Treasury Constant Maturity +2.25%) ± | | | 3.99 | | | | 6-1-2035 | | | | 110,630 | | | | 116,598 | |
FHLMC (1 Year Treasury Constant Maturity +2.25%) ± | | | 3.99 | | | | 2-1-2036 | | | | 613,117 | | | | 640,657 | |
FHLMC (1 Year Treasury Constant Maturity +2.43%) ± | | | 4.00 | | | | 10-1-2030 | | | | 1,508,195 | | | | 1,578,063 | |
FHLMC (1 Year Treasury Constant Maturity +2.13%) ± | | | 4.01 | | | | 7-1-2019 | | | | 306 | | | | 304 | |
FHLMC (1 Year Treasury Constant Maturity +2.26%) ± | | | 4.01 | | | | 2-1-2036 | | | | 517,090 | | | | 544,747 | |
FHLMC (1 Year Treasury Constant Maturity +2.36%) ± | | | 4.01 | | | | 1-1-2028 | | | | 2,406 | | | | 2,521 | |
FHLMC (1 Year Treasury Constant Maturity +2.36%) ± | | | 4.01 | | | | 2-1-2031 | | | | 528,663 | | | | 553,076 | |
FHLMC (1 Year Treasury Constant Maturity +2.25%) ± | | | 4.01 | | | | 10-1-2034 | | | | 871,478 | | | | 917,783 | |
FHLMC (11th District Cost of Funds +2.57%) ± | | | 4.02 | | | | 12-1-2025 | | | | 345,471 | | | | 360,348 | |
FHLMC (1 Year Treasury Constant Maturity +2.38%) ± | | | 4.03 | | | | 6-1-2035 | | | | 1,418,081 | | | | 1,476,131 | |
FHLMC (1 Year Treasury Constant Maturity +2.31%) ± | | | 4.03 | | | | 9-1-2029 | | | | 637,792 | | | | 666,067 | |
FHLMC (1 Year Treasury Constant Maturity +2.35%) ± | | | 4.03 | | | | 2-1-2036 | | | | 107,687 | | | | 113,931 | |
FHLMC (1 Year Treasury Constant Maturity +2.28%) ± | | | 4.03 | | | | 4-1-2037 | | | | 1,369,750 | | | | 1,444,889 | |
FHLMC (1 Year Treasury Constant Maturity +2.34%) ± | | | 4.03 | | | | 9-1-2032 | | | | 1,502,824 | | | | 1,580,156 | |
FHLMC (6 Month LIBOR +2.38%) ± | | | 4.04 | | | | 2-1-2024 | | | | 16,222 | | | | 16,270 | |
FHLMC (1 Year Treasury Constant Maturity +2.32%) ± | | | 4.04 | | | | 9-1-2030 | | | | 181,163 | | | | 190,349 | |
FHLMC (1 Year Treasury Constant Maturity +2.37%) ± | | | 4.05 | | | | 7-1-2027 | | | | 503,779 | | | | 506,588 | |
FHLMC (12 Month LIBOR +1.91%) ± | | | 4.05 | | | | 3-1-2032 | | | | 807,103 | | | | 847,465 | |
FHLMC (1 Year Treasury Constant Maturity +2.17%) ± | | | 4.05 | | | | 5-1-2037 | | | | 177,278 | | | | 185,951 | |
FHLMC (1 Year Treasury Constant Maturity +2.52%) ± | | | 4.05 | | | | 11-1-2029 | | | | 103,124 | | | | 106,114 | |
FHLMC (12 Month LIBOR +1.75%) ± | | | 4.05 | | | | 4-1-2035 | | | | 217,624 | | | | 228,872 | |
The accompanying notes are an integral part of these financial statements.
| | | | |
| 14 | | Wells Fargo Adjustable Rate Government Fund | | Portfolio of investments—August 31, 2018 |
| | | | | | | | | | | | | | | | |
| Security name | | Interest rate | | | Maturity date | | | Principal | | | Value | |
|
Agency Securities (continued) | |
FHLMC (1 Year Treasury Constant Maturity +2.29%) ± | | | 4.06 | % | | | 9-1-2033 | | | $ | 679,470 | | | $ | 714,898 | |
FHLMC (1 Year Treasury Constant Maturity +2.23%) ± | | | 4.08 | | | | 4-1-2034 | | | | 313,120 | | | | 326,885 | |
FHLMC (12 Month LIBOR +1.90%) ± | | | 4.10 | | | | 4-1-2037 | | | | 564,989 | | | | 593,666 | |
FHLMC (1 Year Treasury Constant Maturity +2.48%) ± | | | 4.10 | | | | 6-1-2035 | | | | 1,521,649 | | | | 1,617,871 | |
FHLMC (1 Year Treasury Constant Maturity +2.23%) ± | | | 4.11 | | | | 4-1-2034 | | | | 335,512 | | | | 351,524 | |
FHLMC (1 Year Treasury Constant Maturity +2.44%) ± | | | 4.12 | | | | 11-1-2029 | | | | 620,506 | | | | 645,190 | |
FHLMC (1 Year Treasury Constant Maturity +2.25%) ± | | | 4.13 | | | | 5-1-2034 | | | | 178,298 | | | | 186,349 | |
FHLMC (1 Year Treasury Constant Maturity +2.43%) ± | | | 4.13 | | | | 8-1-2029 | | | | 77,873 | | | | 78,895 | |
FHLMC (1 Year Treasury Constant Maturity +2.48%) ± | | | 4.15 | | | | 10-1-2024 | | | | 80,606 | | | | 83,367 | |
FHLMC (6 Month LIBOR +2.12%) ± | | | 4.17 | | | | 5-1-2037 | | | | 62,076 | | | | 65,125 | |
FHLMC (1 Year Treasury Constant Maturity +2.23%) ± | | | 4.20 | | | | 5-1-2034 | | | | 1,149,050 | | | | 1,203,827 | |
FHLMC (1 Year Treasury Constant Maturity +2.34%) ± | | | 4.21 | | | | 7-1-2034 | | | | 560,240 | | | | 582,635 | |
FHLMC (1 Year Treasury Constant Maturity +2.66%) ± | | | 4.21 | | | | 5-1-2028 | | | | 215,176 | | | | 222,485 | |
FHLMC (1 Year Treasury Constant Maturity +2.61%) ± | | | 4.21 | | | | 9-1-2030 | | | | 101,705 | | | | 103,394 | |
FHLMC (12 Month LIBOR +1.77%) ± | | | 4.21 | | | | 10-1-2036 | | | | 505,448 | | | | 530,970 | |
FHLMC (1 Year Treasury Constant Maturity +2.48%) ± | | | 4.23 | | | | 2-1-2030 | | | | 30,164 | | | | 30,489 | |
FHLMC (1 Year Treasury Constant Maturity +2.23%) ± | | | 4.23 | | | | 5-1-2032 | | | | 42,588 | | | | 44,052 | |
FHLMC (1 Year Treasury Constant Maturity +2.25%) ± | | | 4.23 | | | | 9-1-2038 | | | | 191,104 | | | | 195,383 | |
FHLMC (6 Month LIBOR +1.73%) ± | | | 4.23 | | | | 6-1-2024 | | | | 6,871 | | | | 6,881 | |
FHLMC (1 Year Treasury Constant Maturity +2.36%) ± | | | 4.23 | | | | 4-1-2038 | | | | 1,419,488 | | | | 1,491,937 | |
FHLMC (1 Year Treasury Constant Maturity +2.25%) ± | | | 4.25 | | | | 3-1-2036 | | | | 550,207 | | | | 575,520 | |
FHLMC (FHLMC National Average Mortgage Contract +3.27%) ± | | | 4.27 | | | | 2-1-2021 | | | | 8,898 | | | | 8,943 | |
FHLMC (12 Month LIBOR +1.75%) ± | | | 4.28 | | | | 5-1-2033 | | | | 189,927 | | | | 200,202 | |
FHLMC (12 Month LIBOR +1.78%) ± | | | 4.31 | | | | 10-1-2035 | | | | 1,070,182 | | | | 1,127,230 | |
FHLMC (1 Year Treasury Constant Maturity +2.48%) ± | | | 4.31 | | | | 6-1-2030 | | | | 96,138 | | | | 97,793 | |
FHLMC (1 Year Treasury Constant Maturity +2.44%) ± | | | 4.32 | | | | 4-1-2029 | | | | 93,334 | | | | 94,192 | |
FHLMC (Federal Cost of Funds +2.72%) ± | | | 4.32 | | | | 4-1-2023 | | | | 10,867 | | | | 10,972 | |
FHLMC (1 Year Treasury Constant Maturity +2.40%) ± | | | 4.33 | | | | 7-1-2029 | | | | 54,515 | | | | 56,637 | |
FHLMC (1 Year Treasury Constant Maturity +2.31%) ± | | | 4.36 | | | | 6-1-2035 | | | | 520,689 | | | | 544,769 | |
FHLMC (3 Year Treasury Constant Maturity +2.67%) ± | | | 4.36 | | | | 6-1-2035 | | | | 900,808 | | | | 944,212 | |
FHLMC (1 Year Treasury Constant Maturity +2.25%) ± | | | 4.37 | | | | 11-1-2035 | | | | 926,630 | | | | 974,530 | |
FHLMC (6 Month LIBOR +2.08%) ± | | | 4.38 | | | | 6-1-2026 | | | | 816,116 | | | | 837,930 | |
FHLMC (12 Month LIBOR +1.87%) ± | | | 4.39 | | | | 5-1-2035 | | | | 155,024 | | | | 163,837 | |
FHLMC (1 Year Treasury Constant Maturity +2.48%) ± | | | 4.40 | | | | 6-1-2030 | | | | 264,000 | | | | 274,675 | |
FHLMC (12 Month LIBOR +1.75%) ± | | | 4.41 | | | | 6-1-2033 | | | | 672,800 | | | | 705,031 | |
FHLMC (US Treasury H15 Treasury Bill 6 Month Auction High Discount +1.94%) ± | | | 4.44 | | | | 7-1-2024 | | | | 30,805 | | | | 30,572 | |
FHLMC (1 Year Treasury Constant Maturity +2.35%) ± | | | 4.44 | | | | 7-1-2038 | | | | 1,085,145 | | | | 1,140,408 | |
FHLMC (1 Year Treasury Constant Maturity +2.47%) ± | | | 4.47 | | | | 7-1-2034 | | | | 808,504 | | | | 847,668 | |
FHLMC (1 Year Treasury Constant Maturity +2.22%) ± | | | 4.47 | | | | 8-1-2033 | | | | 230,559 | | | | 242,454 | |
FHLMC (1 Year Treasury Constant Maturity +2.48%) ± | | | 4.48 | | | | 10-1-2025 | | | | 27,921 | | | | 27,956 | |
FHLMC (1 Year Treasury Constant Maturity +2.60%) ± | | | 4.48 | | | | 6-1-2032 | | | | 139,424 | | | | 140,897 | |
FHLMC (1 Year Treasury Constant Maturity +2.23%) ± | | | 4.48 | | | | 11-1-2026 | | | | 69,010 | | | | 71,043 | |
FHLMC (1 Year Treasury Constant Maturity +2.48%) ± | | | 4.51 | | | | 10-1-2025 | | | | 61,534 | | | | 62,456 | |
FHLMC (12 Month LIBOR +1.77%) ± | | | 4.51 | | | | 6-1-2035 | | | | 942,644 | | | | 994,439 | |
FHLMC (1 Year Treasury Constant Maturity +2.43%) ± | | | 4.63 | | | | 6-1-2025 | | | | 56,734 | | | | 57,396 | |
FHLMC | | | 5.00 | | | | 10-1-2022 | | | | 8,029 | | | | 8,199 | |
FHLMC (1 Year Treasury Constant Maturity +2.32%) ± | | | 5.50 | | | | 8-1-2024 | | | | 217,575 | | | | 217,729 | |
FHLMC (6 Month LIBOR +3.30%) ± | | | 5.59 | | | | 11-1-2026 | | | | 93,355 | | | | 96,150 | |
FHLMC Series 0020 Class F ±± | | | 2.61 | | | | 7-1-2029 | | | | 11,544 | | | | 11,801 | |
FHLMC Series 1671 Class QA (11th District Cost of Funds +0.95%) ± | | | 1.88 | | | | 2-15-2024 | | | | 590,190 | | | | 600,600 | |
The accompanying notes are an integral part of these financial statements.
| | | | | | |
| Portfolio of investments—August 31, 2018 | | Wells Fargo Adjustable Rate Government Fund | | | 15 | |
| | | | | | | | | | | | | | | | |
| Security name | | Interest rate | | | Maturity date | | | Principal | | | Value | |
|
Agency Securities (continued) | |
FHLMC Series 1686 Class FE (11th District Cost of Funds +1.10%) ± | | | 2.03 | % | | | 2-15-2024 | | | $ | 17,662 | | | $ | 18,001 | |
FHLMC Series 1730 Class FA (10 Year Treasury Constant Maturity -0.60%) ± | | | 2.26 | | | | 5-15-2024 | | | | 121,237 | | | | 121,056 | |
FHLMC Series 2315 Class FW (1 Month LIBOR +0.55%) ± | | | 2.61 | | | | 4-15-2027 | | | | 80,245 | | | | 81,236 | |
FHLMC Series 2391 Class EF (1 Month LIBOR +0.50%) ± | | | 2.56 | | | | 6-15-2031 | | | | 73,140 | | | | 73,537 | |
FHLMC Series 2454 Class SL (1 Month LIBOR +8.00%) ±(c) | | | 5.94 | | | | 3-15-2032 | | | | 139,888 | | | | 23,710 | |
FHLMC Series 2461 Class FI (1 Month LIBOR +0.50%) ± | | | 2.56 | | | | 4-15-2028 | | | | 102,535 | | | | 102,932 | |
FHLMC Series 2464 Class FE (1 Month LIBOR +1.00%) ± | | | 3.06 | | | | 3-15-2032 | | | | 91,175 | | | | 93,827 | |
FHLMC Series 2466 Class FV (1 Month LIBOR +0.55%) ± | | | 2.61 | | | | 3-15-2032 | | | | 183,163 | | | | 185,911 | |
FHLMC Series 2538 Class F (1 Month LIBOR +0.60%) ± | | | 2.66 | | | | 12-15-2032 | | | | 396,063 | | | | 401,783 | |
FHLMC Series 3335 Class FT (1 Month LIBOR +0.15%) ± | | | 2.21 | | | | 8-15-2019 | | | | 328 | | | | 328 | |
FHLMC Series 3436 Class A ±± | | | 3.42 | | | | 11-15-2036 | | | | 775,406 | | | | 819,024 | |
FHLMC Series T-15 Class A6 (1 Month LIBOR +0.40%) ± | | | 2.46 | | | | 11-25-2028 | | | | 514,557 | | | | 512,483 | |
FHLMC Series T-16 Class A (1 Month LIBOR +0.35%) ± | | | 2.41 | | | | 6-25-2029 | | | | 1,352,778 | | | | 1,321,789 | |
FHLMC Series T-20 Class A7 (1 Month LIBOR +0.15%) ± | | | 2.36 | | | | 12-25-2029 | | | | 2,522,132 | | | | 2,479,642 | |
FHLMC Series T-21 Class A (1 Month LIBOR +0.18%) ± | | | 2.42 | | | | 10-25-2029 | | | | 1,169,955 | | | | 1,161,946 | |
FHLMC Series T-23 Class A (1 Month LIBOR +0.28%) ± | | | 2.34 | | | | 5-25-2030 | | | | 1,518,255 | | | | 1,517,198 | |
FHLMC Series T-27 Class A (1 Month LIBOR +0.30%) ± | | | 2.36 | | | | 10-25-2030 | | | | 1,009,412 | | | | 1,014,721 | |
FHLMC Series T-30 Class A7 (1 Month LIBOR +0.12%) ± | | | 2.42 | | | | 12-25-2030 | | | | 1,087,685 | | | | 1,054,217 | |
FHLMC Series T-35 Class A (1 Month LIBOR +0.28%) ± | | | 2.34 | | | | 9-25-2031 | | | | 2,782,698 | | | | 2,754,292 | |
FHLMC Series T-48 Class 2A ±± | | | 3.96 | | | | 7-25-2033 | | | | 2,158,501 | | | | 2,160,622 | |
FHLMC Series T-54 Class 4A ±± | | | 3.75 | | | | 2-25-2043 | | | | 1,502,518 | | | | 1,490,955 | |
FHLMC Series T-55 Class 1A1 | | | 6.50 | | | | 3-25-2043 | | | | 61,965 | | | | 68,526 | |
FHLMC Series T-56 Class 3AF (1 Month LIBOR +1.00%) ± | | | 3.06 | | | | 5-25-2043 | | | | 969,316 | | | | 991,394 | |
FHLMC Series T-62 Class 1A1 (12 Month Treasury Average +1.20%) ± | | | 2.95 | | | | 10-25-2044 | | | | 3,536,189 | | | | 3,524,283 | |
FHLMC Series T-63 Class 1A1 (12 Month Treasury Average +1.20%) ± | | | 2.76 | | | | 2-25-2045 | | | | 3,187,097 | | | | 3,184,617 | |
FHLMC Series T-66 Class 2A1 ±± | | | 3.88 | | | | 1-25-2036 | | | | 2,038,368 | | | | 2,044,140 | |
FHLMC Series T-67 Class 1A1C ±± | | | 3.67 | | | | 3-25-2036 | | | | 4,710,012 | | | | 4,785,682 | |
FHLMC Series T-67 Class 2A1C ±± | | | 3.43 | | | | 3-25-2036 | | | | 3,756,343 | | | | 3,751,716 | |
FHLMC Series T-75 Class A1 (1 Month LIBOR +0.04%) ± | | | 2.10 | | | | 12-25-2036 | | | | 984,275 | | | | 982,276 | |
FNMA (11th District Cost of Funds +1.25%) ± | | | 2.06 | | | | 4-1-2019 | | | | 85 | | | | 85 | |
FNMA (11th District Cost of Funds +1.25%) ± | | | 2.06 | | | | 4-1-2021 | | | | 23,046 | | | | 22,937 | |
FNMA (11th District Cost of Funds +1.25%) ± | | | 2.06 | | | | 3-1-2033 | | | | 121,480 | | | | 121,510 | |
FNMA (11th District Cost of Funds +1.25%) ± | | | 2.08 | | | | 11-1-2024 | | | | 2,562 | | | | 2,556 | |
FNMA (11th District Cost of Funds +1.25%) ± | | | 2.10 | | | | 11-1-2020 | | | | 122,673 | | | | 121,926 | |
FNMA (11th District Cost of Funds +1.25%) ± | | | 2.13 | | | | 3-1-2021 | | | | 84 | | | | 84 | |
FNMA (11th District Cost of Funds +1.25%) ± | | | 2.14 | | | | 4-1-2042 | | | | 1,975,713 | | | | 1,966,212 | |
FNMA (11th District Cost of Funds +1.25%) ± | | | 2.14 | | | | 10-1-2044 | | | | 974,965 | | | | 970,035 | |
FNMA (11th District Cost of Funds +1.25%) ± | | | 2.15 | | | | 11-1-2023 | | | | 25,262 | | | | 25,060 | |
FNMA (11th District Cost of Funds +1.26%) ± | | | 2.16 | | | | 1-1-2035 | | | | 844,301 | | | | 850,141 | |
FNMA (11th District Cost of Funds +1.50%) ± | | | 2.25 | | | | 5-1-2019 | | | | 14 | | | | 14 | |
FNMA (11th District Cost of Funds +1.25%) ± | | | 2.26 | | | | 1-1-2038 | | | | 110,533 | | | | 110,546 | |
FNMA (11th District Cost of Funds +1.45%) ± | | | 2.30 | | | | 4-1-2024 | | | | 1,687,253 | | | | 1,688,665 | |
FNMA (11th District Cost of Funds +1.25%) ± | | | 2.33 | | | | 9-1-2037 | | | | 2,097,872 | | | | 2,089,010 | |
FNMA (11th District Cost of Funds +1.63%) ± | | | 2.44 | | | | 5-1-2028 | | | | 19,793 | | | | 19,763 | |
FNMA (3 Year Treasury Constant Maturity +1.21%) ± | | | 2.45 | | | | 3-1-2030 | | | | 17,404 | | | | 17,372 | |
FNMA (11th District Cost of Funds +1.50%) ± | | | 2.50 | | | | 1-1-2019 | | | | 1,630 | | | | 1,625 | |
FNMA (11th District Cost of Funds +1.78%) ± | | | 2.50 | | | | 1-1-2036 | | | | 212,236 | | | | 213,500 | |
FNMA (11th District Cost of Funds +1.82%) ± | | | 2.51 | | | | 5-1-2028 | | | | 45,401 | | | | 45,560 | |
FNMA (11th District Cost of Funds +1.86%) ± | | | 2.61 | | | | 9-1-2019 | | | | 2,401 | | | | 2,398 | |
FNMA (1 Year Treasury Constant Maturity +1.25%) ± | | | 2.65 | | | | 1-1-2021 | | | | 802 | | | | 811 | |
The accompanying notes are an integral part of these financial statements.
| | | | |
| 16 | | Wells Fargo Adjustable Rate Government Fund | | Portfolio of investments—August 31, 2018 |
| | | | | | | | | | | | | | | | |
| Security name | | Interest rate | | | Maturity date | | | Principal | | | Value | |
|
Agency Securities (continued) | |
FNMA (1 Year Treasury Constant Maturity +1.25%) ± | | | 2.65 | % | | | 1-1-2021 | | | $ | 1,274 | | | $ | 1,287 | |
FNMA (11th District Cost of Funds +1.78%) ± | | | 2.66 | | | | 11-1-2022 | | | | 22,513 | | | | 22,512 | |
FNMA (11th District Cost of Funds +1.83%) ± | | | 2.67 | | | | 1-1-2036 | | | | 62,756 | | | | 63,034 | |
FNMA (11th District Cost of Funds +1.78%) ± | | | 2.68 | | | | 3-1-2033 | | | | 268,165 | | | | 268,809 | |
FNMA (11th District Cost of Funds +1.91%) ± | | | 2.69 | | | | 9-1-2030 | | | | 242,627 | | | | 246,261 | |
FNMA (11th District Cost of Funds +1.87%) ± | | | 2.75 | | | | 10-1-2027 | | | | 445,778 | | | | 450,474 | |
FNMA (11th District Cost of Funds +1.87%) ± | | | 2.75 | | | | 10-1-2024 | | | | 911 | | | | 911 | |
FNMA (6 Month LIBOR +1.00%) ± | | | 2.75 | | | | 12-1-2020 | | | | 5,968 | | | | 5,949 | |
FNMA (11th District Cost of Funds +1.25%) ± | | | 2.76 | | | | 10-1-2018 | | | | 113 | | | | 113 | |
FNMA (11th District Cost of Funds +2.02%) ± | | | 2.77 | | | | 11-1-2024 | | | | 29,799 | | | | 30,012 | |
FNMA (11th District Cost of Funds +1.25%) ± | | | 2.79 | | | | 7-1-2020 | | | | 464,334 | | | | 463,991 | |
FNMA (11th District Cost of Funds +1.25%) ± | | | 2.84 | | | | 3-1-2019 | | | | 27,825 | | | | 27,785 | |
FNMA (11th District Cost of Funds +1.97%) ± | | | 2.84 | | | | 9-1-2021 | | | | 7,251 | | | | 7,243 | |
FNMA (11th District Cost of Funds +1.97%) ± | | | 2.85 | | | | 1-1-2021 | | | | 46,344 | | | | 46,315 | |
FNMA (11th District Cost of Funds +2.11%) ± | | | 2.94 | | | | 4-1-2020 | | | | 953,753 | | | | 951,602 | |
FNMA (6 Month LIBOR +1.08%) ± | | | 2.95 | | | | 9-1-2032 | | | | 53,823 | | | | 53,750 | |
FNMA (11th District Cost of Funds +1.70%) ± | | | 2.99 | | | | 4-1-2030 | | | | 1,170 | | | | 1,171 | |
FNMA (3 Year Treasury Constant Maturity +2.14%) ± | | | 3.02 | | | | 10-1-2025 | | | | 6,289 | | | | 6,251 | |
FNMA (11th District Cost of Funds +1.21%) ± | | | 3.05 | | | | 10-1-2034 | | | | 121,526 | | | | 122,386 | |
FNMA (12 Month Treasury Average +1.40%) ± | | | 3.05 | | | | 12-1-2030 | | | | 89,232 | | | | 88,265 | |
FNMA (1 Year Treasury Constant Maturity +1.74%) ± | | | 3.12 | | | | 1-1-2035 | | | | 42,670 | | | | 44,105 | |
FNMA (6 Month LIBOR +1.38%) ± | | | 3.13 | | | | 8-1-2031 | | | | 128,640 | | | | 130,875 | |
FNMA (11th District Cost of Funds +1.25%) ± | | | 3.15 | | | | 4-1-2034 | | | | 1,289,848 | | | | 1,313,929 | |
FNMA (1 Year Treasury Constant Maturity +1.82%) ± | | | 3.16 | | | | 4-1-2038 | | | | 389,511 | | | | 406,159 | |
FNMA (1 Year Treasury Constant Maturity +1.70%) ± | | | 3.17 | | | | 2-1-2033 | | | | 275,593 | | | | 285,094 | |
FNMA (1 Month LIBOR +1.17%) ± | | | 3.17 | | | | 5-1-2029 | | | | 44,074 | | | | 45,585 | |
FNMA (6 Month LIBOR +1.42%) ± | | | 3.18 | | | | 9-1-2031 | | | | 148,088 | | | | 151,809 | |
FNMA (1 Year Treasury Constant Maturity +1.50%) ± | | | 3.18 | | | | 8-1-2030 | | | | 1,140,095 | | | | 1,165,934 | |
FNMA (3 Year Treasury Constant Maturity +2.47%) ± | | | 3.22 | | | | 6-1-2024 | | | | 16,913 | | | | 16,871 | |
FNMA (6 Month LIBOR +1.00%) ± | | | 3.29 | | | | 6-1-2021 | | | | 17,952 | | | | 18,367 | |
FNMA (1 Year Treasury Constant Maturity +2.13%) ± | | | 3.31 | | | | 10-1-2025 | | | | 89,449 | | | | 90,976 | |
FNMA (1 Year Treasury Constant Maturity +2.08%) ± | | | 3.34 | | | | 11-1-2035 | | | | 667,962 | | | | 701,846 | |
FNMA (Federal Cost of Funds +2.00%) ± | | | 3.35 | | | | 2-1-2029 | | | | 2,591 | | | | 2,590 | |
FNMA (1 Year Treasury Constant Maturity +1.58%) ± | | | 3.36 | | | | 3-1-2034 | | | | 339,547 | | | | 355,352 | |
FNMA (1 Year Treasury Constant Maturity +2.13%) ± | | | 3.38 | | | | 10-1-2035 | | | | 162,565 | | | | 171,561 | |
FNMA (6 Month LIBOR +1.18%) ± | | | 3.40 | | | | 8-1-2033 | | | | 174,141 | | | | 180,711 | |
FNMA (12 Month LIBOR +1.65%) ± | | | 3.40 | | | | 9-1-2037 | | | | 577,710 | | | | 600,754 | |
FNMA (1 Year Treasury Constant Maturity +2.28%) ± | | | 3.40 | | | | 9-1-2026 | | | | 33,560 | | | | 34,022 | |
FNMA (1 Year Treasury Constant Maturity +2.09%) ± | | | 3.40 | | | | 1-1-2036 | | | | 176,190 | | | | 185,379 | |
FNMA (12 Month LIBOR +1.67%) ± | | | 3.42 | | | | 9-1-2034 | | | | 924,395 | | | | 972,806 | |
FNMA (1 Year Treasury Constant Maturity +2.17%) ± | | | 3.42 | | | | 12-1-2039 | | | | 196,364 | | | | 202,655 | |
FNMA (1 Year Treasury Constant Maturity +2.18%) ± | | | 3.44 | | | | 9-1-2035 | | | | 1,304,963 | | | | 1,373,539 | |
FNMA (Federal Cost of Funds +2.00%) ± | | | 3.44 | | | | 1-1-2029 | | | | 214 | | | | 215 | |
FNMA (US Treasury H15 Treasury Bill 6 Month Auction High Discount +1.75%) ± | | | 3.45 | | | | 7-1-2020 | | | | 518 | | | | 519 | |
FNMA (12 Month LIBOR +1.65%) ± | | | 3.46 | | | | 12-1-2033 | | | | 1,050,271 | | | | 1,100,202 | |
FNMA (1 Year Treasury Constant Maturity +2.22%) ± | | | 3.47 | | | | 10-1-2034 | | | | 429,199 | | | | 453,658 | |
FNMA (1 Year Treasury Constant Maturity +2.22%) ± | | | 3.47 | | | | 6-1-2026 | | | | 30,768 | | | | 31,562 | |
FNMA (Federal Cost of Funds +2.00%) ± | | | 3.49 | | | | 8-1-2029 | | | | 40,984 | | | | 42,989 | |
FNMA (1 Year Treasury Constant Maturity +2.13%) ± | | | 3.50 | | | | 1-1-2027 | | | | 11,590 | | | | 11,638 | |
FNMA (1 Year Treasury Constant Maturity +2.29%) ± | | | 3.50 | | | | 12-1-2030 | | | | 67,458 | | | | 68,690 | |
The accompanying notes are an integral part of these financial statements.
| | | | | | |
| Portfolio of investments—August 31, 2018 | | Wells Fargo Adjustable Rate Government Fund | | | 17 | |
| | | | | | | | | | | | | | | | |
| Security name | | Interest rate | | | Maturity date | | | Principal | | | Value | |
|
Agency Securities (continued) | |
FNMA (1 Year Treasury Constant Maturity +2.24%) ± | | | 3.50 | % | | | 2-1-2033 | | | $ | 141,161 | | | $ | 144,298 | |
FNMA (1 Year Treasury Constant Maturity +2.33%) ± | | | 3.51 | | | | 11-1-2024 | | | | 65,540 | | | | 67,435 | |
FNMA (1 Year Treasury Constant Maturity +1.90%) ± | | | 3.52 | | | | 7-1-2038 | | | | 834,660 | | | | 868,106 | |
FNMA (1 Year Treasury Constant Maturity +1.52%) ± | | | 3.53 | | | | 8-1-2033 | | | | 1,095,408 | | | | 1,128,751 | |
FNMA (12 Month LIBOR +1.65%) ± | | | 3.54 | | | | 9-1-2036 | | | | 699,893 | | | | 726,144 | |
FNMA (12 Month LIBOR +1.75%) ± | | | 3.54 | | | | 1-1-2035 | | | | 663,224 | | | | 698,400 | |
FNMA (1 Year Treasury Constant Maturity +1.67%) ± | | | 3.54 | | | | 4-1-2033 | | | | 182,870 | | | | 190,176 | |
FNMA (12 Month Treasury Average +1.88%) ± | | | 3.54 | | | | 11-1-2035 | | | | 34,110 | | | | 34,901 | |
FNMA (12 Month LIBOR +1.53%) ± | | | 3.55 | | | | 9-1-2035 | | | | 1,215,089 | | | | 1,266,984 | |
FNMA (12 Month Treasury Average +1.89%) ± | | | 3.55 | | | | 11-1-2035 | | | | 862,624 | | | | 899,095 | |
FNMA (1 Year Treasury Constant Maturity +2.18%) ± | | | 3.55 | | | | 12-1-2024 | | | | 24,079 | | | | 24,181 | |
FNMA (1 Year Treasury Constant Maturity +2.17%) ± | | | 3.56 | | | | 12-1-2034 | | | | 912,765 | | | | 960,121 | |
FNMA (1 Year Treasury Constant Maturity +2.32%) ± | | | 3.57 | | | | 5-1-2025 | | | | 33,392 | | | | 33,540 | |
FNMA (12 Month Treasury Average +1.91%) ± | | | 3.57 | | | | 1-1-2036 | | | | 2,148,943 | | | | 2,202,514 | |
FNMA (12 Month Treasury Average +1.92%) ± | | | 3.58 | | | | 6-1-2035 | | | | 620,912 | | | | 636,508 | |
FNMA (12 Month LIBOR +1.83%) ± | | | 3.58 | | | | 1-1-2033 | | | | 828,458 | | | | 872,112 | |
FNMA (12 Month Treasury Average +1.91%) ± | | | 3.58 | | | | 11-1-2035 | | | | 146,412 | | | | 150,441 | |
FNMA (5 Year Treasury Constant Maturity +1.90%) ± | | | 3.59 | | | | 9-1-2031 | | | | 211,780 | | | | 215,867 | |
FNMA (6 Month LIBOR +1.45%) ± | | | 3.59 | | | | 10-1-2037 | | | | 790,661 | | | | 814,266 | |
FNMA (12 Month Treasury Average +1.99%) ± | | | 3.59 | | | | 7-1-2035 | | | | 1,055,922 | | | | 1,085,298 | |
FNMA (1 Year Treasury Constant Maturity +2.22%) ± | | | 3.60 | | | | 8-1-2031 | | | | 108,283 | | | | 110,044 | |
FNMA (1 Year Treasury Constant Maturity +2.31%) ± | | | 3.60 | | | | 12-1-2034 | | | | 727,816 | | | | 770,680 | |
FNMA (12 Month Treasury Average +1.95%) ± | | | 3.61 | | | | 7-1-2035 | | | | 705,462 | | | | 723,843 | |
FNMA (1 Year Treasury Constant Maturity +2.20%) ± | | | 3.61 | | | | 2-1-2035 | | | | 199,636 | | | | 210,124 | |
FNMA (12 Month Treasury Average +2.48%) ± | | | 3.62 | | | | 6-1-2040 | | | | 774,873 | | | | 799,075 | |
FNMA (1 Year Treasury Constant Maturity +2.25%) ± | | | 3.62 | | | | 6-1-2027 | | | | 783 | | | | 800 | |
FNMA (1 Year Treasury Constant Maturity +2.37%) ± | | | 3.62 | | | | 7-1-2027 | | | | 21,685 | | | | 21,807 | |
FNMA (1 Year Treasury Constant Maturity +2.18%) ± | | | 3.62 | | | | 11-1-2038 | | | | 526,428 | | | | 552,062 | |
FNMA (Federal Cost of Funds +1.75%) ± | | | 3.63 | | | | 1-1-2029 | | | | 440 | | | | 441 | |
FNMA (6 Month LIBOR +1.55%) ± | | | 3.63 | | | | 3-1-2034 | | | | 269,267 | | | | 278,418 | |
FNMA (12 Month Treasury Average +1.97%) ± | | | 3.63 | | | | 12-1-2035 | | | | 2,953,886 | | | | 3,034,240 | |
FNMA (12 Month Treasury Average +1.97%) ± | | | 3.63 | | | | 11-1-2035 | | | | 999,263 | | | | 1,039,745 | |
FNMA (12 Month LIBOR +1.82%) ± | | | 3.64 | | | | 12-1-2046 | | | | 633,848 | | | | 670,484 | |
FNMA (1 Year Treasury Constant Maturity +2.02%) ± | | | 3.64 | | | | 11-1-2027 | | | | 23,712 | | | | 23,809 | |
FNMA (1 Year Treasury Constant Maturity +2.23%) ± | | | 3.64 | | | | 5-1-2035 | | | | 1,153,893 | | | | 1,214,091 | |
FNMA (12 Month Treasury Average +1.98%) ± | | | 3.64 | | | | 10-1-2035 | | | | 526,896 | | | | 541,640 | |
FNMA (6 Month LIBOR +1.15%) ± | | | 3.65 | | | | 8-1-2032 | | | | 222,957 | | | | 223,266 | |
FNMA (1 Year Treasury Constant Maturity +2.06%) ± | | | 3.65 | | | | 12-1-2033 | | | | 733,798 | | | | 756,749 | |
FNMA (12 Month Treasury Average +1.99%) ± | | | 3.66 | | | | 8-1-2035 | | | | 63,861 | | | | 63,653 | |
FNMA (1 Year Treasury Constant Maturity +2.25%) ± | | | 3.66 | | | | 10-1-2029 | | | | 70,041 | | | | 71,316 | |
FNMA (6 Month LIBOR +1.42%) ± | | | 3.67 | | | | 12-1-2031 | | | | 219,184 | | | | 227,305 | |
FNMA (1 Year Treasury Constant Maturity +2.18%) ± | | | 3.68 | | | | 1-1-2035 | | | | 86,671 | | | | 90,468 | |
FNMA (1 Year Treasury Constant Maturity +2.19%) ± | | | 3.68 | | | | 9-1-2035 | | | | 175,469 | | | | 184,623 | |
FNMA (1 Year Treasury Constant Maturity +2.20%) ± | | | 3.68 | | | | 12-1-2032 | | | | 542,606 | | | | 570,470 | |
FNMA (1 Year Treasury Constant Maturity +2.14%) ± | | | 3.69 | | | | 10-1-2033 | | | | 302,766 | | | | 318,208 | |
FNMA (1 Year Treasury Constant Maturity +2.32%) ± | | | 3.70 | | | | 1-1-2028 | | | | 2,645 | | | | 2,643 | |
FNMA (1 Year Treasury Constant Maturity +2.32%) ± | | | 3.70 | | | | 6-1-2032 | | | | 21,714 | | | | 21,812 | |
FNMA (1 Year Treasury Constant Maturity +2.19%) ± | | | 3.70 | | | | 12-1-2035 | | | | 340,457 | | | | 359,231 | |
FNMA (1 Year Treasury Constant Maturity +2.21%) ± | | | 3.70 | | | | 2-1-2034 | | | | 1,446,510 | | | | 1,512,279 | |
FNMA (12 Month Treasury Average +2.08%) ± | | | 3.70 | | | | 1-1-2035 | | | | 387,558 | | | | 398,632 | |
The accompanying notes are an integral part of these financial statements.
| | | | |
| 18 | | Wells Fargo Adjustable Rate Government Fund | | Portfolio of investments—August 31, 2018 |
| | | | | | | | | | | | | | | | |
| Security name | | Interest rate | | | Maturity date | | | Principal | | | Value | |
|
Agency Securities (continued) | |
FNMA (1 Year Treasury Constant Maturity +2.03%) ± | | | 3.71 | % | | | 12-1-2032 | | | $ | 624,381 | | | $ | 645,820 | |
FNMA (1 Year Treasury Constant Maturity +2.20%) ± | | | 3.71 | | | | 5-1-2033 | | | | 289,902 | | | | 301,838 | |
FNMA (6 Month LIBOR +1.98%) ± | | | 3.73 | | | | 9-1-2033 | | | | 54,726 | | | | 55,127 | |
FNMA (12 Month LIBOR +1.62%) ± | | | 3.73 | | | | 1-1-2040 | | | | 234,969 | | | | 245,595 | |
FNMA (1 Year Treasury Constant Maturity +2.42%) ± | | | 3.74 | | | | 9-1-2033 | | | | 525,558 | | | | 556,714 | |
FNMA (1 Year Treasury Constant Maturity +2.29%) ± | | | 3.75 | | | | 1-1-2031 | | | | 324,458 | | | | 341,618 | |
FNMA (12 Month LIBOR +1.90%) ± | | | 3.76 | | | | 10-1-2034 | | | | 463,546 | | | | 493,471 | |
FNMA (1 Year Treasury Constant Maturity +2.28%) ± | | | 3.76 | | | | 4-1-2024 | | | | 10,425 | | | | 10,682 | |
FNMA (1 Year Treasury Constant Maturity +2.18%) ± | | | 3.76 | | | | 12-1-2034 | | | | 734,863 | | | | 772,186 | |
FNMA (12 Month Treasury Average +2.60%) ± | | | 3.76 | | | | 7-1-2039 | | | | 1,737,296 | | | | 1,804,699 | |
FNMA (1 Year Treasury Constant Maturity +2.19%) ± | | | 3.76 | | | | 5-1-2036 | | | | 869,734 | | | | 916,266 | |
FNMA (1 Year Treasury Constant Maturity +2.52%) ± | | | 3.77 | | | | 11-1-2024 | | | | 59,319 | | | | 59,895 | |
FNMA (1 Year Treasury Constant Maturity +1.89%) ± | | | 3.77 | | | | 6-1-2032 | | | | 59,266 | | | | 59,253 | |
FNMA (1 Year Treasury Constant Maturity +2.13%) ± | | | 3.77 | | | | 5-1-2035 | | | | 658,391 | | | | 691,452 | |
FNMA (3 Year Treasury Constant Maturity +2.15%) ± | | | 3.77 | | | | 10-1-2024 | | | | 31,721 | | | | 31,852 | |
FNMA (1 Year Treasury Constant Maturity +2.28%) ± | | | 3.78 | | | | 7-1-2024 | | | | 9,362 | | | | 9,432 | |
FNMA (1 Year Treasury Constant Maturity +2.28%) ± | | | 3.78 | | | | 2-1-2037 | | | | 1,185,915 | | | | 1,256,616 | |
FNMA (12 Month LIBOR +1.68%) ± | | | 3.78 | | | | 9-1-2038 | | | | 797,062 | | | | 837,258 | |
FNMA (1 Year Treasury Constant Maturity +2.27%) ± | | | 3.78 | | | | 5-1-2034 | | | | 349,634 | | | | 366,342 | |
FNMA (1 Year Treasury Constant Maturity +2.15%) ± | | | 3.80 | | | | 4-1-2040 | | | | 148,070 | | | | 155,638 | |
FNMA (1 Year Treasury Constant Maturity +2.21%) ± | | | 3.80 | | | | 7-1-2038 | | | | 1,290,619 | | | | 1,363,104 | |
FNMA (6 Month LIBOR +1.42%) ± | | | 3.81 | | | | 12-1-2031 | | | | 36,691 | | | | 37,198 | |
FNMA (1 Year Treasury Constant Maturity +2.18%) ± | | | 3.81 | | | | 1-1-2033 | | | | 1,937,840 | | | | 1,997,031 | |
FNMA (1 Year Treasury Constant Maturity +2.11%) ± | | | 3.81 | | | | 5-1-2034 | | | | 651,085 | | | | 682,820 | |
FNMA (Federal Cost of Funds +2.38%) ± | | | 3.81 | | | | 2-1-2029 | | | | 1,056,410 | | | | 1,083,243 | |
FNMA (1 Year Treasury Constant Maturity +2.19%) ± | | | 3.81 | | | | 12-1-2040 | | | | 307,206 | | | | 322,843 | |
FNMA (12 Month Treasury Average +2.16%) ± | | | 3.81 | | | | 8-1-2036 | | | | 2,005,259 | | | | 2,075,219 | |
FNMA (1 Year Treasury Constant Maturity +2.22%) ± | | | 3.82 | | | | 12-1-2036 | | | | 454,716 | | | | 478,217 | |
FNMA (1 Year Treasury Constant Maturity +2.50%) ± | | | 3.82 | | | | 5-1-2035 | | | | 1,452,288 | | | | 1,549,223 | |
FNMA (1 Year Treasury Constant Maturity +2.24%) ± | | | 3.82 | | | | 10-1-2035 | | | | 875,281 | | | | 922,531 | |
FNMA (1 Year Treasury Constant Maturity +2.21%) ± | | | 3.83 | | | | 1-1-2027 | | | | 326,892 | | | | 329,420 | |
FNMA (6 Month LIBOR +1.52%) ± | | | 3.84 | | | | 11-1-2034 | | | | 353,108 | | | | 364,894 | |
FNMA (1 Year Treasury Constant Maturity +2.37%) ± | | | 3.84 | | | | 9-1-2030 | | | | 660,962 | | | | 699,882 | |
FNMA (1 Year Treasury Constant Maturity +2.60%) ± | | | 3.85 | | | | 10-1-2025 | | | | 7,710 | | | | 7,854 | |
FNMA (1 Year Treasury Constant Maturity +1.88%) ± | | | 3.85 | | | | 4-1-2030 | | | | 62,037 | | | | 62,516 | |
FNMA (1 Year Treasury Constant Maturity +2.04%) ± | | | 3.85 | | | | 6-1-2034 | | | | 634,307 | | | | 663,443 | |
FNMA (1 Year Treasury Constant Maturity +2.19%) ± | | | 3.85 | | | | 6-1-2036 | | | | 1,308,200 | | | | 1,374,371 | |
FNMA (12 Month LIBOR +1.71%) ± | | | 3.86 | | | | 2-1-2038 | | | | 600,524 | | | | 631,525 | |
FNMA (1 Year Treasury Constant Maturity +2.22%) ± | | | 3.86 | | | | 4-1-2038 | | | | 940,752 | | | | 987,134 | |
FNMA (1 Year Treasury Constant Maturity +2.22%) ± | | | 3.86 | | | | 9-1-2022 | | | | 95,053 | | | | 95,629 | |
FNMA (1 Year Treasury Constant Maturity +2.20%) ± | | | 3.86 | | | | 10-1-2036 | | | | 727,595 | | | | 762,629 | |
FNMA (6 Month LIBOR +1.37%) ± | | | 3.87 | | | | 1-1-2032 | | | | 218,100 | | | | 225,842 | |
FNMA (6 Month LIBOR +1.16%) ± | | | 3.87 | | | | 8-1-2033 | | | | 3,419 | | | | 3,470 | |
FNMA (12 Month LIBOR +1.74%) ± | | | 3.87 | | | | 6-1-2041 | | | | 585,246 | | | | 611,809 | |
FNMA (1 Year Treasury Constant Maturity +2.20%) ± | | | 3.87 | | | | 7-1-2029 | | | | 431,879 | | | | 453,565 | |
FNMA (US Treasury H15 Treasury Bill 6 Month Auction High Discount +2.00%) ± | | | 3.88 | | | | 10-1-2018 | | | | 126 | | | | 126 | |
FNMA (6 Month LIBOR +1.38%) ± | | | 3.88 | | | | 12-1-2031 | | | | 18,908 | | | | 18,928 | |
FNMA (1 Year Treasury Constant Maturity +2.15%) ± | | | 3.89 | | | | 1-1-2037 | | | | 884,803 | | | | 928,934 | |
FNMA (1 Year Treasury Constant Maturity +2.36%) ± | | | 3.89 | | | | 11-1-2034 | | | | 424,639 | | | | 449,527 | |
FNMA (1 Year Treasury Constant Maturity +2.26%) ± | | | 3.89 | | | | 5-1-2036 | | | | 1,560,987 | | | | 1,629,977 | |
The accompanying notes are an integral part of these financial statements.
| | | | | | |
| Portfolio of investments—August 31, 2018 | | Wells Fargo Adjustable Rate Government Fund | | | 19 | |
| | | | | | | | | | | | | | | | |
| Security name | | Interest rate | | | Maturity date | | | Principal | | | Value | |
|
Agency Securities (continued) | |
FNMA (1 Year Treasury Constant Maturity +1.63%) ± | | | 3.90 | % | | | 11-1-2029 | | | $ | 7,412 | | | $ | 7,413 | |
FNMA (1 Year Treasury Constant Maturity +2.21%) ± | | | 3.90 | | | | 9-1-2033 | | | | 561,020 | | | | 584,065 | |
FNMA (1 Year Treasury Constant Maturity +2.40%) ± | | | 3.90 | | | | 6-1-2024 | | | | 35,974 | | | | 36,151 | |
FNMA (6 Month LIBOR +1.84%) ± | | | 3.90 | | | | 4-1-2033 | | | | 371,791 | | | | 389,642 | |
FNMA (1 Year Treasury Constant Maturity +2.22%) ± | | | 3.90 | | | | 12-1-2040 | | | | 852,576 | | | | 897,541 | |
FNMA (1 Year Treasury Constant Maturity +2.07%) ± | | | 3.91 | | | | 9-1-2035 | | | | 1,572,606 | | | | 1,652,232 | |
FNMA (12 Month Treasury Average +2.24%) ± | | | 3.91 | | | | 8-1-2035 | | | | 743,440 | | | | 763,239 | |
FNMA (1 Year Treasury Constant Maturity +2.19%) ± | | | 3.91 | | | | 6-1-2036 | | | | 867,904 | | | | 912,575 | |
FNMA (12 Month LIBOR +1.75%) ± | | | 3.92 | | | | 4-1-2033 | | | | 381,561 | | | | 395,562 | |
FNMA (11th District Cost of Funds +2.06%) ± | | | 3.92 | | | | 7-1-2021 | | | | 17,014 | | | | 17,020 | |
FNMA (12 Month Treasury Average +2.27%) ± | | | 3.92 | | | | 9-1-2036 | | | | 441,053 | | | | 458,318 | |
FNMA (1 Year Treasury Constant Maturity +2.22%) ± | | | 3.94 | | | | 5-1-2033 | | | | 1,412,062 | | | | 1,468,352 | |
FNMA (1 Year Treasury Constant Maturity +2.26%) ± | | | 3.94 | | | | 1-1-2038 | | | | 650,786 | | | | 687,800 | |
FNMA (1 Year Treasury Constant Maturity +2.19%) ± | | | 3.95 | | | | 2-1-2036 | | | | 647,955 | | | | 683,021 | |
FNMA (1 Year Treasury Constant Maturity +2.36%) ± | | | 3.95 | | | | 7-1-2028 | | | | 528,239 | | | | 544,670 | |
FNMA (12 Month LIBOR +1.69%) ± | | | 3.96 | | | | 11-1-2038 | | | | 514,676 | | | | 535,736 | |
FNMA (1 Year Treasury Constant Maturity +2.21%) ± | | | 3.96 | | | | 11-1-2035 | | | | 1,200,038 | | | | 1,263,533 | |
FNMA (1 Year Treasury Constant Maturity +2.24%) ± | | | 3.96 | | | | 1-1-2037 | | | | 1,236,829 | | | | 1,306,266 | |
FNMA (1 Year Treasury Constant Maturity +2.15%) ± | | | 3.96 | | | | 4-1-2033 | | | | 1,008,392 | | | | 1,061,516 | |
FNMA (12 Month LIBOR +1.83%) ± | | | 3.97 | | | | 4-1-2035 | | | | 1,035,075 | | | | 1,090,651 | |
FNMA (1 Year Treasury Constant Maturity +2.33%) ± | | | 3.97 | | | | 1-1-2037 | | | | 825,539 | | | | 867,677 | |
FNMA (US Treasury H15 Treasury Bill 6 Month Auction High Discount +2.25%) ± | | | 3.97 | | | | 7-1-2020 | | | | 6,840 | | | | 6,835 | |
FNMA (12 Month LIBOR +1.70%) ± | | | 3.97 | | | | 4-1-2034 | | | | 603,163 | | | | 632,968 | |
FNMA (1 Year Treasury Constant Maturity +1.76%) ± | | | 3.97 | | | | 8-1-2032 | | | | 134,439 | | | | 137,016 | |
FNMA (1 Year Treasury Constant Maturity +2.60%) ± | | | 3.97 | | | | 2-1-2028 | | | | 36,097 | | | | 36,261 | |
FNMA (12 Month LIBOR +1.69%) ± | | | 3.97 | | | | 3-1-2037 | | | | 388,061 | | | | 409,324 | |
FNMA (1 Year Treasury Constant Maturity +2.13%) ± | | | 3.97 | | | | 5-1-2033 | | | | 546,591 | | | | 570,793 | |
FNMA (1 Year Treasury Constant Maturity +2.22%) ± | | | 3.97 | | | | 3-1-2038 | | | | 1,538,717 | | | | 1,623,077 | |
FNMA (1 Year Treasury Constant Maturity +2.25%) ± | | | 3.98 | | | | 4-1-2033 | | | | 517,548 | | | | 544,688 | |
FNMA (12 Month LIBOR +1.75%) ± | | | 3.98 | | | | 4-1-2034 | | | | 363,662 | | | | 380,146 | |
FNMA (1 Year Treasury Constant Maturity +2.22%) ± | | | 3.98 | | | | 8-1-2026 | | | | 299,114 | | | | 313,336 | |
FNMA (1 Year Treasury Constant Maturity +2.23%) ± | | | 3.98 | | | | 1-1-2032 | | | | 56,712 | | | | 57,455 | |
FNMA (1 Year Treasury Constant Maturity +2.23%) ± | | | 3.98 | | | | 11-1-2037 | | | | 652,234 | | | | 686,027 | |
FNMA (1 Year Treasury Constant Maturity +2.31%) ± | | | 3.99 | | | | 2-1-2035 | | | | 682,346 | | | | 720,556 | |
FNMA (1 Year Treasury Constant Maturity +2.25%) ± | | | 3.99 | | | | 7-1-2030 | | | | 454,884 | | | | 473,932 | |
FNMA (1 Year Treasury Constant Maturity +2.50%) ± | | | 3.99 | | | | 9-1-2030 | | | | 511,876 | | | | 534,703 | |
FNMA (6 Month LIBOR +1.74%) ± | | | 3.99 | | | | 10-1-2024 | | | | 38,421 | | | | 38,560 | |
FNMA (1 Year Treasury Constant Maturity +2.12%) ± | | | 4.00 | | | | 3-1-2031 | | | | 33,268 | | | | 33,244 | |
FNMA (12 Month LIBOR +1.98%) ± | | | 4.00 | | | | 9-1-2035 | | | | 444,227 | | | | 470,779 | |
FNMA (1 Year Treasury Constant Maturity +2.29%) ± | | | 4.00 | | | | 10-1-2036 | | | | 654,253 | | | | 691,184 | |
FNMA (6 Month LIBOR +1.63%) ± | | | 4.00 | | | | 1-1-2022 | | | | 5,957 | | | | 5,948 | |
FNMA (1 Year Treasury Constant Maturity +2.50%) ± | | | 4.00 | | | | 6-1-2032 | | | | 88,399 | | | | 90,136 | |
FNMA (1 Year Treasury Constant Maturity +2.19%) ± | | | 4.00 | | | | 3-1-2035 | | | | 682,701 | | | | 713,053 | |
FNMA (1 Year Treasury Constant Maturity +2.20%) ± | | | 4.00 | | | | 9-1-2035 | | | | 483,003 | | | | 507,716 | |
FNMA (12 Month Treasury Average +2.81%) ± | | | 4.00 | | | | 4-1-2040 | | | | 1,838,796 | | | | 1,921,036 | |
FNMA (12 Month Treasury Average +2.36%) ± | | | 4.01 | | | | 8-1-2040 | | | | 478,103 | | | | 491,899 | |
FNMA (1 Year Treasury Constant Maturity +2.13%) ± | | | 4.01 | | | | 5-1-2033 | | | | 407,590 | | | | 426,895 | |
FNMA (12 Month LIBOR +1.75%) ± | | | 4.02 | | | | 5-1-2035 | | | | 882,054 | | | | 929,142 | |
FNMA (6 Month LIBOR +1.54%) ± | | | 4.02 | | | | 1-1-2035 | | | | 1,370,304 | | | | 1,416,789 | |
FNMA (1 Year Treasury Constant Maturity +2.34%) ± | | | 4.03 | | | | 3-1-2033 | | | | 1,040,255 | | | | 1,100,577 | |
The accompanying notes are an integral part of these financial statements.
| | | | |
| 20 | | Wells Fargo Adjustable Rate Government Fund | | Portfolio of investments—August 31, 2018 |
| | | | | | | | | | | | | | | | |
| Security name | | Interest rate | | | Maturity date | | | Principal | | | Value | |
|
Agency Securities (continued) | |
FNMA (1 Year Treasury Constant Maturity +2.22%) ± | | | 4.04 | % | | | 5-1-2033 | | | $ | 205,872 | | | $ | 217,114 | |
FNMA (1 Year Treasury Constant Maturity +2.46%) ± | | | 4.04 | | | | 8-1-2035 | | | | 471,624 | | | | 495,574 | |
FNMA (12 Month Treasury Average +2.39%) ± | | | 4.04 | | | | 5-1-2036 | | | | 338,884 | | | | 353,746 | |
FNMA (1 Year Treasury Constant Maturity +2.36%) ± | | | 4.04 | | | | 1-1-2029 | | | | 226,531 | | | | 233,429 | |
FNMA (1 Year Treasury Constant Maturity +2.22%) ± | | | 4.04 | | | | 6-1-2027 | | | | 82,491 | | | | 83,852 | |
FNMA (6 Month LIBOR +1.55%) ± | | | 4.05 | | | | 12-1-2022 | | | | 5,705 | | | | 5,717 | |
FNMA (1 Year Treasury Constant Maturity +2.28%) ± | | | 4.05 | | | | 4-1-2024 | | | | 37,442 | | | | 37,715 | |
FNMA (6 Month LIBOR +1.64%) ± | | | 4.05 | | | | 2-1-2033 | | | | 130,719 | | | | 134,265 | |
FNMA (1 Year Treasury Constant Maturity +1.88%) ± | | | 4.06 | | | | 8-1-2031 | | | | 58,511 | | | | 60,640 | |
FNMA (1 Year Treasury Constant Maturity +2.18%) ± | | | 4.06 | | | | 5-1-2035 | | | | 201,373 | | | | 213,107 | |
FNMA (1 Year Treasury Constant Maturity +2.58%) ± | | | 4.06 | | | | 3-1-2032 | | | | 115,651 | | | | 118,430 | |
FNMA (11th District Cost of Funds +1.87%) ± | | | 4.07 | | | | 5-1-2034 | | | | 173,303 | | | | 178,193 | |
FNMA (1 Year Treasury Constant Maturity +2.12%) ± | | | 4.07 | | | | 5-1-2034 | | | | 478,196 | | | | 500,473 | |
FNMA (3 Year Treasury Constant Maturity +2.20%) ± | | | 4.08 | | | | 5-1-2025 | | | | 50 | | | | 50 | |
FNMA (1 Year Treasury Constant Maturity +2.32%) ± | | | 4.08 | | | | 10-1-2034 | | | | 455,415 | | | | 480,573 | |
FNMA (1 Year Treasury Constant Maturity +2.21%) ± | | | 4.08 | | | | 5-1-2037 | | | | 924,272 | | | | 964,349 | |
FNMA (1 Year Treasury Constant Maturity +2.11%) ± | | | 4.08 | | | | 9-1-2036 | | | | 386,411 | | | | 403,654 | |
FNMA (1 Year Treasury Constant Maturity +2.22%) ± | | | 4.09 | | | | 4-1-2030 | | | | 14,132 | | | | 14,126 | |
FNMA (1 Year Treasury Constant Maturity +2.22%) ± | | | 4.09 | | | | 4-1-2033 | | | | 665,005 | | | | 690,768 | |
FNMA (12 Month Treasury Average +2.82%) ± | | | 4.10 | | | | 9-1-2032 | | | | 1,341,631 | | | | 1,400,693 | |
FNMA (12 Month LIBOR +1.57%) ± | | | 4.10 | | | | 6-1-2035 | | | | 1,621,048 | | | | 1,696,982 | |
FNMA (5 Year Treasury Constant Maturity +2.46%) ± | | | 4.11 | | | | 6-1-2019 | | | | 298 | | | | 298 | |
FNMA (1 Year Treasury Constant Maturity +2.32%) ± | | | 4.11 | | | | 4-1-2028 | | | | 128,379 | | | | 131,907 | |
FNMA (1 Year Treasury Constant Maturity +2.12%) ± | | | 4.12 | | | | 8-1-2026 | | | | 31,109 | | | | 31,353 | |
FNMA (1 Year Treasury Constant Maturity +2.37%) ± | | | 4.12 | | | | 4-1-2038 | | | | 553,818 | | | | 578,922 | |
FNMA (1 Year Treasury Constant Maturity +2.38%) ± | | | 4.12 | | | | 7-1-2027 | | | | 92,897 | | | | 94,883 | |
FNMA (1 Year Treasury Constant Maturity +2.25%) ± | | | 4.13 | | | | 6-1-2025 | | | | 6,003 | | | | 5,988 | |
FNMA (1 Year Treasury Constant Maturity +2.26%) ± | | | 4.13 | | | | 5-1-2035 | | | | 420,870 | | | | 441,496 | |
FNMA (1 Year Treasury Constant Maturity +2.24%) ± | | | 4.14 | | | | 7-1-2037 | | | | 436,979 | | | | 458,757 | |
FNMA (12 Month Treasury Average +2.47%) ± | | | 4.14 | | | | 4-1-2036 | | | | 3,230,670 | | | | 3,382,313 | |
FNMA (1 Year Treasury Constant Maturity +2.89%) ± | | | 4.14 | | | | 1-1-2031 | | | | 21,780 | | | | 21,984 | |
FNMA (1 Year Treasury Constant Maturity +2.31%) ± | | | 4.14 | | | | 1-1-2026 | | | | 220,727 | | | | 228,173 | |
FNMA (1 Year Treasury Constant Maturity +2.21%) ± | | | 4.14 | | | | 6-1-2033 | | | | 266,004 | | | | 274,428 | |
FNMA (12 Month LIBOR +1.85%) ± | | | 4.16 | | | | 12-1-2037 | | | | 1,698,300 | | | | 1,788,078 | |
FNMA (1 Year Treasury Constant Maturity +2.25%) ± | | | 4.17 | | | | 12-1-2040 | | | | 1,495,228 | | | | 1,574,457 | |
FNMA (1 Year Treasury Constant Maturity +2.40%) ± | | | 4.17 | | | | 9-1-2030 | | | | 273,406 | | | | 288,881 | |
FNMA (1 Year Treasury Constant Maturity +2.18%) ± | | | 4.17 | | | | 9-1-2036 | | | | 500,012 | | | | 527,541 | |
FNMA (1 Year Treasury Constant Maturity +2.18%) ± | | | 4.17 | | | | 6-1-2035 | | | | 407,435 | | | | 429,686 | |
FNMA (1 Year Treasury Constant Maturity +2.21%) ± | | | 4.18 | | | | 6-1-2035 | | | | 717,640 | | | | 755,078 | |
FNMA (1 Year Treasury Constant Maturity +2.41%) ± | | | 4.18 | | | | 5-1-2027 | | | | 58,588 | | | | 60,472 | |
FNMA (1 Year Treasury Constant Maturity +2.24%) ± | | | 4.18 | | | | 7-1-2028 | | | | 165 | | | | 171 | |
FNMA (1 Year Treasury Constant Maturity +2.34%) ± | | | 4.19 | | | | 4-1-2036 | | | | 657,102 | | | | 692,477 | |
FNMA (1 Year Treasury Constant Maturity +2.31%) ± | | | 4.19 | | | | 5-1-2035 | | | | 969,107 | | | | 1,028,157 | |
FNMA (1 Year Treasury Constant Maturity +2.18%) ± | | | 4.19 | | | | 1-1-2036 | | | | 853,893 | | | | 899,589 | |
FNMA (5 Year Treasury Constant Maturity +2.43%) ± | | | 4.20 | | | | 6-1-2028 | | | | 29,067 | | | | 29,235 | |
FNMA (1 Year Treasury Constant Maturity +2.22%) ± | | | 4.21 | | | | 6-1-2035 | | | | 593,471 | | | | 622,832 | |
FNMA (1 Year Treasury Constant Maturity +2.19%) ± | | | 4.21 | | | | 7-1-2035 | | | | 982,814 | | | | 1,035,606 | |
FNMA (1 Year Treasury Constant Maturity +2.09%) ± | | | 4.21 | | | | 8-1-2025 | | | | 19,914 | | | | 20,136 | |
FNMA (1 Year Treasury Constant Maturity +2.21%) ± | | | 4.22 | | | | 6-1-2033 | | | | 446,706 | | | | 465,051 | |
FNMA (12 Month LIBOR +1.73%) ± | | | 4.23 | | | | 12-1-2033 | | | | 938,539 | | | | 986,088 | |
The accompanying notes are an integral part of these financial statements.
| | | | | | |
| Portfolio of investments—August 31, 2018 | | Wells Fargo Adjustable Rate Government Fund | | | 21 | |
| | | | | | | | | | | | | | | | |
| Security name | | Interest rate | | | Maturity date | | | Principal | | | Value | |
|
Agency Securities (continued) | |
FNMA (1 Year Treasury Constant Maturity +2.23%) ± | | | 4.23 | % | | | 1-1-2035 | | | $ | 532,280 | | | $ | 560,990 | |
FNMA (1 Year Treasury Constant Maturity +2.21%) ± | | | 4.23 | | | | 8-1-2035 | | | | 1,264,680 | | | | 1,338,112 | |
FNMA (1 Year Treasury Constant Maturity +2.32%) ± | | | 4.24 | | | | 9-1-2037 | | | | 637,606 | | | | 675,068 | |
FNMA (6 Month LIBOR +1.74%) ± | | | 4.24 | | | | 12-1-2024 | | | | 55,399 | | | | 55,501 | |
FNMA (12 Month LIBOR +1.74%) ± | | | 4.24 | | | | 5-1-2032 | | | | 168,387 | | | | 170,780 | |
FNMA (1 Year Treasury Constant Maturity +2.10%) ± | | | 4.24 | | | | 7-1-2035 | | | | 323,418 | | | | 333,837 | |
FNMA (3 Year Treasury Constant Maturity +2.38%) ± | | | 4.25 | | | | 10-1-2021 | | | | 556 | | | | 554 | |
FNMA (US Treasury H15 Treasury Bill 6 Month Auction High Discount +2.23%) ± | | | 4.25 | | | | 7-1-2025 | | | | 2,161 | | | | 2,254 | |
FNMA (1 Year Treasury Constant Maturity +2.47%) ± | | | 4.25 | | | | 9-1-2035 | | | | 55,821 | | | | 59,385 | |
FNMA (12 Month LIBOR +1.75%) ± | | | 4.26 | | | | 7-1-2035 | | | | 561,381 | | | | 591,771 | |
FNMA (1 Year Treasury Constant Maturity +2.35%) ± | | | 4.27 | | | | 12-1-2030 | | | | 681,171 | | | | 709,634 | |
FNMA (11th District Cost of Funds +1.82%) ± | | | 4.27 | | | | 6-1-2034 | | | | 158,750 | | | | 163,980 | |
FNMA (11th District Cost of Funds +1.93%) ± | | | 4.28 | | | | 12-1-2036 | | | | 92,757 | | | | 96,932 | |
FNMA (1 Year Treasury Constant Maturity +2.50%) ± | | | 4.29 | | | | 10-1-2029 | | | | 338,219 | | | | 351,594 | |
FNMA (1 Year Treasury Constant Maturity +2.35%) ± | | | 4.29 | | | | 6-1-2027 | | | | 70,755 | | | | 71,441 | |
FNMA (1 Year Treasury Constant Maturity +2.27%) ± | | | 4.30 | | | | 6-1-2036 | | | | 164,400 | | | | 173,897 | |
FNMA (6 Month LIBOR +2.10%) ± | | | 4.32 | | | | 2-1-2033 | | | | 357,847 | | | | 375,323 | |
FNMA (1 Year Treasury Constant Maturity +2.11%) ± | | | 4.32 | | | | 7-1-2035 | | | | 548,174 | | | | 574,055 | |
FNMA (6 Month LIBOR +2.25%) ± | | | 4.32 | | | | 3-1-2034 | | | | 1,051,071 | | | | 1,111,599 | |
FNMA (1 Year Treasury Constant Maturity +2.64%) ± | | | 4.33 | | | | 7-1-2028 | | | | 100,559 | | | | 102,705 | |
FNMA ±± | | | 4.33 | | | | 11-1-2019 | | | | 75 | | | | 71 | |
FNMA (12 Month LIBOR +1.80%) ± | | | 4.33 | | | | 5-1-2033 | | | | 477,396 | | | | 502,031 | |
FNMA (12 Month LIBOR +1.87%) ± | | | 4.34 | | | | 5-1-2038 | | | | 760,259 | | | | 801,745 | |
FNMA (1 Year Treasury Constant Maturity +2.22%) ± | | | 4.35 | | | | 7-1-2035 | | | | 175,873 | | | | 184,975 | |
FNMA (1 Year Treasury Constant Maturity +2.30%) ± | | | 4.35 | | | | 9-1-2030 | | | | 105,938 | | | | 107,302 | |
FNMA (6 Month LIBOR +1.98%) ± | | | 4.37 | | | | 10-1-2024 | | | | 79,865 | | | | 82,067 | |
FNMA (1 Year Treasury Constant Maturity +2.43%) ± | | | 4.38 | | | | 7-1-2037 | | | | 1,733,211 | | | | 1,840,955 | |
FNMA (1 Year Treasury Constant Maturity +2.40%) ± | | | 4.39 | | | | 7-1-2037 | | | | 628,588 | | | | 655,479 | |
FNMA (1 Year Treasury Constant Maturity +2.21%) ± | | | 4.39 | | | | 7-1-2033 | | | | 63,505 | | | | 66,986 | |
FNMA (12 Month LIBOR +1.74%) ± | | | 4.39 | | | | 6-1-2036 | | | | 316,793 | | | | 333,026 | |
FNMA (12 Month LIBOR +1.72%) ± | | | 4.39 | | | | 6-1-2035 | | | | 172,904 | | | | 182,314 | |
FNMA (12 Month LIBOR +1.67%) ± | | | 4.39 | | | | 7-1-2035 | | | | 1,225,599 | | | | 1,285,943 | |
FNMA (12 Month LIBOR +1.83%) ± | | | 4.40 | | | | 6-1-2041 | | | | 679,870 | | | | 714,731 | |
FNMA (1 Year Treasury Constant Maturity +2.55%) ± | | | 4.42 | | | | 5-1-2035 | | | | 1,109,996 | | | | 1,184,424 | |
FNMA (1 Year Treasury Constant Maturity +2.29%) ± | | | 4.42 | | | | 6-1-2037 | | | | 546,873 | | | | 571,163 | |
FNMA (1 Year Treasury Constant Maturity +2.55%) ± | | | 4.42 | | | | 12-1-2021 | | | | 7,981 | | | | 7,979 | |
FNMA (6 Month LIBOR +1.93%) ± | | | 4.43 | | | | 6-1-2032 | | | | 69,106 | | | | 69,789 | |
FNMA (1 Year Treasury Constant Maturity +2.19%) ± | | | 4.44 | | | | 8-1-2033 | | | | 1,030,530 | | | | 1,080,749 | |
FNMA (1 Year Treasury Constant Maturity +2.22%) ± | | | 4.44 | | | | 7-1-2035 | | | | 756,964 | | | | 797,673 | |
FNMA (1 Year Treasury Constant Maturity +2.64%) ± | | | 4.45 | | | | 10-1-2028 | | | | 114,521 | | | | 117,177 | |
FNMA (1 Year Treasury Constant Maturity +2.21%) ± | | | 4.46 | | | | 7-1-2035 | | | | 554,264 | | | | 587,299 | |
FNMA (1 Year Treasury Constant Maturity +2.50%) ± | | | 4.47 | | | | 3-1-2027 | | | | 81,524 | | | | 83,952 | |
FNMA (1 Year Treasury Constant Maturity +2.35%) ± | | | 4.48 | | | | 6-1-2030 | | | | 51,640 | | | | 52,308 | |
FNMA (12 Month LIBOR +1.88%) ± | | | 4.51 | | | | 5-1-2037 | | | | 1,569,342 | | | | 1,656,550 | |
FNMA (1 Year Treasury Constant Maturity +2.64%) ± | | | 4.55 | | | | 3-1-2030 | | | | 8,391 | | | | 8,552 | |
FNMA (6 Month LIBOR +2.43%) ± | | | 4.58 | | | | 1-1-2033 | | | | 92,210 | | | | 94,099 | |
FNMA (3 Year Treasury Constant Maturity +2.15%) ± | | | 4.59 | | | | 8-1-2031 | | | | 34,734 | | | | 35,152 | |
FNMA (12 Month LIBOR +1.80%) ± | | | 4.64 | | | | 7-1-2033 | | | | 664,017 | | | | 699,987 | |
FNMA (6 Month LIBOR +3.11%) ± | | | 4.66 | | | | 9-1-2033 | | | | 38,583 | | | | 38,990 | |
FNMA (12 Month LIBOR +1.91%) ± | | | 4.66 | | | | 8-1-2034 | | | | 1,665,796 | | | | 1,763,786 | |
The accompanying notes are an integral part of these financial statements.
| | | | |
| 22 | | Wells Fargo Adjustable Rate Government Fund | | Portfolio of investments—August 31, 2018 |
| | | | | | | | | | | | | | | | |
| Security name | | Interest rate | | | Maturity date | | | Principal | | | Value | |
|
Agency Securities (continued) | |
FNMA (6 Month LIBOR +2.65%) ± | | | 4.68 | % | | | 4-1-2024 | | | $ | 178,440 | | | $ | 187,442 | |
FNMA (1 Year Treasury Constant Maturity +2.47%) ± | | | 4.72 | | | | 9-1-2028 | | | | 39,247 | | | | 39,915 | |
FNMA (11th District Cost of Funds +1.25%) ± | | | 4.73 | | | | 2-1-2019 | | | | 20,268 | | | | 20,338 | |
FNMA (1 Year Treasury Constant Maturity +2.87%) ± | | | 4.75 | | | | 8-1-2030 | | | | 80,049 | | | | 80,767 | |
FNMA (6 Month LIBOR +2.70%) ± | | | 4.80 | | | | 1-1-2033 | | | | 61,726 | | | | 62,690 | |
FNMA (6 Month LIBOR +2.64%) ± | | | 4.86 | | | | 4-1-2033 | | | | 260,033 | | | | 273,028 | |
FNMA (6 Month LIBOR +2.48%) ± | | | 4.98 | | | | 7-1-2033 | | | | 34,790 | | | | 35,008 | |
FNMA (6 Month LIBOR +2.72%) ± | | | 5.07 | | | | 5-1-2033 | | | | 982,073 | | | | 1,055,464 | |
FNMA | | | 5.50 | | | | 9-1-2019 | | | | 69 | | | | 69 | |
FNMA (11th District Cost of Funds +1.25%) ± | | | 5.68 | | | | 1-1-2019 | | | | 3,832 | | | | 3,832 | |
FNMA (6 Month LIBOR +3.47%) ± | | | 5.69 | | | | 12-1-2032 | | | | 148,858 | | | | 153,390 | |
FNMA (6 Month LIBOR +3.68%) ± | | | 5.70 | | | | 11-1-2031 | | | | 87,126 | | | | 86,614 | |
FNMA (6 Month LIBOR +3.43%) ± | | | 5.93 | | | | 4-1-2033 | | | | 179,049 | | | | 184,177 | |
FNMA (1 Year Treasury Constant Maturity +1.75%) ± | | | 6.00 | | | | 1-1-2020 | | | | 1,999 | | | | 1,973 | |
FNMA (6 Month LIBOR +3.57%) ± | | | 6.07 | | | | 11-1-2031 | | | | 13,038 | | | | 13,008 | |
FNMA (11th District Cost of Funds +1.90%) ± | | | 6.45 | | | | 2-1-2034 | | | | 12,391 | | | | 12,279 | |
FNMA | | | 6.50 | | | | 8-1-2028 | | | | 50,944 | | | | 52,265 | |
FNMA | | | 6.50 | | | | 5-1-2031 | | | | 136,240 | | | | 149,288 | |
FNMA | | | 7.06 | | | | 11-1-2024 | | | | 8,202 | | | | 8,212 | |
FNMA | | | 7.06 | | | | 12-1-2024 | | | | 23,851 | | | | 23,920 | |
FNMA | | | 7.06 | | | | 3-1-2025 | | | | 43,218 | | | | 43,883 | |
FNMA | | | 7.06 | | | | 3-1-2025 | | | | 3,227 | | | | 3,230 | |
FNMA | | | 7.06 | | | | 1-1-2027 | | | | 24,586 | | | | 24,595 | |
FNMA | | | 7.50 | | | | 1-1-2031 | | | | 59,200 | | | | 62,940 | |
FNMA | | | 7.50 | | | | 1-1-2033 | | | | 216,121 | | | | 234,013 | |
FNMA | | | 7.50 | | | | 5-1-2033 | | | | 170,220 | | | | 183,892 | |
FNMA | | | 7.50 | | | | 5-1-2033 | | | | 152,061 | | | | 162,176 | |
FNMA | | | 7.50 | | | | 6-1-2033 | | | | 27,031 | | | | 27,172 | |
FNMA | | | 7.50 | | | | 7-1-2033 | | | | 42,952 | | | | 43,959 | |
FNMA | | | 7.50 | | | | 8-1-2033 | | | | 54,332 | | | | 56,390 | |
FNMA | | | 8.00 | | | | 12-1-2026 | | | | 74,329 | | | | 80,240 | |
FNMA | | | 8.00 | | | | 2-1-2030 | | | | 177 | | | | 178 | |
FNMA | | | 8.00 | | | | 3-1-2030 | | | | 239 | | | | 255 | |
FNMA | | | 8.00 | | | | 7-1-2031 | | | | 24,834 | | | | 24,980 | |
FNMA | | | 8.00 | | | | 5-1-2033 | | | | 88,131 | | | | 93,449 | |
FNMA | | | 8.50 | | | | 10-1-2026 | | | | 2,625 | | | | 2,651 | |
FNMA | | | 8.50 | | | | 8-15-2024 | | | | 36,486 | | | | 37,043 | |
FNMA | | | 10.00 | | | | 1-20-2021 | | | | 2,037 | | | | 2,058 | |
FNMA Series 1989-74 Class J | | | 9.80 | | | | 10-25-2019 | | | | 2,266 | | | | 2,323 | |
FNMA Series 1989-96 Class H | | | 9.00 | | | | 12-25-2019 | | | | 1,191 | | | | 1,218 | |
FNMA Series 1992-39 Class FA (7-Year Treasury Constant Maturity +0.00%) ± | | | 2.82 | | | | 3-25-2022 | | | | 81,426 | | | | 81,361 | |
FNMA Series 1992-45 Class F (7-Year Treasury Constant Maturity +0.00%) ± | | | 2.82 | | | | 4-25-2022 | | | | 12,952 | | | | 12,837 | |
FNMA Series 1992-87 Class Z | | | 8.00 | | | | 5-25-2022 | | | | 7,363 | | | | 7,802 | |
FNMA Series 1993-113 Class FA (10 Year Treasury Constant Maturity -0.65%) ± | | | 2.22 | | | | 7-25-2023 | | | | 53,192 | | | | 53,090 | |
FNMA Series 1993-247 Class FM (11th District Cost of Funds +1.20%) ± | | | 2.13 | | | | 12-25-2023 | | | | 249,760 | | | | 254,476 | |
FNMA Series 1994-14 Class F (11th District Cost of Funds +1.60%) ± | | | 2.53 | | | | 10-25-2023 | | | | 141,008 | | | | 144,914 | |
FNMA Series 2001-50 Class BA | | | 7.00 | | | | 10-25-2041 | | | | 143,535 | | | | 158,374 | |
FNMA Series 2001-63 Class FD (1 Month LIBOR +0.60%) ± | | | 2.68 | | | | 12-18-2031 | | | | 139,084 | | | | 140,516 | |
FNMA Series 2001-81 Class F (1 Month LIBOR +0.55%) ± | | | 2.61 | | | | 1-25-2032 | | | | 58,265 | | | | 59,200 | |
FNMA Series 2001-T08 Class A1 | | | 7.50 | | | | 7-25-2041 | | | | 127,168 | | | | 143,194 | |
The accompanying notes are an integral part of these financial statements.
| | | | | | |
| Portfolio of investments—August 31, 2018 | | Wells Fargo Adjustable Rate Government Fund | | | 23 | |
| | | | | | | | | | | | | | | | |
| Security name | | Interest rate | | | Maturity date | | | Principal | | | Value | |
|
Agency Securities (continued) | |
FNMA Series 2001-T10 Class A2 | | | 7.50 | % | | | 12-25-2041 | | | $ | 2,296,155 | | | $ | 2,603,383 | |
FNMA Series 2001-T12 Class A2 | | | 7.50 | | | | 8-25-2041 | | | | 180,682 | | | | 205,112 | |
FNMA Series 2001-T12 Class A4 ±± | | | 4.23 | | | | 8-25-2041 | | | | 4,112,726 | | | | 4,266,289 | |
FNMA Series 2001-W01 Class AV1 (1 Month LIBOR +0.24%) ± | | | 2.30 | | | | 8-25-2031 | | | | 59,443 | | | | 57,954 | |
FNMA Series 2001-W03 Class A ±± | | | 6.13 | | | | 9-25-2041 | | | | 506,597 | | | | 531,769 | |
FNMA Series 2002-05 Class FD (1 Month LIBOR +0.90%) ± | | | 2.96 | | | | 2-25-2032 | | | | 115,446 | | | | 118,084 | |
FNMA Series 2002-33 Class A4 ±± | | | 5.27 | | | | 11-25-2030 | | | | 132,813 | | | | 137,962 | |
FNMA Series 2002-59 Class F (1 Month LIBOR +0.40%) ± | | | 2.46 | | | | 9-25-2032 | | | | 395,693 | | | | 395,952 | |
FNMA Series 2002-66 Class A3 ±± | | | 4.09 | | | | 4-25-2042 | | | | 7,556,352 | | | | 7,863,329 | |
FNMA Series 2002-T12 Class A3 | | | 7.50 | | | | 5-25-2042 | | | | 1,279,309 | | | | 1,475,616 | |
FNMA Series 2002-T12 Class A5 ±± | | | 4.52 | | | | 10-25-2041 | | | | 1,610,488 | | | | 1,647,233 | |
FNMA Series 2002-T18 Class A5 ±± | | | 4.38 | | | | 5-25-2042 | | | | 3,219,382 | | | | 3,290,484 | |
FNMA Series 2002-T19 Class A4 ±± | | | 4.34 | | | | 3-25-2042 | | | | 184,539 | | | | 192,321 | |
FNMA Series 2002-W01 Class 3A ±± | | | 3.87 | | | | 4-25-2042 | | | | 1,044,074 | | | | 1,045,604 | |
FNMA Series 2002-W04 Class A6 ±± | | | 4.27 | | | | 5-25-2042 | | | | 1,762,099 | | | | 1,800,661 | |
FNMA Series 2003-07 Class A2 ±± | | | 3.65 | | | | 5-25-2042 | | | | 727,089 | | | | 736,217 | |
FNMA Series 2003-63 Class A8 ±± | | | 3.94 | | | | 1-25-2043 | | | | 1,276,887 | | | | 1,319,418 | |
FNMA Series 2003-W02 Class 1A3 | | | 7.50 | | | | 7-25-2042 | | | | 375,312 | | | | 432,187 | |
FNMA Series 2003-W04 Class 5A ±± | | | 4.07 | | | | 10-25-2042 | | | | 994,551 | | | | 998,737 | |
FNMA Series 2003-W08 Class 4A ±± | | | 4.12 | | | | 11-25-2042 | | | | 1,291,679 | | | | 1,324,010 | |
FNMA Series 2003-W09 Class A (1 Month LIBOR +0.12%) ± | | | 2.18 | | | | 6-25-2033 | | | | 1,763,904 | | | | 1,731,672 | |
FNMA Series 2003-W10 Class 2A ±± | | | 3.89 | | | | 6-25-2043 | | | | 2,489,001 | | | | 2,479,298 | |
FNMA Series 2003-W18 Class 2A ±± | | | 4.04 | | | | 6-25-2043 | | | | 3,673,331 | | | | 3,815,128 | |
FNMA Series 2004-38 Class FT (1 Month LIBOR +0.43%) ± | | | 2.49 | | | | 10-25-2033 | | | | 20,750 | | | | 20,763 | |
FNMA Series 2004-T03 Class 1A3 | | | 7.00 | | | | 2-25-2044 | | | | 485,477 | | | | 546,263 | |
FNMA Series 2004-T03 Class 2A ±± | | | 4.20 | | | | 8-25-2043 | | | | 1,418,744 | | | | 1,468,495 | |
FNMA Series 2004-W01 Class 2A2 | | | 7.00 | | | | 12-25-2033 | | | | 257,441 | | | | 289,800 | |
FNMA Series 2004-W01 Class 3A ±± | | | 4.19 | | | | 1-25-2043 | | | | 71,777 | | | | 72,465 | |
FNMA Series 2004-W02 Class 5A | | | 7.50 | | | | 3-25-2044 | | | | 114,912 | | | | 126,553 | |
FNMA Series 2004-W12 Class 2A ±± | | | 4.02 | | | | 6-25-2044 | | | | 4,474,596 | | | | 4,597,082 | |
FNMA Series 2004-W15 Class 3A ±± | | | 3.96 | | | | 6-25-2044 | | | | 5,771,975 | | | | 5,850,225 | |
FNMA Series 2005-W03 Class 3A ±± | | | 3.81 | | | | 4-25-2045 | | | | 1,165,817 | | | | 1,170,924 | |
FNMA Series 2006-15 Class FW (1 Month LIBOR +0.30%) ± | | | 2.36 | | | | 1-25-2036 | | | | 113,604 | | | | 113,960 | |
FNMA Series 2006-44 Class FY (1 Month LIBOR +0.57%) ± | | | 2.63 | | | | 6-25-2036 | | | | 968,674 | | | | 981,045 | |
FNMA Series 2006-W01 Class 3A ±± | | | 3.59 | | | | 10-25-2045 | | | | 4,587,186 | | | | 4,776,088 | |
FNMA Series 2007-88 Class JF (1 Month LIBOR +0.55%) ± | | | 2.61 | | | | 4-25-2037 | | | | 1,311,535 | | | | 1,321,813 | |
FNMA Series 2007-95 Class A2 (1 Month LIBOR +0.25%) ± | | | 2.31 | | | | 8-27-2036 | | | | 379,647 | | | | 378,218 | |
FNMA Series 2012-47 Class FW (1 Month LIBOR +1.70%) ± | | | 3.76 | | | | 5-25-2027 | | | | 434,872 | | | | 452,825 | |
FNMA Series 2016-82 Class FM (1 Month LIBOR +0.40%) ± | | | 2.49 | | | | 11-25-2046 | | | | 1,739,917 | | | | 1,737,095 | |
FNMA Series G92-20 Class FB (7-Year Treasury Constant Maturity +0.00%) ± | | | 2.82 | | | | 4-25-2022 | | | | 8,670 | | | | 8,644 | |
FNMA Series G93-1 Class K | | | 6.68 | | | | 1-25-2023 | | | | 227,260 | | | | 237,283 | |
FNMA Series G93-19 Class FD (10 Year Treasury Constant Maturity -0.65%) ± | | | 2.22 | | | | 4-25-2023 | | | | 131,507 | | | | 131,472 | |
GNMA | | | 6.45 | | | | 4-20-2025 | | | | 34,979 | | | | 38,628 | |
GNMA | | | 6.45 | | | | 9-20-2025 | | | | 35,221 | | | | 40,266 | |
GNMA | | | 6.50 | | | | 6-20-2034 | | | | 73,694 | | | | 74,539 | |
GNMA | | | 6.50 | | | | 8-20-2034 | | | | 494,439 | | | | 529,990 | |
GNMA | | | 6.50 | | | | 8-20-2034 | | | | 102,011 | | | | 104,530 | |
GNMA | | | 6.75 | | | | 2-15-2029 | | | | 42,411 | | | | 46,592 | |
GNMA | | | 7.00 | | | | 7-20-2034 | | | | 52,820 | | | | 53,514 | |
GNMA | | | 9.00 | | | | 3-15-2020 | | | | 601 | | | | 602 | |
The accompanying notes are an integral part of these financial statements.
| | | | |
| 24 | | Wells Fargo Adjustable Rate Government Fund | | Portfolio of investments—August 31, 2018 |
| | | | | | | | | | | | | | | | |
| Security name | | Interest rate | | | Maturity date | | | Principal | | | Value | |
|
Agency Securities (continued) | |
GNMA | | | 9.00 | % | | | 8-15-2021 | | | $ | 70 | | | $ | 70 | |
GNMA | | | 9.00 | | | | 8-20-2024 | | | | 26 | | | | 26 | |
GNMA | | | 9.00 | | | | 9-20-2024 | | | | 929 | | | | 948 | |
GNMA | | | 9.00 | | | | 11-20-2024 | | | | 126 | | | | 126 | |
GNMA | | | 9.00 | | | | 1-20-2025 | | | | 5,113 | | | | 5,553 | |
GNMA | | | 9.00 | | | | 2-20-2025 | | | | 15,695 | | | | 17,191 | |
GNMA Series 2008-65 Class FG (1 Month LIBOR +0.75%) ± | | | 2.83 | | | | 8-20-2038 | | | | 1,550,772 | | | | 1,578,142 | |
GNMA Series 2008-68 Class FA (1 Month LIBOR +0.95%) ± | | | 3.03 | | | | 8-20-2038 | | | | 1,904,393 | | | | 1,954,829 | |
GNMA Series 2009-50 Class FW (1 Month LIBOR +1.00%) ± | | | 3.08 | | | | 7-20-2039 | | | | 1,941,635 | | | | 1,994,552 | |
GNMA Series 2009-52 Class FD (1 Month LIBOR +0.95%) ± | | | 3.01 | | | | 7-16-2039 | | | | 965,261 | | | | 989,679 | |
GNMA Series 2010-25 Class FH (1 Month LIBOR +0.72%) ± | | | 2.78 | | | | 2-16-2040 | | | | 820,821 | | | | 837,954 | |
GNMA Series 2011-H12 Class FA (1 Month LIBOR +0.49%) ± | | | 2.59 | | | | 2-20-2061 | | | | 2,608,466 | | | | 2,613,461 | |
GNMA Series 2011-H17 Class FA (1 Month LIBOR +0.53%) ± | | | 2.63 | | | | 6-20-2061 | | | | 1,067,906 | | | | 1,071,336 | |
GNMA Series 2017-H11 Class FE (12 Month LIBOR +0.18%) ± | | | 2.84 | | | | 5-20-2067 | | | | 4,956,631 | | | | 4,968,507 | |
| |
Total Agency Securities (Cost $371,915,311) | | | | 376,251,593 | |
| | | | | |
| | | | |
| | | Yield | | | | | | Shares | | | | |
| Short-Term Investments: 3.60% | | | | | | | | | | | | | | | | |
| | | | |
| Investment Companies: 3.60% | | | | | | | | | | | | | | | | |
Wells Fargo Government Money Market Fund Select Class (l)(u) | | | 1.87 | | | | | | | | 14,194,527 | | | | 14,194,527 | |
| | | | | | | | | | | | | | | | |
| | | | |
Total Short-Term Investments (Cost $14,194,527) | | | | | | | | | | | | | | | 14,194,527 | |
| | | | | | | | | | | | | | | | |
| | | | | | | | |
| Total investments in securities (Cost $386,109,838) | | | 99.13 | % | | | 390,446,120 | |
Other assets and liabilities, net | | | 0.87 | | | | 3,428,060 | |
| | | | | | | | |
| Total net assets | | | 100.00 | % | | $ | 393,874,180 | |
| | | | | | | | |
| 144A | The security may be resold in transactions exempt from registration, normally to qualified institutional buyers, pursuant to Rule 144A under the Securities Act of 1933. |
| ± | Variable rate investment. The rate shown is the rate in effect at period end. |
| ±± | The coupon of the security is adjusted based on the principal and interest payments received from the underlying pool of mortgages as well as the credit quality and the actual prepayment speed of the underlying mortgages. |
| (c) | Investment in an interest-only security entitles holders to receive only the interest payments on the underlying mortgages. The principal amount shown is the notional amount of the underlying mortgages. The rate represents the coupon rate. |
| (l) | The issuer of the security is an affiliated person of the Fund as defined in the Investment Company Act of 1940. |
| (u) | The rate represents the 7-day annualized yield at period end. |
Abbreviations:
| FDIC | Federal Deposit Insurance Corporation |
| FHLMC | Federal Home Loan Mortgage Corporation |
| FNMA | Federal National Mortgage Association |
| GNMA | Government National Mortgage Association |
| LIBOR | London Interbank Offered Rate |
The accompanying notes are an integral part of these financial statements.
| | | | | | |
| Portfolio of investments—August 31, 2018 | | Wells Fargo Adjustable Rate Government Fund | | | 25 | |
Investments in Affiliates
An affiliated investment is an investment in which the Fund owns at least 5% of the outstanding voting shares of the issuer or as a result of other relationships, such as the Fund and the issuer having the same investment manager. Transactions with issuers that were either affiliated persons of the Fund at the beginning of the period or the end of the period were as follows:
| | | | | | | | | | | | | | | | | | | | | | | | | | | | | | | | | | | | |
| | | Shares,
beginning of
period | | | Shares
purchased | | | Shares
sold | | | Shares,
end of
period | | | Net
realized
gains
(losses) | | | Net
change in
unrealized
gains
(losses) | | | Income
from
affiliated
securities | | | Value,
end
of period | | | % of
net
assets | |
Short-Term Investments | | | | | | | | | | | | | | | | | | | | | | | | | | | | | | | | | | | | |
Investment Companies | | | | | | | | | | | | | | | | | | | | | | | | | | | | | | | | | | | | |
Wells Fargo Government Money Market Fund Select Class | | | 8,353,190 | | | | 182,751,007 | | | | 176,909,670 | | | | 14,194,527 | | | $ | 0 | | | $ | 0 | | | $ | 153,959 | | | $ | 14,194,527 | | | | 3.60 | % |
The accompanying notes are an integral part of these financial statements.
| | | | |
| 26 | | Wells Fargo Adjustable Rate Government Fund | | Statement of assets and liabilities—August 31, 2018 |
| | | | |
| | | | |
| |
Assets | | | | |
Investments in unaffiliated securities, at value (cost $371,915,311) | | $ | 376,251,593 | |
Investments in affiliated securities, at value (cost $14,194,527) | | | 14,194,527 | |
Cash | | | 19,263 | |
Receivable for investments sold | | | 17 | |
Principal paydown receivable | | | 2,103,634 | |
Receivable for Fund shares sold | | | 303,814 | |
Receivable for interest | | | 1,528,252 | |
Prepaid expenses and other assets | | | 125,395 | |
| | | | |
Total assets | | | 394,526,495 | |
| | | | |
| |
Liabilities | | | | |
Payable for Fund shares redeemed | | | 236,375 | |
Dividends payable | | | 131,306 | |
Custodian and accounting fees payable | | | 80,964 | |
Management fee payable | | | 69,801 | |
Administration fees payable | | | 41,090 | |
Shareholder servicing fees payable | | | 37,416 | |
Distribution fee payable | | | 32,353 | |
Trustees’ fees and expenses payable | | | 2,252 | |
Accrued expenses and other liabilities | | | 20,758 | |
| | | | |
Total liabilities | | | 652,315 | |
| | | | |
Total net assets | | $ | 393,874,180 | |
| | | | |
| |
NET ASSETS CONSIST OF | | | | |
Paid-in capital | | $ | 390,174,059 | |
Overdistributed net investment income | | | (192,257 | ) |
Accumulated net realized losses on investments | | | (443,904 | ) |
Net unrealized gains on investments | | | 4,336,282 | |
| | | | |
Total net assets | | $ | 393,874,180 | |
| | | | |
| |
COMPUTATION OF NET ASSET VALUE AND OFFERING PRICE PER SHARE | | | | |
Net assets – Class A | | $ | 103,963,224 | |
Shares outstanding – Class A1 | | | 11,643,594 | |
Net asset value per share – Class A | | | $8.93 | |
Maximum offering price per share – Class A2 | | | $9.11 | |
Net assets – Class C | | $ | 45,692,505 | |
Shares outstanding – Class C1 | | | 5,117,938 | |
Net asset value per share – Class C | | | $8.93 | |
Net assets – Administrator Class | | $ | 9,140,127 | |
Shares outstanding – Administrator Class1 | | | 1,023,541 | |
Net asset value per share – Administrator Class | | | $8.93 | |
Net assets – Institutional Class | | $ | 235,078,324 | |
Shares outstanding – Institutional Class1 | | | 26,327,085 | |
Net asset value per share – Institutional Class | | | $8.93 | |
| 1 | The Fund has an unlimited number of authorized shares. |
| 2 | Maximum offering price is computed as 100/98 of net asset value. On investments of $50,000 or more, the offering price is reduced. |
The accompanying notes are an integral part of these financial statements.
| | | | | | |
| Statement of operations—year ended August 31, 2018 | | Wells Fargo Adjustable Rate Government Fund | | | 27 | |
| | | | |
| | | | |
| |
Investment income | | | | |
Interest | | $ | 9,359,506 | |
Income from affiliated securities | | | 153,959 | |
| | | | |
Total investment income | | | 9,513,465 | |
| | | | |
| |
Expenses | | | | |
Management fee | | | 1,650,751 | |
Administration fees | | | | |
Class A | | | 208,838 | |
Class C | | | 85,683 | |
Administrator Class | | | 13,845 | |
Institutional Class | | | 218,978 | |
Shareholder servicing fees | | | | |
Class A | | | 326,310 | |
Class C | | | 133,879 | |
Administrator Class | | | 34,404 | |
Distribution fee | | | | |
Class C | | | 401,637 | |
Custody and accounting fees | | | 78,329 | |
Professional fees | | | 71,309 | |
Registration fees | | | 99,095 | |
Shareholder report expenses | | | 41,265 | |
Trustees’ fees and expenses | | | 22,727 | |
Other fees and expenses | | | 39,156 | |
| | | | |
Total expenses | | | 3,426,206 | |
Less: Fee waivers and/or expense reimbursements | | | (320,215 | ) |
| | | | |
Net expenses | | | 3,105,991 | |
| | | | |
Net investment income | | | 6,407,474 | |
| | | | |
| |
REALIZED AND UNREALIZED GAINS (LOSSES) ON INVESTMENTS | | | | |
Net realized gains on investments | | | 736,194 | |
Net change in unrealized gains (losses) on investments | | | (2,234,630 | ) |
| | | | |
Net realized and unrealized gains (losses) on investments | | | (1,498,436 | ) |
| | | | |
Net increase in net assets resulting from operations | | $ | 4,909,038 | |
| | | | |
The accompanying notes are an integral part of these financial statements.
| | | | |
| 28 | | Wells Fargo Adjustable Rate Government Fund | | Statement of changes in net assets |
| | | | | | | | | | | | | | | | |
| | | Year ended
August 31, 2018 | | | Year ended
August 31, 2017 | |
| | | |
Operations | | | | | | | | | | | | |
Net investment income | | | | | | $ | 6,407,474 | | | | | | | $ | 6,832,710 | |
Net realized gains on investments | | | | | | | 736,194 | | | | | | | | 1,558,231 | |
Net change in unrealized gains (losses) on investments | | | | | | | (2,234,630 | ) | | | | | | | (5,258,425 | ) |
| | | | |
Net increase in net assets resulting from operations | | | | | | | 4,909,038 | | | | | | | | 3,132,516 | |
| | | | |
| | | |
Distributions to shareholders from | | | | | | | | | | | | |
Net investment income | | | | | | | | | | | | | | | | |
Class A | | | | | | | (1,690,233 | ) | | | | | | | (1,238,794 | ) |
Class B | | | | | | | N/A | | | | | | | | (5 | )1 |
Class C | | | | | | | (291,921 | ) | | | | | | | (27,529 | ) |
Administrator Class | | | | | | | (197,212 | ) | | | | | | | (324,646 | ) |
Institutional Class | | | | | | | (4,228,118 | ) | | | | | | | (5,899,360 | ) |
| | | | |
Total distributions to shareholders | | | | | | | (6,407,484 | ) | | | | | | | (7,490,334 | ) |
| | | | |
| | | | |
Capital share transactions | | | Shares | | | | | | | | Shares | | | | | |
Proceeds from shares sold | | | | | | | | | | | | | | | | |
Class A | | | 959,219 | | | | 8,580,205 | | | | 3,084,824 | | | | 27,722,527 | |
Class C | | | 96,466 | | | | 864,644 | | | | 174,032 | | | | 1,564,611 | |
Administrator Class | | | 106,068 | | | | 950,975 | | | | 1,084,425 | | | | 9,765,946 | |
Institutional Class | | | 5,355,474 | | | | 47,989,301 | | | | 17,873,034 | | | | 160,859,388 | |
| | | | |
| | | | | | | 58,385,125 | | | | | | | | 199,912,472 | |
| | | | |
Reinvestment of distributions | | | | | | | | | | | | | | | | |
Class A | | | 138,550 | | | | 1,239,446 | | | | 111,286 | | | | 1,000,787 | |
Class B | | | N/A | | | | N/A | | | | 1 | 1 | | | 5 | 1 |
Class C | | | 31,593 | | | | 282,408 | | | | 2,348 | | | | 21,130 | |
Administrator Class | | | 21,739 | | | | 194,536 | | | | 33,857 | | | | 304,570 | |
Institutional Class | | | 358,053 | | | | 3,204,150 | | | | 499,163 | | | | 4,490,201 | |
| | | | |
| | | | | | | 4,920,540 | | | | | | | | 5,816,693 | |
| | | | |
Payment for shares redeemed | | | | | | | | | | | | | | | | |
Class A | | | (6,633,879 | ) | | | (59,360,844 | ) | | | (5,118,157 | ) | | | (46,046,224 | ) |
Class B | | | N/A | | | | N/A | | | | (7,783 | )1 | | | (70,136 | )1 |
Class C | | | (1,791,217 | ) | | | (16,036,464 | ) | | | (4,209,467 | ) | | | (37,840,666 | ) |
Administrator Class | | | (1,202,643 | ) | | | (10,766,120 | ) | | | (5,862,305 | ) | | | (52,736,098 | ) |
Institutional Class | | | (23,742,189 | ) | | | (212,822,264 | ) | | | (51,978,754 | ) | | | (467,553,596 | ) |
| | | | |
| | | | | | | (298,985,692 | ) | | | | | | | (604,246,720 | ) |
| | | | |
Net decrease in net assets resulting from capital share transactions | | | | | | | (235,680,027 | ) | | | | | | | (398,517,555 | ) |
| | | | |
Total decrease in net assets | | | | | | | (237,178,473 | ) | | | | | | | (402,875,373 | ) |
| | | | |
| | |
Net assets | | | | | | | | |
Beginning of period | | | | | | | 631,052,653 | | | | | | | | 1,033,928,026 | |
| | | | |
End of period | | | | | | $ | 393,874,180 | | | | | | | $ | 631,052,653 | |
| | | | |
Overdistributed net investment income | | | | | | $ | (192,257 | ) | | | | | | $ | (192,247 | ) |
| | | | |
| 1 | For the period from September 1, 2016 to December 5, 2016. Effective at the close of business on December 5, 2016, Class B shares were converted to Class A shares and are no longer offered by the Fund. |
The accompanying notes are an integral part of these financial statements.
| | | | | | |
| Financial highlights | | Wells Fargo Adjustable Rate Government Fund | | | 29 | |
(For a share outstanding throughout each period)
| | | | | | | | | | | | | | | | | | | | |
| | | Year ended August 31 | |
| CLASS A | | 2018 | | | 2017 | | | 2016 | | | 2015 | | | 2014 | |
Net asset value, beginning of period | | | $8.96 | | | | $9.01 | | | | $9.10 | | | | $9.15 | | | | $9.14 | |
Net investment income | | | 0.10 | | | | 0.06 | | | | 0.04 | | | | 0.05 | | | | 0.06 | |
Net realized and unrealized gains (losses) on investments | | | (0.01 | ) | | | (0.04 | ) | | | (0.06 | ) | | | (0.03 | ) | | | 0.02 | |
| | | | | | | | | | | | | | | | | | | | |
Total from investment operations | | | 0.09 | | | | 0.02 | | | | (0.02 | ) | | | 0.02 | | | | 0.08 | |
Distributions to shareholders from | | | | | | | | | | | | | | | | | | | | |
Net investment income | | | (0.12 | ) | | | (0.07 | ) | | | (0.05 | ) | | | (0.05 | ) | | | (0.06 | ) |
Tax basis return of capital | | | 0.00 | | | | 0.00 | | | | (0.02 | ) | | | (0.02 | ) | | | (0.01 | ) |
| | | | | | | | | | | | | | | | | | | | |
Total distributions to shareholders | | | (0.12 | ) | | | (0.07 | ) | | | (0.07 | ) | | | (0.07 | ) | | | (0.07 | ) |
Net asset value, end of period | | | $8.93 | | | | $8.96 | | | | $9.01 | | | | $9.10 | | | | $9.15 | |
Total return1 | | | 0.98 | % | | | 0.23 | % | | | (0.19 | )% | | | 0.24 | % | | | 0.90 | % |
Ratios to average net assets (annualized) | | | | | | | | | | | | | | | | | | | | |
Gross expenses | | | 0.83 | % | | | 0.80 | % | | | 0.78 | % | | | 0.79 | % | | | 0.80 | % |
Net expenses | | | 0.74 | % | | | 0.74 | % | | | 0.74 | % | | | 0.74 | % | | | 0.74 | % |
Net investment income | | | 1.28 | % | | | 0.72 | % | | | 0.56 | % | | | 0.58 | % | | | 0.64 | % |
Supplemental data | | | | | | | | | | | | | | | | | | | | |
Portfolio turnover rate | | | 3 | % | | | 2 | % | | | 13 | % | | | 10 | % | | | 18 | % |
Net assets, end of period (000s omitted) | | | $103,963 | | | | $153,953 | | | | $172,131 | | | | $215,830 | | | | $251,686 | |
| 1 | Total return calculations do not include any sales charges. |
The accompanying notes are an integral part of these financial statements.
| | | | |
| 30 | | Wells Fargo Adjustable Rate Government Fund | | Financial highlights |
(For a share outstanding throughout each period)
| | | | | | | | | | | | | | | | | | | | |
| | | Year ended August 31 | |
| CLASS C | | 2018 | | | 2017 | | | 2016 | | | 2015 | | | 2014 | |
Net asset value, beginning of period | | | $8.96 | | | | $9.01 | | | | $9.10 | | | | $9.15 | | | | $9.14 | |
Net investment income (loss) | | | 0.05 | 1 | | | (0.00 | )1,2 | | | (0.02 | )1 | | | (0.01 | )1 | | | (0.01 | )1 |
Net realized and unrealized gains (losses) on investments | | | (0.03 | ) | | | (0.05 | ) | | | (0.07 | ) | | | (0.04 | ) | | | 0.02 | |
| | | | | | | | | | | | | | | | | | | | |
Total from investment operations | | | 0.02 | | | | (0.05 | ) | | | (0.09 | ) | | | (0.05 | ) | | | 0.01 | |
Distributions to shareholders from | | | | | | | | | | | | | | | | | | | | |
Net investment income | | | (0.05 | ) | | | (0.00 | )3 | | | (0.00 | )3 | | | (0.00 | )3 | | | (0.00 | )3 |
Tax basis return of capital | | | 0.00 | | | | 0.00 | | | | (0.00 | )3 | | | (0.00 | )3 | | | (0.00 | )3 |
| | | | | | | | | | | | | | | | | | | | |
Total distributions to shareholders | | | (0.05 | ) | | | (0.00 | )3 | | | (0.00 | )3 | | | (0.00 | )3 | | | (0.00 | )3 |
Net asset value, end of period | | | $8.93 | | | | $8.96 | | | | $9.01 | | | | $9.10 | | | | $9.15 | |
Total return4 | | | 0.23 | % | | | (0.52 | )% | | | (0.94 | )% | | | (0.51 | )% | | | 0.15 | % |
Ratios to average net assets (annualized) | | | | | | | | | | | | | | | | | | | | |
Gross expenses | | | 1.59 | % | | | 1.55 | % | | | 1.53 | % | | | 1.54 | % | | | 1.55 | % |
Net expenses | | | 1.49 | % | | | 1.49 | % | | | 1.49 | % | | | 1.49 | % | | | 1.49 | % |
Net investment income (loss) | | | 0.54 | % | | | (0.04 | )% | | | (0.19 | )% | | | (0.16 | )% | | | (0.11 | )% |
Supplemental data | | | | | | | | | | | | | | | | | | | | |
Portfolio turnover rate | | | 3 | % | | | 2 | % | | | 13 | % | | | 10 | % | | | 18 | % |
Net assets, end of period (000s omitted) | | | $45,693 | | | | $60,766 | | | | $97,452 | | | | $121,117 | | | | $148,523 | |
| 1 | Calculated based upon average shares outstanding |
| 2 | Amount is more than $(0.005). |
| 3 | Amount is less than $0.005. |
| 4 | Total return calculations do not include any sales charges. |
The accompanying notes are an integral part of these financial statements.
| | | | | | |
| Financial highlights | | Wells Fargo Adjustable Rate Government Fund | | | 31 | |
(For a share outstanding throughout each period)
| | | | | | | | | | | | | | | | | | | | |
| | | Year ended August 31 | |
| ADMINISTRATOR CLASS | | 2018 | | | 2017 | | | 2016 | | | 2015 | | | 2014 | |
Net asset value, beginning of period | | | $8.96 | | | | $9.01 | | | | $9.10 | | | | $9.15 | | | | $9.14 | |
Net investment income | | | 0.13 | 1 | | | 0.07 | 1 | | | 0.06 | | | | 0.06 | | | | 0.07 | |
Net realized and unrealized gains (losses) on investments | | | (0.03 | ) | | | (0.04 | ) | | | (0.06 | ) | | | (0.03 | ) | | | 0.03 | |
| | | | | | | | | | | | | | | | | | | | |
Total from investment operations | | | 0.10 | | | | 0.03 | | | | 0.00 | | | | 0.03 | | | | 0.10 | |
Distributions to shareholders from | | | | | | | | | | | | | | | | | | | | |
Net investment income | | | (0.13 | ) | | | (0.08 | ) | | | (0.07 | ) | | | (0.06 | ) | | | (0.07 | ) |
Tax basis return of capital | | | 0.00 | | | | 0.00 | | | | (0.02 | ) | | | (0.02 | ) | | | (0.02 | ) |
| | | | | | | | | | | | | | | | | | | | |
Total distributions to shareholders | | | (0.13 | ) | | | (0.08 | ) | | | (0.09 | ) | | | (0.08 | ) | | | (0.09 | ) |
Net asset value, end of period | | | $8.93 | | | | $8.96 | | | | $9.01 | | | | $9.10 | | | | $9.15 | |
Total return | | | 1.12 | % | | | 0.37 | % | | | (0.05 | )% | | | 0.38 | % | | | 1.05 | % |
Ratios to average net assets (annualized) | | | | | | | | | | | | | | | | | | | | |
Gross expenses | | | 0.77 | % | | | 0.74 | % | | | 0.72 | % | | | 0.72 | % | | | 0.73 | % |
Net expenses | | | 0.60 | % | | | 0.60 | % | | | 0.60 | % | | | 0.60 | % | | | 0.60 | % |
Net investment income | | | 1.42 | % | | | 0.82 | % | | | 0.71 | % | | | 0.72 | % | | | 0.78 | % |
Supplemental data | | | | | | | | | | | | | | | | | | | | |
Portfolio turnover rate | | | 3 | % | | | 2 | % | | | 13 | % | | | 10 | % | | | 18 | % |
Net assets, end of period (000s omitted) | | | $9,140 | | | | $18,805 | | | | $61,658 | | | | $66,037 | | | | $124,345 | |
| 1 | Calculated based upon average shares outstanding |
The accompanying notes are an integral part of these financial statements.
| | | | |
| 32 | | Wells Fargo Adjustable Rate Government Fund | | Financial highlights |
(For a share outstanding throughout each period)
| | | | | | | | | | | | | | | | | | | | |
| | | Year ended August 31 | |
| INSTITUTIONAL CLASS | | 2018 | | | 2017 | | | 2016 | | | 2015 | | | 2014 | |
Net asset value, beginning of period | | | $8.96 | | | | $9.01 | | | | $9.10 | | | | $9.15 | | | | $9.14 | |
Net investment income | | | 0.16 | | | | 0.09 | | | | 0.08 | | | | 0.08 | | | | 0.08 | |
Net realized and unrealized gains (losses) on investments | | | (0.05 | ) | | | (0.04 | ) | | | (0.07 | ) | | | (0.03 | ) | | | 0.03 | |
| | | | | | | | | | | | | | | | | | | | |
Total from investment operations | | | 0.11 | | | | 0.05 | | | | 0.01 | | | | 0.05 | | | | 0.11 | |
Distributions to shareholders from | | | | | | | | | | | | | | | | | | | | |
Net investment income | | | (0.14 | ) | | | (0.10 | ) | | | (0.07 | ) | | | (0.08 | ) | | | (0.08 | ) |
Tax basis return of capital | | | 0.00 | | | | 0.00 | | | | (0.03 | ) | | | (0.02 | ) | | | (0.02 | ) |
| | | | | | | | | | | | | | | | | | | | |
Total distributions to shareholders | | | (0.14 | ) | | | (0.10 | ) | | | (0.10 | ) | | | (0.10 | ) | | | (0.10 | ) |
Net asset value, end of period | | | $8.93 | | | | $8.96 | | | | $9.01 | | | | $9.10 | | | | $9.15 | |
Total return | | | 1.26 | % | | | 0.51 | % | | | 0.09 | % | | | 0.52 | % | | | 1.19 | % |
Ratios to average net assets (annualized) | | | | | | | | | | | | | | | | | | | | |
Gross expenses | | | 0.50 | % | | | 0.47 | % | | | 0.45 | % | | | 0.46 | % | | | 0.47 | % |
Net expenses | | | 0.46 | % | | | 0.46 | % | | | 0.45 | % | | | 0.46 | % | | | 0.46 | % |
Net investment income | | | 1.55 | % | | | 0.98 | % | | | 0.84 | % | | | 0.87 | % | | | 0.93 | % |
Supplemental data | | | | | | | | | | | | | | | | | | | | |
Portfolio turnover rate | | | 3 | % | | | 2 | % | | | 13 | % | | | 10 | % | | | 18 | % |
Net assets, end of period (000s omitted) | | | $235,078 | | | | $397,529 | | | | $702,617 | | | | $906,536 | | | | $844,221 | |
The accompanying notes are an integral part of these financial statements.
| | | | | | |
| Notes to financial statements | | Wells Fargo Adjustable Rate Government Fund | | | 33 | |
1. ORGANIZATION
Wells Fargo Funds Trust (the “Trust”), a Delaware statutory trust organized on March 10, 1999, is an open-end management investment company registered under the Investment Company Act of 1940, as amended (the “1940 Act”). As an investment company, the Trust follows the accounting and reporting guidance in Financial Accounting Standards Board (“FASB”) Accounting Standards Codification Topic 946, Financial Services – Investment Companies. These financial statements report on the Wells Fargo Adjustable Rate Government Fund (the “Fund”) which is a diversified series of the Trust.
Effective at the close of business on December 5, 2016, Class B shares were converted to Class A shares and are no longer offered by the Fund. Information for Class B shares reflected in the financial statements represents activity through December 5, 2016.
2. SIGNIFICANT ACCOUNTING POLICIES
The following significant accounting policies, which are consistently followed in the preparation of the financial statements of the Fund, are in conformity with U.S. generally accepted accounting principles which require management to make estimates and assumptions that affect the reported amounts of assets and liabilities, disclosure of contingent assets and liabilities at the date of the financial statements, and the reported amounts of revenues and expenses during the reporting period. Actual results could differ from those estimates.
Securities valuation
All investments are valued each business day as of the close of regular trading on the New York Stock Exchange (generally 4 p.m. Eastern Time), although the Fund may deviate from this calculation time under unusual or unexpected circumstances.
Debt securities are valued at the evaluated bid price provided by an independent pricing service or, if a reliable price is not available, the quoted bid price from an independent broker-dealer.
Investments in registered open-end investment companies are valued at net asset value.
Investments which are not valued using any of the methods discussed above are valued at their fair value, as determined in good faith by the Board of Trustees of the Fund. The Board of Trustees has established a Valuation Committee comprised of the Trustees and has delegated to it the authority to take any actions regarding the valuation of portfolio securities that the Valuation Committee deems necessary or appropriate, including determining the fair value of portfolio securities, unless the determination has been delegated to the Wells Fargo Asset Management Pricing Committee at Wells Fargo Funds Management, LLC (“Funds Management”). The Board of Trustees retains the authority to make or ratify any valuation decisions or approve any changes to the Valuation Procedures as it deems appropriate. On a quarterly basis, the Board of Trustees receives reports on any valuation actions taken by the Valuation Committee or the Wells Fargo Asset Management Pricing Committee which may include items for ratification.
Valuations of fair valued securities are compared to the next actual sales price when available, or other appropriate market values, to assess the continued appropriateness of the fair valuation methodologies used. These securities are fair valued on a day-to-day basis, taking into consideration changes to appropriate market information and any significant changes to the inputs considered in the valuation process until there is a readily available price provided on an exchange or by an independent pricing service. Valuations received from an independent pricing service or independent broker-dealer quotes are periodically validated by comparisons to most recent trades and valuations provided by other independent pricing services in addition to the review of prices by the manager and/or subadviser. Unobservable inputs used in determining fair valuations are identified based on the type of security, taking into consideration factors utilized by market participants in valuing the investment, knowledge about the issuer and the current market environment.
Security transactions and income recognition
Securities transactions are recorded on a trade date basis. Realized gains or losses are recorded on the basis of identified cost.
Interest income is accrued daily and bond discounts are accreted and premiums are amortized daily. To the extent debt obligations are placed on non-accrual status, any related interest income may be reduced by writing off interest receivables when the collection of all or a portion of interest has been determined to be doubtful based on consistently applied procedures and the fair value has decreased. If the issuer subsequently resumes interest payments or when the collectability of interest is reasonably assured, the debt obligation is removed from non-accrual status.
Distributions to shareholders
Distributions to shareholders from net investment income are declared daily and paid monthly. Distributions from net realized gains, if any, are recorded on the ex-dividend date and paid at least annually. Such distributions are determined in accordance with income tax regulations and may differ from U.S. generally accepted accounting principles. Dividend
| | | | |
| 34 | | Wells Fargo Adjustable Rate Government Fund | | Notes to financial statements |
sources are estimated at the time of declaration. The tax character of distributions is determined as of the Fund’s fiscal year end. Therefore, a portion of the Fund’s distributions made prior to the Fund’s fiscal year end may be categorized as a tax return of capital at year end.
Federal and other taxes
The Fund intends to continue to qualify as a regulated investment company by distributing substantially all of its investment company taxable income and any net realized capital gains (after reduction for capital loss carryforwards) sufficient to relieve it from all, or substantially all, federal income taxes. Accordingly, no provision for federal income taxes was required.
The Fund’s income and federal excise tax returns and all financial records supporting those returns for the prior three fiscal years are subject to examination by the federal and Delaware revenue authorities. Management has analyzed the Fund’s tax positions taken on federal, state, and foreign tax returns for all open tax years and does not believe that there are any uncertain tax positions that require recognition of a tax liability.
As of August 31, 2018, the aggregate cost of all investments for federal income tax purposes was $386,487,299 and the unrealized gains (losses) consisted of:
| | | | |
Gross unrealized gains | | $ | 5,518,620 | |
Gross unrealized losses | | | (1,559,799 | ) |
Net unrealized gains | | $ | 3,958,821 | |
Reclassifications are made to the Fund’s capital accounts for permanent tax differences to reflect income and gains available for distribution (or available capital loss carryforwards) under federal income tax regulations. U.S. generally accepted accounting principles require that certain components of net assets be adjusted to reflect permanent differences between financial and tax reporting. These reclassifications have no effect on net assets or net asset values per share. The primary permanent difference causing such a reclassification is due to expiration of capital loss carryforwards. At August 31, 2018, as a result of permanent book-to-tax differences, the following reclassification adjustments were made on the Statement of Assets and Liabilities:
| | |
| Paid-in capital | | Accumulated net
realized losses
on investments |
| $(1,122,258) | | $1,122,258 |
As of August 31, 2018, the Fund had capital loss carryforwards available to offset future net realized capital gains in the amount of $66,443 expiring in 2019.
Class allocations
The separate classes of shares offered by the Fund differ principally in applicable sales charges, distribution, shareholder servicing, and administration fees. Class specific expenses are charged directly to that share class. Investment income, common expenses, and realized and unrealized gains (losses) on investments are allocated daily to each class of shares based on the relative proportion of net assets of each class.
3. FAIR VALUATION MEASUREMENTS
Fair value measurements of investments are determined within a framework that has established a fair value hierarchy based upon the various data inputs utilized in determining the value of the Fund’s investments. The three-level hierarchy gives the highest priority to unadjusted quoted prices in active markets for identical assets or liabilities (Level 1) and the lowest priority to unobservable inputs (Level 3). The Fund’s investments are classified within the fair value hierarchy based on the lowest level of input that is significant to the fair value measurement. The inputs are summarized into three broad levels as follows:
| ∎ | | Level 1 – quoted prices in active markets for identical securities |
| ∎ | | Level 2 – other significant observable inputs (including quoted prices for similar securities, interest rates, prepayment speeds, credit risk, etc.) |
| ∎ | | Level 3 – significant unobservable inputs (including the Fund’s own assumptions in determining the fair value of investments) |
| | | | | | |
| Notes to financial statements | | Wells Fargo Adjustable Rate Government Fund | | | 35 | |
The inputs or methodologies used for valuing investments in securities are not necessarily an indication of the risk associated with investing in those securities.
The following is a summary of the inputs used in valuing the Fund’s assets and liabilities as of August 31, 2018:
| | | | | | | | | | | | | | | | |
| | | Quoted prices
(Level 1) | | | Other significant
observable inputs
(Level 2) | | | Significant
unobservable inputs (Level 3) | | | Total | |
Assets | | | | | | | | | | | | | | | | |
Investments in: | | | | | | | | | | | | | | | | |
| | | | |
Agency securities | | $ | 0 | | | $ | 376,251,593 | | | $ | 0 | | | $ | 376,251,593 | |
| | | | |
Short-term investments | | | | | | | | | | | | | | | | |
Investment companies | | | 14,194,527 | | | | 0 | | | | 0 | | | | 14,194,527 | |
Total assets | | $ | 14,194,527 | | | $ | 376,251,593 | | | $ | 0 | | | $ | 390,446,120 | |
The Fund recognizes transfers between levels within the fair value hierarchy at the end of the reporting period. At August 31, 2018, the Fund did not have any transfers into/out of Level 1, Level 2, or Level 3.
4. TRANSACTIONS WITH AFFILIATES
Management fee
Funds Management, an indirect wholly owned subsidiary of Wells Fargo & Company (“Wells Fargo”), is the manager of the Fund and provides advisory and fund-level administrative services under an investment management agreement. Under the investment management agreement, Funds Management is responsible for, among other services, implementing the investment objectives and strategies of the Fund, supervising the subadviser and providing fund-level administrative services in connection with the Fund’s operations. As compensation for its services under the investment management agreement, Funds Management is entitled to receive an annual management fee starting at 0.35% and declining to 0.255% as the average daily net assets of the Fund increase. For the year ended August 31, 2018, the management fee was equivalent to an annual rate of 0.35% of the Fund’s average daily net assets.
Funds Management has retained the services of a subadviser to provide daily portfolio management to the Fund. The fee for subadvisory services is borne by Funds Management. Wells Capital Management Incorporated, an affiliate of Funds Management and an indirect wholly owned subsidiary of Wells Fargo, is the subadviser to the Fund and is entitled to receive a fee from Funds Management at an annual rate starting at 0.20% and declining to 0.10% as the average daily net assets of the Fund increase.
Administration fees
Under a class-level administration agreement, Funds Management provides class-level administrative services to the Fund, which includes paying fees and expenses for services provided by the transfer agent, sub-transfer agents, omnibus account servicers and record-keepers. As compensation for its services under the class-level administration agreement, Funds Management receives an annual fee which is calculated based on the average daily net assets of each class as follows:
| | | | |
| | | Class-level
administration fee | |
Class A, Class C | | | 0.16 | % |
Administrator Class | | | 0.10 | |
Institutional Class | | | 0.08 | |
Funds Management has contractually waived and/or reimbursed management and administration fees to the extent necessary to maintain certain net operating expense ratios for the Fund. When each class of the Fund has exceeded its expense cap, Funds Management has waived fees and/or reimbursed expenses from fund level expenses on a proportionate basis and then from class specific expenses; otherwise, waivers and/or reimbursements are applied against class specific expenses before fund level expenses. Funds Management has committed through December 31, 2018 to waive fees and/or reimburse expenses to the extent necessary to cap the Fund’s expenses at 0.74% for Class A shares, 1.49% for Class C shares, 0.60% for Administrator Class shares and 0.46% for Institutional Class shares. After this time, the cap may be increased or the commitment to maintain the cap may be terminated only with the approval of the Board of Trustees.
| | | | |
| 36 | | Wells Fargo Adjustable Rate Government Fund | | Notes to financial statements |
Distribution fee
The Trust has adopted a distribution plan for Class C shares of the Fund pursuant to Rule 12b-1 under the 1940 Act. A distribution fee is charged to Class C shares and paid to Wells Fargo Funds Distributor, LLC (“Funds Distributor”), the principal underwriter, at an annual rate of 0.75% of the average daily net assets of Class C shares.
In addition, Funds Distributor is entitled to receive the front-end sales charge from the purchase of Class A shares and a contingent deferred sales charge on the redemption of certain Class A shares. Funds Distributor is also entitled to receive the contingent deferred sales charges from redemptions of Class C shares. For the year ended August 31, 2018, Funds Distributor received $109 from the sale of Class A shares and $127 in contingent deferred sales charges from redemptions of Class C shares. No contingent deferred sales charges were incurred by Class A shares for the year ended August 31, 2018.
Shareholder servicing fees
The Trust has entered into contracts with one or more shareholder servicing agents, whereby Class A, Class C, and Administrator Class of the Fund are charged a fee at an annual rate of 0.25% of the average daily net assets of each respective class.
A portion of these total shareholder servicing fees were paid to affiliates of Wells Fargo.
Interfund transactions
The Fund may purchase or sell portfolio investment securities to certain other Wells Fargo affiliates pursuant to Rule 17a-7 under the 1940 Act and under procedures adopted by the Board of Trustees. The procedures have been designed to ensure that these interfund transactions, which do not incur broker commissions, are effected at current market prices.
5. INVESTMENT PORTFOLIO TRANSACTIONS
Purchases and sales of investments, excluding short-term securities, for the year ended August 31, 2018 were as follows:
| | | | | | |
Purchases at cost | | Sales proceeds |
U.S.
government | | Non-U.S.
government | | U.S.
government | | Non-U.S.
government |
| $7,016,900 | | $7,580,065 | | $133,028,270 | | $7,635,720 |
6. BANK BORROWINGS
The Trust (excluding the money market funds), Wells Fargo Master Trust and Wells Fargo Variable Trust are parties to a $280,000,000 revolving credit agreement whereby the Fund is permitted to use bank borrowings for temporary or emergency purposes, such as to fund shareholder redemption requests. Interest under the credit agreement is charged to the Fund based on a borrowing rate equal to the higher of the Federal Funds rate in effect on that day plus 1.25% or the overnight LIBOR rate in effect on that day plus 1.25%. In addition, an annual commitment fee equal to 0.25% of the unused balance is allocated to each participating fund.
For the year ended August 31, 2018, there were no borrowings by the Fund under the agreement.
7. DISTRIBUTIONS TO SHAREHOLDERS
The tax character of distributions paid was $6,407,484 and $7,490,334 of ordinary income for the years ended August 31, 2018 and August 31, 2017, respectively.
As of August 31, 2018, the components of distributable earnings on a tax basis were as follows:
| | | | |
Undistributed ordinary income | | Unrealized gains | | Capital loss carryforward |
| $41,268 | | $3,958,821 | | $(66,443) |
8. INDEMNIFICATION
Under the Trust’s organizational documents, the officers and Trustees have been granted certain indemnification rights against certain liabilities that may arise out of performance of their duties to the Trust. Additionally, in the normal course of business, the Trust may enter into contracts with service providers that contain a variety of indemnification clauses. The Trust’s maximum exposure under these arrangements is dependent on future claims that may be made against the Fund and, therefore, cannot be estimated.
| | | | | | |
| Notes to financial statements | | Wells Fargo Adjustable Rate Government Fund | | | 37 | |
9. NEW ACCOUNTING PRONOUNCEMENTS AND REGULATORY CHANGES
On August 17, 2018, the Securities and Exchange Commission (“SEC”) adopted Disclosure Update and Simplification, which amends certain disclosure requirements. The amendments are effective for filings subsequent to November 5, 2018. Management expects these amendments will impact the classification of disclosures in the financial statements.
In August 2018, FASB issued Accounting Standards Update (“ASU”) No. 2018-13, Fair Value Measurement (Topic 820) Disclosure Framework—Changes to the Disclosure Requirements for Fair Value Measurement. ASU 2018-13 updates the disclosure requirements for fair value measurements by modifying or removing certain disclosures and adding certain new disclosures. The amendments are effective for fiscal years, and interim periods within those fiscal years, beginning after December 15, 2019. Early adoption is permitted. Management is currently evaluating the potential impact of this new guidance to the financial statements.
In March 2017, FASB issued ASU No. 2017-08, Premium Amortization on Purchased Callable Debt Securities. ASU 2017-08 shortens the amortization period for certain callable debt securities held at a premium. The amendments require the premium to be amortized to the earliest call date. The amendments do not require an accounting change for securities held at a discount; the discount continues to be amortized to maturity. ASU 2017-08 is effective for fiscal years beginning after December 15, 2018 and for interim periods within those fiscal years. Management is currently evaluating the potential impact of this new guidance to the financial statements.
| | | | |
| 38 | | Wells Fargo Adjustable Rate Government Fund | | Report of independent registered public accounting firm |
BOARD OF TRUSTEES AND SHAREHOLDERS OF WELLS FARGO FUNDS TRUST:
Opinion on the Financial Statements
We have audited the accompanying statement of assets and liabilities of Wells Fargo Adjustable Rate Government Fund (the “Fund”), including the portfolio of investments, as of August 31, 2018, the related statement of operations for the year then ended, the statements of changes in net assets for each of the years in the two-year period then ended, and the related notes (collectively, the “financial statements”) and the financial highlights for each of the years in the five-year period then ended. In our opinion, the financial statements and financial highlights present fairly, in all material respects, the financial position of the Fund as of August 31, 2018, the results of its operations for the year then ended, the changes in its net assets for each of the years in the two-year period then ended, and the financial highlights for each of the years in the five-year period then ended, in conformity with U.S. generally accepted accounting principles.
Basis for Opinion
These financial statements and financial highlights are the responsibility of the Fund’s management. Our responsibility is to express an opinion on these financial statements and financial highlights based on our audits. We are a public accounting firm registered with the Public Company Accounting Oversight Board (United States) (“PCAOB”) and are required to be independent with respect to the Company in accordance with the U.S. federal securities laws and the applicable rules and regulations of the Securities and Exchange Commission and the PCAOB.
We conducted our audits in accordance with the standards of the PCAOB. Those standards require that we plan and perform the audit to obtain reasonable assurance about whether the financial statements and financial highlights are free of material misstatement, whether due to error or fraud. Our audits included performing procedures to assess the risks of material misstatement of the financial statements and financial highlights, whether due to error or fraud, and performing procedures that respond to those risks. Such procedures included examining, on a test basis, evidence regarding the amounts and disclosures in the financial statements and financial highlights. Such procedures also included confirmation of securities owned as of August 31, 2018, by correspondence with the custodian and brokers, or by other appropriate auditing procedures. Our audits also included evaluating the accounting principles used and significant estimates made by management, as well as evaluating the overall presentation of the financial statements and financial highlights. We believe that our audits provide a reasonable basis for our opinion.

We have not been able to determine the specific year that we began serving as the auditor of one or more Wells Fargo Funds investment companies, however we are aware that we have served as the auditor of one or more Wells Fargo Funds investment companies since at least 1955.
Boston, Massachusetts
October 26, 2018
| | | | | | |
| Other information (unaudited) | | Wells Fargo Adjustable Rate Government Fund | | | 39 | |
TAX INFORMATION
For the fiscal year ended August 31, 2018, $6,367,464 has been designated as interest-related dividends for nonresident alien shareholders pursuant to Section 871 of the Internal Revenue Code.
PROXY VOTING INFORMATION
A description of the policies and procedures that the Fund uses to determine how to vote proxies relating to portfolio securities is available, upon request, by calling 1-800-222-8222, visiting our website at wellsfargofunds.com, or visiting the SEC website at sec.gov. Information regarding how the Fund voted proxies relating to portfolio securities during the most recent 12-month period ended June 30 is available on the Fund’s website at wellsfargofunds.com or by visiting the SEC website at sec.gov.
PORTFOLIO HOLDINGS INFORMATION
The complete portfolio holdings for the Fund are publicly available monthly on the Fund’s website (wellsfargofunds.com), on a one-month delayed basis. In addition, top ten holdings information (excluding derivative positions) for the Fund is publicly available on the Fund’s website on a monthly, seven-day or more delayed basis. The Fund files its complete schedule of portfolio holdings with the SEC for the first and third quarters of each fiscal year on Form N-Q, which is available by visiting the SEC website at sec.gov. In addition, the Fund’s Form N-Q may be reviewed and copied at the SEC’s Public Reference Room in Washington, DC, and at regional offices in New York City, at 233 Broadway, and in Chicago, at 175 West Jackson Boulevard, Suite 900. Information about the Public Reference Room may be obtained by calling 1-800-SEC-0330.
| | | | |
| 40 | | Wells Fargo Adjustable Rate Government Fund | | Other information (unaudited) |
BOARD OF TRUSTEES AND OFFICERS
Each of the Trustees and Officers1 listed in the table below acts in identical capacities for each fund in the Wells Fargo family of funds, which consists of 154 mutual funds comprising the Wells Fargo Funds Trust, Wells Fargo Variable Trust, Wells Fargo Master Trust and four closed-end funds (collectively the “Fund Complex”). This table should be read in conjunction with the Prospectus and the Statement of Additional Information2. The mailing address of each Trustee and Officer is 525 Market Street, 12th Floor, San Francisco, CA 94105. Each Trustee and Officer serves an indefinite term, however, each Trustee serves such term until reaching the mandatory retirement age established by the Trustees.
Independent Trustees
| | | | | | |
Name and year of birth | | Position held and length of service* | | Principal occupations during past five years or longer | | Current other public company or
investment company
directorships |
William R. Ebsworth (Born 1957) | | Trustee, since 2015 | | Retired. From 1984 to 2013, equities analyst, portfolio manager, research director and chief investment officer at Fidelity Management and Research Company in Boston, Tokyo, and Hong Kong, and retired in 2013 as Chief Investment Officer of Fidelity Strategic Advisers, Inc. where he led a team of investment professionals managing client assets. Prior thereto, Board member of Hong Kong Securities Clearing Co., Hong Kong Options Clearing Corp., the Thailand International Fund, Ltd., Fidelity Investments Life Insurance Company, and Empire Fidelity Investments Life Insurance Company. Board member of Vincent Memorial Hospital Endowment (non-profit organization), where he serves on the Investment Committee and as a Chair of the Audit Committee. Mr. Ebsworth is a CFA® charterholder. | | N/A |
Jane A. Freeman (Born 1953) | | Trustee, since 2015; Chair Liaison, since 2018 | | Retired. From 2012 to 2014 and 1999 to 2008, Chief Financial Officer of Scientific Learning Corporation. From 2008 to 2012, Ms. Freeman provided consulting services related to strategic business projects. Prior to 1999, Portfolio Manager at Rockefeller & Co. and Scudder, Stevens & Clark. Board member of the Harding Loevner Funds from 1996 to 2014, serving as both Lead Independent Director and chair of the Audit Committee. Board member of the Russell Exchange Traded Funds Trust from 2011 to 2012 and the chair of the Audit Committee. Ms. Freeman is a Board Member of The Ruth Bancroft Garden (non-profit organization). She is also an inactive Chartered Financial Analyst. | | N/A |
Isaiah Harris, Jr. (Born 1952) | | Trustee, since 2009 | | Retired. Chairman of the Board of CIGNA Corporation since 2009, and Director since 2005. From 2003 to 2011, Director of Deluxe Corporation. Prior thereto, President and CEO of BellSouth Advertising and Publishing Corp. from 2005 to 2007, President and CEO of BellSouth Enterprises from 2004 to 2005 and President of BellSouth Consumer Services from 2000 to 2003. Emeritus member of the Iowa State University Foundation Board of Governors. Emeritus Member of the Advisory Board of Iowa State University School of Business. Advisory Board Member, Palm Harbor Academy (private school). Advisory Board Member, Child Evangelism Fellowship (non-profit). Mr. Harris is a certified public accountant (inactive status). | | CIGNA Corporation |
Judith M. Johnson (Born 1949) | | Trustee, since 2008; Audit Committee Chairman, since 2009 | | Retired. Prior thereto, Chief Executive Officer and Chief Investment Officer of Minneapolis Employees Retirement Fund from 1996 to 2008. Ms. Johnson is an attorney, certified public accountant and a certified managerial accountant. | | N/A |
David F. Larcker (Born 1950) | | Trustee, since 2009 | | James Irvin Miller Professor of Accounting at the Graduate School of Business, Stanford University, Director of the Corporate Governance Research Initiative and Senior Faculty of The Rock Center for Corporate Governance since 2006. From 2005 to 2008, Professor of Accounting at the Graduate School of Business, Stanford University. Prior thereto, Ernst & Young Professor of Accounting at The Wharton School, University of Pennsylvania from 1985 to 2005. | | N/A |
| | | | | | |
| Other information (unaudited) | | Wells Fargo Adjustable Rate Government Fund | | | 41 | |
| | | | | | |
Name and year of birth | | Position held and length of service* | | Principal occupations during past five years or longer | | Current other public company or
investment company
directorships |
Olivia S. Mitchell (Born 1953) | | Trustee, since 2006; Governance Committee Chairman, since 2018 | | International Foundation of Employee Benefit Plans Professor, Wharton School of the University of Pennsylvania since 1993. Director of Wharton’s Pension Research Council and Boettner Center on Pensions & Retirement Research, and Research Associate at the National Bureau of Economic Research. Previously, Cornell University Professor from 1978 to 1993. | | N/A |
Timothy J. Penny (Born 1951) | | Trustee, since 1996; Chairman, since 2018; Vice Chairman, from 2017 to 2018 | | President and Chief Executive Officer of Southern Minnesota Initiative Foundation, a non-profit organization, since 2007. Member of the Board of Trustees of NorthStar Education Finance, Inc., a non-profit organization, since 2007. | | N/A |
James G. Polisson (Born 1959) | | Trustee, since 2018; Advisory Board Member, from 2017 to 2018 | | Retired. Chief Marketing Officer, Source (ETF) UK Services, Ltd, from 2015 to 2017. From 2012 to 2015, Principal of The Polisson Group, LLC, a management consulting, corporate advisory and principal investing company. Chief Executive Officer and Managing Director at Russell Investments, Global Exchange Traded Funds from 2010 to 2012. Managing Director of Barclays Global Investors from 1998 to 2010 and Global Chief Marketing Officer for iShares and Barclays Global Investors from 2000 to 2010. Trustee of the San Francisco Mechanics’ Institute, a non-profit organization, from 2013 to 2015. Board member of the Russell Exchange Traded Fund Trust from 2011 to 2012. Director of Barclays Global Investors Holdings Deutschland GmbH from 2006 to 2009. Mr. Polisson is an attorney and has a retired status with the Massachusetts and District of Columbia Bar Associations. | | N/A |
Michael S. Scofield (Born 1943) | | Trustee, since 2010 | | Served on the Investment Company Institute’s Board of Governors and Executive Committee from 2008-2011 as well the Governing Council of the Independent Directors Council from 2006-2011 and the Independent Directors Council Executive Committee from 2008-2011. Trustee of the Evergreen Fund complex (and its predecessors) from 1984 to 2010. Chairman of the Evergreen Funds from 2000-2010. Former Trustee of the Mentor Funds. Retired Attorney, Law Offices of Michael S. Scofield. | | N/A |
Pamela Wheelock (Born 1959) | | Trustee, since 2018; Advisory Board Member, from 2017 to 2018 | | Chief Operating Officer, Twin Cities Habitat for Humanity, since January, 2017. Vice President of University Services, University of Minnesota from 2012 to 2017. Prior thereto, on the Board of Directors, Governance Committee and Finance Committee for the Minnesota Philanthropy Partners (Saint Paul Foundation) from 2012 to 2018, Interim President and Chief Executive Officer of Blue Cross Blue Shield of Minnesota from 2010 to 2011, Chairman of the Board from 2009 to 2011 and Board Director from 2003 to 2015. Vice President, Leadership and Community Engagement, Bush Foundation, Saint Paul, Minnesota (a private foundation) from 2009 to 2011. Executive Vice President and Chief Financial Officer, Minnesota Sports and Entertainment from 2004 to 2009 and Senior Vice President from 2002 to 2004. Commissioner of Finance, State of Minnesota, from 1999 to 2002. Currently the Board Chair of the Minnesota Wild Foundation since 2010. | | N/A |
| * | Length of service dates reflect the Trustee’s commencement of service with the Trust’s predecessor entities, where applicable. |
| | | | |
| 42 | | Wells Fargo Adjustable Rate Government Fund | | Other information (unaudited) |
Officers
| | | | | | |
Name and year of birth | | Position held and
length of service | | Principal occupations during past five years or longer | | |
Andrew Owen (Born 1960) | | President, since 2017 | | Executive Vice President of Wells Fargo & Company and Head of Affiliated Managers, Wells Fargo Asset Management, since 2014. In addition, Mr. Owen is currently President, Chief Executive Officer and Director of Wells Fargo Funds Management, LLC since 2017. Prior thereto, Executive Vice President responsible for marketing, investments and product development for Wells Fargo Funds Management, LLC, from 2009 to 2014. | | |
| Nancy Wiser1 (Born 1967) | | Treasurer, since 2012 | | Executive Vice President of Wells Fargo Funds Management, LLC since 2011. Chief Operating Officer and Chief Compliance Officer at LightBox Capital Management LLC, from 2008 to 2011. | | |
Alexander Kymn3 (Born 1973) | | Secretary, since 2018; Chief Legal Officer, since 2018 | | Senior Company Counsel of Wells Fargo Bank, N.A. since 2018 (previously Senior Counsel from 2007 to 2018). Vice President of Wells Fargo Funds Management, LLC from 2008 to 2014. | | |
Michael H. Whitaker (Born 1967) | | Chief Compliance Officer, since 2016 | | Senior Vice President and Chief Compliance Officer since 2016. Senior Vice President and Chief Compliance Officer for Fidelity Investments from 2007 to 2016. | | |
David Berardi (Born 1975) | | Assistant Treasurer, since 2009 | | Vice President of Wells Fargo Funds Management, LLC since 2009. Vice President of Evergreen Investment Management Company, LLC from 2008 to 2010. Manager of Fund Reporting and Control for Evergreen Investment Management Company, LLC from 2004 to 2010. | | |
Jeremy DePalma1 (Born 1974) | | Assistant Treasurer, since 2009 | | Senior Vice President of Wells Fargo Funds Management, LLC since 2009. Senior Vice President of Evergreen Investment Management Company, LLC from 2008 to 2010 and head of the Fund Reporting and Control Team within Fund Administration from 2005 to 2010. | | |
| 1 | Nancy Wiser acts as Treasurer of 77 funds in the Fund Complex. Jeremy DePalma acts as Treasurer of 77 funds and Assistant Treasurer of 77 funds in the Fund Complex. |
| 2 | The Statement of Additional Information includes additional information about the Trustees and is available, without charge, upon request, by calling 1-800-222-8222 or by visiting the website at wellsfargofunds.com. |
| 3 | Alexander Kymn became the Secretary and Chief Legal Officer effective April 17, 2018. |
| | | | | | |
| Other information (unaudited) | | Wells Fargo Adjustable Rate Government Fund | | | 43 | |
BOARD CONSIDERATION OF INVESTMENT MANAGEMENT AND SUB-ADVISORY AGREEMENTS:
Wells Fargo Adjustable Rate Government Fund
Under the Investment Company Act of 1940 (the “1940 Act”), the Board of Trustees (the “Board”) of Wells Fargo Funds Trust (the “Trust”) must determine annually whether to approve the continuation of the Trust’s investment management and sub-advisory agreements. In this regard, at an in-person meeting held on May 22-23, 2018 (the “Meeting”), the Board, all the members of which have no direct or indirect interest in the investment management and sub-advisory agreements and are not “interested persons” of the Trust, as defined in the 1940 Act (the “Independent Trustees”), reviewed and approved for Wells Fargo Adjustable Rate Government Fund (the “Fund”): (i) an investment management agreement (the “Management Agreement”) with Wells Fargo Funds Management, LLC (“Funds Management”); and (ii) an investment sub-advisory agreement (the “Sub-Advisory Agreement”) with Wells Capital Management Incorporated (the “Sub-Adviser”), an affiliate of Funds Management. The Management Agreement and the Sub-Advisory Agreement are collectively referred to as the “Advisory Agreements.”
At the Meeting, the Board considered the factors and reached the conclusions described below relating to the selection of Funds Management and the Sub-Adviser and the approval of the Advisory Agreements. Prior to the Meeting, including at an in-person meeting in April 2018, the Trustees conferred extensively among themselves and with representatives of Funds Management about these matters. Also, the Board has adopted a team-based approach, with each team consisting of a sub-set of Trustees, to assist the full Board in the discharge of its duties in reviewing investment performance and other matters throughout the year. The Independent Trustees were assisted in their evaluation of the Advisory Agreements by independent legal counsel, from whom they received separate legal advice and with whom they met separately.
In providing information to the Board, Funds Management and the Sub-Adviser were guided by a detailed set of requests for information submitted to them by independent legal counsel on behalf of the Independent Trustees at the start of the Board’s annual contract renewal process earlier in 2018. In considering and approving the Advisory Agreements, the Trustees considered the information they believed relevant, including but not limited to the information discussed below. The Board considered not only the specific information presented in connection with the Meeting, but also the knowledge gained over time through interaction with Funds Management and the Sub-Adviser about various topics. In this regard, the Board reviewed reports of Funds Management at each of its quarterly meetings, which included, among other things, portfolio reviews and investment performance reports. In addition, the Board and the teams mentioned above confer with portfolio managers at various times throughout the year. The Board did not identify any particular information or consideration that was all-important or controlling, and each individual Trustee may have attributed different weights to various factors.
After its deliberations, the Board unanimously approved the continuation of the Advisory Agreements for a one-year term and determined that the compensation payable to Funds Management and the Sub-Adviser under each of the Advisory Agreements was reasonable. The Board considered the approval of the Advisory Agreements for the Fund as part of its consideration of agreements for funds across the complex, but its approvals were made on a fund-by-fund basis. The following summarizes a number of important, but not necessarily all, factors considered by the Board in support of its approvals.
Nature, extent and quality of services
The Board received and considered various information regarding the nature, extent and quality of services provided to the Fund by Funds Management and the Sub-Adviser under the Advisory Agreements. This information included a description of the investment advisory services and Fund-level administrative services covered by the Management Agreement, as well as, among other things, a summary of the background and experience of senior management of Wells Fargo Asset Management (“WFAM”), of which Funds Management and the Sub-Adviser are a part, a summary of investments made in the business of WFAM, a summary of certain organizational and personnel changes involving Funds Management and the Sub-Adviser, and a description of Funds Management’s and the Sub-Adviser’s business continuity planning programs and of their approaches to data privacy and cybersecurity. The Board also considered the qualifications, background, tenure and responsibilities of each of the portfolio managers primarily responsible for the day-to-day portfolio management of the Fund.
The Board evaluated the ability of Funds Management and the Sub-Adviser to attract and retain qualified investment professionals, including research, advisory and supervisory personnel. The Board further considered the compliance programs and compliance records of Funds Management and the Sub-Adviser. In addition, the Board took into account the full range of services provided to the Fund by Funds Management and its affiliates.
| | | | |
| 44 | | Wells Fargo Adjustable Rate Government Fund | | Other information (unaudited) |
Fund investment performance and expenses
The Board considered the investment performance results for the Fund over various time periods ended December 31, 2017. The Board considered these results in comparison to the investment performance of funds in a universe that was determined by Broadridge Inc. (“Broadridge”) to be similar to the Fund (the “Universe”), and in comparison to the Fund’s benchmark index and to other comparative data. Broadridge is an independent provider of investment company data. The Board received a description of the methodology used by Broadridge to select the mutual funds in the performance Universe. The Board noted that the investment performance of the Fund (Class A) was higher than the average investment performance of the Universe for the ten-year period under review, but lower than the average investment performance of the Universe for the one-, three-, and five-year periods under review. The Board also noted that the investment performance of the Fund was higher than or in range of its benchmark index, the Bloomberg Barclays 6-Month Treasury Bill Index, for the five- and ten-year periods under review, but lower than its benchmark for the one-and three-year periods under review.
The Board received information concerning, and discussed factors contributing to, the underperformance of the Fund relative to the Universe and benchmark for the periods identified above. The Board took note of the explanations for the relative underperformance during these periods, including with respect to investment decisions and market factors that affected the Fund’s investment performance.
The Board also received and considered information regarding the Fund’s net operating expense ratios and their various components, including actual management fees, custodian and other non-management fees, and Rule 12b-1 and non-Rule 12b-1 shareholder service fees. The Board considered these ratios in comparison to the median ratios of funds in class-specific expense groups that were determined by Broadridge to be similar to the Fund (the “Groups”). The Board received a description of the methodology used by Broadridge to select the mutual funds in the expense Groups and an explanation of how funds comprising expense groups and their expense ratios may vary from year-to-year. Based on the Broadridge reports, the Board noted that the net operating expense ratios of the Fund were equal to or in range of the median net operating expense ratios of the expense Groups for all share classes.
The Board took into account the Fund’s investment performance and expense information provided to it among the factors considered in deciding to re-approve the Advisory Agreements.
Investment management and sub-advisory fee rates
The Board reviewed and considered the contractual fee rates payable by the Fund to Funds Management under the Management Agreement, as well as the contractual fee rates payable by the Fund to Funds Management for class-level administrative services under a Class-Level Administration Agreement, which include, among other things, class-level transfer agency and sub-transfer agency costs (collectively, the “Management Rates”). The Board also reviewed and considered the contractual investment sub-advisory fee rates that are payable by Funds Management to the Sub-Adviser for investment sub-advisory services.
Among other information reviewed by the Board was a comparison of the Fund’s Management Rates with the average contractual investment management fee rates of funds in the expense Groups at a common asset level as well as transfer agency costs of the funds in the expense Groups. The Board noted that the Management Rates of the Fund were in range of the sum of these average rates for the Fund’s expense Groups for all share classes.
The Board also received and considered information about the portion of the total management fee that was retained by Funds Management after payment of the fee to the Sub-Adviser for sub-advisory services. In assessing the reasonableness of this amount, the Board received and evaluated information about the nature and extent of responsibilities retained and risks assumed by Funds Management and not delegated to or assumed by the Sub-Adviser, and about Funds Management’s on-going oversight services. Given the affiliation between Funds Management and the Sub-Adviser, the Board ascribed limited relevance to the allocation of fees between them.
The Board also received and considered information about the nature and extent of services offered and fee rates charged by Funds Management and the Sub-Adviser to other types of clients with investment strategies similar to those of the Fund. In this regard, the Board received information about the significantly greater scope of services, and compliance, reporting and other legal burdens and risks of managing mutual funds compared with those associated with managing assets of non-mutual fund clients such as institutional separate accounts.
Based on its consideration of the factors and information it deemed relevant, including those described here, the Board determined that the compensation payable to Funds Management under the Management Agreement and to the Sub-Adviser under the Sub-Advisory Agreement was reasonable.
| | | | | | |
| Other information (unaudited) | | Wells Fargo Adjustable Rate Government Fund | | | 45 | |
Profitability
The Board received and considered information concerning the profitability of Funds Management, as well as the profitability of both WFAM and Wells Fargo & Co. (“Wells Fargo”) as a whole, from providing services to the Fund and the fund family as a whole. The Board noted that the Sub-Adviser’s profitability information with respect to providing services to the Fund was subsumed in the WFAM and Wells Fargo profitability analysis.
Funds Management reported on the methodologies and estimates used in calculating profitability, including a description of the methodology used to allocate certain expenses and recent enhancements made to the methodology. Among other things, the Board noted that the levels of profitability reported on a fund-by-fund basis varied widely, depending on factors such as the size and type of fund. Based on its review, the Board did not deem the profits reported by Funds Management, WFAM or Wells Fargo from services provided to the Fund to be at a level that would prevent it from approving the continuation of the Advisory Agreements.
Economies of scale
The Board considered the extent to which Funds Management may experience economies of scale in the provision of management services, and the extent to which scale benefits, if any, would be shared with shareholders. In particular, the Board noted the existence of breakpoints in the Fund’s management fee structure, which operate generally to reduce the Fund’s expense ratios as the Fund grows in size. It considered that, for a small fund or a fund that shrinks in size, breakpoints conversely can result in higher fee levels. The Board also considered that in addition to management fee breakpoints, competitive management fee rates set at the outset without regard to breakpoints and fee waiver and expense reimbursement arrangements, as well as investments in the business intended to enhance services available to Fund shareholders, are means of sharing potential economies of scale with shareholders of the Fund.
The Board concluded that the Fund’s fee and expense arrangements, including contractual breakpoints, constituted a reasonable approach to sharing potential economies of scale with the Fund and its shareholders.
Other benefits to Funds Management and the Sub-Adviser
The Board received and considered information regarding potential “fall-out” or ancillary benefits received by Funds Management and its affiliates, including the Sub-Adviser, as a result of their relationships with the Fund. Ancillary benefits could include, among others, benefits directly attributable to other relationships with the Fund and benefits potentially derived from an increase in Funds Management’s and the Sub-Adviser’s business as a result of their relationships with the Fund. The Board noted that various affiliates of Funds Management may receive distribution-related fees, shareholder servicing payments and sub-transfer agency fees in respect of shares sold or held through them and services provided.
The Board also reviewed information about soft dollar credits earned and utilized by the Sub-Adviser, fees earned by Funds Management and the Sub-Adviser from managing a private investment vehicle for the fund family’s securities lending collateral and commissions earned by an affiliated broker from portfolio transactions.
Based on its consideration of the factors and information it deemed relevant, including those described here, the Board did not find that any ancillary benefits received by Funds Management and its affiliates, including the Sub-Adviser, were unreasonable.
Conclusion
At the Meeting, after considering the above-described factors and based on its deliberations and its evaluation of the information described above, the Board unanimously approved the continuation of the Advisory Agreements for a one-year term and determined that the compensation payable to Funds Management and the Sub-Adviser under each of the Advisory Agreements was reasonable.
| | | | |
| 46 | | Wells Fargo Adjustable Rate Government Fund | | Appendix A (unaudited) |
SALES CHARGE REDUCTIONS AND WAIVERS FOR CERTAIN INTERMEDIARIES
Ameriprise
Effective June 1, 2018, shareholders purchasing Fund shares through an Ameriprise Financial platform or account will be eligible only for the following Class A load waivers (front-end sales charge waivers), which may differ from those disclosed elsewhere in the Fund’s prospectus or Statement of Additional Information.
Front-end Sales Load Waivers on Class A Shares Available at Ameriprise Financial
| | • | | Employer-sponsored retirement plans (e.g., 401(k) plans, 457 plans, employer-sponsored 403(b) plans, profit sharing and money purchase pension plans and defined benefit plans). For purposes of this provision, employer-sponsored retirement plans do not include SEP IRAs, Simple IRAs or SAR-SEPs. |
| | • | | Shares purchased through an Ameriprise Financial investment advisory program (if an Advisory or similar share class for such investment advisory program is not available) |
| | • | | Shares purchased by third party investment advisors on behalf of their advisory clients through Ameriprise Financial’s platform (if an Advisory or similar share class for such investment advisory program is not available) |
| | • | | Shares purchased through reinvestment of distributions and dividend reinvestment when purchasing shares of the same Fund (but not any other fund within the same fund family) |
| | • | | Shares exchanged from Class C shares of the same fund in the month of or following the 10-year anniversary of the purchase date. To the extent that the Fund’s prospectus elsewhere provides for a waiver with respect to such shares following a shorter holding period, that waiver will apply to exchanges following such shorter period. To the extent that the Fund’s prospectus elsewhere provides for a waiver with respect to exchanges of Class C shares for load-waived shares, that waiver will also apply to such exchanges. |
| | • | | Employees and registered representatives of Ameriprise Financial or its affiliates and their immediate family members |
| | • | | Shares purchased by or through qualified accounts (including IRAs, Coverdell Education Savings Accounts, 401(k)s, 403(b) TSCAs subject to ERISA and defined benefit plans) that are held by a covered family member, defined as an Ameriprise financial advisor and/or the advisor’s spouse, advisor’s lineal ascendant (mother, father, grandmother, grandfather, great grandmother, great grandfather), advisor’s lineal descendant (son, step-son, daughter, step-daughter, grandson, granddaughter, great grandson, great granddaughter) or any spouse of a covered family member who is a lineal descendant |
| | • | | Shares purchased from the proceeds of redemptions within the same fund family, provided (1) the repurchase occurs within 90 days following the redemption, (2) the redemption and purchase occur in the same account, and (3) redeemed shares were subject to a front-end or deferred sales load (i.e. Rights of Reinstatement). Subject to the Fund’s policy regarding frequent purchases and redemptions of Fund shares, you may not be able to repurchase shares for the first 30 days after your redemption. |
Automatic Exchange of Class C Shares Available at Ameriprise Financial
| | • | | Class C shares will automatically exchange to Class A shares in the month of the 10-year anniversary of the purchase date. |
Merrill Lynch
Effective April 10, 2017, shareholders purchasing Fund shares through a Merrill Lynch platform or account will be eligible only for the following load waivers (front-end sales charge waivers and contingent deferred, or back-end, sales charge waivers) and discounts, which may differ from those disclosed elsewhere in the Fund’s prospectus or Statement of Additional Information.
Front-end Sales Load Waivers on Class A Shares available at Merrill Lynch
| | • | | Employer-sponsored retirement, deferred compensation and employee benefit plans (including health savings accounts) and trusts used to fund those plans, provided that the shares are not held in a commission-based brokerage account and shares are held for the benefit of the plan |
| | • | | Shares purchased by or through a 529 Plan |
| | • | | Shares purchased through a Merrill Lynch affiliated investment advisory program |
| | | | | | |
| Appendix A (unaudited) | | Wells Fargo Adjustable Rate Government Fund | | | 47 | |
| | • | | Shares purchased by third party investment advisors on behalf of their advisory clients through Merrill Lynch’s platform |
| | • | | Shares of funds purchased through the Merrill Edge Self-Directed platform (if applicable) |
| | • | | Shares purchased through reinvestment of capital gains distributions and dividend reinvestment when purchasing shares of the same fund (but not any other fund within the fund family) |
| | • | | Shares exchanged from Class C (i.e. level-load) shares of the same fund in the month of or following the 10-year anniversary of the purchase date |
| | • | | Employees and registered representatives of Merrill Lynch or its affiliates and their family members, as defined by Merrill Lynch, which may differ from the definition of family member in the Fund’s prospectus. |
| | • | | Directors or Trustees of the Fund, and employees of the Fund’s investment adviser or any of its affiliates, as described in the Fund’s prospectus |
| | • | | Shares purchased from the proceeds of redemptions within the same fund family, provided (1) the repurchase occurs within 90 days following the redemption, (2) the redemption and purchase occur in the same account, and (3) redeemed shares were subject to a front-end or deferred sales load (known as Rights of Reinstatement). Subject to the Fund’s policy regarding frequent purchases and redemptions of Fund shares, you may not be able to repurchase shares for the first 30 days after your redemption. |
CDSC Waivers on A, B and C Shares available at Merrill Lynch
| | • | | Death or disability of the shareholder |
| | • | | Shares sold as part of a systematic withdrawal plan as described in the Fund’s prospectus |
| | • | | Return of excess contributions from an IRA Account |
| | • | | Shares sold as part of a required minimum distribution for IRA and retirement accounts due to the shareholder reaching age 70½ |
| | • | | Shares sold to pay Merrill Lynch fees but only if the transaction is initiated by Merrill Lynch |
| | • | | Shares acquired through a right of reinstatement |
| | • | | Shares held in retirement brokerage accounts, that are exchanged for a lower cost share class due to transfer to certain fee based accounts or platforms (applicable to A and C shares only) |
Front-end load Discounts Available at Merrill Lynch: Breakpoints, Rights of Accumulation & Letters of Intent
| | • | | Breakpoints as described in the Fund’s prospectus |
| | • | | Rights of Accumulation (ROA) which entitle shareholders to breakpoint discounts will be automatically calculated based on the aggregated holding of fund family assets held by accounts within the purchaser’s household at Merrill Lynch. Eligible fund family assets not held at Merrill Lynch may be included in the ROA calculation only if the shareholder notifies his or her financial advisor about such assets. |
| | • | | Letters of Intent (LOI) which allow for breakpoint discounts based on anticipated purchases within a fund family, through Merrill Lynch, over a 13-month period of time (if applicable) |
Morgan Stanley
Effective on or about July 1, 2018, shareholders purchasing Fund shares through a Morgan Stanley Wealth Management transactional brokerage account will be eligible only for the following Class A load waivers (front-end sales charge waivers), which may differ from and be more limited than those disclosed in the Fund’s prospectus or Statement of Additional Information.
Front-end Sales Load Waivers on Class A Shares Available at Morgan Stanley
| | • | | Employer-sponsored retirement plans (e.g., 401(k) plans, 457 plans, employer-sponsored 403(b) plans, profit sharing and money purchase pension plans and defined benefit plans). For purposes of this provision, employer-sponsored retirement plans do not include SEP IRAs, Simple IRAs, SAR-SEPs or Keogh plans. |
| | • | | Morgan Stanley employee and employee-related accounts according to Morgan Stanley’s account linking rules |
| | • | | Shares purchased through reinvestment of dividends and capital gains distributions when purchasing shares of the same fund |
| | • | | Shares purchased through a Morgan Stanley self-directed brokerage account |
| | | | |
| 48 | | Wells Fargo Adjustable Rate Government Fund | | Appendix A (unaudited) |
| | • | | Class C (i.e., level-load) shares that are no longer subject to a contingent deferred sales charge and are exchanged to Class A shares of the same fund pursuant to Morgan Stanley Wealth Management’s share class exchange program. |
| | • | | Shares purchased from the proceeds of redemptions within the same fund family, provided (i) the repurchase occurs within 90 days following the redemption, (ii) the redemption and purchase occur in the same account, and (iii) redeemed shares were subject to a front-end or deferred sales charge. This waiver is subject to the Fund’s policy regarding frequent purchases and redemption of Fund shares, as discussed under “Account Information—Frequent Purchases and Redemptions of Fund Shares” in the Fund’s prospectus. |

For more information
More information about Wells Fargo Funds is available free upon request. To obtain literature, please write, visit the Fund’s website, or call:
Wells Fargo Funds
P.O. Box 219967
Kansas City, MO 64121-9967
Website: wellsfargofunds.com
Individual investors: 1-800-222-8222
Retail investment professionals: 1-888-877-9275
Institutional investment professionals:
1-866-765-0778
This report and the financial statements contained herein are submitted for the general information of the shareholders of the Fund. If this report is used for promotional purposes, distribution of the report must be accompanied or preceded by a current prospectus. Before investing, please consider the investment objectives, risks, charges, and expenses of the investment. For a current prospectus and, if available, a summary prospectus, containing this information, call 1-800-222-8222 or visit the Fund’s website at wellsfargofunds.com. Read the prospectus carefully before you invest or send money.
Wells Fargo Asset Management (WFAM) is the trade name for certain investment advisory/management firms owned by Wells Fargo & Company. These firms include but are not limited to Wells Capital Management Incorporated and Wells Fargo Funds Management, LLC. Certain products managed by WFAM entities are distributed by Wells Fargo Funds Distributor, LLC (a broker/dealer and Member FINRA).
This material is for general informational and educational purposes only and is NOT intended to provide investment advice or a recommendation of any kind—including a recommendation for any specific investment, strategy, or plan.
NOT FDIC INSURED ◾ NO BANK GUARANTEE ◾ MAY LOSE VALUE
© 2018 Wells Fargo Funds Management, LLC. All rights reserved.
| | |
 | | 315402 10-18 A215/AR215 08-18 |
Annual Report
August 31, 2018

Wells Fargo Conservative Income Fund


Reduce clutter. Save trees.
Sign up for electronic delivery of prospectuses and shareholder reports at wellsfargo.com/advantagedelivery
Contents
The views expressed and any forward-looking statements are as of August 31, 2018, unless otherwise noted, and are those of the Fund managers and/or Wells Fargo Funds Management, LLC. Discussions of individual securities, or the markets generally, or any Wells Fargo Fund are not intended as individual recommendations. Future events or results may vary significantly from those expressed in any forward-looking statements. The views expressed are subject to change at any time in response to changing circumstances in the market. Wells Fargo Funds Management, LLC and the Fund disclaim any obligation to publicly update or revise any views expressed or forward-looking statements.
NOT FDIC INSURED ◾ NO BANK GUARANTEE ◾ MAY LOSE VALUE
| | | | |
| 2 | | Wells Fargo Conservative Income Fund | | Letter to shareholders (unaudited) |

Andrew Owen
President
Wells Fargo Funds
After advancing during 2017, economic growth and stock markets globally diverged during the first eight months of 2018.
Dear Shareholder:
We are pleased to offer you this annual report for the Wells Fargo Conservative Income Fund for the 12-month period that ended August 31, 2018. After advancing during 2017, economic growth and stock markets globally diverged during the first eight months of 2018. For fixed-income investors, taxable bond returns suffered and high-yield and municipal bond returns were positive.
For the period, U.S. stocks, as measured by the S&P 500 Index,1 gained 19.66%, and international stocks, as measured by the MSCI ACWI ex USA Index (Net),2 added 3.18%. Based on the MSCI EM Index (Net),3 emerging market stocks lost 0.68%. For bond investors, the Bloomberg Barclays U.S. Aggregate Bond Index4 declined 1.05% while the Bloomberg Barclays Global Aggregate ex-USD Index5 fell 1.64%. The Bloomberg Barclays Municipal Bond Index6 added 0.49%, and the ICE BofAML U.S. High Yield Index7 was up 3.26%.
Continued optimism in the U.S. characterized the fourth quarter of 2017.
Some observers described economic conditions in late 2017 as a Goldilocks scenario: synchronized global growth, low inflation, healthy corporate earnings, and a weaker U.S. dollar that supported international growth. During the quarter, the U.S. Bureau of Economic Analysis reported that annualized U.S. gross domestic product (GDP) growth for the third quarter of 2017 was 2.8% and inflation remained below U.S. Federal Reserve (Fed) targets. U.S. corporate earnings and consumer confidence improved.
Economic momentum increased in Europe. The Bank of England (BOE) raised interest rates in November 2017 to 0.50%, the first increase in more than 10 years, indicating confidence in the economy’s growth potential. Meanwhile, the European Central Bank and the Bank of Japan kept interest rates low to spur business activities and bought bonds in an effort to encourage equity investments. The People’s Bank of China’s (PBOC’s) policies sought to stimulate business. Many emerging market economies benefited from stronger currencies versus the U.S. dollar, while commodity price increases benefited countries that rely on natural resources for exports.
| 1 | The S&P 500 Index consists of 500 stocks chosen for market size, liquidity, and industry group representation. It is a market-value-weighted index with each stock’s weight in the index proportionate to its market value. You cannot invest directly in an index. |
| 2 | The Morgan Stanley Capital International (MSCI) All Country World Index (ACWI) ex USA Index (Net) is a free-float-adjusted market-capitalization-weighted index that is designed to measure the equity market performance of developed markets, excluding the United States and Canada. Source: MSCI. MSCI makes no express or implied warranties or representations and shall have no liability whatsoever with respect to any MSCI data contained herein. The MSCI data may not be further redistributed or used as a basis for other indices or any securities or financial products. This report is not approved, reviewed, or produced by MSCI. You cannot invest directly in an index. |
| 3 | The MSCI Emerging Markets (EM) Index (Net) is a free-float-adjusted market-capitalization-weighted index that is designed to measure large- and mid-cap equity market performance of emerging markets. The MSCI EM Index (Net) consists of the following 24 emerging market country indices: Brazil, Chile, China, Colombia, Czech Republic, Egypt, Greece, Hungary, India, Indonesia, Korea, Malaysia, Mexico, Pakistan, Peru, the Philippines, Poland, Qatar, Russia, South Africa, Taiwan, Thailand, Turkey, and the United Arab Emirates. You cannot invest directly in an index. |
| 4 | The Bloomberg Barclays U.S. Aggregate Bond Index is a broad-based benchmark that measures the investment-grade, U.S. dollar-denominated, fixed-rate taxable bond market, including Treasuries, government-related and corporate securities, mortgage-backed securities (agency fixed-rate and hybrid adjustable-rate mortgage pass-throughs), asset-backed securities, and commercial mortgage-backed securities. You cannot invest directly in an index. |
| 5 | The Bloomberg Barclays Global Aggregate ex-USD Index is an unmanaged index that provides a broad-based measure of the global investment-grade fixed-income markets excluding the U.S. dollar-denominated debt market. You cannot invest directly in an index. |
| 6 | The Bloomberg Barclays Municipal Bond Index is an unmanaged index composed of long-term tax-exempt bonds with a minimum credit rating of Baa. You cannot invest directly in an index. |
| 7 | The ICE BofAML U.S. High Yield Index is a market-capitalization-weighted index of domestic and Yankee high-yield bonds. The index tracks the performance of high-yield securities traded in the U.S. bond market. You cannot invest directly in an index. Copyright 2018. ICE Data Indices, LLC. All rights reserved. |
| | | | | | |
| Letter to shareholders (unaudited) | | Wells Fargo Conservative Income Fund | | | 3 | |
Volatility reemerged during the first quarter of 2018 as global tensions and inflation fears increased.
Stock market gains in January 2018 followed the passage of lower U.S. tax rates. Some investors then grew concerned about trade, particularly between the U.S. and China, and the specter of inflation. The Fed followed its 25-basis-point (bp; 100 bps equal 1.00%) federal funds rate increase in December 2017 with a further 25-bp increase in March 2018. The inflation rate in March reached the Fed’s 2% target for the first time in a year.
The S&P 500 Index closed the first quarter with a negative return, the first negative quarterly return for the index since 2014. Overseas investment markets reversed strong returns in 2017, hurt by a stronger U.S. dollar and mounting trade and diplomatic tensions. After gaining 27.19% for the 12-month period that ended December 31, 2017, the MSCI ACWI ex USA Index (Net) declined 1.81% for the quarter that ended March 31, 2018.
Global trade tensions escalated during the second quarter.
Global trade tensions escalated throughout the second quarter of 2018. The U.S. government imposed tariffs, and foreign governments in North America, Europe, and Asia retaliated. The escalating tensions chilled investment activity as observers awaited signals of next steps.
Meanwhile, inflation continued an upward trend. The CPI-U8 added 0.1% in June after increases of 0.2% in both April and May. On a year-over-year basis, the all-items index rose 2.9% for the 12 months that ended June 30, 2018. The index for all items less food and energy rose 2.3% for the same 12-month period.
U.S. stocks gained while international stocks and bonds declined during the summer of 2018.
The U.S. economy strengthened during the summer months. Revised second-quarter GDP data released in August showed the U.S. economy growing at a 4.2% rate. After ticking up slightly in June, the unemployment rate in the U.S. was 3.9% in July and August, according to the U.S. Department of Labor. Wages showed more consistent growth than they had in recent quarters, and consumer confidence remained strong.
Several U.S. equity market indices reached records during August, with the S&P 500 Index gaining 7.76% for the three-month period that ended August 31, 2018. International stock values continued to suffer under the effects of a strong U.S. dollar and continuing trade tensions. The MSCI ACWI ex USA Index (Net) and the MSCI EM Index (Net) were down 4.70% and 1.64%, respectively, during the same three-month period.
The Fed increased the federal funds rate in June, and expectations grew that two more rate increases were in the offing in 2018. Long-term interest rates in the U.S. remained at higher levels relative to the prior 10 years. Rates on 10-year and 30-year Treasury bonds—2.46% and 2.81%, respectively, on January 1, 2018—were 2.86% and 3.02%, respectively, on August 31, off their peak levels on May 17, 2018, of 3.11% and 3.25%, respectively. Some investors became more aware of and concerned about the potential for an inverted yield curve—sometimes a recession signal—as short-term rates increased more quickly than long-term rates. The Fed decided to forgo an interest rate increase at its August meeting.
The S&P 500 Index closed the first quarter with a negative return, the first negative quarterly return for the index since 2014.
| 8 | The Consumer Price Index for All Urban Consumers (CPI-U) measures the changes in the price of a basket of goods and services purchased by urban consumers. The urban consumer population is deemed by many as a better representative measure of the general public because close to 90% of the country’s population lives in highly populated areas. You cannot invest directly in an index. |
| | | | |
| 4 | | Wells Fargo Conservative Income Fund | | Letter to shareholders (unaudited) |
Internationally, members of Prime Minister Theresa May’s U.K./Brexit negotiating team resigned amid unproductive negotiations. In early August, the BOE’s Monetary Policy Committee increased its key interest rate to 0.75%. Central banks in Europe and Japan maintained low interest rates and accommodative monetary policies. Amid rising trade uncertainty, the PBOC cut reserve requirement ratios and accelerated infrastructure spending and tax cuts for business enterprises and individuals. Nevertheless, a strengthening U.S. dollar and the trade tensions remained headwinds for investors overseas.
Don’t let short-term uncertainty derail long-term investment goals.
Periods of investment uncertainty can present challenges, but experience has taught us that maintaining long-term investment goals can be an effective way to plan for the future. To help you create a sound strategy based on your personal goals and risk tolerance, Wells Fargo Funds offers more than 100 mutual funds spanning a wide range of asset classes and investment styles. Although diversification cannot guarantee an investment profit or prevent losses, we believe it can be an effective way to manage investment risk and potentially smooth out overall portfolio performance. We encourage investors to know their investments and to understand that appropriate levels of risk-taking may unlock opportunities.
Thank you for choosing to invest with Wells Fargo Funds. We appreciate your confidence in us and remain committed to helping you meet your financial needs.
Sincerely,

Andrew Owen
President
Wells Fargo Funds
For further information about your Fund, contact your investment professional, visit our website at wellsfargofunds.com, or call us directly at 1-800-222-8222.
This page is intentionally left blank.
| | | | |
| 6 | | Wells Fargo Conservative Income Fund | | Performance highlights (unaudited) |
Investment objective
The Fund seeks current income consistent with capital preservation.
Manager
Wells Fargo Funds Management, LLC
Subadviser
Wells Capital Management Incorporated
Portfolio managers
Andrew M. Greenberg, CFA®
Anthony J. Melville, CFA®
Jeffrey L. Weaver, CFA®
Average annual total returns (%) as of August 31, 2018
| | | | | | | | | | | | | | | | | | | | | | |
| | | | | | | | | | | | | | Expense ratios1 (%) | |
| | | Inception date | | 1 year | | | 5 year | | | Since inception | | | Gross | | | Net2 | |
| Institutional Class (WCIIX) | | 5-31-2013 | | | 1.65 | | | | 0.93 | | | | 0.89 | | | | 0.36 | | | | 0.27 | |
| Bloomberg Barclays 6-9 Month Treasury Bill Index3 | | – | | | 1.29 | | | | 0.50 | | | | 0.48 | * | | | – | | | | – | |
| * | | Based on the inception date of Institutional Class. |
Figures quoted represent past performance, which is no guarantee of future results, and do not reflect taxes that a shareholder may pay on fund distributions or the redemption of fund shares. Investment return and principal value of an investment will fluctuate so that an investor’s shares, when redeemed, may be worth more or less than their original cost. Current performance may be lower or higher than the performance data quoted, which assumes the reinvestment of dividends and capital gains. Current month-end performance is available on the Fund’s website, wellsfargofunds.com.
Index returns do not include transaction costs associated with buying and selling securities, any mutual fund fees or expenses, or any taxes. It is not possible to invest directly in an index.
Institutional Class shares are sold without a front-end sales charge or contingent deferred sales charge.
Bond values fluctuate in response to the financial condition of individual issuers, general market and economic conditions, and changes in interest rates. Changes in market conditions and government policies may lead to periods of heightened volatility in the bond market and reduced liquidity for certain bonds held by the Fund. In general, when interest rates rise, bond values fall and investors may lose principal value. Interest rate changes and their impact on the Fund and its share price can be sudden and unpredictable. The use of derivatives may reduce returns and/or increase volatility. Certain investment strategies tend to increase the total risk of an investment (relative to the broader market). The Fund is exposed to foreign investment risk, mortgage- and asset-backed securities risk, and municipal securities risk. Consult the Fund’s prospectus for additional information on these and other risks.
Please see footnotes on page 7.
| | | | | | |
| Performance highlights (unaudited) | | Wells Fargo Conservative Income Fund | | | 7 | |
|
Growth of $1,000,000 investment as of August 31, 20184 |
|
 |
| 1 | Reflects the expense ratios as stated in the most recent prospectus. The expense ratios shown are subject to change and may differ from the annualized expense ratio shown in the financial highlights of this report. |
| 2 | The manager has contractually committed through December 31, 2018, to waive fees and/or reimburse expenses to the extent necessary to cap the Fund’s Total Annual Fund Operating Expenses After Fee Waivers at the amount shown. After this time, the cap may be increased or the commitment to maintain the cap may be terminated only with the approval of the Board of Trustees. Brokerage commissions, stamp duty fees, interest, taxes, acquired fund fees and expenses (if any), and extraordinary expenses are excluded from the expense cap. Without this cap, the Fund’s returns would have been lower. The expense ratio paid by an investor is the net expense ratio (the total annual fund operating expenses after fee waivers) as stated in the prospectus. |
| 3 | The Bloomberg Barclays 6-9 Month Treasury Bill Index includes all publicly issued zero-coupon U.S. Treasury bills that have a remaining maturity of less than nine months and more than six, are rated investment-grade, and have $250 million or more of outstanding face value. You cannot invest directly in an index. |
| 4 | The chart compares the performance of Institutional Class shares since inception with the performance of the Bloomberg Barclays 6-9 Month Treasury Bill Index. The chart assumes a hypothetical investment of $1,000,000 in Institutional Class shares and reflects all operating expenses. |
| 5 | The ten largest holdings, excluding cash, cash equivalents and any money market funds, are calculated based on the value of the investments divided by total net assets of the Fund. Holdings are subject to change and may have changed since the date specified. |
| 6 | The Bloomberg Barclays U.S. Aggregate Bond Index is a broad-based benchmark that measures the investment-grade, U.S. dollar–denominated, fixed-rate taxable bond market, including Treasuries, government-related and corporate securities, mortgage-backed securities (agency fixed-rate and hybrid adjustable-rate mortgage pass-throughs), asset-backed securities, and commercial mortgage-backed securities. You cannot invest directly in an index. |
| 7 | Amounts are calculated based on the total long-term investments of the Fund. These amounts are subject to change and may have changed since the date specified. |
| | | | |
| 8 | | Wells Fargo Conservative Income Fund | | Performance highlights (unaudited) |
MANAGER’S DISCUSSION
Fund highlights
| ∎ | | The Fund outperformed its benchmark, the Bloomberg Barclays 6–9 Month Treasury Bill Index, for the 12-month period that ended August 31, 2018. |
| ∎ | | The Fund is primarily invested in securities with a yield advantage over Treasuries, which added to performance. Corporate notes were the best-performing asset class within the portfolio, followed by commercial paper and asset-backed securities (ABS). |
| ∎ | | The Fund maintained a shorter duration throughout the past 12 months to minimize both interest rate risk and the volatility of the Fund’s net asset value (NAV). |
| | | | |
| Ten largest holdings (%) as of August 31, 20185 | |
Master Credit Card Trust Series 2017-1A Class A, 2.26%, 7-21-2021 | | | 1.86 | |
World Omni Auto Receivables Trust Series 2018-C Class A2, 2.80%, 1-18-2022 | | | 1.75 | |
Barclays Dryrock Issuance Trust Series 2014-3 Class A, 2.41%, 7-15-2022 | | | 1.74 | |
Verizon Owner Trust Series 2017-2A Class A, 1.92%, 12-20-2021 | | | 1.60 | |
Sumitomo Mitsui Trust Bank Limited, 3.24%, 10-18-2019 | | | 1.51 | |
Santander UK plc, 2.92%, 6-1-2021 | | | 1.51 | |
Bank of Montreal, 2.80%, 4-13-2021 | | | 1.51 | |
Colorado Tender Option Bond Trust Receipts/Certificates Series 2017-TPG007, 2.60%, 10-29-2027 | | | 1.50 | |
CarMax Auto Owner Trust Series 2018-3 Class A2A, 2.88%, 10-15-2021 | | | 1.49 | |
Ally Auto Receivables Trust Series 2017-3 Class A3, 1.74%, 9-15-2021 | | | 1.49 | |
Yield-advantaged sectors added value.
The largest allocation of the Fund was to corporate bonds. For the 12-month period that ended August 31, 2018, the segment of the Bloomberg Barclays U.S. Aggregate Bond Index6 that comprises one- to three-year credits rated A to AAA returned 34 basis points (bps; 100 bps equal 1.00%) of excess return versus comparable-maturity Treasuries, while the segment of the Bloomberg Barclays U.S. Aggregate Bond Index that comprises zero to three-year floating-rate note credits rated A to AAA had an excess return of 85 bps.
The Fund’s sector allocation changed during the year. The allocation to fixed-rate corporate positions decreased by 16%. These assets were redeployed to commercial paper in order to shorten the duration of the Fund. Floating-rate corporate exposure remained unchanged at 30%, and those securities were top performers as the London Interbank Offered Rate (LIBOR) increased by approximately 100 bps during the year. The increase in LIBOR translated into higher coupon resets of the floating-rate notes, many of which reset every quarter.
The Fund maintained significant exposure to AAA-rated ABS throughout the year. The Fund held both fixed-and floating-rate short-dated tranches (one-year weighted average life) across ABS sectors, with particular emphasis on senior classes in equipment and prime auto lease issuers. Sector fundamentals have been strong, and we continue to view the ABS sector as a defensive and liquid component of the Fund with a favorable profile.
|
| Portfolio allocation as of August 31, 20187 |
|
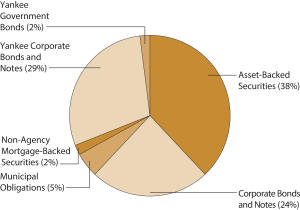 |
We kept duration relatively short due to concerns about higher interest rates.
The U.S. Federal Reserve (Fed) increased the federal funds rate by 25 bps three times during the reporting period, which caused short-term interest rates to move dramatically higher. During the 12-month period that ended August 31, 2018, 1-year Treasury bill yields rose 118 bps to yield 2.45%, 2-year Treasury note yields rose 128 bps to yield 2.63%, and 3-year Treasury note yields rose 123 bps to yield 2.69%.
Please see footnotes on page 7.
| | | | | | |
| Performance highlights (unaudited) | | Wells Fargo Conservative Income Fund | | | 9 | |
The Fund’s duration was shortened to 0.33 years from 0.42 years during the period. We expect to maintain the Fund’s duration with a similar target going forward due to the expectation that rates will continue to move higher.
We see opportunities ahead.
Looking forward, we believe the Fed will likely raise the federal funds rate by 25 bps two more times in 2018. In addition, we expect several more rate hikes in 2019. The corporate bond market is both technically and fundamentally strong. Larger-than-anticipated issuance in the month of August was easily absorbed, especially bonds with maturities shorter than three years.
Going forward, we expect second-half 2018 corporate bond issuance to be less than the first half of the year, with full-year 2018 issuance to be lower than 2017. ABS issuance increased in the first half of 2018 compared with the first half of 2017, resulting in more attractive spreads in the new-issue market compared with the secondary market. Increased demand for commercial paper, primarily from prime money market funds, put downward pressure on commercial paper rates. However, Fed rate hikes and increased Treasury bill issuance in the fourth quarter are expected to put upward pressure on commercial paper rates, which should contribute to the portfolio’s performance.
The duration of the Fund will likely be positioned in a conservative manner in an effort to minimize the volatility of its NAV. We continue to rely on our significant credit research capabilities to potentially avoid credit downgrades from companies that are likely to leverage their balance sheets as the result of merger and acquisition activity.
Please see footnotes on page 7.
| | | | |
| 10 | | Wells Fargo Conservative Income Fund | | Fund expenses (unaudited) |
As a shareholder of the Fund, you incur ongoing costs including management fees and other Fund expenses, This example is intended to help you understand your ongoing costs (in dollars) of investing in the Fund and to compare these costs with the ongoing costs of investing in other mutual funds.
The example is based on an investment of $1,000 invested at the beginning of the six-month period and held for the entire period from March 1, 2018 to August 31, 2018.
Actual expenses
The “Actual” line of the table below provides information about actual account values and actual expenses. You may use the information in this line, together with the amount you invested, to estimate the expenses that you paid over the period. Simply divide your account value by $1,000 (for example, an $8,600 account value divided by $1,000 = 8.6), then multiply the result by the number in the “Actual” line under the heading entitled “Expenses paid during period” for your applicable class of shares to estimate the expenses you paid on your account during this period.
Hypothetical example for comparison purposes
The “Hypothetical” line of the table below provides information about hypothetical account values and hypothetical expenses based on the Fund’s actual expense ratio and an assumed rate of return of 5% per year before expenses, which is not the Fund’s actual return. The hypothetical account values and expenses may not be used to estimate the actual ending account balance or expenses you paid for the period. You may use this information to compare the ongoing costs of investing in the Fund and other funds. To do so, compare this 5% hypothetical example with the 5% hypothetical examples that appear in the shareholder reports of the other funds.
Please note that the expenses shown in the table are meant to highlight your ongoing costs. Therefore, the “Hypothetical” line of the table is useful in comparing ongoing costs only and will not help you determine the relative total costs of owning different funds.
| | | | | | | | | | | | | | | | |
| | | Beginning
account value
3-1-2018 | | | Ending
account value
8-31-2018 | | | Expenses
paid during
the period¹ | | | Annualized net
expense ratio | |
Institutional Class | | | | | | | | | | | | | | | | |
Actual | | $ | 1,000.00 | | | $ | 1,010.86 | | | $ | 1.37 | | | | 0.27 | % |
Hypothetical (5% return before expenses) | | $ | 1,000.00 | | | $ | 1,023.84 | | | $ | 1.38 | | | | 0.27 | % |
| 1 | Expenses paid is equal to the annualized net expense ratio multiplied by the average account value over the period, multiplied by the number of days in the most recent fiscal half-year divided by the number of days in the fiscal year (to reflect the one-half-year period). |
| | | | | | |
| Portfolio of investments—August 31, 2018 | | Wells Fargo Conservative Income Fund | | | 11 | |
| | | | | | | | | | | | | | | | |
| Security name | | Interest rate | | | Maturity date | | | Principal | | | Value | |
|
Asset-Backed Securities: 24.14% | |
Ally Auto Receivables Trust Series 2017-3 Class A3 | | | 1.74 | % | | | 9-15-2021 | | | $ | 6,000,000 | | | $ | 5,944,530 | |
Ally Auto Receivables Trust Series 2018-2 Class A1 | | | 2.30 | | | | 5-15-2019 | | | | 2,199,367 | | | | 2,199,335 | |
Barclays Dryrock Issuance Trust Series 2014-3 Class A | | | 2.41 | | | | 7-15-2022 | | | | 7,000,000 | | | | 6,970,901 | |
CarMax Auto Owner Trust Series 2017-1 Class A3 | | | 1.98 | | | | 11-15-2021 | | | | 500,000 | | | | 496,016 | |
CarMax Auto Owner Trust Series 2018-3 Class A2A | | | 2.88 | | | | 10-15-2021 | | | | 5,950,000 | | | | 5,951,712 | |
CCG Receivables Trust Series 2018-2 Class A2 144A | | | 3.09 | | | | 12-15-2025 | | | | 4,460,000 | | | | 4,459,479 | |
Daimler Trucks Retail Trust Series 2018-1 Class A1 144A | | | 2.20 | | | | 4-15-2019 | | | | 240,650 | | | | 240,618 | |
Dell Equipment Finance Trust Series 2018-1 Class A2A 144A | | | 2.97 | | | | 10-22-2020 | | | | 1,250,000 | | | | 1,251,131 | |
GM Financial Automobile Leasing Trust Series 2011-1 Class A2A | | | 2.39 | | | | 4-20-2020 | | | | 2,873,760 | | | | 2,866,737 | |
GM Financial Automobile Leasing Trust Series 2018-2 Class A2A | | | 2.83 | | | | 7-20-2020 | | | | 3,600,000 | | | | 3,601,543 | |
Golden Credit Card Trust Series 2016-5A Class A 144A | | | 1.60 | | | | 9-15-2021 | | | | 2,000,000 | | | | 1,973,712 | |
Golden Credit Card Trust Series 2017-2A Class A 144A | | | 1.98 | | | | 4-15-2022 | | | | 5,000,000 | | | | 4,915,326 | |
Hertz Fleet Lease Funding LP Series 2017-1 Class A1 (1 Month LIBOR +0.65%) 144A± | | | 2.71 | | | | 4-10-2031 | | | | 1,776,295 | | | | 1,778,479 | |
Honda Auto Receivables Owner Trust Series 2018-1 Class A2 | | | 2.36 | | | | 6-15-2020 | | | | 2,000,000 | | | | 1,997,820 | |
Honda Auto Receivables Owner Trust Series 2018-2 Class A2 | | | 2.66 | | | | 12-18-2020 | | | | 1,000,000 | | | | 999,619 | |
Hyundai Auto Lease Securitization Trust Series 2017-B Class A3 144A | | | 1.97 | | | | 7-15-2020 | | | | 1,650,000 | | | | 1,638,828 | |
Hyundai Auto Lease Securitization Trust Series 2018-B Class A2 144A | | | 2.81 | | | | 12-15-2020 | | | | 5,000,000 | | | | 4,998,427 | |
Kubota Credit Owner Trust Series 2018-1A Class A1 144A | | | 2.37 | | | | 5-15-2019 | | | | 3,260,039 | | | | 3,260,124 | |
Master Credit Card Trust Series 2017-1A Class A 144A | | | 2.26 | | | | 7-21-2021 | | | | 7,500,000 | | | | 7,421,788 | |
Nissan Auto Receivables Owner Trust Series 2015-A Class A4 | | | 1.50 | | | | 9-15-2021 | | | | 3,000,000 | | | | 2,987,679 | |
Oscar US Funding Trust Series 2016-2A Class A2A 144A | | | 2.31 | | | | 11-15-2019 | | | | 101,050 | | | | 101,021 | |
Oscar US Funding Trust Series 2017-1A Class A2B (1 Month LIBOR +0.80%) 144A± | | | 2.86 | | | | 5-11-2020 | | | | 1,073,850 | | | | 1,075,057 | |
Oscar US Funding Trust Series 2017-2A Class A2A 144A | | | 2.13 | | | | 11-10-2020 | | | | 404,693 | | | | 403,062 | |
Oscar US Funding Trust Series 2018-1A Class A2B (1 Month LIBOR +0.49%) 144A± | | | 2.55 | | | | 4-12-2021 | | | | 2,000,000 | | | | 2,002,076 | |
Oscar US Funding Trust Series 2018-2A Class A2A 144A | | | 3.15 | | | | 8-10-2021 | | | | 3,645,000 | | | | 3,647,770 | |
Securitized Term Auto Receivables Trust Series 2017-2A Class A2A 144A | | | 1.78 | | | | 1-27-2020 | | | | 1,764,785 | | | | 1,759,686 | |
Tesla Auto Lease Trust Series 2018-A Class A 144A | | | 2.32 | | | | 12-20-2019 | | | | 1,087,059 | | | | 1,083,788 | |
Tesla Auto Lease Trust Series 2018-A Class C 144A | | | 2.97 | | | | 4-20-2020 | | | | 1,870,000 | | | | 1,862,426 | |
Verizon Owner Trust Series 2017-1A Class A 144A | | | 2.06 | | | | 9-20-2021 | | | | 1,000,000 | | | | 991,239 | |
Verizon Owner Trust Series 2017-2A Class A 144A | | | 1.92 | | | | 12-20-2021 | | | | 6,500,000 | | | | 6,416,452 | |
Volkswagen Auto Loan Enhanced Trust Series 2018-1 Class A2A | | | 2.81 | | | | 7-20-2021 | | | | 4,250,000 | | | | 4,254,967 | |
World Omni Auto Receivables Trust Series 2018-C Class A2 | | | 2.80 | | | | 1-18-2022 | | | | 7,000,000 | | | | 7,002,250 | |
| |
Total Asset-Backed Securities (Cost $96,589,441) | | | | 96,553,598 | |
| | | | | |
|
Corporate Bonds and Notes: 15.69% | |
|
Financials: 15.69% | |
|
| Banks: 4.76% | |
Bank of America Corporation (3 Month LIBOR +0.25%) ± | | | 2.56 | | | | 8-28-2020 | | | | 3,000,000 | | | | 3,001,848 | |
Citibank NA (3 Month LIBOR +0.57%) ± | | | 2.92 | | | | 7-23-2021 | | | | 5,500,000 | | | | 5,528,078 | |
Cooperatieve Rabobank UA (3 Month LIBOR +0.43%) ± | | | 2.76 | | | | 4-26-2021 | | | | 3,000,000 | | | | 3,004,293 | |
Credit Suisse | | | 2.30 | | | | 5-28-2019 | | | | 1,000,000 | | | | 997,508 | |
JPMorgan Chase Bank NA (3 Month LIBOR +0.23%) ± | | | 2.55 | | | | 9-1-2020 | | | | 2,500,000 | | | | 2,501,170 | |
JPMorgan Chase Bank NA (3 Month LIBOR +0.34%) ± | | | 2.67 | | | | 4-26-2021 | | | | 4,000,000 | | | | 4,003,472 | |
| | | | |
| | | | | | | | | | | | | | | 19,036,369 | |
| | | | | | | | | | | | | | | | |
|
| Capital Markets: 2.51% | |
Goldman Sachs Group Incorporated (3 Month LIBOR +1.04%) ± | | | 3.38 | | | | 4-25-2019 | | | | 4,000,000 | | | | 4,023,207 | |
Morgan Stanley (3 Month LIBOR +0.85%) ± | | | 3.19 | | | | 1-24-2019 | | | | 1,000,000 | | | | 1,003,134 | |
Morgan Stanley (3 Month LIBOR +1.38%) ± | | | 3.72 | | | | 2-1-2019 | | | | 5,000,000 | | | | 5,026,326 | |
| | | | |
| | | | | | | | | | | | | | | 10,052,667 | |
| | | | | | | | | | | | | | | | |
The accompanying notes are an integral part of these financial statements.
| | | | |
| 12 | | Wells Fargo Conservative Income Fund | | Portfolio of investments—August 31, 2018 |
| | | | | | | | | | | | | | | | |
| Security name | | Interest rate | | | Maturity date | | | Principal | | | Value | |
|
| Consumer Finance: 3.59% | |
BMW US Capital LLC (3 Month LIBOR +0.41%) 144A± | | | 2.75 | % | | | 9-13-2019 | | | $ | 2,000,000 | | | $ | 2,006,868 | |
BMW US Capital LLC (3 Month LIBOR +0.50%) 144A± | | | 2.82 | | | | 8-13-2021 | | | | 2,325,000 | | | | 2,333,251 | |
Daimler Finance North America LLC (3 Month LIBOR +0.53%) 144A± | | | 2.87 | | | | 5-5-2020 | | | | 4,000,000 | | | | 4,013,261 | |
Nissan Motor Acceptance Corporation (3 Month LIBOR +0.52%) 144A± | | | 2.86 | | | | 3-15-2021 | | | | 3,000,000 | | | | 3,006,986 | |
Nissan Motor Acceptance Corporation (3 Month LIBOR +1.01%) 144A± | | | 3.33 | | | | 3-8-2019 | | | | 3,000,000 | | | | 3,013,315 | |
| | | | |
| | | | | | | | | | | | | | | 14,373,681 | |
| | | | | | | | | | | | | | | | |
|
| Insurance: 4.83% | |
AIG Global Funding (3 Month LIBOR +0.46%) 144A± | | | 2.80 | | | | 6-25-2021 | | | | 2,950,000 | | | | 2,955,223 | |
Jackson National Life Insurance Company (3 Month LIBOR +0.48%) 144A± | | | 2.81 | | | | 6-11-2021 | | | | 2,525,000 | | | | 2,530,365 | |
Metropolitan Life Global Funding I (3 Month LIBOR +0.22%) 144A± | | | 2.55 | | | | 9-19-2019 | | | | 3,000,000 | | | | 3,005,414 | |
Metropolitan Life Global Funding I (3 Month LIBOR +0.40%) 144A± | | | 2.73 | | | | 6-12-2020 | | | | 3,000,000 | | | | 3,014,948 | |
New York Life Global Funding (3 Month LIBOR +0.32%) 144A± | | | 2.66 | | | | 8-6-2021 | | | | 1,950,000 | | | | 1,954,037 | |
Protective Life Global Funding (3 Month LIBOR +0.52%) 144A± | | | 2.86 | | | | 6-28-2021 | | | | 5,000,000 | | | | 5,013,196 | |
The Allstate Corporation (3 Month LIBOR +0.43%) ± | | | 2.76 | | | | 3-29-2021 | | | | 825,000 | | | | 826,011 | |
| | | | |
| | | | | | | | | | | | | | | 19,299,194 | |
| | | | | | | | | | | | | | | | |
| |
Total Corporate Bonds and Notes (Cost $62,573,583) | | | | 62,761,911 | |
| | | | | |
|
Municipal Obligations: 3.04% | |
|
Colorado: 1.50% | |
|
| Health Revenue: 1.50% | |
Colorado Tender Option Bond Trust Receipts/Certificates Series 2017-TPG007 (Bank of America NA LIQ) 144Aø | | | 2.60 | | | | 10-29-2027 | | | | 6,000,000 | | | | 6,000,000 | |
| | | | | | | | | | | | | | | | |
|
Kentucky: 1.17% | |
|
| GO Revenue: 1.17% | |
Louisville Jefferson County KY Metropolitan Government Series A | | | 1.95 | | | | 12-1-2018 | | | | 4,690,000 | | | | 4,683,997 | |
| | | | | | | | | | | | | | | | |
|
Texas: 0.37% | |
|
| GO Revenue: 0.37% | |
Houston TX Taxable Pension Obligation Bonds Series 2017 | | | 2.20 | | | | 3-1-2019 | | | | 1,500,000 | | | | 1,496,865 | |
| | | | | | | | | | | | | | | | |
| |
Total Municipal Obligations (Cost $12,190,000) | | | | 12,180,862 | |
| | | | | |
|
| Non-Agency Mortgage-Backed Securities: 1.25% | |
NextGear Floorplan Master Trust Series 2018-1A Class A1 (1 Month LIBOR +0.64%) 144A± | | | 2.71 | | | | 2-15-2023 | | | | 5,000,000 | | | | 5,007,564 | |
| | | | | | | | | | | | | | | | |
| |
Total Non-Agency Mortgage-Backed Securities (Cost $5,000,000) | | | | 5,007,564 | |
| | | | | |
|
Yankee Corporate Bonds and Notes: 18.71% | |
|
Financials: 18.71% | |
|
| Banks: 17.12% | |
ABN AMRO Bank NV 144A | | | 2.10 | | | | 1-18-2019 | | | | 3,000,000 | | | | 2,993,184 | |
ABN AMRO Bank NV (3 Month LIBOR +0.57%) 144A± | | | 2.88 | | | | 8-27-2021 | | | | 2,675,000 | | | | 2,681,150 | |
Bank of Montreal (3 Month LIBOR +0.46%) ± | | | 2.80 | | | | 4-13-2021 | | | | 6,000,000 | | | | 6,028,657 | |
Barclays Bank plc (3 Month LIBOR +0.46%) ± | | | 2.79 | | | | 1-11-2021 | | | | 5,000,000 | | | | 5,004,657 | |
Barclays Bank plc | | | 6.75 | | | | 5-22-2019 | | | | 1,400,000 | | | | 1,438,635 | |
The accompanying notes are an integral part of these financial statements.
| | | | | | |
| Portfolio of investments—August 31, 2018 | | Wells Fargo Conservative Income Fund | | | 13 | |
| | | | | | | | | | | | | | | | |
| Security name | | Interest rate | | | Maturity date | | | Principal | | | Value | |
|
| Banks (continued) | |
BNP Paribas | | | 2.45 | % | | | 3-17-2019 | | | $ | 4,246,000 | | | $ | 4,244,667 | |
BNZ International Funding of London (3 Month LIBOR +0.70%) 144A± | | | 3.01 | | | | 2-21-2020 | | | | 1,750,000 | | | | 1,761,750 | |
Commonwealth Bank of Australia (3 Month LIBOR +0.40%) 144A± | | | 2.73 | | | | 9-18-2020 | | | | 3,000,000 | | | | 3,007,673 | |
HSBC Holdings plc (3 Month LIBOR +0.60%) ± | | | 2.92 | | | | 5-18-2021 | | | | 3,940,000 | | | | 3,951,744 | |
Mitsubishi UFJ Financial Group Incorporated (3 Month LIBOR +0.65%) ± | | | 2.98 | | | | 7-26-2021 | | | | 4,000,000 | | | | 4,018,567 | |
National Australia Bank (3 Month LIBOR +0.35%) 144A± | | | 2.69 | | | | 1-12-2021 | | | | 2,000,000 | | | | 2,001,891 | |
Rabobank Nederland NV (3 Month LIBOR +0.51%) ± | | | 2.85 | | | | 8-9-2019 | | | | 3,000,000 | | | | 3,012,749 | |
Santander UK plc (3 Month LIBOR +0.62%) ± | | | 2.92 | | | | 6-1-2021 | | | | 6,000,000 | | | | 6,031,339 | |
Sumitomo Mitsui Banking Corporation (3 Month LIBOR +0.31%) ± | | | 2.64 | | | | 10-18-2019 | | | | 2,600,000 | | | | 2,603,744 | |
Sumitomo Mitsui Banking Corporation (3 Month LIBOR +0.35%) ± | | | 2.69 | | | | 1-17-2020 | | | | 3,000,000 | | | | 3,007,458 | |
Sumitomo Mitsui Trust Bank Limited (3 Month LIBOR +0.91%) 144A± | | | 3.24 | | | | 10-18-2019 | | | | 6,000,000 | | | | 6,046,750 | |
Svenska Handelsbanken AB (3 Month LIBOR +0.47%) ± | | | 2.78 | | | | 5-24-2021 | | | | 5,500,000 | | | | 5,517,765 | |
The Bank of Nova Scotia (3 Month LIBOR +0.29%) ± | | | 2.63 | | | | 1-8-2021 | | | | 1,000,000 | | | | 999,553 | |
United Overseas Bank Limited (3 Month LIBOR +0.48%) 144A± | | | 2.83 | | | | 4-23-2021 | | | | 1,800,000 | | | | 1,803,202 | |
Westpac Banking Corporation (3 Month LIBOR +0.28%) ± | | | 2.59 | | | | 5-15-2020 | | | | 2,325,000 | | | | 2,328,389 | |
| | | | |
| | | | | | | | | | | | | | | 68,483,524 | |
| | | | | | | | | | | | | | | | |
|
| Capital Markets: 0.90% | |
Siemens Financieringsmaatschappij NV 144A | | | 2.20 | | | | 3-16-2020 | | | | 1,500,000 | | | | 1,482,413 | |
Siemens Financieringsmaatschappij NV (3 Month LIBOR +0.32%) 144A± | | | 2.65 | | | | 9-13-2019 | | | | 2,110,000 | | | | 2,116,467 | |
| | | | |
| | | | | | | | | | | | | | | 3,598,880 | |
| | | | | | | | | | | | | | | | |
|
| Diversified Financial Services: 0.69% | |
UBS AG (3 Month LIBOR +0.48%) 144A± | | | 2.80 | | | | 12-1-2020 | | | | 2,750,000 | | | | 2,754,392 | |
| | | | | | | | | | | | | | | | |
| |
Total Yankee Corporate Bonds and Notes (Cost $74,608,079) | | | | 74,836,796 | |
| | | | | |
|
| Yankee Government Bonds: 1.30% | |
Export-Import Bank of Korea | | | 2.88 | | | | 9-17-2018 | | | | 1,200,000 | | | | 1,199,980 | |
Export-Import Bank of Korea (3 Month LIBOR +0.70%) ± | | | 3.01 | | | | 5-26-2019 | | | | 4,000,000 | | | | 4,005,952 | |
| |
Total Yankee Government Bonds (Cost $5,200,439) | | | | 5,205,932 | |
| | | | | |
|
Short-Term Investments: 37.32% | |
|
| Commercial Paper: 37.29% | |
American Honda Finance Corporation (z) | | | 2.01 | | | | 10-23-2018 | | | | 10,000,000 | | | | 9,969,083 | |
Antalis SA 144A(z)(p) | | | 2.45 | | | | 1-10-2019 | | | | 3,000,000 | | | | 2,974,062 | |
Apple Incorporated 144A(z) | | | 1.90 | | | | 10-11-2018 | | | | 2,530,000 | | | | 2,524,237 | |
Atlantic Asset Securitization LLC 144A(z)(p) | | | 2.11 | | | | 10-9-2018 | | | | 2,550,000 | | | | 2,544,215 | |
Atlantic Asset Securitization LLC (z)(p) | | | 2.26 | | | | 11-16-2018 | | | | 2,750,000 | | | | 2,736,860 | |
CDP Financial Incorporated 144A(z) | | | 2.04 | | | | 10-26-2018 | | | | 5,000,000 | | | | 4,983,846 | |
CNPC Finance Hong Kong Limited 144A(z) | | | 0.73 | | | | 9-6-2018 | | | | 9,800,000 | | | | 9,796,572 | |
CNPC Finance Hong Kong Limited 144A(z) | | | 2.10 | | | | 9-4-2018 | | | | 2,500,000 | | | | 2,499,418 | |
CRC Funding LLC 144A(z)(p) | | | 0.97 | | | | 9-7-2018 | | | | 6,000,000 | | | | 5,997,713 | |
CRC Funding LLC 144A(z)(p) | | | 2.17 | | | | 12-3-2018 | | | | 4,000,000 | | | | 3,976,228 | |
Crown Point Capital Company LLC 144A(z)(p) | | | 2.13 | | | | 10-12-2018 | | | | 1,650,000 | | | | 1,645,915 | |
Grand China Air Limited Hong Kong Limited (z) | | | 1.16 | | | | 9-7-2018 | | | | 1,850,000 | | | | 1,849,284 | |
Grand China Air Limited Hong Kong Limited (z) | | | 1.87 | | | | 9-13-2018 | | | | 3,150,000 | | | | 3,147,716 | |
Great Bridge Capital Company LLC 144A(z)(p) | | | 1.92 | | | | 10-3-2018 | | | | 1,500,000 | | | | 1,497,085 | |
Kaiser Foundation Hospitals (z) | | | 0.78 | | | | 9-6-2018 | | | | 8,300,000 | | | | 8,297,027 | |
The accompanying notes are an integral part of these financial statements.
| | | | |
| 14 | | Wells Fargo Conservative Income Fund | | Portfolio of investments—August 31, 2018 |
| | | | | | | | | | | | | | | | |
| Security name | | Interest rate | | | Maturity date | | | Principal | | | Value | |
|
| Commercial Paper (continued) | |
La Fayette Asset Securitization LLC 144A(z)(p) | | | 0.90 | % | | | 9-7-2018 | | | $ | 10,500,000 | | | $ | 10,495,937 | |
Lexington Parker Capital Company LLC 144A(z)(p) | | | 0.91 | | | | 9-7-2018 | | | | 7,000,000 | | | | 6,997,265 | |
LMA Americas LLC 144A(z)(p) | | | 1.53 | | | | 9-12-2018 | | | | 2,500,000 | | | | 2,498,363 | |
LMA Americas LLC 144A(z)(p) | | | 2.27 | | | | 12-6-2018 | | | | 5,000,000 | | | | 4,969,162 | |
Metlife Funding Incorporated (z) | | | 1.99 | | | | 11-14-2018 | | | | 5,000,000 | | | | 4,977,604 | |
Mountcliff Funding 144A(z)(p) | | | 1.34 | | | | 9-10-2018 | | | | 11,000,000 | | | | 10,993,892 | |
National Securities Clearing Corporation 144A(z) | | | 1.98 | | | | 10-12-2018 | | | | 1,800,000 | | | | 1,795,737 | |
Old Line Funding LLC (1 Month LIBOR +0.20%) 144A±(p) | | | 2.27 | | | | 11-9-2018 | | | | 7,000,000 | | | | 7,002,835 | |
Ontario Teachers’ Finance Trust 144A(z) | | | 2.30 | | | | 10-29-2018 | | | | 6,000,000 | | | | 5,978,986 | |
Thunder Bay Funding LLC 144A(z)(p) | | | 2.14 | | | | 10-22-2018 | | | | 10,300,000 | | | | 10,268,266 | |
Total Capital Canada Limited 144A(z) | | | 1.97 | | | | 10-16-2018 | | | | 7,800,000 | | | | 7,779,160 | |
Total Capital Canada Limited 144A(z) | | | 2.02 | | | | 10-24-2018 | | | | 3,000,000 | | | | 2,990,388 | |
Toyota Industries Commercial Finance Incorporated (z) | | | 1.77 | | | | 9-24-2018 | | | | 5,000,000 | | | | 4,993,520 | |
Victory Receivables Corporation 144A(z)(p) | | | 1.81 | | | | 10-2-2018 | | | | 3,000,000 | | | | 2,994,507 | |
| | | | |
| | | | | | | | | | | | | | | 149,174,883 | |
| | | | | | | | | | | | | | | | |
| | | | |
| | | Yield | | | | | | Shares | | | | |
| Investment Companies: 0.03% | |
Wells Fargo Government Money Market Fund Select Class (l)(u) | | | 1.87 | | | | | | | | 96,943 | | | | 96,943 | |
| | | | | | | | | | | | | | | | |
| |
Total Short-Term Investments (Cost $149,288,069) | | | | 149,271,826 | |
| | | | | |
| | | | | | | | |
| Total investments in securities (Cost $405,449,611) | | | 101.45 | % | | | 405,818,489 | |
Other assets and liabilities, net | | | (1.45 | ) | | | (5,816,131 | ) |
| | | | | | | | |
| Total net assets | | | 100.00 | % | | $ | 400,002,358 | |
| | | | | | | | |
| 144A | The security may be resold in transactions exempt from registration, normally to qualified institutional buyers, pursuant to Rule 144A under the Securities Act of 1933. |
| ± | Variable rate investment. The rate shown is the rate in effect at period end. |
| ø | Variable rate demand notes are subject to a demand feature which reduces the effective maturity. The maturity date shown represents the final maturity date of the security. The interest rate is determined and reset by the issuer daily, weekly, or monthly depending upon the terms of the security. The rate shown is the rate in effect at period end. |
| (z) | Zero coupon security. The rate represents the current yield to maturity. |
| (p) | Asset-backed commercial paper |
| (l) | The issuer of the security is an affiliated person of the Fund as defined in the Investment Company Act of 1940. |
| (u) | The rate represents the 7-day annualized yield at period end. |
Abbreviations:
| LIBOR | London Interbank Offered Rate |
The accompanying notes are an integral part of these financial statements.
| | | | | | |
| Portfolio of investments—August 31, 2018 | | Wells Fargo Conservative Income Fund | | | 15 | |
Investments in Affiliates
An affiliated investment is an investment in which the Fund owns at least 5% of the outstanding voting shares of the issuer or as a result of other relationships, such as the Fund and the issuer having the same investment manager. Transactions with issuers that were either affiliated persons of the Fund at the beginning of the period or the end of the period were as follows:
| | | | | | | | | | | | | | | | | | | | | | | | | | | | | | | | | | | | |
| | | Shares,
beginning of
period | | | Shares
purchased | | | Shares
sold | | | Shares,
end of
period | | | Net
realized
gains
(losses) | | | Net
change in
unrealized
gains
(losses) | | | Income
from
affiliated
securities | | | Value,
end
of period | | | % of
net
assets | |
Short-Term Investments | | | | | | | | | | | | | | | | | | | | | | | | | | | | | | | | | | | | |
Investment Companies | | | | | | | | | | | | | | | | | | | | | | | | | | | | | | | | | | | | |
Wells Fargo Government Money Market Fund Select Class | | | 275,037 | | | | 214,328,174 | | | | 214,506,268 | | | | 96,943 | | | $ | 0 | | | $ | 0 | | | $ | 17,300 | | | $ | 96,943 | | | | 0.03 | % |
The accompanying notes are an integral part of these financial statements.
| | | | |
| 16 | | Wells Fargo Conservative Income Fund | | Statement of assets and liabilities—August 31, 2018 |
| | | | |
| | | | |
|
Assets | |
Investments in unaffiliated securities, at value (cost $405,352,668) | | $ | 405,721,546 | |
Investments in affiliated securities, at value (cost $96,943) | | | 96,943 | |
Receivable for investments sold | | | 1,891,184 | |
Receivable for interest | | | 851,613 | |
Prepaid expenses and other assets | | | 53,499 | |
| | | | |
Total assets | | | 408,614,785 | |
| | | | |
|
Liabilities | |
Payable for Fund shares redeemed | | | 8,412,769 | |
Dividends payable | | | 102,031 | |
Management fee payable | | | 45,372 | |
Administration fee payable | | | 31,023 | |
Trustees’ fees and expenses payable | | | 1,982 | |
Accrued expenses and other liabilities | | | 19,250 | |
| | | | |
Total liabilities | | | 8,612,427 | |
| | | | |
Total net assets | | $ | 400,002,358 | |
| | | | |
|
NET ASSETS CONSIST OF | |
Paid-in capital | | $ | 400,406,231 | |
Undistributed net investment income | | | 4,184 | |
Accumulated net realized losses on investments | | | (776,935 | ) |
Net unrealized gains on investments | | | 368,878 | |
| | | | |
Total net assets | | $ | 400,002,358 | |
| | | | |
|
COMPUTATION OF NET ASSET VALUE PER SHARE | |
Net assets – Institutional Class | | $ | 400,002,358 | |
Shares outstanding – Institutional Class1 | | | 40,033,643 | |
Net asset value per share – Institutional Class | | | $9.99 | |
| 1 | The Fund has an unlimited number of authorized shares |
The accompanying notes are an integral part of these financial statements.
| | | | | | |
| Statement of operations—year ended August 31, 2018 | | Wells Fargo Conservative Income Fund | | | 17 | |
| | | | |
| | | | |
| |
Investment income | | | | |
Interest (net of foreign interest withholding taxes of $1,106) | | $ | 9,702,101 | |
Income from affiliated securities | | | 17,300 | |
| | | | |
Total investment income | | | 9,719,401 | |
| | | | |
| |
Expenses | | | | |
Management fee | | | 1,181,951 | |
Administration fee | | | | |
Institutional Class | | | 378,224 | |
Custody and accounting fees | | | 29,436 | |
Professional fees | | | 45,082 | |
Registration fees | | | 64,889 | |
Shareholder report expenses | | | 8,603 | |
Trustees’ fees and expenses | | | 18,731 | |
Other fees and expenses | | | 6,182 | |
| | | | |
Total expenses | | | 1,733,098 | |
Less: Fee waivers and/or expense reimbursements | | | (456,592 | ) |
| | | | |
Net expenses | | | 1,276,506 | |
| | | | |
Net investment income | | | 8,442,895 | |
| | | | |
| |
REALIZED AND UNREALIZED GAINS (LOSSES) ON INVESTMENTS | | | | |
Net realized losses on investments | | | (776,935 | ) |
Net change in unrealized gains (losses) on investments | | | (313,636 | ) |
| | | | |
Net realized and unrealized gains (losses) on investments | | | (1,090,571 | ) |
| | | | |
Net increase in net assets resulting from operations | | $ | 7,352,324 | |
| | | | |
The accompanying notes are an integral part of these financial statements.
| | | | |
| 18 | | Wells Fargo Conservative Income Fund | | Statement of changes in net assets |
| | | | | | | | | | | | | | | | |
| | | Year ended
August 31, 2018 | | | Year ended
August 31, 2017 | |
| | | | |
Operations | | | | | | | | | | | | | | | | |
Net investment income | | | | | | $ | 8,442,895 | | | | | | | $ | 5,763,414 | |
Net realized gains (losses) on investments | | | | | | | (776,935 | ) | | | | | | | 376,009 | |
Net change in unrealized gains (losses) on investments | | | | | | | (313,636 | )�� | | | | | | | (76,758 | ) |
| | | | |
Net increase in net assets resulting from operations | | | | | | | 7,352,324 | | | | | | | | 6,062,665 | |
| | | | |
| | | | |
Distributions to shareholders from | | | | | | | | | | | | | | | | |
Net investment income | | | | | | | | | | | | | | | | |
Institutional Class | | | | | | | (8,443,388 | ) | | | | | | | (5,765,706 | ) |
Net realized gains | | | | | | | | | | | | | | | | |
Institutional Class | | | | | | | (148,163 | ) | | | | | | | 0 | |
| | | | |
Total distributions to shareholders | | | | | | | (8,591,551 | ) | | | | | | | (5,765,706 | ) |
| | | | |
| | | | |
Capital share transactions | | | Shares | | | | | | | | Shares | | | | | |
Proceeds from shares sold – Institutional Class | | | 50,241,480 | | | | 502,485,302 | | | | 32,361,100 | | | | 323,882,718 | |
Reinvestment of distributions – Institutional Class | | | 739,437 | | | | 7,389,754 | | | | 500,446 | | | | 5,007,754 | |
Payment for shares redeemed – Institutional Class | | | (52,808,731 | ) | | | (527,872,511 | ) | | | (45,740,798 | ) | | | (457,777,428 | ) |
| | | | |
Net decrease in net assets resulting from capital share transactions | | | | | | | (17,997,455 | ) | | | | | | | (128,886,956 | ) |
| | | | |
Total decrease in net assets | | | | | | | (19,236,682 | ) | | | | | | | (128,589,997 | ) |
| | | | |
| | | | |
Net assets | | | | | | | | | | | | | | | | |
Beginning of period | | | | | | | 419,239,040 | | | | | | | | 547,829,037 | |
| | | | |
End of period | | | | | | $ | 400,002,358 | | | | | | | $ | 419,239,040 | |
| | | | |
Undistributed net investment income | | | | | | $ | 4,184 | | | | | | | $ | 5,094 | |
| | | | |
The accompanying notes are an integral part of these financial statements.
| | | | | | |
| Financial highlights | | Wells Fargo Conservative Income Fund | | | 19 | |
(For a share outstanding throughout each period)
| | | | | | | | | | | | | | | | | | | | |
| | | Year ended August 31 | |
| INSTITUTIONAL CLASS | | 2018 | | | 2017 | | | 2016 | | | 2015 | | | 2014 | |
Net asset value, beginning of period | | | $10.01 | | | | $10.01 | | | | $10.00 | | | | $10.02 | | | | $9.99 | |
Net investment income | | | 0.18 | | | | 0.12 | | | | 0.07 | | | | 0.05 | | | | 0.04 | |
Net realized and unrealized gains (losses) on investments | | | (0.02 | ) | | | 0.00 | 1 | | | 0.01 | | | | (0.02 | ) | | | 0.03 | |
| | | | | | | | | | | | | | | | | | | | |
Total from investment operations | | | 0.16 | | | | 0.12 | | | | 0.08 | | | | 0.03 | | | | 0.07 | |
Distributions to shareholders from | | | | | | | | | | | | | | | | | | | | |
Net investment income | | | (0.18 | ) | | | (0.12 | ) | | | (0.07 | ) | | | (0.05 | ) | | | (0.04 | ) |
Net realized gains | | | (0.00 | )1 | | | 0.00 | | | | 0.00 | | | | (0.00 | )1 | | | (0.00 | )1 |
| | | | | | | | | | | | | | | | | | | | |
Total distributions to shareholders | | | (0.18 | ) | | | (0.12 | ) | | | (0.07 | ) | | | (0.05 | ) | | | (0.04 | ) |
Net asset value, end of period | | | $9.99 | | | | $10.01 | | | | $10.01 | | | | $10.00 | | | | $10.02 | |
Total return | | | 1.65 | % | | | 1.20 | % | | | 0.79 | % | | | 0.28 | % | | | 0.74 | % |
Ratios to average net assets (annualized) | | | | | | | | | | | | | | | | | | | | |
Gross expenses | | | 0.37 | % | | | 0.36 | % | | | 0.36 | % | | | 0.38 | % | | | 0.43 | % |
Net expenses | | | 0.27 | % | | | 0.27 | % | | | 0.27 | % | | | 0.27 | % | | | 0.27 | % |
Net investment income | | | 1.79 | % | | | 1.17 | % | | | 0.72 | % | | | 0.48 | % | | | 0.44 | % |
Supplemental data | | | | | | | | | | | | | | | | | | | | |
Portfolio turnover rate | | | 197 | % | | | 197 | % | | | 269 | % | | | 80 | % | | | 55 | % |
Net assets, end of period (000s omitted) | | | $400,002 | | | | $419,239 | | | | $547,829 | | | | $336,608 | | | | $143,418 | |
| 1 | Amount is less than $0.005. |
The accompanying notes are an integral part of these financial statements.
| | | | |
| 20 | | Wells Fargo Conservative Income Fund | | Notes to financial statements |
1. ORGANIZATION
Wells Fargo Funds Trust (the “Trust”), a Delaware statutory trust organized on March 10, 1999, is an open-end management investment company registered under the Investment Company Act of 1940, as amended (the “1940 Act”). As an investment company, the Trust follows the accounting and reporting guidance in Financial Accounting Standards Board (“FASB”) Accounting Standards Codification Topic 946, Financial Services – Investment Companies. These financial statements report on the Wells Fargo Conservative Income Fund (the “Fund”) which is a diversified series of the Trust.
2. SIGNIFICANT ACCOUNTING POLICIES
The following significant accounting policies, which are consistently followed in the preparation of the financial statements of the Fund, are in conformity with U.S. generally accepted accounting principles which require management to make estimates and assumptions that affect the reported amounts of assets and liabilities, disclosure of contingent assets and liabilities at the date of the financial statements, and the reported amounts of revenues and expenses during the reporting period. Actual results could differ from those estimates.
Securities valuation
All investments are valued each business day as of the close of regular trading on the New York Stock Exchange (generally 4 p.m. Eastern Time), although the Fund may deviate from this calculation time under unusual or unexpected circumstances.
Debt securities are valued at the evaluated bid price provided by an independent pricing service or, if a reliable price is not available, the quoted bid price from an independent broker-dealer.
Futures contracts that are listed on a foreign or domestic exchange or market are valued at the official closing price or, if none, the last sales price.
Investments in registered open-end investment companies are valued at net asset value.
Investments which are not valued using any of the methods discussed above are valued at their fair value, as determined in good faith by the Board of Trustees of the Fund. The Board of Trustees has established a Valuation Committee comprised of the Trustees and has delegated to it the authority to take any actions regarding the valuation of portfolio securities that the Valuation Committee deems necessary or appropriate, including determining the fair value of portfolio securities, unless the determination has been delegated to the Wells Fargo Asset Management Pricing Committee at Wells Fargo Funds Management, LLC (“Funds Management”). The Board of Trustees retains the authority to make or ratify any valuation decisions or approve any changes to the Valuation Procedures as it deems appropriate. On a quarterly basis, the Board of Trustees receives reports on any valuation actions taken by the Valuation Committee or the Wells Fargo Asset Management Pricing Committee which may include items for ratification.
Valuations of fair valued securities are compared to the next actual sales price when available, or other appropriate market values, to assess the continued appropriateness of the fair valuation methodologies used. These securities are fair valued on a day-to-day basis, taking into consideration changes to appropriate market information and any significant changes to the inputs considered in the valuation process until there is a readily available price provided on an exchange or by an independent pricing service. Valuations received from an independent pricing service or independent broker-dealer quotes are periodically validated by comparisons to most recent trades and valuations provided by other independent pricing services in addition to the review of prices by the manager and/or subadviser. Unobservable inputs used in determining fair valuations are identified based on the type of security, taking into consideration factors utilized by market participants in valuing the investment, knowledge about the issuer and the current market environment.
When-issued transactions
The Fund may purchase securities on a forward commitment or when-issued basis. The Fund records a when-issued transaction on the trade date and will segregate assets in an amount at least equal in value to the Fund’s commitment to purchase when-issued securities. Securities purchased on a when-issued basis are marked-to-market daily and the Fund begins earning interest on the settlement date. Losses may arise due to changes in the market value of the underlying securities or if the counterparty does not perform under the contract.
Futures contracts
The Fund is subject to interest rate risk in the normal course of pursuing its investment objectives. Futures contracts are agreements between the Fund and a counterparty to buy or sell a specific amount of a commodity, financial instrument or currency at specified price and on a specified date. The Fund may buy and sell futures contracts in order to gain exposure to, or protect against, changes in interest rates. The primary risks associated with the use of futures contracts are the imperfect correlation between changes in market values of securities held by the Fund and the prices of futures
| | | | | | |
| Notes to financial statements | | Wells Fargo Conservative Income Fund | | | 21 | |
contracts, and the possibility of an illiquid market. Futures contracts are generally entered into on a regulated futures exchange and cleared through a clearinghouse associated with the exchange. With futures contracts, there is minimal counterparty risk to the Fund since futures contracts are exchange traded and the exchange’s clearinghouse, as counterparty to all exchange traded futures, guarantees the futures contracts against default.
Upon entering into a futures contracts, the Fund is required to deposit either cash or securities (initial margin) with the broker in an amount equal to a certain percentage of the contract value. Subsequent payments (variation margin) are paid to or from the broker each day equal to the daily changes in the contract value. Such payments are recorded as unrealized gains or losses and, if any, shown as variation margin receivable (payable) in the Statement of Assets and Liabilities. Should the Fund fail to make requested variation margin payments, the broker can gain access to the initial margin to satisfy the Fund’s payment obligations. When the contracts are closed, a realized gain or loss is recorded in the Statement of Operations.
Security transactions and income recognition
Securities transactions are recorded on a trade date basis. Realized gains or losses are recorded on the basis of identified cost.
Interest income is accrued daily and bond discounts are accreted and premiums are amortized daily. To the extent debt obligations are placed on non-accrual status, any related interest income may be reduced by writing off interest receivables when the collection of all or a portion of interest has been determined to be doubtful based on consistently applied procedures and the fair value has decreased. If the issuer subsequently resumes interest payments or when the collectability of interest is reasonably assured, the debt obligation is removed from non-accrual status.
Income is recorded net of foreign taxes withheld where recovery of such taxes is not assured.
Distributions to shareholders
Distributions to shareholders from net investment income are declared daily and paid monthly. Distributions from net realized gains, if any, are recorded on the ex-dividend date and paid at least annually. Such distributions are determined in accordance with income tax regulations and may differ from U.S. generally accepted accounting principles. Dividend sources are estimated at the time of declaration. The tax character of distributions is determined as of the Fund’s fiscal year end. Therefore, a portion of the Fund’s distributions made prior to the Fund’s fiscal year end may be categorized as a tax return of capital at year end.
Federal and other taxes
The Fund intends to qualify as a regulated investment company by distributing substantially all of its investment company taxable income and any net realized capital gains (after reduction for capital loss carryforwards) sufficient to relieve it from all, or substantially all, federal income taxes. Accordingly, no provision for federal income taxes was required.
The Fund’s income and federal excise tax returns and all financial records supporting those returns for the fiscal years since commencement of operations will be subject to examination by the federal and Delaware revenue authorities. Management has analyzed the Fund’s tax positions taken on federal, state, and foreign tax returns for all open tax years and does not believe that there are any uncertain tax positions that require recognition of a tax liability.
As of August 31, 2018, the aggregate cost of all investments for federal income tax purposes was $405,454,355 and the unrealized gains (losses) consisted of:
| | | | |
Gross unrealized gains | | $ | 454,694 | |
Gross unrealized losses | | | (90,560 | ) |
Net unrealized gains | | $ | 364,134 | |
Reclassifications are made to the Fund’s capital accounts for permanent tax differences to reflect income and gains available for distribution (or available capital loss carryforwards) under federal income tax regulations. U.S. generally accepted accounting principles require that certain components of net assets be adjusted to reflect permanent differences between financial and tax reporting. These reclassifications have no effect on net assets or net asset values per share. At August 31, 2018, as a result of permanent book-to-tax differences, the following reclassification adjustments were made on the Statement of Assets and Liabilities:
| | |
Undistributed net
investment income | | Accumulated net
realized losses
on investments |
| $(417) | | $417 |
| | | | |
| 22 | | Wells Fargo Conservative Income Fund | | Notes to financial statements |
As of August 31, 2018, the Fund had a capital loss carryforward which consisted of $772,191 in short-term capital losses.
3. FAIR VALUATION MEASUREMENTS
Fair value measurements of investments are determined within a framework that has established a fair value hierarchy based upon the various data inputs utilized in determining the value of the Fund’s investments. The three-level hierarchy gives the highest priority to unadjusted quoted prices in active markets for identical assets or liabilities (Level 1) and the lowest priority to unobservable inputs (Level 3). The Fund’s investments are classified within the fair value hierarchy based on the lowest level of input that is significant to the fair value measurement. The inputs are summarized into three broad levels as follows:
| ∎ | | Level 1 – quoted prices in active markets for identical securities |
| ∎ | | Level 2 – other significant observable inputs (including quoted prices for similar securities, interest rates, prepayment speeds, credit risk, etc.) |
| ∎ | | Level 3 – significant unobservable inputs (including the Fund’s own assumptions in determining the fair value of investments) |
The inputs or methodologies used for valuing investments in securities are not necessarily an indication of the risk associated with investing in those securities.
The following is a summary of the inputs used in valuing the Fund’s assets and liabilities as of August 31, 2018:
| | | | | | | | | | | | | | | | |
| | | Quoted prices
(Level 1) | | | Other significant
observable inputs
(Level 2) | | | Significant
unobservable inputs (Level 3) | | | Total | |
|
Assets | | | | | | | | | | | | | | | | |
Investments in: |
| | | | |
Asset-backed securities | | $ | 0 | | | $ | 96,553,598 | | | $ | 0 | | | $ | 96,553,598 | |
| | | | |
Corporate bonds and notes | | | 0 | | | | 62,761,911 | | | | 0 | | | | 62,761,911 | |
| | | | |
Municipal obligations | | | 0 | | | | 12,180,862 | | | | 0 | | | | 12,180,862 | |
| | | | |
Non-agency mortgage-backed securities | | | | | | | 5,007,564 | | | | 0 | | | | 5,007,564 | |
| | | | |
Yankee corporate bonds and notes | | | 0 | | | | 74,836,796 | | | | 0 | | | | 74,836,796 | |
| | | | |
Yankee government bonds | | | 0 | | | | 5,205,932 | | | | 0 | | | | 5,205,932 | |
| | | | |
Short-term investments | | | | | | | | | | | | | | | | |
Commercial paper | | | 0 | | | | 149,174,883 | | | | 0 | | | | 149,174,883 | |
Investment companies | | | 96,943 | | | | 0 | | | | 0 | | | | 96,943 | |
Total assets | | $ | 96,943 | | | $ | 405,721,546 | | | $ | 0 | | | $ | 405,818,489 | |
Additional sector, industry or geographic detail is included in the Portfolio of Investments.
The Fund recognizes transfers between levels within the fair value hierarchy at the end of the reporting period. At August 31, 2018, the Fund did not have any transfers into/out of Level 1, Level 2, or Level 3.
4. TRANSACTIONS WITH AFFILIATES
Management fee
Funds Management, an indirect wholly owned subsidiary of Wells Fargo & Company (“Wells Fargo”), is the manager of the Fund and provides advisory and fund-level administrative services under an investment management agreement. Under the investment management agreement, Funds Management is responsible for, among other services, implementing the investment objectives and strategies of the Fund, supervising the subadviser and providing fund-level administrative services in connection with the Fund’s operations. As compensation for its services under the investment management agreement, Funds Management is entitled to receive an annual management fee starting at 0.25% and declining to 0.18% as the average daily net assets of the Fund increase. For the year ended August 31, 2018, the management fee was equivalent to an annual rate of 0.25% of the Fund’s average daily net assets.
| | | | | | |
| Notes to financial statements | | Wells Fargo Conservative Income Fund | | | 23 | |
Funds Management has retained the services of a subadviser to provide daily portfolio management to the Fund. The fee for subadvisory services is borne by Funds Management. Wells Capital Management Incorporated, an affiliate of Funds Management and an indirect wholly owned subsidiary of Wells Fargo, is the subadviser to the Fund and is entitled to receive a fee from Funds Management at an annual rate starting at 0.10% and declining to 0.05% as the average daily net assets of the Fund increase.
Administration fees
Under a class-level administration agreement, Funds Management provides class-level administrative services to the Fund, which includes paying fees and expenses for services provided by the transfer agent, sub-transfer agents, omnibus account servicers and record-keepers. As compensation for its services under the class-level administration agreement, Funds Management receives an annual fee of 0.08% which is calculated based on the average daily net assets of the Institutional Class.
Funds Management has contractually waived and/or reimbursed management and administration fees to the extent necessary to maintain certain net operating expense ratios for the Fund. When each class of the Fund has exceeded its expense cap, Funds Management has waived fees and/or reimbursed expenses from fund level expenses on a proportionate basis and then from class specific expenses; otherwise, waivers and/or reimbursements are applied against class specific expenses before fund level expenses. Funds Management has committed through December 31, 2018 to waive fees and/or reimburse expenses to the extent necessary to cap the Fund’s expenses at 0.27% for Institutional Class shares. After this time, the cap may be increased or the commitment to maintain the cap may be terminated only with the approval of the Board of Trustees.
Interfund transactions
The Fund may purchase or sell portfolio investment securities to certain other Wells Fargo affiliates pursuant to Rule 17a-7 under the 1940 Act and under procedures adopted by the Board of Trustees. The procedures have been designed to ensure that these interfund transactions, which do not incur broker commissions, are effected at current market prices.
5. INVESTMENT PORTFOLIO TRANSACTIONS
Purchases and sales of investments, excluding U.S. government obligations (if any) and short-term securities, for the year ended August 31, 2018 were $664,190,489 and $766,510,974, respectively.
6. BANK BORROWINGS
The Trust (excluding the money market funds), Wells Fargo Master Trust and Wells Fargo Variable Trust are parties to a $280,000,000 revolving credit agreement whereby the Fund is permitted to use bank borrowings for temporary or emergency purposes, such as to fund shareholder redemption requests. Interest under the credit agreement is charged to the Fund based on a borrowing rate equal to the higher of the Federal Funds rate in effect on that day plus 1.25% or the overnight LIBOR rate in effect on that day plus 1.25%. In addition, an annual commitment fee equal to 0.25% of the unused balance is allocated to each participating fund.
For the year ended August 31, 2018, there were no borrowings by the Fund under the agreement.
7. DISTRIBUTIONS TO SHAREHOLDERS
The tax character of distributions paid during the years ended August 31, 2018 and August 31, 2017 were as follows:
| | | | | | | | |
| | | Year ended August 31 | |
| | | 2018 | | | 2017 | |
Ordinary income | | $ | 8,572,794 | | | $ | 5,765,706 | |
Long-term capital gain | | | 18,757 | | | | 0 | |
As of August 31, 2018, the components of distributable earnings on a tax basis were as follows:
| | | | |
Undistributed
ordinary
income | | Unrealized
gains | | Capital loss
carryforward |
| $106,215 | | $364,134 | | $(772,191) |
| | | | |
| 24 | | Wells Fargo Conservative Income Fund | | Notes to financial statements |
8. INDEMNIFICATION
Under the Trust’s organizational documents, the officers and Trustees have been granted certain indemnification rights against certain liabilities that may arise out of performance of their duties to the Trust. Additionally, in the normal course of business, the Trust may enter into contracts with service providers that contain a variety of indemnification clauses. The Trust’s maximum exposure under these arrangements is dependent on future claims that may be made against the Fund and, therefore, cannot be estimated.
9. NEW ACCOUNTING PRONOUNCEMENTS AND REGULATORY CHANGES
On August 17, 2018, the Securities and Exchange Commission (“SEC”) adopted Disclosure Update and Simplification, which amends certain disclosure requirements. The amendments are effective for filings subsequent to November 5, 2018. Management expects these amendments will impact the classification of disclosures in the financial statements.
In August 2018, FASB issued Accounting Standards Update (“ASU”) No. 2018-13, Fair Value Measurement (Topic 820) Disclosure Framework—Changes to the Disclosure Requirements for Fair Value Measurement. ASU 2018-13 updates the disclosure requirements for fair value measurements by modifying or removing certain disclosures and adding certain new disclosures. The amendments are effective for fiscal years, and interim periods within those fiscal years, beginning after December 15, 2019. Early adoption is permitted. Management is currently evaluating the potential impact of this new guidance to the financial statements.
In March 2017, FASB issued ASU No. 2017-08, Premium Amortization on Purchased Callable Debt Securities. ASU 2017-08 shortens the amortization period for certain callable debt securities held at a premium. The amendments require the premium to be amortized to the earliest call date. The amendments do not require an accounting change for securities held at a discount; the discount continues to be amortized to maturity. ASU 2017-08 is effective for fiscal years beginning after December 15, 2018 and for interim periods within those fiscal years. Management is currently evaluating the potential impact of this new guidance to the financial statements.
| | | | | | |
| Report of independent registered public accounting firm | | Wells Fargo Conservative Income Fund | | | 25 | |
BOARD OF TRUSTEES AND SHAREHOLDERS OF WELLS FARGO FUNDS TRUST:
Opinion on the Financial Statements
We have audited the accompanying statement of assets and liabilities of Wells Fargo Conservative Income Fund (the “Fund”), including the portfolio of investments, as of August 31, 2018, the related statement of operations for the year then ended, the statements of changes in net assets for each of the years in the two-year period then ended, and the related notes (collectively, the “financial statements”) and the financial highlights for each of the years in the five-year period then ended. In our opinion, the financial statements and financial highlights present fairly, in all material respects, the financial position of the Fund as of August 31, 2018, the results of its operations for the year then ended, the changes in its net assets for each of the years in the two-year period then ended, and the financial highlights for each of the years in the five-year period then ended, in conformity with U.S. generally accepted accounting principles.
Basis for Opinion
These financial statements and financial highlights are the responsibility of the Fund’s management. Our responsibility is to express an opinion on these financial statements and financial highlights based on our audits. We are a public accounting firm registered with the Public Company Accounting Oversight Board (United States) (“PCAOB”) and are required to be independent with respect to the Fund in accordance with the U.S. federal securities laws and the applicable rules and regulations of the Securities and Exchange Commission and the PCAOB.
We conducted our audits in accordance with the standards of the PCAOB. Those standards require that we plan and perform the audit to obtain reasonable assurance about whether the financial statements and financial highlights are free of material misstatement, whether due to error or fraud. Our audits included performing procedures to assess the risks of material misstatement of the financial statements and financial highlights, whether due to error or fraud, and performing procedures that respond to those risks. Such procedures included examining, on a test basis, evidence regarding the amounts and disclosures in the financial statements and financial highlights. Such procedures also included confirmation of securities owned as of August 31, 2018, by correspondence with the custodian and brokers, or by other appropriate auditing procedures. Our audits also included evaluating the accounting principles used and significant estimates made by management, as well as evaluating the overall presentation of the financial statements and financial highlights. We believe that our audits provide a reasonable basis for our opinion.

We have not been able to determine the specific year that we began serving as the auditor of one or more Wells Fargo Funds investment companies, however we are aware that we have served as the auditor of one or more Wells Fargo Funds investment companies since at least 1955.
Boston, Massachusetts
October 26, 2018
| | | | |
| 26 | | Wells Fargo Conservative Income Fund | | Other information (unaudited) |
TAX INFORMATION
Pursuant to Section 852 of the Internal Revenue Code, $18,757 was designated as a 20% rate gain distribution for the fiscal year ended August 31, 2018.
For the fiscal year ended August 31, 2018, $5,784,199 has been designated as interest-related dividends for nonresident alien shareholders pursuant to Section 871 of the Internal Revenue Code.
For the fiscal year ended August 31, 2018, $128,989 has been designated as short-term capital gain dividends for nonresident alien shareholders pursuant to Section 871 of the Internal Revenue Code.
PROXY VOTING INFORMATION
A description of the policies and procedures that the Fund uses to determine how to vote proxies relating to portfolio securities is available, upon request, by calling 1-800-222-8222, visiting our website at wellsfargofunds.com, or visiting the SEC website at sec.gov. Information regarding how the Fund voted proxies relating to portfolio securities during the most recent 12-month period ended June 30 is available on the Fund’s website at wellsfargofunds.com or by visiting the SEC website at sec.gov.
PORTFOLIO HOLDINGS INFORMATION
The complete portfolio holdings for the Fund are publicly available monthly on the Fund’s website (wellsfargofunds.com), on a one-month delayed basis. In addition, top ten holdings information (excluding derivative positions) for the Fund is publicly available on the Fund’s website on a monthly, seven-day or more delayed basis. The Fund files its complete schedule of portfolio holdings with the SEC for the first and third quarters of each fiscal year on Form N-Q, which is available by visiting the SEC website at sec.gov. In addition, the Fund’s Form N-Q may be reviewed and copied at the SEC’s Public Reference Room in Washington, DC, and at regional offices in New York City, at 233 Broadway, and in Chicago, at 175 West Jackson Boulevard, Suite 900. Information about the Public Reference Room may be obtained by calling 1-800-SEC-0330.
| | | | | | |
| Other information (unaudited) | | Wells Fargo Conservative Income Fund | | | 27 | |
BOARD OF TRUSTEES AND OFFICERS
Each of the Trustees and Officers1 listed in the table below acts in identical capacities for each fund in the Wells Fargo family of funds, which consists of 154 mutual funds comprising the Wells Fargo Funds Trust, Wells Fargo Variable Trust, Wells Fargo Master Trust and four closed-end funds (collectively the “Fund Complex”). This table should be read in conjunction with the Prospectus and the Statement of Additional Information2. The mailing address of each Trustee and Officer is 525 Market Street, 12th Floor, San Francisco, CA 94105. Each Trustee and Officer serves an indefinite term, however, each Trustee serves such term until reaching the mandatory retirement age established by the Trustees.
Independent Trustees
| | | | | | |
Name and
year of birth | | Position held and
length of service* | | Principal occupations during past five years or longer | | Current other
public company or
investment company
directorships |
William R. Ebsworth
(Born 1957) | | Trustee, since 2015 | | Retired. From 1984 to 2013, equities analyst, portfolio manager, research director and chief investment officer at Fidelity Management and Research Company in Boston, Tokyo, and Hong Kong, and retired in 2013 as Chief Investment Officer of Fidelity Strategic Advisers, Inc. where he led a team of investment professionals managing client assets. Prior thereto, Board member of Hong Kong Securities Clearing Co., Hong Kong Options Clearing Corp., the Thailand International Fund, Ltd., Fidelity Investments Life Insurance Company, and Empire Fidelity Investments Life Insurance Company. Board member of the Vincent Memorial Hospital Endowment (non-profit organization), where he serves on the Investment Committee and as a Chair of the Audit Committee. Mr. Ebsworth is a CFA® charterholder. | | N/A |
Jane A. Freeman
(Born 1953) | | Trustee, since 2015; Chair Liaison, since 2018 | | Retired. From 2012 to 2014 and 1999 to 2008, Chief Financial Officer of Scientific Learning Corporation. From 2008 to 2012, Ms. Freeman provided consulting services related to strategic business projects. Prior to 1999, Portfolio Manager at Rockefeller & Co. and Scudder, Stevens & Clark. Board member of the Harding Loevner Funds from 1996 to 2014, serving as both Lead Independent Director and chair of the Audit Committee. Board member of the Russell Exchange Traded Funds Trust from 2011 to 2012 and the chair of the Audit Committee. Ms. Freeman is a Board Member of The Ruth Bancroft Garden (non-profit organization). She is also an inactive Chartered Financial Analyst. | | N/A |
Isaiah Harris, Jr.
(Born 1952) | | Trustee, since 2009 | | Retired. Chairman of the Board of CIGNA Corporation since 2009, and Director since 2005. From 2003 to 2011, Director of Deluxe Corporation. Prior thereto, President and CEO of BellSouth Advertising and Publishing Corp. from 2005 to 2007, President and CEO of BellSouth Enterprises from 2004 to 2005 and President of BellSouth Consumer Services from 2000 to 2003. Emeritus member of the Iowa State University Foundation Board of Governors. Emeritus Member of the Advisory Board of Iowa State University School of Business. Advisory Board Member, Palm Harbor Academy (private school). Advisory Board Member, Child Evangelism Fellowship (non-profit). Mr. Harris is a certified public accountant (inactive status). | | CIGNA Corporation |
Judith M. Johnson
(Born 1949) | | Trustee, since 2008;
Audit Committee Chairman, since 2009 | | Retired. Prior thereto, Chief Executive Officer and Chief Investment Officer of Minneapolis Employees Retirement Fund from 1996 to 2008. Ms. Johnson is an attorney, certified public accountant and a certified managerial accountant. | | N/A |
David F. Larcker
(Born 1950) | | Trustee, since 2009 | | James Irvin Miller Professor of Accounting at the Graduate School of Business, Stanford University, Director of the Corporate Governance Research Initiative and Senior Faculty of The Rock Center for Corporate Governance since 2006. From 2005 to 2008, Professor of Accounting at the Graduate School of Business, Stanford University. Prior thereto, Ernst & Young Professor of Accounting at The Wharton School, University of Pennsylvania from 1985 to 2005. | | N/A |
| | | | |
| 28 | | Wells Fargo Conservative Income Fund | | Other information (unaudited) |
| | | | | | |
Name and
year of birth | | Position held and
length of service* | | Principal occupations during past five years or longer | | Current other
public company or
investment company
directorships |
Olivia S. Mitchell
(Born 1953) | | Trustee, since 2006; Governance Committee Chairman, since 2018 | | International Foundation of Employee Benefit Plans Professor, Wharton School of the University of Pennsylvania since 1993. Director of Wharton’s Pension Research Council and Boettner Center on Pensions & Retirement Research, and Research Associate at the National Bureau of Economic Research. Previously, Cornell University Professor from 1978 to 1993. | | N/A |
Timothy J. Penny
(Born 1951) | | Trustee, since 1996; Chairman, since 2018; Vice Chairman, from 2017 to 2018 | | President and Chief Executive Officer of Southern Minnesota Initiative Foundation, a non-profit organization, since 2007. Member of the Board of Trustees of NorthStar Education Finance, Inc., a non-profit organization, since 2007. | | N/A |
James G. Polisson
(Born 1959) | | Trustee, since 2018; Advisory Board Member, from 2017 to 2018 | | Retired. Chief Marketing Officer, Source (ETF) UK Services, Ltd, from 2015 to 2017. From 2012 to 2015, Principal of The Polisson Group, LLC, a management consulting, corporate advisory and principal investing company. Chief Executive Officer and Managing Director at Russell Investments, Global Exchange Traded Funds from 2010 to 2012. Managing Director of Barclays Global Investors from 1998 to 2010 and Global Chief Marketing Officer for iShares and Barclays Global Investors from 2000 to 2010. Trustee of the San Francisco Mechanics’ Institute, a non-profit organization, from 2013 to 2015. Board member of the Russell Exchange Traded Fund Trust from 2011 to 2012. Director of Barclays Global Investors Holdings Deutschland GmbH from 2006 to 2009. Mr. Polisson is an attorney and has a retired status with the Massachusetts and District of Columbia Bar Associations. | | N/A |
Michael S. Scofield
(Born 1943) | | Trustee, since 2010 | | Served on the Investment Company Institute’s Board of Governors and Executive Committee from 2008-2011 as well the Governing Council of the Independent Directors Council from 2006-2011 and the Independent Directors Council Executive Committee from 2008-2011. Trustee of the Evergreen Fund complex (and its predecessors) from 1984 to 2010. Chairman of the Evergreen Funds from 2000-2010. Former Trustee of the Mentor Funds. Retired Attorney, Law Offices of Michael S. Scofield. | | N/A |
Pamela Wheelock
(Born 1959) | | Trustee, since 2018; Advisory Board Member, from 2017 to 2018 | | Chief Operating Officer, Twin Cities Habitat for Humanity, since January, 2017. Vice President of University Services, University of Minnesota from 2012 to 2017. Prior thereto, on the Board of Directors, Governance Committee and Finance Committee for the Minnesota Philanthropy Partners (Saint Paul Foundation) from 2012 to 2018, Interim President and Chief Executive Officer of Blue Cross Blue Shield of Minnesota from 2010 to 2011, Chairman of the Board from 2009 to 2011 and Board Director from 2003 to 2015. Vice President, Leadership and Community Engagement, Bush Foundation, Saint Paul, Minnesota (a private foundation) from 2009 to 2011. Executive Vice President and Chief Financial Officer, Minnesota Sports and Entertainment from 2004 to 2009 and Senior Vice President from 2002 to 2004. Commissioner of Finance, State of Minnesota, from 1999 to 2002. Currently the Board Chair of the Minnesota Wild Foundation since 2010. | | N/A |
| * | Length of service dates reflect the Trustee’s commencement of service with the Trust’s predecessor entities, where applicable. |
| | | | | | |
| Other information (unaudited) | | Wells Fargo Conservative Income Fund | | | 29 | |
Officers
| | | | | | |
Name and
year of birth | | Position held and
length of service | | Principal occupations during past five years or longer | | |
Andrew Owen
(Born 1960) | | President, since 2017 | | Executive Vice President of Wells Fargo & Company and Head of Affiliated Managers, Wells Fargo Asset Management, since 2014. In addition, Mr. Owen is currently President, Chief Executive Officer and Director of Wells Fargo Funds Management, LLC since 2017. Prior thereto, Executive Vice President responsible for marketing, investments and product development for Wells Fargo Funds Management, LLC, from 2009 to 2014. | | |
Nancy Wiser1
(Born 1967) | | Treasurer, since 2012 | | Executive Vice President of Wells Fargo Funds Management, LLC since 2011. Chief Operating Officer and Chief Compliance Officer at LightBox Capital Management LLC, from 2008 to 2011. | | |
Alexander Kymn3
(Born 1973) | | Secretary, since 2018; Chief Legal Officer, since 2018 | | Senior Company Counsel of Wells Fargo Bank, N.A. since 2018 (previously Senior Counsel from 2007 to 2018). Vice President of Wells Fargo Funds Management, LLC from 2008 to 2014. | | |
Michael H. Whitaker
(Born 1967) | | Chief Compliance Officer, since 2016 | | Senior Vice President and Chief Compliance Officer since 2016. Senior Vice President and Chief Compliance Officer for Fidelity Investments from 2007 to 2016. | | |
David Berardi
(Born 1975) | | Assistant Treasurer, since 2009 | | Vice President of Wells Fargo Funds Management, LLC since 2009. Vice President of Evergreen Investment Management Company, LLC from 2008 to 2010. Manager of Fund Reporting and Control for Evergreen Investment Management Company, LLC from 2004 to 2010. | | |
Jeremy DePalma1
(Born 1974) | | Assistant Treasurer, since 2009 | | Senior Vice President of Wells Fargo Funds Management, LLC since 2009. Senior Vice President of Evergreen Investment Management Company, LLC from 2008 to 2010 and head of the Fund Reporting and Control Team within Fund Administration from 2005 to 2010. | | |
| 1 | Nancy Wiser acts as Treasurer of 77 funds in the Fund Complex. Jeremy DePalma acts as Treasurer of 77 funds and Assistant Treasurer of 77 funds in the Fund Complex. |
| 2 | The Statement of Additional Information includes additional information about the Trustees and is available, without charge, upon request, by calling 1-800-222-8222 or by visiting the website at wellsfargofunds.com. |
| 3 | Alexander Kymn became the Secretary and Chief Legal Officer effective April 17, 2018. |
| | | | |
| 30 | | Wells Fargo Conservative Income Fund | | Other information (unaudited) |
BOARD CONSIDERATION OF INVESTMENT MANAGEMENT AND SUB-ADVISORY AGREEMENTS:
Wells Fargo Conservative Income Fund
Under the Investment Company Act of 1940 (the “1940 Act”), the Board of Trustees (the “Board”) of Wells Fargo Funds Trust (the “Trust”) must determine annually whether to approve the continuation of the Trust’s investment management and sub-advisory agreements. In this regard, at an in-person meeting held on May 22-23, 2018 (the “Meeting”), the Board, all the members of which have no direct or indirect interest in the investment management and sub-advisory agreements and are not “interested persons” of the Trust, as defined in the 1940 Act (the “Independent Trustees”), reviewed and approved for Wells Fargo Conservative Income Fund (the “Fund”): (i) an investment management agreement (the “Management Agreement”) with Wells Fargo Funds Management, LLC (“Funds Management”); and (ii) an investment sub-advisory agreement (the “Sub-Advisory Agreement”) with Wells Capital Management Incorporated (the “Sub-Adviser”), an affiliate of Funds Management. The Management Agreement and the Sub-Advisory Agreement are collectively referred to as the “Advisory Agreements.”
At the Meeting, the Board considered the factors and reached the conclusions described below relating to the selection of Funds Management and the Sub-Adviser and the approval of the Advisory Agreements. Prior to the Meeting, including at an in-person meeting in April 2018, the Trustees conferred extensively among themselves and with representatives of Funds Management about these matters. Also, the Board has adopted a team-based approach, with each team consisting of a sub-set of Trustees, to assist the full Board in the discharge of its duties in reviewing investment performance and other matters throughout the year. The Independent Trustees were assisted in their evaluation of the Advisory Agreements by independent legal counsel, from whom they received separate legal advice and with whom they met separately.
In providing information to the Board, Funds Management and the Sub-Adviser were guided by a detailed set of requests for information submitted to them by independent legal counsel on behalf of the Independent Trustees at the start of the Board’s annual contract renewal process earlier in 2018. In considering and approving the Advisory Agreements, the Trustees considered the information they believed relevant, including but not limited to the information discussed below. The Board considered not only the specific information presented in connection with the Meeting, but also the knowledge gained over time through interaction with Funds Management and the Sub-Adviser about various topics. In this regard, the Board reviewed reports of Funds Management at each of its quarterly meetings, which included, among other things, portfolio reviews and investment performance reports. In addition, the Board and the teams mentioned above confer with portfolio managers at various times throughout the year. The Board did not identify any particular information or consideration that was all-important or controlling, and each individual Trustee may have attributed different weights to various factors.
After its deliberations, the Board unanimously approved the continuation of the Advisory Agreements for a one-year term and determined that the compensation payable to Funds Management and the Sub-Adviser under each of the Advisory Agreements was reasonable. The Board considered the approval of the Advisory Agreements for the Fund as part of its consideration of agreements for funds across the complex, but its approvals were made on a fund-by-fund basis. The following summarizes a number of important, but not necessarily all, factors considered by the Board in support of its approvals.
Nature, extent and quality of services
The Board received and considered various information regarding the nature, extent and quality of services provided to the Fund by Funds Management and the Sub-Adviser under the Advisory Agreements. This information included a description of the investment advisory services and Fund-level administrative services covered by the Management Agreement, as well as, among other things, a summary of the background and experience of senior management of Wells Fargo Asset Management (“WFAM”), of which Funds Management and the Sub-Adviser are a part, a summary of investments made in the business of WFAM, a summary of certain organizational and personnel changes involving Funds Management and the Sub-Adviser, and a description of Funds Management’s and the Sub-Adviser’s business continuity planning programs and of their approaches to data privacy and cybersecurity. The Board also considered the qualifications, background, tenure and responsibilities of each of the portfolio managers primarily responsible for the day-to-day portfolio management of the Fund.
The Board evaluated the ability of Funds Management and the Sub-Adviser to attract and retain qualified investment professionals, including research, advisory and supervisory personnel. The Board further considered the compliance programs and compliance records of Funds Management and the Sub-Adviser. In addition, the Board took into account the full range of services provided to the Fund by Funds Management and its affiliates.
| | | | | | |
| Other information (unaudited) | | Wells Fargo Conservative Income Fund | | | 31 | |
Fund investment performance and expenses
The Board considered the investment performance results for the Fund over various time periods ended December 31, 2017. The Board considered these results in comparison to the investment performance of funds in a universe that was determined by Broadridge Inc. (“Broadridge”) to be similar to the Fund (the “Universe”), and in comparison to the Fund’s benchmark index and to other comparative data. Broadridge is an independent provider of investment company data. The Board received a description of the methodology used by Broadridge to select the mutual funds in the performance Universe. The Board noted that the investment performance of the Fund (Institutional Class) was in range of the average investment performance of the Universe for the one- and three-year periods under review. The Board also noted that the investment performance of the Fund was higher than its benchmark index, the Bloomberg Barclays U.S. Treasury Bills: 6-9 Month Index, for the one- and three-year periods under review.
The Board also received and considered information regarding the Fund’s net operating expense ratio and its various components, including actual management fees, custodian and other non-management fees, and Rule 12b-1 and non-Rule 12b-1 shareholder service fees. The Board considered this ratio in comparison to the median ratio of funds in a class-specific expense group that was determined by Broadridge to be similar to the Fund (the “Group”). The Board received a description of the methodology used by Broadridge to select the mutual funds in the expense Group and an explanation of how funds comprising expense group and their expense ratios may vary from year-to-year. Based on the Broadridge reports, the Board noted that the net operating expense ratio of the Fund was lower than the median net operating expense ratio of the expense Group.
The Board took into account the Fund’s investment performance and expense information provided to it among the factors considered in deciding to re-approve the Advisory Agreements.
Investment management and sub-advisory fee rates
The Board reviewed and considered the contractual fee rate payable by the Fund to Funds Management under the Management Agreement, as well as the contractual fee rates payable by the Fund to Funds Management for class-level administrative services under a Class-Level Administration Agreement, which include, among other things, class-level transfer agency and sub-transfer agency costs (collectively, the “Management Rate”). The Board also reviewed and considered the contractual investment sub-advisory fee rates that are payable by Funds Management to the Sub-Adviser for investment sub-advisory services.
Among other information reviewed by the Board was a comparison of the Fund’s Management Rate with the average contractual investment management fee rate of funds in the expense Group at a common asset level as well as transfer agency costs of the funds in the expense Group. The Board noted that the Management Rate of the Fund was lower than the sum of these average rates for the Fund’s expense Group.
The Board also received and considered information about the portion of the total management fee that was retained by Funds Management after payment of the fee to the Sub-Adviser for sub-advisory services. In assessing the reasonableness of this amount, the Board received and evaluated information about the nature and extent of responsibilities retained and risks assumed by Funds Management and not delegated to or assumed by the Sub-Adviser, and about Funds Management’s on-going oversight services. Given the affiliation between Funds Management and the Sub-Adviser, the Board ascribed limited relevance to the allocation of fees between them.
The Board also received and considered information about the nature and extent of services offered and fee rates charged by Funds Management and the Sub-Adviser to other types of clients with investment strategies similar to those of the Fund. In this regard, the Board received information about the significantly greater scope of services, and compliance, reporting and other legal burdens and risks of managing mutual funds compared with those associated with managing assets of non-mutual fund clients such as institutional separate accounts.
Based on its consideration of the factors and information it deemed relevant, including those described here, the Board determined that the compensation payable to Funds Management under the Management Agreement and to the Sub-Adviser under the Sub-Advisory Agreement was reasonable.
Profitability
The Board received and considered information concerning the profitability of Funds Management, as well as the profitability of both WFAM and Wells Fargo & Co. (“Wells Fargo”) as a whole, from providing services to the Fund and the fund family as a whole. The Board noted that the Sub-Adviser’s profitability information with respect to providing services to the Fund was subsumed in the WFAM and Wells Fargo profitability analysis.
| | | | |
| 32 | | Wells Fargo Conservative Income Fund | | Other information (unaudited) |
Funds Management reported on the methodologies and estimates used in calculating profitability, including a description of the methodology used to allocate certain expenses and recent enhancements made to the methodology. Among other things, the Board noted that the levels of profitability reported on a fund-by-fund basis varied widely, depending on factors such as the size and type of fund. Based on its review, the Board did not deem the profits reported by Funds Management, WFAM or Wells Fargo from services provided to the Fund to be at a level that would prevent it from approving the continuation of the Advisory Agreements.
Economies of scale
The Board considered the extent to which Funds Management may experience economies of scale in the provision of management services, and the extent to which scale benefits, if any, would be shared with shareholders. In particular, the Board noted the existence of breakpoints in the Fund’s management fee structure, which operate generally to reduce the Fund’s expense ratios as the Fund grows in size. It considered that, for a small fund or a fund that shrinks in size, breakpoints conversely can result in higher fee levels. The Board also considered that in addition to management fee breakpoints, competitive management fee rates set at the outset without regard to breakpoints and fee waiver and expense reimbursement arrangements, as well as investments in the business intended to enhance services available to Fund shareholders, are means of sharing potential economies of scale with shareholders of the Fund.
The Board concluded that the Fund’s fee and expense arrangements, including contractual breakpoints, constituted a reasonable approach to sharing potential economies of scale with the Fund and its shareholders.
Other benefits to Funds Management and the Sub-Adviser
The Board received and considered information regarding potential “fall-out” or ancillary benefits received by Funds Management and its affiliates, including the Sub-Adviser, as a result of their relationships with the Fund. Ancillary benefits could include, among others, benefits directly attributable to other relationships with the Fund and benefits potentially derived from an increase in Funds Management’s and the Sub-Adviser’s business as a result of their relationships with the Fund. The Board noted that various affiliates of Funds Management may receive distribution-related fees, shareholder servicing payments and sub-transfer agency fees in respect of shares sold or held through them and services provided.
The Board also reviewed information about soft dollar credits earned and utilized by the Sub-Adviser, fees earned by Funds Management and the Sub-Adviser from managing a private investment vehicle for the fund family’s securities lending collateral and commissions earned by an affiliated broker from portfolio transactions.
Based on its consideration of the factors and information it deemed relevant, including those described here, the Board did not find that any ancillary benefits received by Funds Management and its affiliates, including the Sub-Adviser, were unreasonable.
Conclusion
At the Meeting, after considering the above-described factors and based on its deliberations and its evaluation of the information described above, the Board unanimously approved the continuation of the Advisory Agreements for a one-year term and determined that the compensation payable to Funds Management and the Sub-Adviser under each of the Advisory Agreements was reasonable.

For more information
More information about Wells Fargo Funds is available free upon request. To obtain literature, please write, visit the Fund’s website, or call:
Wells Fargo Funds
P.O. Box 219967
Kansas City, MO 64121-9967
Website: wellsfargofunds.com
Individual investors: 1-800-222-8222
Retail investment professionals: 1-888-877-9275
Institutional investment professionals: 1-866-765-0778
This report and the financial statements contained herein are submitted for the general information of the shareholders of the Fund. If this report is used for promotional purposes, distribution of the report must be accompanied or preceded by a current prospectus. Before investing, please consider the investment objectives, risks, charges, and expenses of the investment. For a current prospectus and, if available, a summary prospectus, containing this information, call 1-800-222-8222 or visit the Fund’s website at wellsfargofunds.com. Read the prospectus carefully before you invest or send money.
Wells Fargo Asset Management (WFAM) is the trade name for certain investment advisory/management firms owned by Wells Fargo & Company. These firms include but are not limited to Wells Capital Management Incorporated and Wells Fargo Funds Management, LLC. Certain products managed by WFAM entities are distributed by Wells Fargo Funds Distributor, LLC (a broker/dealer and Member FINRA).
This material is for general informational and educational purposes only and is NOT intended to provide investment advice or a recommendation of any kind—including a recommendation for any specific investment, strategy, or plan.
NOT FDIC INSURED ◾ NO BANK GUARANTEE ◾ MAY LOSE VALUE
© 2018 Wells Fargo Funds Management, LLC. All rights reserved.
| | |
 | | 315404 10-18 A265/AR265 08-18 |
Annual Report
August 31, 2018

Wells Fargo Government Securities Fund


Reduce clutter. Save trees.
Sign up for electronic delivery of prospectuses and shareholder reports at wellsfargo.com/advantagedelivery
Contents
The views expressed and any forward-looking statements are as of August 31, 2018, unless otherwise noted, and are those of the Fund managers and/or Wells Fargo Funds Management, LLC. Discussions of individual securities, or the markets generally, or any Wells Fargo Fund are not intended as individual recommendations. Future events or results may vary significantly from those expressed in any forward-looking statements. The views expressed are subject to change at any time in response to changing circumstances in the market. Wells Fargo Funds Management, LLC and the Fund disclaim any obligation to publicly update or revise any views expressed or forward-looking statements.
NOT FDIC INSURED ◾ NO BANK GUARANTEE ◾ MAY LOSE VALUE
| | | | |
| 2 | | Wells Fargo Government Securities Fund | | Letter to shareholders (unaudited) |

Andrew Owen
President
Wells Fargo Funds
After advancing during 2017, economic growth and stock markets globally diverged during the first eight months of 2018.
Dear Shareholder:
We are pleased to offer you this annual report for the Wells Fargo Government Securities Fund for the 12-month period that ended August 31, 2018. After advancing during 2017, economic growth and stock markets globally diverged during the first eight months of 2018. For fixed-income investors, taxable bond returns suffered and high-yield and municipal bond returns were positive.
For the period, U.S. stocks, as measured by the S&P 500 Index,1 gained 19.66%, and international stocks, as measured by the MSCI ACWI ex USA Index (Net),2 added 3.18%. Based on the MSCI EM Index (Net),3 emerging market stocks lost 0.68%. For bond investors, the Bloomberg Barclays U.S. Aggregate Bond Index4 declined 1.05% while the Bloomberg Barclays Global Aggregate ex-USD Index5 fell 1.64%. The Bloomberg Barclays Municipal Bond Index6 added 0.49%, and the ICE BofAML U.S. High Yield Index7 was up 3.26%.
Continued optimism in the U.S. characterized the fourth quarter of 2017.
Some observers described economic conditions in late 2017 as a Goldilocks scenario: synchronized global growth, low inflation, healthy corporate earnings, and a weaker U.S. dollar that supported international growth. During the quarter, the U.S. Bureau of Economic Analysis reported that annualized U.S. gross domestic product (GDP) growth for the third quarter of 2017 was 2.8% and inflation remained below U.S. Federal Reserve (Fed) targets. U.S. corporate earnings and consumer confidence improved.
Economic momentum increased in Europe. The Bank of England (BOE) raised interest rates in November 2017 to 0.50%, the first increase in more than 10 years, indicating confidence in the economy’s growth potential. Meanwhile, the European Central Bank and the Bank of Japan kept interest rates low to spur business activities and bought bonds in an effort to encourage equity investments. The People’s Bank of China’s (PBOC’s) policies sought to stimulate business. Many emerging market economies benefited from stronger currencies versus the U.S. dollar, while commodity price increases benefited countries that rely on natural resources for exports.
| 1 | The S&P 500 Index consists of 500 stocks chosen for market size, liquidity, and industry group representation. It is a market-value-weighted index with each stock’s weight in the index proportionate to its market value. You cannot invest directly in an index. |
| 2 | The Morgan Stanley Capital International (MSCI) All Country World Index (ACWI) ex USA Index (Net) is a free-float-adjusted market-capitalization-weighted index that is designed to measure the equity market performance of developed markets, excluding the United States and Canada. Source: MSCI. MSCI makes no express or implied warranties or representations and shall have no liability whatsoever with respect to any MSCI data contained herein. The MSCI data may not be further redistributed or used as a basis for other indices or any securities or financial products. This report is not approved, reviewed, or produced by MSCI. You cannot invest directly in an index. |
| 3 | The MSCI Emerging Markets (EM) Index (Net) is a free-float-adjusted market-capitalization-weighted index that is designed to measure large- and mid-cap equity market performance of emerging markets. The MSCI EM Index (Net) consists of the following 24 emerging market country indices: Brazil, Chile, China, Colombia, Czech Republic, Egypt, Greece, Hungary, India, Indonesia, Korea, Malaysia, Mexico, Pakistan, Peru, the Philippines, Poland, Qatar, Russia, South Africa, Taiwan, Thailand, Turkey, and the United Arab Emirates. You cannot invest directly in an index. |
| 4 | The Bloomberg Barclays U.S. Aggregate Bond Index is a broad-based benchmark that measures the investment-grade, U.S. dollar-denominated, fixed-rate taxable bond market, including Treasuries, government-related and corporate securities, mortgage-backed securities (agency fixed-rate and hybrid adjustable-rate mortgage pass-throughs), asset-backed securities, and commercial mortgage-backed securities. You cannot invest directly in an index. |
| 5 | The Bloomberg Barclays Global Aggregate ex-USD Index is an unmanaged index that provides a broad-based measure of the global investment-grade fixed-income markets excluding the U.S. dollar-denominated debt market. You cannot invest directly in an index. |
| 6 | The Bloomberg Barclays Municipal Bond Index is an unmanaged index composed of long-term tax-exempt bonds with a minimum credit rating of Baa. You cannot invest directly in an index. |
| 7 | The ICE BofAML U.S. High Yield Index is a market-capitalization-weighted index of domestic and Yankee high-yield bonds. The index tracks the performance of high-yield securities traded in the U.S. bond market. You cannot invest directly in an index. Copyright 2018. ICE Data Indices, LLC. All rights reserved. |
| | | | | | |
| Letter to shareholders (unaudited) | | Wells Fargo Government Securities Fund | | | 3 | |
Volatility reemerged during the first quarter of 2018 as global tensions and inflation fears increased.
Stock market gains in January 2018 followed the passage of lower U.S. tax rates. Some investors then grew concerned about trade, particularly between the U.S. and China, and the specter of inflation. The Fed followed its 25-basis-point (bp; 100 bps equal 1.00%) federal funds rate increase in December 2017 with a further 25-bp increase in March 2018. The inflation rate in March reached the Fed’s 2% target for the first time in a year.
The S&P 500 Index closed the first quarter with a negative return, the first negative quarterly return for the index since 2014. Overseas investment markets reversed strong returns in 2017, hurt by a stronger U.S. dollar and mounting trade and diplomatic tensions. After gaining 27.19% for the 12-month period that ended December 31, 2017, the MSCI ACWI ex USA Index (Net) declined 1.81% for the quarter that ended March 31, 2018.
Global trade tensions escalated during the second quarter.
Global trade tensions escalated throughout the second quarter of 2018. The U.S. government imposed tariffs, and foreign governments in North America, Europe, and Asia retaliated. The escalating tensions chilled investment activity as observers awaited signals of next steps.
Meanwhile, inflation continued an upward trend. The CPI-U8 added 0.1% in June after increases of 0.2% in both April and May. On a year-over-year basis, the all-items index rose 2.9% for the 12 months that ended June 30, 2018. The index for all items less food and energy rose 2.3% for the same 12-month period.
U.S. stocks gained while international stocks and bonds declined during the summer of 2018.
The U.S. economy strengthened during the summer months. Revised second-quarter GDP data released in August showed the U.S. economy growing at a 4.2% rate. After ticking up slightly in June, the unemployment rate in the U.S. was 3.9% in July and August, according to the U.S. Department of Labor. Wages showed more consistent growth than they had in recent quarters, and consumer confidence remained strong.
Several U.S. equity market indices reached records during August, with the S&P 500 Index gaining 7.76% for the three-month period that ended August 31, 2018. International stock values continued to suffer under the effects of a strong U.S. dollar and continuing trade tensions. The MSCI ACWI ex USA Index (Net) and the MSCI EM Index (Net) were down 4.70% and 1.64%, respectively, during the same three-month period.
The Fed increased the federal funds rate in June, and expectations grew that two more rate increases were in the offing in 2018. Long-term interest rates in the U.S. remained at higher levels relative to the prior 10 years. Rates on 10-year and 30-year Treasury bonds—2.46% and 2.81%, respectively, on January 1, 2018—were 2.86% and 3.02%, respectively, on August 31, off their peak levels on May 17, 2018, of 3.11% and 3.25%, respectively. Some investors became more aware of and concerned about the potential for an inverted yield curve—sometimes a recession signal—as short-term rates increased more quickly than long-term rates. The Fed decided to forgo an interest rate increase at its August meeting.
The S&P 500 Index closed the first quarter with a negative return, the first negative quarterly return for the index since 2014.
| 8 | The Consumer Price Index for All Urban Consumers (CPI-U) measures the changes in the price of a basket of goods and services purchased by urban consumers. The urban consumer population is deemed by many as a better representative measure of the general public because close to 90% of the country’s population lives in highly populated areas. You cannot invest directly in an index. |
| | | | |
| 4 | | Wells Fargo Government Securities Fund | | Letter to shareholders (unaudited) |
Internationally, members of Prime Minister Theresa May’s U.K./Brexit negotiating team resigned amid unproductive negotiations. In early August, the BOE’s Monetary Policy Committee increased its key interest rate to 0.75%. Central banks in Europe and Japan maintained low interest rates and accommodative monetary policies. Amid rising trade uncertainty, the PBOC cut reserve requirement ratios and accelerated infrastructure spending and tax cuts for business enterprises and individuals. Nevertheless, a strengthening U.S. dollar and the trade tensions remained headwinds for investors overseas.
Don’t let short-term uncertainty derail long-term investment goals.
Periods of investment uncertainty can present challenges, but experience has taught us that maintaining long-term investment goals can be an effective way to plan for the future. To help you create a sound strategy based on your personal goals and risk tolerance, Wells Fargo Funds offers more than 100 mutual funds spanning a wide range of asset classes and investment styles. Although diversification cannot guarantee an investment profit or prevent losses, we believe it can be an effective way to manage investment risk and potentially smooth out overall portfolio performance. We encourage investors to know their investments and to understand that appropriate levels of risk-taking may unlock opportunities.
Thank you for choosing to invest with Wells Fargo Funds. We appreciate your confidence in us and remain committed to helping you meet your financial needs.
Sincerely,

Andrew Owen
President
Wells Fargo Funds
Notice to shareholders
At a meeting held on August 14-15, 2018, the Board of Trustees of the Fund approved the following policy which will be effective on or about February 5, 2019:
Class C shares will convert automatically into Class A shares ten years after the initial date of purchase or, if you acquired your Class C shares through an exchange or conversion from another share class, ten years after the date you acquired your Class C shares. When Class C shares that you acquired through a purchase or exchange convert, any other Class C shares that you purchased with reinvested dividends and distributions also will convert into Class A shares on a pro rata basis. A shorter holding period may also apply depending on your intermediary. Please see “Appendix A—Sales Charge Reductions and Waivers for Certain Intermediaries” in the Fund’s prospectus or at the end of this report.
For further information about your Fund, contact your investment professional, visit our website at wellsfargofunds.com, or call us directly at 1-800-222-8222.
This page is intentionally left blank.
| | | | |
| 6 | | Wells Fargo Government Securities Fund | | Performance highlights (unaudited) |
Investment objective
The Fund seeks current income.
Manager
Wells Fargo Funds Management, LLC
Subadviser
Wells Capital Management Incorporated
Portfolio managers
Christopher Y. Kauffman, CFA®
Jay N. Mueller, CFA®
Michal Stanczyk
Average annual total returns (%) as of August 31, 2018
| | | | | | | | | | | | | | | | | | | | | | | | | | | | | | | | | | |
| | | | | Including sales charge | | | Excluding sales charge | | | Expense ratios1 (%) | |
| | | Inception date | | 1 year | | | 5 year | | | 10 year | | | 1 year | | | 5 year | | | 10 year | | | Gross | | | Net2 | |
| Class A (SGVDX) | | 8-31-1999 | | | (5.88 | ) | | | 0.66 | | | | 2.35 | | | | (1.44 | ) | | | 1.59 | | | | 2.82 | | | | 0.87 | | | | 0.85 | |
| Class C (WGSCX) | | 12-26-2002 | | | (3.18 | ) | | | 0.84 | | | | 2.05 | | | | (2.18 | ) | | | 0.84 | | | | 2.05 | | | | 1.62 | | | | 1.60 | |
| Administrator Class (WGSDX) | | 4-8-2005 | | | – | | | | – | | | | – | | | | (1.23 | ) | | | 1.83 | | | | 3.03 | | | | 0.81 | | | | 0.64 | |
| Institutional Class (SGVIX) | | 8-31-1999 | | | – | | | | – | | | | – | | | | (0.99 | ) | | | 1.99 | | | | 3.22 | | | | 0.54 | | | | 0.48 | |
| Bloomberg Barclays U.S. Aggregate ex Credit Index3 | | – | | | – | | | | – | | | | – | | | | (1.08 | ) | | | 2.00 | | | | 3.15 | | | | – | | | | – | |
| Bloomberg Barclays Intermediate U.S. Government Bond Index4 | | – | | | – | | | | – | | | | – | | | | (1.25 | ) | | | 1.18 | | | | 2.32 | | | | – | | | | – | |
Figures quoted represent past performance, which is no guarantee of future results, and do not reflect taxes that a shareholder may pay on fund distributions or the redemption of fund shares. Investment return and principal value of an investment will fluctuate so that an investor’s shares, when redeemed, may be worth more or less than their original cost. Performance shown without sales charges would be lower if sales charges were reflected. Current performance may be lower or higher than the performance data quoted, which assumes the reinvestment of dividends and capital gains. Current month-end performance is available on the Fund’s website, wellsfargofunds.com.
Index returns do not include transaction costs associated with buying and selling securities, any mutual fund fees or expenses, or any taxes. It is not possible to invest directly in an index.
For Class A shares, the maximum front-end sales charge is 4.50%. For Class C shares, the maximum contingent deferred sales charge is 1.00%. Performance including a contingent deferred sales charge assumes the sales charge for the corresponding time period. Administrator Class and Institutional Class shares are sold without a front-end sales charge or contingent deferred sales charge.
Bond values fluctuate in response to the financial condition of individual issuers, general market and economic conditions, and changes in interest rates. Changes in market conditions and government policies may lead to periods of heightened volatility in the bond market and reduced liquidity for certain bonds held by the Fund. In general, when interest rates rise, bond values fall and investors may lose principal value. Interest rate changes and their impact on the Fund and its share price can be sudden and unpredictable. The use of derivatives may reduce returns and/or increase volatility. Securities issued by U.S. government agencies or government sponsored entities may not be guaranteed by the U.S. Treasury. Certain investment strategies tend to increase the total risk of an investment (relative to the broader market). The Fund is exposed to mortgage- and asset-backed securities risk. The U.S. government guarantee applies to certain underlying securities and not to shares of the Fund. Consult the Fund’s prospectus for additional information on these and other risks.
Please see footnotes on page 7.
| | | | | | |
| Performance highlights (unaudited) | | Wells Fargo Government Securities Fund | | | 7 | |
|
| Growth of $10,000 investment as of August 31, 20185 |
|
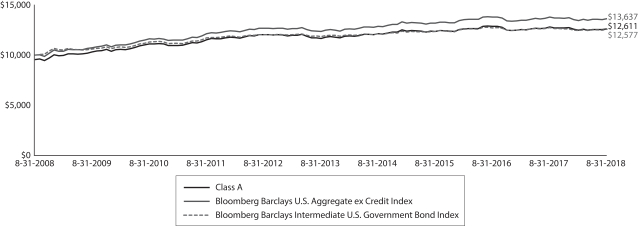 |
| 1 | Reflects the expense ratios as stated in the most recent prospectuses. The expense ratios shown are subject to change and may differ from the annualized expense ratios shown in the financial highlights of this report. |
| 2 | The manager has contractually committed through December 31, 2018, to waive fees and/or reimburse expenses to the extent necessary to cap the Fund’s Total Annual Fund Operating Expenses After Fee Waivers at the amounts shown. After this time, the cap may be increased or the commitment to maintain the cap may be terminated only with the approval of the Board of Trustees. Brokerage commissions, stamp duty fees, interest, taxes, acquired fund fees and expenses (if any), and extraordinary expenses are excluded from the expense cap. Without this cap, the Fund’s returns would have been lower. The expense ratio paid by an investor is the net expense ratio (the total annual fund operating expenses after fee waivers) as stated in the prospectuses. |
| 3 | The Bloomberg Barclays U.S. Aggregate ex Credit Index is composed of the Bloomberg Barclays U.S. Government Index and the Bloomberg Barclays U.S. Mortgage-Backed Securities Index and includes Treasury issues, agency issues, and mortgage-backed securities. You cannot invest directly in an index. |
| 4 | The Bloomberg Barclays Intermediate U.S. Government Bond Index is an unmanaged index composed of U.S. government securities with maturities in the one to 10-year range, including securities issued by the U.S. Treasury and U.S. government agencies. You cannot invest directly in an index. |
| 5 | The chart compares the performance of Class A shares for the most recent ten years with the performance of the Bloomberg Barclays U.S. Aggregate ex Credit Index and the Bloomberg Barclays Intermediate U.S. Government Bond Index. The chart assumes a hypothetical investment of $10,000 in Class A shares and reflects all operating expenses and assumes the maximum initial sales charge of 4.50%. |
| 6 | The ten largest holdings, excluding cash, cash equivalents and any money market funds, are calculated based on the value of the investments divided by total net assets of the Fund. Holdings are subject to change and may have changed since the date specified. |
| 7 | The Consumer Price Index (CPI) is a measure of the average change over time in the prices paid by urban consumers for a market basket of consumer goods and services. You cannot invest directly in an index. |
| 8 | Amounts are calculated based on the total long-term investments of the Fund. These amounts are subject to change and may have changed since the date specified. |
| | | | |
| 8 | | Wells Fargo Government Securities Fund | | Performance highlights (unaudited) |
MANAGER’S DISCUSSION
Fund highlights
| ∎ | | The Fund (Class A shares, excluding sales charges) underperformed its benchmark, the Bloomberg Barclays U.S. Aggregate ex Credit Index, for the 12-month period that ended August 31, 2018. |
| ∎ | | An overweight allocation to higher-coupon mortgages detracted because the duration of higher-coupon pools extended more than lower-coupon pools as interest rates increased during the period. |
| ∎ | | An underweight to mortgage-backed securities (MBS) detracted from results, as did an overweight to higher-coupon 30-year and 15-year mortgages. |
| ∎ | | The Fund’s overweight to securitized sectors, including commercial mortgage-backed securities (CMBS), collateralized mortgage obligations (CMOs), and asset-backed securities contributed to performance over the period due to the sectors’ yield advantage and narrowing spreads. |
| ∎ | | The Fund’s yield-curve and conservative duration positioning contributed to results as interest rates rose and the Fund’s yield positioning benefited from a flattening yield curve, whereby longer-term yields rose less than short-term rates did. |
| ∎ | | The Fund’s underweight allocation to Ginnie Mae mortgages contributed as higher-than-expected supply combined with tepid overseas demand caused the sector to underperform Fannie Mae and Freddie Mac bonds. |
| | | | |
| Ten largest holdings (%) as of August 31, 20186 | |
FNMA, 4.50%, 9-13-2048 | | | 4.97 | |
U.S. Treasury Note, 1.75%, 5-15-2023 | | | 3.46 | |
FNMA, 3.00%, 12-1-2045 | | | 3.32 | |
Resolution Funding Corporation STRIPS, 0.00%, 7-15-2020 | | | 3.25 | |
U.S. Treasury Bond, 3.75%, 11-15-2043 | | | 3.20 | |
FNMA, 3.50%, 9-18-2033 | | | 2.32 | |
FNMA, 4.00%, 4-1-2046 | | | 2.28 | |
GNMA, 4.00%, 12-20-2047 | | | 2.12 | |
GNMA, 3.50%, 12-20-2047 | | | 2.09 | |
GNMA, 3.50%, 9-21-2048 | | | 1.99 | |
Economic growth accelerated and policy normalization continued.
Over the past four quarters, U.S. gross domestic product (GDP) grew by 2.9% in real terms, which was above the post-financial-crisis average. Business investment was a significant source of strength, rising 4.8% for the 12 months that ended June 30, 2018. Consumer spending was a net contributor to growth, although it failed to keep pace with the business sector. Inventories were a net detractor from GDP growth, while trade and government spending were modestly positive factors.
The labor market generally was healthy over the past 12 months. Nonfarm payrolls expanded by an average of 194,000 jobs per month over the period, while the
unemployment rate declined to 3.9% at the end of August 2018 from 4.4% a year earlier. Also encouraging was a 0.2% rise in the employment/population ratio since August 2017, reflecting both the fall in unemployment and a modest increase in the labor force participation rate. Wage gains of about 2.9% over the past 12 months were sufficient to support consumption growth without sparking fears of rising inflation. The CPI7 also rose 2.9% over the past year, which accelerated due in part to higher energy prices.
The U.S. Federal Reserve’s (Fed’s) rate-setting committee, the Federal Open Market Committee (FOMC), raised the federal funds rate three times over the past 12 months by a total of 0.75%. The FOMC’s gradual approach to hiking rates is supported by Fed Chairman Jerome Powell’s stated view that there is no sense that inflation will take off or move unexpectedly quickly.
In line with the FOMC’s policy moves, interest rates had an upward bias over the past 12 months, particularly in shorter-term maturity instruments. Yields on 2-year Treasuries rose by 130 basis points (bps; 100 bps equal 1.00%) during the period, while 10-year Treasuries were about 75 bps higher. Investment-grade credit spreads tightened rapidly into the start of 2018 after the corporate tax cut was enacted in the U.S. but ended the period slightly wider after trade tensions and heavy supply took their toll on bond prices.
Please see footnotes on page 7.
| | | | | | |
| Performance highlights (unaudited) | | Wells Fargo Government Securities Fund | | | 9 | |
|
| Portfolio allocation as of August 31, 20188 |
|
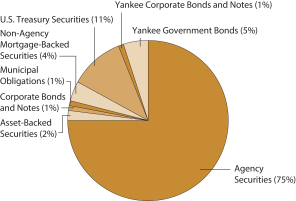 |
The Fund had an overweight allocation to securitized sectors.
We continued to find relative value among securitized bonds, particularly CMOs and agency CMBS. Within the MBS sector, the Fund was underweight versus the benchmark, which detracted from performance, with an emphasis on higher-coupon paper. The Fund also maintained an underweight to Ginnie Mae bonds due to their rich valuations, deteriorating prepayment fundamentals, and poor supply/demand technicals, which contributed to performance. However, the Fund’s overweight to higher-coupon 30-year and 15-year mortgages detracted because the duration of those pools extended as rates rose.
During the period, the Fund maintained an overweight to agency CMBS and a neutral or underweight position to nonagency CMBS. The Fund’s overweight to agency CMBS contributed to results. The Fund held government-guaranteed or government-sponsored agency bonds rather than Treasuries, picking up additional yield and benefiting from positive spread performance. In lieu of holding cash (given its low yield), we instead purchased short-maturity agency and Treasury bonds as well as floating-rate agency CMOs. This allowed the Fund to earn additional income without significant incremental interest rate or credit risk.
We expect modestly above-trend economic growth to continue.
We expect macroeconomic trends to remain relatively consistent in the coming quarters, aided by fiscal stimulus and looser regulations. Real GDP growth in the area of 3% is likely to persist for a period of time, barring some external shock. The biggest risks to the outlook include an escalation in trade tensions and a larger-than-expected slowdown in the Chinese economy.
Please see footnotes on page 7.
| | | | |
| 10 | | Wells Fargo Government Securities Fund | | Fund expenses (unaudited) |
As a shareholder of the Fund, you incur two types of costs: (1) transaction costs, including sales charges (loads) on purchase payments and contingent deferred sales charges (if any) on redemptions and (2) ongoing costs, including management fees, distribution (12b-1) and/or shareholder servicing fees, and other Fund expenses. This example is intended to help you understand your ongoing costs (in dollars) of investing in the Fund and to compare these costs with the ongoing costs of investing in other mutual funds.
The example is based on an investment of $1,000 invested at the beginning of the six-month period and held for the entire period from March 1, 2018 to August 31, 2018.
Actual expenses
The “Actual” line of the table below provides information about actual account values and actual expenses. You may use the information in this line, together with the amount you invested, to estimate the expenses that you paid over the period. Simply divide your account value by $1,000 (for example, an $8,600 account value divided by $1,000 = 8.6), then multiply the result by the number in the “Actual” line under the heading entitled “Expenses paid during period” for your applicable class of shares to estimate the expenses you paid on your account during this period.
Hypothetical example for comparison purposes
The “Hypothetical” line of the table below provides information about hypothetical account values and hypothetical expenses based on the Fund’s actual expense ratio and an assumed rate of return of 5% per year before expenses, which is not the Fund’s actual return. The hypothetical account values and expenses may not be used to estimate the actual ending account balance or expenses you paid for the period. You may use this information to compare the ongoing costs of investing in the Fund and other funds. To do so, compare this 5% hypothetical example with the 5% hypothetical examples that appear in the shareholder reports of the other funds.
Please note that the expenses shown in the table are meant to highlight your ongoing costs only and do not reflect any transactional costs, such as sales charges (loads) and contingent deferred sales charges. Therefore, the “Hypothetical” line of the table is useful in comparing ongoing costs only and will not help you determine the relative total costs of owning different funds. In addition, if these transactional costs were included, your costs would have been higher.
| | | | | | | | | | | | | | | | |
| | | Beginning
account value
3-1-2018 | | | Ending
account value
8-31-2018 | | | Expenses
paid during
the period¹ | | | Annualized net
expense ratio | |
Class A | | | | | | | | | | | | | | | | |
Actual | | $ | 1,000.00 | | | $ | 1,008.99 | | | $ | 4.30 | | | | 0.85 | % |
Hypothetical (5% return before expenses) | | $ | 1,000.00 | | | $ | 1,020.92 | | | $ | 4.33 | | | | 0.85 | % |
Class C | | | | | | | | | | | | | | | | |
Actual | | $ | 1,000.00 | | | $ | 1,005.19 | | | $ | 8.09 | | | | 1.60 | % |
Hypothetical (5% return before expenses) | | $ | 1,000.00 | | | $ | 1,017.14 | | | $ | 8.13 | | | | 1.60 | % |
Administrator Class | | | | | | | | | | | | | | | | |
Actual | | $ | 1,000.00 | | | $ | 1,010.05 | | | $ | 3.24 | | | | 0.64 | % |
Hypothetical (5% return before expenses) | | $ | 1,000.00 | | | $ | 1,021.98 | | | $ | 3.26 | | | | 0.64 | % |
Institutional Class | | | | | | | | | | | | | | | | |
Actual | | $ | 1,000.00 | | | $ | 1,011.81 | | | $ | 2.43 | | | | 0.48 | % |
Hypothetical (5% return before expenses) | | $ | 1,000.00 | | | $ | 1,022.79 | | | $ | 2.45 | | | | 0.48 | % |
| 1 | Expenses paid is equal to the annualized net expense ratio of each class multiplied by the average account value over the period, multiplied by the number of days in the most recent fiscal half-year divided by the number of days in the fiscal year (to reflect the one-half-year period). |
| | | | | | |
| Portfolio of investments—August 31, 2018 | | Wells Fargo Government Securities Fund | | | 11 | |
| | | | | | | | | | | | | | | | |
| Security name | | Interest rate | | | Maturity date | | | Principal | | | Value | |
| | | | |
Agency Securities: 82.68% | | | | | | | | | | | | | | | | |
FDIC Series 2010-R1 Class A 144A | | | 2.18 | % | | | 5-25-2050 | | | $ | 261,226 | | | $ | 261,417 | |
FDIC Series 2013-R1 Class A 144A | | | 1.15 | | | | 3-25-2033 | | | | 1,607,345 | | | | 1,582,983 | |
FHLB | | | 5.63 | | | | 3-14-2036 | | | | 6,020,000 | | | | 7,850,772 | |
FHLMC | | | 1.42 | | | | 5-25-2021 | | | | 2,434,389 | | | | 2,397,689 | |
FHLMC | | | 2.38 | | | | 4-25-2023 | | | | 2,200,313 | | | | 2,163,256 | |
FHLMC | | | 2.46 | | | | 3-25-2022 | | | | 3,469,151 | | | | 3,415,936 | |
FHLMC (1 Month LIBOR +0.50%) ± | | | 2.56 | | | | 8-15-2037 | | | | 3,452,373 | | | | 3,480,523 | |
FHLMC | | | 2.62 | | | | 12-25-2026 | | | | 4,056,462 | | | | 3,940,663 | |
FHLMC | | | 2.75 | | | | 3-25-2027 | | | | 6,328,942 | | | | 6,233,099 | |
FHLMC (1 Month LIBOR +0.67%) ± | | | 2.75 | | | | 2-25-2023 | | | | 501,154 | | | | 502,550 | |
FHLMC | | | 2.90 | | | | 4-25-2026 | | | | 6,490,015 | | | | 6,420,710 | |
FHLMC | | | 3.00 | | | | 5-15-2026 | | | | 789,383 | | | | 786,778 | |
FHLMC | | | 3.00 | | | | 1-15-2054 | | | | 173,087 | | | | 170,573 | |
FHLMC (1 Month LIBOR +1.18%) ± | | | 3.24 | | | | 12-15-2036 | | | | 389,485 | | | | 403,587 | |
FHLMC ±± | | | 3.31 | | | | 5-25-2023 | | | | 2,800,000 | | | | 2,830,096 | |
FHLMC (11th District Cost of Funds +1.25%) ± | | | 3.41 | | | | 7-1-2032 | | | | 447,630 | | | | 449,185 | |
FHLMC (3 Year Treasury Constant Maturity +2.23%) ± | | | 3.46 | | | | 5-1-2026 | | | | 36,696 | | | | 36,513 | |
FHLMC | | | 3.50 | | | | 8-1-2045 | | | | 5,817,838 | | | | 5,798,448 | |
FHLMC | | | 3.50 | | | | 11-1-2045 | | | | 10,487,555 | | | | 10,452,598 | |
FHLMC | | | 3.50 | | | | 12-1-2045 | | | | 7,428,887 | | | | 7,404,127 | |
FHLMC | | | 3.50 | | | | 12-1-2045 | | | | 2,527,007 | | | | 2,518,591 | |
FHLMC (12 Month LIBOR +1.91%) ± | | | 3.66 | | | | 9-1-2031 | | | | 3,388 | | | | 3,424 | |
FHLMC (12 Month LIBOR +1.91%) ± | | | 3.66 | | | | 9-1-2031 | | | | 44,938 | | | | 45,179 | |
FHLMC (1 Year Treasury Constant Maturity +2.14%) ± | | | 3.74 | | | | 10-1-2026 | | | | 141,928 | | | | 146,009 | |
FHLMC (12 Month LIBOR +2.00%) ± | | | 3.75 | | | | 1-1-2038 | | | | 1,070,802 | | | | 1,130,443 | |
FHLMC | | | 4.00 | | | | 12-15-2024 | | | | 1,850,000 | | | | 1,895,945 | |
FHLMC | | | 4.00 | | | | 6-1-2044 | | | | 5,151,734 | | | | 5,259,873 | |
FHLMC (1 Year Treasury Constant Maturity +2.25%) ± | | | 4.31 | | | | 6-1-2032 | | | | 29,386 | | | | 30,485 | |
FHLMC (1 Year Treasury Constant Maturity +2.40%) ± | | | 4.37 | | | | 7-1-2029 | | | | 95,490 | | | | 98,435 | |
FHLMC | | | 4.50 | | | | 3-1-2042 | | | | 456,995 | | | | 479,831 | |
FHLMC | | | 4.50 | | | | 9-1-2044 | | | | 3,844,397 | | | | 4,000,998 | |
FHLMC | | | 5.00 | | | | 4-1-2019 | | | | 5,091 | | | | 5,118 | |
FHLMC | | | 5.00 | | | | 4-1-2019 | | | | 7,394 | | | | 7,433 | |
FHLMC | | | 5.00 | | | | 6-1-2019 | | | | 37,859 | | | | 38,057 | |
FHLMC | | | 5.00 | | | | 8-1-2019 | | | | 114,823 | | | | 116,656 | |
FHLMC | | | 5.00 | | | | 10-1-2019 | | | | 56,227 | | | | 56,521 | |
FHLMC | | | 5.00 | | | | 2-1-2020 | | | | 184,890 | | | | 185,912 | |
FHLMC | | | 5.00 | | | | 8-1-2040 | | | | 1,176,619 | | | | 1,256,716 | |
FHLMC | | | 5.11 | | | | 5-25-2019 | | | | 1,140,000 | | | | 1,150,505 | |
FHLMC | | | 5.50 | | | | 7-1-2035 | | | | 3,630,913 | | | | 3,951,068 | |
FHLMC | | | 5.50 | | | | 12-1-2038 | | | | 2,150,577 | | | | 2,325,839 | |
FHLMC | | | 6.00 | | | | 10-1-2032 | | | | 29,890 | | | | 33,017 | |
FHLMC | | | 6.00 | | | | 5-25-2043 | | | | 4,489,612 | | | | 4,862,479 | |
FHLMC (1 Year Treasury Constant Maturity +2.13%) ± | | | 6.38 | | | | 1-1-2026 | | | | 57,314 | | | | 55,016 | |
FHLMC | | | 6.50 | | | | 4-1-2021 | | | | 1,868 | | | | 1,902 | |
FHLMC | | | 6.50 | | | | 4-1-2022 | | | | 36,684 | | | | 40,514 | |
FHLMC | | | 6.50 | | | | 9-1-2028 | | | | 16,980 | | | | 18,753 | |
FHLMC | | | 6.50 | | | | 9-1-2028 | | | | 19,033 | | | | 21,019 | |
FHLMC | | | 6.50 | | | | 7-1-2031 | | | | 3 | | | | 3 | |
FHLMC | | | 7.00 | | | | 12-1-2023 | | | | 2,617 | | | | 2,799 | |
The accompanying notes are an integral part of these financial statements.
| | | | |
| 12 | | Wells Fargo Government Securities Fund | | Portfolio of investments—August 31, 2018 |
| | | | | | | | | | | | | | | | |
| Security name | | Interest rate | | | Maturity date | | | Principal | | | Value | |
| | | | |
Agency Securities (continued) | | | | | | | | | | | | | | | | |
FHLMC | | | 7.00 | % | | | 12-1-2026 | | | $ | 1,947 | | | $ | 1,978 | |
FHLMC | | | 7.00 | | | | 12-1-2026 | | | | 429 | | | | 453 | |
FHLMC | | | 7.00 | | | | 4-1-2029 | | | | 1,545 | | | | 1,715 | |
FHLMC | | | 7.00 | | | | 5-1-2029 | | | | 9,015 | | | | 10,031 | |
FHLMC | | | 7.00 | | | | 4-1-2032 | | | | 99,135 | | | | 111,255 | |
FHLMC | | | 7.50 | | | | 11-1-2031 | | | | 189,553 | | | | 213,668 | |
FHLMC | | | 7.50 | | | | 4-1-2032 | | | | 166,326 | | | | 185,708 | |
FHLMC | | | 8.00 | | | | 8-1-2023 | | | | 7,433 | | | | 7,806 | |
FHLMC | | | 8.00 | | | | 6-1-2024 | | | | 4,172 | | | | 4,451 | |
FHLMC | | | 8.00 | | | | 6-1-2024 | | | | 2,756 | | | | 2,789 | |
FHLMC | | | 8.00 | | | | 6-1-2024 | | | | 6,768 | | | | 7,064 | |
FHLMC | | | 8.00 | | | | 8-1-2026 | | | | 15,466 | | | | 17,357 | |
FHLMC | | | 8.00 | | | | 11-1-2026 | | | | 14,395 | | | | 16,076 | |
FHLMC | | | 8.00 | | | | 11-1-2028 | | | | 9,817 | | | | 10,552 | |
FHLMC | | | 8.50 | | | | 7-1-2022 | | | | 1,054 | | | | 1,065 | |
FHLMC | | | 8.50 | | | | 12-1-2025 | | | | 9,746 | | | | 10,529 | |
FHLMC | | | 8.50 | | | | 5-1-2026 | | | | 1,416 | | | | 1,516 | |
FHLMC | | | 8.50 | | | | 8-1-2026 | | | | 5,008 | | | | 5,064 | |
FHLMC | | | 8.50 | | | | 8-1-2026 | | | | 17,899 | | | | 17,939 | |
FHLMC | | | 9.00 | | | | 12-1-2019 | | | | 4 | | | | 4 | |
FHLMC | | | 9.00 | | | | 1-1-2020 | | | | 3 | | | | 3 | |
FHLMC | | | 9.00 | | | | 2-1-2020 | | | | 37 | | | | 38 | |
FHLMC | | | 9.00 | | | | 3-1-2020 | | | | 276 | | | | 276 | |
FHLMC | | | 9.00 | | | | 9-1-2020 | | | | 36 | | | | 36 | |
FHLMC | | | 9.00 | | | | 9-1-2020 | | | | 272 | | | | 272 | |
FHLMC | | | 9.00 | | | | 12-1-2020 | | | | 8 | | | | 8 | |
FHLMC | | | 9.00 | | | | 3-1-2021 | | | | 786 | | | | 791 | |
FHLMC | | | 9.00 | | | | 4-1-2021 | | | | 387 | | | | 388 | |
FHLMC | | | 9.00 | | | | 4-1-2021 | | | | 94 | | | | 98 | |
FHLMC | | | 9.00 | | | | 7-1-2021 | | | | 1,740 | | | | 1,745 | |
FHLMC | | | 9.00 | | | | 7-1-2021 | | | | 2,124 | | | | 2,135 | |
FHLMC | | | 9.00 | | | | 8-1-2021 | | | | 171 | | | | 179 | |
FHLMC | | | 9.00 | | | | 7-1-2022 | | | | 228 | | | | 230 | |
FHLMC | | | 9.00 | | | | 9-1-2024 | | | | 321 | | | | 324 | |
FHLMC | | | 9.50 | | | | 8-1-2019 | | | | 10 | | | | 10 | |
FHLMC | | | 9.50 | | | | 2-1-2020 | | | | 1 | | | | 1 | |
FHLMC | | | 9.50 | | | | 6-1-2020 | | | | 11 | | | | 11 | |
FHLMC | | | 9.50 | | | | 8-1-2020 | | | | 70 | | | | 72 | |
FHLMC | | | 9.50 | | | | 9-1-2020 | | | | 9 | | | | 9 | |
FHLMC | | | 9.50 | | | | 9-1-2020 | | | | 293 | | | | 295 | |
FHLMC | | | 9.50 | | | | 9-1-2020 | | | | 11 | | | | 11 | |
FHLMC | | | 9.50 | | | | 10-1-2020 | | | | 19 | | | | 20 | |
FHLMC | | | 9.50 | | | | 10-1-2020 | | | | 12 | | | | 12 | |
FHLMC | | | 9.50 | | | | 11-1-2020 | | | | 27 | | | | 28 | |
FHLMC | | | 9.50 | | | | 5-1-2021 | | | | 86 | | | | 90 | |
FHLMC | | | 9.50 | | | | 9-17-2022 | | | | 62,228 | | | | 62,074 | |
FHLMC | | | 9.50 | | | | 4-1-2025 | | | | 14,649 | | | | 14,818 | |
FHLMC | | | 10.00 | | | | 12-1-2019 | | | | 49 | | | | 49 | |
FHLMC | | | 10.00 | | | | 3-1-2020 | | | | 2 | | | | 2 | |
FHLMC | | | 10.00 | | | | 6-1-2020 | | | | 6 | | | | 7 | |
The accompanying notes are an integral part of these financial statements.
| | | | | | |
| Portfolio of investments—August 31, 2018 | | Wells Fargo Government Securities Fund | | | 13 | |
| | | | | | | | | | | | | | | | |
| Security name | | Interest rate | | | Maturity date | | | Principal | | | Value | |
| | | | |
Agency Securities (continued) | | | | | | | | | | | | | | | | |
FHLMC | | | 10.00 | % | | | 8-1-2020 | | | $ | 11 | | | $ | 11 | |
FHLMC | | | 10.00 | | | | 10-1-2021 | | | | 3,065 | | | | 3,085 | |
FHLMC | | | 10.00 | | | | 8-17-2022 | | | | 2,029 | | | | 2,010 | |
FHLMC | | | 10.00 | | | | 2-17-2025 | | | | 101,952 | | | | 102,381 | |
FHLMC | | | 10.50 | | | | 5-1-2019 | | | | 1 | | | | 1 | |
FHLMC | | | 10.50 | | | | 6-1-2019 | | | | 1 | | | | 1 | |
FHLMC | | | 10.50 | | | | 8-1-2019 | | | | 1,349 | | | | 1,353 | |
FHLMC | | | 10.50 | | | | 12-1-2019 | | | | 5,326 | | | | 5,329 | |
FHLMC | | | 10.50 | | | | 5-1-2020 | | | | 2,295 | | | | 2,307 | |
FHLMC | | | 10.50 | | | | 8-1-2020 | | | | 3,599 | | | | 3,617 | |
FHLMC Multifamily Structured Passthrough Series K075 Class A2 ±± | | | 3.65 | | | | 2-25-2028 | | | | 4,370,000 | | | | 4,443,669 | |
FHLMC Series 2015-SC01 Class 1A | | | 3.50 | | | | 5-25-2045 | | | | 2,436,397 | | | | 2,406,705 | |
FHLMC Series 2758 Class FH (1 Month LIBOR +0.35%) ± | | | 2.41 | | | | 3-15-2019 | | | | 71,959 | | | | 71,977 | |
FHLMC Series 2882 Class TF (1 Month LIBOR +0.25%) ± | | | 2.31 | | | | 10-15-2034 | | | | 333,795 | | | | 334,342 | |
FHLMC Series 3767 Class PD | | | 4.00 | | | | 7-15-2040 | | | | 18,547 | | | | 18,547 | |
FHLMC Series 3948 Class DA | | | 3.00 | | | | 12-15-2024 | | | | 189,432 | | | | 189,707 | |
FHLMC Series 4218 Class DF (1 Month LIBOR +0.25%) ± | | | 2.31 | | | | 7-15-2042 | | | | 754,761 | | | | 753,647 | |
FHLMC Series K020 Class X1 ±±(c) | | | 1.55 | | | | 5-25-2022 | | | | 44,530,662 | | | | 1,902,580 | |
FHLMC Series KJ14 Class A1 | | | 2.20 | | | | 11-25-2023 | | | | 4,969,828 | | | | 4,809,556 | |
FHLMC Series M036 Class A | | | 4.16 | | | | 12-15-2029 | | | | 3,765,000 | | | | 3,663,157 | |
FHLMC Series T-15 Class A6 (1 Month LIBOR +0.40%) ± | | | 2.46 | | | | 11-25-2028 | | | | 239,835 | | | | 238,869 | |
FHLMC Series T-23 Class A (1 Month LIBOR +0.28%) ± | | | 2.34 | | | | 5-25-2030 | | | | 628,866 | | | | 628,428 | |
FHLMC Series T-35 Class A (1 Month LIBOR +0.28%) ± | | | 2.34 | | | | 9-25-2031 | | | | 793,210 | | | | 785,113 | |
FHLMC Series T-42 Class A6 | | | 9.50 | | | | 2-25-2042 | | | | 815,307 | | | | 970,819 | |
FHLMC Series T-55 Class 2A1 ±± | | | 3.72 | | | | 3-25-2043 | | | | 450,641 | | | | 444,539 | |
FHLMC Series T-57 Class 1A1 | | | 6.50 | | | | 7-25-2043 | | | | 1,089,206 | | | | 1,225,411 | |
FHLMC Series T-57 Class 2A1 ±± | | | 3.92 | | | | 7-25-2043 | | | | 2,092,382 | | | | 2,197,354 | |
FHLMC Series T-62 Class 1A1 (12 Month Treasury Average +1.20%) ± | | | 2.95 | | | | 10-25-2044 | | | | 1,187,209 | | | | 1,183,211 | |
FHLMC Series T-67 Class 1A1C ±± | | | 3.67 | | | | 3-25-2036 | | | | 826,276 | | | | 839,551 | |
FHLMC Series T-67 Class 2A1C ±± | | | 3.43 | | | | 3-25-2036 | | | | 1,456,519 | | | | 1,454,725 | |
FHLMC Series T-75 Class A1 (1 Month LIBOR +0.04%) ± | | | 2.10 | | | | 12-25-2036 | | | | 1,121,580 | | | | 1,119,303 | |
FNMA ¤ | | | 0.00 | | | | 10-9-2019 | | | | 9,590,000 | | | | 9,318,756 | |
FNMA ¤ | | | 0.00 | | | | 5-15-2030 | | | | 7,700,000 | | | | 5,164,182 | |
FNMA | | | 1.71 | | | | 12-1-2022 | | | | 3,502,447 | | | | 3,399,112 | |
FNMA | | | 1.78 | | | | 5-1-2020 | | | | 903,146 | | | | 885,058 | |
FNMA (11th District Cost of Funds +1.26%) ± | | | 2.23 | | | | 5-1-2036 | | | | 1,498,471 | | | | 1,494,196 | |
FNMA (1 Month LIBOR +0.35%) ± | | | 2.41 | | | | 2-25-2032 | | | | 630,036 | | | | 634,462 | |
FNMA %% | | | 2.50 | | | | 9-18-2033 | | | | 4,960,000 | | | | 4,822,746 | |
FNMA | | | 2.50 | | | | 4-25-2039 | | | | 68,776 | | | | 67,957 | |
FNMA (12 Month LIBOR +1.61%) ± | | | 2.51 | | | | 5-1-2046 | | | | 5,331,103 | | | | 5,273,995 | |
FNMA (11th District Cost of Funds +1.63%) ± | | | 2.51 | | | | 5-1-2023 | | | | 171,876 | | | | 171,800 | |
FNMA (1 Month LIBOR +0.48%) ± | | | 2.54 | | | | 9-25-2037 | | | | 2,967,168 | | | | 2,990,232 | |
FNMA (1 Month LIBOR +0.25%) ± | | | 2.55 | | | | 6-27-2036 | | | | 111,189 | | | | 109,150 | |
FNMA | | | 2.55 | | | | 3-1-2022 | | | | 1,618,808 | | | | 1,592,786 | |
FNMA | | | 2.56 | | | | 3-1-2021 | | | | 942,954 | | | | 930,148 | |
FNMA (11th District Cost of Funds +1.25%) ± | | | 2.59 | | | | 9-1-2027 | | | | 205,870 | | | | 206,961 | |
FNMA (1 Month LIBOR +0.55%) ± | | | 2.61 | | | | 4-25-2050 | | | | 1,834,917 | | | | 1,837,647 | |
FNMA | | | 2.86 | | | | 11-1-2021 | | | | 2,575,967 | | | | 2,556,048 | |
FNMA ±± | | | 2.88 | | | | 2-25-2027 | | | | 10,000,000 | | | | 9,578,047 | |
FNMA | | | 2.91 | | | | 1-1-2024 | | | | 3,123,414 | | | | 3,120,165 | |
The accompanying notes are an integral part of these financial statements.
| | | | |
| 14 | | Wells Fargo Government Securities Fund | | Portfolio of investments—August 31, 2018 |
| | | | | | | | | | | | | | | | |
| Security name | | Interest rate | | | Maturity date | | | Principal | | | Value | |
| | | | |
Agency Securities (continued) | | | | | | | | | | | | | | | | |
FNMA | | | 3.00 | % | | | 5-1-2027 | | | $ | 1,547,056 | | | $ | 1,548,750 | |
FNMA %% | | | 3.00 | | | | 9-18-2033 | | | | 13,275,000 | | | | 13,191,287 | |
FNMA | | | 3.00 | | | | 4-1-2045 | | | | 132,705 | | | | 128,882 | |
FNMA | | | 3.00 | | | | 11-1-2045 | | | | 10,618,713 | | | | 10,291,691 | |
FNMA | | | 3.00 | | | | 12-1-2045 | | | | 24,379,944 | | | | 23,615,202 | |
FNMA | | | 3.00 | | | | 11-1-2046 | | | | 7,292,030 | | | | 7,056,704 | |
FNMA | | | 3.00 | | | | 12-1-2046 | | | | 812,928 | | | | 786,694 | |
FNMA | | | 3.02 | | | | 2-1-2026 | | | | 6,238,483 | | | | 6,131,045 | |
FNMA (11th District Cost of Funds +1.25%) ± | | | 3.23 | | | | 5-1-2036 | | | | 490,724 | | | | 504,473 | |
FNMA (12 Month LIBOR +1.54%) ± | | | 3.31 | | | | 1-1-2043 | | | | 373,416 | | | | 387,106 | |
FNMA | | | 3.31 | | | | 9-25-2020 | | | | 3,690,783 | | | | 3,701,729 | |
FNMA | | | 3.38 | | | | 9-1-2020 | | | | 1,887,318 | | | | 1,900,802 | |
FNMA (1 Year Treasury Constant Maturity +2.19%) ± | | | 3.43 | | | | 11-1-2031 | | | | 128,653 | | | | 134,744 | |
FNMA (12 Month LIBOR +1.73%) ± | | | 3.49 | | | | 9-1-2036 | | | | 546,031 | | | | 572,819 | |
FNMA | | | 3.49 | | | | 12-1-2020 | | | | 3,404,055 | | | | 3,437,463 | |
FNMA %% | | | 3.50 | | | | 9-18-2033 | | | | 16,320,000 | | | | 16,492,223 | |
FNMA | | | 3.50 | | | | 2-1-2043 | | | | 66,741 | | | | 66,856 | |
FNMA | | | 3.50 | | | | 2-1-2045 | | | | 2,088,275 | | | | 2,086,051 | |
FNMA ## | | | 3.50 | | | | 4-1-2045 | | | | 5,946,997 | | | | 5,926,856 | |
FNMA | | | 3.50 | | | | 8-1-2045 | | | | 737,055 | | | | 734,217 | |
FNMA | | | 3.50 | | | | 12-1-2045 | | | | 2,826,037 | | | | 2,815,152 | |
FNMA | | | 3.50 | | | | 2-1-2046 | | | | 4,446,921 | | | | 4,428,871 | |
FNMA | | | 3.50 | | | | 5-1-2046 | | | | 6,385,038 | | | | 6,356,486 | |
FNMA (1 Year Treasury Constant Maturity +2.23%) ± | | | 3.69 | | | | 12-1-2034 | | | | 842,260 | | | | 879,998 | |
FNMA (1 Year Treasury Constant Maturity +2.23%) ± | | | 3.86 | | | | 12-1-2040 | | | | 26,047 | | | | 27,328 | |
FNMA (12 Month LIBOR +1.64%) ± | | | 3.89 | | | | 4-1-2032 | | | | 83,831 | | | | 84,572 | |
FNMA (12 Month LIBOR +1.80%) ± | | | 3.92 | | | | 8-1-2036 | | | | 849,936 | | | | 891,948 | |
FNMA (1 Year Treasury Constant Maturity +2.21%) ± | | | 3.99 | | | | 9-1-2031 | | | | 31,257 | | | | 32,724 | |
FNMA | | | 4.00 | | | | 5-1-2021 | | | | 225,815 | | | | 231,142 | |
FNMA | | | 4.00 | | | | 10-25-2025 | | | | 492,707 | | | | 10,339 | |
FNMA ## | | | 4.00 | | | | 4-1-2046 | | | | 15,909,432 | | | | 16,212,212 | |
FNMA | | | 4.00 | | | | 3-1-2047 | | | | 1,549,488 | | | | 1,588,608 | |
FNMA %% | | | 4.00 | | | | 9-13-2048 | | | | 6,475,000 | | | | 6,591,443 | |
FNMA (1 Year Treasury Constant Maturity +2.43%) ± | | | 4.04 | | | | 10-1-2027 | | | | 156,084 | | | | 161,207 | |
FNMA (1 Year Treasury Constant Maturity +2.27%) ± | | | 4.08 | | | | 9-1-2031 | | | | 246,887 | | | | 256,640 | |
FNMA (1 Year Treasury Constant Maturity +2.06%) ± | | | 4.16 | | | | 2-1-2027 | | | | 17,637 | | | | 17,637 | |
FNMA (1 Year Treasury Constant Maturity +2.22%) ± | | | 4.19 | | | | 6-1-2032 | | | | 117,364 | | | | 121,751 | |
FNMA (1 Year Treasury Constant Maturity +2.32%) ± | | | 4.35 | | | | 7-1-2026 | | | | 138,416 | | | | 143,464 | |
FNMA (1 Year Treasury Constant Maturity +2.30%) ± | | | 4.42 | | | | 6-1-2034 | | | | 469,653 | | | | 488,146 | |
FNMA | | | 4.50 | | | | 12-1-2018 | | | | 19,511 | | | | 19,709 | |
FNMA | | | 4.50 | | | | 1-1-2026 | | | | 266,679 | | | | 269,417 | |
FNMA | | | 4.50 | | | | 10-1-2046 | | | | 462,889 | | | | 480,683 | |
FNMA %% | | | 4.50 | | | | 9-13-2048 | | | | 34,002,000 | | | | 35,300,485 | |
FNMA | | | 4.68 | | | | 2-1-2020 | | | | 3,046,256 | | | | 3,118,550 | |
FNMA | | | 5.00 | | | | 12-1-2018 | | | | 7,742 | | | | 7,932 | |
FNMA | | | 5.00 | | | | 6-1-2019 | | | | 315 | | | | 323 | |
FNMA | | | 5.00 | | | | 4-1-2023 | | | | 235,471 | | | | 245,778 | |
FNMA | | | 5.00 | | | | 6-1-2023 | | | | 462,479 | | | | 479,989 | |
FNMA | | | 5.00 | | | | 3-1-2034 | | | | 503,730 | | | | 538,101 | |
FNMA | | | 5.00 | | | | 8-1-2040 | | | | 6,386,546 | | | | 6,872,491 | |
The accompanying notes are an integral part of these financial statements.
| | | | | | |
| Portfolio of investments—August 31, 2018 | | Wells Fargo Government Securities Fund | | | 15 | |
| | | | | | | | | | | | | | | | |
| Security name | | Interest rate | | | Maturity date | | | Principal | | | Value | |
| | | | |
Agency Securities (continued) | | | | | | | | | | | | | | | | |
FNMA | | | 5.00 | % | | | 10-1-2040 | | | $ | 748,674 | | | $ | 801,902 | |
FNMA | | | 5.00 | | | | 1-1-2042 | | | | 598,558 | | | | 641,032 | |
FNMA %% | | | 5.00 | | | | 9-13-2048 | | | | 7,525,000 | | | | 7,954,480 | |
FNMA (6 Month LIBOR +2.86%) ± | | | 5.38 | | | | 4-1-2033 | | | | 20,781 | | | | 21,510 | |
FNMA | | | 5.39 | | | | 1-1-2024 | | | | 1,692,171 | | | | 1,772,615 | |
FNMA | | | 5.50 | | | | 6-1-2020 | | | | 154,200 | | | | 155,696 | |
FNMA | | | 5.50 | | | | 11-1-2023 | | | | 72,977 | | | | 75,994 | |
FNMA | | | 5.50 | | | | 1-1-2025 | | | | 37,903 | | | | 39,253 | |
FNMA | | | 5.50 | | | | 1-1-2025 | | | | 175,380 | | | | 181,440 | |
FNMA | | | 5.50 | | | | 9-1-2033 | | | | 1,962,168 | | | | 2,135,627 | |
FNMA | | | 5.50 | | | | 9-1-2033 | | | | 796,057 | | | | 865,280 | |
FNMA | | | 5.50 | | | | 8-1-2035 | | | | 586,920 | | | | 636,867 | |
FNMA | | | 5.50 | | | | 1-1-2037 | | | | 602,846 | | | | 654,720 | |
FNMA | | | 5.50 | | | | 4-1-2040 | | | | 1,557,328 | | | | 1,692,954 | |
FNMA | | | 5.55 | | | | 9-1-2019 | | | | 20,934 | | | | 20,895 | |
FNMA | | | 5.61 | | | | 2-1-2021 | | | | 1,165,471 | | | | 1,190,225 | |
FNMA | | | 5.67 | | | | 11-1-2021 | | | | 5,057,349 | | | | 5,256,768 | |
FNMA | | | 5.75 | | | | 5-1-2021 | | | | 3,166,649 | | | | 3,288,894 | |
FNMA | | | 5.95 | | | | 6-1-2024 | | | | 1,606,821 | | | | 1,700,244 | |
FNMA | | | 6.00 | | | | 3-1-2024 | | | | 65,782 | | | | 71,297 | |
FNMA | | | 6.00 | | | | 1-1-2028 | | | | 951,245 | | | | 1,031,393 | |
FNMA | | | 6.00 | | | | 2-1-2035 | | | | 1,290,975 | | | | 1,383,304 | |
FNMA | | | 6.00 | | | | 11-1-2037 | | | | 475,724 | | | | 525,970 | |
FNMA | | | 6.00 | | | | 7-1-2038 | | | | 180,178 | | | | 198,842 | |
FNMA | | | 6.08 | | | | 1-1-2019 | | | | 118,645 | | | | 118,422 | |
FNMA (6 Month LIBOR +3.13%) ± | | | 6.24 | | | | 7-1-2033 | | | | 142,450 | | | | 145,899 | |
FNMA | | | 6.50 | | | | 1-1-2024 | | | | 22,126 | | | | 24,245 | |
FNMA | | | 6.50 | | | | 3-1-2028 | | | | 21,186 | | | | 22,022 | |
FNMA | | | 6.50 | | | | 12-1-2029 | | | | 221,141 | | | | 244,070 | |
FNMA | | | 6.50 | | | | 11-1-2031 | | | | 50,916 | | | | 55,793 | |
FNMA | | | 6.50 | | | | 7-1-2036 | | | | 366,244 | | | | 409,171 | |
FNMA | | | 6.50 | | | | 7-1-2036 | | | | 306,237 | | | | 338,870 | |
FNMA | | | 6.50 | | | | 7-25-2042 | | | | 1,521,161 | | | | 1,692,089 | |
FNMA | | | 7.00 | | | | 11-1-2026 | | | | 5,538 | | | | 5,804 | |
FNMA | | | 7.00 | | | | 9-1-2031 | | | | 4,039 | | | | 4,040 | |
FNMA | | | 7.00 | | | | 1-1-2032 | | | | 2,105 | | | | 2,222 | |
FNMA | | | 7.00 | | | | 2-1-2032 | | | | 88,438 | | | | 101,008 | |
FNMA | | | 7.00 | | | | 10-1-2032 | | | | 199,436 | | | | 228,530 | |
FNMA | | | 7.00 | | | | 2-1-2034 | | | | 1,985 | | | | 2,178 | |
FNMA | | | 7.00 | | | | 4-1-2034 | | | | 141,337 | | | | 160,287 | |
FNMA | | | 7.00 | | | | 1-1-2036 | | | | 6,358 | | | | 6,659 | |
FNMA | | | 7.50 | | | | 9-1-2031 | | | | 90,077 | | | | 102,956 | |
FNMA | | | 7.50 | | | | 11-25-2031 | | | | 391,318 | | | | 442,127 | |
FNMA | | | 7.50 | | | | 2-1-2032 | | | | 32,712 | | | | 37,043 | |
FNMA | | | 7.50 | | | | 10-1-2037 | | | | 913,002 | | | | 1,075,507 | |
FNMA | | | 8.00 | | | | 5-1-2027 | | | | 31,479 | | | | 31,947 | |
FNMA | | | 8.00 | | | | 10-1-2027 | | | | 1,476 | | | | 1,478 | |
FNMA | | | 8.00 | | | | 6-1-2028 | | | | 5,219 | | | | 5,635 | |
FNMA | | | 8.00 | | | | 2-1-2030 | | | | 55,083 | | | | 59,180 | |
FNMA | | | 8.00 | | | | 7-1-2031 | | | | 991,751 | | | | 1,111,304 | |
The accompanying notes are an integral part of these financial statements.
| | | | |
| 16 | | Wells Fargo Government Securities Fund | | Portfolio of investments—August 31, 2018 |
| | | | | | | | | | | | | | | | |
| Security name | | Interest rate | | | Maturity date | | | Principal | | | Value | |
| | | | |
Agency Securities (continued) | | | | | | | | | | | | | | | | |
FNMA | | | 8.50 | % | | | 8-1-2024 | | | $ | 6,631 | | | $ | 6,690 | |
FNMA | | | 8.50 | | | | 5-1-2026 | | | | 104,884 | | | | 112,456 | |
FNMA | | | 8.50 | | | | 7-1-2026 | | | | 22,818 | | | | 23,457 | |
FNMA | | | 8.50 | | | | 8-1-2026 | | | | 11,734 | | | | 11,807 | |
FNMA | | | 8.50 | | | | 10-1-2026 | | | | 59 | | | | 59 | |
FNMA | | | 8.50 | | | | 10-1-2026 | | | | 4,303 | | | | 4,309 | |
FNMA | | | 8.50 | | | | 11-1-2026 | | | | 27,663 | | | | 28,009 | |
FNMA | | | 8.50 | | | | 11-1-2026 | | | | 7,550 | | | | 7,760 | |
FNMA | | | 8.50 | | | | 12-1-2026 | | | | 139,073 | | | | 153,557 | |
FNMA | | | 8.50 | | | | 12-1-2026 | | | | 15,746 | | | | 17,102 | |
FNMA | | | 8.50 | | | | 12-1-2026 | | | | 261 | | | | 261 | |
FNMA | | | 8.50 | | | | 2-1-2027 | | | | 225 | | | | 245 | |
FNMA | | | 8.50 | | | | 2-1-2027 | | | | 6,448 | | | | 6,457 | |
FNMA | | | 8.50 | | | | 3-1-2027 | | | | 776 | | | | 818 | |
FNMA | | | 8.50 | | | | 6-1-2027 | | | | 65,570 | | | | 67,586 | |
FNMA | | | 8.50 | | | | 7-1-2029 | | | | 812 | | | | 814 | |
FNMA | | | 9.00 | | | | 3-1-2021 | | | | 6,325 | | | | 6,365 | |
FNMA | | | 9.00 | | | | 6-1-2021 | | | | 72 | | | | 75 | |
FNMA | | | 9.00 | | | | 7-1-2021 | | | | 4,509 | | | | 4,528 | |
FNMA | | | 9.00 | | | | 8-1-2021 | | | | 90 | | | | 94 | |
FNMA | | | 9.00 | | | | 10-1-2021 | | | | 938 | | | | 943 | |
FNMA | | | 9.00 | | | | 1-1-2025 | | | | 16,069 | | | | 17,295 | |
FNMA | | | 9.00 | | | | 3-1-2025 | | | | 992 | | | | 994 | |
FNMA | | | 9.00 | | | | 3-1-2025 | | | | 1,890 | | | | 1,897 | |
FNMA | | | 9.00 | | | | 4-1-2025 | | | | 787 | | | | 788 | |
FNMA | | | 9.00 | | | | 7-1-2028 | | | | 4,536 | | | | 4,572 | |
FNMA | | | 9.50 | | | | 11-1-2020 | | | | 28 | | | | 28 | |
FNMA | | | 9.50 | | | | 12-15-2020 | | | | 8,240 | | | | 8,328 | |
FNMA | | | 9.50 | | | | 1-1-2021 | | | | 6,567 | | | | 6,635 | |
FNMA | | | 9.50 | | | | 6-1-2022 | | | | 518 | | | | 521 | |
FNMA | | | 9.50 | | | | 7-1-2028 | | | | 5,803 | | | | 5,815 | |
FNMA | | | 10.00 | | | | 12-1-2020 | | | | 492 | | | | 492 | |
FNMA | | | 11.00 | | | | 10-15-2020 | | | | 282 | | | | 286 | |
FNMA Series 1989-10 Class Z | | | 9.50 | | | | 3-25-2019 | | | | 5,571 | | | | 5,614 | |
FNMA Series 1989-100 Class Z | | | 8.75 | | | | 12-25-2019 | | | | 4,536 | | | | 4,622 | |
FNMA Series 1989-12 Class Y | | | 10.00 | | | | 3-25-2019 | | | | 4,612 | | | | 4,655 | |
FNMA Series 1989-22 Class G | | | 10.00 | | | | 5-25-2019 | | | | 12,294 | | | | 12,467 | |
FNMA Series 1989-63 Class Z | | | 9.40 | | | | 10-25-2019 | | | | 858 | | | | 877 | |
FNMA Series 1989-98 Class E | | | 9.20 | | | | 12-25-2019 | | | | 4,809 | | | | 4,836 | |
FNMA Series 1990-144 Class W | | | 9.50 | | | | 12-25-2020 | | | | 22,253 | | | | 23,488 | |
FNMA Series 1990-75 Class Z | | | 9.50 | | | | 7-25-2020 | | | | 38,091 | | | | 39,746 | |
FNMA Series 1990-84 Class Y | | | 9.00 | | | | 7-25-2020 | | | | 2,833 | | | | 2,947 | |
FNMA Series 1990-96 Class Z | | | 9.67 | | | | 8-25-2020 | | | | 40,299 | | | | 42,217 | |
FNMA Series 1991-5 Class Z | | | 8.75 | | | | 1-25-2021 | | | | 8,839 | | | | 9,063 | |
FNMA Series 1991-85 Class Z | | | 8.00 | | | | 6-25-2021 | | | | 18,709 | | | | 19,573 | |
FNMA Series 1992-45 Class Z | | | 8.00 | | | | 4-25-2022 | | | | 47,407 | | | | 50,148 | |
FNMA Series 1999-W6 Class A ±± | | | 9.68 | | | | 9-25-2028 | | | | 972 | | | | 970 | |
FNMA Series 2000-T6 Class A2 | | | 9.50 | | | | 11-25-2040 | | | | 722,882 | | | | 811,752 | |
FNMA Series 2001-T10 Class A3 | | | 9.50 | | | | 12-25-2041 | | | | 961,922 | | | | 1,097,770 | |
FNMA Series 2001-T12 Class A3 | | | 9.50 | | | | 8-25-2041 | | | | 260,348 | | | | 306,748 | |
The accompanying notes are an integral part of these financial statements.
| | | | | | |
| Portfolio of investments—August 31, 2018 | | Wells Fargo Government Securities Fund | | | 17 | |
| | | | | | | | | | | | | | | | |
| Security name | | Interest rate | | | Maturity date | | | Principal | | | Value | |
| | | | |
Agency Securities (continued) | | | | | | | | | | | | | | | | |
FNMA Series 2002-T12 Class A5 ±± | | | 4.52 | % | | | 10-25-2041 | | | $ | 908,253 | | | $ | 928,977 | |
FNMA Series 2002-T19 Class A1 | | | 6.50 | | | | 7-25-2042 | | | | 4,112,058 | | | | 4,621,444 | |
FNMA Series 2002-T5 Class A1 (1 Month LIBOR +0.24%) ± | | | 2.30 | | | | 5-25-2032 | | | | 196,548 | | | | 196,119 | |
FNMA Series 2002-W4 Class A4 | | | 6.25 | | | | 5-25-2042 | | | | 635,115 | | | | 695,070 | |
FNMA Series 2003-T2 Class A1 (1 Month LIBOR +0.14%) ± | | | 2.34 | | | | 3-25-2033 | | | | 1,098,884 | | | | 1,076,932 | |
FNMA Series 2003-W09 Class A (1 Month LIBOR +0.12%) ± | | | 2.18 | | | | 6-25-2033 | | | | 96,932 | | | | 95,161 | |
FNMA Series 2003-W1 Class 1A1 ±± | | | 5.42 | | | | 12-25-2042 | | | | 603,508 | | | | 629,359 | |
FNMA Series 2003-W11 Class A1 ±± | | | 5.27 | | | | 6-25-2033 | | | | 63,898 | | | | 66,683 | |
FNMA Series 2003-W3 Class 1A4 ±± | | | 3.86 | | | | 8-25-2042 | | | | 2,536,523 | | | | 2,629,677 | |
FNMA Series 2003-W5 Class A (1 Month LIBOR +0.11%) ± | | | 2.17 | | | | 4-25-2033 | | | | 319,080 | | | | 307,396 | |
FNMA Series 2003-W6 Class 6A ±± | | | 4.06 | | | | 8-25-2042 | | | | 1,571,826 | | | | 1,601,912 | |
FNMA Series 2003-W6 Class PT4 ±± | | | 8.22 | | | | 10-25-2042 | | | | 1,554,500 | | | | 1,867,682 | |
FNMA Series 2003-W8 Class PT1 ±± | | | 10.38 | | | | 12-25-2042 | | | | 575,205 | | | | 641,242 | |
FNMA Series 2004-79 Class FA (1 Month LIBOR +0.29%) ± | | | 2.35 | | | | 8-25-2032 | | | | 182,932 | | | | 183,085 | |
FNMA Series 2004-T1 Class 1A2 | | | 6.50 | | | | 1-25-2044 | | | | 580,346 | | | | 644,519 | |
FNMA Series 2004-W01 Class 2A2 | | | 7.00 | | | | 12-25-2033 | | | | 1,257,959 | | | | 1,416,079 | |
FNMA Series 2004-W15 Class 1A3 | | | 7.00 | | | | 8-25-2044 | | | | 799,156 | | | | 900,721 | |
FNMA Series 2005-71 Class DB | | | 4.50 | | | | 8-25-2025 | | | | 650,635 | | | | 661,928 | |
FNMA Series 2007-W10 Class 2A ±± | | | 6.32 | | | | 8-25-2047 | | | | 403,615 | | | | 431,087 | |
FNMA Series 2011-15 Class HI (c) | | | 5.50 | | | | 3-25-2026 | | | | 448,831 | | | | 18,558 | |
FNMA Series 2015-M10 Class FA (1 Month LIBOR +0.25%) ± | | | 2.33 | | | | 3-25-2019 | | | | 204,889 | | | | 204,603 | |
FNMA Series 265 Class 2 | | | 9.00 | | | | 3-25-2024 | | | | 73,709 | | | | 82,565 | |
FNMA Series G-8 Class E | | | 9.00 | | | | 4-25-2021 | | | | 29,705 | | | | 30,712 | |
FNMA Series G92-30 Class Z | | | 7.00 | | | | 6-25-2022 | | | | 43,188 | | | | 44,490 | |
FNMA Series G93-39 Class ZQ | | | 6.50 | | | | 12-25-2023 | | | | 1,075,860 | | | | 1,132,092 | |
GNMA (1 Year Treasury Constant Maturity +0.45%) ± | | | 2.78 | | | | 5-20-2066 | | | | 6,006,346 | | | | 6,005,643 | �� |
GNMA (1 Month LIBOR +0.70%) ± | | | 2.80 | | | | 8-20-2065 | | | | 3,632,477 | | | | 3,676,360 | |
GNMA (1 Month LIBOR +0.73%) ± | | | 2.83 | | | | 9-20-2063 | | | | 4,414,523 | | | | 4,448,864 | |
GNMA (1 Month LIBOR +0.80%) ± | | | 2.88 | | | | 9-20-2038 | | | | 1,233,390 | | | | 1,255,235 | |
GNMA (1 Month LIBOR +0.90%) ± | | | 3.00 | | | | 8-20-2065 | | | | 3,899,888 | | | | 3,969,843 | |
GNMA (1 Month LIBOR +0.90%) ± | | | 3.00 | | | | 4-20-2066 | | | | 5,071,176 | | | | 5,161,883 | |
GNMA (1 Year Treasury Constant Maturity +1.50%) ± | | | 3.00 | | | | 8-20-2020 | | | | 44,496 | | | | 44,575 | |
GNMA | | | 3.00 | | | | 11-20-2045 | | | | 14,270,118 | | | | 13,997,211 | |
GNMA (1 Year Treasury Constant Maturity +1.50%) ± | | | 3.13 | | | | 11-20-2020 | | | | 28,691 | | | | 28,782 | |
GNMA | | | 3.50 | | | | 12-20-2047 | | | | 14,812,288 | | | | 14,870,065 | |
GNMA %% | | | 3.50 | | | | 9-21-2048 | | | | 14,105,000 | | | | 14,149,905 | |
GNMA | | | 4.00 | | | | 12-20-2047 | | | | 14,723,461 | | | | 15,086,355 | |
GNMA | | | 5.00 | | | | 7-20-2040 | | | | 1,308,381 | | | | 1,407,789 | |
GNMA | | | 5.50 | | | | 4-20-2034 | | | | 878,452 | | | | 923,025 | |
GNMA | | | 6.00 | | | | 8-20-2034 | | | | 107,476 | | | | 113,703 | |
GNMA | | | 6.50 | | | | 12-15-2025 | | | | 25,127 | | | | 27,604 | |
GNMA | | | 6.50 | | | | 5-15-2029 | | | | 673 | | | | 740 | |
GNMA | | | 6.50 | | | | 5-15-2031 | | | | 1,278 | | | | 1,404 | |
GNMA | | | 6.50 | | | | 9-20-2033 | | | | 50,465 | | | | 56,903 | |
GNMA | | | 7.00 | | | | 12-15-2022 | | | | 20,744 | | | | 21,480 | |
GNMA | | | 7.00 | | | | 5-15-2026 | | | | 1,988 | | | | 2,080 | |
GNMA | | | 7.00 | | | | 3-15-2028 | | | | 38,406 | | | | 40,342 | |
GNMA | | | 7.00 | | | | 4-15-2031 | | | | 969 | | | | 982 | |
GNMA | | | 7.00 | | | | 8-15-2031 | | | | 19,368 | | | | 19,979 | |
GNMA | | | 7.00 | | | | 3-15-2032 | | | | 14,501 | | | | 14,726 | |
GNMA | | | 7.34 | | | | 10-20-2021 | | | | 27,146 | | | | 27,328 | |
GNMA | | | 7.34 | | | | 2-20-2022 | | | | 2,797 | | | | 2,798 | |
The accompanying notes are an integral part of these financial statements.
| | | | |
| 18 | | Wells Fargo Government Securities Fund | | Portfolio of investments—August 31, 2018 |
| | | | | | | | | | | | | | | | |
| Security name | | Interest rate | | | Maturity date | | | Principal | | | Value | |
| | | | |
Agency Securities (continued) | | | | | | | | | | | | | | | | |
GNMA | | | 7.34 | % | | | 9-20-2022 | | | $ | 8,228 | | | $ | 8,237 | |
GNMA | | | 8.00 | | | | 6-15-2023 | | | | 3,146 | | | | 3,311 | |
GNMA | | | 8.00 | | | | 12-15-2023 | | | | 191,073 | | | | 205,051 | |
GNMA | | | 8.00 | | | | 2-15-2024 | | | | 647 | | | | 685 | |
GNMA | | | 8.00 | | | | 9-15-2024 | | | | 3,162 | | | | 3,208 | |
GNMA | | | 8.00 | | | | 6-15-2025 | | | | 61 | | | | 61 | |
GNMA | | | 8.35 | | | | 4-15-2020 | | | | 36,989 | | | | 37,239 | |
GNMA | | | 8.40 | | | | 5-15-2020 | | | | 27,051 | | | | 27,104 | |
GNMA | | | 9.50 | | | | 10-20-2019 | | | | 1,085 | | | | 1,086 | |
GNMA Series 2002-53 Class IO ±±(c) | | | 0.60 | | | | 4-16-2042 | | | | 420,346 | | | | 4 | |
GNMA Series 2005-23 Class IO ±±(c) | | | 0.01 | | | | 6-17-2045 | | | | 2,580,170 | | | | 1,009 | |
GNMA Series 2006-32 Class XM ±±(c) | | | 0.03 | | | | 11-16-2045 | | | | 7,072,216 | | | | 5,954 | |
GNMA Series 2006-68 Class D ±± | | | 5.31 | | | | 12-16-2037 | | | | 948,239 | | | | 952,714 | |
GNMA Series 2007-69 Class D ±± | | | 5.25 | | | | 6-16-2041 | | | | 573,761 | | | | 585,650 | |
GNMA Series 2008-22 Class XM ±±(c) | | | 0.96 | | | | 2-16-2050 | | | | 16,378,553 | | | | 408,535 | |
GNMA Series 2012-12 Class HD | | | 2.00 | | | | 5-20-2062 | | | | 1,364,838 | | | | 1,354,276 | |
GNMA Series 2016-H07 Class FE (1 Month LIBOR +1.15%) ± | | | 3.25 | | | | 3-20-2066 | | | | 4,388,056 | | | | 4,518,259 | |
GNMA Series 2016-H07 Class FH (1 Month LIBOR +1.00%) ± | | | 3.10 | | | | 2-20-2066 | | | | 4,066,534 | | | | 4,160,799 | |
Resolution Funding Corporation STRIPS ¤ | | | 0.00 | | | | 7-15-2020 | | | | 24,300,000 | | | | 23,093,420 | |
Resolution Funding Corporation STRIPS ¤ | | | 0.00 | | | | 4-15-2030 | | | | 6,100,000 | | | | 4,175,134 | |
TVA ¤ | | | 0.00 | | | | 11-1-2025 | | | | 10,000,000 | | | | 7,926,841 | |
TVA | | | 2.88 | | | | 2-1-2027 | | | | 2,430,000 | | | | 2,373,223 | |
TVA | | | 4.63 | | | | 9-15-2060 | | | | 7,550,000 | | | | 9,063,586 | |
TVA | | | 5.38 | | | | 4-1-2056 | | | | 4,900,000 | | | | 6,557,871 | |
TVA | | | 5.88 | | | | 4-1-2036 | | | | 4,380,000 | | | | 5,718,948 | |
| | | | |
Total Agency Securities (Cost $591,331,560) | | | | | | | | | | | | | | | 587,664,694 | |
| | | | | | | | | | | | | | | | |
| | | | |
Asset-Backed Securities: 2.00% | | | | | | | | | | | | | | | | |
Chesapeake Funding LLC Series 2017-3A Class A 144A | | | 1.91 | | | | 8-15-2029 | | | | 5,732,716 | | | | 5,666,828 | |
Hyundai Auto Lease Securitization Trust Series 2017-B Class A3 144A | | | 1.97 | | | | 7-15-2020 | | | | 4,200,000 | | | | 4,171,563 | |
MMAF Equipment Finance LLC Series 2017-AA Class A4 144A | | | 2.41 | | | | 8-16-2024 | | | | 4,445,000 | | | | 4,350,127 | |
| | | | |
Total Asset-Backed Securities (Cost $14,348,572) | | | | | | | | | | | | | | | 14,188,518 | |
| | | | | | | | | | | | | | | | |
| | | | |
Corporate Bonds and Notes: 1.65% | | | | | | | | | | | | | | | | |
| | | | |
Financials: 0.55% | | | | | | | | | | | | | | | | |
| | | | |
| Mortgage REITs: 0.55% | | | | | | | | | | | | | | | | |
American Tower Trust I 144A | | | 3.65 | | | | 3-23-2048 | | | | 4,000,000 | | | | 3,941,292 | |
| | | | | | | | | | | | | | | | |
| | | | |
Utilities: 1.10% | | | | | | | | | | | | | | | | |
| | | | |
| Electric Utilities: 1.10% | | | | | | | | | | | | | | | | |
Cleveland Thermal LLC | | | 6.25 | | | | 11-1-2018 | | | | 205,000 | | | | 206,104 | |
Cleveland Thermal LLC | | | 7.75 | | | | 11-1-2025 | | | | 2,665,000 | | | | 2,763,550 | |
Cleveland Thermal LLC | | | 8.00 | | | | 11-1-2028 | | | | 1,800,000 | | | | 1,867,252 | |
Cleveland Thermal LLC | | | 8.25 | | | | 11-1-2037 | | | | 2,880,000 | | | | 2,988,706 | |
| | | | |
| | | | | | | | | | | | | | | 7,825,612 | |
| | | | | | | | | | | | | | | | |
| | | | |
Total Corporate Bonds and Notes (Cost $12,786,612) | | | | | | | | | | | | | | | 11,766,904 | |
| | | | | | | | | | | | | | | | |
The accompanying notes are an integral part of these financial statements.
| | | | | | |
| Portfolio of investments—August 31, 2018 | | Wells Fargo Government Securities Fund | | | 19 | |
| | | | | | | | | | | | | | | | |
| Security name | | Interest rate | | | Maturity date | | | Principal | | | Value | |
| | | | |
Municipal Obligations: 0.90% | | | | | | | | | | | | | | | | |
| | | | |
Texas: 0.90% | | | | | | | | | | | | | | | | |
| | | | |
| Miscellaneous Revenue: 0.90% | | | | | | | | | | | | | | | | |
San Antonio TX Retama Development Corporation | | | 10.00 | % | | | 12-15-2020 | | | $ | 5,405,000 | | | $ | 6,374,819 | |
| | | | | | | | | | | | | | | | |
| | | | |
Total Municipal Obligations (Cost $5,946,771) | | | | | | | | | | | | | | | 6,374,819 | |
| | | | | | | | | | | | | | | | |
| | | | |
Non-Agency Mortgage-Backed Securities: 4.44% | | | | | | | | | | | | | | | | |
Benchmark Mortgage Trust Series 2018-B1 Class A4 | | | 3.40 | | | | 1-15-2051 | | | | 305,000 | | | | 300,317 | |
CD Commercial Mortgage Trust Series 2017-6 Class A5 | | | 3.46 | | | | 11-13-2050 | | | | 2,340,000 | | | | 2,307,615 | |
CGBAM Commercial Mortgage Trust Series 2015-SMRT Class A 144A | | | 2.81 | | | | 4-10-2028 | | | | 5,000,000 | | | | 4,979,434 | |
GAHR Commercial Mortgage Trust Series 2015-NRF Class AFX 144A | | | 3.23 | | | | 12-15-2034 | | | | 4,195,000 | | | | 4,200,598 | |
GS Mortgage Securities Trust Series 2013-G1 Class A2 144A±± | | | 3.56 | | | | 4-10-2031 | | | | 5,349,842 | | | | 5,280,661 | |
JPMorgan Chase Commercial Mortgage Securities Corporation Series 2015-C28 Class A4 | | | 3.23 | | | | 10-15-2048 | | | | 5,000,000 | | | | 4,913,678 | |
Morgan Stanley Capital I Trust Series 2011-C2 Class A4 144A | | | 4.66 | | | | 6-15-2044 | | | | 4,900,000 | | | | 5,064,583 | |
UBS Commercial Mortgage Trust Series 2017-C5 Class A5 | | | 3.47 | | | | 11-15-2050 | | | | 2,581,000 | | | | 2,532,316 | |
Vendee Mortgage Trust Series 1995-1 Class 4 ±± | | | 8.31 | | | | 2-15-2025 | | | | 164,941 | | | | 181,099 | |
Vendee Mortgage Trust Series 1995-2C Class 3A | | | 8.79 | | | | 6-15-2025 | | | | 231,349 | | | | 258,584 | |
Vendee Mortgage Trust Series 2011-1 Class DA | | | 3.75 | | | | 2-15-2035 | | | | 1,524,493 | | | | 1,537,101 | |
| | | | |
Total Non-Agency Mortgage-Backed Securities (Cost $32,287,275) | | | | | | | | | | | | | | | 31,555,986 | |
| | | | | | | | | | | | | | | | |
| | | | |
U.S. Treasury Securities: 12.23% | | | | | | | | | | | | | | | | |
STRIPS ¤ | | | 0.00 | | | | 5-15-2036 | | | | 8,765,000 | | | | 5,134,623 | |
U.S. Treasury Bond | | | 2.75 | | | | 8-15-2042 | | | | 1,805,000 | | | | 1,722,929 | |
U.S. Treasury Bond | | | 2.88 | | | | 5-15-2028 | | | | 9,445,000 | | | | 9,446,476 | |
U.S. Treasury Bond | | | 3.13 | | | | 5-15-2048 | | | | 1,225,000 | | | | 1,249,548 | |
U.S. Treasury Bond ## | | | 3.38 | | | | 5-15-2044 | | | | 3,295,000 | | | | 3,501,967 | |
U.S. Treasury Bond | | | 3.63 | | | | 8-15-2043 | | | | 5,170,000 | | | | 5,715,475 | |
U.S. Treasury Bond ## | | | 3.75 | | | | 8-15-2041 | | | | 3,310,000 | | | | 3,718,837 | |
U.S. Treasury Bond ## | | | 3.75 | | | | 11-15-2043 | | | | 20,150,000 | | | | 22,734,080 | |
U.S. Treasury Bond ## | | | 4.25 | | | | 11-15-2040 | | | | 1,590,000 | | | | 1,913,217 | |
U.S. Treasury Bond ## | | | 6.13 | | | | 11-15-2027 | | | | 5,700,000 | | | | 7,196,695 | |
U.S. Treasury Note ## | | | 1.75 | | | | 5-15-2023 | | | | 25,695,000 | | | | 24,569,840 | |
| | | | |
Total U.S. Treasury Securities (Cost $87,458,712) | | | | | | | | | | | | | | | 86,903,687 | |
| | | | | | | | | | | | | | | | |
| | | | |
Yankee Corporate Bonds and Notes: 0.90% | | | | | | | | | | | | | | | | |
| | | | |
Financials: 0.90% | | | | | | | | | | | | | | | | |
| | | | |
| Banks: 0.90% | | | | | | | | | | | | | | | | |
Royal Bank of Canada Incorporated | | | 2.00 | | | | 10-1-2018 | | | | 6,370,000 | | | | 6,367,962 | |
| | | | | | | | | | | | | | | | |
| | | | |
Total Yankee Corporate Bonds and Notes (Cost $6,369,925) | | | | | | | | | | | | | | | 6,367,962 | |
| | | | | | | | | | | | | | | | |
| | | | |
Yankee Government Bonds: 5.71% | | | | | | | | | | | | | | | | |
Hashemite Kingdom of Jordan | | | 3.00 | | | | 6-30-2025 | | | | 10,636,000 | | | | 10,577,263 | |
State of Israel | | | 5.50 | | | | 12-4-2023 | | | | 9,030,000 | | | | 10,152,055 | |
State of Israel | | | 5.50 | | | | 9-18-2033 | | | | 7,390,000 | | | | 9,213,555 | |
Ukraine | | | 1.47 | | | | 9-29-2021 | | | | 11,090,000 | | | | 10,652,100 | |
| | | | |
Total Yankee Government Bonds (Cost $42,595,064) | | | | | | | | | | | | | | | 40,594,973 | |
| | | | | | | | | | | | | | | | |
The accompanying notes are an integral part of these financial statements.
| | | | |
| 20 | | Wells Fargo Government Securities Fund | | Portfolio of investments—August 31, 2018 |
| | | | | | | | | | | | | | | | |
| Security name | | Yield | | | | | | Shares | | | Value | |
| | | | |
Short-Term Investments: 2.89% | | | | | | | | | | | | | | | | |
| | | | |
| Investment Companies: 2.58% | | | | | | | | | | | | | | | | |
Wells Fargo Government Money Market Fund Select Class (l)(u)## | | | 1.87 | % | | | | | | | 18,303,812 | | | $ | 18,303,812 | |
| | | | | | | | | | | | | | | | |
| | | | |
| | | | | | Maturity date | | | Principal | | | | |
| U.S. Treasury Securities: 0.31% | | | | | | | | | | | | | | | | |
U.S. Treasury Bill (z)# | | | 1.31 | | | | 9-13-2018 | | | $ | 2,225,000 | | | | 2,223,939 | |
| | | | | | | | | | | | | | | | |
| | | | |
Total Short-Term Investments (Cost $20,527,760) | | | | | | | | | | | | | | | 20,527,751 | |
| | | | | | | | | | | | | | | | |
| | | | | | | | |
| Total investments in securities (Cost $813,652,251) | | | 113.40 | % | | | 805,945,294 | |
Other assets and liabilities, net | | | (13.40 | ) | | | (95,250,840 | ) |
| | | | | | | | |
| Total net assets | | | 100.00 | % | | $ | 710,694,454 | |
| | | | | | | | |
| 144A | The security may be resold in transactions exempt from registration, normally to qualified institutional buyers, pursuant to Rule 144A under the Securities Act of 1933. |
| ± | Variable rate investment. The rate shown is the rate in effect at period end. |
| ±± | The coupon of the security is adjusted based on the principal and interest payments received from the underlying pool of mortgages as well as the credit quality and the actual prepayment speed of the underlying mortgages. |
| (c) | Investment in an interest-only security entitles holders to receive only the interest payments on the underlying mortgages. The principal amount shown is the notional amount of the underlying mortgages. The rate represents the coupon rate. |
| ¤ | The security is issued in zero coupon form with no periodic interest payments. |
| %% | The security is issued on a when-issued basis. |
| ## | All or a portion of this security is segregated for when-issued securities. |
| (l) | The issuer of the security is an affiliated person of the Fund as defined in the Investment Company Act of 1940. |
| (u) | The rate represents the 7-day annualized yield at period end. |
| (z) | Zero coupon security. The rate represents the current yield to maturity. |
| # | All or a portion of this security is segregated as collateral for investments in derivative instruments. |
Abbreviations:
| FDIC | Federal Deposit Insurance Corporation |
| FHLB | Federal Home Loan Bank |
| FHLMC | Federal Home Loan Mortgage Corporation |
| FNMA | Federal National Mortgage Association |
| GNMA | Government National Mortgage Association |
| LIBOR | London Interbank Offered Rate |
| REIT | Real estate investment trust |
| STRIPS | Separate trading of registered interest and principal securities |
| TVA | Tennessee Valley Authority |
Futures Contracts
| | | | | | | | | | | | | | | | | | | | | | | | |
| Description | | Number of
contracts | | | Expiration
date | | | Notional
cost | | | Notional
value | | | Unrealized
gains | | | Unrealized
losses | |
Long | | | | | | | | | | | | | | | | | | | | | | | | |
5-Year U.S. Treasury Notes | | | 70 | | | | 12-31-2018 | | | $ | 7,935,783 | | | $ | 7,937,891 | | | $ | 2,108 | | | $ | 0 | |
Short | | | | | | | | | | | | | | | | | | | | | | | | |
10-Year U.S. Treasury Notes | | | (79) | | | | 12-19-2018 | | | | (9,480,490 | ) | | | (9,500,984 | ) | | | 0 | | | | (20,494 | ) |
U.S. Long Term Bonds | | | (66) | | | | 12-19-2018 | | | | (9,485,564 | ) | | | (9,518,437 | ) | | | 0 | | | | (32,873 | ) |
Ultra U.S. Treasury Bonds | | | (1) | | | | 12-19-2018 | | | | (158,983 | ) | | | (159,313 | ) | | | 0 | | | | (330 | ) |
2-Year U.S. Treasury Notes | | | (244) | | | | 12-31-2018 | | | | (51,546,285 | ) | | | (51,571,688 | ) | | | 0 | | | | (25,403 | ) |
| | | | | | | | | | | | | | | | | | | | | | | | |
| | | | | | | | | | | | | | | | | | $ | 2,108 | | | $ | (79,100 | ) |
| | | | | | | | | | | | | | | | | | | | | | | | |
The accompanying notes are an integral part of these financial statements.
| | | | | | |
| Portfolio of investments—August 31, 2018 | | Wells Fargo Government Securities Fund | | | 21 | |
Investments in Affiliates
An affiliated investment is an investment in which the Fund owns at least 5% of the outstanding voting shares of the issuer or as a result of other relationships, such as the Fund and the issuer having the same investment manager. Transactions with issuers that were either affiliated persons of the Fund at the beginning of the period or the end of the period were as follows:
| | | | | | | | | | | | | | | | | | | | | | | | | | | | | | | | | | | | |
| | | Shares,
beginning of
period | | | Shares
purchased | | | Shares
sold | | | Shares,
end of
period | | | Net
realized
gains
(losses) | | | Net
change in
unrealized
gains
(losses) | | | Income
from
affiliated
securities | | | Value,
end
of period | | | % of
net
assets | |
Short-Term Investments | | | | | | | | | | | | | | | | | | | | | | | | | | | | | | | | | | | | |
Investment Companies | | | | | | | | | | | | | | | | | | | | | | | | | | | | | | | | | | | | |
Wells Fargo Government Money Market Fund Select Class | | | 7,067,691 | | | | 302,388,297 | | | | 291,152,176 | | | | 18,303,812 | | | | 0 | | | $ | 0 | | | $ | 269,342 | | | $ | 18,303,812 | | | | 2.58 | % |
The accompanying notes are an integral part of these financial statements.
| | | | |
| 22 | | Wells Fargo Government Securities Fund | | Statement of assets and liabilities—August 31, 2018 |
| | | | |
| | | | |
| |
Assets | | | | |
Investments in unaffiliated securities, at value (cost $795,348,439) | | $ | 787,641,482 | |
Investments in affiliated securities, at value (cost $18,303,812) | | | 18,303,812 | |
Cash | | | 6,193 | |
Principal paydown receivable | | | 17,739 | |
Receivable for Fund shares sold | | | 932,968 | |
Receivable for interest | | | 3,709,309 | |
Receivable for daily variation margin on open futures contracts | | | 7,109 | |
Prepaid expenses and other assets | | | 42,540 | |
| | | | |
Total assets | | | 810,661,152 | |
| | | | |
| |
Liabilities | | | | |
Payable for when-issued securities purchased | | | 98,403,913 | |
Payable for Fund shares redeemed | | | 763,678 | |
Management fee payable | | | 218,245 | |
Distributions payable | | | 191,148 | |
Payable due to broker | | | 133,000 | |
Administration fees payable | | | 78,338 | |
Payable for daily variation margin on open futures contracts | | | 46,174 | |
Distribution fee payable | | | 10,864 | |
Trustees’ fees and expenses payable | | | 2,160 | |
Accrued expenses and other liabilities | | | 119,178 | |
| | | | |
Total liabilities | | | 99,966,698 | |
| | | | |
Total net assets | | $ | 710,694,454 | |
| | | | |
| |
NET ASSETS CONSIST OF | | | | |
Paid-in capital | | $ | 750,038,937 | |
Overdistributed net investment income | | | (12,956,930 | ) |
Accumulated net realized losses on investments | | | (18,603,604 | ) |
Net unrealized losses on investments | | | (7,783,949 | ) |
| | | | |
Total net assets | | $ | 710,694,454 | |
| | | | |
| |
COMPUTATION OF NET ASSET VALUE AND OFFERING PRICE PER SHARE | | | | |
Net assets – Class A | | $ | 292,550,004 | |
Shares outstanding – Class A1 | | | 27,467,353 | |
Net asset value per share – Class A | | | $10.65 | |
Maximum offering price per share – Class A2 | | | $11.15 | |
Net assets – Class C | | $ | 15,507,602 | |
Shares outstanding – Class C1 | | | 1,456,213 | |
Net asset value per share – Class C | | | $10.65 | |
Net assets – Administrator Class | | $ | 91,670,965 | |
Shares outstanding – Administrator Class1 | | | 8,609,326 | |
Net asset value per share – Administrator Class | | | $10.65 | |
Net assets – Institutional Class | | $ | 310,965,883 | |
Shares outstanding – Institutional Class1 | | | 29,210,521 | |
Net asset value per share – Institutional Class | | | $10.65 | |
| 1 | The Fund has an unlimited number of authorized shares. |
| 2 | Maximum offering price is computed as 100/95.50 of net asset value. On investments of $50,000 or more, the offering price is reduced. |
The accompanying notes are an integral part of these financial statements.
| | | | | | |
| Statement of operations—year ended August 31, 2018 | | Wells Fargo Government Securities Fund | | | 23 | |
| | | | |
| | | | |
| |
Investment income | | | | |
Interest | | $ | 21,899,481 | |
Income from affiliated securities | | | 269,342 | |
| | | | |
Total investment income | | | 22,168,823 | |
| | | | |
| |
Expenses | | | | |
Management fee | | | 3,601,754 | |
Administration fees | | | | |
Class A | | | 547,522 | |
Class C | | | 28,571 | |
Administrator Class | | | 200,332 | |
Institutional Class | | | 206,190 | |
Shareholder servicing fees | | | | |
Class A | | | 855,504 | |
Class C | | | 44,641 | |
Administrator Class | | | 500,829 | |
Distribution fee | | | | |
Class C | | | 133,924 | |
Custody and accounting fees | | | 76,879 | |
Professional fees | | | 78,403 | |
Registration fees | | | 104,125 | |
Shareholder report expenses | | | 80,978 | |
Trustees’ fees and expenses | | | 23,472 | |
Other fees and expenses | | | 15,735 | |
| | | | |
Total expenses | | | 6,498,859 | |
Less: Fee waivers and/or expense reimbursements | | | (785,180 | ) |
| | | | |
Net expenses | | | 5,713,679 | |
| | | | |
Net investment income | | | 16,455,144 | |
| | | | |
| |
REALIZED AND UNREALIZED GAINS (LOSSES) ON INVESTMENTS | | | | |
| |
Net realized gains (losses) on: | | | | |
Unaffiliated securities | | | (6,233,115 | ) |
Futures contracts | | | 789,135 | |
| | | | |
Net realized losses on investments | | | (5,443,980 | ) |
| | | | |
| |
Net change in unrealized gains (losses) on: | | | | |
Unaffiliated securities | | | (22,956,804 | ) |
Futures contracts | | | (151,802 | ) |
| | | | |
Net change in unrealized gains (losses) on investments | | | (23,108,606 | ) |
| | | | |
Net realized and unrealized gains (losses) on investments | | | (28,552,586 | ) |
| | | | |
Net decrease in net assets resulting from operations | | $ | (12,097,442 | ) |
| | | | |
The accompanying notes are an integral part of these financial statements.
| | | | |
| 24 | | Wells Fargo Government Securities Fund | | Statement of changes in net assets |
| | | | | | | | | | | | | | | | |
| | | Year ended
August 31, 2018 | | | Year ended
August 31, 2017 | |
| | | |
Operations | | | | | | | | | | | | |
Net investment income | | | | | | $ | 16,455,144 | | | | | | | $ | 17,271,849 | |
Net realized losses on investments | | | | | | | (5,443,980 | ) | | | | | | | (10,219,835 | ) |
Net change in unrealized gains (losses) on investments | | | | | | | (23,108,606 | ) | | | | | | | (14,516,843 | ) |
| | | | |
Net decrease in net assets resulting from operations | | | | | | | (12,097,442 | ) | | | | | | | (7,464,829 | ) |
| | | | |
| | | |
Distributions to shareholders from | | | | | | | | | | | | |
Net investment income | | | | | | | | | | | | | | | | |
Class A | | | | | | | (6,375,215 | ) | | | | | | | (6,111,858 | ) |
Class B | | | | | | | N/A | | | | | | | | (161 | )1 |
Class C | | | | | | | (199,378 | ) | | | | | | | (153,118 | ) |
Administrator Class | | | | | | | (4,147,365 | ) | | | | | | | (3,440,050 | ) |
Institutional Class | | | | | | | (5,781,887 | ) | | | | | | | (7,854,351 | ) |
Net realized gains | | | | | | | | | | | | | | | | |
Class A | | | | | | | 0 | | | | | | | | (11,051,306 | ) |
Class C | | | | | | | 0 | | | | | | | | (620,183 | ) |
Administrator Class | | | | | | | 0 | | | | | | | | (5,318,345 | ) |
Institutional Class | | | | | | | 0 | | | | | | | | (11,260,803 | ) |
| | | | |
Total distributions to shareholders | | | | | | | (16,503,845 | ) | | | | | | | (45,810,175 | ) |
| | | | |
| | | | |
Capital share transactions | | | Shares | | | | | | | | Shares | | | | | |
Proceeds from shares sold | | | | | | | | | | | | | | | | |
Class A | | | 3,569,871 | | | | 38,348,367 | | | | 5,048,546 | | | | 55,448,268 | |
Class C | | | 63,470 | | | | 684,459 | | | | 136,498 | | | | 1,516,128 | |
Administrator Class | | | 6,511,960 | | | | 70,326,132 | | | | 4,525,225 | | | | 49,877,489 | |
Institutional Class | | | 19,558,475 | | | | 209,166,296 | | | | 7,840,553 | | | | 86,219,813 | |
| | | | |
| | | | | | | 318,525,254 | | | | | | | | 193,061,698 | |
| | | | |
Reinvestment of distributions | | | | | | | | | | | | | | | | |
Class A | | | 525,663 | | | | 5,649,695 | | | | 1,449,536 | | | | 15,775,799 | |
Class B | | | N/A | | | | N/A | | | | 13 | 1 | | | 140 | 1 |
Class C | | | 7,721 | | | | 82,914 | | | | 29,801 | | | | 323,374 | |
Administrator Class | | | 380,074 | | | | 4,081,678 | | | | 793,271 | | | | 8,634,028 | |
Institutional Class | | | 438,702 | | | | 4,717,547 | | | | 1,609,211 | | | | 17,516,581 | |
| | | | |
| | | | | | | 14,531,834 | | | | | | | | 42,249,922 | |
| | | | |
Payment for shares redeemed | | | | | | | | | | | | | | | | |
Class A | | | (12,470,498 | ) | | | (133,691,683 | ) | | | (12,626,464 | ) | | | (138,762,406 | ) |
Class B | | | N/A | | | | N/A | | | | (16,453 | )1 | | | (185,560 | )1 |
Class C | | | (443,637 | ) | | | (4,768,963 | ) | | | (691,050 | ) | | | (7,592,167 | ) |
Administrator Class | | | (16,318,494 | ) | | | (174,401,645 | ) | | | (7,198,458 | ) | | | (79,199,255 | ) |
Institutional Class | | | (28,678,375 | ) | | | (311,030,462 | ) | | | (13,914,348 | ) | | | (152,833,222 | ) |
| | | | |
| | | | | | | (623,892,753 | ) | | | | | | | (378,572,610 | ) |
| | | | |
Net decrease in net assets resulting from capital share transactions | | | | | | | (290,835,665 | ) | | | | | | | (143,260,990 | ) |
| | | | |
Total decrease in net assets | | | | | | | (319,436,952 | ) | | | | | | | (196,535,994 | ) |
| | | | |
| | | | |
Net assets | | | | | | | | | | | | | | | | |
Beginning of period | | | | | | | 1,030,131,406 | | | | | | | | 1,226,667,400 | |
| | | | |
End of period | | | | | | $ | 710,694,454 | | | | | | | $ | 1,030,131,406 | |
| | | | |
Overdistributed net investment income | | | | | | $ | (12,956,930 | ) | | | | | | $ | (12,908,206 | ) |
| | | | |
| 1 | For the period from September 1, 2016 to December 5, 2016. Effective at the close of business on December 5, 2016, Class B shares were converted to Class A shares and are no longer offered by the Fund. |
The accompanying notes are an integral part of these financial statements.
| | | | | | |
| Financial highlights | | Wells Fargo Government Securities Fund | | | 25 | |
(For a share outstanding throughout each period)
| | | | | | | | | | | | | | | | | | | | |
| | | Year ended August 31 | |
| CLASS A | | 2018 | | | 2017 | | | 2016 | | | 2015 | | | 2014 | |
Net asset value, beginning of period | | | $11.01 | | | | $11.51 | | | | $11.22 | | | | $11.11 | | | | $10.77 | |
Net investment income | | | 0.19 | | | | 0.15 | | | | 0.11 | 1 | | | 0.07 | 1 | | | 0.05 | |
Net realized and unrealized gains (losses) on investments | | | (0.35 | ) | | | (0.22 | ) | | | 0.34 | | | | 0.13 | | | | 0.40 | |
| | | | | | | | | | | | | | | | | | | | |
Total from investment operations | | | (0.16 | ) | | | (0.07 | ) | | | 0.45 | | | | 0.20 | | | | 0.45 | |
Distributions to shareholders from | | | | | | | | | | | | | | | | | | | | |
Net investment income | | | (0.20 | ) | | | (0.16 | ) | | | (0.10 | ) | | | (0.09 | ) | | | (0.11 | ) |
Net realized gains | | | 0.00 | | | | (0.27 | ) | | | (0.06 | ) | | | 0.00 | | | | 0.00 | |
| | | | | | | | | | | | | | | | | | | | |
Total distributions to shareholders | | | (0.20 | ) | | | (0.43 | ) | | | (0.16 | ) | | | (0.09 | ) | | | (0.11 | ) |
Net asset value, end of period | | | $10.65 | | | | $11.01 | | | | $11.51 | | | | $11.22 | | | | $11.11 | |
Total return2 | | | (1.44 | )% | | | (0.52 | )% | | | 4.03 | % | | | 1.84 | % | | | 4.19 | % |
Ratios to average net assets (annualized) | | | | | | | | | | | | | | | | | | | | |
Gross expenses | | | 0.90 | % | | | 0.88 | % | | | 0.87 | % | | | 0.87 | % | | | 0.88 | % |
Net expenses | | | 0.85 | % | | | 0.85 | % | | | 0.85 | % | | | 0.85 | % | | | 0.86 | % |
Net investment income | | | 1.86 | % | | | 1.38 | % | | | 0.94 | % | | | 0.59 | % | | | 0.56 | % |
Supplemental data | | | | | | | | | | | | | | | | | | | | |
Portfolio turnover rate | | | 197 | % | | | 299 | % | | | 397 | % | | | 349 | % | | | 349 | % |
Net assets, end of period (000s omitted) | | | $292,550 | | | | $394,645 | | | | $483,112 | | | | $232,545 | | | | $173,772 | |
| 1 | Calculated based upon average shares outstanding |
| 2 | Total return calculations do not include any sales charges. |
The accompanying notes are an integral part of these financial statements.
| | | | |
| 26 | | Wells Fargo Government Securities Fund | | Financial highlights |
(For a share outstanding throughout each period)
| | | | | | | | | | | | | | | | | | | | |
| | | Year ended August 31 | |
| CLASS C | | 2018 | | | 2017 | | | 2016 | | | 2015 | | | 2014 | |
Net asset value, beginning of period | | | $11.01 | | | | $11.51 | | | | $11.21 | | | | $11.11 | | | | $10.77 | |
Net investment income (loss) | | | 0.12 | 1 | | | 0.07 | 1 | | | 0.02 | 1 | | | (0.01 | )1 | | | (0.02 | )1 |
Net realized and unrealized gains (losses) on investments | | | (0.36 | ) | | | (0.23 | ) | | | 0.36 | | | | 0.12 | | | | 0.39 | |
| | | | | | | | | | | | | | | | | | | | |
Total from investment operations | | | (0.24 | ) | | | (0.16 | ) | | | 0.38 | | | | 0.11 | | | | 0.37 | |
Distributions to shareholders from | | | | | | | | | | | | | | | | | | | | |
Net investment income | | | (0.12 | ) | | | (0.07 | ) | | | (0.02 | ) | | | (0.01 | ) | | | (0.03 | ) |
Net realized gains | | | 0.00 | | | | (0.27 | ) | | | (0.06 | ) | | | 0.00 | | | | 0.00 | |
| | | | | | | | | | | | | | | | | | | | |
Total distributions to shareholders | | | (0.12 | ) | | | (0.34 | ) | | | (0.08 | ) | | | (0.01 | ) | | | (0.03 | ) |
Net asset value, end of period | | | $10.65 | | | | $11.01 | | | | $11.51 | | | | $11.21 | | | | $11.11 | |
Total return2 | | | (2.18 | )% | | | (1.26 | )% | | | 3.25 | % | | | 1.08 | % | | | 3.42 | % |
Ratios to average net assets (annualized) | | | | | | | | | | | | | | | | | | | | |
Gross expenses | | | 1.65 | % | | | 1.61 | % | | | 1.62 | % | | | 1.62 | % | | | 1.63 | % |
Net expenses | | | 1.60 | % | | | 1.60 | % | | | 1.60 | % | | | 1.60 | % | | | 1.61 | % |
Net investment income (loss) | | | 1.12 | % | | | 0.63 | % | | | 0.16 | % | | | (0.13 | )% | | | (0.20 | )% |
Supplemental data | | | | | | | | | | | | | | | | | | | | |
Portfolio turnover rate | | | 197 | % | | | 299 | % | | | 397 | % | | | 349 | % | | | 349 | % |
Net assets, end of period (000s omitted) | | | $15,508 | | | | $20,132 | | | | $27,085 | | | | $26,981 | | | | $31,908 | |
| 1 | Calculated based upon average shares outstanding |
| 2 | Total return calculations do not include any sales charges. |
The accompanying notes are an integral part of these financial statements.
| | | | | | |
| Financial highlights | | Wells Fargo Government Securities Fund | | | 27 | |
(For a share outstanding throughout each period)
| | | | | | | | | | | | | | | | | | | | |
| | | Year ended August 31 | |
| ADMINISTRATOR CLASS | | 2018 | | | 2017 | | | 2016 | | | 2015 | | | 2014 | |
Net asset value, beginning of period | | | $11.01 | | | | $11.51 | | | | $11.21 | | | | $11.11 | | | | $10.76 | |
Net investment income | | | 0.22 | 1 | | | 0.18 | 1 | | | 0.13 | | | | 0.10 | | | | 0.06 | |
Net realized and unrealized gains (losses) on investments | | | (0.35 | ) | | | (0.23 | ) | | | 0.36 | | | | 0.12 | | | | 0.42 | |
| | | | | | | | | | | | | | | | | | | | |
Total from investment operations | | | (0.13 | ) | | | (0.05 | ) | | | 0.49 | | | | 0.22 | | | | 0.48 | |
Distributions to shareholders from | | | | | | | | | | | | | | | | | | | | |
Net investment income | | | (0.23 | ) | | | (0.18 | ) | | | (0.13 | ) | | | (0.12 | ) | | | (0.13 | ) |
Net realized gains | | | 0.00 | | | | (0.27 | ) | | | (0.06 | ) | | | 0.00 | | | | 0.00 | |
| | | | | | | | | | | | | | | | | | | | |
Total distributions to shareholders | | | (0.23 | ) | | | (0.45 | ) | | | (0.19 | ) | | | (0.12 | ) | | | (0.13 | ) |
Net asset value, end of period | | | $10.65 | | | | $11.01 | | | | $11.51 | | | | $11.21 | | | | $11.11 | |
Total return | | | (1.23 | )% | | | (0.31 | )% | | | 4.34 | % | | | 1.97 | % | | | 4.51 | % |
Ratios to average net assets (annualized) | | | | | | | | | | | | | | | | | | | | |
Gross expenses | | | 0.84 | % | | | 0.82 | % | | | 0.81 | % | | | 0.80 | % | | | 0.81 | % |
Net expenses | | | 0.64 | % | | | 0.64 | % | | | 0.64 | % | | | 0.64 | % | | | 0.64 | % |
Net investment income | | | 2.07 | % | | | 1.60 | % | | | 1.13 | % | | | 0.82 | % | | | 0.79 | % |
Supplemental data | | | | | | | | | | | | | | | | | | | | |
Portfolio turnover rate | | | 197 | % | | | 299 | % | | | 397 | % | | | 349 | % | | | 349 | % |
Net assets, end of period (000s omitted) | | | $91,671 | | | | $198,520 | | | | $229,169 | | | | $216,428 | | | | $211,589 | |
| 1 | Calculated based upon average shares outstanding |
The accompanying notes are an integral part of these financial statements.
| | | | |
| 28 | | Wells Fargo Government Securities Fund | | Financial highlights |
(For a share outstanding throughout each period)
| | | | | | | | | | | | | | | | | | | | |
| | | Year ended August 31 | |
| INSTITUTIONAL CLASS | | 2018 | | | 2017 | | | 2016 | | | 2015 | | | 2014 | |
Net asset value, beginning of period | | | $11.00 | | | | $11.50 | | | | $11.21 | | | | $11.10 | | | | $10.76 | |
Net investment income | | | 0.24 | 1 | | | 0.19 | 1 | | | 0.15 | | | | 0.11 | 1 | | | 0.10 | |
Net realized and unrealized gains (losses) on investments | | | (0.35 | ) | | | (0.22 | ) | | | 0.35 | | | | 0.14 | | | | 0.39 | |
| | | | | | | | | | | | | | | | | | | | |
Total from investment operations | | | (0.11 | ) | | | (0.03 | ) | | | 0.50 | | | | 0.25 | | | | 0.49 | |
Distributions to shareholders from | | | | | | | | | | | | | | | | | | | | |
Net investment income | | | (0.24 | ) | | | (0.20 | ) | | | (0.15 | ) | | | (0.14 | ) | | | (0.15 | ) |
Net realized gains | | | 0.00 | | | | (0.27 | ) | | | (0.06 | ) | | | 0.00 | | | | 0.00 | |
| | | | | | | | | | | | | | | | | | | | |
Total distributions to shareholders | | | (0.24 | ) | | | (0.47 | ) | | | (0.21 | ) | | | (0.14 | ) | | | (0.15 | ) |
Net asset value, end of period | | | $10.65 | | | | $11.00 | | | | $11.50 | | | | $11.21 | | | | $11.10 | |
Total return | | | (0.99 | )% | | | (0.15 | )% | | | 4.42 | % | | | 2.22 | % | | | 4.59 | % |
Ratios to average net assets (annualized) | | | | | | | | | | | | | | | | | | | | |
Gross expenses | | | 0.57 | % | | | 0.55 | % | | | 0.54 | % | | | 0.54 | % | | | 0.55 | % |
Net expenses | | | 0.48 | % | | | 0.48 | % | | | 0.48 | % | | | 0.48 | % | | | 0.48 | % |
Net investment income | | | 2.22 | % | | | 1.75 | % | | | 1.28 | % | | | 0.99 | % | | | 0.94 | % |
Supplemental data | | | | | | | | | | | | | | | | | | | | |
Portfolio turnover rate | | | 197 | % | | | 299 | % | | | 397 | % | | | 349 | % | | | 349 | % |
Net assets, end of period (000s omitted) | | | $310,966 | | | | $416,834 | | | | $487,113 | | | | $468,859 | | | | $540,684 | |
| 1 | Calculated based upon average shares outstanding |
The accompanying notes are an integral part of these financial statements.
| | | | | | |
| Notes to financial statements | | Wells Fargo Government Securities Fund | | | 29 | |
1. ORGANIZATION
Wells Fargo Funds Trust (the “Trust”), a Delaware statutory trust organized on March 10, 1999, is an open-end management investment company registered under the Investment Company Act of 1940, as amended (the “1940 Act”). As an investment company, the Trust follows the accounting and reporting guidance in Financial Accounting Standards Board (“FASB”) Accounting Standards Codification Topic 946, Financial Services – Investment Companies. These financial statements report on the Wells Fargo Government Securities Fund (the “Fund”) which is a diversified series of the Trust.
Effective at the close of business on December 5, 2017, Class B shares were converted to Class A shares and are no longer offered by the Fund. Information for Class B shares reflected in the financial statements represents activity through December 5, 2017.
2. SIGNIFICANT ACCOUNTING POLICIES
The following significant accounting policies, which are consistently followed in the preparation of the financial statements of the Fund, are in conformity with U.S. generally accepted accounting principles which require management to make estimates and assumptions that affect the reported amounts of assets and liabilities, disclosure of contingent assets and liabilities at the date of the financial statements, and the reported amounts of revenues and expenses during the reporting period. Actual results could differ from those estimates.
Securities valuation
All investments are valued each business day as of the close of regular trading on the New York Stock Exchange (generally 4 p.m. Eastern Time), although the Fund may deviate from this calculation time under unusual or unexpected circumstances.
Debt securities are valued at the evaluated bid price provided by an independent pricing service or, if a reliable price is not available, the quoted bid price from an independent broker-dealer.
Futures contracts that are listed on a foreign or domestic exchange or market are valued at the official closing price or, if none, the last sales price.
Investments in registered open-end investment companies are valued at net asset value.
Investments which are not valued using any of the methods discussed above are valued at their fair value, as determined in good faith by the Board of Trustees of the Fund. The Board of Trustees has established a Valuation Committee comprised of the Trustees and has delegated to it the authority to take any actions regarding the valuation of portfolio securities that the Valuation Committee deems necessary or appropriate, including determining the fair value of portfolio securities, unless the determination has been delegated to the Wells Fargo Asset Management Pricing Committee at Wells Fargo Funds Management, LLC (“Funds Management”). The Board of Trustees retains the authority to make or ratify any valuation decisions or approve any changes to the Valuation Procedures as it deems appropriate. On a quarterly basis, the Board of Trustees receives reports on any valuation actions taken by the Valuation Committee or the Wells Fargo Asset Management Pricing Committee which may include items for ratification.
Valuations of fair valued securities are compared to the next actual sales price when available, or other appropriate market values, to assess the continued appropriateness of the fair valuation methodologies used. These securities are fair valued on a day-to-day basis, taking into consideration changes to appropriate market information and any significant changes to the inputs considered in the valuation process until there is a readily available price provided on an exchange or by an independent pricing service. Valuations received from an independent pricing service or independent broker-dealer quotes are periodically validated by comparisons to most recent trades and valuations provided by other independent pricing services in addition to the review of prices by the manager and/or subadviser. Unobservable inputs used in determining fair valuations are identified based on the type of security, taking into consideration factors utilized by market participants in valuing the investment, knowledge about the issuer and the current market environment.
When-issued transactions
The Fund may purchase securities on a forward commitment or when-issued basis. The Fund records a when-issued transaction on the trade date and will segregate assets in an amount at least equal in value to the Fund’s commitment to purchase when-issued securities. Securities purchased on a when-issued basis are marked-to-market daily and the Fund begins earning interest on the settlement date. Losses may arise due to changes in the market value of the underlying securities or if the counterparty does not perform under the contract.
| | | | |
| 30 | | Wells Fargo Government Securities Fund | | Notes to financial statements |
Futures contracts
The Fund is subject to interest rate risk in the normal course of pursuing its investment objectives. Futures contracts are agreements between the Fund and a counterparty to buy or sell a specific amount of a commodity, financial instrument or currency at specified price and on a specified date. The Fund may buy and sell futures contracts in order to gain exposure to, or protect against, changes in interest rates. The primary risks associated with the use of futures contracts are the imperfect correlation between changes in market values of securities held by the Fund and the prices of futures contracts, and the possibility of an illiquid market. Futures contracts are generally entered into on a regulated futures exchange and cleared through a clearinghouse associated with the exchange. With futures contracts, there is minimal counterparty risk to the Fund since futures contracts are exchange traded and the exchange’s clearinghouse, as counterparty to all exchange traded futures, guarantees the futures contracts against default.
Upon entering into a futures contracts, the Fund is required to deposit either cash or securities (initial margin) with the broker in an amount equal to a certain percentage of the contract value. Subsequent payments (variation margin) are paid to or from the broker each day equal to the daily changes in the contract value. Such payments are recorded as unrealized gains or losses and, if any, shown as variation margin receivable (payable) in the Statement of Assets and Liabilities. Should the Fund fail to make requested variation margin payments, the broker can gain access to the initial margin to satisfy the Fund’s payment obligations. When the contracts are closed, a realized gain or loss is recorded in the Statement of Operations.
Security transactions and income recognition
Securities transactions are recorded on a trade date basis. Realized gains or losses are recorded on the basis of identified cost.
Interest income is accrued daily and bond discounts are accreted and premiums are amortized daily. To the extent debt obligations are placed on non-accrual status, any related interest income may be reduced by writing off interest receivables when the collection of all or a portion of interest has been determined to be doubtful based on consistently applied procedures and the fair value has decreased. If the issuer subsequently resumes interest payments or when the collectability of interest is reasonably assured, the debt obligation is removed from non-accrual status.
Distributions to shareholders
Distributions to shareholders from net investment income are declared daily and paid monthly. Distributions from net realized gains, if any, are recorded on the ex-dividend date and paid at least annually. Such distributions are determined in accordance with income tax regulations and may differ from U.S. generally accepted accounting principles. Dividend sources are estimated at the time of declaration. The tax character of distributions is determined as of the Fund’s fiscal year end. Therefore, a portion of the Fund’s distributions made prior to the Fund’s fiscal year end may be categorized as a tax return of capital at year end.
Federal and other taxes
The Fund intends to continue to qualify as a regulated investment company by distributing substantially all of its investment company taxable income and any net realized capital gains (after reduction for capital loss carryforwards) sufficient to relieve it from all, or substantially all, federal income taxes. Accordingly, no provision for federal income taxes was required.
The Fund’s income and federal excise tax returns and all financial records supporting those returns for the prior three fiscal years are subject to examination by the federal and Delaware revenue authorities. Management has analyzed the Fund’s tax positions taken on federal, state, and foreign tax returns for all open tax years and does not believe that there are any uncertain tax positions that require recognition of a tax liability.
As of August 31, 2018, the aggregate cost of all investments for federal income tax purposes was $827,231,781 and the unrealized gains (losses) consisted of:
| | | | |
Gross unrealized gains | | $ | 7,503,628 | |
Gross unrealized losses | | | (28,867,107 | ) |
Net unrealized losses | | $ | (21,363,479 | ) |
Reclassifications are made to the Fund’s capital accounts for permanent tax differences to reflect income and gains available for distribution (or available capital loss carryforwards) under federal income tax regulations. U.S. generally accepted accounting principles require that certain components of net assets be adjusted to reflect permanent
| | | | | | |
| Notes to financial statements | | Wells Fargo Government Securities Fund | | | 31 | |
differences between financial and tax reporting. These reclassifications have no effect on net assets or net asset values per share. At August 31, 2018, as a result of permanent book-to-tax differences, the following reclassification adjustments were made on the Statement of Assets and Liabilities:
| | |
Overdistributed net
investment income | | Accumulated net
realized losses
on investments |
| $(23) | | $23 |
As of August 31, 2018, the Fund had capital loss carryforwards which consist of $16,765,738 in short-term capital losses and $1,766,136 in long-term capital losses.
Class allocations
The separate classes of shares offered by the Fund differ principally in applicable sales charges, distribution, shareholder servicing, and administration fees. Class specific expenses are charged directly to that share class. Investment income, common expenses, and realized and unrealized gains (losses) on investments are allocated daily to each class of shares based on the relative proportion of net assets of each class.
3. FAIR VALUATION MEASUREMENTS
Fair value measurements of investments are determined within a framework that has established a fair value hierarchy based upon the various data inputs utilized in determining the value of the Fund’s investments. The three-level hierarchy gives the highest priority to unadjusted quoted prices in active markets for identical assets or liabilities (Level 1) and the lowest priority to unobservable inputs (Level 3). The Fund’s investments are classified within the fair value hierarchy based on the lowest level of input that is significant to the fair value measurement. The inputs are summarized into three broad levels as follows:
| ∎ | | Level 1 – quoted prices in active markets for identical securities |
| ∎ | | Level 2 – other significant observable inputs (including quoted prices for similar securities, interest rates, prepayment speeds, credit risk, etc.) |
| ∎ | | Level 3 – significant unobservable inputs (including the Fund’s own assumptions in determining the fair value of investments) |
The inputs or methodologies used for valuing investments in securities are not necessarily an indication of the risk associated with investing in those securities.
| | | | |
| 32 | | Wells Fargo Government Securities Fund | | Notes to financial statements |
The following is a summary of the inputs used in valuing the Fund’s assets and liabilities as of August 31, 2018:
| | | | | | | | | | | | | | | | |
| | | Quoted prices (Level 1) | | | Other significant
observable inputs (Level 2) | | | Significant
unobservable inputs (Level 3) | | | Total | |
Assets | | | | | | | | | | | | | | | | |
Investments in: | | | | | | | | | | | | | | | | |
| | | | |
Agency securities | | $ | 0 | | | $ | 587,664,694 | | | $ | 0 | | | $ | 587,664,694 | |
| | | | |
Asset-backed securities | | | 0 | | | | 14,188,518 | | | | 0 | | | | 14,188,518 | |
| | | | |
Corporate bonds and notes | | | 0 | | | | 11,766,904 | | | | 0 | | | | 11,766,904 | |
| | | | |
Municipal obligations | | | 0 | | | | 6,374,819 | | | | 0 | | | | 6,374,819 | |
| | | | |
Non-agency mortgage-backed securities | | | 0 | | | | 31,555,986 | | | | 0 | | | | 31,555,986 | |
| | | | |
U.S. Treasuries securities | | | 81,769,064 | | | | 5,134,623 | | | | 0 | | | | 86,903,687 | |
| | | | |
Yankee corporate bonds and notes | | | 0 | | | | 6,367,962 | | | | 0 | | | | 6,367,962 | |
| | | | |
Yankee government bonds | | | 0 | | | | 40,594,973 | | | | 0 | | | | 40,594,973 | |
| | | | |
Short-term investments | | | | | | | | | | | | | | | | |
Investment companies | | | 18,303,812 | | | | 0 | | | | 0 | | | | 18,303,812 | |
U.S. Treasury securities | | | 2,223,939 | | | | 0 | | | | 0 | | | | 2,223,939 | |
| | | 102,296,815 | | | | 703,648,479 | | | | 0 | | | | 805,945,294 | |
Futures contracts | | | 2,108 | | | | 0 | | | | 0 | | | | 2,108 | |
Total assets | | $ | 102,298,923 | | | $ | 703,648,479 | | | $ | 0 | | | $ | 805,947,402 | |
Liabilities | | | | | | | | | | | | | | | | |
Futures contracts | | $ | 79,100 | | | $ | 0 | | | $ | 0 | | | $ | 79,100 | |
Total liabilities | | $ | 79,100 | | | $ | 0 | | | $ | 0 | | | $ | 79,100 | |
Additional sector, industry or geographic detail is included in the Portfolio of Investments.
Futures contracts are reported at their cumulative unrealized gains (losses) at measurement date as reported in the table following the Portfolio of Investments. For futures contracts the current day’s variation margin is reported on the Statement of Assets and Liabilities. All other assets and liabilities are reported at their market value at measurement date.
The Fund recognizes transfers between levels within the fair value hierarchy at the end of the reporting period. At August 31, 2018, the Fund did not have any transfers into/out of Level 1, Level 2, or Level 3.
4. TRANSACTIONS WITH AFFILIATES
Management fee
Funds Management, an indirect wholly owned subsidiary of Wells Fargo & Company (“Wells Fargo”), is the manager of the Fund and provides advisory and fund-level administrative services under an investment management agreement. Under the investment management agreement, Funds Management is responsible for, among other services, implementing the investment objectives and strategies of the Fund, supervising the subadviser and providing fund-level administrative services in connection with the Fund’s operations. As compensation for its services under the investment management agreement, Funds Management is entitled to receive an annual management fee starting at 0.45% and declining to 0.32% as the average daily net assets of the Fund increase. Prior to January 1, 2018, Funds Management received an annual management fee which started at 0.45% and declined to 0.33% as the average daily net assets of the Fund increased. For the year ended August 31, 2018, the management fee was equivalent to an annual rate of 0.44% of the Fund’s average daily net assets.
Funds Management has retained the services of a subadviser to provide daily portfolio management to the Fund. The fee for subadvisory services is borne by Funds Management. Wells Capital Management Incorporated, an affiliate of Funds Management and an indirect wholly owned subsidiary of Wells Fargo, is the subadviser to the Fund and is entitled to receive a fee from Funds Management at an annual rate starting at 0.20% and declining to 0.10% as the average daily net assets of the Fund increase.
| | | | | | |
| Notes to financial statements | | Wells Fargo Government Securities Fund | | | 33 | |
Administration fees
Under a class-level administration agreement, Funds Management provides class-level administrative services to the Fund, which includes paying fees and expenses for services provided by the transfer agent, sub-transfer agents, omnibus account servicers and record-keepers. As compensation for its services under the class-level administration agreement, Funds Management receives an annual fee which is calculated based on the average daily net assets of each class as follows:
| | | | |
| | | Class-level
administration fee | |
Class A, Class C | | | 0.16 | % |
Administrator Class | | | 0.10 | |
Institutional Class | | | 0.08 | |
Funds Management has contractually waived and/or reimbursed management and administration fees to the extent necessary to maintain certain net operating expense ratios for the Fund. When each class of the Fund has exceeded its expense cap, Funds Management has waived fees and/or reimbursed expenses from fund level expenses on a proportionate basis and then from class specific expenses; otherwise, waivers and/or reimbursements are applied against class specific expenses before fund level expenses. Funds Management has committed through December 31, 2018 to waive fees and/or reimburse expenses to the extent necessary to cap the Fund’s expenses at 0.85% for Class A shares, 1.60% for Class C shares, 0.64% for Administrator Class shares, and 0.48% for Institutional Class shares. After this time, the cap may be increased or the commitment to maintain the cap may be terminated only with the approval of the Board of Trustees.
Distribution fee
The Trust has adopted a distribution plan for, Class C of the Fund pursuant to Rule 12b-1 under the 1940 Act. A distribution fee is charged to Class C and paid to Wells Fargo Funds Distributor, LLC (“Funds Distributor”), the principal underwriter, at an annual rate of 0.75% of the average daily net assets of Class C shares.
In addition, Funds Distributor is entitled to receive the front-end sales charge from the purchase of Class A shares and a contingent deferred sales charge on the redemption of certain Class A shares. Funds Distributor is also entitled to receive the contingent deferred sales charges from redemptions of Class C shares. For the year ended August 31, 2018, Funds Distributor received $1,214 from the sale of Class A shares and $20 in contingent deferred sales charges from redemptions of Class C shares. No contingent deferred sales charges were incurred by Class A shares for the year ended August 31, 2018.
Shareholder servicing fees
The Trust has entered into contracts with one or more shareholder servicing agents, whereby Class A, Class C, and Administrator Class of the Fund are charged a fee at an annual rate of 0.25% of the average daily net assets of each respective class.
A portion of these total shareholder servicing fees were paid to affiliates of Wells Fargo.
Interfund transactions
The Fund may purchase or sell portfolio investment securities to certain other Wells Fargo affiliates pursuant to Rule 17a-7 under the 1940 Act and under procedures adopted by the Board of Trustees. The procedures have been designed to ensure that these interfund transactions, which do not incur broker commissions, are effected at current market prices. Pursuant to these procedures, the Fund had $42,853,095 in interfund sales during the year ended August 31, 2018.
5. INVESTMENT PORTFOLIO TRANSACTIONS
Purchases and sales of investments, excluding short-term securities, for the year ended August 31, 2018 were as follows:
| | | | | | |
Purchases at cost | | Sales proceeds |
U.S.
government | | Non-U.S.
government | | U.S.
government | | Non-U.S.
government |
| $1,752,050,254 | | $35,088,145 | | $1,950,141,354 | | $111,640,655 |
6. DERIVATIVE TRANSACTIONS
During the year ended August 31, 2018, the Fund entered into futures contracts to speculate on interest rates. The Fund had an average notional amount of $9,932,009 in long futures contracts and $57,618,041 in short futures contracts during the year ended August 31, 2018.
| | | | |
| 34 | | Wells Fargo Government Securities Fund | | Notes to financial statements |
7. BANK BORROWINGS
The Trust (excluding the money market funds), Wells Fargo Master Trust and Wells Fargo Variable Trust are parties to a $280,000,000 revolving credit agreement whereby the Fund is permitted to use bank borrowings for temporary or emergency purposes, such as to fund shareholder redemption requests. Interest under the credit agreement is charged to the Fund based on a borrowing rate equal to the higher of the Federal Funds rate in effect on that day plus 1.25% or the overnight LIBOR rate in effect on that day plus 1.25%. In addition, an annual commitment fee equal to 0.25% of the unused balance is allocated to each participating fund.
For the year ended August 31, 2018, there were no borrowings by the Fund under the agreement.
8. DISTRIBUTIONS TO SHAREHOLDERS
The tax character of distributions paid during the years ended August 31, 2018 and August 31, 2017 were as follows:
| | | | | | | | |
| | | Year ended August 31 | |
| | | 2018 | | | 2017 | |
Ordinary income | | $ | 16,503,845 | | | $ | 36,854,110 | |
Long-term capital gain | | | 0 | | | | 8,956,065 | |
As of August 31, 2018, the components of distributable earnings on a tax basis were as follows:
| | | | |
Undistributed
ordinary
income | | Unrealized losses | | Capital loss
carryforward |
| $765,712 | | $(21,363,479) | | $(18,531,874) |
9. INDEMNIFICATION
Under the Trust’s organizational documents, the officers and Trustees have been granted certain indemnification rights against certain liabilities that may arise out of performance of their duties to the Trust. Additionally, in the normal course of business, the Trust may enter into contracts with service providers that contain a variety of indemnification clauses. The Trust’s maximum exposure under these arrangements is dependent on future claims that may be made against the Fund and, therefore, cannot be estimated.
10. NEW ACCOUNTING PRONOUNCEMENTS AND REGULATORY CHANGES
On August 17, 2018, the Securities and Exchange Commission (“SEC”) adopted Disclosure Update and Simplification, which amends certain disclosure requirements. The amendments are effective for filings subsequent to November 5, 2018. Management expects these amendments will impact the classification of disclosures in the financial statements.
In August 2018, FASB issued Accounting Standards Update (“ASU”) No. 2018-13, Fair Value Measurement (Topic 820) Disclosure Framework—Changes to the Disclosure Requirements for Fair Value Measurement. ASU 2018-13 updates the disclosure requirements for fair value measurements by modifying or removing certain disclosures and adding certain new disclosures. The amendments are effective for fiscal years, and interim periods within those fiscal years, beginning after December 15, 2019. Early adoption is permitted. Management is currently evaluating the potential impact of this new guidance to the financial statements.
In March 2017, FASB issued ASU No. 2017-08, Premium Amortization on Purchased Callable Debt Securities. ASU
2017-08 shortens the amortization period for certain callable debt securities held at a premium. The amendments require the premium to be amortized to the earliest call date. The amendments do not require an accounting change for securities held at a discount; the discount continues to be amortized to maturity. ASU 2017-08 is effective for fiscal years beginning after December 15, 2018 and for interim periods within those fiscal years . Management is currently evaluating the potential impact of this new guidance to the financial statements.
| | | | | | |
| Report of independent registered public accounting firm | | Wells Fargo Government Securities Fund | | | 35 | |
BOARD OF TRUSTEES AND SHAREHOLDERS OF WELLS FARGO FUNDS TRUST:
Opinion on the Financial Statements
We have audited the accompanying statement of assets and liabilities of Wells Fargo Government Securities Fund (the “Fund”), including the portfolio of investments, as of August 31, 2018, the related statement of operations for the year then ended, the statements of changes in net assets for each of the years in the two-year period then ended, and the related notes (collectively, the “financial statements”) and the financial highlights for each of the years in the five-year period then ended. In our opinion, the financial statements and financial highlights present fairly, in all material respects, the financial position of the Fund as of August 31, 2018, the results of its operations for the year then ended, the changes in its net assets for each of the years in the two-year period then ended, and the financial highlights for each of the years in the five-year period then ended, in conformity with U.S. generally accepted accounting principles.
Basis for Opinion
These financial statements and financial highlights are the responsibility of the Fund’s management. Our responsibility is to express an opinion on these financial statements and financial highlights based on our audits. We are a public accounting firm registered with the Public Company Accounting Oversight Board (United States) (“PCAOB”) and are required to be independent with respect to the Fund in accordance with the U.S. federal securities laws and the applicable rules and regulations of the Securities and Exchange Commission and the PCAOB.
We conducted our audits in accordance with the standards of the PCAOB. Those standards require that we plan and perform the audit to obtain reasonable assurance about whether the financial statements and financial highlights are free of material misstatement, whether due to error or fraud. Our audits included performing procedures to assess the risks of material misstatement of the financial statements and financial highlights, whether due to error or fraud, and performing procedures that respond to those risks. Such procedures included examining, on a test basis, evidence regarding the amounts and disclosures in the financial statements and financial highlights. Such procedures also included confirmation of securities owned as of August 31, 2018, by correspondence with the custodian and brokers, or by other appropriate auditing procedures. Our audits also included evaluating the accounting principles used and significant estimates made by management, as well as evaluating the overall presentation of the financial statements and financial highlights. We believe that our audits provide a reasonable basis for our opinion.

We have not been able to determine the specific year that we began serving as the auditor of one or more Wells Fargo Funds investment companies, however we are aware that we have served as the auditor of one or more Wells Fargo Funds investment companies since at least 1955.
Boston, Massachusetts
October 26, 2018
| | | | |
| 36 | | Wells Fargo Government Securities Fund | | Other information (unaudited) |
TAX INFORMATION
For the fiscal year ended August 31, 2018, $15,385,509 has been designated as interest-related dividends for nonresident alien shareholders pursuant to Section 871 of the Internal Revenue Code.
For the fiscal year ended August 31, 2018, 17.27% of the ordinary income distributed was derived from interest on U.S. Government Securities.
PROXY VOTING INFORMATION
A description of the policies and procedures that the Fund uses to determine how to vote proxies relating to portfolio securities is available, upon request, by calling 1-800-222-8222, visiting our website at wellsfargofunds.com, or visiting the SEC website at sec.gov. Information regarding how the Fund voted proxies relating to portfolio securities during the most recent 12-month period ended June 30 is available on the Fund’s website at wellsfargofunds.com or by visiting the SEC website at sec.gov.
PORTFOLIO HOLDINGS INFORMATION
The complete portfolio holdings for the Fund are publicly available monthly on the Fund’s website (wellsfargofunds.com), on a one-month delayed basis. In addition, top ten holdings information (excluding derivative positions) for the Fund is publicly available on the Fund’s website on a monthly, seven-day or more delayed basis. The Fund files its complete schedule of portfolio holdings with the SEC for the first and third quarters of each fiscal year on Form N-Q, which is available by visiting the SEC website at sec.gov. In addition, the Fund’s Form N-Q may be reviewed and copied at the SEC’s Public Reference Room in Washington, DC, and at regional offices in New York City, at 233 Broadway, and in Chicago, at 175 West Jackson Boulevard, Suite 900. Information about the Public Reference Room may be obtained by calling 1-800-SEC-0330.
| | | | | | |
| Other information (unaudited) | | Wells Fargo Government Securities Fund | | | 37 | |
BOARD OF TRUSTEES AND OFFICERS
Each of the Trustees and Officers1 listed in the table below acts in identical capacities for each fund in the Wells Fargo family of funds, which consists of 154 mutual funds comprising the Wells Fargo Funds Trust, Wells Fargo Variable Trust, Wells Fargo Master Trust and four closed-end funds (collectively the “Fund Complex”). This table should be read in conjunction with the Prospectus and the Statement of Additional Information2. The mailing address of each Trustee and Officer is 525 Market Street, 12th Floor, San Francisco, CA 94105. Each Trustee and Officer serves an indefinite term, however, each Trustee serves such term until reaching the mandatory retirement age established by the Trustees.
Independent Trustees
| | | | | | |
Name and
year of birth | | Position held and
length of service* | | Principal occupations during past five years or longer | | Current other
public company or
investment company
directorships |
William R. Ebsworth (Born 1957) | | Trustee, since 2015 | | Retired. From 1984 to 2013, equities analyst, portfolio manager, research director and chief investment officer at Fidelity Management and Research Company in Boston, Tokyo, and Hong Kong, and retired in 2013 as Chief Investment Officer of Fidelity Strategic Advisers, Inc. where he led a team of investment professionals managing client assets. Prior thereto, Board member of Hong Kong Securities Clearing Co., Hong Kong Options Clearing Corp., the Thailand International Fund, Ltd., Fidelity Investments Life Insurance Company, and Empire Fidelity Investments Life Insurance Company. Board member of the Vincent Memorial Hospital Endowment (non-profit organization), where he serves on the Investment Committee and as a Chair of the Audit Committee. Mr. Ebsworth is a CFA® charterholder. | | N/A |
Jane A. Freeman (Born 1953) | | Trustee, since 2015; Chair Liaison, since 2018 | | Retired. From 2012 to 2014 and 1999 to 2008, Chief Financial Officer of Scientific Learning Corporation. From 2008 to 2012, Ms. Freeman provided consulting services related to strategic business projects. Prior to 1999, Portfolio Manager at Rockefeller & Co. and Scudder, Stevens & Clark. Board member of the Harding Loevner Funds from 1996 to 2014, serving as both Lead Independent Director and chair of the Audit Committee. Board member of the Russell Exchange Traded Funds Trust from 2011 to 2012 and the chair of the Audit Committee. Ms. Freeman is a Board Member of The Ruth Bancroft Garden (non-profit organization). She is also an inactive Chartered Financial Analyst. | | N/A |
Isaiah Harris, Jr. (Born 1952) | | Trustee, since 2009 | | Retired. Chairman of the Board of CIGNA Corporation since 2009, and Director since 2005. From 2003 to 2011, Director of Deluxe Corporation. Prior thereto, President and CEO of BellSouth Advertising and Publishing Corp. from 2005 to 2007, President and CEO of BellSouth Enterprises from 2004 to 2005 and President of BellSouth Consumer Services from 2000 to 2003. Emeritus member of the Iowa State University Foundation Board of Governors. Emeritus Member of the Advisory Board of Iowa State University School of Business. Advisory Board Member, Palm Harbor Academy (private school). Advisory Board Member, Child Evangelism Fellowship (non-profit). Mr. Harris is a certified public accountant (inactive status). | | CIGNA Corporation |
Judith M. Johnson (Born 1949) | | Trustee, since 2008; Audit Committee Chairman, since 2009 | | Retired. Prior thereto, Chief Executive Officer and Chief Investment Officer of Minneapolis Employees Retirement Fund from 1996 to 2008. Ms. Johnson is an attorney, certified public accountant and a certified managerial accountant. | | N/A |
David F. Larcker (Born 1950) | | Trustee, since 2009 | | James Irvin Miller Professor of Accounting at the Graduate School of Business, Stanford University, Director of the Corporate Governance Research Initiative and Senior Faculty of The Rock Center for Corporate Governance since 2006. From 2005 to 2008, Professor of Accounting at the Graduate School of Business, Stanford University. Prior thereto, Ernst & Young Professor of Accounting at The Wharton School, University of Pennsylvania from 1985 to 2005. | | N/A |
| | | | |
| 38 | | Wells Fargo Government Securities Fund | | Other information (unaudited) |
| | | | | | |
Name and
year of birth | | Position held and
length of service* | | Principal occupations during past five years or longer | | Current other
public company or
investment company
directorships |
Olivia S. Mitchell (Born 1953) | | Trustee, since 2006; Governance Committee Chairman, since 2018 | | International Foundation of Employee Benefit Plans Professor, Wharton School of the University of Pennsylvania since 1993. Director of Wharton’s Pension Research Council and Boettner Center on Pensions & Retirement Research, and Research Associate at the National Bureau of Economic Research. Previously, Cornell University Professor from 1978 to 1993. | | N/A |
Timothy J. Penny (Born 1951) | | Trustee, since 1996; Chairman, since 2018; Vice Chairman, from 2017 to 2018 | | President and Chief Executive Officer of Southern Minnesota Initiative Foundation, a non-profit organization, since 2007. Member of the Board of Trustees of NorthStar Education Finance, Inc., a non-profit organization, since 2007. | | N/A |
James G. Polisson (Born 1959) | | Trustee, since 2018; Advisory Board Member, from 2017 to 2018 | | Retired. Chief Marketing Officer, Source (ETF) UK Services, Ltd, from 2015 to 2017. From 2012 to 2015, Principal of The Polisson Group, LLC, a management consulting, corporate advisory and principal investing company. Chief Executive Officer and Managing Director at Russell Investments, Global Exchange Traded Funds from 2010 to 2012. Managing Director of Barclays Global Investors from 1998 to 2010 and Global Chief Marketing Officer for iShares and Barclays Global Investors from 2000 to 2010. Trustee of the San Francisco Mechanics’ Institute, a non-profit organization, from 2013 to 2015. Board member of the Russell Exchange Traded Fund Trust from 2011 to 2012. Director of Barclays Global Investors Holdings Deutschland GmbH from 2006 to 2009. Mr. Polisson is an attorney and has a retired status with the Massachusetts and District of Columbia Bar Associations. | | N/A |
Michael S. Scofield (Born 1943) | | Trustee, since 2010 | | Served on the Investment Company Institute’s Board of Governors and Executive Committee from 2008-2011 as well the Governing Council of the Independent Directors Council from 2006-2011 and the Independent Directors Council Executive Committee from 2008-2011. Trustee of the Evergreen Fund complex (and its predecessors) from 1984 to 2010. Chairman of the Evergreen Funds from 2000-2010. Former Trustee of the Mentor Funds. Retired Attorney, Law Offices of Michael S. Scofield. | | N/A |
Pamela Wheelock (Born 1959) | | Trustee, since 2018; Advisory Board Member, from 2017 to 2018 | | Chief Operating Officer, Twin Cities Habitat for Humanity, since January, 2017. Vice President of University Services, University of Minnesota from 2012 to 2017. Prior thereto, on the Board of Directors, Governance Committee and Finance Committee for the Minnesota Philanthropy Partners (Saint Paul Foundation) from 2012 to 2018, Interim President and Chief Executive Officer of Blue Cross Blue Shield of Minnesota from 2010 to 2011, Chairman of the Board from 2009 to 2011 and Board Director from 2003 to 2015. Vice President, Leadership and Community Engagement, Bush Foundation, Saint Paul, Minnesota (a private foundation) from 2009 to 2011. Executive Vice President and Chief Financial Officer, Minnesota Sports and Entertainment from 2004 to 2009 and Senior Vice President from 2002 to 2004. Commissioner of Finance, State of Minnesota, from 1999 to 2002. Currently the Board Chair of the Minnesota Wild Foundation since 2010. | | N/A |
| * | Length of service dates reflect the Trustee’s commencement of service with the Trust’s predecessor entities, where applicable. |
| | | | | | |
| Other information (unaudited) | | Wells Fargo Government Securities Fund | | | 39 | |
Officers
| | | | | | |
Name and year of birth | | Position held and
length of service | | Principal occupations during past five years or longer | | |
Andrew Owen (Born 1960) | | President, since 2017 | | Executive Vice President of Wells Fargo & Company and Head of Affiliated Managers, Wells Fargo Asset Management, since 2014. In addition, Mr. Owen is currently President, Chief Executive Officer and Director of Wells Fargo Funds Management, LLC since 2017. Prior thereto, Executive Vice President responsible for marketing, investments and product development for Wells Fargo Funds Management, LLC, from 2009 to 2014. | | |
Nancy Wiser1 (Born 1967) | | Treasurer, since 2012 | | Executive Vice President of Wells Fargo Funds Management, LLC since 2011. Chief Operating Officer and Chief Compliance Officer at LightBox Capital Management LLC, from 2008 to 2011. | | |
Alexander Kymn3 (Born 1973) | | Secretary, since 2018; Chief Legal Officer, since 2018 | | Senior Company Counsel of Wells Fargo Bank, N.A. since 2018 (previously Senior Counsel from 2007 to 2018). Vice President of Wells Fargo Funds Management, LLC from 2008 to 2014. | | |
Michael H. Whitaker (Born 1967) | | Chief Compliance Officer, since 2016 | | Senior Vice President and Chief Compliance Officer since 2016. Senior Vice President and Chief Compliance Officer for Fidelity Investments from 2007 to 2016. | | |
David Berardi (Born 1975) | | Assistant Treasurer, since 2009 | | Vice President of Wells Fargo Funds Management, LLC since 2009. Vice President of Evergreen Investment Management Company, LLC from 2008 to 2010. Manager of Fund Reporting and Control for Evergreen Investment Management Company, LLC from 2004 to 2010. | | |
Jeremy DePalma1 (Born 1974) | | Assistant Treasurer, since 2009 | | Senior Vice President of Wells Fargo Funds Management, LLC since 2009. Senior Vice President of Evergreen Investment Management Company, LLC from 2008 to 2010 and head of the Fund Reporting and Control Team within Fund Administration from 2005 to 2010. | | |
| 1 | Nancy Wiser acts as Treasurer of 77 funds in the Fund Complex. Jeremy DePalma acts as Treasurer of 77 funds and Assistant Treasurer of 77 funds in the Fund Complex. |
| 2 | The Statement of Additional Information includes additional information about the Trustees and is available, without charge, upon request, by calling 1-800-222-8222 or by visiting the website at wellsfargofunds.com. |
| 3 | Alexander Kymn became the Secretary and Chief Legal Officer effective April 17, 2018. |
| | | | |
| 40 | | Wells Fargo Government Securities Fund | | Other information (unaudited) |
BOARD CONSIDERATION OF INVESTMENT MANAGEMENT AND SUB-ADVISORY AGREEMENTS:
Wells Fargo Government Securities Fund
Under the Investment Company Act of 1940 (the “1940 Act”), the Board of Trustees (the “Board”) of Wells Fargo Funds Trust (the “Trust”) must determine annually whether to approve the continuation of the Trust’s investment management and sub-advisory agreements. In this regard, at an in-person meeting held on May 22-23, 2018 (the “Meeting”), the Board, all the members of which have no direct or indirect interest in the investment management and sub-advisory agreements and are not “interested persons” of the Trust, as defined in the 1940 Act (the “Independent Trustees”), reviewed and approved for Wells Fargo Government Securities Fund (the “Fund”): (i) an investment management agreement (the “Management Agreement”) with Wells Fargo Funds Management, LLC (“Funds Management”); and (ii) an investment sub-advisory agreement (the “Sub-Advisory Agreement”) with Wells Capital Management Incorporated (the “Sub-Adviser”), an affiliate of Funds Management. The Management Agreement and the Sub-Advisory Agreement are collectively referred to as the “Advisory Agreements.”
At the Meeting, the Board considered the factors and reached the conclusions described below relating to the selection of Funds Management and the Sub-Adviser and the approval of the Advisory Agreements. Prior to the Meeting, including at an in-person meeting in April 2018, the Trustees conferred extensively among themselves and with representatives of Funds Management about these matters. Also, the Board has adopted a team-based approach, with each team consisting of a sub-set of Trustees, to assist the full Board in the discharge of its duties in reviewing investment performance and other matters throughout the year. The Independent Trustees were assisted in their evaluation of the Advisory Agreements by independent legal counsel, from whom they received separate legal advice and with whom they met separately.
In providing information to the Board, Funds Management and the Sub-Adviser were guided by a detailed set of requests for information submitted to them by independent legal counsel on behalf of the Independent Trustees at the start of the Board’s annual contract renewal process earlier in 2018. In considering and approving the Advisory Agreements, the Trustees considered the information they believed relevant, including but not limited to the information discussed below. The Board considered not only the specific information presented in connection with the Meeting, but also the knowledge gained over time through interaction with Funds Management and the Sub-Adviser about various topics. In this regard, the Board reviewed reports of Funds Management at each of its quarterly meetings, which included, among other things, portfolio reviews and investment performance reports. In addition, the Board and the teams mentioned above confer with portfolio managers at various times throughout the year. The Board did not identify any particular information or consideration that was all-important or controlling, and each individual Trustee may have attributed different weights to various factors.
After its deliberations, the Board unanimously approved the continuation of the Advisory Agreements for a one-year term and determined that the compensation payable to Funds Management and the Sub-Adviser under each of the Advisory Agreements was reasonable. The Board considered the approval of the Advisory Agreements for the Fund as part of its consideration of agreements for funds across the complex, but its approvals were made on a fund-by-fund basis. The following summarizes a number of important, but not necessarily all, factors considered by the Board in support of its approvals.
Nature, extent and quality of services
The Board received and considered various information regarding the nature, extent and quality of services provided to the Fund by Funds Management and the Sub-Adviser under the Advisory Agreements. This information included a description of the investment advisory services and Fund-level administrative services covered by the Management Agreement, as well as, among other things, a summary of the background and experience of senior management of Wells Fargo Asset Management (“WFAM”), of which Funds Management and the Sub-Adviser are a part, a summary of investments made in the business of WFAM, a summary of certain organizational and personnel changes involving Funds Management and the Sub-Adviser, and a description of Funds Management’s and the Sub-Adviser’s business continuity planning programs and of their approaches to data privacy and cybersecurity. The Board also considered the qualifications, background, tenure and responsibilities of each of the portfolio managers primarily responsible for the day-to-day portfolio management of the Fund.
The Board evaluated the ability of Funds Management and the Sub-Adviser to attract and retain qualified investment professionals, including research, advisory and supervisory personnel. The Board further considered the compliance programs and compliance records of Funds Management and the Sub-Adviser. In addition, the Board took into account the full range of services provided to the Fund by Funds Management and its affiliates.
| | | | | | |
| Other information (unaudited) | | Wells Fargo Government Securities Fund | | | 41 | |
Fund investment performance and expenses
The Board considered the investment performance results for the Fund over various time periods ended December 31, 2017. The Board considered these results in comparison to the investment performance of funds in a universe that was determined by Broadridge Inc. (“Broadridge”) to be similar to the Fund (the “Universe”), and in comparison to the Fund’s benchmark index and to other comparative data. Broadridge is an independent provider of investment company data. The Board received a description of the methodology used by Broadridge to select the mutual funds in the performance Universe. The Board noted that the investment performance of the Fund (Administrator Class) was higher than the average investment performance of the Universe for all periods under review. The Board also noted that the investment performance of the Fund was in range of its benchmark index, the Bloomberg Barclays U.S. Aggregate ex Credit Index, for the one- and ten-year periods under review but was lower than its benchmark index for the three- and five-year periods under review.
The Board received information concerning, and discussed factors contributing to, the performance of the Fund relative to the Universe and benchmark for the periods identified above. The Board took note of the explanations for the positive performance during these periods, including with respect to investment decisions and market factors that affected the Fund’s investment performance. The Board noted that the Fund experienced a portfolio manager change in 2017.
The Board also received and considered information regarding the Fund’s net operating expense ratios and their various components, including actual management fees, custodian and other non-management fees, and Rule 12b-1 and non-Rule 12b-1 shareholder service fees. The Board considered these ratios in comparison to the median ratios of funds in class-specific expense groups that were determined by Broadridge to be similar to the Fund (the “Groups”). The Board received a description of the methodology used by Broadridge to select the mutual funds in the expense Groups and an explanation of how funds comprising expense groups and their expense ratios may vary from year-to-year. Based on the Broadridge reports, the Board noted that the net operating expense ratios of the Fund were lower than the median net operating expense ratios of the expense Groups for each share class.
The Board took into account the Fund’s investment performance and expense information provided to it among the factors considered in deciding to re-approve the Advisory Agreements.
Investment management and sub-advisory fee rates
The Board reviewed and considered the contractual fee rates payable by the Fund to Funds Management under the Management Agreement, as well as the contractual fee rates payable by the Fund to Funds Management for class-level administrative services under a Class-Level Administration Agreement, which include, among other things, class-level transfer agency and sub-transfer agency costs (collectively, the “Management Rates”). The Board also reviewed and considered the contractual investment sub-advisory fee rates that are payable by Funds Management to the Sub-Adviser for investment sub-advisory services.
Among other information reviewed by the Board was a comparison of the Fund’s Management Rates with the average contractual investment management fee rates of funds in the expense Groups at a common asset level as well as transfer agency costs of the funds in the expense Groups. The Board noted that the Management Rates of the Fund were lower than the sum of these average rates for the Fund’s expense Groups for all share classes.
The Board also received and considered information about the portion of the total management fee that was retained by Funds Management after payment of the fee to the Sub-Adviser for sub-advisory services. In assessing the reasonableness of this amount, the Board received and evaluated information about the nature and extent of responsibilities retained and risks assumed by Funds Management and not delegated to or assumed by the Sub-Adviser, and about Funds Management’s on-going oversight services. Given the affiliation between Funds Management and the Sub-Adviser, the Board ascribed limited relevance to the allocation of fees between them.
The Board also received and considered information about the nature and extent of services offered and fee rates charged by Funds Management and the Sub-Adviser to other types of clients with investment strategies similar to those of the Fund. In this regard, the Board received information about the significantly greater scope of services, and compliance, reporting and other legal burdens and risks of managing mutual funds compared with those associated with managing assets of non-mutual fund clients such as institutional separate accounts.
Based on its consideration of the factors and information it deemed relevant, including those described here, the Board determined that the compensation payable to Funds Management under the Management Agreement and to the Sub-Adviser under the Sub-Advisory Agreement was reasonable.
| | | | |
| 42 | | Wells Fargo Government Securities Fund | | Other information (unaudited) |
Profitability
The Board received and considered information concerning the profitability of Funds Management, as well as the profitability of both WFAM and Wells Fargo & Co. (“Wells Fargo”) as a whole, from providing services to the Fund and the fund family as a whole. The Board noted that the Sub-Adviser’s profitability information with respect to providing services to the Fund was subsumed in the WFAM and Wells Fargo profitability analysis.
Funds Management reported on the methodologies and estimates used in calculating profitability, including a description of the methodology used to allocate certain expenses and recent enhancements made to the methodology. Among other things, the Board noted that the levels of profitability reported on a fund-by-fund basis varied widely, depending on factors such as the size and type of fund. Based on its review, the Board did not deem the profits reported by Funds Management, WFAM or Wells Fargo from services provided to the Fund to be at a level that would prevent it from approving the continuation of the Advisory Agreements.
Economies of scale
The Board considered the extent to which Funds Management may experience economies of scale in the provision of management services, and the extent to which scale benefits, if any, would be shared with shareholders. In particular, the Board noted the existence of breakpoints in the Fund’s management fee structure, which operate generally to reduce the Fund’s expense ratios as the Fund grows in size. It considered that, for a small fund or a fund that shrinks in size, breakpoints conversely can result in higher fee levels. The Board also considered that in addition to management fee breakpoints, competitive management fee rates set at the outset without regard to breakpoints and fee waiver and expense reimbursement arrangements, as well as investments in the business intended to enhance services available to Fund shareholders, are means of sharing potential economies of scale with shareholders of the Fund.
The Board concluded that the Fund’s fee and expense arrangements, including contractual breakpoints, constituted a reasonable approach to sharing potential economies of scale with the Fund and its shareholders.
Other benefits to Funds Management and the Sub-Adviser
The Board received and considered information regarding potential “fall-out” or ancillary benefits received by Funds Management and its affiliates, including the Sub-Adviser, as a result of their relationships with the Fund. Ancillary benefits could include, among others, benefits directly attributable to other relationships with the Fund and benefits potentially derived from an increase in Funds Management’s and the Sub-Adviser’s business as a result of their relationships with the Fund. The Board noted that various affiliates of Funds Management may receive distribution-related fees, shareholder servicing payments and sub-transfer agency fees in respect of shares sold or held through them and services provided.
The Board also reviewed information about soft dollar credits earned and utilized by the Sub-Adviser, fees earned by Funds Management and the Sub-Adviser from managing a private investment vehicle for the fund family’s securities lending collateral and commissions earned by an affiliated broker from portfolio transactions.
Based on its consideration of the factors and information it deemed relevant, including those described here, the Board did not find that any ancillary benefits received by Funds Management and its affiliates, including the Sub-Adviser, were unreasonable.
Conclusion
At the Meeting, after considering the above-described factors and based on its deliberations and its evaluation of the information described above, the Board unanimously approved the continuation of the Advisory Agreements for a one-year term and determined that the compensation payable to Funds Management and the Sub-Adviser under each of the Advisory Agreements was reasonable.
| | | | | | |
| Appendix A (unaudited) | | Wells Fargo Government Securities Fund | | | 43 | |
SALES CHARGE REDUCTIONS AND WAIVERS FOR CERTAIN INTERMEDIARIES
Ameriprise
Effective June 1, 2018, shareholders purchasing Fund shares through an Ameriprise Financial platform or account will be eligible only for the following Class A load waivers (front-end sales charge waivers), which may differ from those disclosed elsewhere in the Fund’s prospectus or Statement of Additional Information.
Front-end Sales Load Waivers on Class A Shares Available at Ameriprise Financial
| | • | | Employer-sponsored retirement plans (e.g., 401(k) plans, 457 plans, employer-sponsored 403(b) plans, profit sharing and money purchase pension plans and defined benefit plans). For purposes of this provision, employer-sponsored retirement plans do not include SEP IRAs, Simple IRAs or SAR-SEPs. |
| | • | | Shares purchased through an Ameriprise Financial investment advisory program (if an Advisory or similar share class for such investment advisory program is not available) |
| | • | | Shares purchased by third party investment advisors on behalf of their advisory clients through Ameriprise Financial’s platform (if an Advisory or similar share class for such investment advisory program is not available) |
| | • | | Shares purchased through reinvestment of distributions and dividend reinvestment when purchasing shares of the same Fund (but not any other fund within the same fund family) |
| | • | | Shares exchanged from Class C shares of the same fund in the month of or following the 10-year anniversary of the purchase date. To the extent that the Fund’s prospectus elsewhere provides for a waiver with respect to such shares following a shorter holding period, that waiver will apply to exchanges following such shorter period. To the extent that the Fund’s prospectus elsewhere provides for a waiver with respect to exchanges of Class C shares for load-waived shares, that waiver will also apply to such exchanges. |
| | • | | Employees and registered representatives of Ameriprise Financial or its affiliates and their immediate family members |
| | • | | Shares purchased by or through qualified accounts (including IRAs, Coverdell Education Savings Accounts, 401(k)s, 403(b) TSCAs subject to ERISA and defined benefit plans) that are held by a covered family member, defined as an Ameriprise financial advisor and/or the advisor’s spouse, advisor’s lineal ascendant (mother, father, grandmother, grandfather, great grandmother, great grandfather), advisor’s lineal descendant (son, step-son, daughter, step-daughter, grandson, granddaughter, great grandson, great granddaughter) or any spouse of a covered family member who is a lineal descendant |
| | • | | Shares purchased from the proceeds of redemptions within the same fund family, provided (1) the repurchase occurs within 90 days following the redemption, (2) the redemption and purchase occur in the same account, and (3) redeemed shares were subject to a front-end or deferred sales load (i.e. Rights of Reinstatement). Subject to the Fund’s policy regarding frequent purchases and redemptions of Fund shares, you may not be able to repurchase shares for the first 30 days after your redemption. |
Automatic Exchange of Class C Shares Available at Ameriprise Financial
| | • | | Class C shares will automatically exchange to Class A shares in the month of the 10-year anniversary of the purchase date. |
Merrill Lynch
Effective April 10, 2017, shareholders purchasing Fund shares through a Merrill Lynch platform or account will be eligible only for the following load waivers (front-end sales charge waivers and contingent deferred, or back-end, sales charge waivers) and discounts, which may differ from those disclosed elsewhere in the Fund’s prospectus or Statement of Additional Information.
Front-end Sales Load Waivers on Class A Shares available at Merrill Lynch
| | • | | Employer-sponsored retirement, deferred compensation and employee benefit plans (including health savings accounts) and trusts used to fund those plans, provided that the shares are not held in a commission-based brokerage account and shares are held for the benefit of the plan |
| | • | | Shares purchased by or through a 529 Plan |
| | • | | Shares purchased through a Merrill Lynch affiliated investment advisory program |
| | | | |
| 44 | | Wells Fargo Government Securities Fund | | Appendix A (unaudited) |
| | • | | Shares purchased by third party investment advisors on behalf of their advisory clients through Merrill Lynch’s platform |
| | • | | Shares of funds purchased through the Merrill Edge Self-Directed platform (if applicable) |
| | • | | Shares purchased through reinvestment of capital gains distributions and dividend reinvestment when purchasing shares of the same fund (but not any other fund within the fund family) |
| | • | | Shares exchanged from Class C (i.e. level-load) shares of the same fund in the month of or following the 10-year anniversary of the purchase date |
| | • | | Employees and registered representatives of Merrill Lynch or its affiliates and their family members, as defined by Merrill Lynch, which may differ from the definition of family member in the Fund’s prospectus. |
| | • | | Directors or Trustees of the Fund, and employees of the Fund’s investment adviser or any of its affiliates, as described in the Fund’s prospectus |
| | • | | Shares purchased from the proceeds of redemptions within the same fund family, provided (1) the repurchase occurs within 90 days following the redemption, (2) the redemption and purchase occur in the same account, and (3) redeemed shares were subject to a front-end or deferred sales load (known as Rights of Reinstatement). Subject to the Fund’s policy regarding frequent purchases and redemptions of Fund shares, you may not be able to repurchase shares for the first 30 days after your redemption. |
CDSC Waivers on A, B and C Shares available at Merrill Lynch
| | • | | Death or disability of the shareholder |
| | • | | Shares sold as part of a systematic withdrawal plan as described in the Fund’s prospectus |
| | • | | Return of excess contributions from an IRA Account |
| | • | | Shares sold as part of a required minimum distribution for IRA and retirement accounts due to the shareholder reaching age 70½ |
| | • | | Shares sold to pay Merrill Lynch fees but only if the transaction is initiated by Merrill Lynch |
| | • | | Shares acquired through a right of reinstatement |
| | • | | Shares held in retirement brokerage accounts, that are exchanged for a lower cost share class due to transfer to certain fee based accounts or platforms (applicable to A and C shares only) |
Front-end load Discounts Available at Merrill Lynch: Breakpoints, Rights of Accumulation & Letters of Intent
| | • | | Breakpoints as described in the Fund’s prospectus |
| | • | | Rights of Accumulation (ROA) which entitle shareholders to breakpoint discounts will be automatically calculated based on the aggregated holding of fund family assets held by accounts within the purchaser’s household at Merrill Lynch. Eligible fund family assets not held at Merrill Lynch may be included in the ROA calculation only if the shareholder notifies his or her financial advisor about such assets. |
| | • | | Letters of Intent (LOI) which allow for breakpoint discounts based on anticipated purchases within a fund family, through Merrill Lynch, over a 13-month period of time (if applicable) |
Morgan Stanley
Effective on or about July 1, 2018, shareholders purchasing Fund shares through a Morgan Stanley Wealth Management transactional brokerage account will be eligible only for the following Class A load waivers (front-end sales charge waivers), which may differ from and be more limited than those disclosed in the Fund’s prospectus or Statement of Additional Information.
Front-end Sales Load Waivers on Class A Shares Available at Morgan Stanley
| | • | | Employer-sponsored retirement plans (e.g., 401(k) plans, 457 plans, employer-sponsored 403(b) plans, profit sharing and money purchase pension plans and defined benefit plans). For purposes of this provision, employer-sponsored retirement plans do not include SEP IRAs, Simple IRAs, SAR-SEPs or Keogh plans. |
| | • | | Morgan Stanley employee and employee-related accounts according to Morgan Stanley’s account linking rules |
| | • | | Shares purchased through reinvestment of dividends and capital gains distributions when purchasing shares of the same fund |
| | • | | Shares purchased through a Morgan Stanley self-directed brokerage account |
| | | | | | |
| Appendix A (unaudited) | | Wells Fargo Government Securities Fund | | | 45 | |
| | • | | Class C (i.e., level-load) shares that are no longer subject to a contingent deferred sales charge and are exchanged to Class A shares of the same fund pursuant to Morgan Stanley Wealth Management’s share class exchange program. |
| | • | | Shares purchased from the proceeds of redemptions within the same fund family, provided (i) the repurchase occurs within 90 days following the redemption, (ii) the redemption and purchase occur in the same account, and (iii) redeemed shares were subject to a front-end or deferred sales charge. This waiver is subject to the Fund’s policy regarding frequent purchases and redemption of Fund shares, as discussed under “Account Information—Frequent Purchases and Redemptions of Fund Shares” in the Fund’s prospectus. |
This page is intentionally left blank.
This page is intentionally left blank.
This page is intentionally left blank.

For more information
More information about Wells Fargo Funds is available free upon request. To obtain literature, please write, visit the Fund’s website, or call:
Wells Fargo Funds
P.O. Box 219967
Kansas City, MO 64121-9967
Website: wellsfargofunds.com
Individual investors: 1-800-222-8222
Retail investment professionals: 1-888-877-9275
Institutional investment professionals: 1-866-765-0778
This report and the financial statements contained herein are submitted for the general information of the shareholders of the Fund. If this report is used for promotional purposes, distribution of the report must be accompanied or preceded by a current prospectus. Before investing, please consider the investment objectives, risks, charges, and expenses of the investment. For a current prospectus and, if available, a summary prospectus, containing this information, call 1-800-222-8222 or visit the Fund’s website at wellsfargofunds.com. Read the prospectus carefully before you invest or send money.
Wells Fargo Asset Management (WFAM) is the trade name for certain investment advisory/management firms owned by Wells Fargo & Company. These firms include but are not limited to Wells Capital Management Incorporated and Wells Fargo Funds Management, LLC. Certain products managed by WFAM entities are distributed by Wells Fargo Funds Distributor, LLC (a broker/dealer and Member FINRA).
This material is for general informational and educational purposes only and is NOT intended to provide investment advice or a recommendation of any kind—including a recommendation for any specific investment, strategy, or plan.
NOT FDIC INSURED ◾ NO BANK GUARANTEE ◾ MAY LOSE VALUE
© 2018 Wells Fargo Funds Management, LLC. All rights reserved.
| | |
 | | 315405 10-18 A216/AR216 08-18 |
Annual Report
August 31, 2018

Wells Fargo High Yield Bond Fund


Reduce clutter. Save trees.
Sign up for electronic delivery of prospectuses and shareholder reports at wellsfargo.com/advantagedelivery
Contents
The views expressed and any forward-looking statements are as of August 31, 2018, unless otherwise noted, and are those of the Fund managers and/or Wells Fargo Funds Management, LLC. Discussions of individual securities, or the markets generally, or any Wells Fargo Fund are not intended as individual recommendations. Future events or results may vary significantly from those expressed in any forward-looking statements. The views expressed are subject to change at any time in response to changing circumstances in the market. Wells Fargo Funds Management, LLC and the Fund disclaim any obligation to publicly update or revise any views expressed or forward-looking statements.
NOT FDIC INSURED ◾ NO BANK GUARANTEE ◾ MAY LOSE VALUE
| | | | |
| 2 | | Wells Fargo High Yield Bond Fund | | Letter to shareholders (unaudited) |

Andrew Owen
President
Wells Fargo Funds
After advancing during 2017, economic growth and stock markets globally diverged during the first eight months of 2018.
Dear Shareholder:
We are pleased to offer you this annual report for the Wells Fargo High Yield Bond Fund for the 12-month period that ended August 31, 2018. After advancing during 2017, economic growth and stock markets globally diverged during the first eight months of 2018. For fixed-income investors, taxable bond returns suffered and high-yield and municipal bond returns were positive.
For the period, U.S. stocks, as measured by the S&P 500 Index,1 gained 19.66%, and international stocks, as measured by the MSCI ACWI ex USA Index (Net),2 added 3.18%. Based on the MSCI EM Index (Net),3 emerging market stocks lost 0.68%. For bond investors, the Bloomberg Barclays U.S. Aggregate Bond Index4 declined 1.05% while the Bloomberg Barclays Global Aggregate ex-USD Index5 fell 1.64%. The Bloomberg Barclays Municipal Bond Index6 added 0.49%, and the ICE BofAML U.S. High Yield Index7 was up 3.26%.
Continued optimism in the U.S. characterized the fourth quarter of 2017.
Some observers described economic conditions in late 2017 as a Goldilocks scenario: synchronized global growth, low inflation, healthy corporate earnings, and a weaker U.S. dollar that supported international growth. During the quarter, the U.S. Bureau of Economic Analysis reported that annualized U.S. gross domestic product (GDP) growth for the third quarter of 2017 was 2.8% and inflation remained below U.S. Federal Reserve (Fed) targets. U.S. corporate earnings and consumer confidence improved.
Economic momentum increased in Europe. The Bank of England (BOE) raised interest rates in November 2017 to 0.50%, the first increase in more than 10 years, indicating confidence in the economy’s growth potential. Meanwhile, the European Central Bank and the Bank of Japan kept interest rates low to spur business activities and bought bonds in an effort to encourage equity investments. The People’s Bank of China’s (PBOC’s) policies sought to stimulate business. Many emerging market economies benefited from stronger currencies versus the U.S. dollar, while commodity price increases benefited countries that rely on natural resources for exports.
| 1 | The S&P 500 Index consists of 500 stocks chosen for market size, liquidity, and industry group representation. It is a market-value-weighted index with each stock’s weight in the index proportionate to its market value. You cannot invest directly in an index. |
| 2 | The Morgan Stanley Capital International (MSCI) All Country World Index (ACWI) ex USA Index (Net) is a free-float-adjusted market-capitalization-weighted index that is designed to measure the equity market performance of developed markets, excluding the United States and Canada. Source: MSCI. MSCI makes no express or implied warranties or representations and shall have no liability whatsoever with respect to any MSCI data contained herein. The MSCI data may not be further redistributed or used as a basis for other indices or any securities or financial products. This report is not approved, reviewed, or produced by MSCI. You cannot invest directly in an index. |
| 3 | The MSCI Emerging Markets (EM) Index (Net) is a free-float-adjusted market-capitalization-weighted index that is designed to measure large- and mid-cap equity market performance of emerging markets. The MSCI EM Index (Net) consists of the following 24 emerging market country indices: Brazil, Chile, China, Colombia, Czech Republic, Egypt, Greece, Hungary, India, Indonesia, Korea, Malaysia, Mexico, Pakistan, Peru, the Philippines, Poland, Qatar, Russia, South Africa, Taiwan, Thailand, Turkey, and the United Arab Emirates. You cannot invest directly in an index. |
| 4 | The Bloomberg Barclays U.S. Aggregate Bond Index is a broad-based benchmark that measures the investment-grade, U.S. dollar-denominated, fixed-rate taxable bond market, including Treasuries, government-related and corporate securities, mortgage-backed securities (agency fixed-rate and hybrid adjustable-rate mortgage pass-throughs), asset-backed securities, and commercial mortgage-backed securities. You cannot invest directly in an index. |
| 5 | The Bloomberg Barclays Global Aggregate ex-USD Index is an unmanaged index that provides a broad-based measure of the global investment-grade fixed-income markets excluding the U.S. dollar-denominated debt market. You cannot invest directly in an index. |
| 6 | The Bloomberg Barclays Municipal Bond Index is an unmanaged index composed of long-term tax-exempt bonds with a minimum credit rating of Baa. You cannot invest directly in an index. |
| 7 | The ICE BofAML U.S. High Yield Index is a market-capitalization-weighted index of domestic and Yankee high-yield bonds. The index tracks the performance of high-yield securities traded in the U.S. bond market. You cannot invest directly in an index. Copyright 2018. ICE Data Indices, LLC. All rights reserved. |
| | | | | | |
| Letter to shareholders (unaudited) | | Wells Fargo High Yield Bond Fund | | | 3 | |
Volatility reemerged during the first quarter of 2018 as global tensions and inflation fears increased.
Stock market gains in January 2018 followed the passage of lower U.S. tax rates. Some investors then grew concerned about trade, particularly between the U.S. and China, and the specter of inflation. The Fed followed its 25-basis-point (bp; 100 bps equal 1.00%) federal funds rate increase in December 2017 with a further 25-bp increase in March 2018. The inflation rate in March reached the Fed’s 2% target for the first time in a year.
The S&P 500 Index closed the first quarter with a negative return, the first negative quarterly return for the index since 2014. Overseas investment markets reversed strong returns in 2017, hurt by a stronger U.S. dollar and mounting trade and diplomatic tensions. After gaining 27.19% for the 12-month period that ended December 31, 2017, the MSCI ACWI ex USA Index (Net) declined 1.81% for the quarter that ended March 31, 2018.
Global trade tensions escalated during the second quarter.
Global trade tensions escalated throughout the second quarter of 2018. The U.S. government imposed tariffs, and foreign governments in North America, Europe, and Asia retaliated. The escalating tensions chilled investment activity as observers awaited signals of next steps.
Meanwhile, inflation continued an upward trend. The CPI-U8 added 0.1% in June after increases of 0.2% in both April and May. On a year-over-year basis, the all-items index rose 2.9% for the 12 months that ended June 30, 2018. The index for all items less food and energy rose 2.3% for the same 12-month period.
U.S. stocks gained while international stocks and bonds declined during the summer of 2018.
The U.S. economy strengthened during the summer months. Revised second-quarter GDP data released in August showed the U.S. economy growing at a 4.2% rate. After ticking up slightly in June, the unemployment rate in the U.S. was 3.9% in July and August, according to the U.S. Department of Labor. Wages showed more consistent growth than they had in recent quarters, and consumer confidence remained strong.
Several U.S. equity market indices reached records during August, with the S&P 500 Index gaining 7.76% for the three-month period that ended August 31, 2018. International stock values continued to suffer under the effects of a strong U.S. dollar and continuing trade tensions. The MSCI ACWI ex USA Index (Net) and the MSCI EM Index (Net) were down 4.70% and 1.64%, respectively, during the same three-month period.
The Fed increased the federal funds rate in June, and expectations grew that two more rate increases were in the offing in 2018. Long-term interest rates in the U.S. remained at higher levels relative to the prior 10 years. Rates on 10-year and 30-year Treasury bonds—2.46% and 2.81%, respectively, on January 1, 2018—were 2.86% and 3.02%, respectively, on August 31, off their peak levels on May 17, 2018, of 3.11% and 3.25%, respectively. Some investors became more aware of and concerned about the potential for an inverted yield curve—sometimes a recession signal—as short-term rates increased more quickly than long-term rates. The Fed decided to forgo an interest rate increase at its August meeting.
The S&P 500 Index closed the first quarter with a negative return, the first negative quarterly return for the index since 2014.
| 8 | The Consumer Price Index for All Urban Consumers (CPI-U) measures the changes in the price of a basket of goods and services purchased by urban consumers. The urban consumer population is deemed by many as a better representative measure of the general public because close to 90% of the country’s population lives in highly populated areas. You cannot invest directly in an index. |
| | | | |
| 4 | | Wells Fargo High Yield Bond Fund | | Letter to shareholders (unaudited) |
Internationally, members of Prime Minister Theresa May’s U.K./Brexit negotiating team resigned amid unproductive negotiations. In early August, the BOE’s Monetary Policy Committee increased its key interest rate to 0.75%. Central banks in Europe and Japan maintained low interest rates and accommodative monetary policies. Amid rising trade uncertainty, the PBOC cut reserve requirement ratios and accelerated infrastructure spending and tax cuts for business enterprises and individuals. Nevertheless, a strengthening U.S. dollar and the trade tensions remained headwinds for investors overseas.
Don’t let short-term uncertainty derail long-term investment goals.
Periods of investment uncertainty can present challenges, but experience has taught us that maintaining long-term investment goals can be an effective way to plan for the future. To help you create a sound strategy based on your personal goals and risk tolerance, Wells Fargo Funds offers more than 100 mutual funds spanning a wide range of asset classes and investment styles. Although diversification cannot guarantee an investment profit or prevent losses, we believe it can be an effective way to manage investment risk and potentially smooth out overall portfolio performance. We encourage investors to know their investments and to understand that appropriate levels of risk-taking may unlock opportunities.
Thank you for choosing to invest with Wells Fargo Funds. We appreciate your confidence in us and remain committed to helping you meet your financial needs.
Sincerely,

Andrew Owen
President
Wells Fargo Funds
Notice to shareholders
At a meeting held on August 14-15, 2018, the Board of Trustees of the Fund approved the following policy which will be effective on or about February 5, 2019:
Class C shares will convert automatically into Class A shares ten years after the initial date of purchase or, if you acquired your Class C shares through an exchange or conversion from another share class, ten years after the date you acquired your Class C shares. When Class C shares that you acquired through a purchase or exchange convert, any other Class C shares that you purchased with reinvested dividends and distributions also will convert into Class A shares on a pro rata basis. A shorter holding period may also apply depending on your intermediary. Please see “Appendix A—Sales Charge Reductions and Waivers for Certain Intermediaries” in the Fund’s prospectus or at the end of this report.
For further information about your Fund, contact your investment professional, visit our website at wellsfargofunds.com, or call us directly at 1-800-222-8222.
This page is intentionally left blank.
| | | | |
| 6 | | Wells Fargo High Yield Bond Fund | | Performance highlights (unaudited) |
Investment objective
The Fund seeks total return, consisting of a high level of current income and capital appreciation.
Manager
Wells Fargo Funds Management, LLC
Subadviser
Wells Capital Management Incorporated
Portfolio manager
Margaret D. Patel
Average annual total returns (%) as of August 31, 20181
| | | | | | | | | | | | | | | | | | | | | | | | | | | | | | | | | | |
| | | | | Including sales charge | | | Excluding sales charge | | | Expense ratios2 (%) | |
| | | Inception date | | 1 year | | | 5 year | | | 10 year | | | 1 year | | | 5 year | | | 10 year | | | Gross | | | Net3 | |
| Class A (EKHAX) | | 1-20-1998 | | | (3.85 | ) | | | 4.20 | | | | 6.72 | | | | 0.68 | | | | 5.17 | | | | 7.22 | | | | 1.02 | | | | 0.93 | |
| Class C (EKHCX) | | 1-21-1998 | | | (1.07 | ) | | | 4.39 | | | | 6.43 | | | | (0.07 | ) | | | 4.39 | | | | 6.43 | | | | 1.77 | | | | 1.68 | |
| Administrator Class (EKHYX) | | 4-14-1998 | | | – | | | | – | | | | – | | | | 0.82 | | | | 5.43 | | | | 7.48 | | | | 0.96 | | | | 0.80 | |
| Institutional Class (EKHIX) | | 10-31-2014 | | | – | | | | – | | | | – | | | | 0.79 | | | | 5.52 | | | | 7.52 | | | | 0.69 | | | | 0.53 | |
| ICE BofAML U.S. High Yield Constrained Index4 | | – | | | – | | | | – | | | | – | | | | 3.27 | | | | 5.64 | | | | 8.41 | | | | – | | | | – | |
Figures quoted represent past performance, which is no guarantee of future results, and do not reflect taxes that a shareholder may pay on fund distributions or the redemption of fund shares. Investment return and principal value of an investment will fluctuate so that an investor’s shares, when redeemed, may be worth more or less than their original cost. Performance shown without sales charges would be lower if sales charges were reflected. Current performance may be lower or higher than the performance data quoted, which assumes the reinvestment of dividends and capital gains. Current month-end performance is available on the Fund’s website, wellsfargofunds.com.
Index returns do not include transaction costs associated with buying and selling securities, any mutual fund fees or expenses, or any taxes. It is not possible to invest directly in an index.
For Class A shares, the maximum front-end sales charge is 4.50%. For Class C shares, the maximum contingent deferred sales charge is 1.00%. Performance including a contingent deferred sales charge assumes the sales charge for the corresponding time period. Administrator Class and Institutional Class shares are sold without a front-end sales charge or contingent deferred sales charge.
Bond values fluctuate in response to the financial condition of individual issuers, general market and economic conditions, and changes in interest rates. Changes in market conditions and government policies may lead to periods of heightened volatility in the bond market and reduced liquidity for certain bonds held by the Fund. In general, when interest rates rise, bond values fall and investors may lose principal value. Interest rate changes and their impact on the Fund and its share price can be sudden and unpredictable. The use of derivatives may reduce returns and/or increase volatility. High-yield securities have a greater risk of default and tend to be more volatile than higher-rated debt securities. Loans are subject to risks similar to those associated with other below investment-grade bond investments, such as credit risk (for example, risk of issuer default), below investment-grade bond risk (for example, risk of greater volatility in value), and risk that the loan may become illiquid or difficult to price. The Fund is exposed to foreign investment risk. Consult the Fund’s prospectus for additional information on these and other risks.
Please see footnotes on page 7.
| | | | | | |
| Performance highlights (unaudited) | | Wells Fargo High Yield Bond Fund | | | 7 | |
|
| Growth of $10,000 investment as of August 31, 20185 |
|
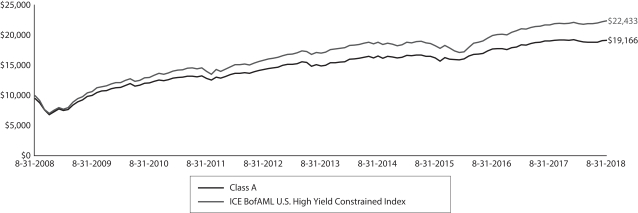 |
| 1 | Historical performance shown for the Institutional Class shares prior to their inception reflects the performance of the Administrator Class shares, and is not adjusted to reflect the Institutional Class expenses. If these expenses had been included, returns for the Institutional Class shares would be higher. Historical performance shown for all classes of the Fund prior to July 12, 2010 is based on the performance of the Fund’s predecessor, Evergreen High Income Fund. |
| 2 | Reflects the expense ratios as stated in the most recent prospectuses. The expense ratios shown are subject to change and may differ from the annualized expense ratios shown in the financial highlights of this report. |
| 3 | The manager has contractually committed through December 31, 2018, to waive fees and/or reimburse expenses to the extent necessary to cap the Fund’s Total Annual Fund Operating Expenses After Fee Waivers at the amounts shown. After this time, the cap may be increased or the commitment to maintain the cap may be terminated only with the approval of the Board of Trustees. Brokerage commissions, stamp duty fees, interest, taxes, acquired fund fees and expenses (if any), and extraordinary expenses are excluded from the expense cap. Without this cap, the Fund’s returns would have been lower. The expense ratio paid by an investor is the net expense ratio (the total annual fund operating expenses after fee waivers) as stated in the prospectuses. |
| 4 | The ICE BofAML U.S. High Yield Constrained Index is a market value-weighted index of all domestic and Yankee high-yield bonds, including deferred interest bonds and payment-in kind securities. Issues included in the index have maturities of one year or more and have a credit rating lower than BBB–/Baa3 but are not in default. The ICE BofAML U.S. High Yield Constrained Index limits any individual issuer to a maximum of 2% benchmark exposure. You cannot invest directly in an index. Copyright 2018. ICE Data Indices, LLC. All rights reserved. |
| 5 | The chart compares the performance of Class A shares for the most recent ten years with the performance of the ICE BofAML U.S. High Yield Constrained Index. The chart assumes a hypothetical investment of $10,000 in Class A shares and reflects all operating expenses and assumes the maximum initial sales charge of 4.50%. |
| 6 | The ten largest holdings, excluding cash, cash equivalents and any money market funds, are calculated based on the value of the investments divided by total net assets of the Fund. Holdings are subject to change and may have changed since the date specified. |
| 7 | The credit quality distribution of portfolio holdings reflected in the chart is based on ratings from Standard & Poor’s, Moody’s Investors Service, and/ or Fitch Ratings Ltd. Credit quality ratings apply to the underlying holdings of the Fund and not to the Fund itself. The percentages of the Fund’s portfolio with the ratings depicted in the chart are calculated based on the total market value of fixed income securities held by the Fund. If a security was rated by all three rating agencies, the middle rating was utilized. If rated by two of three rating agencies, the lower rating was utilized, and if rated by one of the rating agencies, that rating was utilized. Standard & Poor’s rates the creditworthiness of bonds, ranging from AAA (highest) to D (lowest). Ratings from A to CCC may be modified by the addition of a plus (+) or minus (-) sign to show relative standing within the rating categories. Standard & Poor’s rates the creditworthiness of short-term notes from SP-1 (highest) to SP-3 (lowest). Moody’s rates the creditworthiness of bonds, ranging from Aaa (highest) to C (lowest). Ratings Aa to B may be modified by the addition of a number 1 (highest) to 3 (lowest) to show relative standing within the ratings categories. Moody’s rates the creditworthiness of short-term U.S. tax-exempt municipal securities from MIG 1/VMIG 1 (highest) to SG (lowest). Fitch rates the creditworthiness of bonds, ranging from AAA (highest) to D (lowest). Credit quality distribution is subject to change and may have changed since the date specified. |
| * | This security was no longer held at the end of the reporting period. |
| | | | |
| 8 | | Wells Fargo High Yield Bond Fund | | Performance highlights (unaudited) |
MANAGER’S DISCUSSION
Fund highlights
| ∎ | | The Fund underperformed its benchmark, the ICE BofAML U.S. High Yield Constrained Index, for the 12-month period that ended August 31, 2018. |
| ∎ | | The Fund’s overweight to better-quality high-yield bonds detracted from performance during the fiscal year because higher-quality credit tiers underperformed lower-quality credit tiers amid strong investor demand for yield. |
| ∎ | | The Fund’s modest allocation to common stocks (about 9% of total assets) provided above-index returns. Detractors included some of the Fund’s holdings in energy and midstream energy companies as well as information technology (IT) companies. |
| ∎ | | Detractors from bond performance included Diebold, Incorporated, a maker of ATM machines and point-of-sale services; Adient Global Holdings Company an automotive seating supplier; and Iron Mountain Incorporated, a records management and storage company. |
| ∎ | | Detractors from equity performance included energy-related Kinder Morgan, Incorporated, and The Williams Companies, Incorporated*, along with semiconductor company Broadcom, Incorporated and Applied Materials, Incorporated, a semiconductor equipment manufacturer. |
| | | | |
| Ten largest holdings (%) as of August 31, 20186 | |
HCA Incorporated, 5.38%, 2-1-2025 | | | 2.96 | |
Mallinckrodt plc, 5.50%, 4-15-2025 | | | 2.94 | |
Cheniere Corpus Christi Holdings LLC, 5.13%, 6-30-2027 | | | 2.87 | |
TransDigm Group Incorporated, 6.38%, 6-15-2026 | | | 2.68 | |
SPX FLOW Incorporated, 5.88%, 8-15-2026 | | | 2.64 | |
WESCO Distribution Incorporated, 5.38%, 6-15-2024 | | | 2.54 | |
Iron Mountain Incorporated, 5.38%, 6-1-2026 | | | 2.52 | |
AMN Healthcare Incorporated, 5.13%, 10-1-2024 | | | 2.50 | |
Tronox Finance plc, 5.75%, 10-1-2025 | | | 2.41 | |
Post Holdings Incorporated, 5.00%, 8-15-2026 | | | 2.01 | |
Most sectors of the corporate bond market delivered slightly negative total returns over the fiscal year, as income earned was somewhat more than offset by declines in bond prices as interest rates moved higher.
Fixed-income investors realized modestly negative returns during the period.
Low inflation, positive growth, and moderately higher interest rates combined to produce modestly negative returns for fixed-income investors in virtually all quality sectors, including both investment-grade and high-yield corporate bonds, with the only exception being bonds rated CCC or lower, which produced positive returns. For example, 10-year U.S. Treasury bonds at the end of August 2017 yielded approximately 2.12%, and by month-end August 2018, the yield of these bonds had risen to 2.86%.
The average yield for high-yield bonds also increased in the fiscal year, with the result that the yield advantage of high-yield bonds over similar-maturity Treasury bonds dropped from +398 basis points (bps; 100 bps equal 1.00%) on August 31, 2017, to +360 bps and a yield of 6.31% on August 31, 2018.
Bonds of specialty chemicals maker A. Schulman, Incorporated, outperformed, as the company was acquired by investment-grade-rated LyondellBasell Industries N.V. Bonds of TransDigm Group Incorporated, a manufacturer of aircraft components, also outperformed, reflecting good financial results. Bonds of Cheniere Corpus Christi Holdings, LLC, a company focused on transporting liquefied natural gas, contributed to performance. In the IT sector, bonds of Micron Technology, Incorporated, a maker of memory products, and Seagate Technology plc, a manufacturer of hard disk drive memory products, added to performance.
The Fund’s stock allocation was a modest 9% of total assets. However, the Fund’s holdings substantially outperformed the high-yield market and thus provided incremental return and potential liquidity. Holdings of Plains All American Pipeline, L.P.; Abbott Laboratories; LyondellBasell; and Alphabet Incorporated contributed to performance.
Please see footnotes on page 7.
| | | | | | |
| Performance highlights (unaudited) | | Wells Fargo High Yield Bond Fund | | | 9 | |
|
| Credit quality as of August 31, 20187 |
|
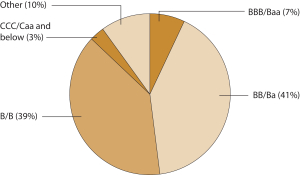
|
The Fund’s positioning reflects our optimistic economic outlook and expectations for interest rates.
The Fund’s holdings of higher-rated below-investment-grade bonds, along with a small exposure to common stocks, incorporate our forecast of continued moderate economic growth, historically low default rates for high-yield bonds, and gradual increases in short-term Treasury yields as the U.S. Federal Reserve (Fed) seeks to end its policy of low interest rates.
The portfolio maintains an allocation to out-of-benchmark BBB-rated debt, with continued avoidance of CCC-rated and distressed holdings, which we believe do not represent good relative investment value. In addition, the portfolio is
concentrated in companies whose operations are primarily in the U.S., with minimal exposure to companies whose products and services are dependent on commodity-based emerging market economies, many of which continue to experience growth rates that are below historical levels.
Virtually all of the Fund’s bond holdings are in companies with U.S. public equity outstanding, which we think provides a more flexible capital structure and more transparent reporting of financial results. We hold a modest allocation to common stocks, believing that this exposure offers fixed-income investors the potential for capital appreciation. In today’s high-yield bond market, most bonds are trading at prices around their face value, thus limiting the potential of future capital appreciation in our bond holdings.
Currently, many investors are worried that the Fed may continue to raise short-term interest rates, with possible negative effects on the yields and prices of high-yield bonds. We believe that the Fed will likely be sensitive in pursuing its higher interest rate policy so as not to disrupt the steady growth that the economy has been experiencing since the recovery from the financial crisis of 2008.
We believe the pace of any increase in Treasury interest rates may be quite modest and not likely to cause stress on the majority of high-yield, interest-rate-sensitive companies. We think the yield advantage offered by high-yield bonds over Treasury issues should remain near its historical low levels, reflecting low inflation, continued economic growth, and ample liquidity in the financial system.
We believe risk in the high-yield market could arise from those highly levered companies in weak or very competitive industries, putting pressure on those companies as they seek to service their debts. Thus, at a time of historically low interest rates and relatively narrow yield advantage to be gained from speculative-grade bonds, we continue to position the Fund in relatively higher-quality issues and in industries we perceive to be stable to growing, which may offer the best possibility of earning attractive total returns with lower risk of principal losses from deteriorating credits.
Please see footnotes on page 7.
| | | | |
| 10 | | Wells Fargo High Yield Bond Fund | | Fund expenses (unaudited) |
As a shareholder of the Fund, you incur two types of costs: (1) transaction costs, including sales charges (loads) on purchase payments and contingent deferred sales charges (if any) on redemptions and (2) ongoing costs, including management fees, distribution (12b-1) and/or shareholder servicing fees, and other Fund expenses. This example is intended to help you understand your ongoing costs (in dollars) of investing in the Fund and to compare these costs with the ongoing costs of investing in other mutual funds.
The example is based on an investment of $1,000 invested at the beginning of the six-month period and held for the entire period from March 1, 2018 to August 31, 2018.
Actual expenses
The “Actual” line of the table below provides information about actual account values and actual expenses. You may use the information in this line, together with the amount you invested, to estimate the expenses that you paid over the period. Simply divide your account value by $1,000 (for example, an $8,600 account value divided by $1,000 = 8.6), then multiply the result by the number in the “Actual” line under the heading entitled “Expenses paid during period” for your applicable class of shares to estimate the expenses you paid on your account during this period.
Hypothetical example for comparison purposes
The “Hypothetical” line of the table below provides information about hypothetical account values and hypothetical expenses based on the Fund’s actual expense ratio and an assumed rate of return of 5% per year before expenses, which is not the Fund’s actual return. The hypothetical account values and expenses may not be used to estimate the actual ending account balance or expenses you paid for the period. You may use this information to compare the ongoing costs of investing in the Fund and other funds. To do so, compare this 5% hypothetical example with the 5% hypothetical examples that appear in the shareholder reports of the other funds.
Please note that the expenses shown in the table are meant to highlight your ongoing costs only and do not reflect any transactional costs, such as sales charges (loads) and contingent deferred sales charges. Therefore, the “Hypothetical” line of the table is useful in comparing ongoing costs only and will not help you determine the relative total costs of owning different funds. In addition, if these transactional costs were included, your costs would have been higher.
| | | | | | | | | | | | | | | | |
| | | Beginning
account value
3-1-2018 | | | Ending
account value
8-31-2018 | | | Expenses
paid during
the period¹ | | | Annualized net
expense ratio | |
Class A | | | | | | | | | | | | | | | | |
Actual | | $ | 1,000.00 | | | $ | 1,006.45 | | | $ | 4.70 | | | | 0.93 | % |
Hypothetical (5% return before expenses) | | $ | 1,000.00 | | | $ | 1,020.52 | | | $ | 4.74 | | | | 0.93 | % |
Class C | | | | | | | | | | | | | | | | |
Actual | | $ | 1,000.00 | | | $ | 1,002.66 | | | $ | 8.48 | | | | 1.68 | % |
Hypothetical (5% return before expenses) | | $ | 1,000.00 | | | $ | 1,016.74 | | | $ | 8.54 | | | | 1.68 | % |
Administrator Class | | | | | | | | | | | | | | | | |
Actual | | $ | 1,000.00 | | | $ | 1,010.18 | | | $ | 4.05 | | | | 0.80 | % |
Hypothetical (5% return before expenses) | | $ | 1,000.00 | | | $ | 1,021.17 | | | $ | 4.08 | | | | 0.80 | % |
Institutional Class | | | | | | | | | | | | | | | | |
Actual | | $ | 1,000.00 | | | $ | 1,008.48 | | | $ | 2.68 | | | | 0.53 | % |
Hypothetical (5% return before expenses) | | $ | 1,000.00 | | | $ | 1,022.53 | | | $ | 2.70 | | | | 0.53 | % |
| 1 | Expenses paid is equal to the annualized net expense ratio of each class multiplied by the average account value over the period, multiplied by the number of days in the most recent fiscal half-year divided by the number of days in the fiscal year (to reflect the one-half-year period). |
| | | | | | |
| Portfolio of investments—August 31, 2018 | | Wells Fargo High Yield Bond Fund | | | 11 | |
| | | | | | | | | | | | | | | | |
| Security name | | | | | | | | Shares | | | Value | |
| | | | |
Common Stocks: 9.60% | | | | | | | | | | | | | | | | |
| | | | |
Consumer Staples: 0.21% | | | | | | | | | | | | | | | | |
| | | | |
| Food Products: 0.21% | | | | | | | | | | | | | | | | |
Lamb Weston Holdings Incorporated | | | | | | | | | | | 15,000 | | | $ | 1,014,000 | |
| | | | | | | | | | | | | | | | |
| | | | |
Energy: 2.98% | | | | | | | | | | | | | | | | |
| | | | |
| Oil, Gas & Consumable Fuels: 2.98% | | | | | | | | | | | | | | | | |
Andeavor Logistics LP | | | | | | | | | | | 85,000 | | | | 4,129,300 | |
Enterprise Products Partners | | | | | | | | | | | 50,000 | | | | 1,430,000 | |
Kinder Morgan Incorporated | | | | | | | | | | | 225,000 | | | | 3,982,500 | |
Plains All American Pipeline LP | | | | | | | | | | | 180,000 | | | | 4,701,600 | |
| | | | |
| | | | | | | | | | | | | | | 14,243,400 | |
| | | | | | | | | | | | | | | | |
| | | | |
Financials: 0.15% | | | | | | | | | | | | | | | | |
| | | | |
| Banks: 0.15% | | | | | | | | | | | | | | | | |
PNC Financial Services Group Incorporated | | | | | | | | | | | 5,000 | | | | 717,700 | |
| | | | | | | | | | | | | | | | |
| | | | |
Health Care: 0.90% | | | | | | | | | | | | | | | | |
| | | | |
| Health Care Equipment & Supplies: 0.67% | | | | | | | | | | | | | | | | |
Abbott Laboratories | | | | | | | | | | | 35,000 | | | | 2,339,400 | |
Becton Dickinson & Company | | | | | | | | | | | 2,000 | | | | 523,740 | |
West Pharmaceutical Services Incorporated | | | | | | | | | | | 3,000 | | | | 351,150 | |
| | | | |
| | | | | | | | | | | | | | | 3,214,290 | |
| | | | | | | | | | | | | | | | |
| | | | |
| Life Sciences Tools & Services: 0.14% | | | | | | | | | | | | | | | | |
Agilent Technologies Incorporated | | | | | | | | | | | 10,000 | | | | 675,400 | |
| | | | | | | | | | | | | | | | |
| | | | |
| Pharmaceuticals: 0.09% | | | | | | | | | | | | | | | | |
Merck KGaA ADR | | | | | | | | | | | 20,000 | | | | 420,800 | |
| | | | | | | | | | | | | | | | |
| | | | |
Industrials: 1.29% | | | | | | | | | | | | | | | | |
| | | | |
| Aerospace & Defense: 0.67% | | | | | | | | | | | | | | | | |
Huntington Ingalls Industries Incorporated | | | | | | | | | | | 5,000 | | | | 1,222,350 | |
Raytheon Company | | | | | | | | | | | 10,000 | | | | 1,994,400 | |
| | | | |
| | | | | | | | | | | | | | | 3,216,750 | |
| | | | | | | | | | | | | | | | |
| | | | |
| Industrial Conglomerates: 0.37% | | | | | | | | | | | | | | | | |
Roper Industries Incorporated | | | | | | | | | | | 6,000 | | | | 1,790,220 | |
| | | | | | | | | | | | | | | | |
| | | | |
| Machinery: 0.25% | | | | | | | | | | | | | | | | |
John Bean Technologies Corporation | | | | | | | | | | | 10,000 | | | | 1,183,000 | |
| | | | | | | | | | | | | | | | |
| | | | |
Information Technology: 2.26% | | | | | | | | | | | | | | | | |
| | | | |
| Electronic Equipment, Instruments & Components: 0.20% | | | | | | | | | | | | | | | | |
Amphenol Corporation Class A | | | | | | | | | | | 10,000 | | | | 945,800 | |
| | | | | | | | | | | | | | | | |
The accompanying notes are an integral part of these financial statements.
| | | | |
| 12 | | Wells Fargo High Yield Bond Fund | | Portfolio of investments—August 31, 2018 |
| | | | | | | | | | | | | | | | |
| Security name | | | | | | | | Shares | | | Value | |
| | | | |
| Internet Software & Services: 0.32% | | | | | | | | | | | | | | | | |
Alphabet Incorporated Class A † | | | | | | | | | | | 1,000 | | | $ | 1,231,800 | |
Nutanix Incorporated Class A † | | | | | | | | | | | 5,000 | | | | 281,600 | |
| | | | |
| | | | | | | | | | | | | | | 1,513,400 | |
| | | | | | | | | | | | | | | | |
| | | | |
| IT Services: 0.29% | | | | | | | | | | | | | | | | |
Leidos Holdings Incorporated | | | | | | | | | | | 20,000 | | | | 1,415,400 | |
| | | | | | | | | | | | | | | | |
| | | | |
| Semiconductors & Semiconductor Equipment: 1.26% | | | | | | | | | | | | | | | | |
Applied Materials Incorporated | | | | | | | | | | | 10,000 | | | | 430,200 | |
Broadcom Incorporated | | | | | | | | | | | 10,000 | | | | 2,190,300 | |
Microchip Technology Incorporated « | | | | | | | | | | | 5,000 | | | | 430,150 | |
Micron Technology Incorporated † | | | | | | | | | | | 25,000 | | | | 1,313,000 | |
QUALCOMM Incorporated | | | | | | | | | | | 5,000 | | | | 343,550 | |
Texas Instruments Incorporated | | | | | | | | | | | 5,000 | | | | 562,000 | |
Xilinx Incorporated | | | | | | | | | | | 10,000 | | | | 778,300 | |
| | | | |
| | | | | | | | | | | | | | | 6,047,500 | |
| | | | | | | | | | | | | | | | |
| | | | |
| Software: 0.16% | | | | | | | | | | | | | | | | |
Salesforce.com Incorporated † | | | | | | | | | | | 5,000 | | | | 763,400 | |
| | | | | | | | | | | | | | | | |
| | | | |
| Technology Hardware, Storage & Peripherals: 0.03% | | | | | | | | | | | | | | | | |
Pure Storage Incorporated Class A † | | | | | | | | | | | 5,000 | | | | 134,200 | |
| | | | | | | | | | | | | | | | |
| | | | |
Materials: 1.18% | | | | | | | | | | | | | | | | |
| | | | |
| Chemicals: 1.18% | | | | | | | | | | | | | | | | |
Celanese Corporation Series A | | | | | | | | | | | 15,000 | | | | 1,752,450 | |
Eastman Chemical Company | | | | | | | | | | | 10,000 | | | | 970,300 | |
Huntsman Corporation | | | | | | | | | | | 22,000 | | | | 670,780 | |
LyondellBasell Industries NV Class A | | | | | | | | | | | 20,000 | | | | 2,255,600 | |
| | | | |
| | | | | | | | | | | | | | | 5,649,130 | |
| | | | | | | | | | | | | | | | |
| | | | |
Real Estate: 0.19% | | | | | | | | | | | | | | | | |
| | | | |
| Equity REITs: 0.19% | | | | | | | | | | | | | | | | |
Saul Centers Incorporated | | | | | | | | | | | 15,000 | | | | 900,000 | |
| | | | | | | | | | | | | | | | |
| | | | |
Utilities: 0.44% | | | | | | | | | | | | | | | | |
| | | | |
| Electric Utilities: 0.15% | | | | | | | | | | | | | | | | |
American Electric Power Company Incorporated | | | | | | | | | | | 10,000 | | | | 717,300 | |
| | | | | | | | | | | | | | | | |
| | | | |
| Gas Utilities: 0.29% | | | | | | | | | | | | | | | | |
Atmos Energy Corporation | | | | | | | | | | | 15,000 | | | | 1,383,450 | |
| | | | | | | | | | | | | | | | |
| | | | |
Total Common Stocks (Cost $40,174,919) | | | | | | | | | | | | | | | 45,945,140 | |
| | | | | | | | | | | | | | | | |
The accompanying notes are an integral part of these financial statements.
| | | | | | |
| Portfolio of investments—August 31, 2018 | | Wells Fargo High Yield Bond Fund | | | 13 | |
| | | | | | | | | | | | | | | | |
| Security name | | Interest rate | | | Maturity date | | | Principal | | | Value | |
| | | | |
Corporate Bonds and Notes: 75.12% | | | | | | | | | | | | | | | | |
| | | | |
Consumer Discretionary: 5.69% | | | | | | | | | | | | | | | | |
| | | | |
| Auto Components: 2.15% | | | | | | | | | | | | | | | | |
Allison Transmission Incorporated 144A | | | 5.00 | % | | | 10-1-2024 | | | $ | 1,000,000 | | | $ | 985,000 | |
Dana Holding Corporation | | | 5.50 | | | | 12-15-2024 | | | | 1,500,000 | | | | 1,486,875 | |
Goodyear Tire & Rubber Company « | | | 5.13 | | | | 11-15-2023 | | | | 2,500,000 | | | | 2,493,750 | |
Tenneco Incorporated | | | 5.00 | | | | 7-15-2026 | | | | 6,000,000 | | | | 5,325,000 | |
| | | | |
| | | | | | | | | | | | | | | 10,290,625 | |
| | | | | | | | | | | | | | | | |
| | | | |
| Hotels, Restaurants & Leisure: 0.65% | | | | | | | | | | | | | | | | |
Speedway Motorsports Incorporated | | | 5.13 | | | | 2-1-2023 | | | | 3,115,000 | | | | 3,083,850 | |
| | | | | | | | | | | | | | | | |
| | | | |
| Media: 2.89% | | | | | | | | | | | | | | | | |
CCO Holdings LLC 144A | | | 5.75 | | | | 2-15-2026 | | | | 3,000,000 | | | | 3,000,000 | |
Clear Channel Worldwide Holdings Incorporated | | | 6.50 | | | | 11-15-2022 | | | | 3,000,000 | | | | 3,056,250 | |
McGraw-Hill Global Education Holdings LLC 144A« | | | 7.88 | | | | 5-15-2024 | | | | 5,500,000 | | | | 4,840,000 | |
Sinclair Television Group Incorporated 144A | | | 5.63 | | | | 8-1-2024 | | | | 3,000,000 | | | | 2,955,000 | |
| | | | |
| | | | | | | | | | | | | | | 13,851,250 | |
| | | | | | | | | | | | | �� | | | |
| | | | |
Consumer Staples: 3.63% | | | | | | | | | | | | | | | | |
| | | | |
| Food Products: 3.21% | | | | | | | | | | | | | | | | |
Dean Foods Company 144A« | | | 6.50 | | | | 3-15-2023 | | | | 5,000,000 | | | | 4,762,500 | |
Lamb Weston Holdings Incorporated 144A | | | 4.63 | | | | 11-1-2024 | | | | 1,000,000 | | | | 982,500 | |
Post Holdings Incorporated 144A | | | 5.00 | | | | 8-15-2026 | | | | 10,000,000 | | | | 9,600,000 | |
| | | | |
| | | | | | | | | | | | | | | 15,345,000 | |
| | | | | | | | | | | | | | | | |
| | | | |
| Household Products: 0.42% | | | | | | | | | | | | | | | | |
Spectrum Brands Incorporated | | | 5.75 | | | | 7-15-2025 | | | | 2,000,000 | | | | 2,020,000 | |
| | | | | | | | | | | | | | | | |
| | | | |
Energy: 4.17% | | | | | | | | | | | | | | | | |
| | | | |
| Energy Equipment & Services: 0.21% | | | | | | | | | | | | | | | | |
NGPL PipeCo LLC 144A | | | 4.88 | | | | 8-15-2027 | | | | 1,000,000 | | | | 1,007,740 | |
| | | | | | | | | | | | | | | | |
| | | | |
| Oil, Gas & Consumable Fuels: 3.96% | | | | | | | | | | | | | | | | |
Cheniere Corpus Christi Holdings LLC | | | 5.13 | | | | 6-30-2027 | | | | 13,500,000 | | | | 13,736,250 | |
Tennessee Gas Pipeline Company | | | 7.00 | | | | 3-15-2027 | | | | 4,534,000 | | | | 5,244,568 | |
| | | | |
| | | | | | | | | | | | | | | 18,980,818 | |
| | | | | | | | | | | | | | | | |
| | | | |
Financials: 2.12% | | | | | | | | | | | | | | | | |
| | | | |
| Banks: 0.66% | | | | | | | | | | | | | | | | |
Bank of America Corporation (3 Month LIBOR +3.90%) ± | | | 6.10 | | | | 12-29-2049 | | | | 3,000,000 | | | | 3,159,750 | |
| | | | | | | | | | | | | | | | |
| | | | |
| Consumer Finance: 0.72% | | | | | | | | | | | | | | | | |
Navient Corporation | | | 5.88 | | | | 10-25-2024 | | | | 1,000,000 | | | | 967,500 | |
SLM Corporation | | | 5.50 | | | | 1-25-2023 | | | | 2,500,000 | | | | 2,471,850 | |
| | | | |
| | | | | | | | | | | | | | | 3,439,350 | |
| | | | | | | | | | | | | | | | |
The accompanying notes are an integral part of these financial statements.
| | | | |
| 14 | | Wells Fargo High Yield Bond Fund | | Portfolio of investments—August 31, 2018 |
| | | | | | | | | | | | | | | | |
| Security name | | Interest rate | | | Maturity date | | | Principal | | | Value | |
| | | | |
| Insurance: 0.74% | | | | | | | | | | | | | | | | |
Genworth Holdings Incorporated | | | 4.80 | % | | | 2-15-2024 | | | $ | 4,000,000 | | | $ | 3,560,000 | |
| | | | | | | | | | | | | | | | |
| | | | |
Health Care: 17.29% | | | | | | | | | | | | | | | | |
| | | | |
| Health Care Equipment & Supplies: 2.15% | | | | | | | | | | | | | | | | |
Avanos Medical Incorporated | | | 6.25 | | | | 10-15-2022 | | | | 1,000,000 | | | | 1,022,500 | |
Teleflex Incorporated | | | 4.88 | | | | 6-1-2026 | | | | 9,415,000 | | | | 9,273,775 | |
| | | | |
| | | | | | | | | | | | | | | 10,296,275 | |
| | | | | | | | | | | | | | | | |
| | | | |
| Health Care Providers & Services: 11.17% | | | | | | | | | | | | | | | | |
AMN Healthcare Incorporated 144A | | | 5.13 | | | | 10-1-2024 | | | | 12,298,000 | | | | 11,944,433 | |
Davita Incorporated | | | 5.00 | | | | 5-1-2025 | | | | 9,000,000 | | | | 8,527,500 | |
Davita Incorporated | | | 5.13 | | | | 7-15-2024 | | | | 2,000,000 | | | | 1,928,240 | |
Encompass Health Corporation | | | 5.75 | | | | 11-1-2024 | | | | 4,000,000 | | | | 4,050,000 | |
HCA Incorporated | | | 5.38 | | | | 2-1-2025 | | | | 14,000,000 | | | | 14,160,020 | |
HealthSouth Corporation | | | 5.13 | | | | 3-15-2023 | | | | 5,000,000 | | | | 4,987,500 | |
Select Medical Corporation | | | 6.38 | | | | 6-1-2021 | | | | 3,500,000 | | | | 3,535,000 | |
West Street Merger Subordinate Incorporated 144A | | | 6.38 | | | | 9-1-2025 | | | | 4,400,000 | | | | 4,312,000 | |
| | | | |
| | | | | | | | | | | | | | | 53,444,693 | |
| | | | | | | | | | | | | | | | |
| | | | |
| Health Care Technology: 1.04% | | | | | | | | | | | | | | | | |
Quintiles IMS Holdings Incorporated 144A | | | 4.88 | | | | 5-15-2023 | | | | 3,000,000 | | | | 3,007,500 | |
Quintiles IMS Holdings Incorporated 144A | | | 5.00 | | | | 10-15-2026 | | | | 2,000,000 | | | | 1,975,000 | |
| | | | |
| | | | | | | | | | | | | | | 4,982,500 | |
| | | | | | | | | | | | | | | | |
| | | | |
| Life Sciences Tools & Services: 1.34% | | | | | | | | | | | | | | | | |
Charles River Laboratories Incorporated 144A | | | 5.50 | | | | 4-1-2026 | | | | 6,300,000 | | | | 6,394,500 | |
| | | | | | | | | | | | | | | | |
| | | | |
| Pharmaceuticals: 1.59% | | | | | | | | | | | | | | | | |
Catalent Pharma Solutions Incorporated 144A | | | 4.88 | | | | 1-15-2026 | | | | 8,000,000 | | | | 7,630,000 | |
| | | | | | | | | | | | | | | | |
| | | | |
Industrials: 15.06% | | | | | | | | | | | | | | | | |
| | | | |
| Aerospace & Defense: 4.71% | | | | | | | | | | | | | | | | |
Huntington Ingalls Industries Incorporated 144A | | | 5.00 | | | | 11-15-2025 | | | | 4,500,000 | | | | 4,663,800 | |
Moog Incorporated 144A | | | 5.25 | | | | 12-1-2022 | | | | 5,000,000 | | | | 5,068,750 | |
TransDigm Group Incorporated | | | 6.38 | | | | 6-15-2026 | | | | 12,700,000 | | | | 12,834,938 | |
| | | | |
| | | | | | | | | | | | | | | 22,567,488 | |
| | | | | | | | | | | | | | | | |
| | | | |
| Commercial Services & Supplies: 1.54% | | | | | | | | | | | | | | | | |
Acco Brands Corporation 144A | | | 5.25 | | | | 12-15-2024 | | | | 7,417,000 | | | | 7,379,915 | |
| | | | | | | | | | | | | | | | |
| | | | |
| Construction & Engineering: 0.62% | | | | | | | | | | | | | | | | |
Aecom Company | | | 5.13 | | | | 3-15-2027 | | | | 3,000,000 | | | | 2,947,500 | |
| | | | | | | | | | | | | | | | |
| | | | |
| Machinery: 5.00% | | | | | | | | | | | | | | | | |
Oshkosh Corporation | | | 5.38 | | | | 3-1-2025 | | | | 4,163,000 | | | | 4,298,298 | |
SPX FLOW Incorporated 144A | | | 5.63 | | | | 8-15-2024 | | | | 7,000,000 | | | | 7,017,500 | |
SPX FLOW Incorporated 144A | | | 5.88 | | | | 8-15-2026 | | | | 12,500,000 | | | | 12,625,000 | |
| | | | |
| | | | | | | | | | | | | | | 23,940,798 | |
| | | | | | | | | | | | | | | | |
The accompanying notes are an integral part of these financial statements.
| | | | | | |
| Portfolio of investments—August 31, 2018 | | Wells Fargo High Yield Bond Fund | | | 15 | |
| | | | | | | | | | | | | | | | |
| Security name | | Interest rate | | | Maturity date | | | Principal | | | Value | |
| | | | |
| Trading Companies & Distributors: 3.19% | | | | | | | | | | | | | | | | |
United Rentals North America Incorporated | | | 5.75 | % | | | 11-15-2024 | | | $ | 3,000,000 | | | $ | 3,096,600 | |
WESCO Distribution Incorporated | | | 5.38 | | | | 6-15-2024 | | | | 12,245,000 | | | | 12,153,163 | |
| | | | |
| | | | | | | | | | | | | | | 15,249,763 | |
| | | | | | | | | | | | | | | | |
| | | | |
Information Technology: 11.50% | | | | | | | | | | | | | | | | |
| | | | |
| Communications Equipment: 2.60% | | | | | | | | | | | | | | | | |
CommScope Incorporated 144A | | | 5.50 | | | | 6-15-2024 | | | | 8,200,000 | | | | 8,302,500 | |
CommScope Technologies Finance LLC 144A | | | 6.00 | | | | 6-15-2025 | | | | 4,000,000 | | | | 4,140,000 | |
| | | | |
| | | | | | | | | | | | | | | 12,442,500 | |
| | | | | | | | | | | | | | | | |
| | | | |
| Electronic Equipment, Instruments & Components: 1.87% | | | | | | | | | | | | | | | | |
TTM Technologies Incorporated 144A | | | 5.63 | | | | 10-1-2025 | | | | 9,000,000 | | | | 8,955,000 | |
| | | | | | | | | | | | | | | | |
| | | | |
| IT Services: 0.42% | | | | | | | | | | | | | | | | |
Gartner Incorporated 144A | | | 5.13 | | | | 4-1-2025 | | | | 2,000,000 | | | | 2,025,000 | |
| | | | | | | | | | | | | | | | |
| | | | |
| Semiconductors & Semiconductor Equipment: 3.61% | | | | | | | | | | | | | | | | |
Micron Technology Incorporated | | | 5.50 | | | | 2-1-2025 | | | | 7,900,000 | | | | 8,175,710 | |
Versum Materials Incorporated 144A | | | 5.50 | | | | 9-30-2024 | | | | 8,901,000 | | | | 9,101,273 | |
| | | | |
| | | | | | | | | | | | | | | 17,276,983 | |
| | | | | | | | | | | | | | | | |
| | | | |
| Software: 1.86% | | | | | | | | | | | | | | | | |
Fair Isaac Corporation 144A | | | 5.25 | | | | 5-15-2026 | | | | 1,000,000 | | | | 1,007,500 | |
Nuance Communications Company | | | 6.00 | | | | 7-1-2024 | | | | 6,760,000 | | | | 6,929,000 | |
Symantec Corporation 144A | | | 5.00 | | | | 4-15-2025 | | | | 1,000,000 | | | | 991,125 | |
| | | | |
| | | | | | | | | | | | | | | 8,927,625 | |
| | | | | | | | | | | | | | | | |
| | | | |
| Technology Hardware, Storage & Peripherals: 1.14% | | | | | | | | | | | | | | | | |
Diebold Incorporated « | | | 8.50 | | | | 4-15-2024 | | | | 7,700,000 | | | | 5,438,125 | |
| | | | | | | | | | | | | | | | |
| | | | |
Materials: 8.86% | | | | | | | | | | | | | | | | |
| | | | |
| Chemicals: 6.61% | | | | | | | | | | | | | | | | |
Koppers Incorporated 144A | | | 6.00 | | | | 2-15-2025 | | | | 3,363,000 | | | | 3,379,815 | |
Olin Corporation | | | 5.50 | | | | 8-15-2022 | | | | 8,275,000 | | | | 8,543,938 | |
Rayonier Advanced Materials Products Incorporated 144A | | | 5.50 | | | | 6-1-2024 | | | | 7,775,000 | | | | 7,408,253 | |
Tronox Incorporated 144A« | | | 6.50 | | | | 4-15-2026 | | | | 2,000,000 | | | | 1,960,000 | |
Valvoline Incorporated | | | 4.38 | | | | 8-15-2025 | | | | 8,000,000 | | | | 7,640,000 | |
Valvoline Incorporated | | | 5.50 | | | | 7-15-2024 | | | | 2,630,000 | | | | 2,689,175 | |
| | | | |
| | | | | | | | | | | | | | | 31,621,181 | |
| | | | | | | | | | | | | | | | |
| | | | |
| Containers & Packaging: 1.58% | | | | | | | | | | | | | | | | |
Berry Global Incorporated | | | 5.13 | | | | 7-15-2023 | | | | 2,000,000 | | | | 1,990,000 | |
Crown Americas Capital Corporation IV | | | 4.50 | | | | 1-15-2023 | | | | 2,000,000 | | | | 2,000,000 | |
Owens-Brockway Glass Container Incorporated 144A | | | 5.88 | | | | 8-15-2023 | | | | 2,000,000 | | | | 2,050,000 | |
Sealed Air Corporation 144A | | | 5.25 | | | | 4-1-2023 | | | | 1,500,000 | | | | 1,522,500 | |
| | | | |
| | | | | | | | | | | | | | | 7,562,500 | |
| | | | | | | | | | | | | | | | |
The accompanying notes are an integral part of these financial statements.
| | | | |
| 16 | | Wells Fargo High Yield Bond Fund | | Portfolio of investments—August 31, 2018 |
| | | | | | | | | | | | | | | | |
| Security name | | Interest rate | | | Maturity date | | | Principal | | | Value | |
| | | | |
| Metals & Mining: 0.55% | | | | | | | | | | | | | | | | |
Steel Dynamics Incorporated | | | 5.50 | % | | | 10-1-2024 | | | $ | 2,550,000 | | | $ | 2,613,750 | |
| | | | | | | | | | | | | | | | |
| | | | |
| Paper & Forest Products: 0.12% | | | | | | | | | | | | | | | | |
P.H. Glatfelter Company | | | 5.38 | | | | 10-15-2020 | | | | 600,000 | | | | 600,000 | |
| | | | | | | | | | | | | | | | |
| | | | |
Real Estate: 6.36% | | | | | | | | | | | | | | | | |
| | | | |
| Equity REITs: 6.36% | | | | | | | | | | | | | | | | |
Equinix Incorporated | | | 5.38 | | | | 5-15-2027 | | | | 6,430,000 | | | | 6,542,525 | |
Equinix Incorporated | | | 5.75 | | | | 1-1-2025 | | | | 5,193,000 | | | | 5,348,790 | |
Iron Mountain Incorporated 144A | | | 4.88 | | | | 9-15-2027 | | | | 500,000 | | | | 463,300 | |
Iron Mountain Incorporated 144A | | | 5.38 | | | | 6-1-2026 | | | | 12,750,000 | | | | 12,080,625 | |
Iron Mountain Incorporated | | | 5.75 | | | | 8-15-2024 | | | | 2,000,000 | | | | 1,982,500 | |
Sabra Health Care LP | | | 5.38 | | | | 6-1-2023 | | | | 4,000,000 | | | | 4,050,000 | |
| | | | |
| | | | | | | | | | | | | | | 30,467,740 | |
| | | | | | | | | | | | | | | | |
| | | | |
Telecommunication Services: 0.44% | | | | | | | | | | | | | | | | |
| | | | |
| Wireless Telecommunication Services: 0.44% | | | | | | | | | | | | | | | | |
T-Mobile USA Incorporated | | | 6.50 | | | | 1-15-2026 | | | | 2,000,000 | | | | 2,114,380 | |
| �� | | | | | | | | | | | | | | | |
| | | | |
Total Corporate Bonds and Notes (Cost $368,156,603) | | | | | | | | | | | | | | | 359,616,599 | |
| | | | | | | | | | | | | | | | |
| | | | |
Yankee Corporate Bonds and Notes: 13.66% | | | | | | | | | | | | | | | | |
| | | | |
Consumer Discretionary: 3.46% | | | | | | | | | | | | | | | | |
| | | | |
| Auto Components: 1.73% | | | | | | | | | | | | | | | | |
Adient Global Holdings Company 144A | | | 4.88 | | | | 8-15-2026 | | | | 9,210,000 | | | | 8,289,000 | |
| | | | | | | | | | | | | | | | |
| | | | |
| Automobiles: 0.64% | | | | | | | | | | | | | | | | |
Fiat Chrysler Automobiles NV | | | 5.25 | | | | 4-15-2023 | | | | 3,000,000 | | | | 3,048,750 | |
| | | | | | | | | | | | | | | | |
| | | | |
| Hotels, Restaurants & Leisure: 0.66% | | | | | | | | | | | | | | | | |
International Game Technology plc 144A | | | 6.50 | | | | 2-15-2025 | | | | 3,000,000 | | | | 3,150,000 | |
| | | | | | | | | | | | | | | | |
| | | | |
| Media: 0.43% | | | | | | | | | | | | | | | | |
Quebecor Media Incorporated | | | 5.75 | | | | 1-15-2023 | | | | 2,000,000 | | | | 2,070,000 | |
| | | | | | | | | | | | | | | | |
| | | | |
Financials: 2.41% | | | | | | | | | | | | | | | | |
| | | | |
| Diversified Financial Services: 2.41% | | | | | | | | | | | | | | | | |
Tronox Finance plc 144A | | | 5.75 | | | | 10-1-2025 | | | | 12,000,000 | | | | 11,550,000 | |
| | | | | | | | | | | | | | | | |
| | | | |
Health Care: 2.95% | | | | | | | | | | | | | | | | |
| | | | |
| Pharmaceuticals: 2.95% | | | | | | | | | | | | | | | | |
Mallinckrodt plc 144A« | | | 5.50 | | | | 4-15-2025 | | | | 16,500,000 | | | | 14,086,875 | |
| | | | | | | | | | | | | | | | |
| | | | |
Industrials: 1.71% | | | | | | | | | | | | | | | | |
| | | | |
| Electrical Equipment: 1.71% | | | | | | | | | | | | | | | | |
Sensata Technologies BV 144A | | | 4.88 | | | | 10-15-2023 | | | | 3,000,000 | | | | 3,000,000 | |
Sensata Technologies BV 144A | | | 5.63 | | | | 11-1-2024 | | | | 5,000,000 | | | | 5,175,000 | |
| | | | |
| | | | | | | | | | | | | | | 8,175,000 | |
| | | | | | | | | | | | | | | | |
The accompanying notes are an integral part of these financial statements.
| | | | | | |
| Portfolio of investments—August 31, 2018 | | Wells Fargo High Yield Bond Fund | | | 17 | |
| | | | | | | | | | | | | | | | |
| Security name | | Interest rate | | | Maturity date | | | Principal | | | Value | |
| | | | |
Information Technology: 2.73% | | | | | | | | | | | | | | | | |
| | | | |
| Technology Hardware, Storage & Peripherals: 2.73% | | | | | | | | | | | | | | | | |
Seagate HDD | | | 4.75 | % | | | 6-1-2023 | | | $ | 4,140,000 | | | $ | 4,157,718 | |
Seagate HDD | | | 4.88 | | | | 6-1-2027 | | | | 9,500,000 | | | | 8,914,629 | |
| | | | |
| | | | | | | | | | | | | | | 13,072,347 | |
| | | | | | | | | | | | | | | | |
| | | | |
Telecommunication Services: 0.40% | | | | | | | | | | | | | | | | |
| | | | |
| Diversified Telecommunication Services: 0.40% | | | | | | | | | | | | | | | | |
Virgin Media Finance plc 144A | | | 5.75 | | | | 1-15-2025 | | | | 2,000,000 | | | | 1,927,498 | |
| | | | | | | | | | | | | | | | |
| | | | |
Total Yankee Corporate Bonds and Notes (Cost $68,698,726) | | | | | | | | | | | | | | | 65,369,470 | |
| | | | | | | | | | | | | | | | |
| | | | |
| | | Yield | | | | | | Shares | | | | |
| Short-Term Investments: 7.79% | | | | | | | | | | | | | | | | |
| | | | |
| Investment Companies: 7.79% | | | | | | | | | | | | | | | | |
Securities Lending Cash Investment LLC (l)(r)(u) | | | 2.07 | | | | | | | | 34,166,983 | | | | 34,170,400 | |
Wells Fargo Government Money Market Fund Select Class (l)(u) | | | 1.87 | | | | | | | | 3,114,436 | | | | 3,114,436 | |
| | | | |
Total Short-Term Investments (Cost $37,284,836) | | | | | | | | | | | | | | | 37,284,836 | |
| | | | | | | | | | | | | | | | |
| | | | | | | | |
| Total investments in securities (Cost $514,315,084) | | | 106.17 | % | | | 508,216,045 | |
Other assets and liabilities, net | | | (6.17 | ) | | | (29,525,556 | ) |
| | | | | | | | |
| Total net assets | | | 100.00 | % | | $ | 478,690,489 | |
| | | | | | | | |
| † | Non-income-earning security |
| « | All or a portion of this security is on loan. |
| 144A | The security may be resold in transactions exempt from registration, normally to qualified institutional buyers, pursuant to Rule 144A under the Securities Act of 1933. |
| ± | Variable rate investment. The rate shown is the rate in effect at period end. |
| (l) | The issuer of the security is an affiliated person of the Fund as defined in the Investment Company Act of 1940. |
| (r) | The investment is a non-registered investment company purchased with cash collateral received from securities on loan. |
| (u) | The rate represents the 7-day annualized yield at period end. |
Abbreviations:
| ADR | American depositary receipt |
| LIBOR | London Interbank Offered Rate |
| REIT | Real estate investment trust |
The accompanying notes are an integral part of these financial statements.
| | | | |
| 18 | | Wells Fargo High Yield Bond Fund | | Portfolio of investments—August 31, 2018 |
Investments in Affiliates
An affiliated investment is an investment in which the Fund owns at least 5% of the outstanding voting shares of the issuer or as a result of other relationships, such as the Fund and the issuer having the same investment manager. Transactions with issuers that were either affiliated persons of the Fund at the beginning of the period or the end of the period were as follows:
| | | | | | | | | | | | | | | | | | | | | | | | | | | | | | | | | | | | |
| | | Shares,
beginning of
period | | | Shares
purchased | | | Shares
sold | | | Shares,
end of
period | | | Net
realized
gains
(losses) | | | Net
change in
unrealized
gains
(losses) | | | Income
from
affiliated
securities | | | Value,
end
of period | | | % of
net
assets | |
Short-Term Investments | | | | | | | | | | | | | | | | | | | | | | | | | | | | | | | | | | | | |
Investment Companies | | | | | | | | | | | | | | | | | | | | | | | | | | | | | | | | | | | | |
Securities Lending Cash Investment LLC | | | 13,052,787 | | | | 84,227,779 | | | | 63,113,583 | | | | 34,166,983 | | | $ | 654 | | | $ | (615 | ) | | $ | 71,914 | | | $ | 34,170,400 | | | | | |
Wells Fargo Government Money Market Fund Select Class | | | 8,238,288 | | | | 163,497,303 | | | | 168,621,155 | | | | 3,114,436 | | | | 0 | | | | 0 | | | | 60,060 | | | | 3,114,436 | | | | | |
| | | | | | | | | | | | | | | | | | | | | | | | | | | | | | | | | | | | |
| | | | | | | | | | | | | | | | | | $ | 654 | | | $ | (615 | ) | | $ | 131,974 | | | $ | 37,284,836 | | | | 7.79 | % |
| | | | | | | | | | | | | | | | | | | | | | | | | | | | | | | | | | | | |
The accompanying notes are an integral part of these financial statements.
| | | | | | |
| Statement of assets and liabilities—August 31, 2018 | | Wells Fargo High Yield Bond Fund | | | 19 | |
| | | | |
| | | | |
|
Assets | |
Investments in unaffiliated securities (including $33,496,577 of securities loaned), at value (cost $477,030,248) | | $ | 470,931,209 | |
Investments in affiliated securities, at value (cost $37,284,836) | | | 37,284,836 | |
Receivable for Fund shares sold | | | 50,892 | |
Receivable for dividends and interest | | | 5,883,012 | |
Receivable for securities lending income | | | 7,359 | |
Prepaid expenses and other assets | | | 113,511 | |
| | | | |
Total assets | | | 514,270,819 | |
| | | | |
|
Liabilities | |
Payable upon receipt of securities loaned | | | 34,169,293 | |
Payable for Fund shares redeemed | | | 1,037,840 | |
Management fee payable | | | 191,395 | |
Administration fees payable | | | 60,153 | |
Distribution fee payable | | | 33,786 | |
Trustees’ fees and expenses payable | | | 2,097 | |
Accrued expenses and other liabilities | | | 85,766 | |
| | | | |
Total liabilities | | | 35,580,330 | |
| | | | |
Total net assets | | $ | 478,690,489 | |
| | | | |
|
NET ASSETS CONSIST OF | |
Paid-in capital | | $ | 525,135,115 | |
Overdistributed net investment income | | | (35,978 | ) |
Accumulated net realized losses on investments | | | (40,309,609 | ) |
Net unrealized losses on investments | | | (6,099,039 | ) |
| | | | |
Total net assets | | $ | 478,690,489 | |
| | | | |
|
COMPUTATION OF NET ASSET VALUE AND OFFERING PRICE PER SHARE | |
Net assets – Class A | | $ | 272,169,888 | |
Shares outstanding – Class A1 | | | 82,923,853 | |
Net asset value per share – Class A | | | $3.28 | |
Maximum offering price per share – Class A2 | | | $3.43 | |
Net assets – Class C | | $ | 47,810,706 | |
Shares outstanding – Class C1 | | | 14,564,342 | |
Net asset value per share – Class C | | | $3.28 | |
Net assets – Administrator Class | | $ | 23,939,686 | |
Shares outstanding – Administrator Class1 | | | 7,287,087 | |
Net asset value per share – Administrator Class | | | $3.29 | |
Net assets – Institutional Class | | $ | 134,770,209 | |
Shares outstanding – Institutional Class1 | | | 41,031,317 | |
Net asset value per share – Institutional Class | | | $3.28 | |
| 1 | The Fund has an unlimited number of authorized shares. |
| 2 | Maximum offering price is computed as 100/95.50 of net asset value. On investments of $50,000 or more, the offering price is reduced. |
The accompanying notes are an integral part of these financial statements.
| | | | |
| 20 | | Wells Fargo High Yield Bond Fund | | Statement of operations—year ended August 31, 2018 |
| | | | |
| | | | |
| |
Investment income | | | | |
Interest | | $ | 25,030,711 | |
Dividends (net of foreign withholding taxes of $817) | | | 1,312,630 | |
Income from affiliated securities | | | 131,974 | |
| | | | |
Total investment income | | | 26,475,315 | |
| | | | |
| |
Expenses | | | | |
Management fee | | | 2,818,838 | |
Administration fees | |
Class A | | | 470,866 | |
Class C | | | 90,147 | |
Administrator Class | | | 27,576 | |
Institutional Class | | | 107,995 | |
Shareholder servicing fees | |
Class A | | | 735,727 | |
Class C | | | 140,854 | |
Administrator Class | | | 68,710 | |
Distribution fee | |
Class C | | | 422,562 | |
Custody and accounting fees | | | 32,686 | |
Professional fees | | | 62,301 | |
Registration fees | | | 83,083 | |
Shareholder report expenses | | | 104,409 | |
Trustees’ fees and expenses | | | 22,852 | |
Other fees and expenses | | | 14,156 | |
| | | | |
Total expenses | | | 5,202,762 | |
Less: Fee waivers and/or expense reimbursements | | | (583,248 | ) |
| | | | |
Net expenses | | | 4,619,514 | |
| | | | |
Net investment income | | | 21,855,801 | |
| | | | |
| |
REALIZED AND UNREALIZED GAINS (LOSSES) ON INVESTMENTS | | | | |
|
Net realized gains on: | |
Unaffiliated securities | | | 6,372,736 | |
Affiliated securities | | | 654 | |
| | | | |
Net realized gains on investments | | | 6,373,390 | |
| | | | |
|
Net change in unrealized gains (losses) on: | |
Unaffiliated securities | | | (25,332,208 | ) |
Affiliated securities | | | (615 | ) |
| | | | |
Net change in unrealized gains (losses) on investments | | | (25,332,823 | ) |
| | | | |
Net realized and unrealized gains (losses) on investments | | | (18,959,433 | ) |
| | | | |
Net increase in net assets resulting from operations | | $ | 2,896,368 | |
| | | | |
The accompanying notes are an integral part of these financial statements.
| | | | | | |
| Statement of changes in net assets | | Wells Fargo High Yield Bond Fund | | | 21 | |
| | | | | | | | | | | | | | | | |
| | | Year ended
August 31, 2018 | | | Year ended
August 31, 2017 | |
| |
Operations | | | | | |
Net investment income | | | | | | $ | 21,855,801 | | | | | | | $ | 24,919,734 | |
Net realized gains on investments | | | | | | | 6,373,390 | | | | | | | | 6,347,524 | |
Net change in unrealized gains (losses) on investments | | | | | | | (25,332,823 | ) | | | | | | | 7,886,932 | |
| | | | |
Net increase in net assets resulting from operations | | | | | | | 2,896,368 | | | | | | | | 39,154,190 | |
| | | | |
| |
Distributions to shareholders from | | | | | |
Net investment income | |
Class A | | | | | | | (11,998,114 | ) | | | | | | | (14,210,998 | ) |
Class B | | | | | | | N/A | | | | | | | | (14,959 | )1 |
Class C | | | | | | | (1,891,216 | ) | | | | | | | (2,374,586 | ) |
Administrator Class | | | | | | | (1,158,390 | ) | | | | | | | (1,969,904 | ) |
Institutional Class | | | | | | | (6,020,709 | ) | | | | | | | (5,524,870 | ) |
Tax basis return of capital | |
Class A | | | | | | | (464,808 | ) | | | | | | | (410,144 | ) |
Class B | | | | | | | N/A | | | | | | | | (432 | )1 |
Class C | | | | | | | (73,266 | ) | | | | | | | (68,533 | ) |
Administrator Class | | | | | | | (44,876 | ) | | | | | | | (56,853 | ) |
Institutional Class | | | | | | | (233,242 | ) | | | | | | | (159,453 | ) |
| | | | |
Total distributions to shareholders | | | | | | | (21,884,621 | ) | | | | | | | (24,790,732 | ) |
| | | | |
| | | | |
Capital share transactions | | | Shares | | | | | | | | Shares | | | | | |
Proceeds from shares sold | |
Class A | | | 4,507,185 | | | | 15,024,416 | | | | 8,416,164 | | | | 28,003,186 | |
Class B | | | N/A | | | | N/A | | | | 12 | 1 | | | 39 | 1 |
Class C | | | 604,048 | | | | 2,028,540 | | | | 946,458 | | | | 3,143,229 | |
Administrator Class | | | 1,169,119 | | | | 3,905,011 | | | | 6,750,591 | | | | 22,463,004 | |
Institutional Class | | | 26,302,261 | | | | 88,474,810 | | | | 26,266,703 | | | | 87,446,183 | |
| | | | |
| | | | | | | 109,432,777 | | | | | | | | 141,055,641 | |
| | | | |
Reinvestment of distributions | |
Class A | | | 3,396,062 | | | | 11,304,123 | | | | 3,942,159 | | | | 13,168,904 | |
Class B | | | N/A | | | | N/A | | | | 4,383 | 1 | | | 14,450 | 1 |
Class C | | | 579,628 | | | | 1,929,924 | | | | 693,090 | | | | 2,315,974 | |
Administrator Class | | | 345,781 | | | | 1,152,618 | | | | 589,815 | | | | 1,965,669 | |
Institutional Class | | | 1,807,352 | | | | 6,016,786 | | | | 1,653,998 | | | | 5,539,894 | |
| | | | |
| | | | | | | 20,403,451 | | | | | | | | 23,004,891 | |
| | | | |
Payment for shares redeemed | |
Class A | | | (17,281,250 | ) | | | (57,593,665 | ) | | | (32,018,320 | ) | | | (106,244,993 | ) |
Class B | | | N/A | | | | N/A | | | | (268,372 | )1 | | | (896,622 | )1 |
Class C | | | (4,753,703 | ) | | | (15,786,507 | ) | | | (5,530,431 | ) | | | (18,463,311 | ) |
Administrator Class | | | (3,502,094 | ) | | | (11,686,695 | ) | | | (21,206,310 | ) | | | (69,867,066 | ) |
Institutional Class | | | (24,076,647 | ) | | | (80,563,659 | ) | | | (21,129,365 | ) | | | (70,531,940 | ) |
| | | | |
| | | | | | | (165,630,526 | ) | | | | | | | (266,003,932 | ) |
| | | | |
Net decrease in net assets resulting from capital share transactions | | | | | | | (35,794,298 | ) | | | | | | | (101,943,400 | ) |
| | | | |
Total decrease in net assets | | | | | | | (54,782,551 | ) | | | | | | | (87,579,942 | ) |
| | | | |
| | | | |
Net assets | | | | | | | | | | | | | | | | |
Beginning of period | | | | | | | 533,473,040 | | | | | | | | 621,052,982 | |
| | | | |
End of period | | | | | | $ | 478,690,489 | | | | | | | $ | 533,473,040 | |
| | | | |
Overdistributed net investment income | | | | | | $ | (35,978 | ) | | | | | | $ | (177,156 | ) |
| | | | |
| 1 | For the period from September 1, 2016 to May 5, 2017. Effective at the close of business on May 5, 2017, Class B shares were converted to Class A shares and are no longer offered by the Fund. |
The accompanying notes are an integral part of these financial statements.
| | | | |
| 22 | | Wells Fargo High Yield Bond Fund | | Financial highlights |
(For a share outstanding throughout each period)
| | | | | | | | | | | | | | | | | | | | |
| | | Year ended August 31 | |
| CLASS A | | 2018 | | | 2017 | | | 2016 | | | 2015 | | | 2014 | |
Net asset value, beginning of period | | | $3.40 | | | | $3.31 | | | | $3.16 | | | | $3.35 | | | | $3.15 | |
Net investment income | | | 0.14 | | | | 0.14 | | | | 0.13 | | | | 0.13 | | | | 0.14 | |
Net realized and unrealized gains (losses) on investments | | | (0.12 | ) | | | 0.10 | | | | 0.15 | | | | (0.19 | ) | | | 0.20 | |
| | | | | | | | | | | | | | | | | | | | |
Total from investment operations | | | 0.02 | | | | 0.24 | | | | 0.28 | | | | (0.06 | ) | | | 0.34 | |
Distributions to shareholders from | | | | | | | | | | | | | | | | | | | | |
Net investment income | | | (0.13 | ) | | | (0.15 | ) | | | (0.13 | ) | | | (0.13 | ) | | | (0.14 | ) |
Tax basis return of capital | | | (0.01 | ) | | | (0.00 | )1 | | | 0.00 | | | | 0.00 | | | | 0.00 | |
| | | | | | | | | | | | | | | | | | | | |
Total distributions to shareholders | | | (0.14 | ) | | | (0.15 | ) | | | (0.13 | ) | | | (0.13 | ) | | | (0.14 | ) |
Net asset value, end of period | | | $3.28 | | | | $3.40 | | | | $3.31 | | | | $3.16 | | | | $3.35 | |
Total return2 | | | 0.68 | % | | | 7.28 | % | | | 9.25 | % | | | (1.79 | )% | | | 11.02 | % |
Ratios to average net assets (annualized) | | | | | | | | | | | | | | | | | | | | |
Gross expenses | | | 1.02 | % | | | 1.01 | % | | | 1.04 | % | | | 1.04 | % | | | 1.03 | % |
Net expenses | | | 0.93 | % | | | 0.93 | % | | | 1.01 | % | | | 1.03 | % | | | 1.03 | % |
Net investment income | | | 4.26 | % | | | 4.39 | % | | | 4.24 | % | | | 4.04 | % | | | 4.35 | % |
Supplemental data | | | | | | | | | | | | | | | | | | | | |
Portfolio turnover rate | | | 18 | % | | | 20 | % | | | 75 | % | | | 55 | % | | | 40 | % |
Net assets, end of period (000s omitted) | | | $272,170 | | | | $314,156 | | | | $370,560 | | | | $179,357 | | | | $210,005 | |
| 1 | Amount is less than $0.005. |
| 2 | Total return calculations do not include any sales charges. |
The accompanying notes are an integral part of these financial statements.
| | | | | | |
| Financial highlights | | Wells Fargo High Yield Bond Fund | | | 23 | |
(For a share outstanding throughout each period)
| | | | | | | | | | | | | | | | | | | | |
| | | Year ended August 31 | |
| CLASS C | | 2018 | | | 2017 | | | 2016 | | | 2015 | | | 2014 | |
Net asset value, beginning of period | | | $3.40 | | | | $3.31 | | | | $3.16 | | | | $3.35 | | | | $3.15 | |
Net investment income | | | 0.12 | | | | 0.12 | | | | 0.11 | | | | 0.11 | | | | 0.12 | |
Net realized and unrealized gains (losses) on investments | | | (0.12 | ) | | | 0.09 | | | | 0.15 | | | | (0.19 | ) | | | 0.20 | |
| | | | | | | | | | | | | | | | | | | | |
Total from investment operations | | | 0.00 | | | | 0.21 | | | | 0.26 | | | | (0.08 | ) | | | 0.32 | |
Distributions to shareholders from | | | | | | | | | | | | | | | | | | | | |
Net investment income | | | (0.11 | ) | | | (0.12 | ) | | | (0.11 | ) | | | (0.11 | ) | | | (0.12 | ) |
Tax basis return of capital | | | (0.01 | ) | | | (0.00 | )1 | | | 0.00 | | | | 0.00 | | | | 0.00 | |
| | | | | | | | | | | | | | | | | | | | |
Total distributions to shareholders | | | (0.12 | ) | | | (0.12 | ) | | | (0.11 | ) | | | (0.11 | ) | | | (0.12 | ) |
Net asset value, end of period | | | $3.28 | | | | $3.40 | | | | $3.31 | | | | $3.16 | | | | $3.35 | |
Total return2 | | | (0.07 | )% | | | 6.49 | % | | | 8.44 | % | | | (2.52 | )% | | | 10.20 | % |
Ratios to average net assets (annualized) | | | | | | | | | | | | | | | | | | | | |
Gross expenses | | | 1.77 | % | | | 1.76 | % | | | 1.80 | % | | | 1.79 | % | | | 1.78 | % |
Net expenses | | | 1.68 | % | | | 1.68 | % | | | 1.77 | % | | | 1.78 | % | | | 1.78 | % |
Net investment income | | | 3.51 | % | | | 3.65 | % | | | 3.48 | % | | | 3.29 | % | | | 3.60 | % |
Supplemental data | | | | | | | | | | | | | | | | | | | | |
Portfolio turnover rate | | | 18 | % | | | 20 | % | | | 75 | % | | | 55 | % | | | 40 | % |
Net assets, end of period (000s omitted) | | | $47,811 | | | | $61,734 | | | | $72,908 | | | | $60,753 | | | | $72,728 | |
| 1 | Amount is less than $0.005. |
| 2 | Total return calculations do not include any sales charges. |
The accompanying notes are an integral part of these financial statements.
| | | | |
| 24 | | Wells Fargo High Yield Bond Fund | | Financial highlights |
(For a share outstanding throughout each period)
| | | | | | | | | | | | | | | | | | | | |
| | | Year ended August 31 | |
| ADMINISTRATOR CLASS | | 2018 | | | 2017 | | | 2016 | | | 2015 | | | 2014 | |
Net asset value, beginning of period | | | $3.41 | | | | $3.31 | | | | $3.16 | | | | $3.36 | | | | $3.15 | |
Net investment income | | | 0.15 | | | | 0.15 | | | | 0.14 | 1 | | | 0.14 | | | | 0.15 | |
Net realized and unrealized gains (losses) on investments | | | (0.12 | ) | | | 0.10 | | | | 0.15 | | | | (0.20 | ) | | | 0.21 | |
| | | | | | | | | | | | | | | | | | | | |
Total from investment operations | | | 0.03 | | | | 0.25 | | | | 0.29 | | | | (0.06 | ) | | | 0.36 | |
Distributions to shareholders from | | | | | | | | | | | | | | | | | | | | |
Net investment income | | | (0.14 | ) | | | (0.15 | ) | | | (0.14 | ) | | | (0.14 | ) | | | (0.15 | ) |
Tax basis return of capital | | | (0.01 | ) | | | (0.00 | )2 | | | 0.00 | | | | 0.00 | | | | 0.00 | |
| | | | | | | | | | | | | | | | | | | | |
Total distributions to shareholders | | | (0.15 | ) | | | (0.15 | ) | | | (0.14 | ) | | | (0.14 | ) | | | (0.15 | ) |
Net asset value, end of period | | | $3.29 | | | | $3.41 | | | | $3.31 | | | | $3.16 | | | | $3.36 | |
Total return | | | 0.82 | % | | | 7.74 | % | | | 9.48 | % | | | (1.86 | )% | | | 11.61 | % |
Ratios to average net assets (annualized) | | | | | | | | | | | | | | | | | | | | |
Gross expenses | | | 0.96 | % | | | 0.95 | % | | | 0.98 | % | | | 0.98 | % | | | 0.96 | % |
Net expenses | | | 0.80 | % | | | 0.80 | % | | | 0.80 | % | | | 0.80 | % | | | 0.80 | % |
Net investment income | | | 4.39 | % | | | 4.55 | % | | | 4.43 | % | | | 4.27 | % | | | 4.57 | % |
Supplemental data | | | | | | | | | | | | | | | | | | | | |
Portfolio turnover rate | | | 18 | % | | | 20 | % | | | 75 | % | | | 55 | % | | | 40 | % |
Net assets, end of period (000s omitted) | | | $23,940 | | | | $31,592 | | | | $76,688 | | | | $13,129 | | | | $20,177 | |
| 1 | Calculated based upon average shares outstanding |
| 2 | Amount is less than $0.005. |
The accompanying notes are an integral part of these financial statements.
| | | | | | |
| Financial highlights | | Wells Fargo High Yield Bond Fund | | | 25 | |
(For a share outstanding throughout each period)
| | | | | | | | | | | | | | | | |
| | | Year ended August 31 | |
| INSTITUTIONAL CLASS | | 2018 | | | 2017 | | | 2016 | | | 20151 | |
Net asset value, beginning of period | | | $3.41 | | | | $3.31 | | | | $3.17 | | | | $3.33 | |
Net investment income | | | 0.16 | | | | 0.16 | | | | 0.14 | | | | 0.12 | |
Net realized and unrealized gains (losses) on investments | | | (0.13 | ) | | | 0.10 | | | | 0.14 | | | | (0.16 | ) |
| | | | | | | | | | | | | | | | |
Total from investment operations | | | 0.03 | | | | 0.26 | | | | 0.28 | | | | (0.04 | ) |
Distributions to shareholders from | | | | | | | | | | | | | | | | |
Net investment income | | | (0.15 | ) | | | (0.16 | ) | | | (0.14 | ) | | | (0.12 | ) |
Tax basis return of capital | | | (0.01 | ) | | | (0.00 | )2 | | | 0.00 | | | | 0.00 | |
| | | | | | | | | | | | | | | | |
Total distributions to shareholders | | | (0.16 | ) | | | (0.16 | ) | | | (0.14 | ) | | | (0.12 | ) |
Net asset value, end of period | | | $3.28 | | | | $3.41 | | | | $3.31 | | | | $3.17 | |
Total return3 | | | 0.79 | % | | | 8.03 | % | | | 9.27 | % | | | (1.31 | )% |
Ratios to average net assets (annualized) | | | | | | | | | | | | | | | | |
Gross expenses | | | 0.69 | % | | | 0.68 | % | | | 0.70 | % | | | 0.71 | % |
Net expenses | | | 0.53 | % | | | 0.53 | % | | | 0.61 | % | | | 0.70 | % |
Net investment income | | | 4.67 | % | | | 4.79 | % | | | 4.65 | % | | | 4.33 | % |
Supplemental data | | | | | | | | | | | | | | | | |
Portfolio turnover rate | | | 18 | % | | | 20 | % | | | 75 | % | | | 55 | % |
Net assets, end of period (000s omitted) | | | $134,770 | | | | $125,991 | | | | $100,023 | | | | $4,847 | |
| 1 | For the period from October 31, 2014 (commencement of class operations) to August 31, 2015. |
| 2 | Amount is less than $0.005. |
| 3 | Returns for periods of less than one year are not annualized. |
The accompanying notes are an integral part of these financial statements.
| | | | |
| 26 | | Wells Fargo High Yield Bond Fund | | Notes to financial statements |
1. ORGANIZATION
Wells Fargo Funds Trust (the “Trust”), a Delaware statutory trust organized on March 10, 1999, is an open-end management investment company registered under the Investment Company Act of 1940, as amended (the “1940 Act”). As an investment company, the Trust follows the accounting and reporting guidance in Financial Accounting Standards Board (“FASB”) Accounting Standards Codification Topic 946, Financial Services – Investment Companies. These financial statements report on the Wells Fargo High Yield Bond Fund (the “Fund”) which is a diversified series of the Trust.
Effective at the close of business on May 5, 2017, Class B shares were converted to Class A shares and are no longer offered by the Fund. Information for Class B shares reflected in the financial statements represents activity through May 5, 2017.
2. SIGNIFICANT ACCOUNTING POLICIES
The following significant accounting policies, which are consistently followed in the preparation of the financial statements of the Fund, are in conformity with U.S. generally accepted accounting principles which require management to make estimates and assumptions that affect the reported amounts of assets and liabilities, disclosure of contingent assets and liabilities at the date of the financial statements, and the reported amounts of revenues and expenses during the reporting period. Actual results could differ from those estimates.
Securities valuation
All investments are valued each business day as of the close of regular trading on the New York Stock Exchange (generally 4 p.m. Eastern Time), although the Fund may deviate from this calculation time under unusual or unexpected circumstances.
Debt securities are valued at the evaluated bid price provided by an independent pricing service or, if a reliable price is not available, the quoted bid price from an independent broker-dealer.
Equity securities that are listed on a foreign or domestic exchange or market are valued at the official closing price or, if none, the last sales price. If no sale occurs on the principal exchange or market that day, a fair value price will be determined in accordance with the Fund’s Valuation Procedures.
Investments in registered open-end investment companies are valued at net asset value. Interests in non-registered investment companies that are redeemable at net asset value are fair valued normally at net asset value.
Investments which are not valued using any of the methods discussed above are valued at their fair value, as determined in good faith by the Board of Trustees. The Board of Trustees has established a Valuation Committee comprised of the Trustees and has delegated to it the authority to take any actions regarding the valuation of portfolio securities that the Valuation Committee deems necessary or appropriate, including determining the fair value of portfolio securities, unless the determination has been delegated to the Wells Fargo Asset Management Pricing Committee at Wells Fargo Funds Management, LLC (“Funds Management”). The Board of Trustees retains the authority to make or ratify any valuation decisions or approve any changes to the Valuation Procedures as it deems appropriate. On a quarterly basis, the Board of Trustees receives reports on any valuation actions taken by the Valuation Committee or the Wells Fargo Asset Management Pricing Committee which may include items for ratification.
Valuations of fair valued securities are compared to the next actual sales price when available, or other appropriate market values, to assess the continued appropriateness of the fair valuation methodologies used. These securities are fair valued on a day-to-day basis, taking into consideration changes to appropriate market information and any significant changes to the inputs considered in the valuation process until there is a readily available price provided on an exchange or by an independent pricing service. Valuations received from an independent pricing service or independent broker-dealer quotes are periodically validated by comparisons to most recent trades and valuations provided by other independent pricing services in addition to the review of prices by the manager and/or subadviser. Unobservable inputs used in determining fair valuations are identified based on the type of security, taking into consideration factors utilized by market participants in valuing the investment, knowledge about the issuer and the current market environment.
Securities lending
The Fund may lend its securities from time to time in order to earn additional income in the form of fees or interest on securities received as collateral or the investment of any cash received as collateral. The Fund continues to receive interest or dividends on the securities loaned. The Fund receives collateral in the form of cash or securities with a value at least equal to the value of the securities on loan. The value of the loaned securities is determined at the close of each business day and any additional required collateral is delivered to the Fund on the next business day. In a securities lending
| | | | | | |
| Notes to financial statements | | Wells Fargo High Yield Bond Fund | | | 27 | |
transaction, the net asset value of the Fund will be affected by an increase or decrease in the value of the securities loaned and by an increase or decrease in the value of the instrument in which collateral is invested. The amount of securities lending activity undertaken by the Fund fluctuates from time to time. In the event of default or bankruptcy by the borrower, the Fund may be prevented from recovering the loaned securities or gaining access to the collateral or may experience delays or costs in doing so. In addition, the investment of any cash collateral received may lose all or part of its value. The Fund has the right under the lending agreement to recover the securities from the borrower on demand.
The Fund lends its securities through an unaffiliated securities lending agent. Cash collateral received in connection with its securities lending transactions is invested in Securities Lending Cash Investments, LLC (the “Securities Lending Fund”). The Securities Lending Fund is exempt from registration under Section 3(c)(7) of the 1940 Act and is managed by Funds Management and is subadvised by Wells Capital Management Incorporated (“WellsCap”), an affiliate of Funds Management and an indirect wholly owned subsidiary of Wells Fargo & Company (“Wells Fargo”). Funds Management receives an advisory fee starting at 0.05% and declining to 0.01% as the average daily net assets of the Securities Lending Fund increase. All of the fees received by Funds Management are paid to WellsCap for its services as subadviser. The Securities Lending Fund seeks to provide a positive return compared to the daily Fed Funds Open Rate by investing in high-quality, U.S. dollar-denominated short-term money market instruments. Securities Lending Fund investments are valued at the evaluated bid price provided by an independent pricing service. Income earned from investment in the Securities Lending Fund, if any, is included in income from affiliated securities on the Statement of Operations.
Security transactions and income recognition
Securities transactions are recorded on a trade date basis. Realized gains or losses are recorded on the basis of identified cost.
Interest income is accrued daily and bond discounts are accreted and premiums are amortized daily. To the extent debt obligations are placed on non-accrual status, any related interest income may be reduced by writing off interest receivables when the collection of all or a portion of interest has been determined to be doubtful based on consistently applied procedures and the fair value has decreased. If the issuer subsequently resumes interest payments or when the collectability of interest is reasonably assured, the debt obligation is removed from non-accrual status.
Dividend income is recognized on the ex-dividend date. Dividend income is recorded net of foreign taxes withheld where recovery of such taxes is not assured.
Distributions to shareholders
Distributions to shareholders from net investment income are declared daily and paid monthly. Distributions from net realized gains, if any, are recorded on the ex-dividend date and paid at least annually. Such distributions are determined in accordance with income tax regulations and may differ from U.S. generally accepted accounting principles. Dividend sources are estimated at the time of declaration. The tax character of distributions is determined as of the Fund’s fiscal year end. Therefore, a portion of the Fund’s distributions made prior to the Fund’s fiscal year end may be categorized as a tax return of capital at year end.
Federal and other taxes
The Fund intends to continue to qualify as a regulated investment company by distributing substantially all of its investment company taxable income and any net realized capital gains (after reduction for capital loss carryforwards) sufficient to relieve it from all, or substantially all, federal income taxes. Accordingly, no provision for federal income taxes was required.
The Fund’s income and federal excise tax returns and all financial records supporting those returns for the prior three fiscal years are subject to examination by the federal and Delaware revenue authorities. Management has analyzed the Fund’s tax positions taken on federal, state, and foreign tax returns for all open tax years and does not believe that there are any uncertain tax positions that require recognition of a tax liability.
As of August 31, 2018, the aggregate cost of all investments for federal income tax purposes was $512,966,942 and the unrealized gains (losses) consisted of:
| | | | |
Gross unrealized gains | | $ | 9,802,483 | |
Gross unrealized losses | | | (14,553,380 | ) |
Net unrealized losses | | $ | (4,750,897 | ) |
| | | | |
| 28 | | Wells Fargo High Yield Bond Fund | | Notes to financial statements |
Reclassifications are made to the Fund’s capital accounts for permanent tax differences to reflect income and gains available for distribution (or available capital loss carryforwards) under federal income tax regulations. U.S. generally accepted accounting principles require that certain components of net assets be adjusted to reflect permanent differences between financial and tax reporting. These reclassifications have no effect on net assets or net asset values per share. The primary permanent difference causing such reclassifications is due to recognition of partnership income. At August 31, 2018, as a result of permanent book-to-tax differences, the following reclassification adjustments were made on the Statement of Assets and Liabilities:
| | | | |
| Paid-in capital | | Overdistributed net
investment income | | Accumulated net
realized losses
on investments |
| $(2,452) | | $(646,194) | | $648,646 |
As of August 31, 2018, the Fund had capital loss carryforwards which consist of $17,191,434 in short-term capital losses and $24,466,317 in long-term capital losses.
Class allocations
The separate classes of shares offered by the Fund differ principally in applicable sales charges, distribution, shareholder servicing, and administration fees. Class specific expenses are charged directly to that share class. Investment income, common expenses, and realized and unrealized gains (losses) on investments are allocated daily to each class of shares based on the relative proportion of net assets of each class.
3. FAIR VALUATION MEASUREMENTS
Fair value measurements of investments are determined within a framework that has established a fair value hierarchy based upon the various data inputs utilized in determining the value of the Fund’s investments. The three-level hierarchy gives the highest priority to unadjusted quoted prices in active markets for identical assets or liabilities (Level 1) and the lowest priority to unobservable inputs (Level 3). The Fund’s investments are classified within the fair value hierarchy based on the lowest level of input that is significant to the fair value measurement. The inputs are summarized into three broad levels as follows:
| ∎ | | Level 1 – quoted prices in active markets for identical securities |
| ∎ | | Level 2 – other significant observable inputs (including quoted prices for similar securities, interest rates, prepayment speeds, credit risk, etc.) |
| ∎ | | Level 3 – significant unobservable inputs (including the Fund’s own assumptions in determining the fair value of investments) |
The inputs or methodologies used for valuing investments in securities are not necessarily an indication of the risk associated with investing in those securities.
| | | | | | |
| Notes to financial statements | | Wells Fargo High Yield Bond Fund | | | 29 | |
The following is a summary of the inputs used in valuing the Fund’s assets and liabilities as of August 31, 2018:
| | | | | | | | | | | | | | | | |
| | | Quoted prices
(Level 1) | | | Other significant
observable inputs
(Level 2) | | | Significant
unobservable inputs (Level 3) | | | Total | |
Assets | | | | | | | | | | | | | | | | |
Investments in: | | | | | | | | | | | | | | | | |
| | | | |
Common stocks | | | | | | | | | | | | | | | | |
Consumer staples | | $ | 1,014,000 | | | $ | 0 | | | $ | 0 | | | $ | 1,014,000 | |
Energy | | | 14,243,400 | | | | 0 | | | | 0 | | | | 14,243,400 | |
Financials | | | 717,700 | | | | 0 | | | | 0 | | | | 717,700 | |
Health care | | | 4,310,490 | | | | 0 | | | | 0 | | | | 4,310,490 | |
Industrials | | | 6,189,970 | | | | 0 | | | | 0 | | | | 6,189,970 | |
Information technology | | | 10,819,700 | | | | 0 | | | | 0 | | | | 10,819,700 | |
Materials | | | 5,649,130 | | | | 0 | | | | 0 | | | | 5,649,130 | |
Real estate | | | 900,000 | | | | 0 | | | | 0 | | | | 900,000 | |
Utilities | | | 2,100,750 | | | | 0 | | | | 0 | | | | 2,100,750 | |
| | | | |
Corporate bonds and notes | | | 0 | | | | 359,616,599 | | | | 0 | | | | 359,616,599 | |
| | | | |
Yankee corporate bonds and notes | | | 0 | | | | 65,369,470 | | | | 0 | | | | 65,369,470 | |
| | | | |
Short-term investments | | | | | | | | | | | | | | | | |
Investment companies | | | 3,114,436 | | | | 0 | | | | 0 | | | | 3,114,436 | |
Investments measured at net asset value* | | | | | | | | | | | | | | | 34,170,400 | |
Total assets | | $ | 49,059,576 | | | $ | 424,986,069 | | | $ | 0 | | | $ | 508,216,045 | |
| * | Investments that are measured at fair value using the net asset value per share (or its equivalent) as a practical expedient have not been categorized in the fair value hierarchy. The fair value amount presented in the table is intended to permit reconciliation of the fair value hierarchy to the amounts presented in the Statement of Assets and Liabilities. The Fund’s investment in Securities Lending Cash Investments, LLC valued at $34,170,400 does not have a redemption period notice, can be redeemed daily and does not have any unfunded commitments. |
Additional sector, industry or geographic detail is included in the Portfolio of Investments.
The Fund recognizes transfers between levels within the fair value hierarchy at the end of the reporting period. At August 31, 2018, the Fund did not have any transfers into/out of Level 1, Level 2, or Level 3.
4. TRANSACTIONS WITH AFFILIATES
Management fee
Funds Management, an indirect wholly owned subsidiary of Wells Fargo, is the manager of the Fund and provides advisory and fund-level administrative services under an investment management agreement. Under the investment management agreement, Funds Management is responsible for, among other services, implementing the investment objectives and strategies of the Fund, supervising the subadviser and providing fund-level administrative services in connection with the Fund’s operations. As compensation for its services under the investment management agreement, Funds Management is entitled to receive an annual management fee starting at 0.55% and declining to 0.43% as the average daily net assets of the Fund increase. For the year ended August 31, 2018, the management fee was equivalent to an annual rate of 0.55% of the Fund’s average daily net assets.
Funds Management has retained the services of a subadviser to provide daily portfolio management to the Fund. The fee for subadvisory services is borne by Funds Management. WellsCap is the subadviser to the Fund and is entitled to receive a fee from Funds Management at an annual rate starting at 0.35% and declining to 0.20% as the average daily net assets of the Fund increase.
Administration fees
Under a class-level administration agreement, Funds Management provides class-level administrative services to the Fund, which includes paying fees and expenses for services provided by the transfer agent, sub-transfer agents, omnibus
| | | | |
| 30 | | Wells Fargo High Yield Bond Fund | | Notes to financial statements |
account servicers and record-keepers. As compensation for its services under the class-level administration agreement, Funds Management receives an annual fee which is calculated based on the average daily net assets of each class as follows:
| | | | |
| | | Class-level
administration fee | |
Class A, Class C | | | 0.16 | % |
Administrator Class | | | 0.10 | |
Institutional Class | | | 0.08 | |
Funds Management has contractually waived and/or reimbursed management and administration fees to the extent necessary to maintain certain net operating expense ratios for the Fund. When each class of the Fund has exceeded its expense cap, Funds Management has waived fees and/or reimbursed expenses from fund level expenses on a proportionate basis and then from class specific expenses; otherwise, waivers and/or reimbursements are applied against class specific expenses before fund level expenses. Funds Management has committed through December 31, 2018 to waive fees and/or reimburse expenses to the extent necessary to cap the Fund’s expenses at 0.93% for Class A shares, 1.68% for Class C shares, 0.80% for Administrator Class shares, and 0.53% for Institutional Class shares. After this time, the cap may be increased or the commitment to maintain the cap may be terminated only with the approval of the Board of Trustees.
Distribution fee
The Trust has adopted a distribution plan for Class C shares of the Fund pursuant to Rule 12b-1 under the 1940 Act. A distribution fee is charged to Class C shares and paid to Wells Fargo Funds Distributor, LLC (“Funds Distributor”), the principal underwriter, at an annual rate of 0.75% of the average daily net assets of Class C shares.
In addition, Funds Distributor is entitled to receive the front-end sales charge from the purchase of Class A shares and a contingent deferred sales charge on the redemption of certain Class A shares. Funds Distributor is also entitled to receive the contingent deferred sales charges from redemptions of Class C shares. For the year ended August 31, 2018, Funds Distributor received $4,016 from the sale of Class A shares and $14 in contingent deferred sales charges from redemptions of Class C shares. No contingent deferred sales charges were incurred by Class A shares for the year ended August 31, 2018.
Shareholder servicing fees
The Trust has entered into contracts with one or more shareholder servicing agents, whereby Class A, Class C, and Administrator Class of the Fund are charged a fee at an annual rate of 0.25% of the average daily net assets of each respective class.
A portion of these total shareholder servicing fees were paid to affiliates of Wells Fargo.
Interfund transactions
The Fund may purchase or sell investment securities to other Wells Fargo affiliates pursuant to Rule 17a-7 under the 1940 Act and under procedures adopted by the Board of Trustees. The procedures have been designed to ensure that these interfund transactions, which do not incur broker commissions, are effected at current market prices.
5. INVESTMENT PORTFOLIO TRANSACTIONS
Purchases and sales of investments, excluding U.S. government obligations (if any) and short-term securities, for the year ended August 31, 2018 were $91,837,383 and $117,817,886, respectively.
6. BANK BORROWINGS
The Trust (excluding the money market funds), Wells Fargo Master Trust and Wells Fargo Variable Trust are parties to a $280,000,000 revolving credit agreement whereby the Fund is permitted to use bank borrowings for temporary or emergency purposes, such as to fund shareholder redemption requests. Interest under the credit agreement is charged to the Fund based on a borrowing rate equal to the higher of the Federal Funds rate in effect on that day plus 1.25% or the overnight LIBOR rate in effect on that day plus 1.25%. In addition, an annual commitment fee equal to 0.25% of the unused balance is allocated to each participating fund.
For the year ended August 31, 2018, there were no borrowings by the Fund under the agreement.
| | | | | | |
| Notes to financial statements | | Wells Fargo High Yield Bond Fund | | | 31 | |
7. DISTRIBUTIONS TO SHAREHOLDERS
The tax character of distributions paid during the years ended August 31, 2018 and August 31, 2017 were as follows:
| | | | | | | | |
| | | Year ended August 31 | |
| | | 2018 | | | 2017 | |
Ordinary income | | $ | 21,068,429 | | | $ | 24,095,317 | |
Tax basis return of capital | | | 816,192 | | | | 695,415 | |
As of August 31, 2018, the components of distributable earnings on a tax basis were as follows:
| | |
Unrealized
losses | | Capital loss carryforward |
| $(4,750,897) | | $(41,657,751) |
8. INDEMNIFICATION
Under the Trust’s organizational documents, the officers and Trustees have been granted certain indemnification rights against certain liabilities that may arise out of performance of their duties to the Trust. Additionally, in the normal course of business, the Trust may enter into contracts with service providers that contain a variety of indemnification clauses. The Trust’s maximum exposure under these arrangements is dependent on future claims that may be made against the Fund and, therefore, cannot be estimated.
9. NEW ACCOUNTING PRONOUNCEMENTS AND REGULATORY CHANGES
On August 17, 2018, the Securities and Exchange Commission (“SEC”) adopted Disclosure Update and Simplification, which amends certain disclosure requirements. The amendments are effective for filings subsequent to November 5, 2018. Management expects these amendments will impact the classification of disclosures in the financial statements.
In August 2018, FASB issued Accounting Standards Update (“ASU”) No. 2018-13, Fair Value Measurement (Topic 820) Disclosure Framework—Changes to the Disclosure Requirements for Fair Value Measurement. ASU 2018-13 updates the disclosure requirements for fair value measurements by modifying or removing certain disclosures and adding certain new disclosures. The amendments are effective for fiscal years, and interim periods within those fiscal years, beginning after December 15, 2019. Early adoption is permitted. Management is currently evaluating the potential impact of this new guidance to the financial statements.
In March 2017, FASB issued ASU No. 2017-08, Premium Amortization on Purchased Callable Debt Securities. ASU 2017-08 shortens the amortization period for certain callable debt securities held at a premium. The amendments require the premium to be amortized to the earliest call date. The amendments do not require an accounting change for securities held at a discount; the discount continues to be amortized to maturity. ASU 2017-08 is effective for fiscal years beginning after December 15, 2018 and for interim periods within those fiscal years. Management is currently evaluating the potential impact of this new guidance to the financial statements.
| | | | |
| 32 | | Wells Fargo High Yield Bond Fund | | Report of independent registered public accounting firm |
BOARD OF TRUSTEES AND SHAREHOLDERS OF WELLS FARGO FUNDS TRUST:
Opinion on the Financial Statements
We have audited the accompanying statement of assets and liabilities of Wells Fargo High Yield Bond Fund (the “Fund”), including the portfolio of investments, as of August 31, 2018, the related statement of operations for the year then ended, the statements of changes in net assets for each of the years in the two-year period then ended, and the related notes (collectively, the “financial statements”) and the financial highlights for each of the years or periods in the five-year period then ended. In our opinion, the financial statements and financial highlights present fairly, in all material respects, the financial position of the Fund as of August 31, 2018, the results of its operations for the year then ended, the changes in its net assets for each of the years in the two-year period then ended, and the financial highlights for each of the years or periods in the five-year period then ended, in conformity with U.S. generally accepted accounting principles.
Basis for Opinion
These financial statements and financial highlights are the responsibility of the Fund’s management. Our responsibility is to express an opinion on these financial statements and financial highlights based on our audits. We are a public accounting firm registered with the Public Company Accounting Oversight Board (United States) (“PCAOB”) and are required to be independent with respect to the Fund in accordance with the U.S. federal securities laws and the applicable rules and regulations of the Securities and Exchange Commission and the PCAOB.
We conducted our audits in accordance with the standards of the PCAOB. Those standards require that we plan and perform the audit to obtain reasonable assurance about whether the financial statements and financial highlights are free of material misstatement, whether due to error or fraud. Our audits included performing procedures to assess the risks of material misstatement of the financial statements and financial highlights, whether due to error or fraud, and performing procedures that respond to those risks. Such procedures included examining, on a test basis, evidence regarding the amounts and disclosures in the financial statements and financial highlights. Such procedures also included confirmation of securities owned as of August 31, 2018, by correspondence with the custodian and brokers, or by other appropriate auditing procedures. Our audits also included evaluating the accounting principles used and significant estimates made by management, as well as evaluating the overall presentation of the financial statements and financial highlights. We believe that our audits provide a reasonable basis for our opinion.

We have not been able to determine the specific year that we began serving as the auditor of one or more Wells Fargo Funds investment companies, however we are aware that we have served as the auditor of one or more Wells Fargo Funds investment companies since at least 1955.
Boston, Massachusetts
October 26, 2018
| | | | | | |
| Other information (unaudited) | | Wells Fargo High Yield Bond Fund | | | 33 | |
TAX INFORMATION
For corporate shareholders, pursuant to Section 854 of the Internal Revenue Code, 2.53% of ordinary income dividends qualify for the corporate dividends-received deduction for the fiscal year ended August 31, 2018
For the fiscal year ended August 31, 2018, $17,566,720 has been designated as interest-related dividends for nonresident alien shareholders pursuant to Section 871 of the Internal Revenue Code.
Pursuant to Section 854 of the Internal Revenue Code, $754,253 of income dividends paid during the fiscal year ended August 31, 2018 has been designated as qualified dividend income (QDI).
PROXY VOTING INFORMATION
A description of the policies and procedures that the Fund uses to determine how to vote proxies relating to portfolio securities is available, upon request, by calling 1-800-222-8222, visiting our website at wellsfargofunds.com, or visiting the SEC website at sec.gov. Information regarding how the Fund voted proxies relating to portfolio securities during the most recent 12-month period ended June 30 is available on the Fund’s website at wellsfargofunds.com or by visiting the SEC website at sec.gov.
PORTFOLIO HOLDINGS INFORMATION
The complete portfolio holdings for the Fund are publicly available monthly on the Fund’s website (wellsfargofunds.com), on a one-month delayed basis. In addition, top ten holdings information (excluding derivative positions) for the Fund is publicly available on the Fund’s website on a monthly, seven-day or more delayed basis. The Fund files its complete schedule of portfolio holdings with the SEC for the first and third quarters of each fiscal year on Form N-Q, which is available by visiting the SEC website at sec.gov. In addition, the Fund’s Form N-Q may be reviewed and copied at the SEC’s Public Reference Room in Washington, DC, and at regional offices in New York City, at 233 Broadway, and in Chicago, at 175 West Jackson Boulevard, Suite 900. Information about the Public Reference Room may be obtained by calling 1-800-SEC-0330.
| | | | |
| 34 | | Wells Fargo High Yield Bond Fund | | Other information (unaudited) |
BOARD OF TRUSTEES AND OFFICERS
Each of the Trustees and Officers1 listed in the table below acts in identical capacities for each fund in the Wells Fargo family of funds, which consists of 154 mutual funds comprising the Wells Fargo Funds Trust, Wells Fargo Variable Trust, Wells Fargo Master Trust and four closed-end funds (collectively the “Fund Complex”). This table should be read in conjunction with the Prospectus and the Statement of Additional Information2. The mailing address of each Trustee and Officer is 525 Market Street, 12th Floor, San Francisco, CA 94105. Each Trustee and Officer serves an indefinite term, however, each Trustee serves such term until reaching the mandatory retirement age established by the Trustees.
Independent Trustees
| | | | | | |
Name and year of birth | | Position held and length of service* | | Principal occupations during past five years or longer | | Current other public company or
investment company
directorships |
William R. Ebsworth (Born 1957) | | Trustee, since 2015 | | Retired. From 1984 to 2013, equities analyst, portfolio manager, research director and chief investment officer at Fidelity Management and Research Company in Boston, Tokyo, and Hong Kong, and retired in 2013 as Chief Investment Officer of Fidelity Strategic Advisers, Inc. where he led a team of investment professionals managing client assets. Prior thereto, Board member of Hong Kong Securities Clearing Co., Hong Kong Options Clearing Corp., the Thailand International Fund, Ltd., Fidelity Investments Life Insurance Company, and Empire Fidelity Investments Life Insurance Company. Board member of the Vincent Memorial Hospital Endowment (non-profit organization), where he serves on the Investment Committee and as a Chair of the Audit Committee. Mr. Ebsworth is a CFA® charterholder. | | N/A |
Jane A. Freeman (Born 1953) | | Trustee, since 2015; Chair Liaison, since 2018 | | Retired. From 2012 to 2014 and 1999 to 2008, Chief Financial Officer of Scientific Learning Corporation. From 2008 to 2012, Ms. Freeman provided consulting services related to strategic business projects. Prior to 1999, Portfolio Manager at Rockefeller & Co. and Scudder, Stevens & Clark. Board member of the Harding Loevner Funds from 1996 to 2014, serving as both Lead Independent Director and chair of the Audit Committee. Board member of the Russell Exchange Traded Funds Trust from 2011 to 2012 and the chair of the Audit Committee. Ms. Freeman is a Board Member of The Ruth Bancroft Garden (non-profit organization). She is also an inactive Chartered Financial Analyst. | | N/A |
Isaiah Harris, Jr. (Born 1952) | | Trustee, since 2009 | | Retired. Chairman of the Board of CIGNA Corporation since 2009, and Director since 2005. From 2003 to 2011, Director of Deluxe Corporation. Prior thereto, President and CEO of BellSouth Advertising and Publishing Corp. from 2005 to 2007, President and CEO of BellSouth Enterprises from 2004 to 2005 and President of BellSouth Consumer Services from 2000 to 2003. Emeritus member of the Iowa State University Foundation Board of Governors. Emeritus Member of the Advisory Board of Iowa State University School of Business. Advisory Board Member, Palm Harbor Academy (private school). Advisory Board Member, Child Evangelism Fellowship (non-profit). Mr. Harris is a certified public accountant (inactive status). | | CIGNA Corporation |
Judith M. Johnson (Born 1949) | | Trustee, since 2008; Audit Committee Chairman, since 2009 | | Retired. Prior thereto, Chief Executive Officer and Chief Investment Officer of Minneapolis Employees Retirement Fund from 1996 to 2008. Ms. Johnson is an attorney, certified public accountant and a certified managerial accountant. | | N/A |
David F. Larcker (Born 1950) | | Trustee, since 2009 | | James Irvin Miller Professor of Accounting at the Graduate School of Business, Stanford University, Director of the Corporate Governance Research Initiative and Senior Faculty of The Rock Center for Corporate Governance since 2006. From 2005 to 2008, Professor of Accounting at the Graduate School of Business, Stanford University. Prior thereto, Ernst & Young Professor of Accounting at The Wharton School, University of Pennsylvania from 1985 to 2005. | | N/A |
| | | | | | |
| Other information (unaudited) | | Wells Fargo High Yield Bond Fund | | | 35 | |
| | | | | | |
Name and year of birth | | Position held and length of service* | | Principal occupations during past five years or longer | | Current other public company or
investment company
directorships |
Olivia S. Mitchell (Born 1953) | | Trustee, since 2006; Governance Committee Chairman, since 2018 | | International Foundation of Employee Benefit Plans Professor, Wharton School of the University of Pennsylvania since 1993. Director of Wharton’s Pension Research Council and Boettner Center on Pensions & Retirement Research, and Research Associate at the National Bureau of Economic Research. Previously, Cornell University Professor from 1978 to 1993. | | N/A |
Timothy J. Penny (Born 1951) | | Trustee, since 1996; Chairman, since 2018; Vice Chairman, from 2017 to 2018 | | President and Chief Executive Officer of Southern Minnesota Initiative Foundation, a non-profit organization, since 2007. Member of the Board of Trustees of NorthStar Education Finance, Inc., a non-profit organization, since 2007. | | N/A |
James G. Polisson (Born 1959) | | Trustee, since 2018; Advisory Board Member, from 2017 to 2018 | | Retired. Chief Marketing Officer, Source (ETF) UK Services, Ltd, from 2015 to 2017. From 2012 to 2015, Principal of The Polisson Group, LLC, a management consulting, corporate advisory and principal investing company. Chief Executive Officer and Managing Director at Russell Investments, Global Exchange Traded Funds from 2010 to 2012. Managing Director of Barclays Global Investors from 1998 to 2010 and Global Chief Marketing Officer for iShares and Barclays Global Investors from 2000 to 2010. Trustee of the San Francisco Mechanics’ Institute, a non-profit organization, from 2013 to 2015. Board member of the Russell Exchange Traded Fund Trust from 2011 to 2012. Director of Barclays Global Investors Holdings Deutschland GmbH from 2006 to 2009. Mr. Polisson is an attorney and has a retired status with the Massachusetts and District of Columbia Bar Associations. | | N/A |
Michael S. Scofield (Born 1943) | | Trustee, since 2010 | | Served on the Investment Company Institute’s Board of Governors and Executive Committee from 2008-2011 as well the Governing Council of the Independent Directors Council from 2006-2011 and the Independent Directors Council Executive Committee from 2008-2011. Trustee of the Evergreen Fund complex (and its predecessors) from 1984 to 2010. Chairman of the Evergreen Funds from 2000-2010. Former Trustee of the Mentor Funds. Retired Attorney, Law Offices of Michael S. Scofield. | | N/A |
Pamela Wheelock (Born 1959) | | Trustee, since 2018; Advisory Board Member, from 2017 to 2018 | | Chief Operating Officer, Twin Cities Habitat for Humanity, since January, 2017. Vice President of University Services, University of Minnesota from 2012 to 2017. Prior thereto, on the Board of Directors, Governance Committee and Finance Committee for the Minnesota Philanthropy Partners (Saint Paul Foundation) from 2012 to 2018, Interim President and Chief Executive Officer of Blue Cross Blue Shield of Minnesota from 2010 to 2011, Chairman of the Board from 2009 to 2011 and Board Director from 2003 to 2015. Vice President, Leadership and Community Engagement, Bush Foundation, Saint Paul, Minnesota (a private foundation) from 2009 to 2011. Executive Vice President and Chief Financial Officer, Minnesota Sports and Entertainment from 2004 to 2009 and Senior Vice President from 2002 to 2004. Commissioner of Finance, State of Minnesota, from 1999 to 2002. Currently the Board Chair of the Minnesota Wild Foundation since 2010. | | N/A |
| * | Length of service dates reflect the Trustee’s commencement of service with the Trust’s predecessor entities, where applicable. |
| | | | |
| 36 | | Wells Fargo High Yield Bond Fund | | Other information (unaudited) |
Officers
| | | | | | |
Name and year of birth | | Position held and length of service | | Principal occupations during past five years or longer | | |
Andrew Owen (Born 1960) | | President, since 2017 | | Executive Vice President of Wells Fargo & Company and Head of Affiliated Managers, Wells Fargo Asset Management, since 2014. In addition, Mr. Owen is currently President, Chief Executive Officer and Director of Wells Fargo Funds Management, LLC since 2017. Prior thereto, Executive Vice President responsible for marketing, investments and product development for Wells Fargo Funds Management, LLC, from 2009 to 2014. | | |
Nancy Wiser1 (Born 1967) | | Treasurer, since 2012 | | Executive Vice President of Wells Fargo Funds Management, LLC since 2011. Chief Operating Officer and Chief Compliance Officer at LightBox Capital Management LLC, from 2008 to 2011. | | |
Alexander Kymn3 (Born 1973) | | Secretary, since 2018; Chief Legal Officer, since 2018 | | Senior Company Counsel of Wells Fargo Bank, N.A. since 2018 (previously Senior Counsel from 2007 to 2018). Vice President of Wells Fargo Funds Management, LLC from 2008 to 2014. | | |
Michael H. Whitaker (Born 1967) | | Chief Compliance Officer, since 2016 | | Senior Vice President and Chief Compliance Officer since 2016. Senior Vice President and Chief Compliance Officer for Fidelity Investments from 2007 to 2016. | | |
David Berardi (Born 1975) | | Assistant Treasurer, since 2009 | | Vice President of Wells Fargo Funds Management, LLC since 2009. Vice President of Evergreen Investment Management Company, LLC from 2008 to 2010. Manager of Fund Reporting and Control for Evergreen Investment Management Company, LLC from 2004 to 2010. | | |
Jeremy DePalma1 (Born 1974) | | Assistant Treasurer, since 2009 | | Senior Vice President of Wells Fargo Funds Management, LLC since 2009. Senior Vice President of Evergreen Investment Management Company, LLC from 2008 to 2010 and head of the Fund Reporting and Control Team within Fund Administration from 2005 to 2010. | | |
| 1 | Nancy Wiser acts as Treasurer of 77 funds in the Fund Complex. Jeremy DePalma acts as Treasurer of 77 funds and Assistant Treasurer of 77 funds in the Fund Complex. |
| 2 | The Statement of Additional Information includes additional information about the Trustees and is available, without charge, upon request, by calling 1-800-222-8222 or by visiting the website at wellsfargofunds.com. |
| 3 | Alexander Kymn became the Secretary and Chief Legal Officer effective April 17, 2018. |
| | | | | | |
| Other information (unaudited) | | Wells Fargo High Yield Bond Fund | | | 37 | |
BOARD CONSIDERATION OF INVESTMENT MANAGEMENT AND SUB-ADVISORY AGREEMENTS:
Wells Fargo High Yield Bond Fund
Under the Investment Company Act of 1940 (the “1940 Act”), the Board of Trustees (the “Board”) of Wells Fargo Funds Trust (the “Trust”) must determine annually whether to approve the continuation of the Trust’s investment management and sub-advisory agreements. In this regard, at an in-person meeting held on May 22-23, 2018 (the “Meeting”), the Board, all the members of which have no direct or indirect interest in the investment management and sub-advisory agreements and are not “interested persons” of the Trust, as defined in the 1940 Act (the “Independent Trustees”), reviewed and approved for Wells Fargo High Yield Bond Fund (the “Fund”): (i) an investment management agreement (the “Management Agreement”) with Wells Fargo Funds Management, LLC (“Funds Management”); and (ii) an investment sub-advisory agreement (the “Sub-Advisory Agreement”) with Wells Capital Management Incorporated (the “Sub-Adviser”), an affiliate of Funds Management. The Management Agreement and the Sub-Advisory Agreement are collectively referred to as the “Advisory Agreements.”
At the Meeting, the Board considered the factors and reached the conclusions described below relating to the selection of Funds Management and the Sub-Adviser and the approval of the Advisory Agreements. Prior to the Meeting, including at an in-person meeting in April 2018, the Trustees conferred extensively among themselves and with representatives of Funds Management about these matters. Also, the Board has adopted a team-based approach, with each team consisting of a sub-set of Trustees, to assist the full Board in the discharge of its duties in reviewing investment performance and other matters throughout the year. The Independent Trustees were assisted in their evaluation of the Advisory Agreements by independent legal counsel, from whom they received separate legal advice and with whom they met separately.
In providing information to the Board, Funds Management and the Sub-Adviser were guided by a detailed set of requests for information submitted to them by independent legal counsel on behalf of the Independent Trustees at the start of the Board’s annual contract renewal process earlier in 2018. In considering and approving the Advisory Agreements, the Trustees considered the information they believed relevant, including but not limited to the information discussed below. The Board considered not only the specific information presented in connection with the Meeting, but also the knowledge gained over time through interaction with Funds Management and the Sub-Adviser about various topics. In this regard, the Board reviewed reports of Funds Management at each of its quarterly meetings, which included, among other things, portfolio reviews and investment performance reports. In addition, the Board and the teams mentioned above confer with portfolio managers at various times throughout the year. The Board did not identify any particular information or consideration that was all-important or controlling, and each individual Trustee may have attributed different weights to various factors.
After its deliberations, the Board unanimously approved the continuation of the Advisory Agreements for a one-year term and determined that the compensation payable to Funds Management and the Sub-Adviser under each of the Advisory Agreements was reasonable. The Board considered the approval of the Advisory Agreements for the Fund as part of its consideration of agreements for funds across the complex, but its approvals were made on a fund-by-fund basis. The following summarizes a number of important, but not necessarily all, factors considered by the Board in support of its approvals.
Nature, extent and quality of services
The Board received and considered various information regarding the nature, extent and quality of services provided to the Fund by Funds Management and the Sub-Adviser under the Advisory Agreements. This information included a description of the investment advisory services and Fund-level administrative services covered by the Management Agreement, as well as, among other things, a summary of the background and experience of senior management of Wells Fargo Asset Management (“WFAM”), of which Funds Management and the Sub-Adviser are a part, a summary of investments made in the business of WFAM, a summary of certain organizational and personnel changes involving Funds Management and the Sub-Adviser, and a description of Funds Management’s and the Sub-Adviser’s business continuity planning programs and of their approaches to data privacy and cybersecurity. The Board also considered the qualifications, background, tenure and responsibilities of each of the portfolio managers primarily responsible for the day-to-day portfolio management of the Fund.
The Board evaluated the ability of Funds Management and the Sub-Adviser to attract and retain qualified investment professionals, including research, advisory and supervisory personnel. The Board further considered the compliance programs and compliance records of Funds Management and the Sub-Adviser. In addition, the Board took into account the full range of services provided to the Fund by Funds Management and its affiliates.
| | | | |
| 38 | | Wells Fargo High Yield Bond Fund | | Other information (unaudited) |
Fund investment performance and expenses
The Board considered the investment performance results for the Fund over various time periods ended December 31, 2017. The Board considered these results in comparison to the investment performance of funds in a universe that was determined by Broadridge Inc. (“Broadridge”) to be similar to the Fund (the “Universe”), and in comparison to the Fund’s benchmark index and to other comparative data. Broadridge is an independent provider of investment company data. The Board received a description of the methodology used by Broadridge to select the mutual funds in the performance Universe. The Board noted that the investment performance of the Fund (Administrator Class) was higher than the average investment performance of the Universe for all periods under review. The Board also noted that the investment performance of the Fund was in range of its benchmark index, the ICE BofAML U.S. High Yield Constrained Index, for the one-year period under review, but lower than its benchmark index for the three-, five-, and ten-year periods under review.
The Board also received and considered information regarding the Fund’s net operating expense ratios and their various components, including actual management fees, custodian and other non-management fees, and Rule 12b-1 and non-Rule 12b-1 shareholder service fees. The Board considered these ratios in comparison to the median ratios of funds in class-specific expense groups that were determined by Broadridge to be similar to the Fund (the “Groups”). The Board received a description of the methodology used by Broadridge to select the mutual funds in the expense Groups and an explanation of how funds comprising expense groups and their expense ratios may vary from year-to-year. Based on the Broadridge reports, the Board noted that the net operating expense ratios of the Fund were lower than the median net operating expense ratios of the expense Groups for each share class.
The Board took into account the Fund’s investment performance and expense information provided to it among the factors considered in deciding to re-approve the Advisory Agreements.
Investment management and sub-advisory fee rates
The Board reviewed and considered the contractual fee rates payable by the Fund to Funds Management under the Management Agreement, as well as the contractual fee rates payable by the Fund to Funds Management for class-level administrative services under a Class-Level Administration Agreement, which include, among other things, class-level transfer agency and sub-transfer agency costs (collectively, the “Management Rates”). The Board also reviewed and considered the contractual investment sub-advisory fee rates that are payable by Funds Management to the Sub-Adviser for investment sub-advisory services.
Among other information reviewed by the Board was a comparison of the Fund’s Management Rates with the average contractual investment management fee rates of funds in the expense Groups at a common asset level as well as transfer agency costs of the funds in the expense Groups. The Board noted that the Management Rates of the Fund were lower than the sum of these average rates for the Fund’s expense Groups for all share classes.
The Board also received and considered information about the portion of the total management fee that was retained by Funds Management after payment of the fee to the Sub-Adviser for sub-advisory services. In assessing the reasonableness of this amount, the Board received and evaluated information about the nature and extent of responsibilities retained and risks assumed by Funds Management and not delegated to or assumed by the Sub-Adviser, and about Funds Management’s on-going oversight services. Given the affiliation between Funds Management and the Sub-Adviser, the Board ascribed limited relevance to the allocation of fees between them.
The Board also received and considered information about the nature and extent of services offered and fee rates charged by Funds Management and the Sub-Adviser to other types of clients with investment strategies similar to those of the Fund. In this regard, the Board received information about the significantly greater scope of services, and compliance, reporting and other legal burdens and risks of managing mutual funds compared with those associated with managing assets of non-mutual fund clients such as institutional separate accounts.
Based on its consideration of the factors and information it deemed relevant, including those described here, the Board determined that the compensation payable to Funds Management under the Management Agreement and to the Sub-Adviser under the Sub-Advisory Agreement was reasonable.
Profitability
The Board received and considered information concerning the profitability of Funds Management, as well as the profitability of both WFAM and Wells Fargo & Co. (“Wells Fargo”) as a whole, from providing services to the Fund and the fund family as a whole. The Board noted that the Sub-Adviser’s profitability information with respect to providing services to the Fund was subsumed in the WFAM and Wells Fargo profitability analysis.
| | | | | | |
| Other information (unaudited) | | Wells Fargo High Yield Bond Fund | | | 39 | |
Funds Management reported on the methodologies and estimates used in calculating profitability, including a description of the methodology used to allocate certain expenses and recent enhancements made to the methodology. Among other things, the Board noted that the levels of profitability reported on a fund-by-fund basis varied widely, depending on factors such as the size and type of fund. Based on its review, the Board did not deem the profits reported by Funds Management, WFAM or Wells Fargo from services provided to the Fund to be at a level that would prevent it from approving the continuation of the Advisory Agreements.
Economies of scale
The Board considered the extent to which Funds Management may experience economies of scale in the provision of management services, and the extent to which scale benefits, if any, would be shared with shareholders. In particular, the Board noted the existence of breakpoints in the Fund’s management fee structure, which operate generally to reduce the Fund’s expense ratios as the Fund grows in size. It considered that, for a small fund or a fund that shrinks in size, breakpoints conversely can result in higher fee levels. The Board also considered that in addition to management fee breakpoints, competitive management fee rates set at the outset without regard to breakpoints and fee waiver and expense reimbursement arrangements, as well as investments in the business intended to enhance services available to Fund shareholders, are means of sharing potential economies of scale with shareholders of the Fund.
The Board concluded that the Fund’s fee and expense arrangements, including contractual breakpoints, constituted a reasonable approach to sharing potential economies of scale with the Fund and its shareholders.
Other benefits to Funds Management and the Sub-Adviser
The Board received and considered information regarding potential “fall-out” or ancillary benefits received by Funds Management and its affiliates, including the Sub-Adviser, as a result of their relationships with the Fund. Ancillary benefits could include, among others, benefits directly attributable to other relationships with the Fund and benefits potentially derived from an increase in Funds Management’s and the Sub-Adviser’s business as a result of their relationships with the Fund. The Board noted that various affiliates of Funds Management may receive distribution-related fees, shareholder servicing payments and sub-transfer agency fees in respect of shares sold or held through them and services provided.
The Board also reviewed information about soft dollar credits earned and utilized by the Sub-Adviser, fees earned by Funds Management and the Sub-Adviser from managing a private investment vehicle for the fund family’s securities lending collateral and commissions earned by an affiliated broker from portfolio transactions.
Based on its consideration of the factors and information it deemed relevant, including those described here, the Board did not find that any ancillary benefits received by Funds Management and its affiliates, including the Sub-Adviser, were unreasonable.
Conclusion
At the Meeting, after considering the above-described factors and based on its deliberations and its evaluation of the information described above, the Board unanimously approved the continuation of the Advisory Agreements for a one-year term and determined that the compensation payable to Funds Management and the Sub-Adviser under each of the Advisory Agreements was reasonable.
| | | | |
| 40 | | Wells Fargo High Yield Bond Fund | | Appendix A (unaudited) |
SALES CHARGE REDUCTIONS AND WAIVERS FOR CERTAIN INTERMEDIARIES
Ameriprise
Effective June 1, 2018, shareholders purchasing Fund shares through an Ameriprise Financial platform or account will be eligible only for the following Class A load waivers (front-end sales charge waivers), which may differ from those disclosed elsewhere in the Fund’s prospectus or Statement of Additional Information.
Front-end Sales Load Waivers on Class A Shares Available at Ameriprise Financial
| | • | | Employer-sponsored retirement plans (e.g., 401(k) plans, 457 plans, employer-sponsored 403(b) plans, profit sharing and money purchase pension plans and defined benefit plans). For purposes of this provision, employer-sponsored retirement plans do not include SEP IRAs, Simple IRAs or SAR-SEPs. |
| | • | | Shares purchased through an Ameriprise Financial investment advisory program (if an Advisory or similar share class for such investment advisory program is not available) |
| | • | | Shares purchased by third party investment advisors on behalf of their advisory clients through Ameriprise Financial’s platform (if an Advisory or similar share class for such investment advisory program is not available) |
| | • | | Shares purchased through reinvestment of distributions and dividend reinvestment when purchasing shares of the same Fund (but not any other fund within the same fund family) |
| | • | | Shares exchanged from Class C shares of the same fund in the month of or following the 10-year anniversary of the purchase date. To the extent that the Fund’s prospectus elsewhere provides for a waiver with respect to such shares following a shorter holding period, that waiver will apply to exchanges following such shorter period. To the extent that the Fund’s prospectus elsewhere provides for a waiver with respect to exchanges of Class C shares for load-waived shares, that waiver will also apply to such exchanges. |
| | • | | Employees and registered representatives of Ameriprise Financial or its affiliates and their immediate family members |
| | • | | Shares purchased by or through qualified accounts (including IRAs, Coverdell Education Savings Accounts, 401(k)s, 403(b) TSCAs subject to ERISA and defined benefit plans) that are held by a covered family member, defined as an Ameriprise financial advisor and/or the advisor’s spouse, advisor’s lineal ascendant (mother, father, grandmother, grandfather, great grandmother, great grandfather), advisor’s lineal descendant (son, step-son, daughter, step-daughter, grandson, granddaughter, great grandson, great granddaughter) or any spouse of a covered family member who is a lineal descendant |
| | • | | Shares purchased from the proceeds of redemptions within the same fund family, provided (1) the repurchase occurs within 90 days following the redemption, (2) the redemption and purchase occur in the same account, and (3) redeemed shares were subject to a front-end or deferred sales load (i.e. Rights of Reinstatement). Subject to the Fund’s policy regarding frequent purchases and redemptions of Fund shares, you may not be able to repurchase shares for the first 30 days after your redemption. |
Automatic Exchange of Class C Shares Available at Ameriprise Financial
| | • | | Class C shares will automatically exchange to Class A shares in the month of the 10-year anniversary of the purchase date. |
Merrill Lynch
Effective April 10, 2017, shareholders purchasing Fund shares through a Merrill Lynch platform or account will be eligible only for the following load waivers (front-end sales charge waivers and contingent deferred, or back-end, sales charge waivers) and discounts, which may differ from those disclosed elsewhere in the Fund’s prospectus or Statement of Additional Information.
Front-end Sales Load Waivers on Class A Shares available at Merrill Lynch
| | • | | Employer-sponsored retirement, deferred compensation and employee benefit plans (including health savings accounts) and trusts used to fund those plans, provided that the shares are not held in a commission-based brokerage account and shares are held for the benefit of the plan |
| | • | | Shares purchased by or through a 529 Plan |
| | • | | Shares purchased through a Merrill Lynch affiliated investment advisory program |
| | | | | | |
| Appendix A (unaudited) | | Wells Fargo High Yield Bond Fund | | | 41 | |
| | • | | Shares purchased by third party investment advisors on behalf of their advisory clients through Merrill Lynch’s platform |
| | • | | Shares of funds purchased through the Merrill Edge Self-Directed platform (if applicable) |
| | • | | Shares purchased through reinvestment of capital gains distributions and dividend reinvestment when purchasing shares of the same fund (but not any other fund within the fund family) |
| | • | | Shares exchanged from Class C (i.e. level-load) shares of the same fund in the month of or following the 10-year anniversary of the purchase date |
| | • | | Employees and registered representatives of Merrill Lynch or its affiliates and their family members, as defined by Merrill Lynch, which may differ from the definition of family member in the Fund’s prospectus. |
| | • | | Directors or Trustees of the Fund, and employees of the Fund’s investment adviser or any of its affiliates, as described in the Fund’s prospectus |
| | • | | Shares purchased from the proceeds of redemptions within the same fund family, provided (1) the repurchase occurs within 90 days following the redemption, (2) the redemption and purchase occur in the same account, and (3) redeemed shares were subject to a front-end or deferred sales load (known as Rights of Reinstatement). Subject to the Fund’s policy regarding frequent purchases and redemptions of Fund shares, you may not be able to repurchase shares for the first 30 days after your redemption. |
CDSC Waivers on A, B and C Shares available at Merrill Lynch
| | • | | Death or disability of the shareholder |
| | • | | Shares sold as part of a systematic withdrawal plan as described in the Fund’s prospectus |
| | • | | Return of excess contributions from an IRA Account |
| | • | | Shares sold as part of a required minimum distribution for IRA and retirement accounts due to the shareholder reaching age 70½ |
| | • | | Shares sold to pay Merrill Lynch fees but only if the transaction is initiated by Merrill Lynch |
| | • | | Shares acquired through a right of reinstatement |
| | • | | Shares held in retirement brokerage accounts, that are exchanged for a lower cost share class due to transfer to certain fee based accounts or platforms (applicable to A and C shares only) |
Front-end load Discounts Available at Merrill Lynch: Breakpoints, Rights of Accumulation & Letters of Intent
| | • | | Breakpoints as described in the Fund’s prospectus |
| | • | | Rights of Accumulation (ROA) which entitle shareholders to breakpoint discounts will be automatically calculated based on the aggregated holding of fund family assets held by accounts within the purchaser’s household at Merrill Lynch. Eligible fund family assets not held at Merrill Lynch may be included in the ROA calculation only if the shareholder notifies his or her financial advisor about such assets. |
| | • | | Letters of Intent (LOI) which allow for breakpoint discounts based on anticipated purchases within a fund family, through Merrill Lynch, over a 13-month period of time (if applicable) |
Morgan Stanley
Effective on or about July 1, 2018, shareholders purchasing Fund shares through a Morgan Stanley Wealth Management transactional brokerage account will be eligible only for the following Class A load waivers (front-end sales charge waivers), which may differ from and be more limited than those disclosed in the Fund’s prospectus or Statement of Additional Information.
Front-end Sales Load Waivers on Class A Shares Available at Morgan Stanley
| | • | | Employer-sponsored retirement plans (e.g., 401(k) plans, 457 plans, employer-sponsored 403(b) plans, profit sharing and money purchase pension plans and defined benefit plans). For purposes of this provision, employer-sponsored retirement plans do not include SEP IRAs, Simple IRAs, SAR-SEPs or Keogh plans. |
| | • | | Morgan Stanley employee and employee-related accounts according to Morgan Stanley’s account linking rules |
| | • | | Shares purchased through reinvestment of dividends and capital gains distributions when purchasing shares of the same fund |
| | • | | Shares purchased through a Morgan Stanley self-directed brokerage account |
| | | | |
| 42 | | Wells Fargo High Yield Bond Fund | | Appendix A (unaudited) |
| | • | | Class C (i.e., level-load) shares that are no longer subject to a contingent deferred sales charge and are exchanged to Class A shares of the same fund pursuant to Morgan Stanley Wealth Management’s share class exchange program. |
| | • | | Shares purchased from the proceeds of redemptions within the same fund family, provided (i) the repurchase occurs within 90 days following the redemption, (ii) the redemption and purchase occur in the same account, and (iii) redeemed shares were subject to a front-end or deferred sales charge. This waiver is subject to the Fund’s policy regarding frequent purchases and redemption of Fund shares, as discussed under “Account Information—Frequent Purchases and Redemptions of Fund Shares” in the Fund’s prospectus. |
This page is intentionally left blank.
This page is intentionally left blank.

For more information
More information about Wells Fargo Funds is available free upon request. To obtain literature, please write, visit the Fund’s website, or call:
Wells Fargo Funds
P.O. Box 219967
Kansas City, MO 64121-9967
Website: wellsfargofunds.com
Individual investors: 1-800-222-8222
Retail investment professionals: 1-888-877-9275
Institutional investment professionals:
1-866-765-0778
This report and the financial statements contained herein are submitted for the general information of the shareholders of the Fund. If this report is used for promotional purposes, distribution of the report must be accompanied or preceded by a current prospectus. Before investing, please consider the investment objectives, risks, charges, and expenses of the investment. For a current prospectus and, if available, a summary prospectus, containing this information, call 1-800-222-8222 or visit the Fund’s website at wellsfargofunds.com. Read the prospectus carefully before you invest or send money.
Wells Fargo Asset Management (WFAM) is the trade name for certain investment advisory/management firms owned by Wells Fargo & Company. These firms include but are not limited to Wells Capital Management Incorporated and Wells Fargo Funds Management, LLC. Certain products managed by WFAM entities are distributed by Wells Fargo Funds Distributor, LLC (a broker/dealer and Member FINRA).
This material is for general informational and educational purposes only and is NOT intended to provide investment advice or a recommendation of any kind—including a recommendation for any specific investment, strategy, or plan.
NOT FDIC INSURED ◾ NO BANK GUARANTEE ◾ MAY LOSE VALUE
© 2018 Wells Fargo Funds Management, LLC. All rights reserved.
| | |
 | | 315406 10-18 A218/AR218 08-18 |
Annual Report
August 31, 2018

Wells Fargo Core Plus Bond Fund


Reduce clutter. Save trees.
Sign up for electronic delivery of prospectuses and shareholder reports at wellsfargo.com/advantagedelivery
Contents
The views expressed and any forward-looking statements are as of August 31, 2018, unless otherwise noted, and are those of the Fund managers and/or Wells Fargo Funds Management, LLC. Discussions of individual securities, or the markets generally, or any Wells Fargo Fund are not intended as individual recommendations. Future events or results may vary significantly from those expressed in any forward-looking statements. The views expressed are subject to change at any time in response to changing circumstances in the market. Wells Fargo Funds Management, LLC and the Fund disclaim any obligation to publicly update or revise any views expressed or forward-looking statements.
NOT FDIC INSURED ◾ NO BANK GUARANTEE ◾ MAY LOSE VALUE
| | | | |
| 2 | | Wells Fargo Core Plus Bond Fund | | Letter to shareholders (unaudited) |

Andrew Owen
President
Wells Fargo Funds
After advancing during 2017, economic growth and stock markets globally diverged during the first eight months of 2018.
Dear Shareholder:
We are pleased to offer you this annual report for the Wells Fargo Core Plus Bond Fund for the 12-month period that ended August 31, 2018. After advancing during 2017, economic growth and stock markets globally diverged during the first eight months of 2018. For fixed-income investors, taxable bond returns suffered and high-yield and municipal bond returns were positive.
For the period, U.S. stocks, as measured by the S&P 500 Index,1 gained 19.66%, and international stocks, as measured by the MSCI ACWI ex USA Index (Net),2 added 3.18%. Based on the MSCI EM Index (Net),3 emerging market stocks lost 0.68%. For bond investors, the Bloomberg Barclays U.S. Aggregate Bond Index4 declined 1.05% while the Bloomberg Barclays Global Aggregate ex-USD Index5 fell 1.64%. The Bloomberg Barclays Municipal Bond Index6 added 0.49%, and the ICE BofAML U.S. High Yield Index7 was up 3.26%.
Continued optimism in the U.S. characterized the fourth quarter of 2017.
Some observers described economic conditions in late 2017 as a Goldilocks scenario: synchronized global growth, low inflation, healthy corporate earnings, and a weaker U.S. dollar that supported international growth. During the quarter, the U.S. Bureau of Economic Analysis reported that annualized U.S. gross domestic product (GDP) growth for the third quarter of 2017 was 2.8% and inflation remained below U.S. Federal Reserve (Fed) targets. U.S. corporate earnings and consumer confidence improved.
Economic momentum increased in Europe. The Bank of England (BOE) raised interest rates in November 2017 to 0.50%, the first increase in more than 10 years, indicating confidence in the economy’s growth potential. Meanwhile, the European Central Bank and the Bank of Japan kept interest rates low to spur business activities and bought bonds in an effort to encourage equity investments. The People’s Bank of China’s (PBOC’s) policies sought to stimulate business. Many emerging market economies benefited from stronger currencies versus the U.S. dollar, while commodity price increases benefited countries that rely on natural resources for exports.
| 1 | The S&P 500 Index consists of 500 stocks chosen for market size, liquidity, and industry group representation. It is a market-value-weighted index with each stock’s weight in the index proportionate to its market value. You cannot invest directly in an index. |
| 2 | The Morgan Stanley Capital International (MSCI) All Country World Index (ACWI) ex USA Index (Net) is a free-float-adjusted market-capitalization-weighted index that is designed to measure the equity market performance of developed markets, excluding the United States and Canada. Source: MSCI. MSCI makes no express or implied warranties or representations and shall have no liability whatsoever with respect to any MSCI data contained herein. The MSCI data may not be further redistributed or used as a basis for other indices or any securities or financial products. This report is not approved, reviewed, or produced by MSCI. You cannot invest directly in an index. |
| 3 | The MSCI Emerging Markets (EM) Index (Net) is a free-float-adjusted market-capitalization-weighted index that is designed to measure large- and mid-cap equity market performance of emerging markets. The MSCI EM Index (Net) consists of the following 24 emerging market country indices: Brazil, Chile, China, Colombia, Czech Republic, Egypt, Greece, Hungary, India, Indonesia, Korea, Malaysia, Mexico, Pakistan, Peru, the Philippines, Poland, Qatar, Russia, South Africa, Taiwan, Thailand, Turkey, and the United Arab Emirates. You cannot invest directly in an index. |
| 4 | The Bloomberg Barclays U.S. Aggregate Bond Index is a broad-based benchmark that measures the investment-grade, U.S. dollar-denominated, fixed-rate taxable bond market, including Treasuries, government-related and corporate securities, mortgage-backed securities (agency fixed-rate and hybrid adjustable-rate mortgage pass-throughs), asset-backed securities, and commercial mortgage-backed securities. You cannot invest directly in an index. |
| 5 | The Bloomberg Barclays Global Aggregate ex-USD Index is an unmanaged index that provides a broad-based measure of the global investment-grade fixed-income markets excluding the U.S. dollar-denominated debt market. You cannot invest directly in an index. |
| 6 | The Bloomberg Barclays Municipal Bond Index is an unmanaged index composed of long-term tax-exempt bonds with a minimum credit rating of Baa. You cannot invest directly in an index. |
| 7 | The ICE BofAML U.S. High Yield Index is a market-capitalization-weighted index of domestic and Yankee high-yield bonds. The index tracks the performance of high-yield securities traded in the U.S. bond market. You cannot invest directly in an index. Copyright 2018. ICE Data Indices, LLC. All rights reserved. |
| | | | | | |
| Letter to shareholders (unaudited) | | Wells Fargo Core Plus Bond Fund | | | 3 | |
Volatility reemerged during the first quarter of 2018 as global tensions and inflation fears increased.
Stock market gains in January 2018 followed the passage of lower U.S. tax rates. Some investors then grew concerned about trade, particularly between the U.S. and China, and the specter of inflation. The Fed followed its 25-basis-point (bp; 100 bps equal 1.00%) federal funds rate increase in December 2017 with a further 25-bp increase in March 2018. The inflation rate in March reached the Fed’s 2% target for the first time in a year.
The S&P 500 Index closed the first quarter with a negative return, the first negative quarterly return for the index since 2014. Overseas investment markets reversed strong returns in 2017, hurt by a stronger U.S. dollar and mounting trade and diplomatic tensions. After gaining 27.19% for the 12-month period that ended December 31, 2017, the MSCI ACWI ex USA Index (Net) declined 1.81% for the quarter that ended March 31, 2018.
Global trade tensions escalated during the second quarter.
Global trade tensions escalated throughout the second quarter of 2018. The U.S. government imposed tariffs, and foreign governments in North America, Europe, and Asia retaliated. The escalating tensions chilled investment activity as observers awaited signals of next steps.
Meanwhile, inflation continued an upward trend. The CPI-U8 added 0.1% in June after increases of 0.2% in both April and May. On a year-over-year basis, the all-items index rose 2.9% for the 12 months that ended June 30, 2018. The index for all items less food and energy rose 2.3% for the same 12-month period.
U.S. stocks gained while international stocks and bonds declined during the summer of 2018.
The U.S. economy strengthened during the summer months. Revised second-quarter GDP data released in August showed the U.S. economy growing at a 4.2% rate. After ticking up slightly in June, the unemployment rate in the U.S. was 3.9% in July and August, according to the U.S. Department of Labor. Wages showed more consistent growth than they had in recent quarters, and consumer confidence remained strong.
Several U.S. equity market indices reached records during August, with the S&P 500 Index gaining 7.76% for the three-month period that ended August 31, 2018. International stock values continued to suffer under the effects of a strong U.S. dollar and continuing trade tensions. The MSCI ACWI ex USA Index (Net) and the MSCI EM Index (Net) were down 4.70% and 1.64%, respectively, during the same three-month period.
The Fed increased the federal funds rate in June, and expectations grew that two more rate increases were in the offing in 2018. Long-term interest rates in the U.S. remained at higher levels relative to the prior 10 years. Rates on 10-year and 30-year Treasury bonds—2.46% and 2.81%, respectively, on January 1, 2018—were 2.86% and 3.02%, respectively, on August 31, off their peak levels on May 17, 2018, of 3.11% and 3.25%, respectively. Some investors became more aware of and concerned about the potential for an inverted yield curve—sometimes a recession signal—as short-term rates increased more quickly than long-term rates. The Fed decided to forgo an interest rate increase at its August meeting.
The S&P 500 Index closed the first quarter with a negative return, the first negative quarterly return for the index since 2014.
| 8 | The Consumer Price Index for All Urban Consumers (CPI-U) measures the changes in the price of a basket of goods and services purchased by urban consumers. The urban consumer population is deemed by many as a better representative measure of the general public because close to 90% of the country’s population lives in highly populated areas. You cannot invest directly in an index. |
| | | | |
| 4 | | Wells Fargo Core Plus Bond Fund | | Letter to shareholders (unaudited) |
Internationally, members of Prime Minister Theresa May’s U.K./Brexit negotiating team resigned amid unproductive negotiations. In early August, the BOE’s Monetary Policy Committee increased its key interest rate to 0.75%. Central banks in Europe and Japan maintained low interest rates and accommodative monetary policies. Amid rising trade uncertainty, the PBOC cut reserve requirement ratios and accelerated infrastructure spending and tax cuts for business enterprises and individuals. Nevertheless, a strengthening U.S. dollar and the trade tensions remained headwinds for investors overseas.
Don’t let short-term uncertainty derail long-term investment goals.
Periods of investment uncertainty can present challenges, but experience has taught us that maintaining long-term investment goals can be an effective way to plan for the future. To help you create a sound strategy based on your personal goals and risk tolerance, Wells Fargo Funds offers more than 100 mutual funds spanning a wide range of asset classes and investment styles. Although diversification cannot guarantee an investment profit or prevent losses, we believe it can be an effective way to manage investment risk and potentially smooth out overall portfolio performance. We encourage investors to know their investments and to understand that appropriate levels of risk-taking may unlock opportunities.
Thank you for choosing to invest with Wells Fargo Funds. We appreciate your confidence in us and remain committed to helping you meet your financial needs.
Sincerely,

Andrew Owen
President
Wells Fargo Funds
Notice to shareholders
At a meeting held on August 14-15, 2018, the Board of Trustees of the Fund approved the following policy which will be effective on or about February 5, 2019:
Class C shares will convert automatically into Class A shares ten years after the initial date of purchase or, if you acquired your Class C shares through an exchange or conversion from another share class, ten years after the date you acquired your Class C shares. When Class C shares that you acquired through a purchase or exchange convert, any other Class C shares that you purchased with reinvested dividends and distributions also will convert into Class A shares on a pro rata basis. A shorter holding period may also apply depending on your intermediary. Please see “Appendix A—Sales Charge Reductions and Waivers for Certain Intermediaries” in the Fund’s prospectus or at the end of this report.
For further information about your Fund, contact your investment professional, visit our website at wellsfargofunds.com, or call us directly at 1-800-222-8222.
This page is intentionally left blank.
| | | | |
| 6 | | Wells Fargo Core Plus Bond Fund | | Performance highlights (unaudited) |
Investment objective
The Fund seeks total return, consisting of current income and capital appreciation.
Manager
Wells Fargo Funds Management, LLC
Subadviser
Wells Capital Management Incorporated
Portfolio managers
Christopher Y. Kauffman, CFA®
Jay N. Mueller, CFA®‡
Thomas M. Price, CFA®
Janet S. Rilling, CFA®, CPA
Michael J. Schueller, CFA®
Noah M. Wise, CFA®
Average annual total returns (%) as of August 31, 20181
| | | | | | | | | | | | | | | | | | | | | | | | | | | | | | | | | | |
| | | | | Including sales charge | | | Excluding sales charge | | | Expense ratios2 (%) | |
| | | Inception date | | 1 year | | | 5 year | | | 10 year | | | 1 year | | | 5 year | | | 10 year | | | Gross | | | Net3 | |
| Class A (STYAX) | | 7-13-1998 | | | (5.31 | ) | | | 2.58 | | | | 4.37 | | | | (0.84 | ) | | | 3.53 | | | | 4.85 | | | | 0.94 | | | | 0.74 | |
| Class C (WFIPX) | | 7-13-1998 | | | (2.50 | ) | | | 2.77 | | | | 4.08 | | | | (1.50 | )* | | | 2.77 | | | | 4.08 | | | | 1.69 | | | | 1.49 | |
| Class R6 (STYJX) | | 10-31-2016 | | | – | | | | – | | | | – | | | | (0.46 | )* | | | 3.85 | | | | 5.19 | | | | 0.56 | | | | 0.36 | |
| Administrator Class (WIPDX) | | 7-30-2010 | | | – | | | | – | | | | – | | | | (0.74 | ) | | | 3.65 | | | | 4.99 | | | | 0.88 | | | | 0.63 | |
| Institutional Class (WIPIX) | | 7-18-2008 | | | – | | | | – | | | | – | | | | (0.52 | ) | | | 3.82 | | | | 5.17 | | | | 0.61 | | | | 0.41 | |
| Bloomberg Barclays U.S. Aggregate Bond Index4 | | – | | | – | | | | – | | | | – | | | | (1.05 | ) | | | 2.49 | | | | 3.70 | | | | – | | | | – | |
| * | | Total return differs from the return in the Financial Highlights in this report. The total return presented is calculated based on the NAV at which the shareholder transactions were processed. The NAV and total return presented in the Financial Highlights reflects certain adjustments made to the net assets of the Fund that are necessary under U.S. generally accepted accounting principles. |
Figures quoted represent past performance, which is no guarantee of future results, and do not reflect taxes that a shareholder may pay on fund distributions or the redemption of fund shares. Investment return and principal value of an investment will fluctuate so that an investor’s shares, when redeemed, may be worth more or less than their original cost. Performance shown without sales charges would be lower if sales charges were reflected. Current performance may be lower or higher than the performance data quoted, which assumes the reinvestment of dividends and capital gains. Current month-end performance is available on the Fund’s website, wellsfargofunds.com.
Index returns do not include transaction costs associated with buying and selling securities, any mutual fund fees or expenses, or any taxes. It is not possible to invest directly in an index.
For Class A shares, the maximum front-end sales charge is 4.50%. For Class C shares, the maximum contingent deferred sales charge is 1.00%. Performance including a contingent deferred sales charge assumes the sales charge for the corresponding time period. Class R6, Administrator Class, and Institutional Class shares are sold without a front-end sales charge or contingent deferred sales charge.
Bond values fluctuate in response to the financial condition of individual issuers, general market and economic conditions, and changes in interest rates. Changes in market conditions and government policies may lead to periods of heightened volatility in the bond market and reduced liquidity for certain bonds held by the Fund. In general, when interest rates rise, bond values fall and investors may lose principal value. Interest rate changes and their impact on the Fund and its share price can be sudden and unpredictable. Loans are subject to risks similar to those associated with other below-investment-grade bond investments, such as risk of greater volatility in value, credit risk (for example, risk of issuer default), and risk that the loan may become illiquid or difficult to price. The use of derivatives may reduce returns and/or increase volatility. Certain investment strategies tend to increase the total risk of an investment (relative to the broader market). The Fund is exposed to foreign investment risk, high-yield securities risk, and mortgage and asset-backed securities risk. High-yield securities have a greater risk of default and tend to be more volatile than higher rated debt securities. Consult the Fund’s prospectus for additional information on these and other risks.
Please see footnotes on page 7.
| | | | | | |
| Performance highlights (unaudited) | | Wells Fargo Core Plus Bond Fund | | | 7 | |
|
| Growth of $10,000 investment as of August 31, 20185 |
|
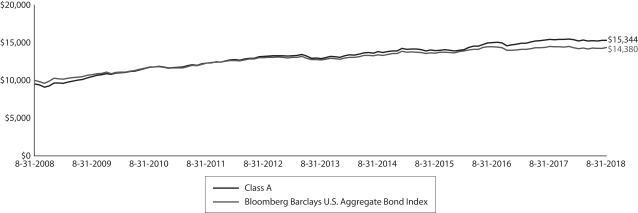 |
| ‡ | Mr. Mueller became a portfolio manager of the Fund on January 1, 2018. |
| 1 | Historical performance shown for Class R6 shares prior to their inception reflects the performance of the Institutional Class shares, and includes the higher expenses applicable to the Institutional Class shares. If these expenses had not been included, returns for Class R6 shares would be higher. Historical performance shown for Administrator Class shares prior to their inception reflects the performance of Institutional Class shares and has been adjusted to include the higher expenses applicable to Administrator Class shares. |
| 2 | Reflects the expense ratios as stated in the most recent prospectuses, which include the impact of 0.01% in acquired fund fees and expenses. The expense ratios shown are subject to change and may differ from the annualized expense ratios shown in the financial highlights of this report, which do not include acquired fund fees and expenses. |
| 3 | The manager has contractually committed through December 31, 2018, to waive fees and/or reimburse expenses to the extent necessary to cap the Fund’s Total Annual Fund Operating Expenses After Fee Waivers at 0.73% for Class A, 1.48% for Class C, 0.35% for Class R6, 0.62% for Administrator Class, and 0.40% for Institutional Class. After this time, the cap may be increased or the commitment to maintain the cap may be terminated only with the approval of the Board of Trustees. Brokerage commissions, stamp duty fees, interest, taxes, acquired fund fees and expenses (if any), and extraordinary expenses are excluded from the expense cap. Without this cap, the Fund’s returns would have been lower. The expense ratio paid by an investor is the net expense ratio (the total annual fund operating expenses after fee waivers) as stated in the prospectuses. |
| 4 | The Bloomberg Barclays U.S. Aggregate Bond Index is a broad-based benchmark that measures the investment-grade, U.S. dollar–denominated, fixed-rate taxable bond market, including Treasuries, government-related and corporate securities, mortgage-backed securities (agency fixed-rate and hybrid adjustable-rate mortgage pass-throughs), asset-backed securities, and commercial mortgage-backed securities. You cannot invest directly in an index. |
| 5 | The chart compares the performance of Class A shares for the most recent ten years with the performance of the Bloomberg Barclays U.S. Aggregate Bond Index. The chart assumes a hypothetical investment of $10,000 in Class A shares and reflects all operating expenses and assumes the maximum initial sales charge of 4.50%. |
| 6 | The ten largest holdings, excluding cash, cash equivalents and any money market funds, are calculated based on the value of the investments divided by total net assets of the Fund. Holdings are subject to change and may have changed since the date specified. |
| 7 | The Consumer Price Index (CPI) is a measure of the average change over time in the prices paid by urban consumers for a market basket of consumer goods and services. You cannot invest directly in an index. |
| 8 | Amounts are calculated based on the total long-term investments of the Fund. These amounts are subject to change and may have changed since the date specified. |
| | | | |
| 8 | | Wells Fargo Core Plus Bond Fund | | Performance highlights (unaudited) |
MANAGER’S DISCUSSION
Fund highlights
| ∎ | | The Fund (Class A shares, excluding sales charges) outperformed its benchmark, the Bloomberg Barclays U.S. Aggregate Bond Index, for the 12-month period that ended August 31, 2018. |
| ∎ | | The Fund’s shorter duration relative to the index and exposure to a flatter U.S. Treasury yield curve contributed to performance, as did overweight allocations to U.S. high-yield and BBB-rated corporate bonds. |
| ∎ | | The Fund’s allocations to emerging market bonds and foreign currencies detracted from performance. |
| | | | |
| Ten largest holdings (%) as of August 31, 20186 | |
U.S. Treasury Note, 2.25%, 11-15-2027 | | | 3.45 | |
FNMA , 3.50%, 3-1-2048 | | | 2.37 | |
iShares iBoxx $ Investment Grade Corporate Bond ETF | | | 2.04 | |
FNMA, 4.50%, 9-13-2048 | | | 1.44 | |
FNMA, 3.00%, 11-1-2047 | | | 1.43 | |
U.S. Treasury Note, 2.00%, 10-31-2022 | | | 1.35 | |
GNMA, 3.50%, 12-20-2047 | | | 1.32 | |
FNMA, 3.50%, 8-1-2045 | | | 1.09 | |
FNMA, 3.00%, 4-1-2048 | | | 0.98 | |
U.S. Treasury Bond, 3.00%, 8-15-2048 | | | 0.95 | |
Economic growth accelerated and policy normalization continued.
Over the past four quarters, U.S. gross domestic product (GDP) grew by 2.9% in real terms, which was above the post-financial-crisis average. Business investment was a significant source of strength, rising 4.8% for the 12 months that ended June 30, 2018. Consumer spending was a net contributor to growth, although it failed to keep pace with the business sector. Inventories were a net detractor from GDP growth, while trade and government spending were modestly positive factors.
The labor market generally was healthy over the past 12 months. Nonfarm payrolls expanded by an average of 194,000 jobs per month over the period, while the
unemployment rate declined to 3.9% at the end of August 2018 from 4.4% a year earlier. Also encouraging was a 0.2% rise in the employment/population ratio since August 2017, reflecting both the fall in unemployment and a modest increase in the labor force participation rate. Wage gains of about 2.9% over the past 12 months were sufficient to support consumption growth without sparking fears of rising inflation. The CPI7 also rose 2.9% over the past year, which accelerated due in part to higher energy prices.
The U.S. Federal Reserve’s (Fed’s) rate-setting committee, the Federal Open Market Committee (FOMC), raised the federal funds rate three times over the past 12 months by a total of 0.75%. The FOMC’s gradual approach to hiking rates is supported by Fed Chairman Jerome Powell’s stated view that there is no sense that inflation will take off or move unexpectedly quickly.
In line with the FOMC’s policy moves, interest rates had an upward bias over the past 12 months, particularly in shorter-term maturity instruments. Yields on 2-year Treasuries rose by 130 basis points (bps; 100 bps equal 1.00%) during the period, while 10-year Treasuries were about 75 bps higher. Investment-grade credit spreads tightened rapidly into the start of 2018 after the corporate tax cut was enacted in the U.S. but ended the period slightly wider after trade tensions and heavy supply took their toll on bond prices.
|
| Portfolio allocation as of August 31, 20188 |
|
 |
The Fund increased holdings in European high-yield bonds and decreased exposure to floating-rate loans.
During the period, the Fund increased holdings in European high-yield bonds and decreased the overweight to floating-rate loans. We added European high-yield bonds because our assessment of both their fundamentals and valuations was of improvement throughout the year. However, European high-yield bond returns lagged due to an increase in Italian political risk and market outflows. The Fund also maintained a short duration profile relative to the index because we believed a defensive position was prudent given the likelihood of the FOMC continuing to gradually reduce its accommodative monetary policy.
Please see footnotes on page 7.
| | | | | | |
| Performance highlights (unaudited) | | Wells Fargo Core Plus Bond Fund | | | 9 | |
The Fund’s shorter duration position in an environment where interest rates rose faster than the market anticipated was a key driver of favorable relative performance during the reporting period. Tighter U.S. high-yield spreads and selection within U.S. investment-grade credit also benefited results. Positioning that detracted from performance included allocations to several Latin American emerging market countries and their currencies, which lagged in the face of stronger U.S. economic growth, higher interest rates, and a stronger U.S. dollar.
We expect modestly above-trend economic growth to continue.
We expect macroeconomic trends to remain relatively consistent in the coming quarters, aided by fiscal stimulus and looser regulations. Real GDP growth in the area of 3% is likely to persist for a period of time, barring some external shock. The biggest risks to the outlook include an escalation in trade tensions and a larger-than-expected slowdown in the Chinese economy.
Please see footnotes on page 7.
| | | | |
| 10 | | Wells Fargo Core Plus Bond Fund | | Fund expenses (unaudited) |
As a shareholder of the Fund, you incur two types of costs: (1) transaction costs, including sales charges (loads) on purchase payments and contingent deferred sales charges (if any) on redemptions and (2) ongoing costs, including management fees, distribution (12b-1) and/or shareholder servicing fees, and other Fund expenses. This example is intended to help you understand your ongoing costs (in dollars) of investing in the Fund and to compare these costs with the ongoing costs of investing in other mutual funds.
The example is based on an investment of $1,000 invested at the beginning of the six-month period and held for the entire period from March 1, 2018 to August 31, 2018.
Actual expenses
The “Actual” line of the table below provides information about actual account values and actual expenses. You may use the information in this line, together with the amount you invested, to estimate the expenses that you paid over the period. Simply divide your account value by $1,000 (for example, an $8,600 account value divided by $1,000 = 8.6), then multiply the result by the number in the “Actual” line under the heading entitled “Expenses paid during period” for your applicable class of shares to estimate the expenses you paid on your account during this period.
Hypothetical example for comparison purposes
The “Hypothetical” line of the table below provides information about hypothetical account values and hypothetical expenses based on the Fund’s actual expense ratio and an assumed rate of return of 5% per year before expenses, which is not the Fund’s actual return. The hypothetical account values and expenses may not be used to estimate the actual ending account balance or expenses you paid for the period. You may use this information to compare the ongoing costs of investing in the Fund and other funds. To do so, compare this 5% hypothetical example with the 5% hypothetical examples that appear in the shareholder reports of the other funds.
Please note that the expenses shown in the table are meant to highlight your ongoing costs only and do not reflect any transactional costs, such as sales charges (loads) and contingent deferred sales charges. Therefore, the “Hypothetical” line of the table is useful in comparing ongoing costs only and will not help you determine the relative total costs of owning different funds. In addition, if these transactional costs were included, your costs would have been higher.
| | | | | | | | | | | | | | | | |
| | | Beginning
account value
3-1-2018 | | | Ending
account value
8-31-2018 | | | Expenses
paid during
the period¹ | | | Annualized net
expense ratio | |
Class A | | | | | | | | | | | | | | | | |
Actual | | $ | 1,000.00 | | | $ | 1,005.79 | | | $ | 3.69 | | | | 0.73 | % |
Hypothetical (5% return before expenses) | | $ | 1,000.00 | | | $ | 1,021.53 | | | $ | 3.72 | | | | 0.73 | % |
Class C | | | | | | | | | | | | | | | | |
Actual | | $ | 1,000.00 | | | $ | 1,001.91 | | | $ | 7.47 | | | | 1.48 | % |
Hypothetical (5% return before expenses) | | $ | 1,000.00 | | | $ | 1,017.74 | | | $ | 7.53 | | | | 1.48 | % |
Class R6 | | | | | | | | | | | | | | | | |
Actual | | $ | 1,000.00 | | | $ | 1,007.75 | | | $ | 1.77 | | | | 0.35 | % |
Hypothetical (5% return before expenses) | | $ | 1,000.00 | | | $ | 1,023.44 | | | $ | 1.79 | | | | 0.35 | % |
Administrator Class | | | | | | | | | | | | | | | | |
Actual | | $ | 1,000.00 | | | $ | 1,006.36 | | | $ | 3.14 | | | | 0.62 | % |
Hypothetical (5% return before expenses) | | $ | 1,000.00 | | | $ | 1,022.08 | | | $ | 3.16 | | | | 0.62 | % |
Institutional Class | | | | | | | | | | | | | | | | |
Actual | | $ | 1,000.00 | | | $ | 1,006.68 | | | $ | 2.02 | | | | 0.40 | % |
Hypothetical (5% return before expenses) | | $ | 1,000.00 | | | $ | 1,023.19 | | | $ | 2.04 | | | | 0.40 | % |
| 1 | Expenses paid is equal to the annualized net expense ratio of each class multiplied by the average account value over the period, multiplied by the number of days in the most recent fiscal half-year divided by the number of days in the fiscal year (to reflect the one-half-year period). |
| | | | | | |
| Portfolio of investments—August 31, 2018 | | Wells Fargo Core Plus Bond Fund | | | 11 | |
| | | | | | | | | | | | | | | | |
| Security name | | Interest rate | | | Maturity date | | | Principal | | | Value | |
|
Agency Securities: 23.09% | |
FHLMC (12 Month LIBOR +1.33%) ± | | | 3.09 | % | | | 1-1-2036 | | | $ | 23,738 | | | $ | 24,531 | |
FHLMC | | | 3.50 | | | | 12-1-2045 | | | | 3,660,267 | | | | 3,648,068 | |
FHLMC | | | 3.50 | | | | 12-1-2045 | | | | 1,388,686 | | | | 1,384,061 | |
FHLMC | | | 4.00 | | | | 6-1-2044 | | | | 2,737,469 | | | | 2,794,930 | |
FHLMC | | | 5.00 | | | | 6-1-2036 | | | | 264,721 | | | | 282,158 | |
FHLMC | | | 5.00 | | | | 8-1-2040 | | | | 251,814 | | | | 268,956 | |
FHLMC | | | 5.50 | | | | 8-1-2038 | | | | 59,818 | | | | 64,556 | |
FHLMC | | | 5.50 | | | | 12-1-2038 | | | | 537,279 | | | | 581,065 | |
FHLMC | | | 5.50 | | | | 6-1-2040 | | | | 852,450 | | | | 919,943 | |
FHLMC | | | 8.00 | | | | 2-1-2030 | | | | 230 | | | | 261 | |
FHLMC Series 2015-SC01 Class 1A | | | 3.50 | | | | 5-25-2045 | | | | 938,717 | | | | 927,277 | |
FHLMC Series 3774 Class AB | | | 3.50 | | | | 12-15-2020 | | | | 90,695 | | | | 91,427 | |
FHLMC Series K020 Class X1 ±±(c) | | | 1.55 | | | | 5-25-2022 | | | | 13,379,594 | | | | 571,646 | |
FHLMC Series T-42 Class A5 | | | 7.50 | | | | 2-25-2042 | | | | 1,525,235 | | | | 1,740,682 | |
FHLMC Series T-57 Class 2A1 ±± | | | 3.92 | | | | 7-25-2043 | | | | 47,191 | | | | 49,559 | |
FHLMC Series T-59 Class 2A1 ±± | | | 3.75 | | | | 10-25-2043 | | | | 237,443 | | | | 230,163 | |
FNMA | | | 3.50 | | | | 3-1-2048 | | | | 14,125,955 | | | | 14,045,391 | |
FNMA ¤ | | | 0.00 | | | | 10-9-2019 | | | | 5,000,000 | | | | 4,858,580 | |
FNMA | | | 2.27 | | | | 3-1-2019 | | | | 2,428,321 | | | | 2,419,488 | |
FNMA %% | | | 2.50 | | | | 9-18-2033 | | | | 1,645,000 | | | | 1,599,479 | |
FNMA (12 Month LIBOR +1.61%) ± | | | 2.51 | | | | 3-1-2046 | | | | 1,347,256 | | | | 1,334,522 | |
FNMA (12 Month LIBOR +1.61%) ± | | | 2.51 | | | | 5-1-2046 | | | | 1,423,143 | | | | 1,407,898 | |
FNMA | | | 3.00 | | | | 11-1-2045 | | | | 2,143,718 | | | | 2,077,698 | |
FNMA | | | 3.00 | | | | 12-1-2045 | | | | 5,421,869 | | | | 5,251,798 | |
FNMA | | | 3.00 | | | | 12-1-2046 | | | | 2,479,206 | | | | 2,399,198 | |
FNMA | | | 3.00 | | | | 11-1-2047 | | | | 8,733,375 | | | | 8,451,361 | |
FNMA | | | 3.00 | | | | 4-1-2048 | | | | 5,987,822 | | | | 5,792,685 | |
FNMA | | | 3.02 | | | | 2-1-2026 | | | | 3,199,601 | | | | 3,144,498 | |
FNMA | | | 3.27 | | | | 7-1-2022 | | | | 1,213,016 | | | | 1,221,432 | |
FNMA (12 Month LIBOR +1.73%) ± | | | 3.49 | | | | 9-1-2036 | | | | 20,046 | | | | 21,030 | |
FNMA | | | 3.50 | | | | 10-1-2043 | | | | 1,035,533 | | | | 1,037,317 | |
FNMA | | | 3.50 | | | | 4-1-2045 | | | | 296,997 | | | | 295,991 | |
FNMA | | | 3.50 | | | | 8-1-2045 | | | | 6,473,729 | | | | 6,448,797 | |
FNMA (1 Year Treasury Constant Maturity +2.27%) ± | | | 3.66 | | | | 1-1-2036 | | | | 73,744 | | | | 77,706 | |
FNMA (1 Year Treasury Constant Maturity +2.26%) ± | | | 3.86 | | | | 8-1-2036 | | | | 907,435 | | | | 955,995 | |
FNMA (12 Month LIBOR +1.80%) ± | | | 3.92 | | | | 8-1-2036 | | | | 32,509 | | | | 34,116 | |
FNMA | | | 3.95 | | | | 9-1-2021 | | | | 406,081 | | | | 415,340 | |
FNMA | | | 4.00 | | | | 9-1-2024 | | | | 23,869 | | | | 24,432 | |
FNMA | | | 4.00 | | | | 2-1-2046 | | | | 565,599 | | | | 576,126 | |
FNMA | | | 4.00 | | | | 4-1-2046 | | | | 2,912,235 | | | | 2,967,659 | |
FNMA %% | | | 4.00 | | | | 9-13-2048 | | | | 5,040,000 | | | | 5,130,636 | |
FNMA | | | 4.26 | | | | 4-1-2021 | | | | 2,670,727 | | | | 2,744,138 | |
FNMA %% | | | 4.50 | | | | 9-13-2048 | | | | 8,230,000 | | | | 8,548,591 | |
FNMA | | | 5.00 | | | | 1-1-2024 | | | | 74,049 | | | | 76,295 | |
FNMA | | | 5.00 | | | | 2-1-2036 | | | | 28,176 | | | | 30,094 | |
FNMA | | | 5.00 | | | | 6-1-2040 | | | | 98,276 | | | | 105,235 | |
FNMA | | | 5.00 | | | | 8-1-2040 | | | | 1,676,544 | | | | 1,804,111 | |
FNMA | | | 5.50 | | | | 11-1-2023 | | | | 49,282 | | | | 51,319 | |
FNMA | | | 5.50 | | | | 8-1-2034 | | | | 96,545 | | | | 105,229 | |
FNMA | | | 5.50 | | | | 2-1-2035 | | | | 29,584 | | | | 32,278 | |
The accompanying notes are an integral part of these financial statements.
| | | | |
| 12 | | Wells Fargo Core Plus Bond Fund | | Portfolio of investments—August 31, 2018 |
| | | | | | | | | | | | | | | | |
| Security name | | Interest rate | | | Maturity date | | | Principal | | | Value | |
| | | | |
Agency Securities (continued) | | | | | | | | | | | | | | | | |
FNMA | | | 5.50 | % | | | 8-1-2038 | | | $ | 105,821 | | | $ | 113,488 | |
FNMA | | | 5.50 | | | | 8-1-2038 | | | | 408,138 | | | | 439,891 | |
FNMA | | | 6.00 | | | | 10-1-2037 | | | | 477,615 | | | | 526,440 | |
FNMA | | | 6.00 | | | | 11-1-2037 | | | | 36,857 | | | | 40,750 | |
FNMA | | | 6.50 | | | | 7-1-2036 | | | | 24,053 | | | | 26,872 | |
FNMA | | | 6.50 | | | | 7-1-2036 | | | | 11,001 | | | | 12,174 | |
FNMA | | | 6.50 | | | | 11-1-2036 | | | | 4,759 | | | | 5,215 | |
FNMA | | | 7.00 | | | | 12-1-2022 | | | | 141,102 | | | | 145,292 | |
FNMA | | | 7.00 | | | | 7-1-2036 | | | | 10,863 | | | | 11,468 | |
FNMA | | | 7.00 | | | | 11-1-2037 | | | | 7,978 | | | | 8,650 | |
FNMA | | | 7.50 | | | | 5-1-2038 | | | | 1,944 | | | | 1,959 | |
FNMA Series 2002-T12 Class A3 | | | 7.50 | | | | 5-25-2042 | | | | 6,527 | | | | 7,529 | |
FNMA Series 2003-W08 Class 4A ±± | | | 4.12 | | | | 11-25-2042 | | | | 151,183 | | | | 154,967 | |
FNMA Series 2003-W14 Class 2A ±± | | | 3.75 | | | | 6-25-2045 | | | | 115,268 | | | | 121,723 | |
FNMA Series 2003-W14 Class 2A ±± | | | 4.28 | | | | 1-25-2043 | | | | 274,344 | | | | 288,240 | |
FNMA Series 2004-W11 Class 1A3 | | | 7.00 | | | | 5-25-2044 | | | | 1,287,873 | | | | 1,486,776 | |
FNMA Series 2004-W15 Class 1A3 | | | 7.00 | | | | 8-25-2044 | | | | 629,025 | | | | 708,968 | |
GNMA | | | 3.00 | | | | 11-20-2045 | | | | 4,613,695 | | | | 4,525,461 | |
GNMA | | | 3.50 | | | | 9-20-2047 | | | | 3,713,817 | | | | 3,728,303 | |
GNMA | | | 3.50 | | | | 12-20-2047 | | | | 7,811,013 | | | | 7,841,481 | |
GNMA | | | 4.00 | | | | 12-20-2047 | | | | 4,818,502 | | | | 4,937,265 | |
GNMA | | | 5.00 | | | | 7-20-2040 | | | | 666,907 | | | | 717,577 | |
GNMA | | | 7.50 | | | | 12-15-2029 | | | | 675 | | | | 735 | |
GNMA Series 2008-22 Class XM ±±(c) | | | 0.96 | | | | 2-16-2050 | | | | 1,197,111 | | | | 29,860 | |
STRIPS ¤ | | | 0.00 | | | | 5-15-2036 | | | | 4,945,000 | | | | 2,896,829 | |
STRIPS ¤ | | | 0.00 | | | | 5-15-2044 | | | | 9,125,000 | | | | 4,197,771 | |
TVA | | | 5.88 | | | | 4-1-2036 | | | | 3,540,000 | | | | 4,622,164 | |
| | | | |
Total Agency Securities (Cost $137,633,702) | | | | | | | | | | | | | | | 136,663,594 | |
| | | | | | | | | | | | | | | | |
| | | | |
Asset-Backed Securities: 7.05% | | | | | | | | | | | | | | | | |
Ally Auto Receivables Trust Series 2015-2 Class A3 | | | 1.49 | | | | 11-15-2019 | | | | 118,040 | | | | 117,990 | |
CarMax Auto Owner Trust Series 2015-3 Class A3 | | | 1.63 | | | | 5-15-2020 | | | | 530,345 | | | | 529,232 | |
CCG Receivables Trust Series 2016-1 Class A2 144A | | | 1.69 | | | | 9-14-2022 | | | | 725,628 | | | | 722,556 | |
Citibank Credit Card Issuance Trust Series 2014-A6 Class A6 | | | 2.15 | | | | 7-15-2021 | | | | 2,650,000 | | | | 2,637,764 | |
Citibank Credit Card Issuance Trust Series 2016-A1 Class A1 | | | 1.75 | | | | 11-19-2021 | | | | 370,000 | | | | 365,401 | |
Dell Equipment Finance Trust Series 2017-2 Class A2B (1 Month LIBOR +0.30%) 144A± | | | 2.37 | | | | 2-24-2020 | | | | 1,060,652 | | | | 1,061,009 | |
Discover Card Execution Note Trust Series 2014 Class A4 | | | 2.12 | | | | 12-15-2021 | | | | 1,015,000 | | | | 1,010,997 | |
Educational Services of America Series 2015-1 Class A (1 Month LIBOR +0.80%) 144A± | | | 2.86 | | | | 10-25-2056 | | | | 1,212,475 | | | | 1,215,647 | |
Five Guys Funding LLC Series 17-1A Class A2 144A | | | 4.60 | | | | 7-25-2047 | | | | 1,597,925 | | | | 1,605,170 | |
GMF Floorplan Owner Revolving Trust Series 2016-1 Class A2 (1 Month LIBOR +0.85%) 144A± | | | 2.91 | | | | 5-17-2021 | | | | 2,105,000 | | | | 2,114,392 | |
Hertz Vehicle Financing LLC Series 2018-2A Class A 144A | | | 3.65 | | | | 6-27-2022 | | | | 1,600,000 | | | | 1,601,455 | |
Hyundai Auto Receivables Trust Series 2015-A Class A4 | | | 1.37 | | | | 7-15-2020 | | | | 330,925 | | | | 330,459 | |
Hyundai Auto Receivables Trust Series 2016-A Class A4 144A | | | 1.80 | | | | 12-16-2019 | | | | 1,629,176 | | | | 1,628,489 | |
Lendmark Funding Trust Series 2018-1A Class A 144A | | | 3.81 | | | | 12-21-2026 | | | | 2,085,000 | | | | 2,093,117 | |
MMAF Equipment Finance LLC Series 2017-AA Class A4 144A | | | 2.41 | | | | 8-16-2024 | | | | 1,975,000 | | | | 1,932,846 | |
Navient Student Loan Trust Series 2017-A Class A1 (1 Month LIBOR +0.40%) 144A± | | | 2.46 | | | | 12-16-2058 | | | | 1,344,284 | | | | 1,345,450 | |
Nissan Auto Lease Trust Series 2017-B Class A3 | | | 2.05 | | | | 9-15-2020 | | | | 1,625,000 | | | | 1,611,967 | |
OCP Collateralized Loan Obligation Limited Trust Series 2012-2A Class A1R (3 Month LIBOR +1.40%) 144A± | | | 3.71 | | | | 11-22-2025 | | | | 1,256,003 | | | | 1,257,069 | |
The accompanying notes are an integral part of these financial statements.
| | | | | | |
| Portfolio of investments—August 31, 2018 | | Wells Fargo Core Plus Bond Fund | | | 13 | |
| | | | | | | | | | | | | | | | |
| Security name | | Interest rate | | | Maturity date | | | Principal | | | Value | |
| | | | |
Asset-Backed Securities (continued) | | | | | | | | | | | | | | | | |
Octagon Investment Partners Series 2015-1A Class A1R (3 Month LIBOR +0.90%) 144A± | | | 3.21 | % | | | 5-21-2027 | | | $ | 3,000,000 | | | $ | 2,997,927 | |
Octagon Investment Partners Series 2017-1A Class B1 (3 Month LIBOR +1.70%) 144A± | | | 4.05 | | | | 7-20-2030 | | | | 1,000,000 | | | | 1,000,501 | |
SLM Student Loan Trust Series 2004-1 Class A4 (3 Month LIBOR +0.26%) ± | | | 2.60 | | | | 10-27-2025 | | | | 1,753,000 | | | | 1,753,389 | |
South Carolina Student Loan Corporation Series 2014-1 Class A1 (1 Month LIBOR +0.75%) ± | | | 2.83 | | | | 5-1-2030 | | | | 2,600,000 | | | | 2,611,432 | |
Student Loan Consolidation Center Series 2011-1 Class A (1 Month LIBOR +1.22%) 144A± | | | 3.28 | | | | 10-25-2027 | | | | 2,151,132 | | | | 2,174,131 | |
Towd Point Asset Trust Series 2018-SL1 Class A (1 Month LIBOR +0.60%) 144A± | | | 2.66 | | | | 1-25-2046 | | | | 3,738,807 | | | | 3,719,471 | |
Volvo Financial Equipment LLC Series 2018-AA (1 Month LIBOR +0.52%) 144A± | | | 2.58 | | | | 7-17-2023 | | | | 2,590,000 | | | | 2,597,284 | |
Wheels SPV LLC Series 2018-1A Class A2 144A | | | 3.06 | | | | 4-20-2027 | | | | 1,600,000 | | | | 1,600,846 | |
World Omni Auto Receivables Trust Series 2015-A Series A3 | | | 1.34 | | | | 5-15-2020 | | | | 73,738 | | | | 73,703 | |
| | | | |
Total Asset-Backed Securities (Cost $41,761,815) | | | | | | | | | | | | | | | 41,709,694 | |
| | | | | | | | | | | | | | | | |
| | | | |
Corporate Bonds and Notes: 17.07% | | | | | | | | | | | | | | | | |
| | | | |
Consumer Discretionary: 1.66% | | | | | | | | | | | | | | | | |
| | | | |
| Internet & Direct Marketing Retail: 0.15% | | | | | | | | | | | | | | | | |
Amazon.com Incorporated | | | 4.95 | | | | 12-5-2044 | | | | 815,000 | | | | 922,715 | |
| | | | | | | | | | | | | | | | |
| | | | |
| Media: 1.01% | | | | | | | | | | | | | | | | |
CCO Holdings LLC 144A | | | 5.13 | | | | 5-1-2027 | | | | 1,300,000 | | | | 1,239,875 | |
Charter Communications Operating LLC | | | 4.20 | | | | 3-15-2028 | | | | 1,100,000 | | | | 1,049,024 | |
Charter Communications Operating LLC | | | 6.48 | | | | 10-23-2045 | | | | 655,000 | | | | 698,295 | |
Discovery Communications LLC | | | 3.95 | | | | 3-20-2028 | | | | 1,695,000 | | | | 1,612,477 | |
Discovery Communications LLC | | | 6.35 | | | | 6-1-2040 | | | | 550,000 | | | | 602,338 | |
SES Global Americas Holding Company 144A | | | 5.30 | | | | 3-25-2044 | | | | 880,000 | | | | 768,461 | |
| | | | |
| | | | | | | | | | | | | | | 5,970,470 | |
| | | | | | | | | | | | | | | | |
| | | | |
| Multiline Retail: 0.16% | | | | | | | | | | | | | | | | |
Macy’s Retail Holdings Incorporated | | | 3.45 | | | | 1-15-2021 | | | | 940,000 | | | | 934,652 | |
| | | | | | | | | | | | | | | | |
| | | | |
| Specialty Retail: 0.34% | | | | | | | | | | | | | | | | |
Asbury Automotive Group Incorporated | | | 6.00 | | | | 12-15-2024 | | | | 1,000,000 | | | | 1,002,500 | |
Group 1 Automotive Incorporated | | | 5.00 | | | | 6-1-2022 | | | | 1,010,000 | | | | 999,900 | |
| | | | |
| | | | | | | | | | | | | | | 2,002,400 | |
| | | | | | | | | | | | | | | | |
| | | | |
Consumer Staples: 0.70% | | | | | | | | | | | | | | | | |
| | | | |
| Beverages: 0.30% | | | | | | | | | | | | | | | | |
Anheuser-Busch InBev Worldwide Incorporated | | | 4.60 | | | | 4-15-2048 | | | | 1,810,000 | | | | 1,777,765 | |
| | | | | | | | | | | | | | | | |
| | | | |
| Tobacco: 0.40% | | | | | | | | | | | | | | | | |
Philip Morris International Incorporated | | | 1.38 | | | | 2-25-2019 | | | | 2,400,000 | | | | 2,386,620 | |
| | | | | | | | | | | | | | | | |
| | | | |
Energy: 0.56% | | | | | | | | | | | | | | | | |
| | | | |
| Energy Equipment & Services: 0.11% | | | | | | | | | | | | | | | | |
Oceaneering International Incorporated | | | 6.00 | | | | 2-1-2028 | | | | 680,000 | | | | 674,772 | |
| | | | | | | | | | | | | | | | |
The accompanying notes are an integral part of these financial statements.
| | | | |
| 14 | | Wells Fargo Core Plus Bond Fund | | Portfolio of investments—August 31, 2018 |
| | | | | | | | | | | | | | | | |
| Security name | | Interest rate | | | Maturity date | | | Principal | | | Value | |
| | | | |
| Oil, Gas & Consumable Fuels: 0.45% | | | | | | | | | | | | | | | | |
Energy Transfer Partners LP | | | 6.13 | % | | | 12-15-2045 | | | $ | 1,330,000 | | | $ | 1,405,863 | |
SemGroup Corporation | | | 7.25 | | | | 3-15-2026 | | | | 875,000 | | | | 870,625 | |
Ultra Resources Incorporated 144A | | | 6.88 | | | | 4-15-2022 | | | | 750,000 | | | | 365,625 | |
| | | | |
| | | | | | | | | | | | | | | 2,642,113 | |
| | | | | | | | | | | | | | | | |
| | | | |
Financials: 6.94% | | | | | | | | | | | | | | | | |
| | | | |
| Banks: 2.09% | | | | | | | | | | | | | | | | |
Bank of America Corporation (3 Month LIBOR +0.94%) ± | | | 3.86 | | | | 7-23-2024 | | | | 1,310,000 | | | | 1,316,017 | |
Bank of America Corporation | | | 3.95 | | | | 4-21-2025 | | | | 1,170,000 | | | | 1,151,132 | |
Bank of America Corporation (3 Month LIBOR +3.90%) ± | | | 6.10 | | | | 12-29-2049 | | | | 1,290,000 | | | | 1,358,693 | |
BBVA Bancomer SA of Texas 144A | | | 7.25 | | | | 4-22-2020 | | | | 1,000,000 | | | | 1,042,500 | |
Huntington National Bank | | | 2.20 | | | | 11-6-2018 | | | | 1,985,000 | | | | 1,984,347 | |
JPMorgan Chase & Company | | | 2.97 | | | | 1-15-2023 | | | | 2,550,000 | | | | 2,496,852 | |
JPMorgan Chase & Company (3 Month LIBOR +3.25%) ± | | | 5.15 | | | | 12-29-2049 | | | | 1,370,000 | | | | 1,366,575 | |
PNC Financial Services (3 Month LIBOR +3.30%) ± | | | 5.00 | | | | 12-29-2049 | | | | 565,000 | | | | 565,000 | |
Santander Holdings USA Incorporated | | | 3.70 | | | | 3-28-2022 | | | | 1,125,000 | | | | 1,116,861 | �� |
| | | | |
| | | | | | | | | | | | | | | 12,397,977 | |
| | | | | | | | | | | | | | | | |
| | | | |
| Capital Markets: 1.57% | | | | | | | | | | | | | | | | |
Blackstone Holdings Finance Company LLC 144A | | | 5.00 | | | | 6-15-2044 | | | | 1,015,000 | | | | 1,049,188 | |
Goldman Sachs Group Incorporated (3 Month LIBOR +0.82%) ± | | | 2.88 | | | | 10-31-2022 | | | | 1,910,000 | | | | 1,867,793 | |
Goldman Sachs Group Incorporated | | | 5.15 | | | | 5-22-2045 | | | | 1,100,000 | | | | 1,124,481 | |
Goldman Sachs Group Incorporated (3 Month LIBOR +3.83%) ± | | | 5.30 | | | | 12-29-2049 | | | | 1,100,000 | | | | 1,100,550 | |
Morgan Stanley (3 Month LIBOR +0.85%) ± | | | 3.74 | | | | 4-24-2024 | | | | 4,155,000 | | | | 4,138,698 | |
| | | | |
| | | | | | | | | | | | | | | 9,280,710 | |
| | | | | | | | | | | | | | | | |
| | | | |
| Consumer Finance: 1.20% | | | | | | | | | | | | | | | | |
ERAC USA Finance LLC 144A | | | 4.50 | | | | 2-15-2045 | | | | 1,695,000 | | | | 1,623,610 | |
PACCAR Financial Corporation | | | 2.30 | | | | 8-10-2022 | | | | 3,000,000 | | | | 2,899,542 | |
Synchrony Financial | | | 3.95 | | | | 12-1-2027 | | | | 2,800,000 | | | | 2,551,240 | |
| | | | |
| | | | | | | | | | | | | | | 7,074,392 | |
| | | | | | | | | | | | | | | | |
| | | | |
| Diversified Financial Services: 0.99% | | | | | | | | | | | | | | | | |
Brookfield Finance LLC | | | 4.00 | | | | 4-1-2024 | | | | 2,005,000 | | | | 1,998,541 | |
Daimler Finance NA LLC 144A | | | 1.75 | | | | 10-30-2019 | | | | 2,215,000 | | | | 2,182,967 | |
LPL Holdings Incorporated 144A | | | 5.75 | | | | 9-15-2025 | | | | 600,000 | | | | 586,500 | |
Silversea Cruise Finance Limited 144A | | | 7.25 | | | | 2-1-2025 | | | | 1,015,000 | | | | 1,102,544 | |
| | | | |
| | | | | | | | | | | | | | | 5,870,552 | |
| | | | | | | | | | | | | | | | |
| | | | |
| Insurance: 1.09% | | | | | | | | | | | | | | | | |
Brighthouse Financial Incorporated | | | 4.70 | | | | 6-22-2047 | | | | 1,345,000 | | | | 1,124,336 | |
Guardian Life Insurance Company 144A | | | 4.85 | | | | 1-24-2077 | | | | 1,045,000 | | | | 1,040,482 | |
National Life Insurance Company (3 Month LIBOR +3.31%) 144A± | | | 5.25 | | | | 7-19-2068 | | | | 1,668,000 | | | | 1,654,917 | |
PartnerRe Finance II Incorporated (3 Month LIBOR +2.33%) ± | | | 4.63 | | | | 12-1-2066 | | | | 1,345,000 | | | | 1,129,800 | |
Transatlantic Holdings Incorporated | | | 8.00 | | | | 11-30-2039 | | | | 1,100,000 | | | | 1,524,620 | |
| | | | |
| | | | | | | | | | | | | | | 6,474,155 | |
| | | | | | | | | | | | | | | | |
The accompanying notes are an integral part of these financial statements.
| | | | | | |
| Portfolio of investments—August 31, 2018 | | Wells Fargo Core Plus Bond Fund | | | 15 | |
| | | | | | | | | | | | | | | | |
| Security name | | Interest rate | | | Maturity date | | | Principal | | | Value | |
| | | | |
Health Care: 0.83% | | | | | | | | | | | | | | | | |
| | | | |
| Health Care Providers & Services: 0.83% | | | | | | | | | | | | | | | | |
CHS Incorporated « | | | 5.13 | % | | | 8-1-2021 | | | $ | 1,000,000 | | | $ | 965,000 | |
CVS Health Corporation | | | 4.78 | | | | 3-25-2038 | | | | 2,100,000 | | | | 2,089,062 | |
Highmark Incorporated 144A | | | 6.13 | | | | 5-15-2041 | | | | 710,000 | | | | 777,810 | |
Tenet Healthcare Corporation | | | 6.00 | | | | 10-1-2020 | | | | 1,010,000 | | | | 1,049,138 | |
| | | | |
| | | | | | | | | | | | | | | 4,881,010 | |
| | | | | | | | | | | | | | | | |
| | | | |
Industrials: 0.86% | | | | | | | | | | | | | | | | |
| | | | |
| Transportation Infrastructure: 0.86% | | | | | | | | | | | | | | | | |
Toll Road Investors Partnership II LP 144A¤ | | | 0.00 | | | | 2-15-2027 | | | | 1,050,000 | | | | 656,329 | |
Toll Road Investors Partnership II LP 144A¤ | | | 0.00 | | | | 2-15-2026 | | | | 5,630,000 | | | | 3,779,332 | |
Toll Road Investors Partnership II LP 144A¤ | | | 0.00 | | | | 2-15-2028 | | | | 1,150,000 | | | | 677,875 | |
| | | | |
| | | | | | | | | | | | | | | 5,113,536 | |
| | | | | | | | | | | | | | | | |
| | | | |
Information Technology: 0.59% | | | | | | | | | | | | | | | | |
| | | | |
| Semiconductors & Semiconductor Equipment: 0.18% | | | | | | | | | | | | | | | | |
Broadcom Corporation | | | 2.65 | | | | 1-15-2023 | | | | 1,115,000 | | | | 1,054,817 | |
| | | | | | | | | | | | | | | | |
| | | | |
| Software: 0.17% | | | | | | | | | | | | | | | | |
Citrix Systems Incorporated | | | 4.50 | | | | 12-1-2027 | | | | 1,045,000 | | | | 1,015,735 | |
| | | | | | | | | | | | | | | | |
| | | | |
| Technology Hardware, Storage & Peripherals: 0.24% | | | | | | | | | | | | | | | | |
Diamond 1 Finance Corporation 144A | | | 8.35 | | | | 7-15-2046 | | | | 1,175,000 | | | | 1,438,737 | |
| | | | | | | | | | | | | | | | |
| | | | |
Materials: 0.76% | | | | | | | | | | | | | | | | |
| | | | |
| Chemicals: 0.40% | | | | | | | | | | | | | | | | |
The Chemours Company | | | 4.00 | | | | 5-15-2026 | | | | 2,000,000 | | | | 2,338,679 | |
| | | | | | | | | | | | | | | | |
| | | | |
| Containers & Packaging: 0.36% | | | | | | | | | | | | | | | | |
Silgan Holdings Incorporated | | | 3.25 | | | | 3-15-2025 | | | | 1,800,000 | | | | 2,145,136 | |
| | | | | | | | | | | | | | | | |
| | | | |
Real Estate: 1.67% | | | | | | | | | | | | | | | | |
| | | | |
| Equity REITs: 1.29% | | | | | | | | | | | | | | | | |
Federal Realty Investment Trust | | | 3.63 | | | | 8-1-2046 | | | | 915,000 | | | | 802,698 | |
Iron Mountain Incorporated 144A | | | 3.00 | | | | 1-15-2025 | | | | 2,000,000 | | | | 2,292,829 | |
Omega Healthcare Investors Incorporated | | | 4.50 | | | | 1-15-2025 | | | | 2,130,000 | | | | 2,108,493 | |
Simon Property Group LP | | | 2.20 | | | | 2-1-2019 | | | | 2,400,000 | | | | 2,397,408 | |
| | | | |
| | | | | | | | | | | | | | | 7,601,428 | |
| | | | | | | | | | | | | | | | |
| | | | |
| Real Estate Management & Development: 0.38% | | | | | | | | | | | | | | | | |
Washington Prime Group | | | 3.85 | | | | 4-1-2020 | | | | 2,275,000 | | | | 2,253,176 | |
| | | | | | | | | | | | | | | | |
| | | | |
Telecommunication Services: 1.78% | | | | | | | | | | | | | | | | |
| | | | |
| Diversified Telecommunication Services: 0.89% | | | | | | | | | | | | | | | | |
AT&T Incorporated | | | 4.75 | | | | 5-15-2046 | | | | 1,075,000 | | | | 969,702 | |
AT&T Incorporated 144A | | | 5.15 | | | | 2-15-2050 | | | | 610,000 | | | | 568,298 | |
AT&T Incorporated | | | 5.25 | | | | 3-1-2037 | | | | 1,070,000 | | | | 1,060,949 | |
The accompanying notes are an integral part of these financial statements.
| | | | |
| 16 | | Wells Fargo Core Plus Bond Fund | | Portfolio of investments—August 31, 2018 |
| | | | | | | | | | | | | | | | |
| Security name | | Interest rate | | | Maturity date | | | Principal | | | Value | |
| | | | |
| Diversified Telecommunication Services (continued) | | | | | | | | | | | | | | | | |
AT&T Incorporated | | | 5.65 | % | | | 2-15-2047 | | | $ | 1,050,000 | | | $ | 1,065,659 | |
Verizon Communications Incorporated | | | 5.01 | | | | 4-15-2049 | | | | 882,000 | | | | 884,660 | |
Verizon Communications Incorporated | | | 5.50 | | | | 3-16-2047 | | | | 675,000 | | | | 727,779 | |
| | | | |
| | | | | | | | | | | | | | | 5,277,047 | |
| | | | | | | | | | | | | | | | |
| | | | |
| Wireless Telecommunication Services: 0.89% | | | | | | | | | | | | | | | | |
Crown Castle Towers LLC 144A | | | 3.22 | | | | 5-15-2042 | | | | 2,600,000 | | | | 2,570,100 | |
SBA Tower Trust 144A | | | 3.72 | | | | 4-9-2048 | | | | 1,968,000 | | | | 1,950,664 | |
Sprint Capital Corporation | | | 6.88 | | | | 11-15-2028 | | | | 750,000 | | | | 744,375 | |
| | | | |
| | | | | | | | | | | | | | | 5,265,139 | |
| | | | | | | | | | | | | | | | |
| | | | |
Utilities: 0.72% | | | | | | | | | | | | | | | | |
| | | | |
| Electric Utilities: 0.53% | | | | | | | | | | | | | | | | |
Basin Electric Power Cooperative 144A | | | 4.75 | | | | 4-26-2047 | | | | 1,315,000 | | | | 1,361,657 | |
Southern California Edison Company | | | 4.13 | | | | 3-1-2048 | | | | 1,835,000 | | | | 1,775,364 | |
| | | | |
| | | | | | | | | | | | | | | 3,137,021 | |
| | | | | | | | | | | | | | | | |
| | | | |
| Independent Power & Renewable Electricity Producers: 0.19% | | | | | | | | | | | | | | | | |
Harper Lake Solar Funding Corporation 144A | | | 7.65 | | | | 12-31-2018 | | | | 310,724 | | | | 313,831 | |
Tri-State Generation and Transmission Association Incorporated | | | 4.25 | | | | 6-1-2046 | | | | 850,000 | | | | 776,341 | |
| | | | |
| | | | | | | | | | | | | | | 1,090,172 | |
| | | | | | | | | | | | | | | | |
| | | | |
Total Corporate Bonds and Notes (Cost $101,696,042) | | | | | | | | | | | | | | | 101,020,926 | |
| | | | | | | | | | | | | | | | |
| | | | |
| | | | | | | | | Shares | | | | |
| Exchange-Traded Funds: 2.04% | | | | | | | | | | | | | | | | |
iShares iBoxx $ Investment Grade Corporate Bond ETF | | | | | | | | | | | 104,500 | | | | 12,063,480 | |
| | | | | | | | | | | | | | | | |
| | | | |
Total Exchange-Traded Funds (Cost $11,998,690) | | | | | | | | | | | | | | | 12,063,480 | |
| | | | | | | | | | | | | | | | |
| | | | |
| | | | | | | | | Principal | | | | |
| Foreign Corporate Bonds and Notes @: 3.95% | | | | | | | | | | | | | | | | |
| | | | |
Consumer Discretionary: 2.00% | | | | | | | | | | | | | | | | |
| | | | |
| Auto Components: 0.24% | | | | | | | | | | | | | | | | |
HP Pelzer Holding GmbH (EUR) 144A | | | 4.13 | | | | 4-1-2024 | | | | 1,200,000 | | | | 1,398,123 | |
| | | | | | | | | | | | | | | | |
| | | | |
| Automobiles: 0.84% | | | | | | | | | | | | | | | | |
Peugeot SA Company (EUR) | | | 2.00 | | | | 3-20-2025 | | | | 1,800,000 | | | | 2,084,862 | |
Volvo Car AB (EUR) | | | 2.00 | | | | 1-24-2025 | | | | 2,500,000 | | | | 2,872,531 | |
| | | | |
| | | | | | | | | | | | | | | 4,957,393 | |
| | | | | | | | | | | | | | | | |
| | | | |
| Hotels, Restaurants & Leisure: 0.24% | | | | | | | | | | | | | | | | |
Snaitech SpA (EUR) 144A | | | 6.38 | | | | 11-7-2021 | | | | 1,200,000 | | | | 1,448,477 | |
| | | | | | | | | | | | | | | | |
| | | | |
| Internet & Direct Marketing Retail: 0.32% | | | | | | | | | | | | | | | | |
Selecta Group BV (EUR) 144A | | | 5.88 | | | | 2-1-2024 | | | | 1,650,000 | | | | 1,908,055 | |
| | | | | | | | | | | | | | | | |
The accompanying notes are an integral part of these financial statements.
| | | | | | |
| Portfolio of investments—August 31, 2018 | | Wells Fargo Core Plus Bond Fund | | | 17 | |
| | | | | | | | | | | | | | | | |
| Security name | | Interest rate | | | Maturity date | | | Principal | | | Value | |
| | | | |
| Media: 0.36% | | | | | | | | | | | | | | | | |
Altice SA (EUR) 144A | | | 7.25 | % | | | 5-15-2022 | | | | 1,800,000 | | | $ | 2,102,993 | |
| | | | | | | | | | | | | | | | |
| | | | |
Energy: 0.91% | | | | | | | | | | | | | | | | |
| | | | |
| Oil, Gas & Consumable Fuels: 0.91% | | | | | | | | | | | | | | | | |
Petroleos Mexicanos (EUR) | | | 3.75 | | | | 2-21-2024 | | | | 1,000,000 | | | | 1,190,278 | |
Raffinerie Heide GmbH (EUR) 144A | | | 6.38 | | | | 12-1-2022 | | | | 1,500,000 | | | | 1,687,690 | |
Total SA (5 Year EUR Swap +3.78%)(EUR) ± | | | 3.88 | | | | 12-29-2049 | | | | 2,000,000 | | | | 2,501,091 | |
| | | | |
| | | | | | | | | | | | | | | 5,379,059 | |
| | | | | | | | | | | | | | | | |
| | | | |
Financials: 0.45% | | | | | | | | | | | | | | | | |
| | | | |
| Banks: 0.09% | | | | | | | | | | | | | | | | |
ATF Netherlands BV (EUR) | | | 1.50 | | | | 7-15-2024 | | | | 500,000 | | | | 576,893 | |
| | | | | | | | | | | | | | | | |
| | | | |
| Diversified Financial Services: 0.36% | | | | | | | | | | | | | | | | |
LKQ European Holdings BV Company (EUR) 144A | | | 3.63 | | | | 4-1-2026 | | | | 1,800,000 | | | | 2,120,690 | |
| | | | | | | | | | | | | | | | |
| | | | |
Industrials: 0.59% | | | | | | | | | | | | | | | | |
| | | | |
| Commercial Services & Supplies: 0.24% | | | | | | | | | | | | | | | | |
Paprec Holding SA (EUR) 144A | | | 4.00 | | | | 3-31-2025 | | | | 1,200,000 | | | | 1,406,506 | |
| | | | | | | | | | | | | | | | |
| | | | |
| Road & Rail: 0.35% | | | | | | | | | | | | | | | | |
Europcar Groupe SA (EUR) 144A | | | 4.13 | | | | 11-15-2024 | | | | 1,800,000 | | | | 2,089,726 | |
| | | | | | | | | | | | | | | | |
| | |
Total Foreign Corporate Bonds and Notes (Cost $23,962,526) | | | | | | | | 23,387,915 | |
| | | | | | | | | | | | | | | | |
| | | | |
Foreign Government Bonds @: 1.51% | | | | | | | | | | | | | | | | |
Brazil (BRL) | | | 10.00 | | | | 1-1-2025 | | | | 8,600,000 | | | | 1,942,808 | |
Brazil (BRL) | | | 10.00 | | | | 1-1-2027 | | | | 4,700,000 | | | | 1,028,758 | |
Indonesia (IDR) | | | 7.88 | | | | 4-15-2019 | | | | 25,000,000,000 | | | | 1,698,914 | |
Italy (EUR) 144A | | | 4.75 | | | | 9-1-2028 | | | | 2,500,000 | | | | 3,250,082 | |
Mexico (MXN) | | | 6.50 | | | | 6-9-2022 | | | | 20,000,000 | | | | 999,914 | |
| | | | |
Total Foreign Government Bonds (Cost $10,567,585) | | | | | | | | | | | | | | | 8,920,476 | |
| | | | | | | | | | | | | | | | |
| | | | |
Loans: 2.88% | | | | | | | | | | | | | | | | |
| | | | |
Consumer Discretionary: 0.11% | | | | | | | | | | | | | | | | |
| | | | |
| Media: 0.11% | | | | | | | | | | | | | | | | |
CSC Holdings LLC (1 Month LIBOR +2.50%) ± | | | 4.56 | | | | 1-25-2026 | | | $ | 626,430 | | | | 626,587 | |
| | | | | | | | | | | | | | | | |
| | | | |
Energy: 0.36% | | | | | | | | | | | | | | | | |
| | | | |
| Oil, Gas & Consumable Fuels: 0.36% | | | | | | | | | | | | | | | | |
Lucid Energy Group II Borrower LLC (1 Month LIBOR +3.00%) ± | | | 5.08 | | | | 2-17-2025 | | | | 1,246,875 | | | | 1,226,613 | |
Traverse Midstream Partners LLC (3 Month LIBOR +4.00%) ± | | | 6.34 | | | | 9-27-2024 | | | | 935,000 | | | | 938,506 | |
| | | | |
| | | | | | | | | | | | | | | 2,165,119 | |
| | | | | | | | | | | | | | | | |
| | | | |
Financials: 0.15% | | | | | | | | | | | | | | | | |
| | | | |
| Insurance: 0.15% | | | | | | | | | | | | | | | | |
Hub International Limited (2 Month LIBOR +3.00%) ± | | | 5.33 | | | | 4-25-2025 | | | | 880,000 | | | | 878,847 | |
| | | | | | | | | | | | | | | | |
The accompanying notes are an integral part of these financial statements.
| | | | |
| 18 | | Wells Fargo Core Plus Bond Fund | | Portfolio of investments—August 31, 2018 |
| | | | | | | | | | | | | | | | |
| Security name | | Interest rate | | | Maturity date | | | Principal | | | Value | |
| | | | |
Health Care: 0.47% | | | | | | | | | | | | | | | | |
| | | | |
| Health Care Providers & Services: 0.21% | | | | | | | | | | | | | | | | |
Surgery Center Holdings Incorporated (3 Month LIBOR +3.25%) ± | | | 5.57 | % | | | 9-2-2024 | | | $ | 1,240,625 | | | $ | 1,238,553 | |
| | | | | | | | | | | | | | | | |
| | | | |
| Health Care Technology: 0.21% | | | | | | | | | | | | | | | | |
Emerald Bidco Incorporated (1 Month LIBOR +2.75%) ± | | | 4.83 | | | | 10-23-2023 | | | | 1,231,250 | | | | 1,233,171 | |
| | | | | | | | | | | | | | | | |
| | | | |
| Pharmaceuticals: 0.05% | | | | | | | | | | | | | | | | |
Valeant Pharmaceuticals International Incorporated (1 Month LIBOR +3.00%) ± | | | 5.08 | | | | 6-2-2025 | | | | 306,125 | | | | 307,092 | |
| | | | | | | | | | | | | | | | |
| | | | |
Industrials: 0.73% | | | | | | | | | | | | | | | | |
| | | | |
| Aerospace & Defense: 0.21% | | | | | | | | | | | | | | | | |
TransDigm Incorporated (1 Month LIBOR +2.50%) ± | | | 4.58 | | | | 5-30-2025 | | | | 1,225,700 | | | | 1,222,440 | |
| | | | | | | | | | | | | | | | |
| | | | |
| Commercial Services & Supplies: 0.31% | | | | | | | | | | | | | | | | |
KAR Auction Services Incorporated (1 Month LIBOR +2.25%) ± | | | 4.38 | | | | 3-11-2021 | | | | 1,231,710 | | | | 1,233,767 | |
Wrangler Buyer Corporation (1 Month LIBOR +2.75%) ± | | | 4.83 | | | | 9-27-2024 | | | | 621,875 | | | | 624,673 | |
| | | | |
| | | | | | | | | | | | | | | 1,858,440 | |
| | | | | | | | | | | | | | | | |
| | | | |
| Communications Equipment: 0.21% | | | | | | | | | | | | | | | | |
Virgin Media Bristol LLC (1 Month LIBOR +2.50%) ± | | | 4.56 | | | | 1-15-2026 | | | | 1,250,000 | | | | 1,249,150 | |
| | | | | | | | | | | | | | | | |
| | | | |
Information Technology: 0.53% | | | | | | | | | | | | | | | | |
| | | | |
| Internet Software & Services: 0.36% | | | | | | | | | | | | | | | | |
Ancestry.com Incorporated (1 Month LIBOR +3.25%) ± | | | 5.33 | | | | 10-19-2023 | | | | 1,221,875 | | | | 1,222,180 | |
Match Group Incorporated (1 Month LIBOR +2.50%) ±‡ | | | 4.58 | | | | 11-16-2022 | | | | 880,000 | | | | 884,400 | |
| | | | |
| | | | | | | | | | | | | | | 2,106,580 | |
| | | | | | | | | | | | | | | | |
| | | | |
| IT Services: 0.17% | | | | | | | | | | | | | | | | |
First Data Corporation (1 Month LIBOR +2.00%) ± | | | 4.07 | | | | 7-8-2022 | | | | 1,026,388 | | | | 1,025,690 | |
| | | | | | | | | | | | | | | | |
| | | | |
Materials: 0.32% | | | | | | | | | | | | | | | | |
| | | | |
| Containers & Packaging: 0.32% | | | | | | | | | | | | | | | | |
Berry Plastics Group Incorporated (2 Month LIBOR +1.75%) ± | | | 3.94 | | | | 2-8-2020 | | | | 871,460 | | | | 870,763 | |
Consolidated Container Company LLC (1 Month LIBOR +2.75%) ± | | | 4.83 | | | | 5-22-2024 | | | | 297,754 | | | | 297,977 | |
Flex Acquisition Company Incorporated (3 Month LIBOR +3.25%) ± | | | 5.75 | | | | 6-29-2025 | | | | 750,000 | | | | 749,063 | |
| | | | |
| | | | | | | | | | | | | | | 1,917,803 | |
| | | | | | | | | | | | | | | | |
| | | | |
Telecommunication Services: 0.21% | | | | | | | | | | | | | | | | |
| | | | |
| Wireless Telecommunication Services: 0.21% | | | | | | | | | | | | | | | | |
Sprint Communications Incorporated (1 Month LIBOR +2.50%) ± | | | 4.63 | | | | 2-2-2024 | | | | 1,234,375 | | | | 1,234,375 | |
| | | | | | | | | | | | | | | | |
| | | | |
Total Loans (Cost $17,099,348) | | | | | | | | | | | | | | | 17,063,847 | |
| | | | | | | | | | | | | | | | |
| | | | |
Municipal Obligations: 4.42% | | | | | | | | | | | | | | | | |
| | | | |
California: 0.58% | | | | | | | | | | | | | | | | |
| | | | |
| Airport Revenue: 0.36% | | | | | | | | | | | | | | | | |
San Jose CA Series B (AGM Insured) | | | 6.60 | | | | 3-1-2041 | | | | 2,000,000 | | | | 2,148,640 | |
| | | | | | | | | | | | | | | | |
The accompanying notes are an integral part of these financial statements.
| | | | | | |
| Portfolio of investments—August 31, 2018 | | Wells Fargo Core Plus Bond Fund | | | 19 | |
| | | | | | | | | | | | | | | | |
| Security name | | Interest rate | | | Maturity date | | | Principal | | | Value | |
| | | | |
| Transportation Revenue: 0.22% | | | | | | | | | | | | | | | | |
Alameda CA Corridor Transportation Authority CAB Refunding Bond Subordinated Series B (Ambac Insured) ¤ | | | 0.00 | % | | | 10-1-2028 | | | $ | 2,115,000 | | | $ | 1,309,650 | |
| | | | | | | | | | | | | | | | |
| | | | |
| | | | | | | | | | | | | | | 3,458,290 | |
| | | | | | | | | | | | | | | | |
| | | | |
Illinois: 1.49% | | | | | | | | | | | | | | | | |
| | | | |
| GO Revenue: 0.98% | | | | | | | | | | | | | | | | |
Chicago IL | | | 5.43 | | | | 1-1-2042 | | | | 1,000,000 | | | | 922,990 | |
Chicago IL Series B | | | 7.38 | | | | 1-1-2033 | | | | 1,125,000 | | | | 1,275,694 | |
Cook County IL Series B (Build America Mutual Assurance Company Insured) | | | 6.36 | | | | 11-15-2033 | | | | 1,745,000 | | | | 2,164,673 | |
Will County IL Community High School District (AGM Insured) ¤ | | | 0.00 | | | | 1-1-2025 | | | | 1,820,000 | | | | 1,456,073 | |
| | | | |
| | | | | | | | | | | | | | | 5,819,430 | |
| | | | | | | | | | | | | | | | |
| | | | |
| Tax Revenue: 0.51% | | | | | | | | | | | | | | | | |
Chicago IL Transit Authority Taxable Pension Funding Series A | | | 6.90 | | | | 12-1-2040 | | | | 1,075,000 | | | | 1,384,751 | |
Metropolitan Pier & Exposition Authority Illinois CAB McCormick Place Expansion Project Series 2010-B1 (AGM Insured) ¤ | | | 0.00 | | | | 6-15-2026 | | | | 1,975,000 | | | | 1,473,706 | |
Metropolitan Pier & Exposition Authority Illinois CAB McCormick Place Expansion Project Series 2012-B ¤ | | | 0.00 | | | | 12-15-2051 | | | | 765,000 | | | | 147,653 | |
| | | | |
| | | | | | | | | | | | | | | 3,006,110 | |
| | | | | | | | | | | | | | | | |
| | | | |
| | | | | | | | | | | | | | | 8,825,540 | |
| | | | | | | | | | | | | | | | |
| | | | |
Maryland: 0.16% | | | | | | | | | | | | | | | | |
| | | | |
| Education Revenue: 0.16% | | | | | | | | | | | | | | | | |
Maryland Health & HEFAR Green Street Academy Series B 144A | | | 6.75 | | | | 7-1-2023 | | | | 975,000 | | | | 957,704 | |
| | | | | | | | | | | | | | | | |
| | | | |
Michigan: 0.35% | | | | | | | | | | | | | | | | |
| | | | |
| Miscellaneous Revenue: 0.35% | | | | | | | | | | | | | | | | |
Michigan Finance Authority Local Government Loan Program Project Series E | | | 7.19 | | | | 11-1-2022 | | | | 1,915,000 | | | | 2,057,208 | |
| | | | | | | | | | | | | | | | |
| | | | |
New Jersey: 0.88% | | | | | | | | | | | | | | | | |
| | | | |
| Miscellaneous Revenue: 0.88% | | | | | | | | | | | | | | | | |
New Jersey EDA Series B (AGM Insured) ¤ | | | 0.00 | | | | 2-15-2019 | | | | 4,250,000 | | | | 4,194,793 | |
New Jersey EDA Series B | | | 3.29 | | | | 7-1-2019 | | | | 1,000,000 | | | | 1,000,450 | |
| | | | |
| | | | | | | | | | | | | | | 5,195,243 | |
| | | | | | | | | | | | | | | | |
| | | | |
| | | | | | | | | | | | | | | 5,195,243 | |
| | | | | | | | | | | | | | | | |
| | | | |
New York: 0.18% | | | | | | | | | | | | | | | | |
| | | | |
| GO Revenue: 0.18% | | | | | | | | | | | | | | | | |
Oyster Bay NY | | | 3.55 | | | | 2-1-2019 | | | | 1,085,000 | | | | 1,086,085 | |
| | | | | | | | | | | | | | | | |
| | | | |
Pennsylvania: 0.49% | | | | | | | | | | | | | | | | |
| | | | |
| Health Revenue: 0.15% | | | | | | | | | | | | | | | | |
Quakertown PA General Authority USDA Loan Anticipation Notes Series 2017-B | | | 3.80 | | | | 7-1-2021 | | | | 900,000 | | | | 888,849 | |
| | | | | | | | | | | | | | | | |
The accompanying notes are an integral part of these financial statements.
| | | | |
| 20 | | Wells Fargo Core Plus Bond Fund | | Portfolio of investments—August 31, 2018 |
| | | | | | | | | | | | | | | | |
| Security name | | Interest rate | | | Maturity date | | | Principal | | | Value | |
| | | | |
| Miscellaneous Revenue: 0.34% | | | | | | | | | | | | | | | | |
Commonwealth of Pennsylvania Financing Authority Series A | | | 4.14 | % | | | 6-1-2038 | | | $ | 1,995,000 | | | $ | 2,001,823 | |
| | | | | | | | | | | | | | | | |
| | | | |
| | | | | | | | | | | | | | | 2,890,672 | |
| | | | | | | | | | | | | | | | |
| | | | |
Texas: 0.29% | | | | | | | | | | | | | | | | |
| | | | |
| Transportation Revenue: 0.29% | | | | | | | | | | | | | | | | |
North Texas Tollway Authority Build America Bonds Subordinate Lien Series B-2 | | | 8.91 | | | | 2-1-2030 | | | | 1,595,000 | | | | 1,719,171 | |
| | | | | | | | | | | | | | | | |
| | | | |
Total Municipal Obligations (Cost $25,138,670) | | | | | | | | | | | | | | | 26,189,913 | |
| | | | | | | | | | | | | | | | |
| | | | |
Non-Agency Mortgage-Backed Securities: 8.65% | | | | | | | | | | | | | | | | |
American Money Management Corporation Series 2015-16A Class AR (3 Month LIBOR +1.26%) 144A± | | | 3.60 | | | | 4-14-2029 | | | | 3,000,000 | | | | 3,002,361 | |
Arbor Realty Collateralized Series 2016-FL Class A (1 Month LIBOR +1.70%) 144A± | | | 3.76 | | | | 9-15-2026 | | | | 1,000,000 | | | | 1,006,807 | |
Banc of America Commercial Mortgage Securities Incorporated Series 2007-1 Class AMFX ±± | | | 5.48 | | | | 1-15-2049 | | | | 778,703 | | | | 781,843 | |
Banc of America Funding Corporation Series 2016-R1 Class A1 144A±± | | | 2.50 | | | | 3-25-2040 | | | | 897,621 | | | | 871,941 | |
BSPRT Commercial Mortgage Backed Series 2017-FL1 (1 Month LIBOR +1.35%) 144A± | | | 3.41 | | | | 6-15-2027 | | | | 1,330,371 | | | | 1,342,335 | |
BX Trust 2017 Series A (1 Month LIBOR +1.05%) 144A± | | | 3.11 | | | | 10-15-2032 | | | | 2,860,000 | | | | 2,863,538 | |
CD Commercial Mortgage Trust Series 2017-6 Class A5 | | | 3.46 | | | | 11-13-2050 | | | | 1,035,000 | | | | 1,020,676 | |
CIFC Funding Limited Series 2012-2RA Class A1 (3 Month LIBOR +0.80%) 144A± | | | 3.15 | | | | 1-20-2028 | | | | 2,525,000 | | | | 2,506,436 | |
Commercial Mortgage Trust Series 2014-CR15 Class A2 | | | 2.93 | | | | 2-10-2047 | | | | 822,424 | | | | 822,570 | |
Credit Suisse First Boston Commercial Mortgage Trust Series 1998-C2 Class AX ±±(c) | | | 0.23 | | | | 11-15-2030 | | | | 107,089 | | | | 22 | |
Crown Point Limited Series 2013-2A Class A1LR (3 Month LIBOR +0.59%) 144A± | | | 2.93 | | | | 12-31-2023 | | | | 116,004 | | | | 115,954 | |
Crown Point Limited Series 2015-3A Class A1AR (3 Month LIBOR +0.91%) 144A± | | | 3.25 | | | | 12-31-2027 | | | | 2,500,000 | | | | 2,499,958 | |
CSAIL Commercial Mortgage Trust Series 2015-C4 Class A1 | | | 2.01 | | | | 11-15-2048 | | | | 2,108,490 | | | | 2,088,239 | |
Financial Asset Securitization Incorporated Series 1997-NAM2 Class B2 ±±† | | | 7.88 | | | | 7-25-2027 | | | | 23,442 | | | | 16,424 | |
FirstKey Mortgage Trust Series 2014-1 Class A2 144A±± | | | 3.00 | | | | 11-25-2044 | | | | 1,630,591 | | | | 1,621,572 | |
GAHR Commercial Mortgage Trust Series 2015-NRF Class AFX 144A | | | 3.23 | | | | 12-15-2034 | | | | 1,600,000 | | | | 1,602,135 | |
Great Wolf Trust Series 2017-A (1 Month LIBOR +0.85%) 144A± | | | 3.06 | | | | 9-15-2034 | | | | 2,350,000 | | | | 2,350,706 | |
GS Mortgage Securities Trust Series 2007 Class AM ±± | | | 5.98 | | | | 8-10-2045 | | | | 308,801 | | | | 314,068 | |
Hyatt Hotel Portfolio Trust Series 2017-HYTE Class A (1 Month LIBOR +0.66%) 144A± | | | 2.72 | | | | 8-9-2032 | | | | 765,000 | | | | 764,271 | |
Jamestown Collateralized Loan Obligation Limited Series 2016-9A Class A1A (3 Month LIBOR +1.57%) 144A± | | | 3.92 | | | | 10-20-2028 | | | | 2,000,000 | | | | 2,000,380 | |
JPMorgan Chase Commercial Mortgage Securities Trust Series 2007-CB18 Class AMFL (1 Month LIBOR +0.17%) ± | | | 2.23 | | | | 6-12-2047 | | | | 639,419 | | | | 628,319 | |
JPMorgan Chase Commercial Mortgage Securities Trust Series 2007-LDPX Class AM ±± | | | 5.46 | | | | 1-15-2049 | | | | 295,382 | | | | 295,945 | |
JPMorgan Chase Commercial Mortgage Securities Trust Series 2018-WPT Class AFL (1 Month LIBOR +0.95%) 144A± | | | 3.03 | | | | 7-5-2033 | | | | 2,660,000 | | | | 2,653,389 | |
Morgan Stanley Capital I Series 2004-RR2 Class X 144A±±(c) | | | 0.35 | | | | 10-28-2033 | | | | 6,880 | | | | 122 | |
Neuberger Berman Limited Series 2015-20A Class AR (3 Month LIBOR +0.80%) 144A± | | | 3.14 | | | | 1-15-2028 | | | | 1,575,000 | | | | 1,572,376 | |
Palmer Square Loan Funding Limited Series 2018-3A Class A1 (3 Month LIBOR +0.85%) 144A± | | | 3.19 | | | | 8-15-2026 | | | | 3,140,000 | | | | 3,136,935 | |
Rait Trust Series 2017-FL8 Class A (1 Month LIBOR +0.85%) 144A± | | | 2.91 | | | | 12-15-2037 | | | | 1,366,030 | | | | 1,366,028 | |
Sound Point Collateralized Loan Obligation Limited Series 2013-2RA Class A1 (3 Month LIBOR +0.95%) 144A± | | | 3.30 | | | | 4-15-2029 | | | | 2,825,000 | | | | 2,820,149 | |
Stonemont Portfolio Trust Series 2017 Class A (1 Month LIBOR +0.85%) 144A± | | | 2.93 | | | | 8-20-2030 | | | | 2,544,900 | | | | 2,544,887 | |
UBS Commercial Mortgage Trust Series 2017-C5 Class A5 | | | 3.47 | | | | 11-15-2050 | | | | 1,140,000 | | | | 1,118,497 | |
Voya Collateralized Loan Obligation Limited Series 2015-2A Class AR (3 Month LIBOR +0.97%) 144A± | | | 3.32 | | | | 7-23-2027 | | | | 2,900,000 | | | | 2,899,948 | |
The accompanying notes are an integral part of these financial statements.
| | | | | | |
| Portfolio of investments—August 31, 2018 | | Wells Fargo Core Plus Bond Fund | | | 21 | |
| | | | | | | | | | | | | | | | |
| Security name | | Interest rate | | | Maturity date | | | Principal | | | Value | |
| | | | |
Non-Agency Mortgage-Backed Securities (continued) | | | | | | | | | | | | | | | | |
West Collateralized Loan Obligation Limited Series 2014-2A Class A1 (3 Month LIBOR +0.87%) 144A± | | | 3.21 | % | | | 1-16-2027 | | | $ | 3,000,000 | | | $ | 2,995,317 | |
Wind River Collateralized Loan Obligation Limited Trust Series 2014-3A Class AR (3 Month LIBOR +1.10%) 144A± | | | 3.45 | | | | 1-22-2027 | | | | 1,600,000 | | | | 1,600,315 | |
| | | | |
Total Non-Agency Mortgage-Backed Securities (Cost $51,520,413) | | | | | | | | | | | | | | | 51,224,463 | |
| | | | | | | | | | | | | | | | |
| | | | |
U.S. Treasury Securities: 12.62% | | | | | | | | | | | | | | | | |
U.S. Treasury Bond | | | 2.88 | | | | 5-15-2028 | | | | 5,625,000 | | | | 5,625,879 | |
U.S. Treasury Bond | | | 3.00 | | | | 8-15-2048 | | | | 5,660,000 | | | | 5,631,479 | |
U.S. Treasury Bond | | | 3.13 | | | | 5-15-2048 | | | | 575,000 | | | | 586,522 | |
U.S. Treasury Bond | | | 3.38 | | | | 5-15-2044 | | | | 2,410,000 | | | | 2,561,378 | |
U.S. Treasury Bond | | | 3.63 | | | | 2-15-2044 | | | | 4,245,000 | | | | 4,698,021 | |
U.S. Treasury Bond | | | 3.75 | | | | 8-15-2041 | | | | 3,965,000 | | | | 4,454,739 | |
U.S. Treasury Bond | | | 3.75 | | | | 11-15-2043 | | | | 2,775,000 | | | | 3,130,872 | |
U.S. Treasury Bond | | | 4.25 | | | | 11-15-2040 | | | | 1,385,000 | | | | 1,666,545 | |
U.S. Treasury Note | | | 1.63 | | | | 8-31-2022 | | | | 465,000 | | | | 445,492 | |
U.S. Treasury Note | | | 1.75 | | | | 5-15-2023 | | | | 2,760,000 | | | | 2,639,142 | |
U.S. Treasury Note | | | 2.00 | | | | 10-31-2022 | | | | 8,210,000 | | | | 7,970,756 | |
U.S. Treasury Note | | | 2.25 | | | | 11-15-2027 | | | | 21,465,000 | | | | 20,403,489 | |
U.S. Treasury Note | | | 2.38 | | | | 1-31-2023 | | | | 3,145,000 | | | | 3,096,719 | |
U.S. Treasury Note | | | 2.50 | | | | 3-31-2023 | | | | 1,790,000 | | | | 1,770,981 | |
U.S. Treasury Note | | | 2.63 | | | | 2-28-2023 | | | | 965,000 | | | | 960,288 | |
U.S. Treasury Note | | | 2.63 | | | | 6-30-2023 | | | | 4,225,000 | | | | 4,201,069 | |
U.S. Treasury Note | | | 6.13 | | | | 11-15-2027 | | | | 3,875,000 | | | | 4,892,490 | |
| | | | |
Total U.S. Treasury Securities (Cost $75,400,414) | | | | | | | | | | | | | | | 74,735,861 | |
| | | | | | | | | | | | | | | | |
| | | | |
Yankee Corporate Bonds and Notes: 9.29% | | | | | | | | | | | | | | | | |
| | | | |
Consumer Staples: 0.55% | | | | | | | | | | | | | | | | |
| | | | |
| Beverages: 0.55% | | | | | | | | | | | | | | | | |
Bacardi Limited 144A | | | 5.30 | | | | 5-15-2048 | | | | 1,485,000 | | | | 1,441,505 | |
Coca-Cola Femsa SAB de CV | | | 3.88 | | | | 11-26-2023 | | | | 1,810,000 | | | | 1,826,894 | |
| | | | |
| | | | | | | | | | | | | | | 3,268,399 | |
| | | | | | | | | | | | | | | | |
| | | | |
Energy: 0.74% | | | | | | | | | | | | | | | | |
| | | | |
| Energy Equipment & Services: 0.19% | | | | | | | | | | | | | | | | |
Ensco plc | | | 5.75 | | | | 10-1-2044 | | | | 1,500,000 | | | | 1,091,250 | |
| | | | | | | | | | | | | | | | |
| | | | |
| Oil, Gas & Consumable Fuels: 0.55% | | | | | | | | | | | | | | | | |
BP Capital Markets plc | | | 3.22 | | | | 11-28-2023 | | | | 2,170,000 | | | | 2,145,942 | |
Comision Federal de Electricidad 144A | | | 4.75 | | | | 2-23-2027 | | | | 1,140,000 | | | | 1,125,750 | |
| | | | |
| | | | | | | | | | | | | | | 3,271,692 | |
| | | | | | | | | | | | | | | | |
| | | | |
Financials: 6.00% | | | | | | | | | | | | | | | | |
| | | | |
| Banks: 3.04% | | | | | | | | | | | | | | | | |
ABN AMRO Bank NV 144A | | | 4.75 | | | | 7-28-2025 | | | | 1,800,000 | | | | 1,822,594 | |
Banco de Bogota SA 144A | | | 4.38 | | | | 8-3-2027 | | | | 1,110,000 | | | | 1,066,988 | |
Banco do Brasil SA 144A | | | 4.63 | | | | 1-15-2025 | | | | 1,615,000 | | | | 1,465,774 | |
Banco General SA 144A | | | 4.13 | | | | 8-7-2027 | | | | 1,035,000 | | | | 980,067 | |
The accompanying notes are an integral part of these financial statements.
| | | | |
| 22 | | Wells Fargo Core Plus Bond Fund | | Portfolio of investments—August 31, 2018 |
| | | | | | | | | | | | | | | | |
| Security name | | Interest rate | | | Maturity date | | | Principal | | | Value | |
| | | | |
| Banks (continued) | | | | | | | | | | | | | | | | |
Banco Internacional del Peru SAA Interbank 144A | | | 3.38 | % | | | 1-18-2023 | | | $ | 1,526,000 | | | $ | 1,466,868 | |
Banco Nacional de Desenvolvimento Econômico e Social 144A | | | 4.75 | | | | 5-9-2024 | | | | 905,000 | | | | 849,343 | |
Banco Safra SA 144A | | | 4.13 | | | | 2-8-2023 | | | | 1,695,000 | | | | 1,603,911 | |
Banco Santander SA | | | 4.25 | | | | 4-11-2027 | | | | 1,600,000 | | | | 1,538,477 | |
Banistmo SA 144A | | | 3.65 | | | | 9-19-2022 | | | | 1,160,000 | | | | 1,112,150 | |
Banque Ouest Africaine de Developpement 144A | | | 5.00 | | | | 7-27-2027 | | | | 2,520,000 | | | | 2,424,240 | |
BPCE SA 144A | | | 5.15 | | | | 7-21-2024 | | | | 1,725,000 | | | | 1,764,530 | |
Credit Suisse Group Funding Limited (3 Month LIBOR +1.20%) 144A± | | | 3.00 | | | | 12-14-2023 | | | | 1,485,000 | | | | 1,424,925 | |
Sumitomo Mitsui Financial Group Incorporated | | | 2.44 | | | | 10-19-2021 | | | | 500,000 | | | | 485,494 | |
| | | | |
| | | | | | | | | | | | | | | 18,005,361 | |
| | | | | | | | | | | | | | | | |
| | | | |
| Capital Markets: 0.41% | | | | | | | | | | | | | | | | |
Macquarie Group Limited 144A | | | 6.00 | | | | 1-14-2020 | | | | 2,365,000 | | | | 2,444,992 | |
| | | | | | | | | | | | | | | | |
| | | | |
| Diversified Financial Services: 1.23% | | | | | | | | | | | | | | | | |
Banco Nacional de Comercio Exterior SNC 144A | | | 4.38 | | | | 10-14-2025 | | | | 2,350,000 | | | | 2,314,774 | |
Corporacion Financiera de Desarrollo SA (3 Month LIBOR +5.61%) 144A± | | | 5.25 | | | | 7-15-2029 | | | | 1,185,000 | | | | 1,202,775 | |
Teva Pharmaceutical Finance Netherlands III BV | | | 6.75 | | | | 3-1-2028 | | | | 800,000 | | | | 834,046 | |
UBS Group Funding Switzerland AG 144A | | | 3.49 | | | | 5-23-2023 | | | | 1,165,000 | | | | 1,149,701 | |
UBS Group Funding Switzerland AG (5 Year USD Swap +4.87%) ± | | | 7.00 | | | | 12-29-2049 | | | | 1,650,000 | | | | 1,751,043 | |
| | | | |
| | | | | | | | | | | | | | | 7,252,339 | |
| | | | | | | | | | | | | | | | |
| | | | |
| Insurance: 0.93% | | | | | | | | | | | | | | | | |
Axis Specialty Finance plc | | | 2.65 | | | | 4-1-2019 | | | | 1,970,000 | | | | 1,967,361 | |
Sompo International Holdings Limited | | | 7.00 | | | | 7-15-2034 | | | | 1,330,000 | | | | 1,574,964 | |
Validus Holdings Limited | | | 8.88 | | | | 1-26-2040 | | | | 1,335,000 | | | | 1,947,474 | |
| | | | |
| | | | | | | | | | | | | | | 5,489,799 | |
| | | | | | | | | | | | | | | | |
| | | | |
| Thrifts & Mortgage Finance: 0.39% | | | | | | | | | | | | | | | | |
Nationwide Building Society (5 Year USD Swap Rate +1.85%) 144A± | | | 4.13 | | | | 10-18-2032 | | | | 2,500,000 | | | | 2,306,978 | |
| | | | | | | | | | | | | | | | |
| | | | |
Health Care: 0.75% | | | | | | | | | | | | | | | | |
| | | | |
| Pharmaceuticals: 0.75% | | | | | | | | | | | | | | | | |
Shire Acquisitions Investment Ireland Limited | | | 2.40 | | | | 9-23-2021 | | | | 2,550,000 | | | | 2,464,084 | |
Teva Pharmaceutical Finance BV | | | 4.10 | | | | 10-1-2046 | | | | 2,700,000 | | | | 1,983,760 | |
| | | | |
| | | | | | | | | | | | | | | 4,447,844 | |
| | | | | | | | | | | | | | | | |
| | | | |
Industrials: 0.12% | | | | | | | | | | | | | | | | |
| | | | |
| Transportation Infrastructure: 0.12% | | | | | | | | | | | | | | | | |
Mexico City Airport Trust 144A | | | 5.50 | | | | 7-31-2047 | | | | 840,000 | | | | 745,441 | |
| | | | | | | | | | | | | | | | |
| | | | |
Telecommunication Services: 0.54% | | | | | | | | | | | | | | | | |
| | | | |
| Diversified Telecommunication Services: 0.15% | | | | | | | | | | | | | | | | |
Telefonica Emisiones SAU | | | 5.21 | | | | 3-8-2047 | | | | 885,000 | | | | 870,724 | |
| | | | | | | | | | | | | | | | |
| | | | |
| Wireless Telecommunication Services: 0.39% | | | | | | | | | | | | | | | | |
Vodafone Group plc | | | 4.38 | | | | 5-30-2028 | | | | 2,330,000 | | | | 2,310,236 | |
| | | | | | | | | | | | | | | | |
The accompanying notes are an integral part of these financial statements.
| | | | | | |
| Portfolio of investments—August 31, 2018 | | Wells Fargo Core Plus Bond Fund | | | 23 | |
| | | | | | | | | | | | | | | | |
| Security name | | Interest rate | | | Maturity date | | | Principal | | | Value | |
| | | | |
Utilities: 0.59% | | | | | | | | | | | | | | | | |
| | | | |
| Electric Utilities: 0.59% | | | | | | | | | | | | | | | | |
Transelec SA 144A | | | 3.88 | % | | | 1-12-2029 | | | $ | 860,000 | | | $ | 795,504 | |
Western Power Distributions Holdings Limited 144A | | | 7.38 | | | | 12-15-2028 | | | | 2,265,000 | | | | 2,686,390 | |
| | | | |
| | | | | | | | | | | | | | | 3,481,894 | |
| | | | | | | | | | | | | | | | |
| | | | |
Total Yankee Corporate Bonds and Notes (Cost $55,301,514) | | | | | | | | | | | | | | | 54,986,949 | |
| | | | | | | | | | | | | | | | |
| | | | |
Yankee Government Bonds: 3.05% | | | | | | | | | | | | | | | | |
Bermuda 144A | | | 3.72 | | | | 1-25-2027 | | | | 995,000 | | | | 937,817 | |
Bermuda 144A | | | 4.14 | | | | 1-3-2023 | | | | 1,210,000 | | | | 1,221,253 | |
Hashemite Kingdom of Jordan | | | 3.00 | | | | 6-30-2025 | | | | 3,000,000 | | | | 2,983,433 | |
Province of Santa Fe 144A | | | 7.00 | | | | 3-23-2023 | | | | 2,000,000 | | | | 1,707,520 | |
Republic of Argentina | | | 6.88 | | | | 4-22-2021 | | | | 1,280,000 | | | | 1,141,133 | |
Republic of Argentina | | | 6.88 | | | | 1-11-2048 | | | | 1,000,000 | | | | 697,500 | |
Republic of Argentina | | | 7.50 | | | | 4-22-2026 | | | | 1,350,000 | | | | 1,114,439 | |
Republic of Brazil | | | 4.63 | | | | 1-13-2028 | | | | 1,795,000 | | | | 1,591,285 | |
Republic of Chile | | | 3.86 | | | | 6-21-2047 | | | | 1,000,000 | | | | 953,500 | |
Republic of Ecuador 144A | | | 7.88 | | | | 1-23-2028 | | | | 500,000 | | | | 428,750 | |
Republic of Kenya 144A | | | 8.25 | | | | 2-28-2048 | | | | 750,000 | | | | 699,852 | |
Republic of Senegal 144A | | | 6.25 | | | | 5-23-2033 | | | | 750,000 | | | | 674,925 | |
Ukraine | | | 1.47 | | | | 9-29-2021 | | | | 3,000,000 | | | | 2,881,542 | |
Ukraine 144A | | | 7.38 | | | | 9-25-2032 | | | | 1,200,000 | | | | 1,014,000 | |
| | | | |
Total Yankee Government Bonds (Cost $19,931,044) | | | | | | | | | | | | | | | 18,046,949 | |
| | | | | | | | | | | | | | | | |
| | | | |
Short-Term Investments: 6.40% | | | | | | | | | | | | | | | | |
| | | | |
| Commercial Paper: 1.62% | | | | | | | | | | | | | | | | |
Catholic Health Initiatives (z) | | | 1.97 | | | | 9-14-2018 | | | | 5,000,000 | | | | 4,996,191 | |
Michigan State University Board of Trustees Series B | | | 2.40 | | | | 9-10-2018 | | | | 4,600,000 | | | | 4,600,138 | |
| | | | |
| | | | | | | | | | | | | | | 9,596,329 | |
| | | | | | | | | | | | | | | | |
| | | | |
| | | Yield | | | | | | Shares | | | | |
| Investment Companies: 4.43% | | | | | | | | | | | | | | | | |
Securities Lending Cash Investment LLC (l)(r)(u) | | | 2.07 | | | | | | | | 892,078 | | | | 892,167 | |
Wells Fargo Government Money Market Fund Select Class (l)(u)## | | | 1.87 | | | | | | | | 25,332,190 | | | | 25,332,190 | |
| | | | |
| | | | | | | | | | | | | | | 26,224,357 | |
| | | | | | | | | | | | | | | | |
| | | | |
| | | | | | | | | Principal | | | | |
| U.S. Treasury Securities: 0.35% | | | | | | | | | | | | | | | | |
U.S. Treasury Bill (z)# | | | 1.31 | | | | 9-13-2018 | | | $ | 1,900,000 | | | | 1,899,094 | |
U.S. Treasury Bill (z)# | | | 1.62 | | | | 9-27-2018 | | | | 180,000 | | | | 179,781 | |
| | | | |
| | | | | | | | | | | | | | | 2,078,875 | |
| | | | | | | | | | | | | | | | |
| | | | |
Total Short-Term Investments (Cost $37,899,362) | | | | | | | | | | | | | | | 37,899,561 | |
| | | | | | | | | | | | | | | | |
| | | | | | | | |
| Total investments in securities (Cost $609,911,125) | | | 102.02 | % | | | 603,913,628 | |
Other assets and liabilities, net | | | (2.02 | ) | | | (11,983,652 | ) |
| | | | | | | | |
| Total net assets | | | 100.00 | % | | $ | 591,929,976 | |
| | | | | | | | |
The accompanying notes are an integral part of these financial statements.
| | | | |
| 24 | | Wells Fargo Core Plus Bond Fund | | Portfolio of investments—August 31, 2018 |
| ± | Variable rate investment. The rate shown is the rate in effect at period end. |
| ±± | The coupon of the security is adjusted based on the principal and interest payments received from the underlying pool of mortgages as well as the credit quality and the actual prepayment speed of the underlying mortgages. |
| (c) | Investment in an interest-only security entitles holders to receive only the interest payments on the underlying mortgages. The principal amount shown is the notional amount of the underlying mortgages. The rate represents the coupon rate. |
| ¤ | The security is issued in zero coupon form with no periodic interest payments. |
| %% | The security is issued on a when-issued basis. |
| 144A | The security may be resold in transactions exempt from registration, normally to qualified institutional buyers, pursuant to Rule 144A under the Securities Act of 1933. |
| « | All or a portion of this security is on loan. |
| @ | Foreign bond principal is denominated in the local currency of the issuer. |
| ‡ | Security is valued using significant unobservable inputs. |
| † | Non-income-earning security |
| (z) | Zero coupon security. The rate represents the current yield to maturity. |
| (l) | The issuer of the security is an affiliated person of the Fund as defined in the Investment Company Act of 1940. |
| (r) | The investment is a non-registered investment company purchased with cash collateral received from securities on loan. |
| (u) | The rate represents the 7-day annualized yield at period end. |
| ## | All or a portion of this security is segregated for when-issued securities. |
| # | All or a portion of this security is segregated as collateral for investments in derivative instruments. |
Abbreviations:
| AGM | Assured Guaranty Municipal |
| Ambac | Ambac Financial Group Incorporated |
| CAB | Capital appreciation bond |
| EDA | Economic Development Authority |
| FHLMC | Federal Home Loan Mortgage Corporation |
| FNMA | Federal National Mortgage Association |
| GNMA | Government National Mortgage Association |
| HEFAR | Higher Education Facilities Authority Revenue |
| LIBOR | London Interbank Offered Rate |
| REIT | Real Estate Investment Trust |
| SBA | Small Business Authority |
| STRIPS | Separate trading of registered interest and principal securities |
| TVA | Tennessee Valley Authority |
Futures Contracts
| | | | | | | | | | | | | | | | | | | | | | | | |
| Description | | Number of
contracts | | | Expiration
date | | | Notional cost | | | Notional value | | | Unrealized
gains | | | Unrealized
losses | |
Long | | | | | | | | | | | | | | | | | | | | | | | | |
Euro BTP Future | | | 45 | | | | 12-6-2018 | | | $ | 6,329,236 | | | $ | 6,308,792 | | | $ | 0 | | | $ | (20,444 | ) |
U.S. Long Term Bond | | | 65 | | | | 12-19-2018 | | | | 9,395,307 | | | | 9,374,219 | | | | 0 | | | | (21,088 | ) |
U.S. Ultra Bond | | | 50 | | | | 12-19-2018 | | | | 7,999,491 | | | | 7,965,625 | | | | 0 | | | | (33,866 | ) |
10-Year U.S. Treasury Notes | | | 60 | | | | 12-19-2018 | | | | 7,219,784 | | | | 7,215,938 | | | | 0 | | | | (3,846 | ) |
10-Year Ultra Futures | | | 5 | | | | 12-19-2018 | | | | 641,024 | | | | 640,234 | | | | 0 | | | | (790 | ) |
5-Year U.S. Treasury Notes | | | 55 | | | | 12-31-2018 | | | | 6,235,258 | | | | 6,236,914 | | | | 1,656 | | | | 0 | |
2-Year U.S. Treasury Notes | | | 180 | | | | 12-31-2018 | | | | 38,036,531 | | | | 38,044,688 | | | | 8,157 | | | | 0 | |
The accompanying notes are an integral part of these financial statements.
| | | | | | |
| Portfolio of investments—August 31, 2018 | | Wells Fargo Core Plus Bond Fund | | | 25 | |
Futures Contracts (continued)
| | | | | | | | | | | | | | | | | | | | | | | | |
| Description | | Number of
contracts | | | Expiration
date | | | Notional cost | | | Notional value | | | Unrealized
gains | | | Unrealized
losses | |
Short | | | | | | | | | | | | | | | | | | | | | | | | |
Euro-Bund Futures | | | (80) | | | | 12-6-2018 | | | $ | (14,906,685 | ) | | $ | (14,930,030 | ) | | $ | 0 | | | $ | (23,345 | ) |
Euro-BOBL Futures | | | (90) | | | | 12-6-2018 | | | | (13,744,642 | ) | | | (13,748,967 | ) | | | 0 | | | | (4,325 | ) |
| | | | | | | | | | | | | | | | | | | | | | | | |
| | | | | | | | | | | | | | | | | | $ | 9,813 | | | $ | (107,704 | ) |
| | | | | | | | | | | | | | | | | | | | | | | | |
Forward Foreign Currency Contracts
| | | | | | | | | | | | | | |
Currency to be received | | Currency to be
delivered | | Counterparty | | Settlement date | | Unrealized
gains | | | Unrealized
losses | |
| 32,173,320 USD | | 27,600,000 EUR | | Citibank | | 9-28-2018 | | $ | 82,127 | | | $ | 0 | |
| 4,239,349 USD | | 3,600,000 EUR | | Citibank | | 9-28-2018 | | | 53,541 | | | | 0 | |
| 2,625,000 EUR | | 3,037,080 USD | | Citibank | | 9-28-2018 | | | 15,071 | | | | 0 | |
| 314,000,000 JPY | | 2,870,463 USD | | Citibank | | 9-28-2018 | | | 0 | | | | (39,918 | ) |
| 1,430,615 USD | | 1,900,000 CAD | | Citibank | | 9-28-2018 | | | 0 | | | | (25,986 | ) |
| | | | | | | | | | | | | | |
| | | | | | | | $ | 150,739 | | | $ | (65,904 | ) |
| | | | | | | | | | | | | | |
Centrally Cleared Credit Default Swaps
| | | | | | | | | | | | | | | | | | | | | | | | | | | | | | | | |
| Reference index | | Fixed rate
received | | | Payment
frequency | | | Maturity
date | | | Notional
amount | | | Value | | | Premiums
paid | | | Unrealized
gains | | | Unrealized
losses | |
Sell protection | | | | | | | | | | | | | | | | | | | | | | | | | | | | | | | | |
Markit iTraxx Europe Index | | | 1.00 | % | | | Quarterly | | | | 6-20-2023 | | | | 4,000,000 EUR | | | $ | 69,282 | | | $ | 90,102 | | | $ | 0 | | | $ | (20,820 | ) |
Markit iTraxx Europe Index | | | 5.00 | | | | Quarterly | | | | 6-20-2023 | | | | 3,000,000 EUR | | | | 302,157 | | | | 313,573 | | | | 0 | | | | (11,416 | ) |
| | | | | | | | | | | | | | | | | | | | | | | | | | | | | | | | |
| | | | | | | | | | | | | | | | | | | | | | $ | 403,675 | | | $ | 0 | | | $ | (32,236 | ) |
| | | | | | | | | | | | | | | | | | | | | | | | | | | | | | | | |
Investments in Affiliates
An affiliated investment is an investment in which the Fund owns at least 5% of the outstanding voting shares of the issuer or as a result of other relationships, such as the Fund and the issuer having the same investment manager. Transactions with issuers that were either affiliated persons of the Fund at the beginning of the period or the end of the period were as follows:
| | | | | | | | | | | | | | | | | | | | | | | | | | | | | | | | | | | | |
| | | Shares,
beginning of
period | | | Shares
purchased | | | Shares sold | | | Shares,
end of
period | | | Net
realized
gains
(losses) | | | Net
change in
unrealized
gains
(losses) | | | Income
from
affiliated
securities | | | Value, end of period | | | % of
net
assets | |
Short-Term Investments | | | | | | | | | | | | | | | | | | | | | | | | | | | | | | | | | | | | |
Investment Companies | | | | | | | | | | | | | | | | | | | | | | | | | | | | | | | | | | | | |
Securities Lending Cash Investment LLC | | | 2,797,697 | | | | 144,943,430 | | | | 146,849,049 | | | | 892,078 | | | $ | (2 | ) | | $ | (3 | ) | | $ | 45,877 | | | $ | 892,167 | | | | | |
Wells Fargo Government Money Market Fund Select Class | | | 66,446,091 | | | | 321,018,603 | | | | 362,132,504 | | | | 25,332,190 | | | | 0 | | | | 0 | | | | 685,955 | | | | 25,332,190 | | | | | |
| | | | | | | | | | | | | | | | | | | | | | | | | | | | | | | | | | | | |
| | | | | | | | | | | | | | | | | | $ | (2 | ) | | $ | (3 | ) | | $ | 731,832 | | | $ | 26,224,357 | | | | 4.43 | % |
| | | | | | | | | | | | | | | | | | | | | | | | | | | | | | | | | | | | |
The accompanying notes are an integral part of these financial statements.
| | | | |
| 26 | | Wells Fargo Core Plus Bond Fund | | Statement of assets and liabilities—August 31, 2018 |
| | | | |
| | | | |
| |
Assets | | | | |
Investments in unaffiliated securities (including $872,600 of securities loaned), at value (cost $583,686,828) | | $ | 577,689,271 | |
Investments in affiliated, at value (cost $26,224,297) | | | 26,224,357 | |
Cash at broker segregated for centrally cleared swaps | | | 515,017 | |
Foreign currency, at value (cost $332,470) | | | 332,738 | |
Principal paydown receivable | | | 83 | |
Receivable for Fund shares sold | | | 916,097 | |
Receivable for interest | | | 4,105,007 | |
Receivable for daily variation margin on open futures contracts | | | 34,276 | |
Receivable for securities lending income | | | 1,955 | |
Unrealized gains on forward foreign currency contracts | | | 150,739 | |
Prepaid expenses and other assets | | | 262,599 | |
| | | | |
Total assets | | | 610,232,139 | |
| | | | |
| |
Liabilities | | | | |
Payable for investments purchased | | | 15,273,938 | |
Payable for Fund shares redeemed | | | 1,520,736 | |
Payable upon receipt of securities loaned | | | 891,240 | |
Management fee payable | | | 142,995 | |
Due to custodian bank | | | 76,125 | |
Unrealized losses on forward foreign currency contracts | | | 65,904 | |
Administration fees payable | | | 61,691 | |
Payable for daily variation margin on centrally cleared swaps | | | 10,659 | |
Payable for daily variation margin on open futures contracts | | | 56,822 | |
Distribution fees payable | | | 14,428 | |
Trustees’ fees and expenses payable | | | 2,276 | |
Accrued expenses and other liabilities | | | 185,349 | |
| | | | |
Total liabilities | | | 18,302,163 | |
| | | | |
Total net assets | | $ | 591,929,976 | |
| | | | |
| |
NET ASSETS CONSIST OF | | | | |
Paid-in capital | | $ | 598,832,572 | |
Undistributed net investment income | | | 2,094,155 | |
Accumulated net realized losses on investments | | | (2,941,699 | ) |
Net unrealized losses on investments | | | (6,055,052 | ) |
| | | | |
Total net assets | | $ | 591,929,976 | |
| | | | |
| |
COMPUTATION OF NET ASSET VALUE AND OFFERING PRICE PER SHARE | | | | |
Net assets – Class A | | $ | 229,687,519 | |
Shares outstanding – Class A1 | | | 18,725,320 | |
Net asset value per share – Class A | | | $12.27 | |
Maximum offering price per share – Class A2 | | | $12.85 | |
Net assets – Class C | | $ | 20,550,409 | |
Shares outstanding – Class C1 | | | 1,675,927 | |
Net asset value per share – Class C | | | $12.26 | |
Net assets – Class R6 | | $ | 45,158,992 | |
Shares outstanding – Class R61 | | | 3,676,140 | |
Net asset value per share – Class R6 | | | $12.28 | |
Net assets – Administrator Class | | $ | 32,241,404 | |
Shares outstanding – Administrator Class1 | | | 2,632,775 | |
Net asset value per share – Administrator Class | | | $12.25 | |
Net assets – Institutional Class | | $ | 264,291,652 | |
Shares outstanding – Institutional Class1 | | | 21,524,499 | |
Net asset value per share – Institutional Class | | | $12.28 | |
| 1 | The Fund has an unlimited number of authorized shares. |
| 2 | Maximum offering price is computed as 100/95.50 of net asset value. On investments of $50,000 or more, the offering price is reduced. |
The accompanying notes are an integral part of these financial statements.
| | | | | | |
| Statement of operations—year ended August 31, 2018 | | Wells Fargo Core Plus Bond Fund | | | 27 | |
| | | | |
| | | | |
| |
Investment income | | | | |
Interest (net of foreign interest withholding taxes of $7,632) | | $ | 18,588,591 | |
Income from affiliated securities | | | 731,832 | |
Dividends | | | 200,263 | |
| | | | |
Total investment income | | | 19,520,686 | |
| | | | |
| |
Expenses | | | | |
Management fee | | | 2,598,288 | |
Administration fees | | | | |
Class A | | | 398,323 | |
Class C | | | 33,155 | |
Class R6 | | | 11,811 | |
Administrator Class | | | 38,730 | |
Institutional Class | | | 187,147 | |
Shareholder servicing fees | | | | |
Class A | | | 622,380 | |
Class C | | | 51,804 | |
Administrator Class | | | 96,615 | |
Distribution fee | | | | |
Class C | | | 155,413 | |
Custody and accounting fees | | | 59,857 | |
Professional fees | | | 64,294 | |
Registration fees | | | 93,263 | |
Shareholder report expenses | | | 105,695 | |
Trustees’ fees and expenses | | | 24,204 | |
Other fees and expenses | | | 9,903 | |
| | | | |
Total expenses | | | 4,550,882 | |
Less: Fee waivers and/or expense reimbursements | | | (1,113,188 | ) |
| | | | |
Net expenses | | | 3,437,694 | |
| | | | |
Net investment income | | | 16,082,992 | |
| | | | |
| |
REALIZED AND UNREALIZED GAINS (LOSSES) ON INVESTMENTS | | | | |
| |
Net realized gains (losses) on: | | | | |
Unaffiliated securities | | | (214,198 | ) |
Affiliated securities | | | (2 | ) |
Futures contracts | | | (2,344,997 | ) |
Forward foreign currency contracts | | | (46,781 | ) |
Credit default swap contracts | | | 135,319 | |
| | | | |
Net realized losses on investments | | | (2,470,659 | ) |
| | | | |
| |
Net change in unrealized gains (losses) on: | | | | |
Unaffiliated securities | | | (19,418,939 | ) |
Affiliated securities | | | (3 | ) |
Futures contracts | | | (139,113 | ) |
Forward foreign currency contracts | | | 1,669,470 | |
Credit default swap contracts | | | (18,762 | ) |
| | | | |
Net change in unrealized gains (losses) on investments | | | (17,907,347 | ) |
| | | | |
Net realized and unrealized gains (losses) on investments | | | (20,378,006 | ) |
| | | | |
Net decrease in net assets resulting from operations | | $ | (4,295,014 | ) |
| | | | |
The accompanying notes are an integral part of these financial statements.
| | | | |
| 28 | | Wells Fargo Core Plus Bond Fund | | Statement of changes in net assets |
| | | | | | | | | | | | | | | | |
| | | Year ended
August 31, 2018 | | | Year ended
August 31, 2017 | |
| | | |
Operations | | | | | | | | | | | | |
Net investment income | | | | | | $ | 16,082,992 | | | | | | | $ | 14,822,987 | |
Net realized gains (losses) on investments | | | | | | | (2,470,659 | ) | | | | | | | 4,956,568 | |
Net change in unrealized gains (losses) on investments | | | | | | | (17,907,347 | ) | | | | | | | (6,580,780 | ) |
| | | | |
Net increase (decrease) in net assets resulting from operations | | | | | | | (4,295,014 | ) | | | | | | | 13,198,775 | |
| | | | |
| | | |
Distributions to shareholders from | | | | | | | | | | | | |
Net investment income | | | | | | | | | | | | | | | | |
Class A | | | | | | | (6,592,901 | ) | | | | | | | (8,298,601 | ) |
Class B | | | | | | | N/A | | | | | | | | (563 | )1 |
Class C | | | | | | | (396,945 | ) | | | | | | | (354,581 | ) |
Class R6 | | | | | | | (1,205,963 | ) | | | | | | | (337,520 | )2 |
Administrator Class | | | | | | | (1,057,877 | ) | | | | | | | (1,459,294 | ) |
Institutional Class | | | | | | | (7,080,934 | ) | | | | | | | (3,111,816 | ) |
Net realized gains | | | | | | | | | | | | | | | | |
Class A | | | | | | | 0 | | | | | | | | (174,322 | ) |
Class C | | | | | | | 0 | | | | | | | | (10,016 | ) |
Class R6 | | | | | | | 0 | | | | | | | | (12 | )2 |
Administrator Class | | | | | | | 0 | | | | | | | | (28,708 | ) |
Institutional Class | | | | | | | 0 | | | | | | | | (41,445 | ) |
| | | | |
Total distributions to shareholders | | | | | | | (16,334,620 | ) | | | | | | | (13,816,878 | ) |
| | | | |
| | | | |
Capital share transactions | | | Shares | | | | | | | | Shares | | | | | |
Proceeds from shares sold | | | | | | | | | | | | | | | | |
Class A | | | 3,153,880 | | | | 39,493,506 | | | | 6,027,974 | | | | 75,386,710 | |
Class C | | | 574,528 | | | | 7,177,070 | | | | 419,941 | | | | 5,278,093 | |
Class R6 | | | 1,231,456 | | | | 15,394,192 | | | | 2,444,368 | 2 | | | 30,444,742 | 2 |
Administrator Class | | | 1,331,903 | | | | 16,514,724 | | | | 2,382,823 | | | | 29,615,799 | |
Institutional Class | | | 15,277,371 | | | | 190,922,160 | | | | 10,894,809 | | | | 136,214,194 | |
| | | | |
| | | | | | | 269,501,652 | | | | | | | | 276,939,538 | |
| | | | |
Reinvestment of distributions | | | | | | | | | | | | | | | | |
Class A | | | 490,954 | | | | 6,097,803 | | | | 633,102 | | | | 7,894,693 | |
Class B | | | N/A | | | | N/A | | | | 44 | 1 | | | 550 | 1 |
Class C | | | 29,298 | | | | 363,379 | | | | 22,979 | | | | 286,809 | |
Class R6 | | | 81,463 | | | | 1,012,889 | | | | 26,775 | 2 | | | 337,532 | 2 |
Administrator Class | | | 84,932 | | | | 1,053,385 | | | | 119,039 | | | | 1,483,140 | |
Institutional Class | | | 530,646 | | | | 6,583,306 | | | | 232,681 | | | | 2,910,737 | |
| | | | |
| | | | | | | 15,110,762 | | | | | | | | 12,913,461 | |
| | | | |
Payment for shares redeemed | | | | | | | | | | | | | | | | |
Class A | | | (5,034,990 | ) | | | (62,673,141 | ) | | | (14,092,819 | ) | | | (175,455,886 | ) |
Class B | | | N/A | | | | N/A | | | | (10,056 | )1 | | | (124,139 | )1 |
Class C | | | (426,093 | ) | | | (5,284,028 | ) | | | (615,840 | ) | | | (7,673,788 | ) |
Class R6 | | | (107,920 | ) | | | (1,336,675 | ) | | | (2 | )2 | | | (22 | )2 |
Administrator Class | | | (2,078,726 | ) | | | (25,750,208 | ) | | | (4,817,096 | ) | | | (59,885,885 | ) |
Institutional Class | | | (7,127,474 | ) | | | (88,356,112 | ) | | | (4,552,266 | ) | | | (56,762,736 | ) |
| | | | |
| | | | | | | (183,400,164 | ) | | | | | | | (299,902,456 | ) |
| | | | |
Net increase (decrease) in net assets resulting from capital share transactions | | | | | | | 101,212,250 | | | | | | | | (10,049,457 | ) |
| | | | |
Total increase (decrease) in net assets | | | | | | | 80,582,616 | | | | | | | | (10,667,560 | ) |
| | | | |
| | |
Net assets | | | | | | | | |
Beginning of period | | | | | | | 511,347,360 | | | | | | | | 522,014,920 | |
| | | | |
End of period | | | | | | $ | 591,929,976 | | | | | | | $ | 511,347,360 | |
| | | | |
Undistributed net investment income | | | | | | $ | 2,094,155 | | | | | | | $ | 2,271,037 | |
| | | | |
| 1 | For the period from September 1, 2016 to December 5, 2016. Effective at the close of business on December 5, 2016, Class B shares were converted to Class A shares and are no longer offered by the Fund. |
| 2 | For the period from October 31, 2016 (commencement of class operations) to August 31, 2017 |
The accompanying notes are an integral part of these financial statements.
| | | | | | |
| Financial highlights | | Wells Fargo Core Plus Bond Fund | | | 29 | |
(For a share outstanding throughout each period)
| | | | | | | | | | | | | | | | | | | | |
| | | Year ended August 31 | |
| CLASS A | | 2018 | | | 2017 | | | 2016 | | | 2015 | | | 2014 | |
Net asset value, beginning of period | | | $12.71 | | | | $12.70 | | | | $12.14 | | | | $12.24 | | | | $11.66 | |
Net investment income | | | 0.34 | | | | 0.36 | 1 | | | 0.33 | | | | 0.21 | 1 | | | 0.26 | |
Net realized and unrealized gains (losses) on investments | | | (0.45 | ) | | | (0.01 | ) | | | 0.60 | | | | (0.08 | ) | | | 0.57 | |
| | | | | | | | | | | | | | | | | | | | |
Total from investment operations | | | (0.11 | ) | | | 0.35 | | | | 0.93 | | | | 0.13 | | | | 0.83 | |
Distributions to shareholders from | | | | | | | | | | | | | | | | | | | | |
Net investment income | | | (0.33 | ) | | | (0.33 | ) | | | (0.33 | ) | | | (0.21 | ) | | | (0.25 | ) |
Net realized gains | | | 0.00 | | | | (0.01 | ) | | | (0.04 | ) | | | (0.02 | ) | | | 0.00 | |
| | | | | | | | | | | | | | | | | | | | |
Total distributions to shareholders | | | (0.33 | ) | | | (0.34 | ) | | | (0.37 | ) | | | (0.23 | ) | | | (0.25 | ) |
Net asset value, end of period | | | $12.27 | | | | $12.71 | | | | $12.70 | | | | $12.14 | | | | $12.24 | |
Total return2 | | | (0.84 | )% | | | 2.78 | % | | | 7.78 | % | | | 1.04 | % | | | 7.16 | % |
Ratios to average net assets (annualized) | | | | | | | | | | | | | | | | | | | | |
Gross expenses | | | 0.92 | % | | | 0.93 | % | | | 0.93 | % | | | 0.91 | % | | | 0.93 | % |
Net expenses | | | 0.73 | % | | | 0.76 | % | | | 0.84 | % | | | 0.84 | % | | | 0.85 | % |
Net investment income | | | 2.63 | % | | | 2.88 | % | | | 2.76 | % | | | 1.69 | % | | | 2.10 | % |
Supplemental data | | | | | | | | | | | | | | | | | | | | |
Portfolio turnover rate | | | 148 | % | | | 199 | % | | | 288 | % | | | 322 | % | | | 267 | % |
Net assets, end of period (000s omitted) | | | $229,688 | | | | $255,668 | | | | $349,852 | | | | $223,755 | | | | $129,646 | |
| 1 | Calculated based upon average shares outstanding |
| 2 | Total return calculations do not include any sales charges. |
The accompanying notes are an integral part of these financial statements.
| | | | |
| 30 | | Wells Fargo Core Plus Bond Fund | | Financial highlights |
(For a share outstanding throughout each period)
| | | | | | | | | | | | | | | | | | | | |
| | | Year ended August 31 | |
| CLASS C | | 2018 | | | 2017 | | | 2016 | | | 2015 | | | 2014 | |
Net asset value, beginning of period | | | $12.71 | | | | $12.70 | | | | $12.14 | | | | $12.23 | | | | $11.65 | |
Net investment income | | | 0.23 | | | | 0.26 | | | | 0.24 | 1 | | | 0.12 | 1 | | | 0.16 | |
Net realized and unrealized gains (losses) on investments | | | (0.44 | ) | | | (0.01 | ) | | | 0.59 | | | | (0.08 | ) | | | 0.58 | |
| | | | | | | | | | | | | | | | | | | | |
Total from investment operations | | | (0.21 | ) | | | 0.25 | | | | 0.83 | | | | 0.04 | | | | 0.74 | |
Distributions to shareholders from | | | | | | | | | | | | | | | | | | | | |
Net investment income | | | (0.24 | ) | | | (0.23 | ) | | | (0.23 | ) | | | (0.11 | ) | | | (0.16 | ) |
Net realized gains | | | 0.00 | | | | (0.01 | ) | | | (0.04 | ) | | | (0.02 | ) | | | 0.00 | |
| | | | | | | | | | | | | | | | | | | | |
Total distributions to shareholders | | | (0.24 | ) | | | (0.24 | ) | | | (0.27 | ) | | | (0.13 | ) | | | (0.16 | ) |
Net asset value, end of period | | | $12.26 | | | | $12.71 | | | | $12.70 | | | | $12.14 | | | | $12.23 | |
Total return2 | | | (1.66 | )% | | | 2.01 | % | | | 6.99 | % | | | 0.35 | % | | | 6.35 | % |
Ratios to average net assets (annualized) | | | | | | | | | | | | | | | | | | | | |
Gross expenses | | | 1.67 | % | | | 1.68 | % | | | 1.68 | % | | | 1.66 | % | | | 1.68 | % |
Net expenses | | | 1.48 | % | | | 1.51 | % | | | 1.59 | % | | | 1.59 | % | | | 1.60 | % |
Net investment income | | | 1.89 | % | | | 2.12 | % | | | 2.00 | % | | | 0.95 | % | | | 1.35 | % |
Supplemental data | | | | | | | | | | | | | | | | | | | | |
Portfolio turnover rate | | | 148 | % | | | 199 | % | | | 288 | % | | | 322 | % | | | 267 | % |
Net assets, end of period (000s omitted) | | | $20,550 | | | | $19,036 | | | | $21,216 | | | | $20,381 | | | | $24,212 | |
| 1 | Calculated based upon average shares outstanding |
| 2 | Total return calculations do not include any sales charges. |
The accompanying notes are an integral part of these financial statements.
| | | | | | |
| Financial highlights | | Wells Fargo Core Plus Bond Fund | | | 31 | |
(For a share outstanding throughout the period)
| | | | | | | | |
| | | Year ended August 31 | |
| CLASS R6 | | 2018 | | | 20171 | |
Net asset value, beginning of period | | | $12.73 | | | | $12.59 | |
Net investment income | | | 0.39 | | | | 0.33 | 2 |
Net realized and unrealized gains (losses) on investments | | | (0.46 | ) | | | 0.12 | |
| | | | | | | | |
Total from investment operations | | | (0.07 | ) | | | 0.45 | |
Distributions to shareholders from | | | | | | | | |
Net investment income | | | (0.38 | ) | | | (0.30 | ) |
Net realized gains | | | 0.00 | | | | (0.01 | ) |
| | | | | | | | |
Total distributions to shareholders | | | (0.38 | ) | | | (0.31 | ) |
Net asset value, end of period | | | $12.28 | | | | $12.73 | |
Total return3 | | | (0.55 | )% | | | 3.64 | % |
Ratios to average net assets (annualized) | | | | | | | | |
Gross expenses | | | 0.54 | % | | | 0.55 | % |
Net expenses | | | 0.35 | % | | | 0.35 | % |
Net investment income | | | 3.05 | % | | | 3.12 | % |
Supplemental data | | | | | | | | |
Portfolio turnover rate | | | 148 | % | | | 199 | % |
Net assets, end of period (000s omitted) | | | $45,159 | | | | $31,451 | |
| 1 | For the period from October 31, 2016 (commencement of class operations) to August 31, 2017 |
| 2 | Calculated based upon average shares outstanding |
| 3 | Returns for periods of less than one year are not annualized. |
The accompanying notes are an integral part of these financial statements.
| | | | |
| 32 | | Wells Fargo Core Plus Bond Fund | | Financial highlights |
(For a share outstanding throughout each period)
| | | | | | | | | | | | | | | | | | | | |
| | | Year ended August 31 | |
| ADMINISTRATOR CLASS | | 2018 | | | 2017 | | | 2016 | | | 2015 | | | 2014 | |
Net asset value, beginning of period | | | $12.69 | | | | $12.68 | | | | $12.12 | | | | $12.22 | | | | $11.64 | |
Net investment income | | | 0.35 | | | | 0.37 | | | | 0.34 | | | | 0.22 | | | | 0.27 | 1 |
Net realized and unrealized gains (losses) on investments | | | (0.44 | ) | | | (0.01 | ) | | | 0.60 | | | | (0.08 | ) | | | 0.57 | |
| | | | | | | | | | | | | | | | | | | | |
Total from investment operations | | | (0.09 | ) | | | 0.36 | | | | 0.94 | | | | 0.14 | | | | 0.84 | |
Distributions to shareholders from | | | | | | | | | | | | | | | | | | | | |
Net investment income | | | (0.35 | ) | | | (0.34 | ) | | | (0.34 | ) | | | (0.22 | ) | | | (0.26 | ) |
Net realized gains | | | 0.00 | | | | (0.01 | ) | | | (0.04 | ) | | | (0.02 | ) | | | 0.00 | |
| | | | | | | | | | | | | | | | | | | | |
Total distributions to shareholders | | | (0.35 | ) | | | (0.35 | ) | | | (0.38 | ) | | | (0.24 | ) | | | (0.26 | ) |
Net asset value, end of period | | | $12.25 | | | | $12.69 | | | | $12.68 | | | | $12.12 | | | | $12.22 | |
Total return | | | (0.74 | )% | | | 2.90 | % | | | 7.92 | % | | | 1.15 | % | | | 7.31 | % |
Ratios to average net assets (annualized) | | | | | | | | | | | | | | | | | | | | |
Gross expenses | | | 0.86 | % | | | 0.87 | % | | | 0.87 | % | | | 0.85 | % | | | 0.87 | % |
Net expenses | | | 0.62 | % | | | 0.66 | % | | | 0.72 | % | | | 0.72 | % | | | 0.72 | % |
Net investment income | | | 2.74 | % | | | 2.97 | % | | | 2.84 | % | | | 1.82 | % | | | 2.24 | % |
Supplemental data | | | | | | | | | | | | | | | | | | | | |
Portfolio turnover rate | | | 148 | % | | | 199 | % | | | 288 | % | | | 322 | % | | | 267 | % |
Net assets, end of period (000s omitted) | | | $32,241 | | | | $41,806 | | | | $71,133 | | | | $85,431 | | | | $101,653 | |
| 1 | Calculated based upon average shares outstanding |
The accompanying notes are an integral part of these financial statements.
| | | | | | |
| Financial highlights | | Wells Fargo Core Plus Bond Fund | | | 33 | |
(For a share outstanding throughout each period)
| | | | | | | | | | | | | | | | | | | | |
| | | Year ended August 31 | |
| INSTITUTIONAL CLASS | | 2018 | | | 2017 | | | 2016 | | | 2015 | | | 2014 | |
Net asset value, beginning of period | | | $12.72 | | | | $12.71 | | | | $12.15 | | | | $12.24 | | | | $11.67 | |
Net investment income | | | 0.37 | 1 | | | 0.38 | | | | 0.36 | | | | 0.24 | 1 | | | 0.28 | |
Net realized and unrealized gains (losses) on investments | | | (0.44 | ) | | | 0.01 | | | | 0.60 | | | | (0.07 | ) | | | 0.57 | |
| | | | | | | | | | | | | | | | | | | | |
Total from investment operations | | | (0.07 | ) | | | 0.39 | | | | 0.96 | | | | 0.17 | | | | 0.85 | |
Distributions to shareholders from | | | | | | | | | | | | | | | | | | | | |
Net investment income | | | (0.37 | ) | | | (0.37 | ) | | | (0.36 | ) | | | (0.24 | ) | | | (0.28 | ) |
Net realized gains | | | 0.00 | | | | (0.01 | ) | | | (0.04 | ) | | | (0.02 | ) | | | 0.00 | |
| | | | | | | | | | | | | | | | | | | | |
Total distributions to shareholders | | | (0.37 | ) | | | (0.38 | ) | | | (0.40 | ) | | | (0.26 | ) | | | (0.28 | ) |
Net asset value, end of period | | | $12.28 | | | | $12.72 | | | | $12.71 | | | | $12.15 | | | | $12.24 | |
Total return | | | (0.52 | )% | | | 3.10 | % | | | 8.05 | % | | | 1.37 | % | | | 7.36 | % |
Ratios to average net assets (annualized) | | | | | | | | | | | | | | | | | | | | |
Gross expenses | | | 0.59 | % | | | 0.60 | % | | | 0.60 | % | | | 0.58 | % | | | 0.60 | % |
Net expenses | | | 0.40 | % | | | 0.44 | % | | | 0.58 | % | | | 0.58 | % | | | 0.58 | % |
Net investment income | | | 3.00 | % | | | 3.17 | % | | | 3.04 | % | | | 1.95 | % | | | 2.38 | % |
Supplemental data | | | | | | | | | | | | | | | | | | | | |
Portfolio turnover rate | | | 148 | % | | | 199 | % | | | 288 | % | | | 322 | % | | | 267 | % |
Net assets, end of period (000s omitted) | | | $264,292 | | | | $163,387 | | | | $79,687 | | | | $54,419 | | | | $32,438 | |
| 1 | Calculated based upon average shares outstanding |
The accompanying notes are an integral part of these financial statements.
| | | | |
| 34 | | Wells Fargo Core Plus Bond Fund | | Notes to financial statements |
1. ORGANIZATION
Wells Fargo Funds Trust (the “Trust”), a Delaware statutory trust organized on March 10, 1999, is an open-end management investment company registered under the Investment Company Act of 1940, as amended (the “1940 Act”). As an investment company, the Trust follows the accounting and reporting guidance in Financial Accounting Standards Board (“FASB”) Accounting Standards Codification Topic 946, Financial Services – Investment Companies. These financial statements report on the Wells Fargo Core Plus Bond Fund (the “Fund”) which is a diversified series of the Trust.
Effective at the close of business on December 5, 2016, Class B shares were converted to Class A shares and are no longer offered by the Fund. Information for Class B shares reflected in the financial statements represents activity through December 5, 2016.
2. SIGNIFICANT ACCOUNTING POLICIES
The following significant accounting policies, which are consistently followed in the preparation of the financial statements of the Fund, are in conformity with U.S. generally accepted accounting principles which require management to make estimates and assumptions that affect the reported amounts of assets and liabilities, disclosure of contingent assets and liabilities at the date of the financial statements, and the reported amounts of revenues and expenses during the reporting period. Actual results could differ from those estimates.
Securities valuation
All investments are valued each business day as of the close of regular trading on the New York Stock Exchange (generally 4 p.m. Eastern Time), although the Fund may deviate from this calculation time under unusual or unexpected circumstances.
Debt securities are valued at the evaluated bid price provided by an independent pricing service or, if a reliable price is not available, the quoted bid price from an independent broker-dealer.
Equity securities and futures contracts that are listed on a foreign or domestic exchange or market are valued at the official closing price or, if none, the last sales price. If no sale occurs on the principal exchange or market that day, a fair value price will be determined in accordance with the Fund’s Valuation Procedures.
Swap contracts are valued at the evaluated price provided by an independent pricing service or, if a reliable price is not available, the quoted bid price from an independent broker-dealer.
The values of securities denominated in foreign currencies are translated into U.S. dollars at rates provided by an independent foreign currency pricing source at a time each business day specified by the Wells Fargo Asset Management Pricing Committee at Wells Fargo Funds Management, LLC (“Funds Management”).
Investments in registered open-end investment companies are valued at net asset value. Interests in non-registered investment companies that are redeemable at net asset value are fair valued normally at net asset value.
Investments which are not valued using any of the methods discussed above are valued at their fair value, as determined in good faith by the Board of Trustees of the Fund. The Board of Trustees has established a Valuation Committee comprised of the Trustees and has delegated to it the authority to take any actions regarding the valuation of portfolio securities that the Valuation Committee deems necessary or appropriate, including determining the fair value of portfolio securities, unless the determination has been delegated to the Wells Fargo Asset Management Pricing Committee. The Board of Trustees retains the authority to make or ratify any valuation decisions or approve any changes to the Valuation Procedures as it deems appropriate. On a quarterly basis, the Board of Trustees receives reports on any valuation actions taken by the Valuation Committee or the Wells Fargo Asset Management Pricing Committee which may include items for ratification.
Valuations of fair valued securities are compared to the next actual sales price when available, or other appropriate market values, to assess the continued appropriateness of the fair valuation methodologies used. These securities are fair valued on a day-to-day basis, taking into consideration changes to appropriate market information and any significant changes to the inputs considered in the valuation process until there is a readily available price provided on an exchange or by an independent pricing service. Valuations received from an independent pricing service or independent broker-dealer quotes are periodically validated by comparisons to most recent trades and valuations provided by other independent pricing services in addition to the review of prices by the manager and/or subadviser. Unobservable inputs used in determining fair valuations are identified based on the type of security, taking into consideration factors utilized by market participants in valuing the investment, knowledge about the issuer and the current market environment.
| | | | | | |
| Notes to financial statements | | Wells Fargo Core Plus Bond Fund | | | 35 | |
Foreign currency translation
The accounting records of the Fund are maintained in U.S. dollars. The values of other assets and liabilities denominated in foreign currencies are translated into U.S. dollars at rates provided by an independent foreign currency pricing source at a time each business day specified by the Wells Fargo Asset Management Pricing Committee. Purchases and sales of securities, and income and expenses are converted at the rate of exchange on the respective dates of such transactions. Net realized foreign exchange gains or losses arise from sales of foreign currencies, currency gains or losses realized between the trade and settlement dates on securities transactions, and the difference between the amounts of dividends, interest and foreign withholding taxes recorded and the U.S. dollar equivalent of the amounts actually paid or received. Net unrealized foreign exchange gains and losses arise from changes in the fair value of assets and liabilities other than investments in securities resulting from changes in exchange rates. The changes in net assets arising from changes in exchange rates of securities and the changes in net assets resulting from changes in market prices of securities are not separately presented. Such changes are included in net realized and unrealized gains or losses from investments.
Forward foreign currency contracts
The Fund is subject to foreign currency risk in the normal course of pursuing its investment objectives. A forward foreign currency contract is an agreement between two parties to purchase or sell a specific currency for an agreed-upon price at a future date. The Fund enters into forward foreign currency contracts to facilitate transactions in foreign-denominated securities and to attempt to minimize the risk to the Fund from adverse changes in the relationship between currencies. Forward foreign currency contracts are recorded at the forward rate and marked-to-market daily. When the contracts are closed, realized gains and losses arising from such transactions are recorded as realized gains or losses on forward foreign currency contracts. The Fund could be exposed to risks if the counterparties to the contracts are unable to meet the terms of their contracts or if the value of the foreign currency changes unfavorably. The Fund’s maximum risk of loss from counterparty credit risk is the unrealized gains on the contracts. This risk may be mitigated if there is a master netting arrangement between the Fund and the counterparty.
Securities lending
The Fund may lend its securities from time to time in order to earn additional income in the form of fees or interest on securities received as collateral or the investment of any cash received as collateral. The Fund continues to receive interest or dividends on the securities loaned. The Fund receives collateral in the form of cash or securities with a value at least equal to the value of the securities on loan. The value of the loaned securities is determined at the close of each business day and any additional required collateral is delivered to the Fund on the next business day. In a securities lending transaction, the net asset value of the Fund will be affected by an increase or decrease in the value of the securities loaned and by an increase or decrease in the value of the instrument in which collateral is invested. The amount of securities lending activity undertaken by the Fund fluctuates from time to time. In the event of default or bankruptcy by the borrower, the Fund may be prevented from recovering the loaned securities or gaining access to the collateral or may experience delays or costs in doing so. In addition, the investment of any cash collateral received may lose all or part of its value. The Fund has the right under the lending agreement to recover the securities from the borrower on demand.
The Fund lends its securities through an unaffiliated securities lending agent. Cash collateral received in connection with its securities lending transactions is invested in Securities Lending Cash Investments, LLC (the “Securities Lending Fund”). The Securities Lending Fund is exempt from registration under Section 3(c)(7) of the 1940 Act and is managed by Funds Management and is subadvised by Wells Capital Management Incorporated (���WellsCap”), an affiliate of Funds Management and an indirect wholly owned subsidiary of Wells Fargo & Company (“Wells Fargo”). Funds Management receives an advisory fee starting at 0.05% and declining to 0.01% as the average daily net assets of the Securities Lending Fund increase. All of the fees received by Funds Management are paid to WellsCap for its services as subadviser. The Securities Lending Fund seeks to provide a positive return compared to the daily Fed Funds Open Rate by investing in high-quality, U.S. dollar-denominated short-term money market instruments. Securities Lending Fund investments are valued at the evaluated bid price provided by an independent pricing service. Income earned from investment in the Securities Lending Fund, if any, is included in income from affiliated securities on the Statement of Operations.
When-issued transactions
The Fund may purchase securities on a forward commitment or when-issued basis. The Fund records a when-issued transaction on the trade date and will segregate assets in an amount at least equal in value to the Fund’s commitment to purchase when-issued securities. Securities purchased on a when-issued basis are marked-to-market daily and the Fund begins earning interest on the settlement date. Losses may arise due to changes in the market value of the underlying securities or if the counterparty does not perform under the contract.
| | | | |
| 36 | | Wells Fargo Core Plus Bond Fund | | Notes to financial statements |
Loans
The Fund may invest in direct debt instruments which are interests in amounts owed to lenders by corporate or other borrowers. The loans pay interest at rates which are periodically reset by reference to a base lending rate plus a spread. Investments in loans may be in the form of participations in loans or assignments of all or a portion of loans from third parties. When the Fund purchases participations, it generally has no rights to enforce compliance with terms of the loan agreement with the borrower. As a result, the Fund assumes the credit risk of both the borrower and the lender that is selling the participation. When the Fund purchases assignments from lenders, it acquires direct rights against the borrower on the loan and may enforce compliance by the borrower with the terms of the loan agreement. Loans may include fully funded term loans or unfunded loan commitments, which are contractual obligations for future funding.
Futures contracts
The Fund is subject to interest rate risk and foreign currency risk in the normal course of pursuing its investment objectives. Futures contracts are agreements between the Fund and a counterparty to buy or sell a specific amount of a commodity, financial instrument or currency at specified price and on a specified date. The Fund may buy and sell futures contracts in order to gain exposure to, or protect against, changes in interest rates and foreign exchange rates. The primary risks associated with the use of futures contracts are the imperfect correlation between changes in market values of securities held by the Fund and the prices of futures contracts, and the possibility of an illiquid market. Futures contracts are generally entered into on a regulated futures exchange and cleared through a clearinghouse associated with the exchange. With futures contracts, there is minimal counterparty risk to the Fund since futures contracts are exchange traded and the exchange’s clearinghouse, as counterparty to all exchange traded futures, guarantees the futures contracts against default.
Upon entering into a futures contracts, the Fund is required to deposit either cash or securities (initial margin) with the broker in an amount equal to a certain percentage of the contract value. Subsequent payments (variation margin) are paid to or from the broker each day equal to the daily changes in the contract value. Such payments are recorded as unrealized gains or losses and, if any, shown as variation margin receivable (payable) in the Statement of Assets and Liabilities. Should the Fund fail to make requested variation margin payments, the broker can gain access to the initial margin to satisfy the Fund’s payment obligations. When the contracts are closed, a realized gain or loss is recorded in the Statement of Operations.
Swap contracts
Swap contracts are agreements between the Fund and a counterparty to exchange a series of cash flows over a specified period. Swap agreements are privately negotiated contracts between the Fund and a counterparty in the OTC market and may be entered into as a bilateral contract (“OTC swaps”) or centrally cleared (“centrally cleared swaps”) with a central clearinghouse.
For OTC swaps, any upfront premiums paid and any upfront fees received are shown as swap premiums paid and swap premiums received, respectively, in the Statement of Assets and Liabilities and amortized over the term of the contract. The daily fluctuations in market value are recorded as unrealized gains or losses on OTC swaps in the Statement of Assets and Liabilities. Payments received or paid are recorded in the Statement of Operations as realized gains or losses, respectively. When an OTC swap is terminated, a realized gain or loss is recorded in the Statement of Operations equal to the difference between the proceeds from (or cost of) the closing transaction and the Fund’s basis in the contract, if any. Generally, the basis of the contract is the premium received or paid.
In a centrally cleared swap, immediately following execution of the swap contract, the swap contract is novated to a central counterparty (the “CCP”) and the Fund’s counterparty on the swap agreement becomes the CCP. Upon entering into a centrally cleared swap, the Fund is required to deposit an initial margin with the broker in the form of cash or securities. Securities deposited as initial margin are designated in the Portfolio of Investments and cash deposited is shown as cash segregated for centrally cleared swaps in the Statement of Assets and Liabilities. Pursuant to the contract, the Fund agrees to receive from or pay to the broker an amount of cash equal to the daily fluctuation in market value of the contract (“variation margin”). The variation margin is recorded as an unrealized gain (or loss) and shown as variation margin receivable (or payable) on centrally cleared swaps in the Statement of Assets and Liabilities. Payments received from (paid to) the counterparty, including at termination, are recorded as realized gains (losses) in the Statement of Operations.
Credit default swaps
The Fund is subject to credit risk in the normal course of pursuing its investment objectives. The Fund may enter into credit default swaps for hedging or speculative purposes to provide or receive a measure of protection against default on a referenced entity, obligation or index or a basket of single-name issuers or traded indexes. An index
| | | | | | |
| Notes to financial statements | | Wells Fargo Core Plus Bond Fund | | | 37 | |
credit default swap references all the names in the index, and if a credit event is triggered, the credit event is settled based on that name’s weight in the index. Credit default swaps are agreements in which the protection buyer pays fixed periodic payments to the protection seller in consideration for a promise from the protection seller to make a specific payment should a negative credit event take place with respect to the referenced entity (e.g., bankruptcy, failure to pay, obligation acceleration, repudiation, moratorium or restructuring).
The Fund may enter into credit default swaps as either the seller of protection or the buyer of protection. If the Fund is the buyer of protection and a credit event occurs, the Fund will either receive from the seller an amount equal to the notional amount of the swap and deliver the referenced security or underlying securities comprising the index, or receive a net settlement of cash equal to the notional amount of the swap less the recovery value of the security or underlying securities comprising the index. If the Fund is the seller of protection and a credit event occurs, the Fund will either pay the buyer an amount equal to the notional amount of the swap and take delivery of the referenced security or underlying securities comprising the index or pay a net settlement of cash equal to the notional amount of the swap less the recovery value of the security or underlying securities comprising the index.
As the seller of protection, the Fund is subject to investment exposure on the notional amount of the swap and has assumed the risk of default of the underlying security or index. As the buyer of protection, the Fund could be exposed to risks if the seller of the protection defaults on its obligation to perform, or if there are unfavorable changes in the fluctuation of interest rates.
Security transactions and income recognition
Securities transactions are recorded on a trade date basis. Realized gains or losses are recorded on the basis of identified cost.
Interest income is accrued daily and bond discounts are accreted and premiums are amortized daily. To the extent debt obligations are placed on non-accrual status, any related interest income may be reduced by writing off interest receivables when the collection of all or a portion of interest has been determined to be doubtful based on consistently applied procedures and the fair value has decreased. If the issuer subsequently resumes interest payments or when the collectability of interest is reasonably assured, the debt obligation is removed from non-accrual status.
Income dividends and capital gain distributions from investment companies are recorded on the ex-dividend date. Capital gain distributions from investment companies are treated as realized gains.
Income from foreign securities is recorded net of foreign taxes withheld where recovery of such taxes is not assured.
Distributions to shareholders
Distributions to shareholders are recorded on the ex-dividend date and paid from net investment income monthly and any net realized gains are paid at least annually. Such distributions are determined in accordance with income tax regulations and may differ from U.S. generally accepted accounting principles. Dividend sources are estimated at the time of declaration. The tax character of distributions is determined as of the Fund’s fiscal year end. Therefore, a portion of the Fund’s distributions made prior to the Fund’s fiscal year end may be categorized as a tax return of capital at year end.
Federal and other taxes
The Fund intends to continue to qualify as a regulated investment company by distributing substantially all of its investment company taxable income and any net realized capital gains (after reduction for capital loss carryforwards) sufficient to relieve it from all, or substantially all, federal income taxes. Accordingly, no provision for federal income taxes was required.
The Fund’s income and federal excise tax returns and all financial records supporting those returns for the prior three fiscal years are subject to examination by the federal and Delaware revenue authorities. Management has analyzed the Fund’s tax positions taken on federal, state, and foreign tax returns for all open tax years and does not believe that there are any uncertain tax positions that require recognition of a tax liability.
As of August 31, 2018, the aggregate cost of all investments for federal income tax purposes was $608,300,392 and the unrealized gains (losses) consisted of:
| | | | |
Gross unrealized gains | | $ | 6,811,131 | |
Gross unrealized losses | | | (11,243,187 | ) |
Net unrealized losses | | $ | (4,432,056 | ) |
| | | | |
| 38 | | Wells Fargo Core Plus Bond Fund | | Notes to financial statements |
Reclassifications are made to the Fund’s capital accounts for permanent tax differences to reflect income and gains available for distribution (or available capital loss carryforwards) under federal income tax regulations. U.S. generally accepted accounting principles require that certain components of net assets be adjusted to reflect permanent differences between financial and tax reporting. These reclassifications have no effect on net assets or net asset values per share. The primary permanent difference causing such reclassification is due to foreign currency transactions. At August 31, 2018, as a result of permanent book-to-tax differences, the following reclassification adjustments were made on the Statement of Assets and Liabilities:
| | | | |
| Paid-in capital | | Undistributed net investment income | | Accumulated net realized losses on investments |
| $119,600 | | $74,746 | | $(194,346) |
As of August 31, 2018, the Fund had capital loss carryforwards which consist of $2,883,692 in short-term capital losses and $57,244 in long-term capital losses.
Class allocations
The separate classes of shares offered by the Fund differ principally in applicable sales charges, distribution, shareholder servicing, and administration fees. Class specific expenses are charged directly to that share class. Investment income, common expenses, and realized and unrealized gains (losses) on investments are allocated daily to each class of shares based on the relative proportion of net assets of each class.
3. FAIR VALUATION MEASUREMENTS
Fair value measurements of investments are determined within a framework that has established a fair value hierarchy based upon the various data inputs utilized in determining the value of the Fund’s investments. The three-level hierarchy gives the highest priority to unadjusted quoted prices in active markets for identical assets or liabilities (Level 1) and the lowest priority to unobservable inputs (Level 3). The Fund’s investments are classified within the fair value hierarchy based on the lowest level of input that is significant to the fair value measurement. The inputs are summarized into three broad levels as follows:
| ∎ | | Level 1 – quoted prices in active markets for identical securities |
| ∎ | | Level 2 – other significant observable inputs (including quoted prices for similar securities, interest rates, prepayment speeds, credit risk, etc.) |
| ∎ | | Level 3 – significant unobservable inputs (including the Fund’s own assumptions in determining the fair value of investments) |
The inputs or methodologies used for valuing investments in securities are not necessarily an indication of the risk associated with investing in those securities.
| | | | | | |
| Notes to financial statements | | Wells Fargo Core Plus Bond Fund | | | 39 | |
The following is a summary of the inputs used in valuing the Fund’s assets and liabilities as of August 31, 2018:
| | | | | | | | | | | | | | | | |
| | | Quoted prices
(Level 1) | | | Other significant
observable inputs
(Level 2) | | | Significant
unobservable inputs (Level 3) | | | Total | |
Assets | | | | | | | | | | | | | | | | |
Investments in: | | | | | | | | | | | | | | | | |
| | | | |
Agency securities | | $ | 0 | | | $ | 136,663,594 | | | $ | 0 | | | $ | 136,663,594 | |
| | | | |
Asset-backed securities | | | 0 | | | | 41,709,694 | | | | 0 | | | | 41,709,694 | |
| | | | |
Corporate bonds and notes | | | 0 | | | | 101,020,926 | | | | 0 | | | | 101,020,926 | |
| | | | |
Exchange-traded funds | | | 12,063,480 | | | | 0 | | | | 0 | | | | 12,063,480 | |
| | | | |
Foreign corporate bonds and notes | | | 0 | | | | 23,387,915 | | | | 0 | | | | 23,387,915 | |
| | | | |
Foreign government bonds | | | 0 | | | | 8,920,476 | | | | 0 | | | | 8,920,476 | |
| | | | |
Loans | | | 0 | | | | 16,179,447 | | | | 884,400 | | | | 17,063,847 | |
| | | | |
Municipal obligations | | | 0 | | | | 26,189,913 | | | | 0 | | | | 26,189,913 | |
| | | | |
Non-agency mortgage-backed securities | | | 0 | | | | 51,224,463 | | | | 0 | | | | 51,224,463 | |
| | | | |
U.S. Treasury securities | | | 74,735,861 | | | | 0 | | | | 0 | | | | 74,735,861 | |
| | | | |
Yankee corporate bonds and notes | | | 0 | | | | 54,986,949 | | | | 0 | | | | 54,986,949 | |
| | | | |
Yankee government bonds | | | | | | | 18,046,949 | | | | | | | | 18,046,949 | |
| | | | |
Short-term investments | | | | | | | | | | | | | | | | |
Commercial paper | | | 0 | | | | 9,596,329 | | | | 0 | | | | 9,596,329 | |
Investment companies | | | 25,332,190 | | | | 0 | | | | 0 | | | | 25,332,190 | |
U.S. Treasury securities | | | 2,078,875 | | | | 0 | | | | 0 | | | | 2,078,875 | |
Investments measured at net asset value* | | | | | | | | | | | | | | | 892,167 | |
| | | 114,210,406 | | | | 487,926,655 | | | | 884,400 | | | | 603,913,628 | |
Forward foreign currency contracts | | | 0 | | | | 150,739 | | | | 0 | | | | 150,739 | |
Futures contracts | | | 9,813 | | | | 0 | | | | 0 | | | | 9,813 | |
Total assets | | $ | 114,220,219 | | | $ | 488,077,394 | | | $ | 884,400 | | | $ | 604,074,180 | |
Liabilities | | | | | | | | | | | | | | | | |
Credit default swap contracts | | $ | 0 | | | $ | 32,236 | | | $ | 0 | | | $ | 32,236 | |
Forward foreign currency contracts | | | 0 | | | | 65,904 | | | | 0 | | | | 65,904 | |
Futures contracts | | | 107,704 | | | | 0 | | | | 0 | | | | 107,704 | |
Total liabilities | | $ | 107,704 | | | $ | 98,140 | | | $ | 0 | | | $ | 205,844 | |
| * | Investments that are measured at fair value using the net asset value per share (or its equivalent) as a practical expedient have not been categorized in the fair value hierarchy. The fair value amount presented in the table is intended to permit reconciliation of the fair value hierarchy to the amounts presented in the Statement of Assets and Liabilities. The Fund’s investment in Securities Lending Cash Investments, LLC valued at $892,167 does not have a redemption period notice, can be redeemed daily and does not have any unfunded commitments. |
Additional sector, industry or geographic detail is included in the Portfolio of Investments.
Forward foreign currency contracts, futures contracts and swap contracts are reported at their cumulative unrealized gains (losses) at measurement date as reported in the tables following the Portfolio of Investments. For futures contracts and centrally cleared swaps, the current day’s variation margin is reported on the Statement of Assets and Liabilities. All other assets and liabilities are reported at their market value at measurement date.
The Fund recognizes transfers between levels within the fair value hierarchy at the end of the reporting period. At August 31, 2018, the Fund did not have any transfers into/out of Level 1. The Fund had no material transfers between Level 2 and Level 3.
| | | | |
| 40 | | Wells Fargo Core Plus Bond Fund | | Notes to financial statements |
4. TRANSACTIONS WITH AFFILIATES
Management fee
Funds Management, an indirect wholly owned subsidiary of Wells Fargo, is the manager of the Fund and provides advisory and fund-level administrative services under an investment management agreement. Under the investment management agreement, Funds Management is responsible for, among other services, implementing the investment objectives and strategies of the Fund, supervising the subadviser and providing fund-level administrative services in connection with the Fund’s operations. As compensation for its services under the investment management agreement, Funds Management is entitled to receive an annual management fee starting at 0.45% and declining to 0.32% as the average daily net assets of the Fund increase. Prior to January 1, 2018, Funds Management was entitled to receive an annual management fee which started at 0.45% and declined to 0.33% as the average daily net assets of the Fund increased. For the year ended August 31, 2018, the management fee was equivalent to an annual rate of 0.45% of the Fund’s average daily net assets.
Funds Management has retained the services of a subadviser to provide daily portfolio management to the Fund. The fee for subadvisory services is borne by Funds Management. WellsCap is the subadviser to the Fund and is entitled to receive a fee from Funds Management at an annual rate starting at 0.20% and declining to 0.10% as the average daily net assets of the Fund increase.
Administration fees
Under a class-level administration agreement, Funds Management provides class-level administrative services to the Fund, which includes paying fees and expenses for services provided by the transfer agent, sub-transfer agents, omnibus account servicers and record-keepers. As compensation for its services under the class-level administration agreement, Funds Management receives an annual fee which is calculated based on the average daily net assets of each class as follows:
| | | | |
| | | Class-level
administration fee | |
Class A, Class C | | | 0.16 | % |
Class R6 | | | 0.03 | |
Administrator Class | | | 0.10 | |
Institutional Class | | | 0.08 | |
Funds Management has contractually waived and/or reimbursed management and administration fees to the extent necessary to maintain certain net operating expense ratios for the Fund. When each class of the Fund has exceeded its expense cap, Funds Management has waived fees and/or reimbursed expenses from fund level expenses on a proportionate basis and then from class specific expenses; otherwise, waivers and/or reimbursements are applied against class specific expenses before fund level expenses. Funds Management has committed through December 31, 2018 to waive fees and/or reimburse expenses to the extent necessary to cap the Fund’s expenses at 0.73% for Class A shares, 1.48% for Class C shares, 0.35% for Class R6 shares, 0.62% for Administrator Class shares, and 0.40% for Institutional Class shares. After this time, the cap may be increased or the commitment to maintain the cap may be terminated only with the approval of the Board of Trustees.
Distribution fee
The Trust has adopted a distribution plan for Class C shares of the Fund pursuant to Rule 12b-1 under the 1940 Act. A distribution fee is charged to Class C shares and paid to Wells Fargo Funds Distributor, LLC (“Funds Distributor”), the principal underwriter, at an annual rate of 0.75% of the average daily net assets of Class C shares.
In addition, Funds Distributor is entitled to receive the front-end sales charge from the purchase of Class A shares and a contingent deferred sales charge on the redemption of certain Class A shares. Funds Distributor is also entitled to receive the contingent deferred sales charges from redemptions of Class C shares. For the year ended August 31, 2108, Funds Distributor received $13,375 from the sale of Class A shares and $11 in contingent deferred sales charges from redemptions of Class C shares. No contingent deferred sales charges were incurred by Class A shares for the year ended August 31, 2018.
Shareholder servicing fees
The Trust has entered into contracts with one or more shareholder servicing agents, whereby Class A, Class C, and Administrator Class of the Fund are charged a fee at an annual rate of 0.25% of the average daily net assets of each respective class.
A portion of these total shareholder servicing fees were paid to affiliates of Wells Fargo.
| | | | | | |
| Notes to financial statements | | Wells Fargo Core Plus Bond Fund | | | 41 | |
Interfund transactions
The Fund may purchase or sell portfolio investment securities to certain other Wells Fargo affiliates pursuant to Rule 17a-7 under the 1940 Act and under procedures adopted by the Board of Trustees. The procedures have been designed to ensure that these interfund transactions, which do not incur broker commissions, are effected at current market prices.
5. INVESTMENT PORTFOLIO TRANSACTIONS
Purchases and sales of investments, excluding short-term securities, for the year ended August 31, 2018 were as follows:
| | | | | | |
Purchases at cost | | Sales proceeds |
U.S. government | | Non-U.S. government | | U.S. government | | Non-U.S. government |
| $620,141,502 | | $348,636,574 | | $544,021,408 | | $262,182,137 |
6. DERIVATIVE TRANSACTIONS
During the year ended August 31, 2018, the Fund entered into futures contracts to speculate on interest rates and to help manage the duration of the portfolio, forward foreign currency contracts for economic hedging purposes, and credit default swap contracts as a substitute for taking a position in the underlying security or basket of securities or to potentially enhance the Fund’s total return.
The volume of the Fund’s derivative activity during the year ended August 31, 2018 was as follows:
| | | | |
Futures contracts | | | | |
Average notional balance on long futures | | $ | 79,345,144 | |
Average notional balance on short futures | | | 27,526,186 | |
Forward foreign currency contracts | | | | |
Average contract amounts to buy | | | 10,335,673 | |
Average contract amounts to sell | | | 31,075,740 | |
Credit default swap contracts | | | | |
Average notional balance | | | 11,030,137 | |
The Fund’s credit default swap may contain provisions for early termination in the event the net assets of the Fund declines below specific levels identified by the counterparty. If these levels are triggered, the counterparty may terminate the transaction and seek payment or request full collateralization of the derivative transactions in net liability positions.
A summary of the location of derivative instruments on the financial statements by primary risk exposure is outlined following tables.
The fair value of derivative instruments as of August 31, 2018 was as follows for the Fund:
| | | | | | | | | | | | |
| | | Asset derivatives | | | Liability derivatives | |
| | | Statement of Assets and
Liabilities location | | Fair value | | | Statement of Assets and
Liabilities location | | Fair value | |
Interest rate contracts | | Unrealized gains on futures contracts | | $ | 9,813 | * | | Unrealized losses on futures contracts | | $ | 59,590 | * |
Foreign currency contracts | | Unrealized gains on futures contracts | | | 0 | * | | Unrealized losses on futures contracts | | | 48,114 | * |
| | Unrealized gains on forward foreign currency contracts | | | 150,739 | | | Unrealized losses on forward foreign currency contracts | | | 65,904 | |
Credit contracts | | Net unrealized gains on swap contracts | | | 0 | * | | Net unrealized losses on swap contracts | | | 32,236 | * |
| | | | | $ | 160,552 | | | | | $ | 205,844 | |
| * | Amount represents cumulative unrealized gains (losses) as reported in the tables following the Portfolio of Investments. Only the current day’s variation margin as of August 31, 2018 is reported separately on the Statement of Assets and Liabilities. |
| | | | |
| 42 | | Wells Fargo Core Plus Bond Fund | | Notes to financial statements |
The effect of derivative instruments on the Statement of Operations for the year ended August 31, 2018 was as follows for the Fund:
| | | | | | | | | | | | | | | | |
| | | Amount of realized gains (losses) on derivatives | |
| | | Futures
contracts | | | Forward
foreign
currency
contracts | | | Swap
contracts | | | Total | |
Interest rate risk | | $ | (1,616,611 | ) | | $ | 0 | | | $ | 0 | | | $ | (1,616,611 | ) |
Foreign currency risk | | | (728,386 | ) | | | (46,781 | ) | | | 0 | | | | (775,167 | ) |
Credit risk | | | 0 | | | | 0 | | | | 135,319 | | | | 135,319 | |
| | | $ | (2,344,997 | ) | | $ | (46,781 | ) | | $ | 135,319 | | | $ | (2,256,459 | ) |
| |
| | | Change in unrealized gains (losses) on derivatives | |
| | | Futures
contracts | | | Forward
foreign
currency
contracts | | | Swap
contracts | | | Total | |
Interest rate risk | | $ | (164,615 | ) | | $ | 0 | | | $ | 0 | | | $ | (164,615 | ) |
Foreign currency risk | | | 25,502 | | | | 1,669,470 | | | | 0 | | | | 1,694,972 | |
Credit risk | | | 0 | | | | 0 | | | | (18,762 | ) | | | (18,762 | ) |
| | | $ | (139,113 | ) | | $ | 1,669,470 | | | $ | (18,762 | ) | | $ | 1,511,595 | |
For certain types of derivative transactions, the Fund has entered into International Swaps and Derivatives Association, Inc. master agreements (“ISDA Master Agreements”) or similar agreements with approved counterparties. The ISDA Master Agreements or similar agreements may have requirements to deliver/deposit securities or cash to/with an exchange or broker-dealer as collateral and allows the Fund to offset, with each counterparty, certain derivative financial instrument’s assets and/or liabilities with collateral held or pledged. Collateral requirements differ by type of derivative. Collateral or margin requirements are set by the broker or exchange clearinghouse for exchange traded derivatives while collateral terms are contract specific for over-the-counter traded derivatives. Cash collateral that has been pledged to cover obligations of the Fund under ISDA Master Agreements or similar agreements, if any, are reported separately in the Statement of Assets and Liabilities. Securities pledged as collateral, if any, are noted in the Portfolio of Investments. With respect to balance sheet offsetting, absent an event of default by the counterparty or a termination of the agreement, the reported amounts of financial assets and financial liabilities in the Statement of Assets and Liabilities are not offset across transactions between the Fund and the applicable counterparty. A reconciliation of the gross amounts on the Statement of Assets and Liabilities to the net amounts by counterparty, including any collateral exposure, is as follows:
| | | | | | | | | | | | | | | | |
| Counterparty | | Gross amounts of assets in the Statement of Assets and Liabilities | | | Amounts subject to netting agreements | | | Collateral
received | | | Net amount of assets | |
Citibank | | $ | 150,739 | | | $ | (65,904 | ) | | $ | 0 | | | $ | 84,835 | |
| | | | | | | | | | | | | | | | |
| Counterparty | | Gross amounts
of liabilities in the
Statement of
Assets and
Liabilities | | | Amounts
subject to
netting
agreements | | | Collateral
pledged | | | Net amount of liabilities | |
Citibank | | $ | 65,904 | | | $ | (65,904 | ) | | $ | 0 | | | $ | 0 | |
7. BANK BORROWINGS
The Trust (excluding the money market funds), Wells Fargo Master Trust and Wells Fargo Variable Trust are parties to a $280,000,000 revolving credit agreement whereby the Fund is permitted to use bank borrowings for temporary or emergency purposes, such as to fund shareholder redemption requests. Interest under the credit agreement is charged to the Fund based on a borrowing rate equal to the higher of the Federal Funds rate in effect on that day plus 1.25% or the overnight LIBOR rate in effect on that day plus 1.25%. In addition, an annual commitment fee equal to 0.25% of the unused balance is allocated to each participating fund.
For the year ended August 31, 2018, there were no borrowings by the Fund under the agreement.
| | | | | | |
| Notes to financial statements | | Wells Fargo Core Plus Bond Fund | | | 43 | |
8. DISTRIBUTIONS TO SHAREHOLDERS
The tax character of distributions paid during the years ended August 31, 2018 and August 31, 2017 were as follows:
| | | | | | | | |
| | | Year ended August 31 | |
| | | 2018 | | | 2017 | |
Ordinary income | | $ | 16,334,620 | | | $ | 13,562,587 | |
Long-term capital gain | | | 0 | | | | 254,291 | |
As of August 31, 2018, the components of distributable earnings on a tax basis were as follows:
| | | | |
Undistributed ordinary income | | Unrealized losses | | Capital loss carryforward |
| $490,179 | | $(4,432,056) | | $(2,940,936) |
9. INDEMNIFICATION
Under the Trust’s organizational documents, the officers and Trustees have been granted certain indemnification rights against certain liabilities that may arise out of performance of their duties to the Trust. Additionally, in the normal course of business, the Trust may enter into contracts with service providers that contain a variety of indemnification clauses. The Trust’s maximum exposure under these arrangements is dependent on future claims that may be made against the Fund and, therefore, cannot be estimated.
10. NEW ACCOUNTING PRONOUNCEMENTS AND REGULATORY CHANGES
On August 17, 2018, the Securities and Exchange Commission (“SEC”) adopted Disclosure Update and Simplification, which amends certain disclosure requirements. The amendments are effective for filings subsequent to November 5, 2018. Management expects these amendments will impact the classification of disclosures in the financial statements.
In August 2018, FASB issued Accounting Standards Update (“ASU”) No. 2018-13, Fair Value Measurement (Topic 820) Disclosure Framework—Changes to the Disclosure Requirements for Fair Value Measurement. ASU 2018-13 updates the disclosure requirements for fair value measurements by modifying or removing certain disclosures and adding certain new disclosures. The amendments are effective for fiscal years, and interim periods within those fiscal years, beginning after December 15, 2019. Early adoption is permitted. Management is currently evaluating the potential impact of this new guidance to the financial statements.
In March 2017, FASB issued ASU No. 2017-08, Premium Amortization on Purchased Callable Debt Securities. ASU 2017-08 shortens the amortization period for certain callable debt securities held at a premium. The amendments require the premium to be amortized to the earliest call date. The amendments do not require an accounting change for securities held at a discount; the discount continues to be amortized to maturity. ASU 2017-08 is effective for fiscal years beginning after December 15, 2018 and for interim periods within those fiscal years . Management is currently evaluating the potential impact of this new guidance to the financial statements.
11. SUBSEQUENT DISTRIBUTIONS
On September 24, 2018, the Fund declared distributions from net investment income to shareholders of record on September 21, 2018. The per share amounts payable on September 25, 2018 were as follows:
| | | | |
| | | Net investment
income | |
Class A | | | $0.03054 | |
Class C | | | 0.02348 | |
Class R6 | | | 0.03412 | |
Administrator Class | | | 0.03138 | |
Institutional Class | | | 0.03366 | |
| | | | |
| 44 | | Wells Fargo Core Plus Bond Fund | | Notes to financial statements |
On October 25, 2018, the Fund declared distributions from net investment income to shareholders of record on October 24, 2018. The per share amounts payable on October 26, 2018 were as follows:
| | | | |
| | | Net investment
income | |
Class A | | | $ 0.01958 | |
Class C | | | 0.01172 | |
Class R6 | | | 0.02353 | |
Administrator Class | | | 0.02066 | |
Institutional Class | | | 0.02302 | |
These distributions are not reflected in the accompanying financial statements.
| | | | | | |
| Report of independent registered public accounting firm | | Wells Fargo Core Plus Bond Fund | | | 45 | |
BOARD OF TRUSTEES AND SHAREHOLDERS OF WELLS FARGO FUNDS TRUST:
Opinion on the Financial Statements
We have audited the accompanying statement of assets and liabilities of Wells Fargo Core Plus Bond Fund (the “Fund”), including the portfolio of investments, as of August 31, 2018, the related statement of operations for the year then ended, the statements of changes in net assets for each of the years in the two-year period then ended, and the related notes (collectively, the “financial statements”) and the financial highlights for each of the years or periods in the five-year period then ended. In our opinion, the financial statements and financial highlights present fairly, in all material respects, the financial position of the Fund as of August 31, 2018, the results of its operations for the year then ended, the changes in its net assets for each of the years in the two-year period then ended, and the financial highlights for each of the years or periods in the five-year period then ended, in conformity with U.S. generally accepted accounting principles.
Basis for Opinion
These financial statements and financial highlights are the responsibility of the Fund’s management. Our responsibility is to express an opinion on these financial statements and financial highlights based on our audits. We are a public accounting firm registered with the Public Company Accounting Oversight Board (United States) (“PCAOB”) and are required to be independent with respect to the Fund in accordance with the U.S. federal securities laws and the applicable rules and regulations of the Securities and Exchange Commission and the PCAOB.
We conducted our audits in accordance with the standards of the PCAOB. Those standards require that we plan and perform the audit to obtain reasonable assurance about whether the financial statements and financial highlights are free of material misstatement, whether due to error or fraud. Our audits included performing procedures to assess the risks of material misstatement of the financial statements and financial highlights, whether due to error or fraud, and performing procedures that respond to those risks. Such procedures included examining, on a test basis, evidence regarding the amounts and disclosures in the financial statements and financial highlights. Such procedures also included confirmation of securities owned as of August 31, 2018, by correspondence with the custodian and brokers, or by other appropriate auditing procedures. Our audits also included evaluating the accounting principles used and significant estimates made by management, as well as evaluating the overall presentation of the financial statements and financial highlights. We believe that our audits provide a reasonable basis for our opinion.

We have not been able to determine the specific year that we began serving as the auditor of one or more Wells Fargo Funds investment companies, however we are aware that we have served as the auditor of one or more Wells Fargo Funds investment companies since at least 1955.
Boston, Massachusetts
October 26, 2018
| | | | |
| 46 | | Wells Fargo Core Plus Bond Fund | | Other information (unaudited) |
TAX INFORMATION
For the fiscal year ended August 31, 2018, $10,869,557 has been designated as interest-related dividends for nonresident alien shareholders pursuant to Section 871 of the Internal Revenue Code.
For the fiscal year ended August 31, 2018, 9.14% of the ordinary income distributed was derived from interest on U.S. government securities.
PROXY VOTING INFORMATION
A description of the policies and procedures that the Fund uses to determine how to vote proxies relating to portfolio securities is available, upon request, by calling 1-800-222-8222, visiting our website at wellsfargofunds.com, or visiting the SEC website at sec.gov. Information regarding how the Fund voted proxies relating to portfolio securities during the most recent 12-month period ended June 30 is available on the Fund’s website at wellsfargofunds.com or by visiting the SEC website at sec.gov.
PORTFOLIO HOLDINGS INFORMATION
The complete portfolio holdings for the Fund are publicly available monthly on the Fund’s website (wellsfargofunds.com), on a one-month delayed basis. In addition, top ten holdings information (excluding derivative positions) for the Fund is publicly available on the Fund’s website on a monthly, seven-day or more delayed basis. The Fund files its complete schedule of portfolio holdings with the SEC for the first and third quarters of each fiscal year on Form N-Q, which is available by visiting the SEC website at sec.gov. In addition, the Fund’s Form N-Q may be reviewed and copied at the SEC’s Public Reference Room in Washington, DC, and at regional offices in New York City, at 233 Broadway, and in Chicago, at 175 West Jackson Boulevard, Suite 900. Information about the Public Reference Room may be obtained by calling 1-800-SEC-0330.
| | | | | | |
| Other information (unaudited) | | Wells Fargo Core Plus Bond Fund | | | 47 | |
BOARD OF TRUSTEES AND OFFICERS
Each of the Trustees and Officers1 listed in the table below acts in identical capacities for each fund in the Wells Fargo family of funds, which consists of 154 mutual funds comprising the Wells Fargo Funds Trust, Wells Fargo Variable Trust, Wells Fargo Master Trust and four closed-end funds (collectively the “Fund Complex”). This table should be read in conjunction with the Prospectus and the Statement of Additional Information2. The mailing address of each Trustee and Officer is 525 Market Street, 12th Floor, San Francisco, CA 94105. Each Trustee and Officer serves an indefinite term, however, each Trustee serves such term until reaching the mandatory retirement age established by the Trustees.
Independent Trustees
| | | | | | |
Name and year of birth | | Position held and length of service* | | Principal occupations during past five years or longer | | Current other public company or
investment company
directorships |
William R. Ebsworth (Born 1957) | | Trustee, since 2015 | | Retired. From 1984 to 2013, equities analyst, portfolio manager, research director and chief investment officer at Fidelity Management and Research Company in Boston, Tokyo, and Hong Kong, and retired in 2013 as Chief Investment Officer of Fidelity Strategic Advisers, Inc. where he led a team of investment professionals managing client assets. Prior thereto, Board member of Hong Kong Securities Clearing Co., Hong Kong Options Clearing Corp., the Thailand International Fund, Ltd., Fidelity Investments Life Insurance Company, and Empire Fidelity Investments Life Insurance Company. Board member of the Vincent Memorial Hospital Endowment (non-profit organization), where he serves on the Investment Committee and as a Chair of the Audit Committee. Mr. Ebsworth is a CFA® charterholder. | | N/A |
Jane A. Freeman (Born 1953) | | Trustee, since 2015; Chair Liaison, since 2018 | | Retired. From 2012 to 2014 and 1999 to 2008, Chief Financial Officer of Scientific Learning Corporation. From 2008 to 2012, Ms. Freeman provided consulting services related to strategic business projects. Prior to 1999, Portfolio Manager at Rockefeller & Co. and Scudder, Stevens & Clark. Board member of the Harding Loevner Funds from 1996 to 2014, serving as both Lead Independent Director and chair of the Audit Committee. Board member of the Russell Exchange Traded Funds Trust from 2011 to 2012 and the chair of the Audit Committee. Ms. Freeman is a Board Member of The Ruth Bancroft Garden (non-profit organization). She is also an inactive Chartered Financial Analyst. | | N/A |
Isaiah Harris, Jr. (Born 1952) | | Trustee, since 2009 | | Retired. Chairman of the Board of CIGNA Corporation since 2009, and Director since 2005. From 2003 to 2011, Director of Deluxe Corporation. Prior thereto, President and CEO of BellSouth Advertising and Publishing Corp. from 2005 to 2007, President and CEO of BellSouth Enterprises from 2004 to 2005 and President of BellSouth Consumer Services from 2000 to 2003. Emeritus member of the Iowa State University Foundation Board of Governors. Emeritus Member of the Advisory Board of Iowa State University School of Business. Advisory Board Member, Palm Harbor Academy (private school). Advisory Board Member, Child Evangelism Fellowship (non-profit). Mr. Harris is a certified public accountant (inactive status). | | CIGNA Corporation |
Judith M. Johnson (Born 1949) | | Trustee, since 2008; Audit Committee Chairman, since 2009 | | Retired. Prior thereto, Chief Executive Officer and Chief Investment Officer of Minneapolis Employees Retirement Fund from 1996 to 2008. Ms. Johnson is an attorney, certified public accountant and a certified managerial accountant. | | N/A |
David F. Larcker (Born 1950) | | Trustee, since 2009 | | James Irvin Miller Professor of Accounting at the Graduate School of Business, Stanford University, Director of the Corporate Governance Research Initiative and Senior Faculty of The Rock Center for Corporate Governance since 2006. From 2005 to 2008, Professor of Accounting at the Graduate School of Business, Stanford University. Prior thereto, Ernst & Young Professor of Accounting at The Wharton School, University of Pennsylvania from 1985 to 2005. | | N/A |
| | | | |
| 48 | | Wells Fargo Core Plus Bond Fund | | Other information (unaudited) |
| | | | | | |
Name and year of birth | | Position held and length of service* | | Principal occupations during past five years or longer | | Current other public company or
investment company
directorships |
Olivia S. Mitchell (Born 1953) | | Trustee, since 2006; Governance Committee Chairman, since 2018 | | International Foundation of Employee Benefit Plans Professor, Wharton School of the University of Pennsylvania since 1993. Director of Wharton’s Pension Research Council and Boettner Center on Pensions & Retirement Research, and Research Associate at the National Bureau of Economic Research. Previously, Cornell University Professor from 1978 to 1993. | | N/A |
Timothy J. Penny (Born 1951) | | Trustee, since 1996; Chairman, since 2018; Vice Chairman, from 2017 to 2018 | | President and Chief Executive Officer of Southern Minnesota Initiative Foundation, a non-profit organization, since 2007. Member of the Board of Trustees of NorthStar Education Finance, Inc., a non-profit organization, since 2007. | | N/A |
James G. Polisson (Born 1959) | | Trustee, since 2018; Advisory Board Member, from 2017 to 2018 | | Retired. Chief Marketing Officer, Source (ETF) UK Services, Ltd, from 2015 to 2017. From 2012 to 2015, Principal of The Polisson Group, LLC, a management consulting, corporate advisory and principal investing company. Chief Executive Officer and Managing Director at Russell Investments, Global Exchange Traded Funds from 2010 to 2012. Managing Director of Barclays Global Investors from 1998 to 2010 and Global Chief Marketing Officer for iShares and Barclays Global Investors from 2000 to 2010. Trustee of the San Francisco Mechanics’ Institute, a non-profit organization, from 2013 to 2015. Board member of the Russell Exchange Traded Fund Trust from 2011 to 2012. Director of Barclays Global Investors Holdings Deutschland GmbH from 2006 to 2009. Mr. Polisson is an attorney and has a retired status with the Massachusetts and District of Columbia Bar Associations. | | N/A |
Michael S. Scofield (Born 1943) | | Trustee, since 2010 | | Served on the Investment Company Institute’s Board of Governors and Executive Committee from 2008-2011 as well the Governing Council of the Independent Directors Council from 2006-2011 and the Independent Directors Council Executive Committee from 2008-2011. Trustee of the Evergreen Fund complex (and its predecessors) from 1984 to 2010. Chairman of the Evergreen Funds from 2000-2010. Former Trustee of the Mentor Funds. Retired Attorney, Law Offices of Michael S. Scofield. | | N/A |
Pamela Wheelock (Born 1959) | | Trustee, since 2018; Advisory Board Member, from 2017 to 2018 | | Chief Operating Officer, Twin Cities Habitat for Humanity, since January, 2017. Vice President of University Services, University of Minnesota from 2012 to 2017. Prior thereto, on the Board of Directors, Governance Committee and Finance Committee for the Minnesota Philanthropy Partners (Saint Paul Foundation) from 2012 to 2018, Interim President and Chief Executive Officer of Blue Cross Blue Shield of Minnesota from 2010 to 2011, Chairman of the Board from 2009 to 2011 and Board Director from 2003 to 2015. Vice President, Leadership and Community Engagement, Bush Foundation, Saint Paul, Minnesota (a private foundation) from 2009 to 2011. Executive Vice President and Chief Financial Officer, Minnesota Sports and Entertainment from 2004 to 2009 and Senior Vice President from 2002 to 2004. Commissioner of Finance, State of Minnesota, from 1999 to 2002. Currently the Board Chair of the Minnesota Wild Foundation since 2010. | | N/A |
| * | Length of service dates reflect the Trustee’s commencement of service with the Trust’s predecessor entities, where applicable. |
| | | | | | |
| Other information (unaudited) | | Wells Fargo Core Plus Bond Fund | | | 49 | |
Officers
| | | | | | |
Name and year of birth | | Position held and length of service | | Principal occupations during past five years or longer | | |
Andrew Owen (Born 1960) | | President, since 2017 | | Executive Vice President of Wells Fargo & Company and Head of Affiliated Managers, Wells Fargo Asset Management, since 2014. In addition, Mr. Owen is currently President, Chief Executive Officer and Director of Wells Fargo Funds Management, LLC since 2017. Prior thereto, Executive Vice President responsible for marketing, investments and product development for Wells Fargo Funds Management, LLC, from 2009 to 2014. | | |
Nancy Wiser1 (Born 1967) | | Treasurer, since 2012 | | Executive Vice President of Wells Fargo Funds Management, LLC since 2011. Chief Operating Officer and Chief Compliance Officer at LightBox Capital Management LLC, from 2008 to 2011. | | |
Alexander Kymn3 (Born 1973) | | Secretary, since 2018; Chief Legal Officer, since 2018 | | Senior Company Counsel of Wells Fargo Bank, N.A. since 2018 (previously Senior Counsel from 2007 to 2018). Vice President of Wells Fargo Funds Management, LLC from 2008 to 2014. | | |
Michael H. Whitaker (Born 1967) | | Chief Compliance Officer, since 2016 | | Senior Vice President and Chief Compliance Officer since 2016. Senior Vice President and Chief Compliance Officer for Fidelity Investments from 2007 to 2016. | | |
David Berardi (Born 1975) | | Assistant Treasurer, since 2009 | | Vice President of Wells Fargo Funds Management, LLC since 2009. Vice President of Evergreen Investment Management Company, LLC from 2008 to 2010. Manager of Fund Reporting and Control for Evergreen Investment Management Company, LLC from 2004 to 2010. | | |
Jeremy DePalma1 (Born 1974) | | Assistant Treasurer, since 2009 | | Senior Vice President of Wells Fargo Funds Management, LLC since 2009. Senior Vice President of Evergreen Investment Management Company, LLC from 2008 to 2010 and head of the Fund Reporting and Control Team within Fund Administration from 2005 to 2010. | | |
| 1 | Nancy Wiser acts as Treasurer of 77 funds in the Fund Complex. Jeremy DePalma acts as Treasurer of 77 funds and Assistant Treasurer of 77 funds in the Fund Complex. |
| 2 | The Statement of Additional Information includes additional information about the Trustees and is available, without charge, upon request, by calling 1-800-222-8222 or by visiting the website at wellsfargofunds.com. |
| 3 | Alexander Kymn became the Secretary and Chief Legal Officer effective April 17, 2018. |
| | | | |
| 50 | | Wells Fargo Core Plus Bond Fund | | Other information (unaudited) |
BOARD CONSIDERATION OF INVESTMENT MANAGEMENT AND SUB-ADVISORY AGREEMENTS:
Wells Fargo Core Plus Bond Fund
Under the Investment Company Act of 1940 (the “1940 Act”), the Board of Trustees (the “Board”) of Wells Fargo Funds Trust (the “Trust”) must determine annually whether to approve the continuation of the Trust’s investment management and sub-advisory agreements. In this regard, at an in-person meeting held on May 22-23, 2018 (the “Meeting”), the Board, all the members of which have no direct or indirect interest in the investment management and sub-advisory agreements and are not “interested persons” of the Trust, as defined in the 1940 Act (the “Independent Trustees”), reviewed and approved for Wells Fargo Core Plus Bond Fund (the “Fund”): (i) an investment management agreement (the “Management Agreement”) with Wells Fargo Funds Management, LLC (“Funds Management”); and (ii) an investment sub-advisory agreement (the “Sub-Advisory Agreement”) with Wells Capital Management Incorporated (the “Sub-Adviser”), an affiliate of Funds Management. The Management Agreement and the Sub-Advisory Agreement are collectively referred to as the “Advisory Agreements.”
At the Meeting, the Board considered the factors and reached the conclusions described below relating to the selection of Funds Management and the Sub-Adviser and the approval of the Advisory Agreements. Prior to the Meeting, including at an in-person meeting in April 2018, the Trustees conferred extensively among themselves and with representatives of Funds Management about these matters. Also, the Board has adopted a team-based approach, with each team consisting of a sub-set of Trustees, to assist the full Board in the discharge of its duties in reviewing investment performance and other matters throughout the year. The Independent Trustees were assisted in their evaluation of the Advisory Agreements by independent legal counsel, from whom they received separate legal advice and with whom they met separately.
In providing information to the Board, Funds Management and the Sub-Adviser were guided by a detailed set of requests for information submitted to them by independent legal counsel on behalf of the Independent Trustees at the start of the Board’s annual contract renewal process earlier in 2018. In considering and approving the Advisory Agreements, the Trustees considered the information they believed relevant, including but not limited to the information discussed below. The Board considered not only the specific information presented in connection with the Meeting, but also the knowledge gained over time through interaction with Funds Management and the Sub-Adviser about various topics. In this regard, the Board reviewed reports of Funds Management at each of its quarterly meetings, which included, among other things, portfolio reviews and investment performance reports. In addition, the Board and the teams mentioned above confer with portfolio managers at various times throughout the year. The Board did not identify any particular information or consideration that was all-important or controlling, and each individual Trustee may have attributed different weights to various factors.
After its deliberations, the Board unanimously approved the continuation of the Advisory Agreements for a one-year term and determined that the compensation payable to Funds Management and the Sub-Adviser under each of the Advisory Agreements was reasonable. The Board considered the approval of the Advisory Agreements for the Fund as part of its consideration of agreements for funds across the complex, but its approvals were made on a fund-by-fund basis. The following summarizes a number of important, but not necessarily all, factors considered by the Board in support of its approvals.
Nature, extent and quality of services
The Board received and considered various information regarding the nature, extent and quality of services provided to the Fund by Funds Management and the Sub-Adviser under the Advisory Agreements. This information included a description of the investment advisory services and Fund-level administrative services covered by the Management Agreement, as well as, among other things, a summary of the background and experience of senior management of Wells Fargo Asset Management (“WFAM”), of which Funds Management and the Sub-Adviser are a part, a summary of investments made in the business of WFAM, a summary of certain organizational and personnel changes involving Funds Management and the Sub-Adviser, and a description of Funds Management’s and the Sub-Adviser’s business continuity planning programs and of their approaches to data privacy and cybersecurity. The Board also considered the qualifications, background, tenure and responsibilities of each of the portfolio managers primarily responsible for the day-to-day portfolio management of the Fund.
The Board evaluated the ability of Funds Management and the Sub-Adviser to attract and retain qualified investment professionals, including research, advisory and supervisory personnel. The Board further considered the compliance programs and compliance records of Funds Management and the Sub-Adviser. In addition, the Board took into account the full range of services provided to the Fund by Funds Management and its affiliates.
| | | | | | |
| Other information (unaudited) | | Wells Fargo Core Plus Bond Fund | | | 51 | |
Fund investment performance and expenses
The Board considered the investment performance results for the Fund over various time periods ended December 31, 2017. The Board considered these results in comparison to the investment performance of funds in a universe that was determined by Broadridge Inc. (“Broadridge”) to be similar to the Fund (the “Universe”), and in comparison to the Fund’s benchmark index and to other comparative data. Broadridge is an independent provider of investment company data. The Board received a description of the methodology used by Broadridge to select the mutual funds in the performance Universe. The Board noted that the investment performance of the Fund (Class A) was higher than the average investment performance of the Universe for all periods under review. The Board also noted that the investment performance of the Fund was higher than its benchmark index, the Bloomberg Barclays U.S. Aggregate Bond Index, for all periods under review. The Board noted that the Fund experienced a portfolio manager change in 2017.
The Board also received and considered information regarding the Fund’s net operating expense ratios and their various components, including actual management fees, custodian and other non-management fees, and Rule 12b-1 and non-Rule 12b-1 shareholder service fees. The Board considered these ratios in comparison to the median ratios of funds in class-specific expense groups that were determined by Broadridge to be similar to the Fund (the “Groups”). The Board received a description of the methodology used by Broadridge to select the mutual funds in the expense Groups and an explanation of how funds comprising expense groups and their expense ratios may vary from year-to-year. Based on the Broadridge reports, the Board noted that the net operating expense ratios of the Fund were lower than the median net operating expense ratios of the expense Groups for each share class.
The Board took into account the Fund’s investment performance and expense information provided to it among the factors considered in deciding to re-approve the Advisory Agreements.
Investment management and sub-advisory fee rates
The Board reviewed and considered the contractual fee rates payable by the Fund to Funds Management under the Management Agreement, as well as the contractual fee rates payable by the Fund to Funds Management for class-level administrative services under a Class-Level Administration Agreement, which include, among other things, class-level transfer agency and sub-transfer agency costs (collectively, the “Management Rates”). The Board also reviewed and considered the contractual investment sub-advisory fee rates that are payable by Funds Management to the Sub-Adviser for investment sub-advisory services.
Among other information reviewed by the Board was a comparison of the Fund’s Management Rates with the average contractual investment management fee rates of funds in the expense Groups at a common asset level as well as transfer agency costs of the funds in the expense Groups. The Board noted that the Management Rates of the Fund were in range of the sum of these average rates for the Fund’s expense Groups for all share classes.
The Board also received and considered information about the portion of the total management fee that was retained by Funds Management after payment of the fee to the Sub-Adviser for sub-advisory services. In assessing the reasonableness of this amount, the Board received and evaluated information about the nature and extent of responsibilities retained and risks assumed by Funds Management and not delegated to or assumed by the Sub-Adviser, and about Funds Management’s on-going oversight services. Given the affiliation between Funds Management and the Sub-Adviser, the Board ascribed limited relevance to the allocation of fees between them.
The Board also received and considered information about the nature and extent of services offered and fee rates charged by Funds Management and the Sub-Adviser to other types of clients with investment strategies similar to those of the Fund. In this regard, the Board received information about the significantly greater scope of services, and compliance, reporting and other legal burdens and risks of managing mutual funds compared with those associated with managing assets of non-mutual fund clients such as institutional separate accounts.
Based on its consideration of the factors and information it deemed relevant, including those described here, the Board determined that the compensation payable to Funds Management under the Management Agreement and to the Sub-Adviser under the Sub-Advisory Agreement was reasonable.
Profitability
The Board received and considered information concerning the profitability of Funds Management, as well as the profitability of both WFAM and Wells Fargo & Co. (“Wells Fargo”) as a whole, from providing services to the Fund and the fund family as a whole. The Board noted that the Sub-Adviser’s profitability information with respect to providing services to the Fund was subsumed in the WFAM and Wells Fargo profitability analysis.
| | | | |
| 52 | | Wells Fargo Core Plus Bond Fund | | Other information (unaudited) |
Funds Management reported on the methodologies and estimates used in calculating profitability, including a description of the methodology used to allocate certain expenses and recent enhancements made to the methodology. Among other things, the Board noted that the levels of profitability reported on a fund-by-fund basis varied widely, depending on factors such as the size and type of fund. Based on its review, the Board did not deem the profits reported by Funds Management, WFAM or Wells Fargo from services provided to the Fund to be at a level that would prevent it from approving the continuation of the Advisory Agreements.
Economies of scale
The Board considered the extent to which Funds Management may experience economies of scale in the provision of management services, and the extent to which scale benefits, if any, would be shared with shareholders. In particular, the Board noted the existence of breakpoints in the Fund’s management fee structure, which operate generally to reduce the Fund’s expense ratios as the Fund grows in size. It considered that, for a small fund or a fund that shrinks in size, breakpoints conversely can result in higher fee levels. The Board also considered that in addition to management fee breakpoints, competitive management fee rates set at the outset without regard to breakpoints and fee waiver and expense reimbursement arrangements, as well as investments in the business intended to enhance services available to Fund shareholders, are means of sharing potential economies of scale with shareholders of the Fund.
The Board concluded that the Fund’s fee and expense arrangements, including contractual breakpoints, constituted a reasonable approach to sharing potential economies of scale with the Fund and its shareholders.
Other benefits to Funds Management and the Sub-Adviser
The Board received and considered information regarding potential “fall-out” or ancillary benefits received by Funds Management and its affiliates, including the Sub-Adviser, as a result of their relationships with the Fund. Ancillary benefits could include, among others, benefits directly attributable to other relationships with the Fund and benefits potentially derived from an increase in Funds Management’s and the Sub-Adviser’s business as a result of their relationships with the Fund. The Board noted that various affiliates of Funds Management may receive distribution-related fees, shareholder servicing payments and sub-transfer agency fees in respect of shares sold or held through them and services provided.
The Board also reviewed information about soft dollar credits earned and utilized by the Sub-Adviser, fees earned by Funds Management and the Sub-Adviser from managing a private investment vehicle for the fund family’s securities lending collateral and commissions earned by an affiliated broker from portfolio transactions.
Based on its consideration of the factors and information it deemed relevant, including those described here, the Board did not find that any ancillary benefits received by Funds Management and its affiliates, including the Sub-Adviser, were unreasonable.
Conclusion
At the Meeting, after considering the above-described factors and based on its deliberations and its evaluation of the information described above, the Board unanimously approved the continuation of the Advisory Agreements for a one-year term and determined that the compensation payable to Funds Management and the Sub-Adviser under each of the Advisory Agreements was reasonable.
| | | | | | |
| Appendix A (unaudited) | | Wells Fargo Core Plus Bond Fund | | | 53 | |
SALES CHARGE REDUCTIONS AND WAIVERS FOR CERTAIN INTERMEDIARIES
Ameriprise
Effective June 1, 2018, shareholders purchasing Fund shares through an Ameriprise Financial platform or account will be eligible only for the following Class A load waivers (front-end sales charge waivers), which may differ from those disclosed elsewhere in the Fund’s prospectus or Statement of Additional Information.
Front-end Sales Load Waivers on Class A Shares Available at Ameriprise Financial
| | • | | Employer-sponsored retirement plans (e.g., 401(k) plans, 457 plans, employer-sponsored 403(b) plans, profit sharing and money purchase pension plans and defined benefit plans). For purposes of this provision, employer-sponsored retirement plans do not include SEP IRAs, Simple IRAs or SAR-SEPs. |
| | • | | Shares purchased through an Ameriprise Financial investment advisory program (if an Advisory or similar share class for such investment advisory program is not available) |
| | • | | Shares purchased by third party investment advisors on behalf of their advisory clients through Ameriprise Financial’s platform (if an Advisory or similar share class for such investment advisory program is not available) |
| | • | | Shares purchased through reinvestment of distributions and dividend reinvestment when purchasing shares of the same Fund (but not any other fund within the same fund family) |
| | • | | Shares exchanged from Class C shares of the same fund in the month of or following the 10-year anniversary of the purchase date. To the extent that the Fund’s prospectus elsewhere provides for a waiver with respect to such shares following a shorter holding period, that waiver will apply to exchanges following such shorter period. To the extent that the Fund’s prospectus elsewhere provides for a waiver with respect to exchanges of Class C shares for load-waived shares, that waiver will also apply to such exchanges. |
| | • | | Employees and registered representatives of Ameriprise Financial or its affiliates and their immediate family members |
| | • | | Shares purchased by or through qualified accounts (including IRAs, Coverdell Education Savings Accounts, 401(k)s, 403(b) TSCAs subject to ERISA and defined benefit plans) that are held by a covered family member, defined as an Ameriprise financial advisor and/or the advisor’s spouse, advisor’s lineal ascendant (mother, father, grandmother, grandfather, great grandmother, great grandfather), advisor’s lineal descendant (son, step-son, daughter, step-daughter, grandson, granddaughter, great grandson, great granddaughter) or any spouse of a covered family member who is a lineal descendant |
| | • | | Shares purchased from the proceeds of redemptions within the same fund family, provided (1) the repurchase occurs within 90 days following the redemption, (2) the redemption and purchase occur in the same account, and (3) redeemed shares were subject to a front-end or deferred sales load (i.e. Rights of Reinstatement). Subject to the Fund’s policy regarding frequent purchases and redemptions of Fund shares, you may not be able to repurchase shares for the first 30 days after your redemption. |
Automatic Exchange of Class C Shares Available at Ameriprise Financial
| | • | | Class C shares will automatically exchange to Class A shares in the month of the 10-year anniversary of the purchase date. |
Merrill Lynch
Effective April 10, 2017, shareholders purchasing Fund shares through a Merrill Lynch platform or account will be eligible only for the following load waivers (front-end sales charge waivers and contingent deferred, or back-end, sales charge waivers) and discounts, which may differ from those disclosed elsewhere in the Fund’s prospectus or Statement of Additional Information.
Front-end Sales Load Waivers on Class A Shares available at Merrill Lynch
| | • | | Employer-sponsored retirement, deferred compensation and employee benefit plans (including health savings accounts) and trusts used to fund those plans, provided that the shares are not held in a commission-based brokerage account and shares are held for the benefit of the plan |
| | • | | Shares purchased by or through a 529 Plan |
| | • | | Shares purchased through a Merrill Lynch affiliated investment advisory program |
| | | | |
| 54 | | Wells Fargo Core Plus Bond Fund | | Appendix A (unaudited) |
| | • | | Shares purchased by third party investment advisors on behalf of their advisory clients through Merrill Lynch’s platform |
| | • | | Shares of funds purchased through the Merrill Edge Self-Directed platform (if applicable) |
| | • | | Shares purchased through reinvestment of capital gains distributions and dividend reinvestment when purchasing shares of the same fund (but not any other fund within the fund family) |
| | • | | Shares exchanged from Class C (i.e. level-load) shares of the same fund in the month of or following the 10-year anniversary of the purchase date |
| | • | | Employees and registered representatives of Merrill Lynch or its affiliates and their family members, as defined by Merrill Lynch, which may differ from the definition of family member in the Fund’s prospectus. |
| | • | | Directors or Trustees of the Fund, and employees of the Fund’s investment adviser or any of its affiliates, as described in the Fund’s prospectus |
| | • | | Shares purchased from the proceeds of redemptions within the same fund family, provided (1) the repurchase occurs within 90 days following the redemption, (2) the redemption and purchase occur in the same account, and (3) redeemed shares were subject to a front-end or deferred sales load (known as Rights of Reinstatement). Subject to the Fund’s policy regarding frequent purchases and redemptions of Fund shares, you may not be able to repurchase shares for the first 30 days after your redemption. |
CDSC Waivers on A, B and C Shares available at Merrill Lynch
| | • | | Death or disability of the shareholder |
| | • | | Shares sold as part of a systematic withdrawal plan as described in the Fund’s prospectus |
| | • | | Return of excess contributions from an IRA Account |
| | • | | Shares sold as part of a required minimum distribution for IRA and retirement accounts due to the shareholder reaching age 70½ |
| | • | | Shares sold to pay Merrill Lynch fees but only if the transaction is initiated by Merrill Lynch |
| | • | | Shares acquired through a right of reinstatement |
| | • | | Shares held in retirement brokerage accounts, that are exchanged for a lower cost share class due to transfer to certain fee based accounts or platforms (applicable to A and C shares only) |
Front-end load Discounts Available at Merrill Lynch: Breakpoints, Rights of Accumulation & Letters of Intent
| | • | | Breakpoints as described in the Fund’s prospectus |
| | • | | Rights of Accumulation (ROA) which entitle shareholders to breakpoint discounts will be automatically calculated based on the aggregated holding of fund family assets held by accounts within the purchaser’s household at Merrill Lynch. Eligible fund family assets not held at Merrill Lynch may be included in the ROA calculation only if the shareholder notifies his or her financial advisor about such assets. |
| | • | | Letters of Intent (LOI) which allow for breakpoint discounts based on anticipated purchases within a fund family, through Merrill Lynch, over a 13-month period of time (if applicable) |
Morgan Stanley
Effective on or about July 1, 2018, shareholders purchasing Fund shares through a Morgan Stanley Wealth Management transactional brokerage account will be eligible only for the following Class A load waivers (front-end sales charge waivers), which may differ from and be more limited than those disclosed in the Fund’s prospectus or Statement of Additional Information.
Front-end Sales Load Waivers on Class A Shares Available at Morgan Stanley
| | • | | Employer-sponsored retirement plans (e.g., 401(k) plans, 457 plans, employer-sponsored 403(b) plans, profit sharing and money purchase pension plans and defined benefit plans). For purposes of this provision, employer-sponsored retirement plans do not include SEP IRAs, Simple IRAs, SAR-SEPs or Keogh plans. |
| | • | | Morgan Stanley employee and employee-related accounts according to Morgan Stanley’s account linking rules |
| | • | | Shares purchased through reinvestment of dividends and capital gains distributions when purchasing shares of the same fund |
| | • | | Shares purchased through a Morgan Stanley self-directed brokerage account |
| | | | | | |
| Appendix A (unaudited) | | Wells Fargo Core Plus Bond Fund | | | 55 | |
| | • | | Class C (i.e., level-load) shares that are no longer subject to a contingent deferred sales charge and are exchanged to Class A shares of the same fund pursuant to Morgan Stanley Wealth Management’s share class exchange program. |
| | • | | Shares purchased from the proceeds of redemptions within the same fund family, provided (i) the repurchase occurs within 90 days following the redemption, (ii) the redemption and purchase occur in the same account, and (iii) redeemed shares were subject to a front-end or deferred sales charge. This waiver is subject to the Fund’s policy regarding frequent purchases and redemption of Fund shares, as discussed under “Account Information—Frequent Purchases and Redemptions of Fund Shares” in the Fund’s prospectus. |
This page is intentionally left blank.

For more information
More information about Wells Fargo Funds is available free upon request. To obtain literature, please write, visit the Fund’s website, or call:
Wells Fargo Funds
P.O. Box 219967
Kansas City, MO 64121-9967
Website: wellsfargofunds.com
Individual investors: 1-800-222-8222
Retail investment professionals: 1-888-877-9275
Institutional investment professionals: 1-866-765-0778
This report and the financial statements contained herein are submitted for the general information of the shareholders of the Fund. If this report is used for promotional purposes, distribution of the report must be accompanied or preceded by a current prospectus. Before investing, please consider the investment objectives, risks, charges, and expenses of the investment. For a current prospectus and, if available, a summary prospectus, containing this information, call 1-800-222-8222 or visit the Fund’s website at wellsfargofunds.com. Read the prospectus carefully before you invest or send money.
Wells Fargo Asset Management (WFAM) is the trade name for certain investment advisory/management firms owned by Wells Fargo & Company. These firms include but are not limited to Wells Capital Management Incorporated and Wells Fargo Funds Management, LLC. Certain products managed by WFAM entities are distributed by Wells Fargo Funds Distributor, LLC (a broker/dealer and Member FINRA).
This material is for general informational and educational purposes only and is NOT intended to provide investment advice or a recommendation of any kind—including a recommendation for any specific investment, strategy, or plan.
NOT FDIC INSURED ◾ NO BANK GUARANTEE ◾ MAY LOSE VALUE
© 2018 Wells Fargo Funds Management, LLC. All rights reserved.
| | |
 | | 315407 10-18 A219/AR219 08-18 |
Annual Report
August 31, 2018

Wells Fargo
Short Duration Government Bond Fund


Reduce clutter. Save trees.
Sign up for electronic delivery of prospectuses and shareholder reports at wellsfargo.com/advantagedelivery
Contents
The views expressed and any forward-looking statements are as of August 31, 2018, unless otherwise noted, and are those of the Fund managers and/or Wells Fargo Funds Management, LLC. Discussions of individual securities, or the markets generally, or any Wells Fargo Fund are not intended as individual recommendations. Future events or results may vary significantly from those expressed in any forward-looking statements. The views expressed are subject to change at any time in response to changing circumstances in the market. Wells Fargo Funds Management, LLC and the Fund disclaim any obligation to publicly update or revise any views expressed or forward-looking statements.
NOT FDIC INSURED ◾ NO BANK GUARANTEE ◾ MAY LOSE VALUE
| | | | |
| 2 | | Wells Fargo Short Duration Government Bond Fund | | Letter to shareholders (unaudited) |

Andrew Owen
President
Wells Fargo Funds
After advancing during 2017, economic growth and stock markets globally diverged during the first eight months of 2018.
Dear Shareholder:
We are pleased to offer you this annual report for the Wells Fargo Short Duration Government Bond Fund for the 12-month period that ended August 31, 2018. After advancing during 2017, economic growth and stock markets globally diverged during the first eight months of 2018. For fixed-income investors, taxable bond returns suffered and high-yield and municipal bond returns were positive.
For the period, U.S. stocks, as measured by the S&P 500 Index,1 gained 19.66%, and international stocks, as measured by the MSCI ACWI ex USA Index (Net),2 added 3.18%. Based on the MSCI EM Index (Net),3 emerging market stocks lost 0.68%. For bond investors, the Bloomberg Barclays U.S. Aggregate Bond Index4 declined 1.05% while the Bloomberg Barclays Global Aggregate ex-USD Index5 fell 1.64%. The Bloomberg Barclays Municipal Bond Index6 added 0.49%, and the ICE BofAML U.S. High Yield Index7 was up 3.26%.
Continued optimism in the U.S. characterized the fourth quarter of 2017.
Some observers described economic conditions in late 2017 as a Goldilocks scenario: synchronized global growth, low inflation, healthy corporate earnings, and a weaker U.S. dollar that supported international growth. During the quarter, the U.S. Bureau of Economic Analysis reported that annualized U.S. gross domestic product (GDP) growth for the third quarter of 2017 was 2.8% and inflation remained below U.S. Federal Reserve (Fed) targets. U.S. corporate earnings and consumer confidence improved.
Economic momentum increased in Europe. The Bank of England (BOE) raised interest rates in November 2017 to 0.50%, the first increase in more than 10 years, indicating confidence in the economy’s growth potential. Meanwhile, the European Central Bank and the Bank of Japan kept interest rates low to spur business activities and bought bonds in an effort to encourage equity investments. The People’s Bank of China’s (PBOC’s) policies sought to stimulate business. Many emerging market economies benefited from stronger currencies versus the U.S. dollar, while commodity price increases benefited countries that rely on natural resources for exports.
| 1 | The S&P 500 Index consists of 500 stocks chosen for market size, liquidity, and industry group representation. It is a market-value-weighted index with each stock’s weight in the index proportionate to its market value. You cannot invest directly in an index. |
| 2 | The Morgan Stanley Capital International (MSCI) All Country World Index (ACWI) ex USA Index (Net) is a free-float-adjusted market-capitalization-weighted index that is designed to measure the equity market performance of developed markets, excluding the United States and Canada. Source: MSCI. MSCI makes no express or implied warranties or representations and shall have no liability whatsoever with respect to any MSCI data contained herein. The MSCI data may not be further redistributed or used as a basis for other indices or any securities or financial products. This report is not approved, reviewed, or produced by MSCI. You cannot invest directly in an index. |
| 3 | The MSCI Emerging Markets (EM) Index (Net) is a free-float-adjusted market-capitalization-weighted index that is designed to measure large- and mid-cap equity market performance of emerging markets. The MSCI EM Index (Net) consists of the following 24 emerging market country indices: Brazil, Chile, China, Colombia, Czech Republic, Egypt, Greece, Hungary, India, Indonesia, Korea, Malaysia, Mexico, Pakistan, Peru, the Philippines, Poland, Qatar, Russia, South Africa, Taiwan, Thailand, Turkey, and the United Arab Emirates. You cannot invest directly in an index. |
| 4 | The Bloomberg Barclays U.S. Aggregate Bond Index is a broad-based benchmark that measures the investment-grade, U.S. dollar-denominated, fixed-rate taxable bond market, including Treasuries, government-related and corporate securities, mortgage-backed securities (agency fixed-rate and hybrid adjustable-rate mortgage pass-throughs), asset-backed securities, and commercial mortgage-backed securities. You cannot invest directly in an index. |
| 5 | The Bloomberg Barclays Global Aggregate ex-USD Index is an unmanaged index that provides a broad-based measure of the global investment-grade fixed-income markets excluding the U.S. dollar-denominated debt market. You cannot invest directly in an index. |
| 6 | The Bloomberg Barclays Municipal Bond Index is an unmanaged index composed of long-term tax-exempt bonds with a minimum credit rating of Baa. You cannot invest directly in an index. |
| 7 | The ICE BofAML U.S. High Yield Index is a market-capitalization-weighted index of domestic and Yankee high-yield bonds. The index tracks the performance of high-yield securities traded in the U.S. bond market. You cannot invest directly in an index. Copyright 2018. ICE Data Indices, LLC. All rights reserved. |
| | | | | | |
| Letter to shareholders (unaudited) | | Wells Fargo Short Duration Government Bond Fund | | | 3 | |
Volatility reemerged during the first quarter of 2018 as global tensions and inflation fears increased.
Stock market gains in January 2018 followed the passage of lower U.S. tax rates. Some investors then grew concerned about trade, particularly between the U.S. and China, and the specter of inflation. The Fed followed its 25-basis-point (bp; 100 bps equal 1.00%) federal funds rate increase in December 2017 with a further 25-bp increase in March 2018. The inflation rate in March reached the Fed’s 2% target for the first time in a year.
The S&P 500 Index closed the first quarter with a negative return, the first negative quarterly return for the index since 2014. Overseas investment markets reversed strong returns in 2017, hurt by a stronger U.S. dollar and mounting trade and diplomatic tensions. After gaining 27.19% for the 12-month period that ended December 31, 2017, the MSCI ACWI ex USA Index (Net) declined 1.81% for the quarter that ended March 31, 2018.
Global trade tensions escalated during the second quarter.
Global trade tensions escalated throughout the second quarter of 2018. The U.S. government imposed tariffs, and foreign governments in North America, Europe, and Asia retaliated. The escalating tensions chilled investment activity as observers awaited signals of next steps.
Meanwhile, inflation continued an upward trend. The CPI-U8 added 0.1% in June after increases of 0.2% in both April and May. On a year-over-year basis, the all-items index rose 2.9% for the 12 months that ended June 30, 2018. The index for all items less food and energy rose 2.3% for the same 12-month period.
U.S. stocks gained while international stocks and bonds declined during the summer of 2018.
The U.S. economy strengthened during the summer months. Revised second-quarter GDP data released in August showed the U.S. economy growing at a 4.2% rate. After ticking up slightly in June, the unemployment rate in the U.S. was 3.9% in July and August, according to the U.S. Department of Labor. Wages showed more consistent growth than they had in recent quarters, and consumer confidence remained strong.
Several U.S. equity market indices reached records during August, with the S&P 500 Index gaining 7.76% for the three-month period that ended August 31, 2018. International stock values continued to suffer under the effects of a strong U.S. dollar and continuing trade tensions. The MSCI ACWI ex USA Index (Net) and the MSCI EM Index (Net) were down 4.70% and 1.64%, respectively, during the same three-month period.
The Fed increased the federal funds rate in June, and expectations grew that two more rate increases were in the offing in 2018. Long-term interest rates in the U.S. remained at higher levels relative to the prior 10 years. Rates on 10-year and 30-year Treasury bonds—2.46% and 2.81%, respectively, on January 1, 2018—were 2.86% and 3.02%, respectively, on August 31, off their peak levels on May 17, 2018, of 3.11% and 3.25%, respectively. Some investors became more aware of and concerned about the potential for an inverted yield curve—sometimes a recession signal—as short-term rates increased more quickly than long-term rates. The Fed decided to forgo an interest rate increase at its August meeting.
The S&P 500 Index closed the first quarter with a negative return, the first negative quarterly return for the index since 2014.
| 8 | The Consumer Price Index for All Urban Consumers (CPI-U) measures the changes in the price of a basket of goods and services purchased by urban consumers. The urban consumer population is deemed by many as a better representative measure of the general public because close to 90% of the country’s population lives in highly populated areas. You cannot invest directly in an index. |
| | | | |
| 4 | | Wells Fargo Short Duration Government Bond Fund | | Letter to shareholders (unaudited) |
Internationally, members of Prime Minister Theresa May’s U.K./Brexit negotiating team resigned amid unproductive negotiations. In early August, the BOE’s Monetary Policy Committee increased its key interest rate to 0.75%. Central banks in Europe and Japan maintained low interest rates and accommodative monetary policies. Amid rising trade uncertainty, the PBOC cut reserve requirement ratios and accelerated infrastructure spending and tax cuts for business enterprises and individuals. Nevertheless, a strengthening U.S. dollar and the trade tensions remained headwinds for investors overseas.
Don’t let short-term uncertainty derail long-term investment goals.
Periods of investment uncertainty can present challenges, but experience has taught us that maintaining long-term investment goals can be an effective way to plan for the future. To help you create a sound strategy based on your personal goals and risk tolerance, Wells Fargo Funds offers more than 100 mutual funds spanning a wide range of asset classes and investment styles. Although diversification cannot guarantee an investment profit or prevent losses, we believe it can be an effective way to manage investment risk and potentially smooth out overall portfolio performance. We encourage investors to know their investments and to understand that appropriate levels of risk-taking may unlock opportunities.
Thank you for choosing to invest with Wells Fargo Funds. We appreciate your confidence in us and remain committed to helping you meet your financial needs.
Sincerely,

Andrew Owen
President
Wells Fargo Funds
Notice to shareholders
| | ∎ | | At a meeting held on May 22-23, 2018, the Board of Trustees of the Fund approved changes to the Fund’s Class A sales charge schedule, effective August 1, 2018. In connection with this change, the net asset value (NAV) breakpoint was lowered from $500,000 to $250,000 and NAV purchases of $250,000 or more redeemed within 12 months of purchase are assessed a contingent deferred sales charge (CDSC) of 0.40%. There is no change for purchase amounts below this breakpoint. Beginning August 1, 2018, any purchases made by a shareholder with an active Letter of Intent (LOI) are subject to the terms of the new load schedule. | |
| | ∎ | | At a meeting held on August 14-15, 2018, the Board of Trustees of the Fund approved the following policy which will be effective on or about February 5, 2019: | |
Class C shares will convert automatically into Class A shares ten years after the initial date of purchase or, if you acquired your Class C shares through an exchange or conversion from another share class, ten years after the date you acquired your Class C shares. When Class C shares that you acquired through a purchase or exchange convert, any other Class C shares that you purchased with reinvested dividends and distributions also will convert into Class A shares on a pro rata basis. A shorter holding period may also apply depending on your intermediary. Please see “Appendix A—Sales Charge Reductions and Waivers for Certain Intermediaries” in the Fund’s prospectus or at the end of this report.
For further information about your Fund, contact your investment professional, visit our website at wellsfargofunds.com, or call us directly at 1-800-222-8222.
This page is intentionally left blank.
| | | | |
| 6 | | Wells Fargo Short Duration Government Bond Fund | | Performance highlights (unaudited) |
Investment objective
The Fund seeks to provide current income consistent with capital preservation.
Manager
Wells Fargo Funds Management, LLC
Subadviser
Wells Capital Management Incorporated
Portfolio managers
Maulik Bhansali, CFA®‡
Thomas O’Connor, CFA®
Jarad Vasquez‡
Average annual total returns (%) as of August 31, 20181
| | | | | | | | | | | | | | | | | | | | | | | | | | | | | | | | | | |
| | | | | Including sales charge | | | Excluding sales charge | | | Expense ratios2 (%) | |
| | | Inception date | | 1 year | | | 5 year | | | 10 year | | | 1 year | | | 5 year | | | 10 year | | | Gross | | | Net3 | |
| Class A (MSDAX) | | 3-11-1996 | | | (2.55 | ) | | | 0.07 | | | | 1.47 | | | | (0.56 | ) | | | 0.47 | | | | 1.68 | | | | 0.79 | | | | 0.78 | |
| Class C (MSDCX) | | 5-31-2002 | | | (2.30 | ) | | | (0.27 | ) | | | 0.93 | | | | (1.30 | ) | | | (0.27 | ) | | | 0.93 | | | | 1.54 | | | | 1.53 | |
| Class R6 (MSDRX) | | 11-30-2012 | | | – | | | | – | | | | – | | | | (0.14 | ) | | | 0.89 | | | | 2.13 | | | | 0.41 | | | | 0.37 | |
| Administrator Class (MNSGX) | | 12-18-1992 | | | – | | | | – | | | | – | | | | (0.37 | ) | | | 0.66 | | | | 1.90 | | | | 0.73 | | | | 0.60 | |
| Institutional Class (WSGIX) | | 4-8-2005 | | | – | | | | – | | | | – | | | | (0.20 | ) | | | 0.86 | | | | 2.08 | | | | 0.46 | | | | 0.42 | |
| Bloomberg Barclays U.S. 1-3 Year Government Bond Index4 | | – | | | – | | | | – | | | | – | | | | (0.05 | ) | | | 0.64 | | | | 1.28 | | | | – | | | | – | |
Figures quoted represent past performance, which is no guarantee of future results, and do not reflect taxes that a shareholder may pay on fund distributions or the redemption of fund shares. Investment return and principal value of an investment will fluctuate so that an investor’s shares, when redeemed, may be worth more or less than their original cost. Performance shown without sales charges would be lower if sales charges were reflected. Current performance may be lower or higher than the performance data quoted, which assumes the reinvestment of dividends and capital gains. Current month-end performance is available on the Fund’s website, wellsfargofunds.com.
Index returns do not include transaction costs associated with buying and selling securities, any mutual fund fees or expenses, or any taxes. It is not possible to invest directly in an index.
For Class A shares, the maximum front-end sales charge is 2.00%. For Class C shares, the maximum contingent deferred sales charge is 1.00%. Performance including a contingent deferred sales charge assumes the sales charge for the corresponding time period. Class R6, Administrator Class, and Institutional Class shares are sold without a front-end sales charge or contingent deferred sales charge.
Bond values fluctuate in response to the financial condition of individual issuers, general market and economic conditions, and changes in interest rates. Changes in market conditions and government policies may lead to periods of heightened volatility in the bond market and reduced liquidity for certain bonds held by the Fund. In general, when interest rates rise, bond values fall and investors may lose principal value. Interest rate changes and their impact on the Fund and its share price can be sudden and unpredictable. Securities issued by U.S. government agencies or government sponsored entities may not be guaranteed by the U.S. Treasury. Certain investment strategies tend to increase the total risk of an investment (relative to the broader market). The Fund is exposed to mortgage- and asset-backed securities risk. The U.S. government guarantee applies to certain underlying securities and not to shares of the Fund. Consult the Fund’s prospectus for additional information on these and other risks.
Please see footnotes on page 7.
| | | | | | |
| Performance highlights (unaudited) | | Wells Fargo Short Duration Government Bond Fund | | | 7 | |
|
| Growth of $10,000 investment as of August 31, 20185 |
|
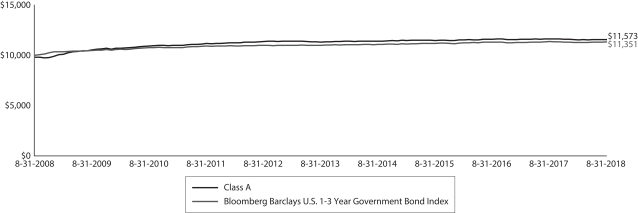 |
| ‡ | Mr. Bhansali and Mr. Vasquez became portfolio managers of the Fund on October 16, 2017. |
| 1 | Historical performance shown for Class R6 shares prior to their inception reflects the performance of Institutional Class shares and includes the higher expenses applicable to Institutional Class shares. If these expenses had not been included, returns for Class R6 shares would be higher. |
| 2 | Reflects the expense ratios as stated in the most recent prospectuses. The expense ratios shown are subject to change and may differ from the annualized expense ratios shown in this report. |
| 3 | The manager has contractually committed through December 31, 2018, to waive fees and/or reimburse expenses to the extent necessary to cap the Fund’s Total Annual Fund Operating Expenses After Fee Waivers at the amounts shown. After this time, the cap may be increased or the commitment to maintain the cap may be terminated only with the approval of the Board of Trustees. Brokerage commissions, stamp duty fees, interest, taxes, acquired fund fees and expenses (if any), and extraordinary expenses are excluded from the expense cap. Without this cap, the Fund’s returns would have been lower. The expense ratio paid by an investor is the net expense ratio (the total annual fund operating expenses after fee waivers) as stated in the prospectuses. |
| 4 | The Bloomberg Barclays U.S. 1–3 Year Government Bond Index is composed of all publicly issued, nonconvertible domestic debt of the U.S. government and its agencies. The index also includes corporate debt guaranteed by the U.S. government. Only notes and bonds with a minimum maturity of one year up to a maximum maturity of 2.9 years are included. You cannot invest directly in an index. |
| 5 | The chart compares the performance of Class A shares for the most recent ten years with the performance of the Bloomberg Barclays U.S. 1–3 Year Government Bond Index. The chart assumes a hypothetical investment of $10,000 in Class A shares and reflects all operating expenses and assumes the maximum initial sales charge of 2.00%. |
| 6 | The ten largest holdings, excluding cash, cash equivalents and any money market funds, are calculated based on the value of the investments divided by total net assets of the Fund. Holdings are subject to change and may have changed since the date specified. |
| 7 | The Chicago Board Options Exchange Market Volatility Index (CBOE VIX) is a popular measure of the implied volatility of S&P 500 Index options. It represents one measure of the market’s expectation of stock market volatility over the next 30-day period. You cannot invest directly in an index. |
| 8 | Amounts are calculated based on the total long-term investments of the Fund. These amounts are subject to change and may have changed since the date specified. |
| | | | |
| 8 | | Wells Fargo Short Duration Government Bond Fund | | Performance highlights (unaudited) |
MANAGER’S DISCUSSION
Fund highlights
| ∎ | | The Fund underperformed its benchmark, the Bloomberg Barclays U.S. 1–3 Year Government Bond Index, for the 12-month period that ended August 31, 2018. |
| ∎ | | Yield-curve positioning was a slight detractor for the 12-month period, as the Fund was overweight longer-duration risk and underweight two-year risk versus the benchmark based on our bottom-up security research and selection. |
| ∎ | | Security selection within agency mortgage-backed pass-through securities and asset-backed securities (ABS) were the largest contributors to performance. |
| ∎ | | The Fund has out-of-benchmark allocations to high-quality ABS and commercial mortgage-backed securities (CMBS). These sector allocations also contributed to results. |
| | | | |
| Ten largest holdings (%) as of August 31, 20186 | |
U.S. Treasury Note, 2.63%, 7-15-2021 | | | 8.09 | |
GNMA, 5.00%, 7-20-2048 | | | 6.61 | |
U.S. Treasury Note, 2.75%, 8-15-2021 | | | 6.45 | |
U.S. Treasury Note, 1.63%, 10-15-2020 | | | 5.46 | |
FNMA, 4.00%, 9-1-2033 | | | 4.77 | |
U.S. Treasury Note, 2.63%, 7-31-2020 | | | 4.12 | |
GNMA , 5.00%, 8-20-2048 | | | 3.80 | |
FNMA, 3,00%, 7-1-2026 | | | 3.76 | |
U.S. Treasury Note, 2.50%, 5-31-2020 | | | 3.05 | |
U.S. Treasury Note, 2.38%, 4-30-2020 | | | 2.15 | |
The economy and markets were favorable.
Early during the period, trends of low volatility and a healthy risk appetite prevailed. Credit spreads continued a one-way path tighter as the CBOE VIX7 declined to single-digit territory toward year-end 2017. Following the apparent shelving of health care reform legislation in the fourth quarter, markets quickly turned attention to the selection of the seemingly dovish Jerome Powell as U.S. Federal Reserve (Fed) chairman and, relatedly, the Fed’s continuing interest rate tightening campaign; the looming reversal of central bank stimulus in a number of global markets; and a policy focus toward tax reform in the U.S., with ever-shifting speculation and headlines regarding the timing, likelihood, and details of tax-reform legislation influencing risk-on appetites.
As we turned the calendar to 2018, investors saw negative returns for fixed income as bond yields rose sharply across the globe, driven by fears of emerging inflation and the upcoming reversal of central bank stimulus. In early February, risk sentiment shifted rapidly. U.S. Treasury yields marched higher for the second consecutive month, and risk assets, including equities and high-yield bonds, sold off sharply due to fears about both monetary and trade policies.
Following months of rising rates that weighed on bond prices in the first several months of the year, fixed income rebounded somewhat as U.S. Treasury yields retraced some ground. The 10-year Treasury ended the period at 2.86%, 45 basis points (bps; 100 bps equal 1.00%) higher since the start of the year, after piercing the 3.00% threshold earlier in May. The curve of the 2-year to 10-year section of the Treasury yield curve flattened to 23 bps at the end of August, a level not seen since just before the financial crisis.
As widely anticipated at its June meeting, the Fed raised its federal funds target rate by 25 bps, the third such increase since our last annual review and the second in 2018 under the leadership of Fed Chair Powell. While appeasing those with a more hawkish bent by signaling additional rate increases throughout the year, the Fed continues with a somewhat dovish tone, indicating that any moves could be data-dependent and gradual, perhaps resulting in small adjustments occurring over a more prolonged period of time, potentially extending into next year.
In Washington, President Trump directed the U.S. trade representative to level tariffs on more than $200 billion worth of Chinese imports following a seven-month investigation into Chinese trade abuses with a focus on intellectual property theft. Trade tensions worsened during the summer months, and the Trump administration stands ready to impose even more tariffs as negotiations with China continue.
In Italy, anti-European remarks by emerging Italian populist leaders sent bond and currency markets into a frenzy during May. The rhetoric sets the stage for a showdown between authorities in Rome and officials in Berlin and Brussels over the issue of deficit spending and will likely challenge the fiscal framework of the European Union.
Please see footnotes on page 7.
| | | | | | |
| Performance highlights (unaudited) | | Wells Fargo Short Duration Government Bond Fund | | | 9 | |
Emerging markets—both debt and equity—continued their slide during the summer months while U.S. stock indices moved higher. Amid political and trade turmoil, investors fled developing nations and moved to the security of the U.S. dollar and its capital markets. During August, the Turkish financial system fell under pressure as the country moved to the brink of a debt crisis that presented risks of contagion.
|
| Portfolio allocation as of August 31, 20188 |
|
 |
Portfolio positioning continues to be driven by our bottom-up research and selection.
We ended the period with approximately 8% of the portfolio in agency collateralized mortgage obligations, 18% in high-quality ABS and CMBS, 37% in agency mortgage-backed pass-through securities, 3% in mortgage hybrid adjustable-rate mortgages, 1% in nonagency mortgage-backed securities (MBS), and the remainder in U.S. Treasury and agency debt. We remained overweight the MBS, ABS, and CMBS sectors and underweight the agency and Treasury sectors. Driven by bottom-up security selection opportunities, we maintained an overweight to longer-duration risk and an underweight to two-year risk versus the benchmark. Our nongovernment exposure remained flat during the year.
Our outlook is positive.
Strength in the U.S. and global economies extended in August, continuing to provide some of the best performance in the post-financial-crisis environment. U.S. manufacturing and services activity appeared to increase in August to recent cyclical highs. Job growth has remained steady, with the unemployment rate dipping below 4.0%, the lowest level in decades. Consumption continues to hold up well, bolstered by wage gains, employment strength, and the benefits of tax reform. Among international markets, European indicators remain good, having rebounded from a slowdown during the spring.
A possible risk to watch going forward is a nascent slowdown in U.S. housing. Meanwhile, in emerging markets, sustained capital outflow pressures and mismatches between rising oil import costs relative to export costs are starting to affect fundamentals.
Recent commentary from Fed officials points to a likely increase in the federal funds rate by 25 bps at the upcoming September meeting and an additional increase in December. While stabilization of economic data has reduced volatility and supported valuations, a large calendar of policy and political events looms on the near-term horizon that could provide event risk to financial markets.
We believe fixed-income markets may likely provide healthy opportunities as we move through the balance of 2018 and into 2019, particularly if heightened volatility endures. We strive to add value through our bottom-up security selection process, providing active portfolio rotation among sectors and maturities with a focus on relative value while maintaining a disciplined risk management framework.
Consistent with our bottom-up process, we maintain a neutral duration, remain nimble and agile, and stand ready to take advantage of security selection opportunities as they arise.
Please see footnotes on page 7.
| | | | |
| 10 | | Wells Fargo Short Duration Government Bond Fund | | Fund expenses (unaudited) |
As a shareholder of the Fund, you incur two types of costs: (1) transaction costs, including sales charges (loads) on purchase payments and contingent deferred sales charges (if any) on redemptions and (2) ongoing costs, including management fees, distribution (12b-1) and/or shareholder servicing fees, and other Fund expenses. This example is intended to help you understand your ongoing costs (in dollars) of investing in the Fund and to compare these costs with the ongoing costs of investing in other mutual funds.
The example is based on an investment of $1,000 invested at the beginning of the six-month period and held for the entire period from March 1, 2018 to August 31, 2018.
Actual expenses
The “Actual” line of the table below provides information about actual account values and actual expenses. You may use the information in this line, together with the amount you invested, to estimate the expenses that you paid over the period. Simply divide your account value by $1,000 (for example, an $8,600 account value divided by $1,000 = 8.6), then multiply the result by the number in the “Actual” line under the heading entitled “Expenses paid during period” for your applicable class of shares to estimate the expenses you paid on your account during this period.
Hypothetical example for comparison purposes
The “Hypothetical” line of the table below provides information about hypothetical account values and hypothetical expenses based on the Fund’s actual expense ratio and an assumed rate of return of 5% per year before expenses, which is not the Fund’s actual return. The hypothetical account values and expenses may not be used to estimate the actual ending account balance or expenses you paid for the period. You may use this information to compare the ongoing costs of investing in the Fund and other funds. To do so, compare this 5% hypothetical example with the 5% hypothetical examples that appear in the shareholder reports of the other funds.
Please note that the expenses shown in the table are meant to highlight your ongoing costs only and do not reflect any transactional costs, such as sales charges (loads) and contingent deferred sales charges. Therefore, the “Hypothetical” line of the table is useful in comparing ongoing costs only and will not help you determine the relative total costs of owning different funds. In addition, if these transactional costs were included, your costs would have been higher.
| | | | | | | | | | | | | | | | |
| | | Beginning
account value
3-1-2018 | | | Ending
account value
8-31-2018 | | | Expenses
paid during
the period¹ | | | Annualized net
expense ratio | |
Class A | | | | | | | | | | | | | | | | |
Actual | | $ | 1,000.00 | | | $ | 1,002.50 | | | $ | 3.94 | | | | 0.78 | % |
Hypothetical (5% return before expenses) | | $ | 1,000.00 | | | $ | 1,021.27 | | | $ | 3.97 | | | | 0.78 | % |
Class C | | | | | | | | | | | | | | | | |
Actual | | $ | 1,000.00 | | | $ | 998.73 | | | $ | 7.71 | | | | 1.53 | % |
Hypothetical (5% return before expenses) | | $ | 1,000.00 | | | $ | 1,017.49 | | | $ | 7.78 | | | | 1.53 | % |
Class R6 | | | | | | | | | | | | | | | | |
Actual | | $ | 1,000.00 | | | $ | 1,004.60 | | | $ | 1.87 | | | | 0.37 | % |
Hypothetical (5% return before expenses) | | $ | 1,000.00 | | | $ | 1,023.34 | | | $ | 1.89 | | | | 0.37 | % |
Administrator Class | | | | | | | | | | | | | | | | |
Actual | | $ | 1,000.00 | | | $ | 1,003.42 | | | $ | 3.03 | | | | 0.60 | % |
Hypothetical (5% return before expenses) | | $ | 1,000.00 | | | $ | 1,022.18 | | | $ | 3.06 | | | | 0.60 | % |
Institutional Class | | | | | | | | | | | | | | | | |
Actual | | $ | 1,000.00 | | | $ | 1,004.33 | | | $ | 2.12 | | | | 0.42 | % |
Hypothetical (5% return before expenses) | | $ | 1,000.00 | | | $ | 1,023.09 | | | $ | 2.14 | | | | 0.42 | % |
| 1 | Expenses paid is equal to the annualized net expense ratio of each class multiplied by the average account value over the period, multiplied by the number of days in the most recent fiscal half-year divided by the number of days in the fiscal year (to reflect the one-half-year period). |
| | | | | | |
| Portfolio of investments—August 31, 2018 | | Wells Fargo Short Duration Government Bond Fund | | | 11 | |
| | | | | | | | | | | | | | | | |
| Security name | | Interest rate | | | Maturity date | | | Principal | | | Value | |
| | | | |
Agency Securities: 47.35% | | | | | | | | | | | | | | | | |
FHLMC (12 Month LIBOR +1.84%) ± | | | 3.41 | % | | | 5-1-2042 | | | $ | 2,499,356 | | | $ | 2,526,708 | |
FHLMC | | | 4.00 | | | | 9-1-2030 | | | | 254,811 | | | | 262,326 | |
FHLMC | | | 4.00 | | | | 3-1-2031 | | | | 889,411 | | | | 917,593 | |
FHLMC | | | 4.00 | | | | 6-1-2031 | | | | 1,739,339 | | | | 1,784,421 | |
FHLMC | | | 4.00 | | | | 3-1-2032 | | | | 1,700,579 | | | | 1,754,505 | |
FHLMC | | | 4.00 | | | | 4-1-2032 | | | | 739,662 | | | | 757,777 | |
FHLMC | | | 4.00 | | | | 10-1-2033 | | | | 758,412 | | | | 783,695 | |
FHLMC | | | 4.00 | | | | 1-1-2034 | | | | 3,866,847 | | | | 3,995,264 | |
FHLMC | | | 4.00 | | | | 1-1-2034 | | | | 716,399 | | | | 740,284 | |
FHLMC | | | 4.00 | | | | 8-1-2035 | | | | 485,238 | | | | 501,400 | |
FHLMC | | | 4.50 | | | | 10-1-2018 | | | | 27,517 | | | | 27,773 | |
FHLMC | | | 4.50 | | | | 4-1-2031 | | | | 1,715,883 | | | | 1,788,875 | |
FHLMC Multifamily Structured Pass-Through Certificates Series K017 Class A1 | | | 1.89 | | | | 12-25-2020 | | | | 1,038,717 | | | | 1,031,815 | |
FHLMC Multifamily Structured Pass-Through Certificates Series KI02 Class A (1 Month LIBOR +0.20%) ± | | | 2.28 | | | | 2-25-2023 | | | | 3,160,000 | | | | 3,159,995 | |
FHLMC Series 3632 Class PK | | | 5.00 | | | | 2-15-2040 | | | | 4,795,330 | | | | 5,080,350 | |
FHLMC Series 3653 Class AU | | | 4.00 | | | | 4-15-2040 | | | | 1,562,176 | | | | 1,603,109 | |
FNMA (12 Month LIBOR +1.60%) ± | | | 2.95 | | | | 8-1-2047 | | | | 4,624,679 | | | | 4,615,794 | |
FNMA (12 Month LIBOR +1.62%) ± | | | 3.75 | | | | 8-1-2048 | | | | 3,618,000 | | | | 3,694,991 | |
FNMA | | | 4.50 | | | | 7-1-2048 | | | | 9,171,583 | | | | 9,524,150 | |
FNMA ¤ | | | 0.00 | | | | 10-9-2019 | | | | 12,410,000 | | | | 12,058,995 | |
FNMA | | | 2.00 | | | | 3-25-2028 | | | | 2,388,199 | | | | 2,303,205 | |
FNMA (12 Month LIBOR +1.61%) ± | | | 2.77 | | | | 3-1-2047 | | | | 7,884,125 | | | | 7,842,027 | |
FNMA (12 Month LIBOR +1.56%) ± | | | 2.94 | | | | 12-1-2045 | | | | 3,401,117 | | | | 3,392,798 | |
FNMA | | | 3.00 | | | | 7-1-2026 | | | | 24,293,367 | | | | 24,331,999 | |
FNMA | | | 4.00 | | | | 12-1-2029 | | | | 1,091,905 | | | | 1,123,136 | |
FNMA | | | 4.00 | | | | 9-1-2030 | | | | 336,613 | | | | 347,051 | |
FNMA | | | 4.00 | | | | 10-1-2030 | | | | 655,384 | | | | 672,182 | |
FNMA | | | 4.00 | | | | 4-1-2031 | | | | 676,988 | | | | 694,320 | |
FNMA | | | 4.00 | | | | 1-1-2032 | | | | 3,451,449 | | | | 3,565,464 | |
FNMA | | | 4.00 | | | | 2-1-2032 | | | | 3,765,968 | | | | 3,890,325 | |
FNMA | | | 4.00 | | | | 3-1-2032 | | | | 1,764,022 | | | | 1,818,825 | |
FNMA | | | 4.00 | | | | 4-1-2032 | | | | 772,339 | | | | 796,449 | |
FNMA | | | 4.00 | | | | 6-1-2032 | | | | 2,732,142 | | | | 2,812,421 | |
FNMA | | | 4.00 | | | | 6-1-2032 | | | | 4,070,503 | | | | 4,186,867 | |
FNMA | | | 4.00 | | | | 10-1-2032 | | | | 927,427 | | | | 956,275 | |
FNMA | | | 4.00 | | | | 8-1-2033 | | | | 2,490,000 | | | | 2,554,904 | |
FNMA | | | 4.00 | | | | 9-1-2033 | | | | 30,043,000 | | | | 30,826,247 | |
FNMA | | | 4.00 | | | | 10-1-2033 | | | | 1,105,214 | | | | 1,139,077 | |
FNMA | | | 4.00 | | | | 2-1-2034 | | | | 6,348,642 | | | | 6,556,783 | |
FNMA | | | 4.00 | | | | 7-1-2034 | | | | 1,478,768 | | | | 1,523,557 | |
FNMA | | | 4.50 | | | | 4-1-2024 | | | | 2,439,103 | | | | 2,524,085 | |
FNMA | | | 4.50 | | | | 6-1-2025 | | | | 950,348 | | | | 983,774 | |
FNMA | | | 4.50 | | | | 10-1-2026 | | | | 2,835,836 | | | | 2,934,968 | |
FNMA | | | 4.50 | | | | 10-1-2026 | | | | 3,083,715 | | | | 3,198,868 | |
FNMA | | | 4.50 | | | | 3-1-2027 | | | | 4,451,915 | | | | 4,607,291 | |
FNMA | | | 4.50 | | | | 9-1-2037 | | | | 693,785 | | | | 734,097 | |
FNMA %% | | | 4.50 | | | | 9-13-2048 | | | | 2,200,000 | | | | 2,284,015 | |
FNMA | | | 5.00 | | | | 2-1-2023 | | | | 616,991 | | | | 632,138 | |
FNMA | | | 5.00 | | | | 5-1-2023 | | | | 251,052 | | | | 259,979 | |
The accompanying notes are an integral part of these financial statements.
| | | | |
| 12 | | Wells Fargo Short Duration Government Bond Fund | | Portfolio of investments—August 31, 2018 |
| | | | | | | | | | | | | | | | |
| Security name | | Interest rate | | | Maturity date | | | Principal | | | Value | |
| | | | |
Agency Securities (continued) | | | | | | | | | | | | | | | | |
FNMA | | | 5.00 | % | | | 10-1-2040 | | | $ | 1,435,975 | | | $ | 1,520,855 | |
FNMA | | | 5.00 | | | | 5-1-2046 | | | | 541,103 | | | | 573,210 | |
FNMA Series 2009-20 Class DT | | | 4.50 | | | | 4-25-2039 | | | | 2,182,958 | | | | 2,293,994 | |
FNMA Series 2013-103 Class H | | | 4.50 | | | | 3-25-2038 | | | | 2,827,645 | | | | 2,909,903 | |
FNMA Series 2013-90 Class A | | | 4.00 | | | | 11-25-2038 | | | | 4,106,865 | | | | 4,158,885 | |
FNMA Series 2015-57 Class AB | | | 3.00 | | | | 8-25-2045 | | | | 3,538,448 | | | | 3,485,748 | |
FNMA Series 2015-M10 Class FA (1 Month LIBOR +0.25%) ± | | | 2.33 | | | | 3-25-2019 | | | | 638,317 | | | | 637,425 | |
FNMA Series 2015-M4 Class FA (1 Month LIBOR +0.21%) ± | | | 2.29 | | | | 9-25-2018 | | | | 153,802 | | | | 153,575 | |
FNMA Series 2015-M8 Class FA (1 Month LIBOR +0.17%) ± | | | 2.25 | | | | 11-25-2018 | | | | 607,813 | | | | 607,617 | |
GNMA | | | 5.00 | | | | 7-20-2048 | | | | 40,597,597 | | | | 42,737,226 | |
GNMA | | | 5.00 | | | | 8-20-2048 | | | | 23,354,101 | | | | 24,552,556 | |
GNMA %% | | | 5.00 | | | | 9-20-2048 | | | | 8,825,768 | | | | 9,283,625 | |
GNMA | | | 4.50 | | | | 7-20-2048 | | | | 9,670,690 | | | | 10,057,585 | |
GNMA | | | 5.00 | | | | 10-15-2039 | | | | 1,395,639 | | | | 1,496,577 | |
GNMA | | | 5.00 | | | | 6-20-2048 | | | | 11,680,656 | | | | 12,298,059 | |
GNMA %% | | | 5.00 | | | | 10-18-2048 | | | | 1,200,000 | | | | 1,258,178 | |
GNMA 2012-124 Class PT | | | 6.00 | | | | 10-20-2042 | | | | 2,556,637 | | | | 2,785,512 | |
GNMA 2012-141 Class WD ±± | | | 4.98 | | | | 7-20-2040 | | | | 2,725,439 | | | | 2,896,762 | |
GNMA Series 2011-137 Class WA ±± | | | 5.56 | | | | 7-20-2040 | | | | 3,073,544 | | | | 3,352,013 | |
GNMA Series 2016-112 Class AW ±± | | | 7.14 | | | | 12-20-2040 | | | | 2,598,567 | | | | 2,952,712 | |
| | | | |
Total Agency Securities (Cost $309,254,583) | | | | | | | | | | | | | | | 306,114,964 | |
| | | | | | | | | | | | | | | | |
| | | | |
Asset-Backed Securities: 14.78% | | | | | | | | | | | | | | | | |
Ally Master Owner Trust Series 2018-4 Class A | | | 3.30 | | | | 7-17-2023 | | | | 3,754,000 | | | | 3,768,414 | |
Ford Credit Auto Lease Trust Series 2018-A Class A4 | | | 3.05 | | | | 8-15-2021 | | | | 4,116,000 | | | | 4,110,449 | |
Ford Credit Auto Owner Trust Series 2017-1 Class A 144A | | | 2.62 | | | | 8-15-2028 | | | | 6,085,000 | | | | 5,951,659 | |
Hertz Fleet Lease Funding LP Series 2018-1 Class A2 144A | | | 3.23 | | | | 5-10-2032 | | | | 4,640,000 | | | | 4,649,601 | |
Hertz Vehicle Financing LLC Series 2015-3A Class A 144A | | | 2.67 | | | | 9-25-2021 | | | | 10,196,000 | | | | 10,037,911 | |
Hertz Vehicle Financing LLC Series 2016-4A Class A 144A | | | 2.65 | | | | 7-25-2022 | | | | 3,779,000 | | | | 3,680,328 | |
Navient Student Loan Trust Series 2014-CTA Class A (1 Month LIBOR +0.70%) 144A± | | | 2.76 | | | | 9-16-2024 | | | | 3,296,328 | | | | 3,300,101 | |
Navient Student Loan Trust Series 2017-4A Class A2 (1 Month LIBOR +0.50%) 144A± | | | 2.56 | | | | 9-27-2066 | | | | 4,030,000 | | | | 4,043,294 | |
Nelnet Student Loan Trust Series 2004-4 Class A5 (3 Month LIBOR +0.16%) ± | | | 2.50 | | | | 1-25-2037 | | | | 2,966,926 | | | | 2,941,452 | |
Nelnet Student Loan Trust Series 2006-1 Class A5 (3 Month LIBOR +0.11%) ± | | | 2.42 | | | | 8-23-2027 | | | | 1,115,699 | | | | 1,114,723 | |
Nelnet Student Loan Trust Series 2016-1A Class A (1 Month LIBOR +0.80%) 144A± | | | 2.86 | | | | 9-25-2065 | | | | 6,429,050 | | | | 6,502,381 | |
Nelnet Student Loan Trust Series 2018-3A Class A2 (1 Month LIBOR +0.44%) 144A± | | | 2.52 | | | | 9-27-2066 | | | | 6,616,000 | | | | 6,615,993 | |
SLC Student Loan Trust Series 2010-1 Class A (3 Month LIBOR +0.88%) ± | | | 3.19 | | | | 11-25-2042 | | | | 1,492,683 | | | | 1,510,549 | |
SLM Student Loan Trust Series 2004-10 Class A7A (3 Month LIBOR +0.60%) 144A± | | | 2.94 | | | | 10-25-2029 | | | | 3,874,000 | | | | 3,899,628 | |
SLM Student Loan Trust Series 2004-10 Class A7B (3 Month LIBOR +0.60%) 144A± | | | 2.94 | | | | 10-25-2029 | | | | 6,174,000 | | | | 6,198,968 | |
SLM Student Loan Trust Series 2005-6 Class A6 (3 Month LIBOR +0.14%) ± | | | 2.48 | | | | 10-27-2031 | | | | 3,517,503 | | | | 3,494,530 | |
SLM Student Loan Trust Series 2010-A Class 1A (PRIME -0.05%) 144A± | | | 4.95 | | | | 5-16-2044 | | | | 736,076 | | | | 745,977 | |
SLM Student Loan Trust Series 2012-3 Class A (1 Month LIBOR +0.65%) ± | | | 2.71 | | | | 12-27-2038 | | | | 6,492,938 | | | | 6,517,885 | |
SLM Student Loan Trust Series 2014-A Class A2A 144A | | | 2.59 | | | | 1-15-2026 | | | | 1,140,622 | | | | 1,138,478 | |
SLM Student Loan Trust Series 2014-A Class A2B (1 Month LIBOR +1.15%) 144A± | | | 3.21 | | | | 1-15-2026 | | | | 1,663,580 | | | | 1,670,144 | |
SMB Private Education Loan Trust Series 2015-A Class A2A 144A | | | 2.49 | | | | 6-15-2027 | | | | 3,655,542 | | | | 3,611,170 | |
SMB Private Education Loan Trust Series 2015-C Class A2A 144A | | | 2.75 | | | | 7-15-2027 | | | | 3,826,850 | | | | 3,796,027 | |
SMB Private Education Loan Trust Series 2016-B Class A2B (1 Month LIBOR +1.45%) 144A± | | | 3.51 | | | | 2-17-2032 | | | | 2,645,101 | | | | 2,694,345 | |
Volkswagen Auto Loan Enhanced Trust Series 2018-1 Class A4 | | | 3.15 | | | | 7-22-2024 | | | | 3,546,000 | | | | 3,548,890 | |
| | | | |
Total Asset-Backed Securities (Cost $95,626,963) | | | | | | | | | | | | | | | 95,542,897 | |
| | | | | | | | | | | | | | | | |
The accompanying notes are an integral part of these financial statements.
| | | | | | |
| Portfolio of investments—August 31, 2018 | | Wells Fargo Short Duration Government Bond Fund | | | 13 | |
| | | | | | | | | | | | | | | | |
| Security name | | Interest rate | | | Maturity date | | | Principal | | | Value | |
| | | | |
Non-Agency Mortgage-Backed Securities: 3.91% | | | | | | | | | | | | | | | | |
DBUBS Mortgage Trust Series 2011-LC2A Class A1 144A | | | 3.53 | % | | | 7-10-2044 | | | $ | 337,128 | | | $ | 339,231 | |
GS Mortgage Securities Trust Series 2010-C1 Class A1 144A | | | 3.68 | | | | 8-10-2043 | | | | 751,629 | | | | 754,580 | |
GS Mortgage Securities Trust Series 2010-C2 Class A1 144A | | | 3.85 | | | | 12-10-2043 | | | | 554,066 | | | | 559,338 | |
GS Mortgage Securities Trust Series 2012-GCJ7 Class AAB | | | 2.94 | | | | 5-10-2045 | | | | 1,868,044 | | | | 1,866,473 | |
JPMorgan Chase Commercial Mortgage Securities Trust Series 2010-C1 Class A2 144A | | | 4.61 | | | | 6-15-2043 | | | | 1,382,278 | | | | 1,405,308 | |
JPMorgan Chase Commercial Mortgage Securities Trust Series 2012-CBX Class A3 | | | 3.14 | | | | 6-15-2045 | | | | 785,112 | | | | 785,076 | |
JPMorgan Mortgage Trust Series 2017-5 Class A1 144A±± | | | 3.17 | | | | 10-26-2048 | | | | 3,320,154 | | | | 3,285,623 | |
Morgan Stanley Capital I Trust Series 2011-C2 Class A3 144A | | | 4.21 | | | | 6-15-2044 | | | | 325,424 | | | | 329,247 | |
SoFi Professional Loan Program LLC Series 2016-C Class A1 (1 Month LIBOR +1.10%) 144A± | | | 3.16 | | | | 10-27-2036 | | | | 1,812,014 | | | | 1,833,124 | |
SoFi Professional Loan Program LLC Series 2016-D Class A1 (1 Month LIBOR +0.95%) 144A± | | | 3.01 | | | | 1-25-2039 | | | | 4,088,289 | | | | 4,111,353 | |
SoFi Professional Loan Program LLC Series 2016-E Class A1 (1 Month LIBOR +0.85%) 144A± | | | 2.91 | | | | 7-25-2039 | | | | 1,819,494 | | | | 1,827,968 | |
SoFi Professional Loan Program LLC Series 2017-A Class A1 (1 Month LIBOR +0.70%) 144A± | | | 2.76 | | | | 3-26-2040 | | | | 2,315,534 | | | | 2,322,356 | |
SoFi Professional Loan Program LLC Series 2017-C Class A1 (1 Month LIBOR +0.60%) 144A± | | | 2.66 | | | | 7-25-2040 | | | | 2,142,308 | | | | 2,146,371 | |
Verus Securitization Trust Series 2018-2 Class A1 144A±± | | | 3.68 | | | | 6-1-2058 | | | | 3,743,895 | | | | 3,743,218 | |
| | | | |
Total Non-Agency Mortgage-Backed Securities (Cost $25,646,786) | | | | | | | | | | | | | | | 25,309,266 | |
| | | | | | | | | | | | | | | | |
| | | | |
U.S. Treasury Securities: 34.90% | | | | | | | | | | | | | | | | |
U.S. Treasury Note | | | 1.13 | | | | 1-31-2019 | | | | 4,689,000 | | | | 4,667,387 | |
U.S. Treasury Note | | | 1.38 | | | | 2-15-2020 | | | | 3,289,000 | | | | 3,232,984 | |
U.S. Treasury Note | | | 1.38 | | | | 9-30-2020 | | | | 840,000 | | | | 818,573 | |
U.S. Treasury Note | | | 1.50 | | | | 8-15-2020 | | | | 2,533,000 | | | | 2,478,778 | |
U.S. Treasury Note | | | 1.63 | | | | 3-15-2020 | | | | 3,592,000 | | | | 3,540,225 | |
U.S. Treasury Note | | | 1.63 | | | | 10-15-2020 | | | | 36,028,000 | | | | 35,269,442 | |
U.S. Treasury Note | | | 1.75 | | | | 11-15-2020 | | | | 8,740,000 | | | | 8,569,980 | |
U.S. Treasury Note | | | 2.38 | | | | 4-30-2020 | | | | 13,979,000 | | | | 13,925,487 | |
U.S. Treasury Note | | | 2.38 | | | | 4-15-2021 | | | | 6,612,000 | | | | 6,560,085 | |
U.S. Treasury Note | | | 2.50 | | | | 5-31-2020 | | | | 19,741,000 | | | | 19,699,359 | |
U.S. Treasury Note | | | 2.63 | | | | 7-31-2020 | | | | 26,670,000 | | | | 26,663,749 | |
U.S. Treasury Note | | | 2.63 | | | | 8-31-2020 | | | | 4,167,000 | | | | 4,166,186 | |
U.S. Treasury Note | | | 2.63 | | | | 5-15-2021 | | | | 2,000,000 | | | | 1,996,406 | |
U.S. Treasury Note | | | 2.63 | | | | 7-15-2021 | | | | 52,387,000 | | | | 52,280,589 | |
U.S. Treasury Note | | | 2.75 | | | | 8-15-2021 | | | | 41,676,000 | | | | 41,731,351 | |
| | | | |
Total U.S. Treasury Securities (Cost $226,224,337) | | | | | | | | | | | | | | | 225,600,581 | |
| | | | | | | | | | | | | | | | |
| | | | |
| | | Yield | | | | | | Shares | | | | |
| Short-Term Investments: 1.78% | | | | | | | | | | | | | | | | |
| | | | |
| Investment Companies: 1.78% | | | | | | | | | | | | | | | | |
Wells Fargo Government Money Market Fund Select
Class (l)(u)## | | | 1.87 | | | | | | | | 11,514,693 | | | | 11,514,693 | |
| | | | | | | | | | | | | | | | |
| | | | |
Total Short-Term Investments (Cost $11,514,693) | | | | | | | | | | | | | | | 11,514,693 | |
| | | | | | | | | | | | | | | | |
| | | | | | | | |
| Total investments in securities (Cost $668,267,362) | | | 102.72 | % | | | 664,082,401 | |
Other assets and liabilities, net | | | (2.72 | ) | | | (17,611,008 | ) |
| | | | | | | | |
| Total net assets | | | 100.00 | % | | $ | 646,471,393 | |
| | | | | | | | |
The accompanying notes are an integral part of these financial statements.
| | | | |
| 14 | | Wells Fargo Short Duration Government Bond Fund | | Portfolio of investments—August 31, 2018 |
| ± | Variable rate investment. The rate shown is the rate in effect at period end. |
| ¤ | The security is issued in zero coupon form with no periodic interest payments. |
| %% | The security is issued on a when-issued basis. |
| ±± | The coupon of the security is adjusted based on the principal and interest payments received from the underlying pool of mortgages as well as the credit quality and the actual prepayment speed of the underlying mortgages. |
| 144A | The security may be resold in transactions exempt from registration, normally to qualified institutional buyers, pursuant to Rule 144A under the Securities Act of 1933. |
| (l) | The issuer of the security is an affiliated person of the Fund as defined in the Investment Company Act of 1940. |
| (u) | The rate represents the 7-day annualized yield at period end. |
| ## | All or a portion of this security is segregated for when-issued securities. |
Abbreviations:
| FHLMC | Federal Home Loan Mortgage Corporation |
| FNMA | Federal National Mortgage Association |
| GNMA | Government National Mortgage Association |
| LIBOR | London Interbank Offered Rate |
Futures Contracts
| | | | | | | | | | | | | | | | | | | | | | | | |
| Description | | Number of
contracts | | | Expiration
date | | | Notional
cost | | | Notional
value | | | Unrealized
gains | | | Unrealized
losses | |
Long | | | | | | | | | | | | | | | | | | | | | | | | |
2-Year U.S. Treasury Notes | | | 456 | | | | 12-31-2018 | | | $ | 96,295,241 | | | $ | 96,379,875 | | | $ | 84,634 | | | $ | 0 | |
Short | | | | | | | | | | | | | | | | | | | | | | | | |
10-Year Ultra Futures | | | (128) | | | | 12-19-2018 | | | | (16,339,744 | ) | | | (16,390,000 | ) | | | 0 | | | | (50,256 | ) |
5-Year U.S. Treasury Notes | | | (415) | | | | 12-31-2018 | | | | (46,968,782 | ) | | | (47,060,352 | ) | | | 0 | | | | (91,570 | ) |
| | | | | | | | | | | | | | | | | | | | | | | | |
| | | | | | | | | | | | | | | | | | $ | 84,634 | | | $ | (141,826 | ) |
| | | | | | | | | | | | | | | | | | | | | | | | |
Investments in Affiliates
An affiliated investment is an investment in which the Fund owns at least 5% of the outstanding voting shares of the issuer or as a result of other relationships, such as the Fund and the issuer having the same investment manager. Transactions with issuers that were either affiliated persons of the Fund at the beginning of the period or the end of the period were as follows:
| | | | | | | | | | | | | | | | | | | | | | | | | | | | | | | | | | | | |
| | | Shares,
beginning of
period | | | Shares
purchased | | | Shares sold | | | Shares,
end of
period | | | Net
realized
gains
(losses) | | | Net
change in
unrealized
gains
(losses) | | | Income
from
affiliated
securities | | | Value, end
of period | | | % of
net
assets | |
Short-Term Investments | | | | | | | | | | | | | | | | | | | | | | | | | | | | | | | | | | | | |
Investment Companies | | | | | | | | | | | | | | | | | | | | | | | | | | | | | | | | | | | | |
Wells Fargo Government Money Market Fund Select Class | | | 12,155,202 | | | | 915,923,326 | | | | 916,563,835 | | | | 11,514,693 | | | $ | 0 | | | $ | 0 | | | $ | 263,556 | | | $ | 11,514,693 | | | | 1.78 | % |
The accompanying notes are an integral part of these financial statements.
| | | | | | |
| Statement of assets and liabilities—August 31, 2018 | | Wells Fargo Short Duration Government Bond Fund | | | 15 | |
| | | | |
| | | | |
| |
Assets | | | | |
Investments in unaffiliated securities, at value (cost $656,752,669) | | $ | 652,567,708 | |
Investments in affiliated securities, at value (cost $11,514,693) | | | 11,514,693 | |
Segregated cash for future contracts | | | 525,000 | |
Receivable for investments sold | | | 71,151,442 | |
Principal paydown receivable | | | 132,093 | |
Receivable for Fund shares sold | | | 121,652 | |
Receivable for interest | | | 2,103,183 | |
Receivable for daily variation margin on open futures contracts | | | 42,750 | |
Prepaid expenses and other assets | | | 108,231 | |
| | | | |
Total assets | | | 738,266,752 | |
| | | | |
| |
Liabilities | | | | |
Payable for investments purchased | | | 86,468,874 | |
Payable for Fund shares redeemed | | | 5,003,288 | |
Management fee payable | | | 162,113 | |
Payable for daily variation margin on open futures contracts | | | 52,149 | |
Administration fees payable | | | 51,559 | |
Due to custodian | | | 23,813 | |
Distribution fee payable | | | 10,817 | |
Trustees’ fees and expenses payable | | | 2,015 | |
Accrued expenses and other liabilities | | | 20,731 | |
| | | | |
Total liabilities | | | 91,795,359 | |
| | | | |
Total net assets | | $ | 646,471,393 | |
| | | | |
| |
NET ASSETS CONSIST OF | | | | |
Paid-in capital | | $ | 727,120,731 | |
Undistributed net investment income | | | 480,677 | |
Accumulated net realized losses on investments | | | (76,887,862 | ) |
Net unrealized losses on investments | | | (4,242,153 | ) |
| | | | |
Total net assets | | $ | 646,471,393 | |
| | | | |
| |
COMPUTATION OF NET ASSET VALUE AND OFFERING PRICE PER SHARE | | | | |
Net assets – Class A | | $ | 30,538,242 | |
Shares outstanding – Class A1 | | | 3,180,338 | |
Net asset value per share – Class A | | | $9.60 | |
Maximum offering price per share – Class A2 | | | $9.80 | |
Net assets – Class C | | $ | 15,092,587 | |
Shares outstanding – Class C1 | | | 1,569,052 | |
Net asset value per share – Class C | | | $9.62 | |
Net assets – Class R6 | | $ | 35,472,012 | |
Shares outstanding – Class R61 | | | 3,680,428 | |
Net asset value per share – Class R6 | | | $9.64 | |
Net assets – Administrator Class | | $ | 71,996,846 | |
Shares outstanding – Administrator Class1 | | | 7,483,843 | |
Net asset value per share – Administrator Class | | | $9.62 | |
Net assets – Institutional Class | | $ | 493,371,706 | |
Shares outstanding – Institutional Class1 | | | 51,297,247 | |
Net asset value per share – Institutional Class | | | $9.62 | |
| 1 | The Fund has an unlimited number of authorized shares. |
| 2 | Maximum offering price is computed as 100/98 of net asset value. On investments of $50,000 or more, the offering price is reduced. |
The accompanying notes are an integral part of these financial statements.
| | | | |
| 16 | | Wells Fargo Short Duration Government Bond Fund | | Statement of operations—year ended August 31, 2018 |
| | | | |
| | | | |
| |
Investment income | | | | |
Interest | | $ | 15,467,728 | |
Income from affiliated securities | | | 263,556 | |
| | | | |
Total investment income | | | 15,731,284 | |
| | | | |
| |
Expenses | | | | |
Management fee | | | 2,572,833 | |
Administration fees | | | | |
Class A | | | 59,904 | |
Class C | | | 28,309 | |
Class R6 | | | 18,424 | |
Administrator Class | | | 79,962 | |
Institutional Class | | | 430,869 | |
Shareholder servicing fees | | | | |
Class A | | | 93,600 | |
Class C | | | 44,233 | |
Administrator Class | | | 199,684 | |
Distribution fee | | | | |
Class C | | | 132,699 | |
Custody and accounting fees | | | 68,525 | |
Professional fees | | | 51,102 | |
Registration fees | | | 74,913 | |
Shareholder report expenses | | | 51,305 | |
Trustees’ fees and expenses | | | 23,070 | |
Other fees and expenses | | | 15,168 | |
| | | | |
Total expenses | | | 3,944,600 | |
Less: Fee waivers and/or expense reimbursements | | | (412,798 | ) |
| | | | |
Net expenses | | | 3,531,802 | |
| | | | |
Net investment income | | | 12,199,482 | |
| | | | |
| |
REALIZED AND UNREALIZED GAINS (LOSSES) ON INVESTMENTS | | | | |
| |
Net realized gains (losses) on: | | | | |
Unaffiliated securities | | | (11,603,544 | ) |
Futures contracts | | | 289,255 | |
| | | | |
Net realized losses on investments | | | (11,314,289 | ) |
| | | | |
| |
Net change in unrealized gains (losses) on: | | | | |
Unaffiliated securities | | | (3,350,775 | ) |
Futures contracts | | | 9,987 | |
| | | | |
Net change in unrealized gains (losses) on investments | | | (3,340,788 | ) |
| | | | |
Net realized and unrealized gains (losses) on investments | | | (14,655,077 | ) |
| | | | |
Net decrease in net assets resulting from operations | | $ | (2,455,595 | ) |
| | | | |
The accompanying notes are an integral part of these financial statements.
| | | | | | |
| Statement of changes in net assets | | Wells Fargo Short Duration Government Bond Fund | | | 17 | |
| | | | | | | | | | | | | | | | |
| | | Year ended
August 31, 2018 | | | Year ended
August 31, 2017 | |
| | | | |
Operations | | | | | | | | | | | | | | | | |
Net investment income | | | | | | $ | 12,199,482 | | | | | | | $ | 11,107,728 | |
Net realized losses on investments | | | | | | | (11,314,289 | ) | | | | | | | (5,488,498 | ) |
Net change in unrealized gains (losses) on investments | | | | | | | (3,340,788 | ) | | | | | | | 1,993,374 | |
| | | | |
Net increase (decrease) in net assets resulting from operations | | | | | | | (2,455,595 | ) | | | | | | | 7,612,604 | |
| | | | |
| | | | |
Distributions to shareholders from | | | | | | | | | | | | | | | | |
Net investment income | | | | | | | | | | | | | | | | |
Class A | | | | | | | (735,153 | ) | | | | | | | (887,555 | ) |
Class B | | | | | | | N/A | | | | | | | | (73 | )1 |
Class C | | | | | | | (217,568 | ) | | | | | | | (194,088 | ) |
Class R6 | | | | | | | (1,398,687 | ) | | | | | | | (4,107,221 | ) |
Administrator Class | | | | | | | (1,726,039 | ) | | | | | | | (1,874,754 | ) |
Institutional Class | | | | | | | (12,631,240 | ) | | | | | | | (11,823,677 | ) |
| | | | |
Total distributions to shareholders | | | | | | | (16,708,687 | ) | | | | | | | (18,887,368 | ) |
| | | | |
| | | | |
Capital share transactions | | | Shares | | | | | | | | Shares | | | | | |
Proceeds from shares sold | | | | | | | | | | | | | | | | |
Class A | | | 376,228 | | | | 3,627,108 | | | | 2,522,578 | | | | 25,119,924 | |
Class C | | | 22,308 | | | | 218,154 | | | | 152,650 | | | | 1,513,522 | |
Class R6 | | | 2,144,288 | | | | 20,939,039 | | | | 2,382,978 | | | | 23,634,167 | |
Administrator Class | | | 395,318 | | | | 3,847,681 | | | | 884,562 | | | | 8,769,727 | |
Institutional Class | | | 13,527,957 | | | | 131,987,736 | | | | 21,525,925 | | | | 213,452,302 | |
| | | | |
| | | | | | | 160,619,718 | | | | | | | | 272,489,642 | |
| | | | |
Reinvestment of distributions | | | | | | | | | | | | | | | | |
Class A | | | 71,432 | | | | 692,759 | | | | 82,087 | | | | 811,706 | |
Class B | | | N/A | | | | N/A | | | | 7 | 1 | | | 68 | 1 |
Class C | | | 20,781 | | | | 201,738 | | | | 17,877 | | | | 177,097 | |
Class R6 | | | 126,725 | | | | 1,239,028 | | | | 414,035 | | | | 4,107,221 | |
Administrator Class | | | 178,230 | | | | 1,730,952 | | | | 185,942 | | | | 1,841,783 | |
Institutional Class | | | 1,256,662 | | | | 12,199,437 | | | | 1,135,203 | | | | 11,238,682 | |
| | | | |
| | | | | | | 16,063,914 | | | | | | | | 18,176,557 | |
| | | | |
Payment for shares redeemed | | | | | | | | | | | | | | | | |
Class A | | | (2,532,682 | ) | | | (24,674,032 | ) | | | (3,159,388 | ) | | | (31,338,166 | ) |
Class B | | | N/A | | | | N/A | | | | (4,044 | )1 | | | (40,138 | )1 |
Class C | | | (502,772 | ) | | | (4,888,594 | ) | | | (893,469 | ) | | | (8,848,973 | ) |
Class R6 | | | (15,996,524 | ) | | | (157,173,416 | ) | | | (8,804,898 | ) | | | (87,286,298 | ) |
Administrator Class | | | (2,179,946 | ) | | | (21,230,405 | ) | | | (4,164,783 | ) | | | (41,236,752 | ) |
Institutional Class | | | (22,222,211 | ) | | | (216,535,537 | ) | | | (30,492,116 | ) | | | (302,273,975 | ) |
| | | | |
| | | | | | | (424,501,984 | ) | | | | | | | (471,024,302 | ) |
| | | | |
Net decrease in net assets resulting from capital share transactions | | | | | | | (247,818,352 | ) | | | | | | | (180,358,103 | ) |
| | | | |
Total decrease in net assets | | | | | | | (266,982,634 | ) | | | | | | | (191,632,867 | ) |
| | | | |
| | | | |
Net assets | | | | | | | | | | | | | | | | |
Beginning of period | | | | | | | 913,454,027 | | | | | | | | 1,105,086,894 | |
| | | | |
End of period | | | | | | $ | 646,471,393 | | | | | | | $ | 913,454,027 | |
| | | | |
Undistributed net investment income | | | | | | $ | 480,677 | | | | | | | $ | 623,073 | |
| | | | |
| 1 | For the period from September 1, 2016 to December 5, 2016. Effective at the close of business on December 5, 2016, Class B shares were converted to Class A shares and are no longer offered by the Fund. |
The accompanying notes are an integral part of these financial statements.
| | | | |
| 18 | | Wells Fargo Short Duration Government Bond Fund | | Financial highlights |
(For a share outstanding throughout each period)
| | | | | | | | | | | | | | | | | | | | |
| | | Year ended August 31 | |
| CLASS A | | 2018 | | | 2017 | | | 2016 | | | 2015 | | | 2014 | |
Net asset value, beginning of period | | | $9.85 | | | | $9.96 | | | | $10.02 | | | | $10.08 | | | | $10.09 | |
Net investment income | | | 0.14 | | | | 0.07 | | | | 0.07 | | | | 0.04 | | | | 0.03 | |
Net realized and unrealized gains (losses) on investments | | | (0.20 | ) | | | (0.03 | ) | | | 0.02 | | | | 0.02 | | | | 0.07 | |
| | | | | | | | | | | | | | | | | | | | |
Total from investment operations | | | (0.06 | ) | | | 0.04 | | | | 0.09 | | | | 0.06 | | | | 0.10 | |
Distributions to shareholders from | | | | | | | | | | | | | | | | | | | | |
Net investment income | | | (0.19 | ) | | | (0.15 | ) | | | (0.15 | ) | | | (0.12 | ) | | | (0.11 | ) |
Net asset value, end of period | | | $9.60 | | | | $9.85 | | | | $9.96 | | | | $10.02 | | | | $10.08 | |
Total return1 | | | (0.56 | )% | | | 0.45 | % | | | 0.90 | % | | | 0.55 | % | | | 1.03 | % |
Ratios to average net assets (annualized) | | | | | | | | | | | | | | | | | | | | |
Gross expenses | | | 0.80 | % | | | 0.79 | % | | | 0.78 | % | | | 0.78 | % | | | 0.80 | % |
Net expenses | | | 0.78 | % | | | 0.78 | % | | | 0.78 | % | | | 0.78 | % | | | 0.78 | % |
Net investment income | | | 1.36 | % | | | 0.79 | % | | | 0.70 | % | | | 0.55 | % | | | 0.38 | % |
Supplemental data | | | | | | | | | | | | | | | | | | | | |
Portfolio turnover rate | | | 331 | % | | | 348 | % | | | 284 | % | | | 500 | % | | | 408 | % |
Net assets, end of period (000s omitted) | | | $30,538 | | | | $51,890 | | | | $57,976 | | | | $62,504 | | | | $107,005 | |
| 1 | Total return calculations do not include any sales charges. |
The accompanying notes are an integral part of these financial statements.
| | | | | | |
| Financial highlights | | Wells Fargo Short Duration Government Bond Fund | | | 19 | |
(For a share outstanding throughout each period)
| | | | | | | | | | | | | | | | | | | | |
| | | Year ended August 31 | |
| CLASS C | | 2018 | | | 2017 | | | 2016 | | | 2015 | | | 2014 | |
Net asset value, beginning of period | | | $9.87 | | | | $9.98 | | | | $10.03 | | | | $10.10 | | | | $10.11 | |
Net investment income (loss) | | | 0.06 | 1 | | | 0.00 | 1,2 | | | (0.01 | ) | | | (0.03 | ) | | | (0.05 | ) |
Net realized and unrealized gains (losses) on investments | | | (0.19 | ) | | | (0.03 | ) | | | 0.03 | | | | 0.00 | 2 | | | 0.08 | |
| | | | | | | | | | | | | | | | | | | | |
Total from investment operations | | | (0.13 | ) | | | (0.03 | ) | | | 0.02 | | | | (0.03 | ) | | | 0.03 | |
Distributions to shareholders from | | | | | | | | | | | | | | | | | | | | |
Net investment income | | | (0.12 | ) | | | (0.08 | ) | | | (0.07 | ) | | | (0.04 | ) | | | (0.04 | ) |
Net asset value, end of period | | | $9.62 | | | | $9.87 | | | | $9.98 | | | | $10.03 | | | | $10.10 | |
Total return3 | | | (1.30 | )% | | | (0.30 | )% | | | 0.25 | % | | | (0.30 | )% | | | 0.28 | % |
Ratios to average net assets (annualized) | | | | | | | | | | | | | | | | | | | | |
Gross expenses | | | 1.55 | % | | | 1.54 | % | | | 1.53 | % | | | 1.53 | % | | | 1.55 | % |
Net expenses | | | 1.53 | % | | | 1.53 | % | | | 1.53 | % | | | 1.53 | % | | | 1.53 | % |
Net investment income (loss) | | | 0.62 | % | | | 0.04 | % | | | (0.05 | )% | | | (0.20 | )% | | | (0.37 | )% |
Supplemental data | | | | | | | | | | | | | | | | | | | | |
Portfolio turnover rate | | | 331 | % | | | 348 | % | | | 284 | % | | | 500 | % | | | 408 | % |
Net assets, end of period (000s omitted) | | | $15,093 | | | | $20,026 | | | | $27,454 | | | | $31,910 | | | | $44,423 | |
| 1 | Calculated based upon average shares outstanding |
| 2 | Amount is less than $0.005. |
| 3 | Total return calculations do not include any sales charges. |
The accompanying notes are an integral part of these financial statements.
| | | | |
| 20 | | Wells Fargo Short Duration Government Bond Fund | | Financial highlights |
(For a share outstanding throughout each period)
| | | | | | | | | | | | | | | | | | | | |
| | | Year ended August 31 | |
| CLASS R6 | | 2018 | | | 2017 | | | 2016 | | | 2015 | | | 2014 | |
Net asset value, beginning of period | | | $9.89 | | | | $9.99 | | | | $10.05 | | | | $10.11 | | | | $10.13 | |
Net investment income | | | 0.16 | 1 | | | 0.12 | 1 | | | 0.12 | | | | 0.09 | 1 | | | 0.08 | 1 |
Net realized and unrealized gains (losses) on investments | | | (0.17 | ) | | | (0.02 | ) | | | 0.01 | | | | 0.01 | | | | 0.05 | |
| | | | | | | | | | | | | | | | | | | | |
Total from investment operations | | | (0.01 | ) | | | 0.10 | | | | 0.13 | | | | 0.10 | | | | 0.13 | |
Distributions to shareholders from | | | | | | | | | | | | | | | | | | | | |
Net investment income | | | (0.24 | ) | | | (0.20 | ) | | | (0.19 | ) | | | (0.16 | ) | | | (0.15 | ) |
Net asset value, end of period | | | $9.64 | | | | $9.89 | | | | $9.99 | | | | $10.05 | | | | $10.11 | |
Total return | | | (0.14 | )% | | | 0.96 | % | | | 1.32 | % | | | 0.96 | % | | | 1.35 | % |
Ratios to average net assets (annualized) | | | | | | | | | | | | | | | | | | | | |
Gross expenses | | | 0.42 | % | | | 0.41 | % | | | 0.40 | % | | | 0.40 | % | | | 0.41 | % |
Net expenses | | | 0.37 | % | | | 0.37 | % | | | 0.37 | % | | | 0.37 | % | | | 0.37 | % |
Net investment income | | | 1.64 | % | | | 1.19 | % | | | 1.11 | % | | | 0.88 | % | | | 0.76 | % |
Supplemental data | | | | | | | | | | | | | | | | | | | | |
Portfolio turnover rate | | | 331 | % | | | 348 | % | | | 284 | % | | | 500 | % | | | 408 | % |
Net assets, end of period (000s omitted) | | | $35,472 | | | | $172,106 | | | | $233,993 | | | | $231,878 | | | | $48,446 | |
| 1 | Calculated based upon average shares outstanding |
The accompanying notes are an integral part of these financial statements.
| | | | | | |
| Financial highlights | | Wells Fargo Short Duration Government Bond Fund | | | 21 | |
(For a share outstanding throughout each period)
| | | | | | | | | | | | | | | | | | | | |
| | | Year ended August 31 | |
| ADMINISTRATOR CLASS | | 2018 | | | 2017 | | | 2016 | | | 2015 | | | 2014 | |
Net asset value, beginning of period | | | $9.87 | | | | $9.98 | | | | $10.03 | | | | $10.10 | | | | $10.11 | |
Net investment income | | | 0.15 | 1 | | | 0.08 | | | | 0.08 | | | | 0.06 | | | | 0.06 | 1 |
Net realized and unrealized gains (losses) on investments | | | (0.19 | ) | | | (0.02 | ) | | | 0.04 | | | | 0.00 | 2 | | | 0.06 | |
| | | | | | | | | | | | | | | | | | | | |
Total from investment operations | | | (0.04 | ) | | | 0.06 | | | | 0.12 | | | | 0.06 | | | | 0.12 | |
Distributions to shareholders from | | | | | | | | | | | | | | | | | | | | |
Net investment income | | | (0.21 | ) | | | (0.17 | ) | | | (0.17 | ) | | | (0.13 | ) | | | (0.13 | ) |
Net asset value, end of period | | | $9.62 | | | | $9.87 | | | | $9.98 | | | | $10.03 | | | | $10.10 | |
Total return | | | (0.37 | )% | | | 0.63 | % | | | 1.18 | % | | | 0.63 | % | | | 1.21 | % |
Ratios to average net assets (annualized) | | | | | | | | | | | | | | | | | | | | |
Gross expenses | | | 0.74 | % | | | 0.73 | % | | | 0.72 | % | | | 0.72 | % | | | 0.74 | % |
Net expenses | | | 0.60 | % | | | 0.60 | % | | | 0.60 | % | | | 0.60 | % | | | 0.60 | % |
Net investment income | | | 1.56 | % | | | 0.96 | % | | | 0.87 | % | | | 0.73 | % | | | 0.56 | % |
Supplemental data | | | | | | | | | | | | | | | | | | | | |
Portfolio turnover rate | | | 331 | % | | | 348 | % | | | 284 | % | | | 500 | % | | | 408 | % |
Net assets, end of period (000s omitted) | | | $71,997 | | | | $89,743 | | | | $121,576 | | | | $156,669 | | | | $191,469 | |
| 1 | Calculated based upon average shares outstanding |
| 2 | Amount is less than $0.005. |
The accompanying notes are an integral part of these financial statements.
| | | | |
| 22 | | Wells Fargo Short Duration Government Bond Fund | | Financial highlights |
(For a share outstanding throughout each period)
| | | | | | | | | | | | | | | | | | | | |
| | | Year ended August 31 | |
| INSTITUTIONAL CLASS | | 2018 | | | 2017 | | | 2016 | | | 2015 | | | 2014 | |
Net asset value, beginning of period | | | $9.87 | | | | $9.98 | | | | $10.03 | | | | $10.10 | | | | $10.10 | |
Net investment income | | | 0.17 | | | | 0.11 | | | | 0.11 | | | | 0.09 | 1 | | | 0.07 | |
Net realized and unrealized gains (losses) on investments | | | (0.19 | ) | | | (0.03 | ) | | | 0.03 | | | | (0.01 | ) | | | 0.08 | |
| | | | | | | | | | | | | | | | | | | | |
Total from investment operations | | | (0.02 | ) | | | 0.08 | | | | 0.14 | | | | 0.08 | | | | 0.15 | |
Distributions to shareholders from | | | | | | | | | | | | | | | | | | | | |
Net investment income | | | (0.23 | ) | | | (0.19 | ) | | | (0.19 | ) | | | (0.15 | ) | | | (0.15 | ) |
Net asset value, end of period | | | $9.62 | | | | $9.87 | | | | $9.98 | | | | $10.03 | | | | $10.10 | |
Total return | | | (0.20 | )% | | | 0.81 | % | | | 1.37 | % | | | 0.81 | % | | | 1.50 | % |
Ratios to average net assets (annualized) | | | | | | | | | | | | | | | | | | | | |
Gross expenses | | | 0.47 | % | | | 0.46 | % | | | 0.45 | % | | | 0.45 | % | | | 0.47 | % |
Net expenses | | | 0.42 | % | | | 0.42 | % | | | 0.42 | % | | | 0.42 | % | | | 0.42 | % |
Net investment income | | | 1.75 | % | | | 1.15 | % | | | 1.06 | % | | | 0.92 | % | | | 0.74 | % |
Supplemental data | | | | | | | | | | | | | | | | | | | | |
Portfolio turnover rate | | | 331 | % | | | 348 | % | | | 284 | % | | | 500 | % | | | 408 | % |
Net assets, end of period (000s omitted) | | | $493,372 | | | | $579,690 | | | | $664,047 | | | | $587,835 | | | | $903,096 | |
| 1 | Calculated based upon average shares outstanding |
The accompanying notes are an integral part of these financial statements.
| | | | | | |
| Notes to financial statements | | Wells Fargo Short Duration Government Bond Fund | | | 23 | |
1. ORGANIZATION
Wells Fargo Funds Trust (the “Trust”), a Delaware statutory trust organized on March 10, 1999, is an open-end management investment company registered under the Investment Company Act of 1940, as amended (the “1940 Act”). As an investment company, the Trust follows the accounting and reporting guidance in Financial Accounting Standards Board (“FASB”) Accounting Standards Codification Topic 946, Financial Services – Investment Companies. These financial statements report on the Wells Fargo Short Duration Government Bond Fund (the “Fund”) which is a diversified series of the Trust.
Effective at the close of business on December 5, 2016, Class B shares were converted to Class A shares and are no longer offered by the Fund. Information for Class B shares reflected in the financial statements represents activity through December 5, 2016.
2. SIGNIFICANT ACCOUNTING POLICIES
The following significant accounting policies, which are consistently followed in the preparation of the financial statements of the Fund, are in conformity with U.S. generally accepted accounting principles which require management to make estimates and assumptions that affect the reported amounts of assets and liabilities, disclosure of contingent assets and liabilities at the date of the financial statements, and the reported amounts of revenues and expenses during the reporting period. Actual results could differ from those estimates.
Securities valuation
All investments are valued each business day as of the close of regular trading on the New York Stock Exchange (generally 4 p.m. Eastern Time), although the Fund may deviate from this calculation time under unusual or unexpected circumstances.
Debt securities are valued at the evaluated bid price provided by an independent pricing service or, if a reliable price is not available, the quoted bid price from an independent broker-dealer.
Futures contracts that are listed on a foreign or domestic exchange or market are valued at the official closing price or, if none, the last sales price.
Investments in registered open-end investment companies are valued at net asset value.
Investments which are not valued using any of the methods discussed above are valued at their fair value, as determined in good faith by the Board of Trustees of the Fund. The Board of Trustees has established a Valuation Committee comprised of the Trustees and has delegated to it the authority to take any actions regarding the valuation of portfolio securities that the Valuation Committee deems necessary or appropriate, including determining the fair value of portfolio securities, unless the determination has been delegated to the Wells Fargo Asset Management Pricing Committee at Wells Fargo Funds Management, LLC (“Funds Management”). The Board of Trustees retains the authority to make or ratify any valuation decisions or approve any changes to the Valuation Procedures as it deems appropriate. On a quarterly basis, the Board of Trustees receives reports on any valuation actions taken by the Valuation Committee or the Wells Fargo Asset Management Pricing Committee which may include items for ratification.
Valuations of fair valued securities are compared to the next actual sales price when available, or other appropriate market values, to assess the continued appropriateness of the fair valuation methodologies used. These securities are fair valued on a day-to-day basis, taking into consideration changes to appropriate market information and any significant changes to the inputs considered in the valuation process until there is a readily available price provided on an exchange or by an independent pricing service. Valuations received from an independent pricing service or independent broker-dealer quotes are periodically validated by comparisons to most recent trades and valuations provided by other independent pricing services in addition to the review of prices by the manager and/or subadviser. Unobservable inputs used in determining fair valuations are identified based on the type of security, taking into consideration factors utilized by market participants in valuing the investment, knowledge about the issuer and the current market environment.
When-issued transactions
The Fund may purchase securities on a forward commitment or when-issued basis. The Fund records a when-issued transaction on the trade date and will segregate assets in an amount at least equal in value to the Fund’s commitment to purchase when-issued securities. Securities purchased on a when-issued basis are marked-to-market daily and the Fund begins earning interest on the settlement date. Losses may arise due to changes in the market value of the underlying securities or if the counterparty does not perform under the contract.
| | | | |
| 24 | | Wells Fargo Short Duration Government Bond Fund | | Notes to financial statements |
Futures contracts
The Fund is subject to interest rate risk in the normal course of pursuing its investment objectives. Futures contracts are agreements between the Fund and a counterparty to buy or sell a specific amount of a commodity, financial instrument or currency at specified price and on a specified date. The Fund may buy and sell futures contracts in order to gain exposure to, or protect against, changes in interest rates. The primary risks associated with the use of futures contracts are the imperfect correlation between changes in market values of securities held by the Fund and the prices of futures contracts, and the possibility of an illiquid market. Futures contracts are generally entered into on a regulated futures exchange and cleared through a clearinghouse associated with the exchange. With futures contracts, there is minimal counterparty risk to the Fund since futures contracts are exchange traded and the exchange’s clearinghouse, as counterparty to all exchange traded futures, guarantees the futures contracts against default.
Upon entering into a futures contracts, the Fund is required to deposit either cash or securities (initial margin) with the broker in an amount equal to a certain percentage of the contract value. Subsequent payments (variation margin) are paid to or from the broker each day equal to the daily changes in the contract value. Such payments are recorded as unrealized gains or losses and, if any, shown as variation margin receivable (payable) in the Statement of Assets and Liabilities. Should the Fund fail to make requested variation margin payments, the broker can gain access to the initial margin to satisfy the Fund’s payment obligations. When the contracts are closed, a realized gain or loss is recorded in the Statement of Operations.
Security transactions and income recognition
Securities transactions are recorded on a trade date basis. Realized gains or losses are recorded on the basis of identified cost.
Interest income is accrued daily and bond discounts are accreted and premiums are amortized daily. To the extent debt obligations are placed on non-accrual status, any related interest income may be reduced by writing off interest receivables when the collection of all or a portion of interest has been determined to be doubtful based on consistently applied procedures and the fair value has decreased. If the issuer subsequently resumes interest payments or when the collectability of interest is reasonably assured, the debt obligation is removed from non-accrual status.
Distributions to shareholders
Distributions to shareholders from net investment income are declared daily and paid monthly. Distributions from net realized gains, if any, are recorded on the ex-dividend date and paid at least annually. Such distributions are determined in accordance with income tax regulations and may differ from U.S. generally accepted accounting principles. Dividend sources are estimated at the time of declaration. The tax character of distributions is determined as of the Fund’s fiscal year end. Therefore, a portion of the Fund’s distributions made prior to the Fund’s fiscal year end may be categorized as a tax return of capital at year end.
Federal and other taxes
The Fund intends to continue to qualify as a regulated investment company by distributing substantially all of its investment company taxable income and any net realized capital gains (after reduction for capital loss carryforwards) sufficient to relieve it from all, or substantially all, federal income taxes. Accordingly, no provision for federal income taxes was required.
The Fund’s income and federal excise tax returns and all financial records supporting those returns for the prior three fiscal years are subject to examination by the federal and Delaware revenue authorities. Management has analyzed the Fund’s tax positions taken on federal, state, and foreign tax returns for all open tax years and does not believe that there are any uncertain tax positions that require recognition of a tax liability.
As of August 31, 2018, the aggregate cost of all investments for federal income tax purposes was $668,393,790 and the unrealized gains (losses) consisted of:
| | | | |
Gross unrealized gains | | $ | 549,841 | |
Gross unrealized losses | | | (4,918,422 | ) |
Net unrealized losses | | $ | (4,368,581 | ) |
Reclassifications are made to the Fund’s capital accounts for permanent tax differences to reflect income and gains available for distribution (or available capital loss carryforwards) under federal income tax regulations. U.S. generally accepted accounting principles require that certain components of net assets be adjusted to reflect permanent differences between financial and tax reporting. These reclassifications have no effect on net assets or net asset values
| | | | | | |
| Notes to financial statements | | Wells Fargo Short Duration Government Bond Fund | | | 25 | |
per share. The primary permanent difference causing such reclassifications is due to paydown losses. At August 31, 2018, as a result of permanent book-to-tax differences, the following reclassification adjustments were made on the Statement of Assets and Liabilities:
| | |
Undistributed net
investment income | | Accumulated net
realized losses
on investments |
| $4,366,809 | | $(4,366,809) |
As of August 31, 2018, the Fund had capital loss carryforwards which consist of $44,623,890 in short-term capital losses and $32,137,541 in long-term capital losses.
Class allocations
The separate classes of shares offered by the Fund differ principally in applicable sales charges, distribution, shareholder servicing, and administration fees. Class specific expenses are charged directly to that share class. Investment income, common expenses, and realized and unrealized gains (losses) on investments are allocated daily to each class of shares based on the relative proportion of net assets of each class.
3. FAIR VALUATION MEASUREMENTS
Fair value measurements of investments are determined within a framework that has established a fair value hierarchy based upon the various data inputs utilized in determining the value of the Fund’s investments. The three-level hierarchy gives the highest priority to unadjusted quoted prices in active markets for identical assets or liabilities (Level 1) and the lowest priority to unobservable inputs (Level 3). The Fund’s investments are classified within the fair value hierarchy based on the lowest level of input that is significant to the fair value measurement. The inputs are summarized into three broad levels as follows:
| ∎ | | Level 1 – quoted prices in active markets for identical securities |
| ∎ | | Level 2 – other significant observable inputs (including quoted prices for similar securities, interest rates, prepayment speeds, credit risk, etc.) |
| ∎ | | Level 3 – significant unobservable inputs (including the Fund’s own assumptions in determining the fair value of investments) |
The inputs or methodologies used for valuing investments in securities are not necessarily an indication of the risk associated with investing in those securities.
The following is a summary of the inputs used in valuing the Fund’s assets and liabilities as of August 31, 2018:
| | | | | | | | | | | | | | | | |
| | | Quoted prices (Level 1) | | | Other significant observable inputs (Level 2) | | | Significant
unobservable inputs (Level 3) | | | Total | |
Assets | | | | | | | | | | | | | | | | |
Investments in: | | | | | | | | | | | | | | | | |
| | | | |
Agency securities | | $ | 0 | | | $ | 306,114,964 | | | $ | 0 | | | $ | 306,114,964 | |
| | | | |
Asset-backed securities | | | 0 | | | | 95,542,897 | | | | 0 | | | | 95,542,897 | |
| | | | |
Non-agency mortgage-backed securities | | | 0 | | | | 25,309,266 | | | | 0 | | | | 25,309,266 | |
| | | | |
U.S. Treasury securities | | | 225,600,581 | | | | 0 | | | | 0 | | | | 225,600,581 | |
| | | | |
Short-term investments | | | | | | | | | | | | | | | | |
Investment companies | | | 11,514,693 | | | | 0 | | | | 0 | | | | 11,514,693 | �� |
| | | 237,115,274 | | | | 426,967,127 | | | | 0 | | | | 664,082,401 | |
Futures contracts | | | 84,634 | | | | 0 | | | | 0 | | | | 84,634 | |
Total assets | | $ | 237,199,908 | | | $ | 426,967,127 | | | $ | 0 | | | $ | 664,167,035 | |
Liabilities | | | | | | | | | | | | | | | | |
Futures contracts | | $ | 141,826 | | | $ | 0 | | | $ | 0 | | | $ | 141,826 | |
Total liabilities | | $ | 141,826 | | | $ | 0 | | | $ | 0 | | | $ | 141,826 | |
| | | | |
| 26 | | Wells Fargo Short Duration Government Bond Fund | | Notes to financial statements |
Futures contracts are reported at their cumulative unrealized gains (losses) at measurement date as reported in the table following the Portfolio of Investments. For futures contracts the current day’s variation margin is reported on the Statement of Assets and Liabilities. All other assets and liabilities are reported at their market value at measurement date.
The Fund recognizes transfers between levels within the fair value hierarchy at the end of the reporting period. At August 31, 2018, the Fund did not have any transfers into/out of Level 1, Level 2, or Level 3.
4. TRANSACTIONS WITH AFFILIATES
Management fee
Funds Management, an indirect wholly owned subsidiary of Wells Fargo & Company (“Wells Fargo”), is the manager of the Fund and provides advisory and fund-level administrative services under an investment management agreement. Under the investment management agreement, Funds Management is responsible for, among other services, implementing the investment objectives and strategies of the Fund, supervising the subadviser and providing fund-level administrative services in connection with the Fund’s operations. As compensation for its services under the investment management agreement, Funds Management is entitled to receive an annual management fee starting at 0.35% and declining to 0.255% as the average daily net assets of the Fund increase. For the year ended August 31, 2018, the management fee was equivalent to an annual rate of 0.35% of the Fund’s average daily net assets.
Funds Management has retained the services of a subadviser to provide daily portfolio management to the Fund. The fee for subadvisory services is borne by Funds Management. Wells Capital Management Incorporated, an affiliate of Funds Management and an indirect wholly owned subsidiary of Wells Fargo, is the subadviser to the Fund and is entitled to receive a fee from Funds Management at an annual rate starting at 0.15% and declining to 0.05% as the average daily net assets of the Fund increase.
Administration fees
Under a class-level administration agreement, Funds Management provides class-level administrative services to the Fund, which includes paying fees and expenses for services provided by the transfer agent, sub-transfer agents, omnibus account servicers and record-keepers. As compensation for its services under the class-level administration agreement, Funds Management receives an annual fee which is calculated based on the average daily net assets of each class as follows:
| | | | |
| | | Class-level
administration fee | |
Class A, Class C | | | 0.16 | % |
Class R6 | | | 0.03 | |
Administrator Class | | | 0.10 | |
Institutional Class | | | 0.08 | |
Funds Management has contractually waived and/or reimbursed management and administration fees to the extent necessary to maintain certain net operating expense ratios for the Fund. When each class of the Fund has exceeded its expense cap, Funds Management has waived fees and/or reimbursed expenses from fund level expenses on a proportionate basis and then from class specific expenses; otherwise, waivers and/or reimbursements are applied against class specific expenses before fund level expenses. Funds Management has committed through December 31, 2018 to waive fees and/or reimburse expenses to the extent necessary to cap the Fund’s expenses at 0.78% for Class A shares, 1.53% for Class C shares, 0.37% for Class R6 shares, 0.60% for Administrator Class shares, and 0.42% for Institutional Class shares. After this time, the cap may be increased or the commitment to maintain the cap may be terminated only with the approval of the Board of Trustees.
Distribution fee
The Trust has adopted a distribution plan for Class C shares of the Fund pursuant to Rule 12b-1 under the 1940 Act. A distribution fee is charged to Class C shares and paid to Wells Fargo Funds Distributor, LLC (“Funds Distributor”), the principal underwriter, at an annual rate of 0.75% of the average daily net assets of Class C shares.
In addition, Funds Distributor is entitled to receive the front-end sales charge from the purchase of Class A shares and a contingent deferred sales charge on the redemption of certain Class A shares. Funds Distributor is also entitled to receive the contingent deferred sales charges from redemptions of Class C shares. For the year ended August 31, 2018, Funds Distributor received $163 from the sale of Class A shares. No contingent deferred sales charges were incurred by Class A and Class C shares for the year ended August 31, 2018.
| | | | | | |
| Notes to financial statements | | Wells Fargo Short Duration Government Bond Fund | | | 27 | |
Shareholder servicing fees
The Trust has entered into contracts with one or more shareholder servicing agents, whereby Class A, Class C, and Administrator Class of the Fund are charged a fee at an annual rate of 0.25% of the average daily net assets of each respective class.
A portion of these total shareholder servicing fees were paid to affiliates of Wells Fargo.
Interfund transactions
The Fund may purchase or sell portfolio investment securities to certain other Wells Fargo affiliates pursuant to Rule 17a-7 under the 1940 Act and under procedures adopted by the Board of Trustees. The procedures have been designed to ensure that these interfund transactions, which do not incur broker commissions, are effected at current market prices.
5. INVESTMENT PORTFOLIO TRANSACTIONS
Purchases and sales of investments, excluding short-term securities, for the year ended August 31, 2018 were as follows:
| | | | | | |
Purchases at cost | | Sales proceeds |
U.S.
government | | Non-U.S.
government | | U.S.
government | | Non-U.S.
government |
| $2,314,230,338 | | $116,629,318 | | $2,412,669,631 | | $128,896,918 |
6. DERIVATIVE TRANSACTIONS
During the year ended August 31, 2018, the Fund entered into futures contracts to speculate on interest rates and to help manage the duration of the portfolio. The Fund had an average notional amount of $152,304,811 in long futures contracts and $75,335,049 in short futures contracts during the year ended August 31, 2018.
7. BANK BORROWINGS
The Trust (excluding the money market funds), Wells Fargo Master Trust and Wells Fargo Variable Trust are parties to a $280,000,000 revolving credit agreement whereby the Fund is permitted to use bank borrowings for temporary or emergency purposes, such as to fund shareholder redemption requests. Interest under the credit agreement is charged to the Fund based on a borrowing rate equal to the higher of the Federal Funds rate in effect on that day plus 1.25% or the overnight LIBOR rate in effect on that day plus 1.25%. In addition, an annual commitment fee equal to 0.25% of the unused balance is allocated to each participating fund.
For the year ended August 31, 2018, there were no borrowings by the Fund under the agreement.
8. DISTRIBUTIONS TO SHAREHOLDERS
The tax character of distributions paid was $16,708,687 and $18,887,368 of ordinary income for the years ended August 31, 2018 and August 31, 2017, respectively.
As of August 31, 2018, the components of distributable earnings on a tax basis were as follows:
| | | | |
Undistributed ordinary income | | Unrealized losses | | Capital loss carryforward |
| $480,674 | | $(4,368,581) | | $(76,761,431) |
9. INDEMNIFICATION
Under the Trust’s organizational documents, the officers and Trustees have been granted certain indemnification rights against certain liabilities that may arise out of performance of their duties to the Trust. Additionally, in the normal course of business, the Trust may enter into contracts with service providers that contain a variety of indemnification clauses. The Trust’s maximum exposure under these arrangements is dependent on future claims that may be made against the Fund and, therefore, cannot be estimated.
| | | | |
| 28 | | Wells Fargo Short Duration Government Bond Fund | | Notes to financial statements |
10. NEW ACCOUNTING PRONOUNCEMENTS AND REGULATORY CHANGES
On August 17, 2018, the Securities and Exchange Commission (“SEC”) adopted Disclosure Update and Simplification, which amends certain disclosure requirements. The amendments are effective for filings subsequent to November 5, 2018. Management expects these amendments will impact the classification of disclosures in the financial statements.
In August 2018, FASB issued Accounting Standards Update (“ASU”) No. 2018-13, Fair Value Measurement (Topic 820) Disclosure Framework—Changes to the Disclosure Requirements for Fair Value Measurement. ASU 2018-13 updates the disclosure requirements for fair value measurements by modifying or removing certain disclosures and adding certain new disclosures. The amendments are effective for fiscal years, and interim periods within those fiscal years, beginning after December 15, 2019. Early adoption is permitted. Management is currently evaluating the potential impact of this new guidance to the financial statements.
In March 2017, FASB issued ASU No. 2017-08, Premium Amortization on Purchased Callable Debt Securities. ASU 2017-08 shortens the amortization period for certain callable debt securities held at a premium. The amendments require the premium to be amortized to the earliest call date. The amendments do not require an accounting change for securities held at a discount; the discount continues to be amortized to maturity. ASU 2017-08 is effective for fiscal years beginning after December 15, 2018 and for interim periods within those fiscal years . Management is currently evaluating the potential impact of this new guidance to the financial statements.
| | | | | | |
| Report of independent registered public accounting firm | | Wells Fargo Short Duration Government Bond Fund | | | 29 | |
BOARD OF TRUSTEES AND SHAREHOLDERS OF WELLS FARGO FUNDS TRUST:
Opinion on the Financial Statements
We have audited the accompanying statement of assets and liabilities of Wells Fargo Short Duration Government Bond Fund (the “Fund”), including the portfolio of investments, as of August 31, 2018, the related statement of operations for the year then ended, the statements of changes in net assets for each of the years in the two-year period then ended, and the related notes (collectively, the “financial statements”) and the financial highlights for each of the years in the five-year period then ended. In our opinion, the financial statements and financial highlights present fairly, in all material respects, the financial position of the Fund as of August 31, 2018, the results of its operations for the year then ended, the changes in its net assets for each of the years in the two-year period then ended, and the financial highlights for each of the years in the five-year period then ended, in conformity with U.S. generally accepted accounting principles.
Basis for Opinion
These financial statements and financial highlights are the responsibility of the Fund’s management. Our responsibility is to express an opinion on these financial statements and financial highlights based on our audits. We are a public accounting firm registered with the Public Company Accounting Oversight Board (United States) (“PCAOB”) and are required to be independent with respect to the Fund in accordance with the U.S. federal securities laws and the applicable rules and regulations of the Securities and Exchange Commission and the PCAOB.
We conducted our audits in accordance with the standards of the PCAOB. Those standards require that we plan and perform the audit to obtain reasonable assurance about whether the financial statements and financial highlights are free of material misstatement, whether due to error or fraud. Our audits included performing procedures to assess the risks of material misstatement of the financial statements and financial highlights, whether due to error or fraud, and performing procedures that respond to those risks. Such procedures included examining, on a test basis, evidence regarding the amounts and disclosures in the financial statements and financial highlights. Such procedures also included confirmation of securities owned as of August 31, 2018, by correspondence with the custodian and brokers, or by other appropriate auditing procedures. Our audits also included evaluating the accounting principles used and significant estimates made by management, as well as evaluating the overall presentation of the financial statements and financial highlights. We believe that our audits provide a reasonable basis for our opinion.

We have not been able to determine the specific year that we began serving as the auditor of one or more Wells Fargo Funds investment companies, however we are aware that we have served as the auditor of one or more Wells Fargo Funds investment companies since at least 1955.
Boston, Massachusetts
October 26, 2018
| | | | |
| 30 | | Wells Fargo Short Duration Government Bond Fund | | Other information (unaudited) |
TAX INFORMATION
For the fiscal year ended August 31, 2018. $16,759,542 has been designated as interest-related dividends for nonresident alien shareholders pursuant to Section 871 of the Internal Revenue Code.
For the fiscal year ended August 31, 2018, 21.82% of the ordinary income distributed was derived from interest on U.S. government securities.
PROXY VOTING INFORMATION
A description of the policies and procedures that the Fund uses to determine how to vote proxies relating to portfolio securities is available, upon request, by calling 1-800-222-8222, visiting our website at wellsfargofunds.com, or visiting the SEC website at sec.gov. Information regarding how the Fund voted proxies relating to portfolio securities during the most recent 12-month period ended June 30 is available on the Fund’s website at wellsfargofunds.com or by visiting the SEC website at sec.gov.
PORTFOLIO HOLDINGS INFORMATION
The complete portfolio holdings for the Fund are publicly available monthly on the Fund’s website (wellsfargofunds.com), on a one-month delayed basis. In addition, top ten holdings information (excluding derivative positions) for the Fund is publicly available on the Fund’s website on a monthly, seven-day or more delayed basis. The Fund files its complete schedule of portfolio holdings with the SEC for the first and third quarters of each fiscal year on Form N-Q, which is available by visiting the SEC website at sec.gov. In addition, the Fund’s Form N-Q may be reviewed and copied at the SEC’s Public Reference Room in Washington, DC, and at regional offices in New York City, at 233 Broadway, and in Chicago, at 175 West Jackson Boulevard, Suite 900. Information about the Public Reference Room may be obtained by calling 1-800-SEC-0330.
| | | | | | |
| Other information (unaudited) | | Wells Fargo Short Duration Government Bond Fund | | | 31 | |
BOARD OF TRUSTEES AND OFFICERS
Each of the Trustees and Officers1 listed in the table below acts in identical capacities for each fund in the Wells Fargo family of funds, which consists of 154 mutual funds comprising the Wells Fargo Funds Trust, Wells Fargo Variable Trust, Wells Fargo Master Trust and four closed-end funds (collectively the “Fund Complex”). This table should be read in conjunction with the Prospectus and the Statement of Additional Information2. The mailing address of each Trustee and Officer is 525 Market Street, 12th Floor, San Francisco, CA 94105. Each Trustee and Officer serves an indefinite term, however, each Trustee serves such term until reaching the mandatory retirement age established by the Trustees.
Independent Trustees
| | | | | | |
Name and year of birth | | Position held and length of service* | | Principal occupations during past five years or longer | | Current other public company or investment company directorships |
William R. Ebsworth (Born 1957) | | Trustee, since 2015 | | Retired. From 1984 to 2013, equities analyst, portfolio manager, research director and chief investment officer at Fidelity Management and Research Company in Boston, Tokyo, and Hong Kong, and retired in 2013 as Chief Investment Officer of Fidelity Strategic Advisers, Inc. where he led a team of investment professionals managing client assets. Prior thereto, Board member of Hong Kong Securities Clearing Co., Hong Kong Options Clearing Corp., the Thailand International Fund, Ltd., Fidelity Investments Life Insurance Company, and Empire Fidelity Investments Life Insurance Company. Board member of the Vincent Memorial Hospital Endowment (non-profit organization), where he serves on the Investment Committee and as a Chair of the Audit Committee. Mr. Ebsworth is a CFA® charterholder. | | N/A |
Jane A. Freeman (Born 1953) | | Trustee, since 2015; Chair Liaison, since 2018 | | Retired. From 2012 to 2014 and 1999 to 2008, Chief Financial Officer of Scientific Learning Corporation. From 2008 to 2012, Ms. Freeman provided consulting services related to strategic business projects. Prior to 1999, Portfolio Manager at Rockefeller & Co. and Scudder, Stevens & Clark. Board member of the Harding Loevner Funds from 1996 to 2014, serving as both Lead Independent Director and chair of the Audit Committee. Board member of the Russell Exchange Traded Funds Trust from 2011 to 2012 and the chair of the Audit Committee. Ms. Freeman is a Board Member of The Ruth Bancroft Garden (non-profit organization). She is also an inactive Chartered Financial Analyst. | | N/A |
Isaiah Harris, Jr. (Born 1952) | | Trustee, since 2009 | | Retired. Chairman of the Board of CIGNA Corporation since 2009, and Director since 2005. From 2003 to 2011, Director of Deluxe Corporation. Prior thereto, President and CEO of BellSouth Advertising and Publishing Corp. from 2005 to 2007, President and CEO of BellSouth Enterprises from 2004 to 2005 and President of BellSouth Consumer Services from 2000 to 2003. Emeritus member of the Iowa State University Foundation Board of Governors. Emeritus Member of the Advisory Board of Iowa State University School of Business. Advisory Board Member, Palm Harbor Academy (private school). Advisory Board Member, Child Evangelism Fellowship (non-profit). Mr. Harris is a certified public accountant (inactive status). | | CIGNA Corporation |
Judith M. Johnson (Born 1949) | | Trustee, since 2008; Audit Committee Chairman, since 2009 | | Retired. Prior thereto, Chief Executive Officer and Chief Investment Officer of Minneapolis Employees Retirement Fund from 1996 to 2008. Ms. Johnson is an attorney, certified public accountant and a certified managerial accountant. | | N/A |
David F. Larcker (Born 1950) | | Trustee, since 2009 | | James Irvin Miller Professor of Accounting at the Graduate School of Business, Stanford University, Director of the Corporate Governance Research Initiative and Senior Faculty of The Rock Center for Corporate Governance since 2006. From 2005 to 2008, Professor of Accounting at the Graduate School of Business, Stanford University. Prior thereto, Ernst & Young Professor of Accounting at The Wharton School, University of Pennsylvania from 1985 to 2005. | | N/A |
| | | | |
| 32 | | Wells Fargo Short Duration Government Bond Fund | | Other information (unaudited) |
| | | | | | |
Name and year of birth | | Position held and length of service* | | Principal occupations during past five years or longer | | Current other public company or investment company directorships |
Olivia S. Mitchell (Born 1953) | | Trustee, since 2006; Governance Committee Chairman, since 2018 | | International Foundation of Employee Benefit Plans Professor, Wharton School of the University of Pennsylvania since 1993. Director of Wharton’s Pension Research Council and Boettner Center on Pensions & Retirement Research, and Research Associate at the National Bureau of Economic Research. Previously, Cornell University Professor from 1978 to 1993. | | N/A |
Timothy J. Penny (Born 1951) | | Trustee, since 1996; Chairman, since 2018; Vice Chairman, from 2017 to 2018 | | President and Chief Executive Officer of Southern Minnesota Initiative Foundation, a non-profit organization, since 2007. Member of the Board of Trustees of NorthStar Education Finance, Inc., a non-profit organization, since 2007. | | N/A |
James G. Polisson (Born 1959) | | Trustee, since 2018; Advisory Board Member, from 2017 to 2018 | | Retired. Chief Marketing Officer, Source (ETF) UK Services, Ltd, from 2015 to 2017. From 2012 to 2015, Principal of The Polisson Group, LLC, a management consulting, corporate advisory and principal investing company. Chief Executive Officer and Managing Director at Russell Investments, Global Exchange Traded Funds from 2010 to 2012. Managing Director of Barclays Global Investors from 1998 to 2010 and Global Chief Marketing Officer for iShares and Barclays Global Investors from 2000 to 2010. Trustee of the San Francisco Mechanics’ Institute, a non-profit organization, from 2013 to 2015. Board member of the Russell Exchange Traded Fund Trust from 2011 to 2012. Director of Barclays Global Investors Holdings Deutschland GmbH from 2006 to 2009. Mr. Polisson is an attorney and has a retired status with the Massachusetts and District of Columbia Bar Associations. | | N/A |
Michael S. Scofield (Born 1943) | | Trustee, since 2010 | | Served on the Investment Company Institute’s Board of Governors and Executive Committee from 2008-2011 as well the Governing Council of the Independent Directors Council from 2006-2011 and the Independent Directors Council Executive Committee from 2008-2011. Trustee of the Evergreen Fund complex (and its predecessors) from 1984 to 2010. Chairman of the Evergreen Funds from 2000-2010. Former Trustee of the Mentor Funds. Retired Attorney, Law Offices of Michael S. Scofield. | | N/A |
Pamela Wheelock (Born 1959) | | Trustee, since 2018; Advisory Board Member, from 2017 to 2018 | | Chief Operating Officer, Twin Cities Habitat for Humanity, since January, 2017. Vice President of University Services, University of Minnesota from 2012 to 2017. Prior thereto, on the Board of Directors, Governance Committee and Finance Committee for the Minnesota Philanthropy Partners (Saint Paul Foundation) from 2012 to 2018, Interim President and Chief Executive Officer of Blue Cross Blue Shield of Minnesota from 2010 to 2011, Chairman of the Board from 2009 to 2011 and Board Director from 2003 to 2015. Vice President, Leadership and Community Engagement, Bush Foundation, Saint Paul, Minnesota (a private foundation) from 2009 to 2011. Executive Vice President and Chief Financial Officer, Minnesota Sports and Entertainment from 2004 to 2009 and Senior Vice President from 2002 to 2004. Commissioner of Finance, State of Minnesota, from 1999 to 2002. Currently the Board Chair of the Minnesota Wild Foundation since 2010. | | N/A |
| * | Length of service dates reflect the Trustee’s commencement of service with the Trust’s predecessor entities, where applicable. |
| | | | | | |
| Other information (unaudited) | | Wells Fargo Short Duration Government Bond Fund | | | 33 | |
Officers
| | | | | | |
Name and year of birth | | Position held and length of service | | Principal occupations during past five years or longer | | |
Andrew Owen (Born 1960) | | President, since 2017 | | Executive Vice President of Wells Fargo & Company and Head of Affiliated Managers, Wells Fargo Asset Management, since 2014. In addition, Mr. Owen is currently President, Chief Executive Officer and Director of Wells Fargo Funds Management, LLC since 2017. Prior thereto, Executive Vice President responsible for marketing, investments and product development for Wells Fargo Funds Management, LLC, from 2009 to 2014. | | |
Nancy Wiser1 (Born 1967) | | Treasurer, since 2012 | | Executive Vice President of Wells Fargo Funds Management, LLC since 2011. Chief Operating Officer and Chief Compliance Officer at LightBox Capital Management LLC, from 2008 to 2011. | | |
Alexander Kymn3 (Born 1973) | | Secretary, since 2018; Chief Legal Officer, since 2018 | | Senior Company Counsel of Wells Fargo Bank, N.A. since 2018 (previously Senior Counsel from 2007 to 2018). Vice President of Wells Fargo Funds Management, LLC from 2008 to 2014. | | |
Michael H. Whitaker (Born 1967) | | Chief Compliance Officer, since 2016 | | Senior Vice President and Chief Compliance Officer since 2016. Senior Vice President and Chief Compliance Officer for Fidelity Investments from 2007 to 2016. | | |
David Berardi (Born 1975) | | Assistant Treasurer, since 2009 | | Vice President of Wells Fargo Funds Management, LLC since 2009. Vice President of Evergreen Investment Management Company, LLC from 2008 to 2010. Manager of Fund Reporting and Control for Evergreen Investment Management Company, LLC from 2004 to 2010. | | |
Jeremy DePalma1 (Born 1974) | | Assistant Treasurer, since 2009 | | Senior Vice President of Wells Fargo Funds Management, LLC since 2009. Senior Vice President of Evergreen Investment Management Company, LLC from 2008 to 2010 and head of the Fund Reporting and Control Team within Fund Administration from 2005 to 2010. | | |
| 1 | Nancy Wiser acts as Treasurer of 77 funds in the Fund Complex. Jeremy DePalma acts as Treasurer of 77 funds and Assistant Treasurer of 77 funds in the Fund Complex. |
| 2 | The Statement of Additional Information includes additional information about the Trustees and is available, without charge, upon request, by calling 1-800-222-8222 or by visiting the website at wellsfargofunds.com. |
| 3 | Alexander Kymn became the Secretary and Chief Legal Officer effective April 17, 2018. |
| | | | |
| 34 | | Wells Fargo Short Duration Government Bond Fund | | Other information (unaudited) |
BOARD CONSIDERATION OF INVESTMENT MANAGEMENT AND SUB-ADVISORY AGREEMENTS:
Wells Fargo Short Duration Government Bond Fund
Under the Investment Company Act of 1940 (the “1940 Act”), the Board of Trustees (the “Board”) of Wells Fargo Funds Trust (the “Trust”) must determine annually whether to approve the continuation of the Trust’s investment management and sub-advisory agreements. In this regard, at an in-person meeting held on May 22-23, 2018 (the “Meeting”), the Board, all the members of which have no direct or indirect interest in the investment management and sub-advisory agreements and are not “interested persons” of the Trust, as defined in the 1940 Act (the “Independent Trustees”), reviewed and approved for Wells Fargo Short Duration Government Bond Fund (the “Fund”): (i) an investment management agreement (the “Management Agreement”) with Wells Fargo Funds Management, LLC (“Funds Management”); and (ii) an investment sub-advisory agreement (the “Sub-Advisory Agreement”) with Wells Capital Management Incorporated (the “Sub-Adviser”), an affiliate of Funds Management. The Management Agreement and the Sub-Advisory Agreement are collectively referred to as the “Advisory Agreements.”
At the Meeting, the Board considered the factors and reached the conclusions described below relating to the selection of Funds Management and the Sub-Adviser and the approval of the Advisory Agreements. Prior to the Meeting, including at an in-person meeting in April 2018, the Trustees conferred extensively among themselves and with representatives of Funds Management about these matters. Also, the Board has adopted a team-based approach, with each team consisting of a sub-set of Trustees, to assist the full Board in the discharge of its duties in reviewing investment performance and other matters throughout the year. The Independent Trustees were assisted in their evaluation of the Advisory Agreements by independent legal counsel, from whom they received separate legal advice and with whom they met separately.
In providing information to the Board, Funds Management and the Sub-Adviser were guided by a detailed set of requests for information submitted to them by independent legal counsel on behalf of the Independent Trustees at the start of the Board’s annual contract renewal process earlier in 2018. In considering and approving the Advisory Agreements, the Trustees considered the information they believed relevant, including but not limited to the information discussed below. The Board considered not only the specific information presented in connection with the Meeting, but also the knowledge gained over time through interaction with Funds Management and the Sub-Adviser about various topics. In this regard, the Board reviewed reports of Funds Management at each of its quarterly meetings, which included, among other things, portfolio reviews and investment performance reports. In addition, the Board and the teams mentioned above confer with portfolio managers at various times throughout the year. The Board did not identify any particular information or consideration that was all-important or controlling, and each individual Trustee may have attributed different weights to various factors.
After its deliberations, the Board unanimously approved the continuation of the Advisory Agreements for a one-year term and determined that the compensation payable to Funds Management and the Sub-Adviser under each of the Advisory Agreements was reasonable. The Board considered the approval of the Advisory Agreements for the Fund as part of its consideration of agreements for funds across the complex, but its approvals were made on a fund-by-fund basis. The following summarizes a number of important, but not necessarily all, factors considered by the Board in support of its approvals.
Nature, extent and quality of services
The Board received and considered various information regarding the nature, extent and quality of services provided to the Fund by Funds Management and the Sub-Adviser under the Advisory Agreements. This information included a description of the investment advisory services and Fund-level administrative services covered by the Management Agreement, as well as, among other things, a summary of the background and experience of senior management of Wells Fargo Asset Management (“WFAM”), of which Funds Management and the Sub-Adviser are a part, a summary of investments made in the business of WFAM, a summary of certain organizational and personnel changes involving Funds Management and the Sub-Adviser, and a description of Funds Management’s and the Sub-Adviser’s business continuity planning programs and of their approaches to data privacy and cybersecurity. The Board also considered the qualifications, background, tenure and responsibilities of each of the portfolio managers primarily responsible for the day-to-day portfolio management of the Fund.
The Board evaluated the ability of Funds Management and the Sub-Adviser to attract and retain qualified investment professionals, including research, advisory and supervisory personnel. The Board further considered the compliance programs and compliance records of Funds Management and the Sub-Adviser. In addition, the Board took into account the full range of services provided to the Fund by Funds Management and its affiliates.
Fund investment performance and expenses
The Board considered the investment performance results for the Fund over various time periods ended December 31, 2017. The Board considered these results in comparison to the investment performance of funds in a universe that was determined
| | | | | | |
| Other information (unaudited) | | Wells Fargo Short Duration Government Bond Fund | | | 35 | |
by Broadridge Inc. (“Broadridge”) to be similar to the Fund (the “Universe”), and in comparison to the Fund’s benchmark index and to other comparative data. Broadridge is an independent provider of investment company data. The Board received a description of the methodology used by Broadridge to select the mutual funds in the performance Universe. The Board noted that the investment performance of the Fund (Administrator Class) was higher than the average investment performance of the Universe for all periods under review. The Board also noted that the investment performance of the Fund was higher than or in range of its benchmark index, the Bloomberg Barclays 1-3 Year Government Index, for all periods under review. The Board noted that the Fund experienced a portfolio manager change in 2017.
The Board also received and considered information regarding the Fund’s net operating expense ratios and their various components, including actual management fees, custodian and other non-management fees, and Rule 12b-1 and non-Rule 12b-1 shareholder service fees. The Board considered these ratios in comparison to the median ratios of funds in class-specific expense groups that were determined by Broadridge to be similar to the Fund (the “Groups”). The Board received a description of the methodology used by Broadridge to select the mutual funds in the expense Groups and an explanation of how funds comprising expense groups and their expense ratios may vary from year-to-year. Based on the Broadridge reports, the Board noted that the net operating expense ratios of the Fund were lower than the median net operating expense ratios of the expense Groups for each share class.
The Board took into account the Fund’s investment performance and expense information provided to it among the factors considered in deciding to re-approve the Advisory Agreements.
Investment management and sub-advisory fee rates
The Board reviewed and considered the contractual fee rates payable by the Fund to Funds Management under the Management Agreement, as well as the contractual fee rates payable by the Fund to Funds Management for class-level administrative services under a Class-Level Administration Agreement, which include, among other things, class-level transfer agency and sub-transfer agency costs (collectively, the “Management Rates”). The Board also reviewed and considered the contractual investment sub-advisory fee rates that are payable by Funds Management to the Sub-Adviser for investment sub-advisory services.
Among other information reviewed by the Board was a comparison of the Fund’s Management Rates with the average contractual investment management fee rates of funds in the expense Groups at a common asset level as well as transfer agency costs of the funds in the expense Groups. The Board noted that the Management Rates of the Fund were lower than or equal to the sum of these average rates for the Fund’s expense Groups for all share classes.
The Board also received and considered information about the portion of the total management fee that was retained by Funds Management after payment of the fee to the Sub-Adviser for sub-advisory services. In assessing the reasonableness of this amount, the Board received and evaluated information about the nature and extent of responsibilities retained and risks assumed by Funds Management and not delegated to or assumed by the Sub-Adviser, and about Funds Management’s on-going oversight services. Given the affiliation between Funds Management and the Sub-Adviser, the Board ascribed limited relevance to the allocation of fees between them.
The Board also received and considered information about the nature and extent of services offered and fee rates charged by Funds Management and the Sub-Adviser to other types of clients with investment strategies similar to those of the Fund. In this regard, the Board received information about the significantly greater scope of services, and compliance, reporting and other legal burdens and risks of managing mutual funds compared with those associated with managing assets of non-mutual fund clients such as institutional separate accounts.
Based on its consideration of the factors and information it deemed relevant, including those described here, the Board determined that the compensation payable to Funds Management under the Management Agreement and to the Sub-Adviser under the Sub-Advisory Agreement was reasonable.
Profitability
The Board received and considered information concerning the profitability of Funds Management, as well as the profitability of both WFAM and Wells Fargo & Co. (“Wells Fargo”) as a whole, from providing services to the Fund and the fund family as a whole. The Board noted that the Sub-Adviser’s profitability information with respect to providing services to the Fund was subsumed in the WFAM and Wells Fargo profitability analysis.
Funds Management reported on the methodologies and estimates used in calculating profitability, including a description of the methodology used to allocate certain expenses and recent enhancements made to the methodology. Among other things, the Board noted that the levels of profitability reported on a fund-by-fund basis varied widely, depending on factors such as the size and type of fund. Based on its review, the Board did not deem the profits reported by Funds Management, WFAM or Wells Fargo from services provided to the Fund to be at a level that would prevent it from approving the continuation of the Advisory Agreements.
| | | | |
| 36 | | Wells Fargo Short Duration Government Bond Fund | | Other information (unaudited) |
Economies of scale
The Board considered the extent to which Funds Management may experience economies of scale in the provision of management services, and the extent to which scale benefits, if any, would be shared with shareholders. In particular, the Board noted the existence of breakpoints in the Fund’s management fee structure, which operate generally to reduce the Fund’s expense ratios as the Fund grows in size. It considered that, for a small fund or a fund that shrinks in size, breakpoints conversely can result in higher fee levels. The Board also considered that in addition to management fee breakpoints, competitive management fee rates set at the outset without regard to breakpoints and fee waiver and expense reimbursement arrangements, as well as investments in the business intended to enhance services available to Fund shareholders, are means of sharing potential economies of scale with shareholders of the Fund.
The Board concluded that the Fund’s fee and expense arrangements, including contractual breakpoints, constituted a reasonable approach to sharing potential economies of scale with the Fund and its shareholders.
Other benefits to Funds Management and the Sub-Adviser
The Board received and considered information regarding potential “fall-out” or ancillary benefits received by Funds Management and its affiliates, including the Sub-Adviser, as a result of their relationships with the Fund. Ancillary benefits could include, among others, benefits directly attributable to other relationships with the Fund and benefits potentially derived from an increase in Funds Management’s and the Sub-Adviser’s business as a result of their relationships with the Fund. The Board noted that various affiliates of Funds Management may receive distribution-related fees, shareholder servicing payments and sub-transfer agency fees in respect of shares sold or held through them and services provided.
The Board also reviewed information about soft dollar credits earned and utilized by the Sub-Adviser, fees earned by Funds Management and the Sub-Adviser from managing a private investment vehicle for the fund family’s securities lending collateral and commissions earned by an affiliated broker from portfolio transactions.
Based on its consideration of the factors and information it deemed relevant, including those described here, the Board did not find that any ancillary benefits received by Funds Management and its affiliates, including the Sub-Adviser, were unreasonable.
Conclusion
At the Meeting, after considering the above-described factors and based on its deliberations and its evaluation of the information described above, the Board unanimously approved the continuation of the Advisory Agreements for a one-year term and determined that the compensation payable to Funds Management and the Sub-Adviser under each of the Advisory Agreements was reasonable.
| | | | | | |
| Appendix A (unaudited) | | Wells Fargo Short Duration Government Bond Fund | | | 37 | |
SALES CHARGE REDUCTIONS AND WAIVERS FOR CERTAIN INTERMEDIARIES
Ameriprise
Effective June 1, 2018, shareholders purchasing Fund shares through an Ameriprise Financial platform or account will be eligible only for the following Class A load waivers (front-end sales charge waivers), which may differ from those disclosed elsewhere in the Fund’s prospectus or Statement of Additional Information.
Front-end Sales Load Waivers on Class A Shares Available at Ameriprise Financial
| | • | | Employer-sponsored retirement plans (e.g., 401(k) plans, 457 plans, employer-sponsored 403(b) plans, profit sharing and money purchase pension plans and defined benefit plans). For purposes of this provision, employer-sponsored retirement plans do not include SEP IRAs, Simple IRAs or SAR-SEPs. |
| | • | | Shares purchased through an Ameriprise Financial investment advisory program (if an Advisory or similar share class for such investment advisory program is not available) |
| | • | | Shares purchased by third party investment advisors on behalf of their advisory clients through Ameriprise Financial’s platform (if an Advisory or similar share class for such investment advisory program is not available) |
| | • | | Shares purchased through reinvestment of distributions and dividend reinvestment when purchasing shares of the same Fund (but not any other fund within the same fund family) |
| | • | | Shares exchanged from Class C shares of the same fund in the month of or following the 10-year anniversary of the purchase date. To the extent that the Fund’s prospectus elsewhere provides for a waiver with respect to such shares following a shorter holding period, that waiver will apply to exchanges following such shorter period. To the extent that the Fund’s prospectus elsewhere provides for a waiver with respect to exchanges of Class C shares for load-waived shares, that waiver will also apply to such exchanges. |
| | • | | Employees and registered representatives of Ameriprise Financial or its affiliates and their immediate family members |
| | • | | Shares purchased by or through qualified accounts (including IRAs, Coverdell Education Savings Accounts, 401(k)s, 403(b) TSCAs subject to ERISA and defined benefit plans) that are held by a covered family member, defined as an Ameriprise financial advisor and/or the advisor’s spouse, advisor’s lineal ascendant (mother, father, grandmother, grandfather, great grandmother, great grandfather), advisor’s lineal descendant (son, step-son, daughter, step-daughter, grandson, granddaughter, great grandson, great granddaughter) or any spouse of a covered family member who is a lineal descendant |
| | • | | Shares purchased from the proceeds of redemptions within the same fund family, provided (1) the repurchase occurs within 90 days following the redemption, (2) the redemption and purchase occur in the same account, and (3) redeemed shares were subject to a front-end or deferred sales load (i.e. Rights of Reinstatement). Subject to the Fund’s policy regarding frequent purchases and redemptions of Fund shares, you may not be able to repurchase shares for the first 30 days after your redemption. |
Automatic Exchange of Class C Shares Available at Ameriprise Financial
| | • | | Class C shares will automatically exchange to Class A shares in the month of the 10-year anniversary of the purchase date. |
Merrill Lynch
Effective April 10, 2017, shareholders purchasing Fund shares through a Merrill Lynch platform or account will be eligible only for the following load waivers (front-end sales charge waivers and contingent deferred, or back-end, sales charge waivers) and discounts, which may differ from those disclosed elsewhere in the Fund’s prospectus or Statement of Additional Information.
Front-end Sales Load Waivers on Class A Shares available at Merrill Lynch
| | • | | Employer-sponsored retirement, deferred compensation and employee benefit plans (including health savings accounts) and trusts used to fund those plans, provided that the shares are not held in a commission-based brokerage account and shares are held for the benefit of the plan |
| | • | | Shares purchased by or through a 529 Plan |
| | • | | Shares purchased through a Merrill Lynch affiliated investment advisory program |
| | | | |
| 38 | | Wells Fargo Short Duration Government Bond Fund | | Appendix A (unaudited) |
| | • | | Shares purchased by third party investment advisors on behalf of their advisory clients through Merrill Lynch’s platform |
| | • | | Shares of funds purchased through the Merrill Edge Self-Directed platform (if applicable) |
| | • | | Shares purchased through reinvestment of capital gains distributions and dividend reinvestment when purchasing shares of the same fund (but not any other fund within the fund family) |
| | • | | Shares exchanged from Class C (i.e. level-load) shares of the same fund in the month of or following the 10-year anniversary of the purchase date |
| | • | | Employees and registered representatives of Merrill Lynch or its affiliates and their family members, as defined by Merrill Lynch, which may differ from the definition of family member in the Fund’s prospectus. |
| | • | | Directors or Trustees of the Fund, and employees of the Fund’s investment adviser or any of its affiliates, as described in the Fund’s prospectus |
| | • | | Shares purchased from the proceeds of redemptions within the same fund family, provided (1) the repurchase occurs within 90 days following the redemption, (2) the redemption and purchase occur in the same account, and (3) redeemed shares were subject to a front-end or deferred sales load (known as Rights of Reinstatement). Subject to the Fund’s policy regarding frequent purchases and redemptions of Fund shares, you may not be able to repurchase shares for the first 30 days after your redemption. |
CDSC Waivers on A, B and C Shares available at Merrill Lynch
| | • | | Death or disability of the shareholder |
| | • | | Shares sold as part of a systematic withdrawal plan as described in the Fund’s prospectus |
| | • | | Return of excess contributions from an IRA Account |
| | • | | Shares sold as part of a required minimum distribution for IRA and retirement accounts due to the shareholder reaching age 70½ |
| | • | | Shares sold to pay Merrill Lynch fees but only if the transaction is initiated by Merrill Lynch |
| | • | | Shares acquired through a right of reinstatement |
| | • | | Shares held in retirement brokerage accounts, that are exchanged for a lower cost share class due to transfer to certain fee based accounts or platforms (applicable to A and C shares only) |
Front-end load Discounts Available at Merrill Lynch: Breakpoints, Rights of Accumulation & Letters of Intent
| | • | | Breakpoints as described in the Fund’s prospectus |
| | • | | Rights of Accumulation (ROA) which entitle shareholders to breakpoint discounts will be automatically calculated based on the aggregated holding of fund family assets held by accounts within the purchaser’s household at Merrill Lynch. Eligible fund family assets not held at Merrill Lynch may be included in the ROA calculation only if the shareholder notifies his or her financial advisor about such assets. |
| | • | | Letters of Intent (LOI) which allow for breakpoint discounts based on anticipated purchases within a fund family, through Merrill Lynch, over a 13-month period of time (if applicable) |
Morgan Stanley
Effective on or about July 1, 2018, shareholders purchasing Fund shares through a Morgan Stanley Wealth Management transactional brokerage account will be eligible only for the following Class A load waivers (front-end sales charge waivers), which may differ from and be more limited than those disclosed in the Fund’s prospectus or Statement of Additional Information.
Front-end Sales Load Waivers on Class A Shares Available at Morgan Stanley
| | • | | Employer-sponsored retirement plans (e.g., 401(k) plans, 457 plans, employer-sponsored 403(b) plans, profit sharing and money purchase pension plans and defined benefit plans). For purposes of this provision, employer-sponsored retirement plans do not include SEP IRAs, Simple IRAs, SAR-SEPs or Keogh plans. |
| | • | | Morgan Stanley employee and employee-related accounts according to Morgan Stanley’s account linking rules |
| | • | | Shares purchased through reinvestment of dividends and capital gains distributions when purchasing shares of the same fund |
| | • | | Shares purchased through a Morgan Stanley self-directed brokerage account |
| | | | | | |
| Appendix A (unaudited) | | Wells Fargo Short Duration Government Bond Fund | | | 39 | |
| | • | | Class C (i.e., level-load) shares that are no longer subject to a contingent deferred sales charge and are exchanged to Class A shares of the same fund pursuant to Morgan Stanley Wealth Management’s share class exchange program. |
| | • | | Shares purchased from the proceeds of redemptions within the same fund family, provided (i) the repurchase occurs within 90 days following the redemption, (ii) the redemption and purchase occur in the same account, and (iii) redeemed shares were subject to a front-end or deferred sales charge. This waiver is subject to the Fund’s policy regarding frequent purchases and redemption of Fund shares, as discussed under “Account Information—Frequent Purchases and Redemptions of Fund Shares” in the Fund’s prospectus. |
This page is intentionally left blank.

For more information
More information about Wells Fargo Funds is available free upon request. To obtain literature, please write, visit the Fund’s website, or call:
Wells Fargo Funds
P.O. Box 219967
Kansas City, MO 64121-9967
Website: wellsfargofunds.com
Individual investors: 1-800-222-8222
Retail investment professionals: 1-888-877-9275
Institutional investment professionals: 1-866-765-0778
This report and the financial statements contained herein are submitted for the general information of the shareholders of the Fund. If this report is used for promotional purposes, distribution of the report must be accompanied or preceded by a current prospectus. Before investing, please consider the investment objectives, risks, charges, and expenses of the investment. For a current prospectus and, if available, a summary prospectus, containing this information, call 1-800-222-8222 or visit the Fund’s website at wellsfargofunds.com. Read the prospectus carefully before you invest or send money.
Wells Fargo Asset Management (WFAM) is the trade name for certain investment advisory/management firms owned by Wells Fargo & Company. These firms include but are not limited to Wells Capital Management Incorporated and Wells Fargo Funds Management, LLC. Certain products managed by WFAM entities are distributed by Wells Fargo Funds Distributor, LLC (a broker/dealer and Member FINRA).
This material is for general informational and educational purposes only and is NOT intended to provide investment advice or a recommendation of any kind—including a recommendation for any specific investment, strategy, or plan.
NOT FDIC INSURED ◾ NO BANK GUARANTEE ◾ MAY LOSE VALUE
© 2018 Wells Fargo Funds Management, LLC. All rights reserved.
| | |
 | | 315408 10-18 A220/AR220 08-18 |
Annual Report
August 31, 2018

Wells Fargo Short-Term Bond Fund


Reduce clutter. Save trees.
Sign up for electronic delivery of prospectuses and shareholder reports at wellsfargo.com/advantagedelivery
Contents
The views expressed and any forward-looking statements are as of August 31, 2018, unless otherwise noted, and are those of the Fund managers and/or Wells Fargo Funds Management, LLC. Discussions of individual securities, or the markets generally, or any Wells Fargo Fund are not intended as individual recommendations. Future events or results may vary significantly from those expressed in any forward-looking statements. The views expressed are subject to change at any time in response to changing circumstances in the market. Wells Fargo Funds Management, LLC and the Fund disclaim any obligation to publicly update or revise any views expressed or forward-looking statements.
NOT FDIC INSURED ◾ NO BANK GUARANTEE ◾ MAY LOSE VALUE
| | | | |
| 2 | | Wells Fargo Short-Term Bond Fund | | Letter to shareholders (unaudited) |

Andrew Owen
President
Wells Fargo Funds
After advancing during 2017, economic growth and stock markets globally diverged during the first eight months of 2018.
Dear Shareholder:
We are pleased to offer you this annual report for the Wells Fargo Short-Term Bond Fund for the 12-month period that ended August 31, 2018. After advancing during 2017, economic growth and stock markets globally diverged during the first eight months of 2018. For fixed-income investors, taxable bond returns suffered and high-yield and municipal bond returns were positive.
For the period, U.S. stocks, as measured by the S&P 500 Index,1 gained 19.66%, and international stocks, as measured by the MSCI ACWI ex USA Index (Net),2 added 3.18%. Based on the MSCI EM Index (Net),3 emerging market stocks lost 0.68%. For bond investors, the Bloomberg Barclays U.S. Aggregate Bond Index4 declined 1.05% while the Bloomberg Barclays Global Aggregate ex-USD Index5 fell 1.64%. The Bloomberg Barclays Municipal Bond Index6 added 0.49%, and the ICE BofAML U.S. High Yield Index7 was up 3.26%.
Continued optimism in the U.S. characterized the fourth quarter of 2017.
Some observers described economic conditions in late 2017 as a Goldilocks scenario: synchronized global growth, low inflation, healthy corporate earnings, and a weaker U.S. dollar that supported international growth. During the quarter, the U.S. Bureau of Economic Analysis reported that annualized U.S. gross domestic product (GDP) growth for the third quarter of 2017 was 2.8% and inflation remained below U.S. Federal Reserve (Fed) targets. U.S. corporate earnings and consumer confidence improved.
Economic momentum increased in Europe. The Bank of England (BOE) raised interest rates in November 2017 to 0.50%, the first increase in more than 10 years, indicating confidence in the economy’s growth potential. Meanwhile, the European Central Bank and the Bank of Japan kept interest rates low to spur business activities and bought bonds in an effort to encourage equity investments. The People’s Bank of China’s (PBOC’s) policies sought to stimulate business. Many emerging market economies benefited from stronger currencies versus the U.S. dollar, while commodity price increases benefited countries that rely on natural resources for exports.
| 1 | The S&P 500 Index consists of 500 stocks chosen for market size, liquidity, and industry group representation. It is a market-value-weighted index with each stock’s weight in the index proportionate to its market value. You cannot invest directly in an index. |
| 2 | The Morgan Stanley Capital International (MSCI) All Country World Index (ACWI) ex USA Index (Net) is a free-float-adjusted market-capitalization-weighted index that is designed to measure the equity market performance of developed markets, excluding the United States and Canada. Source: MSCI. MSCI makes no express or implied warranties or representations and shall have no liability whatsoever with respect to any MSCI data contained herein. The MSCI data may not be further redistributed or used as a basis for other indices or any securities or financial products. This report is not approved, reviewed, or produced by MSCI. You cannot invest directly in an index. |
| 3 | The MSCI Emerging Markets (EM) Index (Net) is a free-float-adjusted market-capitalization-weighted index that is designed to measure large- and mid-cap equity market performance of emerging markets. The MSCI EM Index (Net) consists of the following 24 emerging market country indices: Brazil, Chile, China, Colombia, Czech Republic, Egypt, Greece, Hungary, India, Indonesia, Korea, Malaysia, Mexico, Pakistan, Peru, the Philippines, Poland, Qatar, Russia, South Africa, Taiwan, Thailand, Turkey, and the United Arab Emirates. You cannot invest directly in an index. |
| 4 | The Bloomberg Barclays U.S. Aggregate Bond Index is a broad-based benchmark that measures the investment-grade, U.S. dollar-denominated, fixed-rate taxable bond market, including Treasuries, government-related and corporate securities, mortgage-backed securities (agency fixed-rate and hybrid adjustable-rate mortgage pass-throughs), asset-backed securities, and commercial mortgage-backed securities. You cannot invest directly in an index. |
| 5 | The Bloomberg Barclays Global Aggregate ex-USD Index is an unmanaged index that provides a broad-based measure of the global investment-grade fixed-income markets excluding the U.S. dollar-denominated debt market. You cannot invest directly in an index. |
| 6 | The Bloomberg Barclays Municipal Bond Index is an unmanaged index composed of long-term tax-exempt bonds with a minimum credit rating of Baa. You cannot invest directly in an index. |
| 7 | The ICE BofAML U.S. High Yield Index is a market-capitalization-weighted index of domestic and Yankee high-yield bonds. The index tracks the performance of high-yield securities traded in the U.S. bond market. You cannot invest directly in an index. Copyright 2018. ICE Data Indices, LLC. All rights reserved. |
| | | | | | |
| Letter to shareholders (unaudited) | | Wells Fargo Short-Term Bond Fund | | | 3 | |
Volatility reemerged during the first quarter of 2018 as global tensions and inflation fears increased.
Stock market gains in January 2018 followed the passage of lower U.S. tax rates. Some investors then grew concerned about trade, particularly between the U.S. and China, and the specter of inflation. The Fed followed its 25-basis-point (bp; 100 bps equal 1.00%) federal funds rate increase in December 2017 with a further 25-bp increase in March 2018. The inflation rate in March reached the Fed’s 2% target for the first time in a year.
The S&P 500 Index closed the first quarter with a negative return, the first negative quarterly return for the index since 2014. Overseas investment markets reversed strong returns in 2017, hurt by a stronger U.S. dollar and mounting trade and diplomatic tensions. After gaining 27.19% for the 12-month period that ended December 31, 2017, the MSCI ACWI ex USA Index (Net) declined 1.81% for the quarter that ended March 31, 2018.
Global trade tensions escalated during the second quarter.
Global trade tensions escalated throughout the second quarter of 2018. The U.S. government imposed tariffs, and foreign governments in North America, Europe, and Asia retaliated. The escalating tensions chilled investment activity as observers awaited signals of next steps.
Meanwhile, inflation continued an upward trend. The CPI-U8 added 0.1% in June after increases of 0.2% in both April and May. On a year-over-year basis, the all-items index rose 2.9% for the 12 months that ended June 30, 2018. The index for all items less food and energy rose 2.3% for the same 12-month period.
U.S. stocks gained while international stocks and bonds declined during the summer of 2018.
The U.S. economy strengthened during the summer months. Revised second-quarter GDP data released in August showed the U.S. economy growing at a 4.2% rate. After ticking up slightly in June, the unemployment rate in the U.S. was 3.9% in July and August, according to the U.S. Department of Labor. Wages showed more consistent growth than they had in recent quarters, and consumer confidence remained strong.
Several U.S. equity market indices reached records during August, with the S&P 500 Index gaining 7.76% for the three-month period that ended August 31, 2018. International stock values continued to suffer under the effects of a strong U.S. dollar and continuing trade tensions. The MSCI ACWI ex USA Index (Net) and the MSCI EM Index (Net) were down 4.70% and 1.64%, respectively, during the same three-month period.
The Fed increased the federal funds rate in June, and expectations grew that two more rate increases were in the offing in 2018. Long-term interest rates in the U.S. remained at higher levels relative to the prior 10 years. Rates on 10-year and 30-year Treasury bonds—2.46% and 2.81%, respectively, on January 1, 2018—were 2.86% and 3.02%, respectively, on August 31, off their peak levels on May 17, 2018, of 3.11% and 3.25%, respectively. Some investors became more aware of and concerned about the potential for an inverted yield curve—sometimes a recession signal—as short-term rates increased more quickly than long-term rates. The Fed decided to forgo an interest rate increase at its August meeting.
The S&P 500 Index closed the first quarter with a negative return, the first negative quarterly return for the index since 2014.
| 8 | The Consumer Price Index for All Urban Consumers (CPI-U) measures the changes in the price of a basket of goods and services purchased by urban consumers. The urban consumer population is deemed by many as a better representative measure of the general public because close to 90% of the country’s population lives in highly populated areas. You cannot invest directly in an index. |
| | | | |
| 4 | | Wells Fargo Short-Term Bond Fund | | Letter to shareholders (unaudited) |
Internationally, members of Prime Minister Theresa May’s U.K./Brexit negotiating team resigned amid unproductive negotiations. In early August, the BOE’s Monetary Policy Committee increased its key interest rate to 0.75%. Central banks in Europe and Japan maintained low interest rates and accommodative monetary policies. Amid rising trade uncertainty, the PBOC cut reserve requirement ratios and accelerated infrastructure spending and tax cuts for business enterprises and individuals. Nevertheless, a strengthening U.S. dollar and the trade tensions remained headwinds for investors overseas.
Don’t let short-term uncertainty derail long-term investment goals.
Periods of investment uncertainty can present challenges, but experience has taught us that maintaining long-term investment goals can be an effective way to plan for the future. To help you create a sound strategy based on your personal goals and risk tolerance, Wells Fargo Funds offers more than 100 mutual funds spanning a wide range of asset classes and investment styles. Although diversification cannot guarantee an investment profit or prevent losses, we believe it can be an effective way to manage investment risk and potentially smooth out overall portfolio performance. We encourage investors to know their investments and to understand that appropriate levels of risk-taking may unlock opportunities.
Thank you for choosing to invest with Wells Fargo Funds. We appreciate your confidence in us and remain committed to helping you meet your financial needs.
Sincerely,

Andrew Owen
President
Wells Fargo Funds
Notice to shareholders
| | ∎ | | At a meeting held on May 22-23, 2018, the Board of Trustees of the Fund approved changes to the Fund’s Class A sales charge schedule, effective August 1, 2018. In connection with this change, the net asset value (NAV) breakpoint was lowered from $500,000 to $250,000 and NAV purchases of $250,000 or more redeemed within 12 months of purchase are assessed a contingent deferred sales charge (CDSC) of 0.40%. There is no change for purchase amounts below this breakpoint. Beginning August 1, 2018, any purchases made by a shareholder with an active Letter of Intent (LOI) are subject to the terms of the new load schedule. | |
| | ∎ | | At a meeting held on August 14-15, 2018, the Board of Trustees of the Fund approved the following policy which will be effective on or about February 5, 2019: | |
Class C shares will convert automatically into Class A shares ten years after the initial date of purchase or, if you acquired your Class C shares through an exchange or conversion from another share class, ten years after the date you acquired your Class C shares. When Class C shares that you acquired through a purchase or exchange convert, any other Class C shares that you purchased with reinvested dividends and distributions also will convert into Class A shares on a pro rata basis. A shorter holding period may also apply depending on your intermediary. Please see “Appendix A—Sales Charge Reductions and Waivers for Certain Intermediaries” in the Fund’s prospectus or at the end of this report.
For further information about your Fund, contact your investment professional, visit our website at wellsfargofunds.com, or call us directly at 1-800-222-8222.
This page is intentionally left blank.
| | | | |
| 6 | | Wells Fargo Short-Term Bond Fund | | Performance highlights (unaudited) |
Investment objective
The Fund seeks current income consistent with capital preservation.
Manager
Wells Fargo Funds Management, LLC
Subadviser
Wells Capital Management Incorporated
Portfolio managers
Christopher Y. Kauffman, CFA®
Jay N. Mueller, CFA®
Noah M. Wise, CFA®
Average annual total returns (%) as of August 31, 20181
| | | | | | | | | | | | | | | | | | | | | | | | | | | | | | | | | | |
| | | | | Including sales charge | | | Excluding sales charge | | | Expense ratios2 (%) | |
| | | Inception date | | 1 year | | | 5 year | | | 10 year | | | 1 year | | | 5 year | | | 10 year | | | Gross | | | Net3 | |
| Class A (SSTVX) | | 8-31-1999 | | | (1.69 | ) | | | 0.73 | | | | 2.07 | | | | 0.31 | | | | 1.14 | | | | 2.28 | | | | 0.82 | | | | 0.73 | |
| Class C (WFSHX) | | 3-31-2008 | | | (1.44 | ) | | | 0.39 | | | | 1.50 | | | | (0.44 | ) | | | 0.39 | | | | 1.50 | | | | 1.57 | | | | 1.48 | |
| Class R6 (SSTYX) | | 7-31-2018 | | | – | | | | – | | | | – | | | | 0.58 | | | | 1.43 | | | | 2.58 | | | | 0.82 | | | | 0.40 | |
| Institutional Class (SSHIX) | | 8-31-1999 | | | – | | | | – | | | | – | | | | 0.46 | | | | 1.41 | | | | 2.56 | | | | 0.49 | | | | 0.46 | |
| Bloomberg Barclays U.S. 1-3 Year Government/Credit Bond Index4 | | – | | | – | | | | – | | | | – | | | | 0.15 | | | | 0.90 | | | | 1.62 | | | | – | | | | – | |
Figures quoted represent past performance, which is no guarantee of future results, and do not reflect taxes that a shareholder may pay on fund distributions or the redemption of fund shares. Investment return and principal value of an investment will fluctuate so that an investor’s shares, when redeemed, may be worth more or less than their original cost. Performance shown without sales charges would be lower if sales charges were reflected. Current performance may be lower or higher than the performance data quoted, which assumes the reinvestment of dividends and capital gains. Current month-end performance is available on the Fund’s website, wellsfargofunds.com.
Index returns do not include transaction costs associated with buying and selling securities, any mutual fund fees or expenses, or any taxes. It is not possible to invest directly in an index.
For Class A shares, the maximum front-end sales charge is 2.00%. For Class C shares, the maximum contingent deferred sales charge is 1.00%. Performance including a contingent deferred sales charge assumes the sales charge for the corresponding time period. Class R6 and Institutional Class shares are sold without a front-end sales charge or contingent deferred sales charge.
Bond values fluctuate in response to the financial condition of individual issuers, general market and economic conditions, and changes in interest rates. Changes in market conditions and government policies may lead to periods of heightened volatility in the bond market and reduced liquidity for certain bonds held by the Fund. In general, when interest rates rise, bond values fall and investors may lose principal value. Interest rate changes and their impact on the Fund and its share price can be sudden and unpredictable. Loans are subject to risks similar to those associated with other below-investment-grade bond investments, such as credit risk (for example, risk of issuer default), below-investment-grade bond risk (for example, risk of greater volatility in value), and risk that the loan may become illiquid or difficult to price. The use of derivatives may reduce returns and/or increase volatility. Certain investment strategies tend to increase the total risk of an investment (relative to the broader market). Foreign investments are especially volatile and can rise or fall dramatically due to differences in the political and economic conditions of the host country. These risks are generally intensified in emerging markets. The Fund is exposed to high-yield securities risk and mortgage- and asset-backed securities risk. Consult the Fund’s prospectus for additional information on these and other risks.
Please see footnotes on page 7.
| | | | | | |
| Performance highlights (unaudited) | | Wells Fargo Short-Term Bond Fund | | | 7 | |
|
| Growth of $10,000 investment as of August 31, 20185 |
|
 |
| 1 | Historical performance shown for Class R6 shares prior to their inception reflects the performance of Institutional Class shares and includes the higher expenses applicable to Institutional Class shares. If these expenses had not been included, returns for Class R6 shares would be higher. |
| 2 | Reflects the expense ratios as stated in the most recent prospectuses, which include the impact of 0.01% in acquired fund fees and expenses. The expense ratios shown are subject to change and may differ from the annualized expense ratios shown in the financial highlights of this report, which do not include acquired fund fees and expenses. |
| 3 | The manager has contractually committed through December 31, 2018 (December 31, 2019 for Class C), to waive fees and/or reimburse expenses to the extent necessary to cap the Fund’s Total Annual Fund Operating Expenses After Fee Waivers at 0.72% for Class A, 1.47% for Class C, 0.40% for Class R6, and 0.45% for Institutional Class. After this time, the cap may be increased or the commitment to maintain the cap may be terminated only with the approval of the Board of Trustees. Brokerage commissions, stamp duty fees, interest, taxes, acquired fund fees and expenses (if any), and extraordinary expenses are excluded from the expense cap. Without this cap, the Fund’s returns would have been lower. The expense ratio paid by an investor is the net expense ratio (the total annual fund operating expenses after fee waivers) as stated in the prospectuses. |
| 4 | The Bloomberg Barclays U.S. 1-3 Year Government/Credit Bond Index is the one- to three-year component of the Bloomberg Barclays U.S. Government/Credit Bond Index that includes securities in the Government and Credit Indices. The Government Index includes Treasuries (that is, public obligations of the U.S. Treasury that have remaining maturities of more than one year) and agencies (that is, publicly issued debt of U.S. government agencies, quasi-federal corporations, and corporate or foreign debt guaranteed by the U.S. government). The Credit Index includes publicly issued U.S. corporate and foreign debentures and secured notes that meet specified maturity, liquidity, and quality requirements. You cannot invest directly in an index. |
| 5 | The chart compares the performance of Class A shares for the most recent ten years with the performance of the Bloomberg Barclays U.S. 1-3 Year Government/Credit Bond Index. The chart assumes a hypothetical investment of $10,000 in Class A shares and reflects all operating expenses and assumes the maximum initial sales charge of 2.00%. |
| 6 | The ten largest holdings, excluding cash, cash equivalents and any money market funds, are calculated based on the value of the investments divided by total net assets of the Fund. Holdings are subject to change and may have changed since the date specified. |
| 7 | The Consumer Price Index (CPI) is a measure of the average change over time in the prices paid by urban consumers for a market basket of consumer goods and services. You cannot invest directly in an index. |
| 8 | Amounts are calculated based on the total long-term investments of the Fund. These amounts are subject to change and may have changed since the date specified. |
| | | | |
| 8 | | Wells Fargo Short-Term Bond Fund | | Performance highlights (unaudited) |
MANAGER’S DISCUSSION
Fund highlights
| ∎ | | The Fund (Class A, excluding sales charges) outperformed its benchmark, the Bloomberg Barclays U.S. 1–3 Year Government/Credit Bond Index, for the 12-month period that ended August 31, 2018. |
| ∎ | | The Fund’s performance was driven by overweights to corporate debt and structured products, both of which generated superior returns compared with similar-duration Treasuries. |
| ∎ | | Cash holdings for liquidity purposes detracted from performance. |
| | | | |
| Ten largest holdings (%) as of August 31, 20186 | |
Jackson National Life Insurance Company, 2.50%, 6-27-2022 | | | 1.15 | |
EMC Corporation, 2.65%, 6-1-2020 | | | 1.01 | |
GM Financial Securitized Term Auto Receivables Trust Series 2018-1 Class A2A, 2.08%, 1-19-2021 | | | 0.94 | |
New Jersey EDA Series B, 0.00%, 2-15-2019 | | | 0.82 | |
Toronto Dominion Bank, 1.45%, 9-6-2018 | | | 0.81 | |
Michigan State University Board of Trustees Series B, 2.40%, 9-10-2018 | | | 0.76 | |
GS Mortgage Securities Trust Series 2010-C1 Class A2, 4.59%, 8-10-2043 | | | 0.76 | |
Illinois Series 2014, 5%, 5-1-2019 | | | 0.74 | |
Verizon Communications Incorporated, 4.60%, 4-1-2021 | | | 0.74 | |
HSBC Bank USA NA, 4.88%, 8-24-2020 | | | 0.74 | |
Economic growth accelerated and policy normalization continued.
Over the past four quarters, U.S. gross domestic product (GDP) grew by 2.9% in real terms, which was above the post-financial-crisis average. Business investment was a significant source of strength, rising 4.8% for the 12 months that ended June 30, 2018. Consumer spending was a net contributor to growth, although it failed to keep pace with the business sector. Inventories were a net detractor from GDP growth, while trade and government spending were modestly positive factors
The labor market generally was healthy over the past 12 months. Nonfarm payrolls expanded by an average of 194,000 jobs per month over the period, while the unemployment rate declined to 3.9% at the end of August 2018 from 4.4% a year earlier. Also encouraging was a 0.2% rise in the employment/population ratio since August 2017, reflecting both the fall in unemployment
and a modest increase in the labor force participation rate. Wage gains of about 2.9% over the past 12 months were sufficient to support consumption growth without sparking fears of rising inflation. The CPI7 also rose 2.9% over the past year, which accelerated due in part to higher energy prices.
The U.S. Federal Reserve’s (Fed’s) rate-setting committee, the Federal Open Market Committee (FOMC), raised the federal funds rate three times over the past 12 months by a total of 0.75%. The FOMC’s gradual approach to hiking rates is supported by Fed Chairman Jerome Powell’s stated view that there is no sense that inflation will take off or move unexpectedly quickly.
In line with the FOMC’s policy moves, interest rates had an upward bias over the past 12 months, particularly in shorter-term maturity instruments. Yields on 2-year Treasuries rose by 130 basis points (bps; 100 bps equal 1.00%) during the period, while 10-year Treasuries were about 75 bps higher. Investment-grade credit spreads tightened rapidly into the start of 2018 after the corporate tax cut was enacted in the U.S. but ended the period slightly wider after trade tensions and heavy supply took their toll on bond prices.
Please see footnotes on page 7.
| | | | | | |
| Performance highlights (unaudited) | | Wells Fargo Short-Term Bond Fund | | | 9 | |
|
| Portfolio allocation as of August 31, 20186 |
|
 |
The Fund maintained overweights to corporate credit and securitized debt.
The Fund continued to overweight short-term corporate bonds as well as securitized debt while retaining underweights to U.S. Treasuries and agency debentures. A little over half of the Fund’s assets were invested in corporate debt, which benefited from a positive credit environment. The other primary sector commitment was to securitized debt: mortgage-backed securities, asset-backed securities, and collateralized mortgage obligations. We maintained the Fund’s duration at slightly less than two years during the reporting period with the expectation that short-term rates could rise.
We expect modestly above-trend economic growth to continue.
We expect macroeconomic trends to remain relatively consistent in the coming quarters, aided by fiscal stimulus and looser regulations. Real GDP growth in the area of 3% is likely to persist for a period of time, barring some external shock. The biggest risks to the outlook include an escalation in trade tensions and a larger-than-expected slowdown in the Chinese economy.
Please see footnotes on page 7.
| | | | |
| 10 | | Wells Fargo Short-Term Bond Fund | | Fund expenses (unaudited) |
As a shareholder of the Fund, you incur two types of costs: (1) transaction costs, including sales charges (loads) on purchase payments and contingent deferred sales charges (if any) on redemptions and (2) ongoing costs, including management fees, distribution (12b-1) and/or shareholder servicing fees, and other Fund expenses. This example is intended to help you understand your ongoing costs (in dollars) of investing in the Fund and to compare these costs with the ongoing costs of investing in other mutual funds.
The example is based on an investment of $1,000 invested at the beginning of the six-month period and held for the entire period from March 1, 2018 to August 31, 2018.
Actual expenses
The “Actual” line of the table below provides information about actual account values and actual expenses. You may use the information in this line, together with the amount you invested, to estimate the expenses that you paid over the period. Simply divide your account value by $1,000 (for example, an $8,600 account value divided by $1,000 = 8.6), then multiply the result by the number in the “Actual” line under the heading entitled “Expenses paid during period” for your applicable class of shares to estimate the expenses you paid on your account during this period.
Hypothetical example for comparison purposes
The “Hypothetical” line of the table below provides information about hypothetical account values and hypothetical expenses based on the Fund’s actual expense ratio and an assumed rate of return of 5% per year before expenses, which is not the Fund’s actual return. The hypothetical account values and expenses may not be used to estimate the actual ending account balance or expenses you paid for the period. You may use this information to compare the ongoing costs of investing in the Fund and other funds. To do so, compare this 5% hypothetical example with the 5% hypothetical examples that appear in the shareholder reports of the other funds.
Please note that the expenses shown in the table are meant to highlight your ongoing costs only and do not reflect any transactional costs, such as sales charges (loads) and contingent deferred sales charges. Therefore, the “Hypothetical” line
of the table is useful in comparing ongoing costs only and will not help you determine the relative total costs of owning different funds. In addition, if these transactional costs were included, your costs would have been higher.
| | | | | | | | | | | | | | | | |
| | | Beginning
account value
3-1-2018 | | | Ending
account value
8-31-2018 | | | Expenses
paid during
the period¹ | | | Annualized net
expense ratio | |
Class A | | | | | | | | | | | | | | | | |
Actual | | $ | 1,000.00 | | | $ | 1,008.25 | | | $ | 3.64 | | | | 0.72 | % |
Hypothetical (5% return before expenses) | | $ | 1,000.00 | | | $ | 1,021.58 | | | $ | 3.67 | | | | 0.72 | % |
Class C | | | | | | | | | | | | | | | | |
Actual | | $ | 1,000.00 | | | $ | 1,004.45 | | | $ | 7.43 | | | | 1.47 | % |
Hypothetical (5% return before expenses) | | $ | 1,000.00 | | | $ | 1,017.80 | | | $ | 7.48 | | | | 1.47 | % |
Class R6 | | | | | | | | | | | | | | | | |
Actual | | $ | 1,000.00 | | | $ | 1,009.67 | | | $ | 2.03 | | | | 0.40 | % |
Hypothetical (5% return before expenses) | | $ | 1,000.00 | | | $ | 1,023.19 | | | $ | 2.04 | | | | 0.40 | % |
Institutional Class | | | | | | | | | | | | | | | | |
Actual | | $ | 1,000.00 | | | $ | 1,008.46 | | | $ | 2.28 | | | | 0.45 | % |
Hypothetical (5% return before expenses) | | $ | 1,000.00 | | | $ | 1,022.94 | | | $ | 2.29 | | | | 0.45 | % |
| 1 | Expenses paid is equal to the annualized net expense ratio of each class multiplied by the average account value over the period, multiplied by the number of days in the most recent fiscal half-year divided by the number of days in the fiscal year (to reflect the one-half-year period). |
| | | | | | |
| Portfolio of investments—August 31, 2018 | | Wells Fargo Short-Term Bond Fund | | | 11 | |
| | | | | | | | | | | | | | | | |
| Security name | | Interest rate | | | Maturity date | | | Principal | | | Value | |
|
Agency Securities: 6.24% | |
FDIC Series 2010-R1 Class A 144A | | | 2.18 | % | | | 5-25-2050 | | | $ | 614,855 | | | $ | 615,304 | |
FDIC Series 2013-R1 Class A 144A | | | 1.15 | | | | 3-25-2033 | | | | 502,295 | | | | 494,682 | |
FHLMC (3 Year Treasury Constant Maturity +2.23%) ± | | | 3.46 | | | | 5-1-2026 | | | | 32,147 | | | | 31,987 | |
FHLMC | | | 3.50 | | | | 10-15-2025 | | | | 529,047 | | | | 538,305 | |
FHLMC | | | 3.50 | | | | 6-15-2038 | | | | 288,359 | | | | 288,992 | |
FHLMC (12 Month LIBOR +1.91%) ± | | | 3.66 | | | | 9-1-2031 | | | | 2,541 | | | | 2,568 | |
FHLMC (1 Year Treasury Constant Maturity +2.25%) ± | | | 3.68 | | | | 4-1-2038 | | | | 271,802 | | | | 286,351 | |
FHLMC | | | 4.00 | | | | 5-1-2025 | | | | 1,001,683 | | | | 1,027,234 | |
FHLMC (1 Year Treasury Constant Maturity +2.25%) ± | | | 4.12 | | | | 4-1-2032 | | | | 39,145 | | | | 40,877 | |
FHLMC (1 Year Treasury Constant Maturity +2.40%) ± | | | 4.37 | | | | 7-1-2029 | | | | 2,313 | | | | 2,384 | |
FHLMC | | | 6.00 | | | | 10-1-2021 | | | | 137,786 | | | | 141,710 | |
FHLMC | | | 9.00 | | | | 6-1-2019 | | | | 2,872 | | | | 2,875 | |
FHLMC | | | 9.00 | | | | 10-1-2019 | | | | 18,720 | | | | 18,808 | |
FHLMC | | | 9.50 | | | | 12-1-2022 | | | | 7,237 | | | | 7,298 | |
FHLMC | | | 10.50 | | | | 2-1-2019 | | | | 68 | | | | 68 | |
FHLMC | | | 10.50 | | | | 4-1-2019 | | | | 72 | | | | 72 | |
FHLMC | | | 10.50 | | | | 5-1-2019 | | | | 47 | | | | 47 | |
FHLMC | | | 10.50 | | | | 6-1-2019 | | | | 277 | | | | 278 | |
FHLMC | | | 10.50 | | | | 7-1-2019 | | | | 144 | | | | 145 | |
FHLMC Series 2597 Series AE | | | 5.50 | | | | 4-15-2033 | | | | 72,889 | | | | 76,639 | |
FHLMC Series 2642 Class AR | | | 4.50 | | | | 7-15-2023 | | | | 247,402 | | | | 254,498 | |
FHLMC Series 3266 Class D | | | 5.00 | | | | 1-15-2022 | | | | 32,016 | | | | 32,040 | |
FHLMC Series 3609 Class LA | | | 4.00 | | | | 12-15-2024 | | | | 34,395 | | | | 34,474 | |
FHLMC Series 3855 Class HL | | | 3.50 | | | | 2-15-2026 | | | | 87,485 | | | | 87,714 | |
FHLMC Series 3920 Class AB | | | 3.00 | | | | 9-15-2025 | | | | 347,438 | | | | 348,439 | |
FHLMC Series KI01 Class A (1 Month LIBOR +0.16%) ± | | | 2.24 | | | | 9-25-2022 | | | | 226,091 | | | | 226,121 | |
FHLMC Series KP04 Class AG1 (1 Month LIBOR +0.22%) ± | | | 2.30 | | | | 7-25-2020 | | | | 1,485,000 | | | | 1,485,818 | |
FHLMC Series QO04 Class AFL (12 Month Treasury Average +0.74%) ± | | | 2.49 | | | | 10-25-2021 | | | | 1,294,821 | | | | 1,296,046 | |
FHLMC Series T-42 Class A6 | | | 9.50 | | | | 2-25-2042 | | | | 329,621 | | | | 392,493 | |
FHLMC Series T-57 Class 2A1 ±± | | | 3.92 | | | | 7-25-2043 | | | | 81,405 | | | | 85,489 | |
FHLMC Series T-59 Class 2A1 ±± | | | 3.75 | | | | 10-25-2043 | | | | 933,725 | | | | 905,095 | |
FNMA (1 Year Treasury Constant Maturity +1.27%) ± | | | 2.69 | | | | 8-1-2034 | | | | 273,373 | | | | 276,658 | |
FNMA | | | 3.02 | | | | 11-1-2020 | | | | 253,864 | | | | 253,653 | |
FNMA (1 Year Treasury Constant Maturity +2.19%) ± | | | 3.43 | | | | 11-1-2031 | | | | 42,884 | | | | 44,915 | |
FNMA (1 Year Treasury Constant Maturity +2.26%) ± | | | 3.86 | | | | 8-1-2036 | | | | 1,361,152 | | | | 1,433,993 | |
FNMA (12 Month Treasury Average +2.29%) ± | | | 3.95 | | | | 10-1-2036 | | | | 1,002,924 | | | | 1,041,360 | |
FNMA | | | 4.00 | | | | 6-25-2026 | | | | 545,196 | | | | 568,823 | |
FNMA | | | 4.00 | | | | 9-1-2026 | | | | 1,520,445 | | | | 1,556,684 | |
FNMA | | | 4.00 | | | | 8-25-2037 | | | | 406,365 | | | | 410,972 | |
FNMA (12 Month Treasury Average +2.40%) ± | | | 4.03 | | | | 7-1-2036 | | | | 1,031,486 | | | | 1,077,109 | |
FNMA (12 Month LIBOR +1.82%) ± | | | 4.04 | | | | 9-1-2040 | | | | 877,873 | | | | 921,462 | |
FNMA | | | 5.50 | | | | 3-1-2023 | | | | 487,115 | | | | 505,308 | |
FNMA | | | 5.50 | | | | 8-25-2034 | | | | 153,533 | | | | 153,459 | |
FNMA | | | 6.00 | | | | 4-1-2021 | | | | 60,803 | | | | 62,086 | |
FNMA | | | 6.00 | | | | 3-1-2033 | | | | 494,988 | | | | 539,774 | |
FNMA | | | 6.28 | | | | 11-1-2018 | | | | 21,199 | | | | 21,159 | |
FNMA | | | 6.50 | | | | 8-1-2031 | | | | 206,600 | | | | 227,859 | |
FNMA | | | 8.00 | | | | 9-1-2023 | | | | 1,055 | | | | 1,060 | |
FNMA | | | 8.33 | | | | 7-15-2020 | | | | 2,861 | | | | 2,914 | |
FNMA | | | 9.00 | | | | 2-15-2020 | | | | 172 | | | | 176 | |
The accompanying notes are an integral part of these financial statements.
| | | | |
| 12 | | Wells Fargo Short-Term Bond Fund | | Portfolio of investments—August 31, 2018 |
| | | | | | | | | | | | | | | | |
| Security name | | Interest rate | | | Maturity date | | | Principal | | | Value | |
|
Agency Securities (continued) | |
FNMA | | | 9.00 | % | | | 11-1-2024 | | | $ | 42,181 | | | $ | 45,010 | |
FNMA | | | 11.00 | | | | 10-15-2020 | | | | 1,814 | | | | 1,838 | |
FNMA Grantor Trust Series 2002-T12 Class A4 | | | 9.50 | | | | 5-25-2042 | | | | 544,197 | | | | 634,525 | |
FNMA Series 1989-29 Class Z | | | 10.00 | | | | 6-25-2019 | | | | 10,430 | | | | 10,638 | |
FNMA Series 1989-63 Class Z | | | 9.40 | | | | 10-25-2019 | | | | 1,839 | | | | 1,879 | |
FNMA Series 2002-T1 Class A4 | | | 9.50 | | | | 11-25-2031 | | | | 36,337 | | | | 41,615 | |
FNMA Series 2003-41 Class PE | | | 5.50 | | | | 5-25-2023 | | | | 309,997 | | | | 318,802 | |
FNMA Series 2003-W11 Class A1 ±± | | | 5.27 | | | | 6-25-2033 | | | | 8,777 | | | | 9,159 | |
FNMA Series 2003-W6 Class 6A ±± | | | 4.06 | | | | 8-25-2042 | | | | 735,745 | | | | 749,828 | |
FNMA Series 2003-W6 Class PT4 ±± | | | 8.22 | | | | 10-25-2042 | | | | 70,741 | | | | 84,993 | |
FNMA Series 2004-32 Class AY | | | 4.00 | | | | 5-25-2019 | | | | 11,059 | | | | 11,075 | |
FNMA Series 2004-90 Class XY | | | 4.00 | | | | 9-25-2034 | | | | 44,175 | | | | 44,153 | |
FNMA Series 2008-53 Class CA | | | 5.00 | | | | 7-25-2023 | | | | 84,051 | | | | 84,575 | |
FNMA Series 2009-M01 Class A2 | | | 4.29 | | | | 7-25-2019 | | | | 853,061 | | | | 855,901 | |
FNMA Series 2010-37 Class A1 | | | 5.41 | | | | 5-25-2035 | | | | 1,924,773 | | | | 1,978,827 | |
FNMA Series 2011-133 Class A | | | 3.50 | | | | 6-25-2029 | | | | 269,524 | | | | 270,726 | |
FNMA Series 2011-17 Class ED | | | 3.50 | | | | 7-25-2025 | | | | 9,423 | | | | 9,411 | |
FNMA Series 2011-39 Class CA | | | 3.00 | | | | 5-25-2024 | | | | 37,254 | | | | 37,175 | |
GNMA | | | 4.50 | | | | 4-20-2035 | | | | 119,472 | | | | 121,988 | |
GNMA | | | 8.00 | | | | 12-15-2023 | | | | 14,677 | | | | 15,751 | |
GNMA | | | 9.00 | | | | 11-15-2024 | | | | 4,958 | | | | 5,153 | |
GNMA Series 2012-19 Class A | | | 1.83 | | | | 3-16-2039 | | | | 767,602 | | | | 761,809 | |
GNMA Series 2017-H13 Class FJ (1 Month LIBOR +0.20%) ± | | | 2.30 | | | | 5-20-2067 | | | | 606,158 | | | | 605,335 | |
GNMA Series 2017-H16 Class FD (1 Month LIBOR +0.20%) ± | | | 2.30 | | | | 8-20-2067 | | | | 965,787 | | | | 964,653 | |
Vendee Mortgage Trust Series 2011-1 Class DA | | | 3.75 | | | | 2-15-2035 | | | | 706,984 | | | | 712,831 | |
| |
Total Agency Securities (Cost $26,169,197) | | | | 26,201,925 | |
| | | | | |
|
Asset-Backed Securities: 11.52% | |
Ascentium Equipment Receivables LLC Series 2017-2A Class A2 144A | | | 2.00 | | | | 5-11-2020 | | | | 1,901,619 | | | | 1,892,194 | |
Avis Budget Rental Car Funding LLC Series 2013-1A Class A 144A | | | 1.92 | | | | 9-20-2019 | | | | 236,667 | | | | 236,569 | |
BMW Vehicle Owner Trust Series 2017-1 Class A2 | | | 1.64 | | | | 7-22-2019 | | | | 525,746 | | | | 525,166 | |
CCG Receivables Trust Series 2015-1 Class A3 144A | | | 1.92 | | | | 1-17-2023 | | | | 2,354,229 | | | | 2,351,497 | |
Chesapeake Funding LLC Series 2017-3A Class A 144A | | | 1.91 | | | | 8-15-2029 | | | | 2,558,951 | | | | 2,529,541 | |
CNH Equipment Trust Series 2015-A Class A3 | | | 1.30 | | | | 4-15-2020 | | | | 65,469 | | | | 65,412 | |
Dell Equipment Finance Trust Series 2017-2 Class A2B (1 Month LIBOR +0.30%) 144A± | | | 2.37 | | | | 2-24-2020 | | | | 923,350 | | | | 923,661 | |
Education Loan Asset-Backed Trust Series 2013-1 Class A1 (1 Month LIBOR +0.80%) 144A± | | | 2.86 | | | | 6-25-2026 | | | | 1,205,401 | | | | 1,210,218 | |
Enterprise Fleet Financing Trust Series 2017-1 Class A2 144A | | | 2.13 | | | | 7-20-2022 | | | | 2,987,853 | | | | 2,972,217 | |
Ford Credit Auto Lease Trust Series 2017-B Class A2A | | | 1.80 | | | | 6-15-2020 | | | | 1,178,722 | | | | 1,175,262 | |
GM Financial Securitized Term Auto Receivables Trust Series 2018-1 Class A2A | | | 2.08 | | | | 1-19-2021 | | | | 3,971,994 | | | | 3,958,831 | |
GMF Floorplan Owner Revolving Trust Series 2016-1 Class A2 (1 Month LIBOR +0.85%) 144A± | | | 2.91 | | | | 5-17-2021 | | | | 1,830,000 | | | | 1,838,165 | |
Home Equity Asset Trust Series 2003-6 Class M1 (1 Month LIBOR +1.05%) ± | | | 3.56 | | | | 2-25-2034 | | | | 969,549 | | | | 949,115 | |
Jimmy John’s Funding LLC Series 2017-1A Class A2I 144A | | | 3.61 | | | | 7-30-2047 | | | | 1,237,500 | | | | 1,225,979 | |
John Deere Owner Trust Series 2016-A Class A3 | | | 1.36 | | | | 4-15-2020 | | | | 778,653 | | | | 775,940 | |
Lendmark Funding Trust Series 2018-1A Class A 144A | | | 3.81 | | | | 12-21-2026 | | | | 1,855,000 | | | | 1,862,221 | |
Navistar Financial Dealer Note Master Trust Series 2017-1 Class A (1 Month LIBOR +0.78%) 144A± | | | 2.84 | | | | 6-27-2022 | | | | 2,000,000 | | | | 2,008,790 | |
Nissan Auto Lease Trust Series 2017-B Class A3 | | | 2.05 | | | | 9-15-2020 | | | | 1,775,000 | | | | 1,760,764 | |
Santander Retail Auto Lease Trust Series 2017-A Class A2A 144A | | | 2.02 | | | | 3-20-2020 | | | | 2,974,288 | | | | 2,963,695 | |
The accompanying notes are an integral part of these financial statements.
| | | | | | |
| Portfolio of investments—August 31, 2018 | | Wells Fargo Short-Term Bond Fund | | | 13 | |
| | | | | | | | | | | | | | | | |
| Security name | | Interest rate | | | Maturity date | | | Principal | | | Value | |
|
Asset-Backed Securities (continued) | |
SLC Student Loan Trust Series 2006-2 Class A5 (3 Month LIBOR +0.10%) ± | | | 2.44 | % | | | 9-15-2026 | | | $ | 1,738,741 | | | $ | 1,736,840 | |
SLM Student Loan Trust Series 2011-1 Class A1 (1 Month LIBOR +0.52%) ± | | | 2.58 | | | | 3-25-2026 | | | | 473,613 | | | | 474,779 | |
SLM Student Loan Trust Series 2011-2 Class A1 (1 Month LIBOR +0.60%) ± | | | 2.66 | | | | 11-25-2027 | | | | 375,412 | | | | 377,086 | |
SLM Student Loan Trust Series 2012-3 Class A (1 Month LIBOR +0.65%) ± | | | 2.71 | | | | 12-27-2038 | | | | 2,149,598 | | | | 2,157,857 | |
Student Loan Consolidation Center Series 2011-1 Class A (1 Month LIBOR +1.22%) 144A± | | | 3.28 | | | | 10-25-2027 | | | | 2,154,997 | | | | 2,178,036 | |
Towd Point Asset Trust Series 2018-SL1 Class A (1 Month LIBOR +0.60%) 144A± | | | 2.66 | | | | 1-25-2046 | | | | 2,804,105 | | | | 2,789,603 | |
Verizon Owner Trust Series 2017-1A Class A 144A | | | 2.06 | | | | 9-20-2021 | | | | 1,800,000 | | | | 1,784,230 | |
Volvo Financial Equipment LLC Series 2016-1A Class A3 144A | | | 1.67 | | | | 2-18-2020 | | | | 703,515 | | | | 701,671 | |
Volvo Financial Equipment LLC Series 2018-AA (1 Month LIBOR +0.52%) 144A± | | | 2.58 | | | | 7-17-2023 | | | | 2,240,000 | | | | 2,246,300 | |
Wheels SPV LLC Series 2018-1A Class A2 144A | | | 3.06 | | | | 4-20-2027 | | | | 1,375,000 | | | | 1,375,727 | |
World Omni Auto Receivables Trust Series 2017-A Class A2 | | | 1.68 | | | | 12-16-2019 | | | | 1,342,545 | | | | 1,338,863 | |
| |
Total Asset-Backed Securities (Cost $48,506,550) | | | | 48,386,229 | |
| | | | | |
|
Corporate Bonds and Notes: 42.94% | |
|
Consumer Discretionary: 4.68% | |
|
| Auto Components: 0.51% | |
ZF North America Capital Incorporated 144A | | | 4.00 | | | | 4-29-2020 | | | | 2,110,000 | | | | 2,128,320 | |
| | | | | | | | | | | | | | | | |
|
| Hotels, Restaurants & Leisure: 0.65% | |
GLP Capital LP | | | 4.88 | | | | 11-1-2020 | | | | 1,340,000 | | | | 1,373,500 | |
MGM Resorts International | | | 5.25 | | | | 3-31-2020 | | | | 1,340,000 | | | | 1,366,800 | |
| | | | |
| | | | | | | | | | | | | | | 2,740,300 | |
| | | | | | | | | | | | | | | | |
|
| Household Durables: 0.11% | |
Lennar Corporation | | | 4.50 | | | | 11-15-2019 | | | | 445,000 | | | | 449,450 | |
| | | | | | | | | | | | | | | | |
|
| Internet & Direct Marketing Retail: 0.18% | |
Amazon.com Incorporated | | | 1.90 | | | | 8-21-2020 | | | | 765,000 | | | | 750,701 | |
| | | | | | | | | | | | | | | | |
|
| Media: 2.64% | |
Charter Communications Operating LLC | | | 3.58 | | | | 7-23-2020 | | | | 3,000,000 | | | | 3,008,729 | |
DIRECTV Holdings LLC | | | 5.88 | | | | 10-1-2019 | | | | 1,680,000 | | | | 1,729,614 | |
Discovery Communications LLC | | | 2.20 | | | | 9-20-2019 | | | | 1,275,000 | | | | 1,264,625 | |
NBCUniversal Enterprise Incorporated 144A | | | 5.25 | | | | 12-31-2049 | | | | 1,655,000 | | | | 1,675,688 | |
TEGNA Incorporated | | | 5.13 | | | | 7-15-2020 | | | | 1,340,000 | | | | 1,351,725 | |
Time Warner Cable Incorporated | | | 4.88 | | | | 3-15-2020 | | | | 2,010,000 | | | | 2,059,575 | |
| | | | |
| | | | | | | | | | | | | | | 11,089,956 | |
| | | | | | | | | | | | | | | | |
|
| Multiline Retail: 0.28% | |
Macy’s Retail Holdings Incorporated | | | 3.45 | | | | 1-15-2021 | | | | 1,205,000 | | | | 1,198,144 | |
| | | | | | | | | | | | | | | | |
|
| Specialty Retail: 0.31% | |
Group 1 Automotive Incorporated | | | 5.00 | | | | 6-1-2022 | | | | 1,300,000 | | | | 1,287,000 | |
| | | | | | | | | | | | | | | | |
|
Consumer Staples: 2.63% | |
|
| Food Products: 1.70% | |
Campbell Soup Company | | | 3.30 | | | | 3-15-2021 | | | | 2,380,000 | | | | 2,367,579 | |
General Mills Incorporated | | | 3.20 | | | | 4-16-2021 | | | | 1,800,000 | | | | 1,796,488 | |
Hershey Company | | | 3.38 | | | | 5-15-2023 | | | | 2,950,000 | | | | 2,966,807 | |
| | | | |
| | | | | | | | | | | | | | | 7,130,874 | |
| | | | | | | | | | | | | | | | |
The accompanying notes are an integral part of these financial statements.
| | | | |
| 14 | | Wells Fargo Short-Term Bond Fund | | Portfolio of investments—August 31, 2018 |
| | | | | | | | | | | | | | | | |
| Security name | | Interest rate | | | Maturity date | | | Principal | | | Value | |
|
| Tobacco: 0.93% | |
British American Tobacco Capital Corporation 144A | | | 2.30 | % | | | 8-14-2020 | | | $ | 1,785,000 | | | $ | 1,752,533 | |
Philip Morris International Incorporated | | | 1.38 | | | | 2-25-2019 | | | | 2,165,000 | | | | 2,152,930 | |
| | | | |
| | | | | | | | | | | | | | | 3,905,463 | |
| | | | | | | | | | | | | | | | |
|
Energy: 0.91% | |
|
| Oil, Gas & Consumable Fuels: 0.91% | |
BP AMI Leasing Incorporated 144A | | | 5.52 | | | | 5-8-2019 | | | | 825,000 | | | | 839,884 | |
Enable Midstream Partner LP | | | 2.40 | | | | 5-15-2019 | | | | 3,000,000 | | | | 2,986,145 | |
| | | | |
| | | | | | | | | | | | | | | 3,826,029 | |
| | | | | | | | | | | | | | | | |
|
Financials: 16.55% | |
|
| Banks: 5.19% | |
Australia & New Zealand Banking Group Limited | | | 2.25 | | | | 11-9-2020 | | | | 2,210,000 | | | | 2,165,806 | |
Bank of America Corporation | | | 2.15 | | | | 11-9-2020 | | | | 2,000,000 | | | | 1,958,994 | |
Citibank NA | | | 3.40 | | | | 7-23-2021 | | | | 2,000,000 | | | | 2,004,115 | |
Citigroup Incorporated | | | 2.50 | | | | 7-29-2019 | | | | 2,235,000 | | | | 2,230,117 | |
Citizens Bank | | | 2.20 | | | | 5-26-2020 | | | | 2,000,000 | | | | 1,963,391 | |
Fifth Third Bank | | | 2.30 | | | | 3-15-2019 | | | | 1,845,000 | | | | 1,842,824 | |
HSBC Bank USA NA | | | 4.88 | | | | 8-24-2020 | | | | 3,000,000 | | | | 3,088,327 | |
JPMorgan Chase (3 Month LIBOR +0.61%) ± | | | 3.51 | | | | 6-18-2022 | | | | 1,000,000 | | | | 1,004,769 | |
JPMorgan Chase | | | 1.65 | | | | 9-23-2019 | | | | 2,000,000 | | | | 1,977,931 | |
Synchrony Bank | | | 3.65 | | | | 5-24-2021 | | | | 1,075,000 | | | | 1,068,139 | |
US Bank NA | | | 2.05 | | | | 10-23-2020 | | | | 2,540,000 | | | | 2,486,837 | |
| | | | |
| | | | | | | | | | | | | | | 21,791,250 | |
| | | | | | | | | | | | | | | | |
|
| Capital Markets: 1.59% | |
Goldman Sachs Group Incorporated | | | 2.30 | | | | 12-13-2019 | | | | 1,000,000 | | | | 992,414 | |
Goldman Sachs Group Incorporated (3 Month LIBOR +0.82%) ± | | | 2.88 | | | | 10-31-2022 | | | | 2,900,000 | | | | 2,835,917 | |
Morgan Stanley | | | 2.20 | | | | 12-7-2018 | | | | 2,000,000 | | | | 1,998,680 | |
Morgan Stanley | | | 2.45 | | | | 2-1-2019 | | | | 840,000 | | | | 839,621 | |
| | | | |
| | | | | | | | | | | | | | | 6,666,632 | |
| | | | | | | | | | | | | | | | |
|
| Consumer Finance: 4.56% | |
Ally Financial Incorporated | | | 3.25 | | | | 11-5-2018 | | | | 2,930,000 | | | | 2,930,000 | |
American Express Company | | | 3.40 | | | | 2-27-2023 | | | | 1,120,000 | | | | 1,110,269 | |
Capital One Financial Corporation | | | 2.50 | | | | 5-12-2020 | | | | 3,000,000 | | | | 2,969,062 | |
Daimler Finance North America LLC 144A | | | 2.20 | | | | 5-5-2020 | | | | 520,000 | | | | 511,223 | |
Daimler Finance North America LLC 144A | | | 3.00 | | | | 2-22-2021 | | | | 2,850,000 | | | | 2,825,088 | |
Ford Motor Credit Company LLC | | | 2.94 | | | | 1-8-2019 | | | | 1,335,000 | | | | 1,334,640 | |
Ford Motor Credit Company LLC (3 Month LIBOR +0.88%) ± | | | 3.22 | | | | 10-12-2021 | | | | 1,160,000 | | | | 1,148,470 | |
General Motors Financial Company Incorporated | | | 3.15 | | | | 1-15-2020 | | | | 3,000,000 | | | | 3,001,440 | |
Nissan Motor Acceptance Corporation 144A | | | 2.00 | | | | 3-8-2019 | | | | 2,000,000 | | | | 1,992,407 | |
Synchrony Financial | | | 2.60 | | | | 1-15-2019 | | | | 1,335,000 | | | | 1,333,730 | |
| | | | |
| | | | | | | | | | | | | | | 19,156,329 | |
| | | | | | | | | | | | | | | | |
|
| Diversified Financial Services: 0.52% | |
WEA Finance LLC 144A | | | 3.25 | | | | 10-5-2020 | | | | 2,205,000 | | | | 2,201,529 | |
| | | | | | | | | | | | | | | | |
The accompanying notes are an integral part of these financial statements.
| | | | | | |
| Portfolio of investments—August 31, 2018 | | Wells Fargo Short-Term Bond Fund | | | 15 | |
| | | | | | | | | | | | | | | | |
| Security name | | Interest rate | | | Maturity date | | | Principal | | | Value | |
|
| Insurance: 4.69% | |
Axis Specialty Finance LLC | | | 5.88 | % | | | 6-1-2020 | | | $ | 1,794,000 | | | $ | 1,867,774 | |
Jackson National Life Global Company 144A | | | 2.50 | | | | 6-27-2022 | | | | 5,000,000 | | | | 4,826,297 | |
Jackson National Life Global Company 144A | | | 3.30 | | | | 6-11-2021 | | | | 2,340,000 | | | | 2,339,297 | |
Metropolitan Life Global Funding Incorporated 144A | | | 1.55 | | | | 9-13-2019 | | | | 1,820,000 | | | | 1,798,360 | |
Metropolitan Life Global Funding Incorporated 144A | | | 1.75 | | | | 12-19-2018 | | | | 2,000,000 | | | | 1,996,380 | |
OneBeacon US Holdings Incorporated | | | 4.60 | | | | 11-9-2022 | | | | 2,075,000 | | | | 2,090,519 | |
Protective Life Global Funding 144A | | | 2.26 | | | | 4-8-2020 | | | | 1,450,000 | | | | 1,431,243 | |
Reliance Standard Life Insurance 144A | | | 2.15 | | | | 10-15-2018 | | | | 1,390,000 | | | | 1,389,558 | |
Reliance Standard Life Insurance 144A | | | 2.38 | | | | 5-4-2020 | | | | 2,000,000 | | | | 1,965,319 | |
| | | | |
| | | | | | | | | | | | | | | 19,704,747 | |
| | | | | | | | | | | | | | | | |
|
Health Care: 3.39% | |
|
| Health Care Providers & Services: 1.50% | |
Anthem Incorporated | | | 2.50 | | | | 11-21-2020 | | | | 1,235,000 | | | | 1,216,486 | |
CVS Health Corporation | | | 3.13 | | | | 3-9-2020 | | | | 2,345,000 | | | | 2,346,044 | |
HCA Incorporated | | | 6.50 | | | | 2-15-2020 | | | | 1,315,000 | | | | 1,364,970 | |
Tenet Healthcare Corporation | | | 6.00 | | | | 10-1-2020 | | | | 1,340,000 | | | | 1,391,925 | |
| | | | |
| | | | | | | | | | | | | | | 6,319,425 | |
| | | | | | | | | | | | | | | | |
|
| Pharmaceuticals: 1.89% | |
Bayer US Finance LLC 144A | | | 3.50 | | | | 6-25-2021 | | | | 1,640,000 | | | | 1,638,323 | |
Eli Lilly and Company | | | 2.35 | | | | 5-15-2022 | | | | 3,000,000 | | | | 2,932,743 | |
EMD Finance LLC 144A | | | 2.40 | | | | 3-19-2020 | | | | 1,925,000 | | | | 1,900,472 | |
Teva Pharmaceutical Finance LLC | | | 2.25 | | | | 3-18-2020 | | | | 1,500,000 | | | | 1,464,566 | |
| | | | |
| | | | | | | | | | | | | | | 7,936,104 | |
| | | | | | | | | | | | | | | | |
|
Industrials: 2.63% | |
|
| Aerospace & Defense: 0.96% | |
Rockwell Collins Incorporated | | | 1.95 | | | | 7-15-2019 | | | | 1,530,000 | | | | 1,517,904 | |
Spirit AeroSystems Incorporated (3 Month LIBOR +0.80%) ± | | | 2.98 | | | | 6-15-2021 | | | | 2,500,000 | | | | 2,506,381 | |
| | | | |
| | | | | | | | | | | | | | | 4,024,285 | |
| | | | | | | | | | | | | | | | |
|
| Airlines: 0.59% | |
Delta Air Lines Incorporated | | | 3.40 | | | | 4-19-2021 | | | | 1,000,000 | | | | 993,713 | |
Delta Air Lines Incorporated | | | 4.75 | | | | 11-7-2021 | | | | 1,454,822 | | | | 1,483,598 | |
| | | | |
| | | | | | | | | | | | | | | 2,477,311 | |
| | | | | | | | | | | | | | | | |
|
| Industrial Conglomerates: 0.70% | |
General Electric Company | | | 2.50 | | | | 3-28-2020 | | | | 3,000,000 | | | | 2,966,769 | |
| | | | | | | | | | | | | | | | |
|
| Professional Services: 0.12% | |
Equifax Incorporated | | | 3.60 | | | | 8-15-2021 | | | | 500,000 | | | | 499,202 | |
| | | | | | | | | | | | | | | | |
| | | | |
| Transportation Infrastructure: 0.26% | | | | | | | | | | | | | | | | |
TTX Company 144A | | | 2.25 | | | | 2-1-2019 | | | | 1,095,000 | | | | 1,092,246 | |
| | | | | | | | | | | | | | | | |
|
Information Technology: 4.52% | |
|
| IT Services: 0.57% | |
IBM Corporation | | | 1.80 | | | | 5-17-2019 | | | | 2,405,000 | | | | 2,392,925 | |
| | | | | | | | | | | | | | | | |
The accompanying notes are an integral part of these financial statements.
| | | | |
| 16 | | Wells Fargo Short-Term Bond Fund | | Portfolio of investments—August 31, 2018 |
| | | | | | | | | | | | | | | | |
| Security name | | Interest rate | | | Maturity date | | | Principal | | | Value | |
|
| Semiconductors & Semiconductor Equipment: 1.29% | |
Broadcom Corporation | | | 2.65 | % | | | 1-15-2023 | | | $ | 3,000,000 | | | $ | 2,838,072 | |
KLA-Tencor Corporation | | | 3.38 | | | | 11-1-2019 | | | | 2,000,000 | | | | 2,008,135 | |
Maxim Integrated Product Incorporated | | | 2.50 | | | | 11-15-2018 | | | | 570,000 | | | | 569,864 | |
| | | | |
| | | | | | | | | | | | | | | 5,416,071 | |
| | | | | | | | | | | | | | | | |
|
| Software: 0.35% | |
Microsoft Corporation | | | 2.40 | | | | 2-6-2022 | | | | 1,500,000 | | | | 1,473,400 | |
| | | | | | | | | | | | | | | | |
|
| Technology Hardware, Storage & Peripherals: 2.31% | |
Apple Incorporated | | | 2.00 | | | | 11-13-2020 | | | | 3,000,000 | | | | 2,948,448 | |
EMC Corporation | | | 2.65 | | | | 6-1-2020 | | | | 4,340,000 | | | | 4,243,863 | |
Hewlett Packard Enterprise Company | | | 3.60 | | | | 10-15-2020 | | | | 2,500,000 | | | | 2,516,925 | |
| | | | |
| | | | | | | | | | | | | | | 9,709,236 | |
| | | | | | | | | | | | | | | | |
|
Materials: 0.59% | |
|
| Paper & Forest Products: 0.59% | |
Georgia Pacific LLC 144A | | | 2.54 | | | | 11-15-2019 | | | | 2,495,000 | | | | 2,480,997 | |
| | | | | | | | | | | | | | | | |
|
Real Estate: 1.58% | |
|
| Equity REITs: 1.09% | |
DDR Corporation | | | 4.63 | | | | 7-15-2022 | | | | 2,355,000 | | | | 2,421,136 | |
Simon Property Group LP | | | 2.20 | | | | 2-1-2019 | | | | 2,165,000 | | | | 2,162,662 | |
| | | | |
| | | | | | | | | | | | | | | 4,583,798 | |
| | | | | | | | | | | | | | | | |
|
| Real Estate Management & Development: 0.49% | |
Washington Prime Group | | | 3.85 | | | | 4-1-2020 | | | | 2,065,000 | | | | 2,045,191 | |
| | | | | | | | | | | | | | | | |
|
Telecommunication Services: 2.29% | |
|
| Diversified Telecommunication Services: 1.95% | |
AT&T Incorporated | | | 2.80 | | | | 2-17-2021 | | | | 1,910,000 | | | | 1,888,152 | |
AT&T Incorporated | | | 5.00 | | | | 3-1-2021 | | | | 1,085,000 | | | | 1,126,370 | |
AT&T Incorporated | | | 5.80 | | | | 2-15-2019 | | | | 783,000 | | | | 793,444 | |
Broadcom International Limited | | | 2.38 | | | | 1-15-2020 | | | | 1,280,000 | | | | 1,266,297 | |
Verizon Communications Incorporated | | | 4.60 | | | | 4-1-2021 | | | | 3,000,000 | | | | 3,103,657 | |
| | | | |
| | | | | | | | | | | | | | | 8,177,920 | |
| | | | | | | | | | | | | | | | |
|
| Wireless Telecommunication Services: 0.34% | |
Sprint Spectrum LP 144A | | | 3.36 | | | | 3-20-2023 | | | | 1,430,000 | | | | 1,422,221 | |
| | | | | | | | | | | | | | | | |
|
Utilities: 3.17% | |
|
| Electric Utilities: 2.52% | |
Duke Energy Corporation | | | 5.05 | | | | 9-15-2019 | | | | 3,000,000 | | | | 3,058,433 | |
Edison International | | | 2.13 | | | | 4-15-2020 | | | | 1,200,000 | | | | 1,176,755 | |
Exelon Corporation | | | 3.50 | | | | 6-1-2022 | | | | 1,895,000 | | | | 1,871,842 | |
Interstate Power & Light Company | | | 5.88 | | | | 9-15-2018 | | | | 580,000 | | | | 580,516 | |
NV Energy Incorporated | | | 6.25 | | | | 11-15-2020 | | | | 2,000,000 | | | | 2,121,077 | |
Oklahoma Gas & Electric Company | | | 6.35 | | | | 9-1-2018 | | | | 1,792,000 | | | | 1,792,000 | |
| | | | |
| | | | | | | | | | | | | | | 10,600,623 | |
| | | | | | | | | | | | | | | | |
The accompanying notes are an integral part of these financial statements.
| | | | | | |
| Portfolio of investments—August 31, 2018 | | Wells Fargo Short-Term Bond Fund | | | 17 | |
| | | | | | | | | | | | | | | | |
| Security name | | Interest rate | | | Maturity date | | | Principal | | | Value | |
|
| Multi-Utilities: 0.65% | |
Black Hills Corporation | | | 2.50 | % | | | 1-11-2019 | | | $ | 1,355,000 | | | $ | 1,353,317 | |
Dominion Resources Incorporated | | | 2.96 | | | | 7-1-2019 | | | | 1,365,000 | | | | 1,366,410 | |
| | | | |
| | | | | | | | | | | | | | | 2,719,727 | |
| | | | | | | | | | | | | | | | |
| |
Total Corporate Bonds and Notes (Cost $181,788,383) | | | | 180,364,175 | |
| | | | | |
|
Municipal Obligations: 5.31% | |
|
California: 0.72% | |
|
| Miscellaneous Revenue: 0.72% | |
Los Angeles CA Municipal Improvement Refunding Bond Convention Center Series A | | | 2.34 | | | | 11-1-2018 | | | | 1,380,000 | | | | 1,379,600 | |
Roman Catholic Diocese of Oakland CA | | | 6.04 | | | | 11-1-2019 | | | | 1,635,000 | | | | 1,663,039 | |
| | | | |
| | | | | | | | | | | | | | | 3,042,639 | |
| | | | | | | | | | | | | | | | |
|
Connecticut: 0.71% | |
|
| GO Revenue: 0.71% | |
Connecticut Series A | | | 2.30 | | | | 1-15-2019 | | | | 3,000,000 | | | | 2,993,400 | |
| | | | | | | | | | | | | | | | |
|
Georgia: 0.25% | |
|
| Health Revenue: 0.25% | |
Medical Center Hospital Authority Taxable Refunding Bond Columbus Regional Healthcare System Incorporated Project | | | 4.88 | | | | 8-1-2022 | | | | 1,000,000 | | | | 1,044,950 | |
| | | | | | | | | | | | | | | | |
|
Illinois: 1.02% | |
|
| Miscellaneous Revenue: 0.74% | |
Illinois Series 2014 | | | 5.00 | | | | 5-1-2019 | | | | 3,070,000 | | | | 3,122,129 | |
| | | | | | | | | | | | | | | | |
|
| Tax Revenue: 0.28% | |
Chicago IL Retiree Health Series B | | | 6.30 | | | | 12-1-2021 | | | | 1,125,000 | | | | 1,180,890 | |
| | | | | | | | | | | | | | | | |
| | | | |
| | | | | | | | | | | | | | | 4,303,019 | |
| | | | | | | | | | | | | | | | |
|
Michigan: 0.48% | |
|
| Water & Sewer Revenue: 0.48% | |
Michigan Finance Authority Series D5 | | | 2.85 | | | | 7-1-2019 | | | | 2,000,000 | | | | 1,999,140 | |
| | | | | | | | | | | | | | | | |
|
New Jersey: 0.82% | |
|
| Miscellaneous Revenue: 0.82% | |
New Jersey EDA Series B (AGM Insured) ¤ | | | 0.00 | | | | 2-15-2019 | | | | 3,500,000 | | | | 3,454,535 | |
| | | | | | | | | | | | | | | | |
|
Oregon: 0.24% | |
|
| GO Revenue: 0.24% | |
Portland OR Taxable Pension (m)(n) | | | 2.38 | | | | 6-1-2019 | | | | 1,000,000 | | | | 1,000,000 | |
| | | | | | | | | | | | | | | | |
|
Pennsylvania: 0.21% | |
|
| Miscellaneous Revenue: 0.21% | |
Philadelphia PA IDA Pension Funding Series B (Ambac Insured) ¤ | | | 0.00 | | | | 4-15-2021 | | | | 970,000 | | | | 881,449 | |
| | | | | | | | | | | | | | | | |
|
Rhode Island: 0.30% | |
|
| Industrial Development Revenue: 0.30% | |
Rhode Island EDA (AGM Insured) | | | 7.75 | | | | 11-1-2020 | | | | 1,200,000 | | | | 1,243,260 | |
| | | | | | | | | | | | | | | | |
The accompanying notes are an integral part of these financial statements.
| | | | |
| 18 | | Wells Fargo Short-Term Bond Fund | | Portfolio of investments—August 31, 2018 |
| | | | | | | | | | | | | | | | |
| Security name | | Interest rate | | | Maturity date | | | Principal | | | Value | |
|
Wisconsin: 0.56% | |
|
| Housing Revenue: 0.56% | |
Wisconsin Healthcare PFA (Citizens Bank LOC) | | | 2.63 | % | | | 11-1-2019 | | | $ | 2,365,000 | | | $ | 2,331,535 | |
| | | | | | | | | | | | | | | | |
| |
Total Municipal Obligations (Cost $22,344,572) | | | | 22,293,927 | |
| | | | | |
|
Non-Agency Mortgage-Backed Securities: 15.56% | |
BDS Limited Series 2018-FL2 Class A (1 Month LIBOR +0.95%) 144A± | | | 3.01 | | | | 8-15-2035 | | | | 1,165,000 | | | | 1,168,292 | |
BlueMountain CLO Limited Series 2014-2A Class AR (3 Month LIBOR +0.93%) 144A± | | | 3.28 | | | | 7-20-2026 | | | | 2,030,000 | | | | 2,029,231 | |
BX Trust 2017 Series A (1 Month LIBOR +1.05%) 144A± | | | 3.11 | | | | 10-15-2032 | | | | 2,640,000 | | | | 2,643,266 | |
CD Commercial Mortgage Trust Series 2017-CD3 Class A1 | | | 1.97 | | | | 2-10-2050 | | | | 1,283,127 | | | | 1,262,396 | |
CGBAM Commercial Mortgage Trust Series 2015-SMRT Class A 144A | | | 2.81 | | | | 4-10-2028 | | | | 1,365,000 | | | | 1,359,386 | |
CGDBB Commercial Mortgage Trust Series 2017-BIOC Class A (1 Month LIBOR +0.79%) 144A± | | | 2.85 | | | | 7-15-2032 | | | | 2,850,000 | | | | 2,849,996 | |
CIFC Funding Limited Series 2012-2RA Class A1 (3 Month LIBOR +0.80%) 144A± | | | 3.15 | | | | 1-20-2028 | | | | 2,440,000 | | | | 2,422,061 | |
Citigroup Commercial Mortgage Trust Series 2016-P5 Class A2 | | | 2.40 | | | | 10-10-2049 | | | | 128,000 | | | | 125,023 | |
Citigroup Commercial Mortgage Trust Series 2017-1500 Class A (1 Month LIBOR +0.85%) 144A± | | | 2.91 | | | | 7-15-2032 | | | | 2,100,000 | | | | 2,100,680 | |
Citigroup Commercial Mortgage Trust Series 2017-MDRB Class A (1 Month LIBOR +1.10%) 144A± | | | 3.16 | | | | 7-15-2030 | | | | 1,605,052 | | | | 1,599,219 | |
Commercial Mortgage Trust Series 2012-CR1 Class ASB | | | 3.05 | | | | 5-15-2045 | | | | 2,232,823 | | | | 2,229,786 | |
Commercial Mortgage Trust Series 2014-LC17 Class A2 | | | 3.16 | | | | 10-10-2047 | | | | 2,300,000 | | | | 2,305,693 | |
Commercial Mortgage Trust Series 2015-CR27 Class A1 | | | 1.58 | | | | 10-10-2048 | | | | 1,646,217 | | | | 1,625,483 | |
ContiMortgage Home Equity Trust Series 1996-2 Class IO ¤ | | | 0.00 | | | | 7-15-2027 | | | | 636,532 | | | | 11,852 | |
Countrywide Home Loans Mortgage Pass-Through Trust Series 2001-HYB1 Class 2A1 ±± | | | 3.21 | | | | 6-19-2031 | | | | 107,177 | | | | 105,443 | |
Crown Point Limited Series 2013-2A Class A1LR (3 Month LIBOR +0.59%) 144A± | | | 2.93 | | | | 12-31-2023 | | | | 62,932 | | | | 62,905 | |
Deutsche Bank UBS Securities Mortgage Trust Series 2011-LC2A Class A4 144A | | | 4.54 | | | | 7-10-2044 | | | | 704,946 | | | | 726,617 | |
EquiFirst Mortgage Loan Trust Series 2003-2 Class 3A3 (1 Month LIBOR +1.13%) ± | | | 3.19 | | | | 9-25-2033 | | | | 281,906 | | | | 277,978 | |
Golden National Mortgage Asset-Backed Certificates Series 1998-GN1 Class M2 †† | | | 1.00 | | | | 2-25-2027 | | | | 34,322 | | | | 34,198 | |
Great Wolf Trust Series 2017-A (1 Month LIBOR +0.85%) 144A± | | | 3.06 | | | | 9-15-2034 | | | | 2,150,000 | | | | 2,150,646 | |
GS Mortgage Securities Trust Series 2010-C1 Class A2 144A | | | 4.59 | | | | 8-10-2043 | | | | 3,110,000 | | | | 3,180,663 | |
GS Mortgage Securities Trust Series 2013-GC16 Class A2 | | | 3.03 | | | | 11-10-2046 | | | | 520,568 | | | | 520,372 | |
GS Mortgage Securities Trust Series 2016-GS3 Class A1 | | | 1.43 | | | | 10-10-2049 | | | | 1,884,008 | | | | 1,844,058 | |
GSMPS Mortgage Loan Trust Series 1998-1 Class A 144A±± | | | 8.00 | | | | 9-19-2027 | | | | 183,140 | | | | 182,046 | |
Hospitality Mortgage Trust Series 2017-HIT Class A (1 Month LIBOR +0.85%) 144A± | | | 2.93 | | | | 5-8-2030 | | | | 750,000 | | | | 750,700 | |
Hyatt Hotel Portfolio Trust Series 2017-HYTE Class A (1 Month LIBOR +0.66%) 144A± | | | 2.72 | | | | 8-9-2032 | | | | 2,986,000 | | | | 2,983,155 | |
JPMorgan Chase Commercial Mortgage Securities Trust Series 2007-CB18 Class AMFL (1 Month LIBOR +0.17%) ± | | | 2.23 | | | | 6-12-2047 | | | | 917,488 | | | | 901,561 | |
JPMorgan Chase Commercial Mortgage Securities Trust Series 2007-LDPX Class AM ±± | | | 5.46 | | | | 1-15-2049 | | | | 492,304 | | | | 493,242 | |
JPMorgan Chase Commercial Mortgage Securities Trust Series 2016-JP3 Class A1 | | | 1.46 | | | | 8-15-2049 | | | | 1,619,908 | | | | 1,584,266 | |
JPMorgan Chase Commercial Mortgage Securities Trust Series 2018-PHH Class A (1 Month LIBOR +0.91%) 144A± | | | 2.97 | | | | 6-15-2035 | | | | 1,085,000 | | | | 1,086,689 | |
KKR Financial Holdings LLC (3 Month LIBOR +1.34%) 144A± | | | 3.68 | | | | 4-15-2029 | | | | 2,250,000 | | | | 2,252,608 | |
LStar Commercial Mortgage Trust Series 2017-5 Class A1 144A | | | 2.42 | | | | 3-10-2050 | | | | 515,799 | | | | 508,020 | |
Master Mortgages Trust Series 2002-3 Class 4A1 ±± | | | 4.31 | | | | 10-25-2032 | | | | 3,841 | | | | 3,839 | |
Morgan Stanley Bank of America Merrill Lynch Trust Series 2014-C15 Class A2 | | | 2.98 | | | | 4-15-2047 | | | | 2,510,187 | | | | 2,509,916 | |
Morgan Stanley Capital I Trust Series 2016-C30 Class A1 | | | 1.39 | | | | 9-15-2049 | | | | 1,477,394 | | | | 1,441,166 | |
Neuberger Berman Limited Series 2015-20A Class AR (3 Month LIBOR +0.80%) 144A± | | | 3.14 | | | | 1-15-2028 | | | | 1,340,000 | | | | 1,337,768 | |
Oaktree CLO Limited Series 15-1A Class A1R (3 Month LIBOR +0.87%) 144A± | | | 3.22 | | | | 10-20-2027 | | | | 1,500,000 | | | | 1,496,804 | |
Octagon Investment Partners Series 2015-1A Class A1R (3 Month LIBOR +0.90%) 144A± | | | 3.21 | | | | 5-21-2027 | | | | 2,000,000 | | | | 1,998,618 | |
The accompanying notes are an integral part of these financial statements.
| | | | | | |
| Portfolio of investments—August 31, 2018 | | Wells Fargo Short-Term Bond Fund | | | 19 | |
| | | | | | | | | | | | | | | | |
| Security name | | Interest rate | | | Maturity date | | | Principal | | | Value | |
|
Non-Agency Mortgage-Backed Securities (continued) | |
Palmer Square Loan Funding Limited Series 2017-1A Class A1 (3 Month LIBOR +0.74%) 144A± | | | 3.08 | % | | | 10-15-2025 | | | $ | 1,804,738 | | | $ | 1,798,031 | |
RAIT Trust Series 2017-FL7 Class A (1 Month LIBOR +0.95%) 144A± | | | 3.01 | | | | 6-15-2037 | | | | 745,865 | | | | 746,229 | |
RAIT Trust Series 2017-FL8 Class A (1 Month LIBOR +0.85%) 144A± | | | 2.91 | | | | 12-15-2037 | | | | 1,329,010 | | | | 1,329,008 | |
ReadyCap Commercial Mortgage Trust Series 2017-FL1 Class A (1 Month LIBOR +0.85%) 144A± | | | 2.91 | | | | 5-25-2034 | | | | 530,988 | | | | 530,988 | |
Regatta IV Funding Limited Series 2014-1A Class A2R (3 Month LIBOR +1.02%) 144A± | | | 3.36 | | | | 7-25-2026 | | | | 1,755,000 | | | | 1,755,156 | |
SBA Tower Trust Series 2014-1A Class C 144A | | | 2.90 | | | | 10-15-2044 | | | | 3,000,000 | | | | 2,978,070 | |
Stonemont Portfolio Trust Series 2017 Class A (1 Month LIBOR +0.85%) 144A± | | | 2.93 | | | | 8-20-2030 | | | | 1,764,530 | | | | 1,764,521 | |
Wilshire Funding Corporation Series 1996-3 Class M2 ±± | | | 7.12 | | | | 8-25-2032 | | | | 81,560 | | | | 79,420 | |
Wilshire Funding Corporation Series 1996-3 Class M3 ±± | | | 7.12 | | | | 8-25-2032 | | | | 86,727 | | | | 82,662 | |
Wilshire Funding Corporation Series 1998-2 Class M1 ±± | | | 2.00 | | | | 12-28-2037 | | | | 11,587 | | | | 11,550 | |
Wind River Collateralized Loan Obligation Limited Trust Series 2014-3A Class AR (3 Month LIBOR +1.10%) 144A± | | | 3.45 | | | | 1-22-2027 | | | | 2,100,000 | | | | 2,100,414 | |
| |
Total Non-Agency Mortgage-Backed Securities (Cost $65,800,451) | | | | 65,341,691 | |
| | | | | |
|
Yankee Corporate Bonds and Notes: 12.46% | |
|
Consumer Discretionary: 0.26% | |
|
| Auto Components: 0.15% | |
IHO Verwaltungs GmbH 144A | | | 4.13 | | | | 9-15-2021 | | | | 650,000 | | | | 646,750 | |
| | | | | | | | | | | | | | | | |
|
| Automobiles: 0.11% | |
Jaguar Land Rover Limited 144A | | | 4.25 | | | | 11-15-2019 | | | | 445,000 | | | | 443,888 | |
| | | | | | | | | | | | | | | | |
|
Consumer Staples: 0.68% | |
|
| Beverages: 0.68% | |
Suntory Holdings Limited 144A | | | 2.55 | | | | 6-28-2022 | | | | 2,975,000 | | | | 2,859,332 | |
| | | | | | | | | | | | | | | | |
|
Financials: 9.81% | |
|
| Banks: 8.86% | |
Banco de Credito del Peru 144A | | | 2.25 | | | | 10-25-2019 | | | | 1,500,000 | | | | 1,477,500 | |
Banco Internacional del Peru SAA Interbank 144A | | | 3.38 | | | | 1-18-2023 | | | | 1,305,000 | | | | 1,254,431 | |
Banque Federative du Credit Mutuel SA 144A | | | 2.20 | | | | 7-20-2020 | | | | 2,530,000 | | | | 2,482,095 | |
BPCE SA | | | 2.50 | | | | 7-15-2019 | | | | 755,000 | | | | 751,538 | |
Commonwealth Bank of Australia 144A | | | 1.75 | | | | 11-7-2019 | | | | 1,750,000 | | | | 1,726,390 | |
Cooperatieve Rabobank U.A. | | | 2.75 | | | | 1-10-2022 | | | | 3,000,000 | | | | 2,936,437 | |
Corporacion Andina de Fomento | | | 2.13 | | | | 9-27-2021 | | | | 3,000,000 | | | | 2,886,900 | |
Credit Suisse Group Funding Limited | | | 3.13 | | | | 12-10-2020 | | | | 2,110,000 | | | | 2,094,895 | |
Danske Bank 144A | | | 1.65 | | | | 9-6-2019 | | | | 3,000,000 | | | | 2,959,773 | |
Macquarie Bank Limited 144A | | | 2.85 | | | | 7-29-2020 | | | | 3,000,000 | | | | 2,972,512 | |
Mitsubishi UFJ Trust and Banking Corporation 144A | | | 2.45 | | | | 10-16-2019 | | | | 3,000,000 | | | | 2,981,356 | |
Nordea Bank Ab 144A | | | 3.75 | | | | 8-30-2023 | | | | 2,000,000 | | | | 1,991,502 | |
Santander UK plc | | | 2.50 | | | | 3-14-2019 | | | | 2,750,000 | | | | 2,749,062 | |
Sumitomo Mitsui Banking Corporation | | | 2.09 | | | | 10-18-2019 | | | | 2,000,000 | | | | 1,975,720 | |
Svenska Handelsbanken AB | | | 1.50 | | | | 9-6-2019 | | | | 2,605,000 | | | | 2,569,718 | |
Toronto Dominion Bank | | | 1.45 | | | | 9-6-2018 | | | | 3,385,000 | | | | 3,384,911 | |
| | | | |
| | | | | | | | | | | | | | | 37,194,740 | |
| | | | | | | | | | | | | | | | |
|
| Diversified Financial Services: 0.60% | |
UBS AG 144A | | | 2.20 | | | | 6-8-2020 | | | | 1,275,000 | | | | 1,252,083 | |
UBS AG | | | 2.38 | | | | 8-14-2019 | | | | 1,270,000 | | | | 1,265,040 | |
| | | | |
| | | | | | | | | | | | | | | 2,517,123 | |
| | | | | | | | | | | | | | | | |
The accompanying notes are an integral part of these financial statements.
| | | | |
| 20 | | Wells Fargo Short-Term Bond Fund | | Portfolio of investments—August 31, 2018 |
| | | | | | | | | | | | | | | | |
| Security name | | Interest rate | | | Maturity date | | | Principal | | | Value | |
|
| Insurance: 0.35% | |
Sompo International Holdings Limited | | | 4.70 | % | | | 10-15-2022 | | | $ | 1,447,000 | | | $ | 1,476,707 | |
| | | | | | | | | | | | | | | | |
|
Health Care: 0.46% | |
|
| Pharmaceuticals: 0.46% | |
Shire Acquisitions Investment Ireland Limited | | | 1.90 | | | | 9-23-2019 | | | | 1,010,000 | | | | 998,240 | |
Shire Acquisitions Investment Ireland Limited | | | 2.40 | | | | 9-23-2021 | | | | 980,000 | | | | 946,981 | |
| | | | |
| | | | | | | | | | | | | | | 1,945,221 | |
| | | | | | | | | | | | | | | | |
|
Industrials: 0.44% | |
|
| Transportation Infrastructure: 0.44% | |
Asciano Finance Limited 144A | | | 4.63 | | | | 9-23-2020 | | | | 1,821,000 | | | | 1,844,952 | |
| | | | | | | | | | | | | | | | |
|
Materials: 0.81% | |
|
| Chemicals: 0.48% | |
Syngenta Finance NV 144A | | | 3.93 | | | | 4-23-2021 | | | | 2,000,000 | | | | 2,004,837 | |
| | | | | | | | | | | | | | | | |
|
| Metals & Mining: 0.33% | |
ArcelorMittal | | | 5.50 | | | | 3-1-2021 | | | | 1,340,000 | | | | 1,388,547 | |
| | | | | | | | | | | | | | | | |
| |
Total Yankee Corporate Bonds and Notes (Cost $52,957,195) | | | | 52,322,097 | |
| | | | | | | | | | | | | | | | |
| | | | |
| | | Yield | | | | | | Shares | | | | |
| Short-Term Investments: 5.51% | |
|
| Commercial Paper: 1.83% | |
Baptist Memorial Health Care Facilities & Services | | | 2.60 | | | | 10-5-2018 | | | | 1,500,000 | | | | 1,499,370 | |
Catholic Health Initiatives (p)(z) | | | 1.97 | | | | 9-14-2018 | | | | 3,000,000 | | | | 2,997,715 | |
Michigan State University Board of Trustees Series B | | | 2.40 | | | | 9-10-2018 | | | | 3,200,000 | | | | 3,200,096 | |
| | | | |
| | | | | | | | | | | | | | | 7,697,181 | |
| | | | | | | | | | | | | | | | |
|
| Investment Companies: 3.53% | |
Wells Fargo Government Money Market Fund Select Class (l)(r)(u) | | | 1.87 | | | | | | | | 14,823,405 | | | | 14,823,405 | |
| | | | | | | | | | | | | | | | |
| | | | |
| | | | | | | | | Principal | | | | |
| U.S. Treasury Securities: 0.15% | |
U.S. Treasury Bill (z)# | | | 1.31 | | | | 9-13-2018 | | | $ | 625,000 | | | | 624,702 | |
| | | | | | | | | | | | | | | | |
| |
Total Short-Term Investments (Cost $23,145,817) | | | | 23,145,288 | |
| | | | | |
| | | | | | | | |
| Total investments in securities (Cost $420,712,165) | | | 99.54 | % | | | 418,055,332 | |
Other assets and liabilities, net | | | 0.46 | | | | 1,919,491 | |
| | | | | | | | |
| Total net assets | | | 100.00 | % | | $ | 419,974,823 | |
| | | | | | | | |
The accompanying notes are an integral part of these financial statements.
| | | | | | |
| Portfolio of investments—August 31, 2018 | | Wells Fargo Short-Term Bond Fund | | | 21 | |
| 144A | The security may be resold in transactions exempt from registration, normally to qualified institutional buyers, pursuant to Rule 144A under the Securities Act of 1933. |
| ± | Variable rate investment. The rate shown is the rate in effect at period end. |
| ±± | The coupon of the security is adjusted based on the principal and interest payments received from the underlying pool of mortgages as well as the credit quality and the actual prepayment speed of the underlying mortgages. |
| ¤ | The security is issued in zero coupon form with no periodic interest payments. |
| (m) | The security is an auction-rate security which has an interest rate that resets at predetermined short-term intervals through a Dutch auction. The rate shown is the rate in effect at period end. |
| (n) | The auction to set the interest rate on the security failed at period end due to insufficient investor interest. A failed auction does not itself cause a default. |
| †† | On the last interest date, partial interest was paid. |
| (p) | Asset-backed commercial paper |
| (z) | Zero coupon security. The rate represents the current yield to maturity. |
| (l) | The issuer of the security is an affiliated person of the Fund as defined in the Investment Company Act of 1940. |
| (r) | The investment is a non-registered investment company purchased with cash collateral received from securities on loan. |
| (u) | The rate represents the 7-day annualized yield at period end. |
| # | All or a portion of this security is segregated as collateral for investments in derivative instruments. |
Abbreviations:
| AGM | Assured Guaranty Municipal |
| Ambac | Ambac Financial Group Incorporated |
| CLO | Collateralized loan obligation |
| EDA | Economic Development Authority |
| FDIC | Federal Deposit Insurance Corporation |
| FHLMC | Federal Home Loan Mortgage Corporation |
| FNMA | Federal National Mortgage Association |
| GNMA | Government National Mortgage Association |
| IDA | Industrial Development Authority |
| LIBOR | London Interbank Offered Rate |
| PFA | Public Finance Authority |
| SBA | Small Business Authority |
| REIT | Real estate investment trust |
Futures Contracts
| | | | | | | | | | | | | | | | | | | | | | | | |
| Description | | Number of
contracts | | | Expiration
date | | | Notional
cost | | | Notional
value | | | Unrealized
gains | | | Unrealized
losses | |
Long | | | | | | | | | | | | | | | | | | | | | | | | |
2-Year U.S. Treasury Notes | | | 739 | | | | 12-31-2018 | | | $ | 156,161,388 | | | $ | 156,194,579 | | | $ | 33,191 | | | $ | 0 | |
Short | | | | | | | | | | | | | | | | | | | | | | | | |
5-Year U.S. Treasury Notes | | | (186) | | | | 12-31-2018 | | | | (21,068,749 | ) | | | (21,092,110 | ) | | | 0 | | | | (23,361 | ) |
| | | | | | | | | | | | | | | | | | | | | | | | |
| | | | | | | | | | | | | | | | | | $ | 33,191 | | | $ | (23,361 | ) |
| | | | | | | | | | | | | | | | | | | | | | | | |
The accompanying notes are an integral part of these financial statements.
| | | | |
| 22 | | Wells Fargo Short-Term Bond Fund | | Portfolio of investments—August 31, 2018 |
Investments in Affiliates
An affiliated investment is an investment in which the Fund owns at least 5% of the outstanding voting shares of the issuer or as a result of other relationships, such as the Fund and the issuer having the same investment manager. Transactions with issuers that were either affiliated persons of the Fund at the beginning of the period or the end of the period were as follows:
| | | | | | | | | | | | | | | | | | | | | | | | | | | | | | | | | | | | |
| | | Shares,
beginning of
period | | | Shares
purchased | | | Shares
sold | | | Shares,
end of
period | | | Net
realized
gains
(losses) | | | Net
change in
unrealized
gains
(losses) | | | Income
from
affiliated
securities | | | Value,
end
of period | | | % of
net
assets | |
Short-Term Investments | | | | | | | | | | | | | | | | | | | | | | | | | | | | | | | | | | | | |
Investment Companies | | | | | | | | | | | | | | | | | | | | | | | | | | | | | | | | | | | | |
Security Lending Cash Investment LLC* | | | 1,127,387 | | | | 118,238 | | | | 1,245,625 | | | | 0 | | | $ | 0 | | | $ | 0 | | | $ | 914 | | | $ | 0 | | | | | |
Wells Fargo Government Money Market Fund Select Class | | | 30,383,096 | | | | 186,850,594 | | | | 202,410,285 | | | | 14,823,405 | | | | 0 | | | | 0 | | | | 219,403 | | | | 14,823,405 | | | | 3.53 | % |
| | | | | | | | | | | | | | | | | | | | | | | | | | | | | | | | | | | | |
| | | | | | | | | | | | | | | | | | $ | 0 | | | $ | 0 | | | $ | 220,317 | | | $ | 14,823,405 | | | | | |
| | | | | | | | | | | | | | | | | | | | | | | | | | | | | | | | | | | | |
| | * | No longer held at the end of the period. |
The accompanying notes are an integral part of these financial statements.
| | | | | | |
| Statement of assets and liabilities—August 31, 2018 | | Wells Fargo Short-Term Bond Fund | | | 23 | |
| | | | |
| | | | |
| |
Assets | | | | |
Investments in unaffiliated securities, at value (cost $405,888,760) | | $ | 403,231,927 | |
Investments in affiliated securities, at value (cost $14,823,405) | | | 14,823,405 | |
Cash | | | 174 | |
Principal paydown receivable | | | 13,832 | |
Receivable for Fund shares sold | | | 275,353 | |
Receivable for interest | | | 2,588,799 | |
Receivable for daily variation margin on open futures contracts | | | 68,063 | |
Prepaid expenses and other assets | | | 34,731 | |
| | | | |
Total assets | | | 421,036,284 | |
| | | | |
| |
Liabilities | | | | |
Payable for Fund shares redeemed | | | 611,624 | |
Dividends payable | | | 184,649 | |
Management fee payable | | | 110,300 | |
Administration fees payable | | | 45,526 | |
Payable for daily variation margin on open futures contracts | | | 22,228 | |
Distribution fee payable | | | 6,121 | |
Trustees’ fees and expenses payable | | | 2,087 | |
Accrued expenses and other liabilities | | | 78,926 | |
| | | | |
Total liabilities | | | 1,061,461 | |
| | | | |
Total net assets | | $ | 419,974,823 | |
| | | | |
| |
NET ASSETS CONSIST OF | | | | |
Paid-in capital | | $ | 425,690,308 | |
Undistributed net investment income | | | 37,877 | |
Accumulated net realized losses on investments | | | (3,106,359 | ) |
Net unrealized losses on investments | | | (2,647,003 | ) |
| | | | |
Total net assets | | $ | 419,974,823 | |
| | | | |
| |
COMPUTATION OF NET ASSET VALUE AND OFFERING PRICE PER SHARE | | | | |
Net assets – Class A | | $ | 182,179,253 | |
Shares outstanding – Class A1 | | | 21,062,959 | |
Net asset value per share – Class A | | | $8.65 | |
Maximum offering price per share – Class A2 | | | $8.83 | |
Net assets – Class C | | $ | 8,587,774 | |
Shares outstanding – Class C1 | | | 994,077 | |
Net asset value per share – Class C | | | $8.64 | |
Net assets – Class R6 | | $ | 2,552,599 | |
Shares outstanding – Class R61 | | | 294,889 | |
Net asset value per share – Class R6 | | | $8.66 | |
Net assets – Institutional Class | | $ | 226,655,197 | |
Shares outstanding – Institutional Class1 | | | 26,193,524 | |
Net asset value per share – Institutional Class | | | $8.65 | |
| 1 | The Fund has an unlimited number of authorized shares. |
| 2 | Maximum offering price is computed as 100/98 of net asset value. On investments of $50,000 or more, the offering price is reduced. |
The accompanying notes are an integral part of these financial statements.
| | | | |
| 24 | | Wells Fargo Short-Term Bond Fund | | Statement of operations—year ended August 31, 2018 |
| | | | |
| | | | |
|
Investment income | |
Interest (net of foreign interest withholding taxes of $1,242) | | $ | 10,564,748 | |
Income from affiliated securities | | | 220,317 | |
| | | | |
Total investment income | | | 10,785,065 | |
| | | | |
|
Expenses | |
Management fee | | | 1,568,099 | |
Administration fees | | | | |
Class A | | | 330,412 | |
Class C | | | 15,613 | |
Class R6 | | | 61 | 1 |
Institutional Class | | | 185,248 | |
Shareholder servicing fees | | | | |
Class A | | | 516,269 | |
Class C | | | 24,395 | |
Distribution fee | | | | |
Class C | | | 73,186 | |
Custody and accounting fees | | | 42,246 | |
Professional fees | | | 54,253 | |
Registration fees | | | 78,866 | |
Shareholder report expenses | | | 47,909 | |
Trustees’ fees and expenses | | | 22,027 | |
Other fees and expenses | | | 13,235 | |
| | | | |
Total expenses | | | 2,971,819 | |
Less: Fee waivers and/or expense reimbursements | | | (275,477 | ) |
| | | | |
Net expenses | | | 2,696,342 | |
| | | | |
Net investment income | | | 8,088,723 | |
| | | | |
| |
REALIZED AND UNREALIZED GAINS (LOSSES) ON INVESTMENTS | | | | |
| |
Net realized losses on: | | | | |
Unaffiliated securities | | | (154,213 | ) |
Futures contracts | | | (1,865,525 | ) |
| | | | |
Net realized losses on investments | | | (2,019,738 | ) |
| | | | |
| |
Net change in unrealized gains (losses) on: | | | | |
Unaffiliated securities | | | (4,293,133 | ) |
Futures contracts | | | (91,470 | ) |
| | | | |
Net change in unrealized gains (losses) on investments | | | (4,384,603 | ) |
| | | | |
Net realized and unrealized gains (losses) on investments | | | (6,404,341 | ) |
| | | | |
Net increase in net assets resulting from operations | | $ | 1,684,382 | |
| | | | |
| 1 | For the period from July 31, 2018 (commencement of operations) to August 31, 2018 |
The accompanying notes are an integral part of these financial statements.
| | | | | | |
| Statement of changes in net assets | | Wells Fargo Short-Term Bond Fund | | | 25 | |
| | | | | | | | | | | | | | | | |
| | | Year ended
August 31, 2018 | | | Year ended
August 31, 2017 | |
| | | | |
Operations | | | | | | | | | | | | | | | | |
Net investment income | | | | | | $ | 8,088,723 | | | | | | | $ | 7,341,144 | |
Net realized losses on investments | | | | | | | (2,019,738 | ) | | | | | | | (292,973 | ) |
Net change in unrealized gains (losses) on investments | | | | | | | (4,384,603 | ) | | | | | | | (686,076 | ) |
| | | | |
Net increase in net assets resulting from operations | | | | | | | 1,684,382 | | | | | | | | 6,362,095 | |
| | | | |
| | | | |
Distributions to shareholders from | | | | | | | | | | | | | | | | |
Net investment income | | | | | | | | | | | | | | | | |
Class A | | | | | | | (3,469,175 | ) | | | | | | | (3,318,768 | ) |
Class C | | | | | | | (90,525 | ) | | | | | | | (75,709 | ) |
Class R6 | | | | | | | (4,529 | )1 | | | | | | | N/A | |
Institutional Class | | | | | | | (4,526,238 | ) | | | | | | | (3,946,663 | ) |
| | | | |
Total distributions to shareholders | | | | | | | (8,090,467 | ) | | | | | | | (7,341,140 | ) |
| | | | |
| | | | |
Capital share transactions | | | Shares | | | | | | | | Shares | | | | | |
Proceeds from shares sold | | | | | | | | | | | | | | | | |
Class A | | | 2,950,320 | | | | 25,683,232 | | | | 3,840,470 | | | | 33,642,098 | |
Class C | | | 199,067 | | | | 1,725,463 | | | | 300,680 | | | | 2,631,368 | |
Class R6 | | | 295,683 | 1 | | | 2,557,641 | 1 | | | N/A | | | | N/A | |
Institutional Class | | | 9,805,488 | | | | 85,201,932 | | | | 11,826,160 | | | | 103,614,345 | |
| | | | |
| | | | | | | 115,168,268 | | | | | | | | 139,887,811 | |
| | | | |
Reinvestment of distributions | | | | | | | | | | | | | | | | |
Class A | | | 376,379 | | | | 3,266,179 | | | | 357,529 | | | | 3,130,762 | |
Class C | | | 8,860 | | | | 76,773 | | | | 7,137 | | | | 62,415 | |
Class R6 | | | 517 | 1 | | | 4,475 | 1 | | | N/A | | | | N/A | |
Institutional Class | | | 346,975 | | | | 3,011,667 | | | | 314,369 | | | | 2,754,565 | |
| | | | |
| | | | | | | 6,359,094 | | | | | | | | 5,947,742 | |
| | | | |
Payment for shares redeemed | | | | | | | | | | | | | | | | |
Class A | | | (8,005,429 | ) | | | (69,532,343 | ) | | | (10,195,238 | ) | | | (89,264,300 | ) |
Class C | | | (510,548 | ) | | | (4,431,866 | ) | | | (630,122 | ) | | | (5,509,876 | ) |
Class R6 | | | (1,311 | )1 | | | (11,344 | )1 | | | N/A | | | | N/A | |
Institutional Class | | | (10,231,298 | ) | | | (88,878,420 | ) | | | (14,653,735 | ) | | | (128,341,544 | ) |
| | | | |
| | | | | | | (162,853,973 | ) | | | | | | | (223,115,720 | ) |
| | | | |
Net decrease in net assets resulting from capital share transactions | | | | | | | (41,326,611 | ) | | | | | | | (77,280,167 | ) |
| | | | |
Total decrease in net assets | | | | | | | (47,732,696 | ) | | | | | | | (78,259,212 | ) |
| | | | |
| | | | |
Net assets | | | | | | | | | | | | | | | | |
Beginning of period | | | | | | | 467,707,519 | | | | | | | | 545,966,731 | |
| | | | |
End of period | | | | | | $ | 419,974,823 | | | | | | | $ | 467,707,519 | |
| | | | |
Undistributed net investment income | | | | | | $ | 37,877 | | | | | | | $ | 39,621 | |
| | | | |
| 1 | For the period from July 31, 2018 (commencement of operations) to August 31, 2018 |
The accompanying notes are an integral part of these financial statements.
| | | | |
| 26 | | Wells Fargo Short-Term Bond Fund | | Financial highlights |
(For a share outstanding throughout each period)
| | | | | | | | | | | | | | | | | | | | |
| | | Year ended August 31 | |
| CLASS A | | 2018 | | | 2017 | | | 2016 | | | 2015 | | | 2014 | |
Net asset value, beginning of period | | | $8.77 | | | | $8.78 | | | | $8.77 | | | | $8.82 | | | | $8.77 | |
Net investment income | | | 0.15 | | | | 0.12 | | | | 0.11 | | | | 0.09 | | | | 0.10 | |
Net realized and unrealized gains (losses) on investments | | | (0.12 | ) | | | (0.01 | ) | | | 0.04 | | | | (0.03 | ) | | | 0.05 | |
| | | | | | | | | | | | | | | | | | | | |
Total from investment operations | | | 0.03 | | | | 0.11 | | | | 0.15 | | | | 0.06 | | | | 0.15 | |
Distributions to shareholders from | | | | | | | | | | | | | | | | | | | | |
Net investment income | | | (0.15 | ) | | | (0.12 | ) | | | (0.11 | ) | | | (0.09 | ) | | | (0.10 | ) |
Net realized gains | | | 0.00 | | | | 0.00 | | | | (0.03 | ) | | | (0.02 | ) | | | 0.00 | |
| | | | | | | | | | | | | | | | | | | | |
Total distributions to shareholders | | | (0.15 | ) | | | (0.12 | ) | | | (0.14 | ) | | | (0.11 | ) | | | (0.10 | ) |
Net asset value, end of period | | | $8.65 | | | | $8.77 | | | | $8.78 | | | | $8.77 | | | | $8.82 | |
Total return1 | | | 0.31 | % | | | 1.25 | % | | | 1.77 | % | | | 0.66 | % | | | 1.72 | % |
Ratios to average net assets (annualized) | | | | | | | | | | | | | | | | | | | | |
Gross expenses | | | 0.82 | % | | | 0.81 | % | | | 0.81 | % | | | 0.80 | % | | | 0.82 | % |
Net expenses | | | 0.72 | % | | | 0.72 | % | | | 0.72 | % | | | 0.74 | % | | | 0.78 | % |
Net investment income | | | 1.68 | % | | | 1.35 | % | | | 1.29 | % | | | 1.00 | % | | | 1.12 | % |
Supplemental data | | | | | | | | | | | | | | | | | | | | |
Portfolio turnover rate | | | 43 | % | | | 50 | % | | | 59 | % | | | 57 | % | | | 70 | % |
Net assets, end of period (000s omitted) | | | $182,179 | | | | $225,797 | | | | $278,802 | | | | $65,454 | | | | $59,962 | |
| 1 | Total return calculations do not include any sales charges. |
The accompanying notes are an integral part of these financial statements.
| | | | | | |
| Financial highlights | | Wells Fargo Short-Term Bond Fund | | | 27 | |
(For a share outstanding throughout each period)
| | | | | | | | | | | | | | | | | | | | |
| | | Year ended August 31 | |
| CLASS C | | 2018 | | | 2017 | | | 2016 | | | 2015 | | | 2014 | |
Net asset value, beginning of period | | | $8.76 | | | | $8.77 | | | | $8.76 | | | | $8.81 | | | | $8.76 | |
Net investment income | | | 0.08 | | | | 0.05 | | | | 0.05 | | | | 0.02 | | | | 0.03 | |
Net realized and unrealized gains (losses) on investments | | | (0.12 | ) | | | (0.01 | ) | | | 0.04 | | | | (0.03 | ) | | | 0.05 | |
| | | | | | | | | | | | | | | | | | | | |
Total from investment operations | | | (0.04 | ) | | | 0.04 | | | | 0.09 | | | | (0.01 | ) | | | 0.08 | |
Distributions to shareholders from | | | | | | | | | | | | | | | | | | | | |
Net investment income | | | (0.08 | ) | | | (0.05 | ) | | | (0.05 | ) | | | (0.02 | ) | | | (0.03 | ) |
Net realized gains | | | 0.00 | | | | 0.00 | | | | (0.03 | ) | | | (0.02 | ) | | | 0.00 | |
| | | | | | | | | | | | | | | | | | | | |
Total distributions to shareholders | | | (0.08 | ) | | | (0.05 | ) | | | (0.08 | ) | | | (0.04 | ) | | | (0.03 | ) |
Net asset value, end of period | | | $8.64 | | | | $8.76 | | | | $8.77 | | | | $8.76 | | | | $8.81 | |
Total return1 | | | (0.44 | )% | | | 0.49 | % | | | 1.01 | % | | | (0.09 | )% | | | 0.97 | % |
Ratios to average net assets (annualized) | | | | | | | | | | | | | | | | | | | | |
Gross expenses | | | 1.57 | % | | | 1.56 | % | | | 1.56 | % | | | 1.55 | % | | | 1.57 | % |
Net expenses | | | 1.47 | % | | | 1.47 | % | | | 1.47 | % | | | 1.49 | % | | | 1.53 | % |
Net investment income | | | 0.93 | % | | | 0.61 | % | | | 0.53 | % | | | 0.25 | % | | | 0.37 | % |
Supplemental data | | | | | | | | | | | | | | | | | | | | |
Portfolio turnover rate | | | 43 | % | | | 50 | % | | | 59 | % | | | 57 | % | | | 70 | % |
Net assets, end of period (000s omitted) | | | $8,588 | | | | $11,361 | | | | $14,204 | | | | $11,508 | | | | $14,852 | |
| 1 | Total return calculations do not include any sales charges. |
The accompanying notes are an integral part of these financial statements.
| | | | |
| 28 | | Wells Fargo Short-Term Bond Fund | | Financial highlights |
(For a share outstanding throughout each period)
| | | | |
| CLASS R6 | | Year ended
August 31 20181 | |
Net asset value, beginning of period | | | $8.64 | |
Net investment income | | | 0.02 | 2 |
Net realized and unrealized gains (losses) on investments | | | 0.02 | |
| | | | |
Total from investment operations | | | 0.04 | |
Distributions to shareholders from | | | | |
Net investment income | | | (0.02 | ) |
Net asset value, end of period | | | $8.66 | |
Total return | | | 0.42 | % |
Ratios to average net assets (annualized) | | | | |
Gross expenses | | | 0.44 | % |
Net expenses | | | 0.40 | % |
Net investment income | | | 2.24 | % |
Supplemental data | | | | |
Portfolio turnover rate | | | 43 | % |
Net assets, end of period (000s omitted) | | | $2,553 | |
| 1 | For the period from July 31, 2018 (commencement of class operations) to August 31, 2018 |
| 2 | Calculated based upon average shares outstanding |
The accompanying notes are an integral part of these financial statements.
| | | | | | |
| Financial highlights | | Wells Fargo Short-Term Bond Fund | | | 29 | |
(For a share outstanding throughout each period)
| | | | | | | | | | | | | | | | | | | | |
| | | Year ended August 31 | |
| INSTITUTIONAL CLASS | | 2018 | | | 2017 | | | 2016 | | | 2015 | | | 2014 | |
Net asset value, beginning of period | | | $8.78 | | | | $8.79 | | | | $8.77 | | | | $8.83 | | | | $8.77 | |
Net investment income | | | 0.17 | | | | 0.14 | | | | 0.13 | | | | 0.11 | | | | 0.12 | |
Net realized and unrealized gains (losses) on investments | | | (0.13 | ) | | | (0.01 | ) | | | 0.05 | | | | (0.04 | ) | | | 0.07 | |
| | | | | | | | | | | | | | | | | | | | |
Total from investment operations | | | 0.04 | | | | 0.13 | | | | 0.18 | | | | 0.07 | | | | 0.19 | |
Distributions to shareholders from | | | | | | | | | | | | | | | | | | | | |
Net investment income | | | (0.17 | ) | | | (0.14 | ) | | | (0.13 | ) | | | (0.11 | ) | | | (0.13 | ) |
Net realized gains | | | 0.00 | | | | 0.00 | | | | (0.03 | ) | | | (0.02 | ) | | | 0.00 | |
| | | | | | | | | | | | | | | | | | | | |
Total distributions to shareholders | | | (0.17 | ) | | | (0.14 | ) | | | (0.16 | ) | | | (0.13 | ) | | | (0.13 | ) |
Net asset value, end of period | | | $8.65 | | | | $8.78 | | | | $8.79 | | | | $8.77 | | | | $8.83 | |
Total return | | | 0.46 | % | | | 1.49 | % | | | 2.14 | % | | | 0.82 | % | | | 2.15 | % |
Ratios to average net assets (annualized) | | | | | | | | | | | | | | | | | | | | |
Gross expenses | | | 0.49 | % | | | 0.48 | % | | | 0.48 | % | | | 0.47 | % | | | 0.49 | % |
Net expenses | | | 0.46 | % | | | 0.48 | % | | | 0.48 | % | | | 0.47 | % | | | 0.47 | % |
Net investment income | | | 1.95 | % | | | 1.59 | % | | | 1.51 | % | | | 1.26 | % | | | 1.42 | % |
Supplemental data | | | | | | | | | | | | | | | | | | | | |
Portfolio turnover rate | | | 43 | % | | | 50 | % | | | 59 | % | | | 57 | % | | | 70 | % |
Net assets, end of period (000s omitted) | | | $226,655 | | | | $230,549 | | | | $252,961 | | | | $306,832 | | | | $330,613 | |
The accompanying notes are an integral part of these financial statements.
| | | | |
| 30 | | Wells Fargo Short-Term Bond Fund | | Notes to financial statements |
1. ORGANIZATION
Wells Fargo Funds Trust (the “Trust”), a Delaware statutory trust organized on March 10, 1999, is an open-end management investment company registered under the Investment Company Act of 1940, as amended (the “1940 Act”). As an investment company, the Trust follows the accounting and reporting guidance in Financial Accounting Standards Board (“FASB”) Accounting Standards Codification Topic 946, Financial Services – Investment Companies. These financial statements report on the Wells Fargo Short-Term Bond Fund (the “Fund”) which is a diversified series of the Trust.
2. SIGNIFICANT ACCOUNTING POLICIES
The following significant accounting policies, which are consistently followed in the preparation of the financial statements of the Fund, are in conformity with U.S. generally accepted accounting principles which require management to make estimates and assumptions that affect the reported amounts of assets and liabilities, disclosure of contingent assets and liabilities at the date of the financial statements, and the reported amounts of revenues and expenses during the reporting period. Actual results could differ from those estimates.
Securities valuation
All investments are valued each business day as of the close of regular trading on the New York Stock Exchange (generally 4 p.m. Eastern Time), although the Fund may deviate from this calculation time under unusual or unexpected circumstances.
Debt securities are valued at the evaluated bid price provided by an independent pricing service or, if a reliable price is not available, the quoted bid price from an independent broker-dealer.
Equity securities and futures contracts that are listed on a foreign or domestic exchange or market are valued at the official closing price or, if none, the last sales price. If no sale occurs on the principal exchange or market that day, a fair value price will be determined in accordance with the Fund’s Valuation Procedures.
Investments in registered open-end investment companies are valued at net asset value. Interests in non-registered investment companies that are redeemable at net asset value are fair valued normally at net asset value.
Investments which are not valued using any of the methods discussed above are valued at their fair value, as determined in good faith by the Board of Trustees of the Fund. The Board of Trustees has established a Valuation Committee comprised of the Trustees and has delegated to it the authority to take any actions regarding the valuation of portfolio securities that the Valuation Committee deems necessary or appropriate, including determining the fair value of portfolio securities, unless the determination has been delegated to the Wells Fargo Asset Management Pricing Committee at Wells Fargo Funds Management, LLC (“Funds Management”). The Board of Trustees retains the authority to make or ratify any valuation decisions or approve any changes to the Valuation Procedures as it deems appropriate. On a quarterly basis, the Board of Trustees receives reports on any valuation actions taken by the Valuation Committee or the Wells Fargo Asset Management Pricing Committee which may include items for ratification.
Valuations of fair valued securities are compared to the next actual sales price when available, or other appropriate market values, to assess the continued appropriateness of the fair valuation methodologies used. These securities are fair valued on a day-to-day basis, taking into consideration changes to appropriate market information and any significant changes to the inputs considered in the valuation process until there is a readily available price provided on an exchange or by an independent pricing service. Valuations received from an independent pricing service or independent broker-dealer quotes are periodically validated by comparisons to most recent trades and valuations provided by other independent pricing services in addition to the review of prices by the manager and/or subadviser. Unobservable inputs used in determining fair valuations are identified based on the type of security, taking into consideration factors utilized by market participants in valuing the investment, knowledge about the issuer and the current market environment.
Securities lending
The Fund may lend its securities from time to time in order to earn additional income in the form of fees or interest on securities received as collateral or the investment of any cash received as collateral. The Fund continues to receive interest or dividends on the securities loaned. The Fund receives collateral in the form of cash or securities with a value at least equal to the value of the securities on loan. The value of the loaned securities is determined at the close of each business day and any additional required collateral is delivered to the Fund on the next business day. In a securities lending transaction, the net asset value of the Fund will be affected by an increase or decrease in the value of the securities loaned and by an increase or decrease in the value of the instrument in which collateral is invested. The amount of securities lending activity undertaken by the Fund fluctuates from time to time. In the event of default or bankruptcy by the borrower, the Fund may be prevented from recovering the loaned securities or gaining access to the collateral or
| | | | | | |
| Notes to financial statements | | Wells Fargo Short-Term Bond Fund | | | 31 | |
may experience delays or costs in doing so. In addition, the investment of any cash collateral received may lose all or part of its value. The Fund has the right under the lending agreement to recover the securities from the borrower on demand.
The Fund lends its securities through an unaffiliated securities lending agent. Cash collateral received in connection with its securities lending transactions is invested in Securities Lending Cash Investments, LLC (the “Securities Lending Fund”). The Securities Lending Fund is exempt from registration under Section 3(c) (7) of the 1940 Act and is managed by Funds Management and is subadvised by Wells Capital Management Incorporated (“WellsCap”), an affiliate of Funds Management and an indirect wholly owned subsidiary of Wells Fargo & Company (“Wells Fargo”). Funds Management receives an advisory fee starting at 0.05% and declining to 0.01% as the average daily net assets of the Securities Lending Fund increase. All of the fees received by Funds Management are paid to WellsCap for its services as subadviser. The Securities Lending Fund seeks to provide a positive return compared to the daily Fed Funds Open Rate by investing in high-quality, U.S. dollar-denominated short-term money market instruments. Securities Lending Fund investments are valued at the evaluated bid price provided by an independent pricing service. Income earned from investment in the Securities Lending Fund, if any, is included in income from affiliated securities on the Statement of Operations.
When-issued transactions
The Fund may purchase securities on a forward commitment or when-issued basis. The Fund records a when-issued transaction on the trade date and will segregate assets in an amount at least equal in value to the Fund’s commitment to purchase when-issued securities. Securities purchased on a when-issued basis are marked-to-market daily and the Fund begins earning interest on the settlement date. Losses may arise due to changes in the market value of the underlying securities or if the counterparty does not perform under the contract.
Futures contracts
The Fund is subject to interest rate risk in the normal course of pursuing its investment objectives. Futures contracts are agreements between the Fund and a counterparty to buy or sell a specific amount of a commodity, financial instrument or currency at specified price and on a specified date. The Fund may buy and sell futures contracts in order to gain exposure to, or protect against, changes in interest rates. The primary risks associated with the use of futures contracts are the imperfect correlation between changes in market values of securities held by the Fund and the prices of futures contracts, and the possibility of an illiquid market. Futures contracts are generally entered into on a regulated futures exchange and cleared through a clearinghouse associated with the exchange. With futures contracts, there is minimal counterparty risk to the Fund since futures contracts are exchange traded and the exchange’s clearinghouse, as counterparty to all exchange traded futures, guarantees the futures contracts against default.
Upon entering into a futures contracts, the Fund is required to deposit either cash or securities (initial margin) with the broker in an amount equal to a certain percentage of the contract value. Subsequent payments (variation margin) are paid to or from the broker each day equal to the daily changes in the contract value. Such payments are recorded as unrealized gains or losses and, if any, shown as variation margin receivable (payable) in the Statement of Assets and Liabilities. Should the Fund fail to make requested variation margin payments, the broker can gain access to the initial margin to satisfy the Fund’s payment obligations. When the contracts are closed, a realized gain or loss is recorded in the Statement of Operations.
Security transactions and income recognition
Securities transactions are recorded on a trade date basis. Realized gains or losses are recorded on the basis of identified cost.
Interest income is accrued daily and bond discounts are accreted and premiums are amortized daily. To the extent debt obligations are placed on non-accrual status, any related interest income may be reduced by writing off interest receivables when the collection of all or a portion of interest has been determined to be doubtful based on consistently applied procedures and the fair value has decreased. If the issuer subsequently resumes interest payments or when the collectability of interest is reasonably assured, the debt obligation is removed from non-accrual status.
Dividend income is recognized on the ex-dividend date.
Income from foreign securities is recorded net of foreign taxes withheld where recovery of such taxes is not assured.
Distributions to shareholders
Distributions to shareholders from net investment income are declared daily and paid monthly. Distributions from net realized gains, if any, are recorded on the ex-dividend date. Such distributions are determined in accordance with income tax regulations and may differ from U.S. generally accepted accounting principles. Dividend sources are estimated at the time of declaration. The tax character of distributions is determined as of the Fund’s fiscal year end. Therefore, a portion of the Fund’s distributions made prior to the Fund’s fiscal year end may be categorized as a tax return of capital at year end.
| | | | |
| 32 | | Wells Fargo Short-Term Bond Fund | | Notes to financial statements |
Federal and other taxes
The Fund intends to continue to qualify as a regulated investment company by distributing substantially all of its investment company taxable income and any net realized capital gains (after reduction for capital loss carryforwards) sufficient to relieve it from all, or substantially all, federal income taxes. Accordingly, no provision for federal income taxes was required.
The Fund’s income and federal excise tax returns and all financial records supporting those returns for the prior three fiscal years are subject to examination by the federal and Delaware revenue authorities. Management has analyzed the Fund’s tax positions taken on federal, state, and foreign tax returns for all open tax years and does not believe that there are any uncertain tax positions that require recognition of a tax liability.
As of August 31, 2018, the aggregate cost of all investments for federal income tax purposes was $420,721,995 and the unrealized gains (losses) consisted of:
| | | | |
Gross unrealized gains | | $ | 519,745 | |
Gross unrealized losses | | | (3,176,578 | ) |
Net unrealized losses | | $ | (2,656,833 | ) |
Reclassifications are made to the Fund’s capital accounts for permanent tax differences to reflect income and gains available for distribution (or available capital loss carryforwards) under federal income tax regulations. U.S. generally accepted accounting principles require that certain components of net assets be adjusted to reflect permanent differences between financial and tax reporting. These reclassifications have no effect on net assets or net asset values per share. At August 31, 2018, as a result of permanent book-to-tax differences, the following reclassification adjustments were made on the Statement of Assets and Liabilities:
| | |
| Paid-in capital | | Accumulated net
realized losses
on investments |
| $(50) | | $50 |
As of August 31, 2018, the Fund had capital loss carryforwards which consist of $170,149 in short-term capital losses and $1,246,541 in long-term capital losses.
As of August 31, 2018, the Fund had current year deferred post-October capital losses consisting of $744,588 in short-term losses and $935,251 in long-term losses which will be recognized on the first day of the following fiscal year.
Class allocations
The separate classes of shares offered by the Fund differ principally in applicable sales charges, distribution, shareholder servicing, and administration fees. Class specific expenses are charged directly to that share class. Investment income, common expenses, and realized and unrealized gains (losses) on investments are allocated daily to each class of shares based on the relative proportion of net assets of each class.
3. FAIR VALUATION MEASUREMENTS
Fair value measurements of investments are determined within a framework that has established a fair value hierarchy based upon the various data inputs utilized in determining the value of the Fund’s investments. The three-level hierarchy gives the highest priority to unadjusted quoted prices in active markets for identical assets or liabilities (Level 1) and the lowest priority to unobservable inputs (Level 3). The Fund’s investments are classified within the fair value hierarchy based on the lowest level of input that is significant to the fair value measurement. The inputs are summarized into three broad levels as follows:
| ∎ | | Level 1 – quoted prices in active markets for identical securities |
| ∎ | | Level 2 – other significant observable inputs (including quoted prices for similar securities, interest rates, prepayment speeds, credit risk, etc.) |
| ∎ | | Level 3 – significant unobservable inputs (including the Fund’s own assumptions in determining the fair value of investments) |
| | | | | | |
| Notes to financial statements | | Wells Fargo Short-Term Bond Fund | | | 33 | |
The inputs or methodologies used for valuing investments in securities are not necessarily an indication of the risk associated with investing in those securities.
The following is a summary of the inputs used in valuing the Fund’s assets and liabilities as of August 31, 2018:
| | | | | | | | | | | | | | | | |
| | | Quoted prices
(Level 1) | | | Other significant
observable inputs
(Level 2) | | | Significant
unobservable inputs (Level 3) | | | Total | |
|
Assets | | | | | | | | | | | | | | | | |
Investments in: | | | | | | | | | | | | | | | | |
| | | | |
Agency securities | | $ | 0 | | | $ | 26,201,925 | | | $ | 0 | | | $ | 26,201,925 | |
| | | | |
Asset-backed securities | | | 0 | | | | 48,386,229 | | | | 0 | | | | 48,386,229 | |
| | | | |
Corporate bonds and notes | | | 0 | | | | 180,364,175 | | | | 0 | | | | 180,364,175 | |
| | | | |
Municipal obligations | | | 0 | | | | 22,293,927 | | | | 0 | | | | 22,293,927 | |
| | | | |
Non-agency mortgage-backed securities | | | 0 | | | | 65,341,691 | | | | 0 | | | | 65,341,691 | |
| | | | |
Yankee corporate bonds and notes | | | 0 | | | | 52,322,097 | | | | 0 | | | | 52,322,097 | |
| | | | |
Short-term investments | | | | | | | | | | | | | | | | |
Commercial papers | | | 0 | | | | 7,697,181 | | | | 0 | | | | 7,697,181 | |
Investment companies | | | 14,823,405 | | | | 0 | | | | 0 | | | | 14,823,405 | |
U.S. Treasury securities | | | 624,702 | | | | 0 | | | | 0 | | | | 624,702 | |
| | $ | 15,448,107 | | | $ | 402,607,225 | | | $ | 0 | | | $ | 418,055,332 | |
Futures contracts | | | 33,191 | | | | 0 | | | | 0 | | | | 33,191 | |
Total assets | | $ | 15,481,298 | | | $ | 402,607,225 | | | $ | 0 | | | $ | 418,088,523 | |
Liabilities | | | | | | | | | | | | | | | | |
Futures contracts | | $ | 23,361 | | | $ | 0 | | | $ | 0 | | | $ | 23,361 | |
Total liabilities | | $ | 23,361 | | | $ | 0 | | | $ | 0 | | | $ | 23,361 | |
Additional sector, industry or geographic detail is included in the Portfolio of Investments.
Futures contracts are reported at their cumulative unrealized gains (losses) at measurement date as reported in the table following the Portfolio of Investments. For futures contracts the current day’s variation margin is reported on the Statement of Assets and Liabilities. All other assets and liabilities are reported at their market value at measurement date.
The Fund recognizes transfers between levels within the fair value hierarchy at the end of the reporting period. At August 31, 2018, the Fund did not have any transfers into/out of Level 1, Level 2, or Level 3.
4. TRANSACTIONS WITH AFFILIATES
Management fee
Funds Management, an indirect wholly owned subsidiary of Wells Fargo, is the manager of the Fund and provides advisory and fund-level administrative services under an investment management agreement. Under the investment management agreement, Funds Management is responsible for, among other services, implementing the investment objectives and strategies of the Fund, supervising the subadviser and providing fund-level administrative services in connection with the Fund’s operations. As compensation for its services under the investment management agreement, Funds Management is entitled to receive an annual management fee starting at 0.35% and declining to 0.255% as the average daily net assets of the Fund increase. For the year ended August 31, 2018, the management fee was equivalent to an annual rate of 0.35% of the Fund’s average daily net assets.
Funds Management has retained the services of a subadviser to provide daily portfolio management to the Fund. The fee for subadvisory services is borne by Funds Management. WellsCap is the subadviser to the Fund and is entitled to receive a fee from Funds Management at an annual rate starting at 0.15% and declining to 0.05% as the average daily net assets of the Fund increase.
| | | | |
| 34 | | Wells Fargo Short-Term Bond Fund | | Notes to financial statements |
Administration fees
Under a class-level administration agreement, Funds Management provides class-level administrative services to the Fund, which includes paying fees and expenses for services provided by the transfer agent, sub-transfer agents, omnibus account servicers and record-keepers. As compensation for its services under the class-level administration agreement, Funds Management receives an annual fee which is calculated based on the average daily net assets of each class as follows:
| | | | |
| | | Class-level
administration fee | |
Class A, Class C | | | 0.16 | % |
Class R6 | | | 0.03 | |
Institutional Class | | | 0.08 | |
Funds Management has contractually waived and/or reimbursed management and administration fees to the extent necessary to maintain certain net operating expense ratios for the Fund. When each class of the Fund has exceeded its expense cap, Funds Management has waived fees and/or reimbursed expenses from fund level expenses on a proportionate basis and then from class specific expenses; otherwise, waivers and/or reimbursements are applied against class specific expenses before fund level expenses. Funds Management has committed through December 31, 2018 (December 31, 2019 for Class C) to waive fees and/or reimburse expenses to the extent necessary to cap the Fund’s expenses at 0.72% for Class A shares, 1.47% for Class C shares, 0.40% for Class R6 shares, and 0.45% for Institutional Class shares. After this time, the cap may be increased or the commitment to maintain the cap may be terminated only with the approval of the Board of Trustees. Prior to February 28, 2018, the Fund’s expense was capped at 0.48% for Institutional Class shares.
Distribution fee
The Trust has adopted a distribution plan for Class C shares of the Fund pursuant to Rule 12b-1 under the 1940 Act. A distribution fee is charged to Class C shares and paid to Wells Fargo Funds Distributor, LLC (“Funds Distributor”), the principal underwriter, at an annual rate of 0.75% of the average daily net assets of Class C shares.
In addition, Funds Distributor is entitled to receive the front-end sales charge from the purchase of Class A shares and a contingent deferred sales charge on the redemption of certain Class A shares. Funds Distributor is also entitled to receive the contingent deferred sales charges from redemptions of Class C shares. For the year ended August 31, 2018, Funds Distributor received $464 from the sale of Class A shares. No contingent deferred sales charges were incurred by Class A and Class C shares for the year ended August 31, 2018.
Shareholder servicing fees
The Trust has entered into contracts with one or more shareholder servicing agents, whereby Class A and Class C of the Fund are charged a fee at an annual rate of 0.25% of the average daily net assets of each respective class.
A portion of these total shareholder servicing fees were paid to affiliates of Wells Fargo.
Interfund transactions
The Fund may purchase or sell investment securities to other Wells Fargo affiliates pursuant to Rule 17a-7 under the 1940 Act and under procedures adopted by the Board of Trustees. The procedures have been designed to ensure that these interfund transactions, which do not incur broker commissions, are effected at current market prices.
5. INVESTMENT PORTFOLIO TRANSACTIONS
Purchases and sales of investments, excluding short-term securities, for the year ended August 31, 2018 were as follows:
| | | | | | |
Purchases at cost | | Sales proceeds |
U.S.
government | | Non-U.S.
government | | U.S.
government | | Non-U.S.
government |
| $8,874,719 | | $209,316,943 | | $175,560 | | $180,044,529 |
| | | | | | |
| Notes to financial statements | | Wells Fargo Short-Term Bond Fund | | | 35 | |
6. DERIVATIVE TRANSACTIONS
During the year ended August 31, 2018, the Fund entered into futures contracts to speculate on interest rates and to help manage the duration of the portfolio. The Fund had an average notional amount of $179,813,790 in long futures contracts and $28,834,314 in short future contracts during the year ended August 31, 2018.
7. BANK BORROWINGS
The Trust (excluding the money market funds), Wells Fargo Master Trust and Wells Fargo Variable Trust are parties to a $280,000,000 revolving credit agreement whereby the Fund is permitted to use bank borrowings for temporary or emergency purposes, such as to fund shareholder redemption requests. Interest under the credit agreement is charged to the Fund based on a borrowing rate equal to the higher of the Federal Funds rate in effect on that day plus 1.25% or the overnight LIBOR rate in effect on that day plus 1.25%. In addition, an annual commitment fee equal to 0.25% of the unused balance is allocated to each participating fund.
For the year ended August 31, 2018, there were no borrowings by the Fund under the agreement.
8. DISTRIBUTIONS TO SHAREHOLDERS
The tax character of distributions paid was $8,090,467 and $7,341,140 of ordinary income for the years ended August 31, 2018 and August 31, 2017, respectively.
As of August 31, 2018, the components of distributable earnings on a tax basis were as follows:
| | | | | | |
Undistributed ordinary income | | Unrealized
losses | | Post-October
capital losses
deferred | | Capital loss
carryforward |
| $317,427 | | $(2,751,734) | | $(1,679,839) | | $(1,416,690) |
9. INDEMNIFICATION
Under the Trust’s organizational documents, the officers and Trustees have been granted certain indemnification rights against certain liabilities that may arise out of performance of their duties to the Trust. Additionally, in the normal course of business, the Trust may enter into contracts with service providers that contain a variety of indemnification clauses. The Trust’s maximum exposure under these arrangements is dependent on future claims that may be made against the Fund and, therefore, cannot be estimated.
10. NEW ACCOUNTING PRONOUNCEMENTS AND REGULATORY CHANGES
On August 17, 2018, the Securities and Exchange Commission (“SEC”) adopted Disclosure Update and Simplification, which amends certain disclosure requirements. The amendments are effective for filings subsequent to November 5, 2018. Management expects these amendments will impact the classification of disclosures in the financial statements.
In August 2018, FASB issued Accounting Standards Update (“ASU”) No. 2018-13, Fair Value Measurement (Topic 820) Disclosure Framework—Changes to the Disclosure Requirements for Fair Value Measurement. ASU 2018-13 updates the disclosure requirements for fair value measurements by modifying or removing certain disclosures and adding certain new disclosures. The amendments are effective for fiscal years, and interim periods within those fiscal years, beginning after December 15, 2019. Early adoption is permitted. Management is currently evaluating the potential impact of this new guidance to the financial statements.
In March 2017, FASB issued ASU No. 2017-08, Premium Amortization on Purchased Callable Debt Securities. ASU 2017-08 shortens the amortization period for certain callable debt securities held at a premium. The amendments require the premium to be amortized to the earliest call date. The amendments do not require an accounting change for securities held at a discount; the discount continues to be amortized to maturity. ASU 2017-08 is effective for fiscal years beginning after December 15, 2018 and for interim periods within those fiscal years. Management is currently evaluating the potential impact of this new guidance to the financial statements.
| | | | |
| 36 | | Wells Fargo Short-Term Bond Fund | | Report of independent registered public accounting firm |
BOARD OF TRUSTEES AND SHAREHOLDERS OF WELLS FARGO FUNDS TRUST:
Opinion on the Financial Statements
We have audited the accompanying statement of assets and liabilities of Wells Fargo Short-Term Bond Fund (the “Fund”), including the portfolio of investments, as of August 31, 2018, the related statement of operations for the year then ended, the statements of changes in net assets for each of the years in the two-year period then ended, and the related notes (collectively, the “financial statements”) and the financial highlights for each of the years or periods in the five-year period then ended. In our opinion, the financial statements and financial highlights present fairly, in all material respects, the financial position of the Fund as of August 31, 2018, the results of its operations for the year then ended, the changes in its net assets for each of the years in the two-year period then ended, and the financial highlights for each of the years or periods in the five-year period then ended, in conformity with U.S. generally accepted accounting principles.
Basis for Opinion
These financial statements and financial highlights are the responsibility of the Fund’s management. Our responsibility is to express an opinion on these financial statements and financial highlights based on our audits. We are a public accounting firm registered with the Public Company Accounting Oversight Board (United States) (“PCAOB”) and are required to be independent with respect to the Fund in accordance with the U.S. federal securities laws and the applicable rules and regulations of the Securities and Exchange Commission and the PCAOB.
We conducted our audits in accordance with the standards of the PCAOB. Those standards require that we plan and perform the audit to obtain reasonable assurance about whether the financial statements and financial highlights are free of material misstatement, whether due to error or fraud. Our audits included performing procedures to assess the risks of material misstatement of the financial statements and financial highlights, whether due to error or fraud, and performing procedures that respond to those risks. Such procedures included examining, on a test basis, evidence regarding the amounts and disclosures in the financial statements and financial highlights. Such procedures also included confirmation of securities owned as of August 31, 2018, by correspondence with the custodian and brokers, or by other appropriate auditing procedures. Our audits also included evaluating the accounting principles used and significant estimates made by management, as well as evaluating the overall presentation of the financial statements and financial highlights. We believe that our audits provide a reasonable basis for our opinion.

We have not been able to determine the specific year that we began serving as the auditor of one or more Wells Fargo Funds investment companies, however we are aware that we have served as the auditor of one or more Wells Fargo Funds investment companies since at least 1955.
Boston, Massachusetts
October 26, 2018
| | | | | | |
| Other information (unaudited) | | Wells Fargo Short-Term Bond Fund | | | 37 | |
TAX INFORMATION
For the fiscal year ended August 31, 2018, $6,694,700 has been designated as interest-related dividends for nonresident alien shareholders pursuant to Section 871 of the Internal Revenue Code.
PROXY VOTING INFORMATION
A description of the policies and procedures that the Fund uses to determine how to vote proxies relating to portfolio securities is available, upon request, by calling 1-800-222-8222, visiting our website at wellsfargofunds.com, or visiting the SEC website at sec.gov. Information regarding how the Fund voted proxies relating to portfolio securities during the most recent 12-month period ended June 30 is available on the Fund’s website at wellsfargofunds.com or by visiting the SEC website at sec.gov.
PORTFOLIO HOLDINGS INFORMATION
The complete portfolio holdings for the Fund are publicly available monthly on the Fund’s website (wellsfargofunds.com), on a one-month delayed basis. In addition, top ten holdings information (excluding derivative positions) for the Fund is publicly available on the Fund’s website on a monthly, seven-day or more delayed basis. The Fund files its complete schedule of portfolio holdings with the SEC for the first and third quarters of each fiscal year on Form N-Q, which is available by visiting the SEC website at sec.gov. In addition, the Fund’s Form N-Q may be reviewed and copied at the SEC’s Public Reference Room in Washington, DC, and at regional offices in New York City, at 233 Broadway, and in Chicago, at 175 West Jackson Boulevard, Suite 900. Information about the Public Reference Room may be obtained by calling 1-800-SEC-0330.
| | | | |
| 38 | | Wells Fargo Short-Term Bond Fund | | Other information (unaudited) |
BOARD OF TRUSTEES AND OFFICERS
Each of the Trustees and Officers1 listed in the table below acts in identical capacities for each fund in the Wells Fargo family of funds, which consists of 154 mutual funds comprising the Wells Fargo Funds Trust, Wells Fargo Variable Trust, Wells Fargo Master Trust and four closed-end funds (collectively the “Fund Complex”). This table should be read in conjunction with the Prospectus and the Statement of Additional Information2. The mailing address of each Trustee and Officer is 525 Market Street, 12th Floor, San Francisco, CA 94105. Each Trustee and Officer serves an indefinite term, however, each Trustee serves such term until reaching the mandatory retirement age established by the Trustees.
Independent Trustees
| | | | | | |
Name and
year of birth | | Position held and
length of service* | | Principal occupations during past five years or longer | | Current other
public company or
investment company
directorships |
William R. Ebsworth
(Born 1957) | | Trustee, since 2015 | | Retired. From 1984 to 2013, equities analyst, portfolio manager, research director and chief investment officer at Fidelity Management and Research Company in Boston, Tokyo, and Hong Kong, and retired in 2013 as Chief Investment Officer of Fidelity Strategic Advisers, Inc. where he led a team of investment professionals managing client assets. Prior thereto, Board member of Hong Kong Securities Clearing Co., Hong Kong Options Clearing Corp., the Thailand International Fund, Ltd., Fidelity Investments Life Insurance Company, and Empire Fidelity Investments Life Insurance Company. Board member of the Vincent Memorial Hospital Endowment (non-profit organization), where he serves on the Investment Committee and as a Chair of the Audit Committee. Mr. Ebsworth is a CFA® charterholder. | | N/A |
Jane A. Freeman
(Born 1953) | | Trustee, since 2015;
Chair Liaison,
since 2018 | | Retired. From 2012 to 2014 and 1999 to 2008, Chief Financial Officer of Scientific Learning Corporation. From 2008 to 2012, Ms. Freeman provided consulting services related to strategic business projects. Prior to 1999, Portfolio Manager at Rockefeller & Co. and Scudder, Stevens & Clark. Board member of the Harding Loevner Funds from 1996 to 2014, serving as both Lead Independent Director and chair of the Audit Committee. Board member of the Russell Exchange Traded Funds Trust from 2011 to 2012 and the chair of the Audit Committee. Ms. Freeman is a Board Member of The Ruth Bancroft Garden (non-profit organization). She is also an inactive Chartered Financial Analyst. | | N/A |
Isaiah Harris, Jr.
(Born 1952) | | Trustee, since 2009 | | Retired. Chairman of the Board of CIGNA Corporation since 2009, and Director since 2005. From 2003 to 2011, Director of Deluxe Corporation. Prior thereto, President and CEO of BellSouth Advertising and Publishing Corp. from 2005 to 2007, President and CEO of BellSouth Enterprises from 2004 to 2005 and President of BellSouth Consumer Services from 2000 to 2003. Emeritus member of the Iowa State University Foundation Board of Governors. Emeritus Member of the Advisory Board of Iowa State University School of Business. Advisory Board Member, Palm Harbor Academy (private school). Advisory Board Member, Child Evangelism Fellowship (non-profit). Mr. Harris is a certified public accountant (inactive status). | | CIGNA Corporation |
| Judith M. Johnson (Born 1949) | | Trustee, since 2008;
Audit Committee Chairman, since 2009 | | Retired. Prior thereto, Chief Executive Officer and Chief Investment Officer of Minneapolis Employees Retirement Fund from 1996 to 2008. Ms. Johnson is an attorney, certified public accountant and a certified managerial accountant. | | N/A |
David F. Larcker
(Born 1950) | | Trustee, since 2009 | | James Irvin Miller Professor of Accounting at the Graduate School of Business, Stanford University, Director of the Corporate Governance Research Initiative and Senior Faculty of The Rock Center for Corporate Governance since 2006. From 2005 to 2008, Professor of Accounting at the Graduate School of Business, Stanford University. Prior thereto, Ernst & Young Professor of Accounting at The Wharton School, University of Pennsylvania from 1985 to 2005. | | N/A |
| | | | | | |
| Other information (unaudited) | | Wells Fargo Short-Term Bond Fund | | | 39 | |
| | | | | | |
Name and
year of birth | | Position held and
length of service* | | Principal occupations during past five years or longer | | Current other
public company or
investment company
directorships |
Olivia S. Mitchell
(Born 1953) | | Trustee, since 2006; Governance Committee Chairman, since 2018 | | International Foundation of Employee Benefit Plans Professor, Wharton School of the University of Pennsylvania since 1993. Director of Wharton’s Pension Research Council and Boettner Center on Pensions & Retirement Research, and Research Associate at the National Bureau of Economic Research. Previously, Cornell University Professor from 1978 to 1993. | | N/A |
Timothy J. Penny
(Born 1951) | | Trustee, since 1996; Chairman, since 2018; Vice Chairman, from 2017 to 2018 | | President and Chief Executive Officer of Southern Minnesota Initiative Foundation, a non-profit organization, since 2007. Member of the Board of Trustees of NorthStar Education Finance, Inc., a non-profit organization, since 2007. | | N/A |
James G. Polisson
(Born 1959) | | Trustee, since 2018; Advisory Board Member, from 2017 to 2018 | | Retired. Chief Marketing Officer, Source (ETF) UK Services, Ltd, from 2015 to 2017. From 2012 to 2015, Principal of The Polisson Group, LLC, a management consulting, corporate advisory and principal investing company. Chief Executive Officer and Managing Director at Russell Investments, Global Exchange Traded Funds from 2010 to 2012. Managing Director of Barclays Global Investors from 1998 to 2010 and Global Chief Marketing Officer for iShares and Barclays Global Investors from 2000 to 2010. Trustee of the San Francisco Mechanics’ Institute, a non-profit organization, from 2013 to 2015. Board member of the Russell Exchange Traded Fund Trust from 2011 to 2012. Director of Barclays Global Investors Holdings Deutschland GmbH from 2006 to 2009. Mr. Polisson is an attorney and has a retired status with the Massachusetts and District of Columbia Bar Associations. | | N/A |
Michael S. Scofield
(Born 1943) | | Trustee, since 2010 | | Served on the Investment Company Institute’s Board of Governors and Executive Committee from 2008-2011 as well the Governing Council of the Independent Directors Council from 2006-2011 and the Independent Directors Council Executive Committee from 2008-2011. Trustee of the Evergreen Fund complex (and its predecessors) from 1984 to 2010. Chairman of the Evergreen Funds from 2000-2010. Former Trustee of the Mentor Funds. Retired Attorney, Law Offices of Michael S. Scofield. | | N/A |
Pamela Wheelock
(Born 1959) | | Trustee, since 2018; Advisory Board Member, from 2017 to 2018 | | Chief Operating Officer, Twin Cities Habitat for Humanity, since January, 2017. Vice President of University Services, University of Minnesota from 2012 to 2017. Prior thereto, on the Board of Directors, Governance Committee and Finance Committee for the Minnesota Philanthropy Partners (Saint Paul Foundation) from 2012 to 2018, Interim President and Chief Executive Officer of Blue Cross Blue Shield of Minnesota from 2010 to 2011, Chairman of the Board from 2009 to 2011 and Board Director from 2003 to 2015. Vice President, Leadership and Community Engagement, Bush Foundation, Saint Paul, Minnesota (a private foundation) from 2009 to 2011. Executive Vice President and Chief Financial Officer, Minnesota Sports and Entertainment from 2004 to 2009 and Senior Vice President from 2002 to 2004. Commissioner of Finance, State of Minnesota, from 1999 to 2002. Currently the Board Chair of the Minnesota Wild Foundation since 2010. | | N/A |
| * | Length of service dates reflect the Trustee’s commencement of service with the Trust’s predecessor entities, where applicable. |
| | | | |
| 40 | | Wells Fargo Short-Term Bond Fund | | Other information (unaudited) |
Officers
| | | | | | |
Name and
year of birth | | Position held and
length of service | | Principal occupations during past five years or longer | | |
Andrew Owen
(Born 1960) | | President, since 2017 | | Executive Vice President of Wells Fargo & Company and Head of Affiliated Managers, Wells Fargo Asset Management, since 2014. In addition, Mr. Owen is currently President, Chief Executive Officer and Director of Wells Fargo Funds Management, LLC since 2017. Prior thereto, Executive Vice President responsible for marketing, investments and product development for Wells Fargo Funds Management, LLC, from 2009 to 2014. | | |
Nancy Wiser1
(Born 1967) | | Treasurer, since 2012 | | Executive Vice President of Wells Fargo Funds Management, LLC since 2011. Chief Operating Officer and Chief Compliance Officer at LightBox Capital Management LLC, from 2008 to 2011. | | |
Alexander Kymn3
(Born 1973) | | Secretary, since 2018; Chief Legal Officer, since 2018 | | Senior Company Counsel of Wells Fargo Bank, N.A. since 2018 (previously Senior Counsel from 2007 to 2018). Vice President of Wells Fargo Funds Management, LLC from 2008 to 2014. | | |
Michael H. Whitaker
(Born 1967) | | Chief Compliance Officer, since 2016 | | Senior Vice President and Chief Compliance Officer since 2016. Senior Vice President and Chief Compliance Officer for Fidelity Investments from 2007 to 2016. | | |
David Berardi
(Born 1975) | | Assistant Treasurer, since 2009 | | Vice President of Wells Fargo Funds Management, LLC since 2009. Vice President of Evergreen Investment Management Company, LLC from 2008 to 2010. Manager of Fund Reporting and Control for Evergreen Investment Management Company, LLC from 2004 to 2010. | | |
Jeremy DePalma1
(Born 1974) | | Assistant Treasurer, since 2009 | | Senior Vice President of Wells Fargo Funds Management, LLC since 2009. Senior Vice President of Evergreen Investment Management Company, LLC from 2008 to 2010 and head of the Fund Reporting and Control Team within Fund Administration from 2005 to 2010. | | |
| 1 | Nancy Wiser acts as Treasurer of 77 funds in the Fund Complex. Jeremy DePalma acts as Treasurer of 77 funds and Assistant Treasurer of 77 funds in the Fund Complex. |
| 2 | The Statement of Additional Information includes additional information about the Trustees and is available, without charge, upon request, by calling 1-800-222-8222 or by visiting the website at wellsfargofunds.com. |
| 3 | Alexander Kymn became the Secretary and Chief Legal Officer effective April 17, 2018. |
| | | | | | |
| Other information (unaudited) | | Wells Fargo Short-Term Bond Fund | | | 41 | |
BOARD CONSIDERATION OF INVESTMENT MANAGEMENT AND SUB-ADVISORY AGREEMENTS:
Wells Fargo Short-Term Bond Fund
Under the Investment Company Act of 1940 (the “1940 Act”), the Board of Trustees (the “Board”) of Wells Fargo Funds Trust (the “Trust”) must determine annually whether to approve the continuation of the Trust’s investment management and sub-advisory agreements. In this regard, at an in-person meeting held on May 22-23, 2018 (the “Meeting”), the Board, all the members of which have no direct or indirect interest in the investment management and sub-advisory agreements and are not “interested persons” of the Trust, as defined in the 1940 Act (the “Independent Trustees”), reviewed and approved for Wells Fargo Short-Term Bond Fund (the “Fund”): (i) an investment management agreement (the “Management Agreement”) with Wells Fargo Funds Management, LLC (“Funds Management”); and (ii) an investment sub-advisory agreement (the “Sub-Advisory Agreement”) with Wells Capital Management Incorporated (the “Sub-Adviser”), an affiliate of Funds Management. The Management Agreement and the Sub-Advisory Agreement are collectively referred to as the “Advisory Agreements.”
At the Meeting, the Board considered the factors and reached the conclusions described below relating to the selection of Funds Management and the Sub-Adviser and the approval of the Advisory Agreements. Prior to the Meeting, including at an in-person meeting in April 2018, the Trustees conferred extensively among themselves and with representatives of Funds Management about these matters. Also, the Board has adopted a team-based approach, with each team consisting of a sub-set of Trustees, to assist the full Board in the discharge of its duties in reviewing investment performance and other matters throughout the year. The Independent Trustees were assisted in their evaluation of the Advisory Agreements by independent legal counsel, from whom they received separate legal advice and with whom they met separately.
In providing information to the Board, Funds Management and the Sub-Adviser were guided by a detailed set of requests for information submitted to them by independent legal counsel on behalf of the Independent Trustees at the start of the Board’s annual contract renewal process earlier in 2018. In considering and approving the Advisory Agreements, the Trustees considered the information they believed relevant, including but not limited to the information discussed below. The Board considered not only the specific information presented in connection with the Meeting, but also the knowledge gained over time through interaction with Funds Management and the Sub-Adviser about various topics. In this regard, the Board reviewed reports of Funds Management at each of its quarterly meetings, which included, among other things, portfolio reviews and investment performance reports. In addition, the Board and the teams mentioned above confer with portfolio managers at various times throughout the year. The Board did not identify any particular information or consideration that was all-important or controlling, and each individual Trustee may have attributed different weights to various factors.
After its deliberations, the Board unanimously approved the continuation of the Advisory Agreements for a one-year term and determined that the compensation payable to Funds Management and the Sub-Adviser under each of the Advisory Agreements was reasonable. The Board considered the approval of the Advisory Agreements for the Fund as part of its consideration of agreements for funds across the complex, but its approvals were made on a fund-by-fund basis. The following summarizes a number of important, but not necessarily all, factors considered by the Board in support of its approvals.
Nature, extent and quality of services
The Board received and considered various information regarding the nature, extent and quality of services provided to the Fund by Funds Management and the Sub-Adviser under the Advisory Agreements. This information included a description of the investment advisory services and Fund-level administrative services covered by the Management Agreement, as well as, among other things, a summary of the background and experience of senior management of Wells Fargo Asset Management (“WFAM”), of which Funds Management and the Sub-Adviser are a part, a summary of investments made in the business of WFAM, a summary of certain organizational and personnel changes involving Funds Management and the Sub-Adviser, and a description of Funds Management’s and the Sub-Adviser’s business continuity planning programs and of their approaches to data privacy and cybersecurity. The Board also considered the qualifications, background, tenure and responsibilities of each of the portfolio managers primarily responsible for the day-to-day portfolio management of the Fund.
The Board evaluated the ability of Funds Management and the Sub-Adviser to attract and retain qualified investment professionals, including research, advisory and supervisory personnel. The Board further considered the compliance programs and compliance records of Funds Management and the Sub-Adviser. In addition, the Board took into account the full range of services provided to the Fund by Funds Management and its affiliates.
| | | | |
| 42 | | Wells Fargo Short-Term Bond Fund | | Other information (unaudited) |
Fund investment performance and expenses
The Board considered the investment performance results for the Fund over various time periods ended December 31, 2017. The Board considered these results in comparison to the investment performance of funds in a universe that was determined by Broadridge Inc. (“Broadridge”) to be similar to the Fund (the “Universe”), and in comparison to the Fund’s benchmark index and to other comparative data. Broadridge is an independent provider of investment company data. The Board received a description of the methodology used by Broadridge to select the mutual funds in the performance Universe. The Board noted that the investment performance of the Fund (Class A) was higher than or in range of the average investment performance of the Universe for the three-, five-, and ten-year periods under review, but lower than the average investment performance of the Universe for the one-year period under review. The Board also noted that the investment performance of the Fund was higher than its benchmark index, the Bloomberg Barclays 1-3 Year US Government/Credit Index, for all periods under review.
The Board also received and considered information regarding the Fund’s net operating expense ratios and their various components, including actual management fees, custodian and other non-management fees, and Rule 12b-1 and non-Rule 12b-1 shareholder service fees. The Board considered these ratios in comparison to the median ratios of funds in class-specific expense groups that were determined by Broadridge to be similar to the Fund (the “Groups”). The Board received a description of the methodology used by Broadridge to select the mutual funds in the expense Groups and an explanation of how funds comprising expense groups and their expense ratios may vary from year-to-year. Based on the Broadridge reports, the Board noted that the net operating expense ratios of the Fund were lower than the median net operating expense ratios of the expense Groups for each share class.
The Board took into account the Fund’s investment performance and expense information provided to it among the factors considered in deciding to re-approve the Advisory Agreements.
Investment management and sub-advisory fee rates
The Board reviewed and considered the contractual fee rates payable by the Fund to Funds Management under the Management Agreement, as well as the contractual fee rates payable by the Fund to Funds Management for class-level administrative services under a Class-Level Administration Agreement, which include, among other things, class-level transfer agency and sub-transfer agency costs (collectively, the “Management Rates”). The Board also reviewed and considered the contractual investment sub-advisory fee rates that are payable by Funds Management to the Sub-Adviser for investment sub-advisory services.
Among other information reviewed by the Board was a comparison of the Fund’s Management Rates with the average contractual investment management fee rates of funds in the expense Groups at a common asset level as well as transfer agency costs of the funds in the expense Groups. The Board noted that the Management Rates of the Fund were lower than the sum of these average rates for the Fund’s expense Groups for all share classes.
The Board also received and considered information about the portion of the total management fee that was retained by Funds Management after payment of the fee to the Sub-Adviser for sub-advisory services. In assessing the reasonableness of this amount, the Board received and evaluated information about the nature and extent of responsibilities retained and risks assumed by Funds Management and not delegated to or assumed by the Sub-Adviser, and about Funds Management’s on-going oversight services. Given the affiliation between Funds Management and the Sub-Adviser, the Board ascribed limited relevance to the allocation of fees between them.
The Board also received and considered information about the nature and extent of services offered and fee rates charged by Funds Management and the Sub-Adviser to other types of clients with investment strategies similar to those of the Fund. In this regard, the Board received information about the significantly greater scope of services, and compliance, reporting and other legal burdens and risks of managing mutual funds compared with those associated with managing assets of non-mutual fund clients such as institutional separate accounts.
Based on its consideration of the factors and information it deemed relevant, including those described here, the Board determined that the compensation payable to Funds Management under the Management Agreement and to the Sub-Adviser under the Sub-Advisory Agreement was reasonable.
Profitability
The Board received and considered information concerning the profitability of Funds Management, as well as the profitability of both WFAM and Wells Fargo & Co. (“Wells Fargo”) as a whole, from providing services to the Fund and the fund family as a whole. The Board noted that the Sub-Adviser’s profitability information with respect to providing services to the Fund was subsumed in the WFAM and Wells Fargo profitability analysis.
| | | | | | |
| Other information (unaudited) | | Wells Fargo Short-Term Bond Fund | | | 43 | |
Funds Management reported on the methodologies and estimates used in calculating profitability, including a description of the methodology used to allocate certain expenses and recent enhancements made to the methodology. Among other things, the Board noted that the levels of profitability reported on a fund-by-fund basis varied widely, depending on factors such as the size and type of fund. Based on its review, the Board did not deem the profits reported by Funds Management, WFAM or Wells Fargo from services provided to the Fund to be at a level that would prevent it from approving the continuation of the Advisory Agreements.
Economies of scale
The Board considered the extent to which Funds Management may experience economies of scale in the provision of management services, and the extent to which scale benefits, if any, would be shared with shareholders. In particular, the Board noted the existence of breakpoints in the Fund’s management fee structure, which operate generally to reduce the Fund’s expense ratios as the Fund grows in size. It considered that, for a small fund or a fund that shrinks in size, breakpoints conversely can result in higher fee levels. The Board also considered that in addition to management fee breakpoints, competitive management fee rates set at the outset without regard to breakpoints and fee waiver and expense reimbursement arrangements, as well as investments in the business intended to enhance services available to Fund shareholders, are means of sharing potential economies of scale with shareholders of the Fund.
The Board concluded that the Fund’s fee and expense arrangements, including contractual breakpoints, constituted a reasonable approach to sharing potential economies of scale with the Fund and its shareholders.
Other benefits to Funds Management and the Sub-Adviser
The Board received and considered information regarding potential “fall-out” or ancillary benefits received by Funds Management and its affiliates, including the Sub-Adviser, as a result of their relationships with the Fund. Ancillary benefits could include, among others, benefits directly attributable to other relationships with the Fund and benefits potentially derived from an increase in Funds Management’s and the Sub-Adviser’s business as a result of their relationships with the Fund. The Board noted that various affiliates of Funds Management may receive distribution-related fees, shareholder servicing payments and sub-transfer agency fees in respect of shares sold or held through them and services provided.
The Board also reviewed information about soft dollar credits earned and utilized by the Sub-Adviser, fees earned by Funds Management and the Sub-Adviser from managing a private investment vehicle for the fund family’s securities lending collateral and commissions earned by an affiliated broker from portfolio transactions.
Based on its consideration of the factors and information it deemed relevant, including those described here, the Board did not find that any ancillary benefits received by Funds Management and its affiliates, including the Sub-Adviser, were unreasonable.
Conclusion
At the Meeting, after considering the above-described factors and based on its deliberations and its evaluation of the information described above, the Board unanimously approved the continuation of the Advisory Agreements for a one-year term and determined that the compensation payable to Funds Management and the Sub-Adviser under each of the Advisory Agreements was reasonable.
| | | | |
| 44 | | Wells Fargo Short-Term Bond Fund | | Appendix A (unaudited) |
SALES CHARGE REDUCTIONS AND WAIVERS FOR CERTAIN INTERMEDIARIES
Ameriprise
Effective June 1, 2018, shareholders purchasing Fund shares through an Ameriprise Financial platform or account will be eligible only for the following Class A load waivers (front-end sales charge waivers), which may differ from those disclosed elsewhere in the Fund’s prospectus or Statement of Additional Information.
Front-end Sales Load Waivers on Class A Shares Available at Ameriprise Financial
| | • | | Employer-sponsored retirement plans (e.g., 401(k) plans, 457 plans, employer-sponsored 403(b) plans, profit sharing and money purchase pension plans and defined benefit plans). For purposes of this provision, employer-sponsored retirement plans do not include SEP IRAs, Simple IRAs or SAR-SEPs. |
| | • | | Shares purchased through an Ameriprise Financial investment advisory program (if an Advisory or similar share class for such investment advisory program is not available) |
| | • | | Shares purchased by third party investment advisors on behalf of their advisory clients through Ameriprise Financial’s platform (if an Advisory or similar share class for such investment advisory program is not available) |
| | • | | Shares purchased through reinvestment of distributions and dividend reinvestment when purchasing shares of the same Fund (but not any other fund within the same fund family) |
| | • | | Shares exchanged from Class C shares of the same fund in the month of or following the 10-year anniversary of the purchase date. To the extent that the Fund’s prospectus elsewhere provides for a waiver with respect to such shares following a shorter holding period, that waiver will apply to exchanges following such shorter period. To the extent that the Fund’s prospectus elsewhere provides for a waiver with respect to exchanges of Class C shares for load-waived shares, that waiver will also apply to such exchanges. |
| | • | | Employees and registered representatives of Ameriprise Financial or its affiliates and their immediate family members |
| | • | | Shares purchased by or through qualified accounts (including IRAs, Coverdell Education Savings Accounts, 401(k)s, 403(b) TSCAs subject to ERISA and defined benefit plans) that are held by a covered family member, defined as an Ameriprise financial advisor and/or the advisor’s spouse, advisor’s lineal ascendant (mother, father, grandmother, grandfather, great grandmother, great grandfather), advisor’s lineal descendant (son, step-son, daughter, step-daughter, grandson, granddaughter, great grandson, great granddaughter) or any spouse of a covered family member who is a lineal descendant |
| | • | | Shares purchased from the proceeds of redemptions within the same fund family, provided (1) the repurchase occurs within 90 days following the redemption, (2) the redemption and purchase occur in the same account, and (3) redeemed shares were subject to a front-end or deferred sales load (i.e. Rights of Reinstatement). Subject to the Fund’s policy regarding frequent purchases and redemptions of Fund shares, you may not be able to repurchase shares for the first 30 days after your redemption. |
Automatic Exchange of Class C Shares Available at Ameriprise Financial
| | • | | Class C shares will automatically exchange to Class A shares in the month of the 10-year anniversary of the purchase date. |
Merrill Lynch
Effective April 10, 2017, shareholders purchasing Fund shares through a Merrill Lynch platform or account will be eligible only for the following load waivers (front-end sales charge waivers and contingent deferred, or back-end, sales charge waivers) and discounts, which may differ from those disclosed elsewhere in the Fund’s prospectus or Statement of Additional Information.
Front-end Sales Load Waivers on Class A Shares available at Merrill Lynch
| | • | | Employer-sponsored retirement, deferred compensation and employee benefit plans (including health savings accounts) and trusts used to fund those plans, provided that the shares are not held in a commission-based brokerage account and shares are held for the benefit of the plan |
| | • | | Shares purchased by or through a 529 Plan |
| | • | | Shares purchased through a Merrill Lynch affiliated investment advisory program |
| | | | | | |
| Appendix A (unaudited) | | Wells Fargo Short-Term Bond Fund | | | 45 | |
| | • | | Shares purchased by third party investment advisors on behalf of their advisory clients through Merrill Lynch’s platform |
| | • | | Shares of funds purchased through the Merrill Edge Self-Directed platform (if applicable) |
| | • | | Shares purchased through reinvestment of capital gains distributions and dividend reinvestment when purchasing shares of the same fund (but not any other fund within the fund family) |
| | • | | Shares exchanged from Class C (i.e. level-load) shares of the same fund in the month of or following the 10-year anniversary of the purchase date |
| | • | | Employees and registered representatives of Merrill Lynch or its affiliates and their family members, as defined by Merrill Lynch, which may differ from the definition of family member in the Fund’s prospectus. |
| | • | | Directors or Trustees of the Fund, and employees of the Fund’s investment adviser or any of its affiliates, as described in the Fund’s prospectus |
| | • | | Shares purchased from the proceeds of redemptions within the same fund family, provided (1) the repurchase occurs within 90 days following the redemption, (2) the redemption and purchase occur in the same account, and (3) redeemed shares were subject to a front-end or deferred sales load (known as Rights of Reinstatement). Subject to the Fund’s policy regarding frequent purchases and redemptions of Fund shares, you may not be able to repurchase shares for the first 30 days after your redemption. |
CDSC Waivers on A, B and C Shares available at Merrill Lynch
| | • | | Death or disability of the shareholder |
| | • | | Shares sold as part of a systematic withdrawal plan as described in the Fund’s prospectus |
| | • | | Return of excess contributions from an IRA Account |
| | • | | Shares sold as part of a required minimum distribution for IRA and retirement accounts due to the shareholder reaching age 70½ |
| | • | | Shares sold to pay Merrill Lynch fees but only if the transaction is initiated by Merrill Lynch |
| | • | | Shares acquired through a right of reinstatement |
| | • | | Shares held in retirement brokerage accounts, that are exchanged for a lower cost share class due to transfer to certain fee based accounts or platforms (applicable to A and C shares only) |
Front-end load Discounts Available at Merrill Lynch: Breakpoints, Rights of Accumulation & Letters of Intent
| | • | | Breakpoints as described in the Fund’s prospectus |
| | • | | Rights of Accumulation (ROA) which entitle shareholders to breakpoint discounts will be automatically calculated based on the aggregated holding of fund family assets held by accounts within the purchaser’s household at Merrill Lynch. Eligible fund family assets not held at Merrill Lynch may be included in the ROA calculation only if the shareholder notifies his or her financial advisor about such assets. |
| | • | | Letters of Intent (LOI) which allow for breakpoint discounts based on anticipated purchases within a fund family, through Merrill Lynch, over a 13-month period of time (if applicable) |
Morgan Stanley
Effective on or about July 1, 2018, shareholders purchasing Fund shares through a Morgan Stanley Wealth Management transactional brokerage account will be eligible only for the following Class A load waivers (front-end sales charge waivers), which may differ from and be more limited than those disclosed in the Fund’s prospectus or Statement of Additional Information.
Front-end Sales Load Waivers on Class A Shares Available at Morgan Stanley
| | • | | Employer-sponsored retirement plans (e.g., 401(k) plans, 457 plans, employer-sponsored 403(b) plans, profit sharing and money purchase pension plans and defined benefit plans). For purposes of this provision, employer-sponsored retirement plans do not include SEP IRAs, Simple IRAs, SAR-SEPs or Keogh plans. |
| | • | | Morgan Stanley employee and employee-related accounts according to Morgan Stanley’s account linking rules |
| | • | | Shares purchased through reinvestment of dividends and capital gains distributions when purchasing shares of the same fund |
| | | | |
| 46 | | Wells Fargo Short-Term Bond Fund | | Appendix A (unaudited) |
| | • | | Shares purchased through a Morgan Stanley self-directed brokerage account |
| | • | | Class C (i.e., level-load) shares that are no longer subject to a contingent deferred sales charge and are exchanged to Class A shares of the same fund pursuant to Morgan Stanley Wealth Management’s share class exchange program. |
| | • | | Shares purchased from the proceeds of redemptions within the same fund family, provided (i) the repurchase occurs within 90 days following the redemption, (ii) the redemption and purchase occur in the same account, and (iii) redeemed shares were subject to a front-end or deferred sales charge. This waiver is subject to the Fund’s policy regarding frequent purchases and redemption of Fund shares, as discussed under “Account Information—Frequent Purchases and Redemptions of Fund Shares” in the Fund’s prospectus. |
This page is intentionally left blank.
This page is intentionally left blank.

For more information
More information about Wells Fargo Funds is available free upon request. To obtain literature, please write, visit the Fund’s website, or call:
Wells Fargo Funds
P.O. Box 219967
Kansas City, MO 64121-9967
Website: wellsfargofunds.com
Individual investors: 1-800-222-8222
Retail investment professionals: 1-888-877-9275
Institutional investment professionals: 1-866-765-0778
This report and the financial statements contained herein are submitted for the general information of the shareholders of the Fund. If this report is used for promotional purposes, distribution of the report must be accompanied or preceded by a current prospectus. Before investing, please consider the investment objectives, risks, charges, and expenses of the investment. For a current prospectus and, if available, a summary prospectus, containing this information, call 1-800-222-8222 or visit the Fund’s website at wellsfargofunds.com. Read the prospectus carefully before you invest or send money.
Wells Fargo Asset Management (WFAM) is the trade name for certain investment advisory/management firms owned by Wells Fargo & Company. These firms include but are not limited to Wells Capital Management Incorporated and Wells Fargo Funds Management, LLC. Certain products managed by WFAM entities are distributed by Wells Fargo Funds Distributor, LLC (a broker/dealer and Member FINRA).
This material is for general informational and educational purposes only and is NOT intended to provide investment advice or a recommendation of any kind—including a recommendation for any specific investment, strategy, or plan.
NOT FDIC INSURED ◾ NO BANK GUARANTEE ◾ MAY LOSE VALUE
© 2018 Wells Fargo Funds Management, LLC. All rights reserved.
| | |
 | | 315409 10-18 A221/AR221 08-18 |
Annual Report
August 31, 2018

Wells Fargo Short-Term High Yield Bond Fund


Reduce clutter. Save trees.
Sign up for electronic delivery of prospectuses and shareholder reports at wellsfargo.com/advantagedelivery
Contents
The views expressed and any forward-looking statements are as of August 31, 2018, unless otherwise noted, and are those of the Fund managers and/or Wells Fargo Funds Management, LLC. Discussions of individual securities, or the markets generally, or any Wells Fargo Fund are not intended as individual recommendations. Future events or results may vary significantly from those expressed in any forward-looking statements. The views expressed are subject to change at any time in response to changing circumstances in the market. Wells Fargo Funds Management, LLC and the Fund disclaim any obligation to publicly update or revise any views expressed or forward-looking statements.
NOT FDIC INSURED ◾ NO BANK GUARANTEE ◾ MAY LOSE VALUE
| | | | |
| 2 | | Wells Fargo Short-Term High Yield Bond Fund | | Letter to shareholders (unaudited) |

Andrew Owen
President
Wells Fargo Funds
After advancing during 2017, economic growth and stock markets globally diverged during the first eight months of 2018.
Dear Shareholder:
We are pleased to offer you this annual report for the Wells Fargo Short-Term High Yield Bond Fund for the 12-month period that ended August 31, 2018. After advancing during 2017, economic growth and stock markets globally diverged during the first eight months of 2018. For fixed-income investors, taxable bond returns suffered and high-yield and municipal bond returns were positive.
For the period, U.S. stocks, as measured by the S&P 500 Index,1 gained 19.66%, and international stocks, as measured by the MSCI ACWI ex USA Index (Net),2 added 3.18%. Based on the MSCI EM Index (Net),3 emerging market stocks lost 0.68%. For bond investors, the Bloomberg Barclays U.S. Aggregate Bond Index4 declined 1.05% while the Bloomberg Barclays Global Aggregate ex-USD Index5 fell 1.64%. The Bloomberg Barclays Municipal Bond Index6 added 0.49%, and the ICE BofAML U.S. High Yield Index7 was up 3.26%.
Continued optimism in the U.S. characterized the fourth quarter of 2017.
Some observers described economic conditions in late 2017 as a Goldilocks scenario: synchronized global growth, low inflation, healthy corporate earnings, and a weaker U.S. dollar that supported international growth. During the quarter, the U.S. Bureau of Economic Analysis reported that annualized U.S. gross domestic product (GDP) growth for the third quarter of 2017 was 2.8% and inflation remained below U.S. Federal Reserve (Fed) targets. U.S. corporate earnings and consumer confidence improved.
Economic momentum increased in Europe. The Bank of England (BOE) raised interest rates in November 2017 to 0.50%, the first increase in more than 10 years, indicating confidence in the economy’s growth potential. Meanwhile, the European Central Bank and the Bank of Japan kept interest rates low to spur business activities and bought bonds in an effort to encourage equity investments. The People’s Bank of China’s (PBOC’s) policies sought to stimulate business. Many emerging market economies benefited from stronger currencies versus the U.S. dollar, while commodity price increases benefited countries that rely on natural resources for exports.
| 1 | The S&P 500 Index consists of 500 stocks chosen for market size, liquidity, and industry group representation. It is a market-value-weighted index with each stock’s weight in the index proportionate to its market value. You cannot invest directly in an index. |
| 2 | The Morgan Stanley Capital International (MSCI) All Country World Index (ACWI) ex USA Index (Net) is a free-float-adjusted market-capitalization-weighted index that is designed to measure the equity market performance of developed markets, excluding the United States and Canada. Source: MSCI. MSCI makes no express or implied warranties or representations and shall have no liability whatsoever with respect to any MSCI data contained herein. The MSCI data may not be further redistributed or used as a basis for other indices or any securities or financial products. This report is not approved, reviewed, or produced by MSCI. You cannot invest directly in an index. |
| 3 | The MSCI Emerging Markets (EM) Index (Net) is a free-float-adjusted market-capitalization-weighted index that is designed to measure large- and mid-cap equity market performance of emerging markets. The MSCI EM Index (Net) consists of the following 24 emerging market country indices: Brazil, Chile, China, Colombia, Czech Republic, Egypt, Greece, Hungary, India, Indonesia, Korea, Malaysia, Mexico, Pakistan, Peru, the Philippines, Poland, Qatar, Russia, South Africa, Taiwan, Thailand, Turkey, and the United Arab Emirates. You cannot invest directly in an index. |
| 4 | The Bloomberg Barclays U.S. Aggregate Bond Index is a broad-based benchmark that measures the investment-grade, U.S. dollar-denominated, fixed-rate taxable bond market, including Treasuries, government-related and corporate securities, mortgage-backed securities (agency fixed-rate and hybrid adjustable-rate mortgage pass-throughs), asset-backed securities, and commercial mortgage-backed securities. You cannot invest directly in an index. |
| 5 | The Bloomberg Barclays Global Aggregate ex-USD Index is an unmanaged index that provides a broad-based measure of the global investment-grade fixed-income markets excluding the U.S. dollar-denominated debt market. You cannot invest directly in an index. |
| 6 | The Bloomberg Barclays Municipal Bond Index is an unmanaged index composed of long-term tax-exempt bonds with a minimum credit rating of Baa. You cannot invest directly in an index. |
| 7 | The ICE BofAML U.S. High Yield Index is a market-capitalization-weighted index of domestic and Yankee high-yield bonds. The index tracks the performance of high-yield securities traded in the U.S. bond market. You cannot invest directly in an index. Copyright 2018. ICE Data Indices, LLC. All rights reserved. |
| | | | | | |
| Letter to shareholders (unaudited) | | Wells Fargo Short-Term High Yield Bond Fund | | | 3 | |
Volatility reemerged during the first quarter of 2018 as global tensions and inflation fears increased.
Stock market gains in January 2018 followed the passage of lower U.S. tax rates. Some investors then grew concerned about trade, particularly between the U.S. and China, and the specter of inflation. The Fed followed its 25-basis-point (bp; 100 bps equal 1.00%) federal funds rate increase in December 2017 with a further 25-bp increase in March 2018. The inflation rate in March reached the Fed’s 2% target for the first time in a year.
The S&P 500 Index closed the first quarter with a negative return, the first negative quarterly return for the index since 2014. Overseas investment markets reversed strong returns in 2017, hurt by a stronger U.S. dollar and mounting trade and diplomatic tensions. After gaining 27.19% for the 12-month period that ended December 31, 2017, the MSCI ACWI ex USA Index (Net) declined 1.81% for the quarter that ended March 31, 2018.
Global trade tensions escalated during the second quarter.
Global trade tensions escalated throughout the second quarter of 2018. The U.S. government imposed tariffs, and foreign governments in North America, Europe, and Asia retaliated. The escalating tensions chilled investment activity as observers awaited signals of next steps.
Meanwhile, inflation continued an upward trend. The CPI-U8 added 0.1% in June after increases of 0.2% in both April and May. On a year-over-year basis, the all-items index rose 2.9% for the 12 months that ended June 30, 2018. The index for all items less food and energy rose 2.3% for the same 12-month period.
U.S. stocks gained while international stocks and bonds declined during the summer of 2018.
The U.S. economy strengthened during the summer months. Revised second-quarter GDP data released in August showed the U.S. economy growing at a 4.2% rate. After ticking up slightly in June, the unemployment rate in the U.S. was 3.9% in July and August, according to the U.S. Department of Labor. Wages showed more consistent growth than they had in recent quarters, and consumer confidence remained strong.
Several U.S. equity market indices reached records during August, with the S&P 500 Index gaining 7.76% for the three-month period that ended August 31, 2018. International stock values continued to suffer under the effects of a strong U.S. dollar and continuing trade tensions. The MSCI ACWI ex USA Index (Net) and the MSCI EM Index (Net) were down 4.70% and 1.64%, respectively, during the same three-month period.
The Fed increased the federal funds rate in June, and expectations grew that two more rate increases were in the offing in 2018. Long-term interest rates in the U.S. remained at higher levels relative to the prior 10 years. Rates on 10-year and 30-year Treasury bonds—2.46% and 2.81%, respectively, on January 1, 2018—were 2.86% and 3.02%, respectively, on August 31, off their peak levels on May 17, 2018, of 3.11% and 3.25%, respectively. Some investors became more aware of and concerned about the potential for an inverted yield curve—sometimes a recession signal—as short-term rates increased more quickly than long-term rates. The Fed decided to forgo an interest rate increase at its August meeting.
The S&P 500 Index closed the first quarter with a negative return, the first negative quarterly return for the index since 2014.
| 8 | The Consumer Price Index for All Urban Consumers (CPI-U) measures the changes in the price of a basket of goods and services purchased by urban consumers. The urban consumer population is deemed by many as a better representative measure of the general public because close to 90% of the country’s population lives in highly populated areas. You cannot invest directly in an index. |
| | | | |
| 4 | | Wells Fargo Short-Term High Yield Bond Fund | | Letter to shareholders (unaudited) |
Internationally, members of Prime Minister Theresa May’s U.K./Brexit negotiating team resigned amid unproductive negotiations. In early August, the BOE’s Monetary Policy Committee increased its key interest rate to 0.75%. Central banks in Europe and Japan maintained low interest rates and accommodative monetary policies. Amid rising trade uncertainty, the PBOC cut reserve requirement ratios and accelerated infrastructure spending and tax cuts for business enterprises and individuals. Nevertheless, a strengthening U.S. dollar and the trade tensions remained headwinds for investors overseas.
Don’t let short-term uncertainty derail long-term investment goals.
Periods of investment uncertainty can present challenges, but experience has taught us that maintaining long-term investment goals can be an effective way to plan for the future. To help you create a sound strategy based on your personal goals and risk tolerance, Wells Fargo Funds offers more than 100 mutual funds spanning a wide range of asset classes and investment styles. Although diversification cannot guarantee an investment profit or prevent losses, we believe it can be an effective way to manage investment risk and potentially smooth out overall portfolio performance. We encourage investors to know their investments and to understand that appropriate levels of risk-taking may unlock opportunities.
Thank you for choosing to invest with Wells Fargo Funds. We appreciate your confidence in us and remain committed to helping you meet your financial needs.
Sincerely,

Andrew Owen
President
Wells Fargo Funds
Notice to shareholders
At a meeting held on August 14-15, 2018, the Board of Trustees of the Fund approved the following policy which will be effective on or about February 5, 2019:
Class C shares will convert automatically into Class A shares ten years after the initial date of purchase or, if you acquired your Class C shares through an exchange or conversion from another share class, ten years after the date you acquired your Class C shares. When Class C shares that you acquired through a purchase or exchange convert, any other Class C shares that you purchased with reinvested dividends and distributions also will convert into Class A shares on a pro rata basis. A shorter holding period may also apply depending on your intermediary. Please see “Appendix A—Sales Charge Reductions and Waivers for Certain Intermediaries” in the Fund’s prospectus or at the end of this report.
For further information about your Fund, contact your investment professional, visit our website at wellsfargofunds.com, or call us directly at 1-800-222-8222.
This page is intentionally left blank.
| | | | |
| 6 | | Wells Fargo Short-Term High Yield Bond Fund | | Performance highlights (unaudited) |
Investment objective
The Fund seeks total return, consisting of a high level of current income and capital appreciation.
Manager
Wells Fargo Funds Management, LLC
Subadviser
Wells Capital Management Incorporated
Portfolio managers
Kevin J. Maas, CFA®
Thomas M. Price, CFA®
Michael J. Schueller, CFA®
Average annual total returns (%) as of August 31, 20181
| | | | | | | | | | | | | | | | | | | | | | | | | | | | | | | | | | |
| | | | | Including sales charge | | | Excluding sales charge | | | Expense ratios2 (%) | |
| | | Inception date | | 1 year | | | 5 year | | | 10 year | | | 1 year | | | 5 year | | | 10 year | | | Gross | | | Net3 | |
| Class A (SSTHX) | | 2-29-2000 | | | (1.06 | ) | | | 1.92 | | | | 3.39 | | | | 2.00 | | | | 2.54 | | | | 3.70 | | | | 0.93 | | | | 0.82 | |
| Class C (WFHYX) | | 3-31-2008 | | | 0.36 | | | | 1.81 | | | | 2.93 | | | | 1.36 | | | | 1.81 | | | | 2.93 | | | | 1.68 | | | | 1.57 | |
| Administrator Class (WDHYX) | | 7-30-2010 | | | – | | | | – | | | | – | | | | 2.16 | | | | 2.73 | | | | 3.83 | | | | 0.87 | | | | 0.66 | |
| Institutional Class (STYIX) | | 11-30-2012 | | | – | | | | – | | | | – | | | | 2.31 | | | | 2.89 | | | | 3.90 | | | | 0.60 | | | | 0.51 | |
| ICE BofAML High Yield U.S. Corporates, Cash Pay, BB Rated, 1-5 Year Index4 | | – | | | – | | | | – | | | | – | | | | 2.04 | | | | 4.52 | | | | 6.97 | | | | – | | | | – | |
Figures quoted represent past performance, which is no guarantee of future results, and do not reflect taxes that a shareholder may pay on fund distributions or the redemption of fund shares. Investment return and principal value of an investment will fluctuate so that an investor’s shares, when redeemed, may be worth more or less than their original cost. Performance shown without sales charges would be lower if sales charges were reflected. Current performance may be lower or higher than the performance data quoted, which assumes the reinvestment of dividends and capital gains. Current month-end performance is available on the Fund’s website, wellsfargofunds.com.
Index returns do not include transaction costs associated with buying and selling securities, any mutual fund fees or expenses, or any taxes. It is not possible to invest directly in an index.
For Class A shares, the maximum front-end sales charge is 3.00%. For Class C shares, the maximum contingent deferred sales charge is 1.00%. Performance including a contingent deferred sales charge assumes the sales charge for the corresponding time period. Administrator Class and Institutional Class shares are sold without a front-end sales charge or contingent deferred sales charge.
Bond values fluctuate in response to the financial condition of individual issuers, general market and economic conditions, and changes in interest rates. Changes in market conditions and government policies may lead to periods of heightened volatility in the bond market and reduced liquidity for certain bonds held by the Fund. In general, when interest rates rise, bond values fall and investors may lose principal value. Interest rate changes and their impact on the Fund and its share price can be sudden and unpredictable. High-yield securities have a greater risk of default and tend to be more volatile than higher-rated debt securities. Loans are subject to risks similar to those associated with other below-investment-grade bond investments, such as credit risk (for example, risk of issuer default), below-investment-grade bond risk (for example, risk of greater volatility in value), and risk that the loan may become illiquid or difficult to price. The use of derivatives may reduce returns and/or increase volatility. Certain investment strategies tend to increase the total risk of an investment (relative to the broader market). The Fund is exposed to foreign investment risk. Consult the Fund’s prospectus for additional information on these and other risks.
Please see footnotes on page 7.
| | | | | | |
| Performance highlights (unaudited) | | Wells Fargo Short-Term High Yield Bond Fund | | | 7 | |
|
| Growth of $10,000 investment as of August 31, 20185 |
|
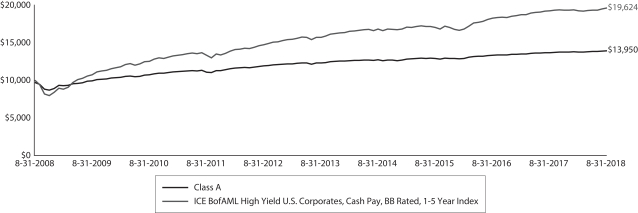 |
| 1 | Historical performance shown for Administrator Class shares prior to their inception reflects the performance of Class A shares and includes the higher expenses applicable to Class A shares. If these expenses had not been included, returns for Administrator Class shares would be higher. Historical performance shown for Institutional Class shares prior to their inception reflects the performance of Administrator Class shares and includes the higher expenses applicable to Administrator Class shares. If these expenses had not been included, returns for Institutional Class shares would be higher. |
| 2 | Reflects the expense ratios as stated in the most recent prospectuses, which include the impact of 0.01% in acquired fund fees and expenses. The expense ratios shown are subject to change and may differ from the annualized expense ratios shown in the financial highlights of this report, which do not include acquired fund fees and expenses. |
| 3 | The manager has contractually committed through December 31, 2018, to waive fees and/or reimburse expenses to the extent necessary to cap the Fund’s Total Annual Fund Operating Expenses After Fee Waivers at 0.81% for Class A, 1.56% for Class C, 0.65% for Administrator Class, and 0.50% for Institutional Class. After this time, the cap may be increased or the commitment to maintain the cap may be terminated only with the approval of the Board of Trustees. Brokerage commissions, stamp duty fees, interest, taxes, acquired fund fees and expenses (if any), and extraordinary expenses are excluded from the expense cap. Without this cap, the Fund’s returns would have been lower. The expense ratio paid by an investor is the net expense ratio (the total annual fund operating expenses after fee waivers) as stated in the prospectuses. |
| 4 | The ICE BofAML High Yield U.S. Corporates, Cash Pay, BB Rated, 1-5 Year Index is an unmanaged index that generally tracks the performance of BB rated U.S. dollar-denominated corporate bonds publicly issued in the U.S. domestic market with maturities of one to five years. You cannot invest directly in an index. Copyright 2018. ICE Data Indices, LLC. All rights reserved. |
| 5 | The chart compares the performance of Class A shares for the most recent ten years with the performance of the ICE BofAML High Yield U.S. Corporates, Cash Pay, BB Rated, 1-5 Year Index. The chart assumes a hypothetical investment of $10,000 in Class A shares and reflects all operating expenses and assumes the maximum initial sales charge of 3.00%. |
| 6 | The ten largest holdings, excluding cash, cash equivalents and any money market funds, are calculated based on the value of the investments divided by total net assets of the Fund. Holdings are subject to change and may have changed since the date specified. |
| 7 | The credit quality distribution of portfolio holdings reflected in the chart is based on ratings from Standard & Poor’s, Moody’s Investors Service, and/or Fitch Ratings Ltd. Credit quality ratings apply to the underlying holdings of the Fund and not to the Fund itself. The percentages of the Fund’s portfolio with the ratings depicted in the chart are calculated based on the total market value of fixed income securities held by the Fund. If a security was rated by all three rating agencies, the middle rating was utilized. If rated by two of three rating agencies, the lower rating was utilized, and if rated by one of the rating agencies, that rating was utilized. Standard & Poor’s rates the creditworthiness of bonds, ranging from AAA (highest) to D (lowest). Ratings from A to CCC may be modified by the addition of a plus (+) or minus (-) sign to show relative standing within the rating categories. Standard & Poor’s rates the creditworthiness of short-term notes from SP-1 (highest) to SP-3 (lowest). Moody’s rates the creditworthiness of bonds, ranging from Aaa (highest) to C (lowest). Ratings Aa to B may be modified by the addition of a number 1 (highest) to 3 (lowest) to show relative standing within the ratings categories. Moody’s rates the creditworthiness of short-term U.S. tax-exempt municipal securities from MIG 1/VMIG 1 (highest) to SG (lowest). Fitch rates the creditworthiness of bonds, ranging from AAA (highest) to D (lowest). Credit quality distribution is subject to change and may have changed since the date specified. |
| | | | |
| 8 | | Wells Fargo Short-Term High Yield Bond Fund | | Performance highlights (unaudited) |
MANAGER’S DISCUSSION
Fund highlights
| ∎ | | The Fund (Class A, excluding sales charges) underperformed its benchmark, the ICE BofAML High Yield U.S. Corporates, Cash Pay, BB Rated, 1-5 Year Index, by 4 basis points (bps; 100 bps equal 1.00%) for the 12-month period that ended August 31, 2018. |
| ∎ | | The Fund is conservatively positioned relative to the benchmark, which detracted from performance as the Fund generated a lower yield than the index. |
| ∎ | | The Fund focuses on conservative credit selection and seeks to limit volatility. The Fund has a lower duration than the index, which contributed to performance during a period of higher Treasury rates. |
| | | | |
| Ten largest holdings (%) as of August 31, 20186 | |
Charter Communications Operating LLC, 4.98%, 4-30-2025 | | | 1.77 | |
Ally Financial Incorporated, 3.75%, 11-18-2019 | | | 1.61 | |
Virgin Media Bristol LLC, 4.56%, 1-15-2026 | | | 1.54 | |
Ineos US Finance LLC, 4.17%, 3-31-2024 | | | 1.50 | |
MGM Growth Properties LLC, 4.08%, 3-21-2025 | | | 1.46 | |
Level 3 Financing Incorporated, 4.32%, 2-22-2024 | | | 1.43 | |
Sprint Communications Incorporated, 9.00%, 11-15-2018 | | | 1.39 | |
Equinix Incorporated, 5.38%, 1-1-2022 | | | 1.36 | |
SBA Senior Finance II LLC, 4.08%, 4-11-2025 | | | 1.34 | |
Service Corporation International, 5.38%, 1-15-2022 | | | 1.31 | |
The Fund invests in shorter-duration and more-conservative securities relative to the index.
BB-rated high-yield credit spreads relative to U.S. Treasury yields were unchanged over the period. U.S. economic growth, continued relatively accommodative monetary policy by the U.S. Federal Reserve, and low default rates combined to create a supportive environment for high-yield spreads. Total returns for the high-yield market were limited relative to yields due to the impact of higher Treasury rates.
Our views on the economy, high-yield spreads, and default rates were largely accurate during the period. However, due to the Fund’s strategy of selecting higher-rated, short-term high-yield securities, our focus is on individual credit selection. The overall Fund positioning does not change significantly. Our exposure to
floating-rate bank loans did increase approximately 5% during the period as we looked to take advantage of increasing London Interbank Offered Rate levels. The increase in floating-rate holdings also allowed us to maintain an effective duration between 0.8 and 1.0 years during the period, which benefited returns relative to the index during a period of higher short-term Treasury rates.
|
| Credit quality as of August 31, 20187 |
|
 |
We continued to adhere to the Fund’s basic portfolio strategy.
The Fund’s investments fit into three principal categories. The first category is composed of short-maturity bonds that we expect to be repaid on the maturity date. The second category is composed of bonds with high coupons that we expect to be refinanced on the call date. These two categories comprised 60% to 70% of the portfolio during the reporting period. The third category consists of floating-rate securities, primarily leveraged loans, which ranged from 29% to 34% of the portfolio.
Yields on the Fund’s leveraged-loan holdings were higher than on its fixed-rate holdings over the period, but the higher yield is appropriate for the greater spread risk, which is the price sensitivity to a change in credit spreads.
Conservative credit selection will likely continue to drive our selection process, and we monitor market conditions to determine the Fund’s floating-rate exposure. We intend to continue evaluating relative-value opportunities for the Fund in the upcoming period, but we do not expect significant changes to overall portfolio positioning.
Please see footnotes on page 7.
| | | | | | |
| Fund expenses (unaudited) | | Wells Fargo Short-Term High Yield Bond Fund | | | 9 | |
As a shareholder of the Fund, you incur two types of costs: (1) transaction costs, including sales charges (loads) on purchase payments and contingent deferred sales charges (if any) on redemptions and (2) ongoing costs, including management fees, distribution (12b-1) and/or shareholder servicing fees, and other Fund expenses. This example is intended to help you understand your ongoing costs (in dollars) of investing in the Fund and to compare these costs with the ongoing costs of investing in other mutual funds.
The example is based on an investment of $1,000 invested at the beginning of the six-month period and held for the entire period from March 1, 2018 to August 31, 2018.
Actual expenses
The “Actual” line of the table below provides information about actual account values and actual expenses. You may use the information in this line, together with the amount you invested, to estimate the expenses that you paid over the period. Simply divide your account value by $1,000 (for example, an $8,600 account value divided by $1,000 = 8.6), then multiply the result by the number in the “Actual” line under the heading entitled “Expenses paid during period” for your applicable class of shares to estimate the expenses you paid on your account during this period.
Hypothetical example for comparison purposes
The “Hypothetical” line of the table below provides information about hypothetical account values and hypothetical expenses based on the Fund’s actual expense ratio and an assumed rate of return of 5% per year before expenses, which is not the Fund’s actual return. The hypothetical account values and expenses may not be used to estimate the actual ending account balance or expenses you paid for the period. You may use this information to compare the ongoing costs of investing in the Fund and other funds. To do so, compare this 5% hypothetical example with the 5% hypothetical examples that appear in the shareholder reports of the other funds.
Please note that the expenses shown in the table are meant to highlight your ongoing costs only and do not reflect any transactional costs, such as sales charges (loads) and contingent deferred sales charges. Therefore, the “Hypothetical” line of the table is useful in comparing ongoing costs only and will not help you determine the relative total costs of owning different funds. In addition, if these transactional costs were included, your costs would have been higher.
| | | | | | | | | | | | | | | | |
| | | Beginning
account value
3-1-2018 | | | Ending
account value
8-31-2018 | | | Expenses paid during
the period¹ | | | Annualized net
expense ratio | |
Class A | | | | | | | | | | | | | | | | |
Actual | | $ | 1,000.00 | | | $ | 1,012.97 | | | $ | 4.11 | | | | 0.81 | % |
Hypothetical (5% return before expenses) | | $ | 1,000.00 | | | $ | 1,021.12 | | | $ | 4.13 | | | | 0.81 | % |
Class C | | | | | | | | | | | | | | | | |
Actual | | $ | 1,000.00 | | | $ | 1,010.41 | | | $ | 7.91 | | | | 1.56 | % |
Hypothetical (5% return before expenses) | | $ | 1,000.00 | | | $ | 1,017.34 | | | $ | 7.93 | | | | 1.56 | % |
Administrator Class | | | | | | | | | | | | | | | | |
Actual | | $ | 1,000.00 | | | $ | 1,013.79 | | | $ | 3.30 | | | | 0.65 | % |
Hypothetical (5% return before expenses) | | $ | 1,000.00 | | | $ | 1,021.93 | | | $ | 3.31 | | | | 0.65 | % |
Institutional Class | | | | | | | | | | | | | | | | |
Actual | | $ | 1,000.00 | | | $ | 1,014.55 | | | $ | 2.54 | | | | 0.50 | % |
Hypothetical (5% return before expenses) | | $ | 1,000.00 | | | $ | 1,022.68 | | | $ | 2.55 | | | | 0.50 | % |
| 1 | Expenses paid is equal to the annualized net expense ratio of each class multiplied by the average account value over the period, multiplied by the number of days in the most recent fiscal half-year divided by the number of days in the fiscal year (to reflect the one-half-year period). |
| | | | |
| 10 | | Wells Fargo Short-Term High Yield Bond Fund | | Portfolio of investments—August 31, 2018 |
| | | | | | | | | | | | | | | | |
| Security name | | Interest rate | | | Maturity date | | | Principal | | | Value | |
|
Corporate Bonds and Notes: 53.58% | |
|
Consumer Discretionary: 20.36% | |
|
| Auto Components: 0.65% | |
American Axle & Manufacturing Incorporated | | | 7.75 | % | | | 11-15-2019 | | | $ | 4,080,000 | | | $ | 4,284,000 | |
Cooper Tire & Rubber Company | | | 8.00 | | | | 12-15-2019 | | | | 2,568,000 | | | | 2,704,130 | |
| | | | |
| | | | | | | | | | | | | | | 6,988,130 | |
| | | | | | | | | | | | | | | | |
|
| Diversified Consumer Services: 2.07% | |
Service Corporation International | | | 5.38 | | | | 1-15-2022 | | | | 13,800,000 | | | | 14,011,692 | |
TRI Pointe Group Incorporated | | | 4.38 | | | | 6-15-2019 | | | | 8,142,000 | | | | 8,182,710 | |
| | | | |
| | | | | | | | | | | | | | | 22,194,402 | |
| | | | | | | | | | | | | | | | |
|
| Hotels, Restaurants & Leisure: 2.63% | |
GLP Capital LP/GLP Financing II Incorporated | | | 4.88 | | | | 11-1-2020 | | | | 11,929,000 | | | | 12,227,225 | |
MGM Resorts International | | | 5.25 | | | | 3-31-2020 | | | | 9,365,000 | | | | 9,552,300 | |
NCL Corporation Limited 144A | | | 4.75 | | | | 12-15-2021 | | | | 6,382,000 | | | | 6,421,888 | |
| | | | |
| | | | | | | | | | | | | | | 28,201,413 | |
| | | | | | | | | | | | | | | | |
|
| Household Durables: 2.34% | |
KB Home | | | 4.75 | | | | 5-15-2019 | | | | 7,835,000 | | | | 7,854,588 | |
Lennar Corporation | | | 4.50 | | | | 6-15-2019 | | | | 3,400,000 | | | | 3,421,250 | |
Lennar Corporation | | | 6.63 | | | | 5-1-2020 | | | | 2,485,000 | | | | 2,589,519 | |
Pulte Group Incorporated | | | 4.25 | | | | 3-1-2021 | | | | 11,145,000 | | | | 11,204,069 | |
| | | | |
| | | | | | | | | | | | | | | 25,069,426 | |
| | | | | | | | | | | | | | | | |
|
| Internet & Direct Marketing Retail: 1.29% | |
Netflix Incorporated | | | 5.38 | | | | 2-1-2021 | | | | 13,445,000 | | | | 13,831,544 | |
| | | | | | | | | | | | | | | | |
|
| Media: 7.62% | |
Cable One Incorporated 144A | | | 5.75 | | | | 6-15-2022 | | | | 10,268,000 | | | | 10,447,690 | |
DISH DBS Corporation | | | 7.88 | | | | 9-1-2019 | | | | 11,065,000 | | | | 11,438,444 | |
LIN Television Corporation | | | 5.88 | | | | 11-15-2022 | | | | 2,870,000 | | | | 2,927,400 | |
National CineMedia LLC | | | 6.00 | | | | 4-15-2022 | | | | 10,175,000 | | | | 10,327,625 | |
Nexstar Broadcasting Group Incorporated 144A | | | 6.13 | | | | 2-15-2022 | | | | 11,535,000 | | | | 11,729,653 | |
Outfront Media Capital Corporation | | | 5.25 | | | | 2-15-2022 | | | | 10,515,000 | | | | 10,567,470 | |
Sinclair Television Group Incorporated | | | 6.13 | | | | 10-1-2022 | | | | 13,200,000 | | | | 13,532,640 | |
TEGNA Incorporated | | | 5.13 | | | | 10-15-2019 | | | | 6,174,000 | | | | 6,174,000 | |
TEGNA Incorporated | | | 5.13 | | | | 7-15-2020 | | | | 4,505,000 | | | | 4,544,419 | |
| | | | |
| | | | | | | | | | | | | | | 81,689,341 | |
| | | | | | | | | | | | | | | | |
|
| Specialty Retail: 2.82% | |
Gap Incorporated | | | 5.95 | | | | 4-12-2021 | | | | 8,965,000 | | | | 9,375,978 | |
Group 1 Automotive Incorporated | | | 5.00 | | | | 6-1-2022 | | | | 7,855,000 | | | | 7,776,450 | |
Penske Auto Group Incorporated | | | 3.75 | | | | 8-15-2020 | | | | 1,905,000 | | | | 1,881,188 | |
Penske Auto Group Incorporated | | | 5.75 | | | | 10-1-2022 | | | | 10,920,000 | | | | 11,138,400 | |
| | | | |
| | | | | | | | | | | | | | | 30,172,016 | |
| | | | | | | | | | | | | | | | |
|
| Textiles, Apparel & Luxury Goods: 0.94% | |
The William Carter Company | | | 5.25 | | | | 8-15-2021 | | | | 9,890,000 | | | | 10,025,988 | |
| | | | | | | | | | | | | | | | |
The accompanying notes are an integral part of these financial statements.
| | | | | | |
| Portfolio of investments—August 31, 2018 | | Wells Fargo Short-Term High Yield Bond Fund | | | 11 | |
| | | | | | | | | | | | | | | | |
| Security name | | Interest rate | | | Maturity date | | | Principal | | | Value | |
|
Consumer Staples: 2.26% | |
|
| Food Products: 1.31% | |
B&G Foods Incorporated | | | 4.63 | % | | | 6-1-2021 | | | $ | 14,070,000 | | | $ | 13,999,650 | |
| | | | | | | | | | | | | | | | |
|
| Personal Products: 0.95% | |
Edgewell Personal Care Company | | | 4.70 | | | | 5-19-2021 | | | | 10,124,000 | | | | 10,199,930 | |
| | | | | | | | | | | | | | | | |
|
Energy: 4.79% | |
|
| Oil, Gas & Consumable Fuels: 4.79% | |
DCP Midstream Operating LP | | | 2.70 | | | | 4-1-2019 | | | | 9,700,000 | | | | 9,639,375 | |
DCP Midstream Operating LP 144A | | | 5.35 | | | | 3-15-2020 | | | | 5,668,000 | | | | 5,795,530 | |
Rockies Express Pipeline LLC 144A | | | 5.63 | | | | 4-15-2020 | | | | 3,190,000 | | | | 3,289,688 | |
Rockies Express Pipeline LLC 144A | | | 6.00 | | | | 1-15-2019 | | | | 6,360,000 | | | | 6,419,657 | |
Sabine Pass Liquefaction LLC | | | 5.63 | | | | 2-1-2021 | | | | 10,000,000 | | | | 10,428,730 | |
Southern Star Central Corporation 144A | | | 5.13 | | | | 7-15-2022 | | | | 8,995,000 | | | | 8,995,000 | |
Targa Resources Partners LP | | | 4.13 | | | | 11-15-2019 | | | | 6,720,000 | | | | 6,725,376 | |
| | | | |
| | | | | | | | | | | | | | | 51,293,356 | |
| | | | | | | | | | | | | | | | |
|
Financials: 5.41% | |
|
| Banks: 0.49% | |
CIT Group Incorporated | | | 3.88 | | | | 2-19-2019 | | | | 5,203,000 | | | | 5,231,617 | |
| | | | | | | | | | | | | | | | |
|
| Consumer Finance: 4.02% | |
Ally Financial Incorporated | | | 3.75 | | | | 11-18-2019 | | | | 17,160,000 | | | | 17,224,350 | |
Navient Corporation | | | 5.50 | | | | 1-15-2019 | | | | 13,635,000 | | | | 13,741,353 | |
Springleaf Finance Corporation | | | 5.25 | | | | 12-15-2019 | | | | 9,380,000 | | | | 9,508,975 | |
Toll Brothers Finance Corporation | | | 4.00 | | | | 12-31-2018 | | | | 2,650,000 | | | | 2,650,000 | |
| | | | |
| | | | | | | | | | | | | | | 43,124,678 | |
| | | | | | | | | | | | | | | | |
|
| Real Estate Management & Development: 0.90% | |
Realogy Group LLC «144A | | | 5.25 | | | | 12-1-2021 | | | | 9,645,000 | | | | 9,645,000 | |
| | | | | | | | | | | | | | | | |
|
Health Care: 4.68% | |
|
| Health Care Providers & Services: 4.68% | |
Acadia Healthcare Company Incorporated | | | 5.13 | | | | 7-1-2022 | | | | 7,232,000 | | | | 7,268,160 | |
Acadia Healthcare Company Incorporated | | | 6.13 | | | | 3-15-2021 | | | | 1,618,000 | | | | 1,630,135 | |
DaVita Incorporated | | | 5.75 | | | | 8-15-2022 | | | | 7,755,000 | | | | 7,861,631 | |
HCA Incorporated | | | 3.75 | | | | 3-15-2019 | | | | 4,030,000 | | | | 4,044,105 | |
HCA Incorporated | | | 6.50 | | | | 2-15-2020 | | | | 4,120,000 | | | | 4,276,560 | |
Lifepoint Health Incorporated | | | 5.50 | | | | 12-1-2021 | | | | 10,617,000 | | | | 10,789,526 | |
Select Medical Corporation | | | 6.38 | | | | 6-1-2021 | | | | 5,345,000 | | | | 5,398,450 | |
Tenet Healthcare Corporation | | | 6.00 | | | | 10-1-2020 | | | | 8,550,000 | | | | 8,881,313 | |
| | | | |
| | | | | | | | | | | | | | | 50,149,880 | |
| | | | | | | | | | | | | | | | |
|
Industrials: 5.28% | |
|
| Aerospace & Defense: 2.07% | |
Alcoa Incorporated | | | 6.15 | | | | 8-15-2020 | | | | 8,830,000 | | | | 9,183,200 | |
Moog Incorporated 144A | | | 5.25 | | | | 12-1-2022 | | | | 12,865,000 | | | | 13,041,894 | |
| | | | |
| | | | | | | | | | | | | | | 22,225,094 | |
| | | | | | | | | | | | | | | | |
The accompanying notes are an integral part of these financial statements.
| | | | |
| 12 | | Wells Fargo Short-Term High Yield Bond Fund | | Portfolio of investments—August 31, 2018 |
| | | | | | | | | | | | | | | | |
| Security name | | Interest rate | | | Maturity date | | | Principal | | | Value | |
|
| Commercial Services & Supplies: 1.05% | |
Clean Harbors Incorporated | | | 5.13 | % | | | 6-1-2021 | | | $ | 11,195,000 | | | $ | 11,222,988 | |
| | | | | | | | | | | | | | | | |
|
| Machinery: 0.88% | |
CNH Industrial Capital LLC | | | 4.38 | | | | 11-6-2020 | | | | 1,425,000 | | | | 1,442,813 | |
Enpro Industries Incorporated | | | 5.88 | | | | 9-15-2022 | | | | 7,780,000 | | | | 7,925,875 | |
| | | | |
| | | | | | | | | | | | | | | 9,368,688 | |
| | | | | | | | | | | | | | | | |
|
| Trading Companies & Distributors: 1.28% | |
HD Supply Incorporated 144A | | | 5.75 | | | | 4-15-2024 | | | | 10,620,000 | | | | 11,164,275 | |
International Lease Finance Corporation | | | 6.25 | | | | 5-15-2019 | | | | 2,500,000 | | | | 2,555,341 | |
| | | | |
| | | | | | | | | | | | | | | 13,719,616 | |
| | | | | | | | | | | | | | | | |
|
Information Technology: 3.38% | |
|
| Electronic Equipment, Instruments & Components: 1.13% | |
Sanmina Corporation 144A | | | 4.38 | | | | 6-1-2019 | | | | 12,100,000 | | | | 12,151,425 | |
| | | | | | | | | | | | | | | | |
|
| Software: 0.44% | |
Symantec Corporation | | | 4.20 | | | | 9-15-2020 | | | | 4,635,000 | | | | 4,664,705 | |
| | | | | | | | | | | | | | | | |
|
| Technology Hardware, Storage & Peripherals: 1.81% | |
EMC Corporation | | | 2.65 | | | | 6-1-2020 | | | | 11,850,000 | | | | 11,587,506 | |
NCR Corporation | | | 4.63 | | | | 2-15-2021 | | | | 7,925,000 | | | | 7,786,313 | |
| | | | |
| | | | | | | | | | | | | | | 19,373,819 | |
| | | | | | | | | | | | | | | | |
|
Materials: 2.75% | |
|
| Chemicals: 0.30% | |
Huntsman International LLC | | | 4.88 | | | | 11-15-2020 | | | | 3,175,000 | | | | 3,248,025 | |
| | | | | | | | | | | | | | | | |
|
| Containers & Packaging: 1.43% | |
Ball Corporation | | | 4.38 | | | | 12-15-2020 | | | | 10,425,000 | | | | 10,555,313 | |
Reynolds Group Holdings | | | 5.75 | | | | 10-15-2020 | | | | 4,768,010 | | | | 4,773,970 | |
| | | | |
| | | | | | | | | | | | | | | 15,329,283 | |
| | | | | | | | | | | | | | | | |
|
| Metals & Mining: 1.02% | |
Freeport-McMoRan Incorporated | | | 3.10 | | | | 3-15-2020 | | | | 1,840,000 | | | | 1,824,636 | |
Steel Dynamics Incorporated | | | 5.13 | | | | 10-1-2021 | | | | 8,963,000 | | | | 9,088,482 | |
| | | | |
| | | | | | | | | | | | | | | 10,913,118 | |
| | | | | | | | | | | | | | | | |
|
Real Estate: 2.68% | |
|
| Equity REITs: 1.91% | |
CoreCivic Incorporated | | | 4.13 | | | | 4-1-2020 | | | | 2,545,000 | | | | 2,551,363 | |
Equinix Incorporated | | | 5.38 | | | | 1-1-2022 | | | | 14,195,000 | | | | 14,618,011 | |
Sabra Health Care REIT Incorporated | | | 5.50 | | | | 2-1-2021 | | | | 3,249,000 | | | | 3,311,949 | |
| | | | |
| | | | | | | | | | | | | | | 20,481,323 | |
| | | | | | | | | | | | | | | | |
|
| Real Estate Management & Development: 0.77% | |
Taylor Morrison Communities Incorporated 144A | | | 5.25 | | | | 4-15-2021 | | | | 8,285,000 | | | | 8,274,644 | |
| | | | | | | | | | | | | | | | |
The accompanying notes are an integral part of these financial statements.
| | | | | | |
| Portfolio of investments—August 31, 2018 | | Wells Fargo Short-Term High Yield Bond Fund | | | 13 | |
| | | | | | | | | | | | | | | | |
| Security name | | Interest rate | | | Maturity date | | | Principal | | | Value | |
|
Telecommunication Services: 1.51% | |
|
| Diversified Telecommunication Services: 0.12% | |
Hughes Satellite Systems Corporation | | | 6.50 | % | | | 6-15-2019 | | | $ | 1,215,000 | | | $ | 1,244,039 | |
| | | | | | | | | | | | | | | | |
|
| Wireless Telecommunication Services: 1.39% | |
Sprint Communications Incorporated 144A | | | 9.00 | | | | 11-15-2018 | | | | 14,780,000 | | | | 14,946,275 | |
| | | | | | | | | | | | | | | | |
|
Utilities: 0.48% | |
|
| Independent Power & Renewable Electricity Producers: 0.48% | |
NRG Energy Incorporated | | | 6.25 | | | | 7-15-2022 | | | | 4,967,000 | | | | 5,128,418 | |
| | | | | | | | | | | | | | | | |
| |
Total Corporate Bonds and Notes (Cost $581,069,649) | | | | 574,107,831 | |
| | | | | | | | | | | | | | | | |
|
Loans: 32.79% | |
|
Consumer Discretionary: 4.65% | |
|
| Auto Components: 0.92% | |
Allison Transmission Incorporated (1 Month LIBOR +1.75%) ± | | | 3.82 | | | | 9-23-2022 | | | | 7,515,033 | | | | 7,548,399 | |
Belron Finance US LLC (3 Month LIBOR +2.50%) ± | | | 4.84 | | | | 11-7-2024 | | | | 2,288,500 | | | | 2,295,182 | |
| | | | |
| | | | | | | | | | | | | | | 9,843,581 | |
| | | | | | | | | | | | | | | | |
|
| Household Products: 1.44% | |
Michaels Stores Incorporated (1 Month LIBOR +2.50%) ± | | | 4.57 | | | | 1-28-2023 | | | | 10,694,149 | | | | 10,646,025 | |
The ServiceMaster Company LLC (1 Month LIBOR +2.50%) ± | | | 4.58 | | | | 11-8-2023 | | | | 4,828,273 | | | | 4,829,143 | |
| | | | |
| | | | | | | | | | | | | | | 15,475,168 | |
| | | | | | | | | | | | | | | | |
|
| Media: 2.08% | |
Altice US Finance I Corporation (1 Month LIBOR +2.25%) ± | | | 4.33 | | | | 7-28-2025 | | | | 10,395,000 | | | | 10,373,378 | |
CSC Holdings LLC (1 Month LIBOR +2.50%) ± | | | 4.56 | | | | 1-25-2026 | | | | 11,902,170 | | | | 11,905,146 | |
| | | | |
| | | | | | | | | | | | | | | 22,278,524 | |
| | | | | | | | | | | | | | | | |
|
| Specialty Retail: 0.21% | |
Sally Beauty Holdings LLC (1 Month LIBOR +2.25%) ± | | | 4.33 | | | | 7-5-2024 | | | | 2,347,263 | | | | 2,283,699 | |
| | | | | | | | | | | | | | | | |
|
Consumer Staples: 1.71% | |
|
| Food Products: 1.71% | |
Pinnacle Foods Finance LLC (1 Month LIBOR +1.75%) ± | | | 3.83 | | | | 2-2-2024 | | | | 7,262,591 | | | | 7,262,591 | |
Post Holdings Incorporated (1 Month LIBOR +2.00%) ± | | | 4.07 | | | | 5-24-2024 | | | | 11,063,250 | | | | 11,050,527 | |
| | | | |
| | | | | | | | | | | | | | | 18,313,118 | |
| | | | | | | | | | | | | | | | |
|
Financials: 3.02% | |
|
| Diversified Consumer Services: 0.88% | |
TransUnion LLC (1 Month LIBOR +2.00%) ± | | | 4.08 | | | | 6-19-2025 | | | | 9,395,000 | | | | 9,424,406 | |
| | | | | | | | | | | | | | | | |
|
| Diversified Financial Services: 2.14% | |
Delos Finance SARL (3 Month LIBOR +1.75%) ± | | | 4.08 | | | | 10-6-2023 | | | | 9,865,000 | | | | 9,889,663 | |
LPL Holdings Incorporated (1 Month LIBOR +2.25%) ± | | | 4.48 | | | | 9-23-2024 | | | | 13,064,339 | | | | 13,061,073 | |
| | | | |
| | | | | | | | | | | | | | | 22,950,736 | |
| | | | | | | | | | | | | | | | |
The accompanying notes are an integral part of these financial statements.
| | | | |
| 14 | | Wells Fargo Short-Term High Yield Bond Fund | | Portfolio of investments—August 31, 2018 |
| | | | | | | | | | | | | | | | |
| Security name | | Interest rate | | | Maturity date | | | Principal | | | Value | |
|
Health Care: 2.55% | |
|
| Health Care Providers & Services: 1.49% | |
HCA Incorporated (1 Month LIBOR +1.75%) ± | | | 3.83 | % | | | 3-18-2023 | | | $ | 10,082,574 | | | $ | 10,124,618 | |
Select Medical Corporation (1 Month LIBOR +2.75%) ± | | | 4.82 | | | | 3-1-2021 | | | | 5,870,687 | | | | 5,897,575 | |
| | | | |
| | | | | | | | | | | | | | | 16,022,193 | |
| | | | | | | | | | | | | | | | |
|
| Health Care Technology: 0.54% | |
Change Healthcare Holdings Incorporated (1 Month LIBOR +2.75%) ± | | | 4.83 | | | | 3-1-2024 | | | | 5,772,138 | | | | 5,773,754 | |
| | | | | | | | | | | | | | | | |
|
| Pharmaceuticals: 0.52% | |
Endo Finance LLC (1 Month LIBOR +4.25%) ± | | | 6.38 | | | | 4-29-2024 | | | | 5,549,348 | | | | 5,577,095 | |
| | | | | | | | | | | | | | | | |
|
Industrials: 9.28% | |
|
| Airlines: 0.73% | |
United Airlines Incorporated (1 Month LIBOR +1.75%) ± | �� | | 3.83 | | | | 4-1-2024 | | | | 7,830,875 | | | | 7,814,587 | |
| | | | | | | | | | | | | | | | |
|
| Commercial Services & Supplies: 3.98% | |
Advanced Disposal Services Incorporated (1 Month LIBOR +2.25%) ± | | | 4.21 | | | | 11-10-2023 | | | | 12,373,687 | | | | 12,392,247 | |
Aramark Services Incorporated (3 Month LIBOR +1.75%) ± | | | 4.08 | | | | 3-28-2024 | | | | 6,327,661 | | | | 6,338,228 | |
Aramark Services Incorporated (3 Month LIBOR +1.75%) ± | | | 4.08 | | | | 3-11-2025 | | | | 6,344,100 | | | | 6,352,030 | |
KAR Auction Services Incorporated (1 Month LIBOR +2.25%) ± | | | 4.38 | | | | 3-11-2021 | | | | 13,282,200 | | | | 13,304,382 | |
Sensata Technologies BV (1 Month LIBOR +1.75%) ± | | | 3.82 | | | | 10-14-2021 | | | | 4,187,303 | | | | 4,196,892 | |
| | | | |
| | | | | | | | | | | | | | | 42,583,779 | |
| | | | | | | | | | | | | | | | |
|
| Communications Equipment: 3.31% | |
Charter Communications Operating LLC (1 Month LIBOR +2.00%) ± | | | 4.08 | | | | 4-30-2025 | | | | 19,019,425 | | | | 19,019,425 | |
Virgin Media Bristol LLC (1 Month LIBOR +2.50%) ± | | | 4.56 | | | | 1-15-2026 | | | | 16,465,000 | | | | 16,453,804 | |
| | | | |
| | | | | | | | | | | | | | | 35,473,229 | |
| | | | | | | | | | | | | | | | |
|
| Machinery: 1.26% | |
Columbus McKinnon Corporation (3 Month LIBOR +2.50%) ± ‡ | | | 4.83 | | | | 1-31-2024 | | | | 6,097,064 | | | | 6,104,686 | |
RBS Global Incorporated (1 Month LIBOR +2.00%) ± | | | 4.06 | | | | 8-21-2024 | | | | 7,400,000 | | | | 7,420,794 | |
| | | | |
| | | | | | | | | | | | | | | 13,525,480 | |
| | | | | | | | | | | | | | | | |
|
Information Technology: 3.33% | |
|
| Communications Equipment: 0.32% | |
CommScope Incorporated (1 Month LIBOR +2.00%) ± | | | 4.08 | | | | 12-29-2022 | | | | 3,359,949 | | | | 3,372,549 | |
| | | | | | | | | | | | | | | | |
|
| Electronic Equipment, Instruments & Components: 0.73% | |
Dell Incorporated (1 Month LIBOR +2.00%) ± | | | 4.08 | | | | 9-7-2023 | | | | 2,654,203 | | | | 2,653,088 | |
Zebra Technologies Corporation (3 Month LIBOR +1.75%) ± | | | 4.06 | | | | 11-15-2021 | | | | 5,158,404 | | | | 5,182,030 | |
| | | | |
| | | | | | | | | | | | | | | 7,835,118 | |
| | | | | | | | | | | | | | | | |
|
| Internet Software & Services: 0.92% | |
Zayo Group LLC (1 Month LIBOR +2.25%) ± | | | 4.33 | | | | 1-19-2024 | | | | 9,837,884 | | | | 9,870,349 | |
| | | | | | | | | | | | | | | | |
|
| IT Services: 1.07% | |
First Data Corporation (1 Month LIBOR +2.00%) ± | | | 4.07 | | | | 7-8-2022 | | | | 11,495,549 | | | | 11,487,732 | |
| | | | | | | | | | | | | | | | |
The accompanying notes are an integral part of these financial statements.
| | | | | | |
| Portfolio of investments—August 31, 2018 | | Wells Fargo Short-Term High Yield Bond Fund | | | 15 | |
| | | | | | | | | | | | | | | | |
| Security name | | Interest rate | | | Maturity date | | | Principal | | | Value | |
|
| Semiconductors & Semiconductor Equipment: 0.29% | |
Micron Technology Incorporated (1 Month LIBOR +1.75%) ± | | | 3.83 | % | | | 4-26-2022 | | | $ | 3,080,000 | | | $ | 3,088,994 | |
| | | | | | | | | | | | | | | | |
|
Materials: 4.02% | |
|
| Chemicals: 2.03% | |
Ashland LLC (1 Month LIBOR +1.75%) ± | | | 3.83 | | | | 5-17-2024 | | | | 5,687,550 | | | | 5,694,659 | |
Ineos US Finance LLC (3 Month LIBOR +2.00%) ± | | | 4.17 | | | | 3-31-2024 | | | | 16,137,979 | | | | 16,111,028 | |
| | | | |
| | | | | | | | | | | | | | | 21,805,687 | |
| | | | | | | | | | | | | | | | |
|
| Containers & Packaging: 1.99% | |
Berry Global Incorporated (2 Month LIBOR +1.75%) ± | | | 3.94 | | | | 2-8-2020 | | | | 11,029,194 | | | | 11,020,371 | |
Reynolds Group Holdings Incorporated (1 Month LIBOR +2.75%) ± | | | 4.83 | | | | 2-5-2023 | | | | 10,231,375 | | | | 10,260,636 | |
| | | | |
| | | | | | | | | | | | | | | 21,281,007 | |
| | | | | | | | | | | | | | | | |
|
Real Estate: 1.46% | |
|
| Equity REITs: 1.46% | |
MGM Growth Properties LLC (1 Month LIBOR +2.00%) ± | | | 4.08 | | | | 3-21-2025 | | | | 15,654,209 | | | | 15,645,443 | |
| | | | | | | | | | | | | | | | |
|
Telecommunication Services: 2.77% | |
|
| Diversified Telecommunication Services: 1.43% | |
Level 3 Financing Incorporated (1 Month LIBOR +2.25%) ± | | | 4.32 | | | | 2-22-2024 | | | | 15,258,850 | | | | 15,273,651 | |
| | | | | | | | | | | | | | | | |
|
| Wireless Telecommunication Services: 1.34% | |
SBA Senior Finance II LLC (1 Month LIBOR +2.00%) ± | | | 4.08 | | | | 4-11-2025 | | | | 14,437,500 | | | | 14,385,381 | |
| | | | | | | | | | | | | | | | |
| |
Total Loans (Cost $352,370,521) | | | | 351,385,260 | |
| | | | | | | | | | | | | | | | |
|
Non-Agency Mortgage-Backed Securities: 0.00% | |
Salomon Brothers Mortgage Securities VII Series 1994-5 Class B2 ±± | | | 4.30 | | | | 4-25-2024 | | | | 27,041 | | | | 24,221 | |
| | | | | | | | | | | | | | | | |
| |
Total Non-Agency Mortgage-Backed Securities (Cost $26,779) | | | | 24,221 | |
| | | | | | | | | | | | | | | | |
|
Yankee Corporate Bonds and Notes: 8.76% | |
|
Consumer Discretionary: 3.68% | |
|
| Auto Components: 1.20% | |
IHO Verwaltungs GmbH 144A | | | 4.13 | | | | 9-15-2021 | | | | 12,890,000 | | | | 12,825,550 | |
| | | | | | | | | | | | | | | | |
|
| Automobiles: 1.23% | |
Jaguar Land Rover Automotive plc 144A | | | 4.13 | | | | 12-15-2018 | | | | 13,235,000 | | | | 13,235,000 | |
| | | | | | | | | | | | | | | | |
|
| Hotels, Restaurants & Leisure: 1.25% | |
International Game Technology plc 144A | | | 5.63 | | | | 2-15-2020 | | | | 13,120,000 | | | | 13,349,600 | |
| | | | | | | | | | | | | | | | |
|
Financials: 1.29% | |
|
| Banks: 1.28% | |
Nielsen Holding and Finance BV 144A | | | 5.50 | | | | 10-1-2021 | | | | 13,670,000 | | | | 13,687,088 | |
| | | | | | | | | | | | | | | | |
|
| Diversified Financial Services: 0.01% | |
Virgin Media Finance plc | | | 5.25 | | | | 1-15-2021 | | | | 75,000 | | | | 76,781 | |
| | | | | | | | | | | | | | | | |
The accompanying notes are an integral part of these financial statements.
| | | | |
| 16 | | Wells Fargo Short-Term High Yield Bond Fund | | Portfolio of investments—August 31, 2018 |
| | | | | | | | | | | | | | | | |
| Security name | | Interest rate | | | Maturity date | | | Principal | | | Value | |
|
Health Care: 2.36% | |
|
| Pharmaceuticals: 2.36% | |
Bausch Health Companies Incorporated 144A | | | 6.50 | % | | | 3-15-2022 | | | $ | 11,695,000 | | | $ | 12,104,325 | |
Teva Pharmaceuticals Industries Incorporated | | | 1.70 | | | | 7-19-2019 | | | | 13,458,000 | | | | 13,230,107 | |
| | | | |
| | | | | | | | | | | | | | | 25,334,432 | |
| | | | | | | | | | | | | | | | |
|
Information Technology: 0.47% | |
|
| Communications Equipment: 0.29% | |
Nokia Corporation | | | 5.38 | | | | 5-15-2019 | | | | 3,094,000 | | | | 3,138,708 | |
| | | | | | | | | | | | | | | | |
|
| Semiconductors & Semiconductor Equipment: 0.18% | |
NXP BV/NXP Funding LLC 144A | | | 4.13 | | | | 6-15-2020 | | | | 1,900,000 | | | | 1,916,625 | |
| | | | | | | | | | | | | | | | |
|
Materials: 0.96% | |
|
| Metals & Mining: 0.96% | |
ArcelorMittal | | | 5.50 | | | | 3-1-2021 | | | | 9,970,000 | | | | 10,331,201 | |
| | | | | | | | | | | | | | | | |
| | | |
Total Yankee Corporate Bonds and Notes (Cost $95,114,532) | | | | | | | | | | | | 93,894,985 | |
| | | | | | | | | | | | | | | | |
| | | | |
| | | Yield | | | | | | Shares | | | | |
| Short-Term Investments: 4.53% | | | | | | | | | | | | | |
| | | | |
| Investment Companies: 4.53% | | | | | | | | | | | | | | | | |
Securities Lending Cash Investment LLC (l)(r)(u) | | | 2.07 | | | | | | | | 146,956 | | | | 146,970 | |
Wells Fargo Government Money Market Fund Select Class (l)(u) | | | 1.87 | | | | | | | | 48,392,907 | | | | 48,392,907 | |
| |
Total Short-Term Investments (Cost $48,539,877) | | | | 48,539,877 | |
| | | | | | | | | | | | | | | | |
| | | | | | | | |
| Total investments in securities (Cost $1,077,121,358) | | | 99.66 | % | | | 1,067,952,174 | |
Other assets and liabilities, net | | | 0.34 | | | | 3,593,599 | |
| | | | | | | | |
| Total net assets | | | 100.00 | % | | $ | 1,071,545,773 | |
| | | | | | | | |
| 144A | The security may be resold in transactions exempt from registration, normally to qualified institutional buyers, pursuant to Rule 144A under the Securities Act of 1933. |
| « | All or a portion of this security is on loan. |
| ± | Variable rate investment. The rate shown is the rate in effect at period end. |
| ‡ | Security is valued using significant unobservable inputs. |
| ±± | The coupon of the security is adjusted based on the principal and interest payments received from the underlying pool of mortgages as well as the credit quality and the actual prepayment speed of the underlying mortgages. |
| (l) | The issuer of the security is an affiliated person of the Fund as defined in the Investment Company Act of 1940. |
| (r) | The investment is a non-registered investment company purchased with cash collateral received from securities on loan. |
| (u) | The rate represents the 7-day annualized yield at period end. |
Abbreviations:
| LIBOR | London Interbank Offered Rate |
| REIT | Real estate investment trust |
The accompanying notes are an integral part of these financial statements.
| | | | | | |
| Portfolio of investments—August 31, 2018 | | Wells Fargo Short-Term High Yield Bond Fund | | | 17 | |
Investments in Affiliates
An affiliated investment is an investment in which the Fund owns at least 5% of the outstanding voting shares of the issuer or as a result of other relationships, such as the Fund and the issuer having the same investment manager. Transactions with issuers that were either affiliated persons of the Fund at the beginning of the period or the end of the period were as follows:
| | | | | | | | | | | | | | | | | | | | | | | | | | | | | | | | | | | | |
| | | Shares,
beginning of
period | | | Shares
purchased | | | Shares
sold | | | Shares,
end of
period | | | Net
realized
gains
(losses) | | | Net
change in
unrealized
gains
(losses) | | | Income
from
affiliated
securities | | | Value,
end
of period | | | % of
net
assets | |
Short-Term Investments | | | | | | | | | | | | | | | | | | | | | | | | | | | | | | | | | | | | |
Investment Companies | | | | | | | | | | | | | | | | | | | | | | | | | | | | | | | | | | | | |
Securities Lending Cash Investment LLC | | | 25,070,746 | | | | 13,560,209 | | | | 38,483,999 | | | | 146,956 | | | $ | 513 | | | $ | (513 | ) | | $ | 38,797 | | | $ | 146,970 | | | | | |
Wells Fargo Government Money Market Fund Select Class | | | 69,795,859 | | | | 668,530,473 | | | | 689,933,425 | | | | 48,392,907 | | | | 0 | | | | 0 | | | | 720,340 | | | | 48,392,907 | | | | | |
| | | | | | | | | | | | | | | | | | | | | | | | | | | | | | | | | | | | |
| | | | | | | | | | | | | | | | | | $ | 513 | | | $ | (513 | ) | | $ | 759,137 | | | $ | 48,539,877 | | | | 4.53 | % |
| | | | | | | | | | | | | | | | | | | | | | | | | | | | | | | | | | | | |
The accompanying notes are an integral part of these financial statements.
| | | | |
| 18 | | Wells Fargo Short-Term High Yield Bond Fund | | Statement of assets and liabilities—August 31, 2018 |
| | | | |
| | | | |
| |
Assets | | | | |
Investments in unaffiliated securities, (including $143,905 of securities loaned), at value (cost $1,028,581,481) | | $ | 1,019,412,297 | |
Investments in affiliated securities, at value (cost $48,539,877) | | | 48,539,877 | |
Receivable for investments sold | | | 59,050 | |
Principal paydown receivable | | | 361 | |
Receivable for Fund shares sold | | | 1,940,455 | |
Receivable for interest | | | 10,198,778 | |
Receivable for securities lending income | | | 134 | |
Prepaid expenses and other assets | | | 7,942 | |
| | | | |
Total assets | | | 1,080,158,894 | |
| | | | |
| |
Liabilities | | | | |
Payable for Fund shares redeemed | | | 7,563,924 | |
Management fee payable | | | 374,497 | |
Dividends payable | | | 197,727 | |
Payable upon receipt of securities loaned | | | 146,970 | |
Administration fees payable | | | 96,814 | |
Distribution fee payable | | | 54,346 | |
Trustees’ fees and expenses payable | | | 2,019 | |
Accrued expenses and other liabilities | | | 176,824 | |
| | | | |
Total liabilities | | | 8,613,121 | |
| | | | |
Total net assets | | $ | 1,071,545,773 | |
| | | | |
| |
NET ASSETS CONSIST OF | | | | |
Paid-in capital | | $ | 1,115,456,923 | |
Undistributed net investment income | | | 7 | |
Accumulated net realized losses on investments | | | (34,741,973 | ) |
Net unrealized losses on investments | | | (9,169,184 | ) |
| | | | |
Total net assets | | $ | 1,071,545,773 | |
| | | | |
| |
COMPUTATION OF NET ASSET VALUE AND OFFERING PRICE PER SHARE | | | | |
Net assets – Class A | | $ | 127,024,000 | |
Shares outstanding – Class A1 | | | 15,888,492 | |
Net asset value per share – Class A | | | $7.99 | |
Maximum offering price per share – Class A2 | | | $8.24 | |
Net assets – Class C | | $ | 77,168,523 | |
Shares outstanding – Class C1 | | | 9,649,351 | |
Net asset value per share – Class C | | | $8.00 | |
Net assets – Administrator Class | | $ | 102,673,219 | |
Shares outstanding – Administrator Class1 | | | 12,843,336 | |
Net asset value per share – Administrator Class | | | $7.99 | |
Net assets – Institutional Class | | $ | 764,680,031 | |
Shares outstanding – Institutional Class1 | | | 95,780,010 | |
Net asset value per share – Institutional Class | | | $7.98 | |
| 1 | The Fund has an unlimited number of authorized shares. |
| 2 | Maximum offering price is computed as 100/97 of net asset value. On investments of $50,000 or more, the offering price is reduced. |
The accompanying notes are an integral part of these financial statements.
| | | | | | |
| Statement of operations—year ended August 31, 2018 | | Wells Fargo Short-Term High Yield Bond Fund | | | 19 | |
| | | | |
| | | | |
| |
Investment income | | | | |
Interest | | $ | 46,149,332 | |
Income from affiliated securities | | | 759,137 | |
| | | | |
Total investment income | | | 46,908,469 | |
| | | | |
| |
Expenses | | | | |
Management fee | | | 6,020,813 | |
Administration fees | | | | |
Class A | | | 240,006 | |
Class C | | | 148,689 | |
Administrator Class | | | 113,817 | |
Institutional Class | | | 717,751 | |
Shareholder servicing fees | | | | |
Class A | | | 375,009 | |
Class C | | | 232,327 | |
Administrator Class | | | 282,081 | |
Distribution fee | | | | |
Class C | | | 696,980 | |
Custody and accounting fees | | | 90,634 | |
Professional fees | | | 60,411 | |
Registration fees | | | 134,927 | |
Shareholder report expenses | | | 104,493 | |
Trustees’ fees and expenses | | | 22,930 | |
Other fees and expenses | | | 25,409 | |
| | | | |
Total expenses | | | 9,266,277 | |
Less: Fee waivers and/or expense reimbursements | | | (1,431,276 | ) |
| | | | |
Net expenses | | | 7,835,001 | |
| | | | |
Net investment income | | | 39,073,468 | |
| | | | |
| |
REALIZED AND UNREALIZED GAINS (LOSSES) ON INVESTMENTS | | | | |
| |
Net realized gains (losses) on: | | | | |
Unaffiliated securities | | | (3,236,382 | ) |
Affiliated securities | | | 513 | |
| | | | |
Net realized losses on investments | | | (3,235,869 | ) |
| | | | |
| |
Net change in unrealized gains (losses) on: | | | | |
Unaffiliated securities | | | (9,349,697 | ) |
Affiliated securities | | | (513 | ) |
| | | | |
Net change in unrealized gains (losses) on investments | | | (9,350,210 | ) |
| | | | |
Net realized and unrealized gains (losses) on investments | | | (12,586,079 | ) |
| | | | |
Net increase in net assets resulting from operations | | $ | 26,487,389 | |
| | | | |
The accompanying notes are an integral part of these financial statements.
| | | | |
| 20 | | Wells Fargo Short-Term High Yield Bond Fund | | Statement of changes in net assets |
| | | | | | | | | | | | | | | | |
| | | Year ended
August 31, 2018 | | | Year ended
August 31, 2017 | |
| | | | |
Operations | | | | | | | | | | | | | | | | |
Net investment income | | | | | | $ | 39,073,468 | | | | | | | $ | 43,836,738 | |
Net realized gains (losses) on investments | | | | | | | (3,235,869 | ) | | | | | | | 802,646 | |
Net change in unrealized gains (losses) on investments | | | | | | | (9,350,210 | ) | | | | | | | (6,629,131 | ) |
| | | | |
Net increase in net assets resulting from operations | | | | | | | 26,487,389 | | | | | | | | 38,010,253 | |
| | | | |
| | | | |
Distributions to shareholders from | | | | | | | | | | | | | | | | |
Net investment income | | | | | | | | | | | | | | | | |
Class A | | | | | | | (4,410,776 | ) | | | | | | | (6,731,705 | ) |
Class C | | | | | | | (2,041,138 | ) | | | | | | | (2,509,379 | ) |
Administrator Class | | | | | | | (3,531,933 | ) | | | | | | | (6,042,398 | ) |
Institutional Class | | | | | | | (29,089,633 | ) | | | | | | | (28,553,188 | ) |
| | | | |
Total distributions to shareholders | | | | | | | (39,073,480 | ) | | | | | | | (43,836,670 | ) |
| | | | |
| | | | |
Capital share transactions | | | Shares | | | | | | | | Shares | | | | | |
Proceeds from shares sold | | | | | | | | | | | | | | | | |
Class A | | | 3,772,243 | | | | 30,248,401 | | | | 8,218,727 | | | | 66,450,237 | |
Class C | | | 821,295 | | | | 6,596,115 | | | | 2,295,200 | | | | 18,559,388 | |
Administrator Class | | | 4,344,267 | | | | 34,806,968 | | | | 10,857,614 | | | | 87,797,670 | |
Institutional Class | | | 40,175,145 | | | | 322,039,713 | | | | 70,215,763 | | | | 566,574,238 | |
| | | | |
| | | | | | | 393,691,197 | | | | | | | | 739,381,533 | |
| | | | |
Reinvestment of distributions | | | | | | | | | | | | | | | | |
Class A | | | 534,775 | | | | 4,287,383 | | | | 809,709 | | | | 6,545,416 | |
Class C | | | 250,383 | | | | 2,008,417 | | | | 300,002 | | | | 2,425,528 | |
Administrator Class | | | 424,158 | | | | 3,399,349 | | | | 692,079 | | | | 5,593,836 | |
Institutional Class | | | 2,938,060 | | | | 23,529,667 | | | | 2,812,373 | | | | 22,702,333 | |
| | | | |
| | | | | | | 33,224,816 | | | | | | | | 37,267,113 | |
| | | | |
Payment for shares redeemed | | | | | | | | | | | | | | | | |
Class A | | | (9,754,483 | ) | | | (78,216,370 | ) | | | (24,321,739 | ) | | | (196,820,631 | ) |
Class C | | | (5,207,987 | ) | | | (41,812,691 | ) | | | (4,080,018 | ) | | | (32,986,378 | ) |
Administrator Class | | | (8,542,255 | ) | | | (68,570,248 | ) | | | (28,866,091 | ) | | | (232,943,723 | ) |
Institutional Class | | | (72,766,723 | ) | | | (582,432,153 | ) | | | (38,479,828 | ) | | | (310,549,066 | ) |
| | | | |
| | | | | | | (771,031,462 | ) | | | | | | | (773,299,798 | ) |
| | | | |
Net increase (decrease) in net assets resulting from capital share transactions | | | | | | | (344,115,449 | ) | | | | | | | 3,348,848 | |
| | | | |
Total decrease in net assets | | | | | | | (356,701,540 | ) | | | | | | | (2,477,569 | ) |
| | | | |
| | | | |
Net assets | | | | | | | | | | | | | | | | |
Beginning of period | | | | | | | 1,428,247,313 | | | | | | | | 1,430,724,882 | |
| | | | |
End of period | | | | | | $ | 1,071,545,773 | | | | | | | $ | 1,428,247,313 | |
| | | | |
Undistributed net investment income | | | | | | $ | 7 | | | | | | | $ | 19 | |
| | | | |
The accompanying notes are an integral part of these financial statements.
| | | | | | |
| Financial highlights | | Wells Fargo Short-Term High Yield Bond Fund | | | 21 | |
(For a share outstanding throughout each period)
| | | | | | | | | | | | | | | | | | | | |
| | | Year ended August 31 | |
| CLASS A | | 2018 | | | 2017 | | | 2016 | | | 2015 | | | 2014 | |
Net asset value, beginning of period | | | $8.07 | | | | $8.10 | | | | $8.07 | | | | $8.20 | | | | $8.21 | |
Net investment income | | | 0.24 | | | | 0.23 | | | | 0.24 | | | | 0.25 | | | | 0.27 | |
Net realized and unrealized gains (losses) on investments | | | (0.08 | ) | | | (0.03 | ) | | | 0.03 | | | | (0.13 | ) | | | 0.01 | |
| | | | | | | | | | | | | | | | | | | | |
Total from investment operations | | | 0.16 | | | | 0.20 | | | | 0.27 | | | | 0.12 | | | | 0.28 | |
Distributions to shareholders from | | | | | | | | | | | | | | | | | | | | |
Net investment income | | | (0.24 | ) | | | (0.23 | ) | | | (0.24 | ) | | | (0.25 | ) | | | (0.27 | ) |
Net realized gains | | | 0.00 | | | | 0.00 | | | | 0.00 | | | | 0.00 | | | | (0.02 | ) |
| | | | | | | | | | | | | | | | | | | | |
Total distributions to shareholders | | | (0.24 | ) | | | (0.23 | ) | | | (0.24 | ) | | | (0.25 | ) | | | (0.29 | ) |
Net asset value, end of period | | | $7.99 | | | | $8.07 | | | | $8.10 | | | | $8.07 | | | | $8.20 | |
Total return1 | | | 2.00 | % | | | 2.51 | % | | | 3.37 | % | | | 1.46 | % | | | 3.40 | % |
Ratios to average net assets (annualized) | | | | | | | | | | | | | | | | | | | | |
Gross expenses | | | 0.93 | % | | | 0.92 | % | | | 0.92 | % | | | 0.92 | % | | | 0.91 | % |
Net expenses | | | 0.81 | % | | | 0.81 | % | | | 0.81 | % | | | 0.81 | % | | | 0.81 | % |
Net investment income | | | 2.96 | % | | | 2.88 | % | | | 2.95 | % | | | 3.11 | % | | | 3.27 | % |
Supplemental data | | | | | | | | | | | | | | | | | | | | |
Portfolio turnover rate | | | 34 | % | | | 35 | % | | | 32 | % | | | 40 | % | | | 28 | % |
Net assets, end of period (000s omitted) | | | $127,024 | | | | $172,151 | | | | $296,817 | | | | $203,856 | | | | $276,436 | |
| 1 | Total return calculations do not include any sales charges. |
The accompanying notes are an integral part of these financial statements.
| | | | |
| 22 | | Wells Fargo Short-Term High Yield Bond Fund | | Financial highlights |
(For a share outstanding throughout each period)
| | | | | | | | | | | | | | | | | | | | |
| | | Year ended August 31 | |
| CLASS C | | 2018 | | | 2017 | | | 2016 | | | 2015 | | | 2014 | |
Net asset value, beginning of period | | | $8.07 | | | | $8.10 | | | | $8.07 | | | | $8.20 | | | | $8.21 | |
Net investment income | | | 0.18 | | | | 0.17 | | | | 0.18 | | | | 0.19 | | | | 0.21 | |
Net realized and unrealized gains (losses) on investments | | | (0.07 | ) | | | (0.03 | ) | | | 0.03 | | | | (0.13 | ) | | | 0.01 | |
| | | | | | | | | | | | | | | | | | | | |
Total from investment operations | | | 0.11 | | | | 0.14 | | | | 0.21 | | | | 0.06 | | | | 0.22 | |
Distributions to shareholders from | | | | | | | | | | | | | | | | | | | | |
Net investment income | | | (0.18 | ) | | | (0.17 | ) | | | (0.18 | ) | | | (0.19 | ) | | | (0.21 | ) |
Net realized gains | | | 0.00 | | | | 0.00 | | | | 0.00 | | | | 0.00 | | | | (0.02 | ) |
| | | | | | | | | | | | | | | | | | | | |
Total distributions to shareholders | | | (0.18 | ) | | | (0.17 | ) | | | (0.18 | ) | | | (0.19 | ) | | | (0.23 | ) |
Net asset value, end of period | | | $8.00 | | | | $8.07 | | | | $8.10 | | | | $8.07 | | | | $8.20 | |
Total return1 | | | 1.36 | % | | | 1.75 | % | | | 2.60 | % | | | 0.70 | % | | | 2.62 | % |
Ratios to average net assets (annualized) | | | | | | | | | | | | | | | | | | | | |
Gross expenses | | | 1.68 | % | | | 1.67 | % | | | 1.67 | % | | | 1.67 | % | | | 1.66 | % |
Net expenses | | | 1.56 | % | | | 1.56 | % | | | 1.56 | % | | | 1.56 | % | | | 1.56 | % |
Net investment income | | | 2.21 | % | | | 2.11 | % | | | 2.20 | % | | | 2.36 | % | | | 2.52 | % |
Supplemental data | | | | | | | | | | | | | | | | | | | | |
Portfolio turnover rate | | | 34 | % | | | 35 | % | | | 32 | % | | | 40 | % | | | 28 | % |
Net assets, end of period (000s omitted) | | | $77,169 | | | | $111,268 | | | | $123,745 | | | | $123,521 | | | | $143,444 | |
| 1 | Total return calculations do not include any sales charges. |
The accompanying notes are an integral part of these financial statements.
| | | | | | |
| Financial highlights | | Wells Fargo Short-Term High Yield Bond Fund | | | 23 | |
(For a share outstanding throughout each period)
| | | | | | | | | | | | | | | | | | | | |
| | | Year ended August 31 | |
| ADMINISTRATOR CLASS | | 2018 | | | 2017 | | | 2016 | | | 2015 | | | 2014 | |
Net asset value, beginning of period | | | $8.07 | | | | $8.10 | | | | $8.07 | | | | $8.20 | | | | $8.20 | |
Net investment income | | | 0.25 | | | | 0.24 | | | | 0.25 | | | | 0.26 | | | | 0.28 | |
Net realized and unrealized gains (losses) on investments | | | (0.08 | ) | | | (0.03 | ) | | | 0.03 | | | | (0.13 | ) | | | 0.02 | |
| | | | | | | | | | | | | | | | | | | | |
Total from investment operations | | | 0.17 | | | | 0.21 | | | | 0.28 | | | | 0.13 | | | | 0.30 | |
Distributions to shareholders from | | | | | | | | | | | | | | | | | | | | |
Net investment income | | | (0.25 | ) | | | (0.24 | ) | | | (0.25 | ) | | | (0.26 | ) | | | (0.28 | ) |
Net realized gains | | | 0.00 | | | | 0.00 | | | | 0.00 | | | | 0.00 | | | | (0.02 | ) |
| | | | | | | | | | | | | | | | | | | | |
Total distributions to shareholders | | | (0.25 | ) | | | (0.24 | ) | | | (0.25 | ) | | | (0.26 | ) | | | (0.30 | ) |
Net asset value, end of period | | | $7.99 | | | | $8.07 | | | | $8.10 | | | | $8.07 | | | | $8.20 | |
Total return | | | 2.16 | % | | | 2.68 | % | | | 3.54 | % | | | 1.62 | % | | | 3.69 | % |
Ratios to average net assets (annualized) | | | | | | | | | | | | | | | | | | | | |
Gross expenses | | | 0.86 | % | | | 0.86 | % | | | 0.86 | % | | | 0.85 | % | | | 0.84 | % |
Net expenses | | | 0.65 | % | | | 0.65 | % | | | 0.65 | % | | | 0.65 | % | | | 0.65 | % |
Net investment income | | | 3.13 | % | | | 3.03 | % | | | 3.11 | % | | | 3.28 | % | | | 3.44 | % |
Supplemental data | | | | | | | | | | | | | | | | | | | | |
Portfolio turnover rate | | | 34 | % | | | 35 | % | | | 32 | % | | | 40 | % | | | 28 | % |
Net assets, end of period (000s omitted) | | | $102,673 | | | | $134,070 | | | | $274,878 | | | | $328,934 | | | | $509,059 | |
The accompanying notes are an integral part of these financial statements.
| | | | |
| 24 | | Wells Fargo Short-Term High Yield Bond Fund | | Financial highlights |
(For a share outstanding throughout each period)
| | | | | | | | | | | | | | | | | | | | |
| | | Year ended August 31 | |
| INSTITUTIONAL CLASS | | 2018 | | | 2017 | | | 2016 | | | 2015 | | | 2014 | |
Net asset value, beginning of period | | | $8.06 | | | | $8.09 | | | | $8.06 | | | | $8.18 | | | | $8.19 | |
Net investment income | | | 0.27 | | | | 0.25 | | | | 0.26 | | | | 0.28 | | | | 0.29 | |
Net realized and unrealized gains (losses) on investments | | | (0.08 | ) | | | (0.02 | ) | | | 0.03 | | | | (0.13 | ) | | | 0.01 | |
| | | | | | | | | | | | | | | | | | | | |
Total from investment operations | | | 0.19 | | | | 0.23 | | | | 0.29 | | | | 0.15 | | | | 0.30 | |
Distributions to shareholders from | | | | | | | | | | | | | | | | | | | | |
Net investment income | | | (0.27 | ) | | | (0.26 | ) | | | (0.26 | ) | | | (0.27 | ) | | | (0.29 | ) |
Net realized gains | | | 0.00 | | | | 0.00 | | | | 0.00 | | | | 0.00 | | | | (0.02 | ) |
| | | | | | | | | | | | | | | | | | | | |
Total distributions to shareholders | | | (0.27 | ) | | | (0.26 | ) | | | (0.26 | ) | | | (0.27 | ) | | | (0.31 | ) |
Net asset value, end of period | | | $7.98 | | | | $8.06 | | | | $8.09 | | | | $8.06 | | | | $8.18 | |
Total return | | | 2.31 | % | | | 2.83 | % | | | 3.69 | % | | | 1.90 | % | | | 3.72 | % |
Ratios to average net assets (annualized) | | | | | | | | | | | | | | | | | | | | |
Gross expenses | | | 0.59 | % | | | 0.59 | % | | | 0.59 | % | | | 0.59 | % | | | 0.58 | % |
Net expenses | | | 0.50 | % | | | 0.50 | % | | | 0.50 | % | | | 0.50 | % | | | 0.50 | % |
Net investment income | | | 3.27 | % | | | 3.16 | % | | | 3.26 | % | | | 3.40 | % | | | 3.58 | % |
Supplemental data | | | | | | | | | | | | | | | | | | | | |
Portfolio turnover rate | | | 34 | % | | | 35 | % | | | 32 | % | | | 40 | % | | | 28 | % |
Net assets, end of period (000s omitted) | | | $764,680 | | | | $1,010,757 | | | | $735,285 | | | | $608,704 | | | | $540,824 | |
The accompanying notes are an integral part of these financial statements.
| | | | | | |
| Notes to financial statements | | Wells Fargo Short-Term High Yield Bond Fund | | | 25 | |
1. ORGANIZATION
Wells Fargo Funds Trust (the “Trust”), a Delaware statutory trust organized on March 10, 1999, is an open-end management investment company registered under the Investment Company Act of 1940, as amended (the “1940 Act”). As an investment company, the Trust follows the accounting and reporting guidance in Financial Accounting Standards Board (“FASB”) Accounting Standards Codification Topic 946, Financial Services – Investment Companies. These financial statements report on the Wells Fargo Short-Term High Yield Bond Fund (the “Fund”) which is a diversified series of the Trust.
2. SIGNIFICANT ACCOUNTING POLICIES
The following significant accounting policies, which are consistently followed in the preparation of the financial statements of the Fund, are in conformity with U.S. generally accepted accounting principles which require management to make estimates and assumptions that affect the reported amounts of assets and liabilities, disclosure of contingent assets and liabilities at the date of the financial statements, and the reported amounts of revenues and expenses during the reporting period. Actual results could differ from those estimates.
Securities valuation
All investments are valued each business day as of the close of regular trading on the New York Stock Exchange (generally 4 p.m. Eastern Time), although the Fund may deviate from this calculation time under unusual or unexpected circumstances.
Debt securities are valued at the evaluated bid price provided by an independent pricing service or, if a reliable price is not available, the quoted bid price from an independent broker-dealer.
Investments in registered open-end investment companies are valued at net asset value. Interests in non-registered investment companies that are redeemable at net asset value are fair valued normally at net asset value.
Investments which are not valued using any of the methods discussed above are valued at their fair value, as determined in good faith by the Board of Trustees of the Fund. The Board of Trustees has established a Valuation Committee comprised of the Trustees and has delegated to it the authority to take any actions regarding the valuation of portfolio securities that the Valuation Committee deems necessary or appropriate, including determining the fair value of portfolio securities, unless the determination has been delegated to the Wells Fargo Asset Management Pricing Committee at Wells Fargo Funds Management, LLC (“Funds Management”). The Board of Trustees retains the authority to make or ratify any valuation decisions or approve any changes to the Valuation Procedures as it deems appropriate. On a quarterly basis, the Board of Trustees receives reports on any valuation actions taken by the Valuation Committee or the Wells Fargo Asset Management Pricing Committee which may include items for ratification.
Valuations of fair valued securities are compared to the next actual sales price when available, or other appropriate market values, to assess the continued appropriateness of the fair valuation methodologies used. These securities are fair valued on a day-to-day basis, taking into consideration changes to appropriate market information and any significant changes to the inputs considered in the valuation process until there is a readily available price provided on an exchange or by an independent pricing service. Valuations received from an independent pricing service or independent broker-dealer quotes are periodically validated by comparisons to most recent trades and valuations provided by other independent pricing services in addition to the review of prices by the manager and/or subadviser. Unobservable inputs used in determining fair valuations are identified based on the type of security, taking into consideration factors utilized by market participants in valuing the investment, knowledge about the issuer and the current market environment.
Securities lending
The Fund may lend its securities from time to time in order to earn additional income in the form of fees or interest on securities received as collateral or the investment of any cash received as collateral. The Fund continues to receive interest or dividends on the securities loaned. The Fund receives collateral in the form of cash or securities with a value at least equal to the value of the securities on loan. The value of the loaned securities is determined at the close of each business day and any additional required collateral is delivered to the Fund on the next business day. In a securities lending transaction, the net asset value of the Fund will be affected by an increase or decrease in the value of the securities loaned and by an increase or decrease in the value of the instrument in which collateral is invested. The amount of securities lending activity undertaken by the Fund fluctuates from time to time. In the event of default or bankruptcy by the borrower, the Fund may be prevented from recovering the loaned securities or gaining access to the collateral or may experience delays or costs in doing so. In addition, the investment of any cash collateral received may lose all or part of its value. The Fund has the right under the lending agreement to recover the securities from the borrower on demand.
| | | | |
| 26 | | Wells Fargo Short-Term High Yield Bond Fund | | Notes to financial statements |
The Fund lends its securities through an unaffiliated securities lending agent. Cash collateral received in connection with its securities lending transactions is invested in Securities Lending Cash Investments, LLC (the “Securities Lending Fund”). The Securities Lending Fund is exempt from registration under Section 3(c)(7) of the 1940 Act and is managed by Funds Management and is subadvised by Wells Capital Management Incorporated (“WellsCap”), an affiliate of Funds Management and an indirect wholly owned subsidiary of Wells Fargo & Company (“Wells Fargo”). Funds Management receives an advisory fee starting at 0.05% and declining to 0.01% as the average daily net assets of the Securities Lending Fund increase. All of the fees received by Funds Management are paid to WellsCap for its services as subadviser. The Securities Lending Fund seeks to provide a positive return compared to the daily Fed Funds Open Rate by investing in high-quality, U.S. dollar-denominated short-term money market instruments. Securities Lending Fund investments are valued at the evaluated bid price provided by an independent pricing service. Income earned from investment in the Securities Lending Fund, if any, is included in income from affiliated securities on the Statement of Operations.
Loans
The Fund may invest in direct debt instruments which are interests in amounts owed to lenders by corporate or other borrowers. The loans pay interest at rates which are periodically reset by reference to a base lending rate plus a spread. Investments in loans may be in the form of participations in loans or assignments of all or a portion of loans from third parties. When the Fund purchases participations, it generally has no rights to enforce compliance with terms of the loan agreement with the borrower. As a result, the Fund assumes the credit risk of both the borrower and the lender that is selling the participation. When the Fund purchases assignments from lenders, it acquires direct rights against the borrower on the loan and may enforce compliance by the borrower with the terms of the loan agreement. Loans may include fully funded term loans or unfunded loan commitments, which are contractual obligations for future funding.
Security transactions and income recognition
Securities transactions are recorded on a trade date basis. Realized gains or losses are recorded on the basis of identified cost.
Interest income is accrued daily and bond discounts are accreted and premiums are amortized daily. To the extent debt obligations are placed on non-accrual status, any related interest income may be reduced by writing off interest receivables when the collection of all or a portion of interest has been determined to be doubtful based on consistently applied procedures and the fair value has decreased. If the issuer subsequently resumes interest payments or when the collectability of interest is reasonably assured, the debt obligation is removed from non-accrual status.
Distributions to shareholders
Distributions to shareholders from net investment income are declared daily and paid monthly. Distributions from net realized gains, if any, are recorded on the ex-dividend date and paid at least annually. Such distributions are determined in accordance with income tax regulations and may differ from U.S. generally accepted accounting principles. Dividend sources are estimated at the time of declaration. The tax character of distributions is determined as of the Fund’s fiscal year end. Therefore, a portion of the Fund’s distributions made prior to the Fund’s fiscal year end may be categorized as a tax return of capital at year end
Federal and other taxes
The Fund intends to continue to qualify as a regulated investment company by distributing substantially all of its investment company taxable income and any net realized capital gains (after reduction for capital loss carryforwards) sufficient to relieve it from all, or substantially all, federal income taxes. Accordingly, no provision for federal income taxes was required.
The Fund’s income and federal excise tax returns and all financial records supporting those returns for the prior three fiscal years are subject to examination by the federal and Delaware revenue authorities. Management has analyzed the Fund’s tax positions taken on federal, state, and foreign tax returns for all open tax years and does not believe that there are any uncertain tax positions that require recognition of a tax liability.
As of August 31, 2018, the aggregate cost of all investments for federal income tax purposes was $1,077,126,157 and the unrealized gains (losses) consisted of:
| | | | |
Gross unrealized gains | | $ | 281,241 | |
Gross unrealized losses | | | (9,455,224 | ) |
Net unrealized losses | | $ | (9,173,983 | ) |
| | | | | | |
| Notes to financial statements | | Wells Fargo Short-Term High Yield Bond Fund | | | 27 | |
As of August 31, 2018, the Fund had capital loss carryforwards available to offset future net realized capital gains which consist of $11,356,983 in short-term capital losses and $23,380,190 in long-term capital losses.
Class allocations
The separate classes of shares offered by the Fund differ principally in applicable sales charges, distribution, shareholder servicing, and administration fees. Class specific expenses are charged directly to that share class. Investment income, common expenses, and realized and unrealized gains (losses) on investments are allocated daily to each class of shares based on the relative proportion of net assets of each class.
3. FAIR VALUATION MEASUREMENTS
Fair value measurements of investments are determined within a framework that has established a fair value hierarchy based upon the various data inputs utilized in determining the value of the Fund’s investments. The three-level hierarchy gives the highest priority to unadjusted quoted prices in active markets for identical assets or liabilities (Level 1) and the lowest priority to unobservable inputs (Level 3). The Fund’s investments are classified within the fair value hierarchy based on the lowest level of input that is significant to the fair value measurement. The inputs are summarized into three broad levels as follows:
| ∎ | | Level 1 – quoted prices in active markets for identical securities |
| ∎ | | Level 2 – other significant observable inputs (including quoted prices for similar securities, interest rates, prepayment speeds, credit risk, etc.) |
| ∎ | | Level 3 – significant unobservable inputs (including the Fund’s own assumptions in determining the fair value of investments) |
The inputs or methodologies used for valuing investments in securities are not necessarily an indication of the risk associated with investing in those securities.
The following is a summary of the inputs used in valuing the Fund’s assets and liabilities as of August 31, 2018:
| | | | | | | | | | | | | | | | |
| | | Quoted prices
(Level 1) | | | Other significant
observable inputs
(Level 2) | | | Significant
unobservable inputs (Level 3) | | | Total | |
Assets | | | | | | | | | | | | | | | | |
Investments in: | | | | | | | | | | | | | | | | |
| | | | |
Corporate bonds and notes | | $ | 0 | | | $ | 574,107,831 | | | $ | 0 | | | $ | 574,107,831 | |
| | | | |
Loans | | | 0 | | | | 345,280,574 | | | | 6,104,686 | | | | 351,385,260 | |
| | | | |
Non-agency mortgage-backed securities | | | 0 | | | | 24,221 | | | | 0 | | | | 24,221 | |
| | | | |
Yankee corporate bonds and notes | | | 0 | | | | 93,894,985 | | | | 0 | | | | 93,894,985 | |
| | | | |
Short-term investments | | | | | | | | | | | | | | | | |
Investment companies | | | 48,392,907 | | | | 0 | | | | 0 | | | | 48,392,907 | |
Investments measured at net asset value* | | | | | | | | | | | | | | | 146,970 | |
Total assets | | $ | 48,392,907 | | | $ | 1,013,307,611 | | | $ | 6,104,686 | | | $ | 1,067,952,174 | |
| * | Investments that are measured at fair value using the net asset value per share (or its equivalent) as a practical expedient have not been categorized in the fair value hierarchy. The fair value amount presented in the table is intended to permit reconciliation of the fair value hierarchy to the amounts presented in the Statement of Assets and Liabilities. The Fund’s investment in Securities Lending Cash Investments, LLC valued at $146,970 does not have a redemption period notice, can be redeemed daily and does not have any unfunded commitments. |
Additional sector, industry or geographic detail is included in the Portfolio of Investments.
The Fund recognizes transfers between levels within the fair value hierarchy at the end of the reporting period. At August 31, 2018, the Fund did not have any transfers into/out of Level 1, Level 2, or Level 3.
4. TRANSACTIONS WITH AFFILIATES
Management fee
Funds Management, an indirect wholly owned subsidiary of Wells Fargo, is the manager of the Fund and provides advisory and fund-level administrative services under an investment management agreement. Under the investment
| | | | |
| 28 | | Wells Fargo Short-Term High Yield Bond Fund | | Notes to financial statements |
management agreement, Funds Management is responsible for, among other services, implementing the investment objectives and strategies of the Fund, supervising the subadviser and providing fund-level administrative services in connection with the Fund’s operations. As compensation for its services under the investment management agreement, Funds Management is entitled to receive an annual management fee starting at 0.50% and declining to 0.38% as the average daily net assets of the Fund increase. For the year ended August 31, 2018, the management fee was equivalent to an annual rate of 0.48% of the Fund’s average daily net assets.
Funds Management has retained the services of a subadviser to provide daily portfolio management to the Fund. The fee for subadvisory services is borne by Funds Management. WellsCap is the subadviser to the Fund and is entitled to receive a fee from Funds Management at an annual rate starting at 0.35% and declining to 0.20% as the average daily net assets of the Fund increase.
Administration fees
Under a class-level administration agreement, Funds Management provides class-level administrative services to the Fund, which includes paying fees and expenses for services provided by the transfer agent, sub-transfer agents, omnibus account servicers and record-keepers. As compensation for its services under the class-level administration agreement, Funds Management receives an annual fee which is calculated based on the average daily net assets of each class as follows:
| | | | |
| | | Class-level
administration fee | |
Class A, Class C | | | 0.16 | % |
Administrator Class | | | 0.10 | |
Institutional Class | | | 0.08 | |
Funds Management has contractually waived and/or reimbursed management and administration fees to the extent necessary to maintain certain net operating expense ratios for the Fund. When each class of the Fund has exceeded its expense cap, Funds Management has waived fees and/or reimbursed expenses from fund level expenses on a proportionate basis and then from class specific expenses; otherwise, waivers and/or reimbursements are applied against class specific expenses before fund level expenses. Funds Management has committed through December 31, 2018 to waive fees and/or reimburse expenses to the extent necessary to cap the Fund’s expenses at 0.81% for Class A shares, 1.56% for Class C shares, 0.65% for Administrator Class shares, and 0.50% for Institutional Class shares. After this time, the cap may be increased or the commitment to maintain the cap may be terminated only with the approval of the Board of Trustees.
Distribution fee
The Trust has adopted a distribution plan for Class C shares of the Fund pursuant to Rule 12b-1 under the 1940 Act. A distribution fee is charged to Class C shares and paid to Wells Fargo Funds Distributor, LLC (“Funds Distributor”), the principal underwriter, at an annual rate of 0.75% of the average daily net assets of Class C shares.
In addition, Funds Distributor is entitled to receive the front-end sales charge from the purchase of Class A shares and a contingent deferred sales charge on the redemption of certain Class A shares. Funds Distributor is also entitled to receive the contingent deferred sales charges from redemptions of Class C shares. For the year ended August 31, 2018, Funds Distributor received $1,593 from the sale of Class A shares and $150 in contingent deferred sales charges from redemptions of Class C shares. No contingent deferred sales charges were incurred by Class A shares for the year ended August 31, 2018.
Shareholder servicing fees
The Trust has entered into contracts with one or more shareholder servicing agents, whereby Class A, Class C, and Administrator Class of the Fund are charged a fee at an annual rate of 0.25% of the average daily net assets of each respective class.
A portion of these total shareholder servicing fees were paid to affiliates of Wells Fargo.
Interfund transactions
The Fund may purchase or sell portfolio investment securities to certain other Wells Fargo affiliates pursuant to Rule 17a-7 under the 1940 Act and under procedures adopted by the Board of Trustees. The procedures have been designed to ensure that these interfund transactions, which do not incur broker commissions, are effected at current market prices.
| | | | | | |
| Notes to financial statements | | Wells Fargo Short-Term High Yield Bond Fund | | | 29 | |
5. INVESTMENT PORTFOLIO TRANSACTIONS
Purchases and sales of investments, excluding U.S. government obligations (if any) and short-term securities, for the year ended August 31, 2018 were $404,734,481 and $558,284,572, respectively.
6. BANK BORROWINGS
The Trust (excluding the money market funds), Wells Fargo Master Trust and Wells Fargo Variable Trust are parties to a $280,000,000 revolving credit agreement whereby the Fund is permitted to use bank borrowings for temporary or emergency purposes, such as to fund shareholder redemption requests. Interest under the credit agreement is charged to the Fund based on a borrowing rate equal to the higher of the Federal Funds rate in effect on that day plus 1.25% or the overnight LIBOR rate in effect on that day plus 1.25%. In addition, an annual commitment fee equal to 0.25% of the unused balance is allocated to each participating fund.
For the year ended August 31, 2018, there were no borrowings by the Fund under the agreement.
7. DISTRIBUTIONS TO SHAREHOLDERS
The tax character of distributions paid was $39,073,480 and $43,836,670 of ordinary income for the years ended August 31, 2018 and August 31, 2017, respectively.
As of August 31, 2018, the components of distributable earnings on a tax basis were as follows:
| | | | |
Undistributed
ordinary
income | | Unrealized
losses | | Capital loss
carryforward |
| $197,733 | | $(9,173,983) | | $(34,737,173) |
8. INDEMNIFICATION
Under the Trust’s organizational documents, the officers and Trustees have been granted certain indemnification rights against certain liabilities that may arise out of performance of their duties to the Trust. Additionally, in the normal course of business, the Trust may enter into contracts with service providers that contain a variety of indemnification clauses. The Trust’s maximum exposure under these arrangements is dependent on future claims that may be made against the Fund and, therefore, cannot be estimated.
9. NEW ACCOUNTING PRONOUNCEMENTS AND REGULATORY CHANGES
On August 17, 2018, the Securities and Exchange Commission (“SEC”) adopted Disclosure Update and Simplification, which amends certain disclosure requirements. The amendments are effective for filings subsequent to November 5, 2018. Management expects these amendments will impact the classification of disclosures in the financial statements.
In August 2018, FASB issued ASU No. 2018-13, Fair Value Measurement (Topic 820) Disclosure Framework—Changes to the Disclosure Requirements for Fair Value Measurement. ASU 2018-13 updates the disclosure requirements for fair value measurements by modifying or removing certain disclosures and adding certain new disclosures. The amendments are effective for fiscal years, and interim periods within those fiscal years, beginning after December 15, 2019. Early adoption is permitted. Management is currently evaluating the potential impact of this new guidance to the financial statements.
In March 2017, FASB issued ASU No. 2017-08, Premium Amortization on Purchased Callable Debt Securities. ASU 2017-08 shortens the amortization period for certain callable debt securities held at a premium. The amendments require the premium to be amortized to the earliest call date. The amendments do not require an accounting change for securities held at a discount; the discount continues to be amortized to maturity. ASU 2017-08 is effective for fiscal years beginning after December 15, 2018 and for interim periods within those fiscal years. Management is currently evaluating the potential impact of this new guidance to the financial statements.
| | | | |
| 30 | | Wells Fargo Short-Term High Yield Bond Fund | | Report of independent registered public accounting firm |
BOARD OF TRUSTEES AND SHAREHOLDERS OF WELLS FARGO FUNDS TRUST:
Opinion on the Financial Statements
We have audited the accompanying statement of assets and liabilities of Wells Fargo Short-Term High Yield Bond Fund (the “Fund”), including the portfolio of investments, as of August 31, 2018, the related statement of operations for the year then ended, the statements of changes in net assets for each of the years in the two-year period then ended, and the related notes (collectively, the “financial statements”) and the financial highlights for each of the years in the five-year period then ended. In our opinion, the financial statements and financial highlights present fairly, in all material respects, the financial position of the Fund as of August 31, 2018, the results of its operations for the year then ended, the changes in its net assets for each of the years in the two-year period then ended, and the financial highlights for each of the years in the five-year period then ended, in conformity with U.S. generally accepted accounting principles.
Basis for Opinion
These financial statements and financial highlights are the responsibility of the Fund’s management. Our responsibility is to express an opinion on these financial statements and financial highlights based on our audits. We are a public accounting firm registered with the Public Company Accounting Oversight Board (United States) (“PCAOB”) and are required to be independent with respect to the Fund in accordance with the U.S. federal securities laws and the applicable rules and regulations of the Securities and Exchange Commission and the PCAOB.
We conducted our audits in accordance with the standards of the PCAOB. Those standards require that we plan and perform the audit to obtain reasonable assurance about whether the financial statements and financial highlights are free of material misstatement, whether due to error or fraud. Our audits included performing procedures to assess the risks of material misstatement of the financial statements and financial highlights, whether due to error or fraud, and performing procedures that respond to those risks. Such procedures included examining, on a test basis, evidence regarding the amounts and disclosures in the financial statements and financial highlights. Such procedures also included confirmation of securities owned as of August 31, 2018, by correspondence with the custodian and brokers, or by other appropriate auditing procedures. Our audits also included evaluating the accounting principles used and significant estimates made by management, as well as evaluating the overall presentation of the financial statements and financial highlights. We believe that our audits provide a reasonable basis for our opinion.

We have not been able to determine the specific year that we began serving as the auditor of one or more Wells Fargo Funds investment companies, however we are aware that we have served as the auditor of one or more Wells Fargo Funds investment companies since at least 1955.
Boston, Massachusetts
October 26, 2018
| | | | | | |
| Other information (unaudited) | | Wells Fargo Short-Term High Yield Bond Fund | | | 31 | |
TAX INFORMATION
For the fiscal year ended August 31, 2018, $22,400,790 has been designated as interest-related dividends for nonresident alien shareholders pursuant to Section 871 of the Internal Revenue Code.
PROXY VOTING INFORMATION
A description of the policies and procedures that the Fund uses to determine how to vote proxies relating to portfolio securities is available, upon request, by calling 1-800-222-8222, visiting our website at wellsfargofunds.com, or visiting the SEC website at sec.gov. Information regarding how the Fund voted proxies relating to portfolio securities during the most recent 12-month period ended June 30 is available on the Fund’s website at wellsfargofunds.com or by visiting the SEC website at sec.gov.
PORTFOLIO HOLDINGS INFORMATION
The complete portfolio holdings for the Fund are publicly available monthly on the Fund’s website (wellsfargofunds.com), on a one-month delayed basis. In addition, top ten holdings information (excluding derivative positions) for the Fund is publicly available on the Fund’s website on a monthly, seven-day or more delayed basis. The Fund files its complete schedule of portfolio holdings with the SEC for the first and third quarters of each fiscal year on Form N-Q, which is available by visiting the SEC website at sec.gov. In addition, the Fund’s Form N-Q may be reviewed and copied at the SEC’s Public Reference Room in Washington, DC, and at regional offices in New York City, at 233 Broadway, and in Chicago, at 175 West Jackson Boulevard, Suite 900. Information about the Public Reference Room may be obtained by calling 1-800-SEC-0330.
| | | | |
| 32 | | Wells Fargo Short-Term High Yield Bond Fund | | Other information (unaudited) |
BOARD OF TRUSTEES AND OFFICERS
Each of the Trustees and Officers1 listed in the table below acts in identical capacities for each fund in the Wells Fargo family of funds, which consists of 154 mutual funds comprising the Wells Fargo Funds Trust, Wells Fargo Variable Trust, Wells Fargo Master Trust and four closed-end funds (collectively the “Fund Complex”). This table should be read in conjunction with the Prospectus and the Statement of Additional Information2. The mailing address of each Trustee and Officer is 525 Market Street, 12th Floor, San Francisco, CA 94105. Each Trustee and Officer serves an indefinite term, however, each Trustee serves such term until reaching the mandatory retirement age established by the Trustees.
Independent Trustees
| | | | | | |
Name and year of birth | | Position held and
length of service* | | Principal occupations during past five years or longer | | Current other public company or
investment company
directorships |
William R. Ebsworth (Born 1957) | | Trustee, since 2015 | | Retired. From 1984 to 2013, equities analyst, portfolio manager, research director and chief investment officer at Fidelity Management and Research Company in Boston, Tokyo, and Hong Kong, and retired in 2013 as Chief Investment Officer of Fidelity Strategic Advisers, Inc. where he led a team of investment professionals managing client assets. Prior thereto, Board member of Hong Kong Securities Clearing Co., Hong Kong Options Clearing Corp., the Thailand International Fund, Ltd., Fidelity Investments Life Insurance Company, and Empire Fidelity Investments Life Insurance Company. Board member of the Vincent Memorial Hospital Endowment (non-profit organization), where he serves on the Investment Committee and as a Chair of the Audit Committee. Mr. Ebsworth is a CFA® charterholder. | | N/A |
Jane A. Freeman (Born 1953) | | Trustee, since 2015; Chair Liaison, since 2018 | | Retired. From 2012 to 2014 and 1999 to 2008, Chief Financial Officer of Scientific Learning Corporation. From 2008 to 2012, Ms. Freeman provided consulting services related to strategic business projects. Prior to 1999, Portfolio Manager at Rockefeller & Co. and Scudder, Stevens & Clark. Board member of the Harding Loevner Funds from 1996 to 2014, serving as both Lead Independent Director and chair of the Audit Committee. Board member of the Russell Exchange Traded Funds Trust from 2011 to 2012 and the chair of the Audit Committee. Ms. Freeman is a Board Member of The Ruth Bancroft Garden (non-profit organization). She is also an inactive Chartered Financial Analyst. | | N/A |
Isaiah Harris, Jr. (Born 1952) | | Trustee, since 2009 | | Retired. Chairman of the Board of CIGNA Corporation since 2009, and Director since 2005. From 2003 to 2011, Director of Deluxe Corporation. Prior thereto, President and CEO of BellSouth Advertising and Publishing Corp. from 2005 to 2007, President and CEO of BellSouth Enterprises from 2004 to 2005 and President of BellSouth Consumer Services from 2000 to 2003. Emeritus member of the Iowa State University Foundation Board of Governors. Emeritus Member of the Advisory Board of Iowa State University School of Business. Advisory Board Member, Palm Harbor Academy (private school). Advisory Board Member, Child Evangelism Fellowship (non-profit). Mr. Harris is a certified public accountant (inactive status). | | CIGNA Corporation |
Judith M. Johnson (Born 1949) | | Trustee, since 2008; Audit Committee Chairman, since 2009 | | Retired. Prior thereto, Chief Executive Officer and Chief Investment Officer of Minneapolis Employees Retirement Fund from 1996 to 2008. Ms. Johnson is an attorney, certified public accountant and a certified managerial accountant. | | N/A |
David F. Larcker (Born 1950) | | Trustee, since 2009 | | James Irvin Miller Professor of Accounting at the Graduate School of Business, Stanford University, Director of the Corporate Governance Research Initiative and Senior Faculty of The Rock Center for Corporate Governance since 2006. From 2005 to 2008, Professor of Accounting at the Graduate School of Business, Stanford University. Prior thereto, Ernst & Young Professor of Accounting at The Wharton School, University of Pennsylvania from 1985 to 2005. | | N/A |
| | | | | | |
| Other information (unaudited) | | Wells Fargo Short-Term High Yield Bond Fund | | | 33 | |
| | | | | | |
Name and year of birth | | Position held and
length of service* | | Principal occupations during past five years or longer | | Current other public company or
investment company
directorships |
Olivia S. Mitchell (Born 1953) | | Trustee, since 2006; Governance Committee Chairman, since 2018 | | International Foundation of Employee Benefit Plans Professor, Wharton School of the University of Pennsylvania since 1993. Director of Wharton’s Pension Research Council and Boettner Center on Pensions & Retirement Research, and Research Associate at the National Bureau of Economic Research. Previously, Cornell University Professor from 1978 to 1993. | | N/A |
Timothy J. Penny (Born 1951) | | Trustee, since 1996; Chairman, since 2018; Vice Chairman, from 2017 to 2018 | | President and Chief Executive Officer of Southern Minnesota Initiative Foundation, a non-profit organization, since 2007. Member of the Board of Trustees of NorthStar Education Finance, Inc., a non-profit organization, since 2007. | | N/A |
James G. Polisson (Born 1959) | | Trustee, since 2018; Advisory Board Member, from 2017 to 2018 | | Retired. Chief Marketing Officer, Source (ETF) UK Services, Ltd, from 2015 to 2017. From 2012 to 2015, Principal of The Polisson Group, LLC, a management consulting, corporate advisory and principal investing company. Chief Executive Officer and Managing Director at Russell Investments, Global Exchange Traded Funds from 2010 to 2012. Managing Director of Barclays Global Investors from 1998 to 2010 and Global Chief Marketing Officer for iShares and Barclays Global Investors from 2000 to 2010. Trustee of the San Francisco Mechanics’ Institute, a non-profit organization, from 2013 to 2015. Board member of the Russell Exchange Traded Fund Trust from 2011 to 2012. Director of Barclays Global Investors Holdings Deutschland GmbH from 2006 to 2009. Mr. Polisson is an attorney and has a retired status with the Massachusetts and District of Columbia Bar Associations. | | N/A |
| Michael S. Scofield (Born 1943) | | Trustee, since 2010 | | Served on the Investment Company Institute’s Board of Governors and Executive Committee from 2008-2011 as well the Governing Council of the Independent Directors Council from 2006-2011 and the Independent Directors Council Executive Committee from 2008-2011. Trustee of the Evergreen Fund complex (and its predecessors) from 1984 to 2010. Chairman of the Evergreen Funds from 2000-2010. Former Trustee of the Mentor Funds. Retired Attorney, Law Offices of Michael S. Scofield. | | N/A |
Pamela Wheelock (Born 1959) | | Trustee, since 2018; Advisory Board Member, from 2017 to 2018 | | Chief Operating Officer, Twin Cities Habitat for Humanity, since January, 2017. Vice President of University Services, University of Minnesota from 2012 to 2017. Prior thereto, on the Board of Directors, Governance Committee and Finance Committee for the Minnesota Philanthropy Partners (Saint Paul Foundation) from 2012 to 2018, Interim President and Chief Executive Officer of Blue Cross Blue Shield of Minnesota from 2010 to 2011, Chairman of the Board from 2009 to 2011 and Board Director from 2003 to 2015. Vice President, Leadership and Community Engagement, Bush Foundation, Saint Paul, Minnesota (a private foundation) from 2009 to 2011. Executive Vice President and Chief Financial Officer, Minnesota Sports and Entertainment from 2004 to 2009 and Senior Vice President from 2002 to 2004. Commissioner of Finance, State of Minnesota, from 1999 to 2002. Currently the Board Chair of the Minnesota Wild Foundation since 2010. | | N/A |
| * | Length of service dates reflect the Trustee’s commencement of service with the Trust’s predecessor entities, where applicable. |
| | | | |
| 34 | | Wells Fargo Short-Term High Yield Bond Fund | | Other information (unaudited) |
Officers
| | | | | | |
Name and year of birth | | Position held and
length of service | | Principal occupations during past five years or longer | | |
Andrew Owen (Born 1960) | | President, since 2017 | | Executive Vice President of Wells Fargo & Company and Head of Affiliated Managers, Wells Fargo Asset Management, since 2014. In addition, Mr. Owen is currently President, Chief Executive Officer and Director of Wells Fargo Funds Management, LLC since 2017. Prior thereto, Executive Vice President responsible for marketing, investments and product development for Wells Fargo Funds Management, LLC, from 2009 to 2014. | | |
Nancy Wiser1 (Born 1967) | | Treasurer, since 2012 | | Executive Vice President of Wells Fargo Funds Management, LLC since 2011. Chief Operating Officer and Chief Compliance Officer at LightBox Capital Management LLC, from 2008 to 2011. | | |
Alexander Kymn3 (Born 1973) | | Secretary, since 2018; Chief Legal Officer, since 2018 | | Senior Company Counsel of Wells Fargo Bank, N.A. since 2018 (previously Senior Counsel from 2007 to 2018). Vice President of Wells Fargo Funds Management, LLC from 2008 to 2014. | | |
| Michael H. Whitaker (Born 1967) | | Chief Compliance Officer, since 2016 | | Senior Vice President and Chief Compliance Officer since 2016. Senior Vice President and Chief Compliance Officer for Fidelity Investments from 2007 to 2016. | | |
David Berardi (Born 1975) | | Assistant Treasurer, since 2009 | | Vice President of Wells Fargo Funds Management, LLC since 2009. Vice President of Evergreen Investment Management Company, LLC from 2008 to 2010. Manager of Fund Reporting and Control for Evergreen Investment Management Company, LLC from 2004 to 2010. | | |
Jeremy DePalma1 (Born 1974) | | Assistant Treasurer, since 2009 | | Senior Vice President of Wells Fargo Funds Management, LLC since 2009. Senior Vice President of Evergreen Investment Management Company, LLC from 2008 to 2010 and head of the Fund Reporting and Control Team within Fund Administration from 2005 to 2010. | | |
| 1 | Nancy Wiser acts as Treasurer of 77 funds in the Fund Complex. Jeremy DePalma acts as Treasurer of 77 funds and Assistant Treasurer of 77 funds in the Fund Complex. |
| 2 | The Statement of Additional Information includes additional information about the Trustees and is available, without charge, upon request, by calling 1-800-222-8222 or by visiting the website at wellsfargofunds.com. |
| 3 | Alexander Kymn became the Secretary and Chief Legal Officer effective April 17, 2018. |
| | | | | | |
| Other information (unaudited) | | Wells Fargo Short-Term High Yield Bond Fund | | | 35 | |
BOARD CONSIDERATION OF INVESTMENT MANAGEMENT AND SUB-ADVISORY AGREEMENTS:
Wells Fargo Short-Term High Yield Bond Fund
Under the Investment Company Act of 1940 (the “1940 Act”), the Board of Trustees (the “Board”) of Wells Fargo Funds Trust (the “Trust”) must determine annually whether to approve the continuation of the Trust’s investment management and sub-advisory agreements. In this regard, at an in-person meeting held on May 22-23, 2018 (the “Meeting”), the Board, all the members of which have no direct or indirect interest in the investment management and sub-advisory agreements and are not “interested persons” of the Trust, as defined in the 1940 Act (the “Independent Trustees”), reviewed and approved for Wells Fargo Short-Term High Yield Bond Fund (the “Fund”): (i) an investment management agreement (the “Management Agreement”) with Wells Fargo Funds Management, LLC (“Funds Management”); and (ii) an investment sub-advisory agreement (the “Sub-Advisory Agreement”) with Wells Capital Management Incorporated (the “Sub-Adviser”), an affiliate of Funds Management. The Management Agreement and the Sub-Advisory Agreement are collectively referred to as the “Advisory Agreements.”
At the Meeting, the Board considered the factors and reached the conclusions described below relating to the selection of Funds Management and the Sub-Adviser and the approval of the Advisory Agreements. Prior to the Meeting, including at an in-person meeting in April 2018, the Trustees conferred extensively among themselves and with representatives of Funds Management about these matters. Also, the Board has adopted a team-based approach, with each team consisting of a sub-set of Trustees, to assist the full Board in the discharge of its duties in reviewing investment performance and other matters throughout the year. The Independent Trustees were assisted in their evaluation of the Advisory Agreements by independent legal counsel, from whom they received separate legal advice and with whom they met separately.
In providing information to the Board, Funds Management and the Sub-Adviser were guided by a detailed set of requests for information submitted to them by independent legal counsel on behalf of the Independent Trustees at the start of the Board’s annual contract renewal process earlier in 2018. In considering and approving the Advisory Agreements, the Trustees considered the information they believed relevant, including but not limited to the information discussed below. The Board considered not only the specific information presented in connection with the Meeting, but also the knowledge gained over time through interaction with Funds Management and the Sub-Adviser about various topics. In this regard, the Board reviewed reports of Funds Management at each of its quarterly meetings, which included, among other things, portfolio reviews and investment performance reports. In addition, the Board and the teams mentioned above confer with portfolio managers at various times throughout the year. The Board did not identify any particular information or consideration that was all-important or controlling, and each individual Trustee may have attributed different weights to various factors.
After its deliberations, the Board unanimously approved the continuation of the Advisory Agreements for a one-year term and determined that the compensation payable to Funds Management and the Sub-Adviser under each of the Advisory Agreements was reasonable. The Board considered the approval of the Advisory Agreements for the Fund as part of its consideration of agreements for funds across the complex, but its approvals were made on a fund-by-fund basis. The following summarizes a number of important, but not necessarily all, factors considered by the Board in support of its approvals.
Nature, extent and quality of services
The Board received and considered various information regarding the nature, extent and quality of services provided to the Fund by Funds Management and the Sub-Adviser under the Advisory Agreements. This information included a description of the investment advisory services and Fund-level administrative services covered by the Management Agreement, as well as, among other things, a summary of the background and experience of senior management of Wells Fargo Asset Management (“WFAM”), of which Funds Management and the Sub-Adviser are a part, a summary of investments made in the business of WFAM, a summary of certain organizational and personnel changes involving Funds Management and the Sub-Adviser, and a description of Funds Management’s and the Sub-Adviser’s business continuity planning programs and of their approaches to data privacy and cybersecurity. The Board also considered the qualifications, background, tenure and responsibilities of each of the portfolio managers primarily responsible for the day-to-day portfolio management of the Fund.
The Board evaluated the ability of Funds Management and the Sub-Adviser to attract and retain qualified investment professionals, including research, advisory and supervisory personnel. The Board further considered the compliance programs and compliance records of Funds Management and the Sub-Adviser. In addition, the Board took into account the full range of services provided to the Fund by Funds Management and its affiliates.
| | | | |
| 36 | | Wells Fargo Short-Term High Yield Bond Fund | | Other information (unaudited) |
Fund investment performance and expenses
The Board considered the investment performance results for the Fund over various time periods ended December 31, 2017. The Board considered these results in comparison to the investment performance of funds in a universe that was determined by Broadridge Inc. (“Broadridge”) to be similar to the Fund (the “Universe”), and in comparison to the Fund’s benchmark index and to other comparative data. Broadridge is an independent provider of investment company data. The Board received a description of the methodology used by Broadridge to select the mutual funds in the performance Universe. The Board noted that the investment performance of the Fund (Class A) was lower than the average investment performance of the Universe for all periods under review. The Board also noted that the investment performance of the Fund was lower than its benchmark index, the ICE BofAML 1-5 Year BB Cash Pay High Yield Index, for all periods under review.
The Board received information concerning, and discussed factors contributing to, the underperformance of the Fund relative to the Universe and benchmark for the periods identified above. The Board took note of the explanations for the relative underperformance during these periods, including with respect to investment decisions and market factors that affected the Fund’s investment performance.
The Board also received and considered information regarding the Fund’s net operating expense ratios and their various components, including actual management fees, custodian and other non-management fees, and Rule 12b-1 and non-Rule 12b-1 shareholder service fees. The Board considered these ratios in comparison to the median ratios of funds in class-specific expense groups that were determined by Broadridge to be similar to the Fund (the “Groups”). The Board received a description of the methodology used by Broadridge to select the mutual funds in the expense Groups and an explanation of how funds comprising expense groups and their expense ratios may vary from year-to-year. Based on the Broadridge reports, the Board noted that the net operating expense ratios of the Fund were lower than the median net operating expense ratios of the expense Groups for each share class.
The Board took into account the Fund’s investment performance and expense information provided to it among the factors considered in deciding to re-approve the Advisory Agreements.
Investment management and sub-advisory fee rates
The Board reviewed and considered the contractual fee rates payable by the Fund to Funds Management under the Management Agreement, as well as the contractual fee rates payable by the Fund to Funds Management for class-level administrative services under a Class-Level Administration Agreement, which include, among other things, class-level transfer agency and sub-transfer agency costs (collectively, the “Management Rates”). The Board also reviewed and considered the contractual investment sub-advisory fee rates that are payable by Funds Management to the Sub-Adviser for investment sub-advisory services.
Among other information reviewed by the Board was a comparison of the Fund’s Management Rates with the average contractual investment management fee rates of funds in the expense Groups at a common asset level as well as transfer agency costs of the funds in the expense Groups. The Board noted that the Management Rates of the Fund were lower than the sum of these average rates for the Fund’s expense Groups for all share classes.
The Board also received and considered information about the portion of the total management fee that was retained by Funds Management after payment of the fee to the Sub-Adviser for sub-advisory services. In assessing the reasonableness of this amount, the Board received and evaluated information about the nature and extent of responsibilities retained and risks assumed by Funds Management and not delegated to or assumed by the Sub-Adviser, and about Funds Management’s on-going oversight services. Given the affiliation between Funds Management and the Sub-Adviser, the Board ascribed limited relevance to the allocation of fees between them.
The Board also received and considered information about the nature and extent of services offered and fee rates charged by Funds Management and the Sub-Adviser to other types of clients with investment strategies similar to those of the Fund. In this regard, the Board received information about the significantly greater scope of services, and compliance, reporting and other legal burdens and risks of managing mutual funds compared with those associated with managing assets of non-mutual fund clients such as institutional separate accounts.
Based on its consideration of the factors and information it deemed relevant, including those described here, the Board determined that the compensation payable to Funds Management under the Management Agreement and to the Sub-Adviser under the Sub-Advisory Agreement was reasonable.
| | | | | | |
| Other information (unaudited) | | Wells Fargo Short-Term High Yield Bond Fund | | | 37 | |
Profitability
The Board received and considered information concerning the profitability of Funds Management, as well as the profitability of both WFAM and Wells Fargo & Co. (“Wells Fargo”) as a whole, from providing services to the Fund and the fund family as a whole. The Board noted that the Sub-Adviser’s profitability information with respect to providing services to the Fund was subsumed in the WFAM and Wells Fargo profitability analysis.
Funds Management reported on the methodologies and estimates used in calculating profitability, including a description of the methodology used to allocate certain expenses and recent enhancements made to the methodology. Among other things, the Board noted that the levels of profitability reported on a fund-by-fund basis varied widely, depending on factors such as the size and type of fund. Based on its review, the Board did not deem the profits reported by Funds Management, WFAM or Wells Fargo from services provided to the Fund to be at a level that would prevent it from approving the continuation of the Advisory Agreements.
Economies of scale
The Board considered the extent to which Funds Management may experience economies of scale in the provision of management services, and the extent to which scale benefits, if any, would be shared with shareholders. In particular, the Board noted the existence of breakpoints in the Fund’s management fee structure, which operate generally to reduce the Fund’s expense ratios as the Fund grows in size. It considered that, for a small fund or a fund that shrinks in size, breakpoints conversely can result in higher fee levels. The Board also considered that in addition to management fee breakpoints, competitive management fee rates set at the outset without regard to breakpoints and fee waiver and expense reimbursement arrangements, as well as investments in the business intended to enhance services available to Fund shareholders, are means of sharing potential economies of scale with shareholders of the Fund.
The Board concluded that the Fund’s fee and expense arrangements, including contractual breakpoints, constituted a reasonable approach to sharing potential economies of scale with the Fund and its shareholders.
Other benefits to Funds Management and the Sub-Adviser
The Board received and considered information regarding potential “fall-out” or ancillary benefits received by Funds Management and its affiliates, including the Sub-Adviser, as a result of their relationships with the Fund. Ancillary benefits could include, among others, benefits directly attributable to other relationships with the Fund and benefits potentially derived from an increase in Funds Management’s and the Sub-Adviser’s business as a result of their relationships with the Fund. The Board noted that various affiliates of Funds Management may receive distribution-related fees, shareholder servicing payments and sub-transfer agency fees in respect of shares sold or held through them and services provided.
The Board also reviewed information about soft dollar credits earned and utilized by the Sub-Adviser, fees earned by Funds Management and the Sub-Adviser from managing a private investment vehicle for the fund family’s securities lending collateral and commissions earned by an affiliated broker from portfolio transactions.
Based on its consideration of the factors and information it deemed relevant, including those described here, the Board did not find that any ancillary benefits received by Funds Management and its affiliates, including the Sub-Adviser, were unreasonable.
Conclusion
At the Meeting, after considering the above-described factors and based on its deliberations and its evaluation of the information described above, the Board unanimously approved the continuation of the Advisory Agreements for a one-year term and determined that the compensation payable to Funds Management and the Sub-Adviser under each of the Advisory Agreements was reasonable.
| | | | |
| 38 | | Wells Fargo Short-Term High Yield Bond Fund | | Appendix A (unaudited) |
SALES CHARGE REDUCTIONS AND WAIVERS FOR CERTAIN INTERMEDIARIES
Ameriprise
Effective June 1, 2018, shareholders purchasing Fund shares through an Ameriprise Financial platform or account will be eligible only for the following Class A load waivers (front-end sales charge waivers), which may differ from those disclosed elsewhere in the Fund’s prospectus or Statement of Additional Information.
Front-end Sales Load Waivers on Class A Shares Available at Ameriprise Financial
| | • | | Employer-sponsored retirement plans (e.g., 401(k) plans, 457 plans, employer-sponsored 403(b) plans, profit sharing and money purchase pension plans and defined benefit plans). For purposes of this provision, employer-sponsored retirement plans do not include SEP IRAs, Simple IRAs or SAR-SEPs. |
| | • | | Shares purchased through an Ameriprise Financial investment advisory program (if an Advisory or similar share class for such investment advisory program is not available) |
| | • | | Shares purchased by third party investment advisors on behalf of their advisory clients through Ameriprise Financial’s platform (if an Advisory or similar share class for such investment advisory program is not available) |
| | • | | Shares purchased through reinvestment of distributions and dividend reinvestment when purchasing shares of the same Fund (but not any other fund within the same fund family) |
| | • | | Shares exchanged from Class C shares of the same fund in the month of or following the 10-year anniversary of the purchase date. To the extent that the Fund’s prospectus elsewhere provides for a waiver with respect to such shares following a shorter holding period, that waiver will apply to exchanges following such shorter period. To the extent that the Fund’s prospectus elsewhere provides for a waiver with respect to exchanges of Class C shares for load-waived shares, that waiver will also apply to such exchanges. |
| | • | | Employees and registered representatives of Ameriprise Financial or its affiliates and their immediate family members |
| | • | | Shares purchased by or through qualified accounts (including IRAs, Coverdell Education Savings Accounts, 401(k)s, 403(b) TSCAs subject to ERISA and defined benefit plans) that are held by a covered family member, defined as an Ameriprise financial advisor and/or the advisor’s spouse, advisor’s lineal ascendant (mother, father, grandmother, grandfather, great grandmother, great grandfather), advisor’s lineal descendant (son, step-son, daughter, step-daughter, grandson, granddaughter, great grandson, great granddaughter) or any spouse of a covered family member who is a lineal descendant |
| | • | | Shares purchased from the proceeds of redemptions within the same fund family, provided (1) the repurchase occurs within 90 days following the redemption, (2) the redemption and purchase occur in the same account, and (3) redeemed shares were subject to a front-end or deferred sales load (i.e. Rights of Reinstatement). Subject to the Fund’s policy regarding frequent purchases and redemptions of Fund shares, you may not be able to repurchase shares for the first 30 days after your redemption. |
Automatic Exchange of Class C Shares Available at Ameriprise Financial
| | • | | Class C shares will automatically exchange to Class A shares in the month of the 10-year anniversary of the purchase date. |
Merrill Lynch
Effective April 10, 2017, shareholders purchasing Fund shares through a Merrill Lynch platform or account will be eligible only for the following load waivers (front-end sales charge waivers and contingent deferred, or back-end, sales charge waivers) and discounts, which may differ from those disclosed elsewhere in the Fund’s prospectus or Statement of Additional Information.
Front-end Sales Load Waivers on Class A Shares available at Merrill Lynch
| | • | | Employer-sponsored retirement, deferred compensation and employee benefit plans (including health savings accounts) and trusts used to fund those plans, provided that the shares are not held in a commission-based brokerage account and shares are held for the benefit of the plan |
| | • | | Shares purchased by or through a 529 Plan |
| | • | | Shares purchased through a Merrill Lynch affiliated investment advisory program |
| | | | | | |
| Appendix A (unaudited) | | Wells Fargo Short-Term High Yield Bond Fund | | | 39 | |
| | • | | Shares purchased by third party investment advisors on behalf of their advisory clients through Merrill Lynch’s platform |
| | • | | Shares of funds purchased through the Merrill Edge Self-Directed platform (if applicable) |
| | • | | Shares purchased through reinvestment of capital gains distributions and dividend reinvestment when purchasing shares of the same fund (but not any other fund within the fund family) |
| | • | | Shares exchanged from Class C (i.e. level-load) shares of the same fund in the month of or following the 10-year anniversary of the purchase date |
| | • | | Employees and registered representatives of Merrill Lynch or its affiliates and their family members, as defined by Merrill Lynch, which may differ from the definition of family member in the Fund’s prospectus. |
| | • | | Directors or Trustees of the Fund, and employees of the Fund’s investment adviser or any of its affiliates, as described in the Fund’s prospectus |
| | • | | Shares purchased from the proceeds of redemptions within the same fund family, provided (1) the repurchase occurs within 90 days following the redemption, (2) the redemption and purchase occur in the same account, and (3) redeemed shares were subject to a front-end or deferred sales load (known as Rights of Reinstatement). Subject to the Fund’s policy regarding frequent purchases and redemptions of Fund shares, you may not be able to repurchase shares for the first 30 days after your redemption. |
CDSC Waivers on A, B and C Shares available at Merrill Lynch
| | • | | Death or disability of the shareholder |
| | • | | Shares sold as part of a systematic withdrawal plan as described in the Fund’s prospectus |
| | • | | Return of excess contributions from an IRA Account |
| | • | | Shares sold as part of a required minimum distribution for IRA and retirement accounts due to the shareholder reaching age 70½ |
| | • | | Shares sold to pay Merrill Lynch fees but only if the transaction is initiated by Merrill Lynch |
| | • | | Shares acquired through a right of reinstatement |
| | • | | Shares held in retirement brokerage accounts, that are exchanged for a lower cost share class due to transfer to certain fee based accounts or platforms (applicable to A and C shares only) |
Front-end load Discounts Available at Merrill Lynch: Breakpoints, Rights of Accumulation & Letters of Intent
| | • | | Breakpoints as described in the Fund’s prospectus |
| | • | | Rights of Accumulation (ROA) which entitle shareholders to breakpoint discounts will be automatically calculated based on the aggregated holding of fund family assets held by accounts within the purchaser’s household at Merrill Lynch. Eligible fund family assets not held at Merrill Lynch may be included in the ROA calculation only if the shareholder notifies his or her financial advisor about such assets. |
| | • | | Letters of Intent (LOI) which allow for breakpoint discounts based on anticipated purchases within a fund family, through Merrill Lynch, over a 13-month period of time (if applicable) |
Morgan Stanley
Effective on or about July 1, 2018, shareholders purchasing Fund shares through a Morgan Stanley Wealth Management transactional brokerage account will be eligible only for the following Class A load waivers (front-end sales charge waivers), which may differ from and be more limited than those disclosed in the Fund’s prospectus or Statement of Additional Information.
Front-end Sales Load Waivers on Class A Shares Available at Morgan Stanley
| | • | | Employer-sponsored retirement plans (e.g., 401(k) plans, 457 plans, employer-sponsored 403(b) plans, profit sharing and money purchase pension plans and defined benefit plans). For purposes of this provision, employer-sponsored retirement plans do not include SEP IRAs, Simple IRAs, SAR-SEPs or Keogh plans. |
| | • | | Morgan Stanley employee and employee-related accounts according to Morgan Stanley’s account linking rules |
| | • | | Shares purchased through reinvestment of dividends and capital gains distributions when purchasing shares of the same fund |
| | • | | Shares purchased through a Morgan Stanley self-directed brokerage account |
| | | | |
| 40 | | Wells Fargo Short-Term High Yield Bond Fund | | Appendix A (unaudited) |
| | • | | Class C (i.e., level-load) shares that are no longer subject to a contingent deferred sales charge and are exchanged to Class A shares of the same fund pursuant to Morgan Stanley Wealth Management’s share class exchange program. |
| | • | | Shares purchased from the proceeds of redemptions within the same fund family, provided (i) the repurchase occurs within 90 days following the redemption, (ii) the redemption and purchase occur in the same account, and (iii) redeemed shares were subject to a front-end or deferred sales charge. This waiver is subject to the Fund’s policy regarding frequent purchases and redemption of Fund shares, as discussed under “Account Information—Frequent Purchases and Redemptions of Fund Shares” in the Fund’s prospectus. |

For more information
More information about Wells Fargo Funds is available free upon request. To obtain literature, please write, visit the Fund’s website, or call:
Wells Fargo Funds
P.O. Box 219967
Kansas City, MO 64121-9967
Website: wellsfargofunds.com
Individual investors: 1-800-222-8222
Retail investment professionals: 1-888-877-9275
Institutional investment professionals: 1-866-765-0778
This report and the financial statements contained herein are submitted for the general information of the shareholders of the Fund. If this report is used for promotional purposes, distribution of the report must be accompanied or preceded by a current prospectus. Before investing, please consider the investment objectives, risks, charges, and expenses of the investment. For a current prospectus and, if available, a summary prospectus, containing this information, call 1-800-222-8222 or visit the Fund’s website at wellsfargofunds.com. Read the prospectus carefully before you invest or send money.
Wells Fargo Asset Management (WFAM) is the trade name for certain investment advisory/management firms owned by Wells Fargo & Company. These firms include but are not limited to Wells Capital Management Incorporated and Wells Fargo Funds Management, LLC. Certain products managed by WFAM entities are distributed by Wells Fargo Funds Distributor, LLC (a broker/dealer and Member FINRA).
This material is for general informational and educational purposes only and is NOT intended to provide investment advice or a recommendation of any kind—including a recommendation for any specific investment, strategy, or plan.
NOT FDIC INSURED ◾ NO BANK GUARANTEE ◾ MAY LOSE VALUE
© 2018 Wells Fargo Funds Management, LLC. All rights reserved.
| | |
 | | 315410 10-18 A222/AR222 08-18 |
Annual Report
August 31, 2018

Wells Fargo Ultra Short-Term Income Fund


Reduce clutter. Save trees.
Sign up for electronic delivery of prospectuses and shareholder reports at wellsfargo.com/advantagedelivery
Contents
The views expressed and any forward-looking statements are as of August 31, 2018, unless otherwise noted, and are those of the Fund managers and/or Wells Fargo Funds Management, LLC. Discussions of individual securities, or the markets generally, or any Wells Fargo Fund are not intended as individual recommendations. Future events or results may vary significantly from those expressed in any forward-looking statements. The views expressed are subject to change at any time in response to changing circumstances in the market. Wells Fargo Funds Management, LLC and the Fund disclaim any obligation to publicly update or revise any views expressed or forward-looking statements.
NOT FDIC INSURED ◾ NO BANK GUARANTEE ◾ MAY LOSE VALUE
| | | | |
| 2 | | Wells Fargo Ultra Short-Term Income Fund | | Letter to shareholders (unaudited) |

Andrew Owen
President
Wells Fargo Funds
After advancing during 2017, economic growth and stock markets globally diverged during the first eight months of 2018.
Dear Shareholder:
We are pleased to offer you this annual report for the Wells Fargo Ultra Short-Term Income Fund for the 12-month period that ended August 31, 2018. After advancing during 2017, economic growth and stock markets globally diverged during the first eight months of 2018. For fixed-income investors, taxable bond returns suffered and high-yield and municipal bond returns were positive.
For the period, U.S. stocks, as measured by the S&P 500 Index,1 gained 19.66%, and international stocks, as measured by the MSCI ACWI ex USA Index (Net),2 added 3.18%. Based on the MSCI EM Index (Net),3 emerging market stocks lost 0.68%. For bond investors, the Bloomberg Barclays U.S. Aggregate Bond Index4 declined 1.05% while the Bloomberg Barclays Global Aggregate ex-USD Index5 fell 1.64%. The Bloomberg Barclays Municipal Bond Index6 added 0.49%, and the ICE BofAML U.S. High Yield Index7 was up 3.26%.
Continued optimism in the U.S. characterized the fourth quarter of 2017.
Some observers described economic conditions in late 2017 as a Goldilocks scenario: synchronized global growth, low inflation, healthy corporate earnings, and a weaker U.S. dollar that supported international growth. During the quarter, the U.S. Bureau of Economic Analysis reported that annualized U.S. gross domestic product (GDP) growth for the third quarter of 2017 was 2.8% and inflation remained below U.S. Federal Reserve (Fed) targets. U.S. corporate earnings and consumer confidence improved.
Economic momentum increased in Europe. The Bank of England (BOE) raised interest rates in November 2017 to 0.50%, the first increase in more than 10 years, indicating confidence in the economy’s growth potential. Meanwhile, the European Central Bank and the Bank of Japan kept interest rates low to spur business activities and bought bonds in an effort to encourage equity investments. The People’s Bank of China’s (PBOC’s) policies sought to stimulate business. Many emerging market economies benefited from stronger currencies versus the U.S. dollar, while commodity price increases benefited countries that rely on natural resources for exports.
| 1 | The S&P 500 Index consists of 500 stocks chosen for market size, liquidity, and industry group representation. It is a market-value-weighted index with each stock’s weight in the index proportionate to its market value. You cannot invest directly in an index. |
| 2 | The Morgan Stanley Capital International (MSCI) All Country World Index (ACWI) ex USA Index (Net) is a free-float-adjusted market-capitalization-weighted index that is designed to measure the equity market performance of developed markets, excluding the United States and Canada. Source: MSCI. MSCI makes no express or implied warranties or representations and shall have no liability whatsoever with respect to any MSCI data contained herein. The MSCI data may not be further redistributed or used as a basis for other indices or any securities or financial products. This report is not approved, reviewed, or produced by MSCI. You cannot invest directly in an index. |
| 3 | The MSCI Emerging Markets (EM) Index (Net) is a free-float-adjusted market-capitalization-weighted index that is designed to measure large- and mid-cap equity market performance of emerging markets. The MSCI EM Index (Net) consists of the following 24 emerging market country indices: Brazil, Chile, China, Colombia, Czech Republic, Egypt, Greece, Hungary, India, Indonesia, Korea, Malaysia, Mexico, Pakistan, Peru, the Philippines, Poland, Qatar, Russia, South Africa, Taiwan, Thailand, Turkey, and the United Arab Emirates. You cannot invest directly in an index. |
| 4 | The Bloomberg Barclays U.S. Aggregate Bond Index is a broad-based benchmark that measures the investment-grade, U.S. dollar-denominated, fixed-rate taxable bond market, including Treasuries, government-related and corporate securities, mortgage-backed securities (agency fixed-rate and hybrid adjustable-rate mortgage pass-throughs), asset-backed securities, and commercial mortgage-backed securities. You cannot invest directly in an index. |
| 5 | The Bloomberg Barclays Global Aggregate ex-USD Index is an unmanaged index that provides a broad-based measure of the global investment-grade fixed-income markets excluding the U.S. dollar-denominated debt market. You cannot invest directly in an index. |
| 6 | The Bloomberg Barclays Municipal Bond Index is an unmanaged index composed of long-term tax-exempt bonds with a minimum credit rating of Baa. You cannot invest directly in an index. |
| 7 | The ICE BofAML U.S. High Yield Index is a market-capitalization-weighted index of domestic and Yankee high-yield bonds. The index tracks the performance of high-yield securities traded in the U.S. bond market. You cannot invest directly in an index. Copyright 2018. ICE Data Indices, LLC. All rights reserved. |
| | | | | | |
| Letter to shareholders (unaudited) | | Wells Fargo Ultra Short-Term Income Fund | | | 3 | |
Volatility reemerged during the first quarter of 2018 as global tensions and inflation fears increased.
Stock market gains in January 2018 followed the passage of lower U.S. tax rates. Some investors then grew concerned about trade, particularly between the U.S. and China, and the specter of inflation. The Fed followed its 25-basis-point (bp; 100 bps equal 1.00%) federal funds rate increase in December 2017 with a further 25-bp increase in March 2018. The inflation rate in March reached the Fed’s 2% target for the first time in a year.
The S&P 500 Index closed the first quarter with a negative return, the first negative quarterly return for the index since 2014. Overseas investment markets reversed strong returns in 2017, hurt by a stronger U.S. dollar and mounting trade and diplomatic tensions. After gaining 27.19% for the 12-month period that ended December 31, 2017, the MSCI ACWI ex USA Index (Net) declined 1.81% for the quarter that ended March 31, 2018.
Global trade tensions escalated during the second quarter.
Global trade tensions escalated throughout the second quarter of 2018. The U.S. government imposed tariffs, and foreign governments in North America, Europe, and Asia retaliated. The escalating tensions chilled investment activity as observers awaited signals of next steps.
Meanwhile, inflation continued an upward trend. The CPI-U8 added 0.1% in June after increases of 0.2% in both April and May. On a year-over-year basis, the all-items index rose 2.9% for the 12 months that ended June 30, 2018. The index for all items less food and energy rose 2.3% for the same 12-month period.
U.S. stocks gained while international stocks and bonds declined during the summer of 2018.
The U.S. economy strengthened during the summer months. Revised second-quarter GDP data released in August showed the U.S. economy growing at a 4.2% rate. After ticking up slightly in June, the unemployment rate in the U.S. was 3.9% in July and August, according to the U.S. Department of Labor. Wages showed more consistent growth than they had in recent quarters, and consumer confidence remained strong.
Several U.S. equity market indices reached records during August, with the S&P 500 Index gaining 7.76% for the three-month period that ended August 31, 2018. International stock values continued to suffer under the effects of a strong U.S. dollar and continuing trade tensions. The MSCI ACWI ex USA Index (Net) and the MSCI EM Index (Net) were down 4.70% and 1.64%, respectively, during the same three-month period.
The Fed increased the federal funds rate in June, and expectations grew that two more rate increases were in the offing in 2018. Long-term interest rates in the U.S. remained at higher levels relative to the prior 10 years. Rates on 10-year and 30-year Treasury bonds—2.46% and 2.81%, respectively, on January 1, 2018—were 2.86% and 3.02%, respectively, on August 31, off their peak levels on May 17, 2018, of 3.11% and 3.25%, respectively. Some investors became more aware of and concerned about the potential for an inverted yield curve—sometimes a recession signal—as short-term rates increased more quickly than long-term rates. The Fed decided to forgo an interest rate increase at its August meeting.
The S&P 500 Index closed the first quarter with a negative return, the first negative quarterly return for the index since 2014.
| 8 | The Consumer Price Index for All Urban Consumers (CPI-U) measures the changes in the price of a basket of goods and services purchased by urban consumers. The urban consumer population is deemed by many as a better representative measure of the general public because close to 90% of the country’s population lives in highly populated areas. You cannot invest directly in an index. |
| | | | |
| 4 | | Wells Fargo Ultra Short-Term Income Fund | | Letter to shareholders (unaudited) |
Internationally, members of Prime Minister Theresa May’s U.K./Brexit negotiating team resigned amid unproductive negotiations. In early August, the BOE’s Monetary Policy Committee increased its key interest rate to 0.75%. Central banks in Europe and Japan maintained low interest rates and accommodative monetary policies. Amid rising trade uncertainty, the PBOC cut reserve requirement ratios and accelerated infrastructure spending and tax cuts for business enterprises and individuals. Nevertheless, a strengthening U.S. dollar and the trade tensions remained headwinds for investors overseas.
Don’t let short-term uncertainty derail long-term investment goals.
Periods of investment uncertainty can present challenges, but experience has taught us that maintaining long-term investment goals can be an effective way to plan for the future. To help you create a sound strategy based on your personal goals and risk tolerance, Wells Fargo Funds offers more than 100 mutual funds spanning a wide range of asset classes and investment styles. Although diversification cannot guarantee an investment profit or prevent losses, we believe it can be an effective way to manage investment risk and potentially smooth out overall portfolio performance. We encourage investors to know their investments and to understand that appropriate levels of risk-taking may unlock opportunities.
Thank you for choosing to invest with Wells Fargo Funds. We appreciate your confidence in us and remain committed to helping you meet your financial needs.
Sincerely,

Andrew Owen
President
Wells Fargo Funds
Notice to shareholders
| | ∎ | | At a meeting held on May 22-23, 2018, the Board of Trustees of the Fund approved changes to the Fund’s Class A sales charge schedule, effective August 1, 2018. In connection with this change, the net asset value (NAV) breakpoint was lowered from $500,000 to $250,000 and NAV purchases of $250,000 or more redeemed within 12 months of purchase are assessed a contingent deferred sales charge (CDSC) of 0.40%. There is no change for purchase amounts below this breakpoint. Beginning August 1, 2018, any purchases made by a shareholder with an active Letter of Intent (LOI) are subject to the terms of the new load schedule. | |
| | ∎ | | At a meeting held on August 14-15, 2018, the Board of Trustees of the Fund approved the following policy which will be effective on or about February 5, 2019: | |
Class C shares will convert automatically into Class A shares ten years after the initial date of purchase or, if you acquired your Class C shares through an exchange or conversion from another share class, ten years after the date you acquired your Class C shares. When Class C shares that you acquired through a purchase or exchange convert, any other Class C shares that you purchased with reinvested dividends and distributions also will convert into Class A shares on a pro rata basis. A shorter holding period may also apply depending on your intermediary. Please see “Appendix A—Sales Charge Reductions and Waivers for Certain Intermediaries” in the Fund’s prospectus or at the end of this report.
For further information about your Fund, contact your investment professional, visit our website at wellsfargofunds.com, or call us directly at 1-800-222-8222.
This page is intentionally left blank.
| | | | |
| 6 | | Wells Fargo Ultra Short-Term Income Fund | | Performance highlights (unaudited) |
Investment objective
The Fund seeks current income consistent with capital preservation.
Manager
Wells Fargo Funds Management, LLC
Subadviser
Wells Capital Management Incorporated
Portfolio managers
Christopher Y. Kauffman, CFA®
Jay N. Mueller, CFA®
Noah M. Wise, CFA®
Average annual total returns (%) as of August 31, 2018
| | | | | | | | | | | | | | | | | | | | | | | | | | | | | | | | | | |
| | | | | Including sales charge | | | Excluding sales charge | | | Expense ratios1 (%) | |
| | | Inception date | | 1 year | | | 5 year | | | 10 year | | | 1 year | | | 5 year | | | 10 year | | | Gross | | | Net2 | |
| Class A (SADAX) | | 8-31-1999 | | | (0.79 | ) | | | 0.42 | | | | 1.12 | | | | 1.24 | | | | 0.83 | | | | 1.32 | | | | 0.80 | | | | 0.71 | |
| Class C (WUSTX) | | 7-18-2008 | | | (0.40 | ) | | | 0.11 | | | | 0.58 | | | | 0.60 | | | | 0.11 | | | | 0.58 | | | | 1.55 | | | | 1.46 | |
| Administrator Class (WUSDX) | | 4-8-2005 | | | – | | | | – | | | | – | | | | 1.39 | | | | 0.98 | | | | 1.48 | | | | 0.74 | | | | 0.56 | |
| Institutional Class (SADIX) | | 8-31-1999 | | | – | | | | – | | | | – | | | | 1.59 | | | | 1.21 | | | | 1.68 | | | | 0.47 | | | | 0.36 | |
| Bloomberg Barclays Short-Term U.S. Government/Credit Bond Index3 | | – | | | – | | | | – | | | | – | | | | 1.54 | | | | 0.70 | | | | 0.79 | | | | – | | | | – | |
Figures quoted represent past performance, which is no guarantee of future results, and do not reflect taxes that a shareholder may pay on fund distributions or the redemption of fund shares. Investment return and principal value of an investment will fluctuate so that an investor’s shares, when redeemed, may be worth more or less than their original cost. Performance shown without sales charges would be lower if sales charges were reflected. Current performance may be lower or higher than the performance data quoted, which assumes the reinvestment of dividends and capital gains. Current month-end performance is available on the Fund’s website, wellsfargofunds.com.
Index returns do not include transaction costs associated with buying and selling securities, any mutual fund fees or expenses, or any taxes. It is not possible to invest directly in an index.
For Class A shares, the maximum front-end sales charge is 2.00%. For Class C shares, the maximum contingent deferred sales charge is 1.00%. Performance including a contingent deferred sales charge assumes the sales charge for the corresponding time period. Administrator Class and Institutional Class shares are sold without a front-end sales charge or contingent deferred sales charge.
Bond values fluctuate in response to the financial condition of individual issuers, general market and economic conditions, and changes in interest rates. Changes in market conditions and government policies may lead to periods of heightened volatility in the bond market and reduced liquidity for certain bonds held by the Fund. In general, when interest rates rise, bond values fall and investors may lose principal value. Interest rate changes and their impact on the Fund and its share price can be sudden and unpredictable. Loans are subject to risks similar to those associated with other below-investment-grade bond investments, such as credit risk (for example, risk of issuer default), below-investment-grade bond risk (for example, risk of greater volatility in value), and risk that the loan may become illiquid or difficult to price. The use of derivatives may reduce returns and/or increase volatility. Foreign investments are especially volatile and can rise or fall dramatically due to differences in the political and economic conditions of the host country. These risks are generally intensified in emerging markets. Certain investment strategies tend to increase the total risk of an investment (relative to the broader market). The Fund is exposed to high-yield securities risk and mortgage- and asset-backed securities risk. Consult the Fund’s prospectus for additional information on these and other risks.
Please see footnotes on page 7.
| | | | | | |
| Performance highlights (unaudited) | | Wells Fargo Ultra Short-Term Income Fund | | | 7 | |
|
| Growth of $10,000 investment as of August 31, 20184 |
|
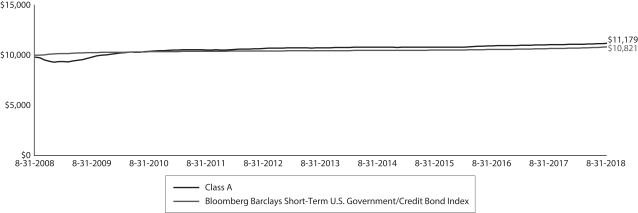 |
| 1 | Reflects the expense ratios as stated in the most recent prospectuses, which include the impact of 0.01% in acquired fund fees and expenses. The expense ratios shown are subject to change and may differ from the annualized expense ratios shown in the financial highlights of this report, which do not include acquired fund fees and expenses. |
| 2 | The manager has contractually committed through December 31, 2018, to waive fees and/or reimburse expenses to the extent necessary to cap the Fund’s Total Annual Fund Operating Expenses After Fee Waivers at 0.70% for Class A, 1.45% for Class C, 0.55% for Administrator Class, and 0.35% for Institutional Class. After this time, the cap may be increased or the commitment to maintain the cap may be terminated only with the approval of the Board of Trustees. Brokerage commissions, stamp duty fees, interest, taxes, acquired fund fees and expenses (if any), and extraordinary expenses are excluded from the expense cap. Without this cap, the Fund’s returns would have been lower. The expense ratio paid by an investor is the net expense ratio (the total annual fund operating expenses after fee waivers) as stated in the prospectuses. |
| 3 | The Bloomberg Barclays Short-Term U.S. Government/Credit Bond Index contains securities that have fallen out of the Bloomberg Barclays U.S. Government/Credit Bond Index because of the standard minimum one-year-to-maturity constraint. Securities in the Bloomberg Barclays Short-Term U.S. Government/Credit Bond Index must have a maturity from 1 up to (but not including) 12 months. You cannot invest directly in an index. |
| 4 | The chart compares the performance of Class A shares for the most recent ten years with the performance of the Bloomberg Barclays Short-Term U.S. Government/Credit Bond Index. The chart assumes a hypothetical investment of $10,000 in Class A shares and reflects all operating expenses and assumes the maximum initial sales charge of 2.00%. |
| 5 | The ten largest holdings, excluding cash, cash equivalents and any money market funds, are calculated based on the value of the investments divided by total net assets of the Fund. Holdings are subject to change and may have changed since the date specified. |
| 6 | The Consumer Price Index (CPI) is a measure of the average change over time in the prices paid by urban consumers for a market basket of consumer goods and services. You cannot invest directly in an index. |
| 7 | Amounts are calculated based on the total long-term investments of the Fund. These amounts are subject to change and may have changed since the date specified. |
| | | | |
| 8 | | Wells Fargo Ultra Short-Term Income Fund | | Performance highlights (unaudited) |
MANAGER’S DISCUSSION
Fund highlights
| ∎ | | The Fund underperformed its benchmark, the Bloomberg Barclays Short-Term U.S. Government/Credit Bond Index, for the 12-month period that ended August 31, 2018, after deduction of expenses. The Fund’s Institutional Class, which has lower expenses, outperformed the benchmark during the same period. |
| ∎ | | Overweights to corporate debt and structured products, both of which generated superior returns compared with similar-duration Treasuries, generated positive results for the Fund. |
| | | | |
| Ten largest holdings (%) as of August 31, 20185 | |
SPDR Portfolio Short Term Corporate Bond ETF | | | 3.00 | |
AT&T Incorporated, 5.00%, 3-1-2021 | | | 1.02 | |
Deutsche Telekom International Finance BV, 2.23%, 1-17-2020 | | | 0.98 | |
ANZ New Zealand International Limited, 2.60%, 9-23-2019 | | | 0.81 | |
Banco Santander Chile, 2.50%, 12-15-2020 | | | 0.80 | |
Corporacion Andina de Fomento, 2.00%, 5-10-2019 | | | 0.79 | |
Commercial Mortgage Trust Series 2014-LC17 Class A2, 3.16%, 10-10-2047 | | | 0.79 | |
Huntington National Bank, 2.38%, 3-10-2020 | | | 0.78 | |
Teva Pharmaceuticals Industries Incorporated, 1.70%, 7-19-2019 | | | 0.78 | |
Georgia Pacific LLC, 2.54%, 11-15-2019 | | | 0.76 | |
Economic growth accelerated and policy normalization continued.
Over the past four quarters, U.S. gross domestic product (GDP) grew by 2.9% in real terms, which was above the post-financial-crisis average. Business investment was a significant source of strength, rising 4.8% for the 12 months that ended June 30, 2018. Consumer spending was a net contributor to growth, although it failed to keep pace with the business sector. Inventories were a net detractor from GDP growth, while trade and government spending were modestly positive factors.
The labor market generally was healthy over the past 12 months. Nonfarm payrolls expanded by an average of 194,000 jobs per month over the period, while the unemployment rate declined to 3.9% at the end of August 2018 from 4.4% a year earlier. Also encouraging was a 0.2% rise in the employment/population ratio since
August 2017, reflecting both the fall in unemployment and a modest increase in the labor force participation rate. Wage gains of about 2.9% over the past 12 months were sufficient to support consumption growth without sparking fears of rising inflation. The CPI6 also rose 2.9% over the past year, which accelerated due in part to higher energy prices.
The U.S. Federal Reserve’s (Fed’s) rate-setting committee, the Federal Open Market Committee (FOMC), raised the federal funds rate three times over the past 12 months by a total of 0.75%. The FOMC’s gradual approach to hiking rates is supported by Fed Chairman Jerome Powell’s stated view that there is no sense that inflation will take off or move unexpectedly quickly.
In line with the FOMC’s policy moves, interest rates had an upward bias over the past 12 months, particularly in shorter-term maturity instruments. Yields on 2-year Treasuries rose by 130 basis points (bps; 100 bps equal 1.00%) during the period, while 10-year Treasuries were about 75 bps higher. Investment-grade credit spreads tightened rapidly into the start of 2018 after the corporate tax cut was enacted in the U.S. but ended the period slightly wider after trade tensions and heavy supply took their toll on bond prices.
Please see footnotes on page 7.
| | | | | | |
| Performance highlights (unaudited) | | Wells Fargo Ultra Short-Term Income Fund | | | 9 | |
|
| Portfolio allocation as of August 31, 20187 |
|
 |
The Fund maintained overweights to corporate credit and securitized debt.
The Fund continued to overweight short-term corporate bonds as well as securitized debt while underweighting U.S. Treasuries and agency debentures. The Fund’s investments in corporate debt benefited from a positive credit environment. The other primary sector commitment was to securitized debt: mortgage-backed securities, asset-backed securities, and a subset of agency securities. These spread sectors benefited the Fund due to their yield advantage. We maintained the Fund’s duration at slightly under half a year during the reporting period because we expected short-term interest rates could rise. In addition, we maintained substantial liquidity in the Fund.
We expect modestly above-trend economic growth to continue.
We expect macroeconomic trends to remain relatively consistent in the coming quarters, aided by fiscal stimulus and looser regulations. Real GDP growth in the area of 3% is likely to persist for a period of time, barring some external shock. The biggest risks to the outlook include an escalation in trade tensions and a larger-than-expected slowdown in the Chinese economy.
Please see footnotes on page 7.
| | | | |
| 10 | | Wells Fargo Ultra Short-Term Income Fund | | Fund expenses (unaudited) |
As a shareholder of the Fund, you incur two types of costs: (1) transaction costs, including sales charges (loads) on purchase payments and contingent deferred sales charges (if any) on redemptions and (2) ongoing costs, including management fees, distribution (12b-1) and/or shareholder servicing fees, and other Fund expenses. This example is intended to help you understand your ongoing costs (in dollars) of investing in the Fund and to compare these costs with the ongoing costs of investing in other mutual funds.
The example is based on an investment of $1,000 invested at the beginning of the six-month period and held for the entire period from March 1, 2018 to August 31, 2018.
Actual expenses
The “Actual” line of the table below provides information about actual account values and actual expenses. You may use the information in this line, together with the amount you invested, to estimate the expenses that you paid over the period. Simply divide your account value by $1,000 (for example, an $8,600 account value divided by $1,000 = 8.6), then multiply the result by the number in the “Actual” line under the heading entitled “Expenses paid during period” for your applicable class of shares to estimate the expenses you paid on your account during this period.
Hypothetical example for comparison purposes
The “Hypothetical” line of the table below provides information about hypothetical account values and hypothetical expenses based on the Fund’s actual expense ratio and an assumed rate of return of 5% per year before expenses, which is not the Fund’s actual return. The hypothetical account values and expenses may not be used to estimate the actual ending account balance or expenses you paid for the period. You may use this information to compare the ongoing costs of investing in the Fund and other funds. To do so, compare this 5% hypothetical example with the 5% hypothetical examples that appear in the shareholder reports of the other funds.
Please note that the expenses shown in the table are meant to highlight your ongoing costs only and do not reflect any transactional costs, such as sales charges (loads) and contingent deferred sales charges. Therefore, the “Hypothetical” line of the table is useful in comparing ongoing costs only and will not help you determine the relative total costs of owning different funds. In addition, if these transactional costs were included, your costs would have been higher.
| | | | | | | | | | | | | | | | |
| | | Beginning
account value
3-1-2018 | | | Ending
account value
8-31-2018 | | | Expenses
paid during
the period¹ | | | Annualized net
expense ratio | |
Class A | | | | | | | | | | | | | | | | |
Actual | | $ | 1,000.00 | | | $ | 1,009.34 | | | $ | 3.55 | | | | 0.70 | % |
Hypothetical (5% return before expenses) | | $ | 1,000.00 | | | $ | 1,021.68 | | | $ | 3.57 | | | | 0.70 | % |
Class C | | | | | | | | | | | | | | | | |
Actual | | $ | 1,000.00 | | | $ | 1,006.73 | | | $ | 7.33 | | | | 1.45 | % |
Hypothetical (5% return before expenses) | | $ | 1,000.00 | | | $ | 1,017.90 | | | $ | 7.38 | | | | 1.45 | % |
Administrator Class | | | | | | | | | | | | | | | | |
Actual | | $ | 1,000.00 | | | $ | 1,010.11 | | | $ | 2.79 | | | | 0.55 | % |
Hypothetical (5% return before expenses) | | $ | 1,000.00 | | | $ | 1,022.43 | | | $ | 2.80 | | | | 0.55 | % |
Institutional Class | | | | | | | | | | | | | | | | |
Actual | | $ | 1,000.00 | | | $ | 1,011.12 | | | $ | 1.77 | | | | 0.35 | % |
Hypothetical (5% return before expenses) | | $ | 1,000.00 | | | $ | 1,023.44 | | | $ | 1.79 | | | | 0.35 | % |
| 1 | Expenses paid is equal to the annualized net expense ratio of each class multiplied by the average account value over the period, multiplied by the number of days in the most recent fiscal half-year divided by the number of days in the fiscal year (to reflect the one-half-year period). |
| | | | | | |
| Portfolio of investments—August 31, 2018 | | Wells Fargo Ultra Short-Term Income Fund | | | 11 | |
| | | | | | | | | | | | | | | | |
| Security name | | Interest rate | | | Maturity date | | | Principal | | | Value | |
|
Agency Securities: 11.15% | |
FDIC Series 2013-R1 Class A 144A | | | 1.15 | % | | | 3-25-2033 | | | $ | 1,105,050 | | | $ | 1,088,301 | |
FHLMC (1 Year Treasury Constant Maturity +2.25%) ± | | | 3.68 | | | | 4-1-2038 | | | | 819,227 | | | | 863,079 | |
FHLMC (1 Year Treasury Constant Maturity +2.25%) ± | | | 3.90 | | | | 9-1-2038 | | | | 1,444,806 | | | | 1,521,611 | |
FHLMC (1 Year Treasury Constant Maturity +2.25%) ± | | | 3.96 | | | | 10-1-2038 | | | | 890,317 | | | | 941,685 | |
FHLMC (1 Year Treasury Constant Maturity +2.18%) ± | | | 4.00 | | | | 5-1-2035 | | | | 383,920 | | | | 403,122 | |
FHLMC (1 Year Treasury Constant Maturity +2.23%) ± | | | 4.05 | | | | 3-1-2035 | | | | 803,163 | | | | 846,268 | |
FHLMC (1 Year Treasury Constant Maturity +2.25%) ± | | | 4.12 | | | | 4-1-2032 | | | | 92,970 | | | | 97,082 | |
FHLMC (1 Year Treasury Constant Maturity +2.33%) ± | | | 4.21 | | | | 1-1-2029 | | | | 37,909 | | | | 37,989 | |
FHLMC (1 Year Treasury Constant Maturity +2.25%) ± | | | 4.31 | | | | 6-1-2032 | | | | 2,270 | | | | 2,355 | |
FHLMC (1 Year Treasury Constant Maturity +2.25%) ± | | | 4.37 | | | | 11-1-2035 | | | | 2,699,141 | | | | 2,838,669 | |
FHLMC (1 Year Treasury Constant Maturity +2.40%) ± | | | 4.37 | | | | 7-1-2029 | | | | 2,313 | | | | 2,384 | |
FHLMC | | | 4.50 | | | | 2-1-2020 | | | | 236,913 | | | | 239,121 | |
FHLMC | | | 4.50 | | | | 8-1-2020 | | | | 148,112 | | | | 149,631 | |
FHLMC | | | 4.50 | | | | 1-1-2022 | | | | 130,900 | | | | 132,334 | |
FHLMC | | | 4.50 | | | | 6-1-2024 | | | | 1,236,282 | | | | 1,278,256 | |
FHLMC | | | 4.50 | | | | 9-1-2026 | | | | 1,974,186 | | | | 2,041,044 | |
FHLMC | | | 5.00 | | | | 12-1-2019 | | | | 332,819 | | | | 337,875 | |
FHLMC | | | 5.50 | | | | 12-1-2022 | | | | 549,080 | | | | 567,538 | |
FHLMC | | | 5.50 | | | | 12-1-2023 | | | | 581,673 | | | | 601,458 | |
FHLMC | | | 6.00 | | | | 10-1-2021 | | | | 692,715 | | | | 713,030 | |
FHLMC | | | 6.00 | | | | 10-1-2021 | | | | 770,108 | | | | 792,034 | |
FHLMC | | | 6.00 | | | | 1-1-2024 | | | | 563,753 | | | | 584,264 | |
FHLMC | | | 7.00 | | | | 6-1-2031 | | | | 283,627 | | | | 310,068 | |
FHLMC | | | 9.00 | | | | 10-1-2019 | | | | 5,485 | | | | 5,511 | |
FHLMC | | | 9.50 | | | | 9-1-2020 | | | | 18,774 | | | | 18,874 | |
FHLMC | | | 9.50 | | | | 12-1-2022 | | | | 12,374 | | | | 12,480 | |
FHLMC | | | 10.00 | | | | 11-17-2021 | | | | 4,793 | | | | 4,796 | |
FHLMC | | | 10.50 | | | | 5-1-2020 | | | | 19,263 | | | | 19,433 | |
FHLMC Series 2611 Class HD | | | 5.00 | | | | 5-15-2023 | | | | 639,988 | | | | 661,765 | |
FHLMC Series 2649 Class WL | | | 4.00 | | | | 7-15-2023 | | | | 1,309,525 | | | | 1,330,217 | |
FHLMC Series 2704 Class BH | | | 4.50 | | | | 11-15-2023 | | | | 451,549 | | | | 463,330 | |
FHLMC Series 2707 Class QE | | | 4.50 | | | | 11-15-2018 | | | | 6,177 | | | | 6,172 | |
FHLMC Series 2843 Class BC | | | 5.00 | | | | 8-15-2019 | | | | 25,891 | | | | 25,938 | |
FHLMC Series 2849 Class B | | | 5.00 | | | | 8-15-2019 | | | | 83,780 | | | | 84,053 | |
FHLMC Series 2855 Class WN | | | 4.00 | | | | 9-15-2019 | | | | 13,647 | | | | 13,669 | |
FHLMC Series 2881 Class AE | | | 5.00 | | | | 8-15-2034 | | | | 240,074 | | | | 244,956 | |
FHLMC Series 2896 Class CB | | | 4.50 | | | | 11-15-2019 | | | | 75,081 | | | | 75,118 | |
FHLMC Series 2953 Class LD | | | 5.00 | | | | 12-15-2034 | | | | 197,240 | | | | 198,175 | |
FHLMC Series 3166 Class AC | | | 5.00 | | | | 6-15-2021 | | | | 1,691,388 | | | | 1,707,019 | |
FHLMC Series 3266 Class D | | | 5.00 | | | | 1-15-2022 | | | | 74,093 | | | | 74,149 | |
FHLMC Series 3609 Class LA | | | 4.00 | | | | 12-15-2024 | | | | 53,476 | | | | 53,600 | |
FHLMC Series 3772 Class HC | | | 3.00 | | | | 10-15-2018 | | | | 1,230 | | | | 1,230 | |
FHLMC Series 3821 Class LA | | | 3.50 | | | | 4-15-2025 | | | | 197,167 | | | | 197,704 | |
FHLMC Series 3834 Class EA | | | 3.50 | | | | 6-15-2029 | | | | 277,683 | | | | 280,812 | |
FHLMC Series 3842 Class CJ | | | 2.00 | | | | 9-15-2018 | | | | 751 | | | | 750 | |
FHLMC Series 3888 Class NA | | | 2.25 | | | | 1-15-2040 | | | | 1,875,482 | | | | 1,828,780 | |
FHLMC Series 3898 Class NE | | | 4.00 | | | | 7-15-2040 | | | | 206,539 | | | | 205,934 | |
FHLMC Series 4172 Class PB | | | 1.50 | | | | 7-15-2040 | | | | 379,767 | | | | 366,128 | |
FHLMC Series 4318 Class LC | | | 2.00 | | | | 6-15-2038 | | | | 515,208 | | | | 506,483 | |
FHLMC Series 4348 Class MH | | | 3.00 | | | | 6-15-2039 | | | | 2,432,261 | | | | 2,415,944 | |
The accompanying notes are an integral part of these financial statements.
| | | | |
| 12 | | Wells Fargo Ultra Short-Term Income Fund | | Portfolio of investments—August 31, 2018 |
| | | | | | | | | | | | | | | | |
| Security name | | Interest rate | | | Maturity date | | | Principal | | | Value | |
| | | | |
Agency Securities (continued) | | | | | | | | | | | | | | | | |
FHLMC Series K005 Class A2 | | | 4.32 | % | | | 11-25-2019 | | | $ | 500,000 | | | $ | 506,014 | |
FHLMC Series KJ13 Class A1 | | | 2.06 | | | | 9-25-2021 | | | | 2,002,035 | | | | 1,980,843 | |
FHLMC Series KP04 Class AG1 (1 Month LIBOR +0.22%) ± | | | 2.30 | | | | 7-25-2020 | | | | 4,515,000 | | | | 4,517,487 | |
FHLMC Series QO04 Class AFL (12 Month Treasury Average +0.74%) ± | | | 2.49 | | | | 10-25-2021 | | | | 4,058,455 | | | | 4,062,293 | |
FHLMC Series T-42 Class A6 | | | 9.50 | | | | 2-25-2042 | | | | 633,886 | | | | 754,793 | |
FNMA | | | 1.77 | | | | 9-1-2019 | | | | 1,077,273 | | | | 1,068,631 | |
FNMA | | | 2.00 | | | | 4-1-2023 | | | | 3,878,018 | | | | 3,806,561 | |
FNMA | | | 2.48 | | | | 7-1-2020 | | | | 3,383,374 | | | | 3,374,934 | |
FNMA (1 Year Treasury Constant Maturity +2.02%) ± | | | 3.37 | | | | 12-1-2034 | | | | 446,448 | | | | 466,995 | |
FNMA (1 Year Treasury Constant Maturity +2.19%) ± | | | 3.43 | | | | 11-1-2031 | | | | 61,637 | | | | 64,556 | |
FNMA (6 Month LIBOR +1.39%) ± | | | 3.44 | | | | 10-1-2031 | | | | 122,223 | | | | 124,986 | |
FNMA (1 Year Treasury Constant Maturity +2.28%) ± | | | 3.53 | | | | 11-1-2032 | | | | 480,469 | | | | 505,038 | |
FNMA (1 Year Treasury Constant Maturity +2.26%) ± | | | 3.60 | | | | 11-1-2035 | | | | 210,267 | | | | 222,168 | |
FNMA (1 Year Treasury Constant Maturity +2.13%) ± | | | 3.60 | | | | 5-1-2032 | | | | 5,165 | | | | 5,335 | |
FNMA (1 Year Treasury Constant Maturity +2.27%) ± | | | 3.74 | | | | 2-1-2036 | | | | 2,102,881 | | | | 2,215,353 | |
FNMA (1 Year Treasury Constant Maturity +2.25%) ± | | | 3.75 | | | | 11-1-2033 | | | | 1,950,207 | | | | 2,052,582 | |
FNMA (6 Month LIBOR +1.51%) ± | | | 3.81 | | | | 9-1-2037 | | | | 399,347 | | | | 412,990 | |
FNMA (1 Year Treasury Constant Maturity +2.19%) ± | | | 3.83 | | | | 4-1-2038 | | | | 2,127,900 | | | | 2,242,305 | |
FNMA (1 Year Treasury Constant Maturity +2.19%) ± | | | 3.84 | | | | 2-1-2035 | | | | 1,066,257 | | | | 1,122,325 | |
FNMA (12 Month Treasury Average +2.22%) ± | | | 3.85 | | | | 8-1-2045 | | | | 702,589 | | | | 729,606 | |
FNMA (1 Year Treasury Constant Maturity +1.86%) ± | | | 3.86 | | | | 1-1-2023 | | | | 7,294 | | | | 7,277 | |
FNMA (1 Year Treasury Constant Maturity +2.26%) ± | | | 3.86 | | | | 8-1-2036 | | | | 2,313,958 | | | | 2,437,787 | |
FNMA (1 Year Treasury Constant Maturity +2.23%) ± | | | 3.86 | | | | 12-1-2040 | | | | 136,746 | | | | 143,470 | |
FNMA (1 Year Treasury Constant Maturity +2.22%) ± | | | 3.87 | | | | 7-1-2038 | | | | 1,501,262 | | | | 1,582,439 | |
FNMA (1 Year Treasury Constant Maturity +2.36%) ± | | | 3.89 | | | | 11-1-2034 | | | | 1,068,055 | | | | 1,130,653 | |
FNMA (12 Month Treasury Average +2.29%) ± | | | 3.94 | | | | 5-1-2036 | | | | 821,758 | | | | 846,403 | |
FNMA (1 Year Treasury Constant Maturity +2.27%) ± | | | 3.95 | | | | 2-1-2033 | | | | 369,464 | | | | 386,382 | |
FNMA | | | 4.00 | | | | 3-1-2025 | | | | 1,120,832 | | | | 1,147,375 | |
FNMA | | | 4.00 | | | | 9-1-2026 | | | | 4,476,653 | | | | 4,583,350 | |
FNMA (1 Year Treasury Constant Maturity +2.31%) ± | | | 4.04 | | | | 5-1-2036 | | | | 836,324 | | | | 884,482 | |
FNMA (12 Month LIBOR +1.82%) ± | | | 4.04 | | | | 9-1-2040 | | | | 2,633,618 | | | | 2,764,386 | |
FNMA (1 Year Treasury Constant Maturity +2.22%) ± | | | 4.19 | | | | 6-1-2032 | | | | 98,586 | | | | 102,271 | |
FNMA (1 Year Treasury Constant Maturity +2.22%) ± | | | 4.25 | | | | 6-1-2034 | | | | 918,109 | | | | 967,690 | |
FNMA | | | 4.50 | | | | 6-1-2019 | | | | 19,979 | | | | 20,183 | |
FNMA | | | 4.50 | | | | 1-1-2027 | | | | 2,239,891 | | | | 2,318,005 | |
FNMA | | | 5.00 | | | | 5-1-2022 | | | | 508,067 | | | | 522,539 | |
FNMA | | | 5.00 | | | | 6-1-2024 | | | | 2,387,126 | | | | 2,477,961 | |
FNMA (6 Month LIBOR +2.86%) ± | | | 5.38 | | | | 4-1-2033 | | | | 1,385 | | | | 1,434 | |
FNMA | | | 6.00 | | | | 4-1-2021 | | | | 112,920 | | | | 115,303 | |
FNMA | | | 6.00 | | | | 1-1-2023 | | | | 1,376,745 | | | | 1,429,100 | |
FNMA | | | 6.50 | | | | 8-1-2031 | | | | 332,394 | | | | 366,599 | |
FNMA | | | 8.33 | | | | 7-15-2020 | | | | 3,983 | | | | 4,058 | |
FNMA | | | 9.00 | | | | 2-15-2020 | | | | 19,474 | | | | 19,999 | |
FNMA | | | 9.00 | | | | 10-15-2021 | | | | 10,148 | | | | 10,508 | |
FNMA | | | 9.00 | | | | 6-1-2024 | | | | 16,736 | | | | 16,856 | |
FNMA | | | 9.50 | | | | 12-1-2020 | | | | 14,866 | | | | 15,298 | |
FNMA | | | 10.25 | | | | 9-1-2021 | | | | 1,281 | | | | 1,281 | |
FNMA | | | 10.50 | | | | 8-1-2020 | | | | 196 | | | | 196 | |
FNMA | | | 10.50 | | | | 4-1-2022 | | | | 191 | | | | 192 | |
FNMA Series 1989-30 Class Z | | | 9.50 | | | | 6-25-2019 | | | | 5,110 | | | | 5,169 | |
The accompanying notes are an integral part of these financial statements.
| | | | | | |
| Portfolio of investments—August 31, 2018 | | Wells Fargo Ultra Short-Term Income Fund | | | 13 | |
| | | | | | | | | | | | | | | | |
| Security name | | Interest rate | | | Maturity date | | | Principal | | | Value | |
| | | | |
Agency Securities (continued) | | | | | | | | | | | | | | | | |
FNMA Series 1990-111 Class Z | | | 8.75 | % | | | 9-25-2020 | | | $ | 2,255 | | | $ | 2,344 | |
FNMA Series 1990-119 Class J | | | 9.00 | | | | 10-25-2020 | | | | 15,984 | | | | 16,697 | |
FNMA Series 1990-124 Class Z | | | 9.00 | | | | 10-25-2020 | | | | 6,483 | | | | 6,743 | |
FNMA Series 1990-21 Class Z | | | 9.00 | | | | 3-25-2020 | | | | 25,902 | | | | 26,744 | |
FNMA Series 1990-27 Class Z | | | 9.00 | | | | 3-25-2020 | | | | 13,298 | | | | 13,704 | |
FNMA Series 1990-30 Class D | | | 9.75 | | | | 3-25-2020 | | | | 3,495 | | | | 3,631 | |
FNMA Series 1990-77 Class D | | | 9.00 | | | | 6-25-2020 | | | | 11,178 | | | | 11,369 | |
FNMA Series 1991-132 Class Z | | | 8.00 | | | | 10-25-2021 | | | | 34,710 | | | | 36,574 | |
FNMA Series 1992-71 Class X | | | 8.25 | | | | 5-25-2022 | | | | 18,648 | | | | 19,989 | |
FNMA Series 2000-T6 Class A2 | | | 9.50 | | | | 11-25-2040 | | | | 347,184 | | | | 389,866 | |
FNMA Series 2001-T10 Class A3 | | | 9.50 | | | | 12-25-2041 | | | | 631,798 | | | | 721,024 | |
FNMA Series 2001-T12 Class A3 | | | 9.50 | | | | 8-25-2041 | | | | 572,213 | | | | 674,194 | |
FNMA Series 2002-T1 Class A4 | | | 9.50 | | | | 11-25-2031 | | | | 677,880 | | | | 776,352 | |
FNMA Series 2002-W04 Class A6 ±± | | | 4.27 | | | | 5-25-2042 | | | | 713,902 | | | | 729,525 | |
FNMA Series 2003-125 Class AY | | | 4.00 | | | | 12-25-2018 | | | | 5,941 | | | | 5,937 | |
FNMA Series 2003-129 Class AP | | | 4.00 | | | | 1-25-2019 | | | | 17 | | | | 17 | |
FNMA Series 2003-92 Class PE | | | 4.50 | | | | 9-25-2018 | | | | 51 | | | | 51 | |
FNMA Series 2003-W11 Class A1 ±± | | | 5.27 | | | | 6-25-2033 | | | | 22,628 | | | | 23,614 | |
FNMA Series 2003-W3 Class 1A4 ±± | | | 3.86 | | | | 8-25-2042 | | | | 35,488 | | | | 36,791 | |
FNMA Series 2004-10 Class FA (1 Month LIBOR +0.35%) ± | | | 2.41 | | | | 2-25-2034 | | | | 218,329 | | | | 218,530 | |
FNMA Series 2004-17 Class HJ | | | 4.75 | | | | 4-25-2019 | | | | 7,671 | | | | 7,660 | |
FNMA Series 2004-32 Class AY | | | 4.00 | | | | 5-25-2019 | | | | 4,700 | | | | 4,707 | |
FNMA Series 2004-92 Class QY | | | 4.50 | | | | 8-25-2034 | | | | 119,376 | | | | 119,364 | |
FNMA Series 2007-W2 Class 1A1 (1 Month LIBOR +0.32%) ± | | | 2.38 | | | | 3-25-2037 | | | | 373,910 | | | | 373,856 | |
FNMA Series 2008-76 Class GF (1 Month LIBOR +0.65%) ± | | | 2.71 | | | | 9-25-2023 | | | | 12,689 | | | | 12,697 | |
FNMA Series 2008-81 Class LK | | | 5.00 | | | | 9-25-2023 | | | | 2,470 | | | | 2,471 | |
FNMA Series 2009-31 Class B | | | 4.00 | | | | 5-25-2024 | | | | 1,690,404 | | | | 1,693,153 | |
FNMA Series 2010-115 Class NC | | | 2.75 | | | | 1-25-2039 | | | | 951,918 | | | | 941,793 | |
FNMA Series 2010-153 Class AB | | | 2.00 | | | | 11-25-2018 | | | | 1,620 | | | | 1,618 | |
FNMA Series 2010-153 Class BG | | | 2.50 | | | | 11-25-2018 | | | | 1,585 | | | | 1,583 | |
FNMA Series 2010-25 Class ND | | | 3.50 | | | | 3-25-2025 | | | | 44,306 | | | | 44,324 | |
FNMA Series 2010-37 Class A1 | | | 5.41 | | | | 5-25-2035 | | | | 5,798,322 | | | | 5,961,160 | |
FNMA Series 2010-57 Class DQ | | | 3.00 | | | | 6-25-2025 | | | | 273,089 | | | | 270,491 | |
FNMA Series 2010-89 Class DP | | | 3.00 | | | | 6-25-2038 | | | | 2,049,335 | | | | 2,053,782 | |
FNMA Series 2011-122 Class A | | | 3.00 | | | | 12-25-2025 | | | | 388,510 | | | | 388,092 | |
FNMA Series 2011-33 Class GA | | | 3.50 | | | | 10-25-2028 | | | | 135,443 | | | | 135,332 | |
FNMA Series 2011-40 Class CA | | | 3.50 | | | | 12-25-2028 | | | | 542,989 | | | | 543,996 | |
FNMA Series 2012-72 Class QE | | | 3.00 | | | | 1-25-2038 | | | | 473,641 | | | | 473,211 | |
FNMA Series 2012-94 Class E | | | 3.00 | | | | 6-25-2022 | | | | 23,938 | | | | 23,928 | |
FNMA Series 2013-26 Class AK | | | 2.50 | | | | 11-25-2038 | | | | 4,128,342 | | | | 4,026,044 | |
FNMA Series 2014-19 Class HA | | | 2.00 | | | | 6-25-2040 | | | | 1,034,292 | | | | 989,239 | |
GNMA | | | 7.00 | | | | 6-15-2033 | | | | 411,666 | | | | 476,236 | |
GNMA Series 2012-57 Class LG | | | 1.50 | | | | 3-16-2035 | | | | 215,107 | | | | 213,483 | |
GNMA Series 2016-H19 Class FE (1 Month LIBOR +0.37%) ± | | | 2.47 | | | | 6-20-2061 | | | | 1,362,270 | | | | 1,361,821 | |
GNMA Series 2017-H13 Class FJ (1 Month LIBOR +0.20%) ± | | | 2.30 | | | | 5-20-2067 | | | | 1,818,475 | | | | 1,816,005 | |
GNMA Series 2017-H16 Class FD (1 Month LIBOR +0.20%) ± | | | 2.30 | | | | 8-20-2067 | | | | 3,002,354 | | | | 2,998,828 | |
Vendee Mortgage Trust Series 2011-1 Class DA | | | 3.75 | | | | 2-15-2035 | | | | 2,120,952 | | | | 2,138,493 | |
| |
Total Agency Securities (Cost $112,959,359) | | | | 112,523,722 | |
| | | | | |
The accompanying notes are an integral part of these financial statements.
| | | | |
| 14 | | Wells Fargo Ultra Short-Term Income Fund | | Portfolio of investments—August 31, 2018 |
| | | | | | | | | | | | | | | | |
| Security name | | Interest rate | | | Maturity date | | | Principal | | | Value | |
|
Asset-Backed Securities: 10.03% | |
Ally Master Owner Trust Series 2017-1 Class A (1 Month LIBOR +0.40%) ± | | | 2.46 | % | | | 2-15-2021 | | | $ | 1,300,000 | | | $ | 1,301,529 | |
Avis Budget Rental Car Funding LLC Series 2014-1A Class A 144A | | | 2.46 | | | | 7-20-2020 | | | | 1,000,000 | | | | 996,631 | |
CCG Receivables Trust Series 2016-1 Class A2 144A | | | 1.69 | | | | 9-14-2022 | | | | 1,608,622 | | | | 1,601,810 | |
CCG Receivables Trust Series 2017-1 Class A2 144A | | | 1.84 | | | | 11-14-2023 | | | | 5,763,539 | | | | 5,719,952 | |
Chesapeake Funding LLC Series 2017-3A Class A 144A | | | 1.91 | | | | 8-15-2029 | | | | 7,464,993 | | | | 7,379,196 | |
Dell Equipment Finance Trust Series 2017-2 Class A2B (1 Month LIBOR +0.30%) 144A± | | | 2.37 | | | | 2-24-2020 | | | | 2,351,283 | | | | 2,352,074 | |
DLL Securitization Trust Series 2017-A Class A2 144A | | | 1.89 | | | | 7-15-2020 | | | | 3,748,670 | | | | 3,735,431 | |
Education Loan Asset-Backed Trust Series 2013-1 Class A1 (1 Month LIBOR +0.80%) 144A± | | | 2.86 | | | | 6-25-2026 | | | | 3,643,166 | | | | 3,657,724 | |
Educational Services of America Incorporated Series 2015-2 Class A (1 Month LIBOR +1.00%) 144A± | | | 3.06 | | | | 12-25-2056 | | | | 1,186,369 | | | | 1,195,912 | |
Enterprise Fleet Financing Trust Series 2017-1 Class A2 144A | | | 2.13 | | | | 7-20-2022 | | | | 3,878,139 | | | | 3,857,844 | |
Enterprise Fleet Financing Trust Series 2017-2 Class A2 144A | | | 1.97 | | | | 1-20-2023 | | | | 1,031,267 | | | | 1,023,968 | |
Finance of America Structured Series 2017-HB1 Class A 144A±±‡ | | | 2.32 | | | | 11-25-2027 | | | | 2,601,947 | | | | 2,594,532 | |
GMF Floorplan Owner Revolving Trust Series 2016-1 Class A2 (1 Month LIBOR +0.85%) 144A± | | | 2.91 | | | | 5-17-2021 | | | | 4,655,000 | | | | 4,675,770 | |
Harley-Davidson Motorcycle Trust Series 2015-1 Class A3 | | | 1.41 | | | | 6-15-2020 | | | | 198,346 | | | | 198,159 | |
Hyundai Auto Lease Securitization Trust Series 2017-C Class A3 144A | | | 2.12 | | | | 2-16-2021 | | | | 5,320,000 | | | | 5,280,268 | |
John Deere Owner Trust Series 2016-A Class A3 | | | 1.36 | | | | 4-15-2020 | | | | 778,653 | | | | 775,940 | |
Navistar Financial Dealer Note Master Trust Series 2017-1 Class A (1 Month LIBOR +0.78%) 144A± | | | 2.84 | | | | 6-27-2022 | | | | 6,000,000 | | | | 6,026,370 | |
Santander Retail Auto Lease Trust Series 2017-A Class A2A 144A | | | 2.02 | | | | 3-20-2020 | | | | 2,370,933 | | | | 2,362,488 | |
SLC Student Loan Trust Series 2006-2 Class A5 (3 Month LIBOR +0.10%) ± | | | 2.44 | | | | 9-15-2026 | | | | 1,917,567 | | | | 1,915,471 | |
SLM Student Loan Trust Series 2004-1 Class A3 (3 Month LIBOR +0.21%) ± | | | 2.55 | | | | 4-25-2023 | | | | 79,787 | | | | 79,798 | |
SLM Student Loan Trust Series 2004-8A Class A5 (3 Month LIBOR +0.50%) 144A± | | | 2.84 | | | | 4-25-2024 | | | | 621,900 | | | | 622,994 | |
SLM Student Loan Trust Series 2006-10 Class A5A (3 Month LIBOR +0.10%) ± | | | 2.44 | | | | 4-25-2027 | | | | 1,581,824 | | | | 1,580,161 | |
SLM Student Loan Trust Series 2011-2 Class A1 (1 Month LIBOR +0.60%) ± | | | 2.66 | | | | 11-25-2027 | | | | 2,131,590 | | | | 2,141,093 | |
SLM Student Loan Trust Series 2012-3 Class A (1 Month LIBOR +0.65%) ± | | | 2.71 | | | | 12-27-2038 | | | | 5,458,109 | | | | 5,479,079 | |
SLM Student Loan Trust Series 2013-1 Class A3 (1 Month LIBOR +0.55%) ± | | | 2.61 | | | | 5-26-2055 | | | | 4,381,128 | | | | 4,398,775 | |
South Texas Higher Education 2012-1 Class A2 (3 Month LIBOR +0.85%) ± | | | 3.19 | | | | 10-1-2024 | | | | 5,436,836 | | | | 5,460,541 | |
Structured Asset Securities Corporation Series 1998-2 Class A (1 Month LIBOR +0.52%) ± | | | 2.58 | | | | 2-25-2028 | | | | 130,602 | | | | 129,676 | |
Student Loan Consolidation Center Series 2011-1 Class A (1 Month LIBOR +1.22%) 144A± | | | 3.28 | | | | 10-25-2027 | | | | 6,562,886 | | | | 6,633,052 | |
Towd Point Asset Trust Series 2018-SL1 Class A (1 Month LIBOR +0.60%) 144A± | | | 2.66 | | | | 1-25-2046 | | | | 5,608,211 | | | | 5,579,207 | |
Verizon Owner Trust Series 2017-1A Class A 144A | | | 2.06 | | | | 9-20-2021 | | | | 5,175,000 | | | | 5,129,661 | |
Volvo Financial Equipment LLC Series 2016-1A Class A3 144A | | | 1.67 | | | | 2-18-2020 | | | | 144,710 | | | | 144,331 | |
Wheels SPV LLC Series 2018-1A Class A2 144A | | | 3.06 | | | | 4-20-2027 | | | | 3,385,000 | | | | 3,386,790 | |
World Omni Auto Receivables Trust Series 2016-B Class A3 | | | 1.30 | | | | 2-15-2022 | | | | 3,880,507 | | | | 3,837,843 | |
| | | | |
Total Asset-Backed Securities (Cost $101,329,516) | | | | | | | | | | | | | | | 101,254,070 | |
| | | | | |
| | | | |
Corporate Bonds and Notes: 33.66% | | | | | | | | | | | | | | | | |
| | | | |
Consumer Discretionary: 4.17% | | | | | | | | | | | | | | | | |
| | | | |
| Auto Components: 0.36% | | | | | | | | | | | | | | | | |
ZF North America Capital Incorporated 144A | | | 4.00 | | | | 4-29-2020 | | | | 3,641,000 | | | | 3,672,617 | |
| | | | | | | | | | | | | | | | |
|
| Hotels, Restaurants & Leisure: 0.94% | |
GLP Capital LP/GLP Financing II Incorporated | | | 4.88 | | | | 11-1-2020 | | | | 3,660,000 | | | | 3,751,500 | |
MGM Resorts International | | | 5.25 | | | | 3-31-2020 | | | | 3,660,000 | | | | 3,733,200 | |
Royal Caribbean Cruises Limited | | | 2.65 | | | | 11-28-2020 | | | | 2,000,000 | | | | 1,966,159 | |
| |
| | | | 9,450,859 | |
| | | | | |
The accompanying notes are an integral part of these financial statements.
| | | | | | |
| Portfolio of investments—August 31, 2018 | | Wells Fargo Ultra Short-Term Income Fund | | | 15 | |
| | | | | | | | | | | | | | | | |
| Security name | | Interest rate | | | Maturity date | | | Principal | | | Value | |
|
| Household Durables: 0.42% | |
D.R. Horton Incorporated | | | 3.75 | % | �� | | 3-1-2019 | | | $ | 2,990,000 | | | $ | 2,995,811 | |
Lennar Corporation | | | 4.50 | | | | 11-15-2019 | | | | 1,220,000 | | | | 1,232,200 | |
| |
| | | | 4,228,011 | |
| | | | | |
|
| Media: 2.45% | |
DIRECTV Holdings LLC | | | 5.88 | | | | 10-1-2019 | | | | 4,902,000 | | | | 5,046,767 | |
Discovery Communications LLC | | | 2.20 | | | | 9-20-2019 | | | | 3,725,000 | | | | 3,694,688 | |
NBCUniversal Enterprise Incorporated 144A | | | 5.25 | | | | 12-31-2049 | | | | 6,000,000 | | | | 6,075,000 | |
TEGNA Incorporated | | | 5.13 | | | | 7-15-2020 | | | | 3,660,000 | | | | 3,692,025 | |
Time Warner Cable Incorporated | | | 4.88 | | | | 3-15-2020 | | | | 6,010,000 | | | | 6,158,231 | |
| |
| | | | 24,666,711 | |
| | | | | |
|
Consumer Staples: 1.65% | |
|
| Food Products: 0.59% | |
Campbell Soup Company | | | 3.30 | | | | 3-15-2021 | | | | 6,040,000 | | | | 6,008,477 | |
| | | | | | | | | | | | | | | | |
|
| Tobacco: 1.06% | |
Altria Group Incorporated | | | 9.70 | | | | 11-10-2018 | | | | 3,625,000 | | | | 3,670,969 | |
British American Tobacco Capital Corporation 144A | | | 2.30 | | | | 8-14-2020 | | | | 5,215,000 | | | | 5,120,144 | |
Reynolds American Incorporated | | | 8.13 | | | | 6-23-2019 | | | | 1,793,000 | | | | 1,866,685 | |
| |
| | | | 10,657,798 | |
| | | | | |
|
Energy: 1.10% | |
|
| Oil, Gas & Consumable Fuels: 1.10% | |
Enable Midstream Partner LP | | | 2.40 | | | | 5-15-2019 | | | | 7,465,000 | | | | 7,430,523 | |
Sabine Pass Liquefaction LLC | | | 5.63 | | | | 2-1-2021 | | | | 3,500,000 | | | | 3,650,055 | |
| |
| | | | 11,080,578 | |
| | | | | |
|
Financials: 16.63% | |
|
| Banks: 7.43% | |
Australia & New Zealand Banking Group Limited | | | 2.25 | | | | 11-9-2020 | | | | 5,790,000 | | | | 5,674,215 | |
Bank of America Corporation (3 Month LIBOR +0.63%) ± | | | 2.33 | | | | 10-1-2021 | | | | 5,000,000 | | | | 4,896,262 | |
BB&T Corporation | | | 2.15 | | | | 2-1-2021 | | | | 7,000,000 | | | | 6,835,394 | |
Citigroup Incorporated | | | 2.45 | | | | 1-10-2020 | | | | 4,000,000 | | | | 3,969,441 | |
Citigroup Incorporated | | | 2.50 | | | | 7-29-2019 | | | | 6,087,000 | | | | 6,073,701 | |
Discover Bank | | | 2.60 | | | | 11-13-2018 | | | | 5,000,000 | | | | 5,000,300 | |
Fifth Third Bank | | | 2.30 | | | | 3-15-2019 | | | | 4,470,000 | | | | 4,464,728 | |
Huntington National Bank | | | 2.38 | | | | 3-10-2020 | | | | 8,000,000 | | | | 7,912,999 | |
JPMorgan Chase & Company (3 Month LIBOR +0.61%) ± | | | 3.51 | | | | 6-18-2022 | | | | 7,000,000 | | | | 7,033,380 | |
JPMorgan Chase Bank | | | 1.45 | | | | 9-21-2018 | | | | 2,000,000 | | | | 1,999,379 | |
PNC Bank | | | 2.45 | | | | 11-5-2020 | | | | 7,000,000 | | | | 6,899,295 | |
Rabobank Nederland NY | | | 1.38 | | | | 8-9-2019 | | | | 7,000,000 | | | | 6,909,950 | |
US Bank | | | 2.05 | | | | 10-23-2020 | | | | 7,460,000 | | | | 7,303,861 | |
| |
| | | | 74,972,905 | |
| | | | | |
|
| Capital Markets: 1.50% | |
Goldman Sachs Group Incorporated | | | 2.00 | | | | 4-25-2019 | | | | 4,000,000 | | | | 3,981,358 | |
Goldman Sachs Group Incorporated | | | 5.38 | | | | 3-15-2020 | | | | 5,000,000 | | | | 5,166,906 | |
The accompanying notes are an integral part of these financial statements.
| | | | |
| 16 | | Wells Fargo Ultra Short-Term Income Fund | | Portfolio of investments—August 31, 2018 |
| | | | | | | | | | | | | | | | |
| Security name | | Interest rate | | | Maturity date | | | Principal | | | Value | |
| | | | |
| Capital Markets (continued) | | | | | | | | | | | | | | | | |
Morgan Stanley | | | 2.20 | % | | | 12-7-2018 | | | $ | 4,000,000 | | | $ | 3,997,361 | |
Morgan Stanley | | | 2.45 | | | | 2-1-2019 | | | | 1,960,000 | | | | 1,959,116 | |
| |
| | | | 15,104,741 | |
| | | | | |
|
| Consumer Finance: 4.72% | |
Ally Financial Incorporated | | | 3.25 | | | | 11-5-2018 | | | | 7,665,000 | | | | 7,665,000 | |
BMW US Capital LLC 144A | | | 2.15 | | | | 4-6-2020 | | | | 1,000,000 | | | | 986,006 | |
Capital One Financial Corporation | | | 2.50 | | | | 5-12-2020 | | | | 7,000,000 | | | | 6,927,811 | |
Daimler Finance North America LLC 144A | | | 1.50 | | | | 7-5-2019 | | | | 3,000,000 | | | | 2,967,520 | |
Daimler Finance North America LLC 144A | | | 2.20 | | | | 5-5-2020 | | | | 1,480,000 | | | | 1,455,019 | |
Daimler Finance North America LLC 144A | | | 2.30 | | | | 2-12-2021 | | | | 4,000,000 | | | | 3,900,598 | |
Ford Motor Credit Company LLC | | | 2.94 | | | | 1-8-2019 | | | | 3,665,000 | | | | 3,664,010 | |
Ford Motor Credit Company LLC (3 Month LIBOR +0.88%) ± | | | 3.22 | | | | 10-12-2021 | | | | 2,840,000 | | | | 2,811,770 | |
Hyundai Capital America Incorporated 144A | | | 2.75 | | | | 9-18-2020 | | | | 4,000,000 | | | | 3,929,318 | |
John Deere Capital Corporation | | | 1.95 | | | | 6-22-2020 | | | | 3,000,000 | | | | 2,952,261 | |
Nissan Motor Acceptance Corporation 144A | | | 2.25 | | | | 1-13-2020 | | | | 4,000,000 | | | | 3,948,772 | |
Synchrony Bank | | | 3.65 | | | | 5-24-2021 | | | | 2,650,000 | | | | 2,633,088 | |
Synchrony Financial | | | 2.60 | | | | 1-15-2019 | | | | 3,815,000 | | | | 3,811,372 | |
| |
| | | | 47,652,545 | |
| | | | | |
|
| Diversified Financial Services: 0.39% | |
WEA Finance LLC 144A | | | 2.70 | | | | 9-17-2019 | | | | 2,975,000 | | | | 2,965,590 | |
WEA Finance LLC 144A | | | 3.25 | | | | 10-5-2020 | | | | 1,000,000 | | | | 998,426 | |
| |
| | | | 3,964,016 | |
| | | | | |
|
| Insurance: 2.59% | |
Axis Specialty Finance LLC | | | 5.88 | | | | 6-1-2020 | | | | 1,685,000 | | | | 1,754,292 | |
Jackson National Life Global Funding 144A | | | 2.30 | | | | 4-16-2019 | | | | 3,251,000 | | | | 3,246,035 | |
Metropolitan Life Global Funding Incorporated 144A | | | 1.55 | | | | 9-13-2019 | | | | 5,180,000 | | | | 5,118,409 | |
Metropolitan Life Global Funding Incorporated 144A | | | 1.75 | | | | 9-19-2019 | | | | 3,000,000 | | | | 2,965,179 | |
PartnerRe Finance B LLC | | | 5.50 | | | | 6-1-2020 | | | | 1,000,000 | | | | 1,034,538 | |
Protective Life Global Funding 144A | | | 2.26 | | | | 4-8-2020 | | | | 4,415,000 | | | | 4,357,889 | |
Reliance Standard Life Insurance 144A | | | 2.15 | | | | 10-15-2018 | | | | 7,610,000 | | | | 7,607,577 | |
| |
| | | | 26,083,919 | |
| | | | | |
| | | | |
Health Care: 2.44% | | | | | | | | | | | | | | | | |
| | | | |
| Health Care Providers & Services: 1.85% | | | | | | | | | | | | | | | | |
Anthem Incorporated | | | 2.50 | | | | 11-21-2020 | | | | 5,040,000 | | | | 4,964,444 | |
CVS Health Corporation | | | 3.13 | | | | 3-9-2020 | | | | 6,100,000 | | | | 6,102,716 | |
HCA Incorporated | | | 6.50 | | | | 2-15-2020 | | | | 3,685,000 | | | | 3,825,030 | |
Tenet Healthcare Corporation | | | 6.00 | | | | 10-1-2020 | | | | 3,660,000 | | | | 3,801,825 | |
| | | | |
| | | | | | | | | | | | | | | 18,694,015 | |
| | | | | | | | | | | | | | | | |
| | | | |
| Pharmaceuticals: 0.59% | | | | | | | | | | | | | | | | |
EMD Finance LLC 144A | | | 2.40 | | | | 3-19-2020 | | | | 5,965,000 | | | | 5,888,994 | |
| | | | | | | | | | | | | | | | |
The accompanying notes are an integral part of these financial statements.
| | | | | | |
| Portfolio of investments—August 31, 2018 | | Wells Fargo Ultra Short-Term Income Fund | | | 17 | |
| | | | | | | | | | | | | | | | |
| Security name | | Interest rate | | | Maturity date | | | Principal | | | Value | |
| | | | |
Industrials: 1.57% | | | | | | | | | | | | | | | | |
| | | | |
| Airlines: 0.59% | | | | | | | | | | | | | | | | |
Delta Air Lines Incorporated | | | 2.60 | % | | | 12-4-2020 | | | $ | 3,000,000 | | | $ | 2,939,702 | |
Delta Air Lines Incorporated | | | 3.40 | | | | 4-19-2021 | | | | 3,000,000 | | | | 2,981,138 | |
| | | | |
| | | | | | | | | | | | | | | 5,920,840 | |
| | | | | | | | | | | | | | | | |
| | | | |
| Machinery: 0.34% | | | | | | | | | | | | | | | | |
CNH Industrial Capital LLC | | | 4.38 | | | | 11-6-2020 | | | | 3,375,000 | | | | 3,417,188 | |
| | | | | | | | | | | | | | | | |
| | | | |
| Road & Rail: 0.35% | | | | | | | | | | | | | | | | |
ERAC USA Finance LLC 144A | | | 2.35 | | | | 10-15-2019 | | | | 3,605,000 | | | | 3,577,025 | |
| | | | | | | | | | | | | | | | |
| | | | |
| Transportation Infrastructure: 0.29% | | | | | | | | | | | | | | | | |
TTX Company 144A | | | 2.25 | | | | 2-1-2019 | | | | 2,905,000 | | | | 2,897,695 | |
| | | | | | | | | | | | | | | | |
| | | | |
Information Technology: 1.34% | | | | | | | | | | | | | | | | |
| | | | |
| Technology Hardware, Storage & Peripherals: 1.34% | | | | | | | | | | | | | | | | |
EMC Corporation | | | 2.65 | | | | 6-1-2020 | | | | 6,660,000 | | | | 6,512,472 | |
Hewlett Packard Enterprise Company | | | 3.60 | | | | 10-15-2020 | | | | 7,000,000 | | | | 7,047,391 | |
| | | | |
| | | | | | | | | | | | | | | 13,559,863 | |
| | | | | | | | | | | | | | | | |
| | | | |
Materials: 0.76% | | | | | | | | | | | | | | | | |
| | | | |
| Paper & Forest Products: 0.76% | | | | | | | | | | | | | | | | |
Georgia Pacific LLC 144A | | | 2.54 | | | | 11-15-2019 | | | | 7,740,000 | | | | 7,696,560 | |
| | | | | | | | | | | | | | | | |
| | | | |
Telecommunication Services: 2.67% | | | | | | | | | | | | | | | | |
| | | | |
| Diversified Telecommunication Services: 2.67% | | | | | | | | | | | | | | | | |
AT&T Incorporated | | | 5.00 | | | | 3-1-2021 | | | | 9,915,000 | | | | 10,293,045 | |
Broadcom International Limited | | | 2.20 | | | | 1-15-2021 | | | | 7,000,000 | | | | 6,786,792 | |
Broadcom International Limited | | | 2.38 | | | | 1-15-2020 | | | | 3,720,000 | | | | 3,680,175 | |
Verizon Communications Incorporated | | | 4.60 | | | | 4-1-2021 | | | | 6,000,000 | | | | 6,207,314 | |
| | | | |
| | | | | | | | | | | | | | | 26,967,326 | |
| | | | | | | | | | | | | | | | |
| | | | |
Utilities: 1.33% | | | | | | | | | | | | | | | | |
| | | | |
| Electric Utilities: 0.61% | | | | | | | | | | | | | | | | |
Duke Energy Florida LLC | | | 2.10 | | | | 12-15-2019 | | | | 1,500,000 | | | | 1,493,421 | |
Interstate Power & Light Company | | | 5.88 | | | | 9-15-2018 | | | | 1,675,000 | | | | 1,676,491 | |
Pinnacle West Capital Corporation | | | 2.25 | | | | 11-30-2020 | | | | 3,000,000 | | | | 2,933,892 | |
| | | | |
| | | | | | | | | | | | | | | 6,103,804 | |
| | | | | | | | | | | | | | | | |
| | | | |
| Multi-Utilities: 0.72% | | | | | | | | | | | | | | | | |
Black Hills Corporation | | | 2.50 | | | | 1-11-2019 | | | | 3,645,000 | | | | 3,640,474 | |
Dominion Resources Incorporated | | | 2.96 | | | | 7-1-2019 | | | | 3,635,000 | | | | 3,638,755 | |
| | | | |
| | | | | | | | | | | | | | | 7,279,229 | |
| | | | | | | | | | | | | | | | |
| | | | |
Total Corporate Bonds and Notes (Cost $342,658,180) | | | | | | | | | | | | | | | 339,545,716 | |
| | | | | | | | | | | | | | | | |
The accompanying notes are an integral part of these financial statements.
| | | | |
| 18 | | Wells Fargo Ultra Short-Term Income Fund | | Portfolio of investments—August 31, 2018 |
| | | | | | | | | | | | | | | | |
| Security name | | | | | | | | Shares | | | Value | |
| | | | |
Exchange-Traded Funds: 3.00% | | | | | | | | | | | | | | | | |
SPDR Portfolio Short Term Corporate Bond ETF « | | | | | | | | | | | 1,000,000 | | | $ | 30,260,000 | |
| | | | | | | | | | | | | | | | |
| | | | |
Total Exchange-Traded Funds (Cost $30,200,000) | | | | | | | | | | | | | | | 30,260,000 | |
| | | | | | | | | | | | | | | | |
| | | | |
| | | Interest rate | | | Maturity date | | | Principal | | | | |
| Municipal Obligations: 2.78% | | | | | | | | | | | | | | | | |
| | | | |
California: 0.36% | | | | | | | | | | | | | | | | |
| | | | |
| Miscellaneous Revenue: 0.36% | | | | | | | | | | | | | | | | |
Los Angeles CA Municipal Improvement Refunding Bond Convention Center Series A | | | 2.34 | % | | | 11-1-2018 | | | $ | 3,620,000 | | | | 3,618,950 | |
| | | | | | | | | | | | | | | | |
| | | | |
Connecticut: 0.64% | | | | | | | | | | | | | | | | |
| | | | |
| GO Revenue: 0.64% | | | | | | | | | | | | | | | | |
Connecticut Series A | | | 2.30 | | | | 1-15-2019 | | | | 5,000,000 | | | | 4,989,000 | |
Connecticut Series A | | | 5.46 | | | | 3-1-2019 | | | | 1,420,000 | | | | 1,436,188 | |
| | | | |
| | | | | | | | | | | | | | | 6,425,188 | |
| | | | | | | | | | | | | | | | |
| | | | |
Illinois: 0.50% | | | | | | | | | | | | | | | | |
| | | | |
| Miscellaneous Revenue: 0.50% | | | | | | | | | | | | | | | | |
Illinois | | | 5.00 | | | | 5-1-2019 | | | | 4,930,000 | | | | 5,013,711 | |
| | | | | | | | | | | | | | | | |
| | | | |
Michigan: 0.15% | | | | | | | | | | | | | | | | |
| | | | |
| Miscellaneous Revenue: 0.15% | | | | | | | | | | | | | | | | |
Michigan Finance Authority Subordinated Bond Series C-2 (Municipal Government Guaranty Insured) | | | 1.61 | | | | 11-1-2018 | | | | 1,000,000 | | | | 999,010 | |
Michigan Finance Authority Subordinated Bond Series C-4 (Municipal Government Guaranty Insured) | | | 2.27 | | | | 4-1-2019 | | | | 500,000 | | | | 495,580 | |
| | | | |
| | | | | | | | | | | | | | | 1,494,590 | |
| | | | | | | | | | | | | | | | |
| | | | |
New Jersey: 0.39% | | | | | | | | | | | | | | | | |
| | | | |
| Miscellaneous Revenue: 0.39% | | | | | | | | | | | | | | | | |
New Jersey TTFA Series B | | | 1.76 | | | | 12-15-2018 | | | | 4,000,000 | | | | 3,988,440 | |
| | | | | | | | | | | | | | | | |
| | | | |
Wisconsin: 0.74% | | | | | | | | | | | | | | | | |
| | | | |
| Housing Revenue: 0.74% | | | | | | | | | | | | | | | | |
Wisconsin Healthcare PFA (Citizens Bank LOC) | | | 2.63 | | | | 11-1-2019 | | | | 7,610,000 | | | | 7,502,319 | |
| | | | | | | | | | | | | | | | |
| | | | |
Total Municipal Obligations (Cost $28,142,631) | | | | | | | | | | | | | | | 28,043,198 | |
| | | | | | | | | | | | | | | | |
| | | | |
Non-Agency Mortgage-Backed Securities: 15.93% | | | | | | | | | | | | | | | | |
Banc of America Funding Corporation Series 2016-R1 Class A1 144A±± | | | 2.50 | | | | 3-25-2040 | | | | 1,907,445 | | | | 1,852,874 | |
BDS Limited Series 2018-FL2 Class A (1 Month LIBOR +0.95%) 144A± | | | 3.01 | | | | 8-15-2035 | | | | 2,855,000 | | | | 2,863,067 | |
BlueMountain CLO Limited Series 2014-2A Class AR (3 Month LIBOR +0.93%) 144A± | | | 3.28 | | | | 7-20-2026 | | | | 5,970,000 | | | | 5,967,737 | |
BX Trust 2017 Series A (1 Month LIBOR +1.05%) 144A± | | | 3.11 | | | | 10-15-2032 | | | | 1,615,000 | | | | 1,616,998 | |
CD Commercial Mortgage Trust Series 2017-CD3 Class A1 | | | 1.97 | | | | 2-10-2050 | | | | 3,984,842 | | | | 3,920,460 | |
CGDBB Commercial Mortgage Trust Series 2017-BIOC Class A (1 Month LIBOR +0.79%) 144A± | | | 2.85 | | | | 7-15-2032 | | | | 5,600,000 | | | | 5,599,992 | |
CIFC Funding Limited Series 2012-2RA Class A1 (3 Month LIBOR +0.80%) 144A± | | | 3.15 | | | | 1-20-2028 | | | | 7,550,000 | | | | 7,494,492 | |
CIFC Funding Limited Series 2015-2A Class AR (3 Month LIBOR +0.78%) 144A± | | | 3.12 | | | | 4-15-2027 | | | | 7,000,000 | | | | 6,971,552 | |
The accompanying notes are an integral part of these financial statements.
| | | | | | |
| Portfolio of investments—August 31, 2018 | | Wells Fargo Ultra Short-Term Income Fund | | | 19 | |
| | | | | | | | | | | | | | | | |
| Security name | | Interest rate | | | Maturity date | | | Principal | | | Value | |
| | | | |
Non-Agency Mortgage-Backed Securities (continued) | | | | | | | | | | | | | | | | |
Citigroup Commercial Mortgage Trust Series 2008-C7 Class AMA ±± | | | 6.34 | % | | | 12-10-2049 | | | $ | 1,000,000 | | | $ | 1,000,000 | |
Citigroup Commercial Mortgage Trust Series 2014-GC25 Class A2 | | | 3.26 | | | | 10-10-2047 | | | | 3,563,000 | | | | 3,574,340 | |
Citigroup Commercial Mortgage Trust Series 2017-1500 Class A (1 Month LIBOR +0.85%) 144A± | | | 2.91 | | | | 7-15-2032 | | | | 6,150,000 | | | | 6,151,993 | |
Citigroup Commercial Mortgage Trust Series 2017-MDRB Class A (1 Month LIBOR +1.10%) 144A± | | | 3.16 | | | | 7-15-2030 | | | | 4,715,235 | | | | 4,698,099 | |
Collateralized Mortgage Obligation Trust Series 66 Class Z | | | 8.00 | | | | 9-20-2021 | | | | 10,440 | | | | 10,762 | |
Commercial Mortgage Trust Series 2010-C1 Class A3 144A | | | 4.21 | | | | 7-10-2046 | | | | 1,592,394 | | | | 1,617,667 | |
Commercial Mortgage Trust Series 2014-LC17 Class A2 | | | 3.16 | | | | 10-10-2047 | | | | 7,925,000 | | | | 7,944,616 | |
Commercial Mortgage Trust Series 2014-UBS5 Class A2 | | | 3.03 | | | | 9-10-2047 | | | | 4,518,637 | | | | 4,521,516 | |
Commercial Mortgage Trust Series 2015-LC23 Class A1 | | | 1.81 | | | | 10-10-2048 | | | | 5,048,323 | | | | 4,989,939 | |
Countrywide Home Loans Mortgage Pass-Through Trust Series 2001-HYB1 Class 1A1 ±± | | | 3.29 | | | | 6-19-2031 | | | | 148,568 | | | | 148,653 | |
Countrywide Home Loans Mortgage Pass-Through Trust Series 2001-HYB1 Class 2A1 ±± | | | 3.21 | | | | 6-19-2031 | | | | 91,503 | | | | 90,023 | |
Crown Point Limited Series 2013-2A Class A1LR (3 Month LIBOR +0.59%) 144A± | | | 2.93 | | | | 12-31-2023 | | | | 180,676 | | | | 180,599 | |
Crown Point Limited Series 2015-3A Class A1AR (3 Month LIBOR +0.91%) 144A± | | | 3.25 | | | | 12-31-2027 | | | | 7,030,000 | | | | 7,029,880 | |
CSAIL Commercial Mortgage Trust Series 2015-C4 Class A1 | | | 2.01 | | | | 11-15-2048 | | | | 1,511,421 | | | | 1,496,905 | |
DLJ Mortgage Acceptance Corporation Series 1990-2 Class A ±± | | | 3.37 | | | | 1-25-2022 | | | | 12,584 | | | | 12,584 | |
EquiFirst Mortgage Loan Trust Series 2003-2 Class 3A3 (1 Month LIBOR +1.13%) ± | | | 3.19 | | | | 9-25-2033 | | | | 373,270 | | | | 368,068 | |
FirstKey Mortgage Trust Series 2014-1 Class A2 144A±± | | | 3.00 | | | | 11-25-2044 | | | | 3,619,260 | | | | 3,599,242 | |
GS Mortgage Securities Trust Series 2010-C1 Class A1 144A | | | 3.68 | | | | 8-10-2043 | | | | 1,784,320 | | | | 1,791,327 | |
GS Mortgage Securities Trust Series 2011-GC3 Class A4 144A | | | 4.75 | | | | 3-10-2044 | | | | 5,315,217 | | | | 5,478,662 | |
GS Mortgage Securities Trust Series 2013-GC12 Class A2 | | | 2.01 | | | | 6-10-2046 | | | | 47,820 | | | | 47,786 | |
GS Mortgage Securities Trust Series 2015-GS1 Class A1 | | | 1.94 | | | | 11-10-2048 | | | | 570,163 | | | | 563,960 | |
GS Mortgage Securities Trust Series 2016-GS3 Class A1 | | | 1.43 | | | | 10-10-2049 | | | | 1,541,461 | | | | 1,508,775 | |
GSMPS Mortgage Loan Trust Series 1998-1 Class A 144A±± | | | 8.00 | | | | 9-19-2027 | | | | 42,122 | | | | 41,871 | |
Halcyon Loan Advisors Funding Series 2014-3A Class AR (3 Month LIBOR +1.10%) 144A± | | | 3.45 | | | | 10-22-2025 | | | | 7,000,000 | | | | 7,001,379 | |
Housing Securities Incorporated Series 1992-8 Class E ±± | | | 4.95 | | | | 6-25-2024 | | | | 37,032 | | | | 37,324 | |
JPMorgan Chase Commercial Mortgage Securities Trust Series 2007-CB18 Class AMFL (1 Month LIBOR +0.17%) ± | | | 2.23 | | | | 6-12-2047 | | | | 2,207,617 | | | | 2,169,294 | |
JPMorgan Chase Commercial Mortgage Securities Trust Series 2012-LC9 Class A3 | | | 2.48 | | | | 12-15-2047 | | | | 1,692,524 | | | | 1,690,546 | |
JPMorgan Chase Commercial Mortgage Securities Trust Series 2015-C28 Class A2 | | | 2.77 | | | | 10-15-2048 | | | | 115,000 | | | | 114,576 | |
JPMorgan Chase Commercial Mortgage Securities Trust Series 2015-C33 Class A1 | | | 1.90 | | | | 12-15-2048 | | | | 3,824,903 | | | | 3,794,300 | |
JPMorgan Chase Commercial Mortgage Securities Trust Series 2016-JP3 Class A1 | | | 1.46 | | | | 8-15-2049 | | | | 3,227,667 | | | | 3,156,650 | |
JPMorgan Chase Commercial Mortgage Securities Trust Series 2017-JP5 Class A1 | | | 2.09 | | | | 3-15-2050 | | | | 3,670,786 | | | | 3,607,623 | |
JPMorgan Chase Commercial Mortgage Securities Trust Series 2018-PHH Class A (1 Month LIBOR +0.91%) 144A± | | | 2.97 | | | | 6-15-2035 | | | | 3,915,000 | | | | 3,921,093 | |
Master Mortgages Trust Series 2002-3 Class 4A1 ±± | | | 4.31 | | | | 10-25-2032 | | | | 7,681 | | | | 7,678 | |
Morgan Stanley Bank of America Merrill Lynch Trust Series 2013-C11 Class A2 | | | 3.09 | | | | 8-15-2046 | | | | 1,889,657 | | | | 1,887,631 | |
Morgan Stanley Bank of America Merrill Lynch Trust Series 2014-C15 Class A2 | | | 2.98 | | | | 4-15-2047 | | | | 2,598,574 | | | | 2,598,293 | |
Morgan Stanley Bank of America Merrill Lynch Trust Series 2016-C28 Class A1 | | | 1.53 | | | | 1-15-2049 | | | | 1,581,072 | | | | 1,551,932 | |
Morgan Stanley Capital I Trust Series 2016-C30 Class A1 | | | 1.39 | | | | 9-15-2049 | | | | 5,540,226 | | | | 5,404,373 | |
Neuberger Berman Limited Series 2015-20A Class AR (3 Month LIBOR +0.80%) 144A± | | | 3.14 | | | | 1-15-2028 | | | | 4,085,000 | | | | 4,078,194 | |
Octagon Investment Partners Series 2015-1A Class A1R (3 Month LIBOR +0.90%) 144A± | | | 3.21 | | | | 5-21-2027 | | | | 6,300,000 | | | | 6,295,647 | |
Rait Trust Series 2017-FL7 Class A (1 Month LIBOR +0.95%) 144A± | | | 3.01 | | | | 6-15-2037 | | | | 2,193,504 | | | | 2,194,574 | |
Regatta IV Funding Limited Series 2014-1A Class A2R (3 Month LIBOR +1.02%) 144A± | | | 3.36 | | | | 7-25-2026 | | | | 5,245,000 | | | | 5,245,467 | |
The accompanying notes are an integral part of these financial statements.
| | | | |
| 20 | | Wells Fargo Ultra Short-Term Income Fund | | Portfolio of investments—August 31, 2018 |
| | | | | | | | | | | | | | | | |
| Security name | | Interest rate | | | Maturity date | | | Principal | | | Value | |
| | | | |
Non-Agency Mortgage-Backed Securities (continued) | | | | | | | | | | | | | | | | |
Salomon Brothers Mortgage Securities VII Series 1990-2 Class A ±± | | | 3.05 | % | | | 11-25-2020 | | | $ | 146,108 | | | $ | 146,182 | |
Stonemont Portfolio Trust Series 2017 Class A (1 Month LIBOR +0.85%) 144A± | | | 2.93 | | | | 8-20-2030 | | | | 5,169,328 | | | | 5,169,302 | |
Structured Asset Mortgage Investments Incorporated Series 2001-4 Class A2 ±± | | | 8.15 | | | | 10-25-2024 | | | | 8,527 | | | | 8,565 | |
Venture CDO Limited Series 2015-20A Class AR (3 Month LIBOR +0.82%) 144A± | | | 3.16 | | | | 4-15-2027 | | | | 7,000,000 | | | | 6,980,239 | |
Wilshire Funding Corporation Series 1996-3 Class M2 ±± | | | 7.12 | | | | 8-25-2032 | | | | 134,807 | | | | 131,271 | |
Wilshire Funding Corporation Series 1996-3 Class M3 ±± | | | 7.12 | | | | 8-25-2032 | | | | 126,374 | | | | 120,450 | |
Wilshire Funding Corporation Series 1998-2 Class M1 ±± | | | 2.00 | | | | 12-28-2037 | | | | 221,299 | | | | 220,602 | |
| | | | |
Total Non-Agency Mortgage-Backed Securities (Cost $161,823,377) | | | | | | | | | | | | | | | 160,687,624 | |
| | | | | | | | | | | | | | | | |
| | | | |
Yankee Corporate Bonds and Notes: 17.13% | | | | | | | | | | | | | | | | |
| | | | |
Consumer Discretionary: 0.82% | | | | | | | | | | | | | | | | |
| | | | |
| Automobiles: 0.12% | | | | | | | | | | | | | | | | |
Jaguar Land Rover Limited 144A | | | 4.25 | | | | 11-15-2019 | | | | 1,220,000 | | | | 1,216,950 | |
| | | | | | | | | | | | | | | | |
| | | | |
| Media: 0.70% | | | | | | | | | | | | | | | | |
British Sky Broadcasting Group plc 144A | | | 9.50 | | | | 11-15-2018 | | | | 7,000,000 | | | | 7,092,154 | |
| | | | | | | | | | | | | | | | |
| | | | |
Consumer Staples: 0.09% | | | | | | | | | | | | | | | | |
| | | | |
| Beverages: 0.09% | | | | | | | | | | | | | | | | |
Suntory Holdings Limited 144A | | | 2.55 | | | | 9-29-2019 | | | | 850,000 | | | | 844,900 | |
| | | | | | | | | | | | | | | | |
| | | | |
Energy: 0.71% | | | | | | | | | | | | | | | | |
| | | | |
| Oil, Gas & Consumable Fuels: 0.71% | | | | | | | | | | | | | | | | |
TransCanada PipeLines Limited | | | 9.88 | | | | 1-1-2021 | | | | 6,200,000 | | | | 7,127,368 | |
| | | | | | | | | | | | | | | | |
| | | | |
Financials: 12.36% | | | | | | | | | | | | | | | | |
| | | | |
| Banks: 8.63% | | | | | | | | | | | | | | | | |
ABN AMRO Bank NV 144A | | | 3.40 | | | | 8-27-2021 | | | | 7,000,000 | | | | 6,993,833 | |
ANZ New Zealand International Limited 144A | | | 2.60 | | | | 9-23-2019 | | | | 8,175,000 | | | | 8,142,535 | |
Banco de Credito del Peru 144A | | | 2.25 | | | | 10-25-2019 | | | | 4,500,000 | | | | 4,432,500 | |
Banco Santander Chile 144A | | | 2.50 | | | | 12-15-2020 | | | | 8,255,000 | | | | 8,058,944 | |
Bank of Tokyo-Mitsubishi UFJ Limited 144A | | | 2.15 | | | | 9-14-2018 | | | | 3,000,000 | | | | 2,999,871 | |
Banque Federative du Credit Mutuel SA 144A | | | 2.20 | | | | 7-20-2020 | | | | 7,470,000 | | | | 7,328,556 | |
BPCE SA | | | 2.50 | | | | 7-15-2019 | | | | 2,245,000 | | | | 2,234,704 | |
Commonwealth Bank of Australia 144A | | | 1.75 | | | | 11-7-2019 | | | | 5,250,000 | | | | 5,179,171 | |
DNB Bank ASA 144A | | | 2.13 | | | | 10-2-2020 | | | | 7,000,000 | | | | 6,831,574 | |
Federation des Caisses Desjardins du Quebec 144A | | | 2.25 | | | | 10-30-2020 | | | | 5,000,000 | | | | 4,891,649 | |
ING Bank NV 144A | | | 1.65 | | | | 8-15-2019 | | | | 7,000,000 | | | | 6,909,559 | |
Sumitomo Mitsui Banking Corporation | | | 2.09 | | | | 10-18-2019 | | | | 5,000,000 | | | | 4,939,300 | |
Sumitomo Mitsui Trust Bank Limited 144A | | | 1.95 | | | | 9-19-2019 | | | | 7,000,000 | | | | 6,917,145 | |
Suncorp-Metway Limited 144A | | | 2.38 | | | | 11-9-2020 | | | | 4,000,000 | | | | 3,911,960 | |
Svenska Handelsbanken AB | | | 1.50 | | | | 9-6-2019 | | | | 7,395,000 | | | | 7,294,843 | |
| | | | |
| | | | | | | | | | | | | | | 87,066,144 | |
| | | | | | | | | | | | | | | | |
| | | | |
| Capital Markets: 0.97% | | | | | | | | | | | | | | | | |
BP Capital Markets plc | | | 1.68 | | | | 5-3-2019 | | | | 7,000,000 | | | | 6,961,294 | |
Macquarie Group Limited 144A | | | 6.00 | | | | 1-14-2020 | | | | 2,750,000 | | | | 2,843,014 | |
| | | | |
| | | | | | | | | | | | | | | 9,804,308 | |
| | | | | | | | | | | | | | | | |
The accompanying notes are an integral part of these financial statements.
| | | | | | |
| Portfolio of investments—August 31, 2018 | | Wells Fargo Ultra Short-Term Income Fund | | | 21 | |
| | | | | | | | | | | | | | | | |
| Security name | | Interest rate | | | Maturity date | | | Principal | | | Value | |
| | | | |
| Diversified Financial Services: 2.10% | | | | | | | | | | | | | | | | |
Corporacion Andina de Fomento | | | 2.00 | % | | | 5-10-2019 | | | $ | 8,000,000 | | | $ | 7,949,456 | |
GE Capital International Funding Company | | | 2.34 | | | | 11-15-2020 | | | | 6,000,000 | | | | 5,877,030 | |
UBS AG 144A | | | 2.20 | | | | 6-8-2020 | | | | 3,725,000 | | | | 3,658,047 | |
UBS AG | | | 2.38 | | | | 8-14-2019 | | | | 3,730,000 | | | | 3,715,432 | |
| | | | |
| | | | | | | | | | | | | | | 21,199,965 | |
| | | | | | | | | | | | | | | | |
| | | | |
| Insurance: 0.66% | | | | | | | | | | | | | | | | |
Axis Specialty Finance plc | | | 2.65 | | | | 4-1-2019 | | | | 6,641,000 | | | | 6,632,103 | |
| | | | | | | | | | | | | | | | |
| | | | |
Health Care: 1.30% | | | | | | | | | | | | | | | | |
| | | | |
| Pharmaceuticals: 1.30% | | | | | | | | | | | | | | | | |
Shire Acquisitions Investment Ireland Limited | | | 1.90 | | | | 9-23-2019 | | | | 2,880,000 | | | | 2,846,465 | |
Shire Acquisitions Investment Ireland Limited | | | 2.40 | | | | 9-23-2021 | | | | 2,520,000 | | | | 2,435,095 | |
Teva Pharmaceuticals Industries Incorporated | | | 1.70 | | | | 7-19-2019 | | | | 8,000,000 | | | | 7,864,531 | |
| | | | |
| | | | | | | | | | | | | | | 13,146,091 | |
| | | | | | | | | | | | | | | | |
| | | | |
Materials: 0.87% | | | | | | | | | | | | | | | | |
| | | | |
| Chemicals: 0.49% | | | | | | | | | | | | | | | | |
Syngenta Finance NV 144A | | | 3.70 | | | | 4-24-2020 | | | | 5,000,000 | | | | 5,002,656 | |
| | | | | | | | | | | | | | | | |
| | | | |
| Metals & Mining: 0.38% | | | | | | | | | | | | | | | | |
ArcelorMittal SA | | | 5.50 | | | | 3-1-2021 | | | | 3,660,000 | | | | 3,792,597 | |
| | | | | | | | | | | | | | | | |
| | | | |
Telecommunication Services: 0.98% | | | | | | | | | | | | | | | | |
| | | | |
| Diversified Telecommunication Services: 0.98% | | | | | | | | | | | | | | | | |
Deutsche Telekom International Finance BV 144A | | | 2.23 | | | | 1-17-2020 | | | | 10,000,000 | | | | 9,889,411 | |
| | | | | | | | | | | | | | | | |
| | | | |
Total Yankee Corporate Bonds and Notes (Cost $174,600,905) | | | | | | | | | | | | | | | 172,814,647 | |
| | | | | | | | | | | | | | | | |
| | | | |
| | | Yield | | | | | | | | | | |
| Short-Term Investments: 6.29% | | | | | | | | | | | | | | | | |
| | | | |
| Commercial Paper: 2.11% | | | | | | | | | | | | | | | | |
Baptist Memorial Health Care Facilities & Services | | | 2.60 | | | | 10-5-2018 | | | | 3,500,000 | | | | 3,498,530 | |
Catholic Health Initiatives (z) | | | 1.97 | | | | 9-14-2018 | | | | 10,000,000 | | | | 9,992,382 | |
Michigan State University Board of Trustees Series B | | | 2.40 | | | | 9-10-2018 | | | | 7,805,000 | | | | 7,805,234 | |
| | | | |
| | | | | | | | | | | | | | | 21,296,146 | |
| | | | | | | | | | | | | | | | |
| | | | |
| | | | | | | | | Shares | | | | |
| Investment Companies: 3.99% | | | | | | | | | | | | | | | | |
Securities Lending Cash Investment LLC (l)(r)(u) | | | 2.07 | | | | | | | | 6,848,410 | | | | 6,849,095 | |
Wells Fargo Government Money Market Fund Select Class (l)(u) | | | 1.87 | | | | | | | | 33,367,503 | | | | 33,367,503 | |
| | | | |
| | | | | | | | | | | | | | | 40,216,598 | |
| | | | | | | | | | | | | | | | |
The accompanying notes are an integral part of these financial statements.
| | | | |
| 22 | | Wells Fargo Ultra Short-Term Income Fund | | Portfolio of investments—August 31, 2018 |
| | | | | | | | | | | | | | | | |
| Security name | | Yield | | | Maturity date | | | Principal | | | Value | |
| | | | |
| U.S. Treasury Securities: 0.19% | | | | | | | | | | | | | | | | |
U.S. Treasury Bill (z)# | | | 1.31 | % | | | 9-13-2018 | | | $ | 1,950,000 | | | $ | 1,949,070 | |
| | | | | | | | | | | | | | | | |
| | | | |
Total Short-Term Investments (Cost $63,463,037) | | | | | | | | | | | | | | | 63,461,814 | |
| | | | | | | | | | | | | | | | |
| | | | | | | | |
| Total investments in securities (Cost $1,015,177,005) | | | 99.97 | % | | | 1,008,590,791 | |
Other assets and liabilities, net | | | 0.03 | | | | 254,576 | |
| | | | | | | | |
| Total net assets | | | 100.00 | % | | $ | 1,008,845,367 | |
| | | | | | | | |
| 144A | The security may be resold in transactions exempt from registration, normally to qualified institutional buyers, pursuant to Rule 144A under the Securities Act of 1933. |
| ± | Variable rate investment. The rate shown is the rate in effect at period end. |
| ±± | The coupon of the security is adjusted based on the principal and interest payments received from the underlying pool of mortgages as well as the credit quality and the actual prepayment speed of the underlying mortgages. |
| ‡ | Security is valued using significant unobservable inputs. |
| « | All or a portion of this security is on loan. |
| (z) | Zero coupon security. The rate represents the current yield to maturity. |
| (l) | The issuer of the security is an affiliated person of the Fund as defined in the Investment Company Act of 1940. |
| (r) | The investment is a non-registered investment company purchased with cash collateral received from securities on loan. |
| (u) | The rate represents the 7-day annualized yield at period end. |
| # | All or a portion of this security is segregated as collateral for investments in derivative instruments. |
Abbreviations:
| CDO | Collateralized debt obligation |
| CLO | Collateralized loan obligation |
| FDIC | Federal Deposit Insurance Corporation |
| FHLMC | Federal Home Loan Mortgage Corporation |
| FNMA | Federal National Mortgage Association |
| GNMA | Government National Mortgage Association |
| LIBOR | London Interbank Offered Rate |
| PFA | Public Finance Authority |
| TTFA | Transportation Trust Fund Authority |
Futures Contracts
| | | | | | | | | | | | | | | | | | | | | | | | |
| Description | | Number of
contracts | | | Expiration
date | | | Notional
cost | | | Notional
value | | | Unrealized
gains | | | Unrealized
losses | |
Short | | | | | | | | | | | | | | | | | | | | | | | | |
2-Year U.S. Treasury Notes | | | (1,483) | | | | 12-31-2018 | | | $ | (313,291,560 | ) | | $ | (313,445,955 | ) | | $ | 0 | | | $ | (154,395 | ) |
5-Year U.S. Treasury Notes | | | (47) | | | | 12-31-2018 | | | | (5,323,824 | ) | | | (5,329,727 | ) | | | 0 | | | | (5,903 | ) |
| | | | | | | | | | | | | | | | | | | | | | | | |
| | | | | | | | | | | | | | | | | | $ | 0 | | | $ | (160,298 | ) |
| | | | | | | | | | | | | | | | | | | | | | | | |
The accompanying notes are an integral part of these financial statements.
| | | | | | |
| Portfolio of investments—August 31, 2018 | | Wells Fargo Ultra Short-Term Income Fund | | | 23 | |
Investments in Affiliates
An affiliated investment is an investment in which the Fund owns at least 5% of the outstanding voting shares of the issuer or as a result of other relationships, such as the Fund and the issuer having the same investment manager. Transactions with issuers that were either affiliated persons of the Fund at the beginning of the period or the end of the period were as follows:
| | | | | | | | | | | | | | | | | | | | | | | | | | | | | | | | | | | | |
| | | Shares,
beginning of
period | | | Shares
purchased | | | Shares
sold | | | Shares,
end of
period | | | Net
realized
gains
(losses) | | | Net
change in
unrealized
gains
(losses) | | | Income
from
affiliated
securities | | | Value,
end
of period | | | % of
net
assets | |
Short-Term Investments | | | | | | | | | | | | | | | | | | | | | | | | | | | | | | | | | | | | |
Investment Companies | | | | | | | | | | | | | | | | | | | | | | | | | | | | | | | | | | | | |
Securities Lending Cash Investment LLC | | | 0 | | | | 16,853,860 | | | | 10,005,450 | | | | 6,848,410 | | | $ | 0 | | | $ | 0 | | | $ | 26,516 | | | $ | 6,849,095 | | | | | |
Wells Fargo Government Money Market Fund Select Class | | | 119,018,607 | | | | 789,550,336 | | | | 875,201,440 | | | | 33,367,503 | | | | 0 | | | | 0 | | | | 646,300 | | | | 33,367,503 | | | | | |
| | | | | | | | | | | | | | | | | | | | | | | | | | | | | | | | | | | | |
| | | | | | | | | | | | | | | | | | $ | 0 | | | $ | 0 | | | $ | 672,816 | | | $ | 40,216,598 | | | | 3.99 | % |
| | | | | | | | | | | | | | | | | | | | | | | | | | | | | | | | | | | | |
The accompanying notes are an integral part of these financial statements.
| | | | |
| 24 | | Wells Fargo Ultra Short-Term Income Fund | | Statement of assets and liabilities—August 31, 2018 |
| | | | |
| | | | |
| |
Assets | | | | |
Investments in unaffiliated securities (including $6,687,460 of securities loaned), at value (cost $974,960,407) | | $ | 968,374,193 | |
Investments in affiliated securities, at value (cost $40,216,598) | | | 40,216,598 | |
Principal paydown receivable | | | 199,811 | |
Receivable for Fund shares sold | | | 3,669,244 | |
Receivable for interest | | | 6,072,267 | |
Receivable for securities lending income | | | 18,652 | |
Prepaid expenses and other assets | | | 1,553 | |
| | | | |
Total assets | | | 1,018,552,318 | |
| | | | |
| |
Liabilities | | | | |
Payable upon receipt of securities loaned | | | 6,849,095 | |
Payable for Fund shares redeemed | | | 1,155,037 | |
Dividends payable | | | 828,727 | |
Management fee payable | | | 258,450 | |
Payable for daily variation margin on open futures contracts | | | 143,805 | |
Administration fees payable | | | 95,451 | |
Distribution fee payable | | | 3,546 | |
Trustees’ fees and expenses payable | | | 2,269 | |
Accrued expenses and other liabilities | | | 370,571 | |
| | | | |
Total liabilities | | | 9,706,951 | |
| | | | |
Total net assets | | $ | 1,008,845,367 | |
| | | | |
| |
NET ASSETS CONSIST OF | | | | |
Paid-in capital | | $ | 1,048,364,808 | |
Overdistributed net investment income | | | (597,033 | ) |
Accumulated net realized losses on investments | | | (32,175,896 | ) |
Net unrealized losses on investments | | | (6,746,512 | ) |
| | | | |
Total net assets | | $ | 1,008,845,367 | |
| | | | |
| |
COMPUTATION OF NET ASSET VALUE AND OFFERING PRICE PER SHARE | | | | |
Net assets – Class A | | $ | 243,908,529 | |
Shares outstanding – Class A1 | | | 28,814,437 | |
Net asset value per share – Class A | | | $8.46 | |
Maximum offering price per share – Class A2 | | | $8.63 | |
Net assets – Class C | | $ | 5,055,937 | |
Shares outstanding – Class C1 | | | 597,976 | |
Net asset value per share – Class C | | | $8.46 | |
Net assets – Administrator Class | | $ | 15,037,158 | |
Shares outstanding – Administrator Class1 | | | 1,784,154 | |
Net asset value per share – Administrator Class | | | $8.43 | |
Net assets – Institutional Class | | $ | 744,843,743 | |
Shares outstanding – Institutional Class1 | | | 88,033,931 | |
Net asset value per share – Institutional Class | | | $8.46 | |
| 1 | The Fund has an unlimited number of authorized shares. |
| 2 | Maximum offering price is computed as 100/98 of net asset value. On investments of $50,000 or more, the offering price is reduced. |
The accompanying notes are an integral part of these financial statements.
| | | | | | |
| Statement of operations—year ended August 31, 2018 | | Wells Fargo Ultra Short-Term Income Fund | | | 25 | |
| | | | |
| | | | |
| |
Investment income | | | | |
Interest | | $ | 25,292,524 | |
Income from affiliated securities | | | 672,816 | |
Dividends | | | 61,069 | |
| | | | |
Total investment income | | | 26,026,409 | |
| | | | |
| |
Expenses | | | | |
Management fee | | | 4,184,410 | |
Administration fees | |
Class A | | | 429,650 | |
Class C | | | 8,575 | |
Administrator Class | | | 25,792 | |
Institutional Class | | | 728,218 | |
Shareholder servicing fees | |
Class A | | | 671,328 | |
Class C | | | 13,399 | |
Administrator Class | | | 64,018 | |
Distribution fee | |
Class C | | | 40,198 | |
Custody and accounting fees | | | 89,485 | |
Professional fees | | | 72,965 | |
Registration fees | | | 272,009 | |
Shareholder report expenses | | | 82,616 | |
Trustees’ fees and expenses | | | 23,041 | |
Other fees and expenses | | | 37,500 | |
| | | | |
Total expenses | | | 6,743,204 | |
Less: Fee waivers and/or expense reimbursements | | | (1,457,962 | ) |
| | | | |
Net expenses | | | 5,285,242 | |
| | | | |
Net investment income | | | 20,741,167 | |
| | | | |
| |
REALIZED AND UNREALIZED GAINS (LOSSES) ON INVESTMENTS | | | | |
|
Net realized gains (losses) on: | |
Unaffiliated securities | | | (1,361,278 | ) |
Futures contracts | | | 6,606,498 | |
| | | | |
Net realized gains on investments | | | 5,245,220 | |
| | | | |
|
Net change in unrealized gains (losses) on: | |
Unaffiliated securities | | | (8,376,810 | ) |
Futures contracts | | | (257,002 | ) |
| | | | |
Net change in unrealized gains (losses) on investments | | | (8,633,812 | ) |
| | | | |
Net realized and unrealized gains (losses) on investments | | | (3,388,592 | ) |
| | | | |
Net increase in net assets resulting from operations | | $ | 17,352,575 | |
| | | | |
The accompanying notes are an integral part of these financial statements.
| | | | |
| 26 | | Wells Fargo Ultra Short-Term Income Fund | | Statement of changes in net assets |
| | | | | | | | | | | | | | | | |
| | | Year ended
August 31, 2018 | | | Year ended
August 31, 2017 | |
| |
Operations | | | | | |
Net investment income | | | | | | $ | 20,741,167 | | | | | | | $ | 20,208,850 | |
Net realized gains on investments | | | | | | | 5,245,220 | | | | | | | | 782,603 | |
Net change in unrealized gains (losses) on investments | | | | | | | (8,633,812 | ) | | | | | | | (2,659,824 | ) |
| | | | |
Net increase in net assets resulting from operations | | | | | | | 17,352,575 | | | | | | | | 18,331,629 | |
| | | | |
| | | |
Distributions to shareholders from | | | | | | | | | | | | |
Net investment income | |
Class A | | | | | | | (3,917,235 | ) | | | | | | | (3,275,149 | ) |
Class C | | | | | | | (37,856 | ) | | | | | | | (21,988 | ) |
Administrator Class | | | | | | | (394,368 | ) | | | | | | | (314,568 | ) |
Institutional Class | | | | | | | (16,292,768 | ) | | | | | | | (16,612,992 | ) |
| | | | |
Total distributions to shareholders | | | | | | | (20,642,227 | ) | | | | | | | (20,224,697 | ) |
| | | | |
| | | | |
Capital share transactions | | | Shares | | | | | | | | Shares | | | | | |
Proceeds from shares sold | |
Class A | | | 9,821,346 | | | | 83,149,259 | | | | 8,702,208 | | | | 73,793,334 | |
Class C | | | 132,182 | | | | 1,117,321 | | | | 156,489 | | | | 1,325,887 | |
Administrator Class | | | 5,167,624 | | | | 43,651,565 | | | | 1,447,554 | | | | 12,229,691 | |
Institutional Class | | | 96,798,778 | | | | 819,199,382 | | | | 131,295,470 | | | | 1,113,341,644 | |
| | | | |
| | | | | | | 947,117,527 | | | | | | | | 1,200,690,556 | |
| | | | |
Reinvestment of distributions | |
Class A | | | 449,252 | | | | 3,800,963 | | | | 372,917 | | | | 3,162,637 | |
Class C | | | 4,431 | | | | 37,441 | | | | 2,557 | | | | 21,662 | |
Administrator Class | | | 46,300 | | | | 390,336 | | | | 36,668 | | | | 309,753 | |
Institutional Class | | | 710,263 | | | | 6,007,655 | | | | 844,776 | | | | 7,162,350 | |
| | | | |
| | | | | | | 10,236,395 | | | | | | | | 10,656,402 | |
| | | | |
Payment for shares redeemed | |
Class A | | | (13,762,670 | ) | | | (116,485,682 | ) | | | (14,399,228 | ) | | | (122,123,201 | ) |
Class C | | | (218,323 | ) | | | (1,846,435 | ) | | | (359,267 | ) | | | (3,043,190 | ) |
Administrator Class | | | (6,654,246 | ) | | | (56,159,888 | ) | | | (1,414,056 | ) | | | (11,944,464 | ) |
Institutional Class | | | (134,706,249 | ) | | | (1,139,718,949 | ) | | | (147,978,477 | ) | | | (1,254,571,635 | ) |
| | | | |
| | | | | | | (1,314,210,954 | ) | | | | | | | (1,391,682,490 | ) |
| | | | |
Net decrease in net assets resulting from capital share transactions | | | | | | | (356,857,032 | ) | | | | | | | (180,335,532 | ) |
| | | | |
Total decrease in net assets | | | | | | | (360,146,684 | ) | | | | | | | (182,228,600 | ) |
| | | | |
| | |
Net assets | | | | | | | | |
Beginning of period | | | | | | | 1,368,992,051 | | | | | | | | 1,551,220,651 | |
| | | | |
End of period | | | | | | $ | 1,008,845,367 | | | | | | | $ | 1,368,992,051 | |
| | | | |
Overdistributed net investment income | | | | | | $ | (597,033 | ) | | | | | | $ | (695,973 | ) |
| | | | |
The accompanying notes are an integral part of these financial statements.
| | | | | | |
| Financial highlights | | Wells Fargo Ultra Short-Term Income Fund | | | 27 | |
(For a share outstanding throughout each period)
| | | | | | | | | | | | | | | | | | | | |
| | | Year ended August 31 | |
| CLASS A | | 2018 | | | 2017 | | | 2016 | | | 2015 | | | 2014 | |
Net asset value, beginning of period | | | $8.48 | | | | $8.49 | | | | $8.46 | | | | $8.53 | | | | $8.53 | |
Net investment income | | | 0.13 | | | | 0.09 | | | | 0.08 | | | | 0.05 | | | | 0.06 | |
Net realized and unrealized gains (losses) on investments | | | (0.02 | ) | | | (0.01 | ) | | | 0.03 | | | | (0.06 | ) | | | 0.00 | |
| | | | | | | | | | | | | | | | | | | | |
Total from investment operations | | | 0.11 | | | | 0.08 | | | | 0.11 | | | | (0.01 | ) | | | 0.06 | |
Distributions to shareholders from | | | | | | | | | | | | | | | | | | | | |
Net investment income | | | (0.13 | ) | | | (0.09 | ) | | | (0.08 | ) | | | (0.05 | ) | | | (0.06 | ) |
Tax basis return of capital | | | 0.00 | | | | 0.00 | | | | 0.00 | | | | (0.01 | ) | | | 0.00 | |
| | | | | | | | | | | | | | | | | | | | |
Total distributions to shareholders | | | (0.13 | ) | | | (0.09 | ) | | | (0.08 | ) | | | (0.06 | ) | | | (0.06 | ) |
Net asset value, end of period | | | $8.46 | | | | $8.48 | | | | $8.49 | | | | $8.46 | | | | $8.53 | |
Total return1 | | | 1.24 | % | | | 0.97 | % | | | 1.28 | % | | | (0.07 | )% | | | 0.74 | % |
Ratios to average net assets (annualized) | | | | | | | | | | | | | | | | | | | | |
Gross expenses | | | 0.80 | % | | | 0.79 | % | | | 0.79 | % | | | 0.77 | % | | | 0.78 | % |
Net expenses | | | 0.70 | % | | | 0.70 | % | | | 0.70 | % | | | 0.70 | % | | | 0.70 | % |
Net investment income | | | 1.47 | % | | | 1.09 | % | | | 0.93 | % | | | 0.64 | % | | | 0.70 | % |
Supplemental data | | | | | | | | | | | | | | | | | | | | |
Portfolio turnover rate | | | 55 | % | | | 56 | % | | | 51 | % | | | 70 | % | | | 47 | % |
Net assets, end of period (000s omitted) | | | $243,909 | | | | $274,079 | | | | $319,565 | | | | $151,561 | | | | $196,459 | |
| 1 | Total return calculations do not include any sales charges. |
The accompanying notes are an integral part of these financial statements.
| | | | |
| 28 | | Wells Fargo Ultra Short-Term Income Fund | | Financial highlights |
(For a share outstanding throughout each period)
| | | | | | | | | | | | | | | | | | | | |
| | | Year ended August 31 | |
| CLASS C | | 2018 | | | 2017 | | | 2016 | | | 2015 | | | 2014 | |
Net asset value, beginning of period | | | $8.47 | | | | $8.48 | | | | $8.45 | | | | $8.52 | | | | $8.52 | |
Net investment income (loss) | | | 0.06 | | | | 0.02 | | | | 0.01 | | | | (0.01 | ) | | | (0.01 | ) |
Net realized and unrealized gains (losses) on investments | | | (0.01 | ) | | | 0.00 | | | | 0.03 | | | | (0.06 | ) | | | 0.01 | |
| | | | | | | | | | | | | | | | | | | | |
Total from investment operations | | | 0.05 | | | | 0.02 | | | | 0.04 | | | | (0.07 | ) | | | 0.00 | |
Distributions to shareholders from | | | | | | | | | | | | | | | | | | | | |
Net investment income | | | (0.06 | ) | | | (0.03 | ) | | | (0.01 | ) | | | (0.00 | )1 | | | (0.00 | )1 |
Tax basis return of capital | | | 0.00 | | | | 0.00 | | | | 0.00 | | | | (0.00 | )1 | | | 0.00 | |
| | | | | | | | | | | | | | | | | | | | |
Total distributions to shareholders | | | (0.06 | ) | | | (0.03 | ) | | | (0.01 | ) | | | (0.00 | )1 | | | (0.00 | )1 |
Net asset value, end of period | | | $8.46 | | | | $8.47 | | | | $8.48 | | | | $8.45 | | | | $8.52 | |
Total return2 | | | 0.60 | % | | | 0.22 | % | | | 0.52 | % | | | (0.81 | )% | | | 0.05 | % |
Ratios to average net assets (annualized) | | | | | | | | | | | | | | | | | | | | |
Gross expenses | | | 1.55 | % | | | 1.54 | % | | | 1.54 | % | | | 1.52 | % | | | 1.53 | % |
Net expenses | | | 1.45 | % | | | 1.45 | % | | | 1.45 | % | | | 1.45 | % | | | 1.45 | % |
Net investment income (loss) | | | 0.72 | % | | | 0.34 | % | | | 0.17 | % | | | (0.10 | )% | | | (0.05 | )% |
Supplemental data | | | | | | | | | | | | | | | | | | | | |
Portfolio turnover rate | | | 55 | % | | | 56 | % | | | 51 | % | | | 70 | % | | | 47 | % |
Net assets, end of period (000s omitted) | | | $5,056 | | | | $5,760 | | | | $7,464 | | | | $7,642 | | | | $9,078 | |
| 1 | Amount is less than $0.005. |
| 2 | Total return calculations do not include any sales charges. |
The accompanying notes are an integral part of these financial statements.
| | | | | | |
| Financial highlights | | Wells Fargo Ultra Short-Term Income Fund | | | 29 | |
(For a share outstanding throughout each period)
| | | | | | | | | | | | | | | | | | | | |
| | | Year ended August 31 | |
| ADMINISTRATOR CLASS | | 2018 | | | 2017 | | | 2016 | | | 2015 | | | 2014 | |
Net asset value, beginning of period | | | $8.45 | | | | $8.46 | | | | $8.42 | | | | $8.50 | | | | $8.50 | |
Net investment income | | | 0.13 | | | | 0.10 | | | | 0.09 | | | | 0.07 | 1 | | | 0.07 | |
Net realized and unrealized gains (losses) on investments | | | (0.01 | ) | | | (0.01 | ) | | | 0.04 | | | | (0.07 | ) | | | 0.01 | |
| | | | | | | | | | | | | | | | | | | | |
Total from investment operations | | | 0.12 | | | | 0.09 | | | | 0.13 | | | | 0.00 | | | | 0.08 | |
Distributions to shareholders from | | | | | | | | | | | | | | | | | | | | |
Net investment income | | | (0.14 | ) | | | (0.10 | ) | | | (0.09 | ) | | | (0.07 | ) | | | (0.08 | ) |
Tax basis return of capital | | | 0.00 | | | | 0.00 | | | | 0.00 | | | | (0.01 | ) | | | 0.00 | |
| | | | | | | | | | | | | | | | | | | | |
Total distributions to shareholders | | | (0.14 | ) | | | (0.10 | ) | | | (0.09 | ) | | | (0.08 | ) | | | (0.08 | ) |
Net asset value, end of period | | | $8.43 | | | | $8.45 | | | | $8.46 | | | | $8.42 | | | | $8.50 | |
Total return | | | 1.39 | % | | | 1.12 | % | | | 1.55 | % | | | (0.04 | )% | | | 0.89 | % |
Ratios to average net assets (annualized) | | | | | | | | | | | | | | | | | | | | |
Gross expenses | | | 0.74 | % | | | 0.73 | % | | | 0.73 | % | | | 0.71 | % | | | 0.72 | % |
Net expenses | | | 0.55 | % | | | 0.55 | % | | | 0.55 | % | | | 0.55 | % | | | 0.55 | % |
Net investment income | | | 1.54 | % | | | 1.24 | % | | | 1.05 | % | | | 0.81 | % | | | 0.84 | % |
Supplemental data | | | | | | | | | | | | | | | | | | | | |
Portfolio turnover rate | | | 55 | % | | | 56 | % | | | 51 | % | | | 70 | % | | | 47 | % |
Net assets, end of period (000s omitted) | | | $15,037 | | | | $27,245 | | | | $26,679 | | | | $44,682 | | | | $119,884 | |
| 1 | Calculated based upon average shares outstanding |
The accompanying notes are an integral part of these financial statements.
| | | | |
| 30 | | Wells Fargo Ultra Short-Term Income Fund | | Financial highlights |
(For a share outstanding throughout each period)
| | | | | | | | | | | | | | | | | | | | |
| | | Year ended August 31 | |
| INSTITUTIONAL CLASS | | 2018 | | | 2017 | | | 2016 | | | 2015 | | | 2014 | |
Net asset value, beginning of period | | | $8.48 | | | | $8.49 | | | | $8.45 | | | | $8.53 | | | | $8.52 | |
Net investment income | | | 0.15 | | | | 0.12 | | | | 0.11 | | | | 0.08 | | | | 0.09 | |
Net realized and unrealized gains (losses) on investments | | | (0.02 | ) | | | (0.01 | ) | | | 0.04 | | | | (0.07 | ) | | | 0.01 | |
| | | | | | | | | | | | | | | | | | | | |
Total from investment operations | | | 0.13 | | | | 0.11 | | | | 0.15 | | | | 0.01 | | | | 0.10 | |
Distributions to shareholders from | | | | | | | | | | | | | | | | | | | | |
Net investment income | | | (0.15 | ) | | | (0.12 | ) | | | (0.11 | ) | | | (0.08 | ) | | | (0.09 | ) |
Tax basis return of capital | | | 0.00 | | | | 0.00 | | | | 0.00 | | | | (0.01 | ) | | | 0.00 | |
| | | | | | | | | | | | | | | | | | | | |
Total distributions to shareholders | | | (0.15 | ) | | | (0.12 | ) | | | (0.11 | ) | | | (0.09 | ) | | | (0.09 | ) |
Net asset value, end of period | | | $8.46 | | | | $8.48 | | | | $8.49 | | | | $8.45 | | | | $8.53 | |
Total return | | | 1.59 | % | | | 1.33 | % | | | 1.75 | % | | | 0.16 | % | | | 1.21 | % |
Ratios to average net assets (annualized) | | | | | | | | | | | | | | | | | | | | |
Gross expenses | | | 0.47 | % | | | 0.46 | % | | | 0.46 | % | | | 0.44 | % | | | 0.45 | % |
Net expenses | | | 0.35 | % | | | 0.35 | % | | | 0.35 | % | | | 0.35 | % | | | 0.35 | % |
Net investment income | | | 1.80 | % | | | 1.43 | % | | | 1.27 | % | | | 0.99 | % | | | 1.05 | % |
Supplemental data | | | | | | | | | | | | | | | | | | | | |
Portfolio turnover rate | | | 55 | % | | | 56 | % | | | 51 | % | | | 70 | % | | | 47 | % |
Net assets, end of period (000s omitted) | | | $744,844 | | | | $1,061,908 | | | | $1,197,514 | | | | $1,137,808 | | | | $1,418,101 | |
The accompanying notes are an integral part of these financial statements.
| | | | | | |
| Notes to financial statements | | Wells Fargo Ultra Short-Term Income Fund | | | 31 | |
1. ORGANIZATION
Wells Fargo Funds Trust (the “Trust”), a Delaware statutory trust organized on March 10, 1999, is an open-end management investment company registered under the Investment Company Act of 1940, as amended (the “1940 Act”). As an investment company, the Trust follows the accounting and reporting guidance in Financial Accounting Standards Board (“FASB”) Accounting Standards Codification Topic 946, Financial Services – Investment Companies. These financial statements report on the Wells Fargo Ultra Short-Term Income Fund (the “Fund”) which is a diversified series of the Trust.
2. SIGNIFICANT ACCOUNTING POLICIES
The following significant accounting policies, which are consistently followed in the preparation of the financial statements of the Fund, are in conformity with U.S. generally accepted accounting principles which require management to make estimates and assumptions that affect the reported amounts of assets and liabilities, disclosure of contingent assets and liabilities at the date of the financial statements, and the reported amounts of revenues and expenses during the reporting period. Actual results could differ from those estimates.
Securities valuation
All investments are valued each business day as of the close of regular trading on the New York Stock Exchange (generally 4 p.m. Eastern Time), although the Fund may deviate from this calculation time under unusual or unexpected circumstances.
Debt securities are valued at the evaluated bid price provided by an independent pricing service or, if a reliable price is not available, the quoted bid price from an independent broker-dealer.
Equity securities and futures contracts that are listed on a foreign or domestic exchange or market are valued at the official closing price or, if none, the last sales price. If no sale occurs on the principal exchange or market that day, a fair value price will be determined in accordance with the Fund’s Valuation Procedures.
Investments in registered open-end investment companies are valued at net asset value. Interests in non-registered investment companies that are redeemable at net asset value are fair valued normally at net asset value.
Investments which are not valued using any of the methods discussed above are valued at their fair value, as determined in good faith by the Board of Trustees of the Fund. The Board of Trustees has established a Valuation Committee comprised of the Trustees and has delegated to it the authority to take any actions regarding the valuation of portfolio securities that the Valuation Committee deems necessary or appropriate, including determining the fair value of portfolio securities, unless the determination has been delegated to the Wells Fargo Asset Management Pricing Committee at Wells Fargo Funds Management, LLC (“Funds Management”). The Board of Trustees retains the authority to make or ratify any valuation decisions or approve any changes to the Valuation Procedures as it deems appropriate. On a quarterly basis, the Board of Trustees receives reports on any valuation actions taken by the Valuation Committee or the Wells Fargo Asset Management Pricing Committee which may include items for ratification.
Valuations of fair valued securities are compared to the next actual sales price when available, or other appropriate market values, to assess the continued appropriateness of the fair valuation methodologies used. These securities are fair valued on a day-to-day basis, taking into consideration changes to appropriate market information and any significant changes to the inputs considered in the valuation process until there is a readily available price provided on an exchange or by an independent pricing service. Valuations received from an independent pricing service or independent broker-dealer quotes are periodically validated by comparisons to most recent trades and valuations provided by other independent pricing services in addition to the review of prices by the manager and/or subadviser. Unobservable inputs used in determining fair valuations are identified based on the type of security, taking into consideration factors utilized by market participants in valuing the investment, knowledge about the issuer and the current market environment.
Securities lending
The Fund may lend its securities from time to time in order to earn additional income in the form of fees or interest on securities received as collateral or the investment of any cash received as collateral. The Fund continues to receive interest or dividends on the securities loaned. The Fund receives collateral in the form of cash or securities with a value at least equal to the value of the securities on loan. The value of the loaned securities is determined at the close of each business day and any additional required collateral is delivered to the Fund on the next business day. In a securities lending transaction, the net asset value of the Fund will be affected by an increase or decrease in the value of the securities loaned and by an increase or decrease in the value of the instrument in which collateral is invested. The amount of securities lending activity undertaken by the Fund fluctuates from time to time. In the event of default or bankruptcy by the borrower, the Fund may be prevented from recovering the loaned securities or gaining access to the collateral or
| | | | |
| 32 | | Wells Fargo Ultra Short-Term Income Fund | | Notes to financial statements |
may experience delays or costs in doing so. In addition, the investment of any cash collateral received may lose all or part of its value. The Fund has the right under the lending agreement to recover the securities from the borrower on demand.
The Fund lends its securities through an unaffiliated securities lending agent. Cash collateral received in connection with its securities lending transactions is invested in Securities Lending Cash Investments, LLC (the “Securities Lending Fund”). The Securities Lending Fund is exempt from registration under Section 3(c)(7) of the 1940 Act and is managed by Funds Management and is subadvised by Wells Capital Management Incorporated (“WellsCap”), an affiliate of Funds Management and an indirect wholly owned subsidiary of Wells Fargo & Company (“Wells Fargo”). Funds Management receives an advisory fee starting at 0.05% and declining to 0.01% as the average daily net assets of the Securities Lending Fund increase. All of the fees received by Funds Management are paid to WellsCap for its services as subadviser. The Securities Lending Fund seeks to provide a positive return compared to the daily Fed Funds Open Rate by investing in high-quality, U.S. dollar-denominated short-term money market instruments. Securities Lending Fund investments are valued at the evaluated bid price provided by an independent pricing service. Income earned from investment in the Securities Lending Fund, if any, is included in income from affiliated securities on the Statement of Operations.
When-issued transactions
The Fund may purchase securities on a forward commitment or when-issued basis. The Fund records a when-issued transaction on the trade date and will segregate assets in an amount at least equal in value to the Fund’s commitment to purchase when-issued securities. Securities purchased on a when-issued basis are marked-to-market daily and the Fund begins earning interest on the settlement date. Losses may arise due to changes in the market value of the underlying securities or if the counterparty does not perform under the contract.
Futures contracts
The Fund is subject to interest rate risk in the normal course of pursuing its investment objectives. Futures contracts are agreements between the Fund and a counterparty to buy or sell a specific amount of a commodity, financial instrument or currency at specified price and on a specified date. The Fund may buy and sell futures contracts in order to gain exposure to, or protect against, changes in interest rates. The primary risks associated with the use of futures contracts are the imperfect correlation between changes in market values of securities held by the Fund and the prices of futures contracts, and the possibility of an illiquid market. Futures contracts are generally entered into on a regulated futures exchange and cleared through a clearinghouse associated with the exchange. With futures contracts, there is minimal counterparty risk to the Fund since futures contracts are exchange traded and the exchange’s clearinghouse, as counterparty to all exchange traded futures, guarantees the futures contracts against default.
Upon entering into a futures contracts, the Fund is required to deposit either cash or securities (initial margin) with the broker in an amount equal to a certain percentage of the contract value. Subsequent payments (variation margin) are paid to or from the broker each day equal to the daily changes in the contract value. Such payments are recorded as unrealized gains or losses and, if any, shown as variation margin receivable (payable) in the Statement of Assets and Liabilities. Should the Fund fail to make requested variation margin payments, the broker can gain access to the initial margin to satisfy the Fund’s payment obligations. When the contracts are closed, a realized gain or loss is recorded in the Statement of Operations.
Security transactions and income recognition
Securities transactions are recorded on a trade date basis. Realized gains or losses are recorded on the basis of identified cost.
Interest income is accrued daily and bond discounts are accreted and premiums are amortized daily. To the extent debt obligations are placed on non-accrual status, any related interest income may be reduced by writing off interest receivables when the collection of all or a portion of interest has been determined to be doubtful based on consistently applied procedures and the fair value has decreased. If the issuer subsequently resumes interest payments or when the collectability of interest is reasonably assured, the debt obligation is removed from non-accrual status.
Income dividends and capital gain distributions from investment companies are recorded on the ex-dividend date. Capital gain distributions from investment companies are treated as realized gains.
Distributions to shareholders
Distributions to shareholders from net investment income are declared daily and paid monthly. Distributions from net realized gains, if any, are recorded on the ex-dividend date and paid at least annually. Such distributions are determined in accordance with income tax regulations and may differ from U.S. generally accepted accounting principles. Dividend sources are estimated at the time of declaration. The tax character of distributions is determined as of the Fund’s fiscal year end. Therefore, a portion of the Fund’s distributions made prior to the Fund’s fiscal year end may be categorized as a tax return of capital at year end.
| | | | | | |
| Notes to financial statements | | Wells Fargo Ultra Short-Term Income Fund | | | 33 | |
Federal and other taxes
The Fund intends to continue to qualify as a regulated investment company by distributing substantially all of its investment company taxable income and any net realized capital gains (after reduction for capital loss carryforwards) sufficient to relieve it from all, or substantially all, federal income taxes. Accordingly, no provision for federal income taxes was required.
The Fund’s income and federal excise tax returns and all financial records supporting those returns for the prior three fiscal years are subject to examination by the federal and Delaware revenue authorities. Management has analyzed the Fund’s tax positions taken on federal, state, and foreign tax returns for all open tax years and does not believe that there are any uncertain tax positions that require recognition of a tax liability.
As of August 31, 2018, the aggregate cost of all investments for federal income tax purposes was $1,015,016,707 and the unrealized gains (losses) consisted of:
| | | | |
Gross unrealized gains | | $ | 1,190,540 | |
Gross unrealized losses | | | (7,776,754 | ) |
Net unrealized losses | | $ | (6,586,214 | ) |
Reclassifications are made to the Fund’s capital accounts for permanent tax differences to reflect income and gains available for distribution (or available capital loss carryforwards) under federal income tax regulations. U.S. generally accepted accounting principles require that certain components of net assets be adjusted to reflect permanent differences between financial and tax reporting. These reclassifications have no effect on net assets or net asset values per share. The primary permanent difference causing such reclassifications is due to expiration of capital loss carryforwards. At August 31, 2018, as a result of permanent book-to-tax differences, the following reclassification adjustments were made on the Statement of Assets and Liabilities:
| | |
| Paid-in capital | | Accumulated net
realized losses
on investments |
| $(7,738,751) | | $7,738,751 |
Capital loss carryforwards that do not expire are required to be utilized prior to capital loss carryforwards that expire. As of August 31, 2018, capital loss carryforwards available to offset future net realized capital gains were as follows through the indicated expiration dates:
| | | | |
| | | No expiration |
| 2019 | | Short-term | | Long-term |
| $7,448,920 | | $1,631,759 | | $23,255,515 |
Class allocations
The separate classes of shares offered by the Fund differ principally in applicable sales charges, distribution, shareholder servicing, and administration fees. Class specific expenses are charged directly to that share class. Investment income, common expenses, and realized and unrealized gains (losses) on investments are allocated daily to each class of shares based on the relative proportion of net assets of each class.
3. FAIR VALUATION MEASUREMENTS
Fair value measurements of investments are determined within a framework that has established a fair value hierarchy based upon the various data inputs utilized in determining the value of the Fund’s investments. The three-level hierarchy gives the highest priority to unadjusted quoted prices in active markets for identical assets or liabilities (Level 1) and the lowest priority to unobservable inputs (Level 3). The Fund’s investments are classified within the fair value hierarchy based on the lowest level of input that is significant to the fair value measurement. The inputs are summarized into three broad levels as follows:
| ∎ | | Level 1 – quoted prices in active markets for identical securities |
| ∎ | | Level 2 – other significant observable inputs (including quoted prices for similar securities, interest rates, prepayment speeds, credit risk, etc.) |
| ∎ | | Level 3 – significant unobservable inputs (including the Fund’s own assumptions in determining the fair value of investments) |
| | | | |
| 34 | | Wells Fargo Ultra Short-Term Income Fund | | Notes to financial statements |
The inputs or methodologies used for valuing investments in securities are not necessarily an indication of the risk associated with investing in those securities.
The following is a summary of the inputs used in valuing the Fund’s assets and liabilities as of August 31, 2018:
| | | | | | | | | | | | | | | | |
| | | Quoted prices
(Level 1) | | | Other significant
observable inputs
(Level 2) | | | Significant
unobservable inputs (Level 3) | | | Total | |
Assets | | | | | | | | | | | | | | | | |
Investments in: | | | | | | | | | | | | | | | | |
| | | | |
Agency securities | | $ | 0 | | | $ | 112,523,722 | | | $ | 0 | | | $ | 112,523,722 | |
| | | | |
Asset-backed securities | | | 0 | | | | 98,659,538 | | | | 2,594,532 | | | | 101,254,070 | |
| | | | |
Corporate bonds and notes | | | 0 | | | | 339,545,716 | | | | 0 | | | | 339,545,716 | |
| | | | |
Exchange-traded funds | | | 30,260,000 | | | | 0 | | | | 0 | | | | 30,260,000 | |
| | | | |
Municipal obligations | | | 0 | | | | 28,043,198 | | | | 0 | | | | 28,043,198 | |
| | | | |
Non-agency mortgage-backed securities | | | 0 | | | | 160,687,624 | | | | 0 | | | | 160,687,624 | |
| | | | |
Yankee corporate bonds and notes | | | 0 | | | | 172,814,647 | | | | 0 | | | | 172,814,647 | |
| | | | |
Short-term investments | | | | | | | | | | | | | | | | |
Commercial paper | | | 0 | | | | 21,296,146 | | | | 0 | | | | 21,296,146 | |
Investment companies | | | 33,367,503 | | | | 0 | | | | 0 | | | | 33,367,503 | |
U.S. Treasury securities | | | 1,949,070 | | | | 0 | | | | 0 | | | | 1,949,070 | |
Investments measured at net asset value* | | | | | | | | | | | | | | | 6,849,095 | |
Total assets | | $ | 65,576,573 | | | $ | 933,570,591 | | | $ | 2,594,532 | | | $ | 1,008,590,791 | |
Liabilities | | | | | | | | | | | | | | | | |
Futures contracts | | $ | 160,298 | | | $ | 0 | | | $ | 0 | | | $ | 160,298 | |
Total liabilities | | $ | 160,298 | | | $ | 0 | | | $ | 0 | | | $ | 160,298 | |
| * | Investments that are measured at fair value using the net asset value per share (or its equivalent) as a practical expedient have not been categorized in the fair value hierarchy. The fair value amount presented in the table is intended to permit reconciliation of the fair value hierarchy to the amounts presented in the Statement of Assets and Liabilities. The Fund’s investment in Securities Lending Cash Investments, LLC valued at $6,849,095 does not have a redemption period notice, can be redeemed daily and does not have any unfunded commitments. |
Additional sector, industry or geographic detail is included in the Portfolio of Investments.
Futures contracts are reported at their cumulative unrealized gains (losses) at measurement date as reported in the table following the Portfolio of Investments. For futures contracts, the current day’s variation margin is reported on the Statement of Assets and Liabilities. All other assets and liabilities are reported at their market value at measurement date.
The Fund recognizes transfers between levels within the fair value hierarchy at the end of the reporting period. At August 31, 2018, the Fund did not have any transfers into/out of Level 1, Level 2, or Level 3.
4. TRANSACTIONS WITH AFFILIATES
Management fee
Funds Management, an indirect wholly owned subsidiary of Wells Fargo, is the manager of the Fund and provides advisory and fund-level administrative services under an investment management agreement. Under the investment management agreement, Funds Management is responsible for, among other services, implementing the investment objectives and strategies of the Fund, supervising the subadviser and providing fund-level administrative services in connection with the Fund’s operations. As compensation for its services under the investment management agreement, Funds Management is entitled to receive an annual management fee starting at 0.35% and declining to 0.255% as the average daily net assets of the Fund increase. For the year ended August 31, 2018, the management fee was equivalent to an annual rate of 0.35% of the Fund’s average daily net assets.
Funds Management has retained the services of a subadviser to provide daily portfolio management to the Fund. The fee for subadvisory services is borne by Funds Management. WellsCap is the subadviser to the Fund and is entitled to receive a fee from Funds Management at an annual rate starting at 0.15% and declining to 0.05% as the average daily net assets of the Fund increase.
| | | | | | |
| Notes to financial statements | | Wells Fargo Ultra Short-Term Income Fund | | | 35 | |
Administration fees
Under a class-level administration agreement, Funds Management provides class-level administrative services to the Fund, which includes paying fees and expenses for services provided by the transfer agent, sub-transfer agents, omnibus account servicers and record-keepers. As compensation for its services under the class-level administration agreement, Funds Management receives an annual fee which is calculated based on the average daily net assets of each class as follows:
| | | | |
| | | Class-level
administration fee | |
Class A, Class C | | | 0.16 | % |
Administrator Class | | | 0.10 | |
Institutional Class | | | 0.08 | |
Funds Management has contractually waived and/or reimbursed management and administration fees to the extent necessary to maintain certain net operating expense ratios for the Fund. When each class of the Fund has exceeded its expense cap, Funds Management has waived fees and/or reimbursed expenses from fund level expenses on a proportionate basis and then from class specific expenses; otherwise, waivers and/or reimbursements are applied against class specific expenses before fund level expenses. Funds Management has committed through December 31, 2018 to waive fees and/or reimburse expenses to the extent necessary to cap the Fund’s expenses at 0.70% for Class A shares, 1.45% for Class C shares, 0.55% for Administrator Class shares, and 0.35% for Institutional Class shares. After this time, the cap may be increased or the commitment to maintain the cap may be terminated only with the approval of the Board of Trustees.
Distribution fee
The Trust has adopted a distribution plan for Class C shares of the Fund pursuant to Rule 12b-1 under the 1940 Act. A distribution fee is charged to Class C shares and paid to Wells Fargo Funds Distributor, LLC (“Funds Distributor”), the principal underwriter, at an annual rate of 0.75% of the average daily net assets of Class C shares.
In addition, Funds Distributor is entitled to receive the front-end sales charge from the purchase of Class A shares and a contingent deferred sales charge on the redemption of certain Class A shares. Funds Distributor is also entitled to receive the contingent deferred sales charges from redemptions of Class C shares. For the year ended August 31, 2018, Funds Distributor received $1,181 from the sale of Class A shares. No contingent deferred sales charges were incurred by Class A and Class C shares for the year ended August 31, 2018.
Shareholder servicing fees
The Trust has entered into contracts with one or more shareholder servicing agents, whereby Class A, Class C, and Administrator Class of the Fund are charged a fee at an annual rate of 0.25% of the average daily net assets of each respective class.
A portion of these total shareholder servicing fees were paid to affiliates of Wells Fargo.
Interfund transactions
The Fund may purchase or sell portfolio investment securities to certain other Wells Fargo affiliates pursuant to Rule 17a-7 under the 1940 Act and under procedures adopted by the Board of Trustees. The procedures have been designed to ensure that these interfund transactions, which do not incur broker commissions, are effected at current market prices.
5. INVESTMENT PORTFOLIO TRANSACTIONS
Purchases and sales of investments, excluding short-term securities, for the year ended August 31, 2018 were as follows:
| | | | | | |
Purchases at cost | | Sales proceeds |
U.S.
government | | Non-U.S.
government | | U.S.
government | | Non-U.S.
government |
| $33,033,659 | | $590,567,102 | | $9,754,933 | | $667,123,584 |
6. DERIVATIVE TRANSACTIONS
During the year ended August 31, 2018, the Fund entered into futures contracts to speculate on interest rates and to help manage the duration. The Fund had an average notional amount of $363,440,344 in short futures contracts during the year ended August 31, 2018.
| | | | |
| 36 | | Wells Fargo Ultra Short-Term Income Fund | | Notes to financial statements |
7. BANK BORROWINGS
The Trust (excluding the money market funds), Wells Fargo Master Trust and Wells Fargo Variable Trust are parties to a $280,000,000 revolving credit agreement whereby the Fund is permitted to use bank borrowings for temporary or emergency purposes, such as to fund shareholder redemption requests. Interest under the credit agreement is charged to the Fund based on a borrowing rate equal to the higher of the Federal Funds rate in effect on that day plus 1.25% or the overnight LIBOR rate in effect on that day plus 1.25%. In addition, an annual commitment fee equal to 0.25% of the unused balance is allocated to each participating fund.
For the year ended August 31, 2018, there were no borrowings by the Fund under the agreement.
8. DISTRIBUTIONS TO SHAREHOLDERS
The tax character of distributions paid was $20,642,227 and $20,224,697 of ordinary income for the years ended August 31, 2018 and August 31, 2017, respectively.
As of August 31, 2018, the components of distributable earnings on a tax basis were as follows:
| | | | |
Undistributed
ordinary
income | | Unrealized
gains
(losses) | | Capital loss
carryforward |
| $231,694 | | $(6,586,214) | | $(32,336,194) |
9. INDEMNIFICATION
Under the Trust’s organizational documents, the officers and Trustees have been granted certain indemnification rights against certain liabilities that may arise out of performance of their duties to the Trust. Additionally, in the normal course of business, the Trust may enter into contracts with service providers that contain a variety of indemnification clauses. The Trust’s maximum exposure under these arrangements is dependent on future claims that may be made against the Fund and, therefore, cannot be estimated.
10. NEW ACCOUNTING PRONOUNCEMENTS AND REGULATORY CHANGES
On August 17, 2018, the Securities and Exchange Commission (“SEC”) adopted Disclosure Update and Simplification, which amends certain disclosure requirements. The amendments are effective for filings subsequent to November 5, 2018. Management expects these amendments will impact the classification of disclosures in the financial statements.
In August 2018, FASB issued Accounting Standards Update (“ASU”) No. 2018-13, Fair Value Measurement (Topic 820) Disclosure Framework—Changes to the Disclosure Requirements for Fair Value Measurement. ASU 2018-13 updates the disclosure requirements for fair value measurements by modifying or removing certain disclosures and adding certain new disclosures. The amendments are effective for fiscal years, and interim periods within those fiscal years, beginning after December 15, 2019. Early adoption is permitted. Management is currently evaluating the potential impact of this new guidance to the financial statements.
In March 2017, FASB issued ASU No. 2017-08, Premium Amortization on Purchased Callable Debt Securities. ASU 2017-08 shortens the amortization period for certain callable debt securities held at a premium. The amendments require the premium to be mortized to the earliest call date. The amendments do not require an accounting change or securities held at a discount; the discount continues to be amortized to maturity. ASU 2017-08 is effective for fiscal years beginning after December 15, 2018 and for interim periods within those fiscal years . Management is currently evaluating the potential impact of this new guidance to the financial statements.
| | | | | | |
| Report of independent registered public accounting firm | | Wells Fargo Ultra Short-Term Income Fund | | | 37 | |
BOARD OF TRUSTEES AND SHAREHOLDERS OF WELLS FARGO FUNDS TRUST:
Opinion on the Financial Statements
We have audited the accompanying statement of assets and liabilities of Wells Fargo Ultra Short-Term Income Fund (the “Fund”), including the portfolio of investments, as of August 31, 2018, the related statement of operations for the year then ended, the statements of changes in net assets for each of the years in the two-year period then ended, and the related notes (collectively, the “financial statements”) and the financial highlights for each of the years in the five-year period then ended. In our opinion, the financial statements and financial highlights present fairly, in all material respects, the financial position of the Fund as of August 31, 2018, the results of its operations for the year then ended, the changes in its net assets for each of the years in the two-year period then ended, and the financial highlights for each of the years in the five-year period then ended, in conformity with U.S. generally accepted accounting principles.
Basis for Opinion
These financial statements and financial highlights are the responsibility of the Fund’s management. Our responsibility is to express an opinion on these financial statements and financial highlights based on our audits. We are a public accounting firm registered with the Public Company Accounting Oversight Board (United States) (“PCAOB”) and are required to be independent with respect to the Fund in accordance with the U.S. federal securities laws and the applicable rules and regulations of the Securities and Exchange Commission and the PCAOB.
We conducted our audits in accordance with the standards of the PCAOB. Those standards require that we plan and perform the audit to obtain reasonable assurance about whether the financial statements and financial highlights are free of material misstatement, whether due to error or fraud. Our audits included performing procedures to assess the risks of material misstatement of the financial statements and financial highlights, whether due to error or fraud, and performing procedures that respond to those risks. Such procedures included examining, on a test basis, evidence regarding the amounts and disclosures in the financial statements and financial highlights. Such procedures also included confirmation of securities owned as of August 31, 2018, by correspondence with the custodian and brokers, or by other appropriate auditing procedures. Our audits also included evaluating the accounting principles used and significant estimates made by management, as well as evaluating the overall presentation of the financial statements and financial highlights. We believe that our audits provide a reasonable basis for our opinion.

We have not been able to determine the specific year that we began serving as the auditor of one or more Wells Fargo Funds investment companies, however we are aware that we have served as the auditor of one or more Wells Fargo Funds investment companies since at least 1955.
Boston, Massachusetts
October 26, 2018
| | | | |
| 38 | | Wells Fargo Ultra Short-Term Income Fund | | Other information (unaudited) |
TAX INFORMATION
For the fiscal year ended August 31, 2018, $15,573,235 has been designated as interest-related dividends for nonresident alien shareholders pursuant to Section 871 of the Internal Revenue Code.
PROXY VOTING INFORMATION
A description of the policies and procedures that the Fund uses to determine how to vote proxies relating to portfolio securities is available, upon request, by calling 1-800-222-8222, visiting our website at wellsfargofunds.com, or visiting the SEC website at sec.gov. Information regarding how the Fund voted proxies relating to portfolio securities during the most recent 12-month period ended June 30 is available on the Fund’s website at wellsfargofunds.com or by visiting the SEC website at sec.gov.
PORTFOLIO HOLDINGS INFORMATION
The complete portfolio holdings for the Fund are publicly available monthly on the Fund’s website (wellsfargofunds.com), on a one-month delayed basis. In addition, top ten holdings information (excluding derivative positions) for the Fund is publicly available on the Fund’s website on a monthly, seven-day or more delayed basis. The Fund files its complete schedule of portfolio holdings with the SEC for the first and third quarters of each fiscal year on Form N-Q, which is available by visiting the SEC website at sec.gov. In addition, the Fund’s Form N-Q may be reviewed and copied at the SEC’s Public Reference Room in Washington, DC, and at regional offices in New York City, at 233 Broadway, and in Chicago, at 175 West Jackson Boulevard, Suite 900. Information about the Public Reference Room may be obtained by calling 1-800-SEC-0330.
| | | | | | |
| Other information (unaudited) | | Wells Fargo Ultra Short-Term Income Fund | | | 39 | |
BOARD OF TRUSTEES AND OFFICERS
Each of the Trustees and Officers1 listed in the table below acts in identical capacities for each fund in the Wells Fargo family of funds, which consists of 154 mutual funds comprising the Wells Fargo Funds Trust, Wells Fargo Variable Trust, Wells Fargo Master Trust and four closed-end funds (collectively the “Fund Complex”). This table should be read in conjunction with the Prospectus and the Statement of Additional Information2. The mailing address of each Trustee and Officer is 525 Market Street, 12th Floor, San Francisco, CA 94105. Each Trustee and Officer serves an indefinite term, however, each Trustee serves such term until reaching the mandatory retirement age established by the Trustees.
Independent Trustees
| | | | | | |
Name and
year of birth | | Position held and
length of service* | | Principal occupations during past five years or longer | | Current other
public company or
investment company
directorships |
William R. Ebsworth (Born 1957) | | Trustee, since 2015 | | Retired. From 1984 to 2013, equities analyst, portfolio manager, research director and chief investment officer at Fidelity Management and Research Company in Boston, Tokyo, and Hong Kong, and retired in 2013 as Chief Investment Officer of Fidelity Strategic Advisers, Inc. where he led a team of investment professionals managing client assets. Prior thereto, Board member of Hong Kong Securities Clearing Co., Hong Kong Options Clearing Corp., the Thailand International Fund, Ltd., Fidelity Investments Life Insurance Company, and Empire Fidelity Investments Life Insurance Company. Board member of the Vincent Memorial Hospital Endowment (non-profit organization), where he serves on the Investment Committee and as a Chair of the Audit Committee. Mr. Ebsworth is a CFA® charterholder. | | N/A |
Jane A. Freeman (Born 1953) | | Trustee, since 2015; Chair Liaison, since 2018 | | Retired. From 2012 to 2014 and 1999 to 2008, Chief Financial Officer of Scientific Learning Corporation. From 2008 to 2012, Ms. Freeman provided consulting services related to strategic business projects. Prior to 1999, Portfolio Manager at Rockefeller & Co. and Scudder, Stevens & Clark. Board member of the Harding Loevner Funds from 1996 to 2014, serving as both Lead Independent Director and chair of the Audit Committee. Board member of the Russell Exchange Traded Funds Trust from 2011 to 2012 and the chair of the Audit Committee. Ms. Freeman is a Board Member of The Ruth Bancroft Garden (non-profit organization). She is also an inactive Chartered Financial Analyst. | | N/A |
Isaiah Harris, Jr. (Born 1952) | | Trustee, since 2009 | | Retired. Chairman of the Board of CIGNA Corporation since 2009, and Director since 2005. From 2003 to 2011, Director of Deluxe Corporation. Prior thereto, President and CEO of BellSouth Advertising and Publishing Corp. from 2005 to 2007, President and CEO of BellSouth Enterprises from 2004 to 2005 and President of BellSouth Consumer Services from 2000 to 2003. Emeritus member of the Iowa State University Foundation Board of Governors. Emeritus Member of the Advisory Board of Iowa State University School of Business. Advisory Board Member, Palm Harbor Academy (private school). Advisory Board Member, Child Evangelism Fellowship (non-profit). Mr. Harris is a certified public accountant (inactive status). | | CIGNA Corporation |
Judith M. Johnson (Born 1949) | | Trustee, since 2008; Audit Committee Chairman, since 2009 | | Retired. Prior thereto, Chief Executive Officer and Chief Investment Officer of Minneapolis Employees Retirement Fund from 1996 to 2008. Ms. Johnson is an attorney, certified public accountant and a certified managerial accountant. | | N/A |
David F. Larcker (Born 1950) | | Trustee, since 2009 | | James Irvin Miller Professor of Accounting at the Graduate School of Business, Stanford University, Director of the Corporate Governance Research Initiative and Senior Faculty of The Rock Center for Corporate Governance since 2006. From 2005 to 2008, Professor of Accounting at the Graduate School of Business, Stanford University. Prior thereto, Ernst & Young Professor of Accounting at The Wharton School, University of Pennsylvania from 1985 to 2005. | | N/A |
| | | | |
| 40 | | Wells Fargo Ultra Short-Term Income Fund | | Other information (unaudited) |
| | | | | | |
Name and
year of birth | | Position held and
length of service* | | Principal occupations during past five years or longer | | Current other
public company or
investment company
directorships |
Olivia S. Mitchell (Born 1953) | | Trustee, since 2006; Governance Committee Chairman, since 2018 | | International Foundation of Employee Benefit Plans Professor, Wharton School of the University of Pennsylvania since 1993. Director of Wharton’s Pension Research Council and Boettner Center on Pensions & Retirement Research, and Research Associate at the National Bureau of Economic Research. Previously, Cornell University Professor from 1978 to 1993. | | N/A |
Timothy J. Penny (Born 1951) | | Trustee, since 1996; Chairman, since 2018; Vice Chairman, from 2017 to 2018 | | President and Chief Executive Officer of Southern Minnesota Initiative Foundation, a non-profit organization, since 2007. Member of the Board of Trustees of NorthStar Education Finance, Inc., a non-profit organization, since 2007. | | N/A |
James G. Polisson (Born 1959) | | Trustee, since 2018; Advisory Board Member, from 2017 to 2018 | | Retired. Chief Marketing Officer, Source (ETF) UK Services, Ltd, from 2015 to 2017. From 2012 to 2015, Principal of The Polisson Group, LLC, a management consulting, corporate advisory and principal investing company. Chief Executive Officer and Managing Director at Russell Investments, Global Exchange Traded Funds from 2010 to 2012. Managing Director of Barclays Global Investors from 1998 to 2010 and Global Chief Marketing Officer for iShares and Barclays Global Investors from 2000 to 2010. Trustee of the San Francisco Mechanics’ Institute, a non-profit organization, from 2013 to 2015. Board member of the Russell Exchange Traded Fund Trust from 2011 to 2012. Director of Barclays Global Investors Holdings Deutschland GmbH from 2006 to 2009. Mr. Polisson is an attorney and has a retired status with the Massachusetts and District of Columbia Bar Associations. | | N/A |
Michael S. Scofield (Born 1943) | | Trustee, since 2010 | | Served on the Investment Company Institute’s Board of Governors and Executive Committee from 2008-2011 as well the Governing Council of the Independent Directors Council from 2006-2011 and the Independent Directors Council Executive Committee from 2008-2011. Trustee of the Evergreen Fund complex (and its predecessors) from 1984 to 2010. Chairman of the Evergreen Funds from 2000-2010. Former Trustee of the Mentor Funds. Retired Attorney, Law Offices of Michael S. Scofield. | | N/A |
Pamela Wheelock (Born 1959) | | Trustee, since 2018; Advisory Board Member, from 2017 to 2018 | | Chief Operating Officer, Twin Cities Habitat for Humanity, since January, 2017. Vice President of University Services, University of Minnesota from 2012 to 2017. Prior thereto, on the Board of Directors, Governance Committee and Finance Committee for the Minnesota Philanthropy Partners (Saint Paul Foundation) from 2012 to 2018, Interim President and Chief Executive Officer of Blue Cross Blue Shield of Minnesota from 2010 to 2011, Chairman of the Board from 2009 to 2011 and Board Director from 2003 to 2015. Vice President, Leadership and Community Engagement, Bush Foundation, Saint Paul, Minnesota (a private foundation) from 2009 to 2011. Executive Vice President and Chief Financial Officer, Minnesota Sports and Entertainment from 2004 to 2009 and Senior Vice President from 2002 to 2004. Commissioner of Finance, State of Minnesota, from 1999 to 2002. Currently the Board Chair of the Minnesota Wild Foundation since 2010. | | N/A |
| * | Length of service dates reflect the Trustee’s commencement of service with the Trust’s predecessor entities, where applicable. |
| | | | | | |
| Other information (unaudited) | | Wells Fargo Ultra Short-Term Income Fund | | | 41 | |
Officers
| | | | | | |
Name and
year of birth | | Position held and
length of service | | Principal occupations during past five years or longer | | |
Andrew Owen (Born 1960) | | President, since 2017 | | Executive Vice President of Wells Fargo & Company and Head of Affiliated Managers, Wells Fargo Asset Management, since 2014. In addition, Mr. Owen is currently President, Chief Executive Officer and Director of Wells Fargo Funds Management, LLC since 2017. Prior thereto, Executive Vice President responsible for marketing, investments and product development for Wells Fargo Funds Management, LLC, from 2009 to 2014. | | |
Nancy Wiser1 (Born 1967) | | Treasurer, since 2012 | | Executive Vice President of Wells Fargo Funds Management, LLC since 2011. Chief Operating Officer and Chief Compliance Officer at LightBox Capital Management LLC, from 2008 to 2011. | | |
Alexander Kymn3 (Born 1973) | | Secretary, since 2018; Chief Legal Officer, since 2018 | | Senior Company Counsel of Wells Fargo Bank, N.A. since 2018 (previously Senior Counsel from 2007 to 2018). Vice President of Wells Fargo Funds Management, LLC from 2008 to 2014. | | |
Michael H. Whitaker (Born 1967) | | Chief Compliance Officer, since 2016 | | Senior Vice President and Chief Compliance Officer since 2016. Senior Vice President and Chief Compliance Officer for Fidelity Investments from 2007 to 2016. | | |
David Berardi (Born 1975) | | Assistant Treasurer, since 2009 | | Vice President of Wells Fargo Funds Management, LLC since 2009. Vice President of Evergreen Investment Management Company, LLC from 2008 to 2010. Manager of Fund Reporting and Control for Evergreen Investment Management Company, LLC from 2004 to 2010. | | |
Jeremy DePalma1 (Born 1974) | | Assistant Treasurer, since 2009 | | Senior Vice President of Wells Fargo Funds Management, LLC since 2009. Senior Vice President of Evergreen Investment Management Company, LLC from 2008 to 2010 and head of the Fund Reporting and Control Team within Fund Administration from 2005 to 2010. | | |
| 1 | Nancy Wiser acts as Treasurer of 77 funds in the Fund Complex. Jeremy DePalma acts as Treasurer of 77 funds and Assistant Treasurer of 77 funds in the Fund Complex. |
| 2 | The Statement of Additional Information includes additional information about the Trustees and is available, without charge, upon request, by calling 1-800-222-8222 or by visiting the website at wellsfargofunds.com. |
| 3 | Alexander Kymn became the Secretary and Chief Legal Officer effective April 17, 2018. |
| | | | |
| 42 | | Wells Fargo Ultra Short-Term Income Fund | | Other information (unaudited) |
BOARD CONSIDERATION OF INVESTMENT MANAGEMENT AND SUB-ADVISORY AGREEMENTS:
Wells Fargo Ultra Short-Term Income Fund
Under the Investment Company Act of 1940 (the “1940 Act”), the Board of Trustees (the “Board”) of Wells Fargo Funds Trust (the “Trust”) must determine annually whether to approve the continuation of the Trust’s investment management and sub-advisory agreements. In this regard, at an in-person meeting held on May 22-23, 2018 (the “Meeting”), the Board, all the members of which have no direct or indirect interest in the investment management and sub-advisory agreements and are not “interested persons” of the Trust, as defined in the 1940 Act (the “Independent Trustees”), reviewed and approved for Wells Fargo Ultra Short-Term Income Fund (the “Fund”): (i) an investment management agreement (the “Management Agreement”) with Wells Fargo Funds Management, LLC (“Funds Management”); and (ii) an investment sub-advisory agreement (the “Sub-Advisory Agreement”) with Wells Capital Management Incorporated (the “Sub-Adviser”), an affiliate of Funds Management. The Management Agreement and the Sub-Advisory Agreement are collectively referred to as the “Advisory Agreements.”
At the Meeting, the Board considered the factors and reached the conclusions described below relating to the selection of Funds Management and the Sub-Adviser and the approval of the Advisory Agreements. Prior to the Meeting, including at an in-person meeting in April 2018, the Trustees conferred extensively among themselves and with representatives of Funds Management about these matters. Also, the Board has adopted a team-based approach, with each team consisting of a sub-set of Trustees, to assist the full Board in the discharge of its duties in reviewing investment performance and other matters throughout the year. The Independent Trustees were assisted in their evaluation of the Advisory Agreements by independent legal counsel, from whom they received separate legal advice and with whom they met separately.
In providing information to the Board, Funds Management and the Sub-Adviser were guided by a detailed set of requests for information submitted to them by independent legal counsel on behalf of the Independent Trustees at the start of the Board’s annual contract renewal process earlier in 2018. In considering and approving the Advisory Agreements, the Trustees considered the information they believed relevant, including but not limited to the information discussed below. The Board considered not only the specific information presented in connection with the Meeting, but also the knowledge gained over time through interaction with Funds Management and the Sub-Adviser about various topics. In this regard, the Board reviewed reports of Funds Management at each of its quarterly meetings, which included, among other things, portfolio reviews and investment performance reports. In addition, the Board and the teams mentioned above confer with portfolio managers at various times throughout the year. The Board did not identify any particular information or consideration that was all-important or controlling, and each individual Trustee may have attributed different weights to various factors.
After its deliberations, the Board unanimously approved the continuation of the Advisory Agreements for a one-year term and determined that the compensation payable to Funds Management and the Sub-Adviser under each of the Advisory Agreements was reasonable. The Board considered the approval of the Advisory Agreements for the Fund as part of its consideration of agreements for funds across the complex, but its approvals were made on a fund-by-fund basis. The following summarizes a number of important, but not necessarily all, factors considered by the Board in support of its approvals.
Nature, extent and quality of services
The Board received and considered various information regarding the nature, extent and quality of services provided to the Fund by Funds Management and the Sub-Adviser under the Advisory Agreements. This information included a description of the investment advisory services and Fund-level administrative services covered by the Management Agreement, as well as, among other things, a summary of the background and experience of senior management of Wells Fargo Asset Management (“WFAM”), of which Funds Management and the Sub-Adviser are a part, a summary of investments made in the business of WFAM, a summary of certain organizational and personnel changes involving Funds Management and the Sub-Adviser, and a description of Funds Management’s and the Sub-Adviser’s business continuity planning programs and of their approaches to data privacy and cybersecurity. The Board also considered the qualifications, background, tenure and responsibilities of each of the portfolio managers primarily responsible for the day-to-day portfolio management of the Fund.
The Board evaluated the ability of Funds Management and the Sub-Adviser to attract and retain qualified investment professionals, including research, advisory and supervisory personnel. The Board further considered the compliance programs and compliance records of Funds Management and the Sub-Adviser. In addition, the Board took into account the full range of services provided to the Fund by Funds Management and its affiliates.
| | | | | | |
| Other information (unaudited) | | Wells Fargo Ultra Short-Term Income Fund | | | 43 | |
Fund investment performance and expenses
The Board considered the investment performance results for the Fund over various time periods ended December 31, 2017. The Board considered these results in comparison to the investment performance of funds in a universe that was determined by Broadridge Inc. (“Broadridge”) to be similar to the Fund (the “Universe”), and in comparison to the Fund’s benchmark index and to other comparative data. Broadridge is an independent provider of investment company data. The Board received a description of the methodology used by Broadridge to select the mutual funds in the performance Universe. The Board noted that the investment performance of the Fund (Administrator Class) was higher than or in range of the average investment performance of the Universe for all periods under review. The Board also noted that the investment performance of the Fund was higher than its benchmark index, the Bloomberg Barclays S/T U.S. Govt/Credit Bond Index, all periods under review.
The Board also received and considered information regarding the Fund’s net operating expense ratios and their various components, including actual management fees, custodian and other non-management fees, and Rule 12b-1 and non-Rule 12b-1 shareholder service fees. The Board considered these ratios in comparison to the median ratios of funds in class-specific expense groups that were determined by Broadridge to be similar to the Fund (the “Groups”). The Board received a description of the methodology used by Broadridge to select the mutual funds in the expense Groups and an explanation of how funds comprising expense groups and their expense ratios may vary from year-to-year. Based on the Broadridge reports, the Board noted that the net operating expense ratios of the Fund were equal to or lower than the median net operating expense ratios of the expense Groups for each share class.
The Board took into account the Fund’s investment performance and expense information provided to it among the factors considered in deciding to re-approve the Advisory Agreements.
Investment management and sub-advisory fee rates
The Board reviewed and considered the contractual fee rates payable by the Fund to Funds Management under the Management Agreement, as well as the contractual fee rates payable by the Fund to Funds Management for class-level administrative services under a Class-Level Administration Agreement, which include, among other things, class-level transfer agency and sub-transfer agency costs (collectively, the “Management Rates”). The Board also reviewed and considered the contractual investment sub-advisory fee rates that are payable by Funds Management to the Sub-Adviser for investment sub-advisory services.
Among other information reviewed by the Board was a comparison of the Fund’s Management Rates with the average contractual investment management fee rates of funds in the expense Groups at a common asset level as well as transfer agency costs of the funds in the expense Groups. The Board noted that the Management Rates of the Fund were in range of the sum of these average rates for the Fund’s expense Groups for all share classes.
The Board also received and considered information about the portion of the total management fee that was retained by Funds Management after payment of the fee to the Sub-Adviser for sub-advisory services. In assessing the reasonableness of this amount, the Board received and evaluated information about the nature and extent of responsibilities retained and risks assumed by Funds Management and not delegated to or assumed by the Sub-Adviser, and about Funds Management’s on-going oversight services. Given the affiliation between Funds Management and the Sub-Adviser, the Board ascribed limited relevance to the allocation of fees between them.
The Board also received and considered information about the nature and extent of services offered and fee rates charged by Funds Management and the Sub-Adviser to other types of clients with investment strategies similar to those of the Fund. In this regard, the Board received information about the significantly greater scope of services, and compliance, reporting and other legal burdens and risks of managing mutual funds compared with those associated with managing assets of non-mutual fund clients such as institutional separate accounts.
Based on its consideration of the factors and information it deemed relevant, including those described here, the Board determined that the compensation payable to Funds Management under the Management Agreement and to the Sub-Adviser under the Sub-Advisory Agreement was reasonable.
Profitability
The Board received and considered information concerning the profitability of Funds Management, as well as the profitability of both WFAM and Wells Fargo & Co. (“Wells Fargo”) as a whole, from providing services to the Fund and the fund family as a whole. The Board noted that the Sub-Adviser’s profitability information with respect to providing services to the Fund was subsumed in the WFAM and Wells Fargo profitability analysis.
Funds Management reported on the methodologies and estimates used in calculating profitability, including a description of the methodology used to allocate certain expenses and recent enhancements made to the methodology.
| | | | |
| 44 | | Wells Fargo Ultra Short-Term Income Fund | | Other information (unaudited) |
Among other things, the Board noted that the levels of profitability reported on a fund-by-fund basis varied widely, depending on factors such as the size and type of fund. Based on its review, the Board did not deem the profits reported by Funds Management, WFAM or Wells Fargo from services provided to the Fund to be at a level that would prevent it from approving the continuation of the Advisory Agreements.
Economies of scale
The Board considered the extent to which Funds Management may experience economies of scale in the provision of management services, and the extent to which scale benefits, if any, would be shared with shareholders. In particular, the Board noted the existence of breakpoints in the Fund’s management fee structure, which operate generally to reduce the Fund’s expense ratios as the Fund grows in size. It considered that, for a small fund or a fund that shrinks in size, breakpoints conversely can result in higher fee levels. The Board also considered that in addition to management fee breakpoints, competitive management fee rates set at the outset without regard to breakpoints and fee waiver and expense reimbursement arrangements, as well as investments in the business intended to enhance services available to Fund shareholders, are means of sharing potential economies of scale with shareholders of the Fund.
The Board concluded that the Fund’s fee and expense arrangements, including contractual breakpoints, constituted a reasonable approach to sharing potential economies of scale with the Fund and its shareholders.
Other benefits to Funds Management and the Sub-Adviser
The Board received and considered information regarding potential “fall-out” or ancillary benefits received by Funds Management and its affiliates, including the Sub-Adviser, as a result of their relationships with the Fund. Ancillary benefits could include, among others, benefits directly attributable to other relationships with the Fund and benefits potentially derived from an increase in Funds Management’s and the Sub-Adviser’s business as a result of their relationships with the Fund. The Board noted that various affiliates of Funds Management may receive distribution-related fees, shareholder servicing payments and sub-transfer agency fees in respect of shares sold or held through them and services provided.
The Board also reviewed information about soft dollar credits earned and utilized by the Sub-Adviser, fees earned by Funds Management and the Sub-Adviser from managing a private investment vehicle for the fund family’s securities lending collateral and commissions earned by an affiliated broker from portfolio transactions.
Based on its consideration of the factors and information it deemed relevant, including those described here, the Board did not find that any ancillary benefits received by Funds Management and its affiliates, including the Sub-Adviser, were unreasonable.
Conclusion
At the Meeting, after considering the above-described factors and based on its deliberations and its evaluation of the information described above, the Board unanimously approved the continuation of the Advisory Agreements for a one-year term and determined that the compensation payable to Funds Management and the Sub-Adviser under each of the Advisory Agreements was reasonable.
| | | | | | |
| Appendix A (unaudited) | | Wells Fargo Ultra Short-Term Income Fund | | | 45 | |
SALES CHARGE REDUCTIONS AND WAIVERS FOR CERTAIN INTERMEDIARIES
Ameriprise
Effective June 1, 2018, shareholders purchasing Fund shares through an Ameriprise Financial platform or account will be eligible only for the following Class A load waivers (front-end sales charge waivers), which may differ from those disclosed elsewhere in the Fund’s prospectus or Statement of Additional Information.
Front-end Sales Load Waivers on Class A Shares Available at Ameriprise Financial
| | • | | Employer-sponsored retirement plans (e.g., 401(k) plans, 457 plans, employer-sponsored 403(b) plans, profit sharing and money purchase pension plans and defined benefit plans). For purposes of this provision, employer-sponsored retirement plans do not include SEP IRAs, Simple IRAs or SAR-SEPs. |
| | • | | Shares purchased through an Ameriprise Financial investment advisory program (if an Advisory or similar share class for such investment advisory program is not available) |
| | • | | Shares purchased by third party investment advisors on behalf of their advisory clients through Ameriprise Financial’s platform (if an Advisory or similar share class for such investment advisory program is not available) |
| | • | | Shares purchased through reinvestment of distributions and dividend reinvestment when purchasing shares of the same Fund (but not any other fund within the same fund family) |
| | • | | Shares exchanged from Class C shares of the same fund in the month of or following the 10-year anniversary of the purchase date. To the extent that the Fund’s prospectus elsewhere provides for a waiver with respect to such shares following a shorter holding period, that waiver will apply to exchanges following such shorter period. To the extent that the Fund’s prospectus elsewhere provides for a waiver with respect to exchanges of Class C shares for load-waived shares, that waiver will also apply to such exchanges. |
| | • | | Employees and registered representatives of Ameriprise Financial or its affiliates and their immediate family members |
| | • | | Shares purchased by or through qualified accounts (including IRAs, Coverdell Education Savings Accounts, 401(k)s, 403(b) TSCAs subject to ERISA and defined benefit plans) that are held by a covered family member, defined as an Ameriprise financial advisor and/or the advisor’s spouse, advisor’s lineal ascendant (mother, father, grandmother, grandfather, great grandmother, great grandfather), advisor’s lineal descendant (son, step-son, daughter, step-daughter, grandson, granddaughter, great grandson, great granddaughter) or any spouse of a covered family member who is a lineal descendant |
| | • | | Shares purchased from the proceeds of redemptions within the same fund family, provided (1) the repurchase occurs within 90 days following the redemption, (2) the redemption and purchase occur in the same account, and (3) redeemed shares were subject to a front-end or deferred sales load (i.e. Rights of Reinstatement). Subject to the Fund’s policy regarding frequent purchases and redemptions of Fund shares, you may not be able to repurchase shares for the first 30 days after your redemption. |
Automatic Exchange of Class C Shares Available at Ameriprise Financial
| | • | | Class C shares will automatically exchange to Class A shares in the month of the 10-year anniversary of the purchase date. |
Merrill Lynch
Effective April 10, 2017, shareholders purchasing Fund shares through a Merrill Lynch platform or account will be eligible only for the following load waivers (front-end sales charge waivers and contingent deferred, or back-end, sales charge waivers) and discounts, which may differ from those disclosed elsewhere in the Fund’s prospectus or Statement of Additional Information.
Front-end Sales Load Waivers on Class A Shares available at Merrill Lynch
| | • | | Employer-sponsored retirement, deferred compensation and employee benefit plans (including health savings accounts) and trusts used to fund those plans, provided that the shares are not held in a commission-based brokerage account and shares are held for the benefit of the plan |
| | • | | Shares purchased by or through a 529 Plan |
| | • | | Shares purchased through a Merrill Lynch affiliated investment advisory program |
| | | | |
| 46 | | Wells Fargo Ultra Short-Term Income Fund | | Appendix A (unaudited) |
| | • | | Shares purchased by third party investment advisors on behalf of their advisory clients through Merrill Lynch’s platform |
| | • | | Shares of funds purchased through the Merrill Edge Self-Directed platform (if applicable) |
| | • | | Shares purchased through reinvestment of capital gains distributions and dividend reinvestment when purchasing shares of the same fund (but not any other fund within the fund family) |
| | • | | Shares exchanged from Class C (i.e. level-load) shares of the same fund in the month of or following the 10-year anniversary of the purchase date |
| | • | | Employees and registered representatives of Merrill Lynch or its affiliates and their family members, as defined by Merrill Lynch, which may differ from the definition of family member in the Fund’s prospectus. |
| | • | | Directors or Trustees of the Fund, and employees of the Fund’s investment adviser or any of its affiliates, as described in the Fund’s prospectus |
| | • | | Shares purchased from the proceeds of redemptions within the same fund family, provided (1) the repurchase occurs within 90 days following the redemption, (2) the redemption and purchase occur in the same account, and (3) redeemed shares were subject to a front-end or deferred sales load (known as Rights of Reinstatement). Subject to the Fund’s policy regarding frequent purchases and redemptions of Fund shares, you may not be able to repurchase shares for the first 30 days after your redemption. |
CDSC Waivers on A, B and C Shares available at Merrill Lynch
| | • | | Death or disability of the shareholder |
| | • | | Shares sold as part of a systematic withdrawal plan as described in the Fund’s prospectus |
| | • | | Return of excess contributions from an IRA Account |
| | • | | Shares sold as part of a required minimum distribution for IRA and retirement accounts due to the shareholder reaching age 70½ |
| | • | | Shares sold to pay Merrill Lynch fees but only if the transaction is initiated by Merrill Lynch |
| | • | | Shares acquired through a right of reinstatement |
| | • | | Shares held in retirement brokerage accounts, that are exchanged for a lower cost share class due to transfer to certain fee based accounts or platforms (applicable to A and C shares only) |
Front-end load Discounts Available at Merrill Lynch: Breakpoints, Rights of Accumulation & Letters of Intent
| | • | | Breakpoints as described in the Fund’s prospectus |
| | • | | Rights of Accumulation (ROA) which entitle shareholders to breakpoint discounts will be automatically calculated based on the aggregated holding of fund family assets held by accounts within the purchaser’s household at Merrill Lynch. Eligible fund family assets not held at Merrill Lynch may be included in the ROA calculation only if the shareholder notifies his or her financial advisor about such assets. |
| | • | | Letters of Intent (LOI) which allow for breakpoint discounts based on anticipated purchases within a fund family, through Merrill Lynch, over a 13-month period of time (if applicable) |
Morgan Stanley
Effective on or about July 1, 2018, shareholders purchasing Fund shares through a Morgan Stanley Wealth Management transactional brokerage account will be eligible only for the following Class A load waivers (front-end sales charge waivers), which may differ from and be more limited than those disclosed in the Fund’s prospectus or Statement of Additional Information.
Front-end Sales Load Waivers on Class A Shares Available at Morgan Stanley
| | • | | Employer-sponsored retirement plans (e.g., 401(k) plans, 457 plans, employer-sponsored 403(b) plans, profit sharing and money purchase pension plans and defined benefit plans). For purposes of this provision, employer-sponsored retirement plans do not include SEP IRAs, Simple IRAs, SAR-SEPs or Keogh plans. |
| | • | | Morgan Stanley employee and employee-related accounts according to Morgan Stanley’s account linking rules |
| | • | | Shares purchased through reinvestment of dividends and capital gains distributions when purchasing shares of the same fund |
| | • | | Shares purchased through a Morgan Stanley self-directed brokerage account |
| | | | | | |
| Appendix A (unaudited) | | Wells Fargo Ultra Short-Term Income Fund | | | 47 | |
| | • | | Class C (i.e., level-load) shares that are no longer subject to a contingent deferred sales charge and are exchanged to Class A shares of the same fund pursuant to Morgan Stanley Wealth Management’s share class exchange program. |
| | • | | Shares purchased from the proceeds of redemptions within the same fund family, provided (i) the repurchase occurs within 90 days following the redemption, (ii) the redemption and purchase occur in the same account, and (iii) redeemed shares were subject to a front-end or deferred sales charge. This waiver is subject to the Fund’s policy regarding frequent purchases and redemption of Fund shares, as discussed under “Account Information—Frequent Purchases and Redemptions of Fund Shares” in the Fund’s prospectus. |
This page is intentionally left blank.

For more information
More information about Wells Fargo Funds is available free upon request. To obtain literature, please write, visit the Fund’s website, or call:
Wells Fargo Funds
P.O. Box 219967
Kansas City, MO 64121-9967
Website: wellsfargofunds.com
Individual investors: 1-800-222-8222
Retail investment professionals: 1-888-877-9275
Institutional investment professionals: 1-866-765-0778
This report and the financial statements contained herein are submitted for the general information of the shareholders of the Fund. If this report is used for promotional purposes, distribution of the report must be accompanied or preceded by a current prospectus. Before investing, please consider the investment objectives, risks, charges, and expenses of the investment. For a current prospectus and, if available, a summary prospectus, containing this information, call 1-800-222-8222 or visit the Fund’s website at wellsfargofunds.com. Read the prospectus carefully before you invest or send money.
Wells Fargo Asset Management (WFAM) is the trade name for certain investment advisory/management firms owned by Wells Fargo & Company. These firms include but are not limited to Wells Capital Management Incorporated and Wells Fargo Funds Management, LLC. Certain products managed by WFAM entities are distributed by Wells Fargo Funds Distributor, LLC (a broker/dealer and Member FINRA).
This material is for general informational and educational purposes only and is NOT intended to provide investment advice or a recommendation of any kind—including a recommendation for any specific investment, strategy, or plan.
NOT FDIC INSURED ◾ NO BANK GUARANTEE ◾ MAY LOSE VALUE
© 2018 Wells Fargo Funds Management, LLC. All rights reserved.
| | |
 | | 315411 10-18 A223/AR223 08-18 |
ITEM 2. CODE OF ETHICS
(a) As of the end of the period covered by the report, Wells Fargo Funds Trust has adopted a code of ethics that applies to its President and Treasurer. A copy of the code of ethics is filed as an exhibit to this Form N-CSR.
(c) During the period covered by this report, there were no amendments to the provisions of the code of ethics adopted in Item 2(a) above.
(d) During the period covered by this report, there were no implicit or explicit waivers to the provisions of the code of ethics adopted in Item 2(a) above.
ITEM 3. AUDIT COMMITTEE FINANCIAL EXPERT
The Board of Trustees of Wells Fargo Funds Trust has determined that Judith Johnson is an audit committee financial expert, as defined in Item 3 of Form N-CSR. Mrs. Johnson is independent for purposes of Item 3 of Form N-CSR.
ITEM 4. PRINCIPAL ACCOUNTANT FEES AND SERVICES
(a), (b), (c), (d) The following table presents aggregate fees billed in each of the last two fiscal years for services rendered to the Registrant by the Registrant’s principal accountant. These fees were billed to the registrant and were approved by the Registrant’s audit committee.
| | | | | | | | |
| | | Fiscal
year ended
August 31, 2018 | | | Fiscal
year ended
August 31, 2017 | |
Audit fees | | $ | 421,385 | | | $ | 412,012 | |
Audit-related fees | | | — | | | | — | |
Tax fees (1) | | | 39,335 | | | | 38,040 | |
All other fees | | | — | | | | — | |
| | | | | | | | |
| | $ | 460,720 | | | $ | 450,052 | |
| | | | | | | | |
| (1) | Tax fees consist of fees for tax compliance, tax advice, tax planning and excise tax. |
(e) The Chairman of the Audit Committees is authorized to pre-approve: (1) audit services for the mutual funds of Wells Fargo Funds Trust; (2) non-audit tax or compliance consulting or training services provided to the Funds by the independent auditors (“Auditors”) if the fees for any particular engagement are not anticipated to exceed $50,000; and (3) non-audit tax or compliance consulting or training services provided by the Auditors to a Fund’s investment adviser and its controlling entities (where pre-approval is required because the engagement relates directly to the operations and financial reporting of the Fund) if the fee to the Auditors for any particular engagement is not anticipated to exceed $50,000. For any such pre-approval sought from the Chairman, Management shall prepare a brief description of the proposed services. If the Chairman approves of such service, he or she shall sign the statement prepared by Management. Such written statement shall be presented to the full Committees at their next regularly scheduled meetings.
(f) Not applicable
(g) Not applicable
(h) Not applicable
ITEM 5. AUDIT COMMITTEE OF LISTED REGISTRANTS
Not applicable.
ITEM 6. INVESTMENTS
A Portfolio of Investments for each series of Wells Fargo Funds Trust is included as part of the report to shareholders filed under Item 1 of this Form.
ITEM 7. DISCLOSURE OF PROXY VOTING POLICIES AND PROCEDURES FOR CLOSED-END MANAGEMENT INVESTMENT COMPANIES
Not applicable.
ITEM 8. PORTFOLIO MANAGERS OF CLOSED-END MANAGEMENT INVESTMENT COMPANIES
Not applicable.
ITEM 9. PURCHASES OF EQUITY SECURITIES BY CLOSED-END MANAGEMENT INVESTMENT COMPANY AND AFFILIATED PURCHASERS
Not applicable.
ITEM 10. SUBMISSION OF MATTERS TO A VOTE OF SECURITY HOLDERS
There have been no material changes to the procedures by which shareholders may recommend nominees to the registrant’s Board of Trustees that have been implemented since the registrant’s last provided disclosure in response to the requirements of this Item.
ITEM 11. CONTROLS AND PROCEDURES
(a) The President and Treasurer have concluded that the Wells Fargo Funds Trust (the “Trust”) disclosure controls and procedures (as defined in Rule 30a-3(c) under the Investment Company Act of 1940) provide reasonable assurances that material information relating to the Trust is made known to them by the appropriate persons based on their evaluation of these controls and procedures as of a date within 90 days of the filing of this report.
(b) There were no significant changes in the Trust’s internal controls over financial reporting (as defined in Rule 30a-3(d) under the Investment Company Act of 1940) that occurred during the second fiscal quarter of the period covered by this report that materially affected, or is reasonably likely to materially affect, the registrant’s internal control over financial reporting.
ITEM 12. EXHIBITS
(a)(1) Code of Ethics pursuant to Item 2 of Form N-CSR is filed and attached hereto as Exhibit COE.
(a)(2) Certification pursuant to Rule 30a-2(a) under the Investment Company Act of 1940 (17 CFR 270.30a-2(a)) is filed and attached hereto as Exhibit 99.CERT.
(a)(3) Not applicable.
(b) Certification pursuant to Rule 30a-2(b) under the Investment Company Act of 1940 (17 CFR 270.30a-2(b)) is filed and attached hereto as Exhibit 99.906CERT.
SIGNATURES
Pursuant to the requirements of the Securities Exchange Act of 1934 and the Investment Company Act of 1940, the registrant has duly caused this report to be signed on its behalf by the undersigned, thereunto duly authorized.
| | |
| Wells Fargo Funds Trust |
| |
| By: | | |
| | /s/ Andrew Owen |
| |
| | Andrew Owen |
| | President |
| |
| Date: | | October 26, 2018 |
Pursuant to the requirements of the Securities Exchange Act of 1934 and the Investment Company Act of 1940, this report has been signed below by the following persons on behalf of the registrant and in the capacities and on the date indicated.
| | |
| Wells Fargo Funds Trust |
| |
| By: | | |
| | /s/ Andrew Owen |
| |
| | Andrew Owen |
| | President |
| |
| Date: | | October 26, 2018 |
| |
| By: | | |
| | /s/ Nancy Wiser |
| |
| | Nancy Wiser |
| | Treasurer |
| |
| Date: | | October 26, 2018 |