
UNITED STATES
SECURITIES AND EXCHANGE COMMISSION
Washington, D.C. 20549
FORM N-CSR
CERTIFIED SHAREHOLDER REPORT OF REGISTERED
MANAGEMENT INVESTMENT COMPANIES
Investment Company Act file number: 811-09253
Wells Fargo Funds Trust
(Exact name of registrant as specified in charter)
525 Market St., San Francisco, CA 94105
(Address of principal executive offices) (Zip code)
Catherine Kennedy
Wells Fargo Funds Management, LLC
525 Market St., San Francisco, CA 94105
(Name and address of agent for service)
Registrant’s telephone number, including area code: 800-222-8222
Date of fiscal year end: June 30
Registrant is making a filing for 13 of its series:
Wells Fargo Alternative Risk Premia Fund, Wells Fargo California Limited-Term Tax-Free Fund, Wells Fargo California Tax-Free Fund, Wells Fargo High Yield Municipal Bond Fund, Wells Fargo Intermediate Tax/AMT-Free Fund, Wells Fargo Minnesota Tax-Free Fund, Wells Fargo Municipal Bond Fund, Wells Fargo Municipal Sustainability Fund, Wells Fargo Pennsylvania Tax-Free Fund, Wells Fargo Short-Term Municipal Bond Fund, Wells Fargo Strategic Municipal Bond Fund, Wells Fargo Ultra Short-Term Municipal Income Fund, and Wells Fargo Wisconsin Tax-Free Fund.
Date of reporting period: June 30, 2020
| ITEM 1. | REPORT TO STOCKHOLDERS |

Annual Report
June 30, 2020
Wells Fargo
Minnesota Tax-Free Fund
Beginning on January 1, 2021, as permitted by new regulations adopted by the Securities and Exchange Commission, paper copies of the Wells Fargo Funds’ annual and semi-annual shareholder reports issued after this date will no longer be sent by mail, unless you specifically request paper copies of the reports. Instead, the reports will be made available on the Funds’ website, and you will be notified by mail each time a report is posted and provided with a website address to access the report.
If you already elected to receive shareholder reports electronically, you will not be affected by this change and you need not take any action. You may elect to receive shareholder reports and other communications from the Fund electronically at any time by contacting your financial intermediary (such as a broker-dealer or bank) or, if you are a direct investor, by calling 1-800-222-8222 or by enrolling at wellsfargo.com/advantagedelivery.
You may elect to receive all future reports in paper free of charge. If you invest through a financial intermediary, you can contact your financial intermediary to request that you continue to receive paper copies of your shareholder reports; if you invest directly with the Fund, you can call 1-800-222-8222. Your election to receive reports in paper will apply to all Wells Fargo Funds held in your account with your financial intermediary or, if you are a direct investor, to all Wells Fargo Funds that you hold.
|
Reduce clutter. Save trees. |
Sign up for electronic delivery of prospectuses and shareholder reports at wellsfargo.com/advantagedelivery |
The views expressed and any forward-looking statements are as of June 30, 2020, unless otherwise noted, and are those of the Fund managers and/or Wells Fargo Asset Management. Discussions of individual securities, or the markets generally, or any Wells Fargo Fund are not intended as individual recommendations. Future events or results may vary significantly from those expressed in any forward-looking statements. The views expressed are subject to change at any time in response to changing circumstances in the market. Wells Fargo Asset Management and the Fund disclaim any obligation to publicly update or revise any views expressed or forward-looking statements.
INVESTMENT PRODUCTS: NOT FDIC INSURED ◾ NO BANK GUARANTEE ◾ MAY LOSE VALUE
Wells Fargo Minnesota Tax-Free Fund | 1
Letter to shareholders (unaudited)

Andrew Owen
President
Wells Fargo Funds
Dear Shareholder:
We are pleased to offer you this annual report for the Wells Fargo Minnesota Tax-Free Fund for the 12-month period that ended June 30, 2020. Global stock markets saw earlier gains erased in February and March as governments around the world took unprecedented measures to stop the spread of the coronavirus at the expense of short-term economic output. However, markets rebounded from April through June to offset much of the losses as central banks attempted to bolster capital markets and confidence. Fixed-income markets generally performed better, with most achieving gains. Overall U.S. markets surpassed their international peers, while U.S. large-cap equity, as measured by the Russell 1000® Index1, easily outperformed small caps, as measured by the Russell 2000® Index2, for the 12-month period.
For the 12-month period, fixed-income securities generally had positive total returns while non-U.S. equities had broad losses and U.S. stocks performed strongly despite sharp volatility since late February. For the period, U.S. stocks, based on the S&P 500 Index,3 gained 7.51%. International stocks, as measured by the MSCI ACWI ex USA Index (Net),4 returned -4.80%, while the MSCI EM Index (Net)5 performed slightly better, with a -3.39% return. For bond investors, the Bloomberg Barclays U.S. Aggregate Bond Index6 returned a robust 8.74%, the Bloomberg Barclays Global Aggregate ex-USD Index7 gained a modest 0.71%, and the Bloomberg Barclays Municipal Bond Index8 returned 4.45% while the ICE BofA U.S. High Yield Index9 lost 1.10%.
The fiscal year began on a positive note.
The 12-month period began with the U.S. equity market advancing to new highs in July 2019. U.S. President Donald Trump initially backed off of earlier tariff threats against Mexico and China. However, later in July, the U.S. reversed course and threatened to impose higher tariffs on China’s exports after talks failed. China responded with tariff threats of its own and devalued the renminbi, roiling global markets. Major U.S. stock market indices closed July with the worst weekly results of the year. Bond prices gained as Treasury yields fell to multiyear lows, and the yield curve inverted at multiple points along the 30-year arc, with shorter term yields higher than longer-term. At the end of July, the U.S. Federal Reserve (Fed) cut its federal funds rate by 0.25%.
In August, U.S.-China trade tensions continued with no signs of compromise. Evidence of a continued global economic slowdown mounted, and central banks in China, New Zealand, and Thailand cut interest rates. Industrial and manufacturing data declined in China,
| 1 | The Russell 1000® Index measures the performance of the 1,000 largest companies in the Russell 3000® Index, which represents approximately 92% of the total market capitalization of the Russell 3000® Index. You cannot invest directly in an index. |
| 2 | The Russell 2000® Index measures the performance of the 2,000 smallest companies in the Russell 3000® Index, which represents approximately 8% of the total market capitalization of the Russell 3000® Index. You cannot invest directly in an index. |
| 3 | The S&P 500 Index consists of 500 stocks chosen for market size, liquidity, and industry group representation. It is a market-value-weighted index with each stock’s weight in the index proportionate to its market value. You cannot invest directly in an index. |
| 4 | The Morgan Stanley Capital International (MSCI) All Country World Index (ACWI) ex USA Index (Net) is a free-float-adjusted market-capitalization-weighted index that is designed to measure the equity market performance of developed and emerging markets, excluding the United States. Source: MSCI. MSCI makes no express or implied warranties or representations and shall have no liability whatsoever with respect to any MSCI data contained herein. The MSCI data may not be further redistributed or used as a basis for other indices or any securities or financial products. This report is not approved, reviewed, or produced by MSCI. You cannot invest directly in an index. |
| 5 | The MSCI Emerging Markets (EM) Index (Net) is a free-float-adjusted market-capitalization-weighted index that is designed to measure equity market performance of emerging markets. You cannot invest directly in an index. |
| 6 | The Bloomberg Barclays U.S. Aggregate Bond Index is a broad-based benchmark that measures the investment-grade, U.S. dollar-denominated, fixed-rate taxable bond market, including Treasuries, government-related and corporate securities, mortgage-backed securities (agency fixed-rate and hybrid adjustable-rate mortgage pass-throughs), asset-backed securities, and commercial mortgage-backed securities. You cannot invest directly in an index. |
| 7 | The Bloomberg Barclays Global Aggregate ex-USD Index is an unmanaged index that provides a broad-based measure of the global investment-grade fixed-income markets excluding the U.S.-dollar-denominated debt market. You cannot invest directly in an index. |
| 8 | The Bloomberg Barclays Municipal Bond Index is an unmanaged index composed of long-term tax-exempt bonds with a minimum credit rating of Baa. You cannot invest directly in an index. |
| 9 | The ICE BofA U.S. High Yield Index is a market-capitalization-weighted index of domestic and Yankee high-yield bonds. The index tracks the performance of high-yield securities traded in the U.S. bond market. You cannot invest directly in an index. Copyright 2020. ICE Data Indices, LLC. All rights reserved. |
2 | Wells Fargo Minnesota Tax-Free Fund
Letter to shareholders (unaudited)
Canada, Japan, and Germany. Adding to global uncertainty, Italy’s prime minister resigned, many feared a crackdown in Hong Kong as protestors sustained their calls for reform, and U.K. Prime Minister Boris Johnson planned to suspend Parliament as Brexit’s deadline neared.
In the U.S., the Fed cut interest rates a second time in September. U.S. manufacturing data disappointed investors. The U.S. Congress announced it would pursue an impeachment investigation of President Trump. Meanwhile, the Brexit impasse showed no signs of resolution. Officials in China said that hitting the country’s economic growth goals for the year would be difficult considering the weight of tariffs and trade restrictions. Although the S&P 500 Index finished the third quarter with the best year-to-date returns in more than 20 years, concerns about future returns remained.
The fourth quarter started on a strong note, with U.S.-China trade tensions relaxing in October along with renewed optimism for a U.K. Brexit deal and positive macroeconomic data. The initial estimate of U.S. third-quarter gross domestic product (GDP) growth was a resilient 1.9% annualized rate, while the U.S. unemployment rate fell to a 50-year low of 3.5% in September. However, despite resilience among U.S. consumers, business confidence declined while manufacturing activity contracted. Concerned with a potential economic slowdown, the Fed lowered interest rates another quarter point in late October—its third rate cut in four months. This helped push the S&P 500 Index to a new all-time high while emerging market equities rallied and global bonds declined overall, reflecting a broad pickup in risk appetite.
Equity markets continued to rally in November despite ongoing geopolitical risks. Hopes for a U.S.-China trade deal buoyed investor confidence. U.S. business sentiment improved slightly, and manufacturing and services activity picked up. While consumer confidence and purchasing manager activity rose in the eurozone, China reported weakening manufacturing and consumer data. Bond yields rose marginally, leading to slightly negative returns for global government and investment-grade corporate bonds.
Financial markets ended 2019 with a boost from the U.S. and China accord on a Phase One trade deal. That, along with the landslide win by the pro-Brexit U.K. Conservative Party in a national election and ongoing central bank support, gave investors greater confidence. U.S. economic indicators were generally positive, with the exception of manufacturing activity and business confidence. Consumer confidence was resilient, fed by a robust labor market, tame inflation, and lower interest rates, which boosted housing affordability and stimulated homebuyer activity. The impeachment of President Trump had little impact on markets. Meanwhile, slowing Chinese economic activity, partly attributable to the trade war, led to further government stimulus at year-end through lower reserve ratios, allowing banks to lend more money.
The year-end rally continued in early January 2020. However, capital market volatility picked up sharply in late January on concerns over the potential impact of the coronavirus on the global economy and stock markets. With sentiment somewhat souring, perceived safe havens did well in January. The U.S. dollar and Japanese yen both rose, and government bonds outperformed equities. While the S&P 500 Index held its ground, emerging market equities tumbled, including those in Asia.
In February, the coronavirus became the major market focus. Fears of the virus’s impact on global growth led to expectations of increased global central bank monetary policy support. That led the 10-year U.S. Treasury yield to fall to an all-time low of 1.1% by the end of the month. Although equity markets initially shrugged off concerns about the outbreak, focusing instead on strong fourth-quarter earnings and improving business confidence in January, market sentiment turned sharply lower toward month-end and the S&P 500 Index lost 8.2% for the month. Oil prices tumbled as Russia and the Organization of the Petroleum Exporting countries compounded a major decline in oil demand with a brutal price war, partly aimed at dissuading further U.S. shale production. As a result, the price of West Texas Intermediate crude oil fell 13% in February.
Wells Fargo Minnesota Tax-Free Fund | 3
Letter to shareholders (unaudited)
“The global spread of the coronavirus led country after country to clamp down on social and business-related activity in order to contain the virus from causing even greater devastation and overwhelming health care systems.”
“Despite ongoing economic weakness and high levels of uncertainty on the containment of the coronavirus and the timing of an effective vaccine, financial markets continued to post widely positive returns in June.”
The global spread of the coronavirus led country after country to clamp down on social and business-related activity in order to contain the virus from causing even greater devastation and overwhelming health care systems. This abrupt stoppage of economic activity led to the sharp deceleration of global output, sending economies into a deep contraction. Central bank responses were swift, as they slashed interest rates and expanded quantitative easing programs to restore liquidity and confidence to the markets. In the U.S., the Fed introduced several new lending programs, funding investment-grade bonds, money market mutual funds, and commercial paper while purchasing Treasuries, mortgage-backed securities, and overnight repurchase agreements. Meanwhile, stock markets tumbled quickly into a bear market, ending the longest bull stock market in U.S. history.
Markets rebounded strongly in April, with the S&P 500 Index gaining 12.8% for the month and the MSCI ACWI ex USA Index (Net) returning 7.6%. The rebound was fueled by unprecedented government and central bank stimulus measures taken to buffer the economic damage created by mass shutdowns enacted in order to contain the virus’s spread. The U.S. economy contracted by an annualized 5.0% pace in the first quarter, with 30 million new unemployment insurance claims in six weeks. In the eurozone, first-quarter real GDP shrank 3.8%, with the composite April Flash Purchasing Managers’ Index, a monthly survey of purchasing managers, falling to an all-time low of 13.5. The European Central Bank expanded its quantitative easing to include the purchase of additional government bonds of countries with the greatest virus-related need, including Italy and Spain. China’s first-quarter GDP fell by 6.8% year over year. However, retail sales, production, and investment showed signs of recovery. Extreme oil-price volatility continued as global supply far exceeded demand.
In May, the equity market rebound continued, with the S&P 500 Index climbing a further 4.8%. European and Japanese stock markets also had monthly gains. Investors regained confidence on reports of early signs of success in human trials of a coronavirus vaccine. Growth stocks continued to outperform value stocks while returns on global government bonds were generally flat. In the U.S., a gap grew between the stock market rebound and devastating economic data points, including an April unemployment rate of 14.7%, the highest level since World War II. Purchasing managers’ indices continued to reflect weakening activity in May in both the manufacturing and services sectors. U.S. corporate earnings reports indicated a 14% year-over-year contraction in earnings from the first quarter of 2019. However, high demand for technology, driven by remote activity, helped maintain robust information technology sector earnings, which helped drive powerful well-known technology stocks higher.
Despite ongoing economic weakness and high levels of uncertainty on the containment of the coronavirus and the timing of an effective vaccine, financial markets continued to post widely positive returns in June. As economies reopened, there were hopeful signs. U.S. retail sales rose 17% in May while retail sales in the U.K. rebounded by 12%. However, year over year, sales remained depressed. Vitally important to market sentiment was the ongoing commitment by central banks globally to do all they can to provide economic support through liquidity and low borrowing costs. U.S. economic activity was aided by one-time $1,200 stimulus checks and $600 bonus weekly unemployment benefits due to expire at the end of July. However, unemployment remained in the double digits, easing somewhat from 14.7% in April to 11.1% in June. At period-end, numerous states reported alarming increases of coronavirus cases. China’s economic recovery picked up momentum in June, though it remained far from a full recovery.
4 | Wells Fargo Minnesota Tax-Free Fund
Letter to shareholders (unaudited)
Don’t let short-term uncertainty derail long-term investment goals.
Periods of investment uncertainty can present challenges, but experience has taught us that maintaining long-term investment goals can be an effective way to plan for the future. To help you create a sound strategy based on your personal goals and risk tolerance, Wells Fargo Funds offers more than 100 mutual funds spanning a wide range of asset classes and investment styles. Although diversification cannot guarantee an investment profit or prevent losses, we believe it can be an effective way to manage investment risk and potentially smooth out overall portfolio performance. We encourage investors to know their investments and to understand that appropriate levels of risk-taking may unlock opportunities.
Thank you for choosing to invest with Wells Fargo Funds. We appreciate your confidence in us and remain committed to helping you meet your financial needs.
Sincerely,

Andrew Owen
President
Wells Fargo Funds
|
For further information about your Fund, contact your investment professional, visit our website at wfam.com, or call us directly at 1-800-222-8222. |
Notice to Shareholders
At a meeting held on August 10-12, 2020, the Board of Trustees of the Fund approved a change to the Fund’s automatic conversion feature for Class C shares in order to shorten the required holding period from 10 to 8 years. As a result, on a monthly basis beginning November 5, 2020, Class C shares will convert automatically into Class A shares 8 years after the initial date of purchase or, if you acquired your Class C shares through an exchange or conversion from another share class, 8 years after the date you acquired your Class C shares. When Class C shares that you acquired through a purchase or exchange convert, any other Class C shares that you purchased with reinvested dividends and distributions also will convert into Class A shares on a pro rata basis.
Please note that a shorter holding period may apply depending on your intermediary. Please see “Appendix A—Sales Charge Reductions and Waivers for Certain Intermediaries” in the Fund’s prospectus for further information.
Wells Fargo Minnesota Tax-Free Fund | 5
Performance highlights (unaudited)
Investment objective
The Fund seeks current income exempt from federal income tax and Minnesota individual income tax.
Manager
Wells Fargo Funds Management, LLC
Subadviser
Wells Capital Management Incorporated
Portfolio manager
Bruce R. Johns
Average annual total returns (%) as of June 30, 2020
| Including sales charge | Excluding sales charge | Expense ratios1 (%) | ||||||||||||||||||||||||||||||||
| Inception date | 1 year | 5 year | 10 year | 1 year | 5 year | 10 year | Gross | Net2 | ||||||||||||||||||||||||||
| Class A (NMTFX) | 1-12-1988 | -1.65 | 1.91 | 2.95 | 2.99 | 2.86 | 3.42 | 0.94 | 0.85 | |||||||||||||||||||||||||
| Class C (WMTCX) | 4-8-2005 | 1.22 | 2.09 | 2.65 | 2.22 | 2.09 | 2.65 | 1.69 | 1.60 | |||||||||||||||||||||||||
| Administrator Class (NWMIX) | 8-2-1993 | – | – | – | 3.34 | 3.13 | 3.68 | 0.88 | 0.60 | |||||||||||||||||||||||||
| Institutional Class (WMTIX)3 | 10-31-2016 | – | – | – | 3.42 | 3.21 | 3.72 | 0.61 | 0.52 | |||||||||||||||||||||||||
| Bloomberg Barclays Municipal Bond Index4 | – | – | – | – | 4.45 | 3.93 | 4.22 | – | – | |||||||||||||||||||||||||
| Bloomberg Barclays Minnesota Municipal Bond Index5 | – | – | – | – | 4.65 | 3.49 | 3.74 | – | – | |||||||||||||||||||||||||
Figures quoted represent past performance, which is no guarantee of future results, and do not reflect taxes that a shareholder may pay on an investment in a fund. Investment return and principal value of an investment will fluctuate so that an investor’s shares, when redeemed, may be worth more or less than their original cost. Performance shown without sales charges would be lower if sales charges were reflected. Current performance may be lower or higher than the performance data quoted, which assumes the reinvestment of dividends and capital gains. Current month-end performance is available on the Fund’s website, wfam.com.
Index returns do not include transaction costs associated with buying and selling securities, any mutual fund fees or expenses, or any taxes. It is not possible to invest directly in an index.
For Class A shares, the maximum front-end sales charge is 4.50%. For Class C shares, the maximum contingent deferred sales charge is 1.00%. Performance including a contingent deferred sales charge assumes the sales charge for the corresponding time period. Administrator Class and Institutional Class shares are sold without a front-end sales charge or contingent deferred sales charge.
Bond values fluctuate in response to the financial condition of individual issuers, general market and economic conditions, and changes in interest rates. Changes in market conditions and government policies may lead to periods of heightened volatility in the bond market and reduced liquidity for certain bonds held by the Fund. In general, when interest rates rise, bond values fall and investors may lose principal value. Interest rate changes and their impact on the Fund and its share price can be sudden and unpredictable. The use of derivatives may reduce returns and/or increase volatility. Certain investment strategies tend to increase the total risk of an investment (relative to the broader market). The Fund is exposed to Minnesota municipal securities risk and high-yield securities risk. Consult the Fund’s prospectus for additional information on these and other risks. A portion of the Fund’s income may be subject to federal, state, and/ or local income taxes or the Alternative Minimum Tax (AMT). Any capital gains distributions may be taxable.
Please see footnotes on page 7.
6 | Wells Fargo Minnesota Tax-Free Fund
Performance highlights (unaudited)
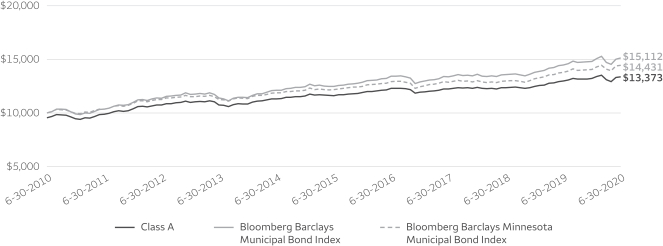
| Growth of $10,000 investment as of June 30, 20206 |
 |
| 1 | Reflects the expense ratios as stated in the most recent prospectuses. The expense ratios shown are subject to change and may differ from the annualized expense ratios shown in the financial highlights of this report. |
| 2 | The manager has contractually committed through October 31, 2020, to waive fees and/or reimburse expenses to the extent necessary to cap total annual fund operating expenses after fee waivers at 0.85% for Class A, 1.60% for Class C, 0.60% for Administrator Class, and 0.52% for Institutional Class. Brokerage commissions, stamp duty fees, interest, taxes, acquired fund fees and expenses (if any), and extraordinary expenses are excluded from the expense caps. Prior to or after the commitment expiration date, the caps may be increased or the commitment to maintain the caps may be terminated only with the approval of the Board of Trustees. Without these caps, the Fund’s returns would have been lower. The expense ratio paid by an investor is the net expense ratio (the total annual fund operating expenses after fee waivers) as stated in the prospectuses. |
| 3 | Historical performance shown for the Institutional Class shares prior to their inception reflects the performance of the Administrator Class shares, and is not adjusted to reflect Institutional Class expenses. If these expenses had been included, returns for Institutional Class shares would be higher. |
| 4 | The Bloomberg Barclays Municipal Bond Index is an unmanaged index composed of long-term tax-exempt bonds with a minimum credit rating of Baa. You cannot invest directly in an index. |
| 5 | The Bloomberg Barclays Minnesota Municipal Bond Index is the Minnesota component of the Bloomberg Barclays Municipal Bond Index. You cannot invest directly in an index. |
| 6 | The chart compares the performance of Class A shares for the most recent ten years with the Bloomberg Barclays Municipal Bond Index and the Bloomberg Barclays Minnesota Municipal Bond Index. The chart assumes a hypothetical $10,000 investment in Class A shares and reflects all operating expenses and assumes the maximum initial sales charge of 4.50%. |
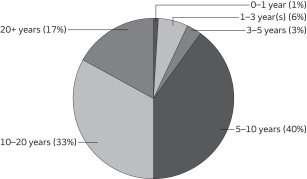
| 7 | Amounts are calculated based on the long-term total investments of the Fund. These amounts are subject to change and may have changed since the date specified. |
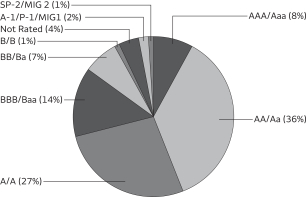
| 8 | The credit quality distribution of portfolio holdings reflected in the chart is based on ratings from Standard & Poor’s, Moody’s Investors Service, and/or Fitch Ratings Ltd. Credit quality ratings apply to the underlying holdings of the Fund and not to the Fund itself. The percentages of the Fund’s portfolio with the ratings depicted in the chart are calculated based on the total market value of fixed income securities held by the Fund. If a security was rated by all three rating agencies, the middle rating was utilized. If rated by two of three rating agencies, the lower rating was utilized, and if rated by one of the rating agencies, that rating was utilized. Standard & Poor’s rates the creditworthiness of bonds, ranging from AAA (highest) to D (lowest). Ratings from A to CCC may be modified by the addition of a plus (+) or minus (-) sign to show relative standing within the rating categories. Standard & Poor’s rates the creditworthiness of short-term notes from SP-1 (highest) to SP-3 (lowest). Moody’s rates the creditworthiness of bonds, ranging from Aaa (highest) to C (lowest). Ratings Aa to B may be modified by the addition of a number 1 (highest) to 3 (lowest) to show relative standing within the ratings categories. Moody’s rates the creditworthiness of short-term U.S. tax-exempt municipal securities from MIG 1/VMIG 1 (highest) to SG (lowest). Fitch rates the creditworthiness of bonds, ranging from AAA (highest) to D (lowest). Credit quality distribution is subject to change and may have changed since the date specified. |
Wells Fargo Minnesota Tax-Free Fund | 7
Performance highlights (unaudited)
MANAGER’S DISCUSSION
Fund highlights
| ∎ | The Fund underperformed its benchmarks, the Bloomberg Barclays Municipal Bond Index and the Bloomberg Barclays Minnesota Municipal Bond Index, for the 12-month period that ended June 30, 2020. |
| ∎ | The Fund’s conservative short-duration and yield-curve positioning detracted from the performance as bonds rallied and rates declined across the yield curve. We were overweight short to intermediate bonds, which underperformed, and underweight longer-term bonds, which outperformed. |
| ∎ | The Fund’s overweight to bonds rated A and BBB detracted from performance, as lower-rated investment-grade bonds underperformed bonds rated AAA and AA during the year’s flight to quality related to the coronavirus. |
| ∎ | Selectivity of individual bonds along with sector allocation drove performance. The Fund’s overweight to housing and local general obligations (GOs) contributed to performance. |
| Effective maturity distribution as of June 30, 20207 |
 |
The coronavirus pandemic and the associated containment efforts became the dominant market influence over the 12-month period.
In 2019, market expectations moved the Federal Reserve (Fed) from a rate-hiking posture to multiple cuts in what was considered a “mid-cycle adjustment” at the time. Generally, positive U.S. economic data was enough for most investors to expect continued slow growth and an extension of the economic expansion. Global trade tensions prompted a rise in market volatility, which subsided with the passage of a Phase One U.S.-China trade deal late in the calendar year. President Trump was formally impeached and ultimately acquitted by the U.S. Senate. By March, the coronavirus pandemic brought an end to the longest bull market on record.
The municipal bond market was heavily influenced by technical factors throughout the reporting period. Municipal mutual funds saw 61 straight weeks of net inflows, which pushed yields across ratings categories to all-time lows by late February. Low yields and ample demand drove municipal issuance higher but also altered the mix. Taxable municipal bonds as a proportion of new issue municipal debt was at its highest level since 2010 by period-end. Pandemic-related volatility and liquidity pressures prompted record-setting outflows from municipal bonds in March. Strong support by the Fed, including a Municipal Liquidity Facility, and more than $2.5 trillion in fiscal stimulus buoyed markets and bolstered investor confidence. Several weeks of consecutive positive net flows for municipal funds and strong demand for new bonds drove yields back near the lows for highly rated issues. The period ended with the Fed pledging to keep short rates low for the foreseeable future. The fundamental outlook for municipal issuers came into question as the path of recovery from the virus remains extraordinarily uncertain.
Minnesota’s municipal credit fundamentals are solid.
Minnesota state credit ratings are AAA (stable), Aa1 (stable), and AAA (stable) by Standard & Poor’s Financial Services LLC; Moody’s Investors Service, Inc.; and Fitch Ratings Inc., respectively. Minnesota is the 22nd-largest state in terms of population, with 5.6 million people, and 17th by gross domestic product. The outbreak of the coronavirus, the corresponding business closures, and other mitigation efforts had a significant impact on Minnesota’s economy and finances. The state’s most recent projections show an anticipated deficit of $2.4 billion for the current biennium, which is almost a $4 billion change from the February forecast. We note, however, that the state has a substantial rainy-day fund of $2.359 billion, which remains available to mitigate the budgetary impact of the coronavirus pandemic. Additionally, Minnesota has maintained a much better employment situation than national levels, with unemployment at 9.9% compared with 13.3% as of the end of May. Debt and pension liabilities remain manageable, in our view, and the state’s reserves have increased significantly over the past several years. Minnesota’s economy is broad and well diversified.
The credit-quality allocation was the single largest detractor from performance as A-rated and BBB-rated bonds, which we are overweight, underperformed as the flight to quality drove AAA-rated and AA-rated bonds to outperform as the coronavirus pandemic disrupted and disjointed all markets. Lower-tier investment-grade credits deteriorated faster during the contraction,
Please see footnotes on page 7.
8 | Wells Fargo Minnesota Tax-Free Fund
Performance highlights (unaudited)
with credit spread widening that affected A-rated and BBB-rated bonds more at year-end. Some of the worst-performing positions in the Fund were rated BBB, including the Minnesota State Higher Education Facilities Authority Bonds for College of Saint Scholastica, Minnesota State Higher Education Facilities Authority for Saint Catherine University, and Minneapolis Charter School Lease Revenue bonds for Northeast College Prep 2020 rated B+. We would expect these bonds to recover in price as the economy continues to reopen in the second half of 2020.
| Credit quality as of June 30, 20208 |
 |
Security selection and sector allocation drove positive performance while duration, yield-curve positioning, and credit quality detracted.
Sector allocation contributed to performance overall, as we were overweight local GO bonds in the Minnesota Tax-Free Fund, which outperformed. We were underweight revenue bonds, which underperformed. The largest driver of performance was security selection. In many categories, even when the sector underperformed the main index, we outperformed with security selection. Examples include industrial development revenue/pollution control revenue (IDR/PCR) bonds and leasing bonds. Some of the better-performing bonds for the year were Minnesota State GO
Bonds (state GO); Minnetonka, Minnesota, Independent School District No. 276 (local GO); and North Saint Paul Maplewood, Minnesota, Independent School District No. 622.
In anticipation of the Fed continuing to normalize rates, we kept the Fund’s duration short relative to its primary benchmark in the first half of the year, but when the coronavirus pandemic became a U.S. health threat in March 2020, we started extending duration as the Fed cut rates in response to the pandemic as the economy contracted and unemployment surged. With both the Congress Coronavirus Aid, Relief, and Economic Security Act and Treasury supplying liquidity to the market, all rates rallied across the curve. The Fund was still short to its primary benchmark at period-end, which detracted from performance. The Fund’s yield-curve positioning detracted slightly as we were underweight short-term bonds that underperformed; overweight intermediate-term bonds, which had the best risk-adjusted returns but still underperformed; and underweight longer-term bonds, which was the best-performing part of the municipal bond market.
Market technicals are driving performance. We believe issue selection remains critical in state-specific funds.
We believe the U.S. economy will rebound in the second half of 2020 at a slow pace and the recovery will be uneven. Minnesota’s economy is dealing with both the coronavirus crisis and the national problem of police brutality that rocked the nation with riots that engulfed the Twin Cities in May and June. The state’s rebound is expected to be choppy with businesses opening and closing through the phased process over the next year. Prudent debt issuance discipline of cash flow notes should stabilize many municipalities along with continued management improvement. We expect the Fed to be on hold for the balance of 2020 and 2021 to support the recovery of economic growth. Some municipalities may do well while others struggle. That is why we feel credit security selection and sector allocation will remain important. We expect to remain overweight in lower-quality investment-grade bonds. We believe investors are being compensated in adding new investments in some of these areas with additional credit spread premium. In our view, the long-term drivers of valuations will be supply and demand trends, absolute yield levels, the shape of the yield curve, and credit fundamentals. We expect to continue to extend the Fund’s duration slightly. While we expect to continue our bias to overweighting lower-quality investment-grade bonds, it will be issuer dependent, and we plan to add some higher-quality bonds in the AAA and AA areas as opportunities arise. We will monitor the economy to see how the recovery proceeds, with an eye on the technical market and fundamental credit quality to see if any changes are warranted in duration, yield-curve positioning, or credit-quality selections over the next year.
Please see footnotes on page 7.
Wells Fargo Minnesota Tax-Free Fund | 9
As a shareholder of the Fund, you incur two types of costs: (1) transaction costs, including sales charges (loads) on purchase payments and contingent deferred sales charges (if any) on redemptions and (2) ongoing costs, including management fees, distribution (12b-1) and/or shareholder servicing fees, and other Fund expenses. This example is intended to help you understand your ongoing costs (in dollars) of investing in the Fund and to compare these costs with the ongoing costs of investing in other mutual funds.
The example is based on an investment of $1,000 invested at the beginning of the six-month period and held for the entire period from January 1, 2020 to June 30, 2020.
Actual expenses
The “Actual” line of the table below provides information about actual account values and actual expenses. You may use the information in this line, together with the amount you invested, to estimate the expenses that you paid over the period. Simply divide your account value by $1,000 (for example, an $8,600 account value divided by $1,000 = 8.6), then multiply the result by the number in the “Actual” line under the heading entitled “Expenses paid during period” for your applicable class of shares to estimate the expenses you paid on your account during this period.
Hypothetical example for comparison purposes
The “Hypothetical” line of the table below provides information about hypothetical account values and hypothetical expenses based on the Fund’s actual expense ratio and an assumed rate of return of 5% per year before expenses, which is not the Fund’s actual return. The hypothetical account values and expenses may not be used to estimate the actual ending account balance or expenses you paid for the period. You may use this information to compare the ongoing costs of investing in the Fund and other funds. To do so, compare this 5% hypothetical example with the 5% hypothetical examples that appear in the shareholder reports of the other funds.
Please note that the expenses shown in the table are meant to highlight your ongoing costs only and do not reflect any transactional costs, such as sales charges (loads) and contingent deferred sales charges. Therefore, the “Hypothetical” line of the table is useful in comparing ongoing costs only and will not help you determine the relative total costs of owning different funds. In addition, if these transactional costs were included, your costs would have been higher.
| Beginning account value 1-1-2020 | Ending account value 6-30-2020 | Expenses paid during the period1 | Annualized net expense ratio | |||||||||||||
Class A | ||||||||||||||||
Actual | $ | 1,000.00 | $ | 1,012.94 | $ | 4.25 | 0.85 | % | ||||||||
Hypothetical (5% return before expenses) | $ | 1,000.00 | $ | 1,020.64 | $ | 4.27 | 0.85 | % | ||||||||
Class C | ||||||||||||||||
Actual | $ | 1,000.00 | $ | 1,009.16 | $ | 7.99 | 1.60 | % | ||||||||
Hypothetical (5% return before expenses) | $ | 1,000.00 | $ | 1,016.91 | $ | 8.02 | 1.60 | % | ||||||||
Administrator Class | ||||||||||||||||
Actual | $ | 1,000.00 | $ | 1,014.19 | $ | 3.00 | 0.60 | % | ||||||||
Hypothetical (5% return before expenses) | $ | 1,000.00 | $ | 1,021.88 | $ | 3.02 | 0.60 | % | ||||||||
Institutional Class | ||||||||||||||||
Actual | $ | 1,000.00 | $ | 1,014.58 | $ | 2.60 | 0.52 | % | ||||||||
Hypothetical (5% return before expenses) | $ | 1,000.00 | $ | 1,022.28 | $ | 2.61 | 0.52 | % | ||||||||
| 1 | Expenses paid is equal to the annualized net expense ratio of each class multiplied by the average account value over the period, multiplied by the number of days in the most recent fiscal half-year divided by the number of days in the fiscal year (to reflect the one-half-year period). |
10 | Wells Fargo Minnesota Tax-Free Fund
Portfolio of investments—June 30, 2020
| Interest rate | Maturity date | Principal | Value | |||||||||||||
| Municipal Obligations: 98.53% | ||||||||||||||||
Guam: 0.93% | ||||||||||||||||
| Airport Revenue: 0.40% | ||||||||||||||||
Guam Port Authority Series 2018B | 5.00 | % | 7-1-2035 | $ | 605,000 | $ | 688,060 | |||||||||
|
| |||||||||||||||
| Water & Sewer Revenue: 0.53% | ||||||||||||||||
Guam Government Waterworks Authority Water & Wastewater System Project | 5.25 | 7-1-2022 | 865,000 | 931,198 | ||||||||||||
|
| |||||||||||||||
| 1,619,258 | ||||||||||||||||
|
| |||||||||||||||
Illinois: 1.84% | ||||||||||||||||
| GO Revenue: 0.93% | ||||||||||||||||
Illinois Refunding Bond Series 2018A | 5.00 | 10-1-2021 | 500,000 | 513,930 | ||||||||||||
Kane, Cook, & DuPage Counties IL School District #46 Series 2015D | 5.00 | 1-1-2027 | 965,000 | 1,108,274 | ||||||||||||
| 1,622,204 | ||||||||||||||||
|
| |||||||||||||||
| Miscellaneous Revenue: 0.91% | ||||||||||||||||
Illinois Series A | 5.00 | 11-1-2023 | 1,000,000 | 1,060,560 | ||||||||||||
Illinois Series D | 5.00 | 11-1-2021 | 500,000 | 514,845 | ||||||||||||
| 1,575,405 | ||||||||||||||||
|
| |||||||||||||||
| 3,197,609 | ||||||||||||||||
|
| |||||||||||||||
Minnesota: 94.58% | ||||||||||||||||
| Airport Revenue: 2.46% | ||||||||||||||||
Minneapolis & St. Paul MN Metropolitan Airports Commission Series 2014A | 5.00 | 1-1-2032 | 750,000 | 840,053 | ||||||||||||
Minneapolis & St. Paul MN Metropolitan Airports Commission Series 2016C | 5.00 | 1-1-2046 | 1,000,000 | 1,170,270 | ||||||||||||
Minneapolis & St. Paul MN Metropolitan Airports Commission Series 2016D | 5.00 | 1-1-2041 | 250,000 | 288,368 | ||||||||||||
Minneapolis & St. Paul MN Metropolitan Airports Commission Subordinate Bond | 5.00 | 1-1-2029 | 500,000 | 564,965 | ||||||||||||
Minneapolis & St. Paul MN Metropolitan Airports Commission Subordinate Bond | 5.00 | 1-1-2026 | 1,250,000 | 1,406,913 | ||||||||||||
| 4,270,569 | ||||||||||||||||
|
| |||||||||||||||
| Education Revenue: 21.76% | ||||||||||||||||
Brooklyn Park MN Charter School Athlos Leadership Academy Project Series 2015A | 4.00 | 7-1-2020 | 100,000 | 100,000 | ||||||||||||
Brooklyn Park MN Charter School Athlos Leadership Academy Project Series 2015A | 5.50 | 7-1-2040 | 750,000 | 768,068 | ||||||||||||
Cologne MN Charter School Cologne Academy Project Series 2014A | 5.00 | 7-1-2029 | 590,000 | 629,324 | ||||||||||||
Cologne MN Charter School Cologne Academy Project Series 2014A | 5.00 | 7-1-2034 | 500,000 | 522,245 | ||||||||||||
Columbus MN Charter School New Millennium Academy Project Series 2015A | 5.50 | 7-1-2030 | 1,000,000 | 875,760 | ||||||||||||
Deephaven MN Charter School Eagle Ridge Academy Project Series 2015A | 5.25 | 7-1-2040 | 500,000 | 535,300 | ||||||||||||
Deephaven MN Charter School Eagle Ridge Academy Project Series 2016A | 4.00 | 7-1-2025 | 125,000 | 130,761 | ||||||||||||
Deephaven MN Charter School Eagle Ridge Academy Project Series 2016A | 4.00 | 7-1-2026 | 100,000 | 104,090 | ||||||||||||
Deephaven MN Charter School Eagle Ridge Academy Project Series 2016A | 4.00 | 7-1-2027 | 100,000 | 103,574 | ||||||||||||
Deephaven MN Charter School Eagle Ridge Academy Project Series 2016A | 5.25 | 7-1-2037 | 400,000 | 430,508 | ||||||||||||
Forest Lakes MN Charter School Lakes International Language Academy Project | 5.50 | 8-1-2036 | 500,000 | 525,050 | ||||||||||||
Ham Lake MN Charter School DaVinci Academy Project Series 2012A | 4.00 | 7-1-2028 | 370,000 | 385,011 | ||||||||||||
Ham Lake MN Charter School DaVinci Academy Project Series 2016A | 5.00 | 7-1-2031 | 625,000 | 673,250 | ||||||||||||
Hugo MN Charter School Lease Revenue Bonds Noble Academy Project Series 2014A | 5.00 | 7-1-2029 | 600,000 | 631,470 | ||||||||||||
Minneapolis MN Charter School Northeast College Preparatory Project | 5.00 | 7-1-2055 | 700,000 | 673,183 | ||||||||||||
Minneapolis MN Charter School Yinghua Academy Project Series 2013A | 5.00 | 7-1-2023 | 190,000 | 196,004 | ||||||||||||
Minnesota HEFAR Bethel University Series 2017 | 5.00 | 5-1-2037 | 1,250,000 | 1,322,100 | ||||||||||||
Minnesota HEFAR College of St. Scholastica Series 2019 | 4.00 | 12-1-2040 | 1,000,000 | 1,006,320 | ||||||||||||
Minnesota HEFAR College of St. Scholastica Series 7R | 4.25 | 12-1-2027 | 400,000 | 415,532 | ||||||||||||
Minnesota HEFAR Concordia University Series 6Q (U.S. Bank NA LOC) ø | 0.14 | 4-1-2037 | 300,000 | 300,000 | ||||||||||||
The accompanying notes are an integral part of these financial statements.
Wells Fargo Minnesota Tax-Free Fund | 11
Portfolio of investments—June 30, 2020
| Interest rate | Maturity date | Principal | Value | |||||||||||||
| Education Revenue (continued) | ||||||||||||||||
Minnesota HEFAR Hamline University Series 2017B | 5.00 | % | 10-1-2035 | $ | 1,000,000 | $ | 1,058,910 | |||||||||
Minnesota HEFAR Hamline University Series 7E | 4.50 | 10-1-2021 | 300,000 | 303,111 | ||||||||||||
Minnesota HEFAR Hamline University Series 7E | 5.00 | 10-1-2029 | 500,000 | 505,800 | ||||||||||||
Minnesota HEFAR St. Benedict College Series 2017 | 4.00 | 3-1-2036 | 410,000 | 413,760 | ||||||||||||
Minnesota HEFAR St. Catherine University Refunding Bond Series A | 5.00 | 10-1-2025 | 570,000 | 629,177 | ||||||||||||
Minnesota HEFAR St. Catherine University Series A | 5.00 | 10-1-2045 | 2,000,000 | 2,138,900 | ||||||||||||
Minnesota HEFAR St. Thomas University Series 2019 | 4.00 | 10-1-2041 | 515,000 | 567,242 | ||||||||||||
Minnesota HEFAR St. Thomas University Series 2019 | 5.00 | 10-1-2040 | 750,000 | 896,273 | ||||||||||||
Minnesota HEFAR St. Thomas University Series 7U | 5.00 | 4-1-2023 | 750,000 | 819,660 | ||||||||||||
Minnesota HEFAR St. Thomas University Series 8L | 5.00 | 4-1-2028 | 920,000 | 1,072,067 | ||||||||||||
Minnesota HEFAR St. Thomas University Series 8L | 5.00 | 4-1-2029 | 750,000 | 871,253 | ||||||||||||
Minnesota HEFAR St. Thomas University Series 8L | 5.00 | 4-1-2035 | 750,000 | 852,023 | ||||||||||||
Minnesota Office of Higher Education Supplemental Student Loan Program Revenue Bonds | 5.00 | 11-1-2027 | 500,000 | 614,965 | ||||||||||||
Minnesota Office of Higher Education Supplemental Student Loan Program Revenue Bonds Series 2018 | 5.00 | 11-1-2026 | 700,000 | 842,919 | ||||||||||||
Minnesota State Colleges & Universities Revenue Fund & Refunding Bonds | 5.00 | 10-1-2027 | 500,000 | 629,360 | ||||||||||||
Moorhead MN Educational Facilities Bond The Concordia College Corporation Project Series 2016 | 5.00 | 12-1-2025 | 2,000,000 | 2,183,120 | ||||||||||||
Otsego MN Charter School Kaleidoscope Charter School Project Series 2014A | 4.15 | 9-1-2024 | 440,000 | 443,458 | ||||||||||||
Otsego MN Charter School Kaleidoscope Charter School Project Series 2014A | 5.00 | 9-1-2034 | 1,100,000 | 1,118,931 | ||||||||||||
Rice County MN Educational Facilities Shattuck-St. Mary’s School Project 144A | 5.00 | 8-1-2022 | 940,000 | 960,323 | ||||||||||||
St. Cloud MN Charter School Lease Revenue Bonds Stride Academy Project | 5.00 | 4-1-2036 | 750,000 | 510,000 | ||||||||||||
St. Paul MN Housing & RDA Charter School Hmong College Preparatory Academy Project Series 2016A | 5.25 | 9-1-2031 | 1,000,000 | 1,096,800 | ||||||||||||
St. Paul MN Housing & RDA Charter School Lease Revenue German Immersion School Project Series 2013A | 4.00 | 7-1-2023 | 125,000 | 127,455 | ||||||||||||
St. Paul MN Housing & RDA Charter School Lease Revenue Twin Cities Academy Project Series 2015A | 5.00 | 7-1-2035 | 925,000 | 963,545 | ||||||||||||
St. Paul MN Housing & RDA Charter School Twin Cities German Immersion School Project Series 2019 | 5.00 | 7-1-2055 | 750,000 | 788,258 | ||||||||||||
St. Paul MN Housing & RDA Conservatory for Performing Artists Series A | 4.00 | 3-1-2028 | 150,000 | 151,391 | ||||||||||||
St. Paul MN Housing & RDA Hope Community Academy Project Series 2015A | 5.00 | 12-1-2034 | 1,645,000 | 1,711,573 | ||||||||||||
University of Minnesota Series 2017A | 5.00 | 9-1-2042 | 770,000 | 938,599 | ||||||||||||
University of Minnesota Series 2019A | 5.00 | 4-1-2044 | 2,000,000 | 2,522,180 | ||||||||||||
University of Minnesota State Supported Biomedical Science Series 2011B | 5.00 | 8-1-2036 | 1,000,000 | 1,047,410 | ||||||||||||
Woodbury MN Charter School Series A | 3.90 | 12-1-2022 | 220,000 | 226,624 | ||||||||||||
Woodbury MN Charter School Series A | 5.00 | 12-1-2027 | 215,000 | 222,069 | ||||||||||||
Woodbury MN Charter School Series A | 5.00 | 12-1-2032 | 220,000 | 226,655 | ||||||||||||
| 37,781,361 | ||||||||||||||||
|
| |||||||||||||||
| GO Revenue: 16.74% | ||||||||||||||||
Hastings MN Independent School District #200 CAB Series A (State School District Credit Program Insured) ¤ | 0.00 | 2-1-2032 | 1,305,000 | 998,377 | ||||||||||||
Hastings MN Independent School District #200 CAB Series A (State School District Credit Program Insured) ¤ | 0.00 | 2-1-2033 | 1,145,000 | 840,190 | ||||||||||||
Hennepin County MN Series 2016B | 5.00 | 12-1-2029 | 450,000 | 566,883 | ||||||||||||
Hennepin County MN Series 2017C | 5.00 | 12-1-2031 | 2,000,000 | 2,501,040 | ||||||||||||
Long Prairie MN Sewer Revenue Bond Series 2018A (Minnesota Credit Program Insured) | 5.00 | 2-1-2025 | 160,000 | 188,717 | ||||||||||||
Long Prairie MN Sewer Revenue Bond Series 2018A (Minnesota Credit Program Insured) | 5.00 | 2-1-2026 | 185,000 | 223,987 | ||||||||||||
Minnesota Series 2018A | 5.00 | 8-1-2032 | 2,700,000 | 3,509,217 | ||||||||||||
The accompanying notes are an integral part of these financial statements.
12 | Wells Fargo Minnesota Tax-Free Fund
Portfolio of investments—June 30, 2020
| Interest rate | Maturity date | Principal | Value | |||||||||||||
| GO Revenue (continued) | ||||||||||||||||
Minnesota Various Purpose Bonds Series 2015A | 5.00 | % | 8-1-2028 | $ | 3,400,000 | $ | 4,141,064 | |||||||||
North St. Paul Maplewood MN Independent School District #622 Facilities Maintenance Series B (State School District Credit Program Insured) | 4.00 | 2-1-2029 | 2,735,000 | 3,333,418 | ||||||||||||
Rosemount MN Independent School District #196 School Building Series 2016A (State School District Credit Program Insured) | 5.00 | 2-1-2027 | 1,500,000 | 1,840,725 | ||||||||||||
Roseville MN Independent School District #623 School Building Series A (State School District Credit Program Insured) | 5.00 | 2-1-2031 | 2,090,000 | 2,587,754 | ||||||||||||
Sartell MN Independent School District #748 St. Stephen Public Schools GO Series 2016A (State School District Credit Program Insured) | 5.00 | 2-1-2027 | 1,250,000 | 1,499,813 | ||||||||||||
Shakopee MN Independent School District #720 Series A (State School District Credit Program Insured) | 5.00 | 2-1-2023 | 1,000,000 | 1,108,770 | ||||||||||||
Shakopee MN Independent School District #720 Series B (State School District Credit Program Insured) | 5.00 | 2-1-2025 | 405,000 | 478,086 | ||||||||||||
St. Cloud MN Series A | 4.00 | 2-1-2028 | 460,000 | 549,364 | ||||||||||||
St. Cloud MN Series A | 4.00 | 2-1-2029 | 475,000 | 564,666 | ||||||||||||
St. Cloud MN Series A | 4.00 | 2-1-2030 | 495,000 | 585,164 | ||||||||||||
St. Francis MN Independent School District #15 Series A (State School District Credit Program Insured) | 5.00 | 2-1-2027 | 485,000 | 540,135 | ||||||||||||
St. Francis MN Independent School District #15 Series A (State School District Credit Program Insured) | 5.00 | 2-1-2028 | 220,000 | 244,649 | ||||||||||||
Willmar MN Rice Memorial Hospital Project Series 2012A | 5.00 | 2-1-2026 | 1,000,000 | 1,025,870 | ||||||||||||
Worthington MN Independent School District #518 School Building Series A (State School District Credit Program Insured) | 4.00 | 2-1-2030 | 440,000 | 508,600 | ||||||||||||
Worthington MN Independent School District #518 School Building Series A (State School District Credit Program Insured) | 4.00 | 2-1-2032 | 530,000 | 603,914 | ||||||||||||
Worthington MN Independent School District #518 School Building Series A (State School District Credit Program Insured) | 4.00 | 2-1-2033 | 555,000 | 627,971 | ||||||||||||
| 29,068,374 | ||||||||||||||||
|
| |||||||||||||||
| Health Revenue: 19.05% | ||||||||||||||||
Center City MN Health Care Facilities Hazelden Betty Ford Foundation Project Series 2014 | 5.00 | 11-1-2026 | 750,000 | 843,930 | ||||||||||||
Center City MN Health Care Facilities Hazelden Betty Ford Foundation Project Series 2014 | 5.00 | 11-1-2027 | 500,000 | 560,660 | ||||||||||||
Center City MN Health Care Facilities Hazelden Betty Ford Foundation Project Series 2014 | 5.00 | 11-1-2029 | 300,000 | 333,492 | ||||||||||||
Duluth MN EDA Health Care Facilities Essentia Health Series A | 5.00 | 2-15-2048 | 650,000 | 743,126 | ||||||||||||
Duluth MN EDA Health Care Facilities Essentia Health Series A | 5.25 | 2-15-2053 | 2,500,000 | 2,891,875 | ||||||||||||
Glencoe MN HCFR Glencoe Regional Health Services Project Series 2013 | 4.00 | 4-1-2022 | 735,000 | 773,095 | ||||||||||||
Maple Grove MN HCFR Maple Grove Hospital Corporation | 5.00 | 5-1-2030 | 850,000 | 995,393 | ||||||||||||
Maple Grove MN HCFR North Memorial Health Care Series 2015 | 5.00 | 9-1-2023 | 655,000 | 726,474 | ||||||||||||
Maple Grove MN HCFR Series 2017 | 5.00 | 5-1-2031 | 500,000 | 582,715 | ||||||||||||
Maple Grove MN HCFR Series 2017 | 5.00 | 5-1-2032 | 500,000 | 579,445 | ||||||||||||
Minneapolis & St. Paul MN Housing & RDA Allina Health System | 5.00 | 11-15-2029 | 1,000,000 | 1,317,750 | ||||||||||||
Minneapolis & St. Paul MN Housing & RDA Allina Health System Series 2017A | 5.00 | 11-15-2029 | 1,000,000 | 1,239,130 | ||||||||||||
Minneapolis & St. Paul MN Housing & RDA Children’s Health Care Facilities Series A | 5.25 | 8-15-2025 | 1,000,000 | 1,005,780 | ||||||||||||
Minneapolis & St. Paul MN Housing & RDA Children’s Health Care Facilities Series A | 5.25 | 8-15-2035 | 1,000,000 | 1,005,780 | ||||||||||||
Minneapolis MN Health Care System Fairview Health Services Series 2015A | 5.00 | 11-15-2033 | 2,000,000 | 2,280,960 | ||||||||||||
Minneapolis MN Health Care System Revenue Refunded Bond Fairview Health Services Series A | 5.00 | 11-15-2049 | 1,000,000 | 1,160,540 | ||||||||||||
Plato MN Health Care Facilities Bond Glencoe Regional Health Services Project Series 2017 | 5.00 | 4-1-2041 | 550,000 | 624,179 | ||||||||||||
Red Wing MN Senior Housing Deer Crest Project Series A | 5.00 | 11-1-2032 | 660,000 | 664,567 | ||||||||||||
Red Wing MN Senior Housing Deer Crest Project Series A | 5.00 | 11-1-2042 | 560,000 | 562,402 | ||||||||||||
Rochester MN Healthcare Facilities Mayo Clinic ø | 0.10 | 11-15-2047 | 1,700,000 | 1,700,000 | ||||||||||||
The accompanying notes are an integral part of these financial statements.
Wells Fargo Minnesota Tax-Free Fund | 13
Portfolio of investments—June 30, 2020
| Interest rate | Maturity date | Principal | Value | |||||||||||||
| Health Revenue (continued) | ||||||||||||||||
Shakopee MN Senior Housing Revenue Benedictine Living Community LLC | 5.85 | % | 11-1-2058 | $ | 750,000 | $ | 734,513 | |||||||||
Shakopee MN St. Francis Regional Medical Center Series 2014 | 5.00 | 9-1-2027 | 700,000 | 797,678 | ||||||||||||
Shakopee MN St. Francis Regional Medical Center Series 2014 | 5.00 | 9-1-2029 | 725,000 | 819,301 | ||||||||||||
St. Cloud MN Health Care Revenue Bonds Series 2016A | 5.00 | 5-1-2030 | 2,000,000 | 2,345,320 | ||||||||||||
St. Cloud MN Health Care Revenue Bonds Series 2016A | 5.00 | 5-1-2031 | 2,000,000 | 2,335,480 | ||||||||||||
St. Cloud MN Health Care Unrefunded Revenue Bonds CentraCare Health | 5.13 | 5-1-2030 | 125,000 | 125,360 | ||||||||||||
St. Paul MN Housing & RDA Fairview Health Services Series 2017A | 5.00 | 11-15-2034 | 565,000 | 663,016 | ||||||||||||
St. Paul MN Housing & RDA Healthfirst Care Systems Project Series 2015A | 5.00 | 11-15-2027 | 1,000,000 | 1,237,510 | ||||||||||||
St. Paul MN Housing & RDA HealthPartners Obligation Group | 5.00 | 7-1-2025 | 520,000 | 612,165 | ||||||||||||
St. Paul MN Housing & RDA HealthPartners Obligation Group | 5.00 | 7-1-2031 | 2,010,000 | 2,315,420 | ||||||||||||
Winona MN Health Care Facilities Refunding Bond Series 2012 | 5.00 | 7-1-2034 | 500,000 | 512,815 | ||||||||||||
| 33,089,871 | ||||||||||||||||
|
| |||||||||||||||
| Housing Revenue: 5.54% | ||||||||||||||||
Brooklyn Park MN MFHR Amorce I Limited Partnership Project Series 2019A (GNMA Insured) øø | 1.25 | 1-1-2022 | 1,735,000 | 1,740,326 | ||||||||||||
Dakota County MN Community Development Agency Single-Family Mortgage Revenue (GNMA/FNMA/FHLMC Insured) | 5.30 | 12-1-2039 | 3,286 | 3,289 | ||||||||||||
Minneapolis MN Student Housing Riverton Community Housing Project | 5.00 | 8-1-2032 | 860,000 | 870,716 | ||||||||||||
Minnesota HFA Series D (SIFMA Municipal Swap +0.43%) (GNMA/FNMA/FHLMC Insured) ± | 0.56 | 1-1-2045 | 1,000,000 | 997,000 | ||||||||||||
Minnesota Housing Finance Agency Rental Bond Series 2019C | 1.60 | 8-1-2021 | 1,475,000 | 1,479,410 | ||||||||||||
Minnesota Housing Finance Agency Residential Housing Series 2012D (GNMA/FNMA/FHLMC Insured) | 4.00 | 7-1-2040 | 85,000 | 86,576 | ||||||||||||
Minnesota Housing Finance Agency Residential Housing Series E (GNMA/FNMA/FHLMC Insured) | 1.75 | 1-1-2028 | 835,000 | 855,508 | ||||||||||||
Minnesota Housing Finance Agency Residential Housing Series E (GNMA/FNMA/FHLMC Insured) | 1.75 | 7-1-2028 | 650,000 | 665,782 | ||||||||||||
Minnesota Housing Finance Agency State Appropriation Bonds Series 2015A | 5.00 | 8-1-2027 | 1,665,000 | 1,948,450 | ||||||||||||
Minnesota Housing Finance Agency State Appropriation Bonds Series 2015A | 5.00 | 8-1-2032 | 500,000 | 577,700 | ||||||||||||
Oak Park Heights MN Boutwells Landing Project Series 2005 (FHLMC LIQ) ø | 0.13 | 11-1-2035 | 395,000 | 395,000 | ||||||||||||
| 9,619,757 | ||||||||||||||||
|
| |||||||||||||||
| Miscellaneous Revenue: 17.09% | ||||||||||||||||
Anoka Hennepin MN Independent School District #11 Certificate of Participation Series 2014A | 5.00 | 2-1-2034 | 1,000,000 | 1,144,800 | ||||||||||||
Center City MN Heath Care Facilities Hazelden Betty Ford Foundation Project Series 2019 | 4.00 | 11-1-2030 | 250,000 | 281,740 | ||||||||||||
Center City MN Heath Care Facilities Hazelden Betty Ford Foundation Project Series 2019 | 4.00 | 11-1-2031 | 250,000 | 279,600 | ||||||||||||
Center City MN Heath Care Facilities Hazelden Betty Ford Foundation Project Series 2019 | 4.00 | 11-1-2034 | 300,000 | 329,601 | ||||||||||||
Duluth MN Independent School District #709 Certificate of Participation | 4.00 | 3-1-2026 | 700,000 | 687,673 | ||||||||||||
Duluth MN Independent School District #709 Certificate of Participation Series 2019B (State School District Credit Program Insured) | 5.00 | 2-1-2026 | 395,000 | 477,527 | ||||||||||||
Duluth MN Independent School District #709 Certificate of Participation Series 2019B (State School District Credit Program Insured) | 5.00 | 2-1-2028 | 700,000 | 887,096 | ||||||||||||
Goodhue County MN Education District #6051 Red Wing Certificate of Participation Series 2014A | 5.00 | 2-1-2029 | 750,000 | 852,060 | ||||||||||||
Minneapolis & St. Paul MN Housing & RDA Children’s Hospital Clinics Series A (AGM Insured, U.S. Bank NA LIQ, U.S. Bank NA SPA) øø | 0.12 | 8-15-2037 | 2,000,000 | 2,000,000 | ||||||||||||
Minneapolis MN Development Limited Tax Supported Common Bond Series 2A | 6.00 | 12-1-2040 | 1,000,000 | 1,022,830 | ||||||||||||
Minnesota General Fund Appropriation Bonds Series 2012B | 5.00 | 3-1-2027 | 2,000,000 | 2,145,500 | ||||||||||||
The accompanying notes are an integral part of these financial statements.
14 | Wells Fargo Minnesota Tax-Free Fund
Portfolio of investments—June 30, 2020
| Interest rate | Maturity date | Principal | Value | |||||||||||||
| Miscellaneous Revenue (continued) | ||||||||||||||||
Minnesota General Fund Appropriation Bonds Series 2012B | 5.00 | % | 3-1-2029 | $ | 2,000,000 | $ | 2,142,740 | |||||||||
Minnesota General Fund Appropriation Bonds Series 2014A | 5.00 | 6-1-2033 | 1,000,000 | 1,095,800 | ||||||||||||
Minnesota Legislative Office Facility Project Certificate of Participation Series 2014 | 5.00 | 6-1-2023 | 435,000 | 493,312 | ||||||||||||
Minnetonka MN Independent School District #276 Certificate of Participation Series 2016F | 5.00 | 2-1-2025 | 205,000 | 228,136 | ||||||||||||
Minnetonka MN Independent School District #276 Certificate of Participation Series 2018C | 5.75 | 2-1-2042 | 2,145,000 | 2,658,728 | ||||||||||||
Northeastern Minnesota Metropolitan Intermediate School District #916 Certificate of Participation Series 2013A | 4.00 | 2-1-2024 | 1,100,000 | 1,191,421 | ||||||||||||
Northeastern Minnesota Metropolitan Intermediate School District #916 Certificate of Participation Series 2015B | 5.00 | 2-1-2034 | 1,500,000 | 1,739,985 | ||||||||||||
Plymouth MN Intermediate School District #287 Certificate of Participation | 4.00 | 5-1-2026 | 500,000 | 568,585 | ||||||||||||
Plymouth MN Intermediate School District #287 Certificate of Participation | 4.00 | 5-1-2027 | 1,000,000 | 1,129,180 | ||||||||||||
Plymouth MN Intermediate School District #287 Certificate of Participation | 4.00 | 2-1-2023 | 230,000 | 248,349 | ||||||||||||
Plymouth MN Intermediate School District #287 Certificate of Participation | 4.00 | 2-1-2024 | 130,000 | 143,913 | ||||||||||||
Plymouth MN Intermediate School District #287 Certificate of Participation | 4.00 | 2-1-2025 | 215,000 | 242,744 | ||||||||||||
St. Cloud MN Independent School District #742 Certificate of Participation | 5.00 | 2-1-2032 | 500,000 | 586,060 | ||||||||||||
St. Cloud MN Independent School District #742 Certificate of Participation | 5.00 | 2-1-2034 | 350,000 | 408,538 | ||||||||||||
St. Cloud MN Infrastructure Management Series B | 4.00 | 2-1-2028 | 245,000 | 292,596 | ||||||||||||
St. Cloud MN Infrastructure Management Series B | 4.00 | 2-1-2029 | 255,000 | 303,136 | ||||||||||||
St. Cloud MN Infrastructure Management Series B | 4.00 | 2-1-2030 | 260,000 | 307,359 | ||||||||||||
St. Paul MN Housing & RDA Charter School Nova Classical Academy Project | 6.63 | 9-1-2042 | 865,000 | 927,142 | ||||||||||||
St. Paul MN Independent School District Series C (State School District Credit Program Insured) | 5.00 | 2-1-2030 | 2,965,000 | 3,711,884 | ||||||||||||
White Bear Lake MN Refunding Bonds YMCA of Greater Twin Cities Project Series 2018 | 5.00 | 6-1-2032 | 1,000,000 | 1,155,440 | ||||||||||||
| 29,683,475 | ||||||||||||||||
|
| |||||||||||||||
| Resource Recovery Revenue: 0.81% | ||||||||||||||||
Douglas County MN Refunding Bond Solid Waste Series A | 5.00 | 8-1-2030 | 1,055,000 | 1,413,795 | ||||||||||||
|
| |||||||||||||||
| Tax Revenue: 0.96% | ||||||||||||||||
Hennepin County MN Series 2019B | 5.00 | 12-15-2031 | 1,260,000 | 1,669,777 | ||||||||||||
|
| |||||||||||||||
| Transportation Revenue: 0.99% | ||||||||||||||||
St. Paul MN Housing & RDA Parking Enterprise Refunding Bonds Series 2017A | 4.00 | 8-1-2026 | 525,000 | 565,987 | ||||||||||||
St. Paul MN Housing & RDA Parking Enterprise Refunding Bonds Series 2017A | 4.00 | 8-1-2027 | 545,000 | 585,548 | ||||||||||||
St. Paul MN Housing & RDA Parking Enterprise Refunding Bonds Series 2017A | 5.00 | 8-1-2025 | 500,000 | 567,365 | ||||||||||||
| 1,718,900 | ||||||||||||||||
|
| |||||||||||||||
| Utilities Revenue: 9.18% | ||||||||||||||||
Central Minnesota Municipal Power Agency Brookings Southeast Twin Cities Transmission Project Series 2012 | 5.00 | 1-1-2042 | 1,500,000 | 1,594,590 | ||||||||||||
Hutchinson MN Public Utility Revenue Refunding Bonds Series 2012A | 5.00 | 12-1-2026 | 700,000 | 773,703 | ||||||||||||
Minnesota Municipal Power Agency Series A | 5.00 | 10-1-2025 | 2,335,000 | 2,361,189 | ||||||||||||
Northern Minnesota Municipal Power Agency Series 2013A | 4.00 | 1-1-2028 | 450,000 | 480,290 | ||||||||||||
Northern Minnesota Municipal Power Agency Series 2016 | 5.00 | 1-1-2030 | 520,000 | 623,100 | ||||||||||||
Northern Minnesota Municipal Power Agency Series 2016 | 5.00 | 1-1-2031 | 350,000 | 417,137 | ||||||||||||
Northern Minnesota Municipal Power Agency Series 2017 | 5.00 | 1-1-2041 | 400,000 | 472,984 | ||||||||||||
The accompanying notes are an integral part of these financial statements.
Wells Fargo Minnesota Tax-Free Fund | 15
Portfolio of investments—June 30, 2020
| Interest rate | Maturity date | Principal | Value | |||||||||||||
| Utilities Revenue (continued) | ||||||||||||||||
Rochester MN Electric Utility Revenue Series 2013B | 5.00 | % | 12-1-2025 | $ | 315,000 | $ | 362,127 | |||||||||
Rochester MN Electric Utility Revenue Series 2013B | 5.00 | 12-1-2026 | 250,000 | 286,853 | ||||||||||||
Rochester MN Electric Utility Revenue Series 2017A | 5.00 | 12-1-2037 | 500,000 | 604,495 | ||||||||||||
Southern Minnesota Municipal Power Agency Badger Coulee Project Series 2019A | 5.00 | 1-1-2032 | 700,000 | 922,971 | ||||||||||||
Southern Minnesota Municipal Power Agency Badger Coulee Project Series 2019A | 5.00 | 1-1-2033 | 560,000 | 733,141 | ||||||||||||
Southern Minnesota Municipal Power Agency Badger Coulee Project Series 2019A | 5.00 | 1-1-2034 | 615,000 | 801,382 | ||||||||||||
Western Minnesota Municipal Power Agency Series A | 5.00 | 1-1-2027 | 1,565,000 | 1,737,760 | ||||||||||||
Western Minnesota Municipal Power Agency Series A | 5.00 | 1-1-2030 | 1,000,000 | 1,105,910 | ||||||||||||
Western Minnesota Municipal Power Agency Series A | 5.00 | 1-1-2031 | 1,000,000 | 1,213,080 | ||||||||||||
Western Minnesota Municipal Power Agency Series A | 5.00 | 1-1-2032 | 1,250,000 | 1,449,488 | ||||||||||||
| 15,940,200 | ||||||||||||||||
|
| |||||||||||||||
| 164,256,079 | ||||||||||||||||
|
| |||||||||||||||
New York: 0.88% |
| |||||||||||||||
| GO Revenue: 0.88% | ||||||||||||||||
Suffolk County NY Series A | 5.00 | 3-19-2021 | 1,500,000 | 1,534,860 | ||||||||||||
|
| |||||||||||||||
Virgin Islands: 0.30% |
| |||||||||||||||
| Tax Revenue: 0.30% | ||||||||||||||||
Virgin Islands PFA Matching Fund Loan Notes Senior Lien Series B (AGM Insured) | 5.00 | 10-1-2025 | 500,000 | 519,195 | ||||||||||||
|
| |||||||||||||||
Total Municipal Obligations (Cost $164,270,513) |
| 171,127,001 | ||||||||||||||
|
| |||||||||||||||
| Total investments in securities (Cost $164,270,513) | 98.53 | % | 171,127,001 | |||||
Other assets and liabilities, net | 1.47 | 2,547,158 | ||||||
|
|
|
| |||||
| Total net assets | 100.00 | % | $ | 173,674,159 | ||||
|
|
|
| |||||
| ø | Variable rate demand notes are subject to a demand feature which reduces the effective maturity. The maturity date shown represents the final maturity date of the security. The interest rate is determined and reset by the issuer daily, weekly, or monthly depending upon the terms of the security. The rate shown is the rate in effect at period end. |
| 144A | The security may be resold in transactions exempt from registration, normally to qualified institutional buyers, pursuant to Rule 144A under the Securities Act of 1933. |
| ¤ | The security is issued in zero coupon form with no periodic interest payments. |
| øø | The interest rate is determined and reset by the issuer periodically depending upon the terms of the security. The rate shown is the rate in effect at period end. |
| ± | Variable rate investment. The rate shown is the rate in effect at period end. |
Abbreviations:
| AGC | Assured Guaranty Corporation |
| AGM | Assured Guaranty Municipal |
| CAB | Capital appreciation bond |
| EDA | Economic Development Authority |
| FHLMC | Federal Home Loan Mortgage Corporation |
| FNMA | Federal National Mortgage Association |
| GNMA | Government National Mortgage Association |
| GO | General obligation |
| HCFR | Healthcare facilities revenue |
| HEFAR | Higher Education Facilities Authority Revenue |
| HFA | Housing Finance Authority |
| LIQ | Liquidity agreement |
| LOC | Letter of credit |
| MFHR | Multifamily housing revenue |
| PFA | Public Finance Authority |
| RDA | Redevelopment Authority |
| SIFMA | Securities Industry and Financial Markets Association |
| SPA | Standby purchase agreement |
The accompanying notes are an integral part of these financial statements.
16 | Wells Fargo Minnesota Tax-Free Fund
Statement of assets and liabilities—June 30, 2020
Assets |
| |||
Investments in unaffiliated securities, at value (cost $164,270,513) | $ | 171,127,001 | ||
Cash | 225,703 | |||
Receivable for investments sold | 135,056 | |||
Receivable for Fund shares sold | 86,429 | |||
Receivable for interest | 2,326,445 | |||
Prepaid expenses and other assets | 82,354 | |||
|
| |||
Total assets | 173,982,988 | |||
|
| |||
Liabilities |
| |||
Payable for Fund shares redeemed | 171,060 | |||
Management fee payable | 35,046 | |||
Dividends payable | 59,749 | |||
Administration fees payable | 14,644 | |||
Distribution fee payable | 2,507 | |||
Shareholder servicing fees payable | 20,960 | |||
Trustees’ fees and expenses payable | 3,872 | |||
Accrued expenses and other liabilities | 991 | |||
|
| |||
Total liabilities | 308,829 | |||
|
| |||
Total net assets | $ | 173,674,159 | ||
|
| |||
Net assets consist of |
| |||
Paid-in capital | $ | 165,997,235 | ||
Total distributable earnings | 7,676,924 | |||
|
| |||
Total net assets | $ | 173,674,159 | ||
|
| |||
Computation of net asset value and offering price per share |
| |||
Net assets – Class A | $ | 29,316,859 | ||
Shares outstanding – Class A1 | 2,698,962 | |||
Net asset value per share – Class A2 | $10.86 | |||
Maximum offering price per share – Class A | $11.37 | |||
Net assets – Class C | $ | 4,020,456 | ||
Shares outstanding – Class C1 | 370,165 | |||
Net asset value per share – Class C | $10.86 | |||
Net assets – Administrator Class | $ | 69,954,165 | ||
Shares outstanding – Administrator Class1 | 6,442,163 | |||
Net asset value per share – Administrator Class | $10.86 | |||
Net assets – Institutional Class | $ | 70,382,679 | ||
Shares outstanding – Institutional Class1 | 6,476,600 | |||
Net asset value per share – Institutional Class | $10.87 | |||
| 1 | The Fund has an unlimited number of authorized shares. |
| 2 | Maximum offering price is computed as 100/95.50 of net asset value. On investments of $50,000 or more, the offering price is reduced. |
The accompanying notes are an integral part of these financial statements.
Wells Fargo Minnesota Tax-Free Fund | 17
Statement of operations—year ended June 30, 2020
Investment income |
| |||
Interest | $ | 5,134,129 | ||
|
| |||
Expenses |
| |||
Management fee | 692,788 | |||
Administration fees | ||||
Class A | 46,146 | |||
Class C | 7,501 | |||
Administrator Class | 80,874 | |||
Institutional Class | 47,034 | |||
Shareholder servicing fees | ||||
Class A | 72,092 | |||
Class C | 11,716 | |||
Administrator Class | 202,042 | |||
Distribution fee | ||||
Class C | 35,149 | |||
Custody and accounting fees | 6,875 | |||
Professional fees | 51,541 | |||
Registration fees | 95,324 | |||
Shareholder report expenses | 28,046 | |||
Trustees’ fees and expenses | 21,541 | |||
Other fees and expenses | 9,163 | |||
|
| |||
Total expenses | 1,407,832 | |||
Less: Fee waivers and/or expense reimbursements | ||||
Fund-level | (142,947 | ) | ||
Class A | (311 | ) | ||
Administrator Class | (154,709 | ) | ||
|
| |||
Net expenses | 1,109,865 | |||
|
| |||
Net investment income | 4,024,264 | |||
|
| |||
Realized and unrealized gains (losses) on investments | ||||
Net realized gains on investments | 22,567 | |||
Net change in unrealized gains (losses) on investments | 1,163,068 | |||
|
| |||
Net realized and unrealized gains (losses) on investments | 1,185,635 | |||
|
| |||
Net increase in net assets resulting from operations | $ | 5,209,899 | ||
|
| |||
The accompanying notes are an integral part of these financial statements.
18 | Wells Fargo Minnesota Tax-Free Fund
Statement of changes in net assets
| Year ended June 30, 2020 | Year ended June 30, 2019 | |||||||||||||||
Operations | ||||||||||||||||
Net investment income | $ | 4,024,264 | $ | 4,184,838 | ||||||||||||
Net realized gains on investments | 22,567 | 42,540 | ||||||||||||||
Net change in unrealized gains (losses) on investments | 1,163,068 | 3,698,165 | ||||||||||||||
|
| |||||||||||||||
Net increase in net assets resulting from operations | 5,209,899 | 7,925,543 | ||||||||||||||
|
| |||||||||||||||
Distributions to shareholders from net investment income and net realized gains | ||||||||||||||||
Class A | (610,435 | ) | (711,001 | ) | ||||||||||||
Class C | (64,198 | ) | (117,484 | ) | ||||||||||||
Administrator Class | (1,922,632 | ) | (2,451,244 | ) | ||||||||||||
Institutional Class | (1,426,999 | ) | (905,109 | ) | ||||||||||||
|
| |||||||||||||||
Total distributions to shareholders | (4,024,264 | ) | (4,184,838 | ) | ||||||||||||
|
| |||||||||||||||
Capital share transactions | Shares | Shares | ||||||||||||||
Proceeds from shares sold | ||||||||||||||||
Class A | 370,531 | 4,040,818 | 347,091 | 3,649,133 | ||||||||||||
Class C | 26,763 | 287,731 | 7,412 | 78,298 | ||||||||||||
Administrator Class | 2,134,245 | 23,116,572 | 3,125,314 | 32,846,044 | ||||||||||||
Institutional Class | 4,681,191 | 50,627,321 | 1,422,688 | 14,957,048 | ||||||||||||
|
| |||||||||||||||
| 78,072,442 | 51,530,523 | |||||||||||||||
|
| |||||||||||||||
Reinvestment of distributions | ||||||||||||||||
Class A | 56,114 | 607,757 | 67,230 | 708,091 | ||||||||||||
Class C | 5,926 | 64,198 | 11,169 | 117,470 | ||||||||||||
Administrator Class | 150,724 | 1,632,339 | 163,889 | 1,727,163 | ||||||||||||
Institutional Class | 93,088 | 1,009,049 | 85,728 | 904,258 | ||||||||||||
|
| |||||||||||||||
| 3,313,343 | 3,456,982 | |||||||||||||||
|
| |||||||||||||||
Payment for shares redeemed | ||||||||||||||||
Class A | (272,388 | ) | (2,943,523 | ) | (680,950 | ) | (7,140,320 | ) | ||||||||
Class C | (150,576 | ) | (1,631,910 | ) | (233,266 | ) | (2,454,511 | ) | ||||||||
Administrator Class | (4,676,308 | ) | (50,444,414 | ) | (2,569,156 | ) | (26,934,068 | ) | ||||||||
Institutional Class | (1,604,815 | ) | (17,232,329 | ) | (1,018,861 | ) | (10,683,211 | ) | ||||||||
|
| |||||||||||||||
| (72,252,176 | ) | (47,212,110 | ) | |||||||||||||
|
| |||||||||||||||
Net increase in net assets resulting from capital share transactions | 9,133,609 | 7,775,395 | ||||||||||||||
|
| |||||||||||||||
Total increase in net assets | 10,319,244 | 11,516,100 | ||||||||||||||
|
| |||||||||||||||
Net assets | ||||||||||||||||
Beginning of period | 163,354,915 | 151,838,815 | ||||||||||||||
|
| |||||||||||||||
End of period | $ | 173,674,159 | $ | 163,354,915 | ||||||||||||
|
| |||||||||||||||
The accompanying notes are an integral part of these financial statements.
Wells Fargo Minnesota Tax-Free Fund | 19
(For a share outstanding throughout each period)
| Year ended June 30 | ||||||||||||||||||||
| CLASS A | 2020 | 2019 | 2018 | 2017 | 2016 | |||||||||||||||
Net asset value, beginning of period | $10.77 | $10.51 | $10.68 | $11.07 | $10.79 | |||||||||||||||
Net investment income | 0.23 | 0.27 | 1 | 0.28 | 1 | 0.28 | 1 | 0.33 | ||||||||||||
Net realized and unrealized gains (losses) on investments | 0.09 | 0.26 | (0.16 | ) | (0.34 | ) | 0.28 | |||||||||||||
|
|
|
|
|
|
|
|
|
| |||||||||||
Total from investment operations | 0.32 | 0.53 | 0.12 | (0.06 | ) | 0.61 | ||||||||||||||
Distributions to shareholders from | ||||||||||||||||||||
Net investment income | (0.23 | ) | (0.27 | ) | (0.28 | ) | (0.28 | ) | (0.33 | ) | ||||||||||
Net realized gains | 0.00 | 0.00 | (0.01 | ) | (0.05 | ) | (0.00 | )2 | ||||||||||||
|
|
|
|
|
|
|
|
|
| |||||||||||
Total distributions to shareholders | (0.23 | ) | (0.27 | ) | (0.29 | ) | (0.33 | ) | (0.33 | ) | ||||||||||
Net asset value, end of period | $10.86 | $10.77 | $10.51 | $10.68 | $11.07 | |||||||||||||||
Total return3 | 2.99 | % | 5.13 | % | 1.10 | % | (0.53 | )% | 5.74 | % | ||||||||||
Ratios to average net assets (annualized) | ||||||||||||||||||||
Gross expenses | 0.93 | % | 0.94 | % | 0.85 | % | 0.91 | % | 0.89 | % | ||||||||||
Net expenses | 0.85 | % | 0.85 | % | 0.84 | % | 0.85 | % | 0.85 | % | ||||||||||
Net investment income | 2.12 | % | 2.57 | % | 2.64 | % | 2.63 | % | 2.99 | % | ||||||||||
Supplemental data | ||||||||||||||||||||
Portfolio turnover rate | 16 | % | 18 | % | 15 | % | 22 | % | 16 | % | ||||||||||
Net assets, end of period (000s omitted) | $29,317 | $27,399 | $29,554 | $34,720 | $45,437 | |||||||||||||||
| 1 | Calculated based upon average shares outstanding |
| 2 | Amount is less than $0.005. |
| 3 | Total return calculations do not include any sales charges. |
The accompanying notes are an integral part of these financial statements.
20 | Wells Fargo Minnesota Tax-Free Fund
Financial highlights
(For a share outstanding throughout each period)
| Year ended June 30 | ||||||||||||||||||||
| CLASS C | 2020 | 2019 | 2018 | 2017 | 2016 | |||||||||||||||
Net asset value, beginning of period | $10.77 | $10.51 | $10.68 | $11.07 | $10.79 | |||||||||||||||
Net investment income | 0.15 | 1 | 0.19 | 1 | 0.20 | 0.20 | 0.24 | |||||||||||||
Net realized and unrealized gains (losses) on investments | 0.09 | 0.26 | (0.16 | ) | (0.34 | ) | 0.28 | |||||||||||||
|
|
|
|
|
|
|
|
|
| |||||||||||
Total from investment operations | 0.24 | 0.45 | 0.04 | (0.14 | ) | 0.52 | ||||||||||||||
Distributions to shareholders from | ||||||||||||||||||||
Net investment income | (0.15 | ) | (0.19 | ) | (0.20 | ) | (0.20 | ) | (0.24 | ) | ||||||||||
Net realized gains | 0.00 | 0.00 | (0.01 | ) | (0.05 | ) | (0.00 | )2 | ||||||||||||
|
|
|
|
|
|
|
|
|
| |||||||||||
Total distributions to shareholders | (0.15 | ) | (0.19 | ) | (0.21 | ) | (0.25 | ) | (0.24 | ) | ||||||||||
Net asset value, end of period | $10.86 | $10.77 | $10.51 | $10.68 | $11.07 | |||||||||||||||
Total return3 | 2.22 | % | 4.35 | % | 0.34 | % | (1.27 | )% | 4.95 | % | ||||||||||
Ratios to average net assets (annualized) | ||||||||||||||||||||
Gross expenses | 1.68 | % | 1.69 | % | 1.59 | % | 1.65 | % | 1.64 | % | ||||||||||
Net expenses | 1.60 | % | 1.60 | % | 1.59 | % | 1.60 | % | 1.60 | % | ||||||||||
Net investment income | 1.37 | % | 1.83 | % | 1.89 | % | 1.88 | % | 2.24 | % | ||||||||||
Supplemental data | ||||||||||||||||||||
Portfolio turnover rate | 16 | % | 18 | % | 15 | % | 22 | % | 16 | % | ||||||||||
Net assets, end of period (000s omitted) | $4,020 | $5,254 | $7,387 | $9,525 | $10,358 | |||||||||||||||
| 1 | Calculated based upon average shares outstanding |
| 2 | Amount is less than $0.005. |
| 3 | Total return calculations do not include any sales charges. |
The accompanying notes are an integral part of these financial statements.
Wells Fargo Minnesota Tax-Free Fund | 21
Financial highlights
(For a share outstanding throughout each period)
| Year ended June 30 | ||||||||||||||||||||
| ADMINISTRATOR CLASS | 2020 | 2019 | 2018 | 2017 | 2016 | |||||||||||||||
Net asset value, beginning of period | $10.76 | $10.51 | $10.68 | $11.07 | $10.78 | |||||||||||||||
Net investment income | 0.26 | 1 | 0.30 | 1 | 0.31 | 1 | 0.31 | 1 | 0.35 | |||||||||||
Net realized and unrealized gains (losses) on investments | 0.10 | 0.25 | (0.16 | ) | (0.34 | ) | 0.29 | |||||||||||||
|
|
|
|
|
|
|
|
|
| |||||||||||
Total from investment operations | 0.36 | 0.55 | 0.15 | (0.03 | ) | 0.64 | ||||||||||||||
Distributions to shareholders from | ||||||||||||||||||||
Net investment income | (0.26 | ) | (0.30 | ) | (0.31 | ) | (0.31 | ) | (0.35 | ) | ||||||||||
Net realized gains | 0.00 | 0.00 | (0.01 | ) | (0.05 | ) | (0.00 | )2 | ||||||||||||
|
|
|
|
|
|
|
|
|
| |||||||||||
Total distributions to shareholders | (0.26 | ) | (0.30 | ) | (0.32 | ) | (0.36 | ) | (0.35 | ) | ||||||||||
Net asset value, end of period | $10.86 | $10.76 | $10.51 | $10.68 | $11.07 | |||||||||||||||
Total return | 3.34 | % | 5.29 | % | 1.34 | % | (0.28 | )% | 6.10 | % | ||||||||||
Ratios to average net assets (annualized) | ||||||||||||||||||||
Gross expenses | 0.87 | % | 0.88 | % | 0.78 | % | 0.84 | % | 0.83 | % | ||||||||||
Net expenses | 0.60 | % | 0.60 | % | 0.60 | % | 0.60 | % | 0.60 | % | ||||||||||
Net investment income | 2.38 | % | 2.81 | % | 2.89 | % | 2.87 | % | 3.24 | % | ||||||||||
Supplemental data | ||||||||||||||||||||
Portfolio turnover rate | 16 | % | 18 | % | 15 | % | 22 | % | 16 | % | ||||||||||
Net assets, end of period (000s omitted) | $69,954 | $95,072 | $85,259 | $104,906 | $124,485 | |||||||||||||||
| 1 | Calculated based upon average shares outstanding |
| 2 | Amount is less than $0.005. |
The accompanying notes are an integral part of these financial statements.
22 | Wells Fargo Minnesota Tax-Free Fund
Financial highlights
(For a share outstanding throughout each period)
| Year ended June 30 | ||||||||||||||||
| INSTITUTIONAL CLASS | 2020 | 2019 | 2018 | 20171 | ||||||||||||
Net asset value, beginning of period | $10.77 | $10.52 | $10.69 | $10.88 | ||||||||||||
Net investment income | 0.26 | 0.30 | 0.32 | 0.21 | ||||||||||||
Net realized and unrealized gains (losses) on investments | 0.10 | 0.25 | (0.16 | ) | (0.14 | ) | ||||||||||
|
|
|
|
|
|
|
| |||||||||
Total from investment operations | 0.36 | 0.55 | 0.16 | 0.07 | ||||||||||||
Distributions to shareholders from | ||||||||||||||||
Net investment income | (0.26 | ) | (0.30 | ) | (0.32 | ) | (0.21 | ) | ||||||||
Net realized gains | 0.00 | 0.00 | (0.01 | ) | (0.05 | ) | ||||||||||
|
|
|
|
|
|
|
| |||||||||
Total distributions to shareholders | (0.26 | ) | (0.30 | ) | (0.33 | ) | (0.26 | ) | ||||||||
Net asset value, end of period | $10.87 | $10.77 | $10.52 | $10.69 | ||||||||||||
Total return2 | 3.42 | % | 5.37 | % | 1.43 | % | 0.62 | % | ||||||||
Ratios to average net assets (annualized) | ||||||||||||||||
Gross expenses | 0.60 | % | 0.61 | % | 0.52 | % | 0.52 | % | ||||||||
Net expenses | 0.52 | % | 0.52 | % | 0.52 | % | 0.51 | % | ||||||||
Net investment income | 2.43 | % | 2.89 | % | 2.98 | % | 2.91 | % | ||||||||
Supplemental data | ||||||||||||||||
Portfolio turnover rate | 16 | % | 18 | % | 15 | % | 22 | % | ||||||||
Net assets, end of period (000s omitted) | $70,383 | $35,630 | $29,639 | $22,785 | ||||||||||||
| 1 | For the period from October 31, 2016 (commencement of class operations) to June 30, 2017 |
| 2 | Returns for periods of less than one year are not annualized. |
The accompanying notes are an integral part of these financial statements.
Wells Fargo Minnesota Tax-Free Fund | 23
1. ORGANIZATION
Wells Fargo Funds Trust (the “Trust”), a Delaware statutory trust organized on March 10, 1999, is an open-end management investment company registered under the Investment Company Act of 1940, as amended (the “1940 Act”). As an investment company, the Trust follows the accounting and reporting guidance in Financial Accounting Standards Board (“FASB”) Accounting Standards Codification Topic 946, Financial Services – Investment Companies. These financial statements report on the Wells Fargo Minnesota Tax-Free Fund (the “Fund”) which is a diversified series of the Trust.
2. SIGNIFICANT ACCOUNTING POLICIES
The following significant accounting policies, which are consistently followed in the preparation of the financial statements of the Fund, are in conformity with U.S. generally accepted accounting principles which require management to make estimates and assumptions that affect the reported amounts of assets and liabilities, disclosure of contingent assets and liabilities at the date of the financial statements, and the reported amounts of revenues and expenses during the reporting period. Actual results could differ from those estimates.
Securities valuation
All investments are valued each business day as of the close of regular trading on the New York Stock Exchange (generally 4 p.m. Eastern Time), although the Fund may deviate from this calculation time under unusual or unexpected circumstances.
Debt securities are valued at the evaluated bid price provided by an independent pricing service (e.g. taking into account various factors, including yields, maturities, or credit ratings) or, if a reliable price is not available, the quoted bid price from an independent broker-dealer.
Investments which are not valued using any of the method discussed above are valued at their fair value, as determined in good faith by the Board of Trustees of the Fund. The Board of Trustees has established a Valuation Committee comprised of the Trustees and has delegated to it the authority to take any actions regarding the valuation of portfolio securities that the Valuation Committee deems necessary or appropriate, including determining the fair value of portfolio securities, unless the determination has been delegated to the Wells Fargo Asset Management Pricing Committee at Wells Fargo Funds Management, LLC (“Funds Management”). The Board of Trustees retains the authority to make or ratify any valuation decisions or approve any changes to the Valuation Procedures as it deems appropriate. On a quarterly basis, the Board of Trustees receives reports on any valuation actions taken by the Valuation Committee or the Wells Fargo Asset Management Pricing Committee which may include items for ratification.
When-issued transactions
The Fund may purchase securities on a forward commitment or when-issued basis. The Fund records a when-issued transaction on the trade date and will segregate assets in an amount at least equal in value to the Fund’s commitment to purchase when-issued securities. Securities purchased on a when-issued basis are marked-to-market daily and the Fund begins earning interest on the settlement date. Losses may arise due to changes in the market value of the underlying securities or if the counterparty does not perform under the contract.
Security transactions and income recognition
Securities transactions are recorded on a trade date basis. Realized gains or losses are recorded on the basis of identified cost.
Interest income is accrued daily and bond discounts are accreted and premiums are amortized daily. To the extent debt obligations are placed on non-accrual status, any related interest income may be reduced by writing off interest receivables when the collection of all or a portion of interest has been determined to be doubtful based on consistently applied procedures and the fair value has decreased. If the issuer subsequently resumes interest payments or when the collectability of interest is reasonably assured, the debt obligation is removed from non-accrual status.
Distributions to shareholders
Distributions to shareholders from net investment income are declared daily and paid monthly. Distributions from net realized gains, if any, are recorded on the ex-dividend date and paid at least annually. Such distributions are determined in accordance with income tax regulations and may differ from U.S. generally accepted accounting principles. Dividend sources are estimated at the time of declaration. The tax character of distributions is determined as of the Fund’s fiscal year end. Therefore, a portion of the Fund’s distributions made prior to the Fund’s fiscal year end may be categorized as a tax return of capital at year end.
24 | Wells Fargo Minnesota Tax-Free Fund
Notes to financial statements
Federal and other taxes
The Fund intends to continue to qualify as a regulated investment company by distributing substantially all of its investment company taxable and tax-exempt income and any net realized capital gains (after reduction for capital loss carryforwards) sufficient to relieve it from all, or substantially all, federal income taxes. Accordingly, no provision for federal income taxes was required.
The Fund’s income and federal excise tax returns and all financial records supporting those returns for the prior three fiscal years are subject to examination by the federal and Delaware revenue authorities. Management has analyzed the Fund’s tax positions taken on federal, state, and foreign tax returns for all open tax years and does not believe that there are any uncertain tax positions that require recognition of a tax liability.
As of June 30, 2020, the aggregate cost of all investments for federal income tax purposes was $164,270,511 and the unrealized gains (losses) consisted of:
Gross unrealized gains | $ | 7,654,382 | ||
Gross unrealized losses | (797,892 | ) | ||
Net unrealized gains | $ | 6,856,490 | ||
As of June 30, 2020, the Fund had capital loss carryforwards which consist of $10,530 in short-term capital losses.
Class allocations
The separate classes of shares offered by the Fund differ principally in applicable sales charges, distribution, shareholder servicing, and administration fees. Class specific expenses are charged directly to that share class. Investment income, common fund-level expenses, and realized and unrealized gains (losses) on investments are allocated daily to each class of shares based on the relative proportion of net assets of each class.
3. FAIR VALUATION MEASUREMENTS
Fair value measurements of investments are determined within a framework that has established a fair value hierarchy based upon the various data inputs utilized in determining the value of the Fund’s investments. The three-level hierarchy gives the highest priority to unadjusted quoted prices in active markets for identical assets or liabilities (Level 1) and the lowest priority to unobservable inputs (Level 3). The Fund’s investments are classified within the fair value hierarchy based on the lowest level of input that is significant to the fair value measurement. The inputs are summarized into three broad levels as follows:
| ∎ | Level 1 – quoted prices in active markets for identical securities |
| ∎ | Level 2 – other significant observable inputs (including quoted prices for similar securities, interest rates, prepayment speeds, credit risk, etc.) |
| ∎ | Level 3 – significant unobservable inputs (including the Fund’s own assumptions in determining the fair value of investments) |
The inputs or methodologies used for valuing investments in securities are not necessarily an indication of the risk associated with investing in those securities.
The following is a summary of the inputs used in valuing the Fund’s assets and liabilities as of June 30, 2020:
| Quoted prices (Level 1) | Other significant observable inputs (Level 2) | Significant (Level 3) | Total | |||||||||||||
Assets | ||||||||||||||||
Investments in: | ||||||||||||||||
Municipal obligations | $ | 0 | $ | 171,127,001 | $ | 0 | $ | 171,127,001 | ||||||||
Additional sector, industry or geographic detail is included in the Portfolio of Investments.
For the year ended June 30, 2020, the Fund did not have any transfers into/out of Level 3.
Wells Fargo Minnesota Tax-Free Fund | 25
Notes to financial statements
4. TRANSACTIONS WITH AFFILIATES
Management fee
Funds Management, an indirect wholly owned subsidiary of Wells Fargo & Company (“Wells Fargo”), is the manager of the Fund and provides advisory and fund-level administrative services under an investment management agreement. Under the investment management agreement, Funds Management is responsible for, among other services, implementing the investment objectives and strategies of the Fund, supervising and providing fund-level administrative services in connection with the Fund’s operations. As compensation for its services under the investment management agreement, Funds Management is entitled to receive a management fee at the following annual rate based on the Fund’s average daily net assets:
| Average daily net assets | Management fee | |
First $500 million | 0.400% | |
Next $500 million | 0.375 | |
Next $2 billion | 0.350 | |
Next $2 billion | 0.325 | |
Next $5 billion | 0.290 | |
Over $10 billion | 0.280 | |
For the year ended June 30, 2020, the management fee was equivalent to an annual rate of 0.40% of the Fund’s average daily net assets.
Funds Management has retained the services of a subadviser to provide daily portfolio management to the Fund. The fee for subadvisory services is borne by Funds Management. Wells Capital Management Incorporated, an affiliate of Funds Management and an indirect wholly owned subsidiary of Wells Fargo, is the subadviser to the Fund and is entitled to receive a fee from Funds Management at an annual rate starting at 0.20% and declining to 0.10% as the average daily net assets of the Fund increase.
Administration fees
Under a class-level administration agreement, Funds Management provides class-level administrative services to the Fund, which includes paying fees and expenses for services provided by the transfer agent, sub-transfer agents, omnibus account servicers and record-keepers. As compensation for its services under the class-level administration agreement, Funds Management receives an annual fee which is calculated based on the average daily net assets of each class as follows:
| Class-level administration fee | ||
Class A, Class C | 0.16% | |
Administrator Class | 0.10 | |
Institutional Class | 0.08 | |
Waivers and/or expense reimbursements
Funds Management has contractually waived and/or reimbursed management and administration fees to the extent necessary to maintain certain net operating expense ratios for the Fund. When each class of the Fund has exceeded its expense cap, Funds Management has waived fees and/or reimbursed expenses from fund-level expenses on a proportionate basis and then from class specific expenses. When only certain classes exceed their expense caps, waivers and/or reimbursements are applied against class specific expenses before fund-level expenses. Funds Management has committed through October 31, 2020 to waive fees and/or reimburse expenses to the extent necessary to cap the Fund’s expenses at 0.85% for Class A shares, 1.60% for Class C shares, 0.60% for Administrator Class shares, and 0.52% for Institutional Class shares. Prior to or after the commitment expiration date, the cap may be increased or the commitment to maintain the cap may be terminated only with the approval of the Board of Trustees.
Distribution fee
The Trust has adopted a distribution plan for Class C shares of the Fund pursuant to Rule 12b-1 under the 1940 Act. A distribution fee is charged to Class C shares and paid to Wells Fargo Funds Distributor, LLC (“Funds Distributor”), the principal underwriter, at an annual rate of 0.75% of the average daily net assets of Class C shares.
26 | Wells Fargo Minnesota Tax-Free Fund
Notes to financial statements
In addition, Funds Distributor is entitled to receive the front-end sales charge from the purchase of Class A shares and a contingent deferred sales charge on the redemption of certain Class A shares. Funds Distributor is also entitled to receive the contingent deferred sales charges from redemptions of Class C shares. For the year ended June 30, 2020, Funds Distributor received $1,771 from the sale of Class A shares. No contingent deferred sales charges were incurred by Class A and Class C shares for the year ended June 30, 2020.
Shareholder servicing fees
The Trust has entered into contracts with one or more shareholder servicing agents, whereby Class A, Class C, and Administrator Class of the Fund are charged a fee at an annual rate of 0.25% of the average daily net assets of each respective class. A portion of these total shareholder servicing fees were paid to affiliates of Wells Fargo.
Interfund transactions
The Fund may purchase or sell portfolio investment securities to certain other Wells Fargo affiliates pursuant to Rule 17a-7 under the 1940 Act and under procedures adopted by the Board of Trustees. The procedures have been designed to ensure that these interfund transactions, which do not incur broker commissions, are effected at current market prices. Pursuant to these procedures, the Fund had $3,000,000 and $5,200,000 in interfund purchases and sales, respectively, during the year ended June 30, 2020.
5. INVESTMENT PORTFOLIO TRANSACTIONS
Purchases and sales of investments, excluding U.S. government obligations (if any) and short-term securities, for the year ended June 30, 2020 were $41,743,327 and $26,534,350, respectively.
6. BANK BORROWINGS
The Trust (excluding the money market funds), Wells Fargo Master Trust and Wells Fargo Variable Trust are parties to a $350,000,000 revolving credit agreement whereby the Fund is permitted to use bank borrowings for temporary or emergency purposes, such as to fund shareholder redemption requests. Interest under the credit agreement is charged to the Fund based on a borrowing rate equal to the higher of the Federal Funds rate in effect on that day plus 1.25% or the overnight LIBOR rate in effect on that day plus 1.25%. In addition, an annual commitment fee equal to 0.25% of the unused balance is allocated to each participating fund.
For the year ended June 30, 2020, there were no borrowings by the Fund under the agreement.
7. DISTRIBUTIONS TO SHAREHOLDERS
The tax character of distributions paid was $4,024,264 and $4,184,838 of tax-exempt income for the years ended June 30, 2020 and June 30, 2019, respectively.
As of June 30, 2020, the components of distributable earnings on a tax basis were as follows:
Undistributed tax-exempt income | Unrealized gains | Capital loss carryforward | ||
| $890,713 | $6,856,490 | $(10,530) | ||
8. CONCENTRATION RISK
The Fund invests a substantial portion of its assets in issuers of municipal debt securities located in a single state or territory of the U.S. Therefore, it may be more affected by economic and political developments in that state or region than would be a comparable general tax-exempt fund. As of the end of the period, the Fund invested a concentration of its portfolio in the state of Minnesota.
9. INDEMNIFICATION
Under the Fund’s organizational documents, the officers and Trustees have been granted certain indemnification rights against certain liabilities that may arise out of performance of their duties to the Fund. The Fund has entered into a separate agreement with each Trustee that converts indemnification rights currently existing under the Fund’s organizational documents into contractual rights that cannot be changed in the future without the consent of the Trustee. Additionally, in the normal course of business, the Fund may enter into contracts with service providers that contain a variety of indemnification clauses. The Fund’s maximum exposure under these arrangements is dependent on future claims that may be made against the Fund and, therefore, cannot be estimated.
Wells Fargo Minnesota Tax-Free Fund | 27
Notes to financial statements
10. NEW ACCOUNTING PRONOUNCEMENT
In August 2018, FASB issued Accounting Standards Update (“ASU”) No. 2018-13, Fair Value Measurement (Topic 820) Disclosure Framework—Changes to the Disclosure Requirements for Fair Value Measurement. ASU 2018-13 updates the disclosure requirements on fair value measurements in Topic 820, Fair Value Measurements. The amendments are effective for fiscal years, and interim periods within those fiscal years, beginning after December 15, 2019. Management has adopted this guidance which did not have a material impact on the financial statements.
11. CORONAVIRUS (COVID-19) PANDEMIC
On March 11, 2020, the World Health Organization announced that it had made the assessment that coronavirus disease 2019 (“COVID-19”) is a pandemic. The impacts of COVID-19 are adversely affecting the entire global economy, individual companies and investment products, and the market in general. There is significant uncertainty around the extent and duration of business disruptions related to COVID-19 and the impacts may be short term or may last for an extended period of time. The risk of further spreading of COVID-19 has led to significant uncertainty and volatility in the financial markets.
28 | Wells Fargo Minnesota Tax-Free Fund
Report of independent registered public accounting firm
To the Shareholders of the Fund and Board of Trustees
Wells Fargo Funds Trust:
Opinion on the Financial Statements
We have audited the accompanying statement of assets and liabilities of Wells Fargo Minnesota Tax-Free Fund (the Fund), one of the funds constituting Wells Fargo Funds Trust, including the portfolio of investments, as of June 30, 2020, the related statement of operations for the year then ended, the statements of changes in net assets for each of the years in the two-year period then ended, and the related notes (collectively, the financial statements) and the financial highlights for each of the years or periods in the five-year period then ended. In our opinion, the financial statements and financial highlights present fairly, in all material respects, the financial position of the Fund as of June 30, 2020, the results of its operations for the year then ended, the changes in its net assets for each of the years in the two-year period then ended, and the financial highlights for each of the years or periods in the five-year period then ended, in conformity with U.S. generally accepted accounting principles.
Basis for Opinion
These financial statements and financial highlights are the responsibility of the Fund’s management. Our responsibility is to express an opinion on these financial statements and financial highlights based on our audits. We are a public accounting firm registered with the Public Company Accounting Oversight Board (United States) (PCAOB) and are required to be independent with respect to the Fund in accordance with the U.S. federal securities laws and the applicable rules and regulations of the Securities and Exchange Commission and the PCAOB.
We conducted our audits in accordance with the standards of the PCAOB. Those standards require that we plan and perform the audit to obtain reasonable assurance about whether the financial statements and financial highlights are free of material misstatement, whether due to error or fraud. Our audits included performing procedures to assess the risks of material misstatement of the financial statements and financial highlights, whether due to error or fraud, and performing procedures that respond to those risks. Such procedures included examining, on a test basis, evidence regarding the amounts and disclosures in the financial statements and financial highlights. Such procedures also included confirmation of securities owned as of June 30, 2020, by correspondence with the custodian. Our audits also included evaluating the accounting principles used and significant estimates made by management, as well as evaluating the overall presentation of the financial statements and financial highlights. We believe that our audits provide a reasonable basis for our opinion.

We have not been able to determine the specific year that we began serving as the auditor of one or more Wells Fargo Funds investment companies; however we are aware that we have served as the auditor of one or more Wells Fargo Funds investment companies since at least 1955.
Boston, Massachusetts
August 29, 2020
Wells Fargo Minnesota Tax-Free Fund | 29
TAX INFORMATION
Pursuant to Section 852 of the Internal Revenue Code, 100% of distributions paid from net investment income is designated as exempt-interest dividends for the fiscal year ended June 30, 2020.
PROXY VOTING INFORMATION
A description of the policies and procedures used to determine how to vote proxies relating to portfolio securities is available, upon request, by calling 1-800-222-8222, visiting our website at wfam.com, or visiting the SEC website at sec.gov. Information regarding how the proxies related to portfolio securities were voted during the most recent 12-month period ended June 30 is available on the website at wfam.com or by visiting the SEC website at sec.gov.
QUARTERLY PORTFOLIO HOLDINGS INFORMATION
The Fund files its complete schedule of portfolio holdings with the SEC for the first and third quarters of each fiscal year as an exhibit to its reports on Form N-PORT. Shareholders may view the filed Form N-PORT by visiting the SEC website at sec.gov.
30 | Wells Fargo Minnesota Tax-Free Fund
Other information (unaudited)
BOARD OF TRUSTEES AND OFFICERS
Each of the Trustees and Officers1 listed in the table below acts in identical capacities for each fund in the Wells Fargo family of funds, which consists of 147 mutual funds comprising the Wells Fargo Funds Trust, Wells Fargo Variable Trust, Wells Fargo Master Trust and four closed-end funds (collectively the “Fund Complex”). This table should be read in conjunction with the Prospectus and the Statement of Additional Information2. The mailing address of each Trustee and Officer is 525 Market Street, 12th Floor, San Francisco, CA 94105. Each Trustee and Officer serves an indefinite term, however, each Trustee serves such term until reaching the mandatory retirement age established by the Trustees.
Independent Trustees
| Name and year of birth | Position held and length of service* | Principal occupations during past five years or longer | Current other public company or investment company directorships | |||
| William R. Ebsworth (Born 1957) | Trustee, since 2015 | Retired. From 1984 to 2013, equities analyst, portfolio manager, research director and chief investment officer at Fidelity Management and Research Company in Boston, Tokyo, and Hong Kong, and retired in 2013 as Chief Investment Officer of Fidelity Strategic Advisers, Inc. where he led a team of investment professionals managing client assets. Prior thereto, Board member of Hong Kong Securities Clearing Co., Hong Kong Options Clearing Corp., the Thailand International Fund, Ltd., Fidelity Investments Life Insurance Company, and Empire Fidelity Investments Life Insurance Company. Audit Committee Chair and Investment Committee Chair of the Vincent Memorial Hospital Endowment (non-profit organization). Mr. Ebsworth is a CFA® charterholder. | N/A | |||
| Jane A. Freeman (Born 1953) | Trustee, since 2015; Chair Liaison, since 2018 | Retired. From 2012 to 2014 and 1999 to 2008, Chief Financial Officer of Scientific Learning Corporation. From 2008 to 2012, Ms. Freeman provided consulting services related to strategic business projects. Prior to 1999, Portfolio Manager at Rockefeller & Co. and Scudder, Stevens & Clark. Board member of the Harding Loevner Funds from 1996 to 2014, serving as both Lead Independent Director and chair of the Audit Committee. Board member of the Russell Exchange Traded Funds Trust from 2011 to 2012 and the chair of the Audit Committee. Ms. Freeman is also an inactive Chartered Financial Analyst. | N/A | |||
| Isaiah Harris, Jr. (Born 1952) | Trustee, since 2009; Audit Committee Chairman, since 2019 | Retired. Chairman of the Board of CIGNA Corporation since 2009, and Director since 2005. From 2003 to 2011, Director of Deluxe Corporation. Prior thereto, President and CEO of BellSouth Advertising and Publishing Corp. from 2005 to 2007, President and CEO of BellSouth Enterprises from 2004 to 2005 and President of BellSouth Consumer Services from 2000 to 2003. Emeritus member of the Iowa State University Foundation Board of Governors. Emeritus Member of the Advisory Board of Iowa State University School of Business. Advisory Board Member, Palm Harbor Academy (private school). Advisory Board Member, Child Evangelism Fellowship (non-profit). Mr. Harris is a certified public accountant (inactive status). | CIGNA Corporation | |||
| Judith M. Johnson (Born 1949) | Trustee, since 2008; Audit Committee Chairman, from 2009 to 2018 | Retired. Prior thereto, Chief Executive Officer and Chief Investment Officer of Minneapolis Employees Retirement Fund from 1996 to 2008. Ms. Johnson is an attorney, certified public accountant and a certified managerial accountant. | N/A | |||
Wells Fargo Minnesota Tax-Free Fund | 31
Other information (unaudited)
| Name and year of birth | Position held and length of service* | Principal occupations during past five years or longer | Current other public company or investment company directorships | |||
| David F. Larcker (Born 1950) | Trustee, since 2009 | James Irvin Miller Professor of Accounting at the Graduate School of Business, Stanford University, Director of the Corporate Governance Research Initiative and Senior Faculty of The Rock Center for Corporate Governance since 2006. From 2005 to 2008, Professor of Accounting at the Graduate School of Business, Stanford University. Prior thereto, Ernst & Young Professor of Accounting at The Wharton School, University of Pennsylvania from 1985 to 2005. | N/A | |||
| Olivia S. Mitchell (Born 1953) | Trustee, since 2006; Nominating and Governance Committee Chair, since 2018 | International Foundation of Employee Benefit Plans Professor, Wharton School of the University of Pennsylvania since 1993. Director of Wharton’s Pension Research Council and Boettner Center on Pensions & Retirement Research, and Research Associate at the National Bureau of Economic Research. Previously, Cornell University Professor from 1978 to 1993. | N/A | |||
| Timothy J. Penny (Born 1951) | Trustee, since 1996; Chairman, since 2018 | President and Chief Executive Officer of Southern Minnesota Initiative Foundation, a non-profit organization, since 2007. Member of the Board of Trustees of NorthStar Education Finance, Inc., a non-profit organization, since 2007. | N/A | |||
| James G. Polisson (Born 1959) | Trustee, since 2018 | Retired. Chief Marketing Officer, Source (ETF) UK Services, Ltd, from 2015 to 2017. From 2012 to 2015, Principal of The Polisson Group, LLC, a management consulting, corporate advisory and principal investing company. Chief Executive Officer and Managing Director at Russell Investments, Global Exchange Traded Funds from 2010 to 2012. Managing Director of Barclays Global Investors from 1998 to 2010 and Global Chief Marketing Officer for iShares and Barclays Global Investors from 2000 to 2010. Trustee of the San Francisco Mechanics’ Institute, a non-profit organization, from 2013 to 2015. Board member of the Russell Exchange Traded Fund Trust from 2011 to 2012. Director of Barclays Global Investors Holdings Deutschland GmbH from 2006 to 2009. Mr. Polisson is an attorney and has a retired status with the Massachusetts and District of Columbia Bar Associations. | N/A | |||
| Pamela Wheelock (Born 1959) | Trustee, since January 2020; previously Trustee from January 2018 to July 2019 | Board member of the Destination Medical Center Economic Development Agency, Rochester, Minnesota since 2019 and Interim President of the McKnight Foundation since 2020. Acting Commissioner, Minnesota Department of Human Services, July 2019 through September 2019. Human Services Manager (part-time), Minnesota Department of Human Services, October 2019 through December 2019. Chief Operating Officer, Twin Cities Habitat for Humanity from 2017 to 2019. Vice President of University Services, University of Minnesota from 2012 to 2016. Prior thereto, on the Board of Directors, Governance Committee and Finance Committee for the Minnesota Philanthropy Partners (Saint Paul Foundation) from 2012 to 2018, Interim Chief Executive Officer of Blue Cross Blue Shield of Minnesota from 2011 to 2012, Chairman of the Board from 2009 to 2012 and Board Director from 2003 to 2015. Vice President, Leadership and Community Engagement, Bush Foundation, Saint Paul, Minnesota (a private foundation) from 2009 to 2011. Executive Vice President and Chief Financial Officer, Minnesota Sports and Entertainment from 2004 to 2009 and Senior Vice President from 2002 to 2004. Executive Vice President of the Minnesota Wild Foundation from 2004 to 2008. Commissioner of Finance, State of Minnesota, from 1999 to 2002. Currently Board Chair of the Minnesota Wild Foundation since 2010. | N/A | |||
| * | Length of service dates reflect the Trustee’s commencement of service with the Trust’s predecessor entities, where applicable. |
32 | Wells Fargo Minnesota Tax-Free Fund
Other information (unaudited)
Officers
| Name and year of birth | Position held and length of service | Principal occupations during past five years or longer | ||
| Andrew Owen (Born 1960) | President, since 2017 | Executive Vice President of Wells Fargo & Company and Head of Affiliated Managers, Wells Fargo Asset Management, since 2014. In addition, Mr. Owen is currently President, Chief Executive Officer and Director of Wells Fargo Funds Management, LLC since 2017. Prior thereto, Executive Vice President responsible for marketing, investments and product development for Wells Fargo Funds Management, LLC, from 2009 to 2014. | ||
| Nancy Wiser1 (Born 1967) | Treasurer, since 2012 | Executive Vice President of Wells Fargo Funds Management, LLC since 2011. Chief Operating Officer and Chief Compliance Officer at LightBox Capital Management LLC, from 2008 to 2011. | ||
| Michelle Rhee (Born 1966) | Chief Legal Officer, since 2019 | Secretary of Wells Fargo Funds Management, LLC, Chief Legal Counsel of Wells Fargo Asset Management and Assistant General Counsel of Wells Fargo Bank, N.A. since 2018. Associate General Counsel and Managing Director of Bank of America Corporation from 2004 to 2018. | ||
| Catherine Kennedy (Born 1969) | Secretary, since 2019 | Vice President of Wells Fargo Funds Management, LLC and Senior Counsel of the Wells Fargo Legal Department since 2010. Vice President and Senior Counsel of Evergreen Investment Management Company, LLC from 1998 to 2010. | ||
| Michael H. Whitaker (Born 1967) | Chief Compliance Officer, since 2016 | Chief Compliance Officer of Wells Fargo Asset Management since 2016. Senior Vice President and Chief Compliance Officer for Fidelity Investments from 2007 to 2016. | ||
| David Berardi (Born 1975) | Assistant Treasurer, since 2009 | Vice President of Wells Fargo Funds Management, LLC since 2009. Vice President of Evergreen Investment Management Company, LLC from 2008 to 2010. Manager of Fund Reporting and Control for Evergreen Investment Management Company, LLC from 2004 to 2010. | ||
| Jeremy DePalma1 (Born 1974) | Assistant Treasurer, since 2009 | Senior Vice President of Wells Fargo Funds Management, LLC since 2009. Senior Vice President of Evergreen Investment Management Company, LLC from 2008 to 2010 and head of the Fund Reporting and Control Team within Fund Administration from 2005 to 2010. | ||
| 1 | Nancy Wiser acts as Treasurer of 65 funds in the Fund Complex. Jeremy DePalma acts as the Treasurer of 82 funds and Assistant Treasurer of 65 funds in the Fund Complex. |
| 2 | The Statement of Additional Information includes additional information about the Trustees and is available, without charge, upon request, by calling 1-800-222-8222 or by visiting the website at wfam.com. |
Wells Fargo Minnesota Tax-Free Fund | 33
Other information (unaudited)
BOARD CONSIDERATION OF INVESTMENT MANAGEMENT AND SUB-ADVISORY AGREEMENTS:
Wells Fargo Minnesota Tax-Free Fund
Under the Investment Company Act of 1940 (the “1940 Act”), the Board of Trustees (the “Board”) of Wells Fargo Funds Trust (the “Trust”) must determine annually whether to approve the continuation of the Trust’s investment management and sub-advisory agreements. In this regard, at a Board meeting held on May 26, 2020 and May 28, 2020 (together, the “Meeting”), the Board, all the members of which have no direct or indirect interest in the investment management and sub-advisory agreements and are not “interested persons” of the Trust, as defined in the 1940 Act (the “Independent Trustees”), reviewed and approved for Wells Fargo Minnesota Tax-Free Fund (the “Fund”): (i) an investment management agreement (the “Management Agreement”) with Wells Fargo Funds Management, LLC (“Funds Management”); and (ii) an investment sub-advisory agreement (the “Sub-Advisory Agreement”) with Wells Capital Management Incorporated (the “Sub-Adviser”), an affiliate of Funds Management. The Management Agreement and the Sub-Advisory Agreement are collectively referred to as the “Advisory Agreements.”
At the Meeting, the Board considered the factors and reached the conclusions described below relating to the selection of Funds Management and the Sub-Adviser and the approval of the Advisory Agreements. Prior to the Meeting, including at a Board meeting held in April 2020, the Trustees conferred extensively among themselves and with representatives of Funds Management about these matters. Also, the Board has adopted a team-based approach, with each team consisting of a sub-set of Trustees, to assist the full Board in the discharge of its duties in reviewing investment performance and other matters throughout the year. The Independent Trustees were assisted in their evaluation of the Advisory Agreements by independent legal counsel, from whom they received separate legal advice and with whom they met separately.
In providing information to the Board, Funds Management and the Sub-Adviser were guided by a detailed set of requests for information submitted to them by independent legal counsel on behalf of the Independent Trustees at the start of the Board’s annual contract renewal process earlier in 2020. In considering and approving the Advisory Agreements, the Trustees considered the information they believed relevant, including but not limited to the information discussed below. The Board considered not only the specific information presented in connection with the Meeting, but also the knowledge gained over time through interaction with Funds Management and the Sub-Adviser about various topics. In this regard, the Board reviewed reports of Funds Management at each of its quarterly meetings, which included, among other things, portfolio reviews and investment performance reports. In addition, the Board and the teams mentioned above confer with portfolio managers at various times throughout the year. The Board did not identify any particular information or consideration that was all-important or controlling, and each individual Trustee may have attributed different weights to various factors.
After its deliberations, the Board unanimously approved the continuation of the Advisory Agreements for a one-year term and determined that the compensation payable to Funds Management and the Sub-Adviser under each of the Advisory Agreements was reasonable. The Board considered the approval of the Advisory Agreements for the Fund as part of its consideration of agreements for funds across the complex, but its approvals were made on a fund-by-fund basis. The following summarizes a number of important, but not necessarily all, factors considered by the Board in support of its approvals.
Nature, extent and quality of services
The Board received and considered various information regarding the nature, extent and quality of services provided to the Fund by Funds Management and the Sub-Adviser under the Advisory Agreements. This information included a description of the investment advisory services and Fund-level administrative services covered by the Management Agreement, as well as, among other things, a summary of the background and experience of senior management of Wells Fargo Asset Management (“WFAM”), of which Funds Management and the Sub-Adviser are a part, and a summary of investments made in the business of WFAM. The Board also received a description of Funds Management’s and the Sub-Adviser’s business continuity plans and of their approaches to data privacy and cybersecurity, and related testing. The Board also received and reviewed information about Funds Management’s role as administrator of the Fund’s liquidity risk management program, Funds Management’s approach to risk management, and Funds Management’s intermediary and vendor oversight program.
The Board also considered the qualifications, background, tenure and responsibilities of each of the portfolio managers primarily responsible for the day-to-day portfolio management of the Fund. The Board evaluated the ability of Funds Management and the Sub-Adviser to attract and retain qualified investment professionals, including research, advisory and supervisory personnel. The Board further considered the compliance programs and compliance records of Funds Management and the Sub-Adviser. In addition, the Board took into account the full range of services provided to the Fund by Funds Management and its affiliates.
34 | Wells Fargo Minnesota Tax-Free Fund
Other information (unaudited)
Fund investment performance and expenses
The Board considered the investment performance results for the Fund over various time periods ended December 31, 2019. The Board also considered more current results for various time periods ended March 31, 2020. The Board considered these results in comparison to the investment performance of funds in a universe that was determined by Broadridge Inc. (“Broadridge”) to be similar to the Fund (the “Universe”), and in comparison to the Fund’s benchmark index and to other comparative data. Broadridge is an independent provider of investment company data. The Board received a description of the methodology used by Broadridge to select the mutual funds in the performance Universe. The Board noted that the investment performance of the Fund (Administrator Class) was higher than or in range of the average investment performance of the Universe for the three-, five- and ten-year periods ended December 31, 2019, and lower than the average investment performance of the Universe for the one-year period ended December 31, 2019. The Board also noted that the investment performance of the Fund (Administrator Class) was higher than the average investment performance of the Universe for all periods ended March 31, 2020. The Board also noted that the investment performance of the Fund was lower than its benchmark index, the Bloomberg Barclays Municipal Bond Index, for all periods ended December 31, 2019. The Board also noted that the investment performance of the Fund was lower than its benchmark index, the Bloomberg Barclays Municipal Bond Index, for all periods ended March 31, 2020.
The Board received information concerning, and discussed factors contributing to, the underperformance of the Fund relative to the Universe and benchmark index for the periods identified above. The Board took note of the explanations for the relative underperformance during these periods, including with respect to investment decisions and market factors that affected the Fund’s investment performance.
The Board also received and considered information regarding the Fund’s net operating expense ratios and their various components, including actual management fees, custodian and other non-management fees, and Rule 12b-1 and non-Rule 12b-1 shareholder service fees. The Board considered these ratios in comparison to the median ratios of funds in class-specific expense groups that were determined by Broadridge to be similar to the Fund (the “Groups”). The Board received a description of the methodology used by Broadridge to select the mutual funds in the expense Groups and an explanation of how funds comprising expense groups and their expense ratios may vary from year-to-year. Based on the Broadridge reports, the Board noted that the net operating expense ratios of the Fund were lower than or equal to the median net operating expense ratios of the expense Groups for each share class.
The Board took into account the Fund’s investment performance and expense information provided to it among the factors considered in deciding to re-approve the Advisory Agreements.
Investment management and sub-advisory fee rates
The Board reviewed and considered the contractual fee rates payable by the Fund to Funds Management under the Management Agreement, as well as the contractual fee rates payable by the Fund to Funds Management for class-level administrative services under a Class-Level Administration Agreement, which include, among other things, class-level transfer agency and sub-transfer agency costs (collectively, the “Management Rates”). The Board also reviewed and considered the contractual investment sub-advisory fee rates that are payable by Funds Management to the Sub-Adviser for investment sub-advisory services.
Among other information reviewed by the Board was a comparison of the Fund’s Management Rates with the average contractual investment management fee rates of funds in the expense Groups at a common asset level as well as transfer agency costs of the funds in the expense Groups. The Board noted that the Management Rates of the Fund were lower than or in range of the sum of these average rates for the Fund’s expense Groups for all share classes.
The Board also received and considered information about the portion of the total management fee that was retained by Funds Management after payment of the fee to the Sub-Adviser for sub-advisory services. In assessing the reasonableness of this amount, the Board received and evaluated information about the nature and extent of responsibilities retained and risks assumed by Funds Management and not delegated to or assumed by the Sub-Adviser, and about Funds Management’s on-going oversight services. Given the affiliation between Funds Management and the Sub-Adviser, the Board ascribed limited relevance to the allocation of fees between them.
The Board also received and considered information about the nature and extent of services offered and fee rates charged by Funds Management and the Sub-Adviser to other types of clients with investment strategies similar to those of the Fund. In this regard, the Board received information about the significantly greater scope of services, and compliance, reporting and other legal burdens and risks of managing proprietary mutual funds compared with those associated with managing assets of other types of clients, including third-party sub-advised fund clients and non-mutual fund clients such as institutional separate accounts.
Wells Fargo Minnesota Tax-Free Fund | 35
Other information (unaudited)
Based on its consideration of the factors and information it deemed relevant, including those described here, the Board determined that the compensation payable to Funds Management under the Management Agreement and to the Sub-Adviser under the Sub-Advisory Agreement was reasonable.
Profitability
The Board received and considered information concerning the profitability of Funds Management, as well as the profitability of both WFAM and Wells Fargo & Co. (“Wells Fargo”) from providing services to the fund family as a whole. The Board noted that the Sub-Adviser’s profitability information with respect to providing services to the Fund and other funds in the family was subsumed in the WFAM and Wells Fargo profitability analysis.
Funds Management reported on the methodologies and estimates used in calculating profitability, including a description of the methodology used to allocate certain expenses. Among other things, the Board noted that the levels of profitability reported on a fund-by-fund basis varied widely, depending on factors such as the size, type and age of fund.
Based on its review, the Board did not deem the profits reported by Funds Management, WFAM or Wells Fargo from services provided to the Fund to be at a level that would prevent it from approving the continuation of the Advisory Agreements.
Economies of scale
The Board received and considered information about the potential for Funds Management to experience economies of scale in the provision of management services to the Fund, the difficulties of calculating economies of scale at an individual fund level, and the extent to which potential scale benefits are shared with shareholders. The Board noted the existence of breakpoints in the Fund’s management fee structure, which operate generally to reduce the Fund’s expense ratios as the Fund grows in size, and the size of the Fund in relation to such breakpoints. The Board considered that in addition to management fee breakpoints, Funds Management shares potential economies of scale from its management business in a variety of ways, including through fee waiver and expense reimbursement arrangements, services that benefit shareholders, competitive management fee rates set at the outset without regard to breakpoints, and investments in the business intended to enhance services available to shareholders.
The Board concluded that Funds Management’s arrangements with respect to the Fund, including contractual breakpoints, constituted a reasonable approach to sharing potential economies of scale with the Fund and its shareholders.
Other benefits to Funds Management and the Sub-Adviser
The Board received and considered information regarding potential “fall-out” or ancillary benefits received by Funds Management and its affiliates, including the Sub-Adviser, as a result of their relationships with the Fund. Ancillary benefits could include, among others, benefits directly attributable to other relationships with the Fund and benefits potentially derived from an increase in Funds Management’s and the Sub-Adviser’s business as a result of their relationships with the Fund. The Board noted that various affiliates of Funds Management may receive distribution-related fees, shareholder servicing payments and sub-transfer agency fees in respect of shares sold or held through them and services provided.
The Board also reviewed information about soft dollar credits earned and utilized by the Sub-Adviser, fees earned by Funds Management and the Sub-Adviser from managing a private investment vehicle for the fund family’s securities lending collateral, and commissions earned by an affiliated broker from portfolio transactions.
Based on its consideration of the factors and information it deemed relevant, including those described here, the Board did not find that any ancillary benefits received by Funds Management and its affiliates, including the Sub-Adviser, were unreasonable.
Conclusion
At the Meeting, after considering the above-described factors and based on its deliberations and its evaluation of the information described above, the Board unanimously approved the continuation of the Advisory Agreements for a one-year term and determined that the compensation payable to Funds Management and the Sub-Adviser under each of the Advisory Agreements was reasonable.
36 | Wells Fargo Minnesota Tax-Free Fund
Other information (unaudited)
LIQUIDITY RISK MANAGEMENT PROGRAM
In accordance with Rule 22e-4 under the Investment Company Act of 1940, as amended (the “Liquidity Rule”), Wells Fargo Funds Trust (the “Trust”) has adopted and implemented a liquidity risk management program (the “Program”) on behalf of each of its series, including the Fund, which is reasonably designed to assess and manage the Fund’s liquidity risk. “Liquidity risk” is defined as the risk that the Fund is unable to meet redemption requests without significantly diluting remaining investors’ interests in the Fund. The Trust’s Board of Trustees (the “Board”) previously approved the designation of Wells Fargo Funds Management, LLC (“Funds Management”), the Fund’s investment manager, as the administrator of the Program, and Funds Management has established a Liquidity Risk Management Council composed of personnel from multiple departments within Funds Management and its affiliates to assist Funds Management in the implementation and on-going administration of the Program.
The Program is comprised of various components designed to support the assessment and/or management of liquidity risk, including: (1) the periodic assessment (no less frequently than annually) of certain factors that influence the Fund’s liquidity risk; (2) the periodic classification (no less frequently than monthly) of the Fund’s investments into one of four liquidity categories that reflect an estimate of their liquidity under current market conditions; (3) a 15% limit on the acquisition of “illiquid investments” (as defined under the Liquidity Rule); (4) to the extent the Fund does not invest primarily in “highly liquid investments” (as defined under the Liquidity Rule), the determination of a minimum percentage of the Fund’s assets that generally will be invested in highly liquid investments (an “HLIM”); (5) if the Fund has established an HLIM, the periodic review (no less frequently than annually) of the HLIM and the adoption of policies and procedures for responding to a shortfall of the Fund’s “highly liquid investments” below its HLIM; and (6) periodic reporting to the Board.
At a meeting of the Board held on May 26 and 28, 2020, the Board received a written report (the “Report”) from Funds Management that addressed the operation of the Program and assessed its adequacy and effectiveness of implementation. The Report covered the initial period from December 1, 2018 through December 31, 2019 (the “Reporting Period”). No significant liquidity events impacting the Fund were noted in the Report. There were no material changes to the Program during the Reporting Period. The Report concluded that the Program is operating effectively to assess and manage the Fund’s liquidity risk, and that the Program has been and continues to be adequately and effectively implemented to monitor and, as applicable, respond to the Fund’s liquidity developments.
There can be no assurance that the Program will achieve its objectives under all circumstances in the future. Please refer to the Fund’s prospectus for more information regarding the Fund’s exposure to liquidity risk and other risks to which an investment in the Fund may be subject.
Wells Fargo Minnesota Tax-Free Fund | 37
Effective on or after May 1, 2020, clients of Edward Jones (also referred to as “shareholders”) purchasing Fund shares on the Edward Jones commission and fee-based platforms are eligible only for the following sales charge discounts (also referred to as “breakpoints”) and waivers, which can differ from breakpoints and waivers described elsewhere in the Fund’s Prospectus or SAI or through another broker-dealer. In all instances, it is the shareholder’s responsibility to inform Edward Jones at the time of purchase of any relationship, holdings of Wells Fargo Funds or other facts qualifying the purchaser for breakpoints or waivers. Edward Jones can ask for documentation of such circumstance.
| Breakpoints available at Edward Jones |
| Rights of Accumulation (ROA) |
The applicable sales charge on a purchase of Class A shares is determined by taking into account all share classes (except any money market funds and retirement plan share classes) of Wells Fargo Funds held by the shareholder or in an account grouped by Edward Jones with other accounts for the purpose of providing certain pricing considerations (“pricing groups”). This includes all share classes held on the Edward Jones platform and/or held on another platform. The inclusion of eligible fund family assets in the rights of accumulation calculation is dependent on the shareholder notifying his or her financial advisor of such assets at the time of calculation. |
ROA is determined by calculating the higher of cost or market value (current shares x NAV). |
| Letter of Intent (LOI) |
Through a LOI, shareholders can receive the sales charge and breakpoint discounts for purchases shareholders intend to makeover a 13-month period from the date Edward Jones receives the LOI. The LOI is determined by calculating the higher of cost or market value of qualifying holdings at LOI initiation in combination with the value that the shareholder intends to buy over a 13-month period to calculate the front-end sales charge and any breakpoint discounts. Each purchase the shareholder makes during that 13-month period will receive the sales charge and breakpoint discount that applies to the total amount. The inclusion of eligible fund family assets in the LOI calculation is dependent on the shareholder notifying his or her financial advisor of such assets at the time of calculation. Purchases made before the LOI is received by Edward Jones are not covered under the LOI and will not reduce the sales charge previously paid. Sales charges will be adjusted if LOI is not met. |
| Sales charges are waived for the following shareholders and in the following situations at Edward Jones: |
● Associates of Edward Jones and its affiliates and their family members who are in the same pricing group (as determined by Edward Jones under its policies and procedures) as the associate. This waiver will continue for the remainder of the associate’s life if the associate retires from Edward Jones in good-standing. |
● Shares purchased in an Edward Jones fee-based program. |
● Shares purchased through reinvestment of capital gains distributions and dividend reinvestment. |
● Shares purchased from the proceeds of redeemed shares of the same fund family so long as the following conditions are met: 1)the proceeds are from the sale of shares within 60 days of the purchase, and 2) the sale and purchase are made in the same share class and the same account or the purchase is made in an individual retirement account with proceeds from liquidations in anon-retirement account. |
● Shares exchanged into Class A shares from another share class so long as the exchange is into the same fund and was initiated at the discretion of Edward Jones. Edward Jones is responsible for any remaining CDSC due to the fund company, if applicable. Any future purchases are subject to the applicable sales charge as disclosed in the prospectus. |
● Exchanges from Class C shares to Class A shares of the same fund, generally, in the 84th month following the anniversary of the purchase date or earlier at the discretion of Edward Jones. |
| If the shareholder purchases shares that are subject to a CDSC and those shares are redeemed before the CDSC is expired, the shareholder is responsible to pay the CDSC except in the following conditions available at Edward Jones: |
● The death or disability of the shareholder. |
● Systematic withdrawals with up to 10% per year of the account value. |
● Return of excess contributions from an Individual Retirement Account (IRA). |
● Shares sold as part of a required minimum distribution for IRA and retirement accounts if the redemption is taken in or after the year the shareholder reaches qualified age based on applicable IRS regulation. |
● Shares sold to pay Edward Jones fees or costs in such cases where the transaction is initiated by Edward Jones. |
● Shares exchanged in an Edward Jones fee-based program. |
● Shares acquired through NAV reinstatement. |
38 | Wells Fargo Minnesota Tax-Free Fund
Appendix I (unaudited)
| Other Important Information for accounts at Edward Jones: |
| Minimum Purchase Amounts |
● $250 initial purchase minimum |
● $50 subsequent purchase minimum |
| Minimum Balances |
| Edward Jones has the right to redeem at its discretion fund holdings with a balance of $250 or less. The following are examples of accounts that are not included in this policy: |
● A fee-based account held on an Edward Jones platform |
● A 529 account held on an Edward Jones platform |
● An account with an active systematic investment plan or letter of intent (LOI) |
| Changing Share Classes |
| At any time it deems necessary, Edward Jones has the authority to exchange at NAV a shareholder’s holdings in a fund to Class A shares. |
Wells Fargo Minnesota Tax-Free Fund | 39
Effective June 1, 2020, shareholders purchasing Fund shares through an Oppenheimer��& Co. Inc. (“Oppenheimer”) platform or account are eligible only for the following load waivers (front-end sales charge waivers and contingent deferred or back-end, sales charge waivers) and discounts, which may differ from those disclosed in the Fund’s Prospectus or SAI.
| Front-end Sales Load Waivers on Class A Shares available at Oppenheimer |
| Employer-sponsored retirement, deferred compensation and employee benefit plans (including health savings accounts) and trusts used to fund those plans, provided that the shares are not held in a commission-based brokerage account and shares are held for the benefit of the plan. |
| Shares purchased by or through a 529 Plan. |
| Shares purchased through an Oppenheimer affiliated investment advisory program. |
| Shares purchased through reinvestment of capital gains distributions and dividend reinvestment when purchasing shares of the same fund (but not any other fund within the fund family). |
| Shares purchased from the proceeds of redemptions within the same fund family, provided (1) the repurchase occurs within 90 days following the redemption, (2) the redemption and purchase occur in the same account, and (3) redeemed shares were subject to a front-end or deferred sales load (known as Rights of Restatement). |
| A shareholder in the Fund’s Class C shares will have their shares exchanged at net asset value to Class A shares (or the appropriate share class) of the Fund if the shares are no longer subject to a CDSC and the exchange is in line with the policies and procedures of Oppenheimer. |
| Employees and registered representatives of Oppenheimer or its affiliates and their family members. |
| Directors or Trustees of the Fund, and employees of the Fund’s investment adviser or any of its affiliates, as described in the Prospectus. |
| CDSC Waivers on A and C Shares available at Oppenheimer |
| Death or disability of the shareholder. |
| Shares sold as part of a systematic withdrawal plan as described in the Prospectus. |
| Return of excess contributions from an IRA Account. |
| Shares sold as part of a required minimum distribution for IRA and retirement accounts due to the shareholder reaching the qualified age based on applicable IRS regulations as described in the Prospectus. |
| Shares sold to pay Oppenheimer fees but only if the transaction is initiated by Oppenheimer. |
| Shares acquired through a right of reinstatement. |
| Front-end load Discounts Available at Oppenheimer: Breakpoints, Rights of Accumulation & Letters of Intent |
| Breakpoints as described in the Prospectus. |
| Rights of Accumulation (ROA), which entitle shareholders to breakpoint discounts, will be automatically calculated based on the aggregated holding of fund family assets held by accounts within the purchaser’s household at Oppenheimer. Eligible fund family assets not held at Oppenheimer may be included in the ROA calculation only if the shareholder notifies his or her financial advisor about such assets. |
40 | Wells Fargo Minnesota Tax-Free Fund
Effective June 15, 2020, shareholders purchasing fund shares through a Robert W. Baird & Co. (“Baird”) platform or account will only be eligible for the following sales charge waivers (front-end sales charge waivers and CDSC waivers) and discounts, which may differ from those disclosed elsewhere in the Fund’s Prospectus or the SAI.
| Front-end Sales Load Waivers on Class A Shares available at Baird |
| Shares purchased through reinvestment of capital gains distributions and dividend reinvestment when purchasing share of the same fund. |
| Share purchase by employees and registers representatives of Baird or its affiliate and their family members as designated by Baird. |
| Shares purchase from the proceeds of redemptions within the same fund family, provided (1) the repurchase occurs within 90 days following the redemption, (2) the redemption and purchase occur in the same accounts, and (3) redeemed shares were subject to a front-end or deferred sales charge (known as rights of reinstatement). |
| A shareholder in the Funds Investor C Shares will have their share exchanged at net asset value to Investor A shares of the fund if the shares are no longer subject to CDSC and the exchange is in line with the policies and procedures of Baird. |
| Employer-sponsored retirement plans or charitable accounts in a transactional brokerage account at Baird, including 401(k)plans, 457 plans, employer-sponsored 403(b) plans, profit sharing and money purchase pension plans and defined benefit plans. For purposes of this provision, employer-sponsored retirement plans do not include SEP IRAs, Simple IRAs or SAR-SEPs. |
| CDSC Waivers on A and C Shares available at Baird |
| Shares sold due to death or disability of the shareholder. |
| Shares sold as part of a systematic withdrawal plan as described in the Fund’s Prospectus. |
| Shares bought due to returns of excess contributions from an IRA Account. |
| Shares sold as part of a required minimum distribution for IRA and retirement accounts due to the shareholder reaching age 72as described in the Fund’s Prospectus. |
| Shares sold to pay Baird fees but only if the transaction is initiated by Baird. |
| Shares acquired through a right of reinstatement. |
| Front-end load Discounts Available at Baird: Breakpoint and/or Rights of Accumulation |
| Breakpoints as described in the Prospectus. |
| Rights of accumulations which entitles shareholders to breakpoint discounts will be automatically calculated based on the aggregated holding of fund family assets held by accounts within the purchaser’s household at Baird. Eligible fund family assets not held at Baird may be included in the rights of accumulations calculation only if the shareholder notifies his or her financial advisor about such assets. |
| Letters of Intent (LOI) allow for breakpoint discounts based on anticipated purchases within a fund family through Baird, over a13-month period of time. |
Wells Fargo Minnesota Tax-Free Fund | 41
This page is intentionally left blank.
This page is intentionally left blank.
This page is intentionally left blank.
For more information
More information about Wells Fargo Funds is available free upon request. To obtain literature, please write, visit the Fund’s website, or call:
Wells Fargo Funds
P.O. Box 219967
Kansas City, MO 64121-9967
Website: wfam.com
Individual investors: 1-800-222-8222
Retail investment professionals: 1-888-877-9275
Institutional investment professionals: 1-866-765-0778

This report and the financial statements contained herein are submitted for the general information of the shareholders of the Fund. If this report is used for promotional purposes, distribution of the report must be accompanied or preceded by a current prospectus. Before investing, please consider the investment objectives, risks, charges, and expenses of the investment. For a current prospectus and, if available, a summary prospectus, containing this information, call 1-800-222-8222 or visit the Fund’s website at wfam.com. Read the prospectus carefully before you invest or send money.
Wells Fargo Asset Management (WFAM) is the trade name for certain investment advisory/management firms owned by Wells Fargo & Company. These firms include but are not limited to Wells Capital Management Incorporated and Wells Fargo Funds Management, LLC. Certain products managed by WFAM entities are distributed by Wells Fargo Funds Distributor, LLC (a broker-dealer and Member FINRA).
This material is for general informational and educational purposes only and is NOT intended to provide investment advice or a recommendation of any kind—including a recommendation for any specific investment, strategy, or plan.
INVESTMENT PRODUCTS: NOT FDIC INSURED ◾ NO BANK GUARANTEE ◾ MAY LOSE VALUE
© 2020 Wells Fargo & Company. All rights reserved.
PAR-0720-00244 08-20
A252/AR252 06-20

Annual Report
June 30, 2020
Wells Fargo
California Tax-Free Fund
Beginning on January 1, 2021, as permitted by new regulations adopted by the Securities and Exchange Commission, paper copies of the Wells Fargo Funds’ annual and semi-annual shareholder reports issued after this date will no longer be sent by mail, unless you specifically request paper copies of the reports. Instead, the reports will be made available on the Funds’ website, and you will be notified by mail each time a report is posted and provided with a website address to access the report.
If you already elected to receive shareholder reports electronically, you will not be affected by this change and you need not take any action. You may elect to receive shareholder reports and other communications from the Fund electronically at any time by contacting your financial intermediary (such as a broker-dealer or bank) or, if you are a direct investor, by calling 1-800-222-8222 or by enrolling at wellsfargo.com/advantagedelivery.
You may elect to receive all future reports in paper free of charge. If you invest through a financial intermediary, you can contact your financial intermediary to request that you continue to receive paper copies of your shareholder reports; if you invest directly with the Fund, you can call 1-800-222-8222. Your election to receive reports in paper will apply to all Wells Fargo Funds held in your account with your financial intermediary or, if you are a direct investor, to all Wells Fargo Funds that you hold.
|
Reduce clutter. Save trees. |
Sign up for electronic delivery of prospectuses and shareholder reports at wellsfargo.com/ |
The views expressed and any forward-looking statements are as of June 30, 2020, unless otherwise noted, and are those of the Fund managers and/or Wells Fargo Asset Management. Discussions of individual securities, or the markets generally, or any Wells Fargo Fund are not intended as individual recommendations. Future events or results may vary significantly from those expressed in any forward-looking statements. The views expressed are subject to change at any time in response to changing circumstances in the market. Wells Fargo Asset Management and the Fund disclaim any obligation to publicly update or revise any views expressed or forward-looking statements.
INVESTMENT PRODUCTS: NOT FDIC INSURED ◾ NO BANK GUARANTEE ◾ MAY LOSE VALUE
Wells Fargo California Tax-Free Fund | 1
Letter to shareholders (unaudited)

Andrew Owen
President
Wells Fargo Funds
Dear Shareholder:
We are pleased to offer you this annual report for the Wells Fargo California Tax-Free Fund for the 12-month period that ended June 30, 2020. Global stock markets saw earlier gains erased in February and March as governments around the world took unprecedented measures to stop the spread of the coronavirus at the expense of short-term economic output. However, markets rebounded from April through June to offset much of the losses as central banks attempted to bolster capital markets and confidence. Fixed-income markets generally performed better, with most achieving gains. Overall U.S. markets surpassed their international peers, while U.S. large-cap equity, as measured by the Russell 1000® Index1, easily outperformed small caps, as measured by the Russell 2000® Index2, for the 12-month period.
For the 12-month period, fixed-income securities generally had positive total returns while non-U.S. equities had broad losses and U.S. stocks performed strongly despite sharp volatility since late February. For the period, U.S. stocks, based on the S&P 500 Index,3 gained 7.51%. International stocks, as measured by the MSCI ACWI ex USA Index (Net),4 returned -4.80%, while the MSCI EM Index (Net)5 performed slightly better, with a -3.39% return. For bond investors, the Bloomberg Barclays U.S. Aggregate Bond Index6 returned a robust 8.74%, the Bloomberg Barclays Global Aggregate ex-USD Index7 gained a modest 0.71%, and the Bloomberg Barclays Municipal Bond Index8 returned 4.45% while the ICE BofA U.S. High Yield Index9 lost 1.10%.
The fiscal year began on a positive note.
The 12-month period began with the U.S. equity market advancing to new highs in July 2019. U.S. President Donald Trump initially backed off of earlier tariff threats against Mexico and China. However, later in July, the U.S. reversed course and threatened to impose higher tariffs on China’s exports after talks failed. China responded with tariff threats of its own and devalued the renminbi, roiling global markets. Major U.S. stock market indices closed July with the worst weekly results of the year. Bond prices gained as Treasury yields fell to multiyear lows, and the yield curve inverted at multiple points along the 30-year arc, with shorter term yields higher than longer-term. At the end of July, the U.S. Federal Reserve (Fed) cut its federal funds rate by 0.25%.
In August, U.S.-China trade tensions continued with no signs of compromise. Evidence of a continued global economic slowdown mounted, and central banks in China, New Zealand, and Thailand cut interest rates. Industrial and manufacturing data declined in China, Canada, Japan, and Germany. Adding to global uncertainty, Italy’s prime minister resigned,
| 1 | The Russell 1000® Index measures the performance of the 1,000 largest companies in the Russell 3000® Index, which represents approximately 92% of the total market capitalization of the Russell 3000® Index. You cannot invest directly in an index. |
| 2 | The Russell 2000® Index measures the performance of the 2,000 smallest companies in the Russell 3000® Index, which represents approximately 8% of the total market capitalization of the Russell 3000® Index. You cannot invest directly in an index. |
| 3 | The S&P 500 Index consists of 500 stocks chosen for market size, liquidity, and industry group representation. It is a market-value-weighted index with each stock’s weight in the index proportionate to its market value. You cannot invest directly in an index. |
| 4 | The Morgan Stanley Capital International (MSCI) All Country World Index (ACWI) ex USA Index (Net) is a free-float-adjusted market-capitalization-weighted index that is designed to measure the equity market performance of developed and emerging markets, excluding the United States. Source: MSCI. MSCI makes no express or implied warranties or representations and shall have no liability whatsoever with respect to any MSCI data contained herein. The MSCI data may not be further redistributed or used as a basis for other indices or any securities or financial products. This report is not approved, reviewed, or produced by MSCI. You cannot invest directly in an index. |
| 5 | The MSCI Emerging Markets (EM) Index (Net) is a free-float-adjusted market-capitalization-weighted index that is designed to measure equity market performance of emerging markets. You cannot invest directly in an index. |
| 6 | The Bloomberg Barclays U.S. Aggregate Bond Index is a broad-based benchmark that measures the investment-grade, U.S. dollar-denominated, fixed-rate taxable bond market, including Treasuries, government-related and corporate securities, mortgage-backed securities (agency fixed-rate and hybrid adjustable-rate mortgage pass-throughs), asset-backed securities, and commercial mortgage-backed securities. You cannot invest directly in an index. |
| 7 | The Bloomberg Barclays Global Aggregate ex-USD Index is an unmanaged index that provides a broad-based measure of the global investment-grade fixed-income markets excluding the U.S.-dollar-denominated debt market. You cannot invest directly in an index. |
| 8 | The Bloomberg Barclays Municipal Bond Index is an unmanaged index composed of long-term tax-exempt bonds with a minimum credit rating of Baa. You cannot invest directly in an index. |
| 9 | The ICE BofA U.S. High Yield Index is a market-capitalization-weighted index of domestic and Yankee high-yield bonds. The index tracks the performance of high-yield securities traded in the U.S. bond market. You cannot invest directly in an index. Copyright 2020. ICE Data Indices, LLC. All rights reserved. |
2 | Wells Fargo California Tax-Free Fund
Letter to shareholders (unaudited)
many feared a crackdown in Hong Kong as protestors sustained their calls for reform, and U.K. Prime Minister Boris Johnson planned to suspend Parliament as Brexit’s deadline neared.
In the U.S., the Fed cut interest rates a second time in September. U.S. manufacturing data disappointed investors. The U.S. Congress announced it would pursue an impeachment investigation of President Trump. Meanwhile, the Brexit impasse showed no signs of resolution. Officials in China said that hitting the country’s economic growth goals for the year would be difficult considering the weight of tariffs and trade restrictions. Although the S&P 500 Index finished the third quarter with the best year-to-date returns in more than 20 years, concerns about future returns remained.
The fourth quarter started on a strong note, with U.S.-China trade tensions relaxing in October along with renewed optimism for a U.K. Brexit deal and positive macroeconomic data. The initial estimate of U.S. third-quarter gross domestic product (GDP) growth was a resilient 1.9% annualized rate, while the U.S. unemployment rate fell to a 50-year low of 3.5% in September. However, despite resilience among U.S. consumers, business confidence declined while manufacturing activity contracted. Concerned with a potential economic slowdown, the Fed lowered interest rates another quarter point in late October—its third rate cut in four months. This helped push the S&P 500 Index to a new all-time high while emerging market equities rallied and global bonds declined overall, reflecting a broad pickup in risk appetite.
Equity markets continued to rally in November despite ongoing geopolitical risks. Hopes for a U.S.-China trade deal buoyed investor confidence. U.S. business sentiment improved slightly, and manufacturing and services activity picked up. While consumer confidence and purchasing manager activity rose in the eurozone, China reported weakening manufacturing and consumer data. Bond yields rose marginally, leading to slightly negative returns for global government and investment-grade corporate bonds.
Financial markets ended 2019 with a boost from the U.S. and China accord on a Phase One trade deal. That, along with the landslide win by the pro-Brexit U.K. Conservative Party in a national election and ongoing central bank support, gave investors greater confidence. U.S. economic indicators were generally positive, with the exception of manufacturing activity and business confidence. Consumer confidence was resilient, fed by a robust labor market, tame inflation, and lower interest rates, which boosted housing affordability and stimulated homebuyer activity. The impeachment of President Trump had little impact on markets. Meanwhile, slowing Chinese economic activity, partly attributable to the trade war, led to further government stimulus at year-end through lower reserve ratios, allowing banks to lend more money.
The year-end rally continued in early January 2020. However, capital market volatility picked up sharply in late January on concerns over the potential impact of the coronavirus on the global economy and stock markets. With sentiment somewhat souring, perceived safe havens did well in January. The U.S. dollar and Japanese yen both rose, and government bonds outperformed equities. While the S&P 500 Index held its ground, emerging market equities tumbled, including those in Asia.
In February, the coronavirus became the major market focus. Fears of the virus’s impact on global growth led to expectations of increased global central bank monetary policy support. That led the 10-year U.S. Treasury yield to fall to an all-time low of 1.1% by the end of the month. Although equity markets initially shrugged off concerns about the outbreak, focusing instead on strong fourth-quarter earnings and improving business confidence in January, market sentiment turned sharply lower toward month-end and the S&P 500 Index lost 8.2% for the month. Oil prices tumbled as Russia and the Organization of the Petroleum Exporting countries compounded a major decline in oil demand with a brutal price war, partly aimed at dissuading further U.S. shale production. As a result, the price of West Texas Intermediate crude oil fell 13% in February.
Wells Fargo California Tax-Free Fund | 3
Letter to shareholders (unaudited)
“The global spread of the coronavirus led country after country to clamp down on social and business-related activity in order to contain the virus from causing even greater devastation and overwhelming health care systems.”
“Despite ongoing economic weakness and high levels of uncertainty on the containment of the coronavirus and the timing of an effective vaccine, financial markets continued to post widely positive returns in June.”
The global spread of the coronavirus led country after country to clamp down on social and business-related activity in order to contain the virus from causing even greater devastation and overwhelming health care systems. This abrupt stoppage of economic activity led to the sharp deceleration of global output, sending economies into a deep contraction. Central bank responses were swift, as they slashed interest rates and expanded quantitative easing programs to restore liquidity and confidence to the markets. In the U.S., the Fed introduced several new lending programs, funding investment-grade bonds, money market mutual funds, and commercial paper while purchasing Treasuries, mortgage-backed securities, and overnight repurchase agreements. Meanwhile, stock markets tumbled quickly into a bear market, ending the longest bull stock market in U.S. history.
Markets rebounded strongly in April, with the S&P 500 Index gaining 12.8% for the month and the MSCI ACWI ex USA Index (Net) returning 7.6%. The rebound was fueled by unprecedented government and central bank stimulus measures taken to buffer the economic damage created by mass shutdowns enacted in order to contain the virus’s spread. The U.S. economy contracted by an annualized 5.0% pace in the first quarter, with 30 million new unemployment insurance claims in six weeks. In the eurozone, first-quarter real GDP shrank 3.8%, with the composite April Flash Purchasing Managers’ Index, a monthly survey of purchasing managers, falling to an all-time low of 13.5. The European Central Bank expanded its quantitative easing to include the purchase of additional government bonds of countries with the greatest virus-related need, including Italy and Spain. China’s first-quarter GDP fell by 6.8% year over year. However, retail sales, production, and investment showed signs of recovery. Extreme oil-price volatility continued as global supply far exceeded demand.
In May, the equity market rebound continued, with the S&P 500 Index climbing a further 4.8%. European and Japanese stock markets also had monthly gains. Investors regained confidence on reports of early signs of success in human trials of a coronavirus vaccine. Growth stocks continued to outperform value stocks while returns on global government bonds were generally flat. In the U.S., a gap grew between the stock market rebound and devastating economic data points, including an April unemployment rate of 14.7%, the highest level since World War II. Purchasing managers’ indices continued to reflect weakening activity in May in both the manufacturing and services sectors. U.S. corporate earnings reports indicated a 14% year-over-year contraction in earnings from the first quarter of 2019. However, high demand for technology, driven by remote activity, helped maintain robust information technology sector earnings, which helped drive powerful well-known technology stocks higher.
Despite ongoing economic weakness and high levels of uncertainty on the containment of the coronavirus and the timing of an effective vaccine, financial markets continued to post widely positive returns in June. As economies reopened, there were hopeful signs. U.S. retail sales rose 17% in May while retail sales in the U.K. rebounded by 12%. However, year over year, sales remained depressed. Vitally important to market sentiment was the ongoing commitment by central banks globally to do all they can to provide economic support through liquidity and low borrowing costs. U.S. economic activity was aided by one-time $1,200 stimulus checks and $600 bonus weekly unemployment benefits due to expire at the end of July. However, unemployment remained in the double digits, easing somewhat from 14.7% in April to 11.1% in June. At period-end, numerous states reported alarming increases of coronavirus cases. China’s economic recovery picked up momentum in June, though it remained far from a full recovery.
4 | Wells Fargo California Tax-Free Fund
Letter to shareholders (unaudited)
Don’t let short-term uncertainty derail long-term investment goals.
Periods of investment uncertainty can present challenges, but experience has taught us that maintaining long-term investment goals can be an effective way to plan for the future. To help you create a sound strategy based on your personal goals and risk tolerance, Wells Fargo Funds offers more than 100 mutual funds spanning a wide range of asset classes and investment styles. Although diversification cannot guarantee an investment profit or prevent losses, we believe it can be an effective way to manage investment risk and potentially smooth out overall portfolio performance. We encourage investors to know their investments and to understand that appropriate levels of risk-taking may unlock opportunities.
Thank you for choosing to invest with Wells Fargo Funds. We appreciate your confidence in us and remain committed to helping you meet your financial needs.
Sincerely,

Andrew Owen
President
Wells Fargo Funds
|
For further information about your Fund, contact your investment professional, visit our website at wfam.com, or call us directly at 1-800-222-8222. |
Notice to Shareholders
At a meeting held on August 10-12, 2020, the Board of Trustees of the Fund approved a change to the Fund’s automatic conversion feature for Class C shares in order to shorten the required holding period from 10 to 8 years. As a result, on a monthly basis beginning November 5, 2020, Class C shares will convert automatically into Class A shares 8 years after the initial date of purchase or, if you acquired your Class C shares through an exchange or conversion from another share class, 8 years after the date you acquired your Class C shares. When Class C shares that you acquired through a purchase or exchange convert, any other Class C shares that you purchased with reinvested dividends and distributions also will convert into Class A shares on a pro rata basis.
Please note that a shorter holding period may apply depending on your intermediary. Please see “Appendix A—Sales Charge Reductions and Waivers for Certain Intermediaries” in the Fund’s prospectus for further information.
Wells Fargo California Tax-Free Fund | 5
Performance highlights (unaudited)
Investment objective
The Fund seeks current income exempt from federal income tax and California individual income tax.
Manager
Wells Fargo Funds Management, LLC
Subadviser
Wells Capital Management Incorporated
Portfolio managers
Terry J. Goode
Brandon Pae
Adrian Van Poppel
Average annual total returns (%) as of June 30, 2020
| Including sales charge | Excluding sales charge | Expense ratios1 (%) | ||||||||||||||||||||||||||||||||
| Inception date | 1 year | 5 year | 10 year | 1 year | 5 year | 10 year | Gross | Net2 | ||||||||||||||||||||||||||
| Class A (SCTAX) | 10-6-1988 | -1.69 | 2.35 | 4.10 | 2.93 | 3.30 | 4.58 | 0.83 | 0.75 | |||||||||||||||||||||||||
| Class C (SCTCX) | 7-1-1993 | 1.08 | 2.53 | 3.80 | 2.08 | 2.53 | 3.80 | 1.58 | 1.50 | |||||||||||||||||||||||||
| Administrator Class (SGCAX) | 12-15-1997 | – | – | – | 3.05 | 3.51 | 4.79 | 0.77 | 0.55 | |||||||||||||||||||||||||
| Institutional Class (SGTIX)3 | 10-31-2014 | – | – | – | 3.12 | 3.58 | 4.83 | 0.50 | 0.48 | |||||||||||||||||||||||||
| Bloomberg Barclays Municipal Bond Index4 | – | – | – | – | 4.45 | 3.93 | 4.22 | – | – | |||||||||||||||||||||||||
| Bloomberg Barclays Municipal Bond: California Index5 | – | – | – | – | 4.83 | 3.95 | 4.67 | – | – | |||||||||||||||||||||||||
Figures quoted represent past performance, which is no guarantee of future results, and do not reflect taxes that a shareholder may pay on an investment in a fund. Investment return and principal value of an investment will fluctuate so that an investor’s shares, when redeemed, may be worth more or less than their original cost. Performance shown without sales charges would be lower if sales charges were reflected. Current performance may be lower or higher than the performance data quoted, which assumes the reinvestment of dividends and capital gains. Current month-end performance is available on the Fund’s website, wfam.com.
Index returns do not include transaction costs associated with buying and selling securities, any mutual fund fees or expenses, or any taxes. It is not possible to invest directly in an index.
For Class A shares, the maximum front-end sales charge is 4.50%. For Class C shares, the maximum contingent deferred sales charge is 1.00%. Performance including a contingent deferred sales charge assumes the sales charge for the corresponding time period. Administrator Class and Institutional Class shares are sold without a front-end sales charge or contingent deferred sales charge.
Bond values fluctuate in response to the financial condition of individual issuers, general market and economic conditions, and changes in interest rates. Changes in market conditions and government policies may lead to periods of heightened volatility in the bond market and reduced liquidity for certain bonds held by the Fund. In general, when interest rates rise, bond values fall and investors may lose principal value. Interest rate changes and their impact on the Fund and its share price can be sudden and unpredictable. The use of derivatives may reduce returns and/or increase volatility. Certain investment strategies tend to increase the total risk of an investment (relative to the broader market). The Fund is exposed to California municipal securities risk, high-yield securities risk, and nondiversification risk. Consult the Fund’s prospectus for additional information on these and other risks. A portion of the Fund’s income may be subject to federal, state, and/or local income taxes or the Alternative Minimum Tax (AMT). Any capital gains distributions may be taxable.
Please see footnotes on page 7.
6 | Wells Fargo California Tax-Free Fund
Performance highlights (unaudited)
| Growth of $10,000 investment as of June 30, 20206 |
|
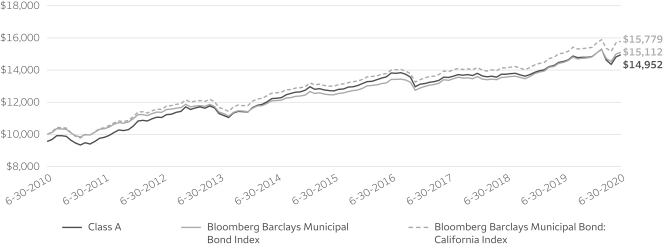
| 1 | Reflects the expense ratios as stated in the most recent prospectuses. The expense ratios shown are subject to change and may differ from the annualized expense ratios shown in the financial highlights of this report. |
| 2 | The manager has contractually committed through October 31, 2020, to waive fees and/or reimburse expenses to the extent necessary to cap total annual fund operating expenses after fee waivers at 0.75% for Class A, 1.50% for Class C, 0.55% for Administrator Class, and 0.48% for Institutional Class. Brokerage commissions, stamp duty fees, interest, taxes, acquired fund fees and expenses (if any), and extraordinary expenses are excluded from the expense caps. Prior to or after the commitment expiration date, the caps may be increased or the commitment to maintain the caps may be terminated only with the approval of the Board of Trustees. Without these caps, the Fund’s returns would have been lower. The expense ratio paid by an investor is the net expense ratio (the total annual fund operating expenses after fee waivers) as stated in the prospectuses. |
| 3 | Historical performance shown for the Institutional Class shares prior to their inception reflects the performance of the Administrator Class shares and includes the higher expenses applicable to Administrator Class shares. If these expenses had not been included, returns for Institutional Class shares would be higher. |
| 4 | The Bloomberg Barclays Municipal Bond Index is an unmanaged index composed of long-term tax-exempt bonds with a minimum credit rating of Baa. You cannot invest directly in an index. |
| 5 | The Bloomberg Barclays Municipal Bond: California Index is the California component of the Bloomberg Barclays Municipal Bond Index. You cannot invest directly in an index. |
| 6 | The chart compares the performance of Class A shares for the most recent ten years with the Bloomberg Barclays Municipal Bond Index and the Bloomberg Barclays Municipal Bond: California Index. The chart assumes a hypothetical $10,000 investment in Class A shares and reflects all operating expenses and assumes the maximum initial sales charge of 4.50%. |
| 7 | Amounts are calculated based on the long-term total investments of the Fund. These amounts are subject to change and may have changed since the date specified. |
| 8 | The credit quality distribution of portfolio holdings reflected in the chart is based on ratings from Standard & Poor’s, Moody’s Investors Service, and/or Fitch Ratings Ltd. Credit quality ratings apply to the underlying holdings of the Fund and not to the Fund itself. The percentages of the Fund’s portfolio with the ratings depicted in the chart are calculated based on the total market value of fixed income securities held by the Fund. If a security was rated by all three rating agencies, the middle rating was utilized. If rated by two of three rating agencies, the lower rating was utilized, and if rated by one of the rating agencies, that rating was utilized. Standard & Poor’s rates the creditworthiness of bonds, ranging from AAA (highest) to D (lowest). Ratings from A to CCC may be modified by the addition of a plus (+) or minus (-) sign to show relative standing within the rating categories. Standard & Poor’s rates the creditworthiness of short-term notes from SP-1 (highest) to SP-3 (lowest). Moody’s rates the creditworthiness of bonds, ranging from Aaa (highest) to C (lowest). Ratings Aa to B may be modified by the addition of a number 1 (highest) to 3 (lowest) to show relative standing within the ratings categories. Moody’s rates the creditworthiness of short-term U.S. tax-exempt municipal securities from MIG 1/VMIG 1 (highest) to SG (lowest). Fitch rates the creditworthiness of bonds, ranging from AAA (highest) to D (lowest). Credit quality distribution is subject to change and may have changed since the date specified. |
Wells Fargo California Tax-Free Fund | 7
Performance highlights (unaudited)
MANAGER’S DISCUSSION
Fund highlights
| ∎ | The Fund underperformed both its benchmarks, the Bloomberg Barclays Municipal Bond Index and the Bloomberg Barclays Municipal Bond: California Index, for the 12-month period that ended June 30, 2020. |
| ∎ | We tactically extended duration over the year from modestly short to modestly long relative to the benchmark. Overall duration positioning detracted slightly from performance as the yield curve steepened over the period. |
| ∎ | Sector allocation was modestly positive, while security selection detracted from performance. Our overweight to local general obligation (GO) bonds aided performance, as did our underweights to the transportation and electric sectors. Security selection was not optimal within the sectors, resulting in underperformance for our holdings in the housing, industrial development revenue/pollution control revenue (IDR/PCR), and leasing sectors. |
| ∎ | Credit positioning detracted from performance as we were overweight lower-investment-grade bonds (A-rated and BBB-rated) and nonrated securities relative to higher-investment-grade bonds (AAA-rated and AA-rated). |
| Effective maturity distribution as of June 30, 20207 |
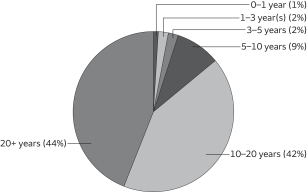 |
The coronavirus pandemic and the associated containment efforts became the dominant market influence over the 12-month period.
In 2019, market expectations moved the U.S. Federal Reserve (Fed) from a rate-hiking posture to multiple cuts in what was considered a “mid-cycle adjustment” at the time. Generally positive U.S. economic data was enough for most investors to expect continued slow growth and an extension of the economic expansion. Global trade tensions prompted a rise in market volatility, which subsided with the passage of a Phase One U.S.-China trade deal late in the calendar year. President Trump was formally impeached and ultimately acquitted by the U.S. Senate. By March, the coronavirus pandemic brought an end to the longest bull market on record.
The municipal bond market was heavily influenced by technical factors throughout the reporting period. Municipal mutual funds saw 61 straight weeks of net inflows, which pushed yields across ratings categories to all-time lows by late February. Low yields and ample demand drove municipal issuance higher but also altered the mix. Taxable municipal bonds as a proportion of new-issue municipal debt was at its highest level since 2010 by period-end. Pandemic-related volatility and liquidity pressures prompted record-setting outflows from municipal bonds in March. Strong support by the Fed, including a Municipal Liquidity Facility and more than $2.5 trillion in fiscal stimulus, buoyed markets and bolstered investor confidence. Several weeks of consecutive positive net flows for municipal funds and strong demand for new bonds drove yields back near the lows for highly rated issues. The period ended with the Fed pledging to keep short rates low for the foreseeable future, and the fundamental outlook for municipal issuers came into question as the path of recovery from the virus remains extraordinarily uncertain.
The Fund tactically extended duration over the period, adding higher-quality, lower-coupon positions.
The Fund gradually extended duration during the period, starting slightly short versus our indices to begin the period and ending modestly long. The Fund increased its allocation to the long bond (22+ years) portion of the yield curve. In addition, we increased our allocation of sub-5% coupon bonds as our high-coupon holdings continue to be refunded and market acceptance of lower coupon structures became more endemic. While we have maintained our overweight to lower-investment-grade bonds, we have also added higher-rated, lower-coupon bonds, which offered additional incremental yield and liquidity in the current market environment compared with lower-rated, higher-coupon bonds. Finally, during the height of the coronavirus market dislocation, we engaged in a series of tax-loss swap transactions that helped improve book yields and tax efficiency.
Please see footnotes on page 7.
8 | Wells Fargo California Tax-Free Fund
Performance highlights (unaudited)
| Credit quality as of June 30, 20208 |
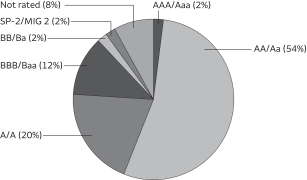 |
Credit quality and security selection were the primary detractors from performance for the Fund.
Credit exposure detracted from performance as credit spreads widened dramatically and were extremely volatile during the coronavirus market dislocation. At period-end, credit spreads remain wide despite some contraction as mutual fund inflows returned to the market and chased a bond supply limited from a two-month-long frozen new-issue market.
Security selection also detracted from performance as coronavirus-related volatility in March discombobulated the municipal market. Prior to this, the best-performing areas of the municipal market were lower-rated bonds, housing,
and alternative minimum tax (AMT) bonds; by period-end, all three of these areas were among the worst performers. Given this backdrop, our selection in and overweights to AMT bonds, housing bonds, hospitals, and IDR/PCR bonds all detracted from performance, including the sale of a distressed IDR/PCR bond ahead of a monetary default.
Sector selection was the strongest performance driver for the Fund.
Sector selection, including our overweight to local GO bonds and underweights to the transportation and electric sectors, contributed to investment performance over the period. In addition, we have reduced our overweights to the leasing and hospital sectors, both of which trailed the indices over the period. As a result, this contributed to performance.
Rates are likely to remain low. Rating downgrades are expected, but defaults in the investment-grade space are expected to remain rare.
The longest economic expansion in history is over. The economic impact of the pandemic worldwide and nationally has yet to be fully realized. As we reopen the economy, we will see a boost versus the lows of April, but economic activity is likely to remain muted and pressure more troubled credits. Most states and municipalities came into this in the best financial shape they’ve been in for decades, notwithstanding the pension challenges of certain issuers. Municipal issuers have a long history of managing through deep recessions, and many have already cut expenses, furloughed employees, and prepared to raise taxes. We expect to see a deterioration of credit quality and resultant downgrades, but we don’t believe that will result in a material increase in defaults in the investment-grade space. Similar to the financial crisis, the impact of this sharp recession likely will be uneven across sectors and geographies—market opportunities should similarly be uneven—highlighting the importance of credit research and a relative-value mindset. We expect to manage duration tactically, moving between 90% and 110% of benchmark depending on technical factors and market opportunities.
Please see footnotes on page 7.
Wells Fargo California Tax-Free Fund | 9
As a shareholder of the Fund, you incur two types of costs: (1) transaction costs, including sales charges (loads) on purchase payments and contingent deferred sales charges (if any) on redemptions and (2) ongoing costs, including management fees, distribution (12b-1) and/or shareholder servicing fees, and other Fund expenses. This example is intended to help you understand your ongoing costs (in dollars) of investing in the Fund and to compare these costs with the ongoing costs of investing in other mutual funds.
The example is based on an investment of $1,000 invested at the beginning of the six-month period and held for the entire period from January 1, 2020 to June 30, 2020.
Actual expenses
The “Actual” line of the table below provides information about actual account values and actual expenses. You may use the information in this line, together with the amount you invested, to estimate the expenses that you paid over the period. Simply divide your account value by $1,000 (for example, an $8,600 account value divided by $1,000 = 8.6), then multiply the result by the number in the “Actual” line under the heading entitled “Expenses paid during period” for your applicable class of shares to estimate the expenses you paid on your account during this period.
Hypothetical example for comparison purposes
The “Hypothetical” line of the table below provides information about hypothetical account values and hypothetical expenses based on the Fund’s actual expense ratio and an assumed rate of return of 5% per year before expenses, which is not the Fund’s actual return. The hypothetical account values and expenses may not be used to estimate the actual ending account balance or expenses you paid for the period. You may use this information to compare the ongoing costs of investing in the Fund and other funds. To do so, compare this 5% hypothetical example with the 5% hypothetical examples that appear in the shareholder reports of the other funds.
Please note that the expenses shown in the table are meant to highlight your ongoing costs only and do not reflect any transactional costs, such as sales charges (loads) and contingent deferred sales charges. Therefore, the “Hypothetical” line of the table is useful in comparing ongoing costs only and will not help you determine the relative total costs of owning different funds. In addition, if these transactional costs were included, your costs would have been higher.
Beginning account value 1-1-2020 | Ending account value 6-30-2020 | Expenses paid during the period1 | Annualized net expense ratio | |||||||||||||
Class A | ||||||||||||||||
Actual | $ | 1,000.00 | $ | 1,008.40 | $ | 3.75 | 0.75 | % | ||||||||
Hypothetical (5% return before expenses) | $ | 1,000.00 | $ | 1,021.13 | $ | 3.77 | 0.75 | % | ||||||||
Class C | ||||||||||||||||
Actual | $ | 1,000.00 | $ | 1,003.93 | $ | 7.47 | 1.50 | % | ||||||||
Hypothetical (5% return before expenses) | $ | 1,000.00 | $ | 1,017.40 | $ | 7.52 | 1.50 | % | ||||||||
Administrator Class | ||||||||||||||||
Actual | $ | 1,000.00 | $ | 1,008.56 | $ | 2.75 | 0.55 | % | ||||||||
Hypothetical (5% return before expenses) | $ | 1,000.00 | $ | 1,022.13 | $ | 2.77 | 0.55 | % | ||||||||
Institutional Class | ||||||||||||||||
Actual | $ | 1,000.00 | $ | 1,008.90 | $ | 2.40 | 0.48 | % | ||||||||
Hypothetical (5% return before expenses) | $ | 1,000.00 | $ | 1,022.48 | $ | 2.41 | 0.48 | % | ||||||||
| 1 | Expenses paid is equal to the annualized net expense ratio of each class multiplied by the average account value over the period, multiplied by the number of days in the most recent fiscal half-year divided by the number of days in the fiscal year (to reflect the one-half-year period). |
10 | Wells Fargo California Tax-Free Fund
Portfolio of investments—June 30, 2020
| Interest rate | Maturity date | Principal | Value | |||||||||||||
| Municipal Obligations: 98.94% | ||||||||||||||||
California: 94.59% | ||||||||||||||||
| Airport Revenue: 4.68% | ||||||||||||||||
California Municipal Finance Authority AMT Senior Lien Linxs Apartment Project Series A | 5.00 | % | 12-31-2043 | $ | 5,730,000 | $ | 6,497,181 | |||||||||
Los Angeles CA Department of Airports AMT Subordinated Bond Series A | 4.00 | 5-15-2044 | 3,500,000 | 3,891,440 | ||||||||||||
Los Angeles CA Department of Airports AMT Subordinated Bond Series A | 5.00 | 5-15-2047 | 5,000,000 | 5,832,800 | ||||||||||||
Sacramento County CA Airport System Refunding Bond AMT Senior Series C | 5.00 | 7-1-2037 | 7,300,000 | 8,748,758 | ||||||||||||
Sacramento County CA Airport System Refunding Bond AMT Senior Series C | 5.00 | 7-1-2038 | 3,000,000 | 3,585,780 | ||||||||||||
San Diego County CA Regional Airport Authority Revenue Refunding Bond Subordinated Series A | 5.00 | 7-1-2044 | 3,045,000 | 3,750,313 | ||||||||||||
San Francisco City & County Airport Commission San Francisco International Airport Series A | 5.00 | 5-1-2047 | 7,715,000 | 8,945,928 | ||||||||||||
San Francisco City & County Airport Commission San Francisco International Airport Series E | 5.00 | 5-1-2050 | 5,000,000 | 5,985,100 | ||||||||||||
San Jose CA Airport AMT Refunding Bond Series A | 5.00 | 3-1-2047 | 4,000,000 | 4,608,240 | ||||||||||||
San Jose CA Airport Refunding Bond Series B | 5.00 | 3-1-2042 | 1,750,000 | 2,086,595 | ||||||||||||
| 53,932,135 | ||||||||||||||||
|
| |||||||||||||||
| Education Revenue: 5.66% | ||||||||||||||||
California Educational Facilities Authority Loma Linda University Series A | 5.00 | 4-1-2042 | 2,645,000 | 2,927,645 | ||||||||||||
California Financial Authority Charter School Palmdale Aerospace Academy Project 144A | 5.00 | 7-1-2046 | 1,670,000 | 1,715,224 | ||||||||||||
California Municipal Finance Authority California Baptist University Series A 144A | 4.00 | 11-1-2021 | 400,000 | 402,956 | ||||||||||||
California Municipal Finance Authority California Baptist University Series A 144A | 5.00 | 11-1-2025 | 1,025,000 | 1,080,852 | ||||||||||||
California Municipal Finance Authority Charter School Albert Einstein Academies Project Series A | 6.75 | 8-1-2033 | 1,525,000 | 1,678,324 | ||||||||||||
California Municipal Finance Authority Charter School Albert Einstein Academies Project Series A | 7.13 | 8-1-2043 | 1,000,000 | 1,097,900 | ||||||||||||
California Municipal Finance Authority Refunding Bond Biola University Incorporated | 5.00 | 10-1-2035 | 600,000 | 664,164 | ||||||||||||
California Municipal Financing Authority Charter School Palmdale Aerospace Academy Project 144A | 5.00 | 7-1-2041 | 1,250,000 | 1,292,488 | ||||||||||||
California Municipal Finance Authority Education Revenue Literacy First Charter Schools | 5.00 | 12-1-2039 | 1,390,000 | 1,586,838 | ||||||||||||
California School Finance Authority Bright Star Schools Obligation Group 144A | 5.00 | 6-1-2047 | 1,000,000 | 1,044,490 | ||||||||||||
California School Finance Authority Bright Star Schools Obligation Group 144A | 5.00 | 6-1-2054 | 1,000,000 | 1,040,230 | ||||||||||||
California School Finance Authority Green Dot Public Schools Projects 144A | 4.00 | 8-1-2025 | 475,000 | 514,781 | ||||||||||||
California School Finance Authority Green Dot Public Schools Projects 144A | 5.00 | 8-1-2035 | 2,525,000 | 2,775,379 | ||||||||||||
California School Finance Authority KIPP Louisiana School Projects Series A 144A | 5.00 | 7-1-2035 | 1,000,000 | 1,107,720 | ||||||||||||
California School Finance Authority Rocketship Education Series A 144A | 5.00 | 6-1-2036 | 945,000 | 961,415 | ||||||||||||
California School Finance Authority Rocketship Education Series A 144A | 5.00 | 6-1-2046 | 2,100,000 | 2,122,680 | ||||||||||||
California Statewide CDA Refunding Bond California Baptist University Series A 144A | 5.00 | 11-1-2032 | 1,135,000 | 1,202,737 | ||||||||||||
California Statewide CDA Refunding Bond California Baptist University Series A 144A | 5.00 | 11-1-2041 | 2,875,000 | 2,967,374 | ||||||||||||
California Statewide CDA School Facility Alliance for College-Ready Public Schools | 6.75 | 7-1-2031 | 1,625,000 | 1,727,765 | ||||||||||||
California University Systemwide Refunding Bond Series A | 4.00 | 11-1-2038 | 8,000,000 | 9,039,040 | ||||||||||||
California University Systemwide Refunding Bond Series A | 5.00 | 11-1-2045 | 6,400,000 | 7,603,456 | ||||||||||||
University of California Series AI | 5.00 | 5-15-2038 | 2,000,000 | 2,220,400 | ||||||||||||
University of California Series K | 4.00 | 5-15-2046 | 5,295,000 | 5,856,800 | ||||||||||||
University of California Series M | 4.00 | 5-15-2047 | 11,155,000 | 12,504,755 | ||||||||||||
| 65,135,413 | ||||||||||||||||
|
| |||||||||||||||
The accompanying notes are an integral part of these financial statements.
Wells Fargo California Tax-Free Fund | 11
Portfolio of investments—June 30, 2020
| Interest rate | Maturity date | Principal | Value | |||||||||||||
| GO Revenue: 31.60% |
| |||||||||||||||
Alhambra CA Unified School District Election of 2008 Series B (AGM Insured) | 6.00 | % | 8-1-2029 | $ | 4,100,000 | $ | 4,354,692 | |||||||||
Alvord CA Unified School District Election of 2012 Series A (AGM Insured) | 5.25 | 8-1-2037 | 1,620,000 | 1,820,929 | ||||||||||||
Antelope Valley CA Community College District Election of 2016 Series B | 3.00 | 8-1-2050 | 4,500,000 | 4,689,945 | ||||||||||||
Bassett CA Unified School District Refunding Bond Series B (BAM Insured) | 5.00 | 8-1-2027 | 1,050,000 | 1,266,006 | ||||||||||||
Beaumont CA Unified School District Election of 2008 Series D (BAM Insured) | 5.25 | 8-1-2044 | 2,000,000 | 2,428,260 | ||||||||||||
Cabrillo CA Unified School District CAB Series A (Ambac Insured) ¤ | 0.00 | 8-1-2021 | 1,500,000 | 1,492,230 | ||||||||||||
California | 5.25 | 11-1-2040 | 3,000,000 | 3,043,140 | ||||||||||||
California Statewide Series B (1 Month LIBOR +0.76%) ± | 0.89 | 12-1-2031 | 2,500,000 | 2,498,600 | ||||||||||||
California Various Purposes | 4.00 | 3-1-2050 | 6,000,000 | 7,022,880 | ||||||||||||
California Various Purposes | 5.00 | 9-1-2029 | 1,475,000 | 1,552,777 | ||||||||||||
California Various Purposes | 5.00 | 9-1-2032 | 5,100,000 | 5,717,151 | ||||||||||||
California Various Purposes (BAM Insured) | 5.00 | 9-1-2035 | 35,000,000 | 42,665,700 | ||||||||||||
California Various Purposes | 5.00 | 2-1-2038 | 5,000,000 | 5,475,050 | ||||||||||||
California Various Purposes | 5.00 | 10-1-2039 | 5,000,000 | 5,979,400 | ||||||||||||
California Various Purposes | 5.00 | 8-1-2046 | 10,000,000 | 11,941,300 | ||||||||||||
California Various Purposes | 5.00 | 4-1-2049 | 2,500,000 | 3,167,650 | ||||||||||||
California Various Purposes | 5.25 | 9-1-2028 | 5,000,000 | 5,270,300 | ||||||||||||
California Various Purposes | 5.25 | 4-1-2035 | 12,640,000 | 13,600,134 | ||||||||||||
California Various Purposes | 5.60 | 3-1-2036 | 295,000 | 296,153 | ||||||||||||
Center Joint Unified School District CAB Series C (National Insured) ¤ | 0.00 | 9-1-2021 | 5,000,000 | 4,961,700 | ||||||||||||
Centinela Valley CA Union High School District Election of 2008 Series B | 6.00 | 8-1-2036 | 2,500,000 | 2,924,825 | ||||||||||||
Centinela Valley CA Union High School District Election of 2008 Series C | 5.00 | 8-1-2035 | 2,000,000 | 2,243,380 | ||||||||||||
Cerritos CA Community College CAB Election of 2004 ¤ | 0.00 | 8-1-2029 | 1,750,000 | 1,550,115 | ||||||||||||
Cerritos CA Community College CAB Election of 2004 ¤ | 0.00 | 8-1-2033 | 1,500,000 | 1,183,545 | ||||||||||||
College of the Sequoias Tulare Area Improvement District #3 CAB Election of 2008 Series A (AGC Insured) ¤ | 0.00 | 8-1-2024 | 1,000,000 | 961,470 | ||||||||||||
Compton CA Community College CAB Election of 2002 Series C ¤ | 0.00 | 8-1-2035 | 3,445,000 | 2,455,837 | ||||||||||||
Contra Costa County CA Community College District Election of 2006 | 5.00 | 8-1-2038 | 3,250,000 | 3,718,033 | ||||||||||||
Delano CA Union High School Election of 2010 Series B (AGM Insured) | 5.75 | 8-1-2035 | 4,510,000 | 4,526,913 | ||||||||||||
Escondido CA Union High School CAB Election of 2008 Series A (AGC Insured) ¤ | 0.00 | 8-1-2027 | 8,385,000 | 7,663,974 | ||||||||||||
Escondido CA Union School District | 4.00 | 8-1-2043 | 2,150,000 | 2,438,380 | ||||||||||||
Eureka CA City Schools Election of 2014 (BAM Insured) %% | 4.00 | 8-1-2049 | 3,750,000 | 4,232,588 | ||||||||||||
Garden Grove CA Unified School District Election of 2010 Series C | 5.25 | 8-1-2037 | 2,000,000 | 2,283,420 | ||||||||||||
Hayward CA Unified School District Refunding Bond | 5.00 | 8-1-2038 | 6,000,000 | 6,893,580 | ||||||||||||
Inglewood CA Unified School District Election of 2012 GO Bond Series B (BAM Insured) | 5.00 | 8-1-2036 | 200,000 | 240,074 | ||||||||||||
Inglewood CA Unified School District Election of 2012 GO Bond Series B (BAM Insured) | 5.00 | 8-1-2038 | 500,000 | 597,620 | ||||||||||||
Lancaster CA School District Election of 2012 Series D (BAM Insured) | 4.00 | 8-1-2045 | 5,970,000 | 6,728,548 | ||||||||||||
Lancaster CA School District Election of 2012 Series D (BAM Insured) | 4.00 | 8-1-2047 | 4,305,000 | 4,844,718 | ||||||||||||
Long Beach CA Unified School District CAB Election of 2008 Series B ¤ | 0.00 | 8-1-2035 | 2,000,000 | 1,434,260 | ||||||||||||
Long Beach CA Unified School District Election of 2008 Series F | 3.00 | 8-1-2047 | 15,000,000 | 15,728,400 | ||||||||||||
Long Beach CA Unified School District Unrefunded Bond Election of 2008 Series A | 5.50 | 8-1-2026 | 95,000 | 95,395 | ||||||||||||
Los Angeles CA Community College District Refunding Bond | 4.00 | 8-1-2038 | 10,000,000 | 11,307,900 | ||||||||||||
Lynwood CA Unified School District Election of 2012 Series A (AGM Insured) | 5.00 | 8-1-2033 | 5,000 | 5,695 | ||||||||||||
Merced CA City School District Election of 2014 | 5.00 | 8-1-2045 | 1,000,000 | 1,174,140 | ||||||||||||
Merced CA Union High School District CAB Series C ¤ | 0.00 | 8-1-2032 | 3,380,000 | 2,718,365 | ||||||||||||
Mount San Antonio CA Community College District CAB Election of 2008 Series A ¤ | 0.00 | 8-1-2024 | 1,610,000 | 1,563,777 | ||||||||||||
Natomas CA Unified School District Series 1999 (National Insured) | 5.95 | 9-1-2021 | 170,000 | 175,938 | ||||||||||||
New Haven CA Unified School District Election of 2014 Series C | 3.00 | 8-1-2049 | 2,750,000 | 2,900,178 | ||||||||||||
Norwalk-La Mirada CA Unified School District CAB Election of 2002 Series D (AGM Insured) ¤ | 0.00 | 8-1-2023 | 1,500,000 | 1,471,185 | ||||||||||||
Oakland CA Unified School District Alameda County | 5.00 | 8-1-2029 | 10,125,000 | 12,144,229 | ||||||||||||
The accompanying notes are an integral part of these financial statements.
12 | Wells Fargo California Tax-Free Fund
Portfolio of investments—June 30, 2020
| Interest rate | Maturity date | Principal | Value | |||||||||||||
| GO Revenue (continued) | ||||||||||||||||
Oakland CA Unified School District Election of 2012 | 5.50 | % | 8-1-2023 | $ | 500,000 | $ | 557,890 | |||||||||
Oakland CA Unified School District Election of 2012 | 6.63 | 8-1-2038 | 7,750,000 | 8,274,908 | ||||||||||||
Oakland CA Unified School District Election of 2012 Series A | 5.00 | 8-1-2040 | 3,600,000 | 4,138,920 | ||||||||||||
Oxnard CA School District Election of 2012 Series D (AGM Insured) | 5.00 | 8-1-2034 | 1,695,000 | 2,017,643 | ||||||||||||
Pajaro Valley CA Unified School District Election of 2012 Series A | 5.00 | 8-1-2038 | 1,700,000 | 1,941,995 | ||||||||||||
Paramount CA Unified School District CAB Election of 2006 ¤ | 0.00 | 8-1-2033 | 2,500,000 | 1,919,625 | ||||||||||||
Piedmont CA Unified School District Election of 2016 | 3.00 | 8-1-2049 | 10,325,000 | 10,951,831 | ||||||||||||
Pomona CA Unified School District Series A (National Insured) | 6.55 | 8-1-2029 | 1,480,000 | 1,932,954 | ||||||||||||
Poway CA Unified School District CAB Election of 2008 Improvement District 07-1-A ¤ | 0.00 | 8-1-2024 | 1,800,000 | 1,742,634 | ||||||||||||
Rialto CA Unified School District CAB Election of 2010 Series A (AGM Insured) ¤ | 0.00 | 8-1-2026 | 3,320,000 | 3,099,087 | ||||||||||||
Sacramento CA Unified School District Election of 2012 Series A (BAM Insured) | 5.25 | 8-1-2033 | 1,000,000 | 1,104,510 | ||||||||||||
Sacramento CA Unified School District Election of 2012 Series C (AGM Insured) | 5.00 | 8-1-2033 | 2,735,000 | 3,165,325 | ||||||||||||
San Bernardino County CA Community Election of 2008 Series D | 5.00 | 8-1-2045 | 2,000,000 | 2,452,060 | ||||||||||||
San Bernardino County CA Unified School District Election of 2012 Series C (AGM Insured) | 5.00 | 8-1-2040 | 8,000,000 | 9,423,200 | ||||||||||||
San Diego CA Community College Election of 2002 | 5.00 | 8-1-2031 | 4,000,000 | 4,569,400 | ||||||||||||
San Diego CA Unified School District | 4.00 | 7-1-2047 | 2,025,000 | 2,292,462 | ||||||||||||
San Gorgonio CA Memorial Healthcare Refunding Bond | 5.00 | 8-1-2032 | 1,750,000 | 1,833,930 | ||||||||||||
San Gorgonio CA Memorial Healthcare Refunding Bond | 5.50 | 8-1-2028 | 2,525,000 | 2,726,066 | ||||||||||||
San Joaquin CA Delta Community College District Election of 2004 Series C | 5.00 | 8-1-2033 | 3,195,000 | 3,784,957 | ||||||||||||
San Joaquin CA Delta Community College District Election of 2004 Series C | 5.00 | 8-1-2034 | 3,315,000 | 3,927,115 | ||||||||||||
San Jose CA Unified School District Santa Clara County | 4.00 | 8-1-2042 | 4,000,000 | 4,692,520 | ||||||||||||
San Mateo County CA Jefferson Union High School District CAB Election of 2006 Series D ¤ | 0.00 | 8-1-2033 | 7,000,000 | 2,625,210 | ||||||||||||
San Mateo County CA Jefferson Union High School District CAB Election of 2006 Series D ¤ | 0.00 | 8-1-2036 | 11,130,000 | 3,256,304 | ||||||||||||
San Mateo County CA Jefferson Union High School District Prerefunded CAB Election of 2006 Series D ¤ | 0.00 | 8-1-2034 | 6,915,000 | 2,384,845 | ||||||||||||
San Mateo County CA Jefferson Union High School District Unrefunded CAB Election of 2006 Series D ¤ | 0.00 | 8-1-2034 | 2,990,000 | 1,030,623 | ||||||||||||
San Rafael CA City High School District CAB Election of 2002 Series B (National Insured) ¤ | 0.00 | 8-1-2023 | 1,260,000 | 1,235,039 | ||||||||||||
San Rafael City CA High School District Election of 2015 Series C | 4.00 | 8-1-2043 | 1,500,000 | 1,753,185 | ||||||||||||
Sanger CA Unified School District Refunding Bond (National Insured) | 5.60 | 8-1-2023 | 405,000 | 424,877 | ||||||||||||
Santa Ana CA Unified School District CAB Election of 2008 Series B (AGC Insured) ¤ | 0.00 | 8-1-2038 | 15,000,000 | 9,563,850 | ||||||||||||
Santa Rosa CA High School District Prerefunded Bond | 5.00 | 8-1-2024 | 750,000 | 821,738 | ||||||||||||
Santa Rosa CA High School District Unrefunded Bond | 5.00 | 8-1-2024 | 255,000 | 278,129 | ||||||||||||
Sierra Kings CA Health Care District | 5.00 | 8-1-2028 | 1,000,000 | 1,148,230 | ||||||||||||
Sierra Kings CA Health Care District | 5.00 | 8-1-2032 | 1,500,000 | 1,696,860 | ||||||||||||
Sierra Kings CA Health Care District | 5.00 | 8-1-2037 | 1,750,000 | 1,946,420 | ||||||||||||
Simi Valley CA Unified School District | 4.00 | 8-1-2048 | 3,250,000 | 3,663,595 | ||||||||||||
Sonoma Valley CA Unified School District CAB Election of 2010 Series A ¤ | 0.00 | 8-1-2027 | 1,020,000 | 938,869 | ||||||||||||
South Pasadena CA Unified School District Series A (FGIC Insured) | 5.55 | 11-1-2020 | 115,000 | 117,052 | ||||||||||||
Stockton CA Unified School District Election of 2012 Series A (AGM Insured) | 5.00 | 8-1-2038 | 1,025,000 | 1,164,933 | ||||||||||||
Tulare CA Local Health Care District Refunding Bond (BAM Insured) | 4.00 | 8-1-2039 | 1,850,000 | 2,120,581 | ||||||||||||
Washington Township CA Health Care District Election of 2004 Series B | 5.50 | 8-1-2038 | 1,500,000 | 1,703,145 | ||||||||||||
West Contra Costa CA Unified School District (AGM Insured) | 5.25 | 8-1-2024 | 1,350,000 | 1,422,482 | ||||||||||||
West Contra Costa CA Unified School District Election of 2010 Series F (AGM Insured) | 4.00 | 8-1-2049 | 1,265,000 | 1,467,767 | ||||||||||||
West Contra Costa CA Unified School District Election of 2012 Series E (AGM Insured) | 4.00 | 8-1-2049 | 2,060,000 | 2,390,197 | ||||||||||||
West Contra Costa CA Unified School District CAB Election of 2005 Series B | 6.00 | 8-1-2027 | 1,080,000 | 1,440,914 | ||||||||||||
West Contra Costa CA Unified School District CAB Election of 2005 Series C-1 (AGC Insured) ¤## | 0.00 | 8-1-2021 | 6,000,000 | 5,959,920 | ||||||||||||
Wiseburn CA School District CAB (AGC Insured) ¤ | 0.00 | 8-1-2027 | 1,525,000 | 1,391,898 | ||||||||||||
| 363,946,174 | ||||||||||||||||
|
| |||||||||||||||
The accompanying notes are an integral part of these financial statements.
Wells Fargo California Tax-Free Fund | 13
Portfolio of investments—June 30, 2020
| Interest rate | Maturity date | Principal | Value | |||||||||||||
| Health Revenue: 14.08% |
| |||||||||||||||
Association of Bay Area Governments California Finance Authority for Nonprofit Corporation O’Connor Woods Project | 5.00 | % | 1-1-2043 | $ | 5,000,000 | $ | 5,453,100 | |||||||||
Association of Bay Area Governments California Finance Authority for Nonprofit Corporation Senior Living Odd Fellows Home of California Series A | 5.00 | 4-1-2042 | 1,100,000 | 1,198,758 | ||||||||||||
California HFFA Catholic Healthcare West Series A | 5.25 | 3-1-2023 | 3,000,000 | 3,073,770 | ||||||||||||
California HFFA El Camino Hospital | 5.00 | 2-1-2035 | 3,000,000 | 3,581,310 | ||||||||||||
California HFFA LA Biomedical Research Institute at Harbor-UCLA Medical Center | 5.00 | 9-1-2048 | 6,095,000 | 6,599,239 | ||||||||||||
California HFFA Nevada Methodist Homes (California Mortgage Insured) | 5.00 | 7-1-2030 | 1,830,000 | 2,154,349 | ||||||||||||
California HFFA Nevada Methodist Homes (California Mortgage Insured) | 5.00 | 7-1-2035 | 1,000,000 | 1,157,820 | ||||||||||||
California HFFA Nevada Methodist Homes (California Mortgage Insured) | 5.00 | 7-1-2045 | 4,500,000 | 5,124,465 | ||||||||||||
California HFFA Refunding Bond Cedars Sinai Medical Center Series B | 4.00 | 8-15-2039 | 10,500,000 | 11,695,845 | ||||||||||||
California HFFA Refunding Bond Children’s Hospital Series A | 5.00 | 8-15-2047 | 10,050,000 | 11,266,553 | ||||||||||||
California HFFA City of Hope Obligated Group | 5.00 | 11-15-2049 | 2,000,000 | 2,324,420 | ||||||||||||
California HFFA Stanford Health Care Series A | 4.00 | 8-15-2050 | 11,000,000 | 12,686,630 | ||||||||||||
California HFFA Sutter Health Series B | 5.00 | 11-15-2046 | 5,000,000 | 5,864,950 | ||||||||||||
California HFFA Sutter Health Series D | 5.25 | 8-15-2031 | 3,100,000 | 3,243,127 | ||||||||||||
California Municipal Finance Authority Refunding Bond Channing House Project Series A | 5.00 | 5-15-2034 | 1,000,000 | 1,195,260 | ||||||||||||
California Municipal Finance Authority Refunding Bond Community Medical Centers Series A | 5.00 | 2-1-2047 | 6,625,000 | 7,445,771 | ||||||||||||
California Municipal Finance Authority Refunding Bond Eisenhower Medical Center Series A | 5.00 | 7-1-2047 | 1,400,000 | 1,567,104 | ||||||||||||
California PFA Refunding Bond Henry Mayo Newhall Hospital | 5.00 | 10-15-2037 | 500,000 | 556,470 | ||||||||||||
California PFA Refunding Bond Henry Mayo Newhall Hospital | 5.00 | 10-15-2047 | 5,365,000 | 5,864,321 | ||||||||||||
California State Health Facilities Financing Authority | 4.00 | 11-15-2048 | 5,000,000 | 5,539,350 | ||||||||||||
California State Health Facilities Financing Authority | 4.00 | 11-1-2051 | 3,000,000 | 3,366,810 | ||||||||||||
California State Health Facilities Financing Authority Series A | 4.00 | 11-1-2040 | 1,375,000 | 1,585,815 | ||||||||||||
California State Municipal Finance Authority Revenue | 4.00 | 12-1-2039 | 1,240,000 | 1,437,693 | ||||||||||||
California State Municipal Finance Authority Revenue | 4.00 | 12-1-2049 | 2,915,000 | 3,293,017 | ||||||||||||
California State Municipal Finance Authority Revenue | 5.00 | 7-1-2039 | 1,000,000 | 1,228,520 | ||||||||||||
California State Municipal Finance Authority Revenue | 5.00 | 7-1-2049 | 2,650,000 | 3,196,165 | ||||||||||||
California Statewide CDA Adventist Health System Series A | 5.00 | 3-1-2045 | 2,500,000 | 2,829,400 | ||||||||||||
California Statewide CDA Enloe Medical Center (Ambac Insured) | 5.00 | 8-15-2033 | 1,650,000 | 1,981,650 | ||||||||||||
California Statewide CDA Enloe Medical Center (Ambac Insured) | 5.00 | 8-15-2035 | 1,000,000 | 1,194,520 | ||||||||||||
California Statewide CDA Enloe Medical Center (Ambac Insured) | 5.00 | 8-15-2038 | 2,000,000 | 2,372,740 | ||||||||||||
California Statewide CDA Loma Linda University Medical Center Refunding Bond Series A | 5.25 | 12-1-2044 | 5,150,000 | 5,527,598 | ||||||||||||
California Statewide CDA Redwoods Projects | 5.13 | 11-15-2035 | 1,500,000 | 1,707,435 | ||||||||||||
California Statewide CDA Revenue Refunding Bond Adventist Health System West Series A | 5.00 | 3-1-2048 | 5,000,000 | 5,854,650 | ||||||||||||
California Statewide Communities Marin General Hospital Series A | 5.00 | 8-1-2036 | 700,000 | 841,974 | ||||||||||||
California Statewide Communities Marin General Hospital Series A | 5.00 | 8-1-2037 | 500,000 | 599,745 | ||||||||||||
California Statewide Communities Marin General Hospital Series A | 5.00 | 8-1-2038 | 450,000 | 538,403 | ||||||||||||
Palomar Health CA Refunding Bond | 5.00 | 11-1-2042 | 4,000,000 | 4,525,440 | ||||||||||||
San Buenaventura CA Community Mental Health System | 8.00 | 12-1-2031 | 1,615,000 | 1,731,797 | ||||||||||||
University of California Regents Medical Center Prerefunded Bond Series J | 5.25 | 5-15-2038 | 7,790,000 | 8,854,815 | ||||||||||||
University of California Regents Medical Center Series J | 5.00 | 5-15-2033 | 2,265,000 | 2,561,942 | ||||||||||||
University of California Regents Medical Center Series L | 4.00 | 5-15-2044 | 4,065,000 | 4,440,037 | ||||||||||||
University of California Regents Medical Center Unrefunded Bond Series J | 5.25 | 5-15-2038 | 2,210,000 | 2,435,531 | ||||||||||||
Washington Township CA Health Care District Series A | 5.00 | 7-1-2026 | 1,190,000 | 1,393,002 | ||||||||||||
Washington Township CA Health Care District Series A | 5.00 | 7-1-2042 | 1,000,000 | 1,133,390 | ||||||||||||
| 162,224,701 | ||||||||||||||||
|
| |||||||||||||||
The accompanying notes are an integral part of these financial statements.
14 | Wells Fargo California Tax-Free Fund
Portfolio of investments—June 30, 2020
| Interest rate | Maturity date | Principal | Value | |||||||||||||
| Housing Revenue: 3.75% |
| |||||||||||||||
California Community Housing Agency Essential Housing Revenue Serenity at Larkspur Series C 144A | 5.00 | % | 2-1-2050 | $ | 3,000,000 | $ | 3,221,880 | |||||||||
California Community Housing Agency Workforce Apartments Series A 144A | 5.00 | 4-1-2049 | 3,000,000 | 3,205,710 | ||||||||||||
California HFA Municipal Certificate of Participation Series 2 Class A | 4.00 | 3-20-2033 | 8,563,063 | 9,178,490 | ||||||||||||
California HFA Municipal Certificate of Participation Series 2019-1 Class A | 4.25 | 1-15-2035 | 4,941,628 | 5,393,886 | ||||||||||||
California Municipal Finance Authority Mobile Senior Caritas Projects Series A | 5.00 | 8-15-2029 | 500,000 | 592,865 | ||||||||||||
California Municipal Finance Authority Student Housing Revenue CHF Davis I LLC West Village Projects | 5.00 | 5-15-2051 | 6,700,000 | 7,498,171 | ||||||||||||
California Municipal Finance Authority Student Housing Revenue CHF Riverside I LLC Projects | 5.00 | 5-15-2029 | 625,000 | 757,656 | ||||||||||||
California Municipal Finance Authority Student Housing Revenue CHF Riverside I LLC Projects | 5.00 | 5-15-2052 | 5,650,000 | 6,386,873 | ||||||||||||
California Statewide CDA Poway Retirement Housing Foundation Housing Incorporated Series A | 5.25 | 11-15-2035 | 1,500,000 | 1,678,680 | ||||||||||||
Contra Costa County CA Home Mortgage Revenue Bonds GNMA Mortgage-Backed Securities Program (GNMA Insured) | 7.75 | 5-1-2022 | 60,000 | 64,354 | ||||||||||||
Independent Cities CA Finance Authority Mobile Home Park Revenue | 5.00 | 5-15-2048 | 2,000,000 | 2,356,220 | ||||||||||||
Independent Cities CA Finance Refunding Bond Sanitary Juan Mobile Estates | 5.00 | 8-15-2030 | 1,000,000 | 1,138,760 | ||||||||||||
Independent Cities CA Finance Refunding Bond Santa Rose Leisure Mobile | 5.00 | 8-15-2046 | 1,570,000 | 1,774,916 | ||||||||||||
| 43,248,461 | ||||||||||||||||
|
| |||||||||||||||
| Miscellaneous Revenue: 14.03% | ||||||||||||||||
Alameda CA Joint Powers Authority Multiple Capital Projects Series A | 5.00 | 12-1-2034 | 1,005,000 | 1,142,554 | ||||||||||||
Anaheim CA PFA CAB Subordinate Lien Bond Public Improvements Project Series C (AGM Insured) ¤ | 0.00 | 9-1-2025 | 10,000,000 | 9,515,500 | ||||||||||||
Anaheim CA PFA Convention Center Expansion Project Series A | 5.00 | 5-1-2039 | 3,000,000 | 3,292,740 | ||||||||||||
Anaheim CA PFA Convention Center Expansion Project Series A | 5.00 | 5-1-2046 | 4,200,000 | 4,576,320 | ||||||||||||
California Enterprise Development Authority Lease Revenue Riverside County Library Facilities Project | 4.00 | 11-1-2049 | 1,900,000 | 2,126,100 | ||||||||||||
California Infrastructure & Economic Development Bank Lease Revenue | 5.00 | 8-1-2044 | 4,000,000 | 4,963,240 | ||||||||||||
California Infrastructure & Economic Development King City Joint Union High School | 5.75 | 8-15-2029 | 2,150,000 | 2,154,150 | ||||||||||||
California Public Works Board California State University Projects Series B-1 | 5.70 | 3-1-2035 | 2,210,000 | 2,218,354 | ||||||||||||
California Public Works Board Judicial Council Projects Series A | 5.00 | 3-1-2038 | 7,000,000 | 7,645,260 | ||||||||||||
California Public Works Board Judicial Council Projects Series D | 5.25 | 12-1-2025 | 4,000,000 | 4,271,160 | ||||||||||||
California Public Works Board Various Capital Projects Series A | 5.00 | 4-1-2037 | 4,925,000 | 5,249,361 | ||||||||||||
California Public Works Board Various Capital Projects Series G | 5.00 | 11-1-2037 | 23,000,000 | 25,015,490 | ||||||||||||
California Public Works Board Various Capital Projects Series I | 5.50 | 11-1-2033 | 2,000,000 | 2,296,080 | ||||||||||||
California Public Works University of California Board of Regents Series G | 5.00 | 12-1-2030 | 9,850,000 | 10,514,284 | ||||||||||||
California Statewide CDA Water & Wastewater Pooled Financing Program Series B (AGM Insured) | 5.25 | 10-1-2027 | 1,040,000 | 1,043,983 | ||||||||||||
California Statewide Communities Series A | 5.00 | 9-2-2047 | 2,000,000 | 2,250,260 | ||||||||||||
Compton CA PFA Refunding Bond 144A | 4.00 | 9-1-2027 | 5,620,000 | 5,281,564 | ||||||||||||
Emeryville CA PFA Assessment District Refinancing | 5.90 | 9-2-2021 | 400,000 | 401,332 | ||||||||||||
Fullerton CA Joint Union High School Project Certificate of Participation (BAM Insured) | 5.00 | 9-1-2035 | 1,385,000 | 1,624,093 | ||||||||||||
Irvine CA Improvement Bond Act 1915 Limited Obligation Reassessment District #15-2 | 5.00 | 9-2-2025 | 725,000 | 856,435 | ||||||||||||
Irvine CA Improvement Bond Act 1915 Limited Obligation Reassessment District #15-2 | 5.00 | 9-2-2026 | 400,000 | 466,464 | ||||||||||||
Irvine CA Improvement Bond Act 1915 Limited Obligation Reassessment District #15-2 | 5.00 | 9-2-2042 | 1,500,000 | 1,660,995 | ||||||||||||
Los Angeles CA Community Redevelopment Vermont Manchester Social Services Project (Ambac Insured) | 5.00 | 9-1-2025 | 2,310,000 | 2,318,570 | ||||||||||||
Los Angeles CA Public Works Financing Authority Series A | 5.00 | 12-1-2039 | 2,860,000 | 3,315,512 | ||||||||||||
The accompanying notes are an integral part of these financial statements.
Wells Fargo California Tax-Free Fund | 15
Portfolio of investments—June 30, 2020
| Interest rate | Maturity date | Principal | Value | |||||||||||||
| Miscellaneous Revenue (continued) | ||||||||||||||||
Modesto CA Irrigation District Financing Authority Series A | 5.00 | % | 10-1-2040 | $ | 3,500,000 | $ | 4,098,115 | |||||||||
Montclair CA PFA Lease Refunding Bond (AGM Insured) | 5.00 | 10-1-2035 | 2,400,000 | 2,789,352 | ||||||||||||
Mountain House CA Financing Authority Utility System Revenue Series A | 5.00 | 12-1-2034 | 535,000 | 654,193 | ||||||||||||
Riverside County CA Asset Leasing Corporation Riverside County Hospital Project (National Insured) ¤ | 0.00 | 6-1-2026 | 10,000,000 | 9,279,500 | ||||||||||||
Sacramento CA City Financing Authority Refunding Bond Master Lease Program Facilities (BAM Insured) | 5.00 | 12-1-2035 | 1,300,000 | 1,559,272 | ||||||||||||
Sacramento CA City Financing Authority Series A (Ambac Insured) | 5.40 | 11-1-2020 | 470,000 | 477,722 | ||||||||||||
Sacramento CA City School Joint Refunding Bond Series A (BAM Insured) | 5.00 | 3-1-2040 | 2,165,000 | 2,408,671 | ||||||||||||
San Jose CA Unified School District CAB (AGM Insured) ¤ | 0.00 | 1-1-2021 | 1,205,000 | 1,202,662 | ||||||||||||
San Jose CA Unified School District CAB (AGM Insured) ¤ | 0.00 | 1-1-2026 | 3,175,000 | 3,033,681 | ||||||||||||
San Marino CA Unified School District Certificate of Participation Los Angeles County Schools Pooled Financing Program Series A | 5.00 | 12-1-2041 | 500,000 | 500,975 | ||||||||||||
San Mateo Foster City CA Public Financing Authority Revenue Sanitary Mateo Street & Flood Control Projects | 4.00 | 5-1-2045 | 3,750,000 | 4,345,613 | ||||||||||||
San Ysidro CA School District Certificate of Participation School Facilities Bridge Funding Program (BAM Insured) | 5.00 | 9-1-2037 | 250,000 | 267,788 | ||||||||||||
San Ysidro CA School District Certificate of Participation School Facilities Bridge Funding Program (BAM Insured) | 5.00 | 9-1-2042 | 625,000 | 667,163 | ||||||||||||
San Ysidro CA School District Certificate of Participation School Facilities Bridge Funding Program (BAM Insured) | 5.00 | 9-1-2047 | 1,000,000 | 1,064,890 | ||||||||||||
Simi Valley CA Unified School District Capital Improvement Projects (Ambac Insured) | 5.25 | 8-1-2022 | 930,000 | 952,106 | ||||||||||||
Stockton CA Unified School District Community Improvement Project | 5.00 | 2-1-2033 | 550,000 | 683,320 | ||||||||||||
Sutter Butte CA Flood Control Agency (BAM Insured) | 5.00 | 10-1-2040 | 3,545,000 | 4,201,321 | ||||||||||||
Torrance CA Certificate of Participation | 5.25 | 6-1-2039 | 5,385,000 | 6,209,605 | ||||||||||||
Union Sanitary District CA Financing Authority Revenue Series A | 3.00 | 9-1-2045 | 2,500,000 | 2,639,475 | ||||||||||||
Union Sanitary District CA Financing Authority Revenue Series A | 3.00 | 9-1-2050 | 3,000,000 | 3,148,080 | ||||||||||||
Upland CA Certificate of Participation San Antonio Regional Hospital | 5.00 | 1-1-2047 | 1,955,000 | 2,155,563 | ||||||||||||
Ventura County CA PFA Series A | 5.00 | 11-1-2038 | 4,545,000 | 5,037,360 | ||||||||||||
| 161,576,228 | ||||||||||||||||
|
| |||||||||||||||
| Tax Revenue: 11.06% | ||||||||||||||||
Beaumont CA Community Facilities District #93-1 Special Tax Improvement Area Number 17C | 5.00 | 9-1-2043 | 750,000 | 837,278 | ||||||||||||
Beaumont CA Community Facilities District #93-1 Special Tax Improvement Area Number 17C | 5.00 | 9-1-2048 | 1,100,000 | 1,220,373 | ||||||||||||
Beaumont CA Community Facilities District #93-1 Special Tax Improvement Area Number 8D Series A | 5.00 | 9-1-2043 | 750,000 | 837,660 | ||||||||||||
Beaumont CA Community Facilities District #93-1 Special Tax Improvement Area Number 8D Series A | 5.00 | 9-1-2048 | 1,035,000 | 1,148,788 | ||||||||||||
Belmont CA Community Facilities Special Tax District #2000-1 Library Project Series A (Ambac Insured) | 5.75 | 8-1-2030 | 3,190,000 | 4,265,859 | ||||||||||||
California Statewide CDA Community Facilities District #2015-01 | 5.00 | 9-1-2047 | 1,420,000 | 1,576,385 | ||||||||||||
California Statewide Communities Development Authority Special Tax Community Facilities District #2017-01 | 5.00 | 9-1-2048 | 5,000,000 | 5,599,750 | ||||||||||||
Casitas CA Municipal Water District Community Facilities District #2013-1-OJAI Series B (BAM Insured) | 5.25 | 9-1-2047 | 5,000,000 | 6,063,500 | ||||||||||||
Cathedral City CA RDA Successor Agency to Merged Redevelopment Project Tax Allocation Bond Series A (AGM Insured) | 5.00 | 8-1-2032 | 1,450,000 | 1,655,610 | ||||||||||||
Cathedral City CA RDA Successor Agency to Merged Redevelopment Project Tax Allocation Bond Series A (AGM Insured) | 5.00 | 8-1-2033 | 880,000 | 1,001,845 | ||||||||||||
Chino CA Community Facilities District Special Tax #2003-3 Improvement Area #7 | 5.00 | 9-1-2048 | 2,500,000 | 2,790,400 | ||||||||||||
Chula Vista CA Community Facilities District Special Tax #16I Improvement Area #1 | 5.00 | 9-1-2043 | 500,000 | 558,440 | ||||||||||||
The accompanying notes are an integral part of these financial statements.
16 | Wells Fargo California Tax-Free Fund
Portfolio of investments—June 30, 2020
| Interest rate | Maturity date | Principal | Value | |||||||||||||
| Tax Revenue (continued) | ||||||||||||||||
Chula Vista CA Community Facilities District Special Tax #16-I-Improvement Area #1 | 5.00 | % | 9-1-2048 | $ | 1,000,000 | $ | 1,109,940 | |||||||||
Compton CA Community College RDA Project 2nd Lien Series A ## | 5.00 | 8-1-2020 | 1,140,000 | 1,143,340 | ||||||||||||
Corona CA Community Facilities District #2018-1 Improvement Area Number 1 2018 Special Tax Bond Series A | 5.00 | 9-1-2048 | 1,000,000 | 1,064,870 | ||||||||||||
Corona Norco CA Unified School Districts Special Tax Community Facilities District #16-1 | 5.00 | 9-1-2048 | 1,500,000 | 1,668,720 | ||||||||||||
Dinuba CA RDA Merged City Redevelopment Project (BAM Insured) | 5.00 | 9-1-2033 | 1,500,000 | 1,711,590 | ||||||||||||
Elk Grove CA Financing Authority Special Tax Refunding Bond (BAM Insured) | 5.00 | 9-1-2038 | 1,500,000 | 1,786,710 | ||||||||||||
Fairfield CA Community Facilities District Special Tax Bond Number 2019 One Lake Improvement Area 144A%% | 5.00 | 9-1-2050 | 3,000,000 | 3,228,870 | ||||||||||||
Folsom Ranch Financing Authority California Facilities District #20 Russell Ranch | 5.00 | 9-1-2048 | 1,650,000 | 1,820,528 | ||||||||||||
Folsom Ranch Financing Authority California Special Tax Revenue Community Facilities District #19 Manginii | 5.00 | 9-1-2049 | 1,000,000 | 1,095,640 | ||||||||||||
Fremont CA Community Facilities District #1 Refunding Bond | 5.00 | 9-1-2040 | 2,700,000 | 2,941,812 | ||||||||||||
Inglewood CA Redevelopment Successor Agency to Merged Redevelopment Project Tax Allocation Refunding Bond Subordinate Lien Series A (BAM Insured) | 5.00 | 5-1-2034 | 500,000 | 605,345 | ||||||||||||
Inglewood CA Redevelopment Successor Agency to Merged Redevelopment Project Tax Allocation Refunding Bond Subordinate Lien Series A (BAM Insured) | 5.00 | 5-1-2038 | 305,000 | 364,966 | ||||||||||||
Inland Valley CA Development Agency Series A | 5.25 | 9-1-2037 | 4,000,000 | 4,421,320 | ||||||||||||
Irvine CA Unified School District Special Tax Community Facilities District #91 Series A (BAM Insured) | 4.00 | 9-1-2044 | 1,000,000 | 1,118,810 | ||||||||||||
Irvine CA Unified School District Special Tax Community Facilities District #91 Series A (BAM Insured) | 4.00 | 9-1-2050 | 3,000,000 | 3,295,860 | ||||||||||||
Lafayette CA RDA Refunding Bond Lafayette Redevelopment Project (AGM Insured) | 5.00 | 8-1-2033 | 1,500,000 | 1,707,690 | ||||||||||||
Lafayette CA RDA Refunding Bond Lafayette Redevelopment Project (AGM Insured) | 5.00 | 8-1-2038 | 1,635,000 | 1,845,098 | ||||||||||||
Lancaster CA RDA Tax Allocation Refunding Bond Combined Redevelopment Project Areas (AGM Insured) | 5.00 | 8-1-2033 | 1,200,000 | 1,428,612 | ||||||||||||
Oakland CA Redevelopment Successor Agency Refunding Bond Subordinate Series TE (AGM Insured) | 5.00 | 9-1-2035 | 2,545,000 | 2,945,939 | ||||||||||||
Oakland CA Redevelopment Successor Agency Refunding Bond Subordinate Series TE (AGM Insured) | 5.00 | 9-1-2036 | 4,000,000 | 4,618,560 | ||||||||||||
Orange County CA Community Facilities District #2015-1 Esencia Village Series A | 5.25 | 8-15-2045 | 1,950,000 | 2,160,581 | ||||||||||||
Rancho Cucamonga CA RDA Rancho Redevelopment Project Area (AGM Insured) | 5.00 | 9-1-2032 | 1,870,000 | 2,139,841 | ||||||||||||
Redwood City CA RDA CAB Redevelopment Project Area Series 2-A (Ambac Insured) ¤ | 0.00 | 7-15-2030 | 3,505,000 | 2,934,561 | ||||||||||||
Rio Vista CA Community Facilities District Special Tax #2018-1 | 5.00 | 9-1-2048 | 1,190,000 | 1,323,851 | ||||||||||||
Riverside County CA Community Facilities Districts Special Tax #05-8 | 5.00 | 9-1-2048 | 1,600,000 | 1,779,968 | ||||||||||||
Romoland School District Community Facilities District #2004-1 Heritage Lake Improvement Area #4 Series 2018 Special Tax Bond | 5.00 | 9-1-2048 | 3,000,000 | 3,322,200 | ||||||||||||
Sacramento CA Transient Occupancy Tax Convention Center Complex Series A | 5.00 | 6-1-2048 | 3,750,000 | 4,142,325 | ||||||||||||
San Bernardino CA Special Tax Community Facilities District #2006-1 Series 2018 | 5.00 | 9-1-2048 | 1,200,000 | 1,333,752 | ||||||||||||
San Clemente CA Special Tax Community Facilities District #2006-1 | 5.00 | 9-1-2040 | 980,000 | 1,080,548 | ||||||||||||
San Clemente CA Special Tax Community Facilities District #2006-1 | 5.00 | 9-1-2046 | 1,190,000 | 1,297,457 | ||||||||||||
San Diego CA RDA CAB Tax Allocation Centre (AGM Insured) ¤ | 0.00 | 9-1-2023 | 885,000 | 868,176 | ||||||||||||
San Diego CA RDA Naval Training Center Series A | 5.00 | 9-1-2025 | 575,000 | 579,560 | ||||||||||||
San Francisco CA City & County RDA Mission Bay South Redevelopment Project Series A | 5.00 | 8-1-2043 | 2,500,000 | 2,741,850 | ||||||||||||
San Francisco CA City & County RDA Tax Transbay Infrastructure Project Third Lien Series B (AGM Insured) | 5.00 | 8-1-2046 | 1,500,000 | 1,761,825 | ||||||||||||
The accompanying notes are an integral part of these financial statements.
Wells Fargo California Tax-Free Fund | 17
Portfolio of investments—June 30, 2020
| Interest rate | Maturity date | Principal | Value | |||||||||||||
| Tax Revenue (continued) | ||||||||||||||||
San Francisco City & County CA RDA CAB Mission Bay South Redevelopment Project Subordinate Bond Series D 144A¤ | 0.00 | % | 8-1-2026 | $ | 4,000,000 | $ | 3,065,440 | |||||||||
San Marcos CA Unified School District Special Tax Community Facilities District #4 (BAM Insured) | 5.00 | 9-1-2034 | 1,705,000 | 2,005,864 | ||||||||||||
San Marcos CA Unified School District Special Tax Community Facilities District #5 (BAM Insured) | 5.00 | 9-1-2028 | 1,290,000 | 1,512,409 | ||||||||||||
San Marcos CA Unified School District Special Tax Community Facilities District #5 (BAM Insured) | 5.00 | 9-1-2029 | 1,325,000 | 1,551,058 | ||||||||||||
Santa Ana CA Community Redevelopment Merged Project Area Series A | 6.00 | 9-1-2022 | 2,000,000 | 2,076,920 | ||||||||||||
Sonoma CA CDA Successor Agency to Sonoma Redevelopment Project Tax Allocation Bond (National Insured) | 5.00 | 6-1-2033 | 1,325,000 | 1,575,756 | ||||||||||||
Successor Agency to the Marina Redevelopment Agency Tax Allocation Bonds Series A | 5.00 | 9-1-2033 | 340,000 | 388,416 | ||||||||||||
Successor Agency to the Marina Redevelopment Agency Tax Allocation Bonds Series A | 5.00 | 9-1-2038 | 400,000 | 448,736 | ||||||||||||
Successor Agency to the Marina Redevelopment Agency Tax Allocation Bonds Series B | 5.00 | 9-1-2033 | 250,000 | 282,725 | ||||||||||||
Successor Agency to the Marina Redevelopment Agency Tax Allocation Bonds Series B | 5.00 | 9-1-2038 | 250,000 | 279,178 | ||||||||||||
Tracy Hills CA Improvement Area #1 Community Facilities District 2016-1 Special Tax Bonds Series 2018 | 5.00 | 9-1-2048 | 2,750,000 | 2,994,255 | ||||||||||||
Transbay Joint Powers Authority Tax Allocation California Senior Series A Green Bonds | 5.00 | 10-1-2045 | 2,000,000 | 2,443,220 | ||||||||||||
Transbay Joint Powers Authority Tax Allocation California Senior Series A Green Bonds | 5.00 | 10-1-2049 | 2,200,000 | 2,677,444 | ||||||||||||
Tustin CA Community Facilities District Special Tax 2014-1 Legacy/Standard Pacific Series A | 5.00 | 9-1-2040 | 750,000 | 826,575 | ||||||||||||
Tustin CA Community Facilities District Special Tax 2014-1 Legacy/Standard Pacific Series A | 5.00 | 9-1-2045 | 1,000,000 | 1,084,460 | ||||||||||||
Union City CA Community RDA Successor Agency to Community Redevelopment Project Tax Allocation Refunding Bond Series A | 5.00 | 10-1-2036 | 1,000,000 | 1,156,820 | ||||||||||||
Union City CA Community RDA Successor Agency to Union City Community Redevelopment Project (AGC Insured) | 5.25 | 10-1-2033 | 8,000,000 | 8,099,600 | ||||||||||||
| 127,415,479 | ||||||||||||||||
|
| |||||||||||||||
| Tobacco Revenue: 0.68% | ||||||||||||||||
California County CA Tobacco Securitization Agency ¤ | 0.00 | 6-1-2055 | 14,000,000 | 2,382,660 | ||||||||||||
Golden State Tobacco Securitization Corporation California Tobacco Settlement Refunding Bond Series A-1 | 5.00 | 6-1-2028 | 2,000,000 | 2,441,900 | ||||||||||||
Golden State Tobacco Securitization Corporation California Tobacco Settlement Refunding Bond Series A-2 | 5.00 | 6-1-2047 | 3,000,000 | 3,036,480 | ||||||||||||
| 7,861,040 | ||||||||||||||||
|
| |||||||||||||||
| Transportation Revenue: 2.16% | ||||||||||||||||
Bay Area CA Toll Authority Toll Bridge Series S-4 | 5.00 | 4-1-2030 | 2,000,000 | 2,256,980 | ||||||||||||
Bay Area CA Toll Authority Toll Bridge Series S-H | 5.00 | 4-1-2049 | 8,000,000 | 9,596,480 | ||||||||||||
Foothill-Eastern Corridor CA Transportation Agency Subordinated Bond Series B-3 | 5.50 | 1-15-2053 | 8,000,000 | 8,589,520 | ||||||||||||
San Diego CA RDA Centre City Subordinate Refunding Bond Parking Series B ## | 5.30 | 9-1-2020 | 1,060,000 | 1,064,335 | ||||||||||||
San Francisco CA Municipal Transportation | 5.00 | 3-1-2039 | 3,000,000 | 3,369,540 | ||||||||||||
| 24,876,855 | ||||||||||||||||
|
| |||||||||||||||
The accompanying notes are an integral part of these financial statements.
18 | Wells Fargo California Tax-Free Fund
Portfolio of investments—June 30, 2020
| Interest rate | Maturity date | Principal | Value | |||||||||||||
| Utilities Revenue: 3.98% |
| |||||||||||||||
Banning CA Financing Authority Refunding Bond Electric System Project (AGM Insured) | 5.00 | % | 6-1-2037 | $ | 5,000,000 | $ | 5,867,800 | |||||||||
Imperial CA Irrigation District Electric System Refunding Bond Series A | 5.00 | 11-1-2040 | 3,715,000 | 4,453,468 | ||||||||||||
Imperial CA Irrigation District Electric System Refunding Bond Series A | 5.00 | 11-1-2045 | 1,060,000 | 1,265,248 | ||||||||||||
Imperial CA Irrigation District Electric System Refunding Bond Series C | 5.00 | 11-1-2038 | 2,500,000 | 2,959,400 | ||||||||||||
Los Angeles CA Department of Water and Power Series E | 5.00 | 7-1-2044 | 12,475,000 | 14,284,374 | ||||||||||||
M-S-R California Energy Authority Gas Series B | 7.00 | 11-1-2034 | 4,000,000 | 6,042,840 | ||||||||||||
M-S-R California Energy Authority Gas Series C | 6.13 | 11-1-2029 | 1,045,000 | 1,320,232 | ||||||||||||
Northern California Power Agency Public Power Prerefunded Bond (Ambac Insured) | 7.50 | 7-1-2023 | 25,000 | 26,320 | ||||||||||||
Redding CA Joint Powers Financing Authority Election System Series A | 5.00 | 6-1-2032 | 440,000 | 533,412 | ||||||||||||
Roseville CA Natural Gas Financing Authority | 5.00 | 2-15-2025 | 1,930,000 | 2,218,496 | ||||||||||||
Southern California Public Power Authority Natural Gas Project #1 Series A | 5.25 | 11-1-2025 | 1,000,000 | 1,175,420 | ||||||||||||
Turlock CA Irrigation District Refunding Bond Subordinate First Priority | 5.50 | 1-1-2041 | 2,000,000 | 2,047,980 | ||||||||||||
Walnut CA Energy Center Authority Series A | 5.00 | 1-1-2034 | 3,115,000 | 3,646,481 | ||||||||||||
| 45,841,471 | ||||||||||||||||
|
| |||||||||||||||
| Water & Sewer Revenue: 2.91% | ||||||||||||||||
Adelanto CA Public Utility Authority Refunding Bond (AGM Insured) | 5.00 | 7-1-2039 | 2,000,000 | 2,442,800 | ||||||||||||
Bakersfield CA Wastewater Revenue Refunding Series A | 5.00 | 9-15-2032 | 1,615,000 | 2,194,930 | ||||||||||||
Bay Area CA Water Supply & Conservation Agency Series A | 5.00 | 10-1-2034 | 6,000,000 | 6,698,400 | ||||||||||||
Compton CA Sewer Revenue | 6.00 | 9-1-2039 | 1,775,000 | 1,778,603 | ||||||||||||
El Dorado CA Irrigation District Refunding Bond Series A (AGM Insured) | 5.25 | 3-1-2039 | 2,000,000 | 2,354,040 | ||||||||||||
Florin CA Resource Conservation Refunding Bond Second Senior Lien Series A (National Insured) | 5.00 | 9-1-2032 | 2,000,000 | 2,335,860 | ||||||||||||
Merced CA Irrigation District Water & Hydroelectric System Series A (AGM Insured) | 5.00 | 10-1-2038 | 4,000,000 | 4,668,880 | ||||||||||||
Pico Rivera CA Water Authority Series A | 6.25 | 12-1-2032 | 3,710,000 | 3,750,402 | ||||||||||||
San Buenaventura CA Public Facilities Financing Authority Series B | 5.00 | 7-1-2042 | 4,000,000 | 4,326,960 | ||||||||||||
Tulare CA Sewer Refunding Bond (AGM Insured) | 5.00 | 11-15-2041 | 1,500,000 | 1,799,820 | ||||||||||||
Vallejo CA Refunding Bond | 5.25 | 5-1-2031 | 1,000,000 | 1,136,370 | ||||||||||||
| 33,487,065 | ||||||||||||||||
|
| |||||||||||||||
| 1,089,545,022 | ||||||||||||||||
|
| |||||||||||||||
Guam: 0.63% |
| |||||||||||||||
| Tax Revenue: 0.09% | ||||||||||||||||
Guam Government Business Privilege Tax Series A | 5.00 | 1-1-2031 | 1,000,000 | 1,028,540 | ||||||||||||
|
| |||||||||||||||
| Water & Sewer Revenue: 0.54% | ||||||||||||||||
Guam Government Waterworks Authority | 5.25 | 7-1-2033 | 1,500,000 | 1,637,175 | ||||||||||||
Guam Government Waterworks Authority | 5.50 | 7-1-2043 | 3,125,000 | 3,404,625 | ||||||||||||
Guam Government Waterworks Authority Series A | 5.00 | 1-1-2050 | 1,000,000 | 1,193,210 | ||||||||||||
| 6,235,010 | ||||||||||||||||
|
| |||||||||||||||
| 7,263,550 | ||||||||||||||||
|
| |||||||||||||||
Illinois: 0.93% | ||||||||||||||||
| Miscellaneous Revenue: 0.93% | ||||||||||||||||
Illinois State Refunding Bond | 5.00 | 2-1-2025 | 10,000,000 | 10,750,800 | ||||||||||||
|
| |||||||||||||||
The accompanying notes are an integral part of these financial statements.
Wells Fargo California Tax-Free Fund | 19
Portfolio of investments—June 30, 2020
| Interest rate | Maturity date | Principal | Value | |||||||||||||
| New York: 0.47% | ||||||||||||||||
| Industrial Development Revenue: 0.47% | ||||||||||||||||
New York Transportation Development Corporation Special Facilities Revenue Delta Air Lines Incorporated LaGuardia Airport Terminals C&D Redevelopment | 5.00 | % | 1-1-2029 | $ | 5,000,000 | $ | 5,355,350 | |||||||||
|
| |||||||||||||||
Ohio: 0.06% | ||||||||||||||||
| Tobacco Revenue: 0.06% | ||||||||||||||||
Buckeye OH Tobacco Settlement Financing Authority CAB ¤ | 0.00 | 6-1-2057 | 5,000,000 | 694,100 | ||||||||||||
|
| |||||||||||||||
Pennsylvania: 0.17% | ||||||||||||||||
| Industrial Development Revenue: 0.17% | ||||||||||||||||
Delaware County PA Airport Facilities United Parcel Service Project Series 2015 ø | 0.29 | 9-1-2045 | 2,010,000 | 2,010,000 | ||||||||||||
|
| |||||||||||||||
Texas: 2.09% | ||||||||||||||||
| Resource Recovery Revenue: 2.09% | ||||||||||||||||
Port Arthur TX Navigation District Jefferson County Environmental Facilities Motiva Enterprises LLC Project Series A ø | 0.90 | 4-1-2040 | 3,000,000 | 3,000,000 | ||||||||||||
Port Arthur TX Navigation District Jefferson County Environmental Facilities Motiva Enterprises LLC Project Series B ø | 0.90 | 4-1-2040 | 15,600,000 | 15,600,000 | ||||||||||||
Port Arthur TX Navigation District Jefferson County Environmental Facilities Motiva Enterprises LLC Project Series C ø | 0.92 | 4-1-2040 | 500,000 | 500,000 | ||||||||||||
Port Arthur TX Navigation District Jefferson County Environmental Facilities Motiva Enterprises LLC Project Subordinate Bond Series D ø | 1.95 | 11-1-2040 | 5,000,000 | 5,000,000 | ||||||||||||
| 24,100,000 | ||||||||||||||||
|
| |||||||||||||||
Total Municipal Obligations (Cost $1,052,048,251) | 1,139,718,822 | |||||||||||||||
|
| |||||||||||||||
| Closed End Municipal Bond Fund Obligations: 1.39% | ||||||||||||||||
| California: 1.39% | ||||||||||||||||
Nuveen California AMT-Free Quality Municipal Income Fund MuniFund Preferred Shares Series A (160 shares) 0.92% 144Aø | 16,000,000 | 16,000,000 | ||||||||||||||
|
| |||||||||||||||
Total Closed End Municipal Bond Fund Obligations (Cost $16,000,000) | 16,000,000 | |||||||||||||||
|
| |||||||||||||||
| Yield | Shares | |||||||||||||||
| Short-Term Investments: 0.09% | ||||||||||||||||
| Investment Companies: 0.09% | ||||||||||||||||
Wells Fargo Municipal Cash Management Money Market Fund Institutional Class (l)(u)## | 0.10 | 1,009,885 | 1,010,188 | |||||||||||||
|
| |||||||||||||||
Total Short-Term Investments (Cost $1,010,087) | 1,010,188 | |||||||||||||||
|
| |||||||||||||||
| Total investments in securities (Cost $1,069,058,338) | 100.42 | % | 1,156,729,010 | |||||
Other assets and liabilities, net | (0.42 | ) | (4,840,737 | ) | ||||
|
|
|
| |||||
| Total net assets | 100.00 | % | $ | 1,151,888,273 | ||||
|
|
|
| |||||
| 144A | The security may be resold in transactions exempt from registration, normally to qualified institutional buyers, pursuant to Rule 144A under the Securities Act of 1933. |
| ¤ | The security is issued in zero coupon form with no periodic interest payments. |
| ± | Variable rate investment. The rate shown is the rate in effect at period end. |
| %% | The security is purchased on a when-issued basis. |
| ## | All or a portion of this security is segregated for when-issued securities |
| ø | Variable rate demand notes are subject to a demand feature which reduces the effective maturity. The maturity date shown represents the final maturity date of the security. The interest rate is determined and reset by the issuer daily, weekly, or monthly depending upon the terms of the security. The rate shown is the rate in effect at period end. |
| (l) | The issuer of the security is an affiliated person of the Fund as defined in the Investment Company Act of 1940. |
| (u) | The rate represents the 7-day annualized yield at period end. |
The accompanying notes are an integral part of these financial statements.
20 | Wells Fargo California Tax-Free Fund
Portfolio of investments—June 30, 2020
Abbreviations:
| AGC | Assured Guaranty Corporation |
| AGM | Assured Guaranty Municipal |
| Ambac | Ambac Financial Group Incorporated |
| AMT | Alternative minimum tax |
| BAM | Build America Mutual Assurance Company |
| CAB | Capital appreciation bond |
| CDA | Community Development Authority |
| FGIC | Financial Guaranty Insurance Corporation |
| GNMA | Government National Mortgage Association |
| GO | General obligation |
| HFA | Housing Finance Authority |
| HFFA | Health Facilities Financing Authority |
| LIBOR | London Interbank Offered Rate |
| National | National Public Finance Guarantee Corporation |
| PFA | Public Finance Authority |
| RDA | Redevelopment Authority |
Investments in Affiliates
An affiliated investment is an investment in which the Fund owns at least 5% of the outstanding voting shares of the issuer or as a result of other relationships, such as the Fund and the issuer having the same investment manager. Transactions with issuers that were either affiliated persons of the Fund at the beginning of the period or the end of the period were as follows:
| Value, beginning of period | Purchases | Sales proceeds | Net realized gains (losses) | Net change in unrealized gains (losses) | Income from affiliated securities | Value, end of period | % of net assets | |||||||||||||||||||||||||
| Short-Term Investments | ||||||||||||||||||||||||||||||||
Investment Companies | ||||||||||||||||||||||||||||||||
Wells Fargo Municipal Cash Management Money Market Fund Institutional Class | $ | 207,875 | $ | 236,049,047 | $ | (235,244,882 | ) | $ | (1,953 | ) | $ | 101 | $ | 73,627 | $ | 1,010,188 | 0.09 | % | ||||||||||||||
The accompanying notes are an integral part of these financial statements.
Wells Fargo California Tax-Free Fund | 21
Statement of assets and liabilities—June 30, 2020
Assets | ||||
Investments in unaffiliated securities, at value (cost $1,068,048,251) | $ | 1,155,718,822 | ||
Investments in affiliated securities, at value (cost $1,010,087) | 1,010,188 | |||
Cash | 29,500 | |||
Receivable for investments sold | 405,000 | |||
Receivable for Fund shares sold | 8,916,916 | |||
Receivable for interest | 12,928,481 | |||
Prepaid expenses and other assets | 9,086 | |||
|
| |||
Total assets | 1,179,017,993 | |||
|
| |||
Liabilities | ||||
Payable for investments purchased | 10,952,775 | |||
Payable for Fund shares redeemed | 15,043,448 | |||
Management fee payable | 279,697 | |||
Dividends payable | 510,112 | |||
Administration fees payable | 113,902 | |||
Distribution fee payable | 16,855 | |||
Trustees’ fees and expenses payable | 3,800 | |||
Accrued expenses and other liabilities | 209,131 | |||
|
| |||
Total liabilities | 27,129,720 | |||
|
| |||
Total net assets | $ | 1,151,888,273 | ||
|
| |||
Net assets consist of | ||||
Paid-in capital | $ | 1,092,986,398 | ||
Total distributable earnings | 58,901,875 | |||
|
| |||
Total net assets | $ | 1,151,888,273 | ||
|
| |||
Computation of net asset value and offering price per share | ||||
Net assets – Class A | $ | 494,449,551 | ||
Shares outstanding – Class A1 | 41,530,912 | |||
Net asset value per share – Class A | $11.91 | |||
Maximum offering price per share – Class A2 | $12.47 | |||
Net assets – Class C | $ | 27,412,796 | ||
Shares outstanding – Class C1 | 2,257,886 | |||
Net asset value per share – Class C | $12.14 | |||
Net assets – Administrator Class | $ | 301,918,873 | ||
Shares outstanding – Administrator Class1 | 25,311,441 | |||
Net asset value per share – Administrator Class | $11.93 | |||
Net assets – Institutional Class | $ | 328,107,053 | ||
Shares outstanding – Institutional Class1 | 27,506,277 | |||
Net asset value per share – Institutional Class | $11.93 | |||
| 1 | The Fund has an unlimited number of authorized shares. |
| 2 | Maximum offering price is computed as 100/95.50 of net asset value. On investments of $50,000 or more, the offering price is reduced. |
The accompanying notes are an integral part of these financial statements.
22 | Wells Fargo California Tax-Free Fund
Statement of operations—year ended June 30, 2020
Investment income | ||||
Interest | $ | 40,406,938 | ||
Income from affiliated securities | 73,627 | |||
|
| |||
Total investment income | 40,480,565 | |||
|
| |||
Expenses | ||||
Management fee | 4,231,573 | |||
Administration fees | ||||
Class A | 782,188 | |||
Class C | 48,056 | |||
Administrator Class | 271,990 | |||
Institutional Class | 248,789 | |||
Shareholder servicing fees | ||||
Class A | 1,222,124 | |||
Class C | 75,072 | |||
Administrator Class | 679,961 | |||
Distribution fee | ||||
Class C | 225,171 | |||
Custody and accounting fees | 33,038 | |||
Professional fees | 59,894 | |||
Registration fees | 62,109 | |||
Shareholder report expenses | 33,006 | |||
Trustees’ fees and expenses | 21,541 | |||
Interest expense | 399 | |||
Other fees and expenses | 9,488 | |||
|
| |||
Total expenses | 8,004,399 | |||
Less: Fee waivers and/or expense reimbursements | ||||
Fund-level | (45,037 | ) | ||
Class A | (301,795 | ) | ||
Class C | (17,770 | ) | ||
Administrator Class | (545,864 | ) | ||
|
| |||
Net expenses | 7,093,933 | |||
|
| |||
Net investment income | 33,386,632 | |||
|
| |||
Realized and unrealized gains (losses) on investments | ||||
Net realized losses on | ||||
Unaffiliated securities | (5,704,754 | ) | ||
Affiliated securities | (1,953 | ) | ||
|
| |||
Net realized losses on investments | (5,706,707 | ) | ||
|
| |||
Net change in unrealized gains (losses) on investments |
| |||
Unaffiliated securities | 2,626,951 | |||
Affiliated securities | 101 | |||
|
| |||
Net change in unrealized gains (losses) on investments | 2,627,052 | |||
|
| |||
Net realized and unrealized gains (losses) on investments | (3,079,655 | ) | ||
|
| |||
Net increase in net assets resulting from operations | $ | 30,306,977 | ||
|
| |||
The accompanying notes are an integral part of these financial statements.
Wells Fargo California Tax-Free Fund | 23
Statement of changes in net assets
| Year ended June 30, 2020 | Year ended June 30, 2019 | |||||||||||||||
Operations | ||||||||||||||||
Net investment income | $ | 33,386,632 | $ | 32,612,816 | ||||||||||||
Net realized losses on investments | (5,706,707 | ) | (1,718,061 | ) | ||||||||||||
Net change in unrealized gains (losses) on investments | 2,627,052 | 24,999,907 | ||||||||||||||
|
| |||||||||||||||
Net increase in net assets resulting from operations | 30,306,977 | 55,894,662 | ||||||||||||||
|
| |||||||||||||||
Distributions to shareholders from net investment income and net realized gains | ||||||||||||||||
Class A | (14,141,709 | ) | (14,669,880 | ) | ||||||||||||
Class C | (643,653 | ) | (988,682 | ) | ||||||||||||
Administrator Class | (8,419,907 | ) | (7,503,063 | ) | ||||||||||||
Institutional Class | (9,838,880 | ) | (9,759,221 | ) | ||||||||||||
|
| |||||||||||||||
Total distributions to shareholders | (33,044,149 | ) | (32,920,846 | ) | ||||||||||||
|
| |||||||||||||||
Capital share transactions | Shares | Shares | ||||||||||||||
Proceeds from shares sold | ||||||||||||||||
Class A | 11,036,626 | 131,693,675 | 8,095,324 | 94,284,323 | ||||||||||||
Class C | 278,006 | 3,385,392 | 277,749 | 3,305,964 | ||||||||||||
Administrator Class | 8,864,944 | 106,569,369 | 5,658,401 | 65,422,085 | ||||||||||||
Institutional Class | 10,316,056 | 123,479,416 | 8,350,924 | 97,289,819 | ||||||||||||
|
| |||||||||||||||
| 365,127,852 | 260,302,191 | |||||||||||||||
|
| |||||||||||||||
Reinvestment of distributions | ||||||||||||||||
Class A | 1,122,167 | 13,411,897 | 1,185,493 | 13,804,957 | ||||||||||||
Class C | 49,002 | 597,402 | 78,205 | 927,056 | ||||||||||||
Administrator Class | 691,273 | 8,273,557 | 629,219 | 7,340,761 | ||||||||||||
Institutional Class | 356,230 | 4,265,361 | 330,436 | 3,856,316 | ||||||||||||
|
| |||||||||||||||
| 26,548,217 | 25,929,090 | |||||||||||||||
|
| |||||||||||||||
Payment for shares redeemed | ||||||||||||||||
Class A | (11,116,036 | ) | (132,686,298 | ) | (6,860,157 | ) | (79,217,878 | ) | ||||||||
Class C | (765,067 | ) | (9,324,238 | ) | (1,688,840 | ) | (19,964,764 | ) | ||||||||
Administrator Class | (3,617,140 | ) | (42,474,283 | ) | (2,915,007 | ) | (33,837,058 | ) | ||||||||
Institutional Class | (7,724,779 | ) | (92,150,306 | ) | (8,779,437 | ) | (101,838,732 | ) | ||||||||
|
| |||||||||||||||
| (276,635,125 | ) | (234,858,432 | ) | |||||||||||||
|
| |||||||||||||||
Net increase in net assets resulting from capital share transactions | 115,040,944 | 51,372,849 | ||||||||||||||
|
| |||||||||||||||
Total increase in net assets | 112,303,772 | 74,346,665 | ||||||||||||||
|
| |||||||||||||||
Net assets | ||||||||||||||||
Beginning of period | 1,039,584,501 | 965,237,836 | ||||||||||||||
|
| |||||||||||||||
End of period | $ | 1,151,888,273 | $ | 1,039,584,501 | ||||||||||||
|
| |||||||||||||||
The accompanying notes are an integral part of these financial statements.
24 | Wells Fargo California Tax-Free Fund
(For a share outstanding throughout each period)
| Year ended June 30 | ||||||||||||||||||||
| CLASS A | 2020 | 2019 | 2018 | 2017 | 2016 | |||||||||||||||
Net asset value, beginning of period | $11.91 | $11.64 | $11.83 | $12.45 | $11.79 | |||||||||||||||
Net investment income | 0.35 | 0.37 | 0.37 | 0.36 | 0.36 | |||||||||||||||
Net realized and unrealized gains (losses) on investments | (0.00 | )1 | 0.28 | (0.19 | ) | (0.62 | ) | 0.66 | ||||||||||||
|
|
|
|
|
|
|
|
|
| |||||||||||
Total from investment operations | 0.35 | 0.65 | 0.18 | (0.26 | ) | 1.02 | ||||||||||||||
Distributions to shareholders from | ||||||||||||||||||||
Net investment income | (0.35 | ) | (0.38 | ) | (0.37 | ) | (0.36 | ) | (0.36 | ) | ||||||||||
Net asset value, end of period | $11.91 | $11.91 | $11.64 | $11.83 | $12.45 | |||||||||||||||
Total return2 | 2.93 | % | 5.70 | % | 1.55 | % | (2.09 | )% | 8.77 | % | ||||||||||
Ratios to average net assets (annualized) | ||||||||||||||||||||
Gross expenses | 0.81 | % | 0.83 | % | 0.83 | % | 0.82 | % | 0.82 | % | ||||||||||
Net expenses | 0.75 | % | 0.75 | % | 0.75 | % | 0.75 | % | 0.75 | % | ||||||||||
Net investment income | 2.92 | % | 3.22 | % | 3.15 | % | 2.99 | % | 2.96 | % | ||||||||||
Supplemental data | ||||||||||||||||||||
Portfolio turnover rate | 23 | % | 9 | % | 33 | % | 48 | % | 17 | % | ||||||||||
Net assets, end of period (000s omitted) | $494,450 | $482,395 | $443,165 | $472,584 | $528,238 | |||||||||||||||
| 1 | Amount is more than $(0.005). |
| 2 | Total return calculations do not include any sales charges. |
The accompanying notes are an integral part of these financial statements.
Wells Fargo California Tax-Free Fund | 25
Financial highlights
(For a share outstanding throughout each period)
| Year ended June 30 | ||||||||||||||||||||
| CLASS C | 2020 | 2019 | 2018 | 2017 | 2016 | |||||||||||||||
Net asset value, beginning of period | $12.15 | $11.87 | $12.07 | $12.70 | $12.02 | |||||||||||||||
Net investment income | 0.27 | 0.29 | 0.29 | 0.27 | 0.27 | |||||||||||||||
Net realized and unrealized gains (losses) on investments | (0.02 | ) | 0.29 | (0.20 | ) | (0.63 | ) | 0.68 | ||||||||||||
|
|
|
|
|
|
|
|
|
| |||||||||||
Total from investment operations | 0.25 | 0.58 | 0.09 | (0.36 | ) | 0.95 | ||||||||||||||
Distributions to shareholders from | ||||||||||||||||||||
Net investment income | (0.26 | ) | (0.30 | ) | (0.29 | ) | (0.27 | ) | (0.27 | ) | ||||||||||
Net asset value, end of period | $12.14 | $12.15 | $11.87 | $12.07 | $12.70 | |||||||||||||||
Total return1 | 2.08 | % | 4.95 | % | 0.74 | % | (2.80 | )% | 8.02 | % | ||||||||||
Ratios to average net assets (annualized) | ||||||||||||||||||||
Gross expenses | 1.56 | % | 1.58 | % | 1.58 | % | 1.57 | % | 1.57 | % | ||||||||||
Net expenses | 1.50 | % | 1.50 | % | 1.50 | % | 1.50 | % | 1.50 | % | ||||||||||
Net investment income | 2.18 | % | 2.47 | % | 2.40 | % | 2.24 | % | 2.21 | % | ||||||||||
Supplemental data | ||||||||||||||||||||
Portfolio turnover rate | 23 | % | 9 | % | 33 | % | 48 | % | 17 | % | ||||||||||
Net assets, end of period (000s omitted) | $27,413 | $32,758 | $47,831 | $57,727 | $66,427 | |||||||||||||||
| 1 | Total return calculations do not include any sales charges. |
The accompanying notes are an integral part of these financial statements.
26 | Wells Fargo California Tax-Free Fund
Financial highlights
(For a share outstanding throughout each period)
| Year ended June 30 | ||||||||||||||||||||
| ADMINISTRATOR CLASS | 2020 | 2019 | 2018 | 2017 | 2016 | |||||||||||||||
Net asset value, beginning of period | $11.94 | $11.66 | $11.86 | $12.48 | $11.81 | |||||||||||||||
Net investment income | 0.37 | 0.40 | 0.39 | 0.38 | 0.38 | |||||||||||||||
Net realized and unrealized gains (losses) on investments | (0.01 | ) | 0.28 | (0.20 | ) | (0.62 | ) | 0.67 | ||||||||||||
|
|
|
|
|
|
|
|
|
| |||||||||||
Total from investment operations | 0.36 | 0.68 | 0.19 | (0.24 | ) | 1.05 | ||||||||||||||
Distributions to shareholders from | ||||||||||||||||||||
Net investment income | (0.37 | ) | (0.40 | ) | (0.39 | ) | (0.38 | ) | (0.38 | ) | ||||||||||
Net asset value, end of period | $11.93 | $11.94 | $11.66 | $11.86 | $12.48 | |||||||||||||||
Total return | 3.05 | % | 5.99 | % | 1.67 | % | (1.88 | )% | 9.06 | % | ||||||||||
Ratios to average net assets (annualized) | ||||||||||||||||||||
Gross expenses | 0.75 | % | 0.77 | % | 0.77 | % | 0.76 | % | 0.76 | % | ||||||||||
Net expenses | 0.55 | % | 0.55 | % | 0.55 | % | 0.55 | % | 0.55 | % | ||||||||||
Net investment income | 3.13 | % | 3.43 | % | 3.34 | % | 3.16 | % | 3.16 | % | ||||||||||
Supplemental data | ||||||||||||||||||||
Portfolio turnover rate | 23 | % | 9 | % | 33 | % | 48 | % | 17 | % | ||||||||||
Net assets, end of period (000s omitted) | $301,919 | $231,252 | $186,626 | $210,209 | $344,090 | |||||||||||||||
The accompanying notes are an integral part of these financial statements.
Wells Fargo California Tax-Free Fund | 27
Financial highlights
(For a share outstanding throughout each period)
| Year ended June 30 | ||||||||||||||||||||
| INSTITUTIONAL CLASS | 2020 | 2019 | 2018 | 2017 | 2016 | |||||||||||||||
Net asset value, beginning of period | $11.94 | $11.66 | $11.86 | $12.48 | $11.81 | |||||||||||||||
Net investment income | 0.38 | 0.41 | 0.40 | 0.39 | 0.39 | |||||||||||||||
Net realized and unrealized gains (losses) on investments | (0.01 | ) | 0.28 | (0.20 | ) | (0.62 | ) | 0.67 | ||||||||||||
|
|
|
|
|
|
|
|
|
| |||||||||||
Total from investment operations | 0.37 | 0.69 | 0.20 | (0.23 | ) | 1.06 | ||||||||||||||
Distributions to shareholders from | ||||||||||||||||||||
Net investment income | (0.38 | ) | (0.41 | ) | (0.40 | ) | (0.39 | ) | (0.39 | ) | ||||||||||
Net asset value, end of period | $11.93 | $11.94 | $11.66 | $11.86 | $12.48 | |||||||||||||||
Total return | 3.12 | % | 6.07 | % | 1.74 | % | (1.81 | )% | 9.14 | % | ||||||||||
Ratios to average net assets (annualized) | ||||||||||||||||||||
Gross expenses | 0.48 | % | 0.50 | % | 0.50 | % | 0.49 | % | 0.49 | % | ||||||||||
Net expenses | 0.48 | % | 0.48 | % | 0.48 | % | 0.48 | % | 0.48 | % | ||||||||||
Net investment income | 3.19 | % | 3.49 | % | 3.42 | % | 3.28 | % | 3.24 | % | ||||||||||
Supplemental data | ||||||||||||||||||||
Portfolio turnover rate | 23 | % | 9 | % | 33 | % | 48 | % | 17 | % | ||||||||||
Net assets, end of period (000s omitted) | $328,107 | $293,180 | $287,616 | $309,253 | $193,154 | |||||||||||||||
The accompanying notes are an integral part of these financial statements.
28 | Wells Fargo California Tax-Free Fund
1. ORGANIZATION
Wells Fargo Funds Trust (the “Trust”), a Delaware statutory trust organized on March 10, 1999, is an open-end management investment company registered under the Investment Company Act of 1940, as amended (the “1940 Act”). As an investment company, the Trust follows the accounting and reporting guidance in Financial Accounting Standards Board (“FASB”) Accounting Standards Codification Topic 946, Financial Services – Investment Companies. These financial statements report on the Wells Fargo California Tax-Free Fund (the “Fund”) which is a non-diversified series of the Trust.
2. SIGNIFICANT ACCOUNTING POLICIES
The following significant accounting policies, which are consistently followed in the preparation of the financial statements of the Fund, are in conformity with U.S. generally accepted accounting principles which require management to make estimates and assumptions that affect the reported amounts of assets and liabilities, disclosure of contingent assets and liabilities at the date of the financial statements, and the reported amounts of revenues and expenses during the reporting period. Actual results could differ from those estimates.
Securities valuation
All investments are valued each business day as of the close of regular trading on the New York Stock Exchange (generally 4 p.m. Eastern Time), although the Fund may deviate from this calculation time under unusual or unexpected circumstances.
Debt securities are valued at the evaluated bid price provided by an independent pricing service (e.g. taking into account various factors, including yields, maturities, or credit ratings) or, if a reliable price is not available, the quoted bid price from an independent broker-dealer.
Investments in registered open-end investment companies are valued at net asset value.
Investments which are not valued using any of the methods discussed above are valued at their fair value, as determined in good faith by the Board of Trustees of the Fund. The Board of Trustees has established a Valuation Committee comprised of the Trustees and has delegated to it the authority to take any actions regarding the valuation of portfolio securities that the Valuation Committee deems necessary or appropriate, including determining the fair value of portfolio securities, unless the determination has been delegated to the Wells Fargo Asset Management Pricing Committee at Wells Fargo Funds Management, LLC (“Funds Management”). The Board of Trustees retains the authority to make or ratify any valuation decisions or approve any changes to the Valuation Procedures as it deems appropriate. On a quarterly basis, the Board of Trustees receives reports on any valuation actions taken by the Valuation Committee or the Wells Fargo Asset Management Pricing Committee which may include items for ratification.
When-issued transactions
The Fund may purchase securities on a forward commitment or when-issued basis. The Fund records a when-issued transaction on the trade date and will segregate assets in an amount at least equal in value to the Fund’s commitment to purchase when-issued securities. Securities purchased on a when-issued basis are marked-to-market daily and the Fund begins earning interest on the settlement date. Losses may arise due to changes in the market value of the underlying securities or if the counterparty does not perform under the contract.
Security transactions and income recognition
Securities transactions are recorded on a trade date basis. Realized gains or losses are recorded on the basis of identified cost.
Interest income is accrued daily and bond discounts are accreted and premiums are amortized daily.To the extent debt obligations are placed on non-accrual status, any related interest income may be reduced by writing off interest receivables when the collection of all or a portion of interest has been determined to be doubtful based on consistently applied procedures and the fair value has decreased. If the issuer subsequently resumes interest payments or when the collectability of interest is reasonably assured, the debt obligation is removed from non-accrual status.
Distributions to shareholders
Distributions to shareholders from net investment income are declared daily and paid monthly. Distributions from net realized gains, if any, are recorded on the ex-dividend date and paid at least annually. Such distributions are determined in accordance with income tax regulations and may differ from U.S. generally accepted accounting principles. Dividend sources are estimated at the time of declaration. The tax character of distributions is determined as of the Fund’s fiscal year end. Therefore, a portion of the Fund’s distributions made prior to the Fund’s fiscal year end may be categorized as a tax return of capital at year end.
Wells Fargo California Tax-Free Fund | 29
Notes to financial statements
Federal and other taxes
The Fund intends to continue to qualify as a regulated investment company by distributing substantially all of its investment company taxable and tax-exempt income and any net realized capital gains (after reduction for capital loss carryforwards) sufficient to relieve it from all, or substantially all, federal income taxes. Accordingly, no provision for federal income taxes was required.
The Fund’s income and federal excise tax returns and all financial records supporting those returns for the prior three fiscal years are subject to examination by the federal and Delaware revenue authorities. Management has analyzed the Fund’s tax positions taken on federal, state, and foreign tax returns for all open tax years and does not believe that there are any uncertain tax positions that require recognition of a tax liability.
As of June 30, 2020 the aggregate cost of all investments for federal income tax purposes was $1,069,188,932 and the unrealized gains (losses) consisted of:
Gross unrealized gains | $ | 88,605,158 | ||
Gross unrealized losses | (1,065,080 | ) | ||
Net unrealized gains | $ | 87,540,078 | ||
As of June 30, 2020, the Fund had capital loss carryforwards which consist of $28,787,467 in short-term capital losses.
Class allocations
The separate classes of shares offered by the Fund differ principally in applicable sales charges, distribution, shareholder servicing, and administration fees. Class specific expenses are charged directly to that share class. Investment income, common fund-level expenses, and realized and unrealized gains (losses) on investments are allocated daily to each class of shares based on the relative proportion of net assets of each class.
3. FAIR VALUATION MEASUREMENTS
Fair value measurements of investments are determined within a framework that has established a fair value hierarchy based upon the various data inputs utilized in determining the value of the Fund’s investments. The three-level hierarchy gives the highest priority to unadjusted quoted prices in active markets for identical assets or liabilities (Level 1) and the lowest priority to unobservable inputs (Level 3). The Fund’s investments are classified within the fair value hierarchy based on the lowest level of input that is significant to the fair value measurement. The inputs are summarized into three broad levels as follows:
| ∎ | Level 1 – quoted prices in active markets for identical securities |
| ∎ | Level 2 – other significant observable inputs (including quoted prices for similar securities, interest rates, prepayment speeds, credit risk, etc.) |
| ∎ | Level 3 – significant unobservable inputs (including the Fund’s own assumptions in determining the fair value of investments) |
The inputs or methodologies used for valuing investments in securities are not necessarily an indication of the risk associated with investing in those securities.
The following is a summary of the inputs used in valuing the Fund’s assets and liabilities as of June 30, 2020:
Quoted prices (Level 1) | Other significant observable inputs (Level 2) | Significant unobservable inputs (Level 3) | Total | |||||||||||||
Assets | ||||||||||||||||
Investments in: | ||||||||||||||||
Municipal obligations | $ | 0 | $ | 1,139,718,822 | $ | 0 | $ | 1,139,718,822 | ||||||||
Closed end municipal bond fund obligations | 0 | 16,000,000 | 0 | 16,000,000 | ||||||||||||
Short-term investments | ||||||||||||||||
Investment companies | 1,010,188 | 0 | 0 | 1,010,188 | ||||||||||||
Total assets | $ | 1,010,188 | $ | 1,155,718,822 | $ | 0 | $ | 1,156,729,010 | ||||||||
30 | Wells Fargo California Tax-Free Fund
Notes to financial statements
Additional sector, industry or geographic detail is included in the Portfolio of Investments.
For the year ended June 30, 2020, the Fund did not have any transfers into/out of Level 3.
4. TRANSACTIONS WITH AFFILIATES
Management fee
Funds Management, an indirect wholly owned subsidiary of Wells Fargo & Company (“Wells Fargo”), is the manager of the Fund and provides advisory and fund-level administrative services under an investment management agreement. Under the investment management agreement, Funds Management is responsible for, among other services, implementing the investment objectives and strategies of the Fund, supervising the subadviser and providing fund-level administrative services in connection with the Fund’s operations. As compensation for its services under the investment management agreement, Funds Management is entitled to receive a management fee at the following annual rate based on the Fund’s average daily net assets:
| Average daily net assets | Management fee | |||
First $500 million | 0.400 | % | ||
Next $500 million | 0.375 | |||
Next $2 billion | 0.350 | |||
Next $2 billion | 0.325 | |||
Next $5 billion | 0.290 | |||
Over $10 billion | 0.280 | |||
For the year ended June 30, 2020, the management fee was equivalent to an annual rate of 0.38% of the Fund’s average daily net assets.
Funds Management has retained the services of a subadviser to provide daily portfolio management to the Fund. The fee for subadvisory services is borne by Funds Management. Wells Capital Management Incorporated, an affiliate of Funds Management and an indirect wholly owned subsidiary of Wells Fargo, is the subadviser to the Fund and is entitled to receive a fee from Funds Management at an annual rate starting at 0.20% and declining to 0.10% as the average daily net assets of the Fund increase.
Administration fees
Under a class-level administration agreement, Funds Management provides class-level administrative services to the Fund, which includes paying fees and expenses for services provided by the transfer agent, sub-transfer agents, omnibus account servicers and record-keepers. As compensation for its services under the class-level administration agreement, Funds Management receives an annual fee which is calculated based on the average daily net assets of each class as follows:
Class-level administration fee | ||||
Class A, Class C | 0.16 | % | ||
Administrator Class | 0.10 | |||
Institutional Class | 0.08 | |||
Waivers and/or expense reimbursements
Funds Management has contractually waived and/or reimbursed management and administration fees to the extent necessary to maintain certain net operating expense ratios for the Fund. When each class of the Fund has exceeded its expense cap, Funds Management has waived fees and/or reimbursed expenses from fund-level expenses on a proportionate basis and then from class specific expenses. When only certain classes exceed their expense caps, waivers and/or reimbursements are applied against class specific expenses before fund-level expenses. Funds Management has committed through October 31, 2020 to waive fees and/or reimburse expenses to the extent necessary to cap the Fund’s expenses at 0.75% for Class A shares, 1.50% for Class C shares, 0.55% for Administrator Class shares, and 0.48% for Institutional Class shares. Prior to or after the commitment expiration date, the cap may be increased or the commitment to maintain the cap may be terminated only with the approval of the Board of Trustees.
Wells Fargo California Tax-Free Fund | 31
Notes to financial statements
Distribution fee
The Trust has adopted a distribution plan for Class C shares of the Fund pursuant to Rule 12b-1 under the 1940 Act. A distribution fee is charged to Class C shares and paid to Wells Fargo Funds Distributor, LLC (“Funds Distributor”), the principal underwriter, at an annual rate of 0.75% of the average daily net assets of Class C shares.
In addition, Funds Distributor is entitled to receive the front-end sales charge from the purchase of Class A shares and a contingent deferred sales charge on the redemption of certain Class A shares. Funds Distributor is also entitled to receive the contingent deferred sales charges from redemptions of Class C shares. For the year ended June 30, 2020, Funds Distributor received $10,211 from the sale of Class A shares. No contingent deferred sales charges were incurred by Class A and Class C shares for the year ended June 30, 2020.
Shareholder servicing fees
The Trust has entered into contracts with one or more shareholder servicing agents, whereby Class A, Class C, and Administrator Class of the Fund are charged a fee at an annual rate of 0.25% of the average daily net assets of each respective class. A portion of these total shareholder servicing fees were paid to affiliates of Wells Fargo.
Interfund transactions
The Fund may purchase or sell portfolio investment securities to certain other Wells Fargo affiliates pursuant to Rule 17a-7 under the 1940 Act and under procedures adopted by the Board of Trustees. The procedures have been designed to ensure that these interfund transactions, which do not incur broker commissions, are effected at current market prices. Pursuant to these procedures, the Fund had $72,805,000 and $60,990,000 in interfund purchases and sales, respectively, during the year ended June 30, 2020.
5. INVESTMENT PORTFOLIO TRANSACTIONS
Purchases and sales of investments, excluding U.S. government obligations (if any) and short-term securities, for the year ended June 30, 2020 were $359,129,964 and $241,880,108, respectively.
6. BANK BORROWINGS
The Trust (excluding the money market funds), Wells Fargo Master Trust and Wells Fargo Variable Trust are parties to a $350,000,000 revolving credit agreement whereby the Fund is permitted to use bank borrowings for temporary or emergency purposes, such as to fund shareholder redemption requests. Interest under the credit agreement is charged to the Fund based on a borrowing rate equal to the higher of the Federal Funds rate in effect on that day plus 1.25% or the overnight LIBOR rate in effect on that day plus 1.25%. In addition, an annual commitment fee equal to 0.25% of the unused balance is allocated to each participating fund.
During the year ended June 30, 2020, the Fund had average borrowings outstanding of $24,630 at an average rate of 1.62% and paid interest in the amount of $399.
7. DISTRIBUTIONS TO SHAREHOLDERS
The tax character of distributions paid was $33,044,149 and $32,920,846 of tax-exempt income for the years ended June 30, 2020 and June 30, 2019, respectively.
As of June 30, 2020, the components of distributable earnings on a tax basis were as follows:
| Undistributed tax-exempt income | Unrealized gains | Capital loss carryforward | ||
| $660,388 | $87,540,078 | $(28,787,467) | ||
8. CONCENTRATION RISK
The Fund invests a substantial portion of its assets in issuers of municipal debt securities located in a single state or territory of the U.S. Therefore, it may be more affected by economic and political developments in that state or region than would be a comparable general tax-exempt fund. As of the end of the period, the Fund invested a concentration of its portfolio in the state of California.
32 | Wells Fargo California Tax-Free Fund
Notes to financial statements
9. INDEMNIFICATION
Under the Fund’s organizational documents, the officers and Trustees have been granted certain indemnification rights against certain liabilities that may arise out of performance of their duties to the Fund. The Fund has entered into a separate agreement with each Trustee that converts indemnification rights currently existing under the Fund’s organizational documents into contractual rights that cannot be changed in the future without the consent of the Trustee. Additionally, in the normal course of business, the Fund may enter into contracts with service providers that contain a variety of indemnification clauses. The Fund’s maximum exposure under these arrangements is dependent on future claims that may be made against the Fund and, therefore, cannot be estimated.
10. NEW ACCOUNTING PRONOUNCEMENT
In August 2018, FASB issued Accounting Standards Update (“ASU”) No. 2018-13, Fair Value Measurement (Topic 820) Disclosure Framework—Changes to the Disclosure Requirements for Fair Value Measurement. ASU 2018-13 updates the disclosure requirements on fair value measurements in Topic 820, Fair Value Measurements. The amendments are effective for fiscal years, and interim periods within those fiscal years, beginning after December 15, 2019. Management has adopted this guidance which did not have a material impact on the financial statements.
11. CORONAVIRUS (COVID-19) PANDEMIC
On March 11, 2020, the World Health Organization announced that it had made the assessment that coronavirus disease 2019 (“COVID-19”) is a pandemic. The impacts of COVID-19 are adversely affecting the entire global economy, individual companies and investment products, and the market in general. There is significant uncertainty around the extent and duration of business disruptions related to COVID-19 and the impacts may be short term or may last for an extended period of time. The risk of further spreading of COVID-19 has led to significant uncertainty and volatility in the financial markets.
Wells Fargo California Tax-Free Fund | 33
Report of independent registered public accounting firm
To the Shareholders of the Fund and Board of Trustees
Wells Fargo Funds Trust:
Opinion on the Financial Statements
We have audited the accompanying statement of assets and liabilities of Wells Fargo California Tax-Free Fund (the Fund), one of the funds constituting Wells Fargo Funds Trust, including the portfolio of investments, as of June 30, 2020, the related statement of operations for the year then ended, the statements of changes in net assets for each of the years in the two-year period then ended, and the related notes (collectively, the financial statements) and the financial highlights for each of the years in the five-year period then ended. In our opinion, the financial statements and financial highlights present fairly, in all material respects, the financial position of the Fund as of June 30, 2020, the results of its operations for the year then ended, the changes in its net assets for each of the years in the two-year period then ended, and the financial highlights for each of the years in the five-year period then ended, in conformity with U.S. generally accepted accounting principles.
Basis for Opinion
These financial statements and financial highlights are the responsibility of the Fund’s management. Our responsibility is to express an opinion on these financial statements and financial highlights based on our audits. We are a public accounting firm registered with the Public Company Accounting Oversight Board (United States) (PCAOB) and are required to be independent with respect to the Fund in accordance with the U.S. federal securities laws and the applicable rules and regulations of the Securities and Exchange Commission and the PCAOB.
We conducted our audits in accordance with the standards of the PCAOB. Those standards require that we plan and perform the audit to obtain reasonable assurance about whether the financial statements and financial highlights are free of material misstatement, whether due to error or fraud. Our audits included performing procedures to assess the risks of material misstatement of the financial statements and financial highlights, whether due to error or fraud, and performing procedures that respond to those risks. Such procedures included examining, on a test basis, evidence regarding the amounts and disclosures in the financial statements and financial highlights. Such procedures also included confirmation of securities owned as of June 30, 2020, by correspondence with the custodian, transfer agent and brokers, or by other appropriate auditing procedures. Our audits also included evaluating the accounting principles used and significant estimates made by management, as well as evaluating the overall presentation of the financial statements and financial highlights. We believe that our audits provide a reasonable basis for our opinion.

We have not been able to determine the specific year that we began serving as the auditor of one or more Wells Fargo Funds investment companies; however we are aware that we have served as the auditor of one or more Wells Fargo Funds investment companies since at least 1955.
Boston, Massachusetts
August 29, 2020
34 | Wells Fargo California Tax-Free Fund
TAX INFORMATION
For federal and California income tax purposes, the Fund designates 100% of its distributions paid from net investment income during the fiscal year as exempt-interest dividends under Section 852(b)(5) of the Internal Revenue Code and under Section 17145 of the California Revenue and Taxation Code.
PROXY VOTING INFORMATION
A description of the policies and procedures used to determine how to vote proxies relating to portfolio securities is available, upon request, by calling 1-800-222-8222, visiting our website at wfam.com, or visiting the SEC website at sec.gov. Information regarding how the proxies related to portfolio securities were voted during the most recent 12-month period ended June 30 is available on the website at wfam.com or by visiting the SEC website at sec.gov.
QUATERLY PORTFOLIO HOLDINGS INFORMATION
The Fund files its complete schedule of portfolio holdings with the SEC for the first and third quarters of each fiscal year as an exhibit to its reports on Form N-PORT. Shareholders may view the filed form N-PORT by visiting the SEC website at sec.gov.
Wells Fargo California Tax-Free Fund | 35
Other information (unaudited)
BOARD OF TRUSTEES AND OFFICERS
Each of the Trustees and Officers1 listed in the table below acts in identical capacities for each fund in the Wells Fargo family of funds, which consists of 147 mutual funds comprising the Wells Fargo Funds Trust, Wells Fargo Variable Trust, Wells Fargo Master Trust and four closed-end funds (collectively the “Fund Complex”). This table should be read in conjunction with the Prospectus and the Statement of Additional Information2. The mailing address of each Trustee and Officer is 525 Market Street, 12th Floor, San Francisco, CA 94105. Each Trustee and Officer serves an indefinite term, however, each Trustee serves such term until reaching the mandatory retirement age established by the Trustees.
Independent Trustees
Name and year of birth | Position held and length of service* | Principal occupations during past five years or longer | Current other public company or investment company directorships | |||
William R. Ebsworth (Born 1957) | Trustee, since 2015 | Retired. From 1984 to 2013, equities analyst, portfolio manager, research director and chief investment officer at Fidelity Management and Research Company in Boston, Tokyo, and Hong Kong, and retired in 2013 as Chief Investment Officer of Fidelity Strategic Advisers, Inc. where he led a team of investment professionals managing client assets. Prior thereto, Board member of Hong Kong Securities Clearing Co., Hong Kong Options Clearing Corp., the Thailand International Fund, Ltd., Fidelity Investments Life Insurance Company, and Empire Fidelity Investments Life Insurance Company. Audit Committee Chair and Investment Committee Chair of the Vincent Memorial Hospital Endowment (non-profit organization). Mr. Ebsworth is a CFA® charterholder. | N/A | |||
Jane A. Freeman (Born 1953) | Trustee, since 2015; Chair Liaison, since 2018 | Retired. From 2012 to 2014 and 1999 to 2008, Chief Financial Officer of Scientific Learning Corporation. From 2008 to 2012, Ms. Freeman provided consulting services related to strategic business projects. Prior to 1999, Portfolio Manager at Rockefeller & Co. and Scudder, Stevens & Clark. Board member of the Harding Loevner Funds from 1996 to 2014, serving as both Lead Independent Director and chair of the Audit Committee. Board member of the Russell Exchange Traded Funds Trust from 2011 to 2012 and the chair of the Audit Committee. Ms. Freeman is also an inactive Chartered Financial Analyst. | N/A | |||
Isaiah Harris, Jr. (Born 1952) | Trustee, since 2009; Audit Committee Chairman, since 2019 | Retired. Chairman of the Board of CIGNA Corporation since 2009, and Director since 2005. From 2003 to 2011, Director of Deluxe Corporation. Prior thereto, President and CEO of BellSouth Advertising and Publishing Corp. from 2005 to 2007, President and CEO of BellSouth Enterprises from 2004 to 2005 and President of BellSouth Consumer Services from 2000 to 2003. Emeritus member of the Iowa State University Foundation Board of Governors. Emeritus Member of the Advisory Board of Iowa State University School of Business. Advisory Board Member, Palm Harbor Academy (private school). Advisory Board Member, Child Evangelism Fellowship (non-profit). Mr. Harris is a certified public accountant (inactive status). | CIGNA Corporation | |||
Judith M. Johnson (Born 1949) | Trustee, since 2008; Audit Committee Chairman, from 2009 to 2018 | Retired. Prior thereto, Chief Executive Officer and Chief Investment Officer of Minneapolis Employees Retirement Fund from 1996 to 2008. Ms. Johnson is an attorney, certified public accountant and a certified managerial accountant. | N/A | |||
36 | Wells Fargo California Tax-Free Fund
Other information (unaudited)
Name and year of birth | Position held and length of service* | Principal occupations during past five years or longer | Current other public company or investment company directorships | |||
David F. Larcker (Born 1950) | Trustee, since 2009 | James Irvin Miller Professor of Accounting at the Graduate School of Business, Stanford University, Director of the Corporate Governance Research Initiative and Senior Faculty of The Rock Center for Corporate Governance since 2006. From 2005 to 2008, Professor of Accounting at the Graduate School of Business, Stanford University. Prior thereto, Ernst & Young Professor of Accounting at The Wharton School, University of Pennsylvania from 1985 to 2005. | N/A | |||
Olivia S. Mitchell (Born 1953) | Trustee, since 2006; Nominating and Governance Committee Chair, since 2018 | International Foundation of Employee Benefit Plans Professor, Wharton School of the University of Pennsylvania since 1993. Director of Wharton’s Pension Research Council and Boettner Center on Pensions & Retirement Research, and Research Associate at the National Bureau of Economic Research. Previously, Cornell University Professor from 1978 to 1993. | N/A | |||
Timothy J. Penny (Born 1951) | Trustee, since 1996; Chairman, since 2018 | President and Chief Executive Officer of Southern Minnesota Initiative Foundation, a non-profit organization, since 2007. Member of the Board of Trustees of NorthStar Education Finance, Inc., a non-profit organization, since 2007. | N/A | |||
James G. Polisson (Born 1959) | Trustee, since 2018 | Retired. Chief Marketing Officer, Source (ETF) UK Services, Ltd, from 2015 to 2017. From 2012 to 2015, Principal of The Polisson Group, LLC, a management consulting, corporate advisory and principal investing company. Chief Executive Officer and Managing Director at Russell Investments, Global Exchange Traded Funds from 2010 to 2012. Managing Director of Barclays Global Investors from 1998 to 2010 and Global Chief Marketing Officer for iShares and Barclays Global Investors from 2000 to 2010. Trustee of the San Francisco Mechanics’ Institute, a non-profit organization, from 2013 to 2015. Board member of the Russell Exchange Traded Fund Trust from 2011 to 2012. Director of Barclays Global Investors Holdings Deutschland GmbH from 2006 to 2009. Mr. Polisson is an attorney and has a retired status with the Massachusetts and District of Columbia Bar Associations. | N/A | |||
Pamela Wheelock (Born 1959) | Trustee, since January 2020; previously Trustee from January 2018 to July 2019 | Board member of the Destination Medical Center Economic Development Agency, Rochester, Minnesota since 2019 and Interim President of the McKnight Foundation since 2020. Acting Commissioner, Minnesota Department of Human Services, July 2019 through September 2019. Human Services Manager (part-time), Minnesota Department of Human Services, October 2019 through December 2019. Chief Operating Officer, Twin Cities Habitat for Humanity from 2017 to 2019. Vice President of University Services, University of Minnesota from 2012 to 2016. Prior thereto, on the Board of Directors, Governance Committee and Finance Committee for the Minnesota Philanthropy Partners (Saint Paul Foundation) from 2012 to 2018, Interim Chief Executive Officer of Blue Cross Blue Shield of Minnesota from 2011 to 2012, Chairman of the Board from 2009 to 2012 and Board Director from 2003 to 2015. Vice President, Leadership and Community Engagement, Bush Foundation, Saint Paul, Minnesota (a private foundation) from 2009 to 2011. Executive Vice President and Chief Financial Officer, Minnesota Sports and Entertainment from 2004 to 2009 and Senior Vice President from 2002 to 2004. Executive Vice President of the Minnesota Wild Foundation from 2004 to 2008. Commissioner of Finance, State of Minnesota, from 1999 to 2002. Currently Board Chair of the Minnesota Wild Foundation since 2010. | N/A | |||
| * | Length of service dates reflect the Trustee’s commencement of service with the Trust’s predecessor entities, where applicable. |
Wells Fargo California Tax-Free Fund | 37
Other information (unaudited)
Officers
Name and year of birth | Position held and length of service | Principal occupations during past five years or longer | ||
Andrew Owen (Born 1960) | President, since 2017 | Executive Vice President of Wells Fargo & Company and Head of Affiliated Managers, Wells Fargo Asset Management, since 2014. In addition, Mr. Owen is currently President, Chief Executive Officer and Director of Wells Fargo Funds Management, LLC since 2017. Prior thereto, Executive Vice President responsible for marketing, investments and product development for Wells Fargo Funds Management, LLC, from 2009 to 2014. | ||
Nancy Wiser1 (Born 1967) | Treasurer, since 2012 | Executive Vice President of Wells Fargo Funds Management, LLC since 2011. Chief Operating Officer and Chief Compliance Officer at LightBox Capital Management LLC, from 2008 to 2011. | ||
Michelle Rhee (Born 1966) | Chief Legal Officer, since 2019 | Secretary of Wells Fargo Funds Management, LLC, Chief Legal Counsel of Wells Fargo Asset Management and Assistant General Counsel of Wells Fargo Bank, N.A. since 2018. Associate General Counsel and Managing Director of Bank of America Corporation from 2004 to 2018. | ||
Catherine Kennedy (Born 1969) | Secretary, since 2019 | Vice President of Wells Fargo Funds Management, LLC and Senior Counsel of the Wells Fargo Legal Department since 2010. Vice President and Senior Counsel of Evergreen Investment Management Company, LLC from 1998 to 2010. | ||
Michael H. Whitaker (Born 1967) | Chief Compliance Officer, since 2016 | Chief Compliance Officer of Wells Fargo Asset Management since 2016. Senior Vice President and Chief Compliance Officer for Fidelity Investments from 2007 to 2016. | ||
David Berardi (Born 1975) | Assistant Treasurer, since 2009 | Vice President of Wells Fargo Funds Management, LLC since 2009. Vice President of Evergreen Investment Management Company, LLC from 2008 to 2010. Manager of Fund Reporting and Control for Evergreen Investment Management Company, LLC from 2004 to 2010. | ||
Jeremy DePalma1 (Born 1974) | Assistant Treasurer, since 2009 | Senior Vice President of Wells Fargo Funds Management, LLC since 2009. Senior Vice President of Evergreen Investment Management Company, LLC from 2008 to 2010 and head of the Fund Reporting and Control Team within Fund Administration from 2005 to 2010. | ||
| 1 | Nancy Wiser acts as Treasurer of 65 funds in the Fund Complex. Jeremy DePalma acts as Treasurer of 82 funds and Assistant Treasurer of 65 funds in the Fund Complex. |
| 2 | The Statement of Additional Information includes additional information about the Trustees and is available, without charge, upon request, by calling 1-800-222-8222 or by visiting the website at wfam.com. |
38 | Wells Fargo California Tax-Free Fund
Other information (unaudited)
BOARD CONSIDERATION OF INVESTMENT MANAGEMENT AND SUB-ADVISORY AGREEMENTS:
Wells Fargo California Tax-Free Fund
Under the Investment Company Act of 1940 (the “1940 Act”), the Board of Trustees (the “Board”) of Wells Fargo Funds Trust (the “Trust”) must determine annually whether to approve the continuation of the Trust’s investment management and sub-advisory agreements. In this regard, at a Board meeting held on May 26, 2020 and May 28, 2020 (together, the “Meeting”), the Board, all the members of which have no direct or indirect interest in the investment management and sub-advisory agreements and are not “interested persons” of the Trust, as defined in the 1940 Act (the “Independent Trustees”), reviewed and approved for Wells Fargo California Tax-Free Fund (the “Fund”): (i) an investment management agreement (the “Management Agreement”) with Wells Fargo Funds Management, LLC (“Funds Management”); and (ii) an investment sub-advisory agreement (the “Sub-Advisory Agreement”) with Wells Capital Management Incorporated (the “Sub-Adviser”), an affiliate of Funds Management. The Management Agreement and the Sub-Advisory Agreement are collectively referred to as the “Advisory Agreements.”
At the Meeting, the Board considered the factors and reached the conclusions described below relating to the selection of Funds Management and the Sub-Adviser and the approval of the Advisory Agreements. Prior to the Meeting, including at a Board meeting held in April 2020, the Trustees conferred extensively among themselves and with representatives of Funds Management about these matters. Also, the Board has adopted a team-based approach, with each team consisting of a sub-set of Trustees, to assist the full Board in the discharge of its duties in reviewing investment performance and other matters throughout the year. The Independent Trustees were assisted in their evaluation of the Advisory Agreements by independent legal counsel, from whom they received separate legal advice and with whom they met separately.
In providing information to the Board, Funds Management and the Sub-Adviser were guided by a detailed set of requests for information submitted to them by independent legal counsel on behalf of the Independent Trustees at the start of the Board’s annual contract renewal process earlier in 2020. In considering and approving the Advisory Agreements, the Trustees considered the information they believed relevant, including but not limited to the information discussed below. The Board considered not only the specific information presented in connection with the Meeting, but also the knowledge gained over time through interaction with Funds Management and the Sub-Adviser about various topics. In this regard, the Board reviewed reports of Funds Management at each of its quarterly meetings, which included, among other things, portfolio reviews and investment performance reports. In addition, the Board and the teams mentioned above confer with portfolio managers at various times throughout the year. The Board did not identify any particular information or consideration that was all-important or controlling, and each individual Trustee may have attributed different weights to various factors.
After its deliberations, the Board unanimously approved the continuation of the Advisory Agreements for a one-year term and determined that the compensation payable to Funds Management and the Sub-Adviser under each of the Advisory Agreements was reasonable. The Board considered the approval of the Advisory Agreements for the Fund as part of its consideration of agreements for funds across the complex, but its approvals were made on a fund-by-fund basis. The following summarizes a number of important, but not necessarily all, factors considered by the Board in support of its approvals.
Nature, extent and quality of services
The Board received and considered various information regarding the nature, extent and quality of services provided to the Fund by Funds Management and the Sub-Adviser under the Advisory Agreements. This information included a description of the investment advisory services and Fund-level administrative services covered by the Management Agreement, as well as, among other things, a summary of the background and experience of senior management of Wells Fargo Asset Management (“WFAM”), of which Funds Management and the Sub-Adviser are a part, and a summary of investments made in the business of WFAM. The Board also received a description of Funds Management’s and the Sub-Adviser’s business continuity plans and of their approaches to data privacy and cybersecurity, and related testing. The Board also received and reviewed information about Funds Management’s role as administrator of the Fund’s liquidity risk management program, Funds Management’s approach to risk management, and Funds Management’s intermediary and vendor oversight program.
The Board also considered the qualifications, background, tenure and responsibilities of each of the portfolio managers primarily responsible for the day-to-day portfolio management of the Fund. The Board evaluated the ability of Funds Management and the Sub-Adviser to attract and retain qualified investment professionals, including research, advisory and supervisory personnel. The Board further considered the compliance programs and compliance records of Funds Management and the Sub-Adviser. In addition, the Board took into account the full range of services provided to the Fund by Funds Management and its affiliates.
Wells Fargo California Tax-Free Fund | 39
Other information (unaudited)
Fund investment performance and expenses
The Board considered the investment performance results for the Fund over various time periods ended December 31, 2019. The Board also considered more current results for various time periods ended March 31, 2020. The Board considered these results in comparison to the investment performance of funds in a universe that was determined by Broadridge Inc. (“Broadridge”) to be similar to the Fund (the “Universe”), and in comparison to the Fund’s benchmark index and to other comparative data. Broadridge is an independent provider of investment company data. The Board received a description of the methodology used by Broadridge to select the mutual funds in the performance Universe. The Board noted that the investment performance of the Fund (Administrator Class) was higher than the average investment performance of the Universe for the ten-year period ended December 31, 2019, and lower than the average investment performance of the Universe for the one-, three- and five-year periods ended December 31, 2019. The Board also noted that the investment performance of the Fund (Administrator Class) was higher than or in range of the average investment performance of the Universe for all periods ended March 31, 2020. The Board also noted that the investment performance of the Fund was higher than its benchmark index, the Bloomberg Barclays Municipal Bond Index, for the ten-year period ended December 31, 2019, and lower than its benchmark index for the one-, three- and five-year periods ended December 31, 2019. The Board also noted that the investment performance of the Fund was higher than its benchmark index, the Bloomberg Barclays Municipal Bond Index, for the ten-year period ended March 31, 2020, and lower than its benchmark index for the one-, three- and five periods ended March 31, 2020.
The Board received information concerning, and discussed factors contributing to, the underperformance of the Fund relative to the Universe and benchmark index for the periods identified above. The Board took note of the explanations for the relative underperformance during these periods, including with respect to investment decisions and market factors that affected the Fund’s investment performance.
The Board also received and considered information regarding the Fund’s net operating expense ratios and their various components, including actual management fees, custodian and other non-management fees, and Rule 12b-1 and non-Rule 12b-1 shareholder service fees. The Board considered these ratios in comparison to the median ratios of funds in class-specific expense groups that were determined by Broadridge to be similar to the Fund (the “Groups”). The Board received a description of the methodology used by Broadridge to select the mutual funds in the expense Groups and an explanation of how funds comprising expense groups and their expense ratios may vary from year-to-year. Based on the Broadridge reports, the Board noted that the net operating expense ratios of the Fund were lower than or equal to the median net operating expense ratios of the expense Groups for each share class.
The Board took into account the Fund’s investment performance and expense information provided to it among the factors considered in deciding to re-approve the Advisory Agreements.
Investment management and sub-advisory fee rates
The Board reviewed and considered the contractual fee rates payable by the Fund to Funds Management under the Management Agreement, as well as the contractual fee rates payable by the Fund to Funds Management for class-level administrative services under a Class-Level Administration Agreement, which include, among other things, class-level transfer agency and sub-transfer agency costs (collectively, the “Management Rates”). The Board also reviewed and considered the contractual investment sub-advisory fee rates that are payable by Funds Management to the Sub-Adviser for investment sub-advisory services.
Among other information reviewed by the Board was a comparison of the Fund’s Management Rates with the average contractual investment management fee rates of funds in the expense Groups at a common asset level as well as transfer agency costs of the funds in the expense Groups. The Board noted that the Management Rates of the Fund were lower than or in range of the sum of these average rates for the Fund’s expense Groups for all share classes.
The Board also received and considered information about the portion of the total management fee that was retained by Funds Management after payment of the fee to the Sub-Adviser for sub-advisory services. In assessing the reasonableness of this amount, the Board received and evaluated information about the nature and extent of responsibilities retained and risks assumed by Funds Management and not delegated to or assumed by the Sub-Adviser, and about Funds Management’s on-going oversight services. Given the affiliation between Funds Management and the Sub-Adviser, the Board ascribed limited relevance to the allocation of fees between them.
The Board also received and considered information about the nature and extent of services offered and fee rates charged by Funds Management and the Sub-Adviser to other types of clients with investment strategies similar to those of the Fund. In this regard, the Board received information about the significantly greater scope of services, and compliance, reporting and other legal burdens and risks of managing proprietary mutual funds compared with those associated with managing assets of other types of clients, including third-party sub-advised fund clients and non-mutual fund clients such as institutional separate accounts.
40 | Wells Fargo California Tax-Free Fund
Other information (unaudited)
Based on its consideration of the factors and information it deemed relevant, including those described here, the Board determined that the compensation payable to Funds Management under the Management Agreement and to the Sub-Adviser under the Sub-Advisory Agreement was reasonable.
Profitability
The Board received and considered information concerning the profitability of Funds Management, as well as the profitability of both WFAM and Wells Fargo & Co. (“Wells Fargo”) from providing services to the fund family as a whole. The Board noted that the Sub-Adviser’s profitability information with respect to providing services to the Fund and other funds in the family was subsumed in the WFAM and Wells Fargo profitability analysis.
Funds Management reported on the methodologies and estimates used in calculating profitability, including a description of the methodology used to allocate certain expenses. Among other things, the Board noted that the levels of profitability reported on a fund-by-fund basis varied widely, depending on factors such as the size, type and age of fund.
Based on its review, the Board did not deem the profits reported by Funds Management, WFAM or Wells Fargo from services provided to the Fund to be at a level that would prevent it from approving the continuation of the Advisory Agreements.
Economies of scale
The Board received and considered information about the potential for Funds Management to experience economies of scale in the provision of management services to the Fund, the difficulties of calculating economies of scale at an individual fund level, and the extent to which potential scale benefits are shared with shareholders. The Board noted the existence of breakpoints in the Fund’s management fee structure, which operate generally to reduce the Fund’s expense ratios as the Fund grows in size, and the size of the Fund in relation to such breakpoints. The Board considered that in addition to management fee breakpoints, Funds Management shares potential economies of scale from its management business in a variety of ways, including through fee waiver and expense reimbursement arrangements, services that benefit shareholders, competitive management fee rates set at the outset without regard to breakpoints, and investments in the business intended to enhance services available to shareholders.
The Board concluded that Funds Management’s arrangements with respect to the Fund, including contractual breakpoints, constituted a reasonable approach to sharing potential economies of scale with the Fund and its shareholders.
Other benefits to Funds Management and the Sub-Adviser
The Board received and considered information regarding potential “fall-out” or ancillary benefits received by Funds Management and its affiliates, including the Sub-Adviser, as a result of their relationships with the Fund. Ancillary benefits could include, among others, benefits directly attributable to other relationships with the Fund and benefits potentially derived from an increase in Funds Management’s and the Sub-Adviser’s business as a result of their relationships with the Fund. The Board noted that various affiliates of Funds Management may receive distribution-related fees, shareholder servicing payments and sub-transfer agency fees in respect of shares sold or held through them and services provided.
The Board also reviewed information about soft dollar credits earned and utilized by the Sub-Adviser, fees earned by Funds Management and the Sub-Adviser from managing a private investment vehicle for the fund family’s securities lending collateral, and commissions earned by an affiliated broker from portfolio transactions.
Based on its consideration of the factors and information it deemed relevant, including those described here, the Board did not find that any ancillary benefits received by Funds Management and its affiliates, including the Sub-Adviser, were unreasonable.
Conclusion
At the Meeting, after considering the above-described factors and based on its deliberations and its evaluation of the information described above, the Board unanimously approved the continuation of the Advisory Agreements for a one-year term and determined that the compensation payable to Funds Management and the Sub-Adviser under each of the Advisory Agreements was reasonable.
Wells Fargo California Tax-Free Fund | 41
Other information (unaudited)
LIQUIDITY RISK MANAGEMENT PROGRAM
In accordance with Rule 22e-4 under the Investment Company Act of 1940, as amended (the “Liquidity Rule”), Wells Fargo Funds Trust (the “Trust”) has adopted and implemented a liquidity risk management program (the “Program”) on behalf of each of its series, including the Fund, which is reasonably designed to assess and manage the Fund’s liquidity risk. “Liquidity risk” is defined as the risk that the Fund is unable to meet redemption requests without significantly diluting remaining investors’ interests in the Fund. The Trust’s Board of Trustees (the “Board”) previously approved the designation of Wells Fargo Funds Management, LLC (“Funds Management”), the Fund’s investment manager, as the administrator of the Program, and Funds Management has established a Liquidity Risk Management Council composed of personnel from multiple departments within Funds Management and its affiliates to assist Funds Management in the implementation and on-going administration of the Program.
The Program is comprised of various components designed to support the assessment and/or management of liquidity risk, including: (1) the periodic assessment (no less frequently than annually) of certain factors that influence the Fund’s liquidity risk; (2) the periodic classification (no less frequently than monthly) of the Fund’s investments into one of four liquidity categories that reflect an estimate of their liquidity under current market conditions; (3) a 15% limit on the acquisition of “illiquid investments” (as defined under the Liquidity Rule); (4) to the extent the Fund does not invest primarily in “highly liquid investments” (as defined under the Liquidity Rule), the determination of a minimum percentage of the Fund’s assets that generally will be invested in highly liquid investments (an “HLIM”); (5) if the Fund has established an HLIM, the periodic review (no less frequently than annually) of the HLIM and the adoption of policies and procedures for responding to a shortfall of the Fund’s “highly liquid investments” below its HLIM; and (6) periodic reporting to the Board.
At a meeting of the Board held on May 26 and 28, 2020, the Board received a written report (the “Report”) from Funds Management that addressed the operation of the Program and assessed its adequacy and effectiveness of implementation. The Report covered the initial period from December 1, 2018 through December 31, 2019 (the “Reporting Period”). No significant liquidity events impacting the Fund were noted in the Report. There were no material changes to the Program during the Reporting Period. The Report concluded that the Program is operating effectively to assess and manage the Fund’s liquidity risk, and that the Program has been and continues to be adequately and effectively implemented to monitor and, as applicable, respond to the Fund’s liquidity developments.
There can be no assurance that the Program will achieve its objectives under all circumstances in the future. Please refer to the Fund’s prospectus for more information regarding the Fund’s exposure to liquidity risk and other risks to which an investment in the Fund may be subject.
42 | Wells Fargo California Tax-Free Fund
Effective on or after May 1, 2020, clients of Edward Jones (also referred to as “shareholders”) purchasing Fund shares on the Edward Jones commission and fee-based platforms are eligible only for the following sales charge discounts (also referred to as “breakpoints”) and waivers, which can differ from breakpoints and waivers described elsewhere in the Fund’s Prospectus or SAI or through another broker-dealer. In all instances, it is the shareholder’s responsibility to inform Edward Jones at the time of purchase of any relationship, holdings of Wells Fargo Funds or other facts qualifying the purchaser for breakpoints or waivers. Edward Jones can ask for documentation of such circumstance.
| Breakpoints available at Edward Jones |
| Rights of Accumulation (ROA) |
The applicable sales charge on a purchase of Class A shares is determined by taking into account all share classes (except any money market funds and retirement plan share classes) of Wells Fargo Funds held by the shareholder or in an account grouped by Edward Jones with other accounts for the purpose of providing certain pricing considerations (“pricing groups”). This includes all share classes held on the Edward Jones platform and/or held on another platform. The inclusion of eligible fund family assets in the rights of accumulation calculation is dependent on the shareholder notifying his or her financial advisor of such assets at the time of calculation. |
ROA is determined by calculating the higher of cost or market value (current shares x NAV). |
| Letter of Intent (LOI) |
Through a LOI, shareholders can receive the sales charge and breakpoint discounts for purchases shareholders intend to makeover a 13-month period from the date Edward Jones receives the LOI. The LOI is determined by calculating the higher of cost or market value of qualifying holdings at LOI initiation in combination with the value that the shareholder intends to buy over a 13-month period to calculate the front-end sales charge and any breakpoint discounts. Each purchase the shareholder makes during that 13-month period will receive the sales charge and breakpoint discount that applies to the total amount. The inclusion of eligible fund family assets in the LOI calculation is dependent on the shareholder notifying his or her financial advisor of such assets at the time of calculation. Purchases made before the LOI is received by Edward Jones are not covered under the LOI and will not reduce the sales charge previously paid. Sales charges will be adjusted if LOI is not met. |
| Sales charges are waived for the following shareholders and in the following situations at Edward Jones: |
● Associates of Edward Jones and its affiliates and their family members who are in the same pricing group (as determined by Edward Jones under its policies and procedures) as the associate. This waiver will continue for the remainder of the associate’s life if the associate retires from Edward Jones in good-standing. |
● Shares purchased in an Edward Jones fee-based program. |
● Shares purchased through reinvestment of capital gains distributions and dividend reinvestment. |
● Shares purchased from the proceeds of redeemed shares of the same fund family so long as the following conditions are met: 1) the proceeds are from the sale of shares within 60 days of the purchase, and 2) the sale and purchase are made in the same share class and the same account or the purchase is made in an individual retirement account with proceeds from liquidations in anon-retirement account. |
● Shares exchanged into Class A shares from another share class so long as the exchange is into the same fund and was initiated at the discretion of Edward Jones. Edward Jones is responsible for any remaining CDSC due to the fund company, if applicable. Any future purchases are subject to the applicable sales charge as disclosed in the prospectus. |
● Exchanges from Class C shares to Class A shares of the same fund, generally, in the 84th month following the anniversary of the purchase date or earlier at the discretion of Edward Jones. |
| If the shareholder purchases shares that are subject to a CDSC and those shares are redeemed before the CDSC is expired, the shareholder is responsible to pay the CDSC except in the following conditions available at Edward Jones: |
● The death or disability of the shareholder. |
● Systematic withdrawals with up to 10% per year of the account value. |
● Return of excess contributions from an Individual Retirement Account (IRA). |
● Shares sold as part of a required minimum distribution for IRA and retirement accounts if the redemption is taken in or after the year the shareholder reaches qualified age based on applicable IRS regulation. |
● Shares sold to pay Edward Jones fees or costs in such cases where the transaction is initiated by Edward Jones. |
● Shares exchanged in an Edward Jones fee-based program. |
● Shares acquired through NAV reinstatement. |
Wells Fargo California Tax-Free Fund | 43
Appendix I (unaudited)
| Other Important Information for accounts at Edward Jones: |
| Minimum Purchase Amounts |
● $250 initial purchase minimum |
● $50 subsequent purchase minimum |
| Minimum Balances |
| Edward Jones has the right to redeem at its discretion fund holdings with a balance of $250 or less. The following are examples of accounts that are not included in this policy: |
● A fee-based account held on an Edward Jones platform |
● A 529 account held on an Edward Jones platform |
● An account with an active systematic investment plan or letter of intent (LOI) |
| Changing Share Classes |
| At any time it deems necessary, Edward Jones has the authority to exchange at NAV a shareholder’s holdings in a fund to Class A shares. |
44 | Wells Fargo California Tax-Free Fund
Effective June 1, 2020, shareholders purchasing Fund shares through an Oppenheimer & Co. Inc. (“Oppenheimer”) platform or account are eligible only for the following load waivers (front-end sales charge waivers and contingent deferred or back-end, sales charge waivers) and discounts, which may differ from those disclosed in the Fund’s Prospectus or SAI.
| Front-end Sales Load Waivers on Class A Shares available at Oppenheimer |
| Employer-sponsored retirement, deferred compensation and employee benefit plans (including health savings accounts) and trusts used to fund those plans, provided that the shares are not held in a commission-based brokerage account and shares are held for the benefit of the plan. |
| Shares purchased by or through a 529 Plan. |
| Shares purchased through an Oppenheimer affiliated investment advisory program. |
| Shares purchased through reinvestment of capital gains distributions and dividend reinvestment when purchasing shares of the same fund (but not any other fund within the fund family). |
| Shares purchased from the proceeds of redemptions within the same fund family, provided (1) the repurchase occurs within 90 days following the redemption, (2) the redemption and purchase occur in the same account, and (3) redeemed shares were subject to a front-end or deferred sales load (known as Rights of Restatement). |
| A shareholder in the Fund’s Class C shares will have their shares exchanged at net asset value to Class A shares (or the appropriate share class) of the Fund if the shares are no longer subject to a CDSC and the exchange is in line with the policies and procedures of Oppenheimer. |
| Employees and registered representatives of Oppenheimer or its affiliates and their family members. |
| Directors or Trustees of the Fund, and employees of the Fund’s investment adviser or any of its affiliates, as described in the Prospectus. |
| CDSC Waivers on A and C Shares available at Oppenheimer |
| Death or disability of the shareholder. |
| Shares sold as part of a systematic withdrawal plan as described in the Prospectus. |
| Return of excess contributions from an IRA Account. |
| Shares sold as part of a required minimum distribution for IRA and retirement accounts due to the shareholder reaching the qualified age based on applicable IRS regulations as described in the Prospectus. |
| Shares sold to pay Oppenheimer fees but only if the transaction is initiated by Oppenheimer. |
| Shares acquired through a right of reinstatement. |
| Front-end load Discounts Available at Oppenheimer: Breakpoints, Rights of Accumulation & Letters of Intent |
| Breakpoints as described in the Prospectus. |
| Rights of Accumulation (ROA), which entitle shareholders to breakpoint discounts, will be automatically calculated based on the aggregated holding of fund family assets held by accounts within the purchaser’s household at Oppenheimer. Eligible fund family assets not held at Oppenheimer may be included in the ROA calculation only if the shareholder notifies his or her financial advisor about such assets. |
Wells Fargo California Tax-Free Fund | 45
Effective June 15, 2020, shareholders purchasing fund shares through a Robert W. Baird & Co. (“Baird”) platform or account will only be eligible for the following sales charge waivers (front-end sales charge waivers and CDSC waivers) and discounts, which may differ from those disclosed elsewhere in the Fund’s Prospectus or the SAI.
| Front-end Sales Load Waivers on Class A Shares available at Baird |
| Shares purchased through reinvestment of capital gains distributions and dividend reinvestment when purchasing share of the same fund. |
| Share purchase by employees and registers representatives of Baird or its affiliate and their family members as designated by Baird. |
| Shares purchase from the proceeds of redemptions within the same fund family, provided (1) the repurchase occurs within 90 days following the redemption, (2) the redemption and purchase occur in the same accounts, and (3) redeemed shares were subject to a front-end or deferred sales charge (known as rights of reinstatement). |
| A shareholder in the Funds Investor C Shares will have their share exchanged at net asset value to Investor A shares of the fund if the shares are no longer subject to CDSC and the exchange is in line with the policies and procedures of Baird. |
| Employer-sponsored retirement plans or charitable accounts in a transactional brokerage account at Baird, including 401(k) plans, 457 plans, employer-sponsored 403(b) plans, profit sharing and money purchase pension plans and defined benefit plans. For purposes of this provision, employer-sponsored retirement plans do not include SEP IRAs, Simple IRAs or SAR-SEPs. |
| CDSC Waivers on A and C Shares available at Baird |
| Shares sold due to death or disability of the shareholder. |
| Shares sold as part of a systematic withdrawal plan as described in the Fund’s Prospectus. |
| Shares bought due to returns of excess contributions from an IRA Account. |
| Shares sold as part of a required minimum distribution for IRA and retirement accounts due to the shareholder reaching age 72 as described in the Fund’s Prospectus. |
| Shares sold to pay Baird fees but only if the transaction is initiated by Baird. |
| Shares acquired through a right of reinstatement. |
| Front-end load Discounts Available at Baird: Breakpoint and/or Rights of Accumulation |
| Breakpoints as described in the Prospectus. |
| Rights of accumulations which entitles shareholders to breakpoint discounts will be automatically calculated based on the aggregated holding of fund family assets held by accounts within the purchaser’s household at Baird. Eligible fund family assets not held at Baird may be included in the rights of accumulations calculation only if the shareholder notifies his or her financial advisor about such assets. |
| Letters of Intent (LOI) allow for breakpoint discounts based on anticipated purchases within a fund family through Baird, over a 13-month period of time. |
46 | Wells Fargo California Tax-Free Fund
This page is intentionally left blank.
This page is intentionally left blank.
For more information
More information about Wells Fargo Funds is available free upon request. To obtain literature, please write, visit the Fund’s website, or call:
Wells Fargo Funds
P.O. Box 219967
Kansas City, MO 64121-9967
Website: wfam.com
Individual investors: 1-800-222-8222
Retail investment professionals: 1-888-877-9275
Institutional investment professionals: 1-866-765-0778

This report and the financial statements contained herein are submitted for the general information of the shareholders of the Fund. If this report is used for promotional purposes, distribution of the report must be accompanied or preceded by a current prospectus. Before investing, please consider the investment objectives, risks, charges, and expenses of the investment. For a current prospectus and, if available, a summary prospectus, containing this information, call 1-800-222-8222 or visit the Fund’s website at wfam.com. Read the prospectus carefully before you invest or send money.
Wells Fargo Asset Management (WFAM) is the trade name for certain investment advisory/management firms owned by Wells Fargo & Company. These firms include but are not limited to Wells Capital Management Incorporated and Wells Fargo Funds Management, LLC. Certain products managed by WFAM entities are distributed by Wells Fargo Funds Distributor, LLC (a broker-dealer and Member FINRA).
This material is for general informational and educational purposes only and is NOT intended to provide investment advice or a recommendation of any kind—including a recommendation for any specific investment, strategy, or plan.
INVESTMENT PRODUCTS: NOT FDIC INSURED ◾ NO BANK GUARANTEE ◾ MAY LOSE VALUE
© 2020 Wells Fargo & Company. All rights reserved.
PAR-0720-00240 08-20
A249/AR249 06-20

Annual Report
June 30, 2020
Wells Fargo
California Limited-Term Tax-Free Fund
Beginning on January 1, 2021, as permitted by new regulations adopted by the Securities and Exchange Commission, paper copies of the Wells Fargo Funds’ annual and semi-annual shareholder reports issued after this date will no longer be sent by mail, unless you specifically request paper copies of the reports. Instead, the reports will be made available on the Funds’ website, and you will be notified by mail each time a report is posted and provided with a website address to access the report.
If you already elected to receive shareholder reports electronically, you will not be affected by this change and you need not take any action. You may elect to receive shareholder reports and other communications from the Fund electronically at any time by contacting your financial intermediary (such as a broker-dealer or bank) or, if you are a direct investor, by calling 1-800-222-8222 or by enrolling at wellsfargo.com/advantagedelivery.
You may elect to receive all future reports in paper free of charge. If you invest through a financial intermediary, you can contact your financial intermediary to request that you continue to receive paper copies of your shareholder reports; if you invest directly with the Fund, you can call 1-800-222-8222. Your election to receive reports in paper will apply to all Wells Fargo Funds held in your account with your financial intermediary or, if you are a direct investor, to all Wells Fargo Funds that you hold.
|
Reduce clutter. Save trees. |
Sign up for electronic delivery of prospectuses and shareholder reports at wellsfargo.com/ |
The views expressed and any forward-looking statements are as of June 30, 2020, unless otherwise noted, and are those of the Fund managers and/or Wells Fargo Asset Management. Discussions of individual securities, or the markets generally, or any Wells Fargo Fund are not intended as individual recommendations. Future events or results may vary significantly from those expressed in any forward-looking statements. The views expressed are subject to change at any time in response to changing circumstances in the market. Wells Fargo Asset Management and the Fund disclaim any obligation to publicly update or revise any views expressed or forward-looking statements.
INVESTMENT PRODUCTS: NOT FDIC INSURED ◾ NO BANK GUARANTEE ◾ MAY LOSE VALUE
Wells Fargo California Limited-Term Tax-Free Fund | 1
Letter to shareholders (unaudited)

Andrew Owen
President
Wells Fargo Funds
Dear Shareholder:
We are pleased to offer you this annual report for the Wells Fargo California Limited-Term Tax-Free Fund for the 12-month period that ended June 30, 2020. Global stock markets saw earlier gains erased in February and March as governments around the world took unprecedented measures to stop the spread of the coronavirus at the expense of short-term economic output. However, markets rebounded from April through June to offset much of the losses as central banks attempted to bolster capital markets and confidence. Fixed-income markets generally performed better, with most achieving gains. Overall U.S. markets surpassed their international peers, while U.S. large-cap equity, as measured by the Russell 1000® Index1, easily outperformed small caps, as measured by the Russell 2000® Index2, for the 12-month period.
For the 12-month period, fixed-income securities generally had positive total returns while non-U.S. equities had broad losses and U.S. stocks performed strongly despite sharp volatility since late February. For the period, U.S. stocks, based on the S&P 500 Index,3 gained 7.51%. International stocks, as measured by the MSCI ACWI ex USA Index (Net),4 returned -4.80%, while the MSCI EM Index (Net)5 performed slightly better, with a -3.39% return. For bond investors, the Bloomberg Barclays U.S. Aggregate Bond Index6 returned a robust 8.74%, the Bloomberg Barclays Global Aggregate ex-USD Index7 gained a modest 0.71%, and the Bloomberg Barclays Municipal Bond Index8 returned 4.45% while the ICE BofA U.S. High Yield Index9 lost 1.10%.
The fiscal year began on a positive note.
The 12-month period began with the U.S. equity market advancing to new highs in July 2019. U.S. President Donald Trump initially backed off of earlier tariff threats against Mexico and China. However, later in July, the U.S. reversed course and threatened to impose higher tariffs on China’s exports after talks failed. China responded with tariff threats of its own and devalued the renminbi, roiling global markets. Major U.S. stock market indices closed July with the worst weekly results of the year. Bond prices gained as Treasury yields fell to multiyear lows, and the yield curve inverted at multiple points along the 30-year arc, with shorter term yields higher than longer-term. At the end of July, the U.S. Federal Reserve (Fed) cut its federal funds rate by 0.25%.
In August, U.S.-China trade tensions continued with no signs of compromise. Evidence of a continued global economic slowdown mounted, and central banks in China, New Zealand, and Thailand cut interest rates. Industrial and manufacturing data declined in China, Canada, Japan, and Germany. Adding to global uncertainty, Italy’s prime minister resigned,
| 1 | The Russell 1000® Index measures the performance of the 1,000 largest companies in the Russell 3000® Index, which represents approximately 92% of the total market capitalization of the Russell 3000® Index. You cannot invest directly in an index. |
| 2 | The Russell 2000® Index measures the performance of the 2,000 smallest companies in the Russell 3000® Index, which represents approximately 8% of the total market capitalization of the Russell 3000® Index. You cannot invest directly in an index. |
| 3 | The S&P 500 Index consists of 500 stocks chosen for market size, liquidity, and industry group representation. It is a market-value-weighted index with each stock’s weight in the index proportionate to its market value. You cannot invest directly in an index. |
| 4 | The Morgan Stanley Capital International (MSCI) All Country World Index (ACWI) ex USA Index (Net) is a free-float-adjusted market-capitalization-weighted index that is designed to measure the equity market performance of developed and emerging markets, excluding the United States. Source: MSCI. MSCI makes no express or implied warranties or representations and shall have no liability whatsoever with respect to any MSCI data contained herein. The MSCI data may not be further redistributed or used as a basis for other indices or any securities or financial products. This report is not approved, reviewed, or produced by MSCI. You cannot invest directly in an index. |
| 5 | The MSCI Emerging Markets (EM) Index (Net) is a free-float-adjusted market-capitalization-weighted index that is designed to measure equity market performance of emerging markets. You cannot invest directly in an index. |
| 6 | The Bloomberg Barclays U.S. Aggregate Bond Index is a broad-based benchmark that measures the investment-grade, U.S. dollar-denominated, fixed-rate taxable bond market, including Treasuries, government-related and corporate securities, mortgage-backed securities (agency fixed-rate and hybrid adjustable-rate mortgage pass-throughs), asset-backed securities, and commercial mortgage-backed securities. You cannot invest directly in an index. |
| 7 | The Bloomberg Barclays Global Aggregate ex-USD Index is an unmanaged index that provides a broad-based measure of the global investment-grade fixed-income markets excluding the U.S.-dollar-denominated debt market. You cannot invest directly in an index. |
| 8 | The Bloomberg Barclays Municipal Bond Index is an unmanaged index composed of long-term tax-exempt bonds with a minimum credit rating of Baa. You cannot invest directly in an index. |
| 9 | The ICE BofA U.S. High Yield Index is a market-capitalization-weighted index of domestic and Yankee high-yield bonds. The index tracks the performance of high-yield securities traded in the U.S. bond market. You cannot invest directly in an index. Copyright 2020. ICE Data Indices, LLC. All rights reserved. |
2 | Wells Fargo California Limited-Term Tax-Free Fund
Letter to shareholders (unaudited)
many feared a crackdown in Hong Kong as protestors sustained their calls for reform, and Prime Minister Boris Johnson planned to suspend Parliament as Brexit’s deadline neared.
In the U.S., the Fed cut interest rates a second time in September. U.S. manufacturing data disappointed investors. The U.S. Congress announced it would pursue an impeachment investigation of President Trump. Meanwhile, the Brexit impasse showed no signs of resolution. Officials in China said that hitting the country’s economic growth goals for the year would be difficult considering the weight of tariffs and trade restrictions. Although the S&P 500 Index finished the third quarter with the best year-to-date returns in more than 20 years, concerns about future returns remained.
The fourth quarter started on a strong note, with U.S.-China trade tensions relaxing in October along with renewed optimism for a U.K. Brexit deal and positive macroeconomic data. The initial estimate of U.S. third-quarter gross domestic product (GDP) growth was a resilient 1.9% annualized rate, while the U.S. unemployment rate fell to a 50-year low of 3.5% in September. However, despite resilience among U.S. consumers, business confidence declined while manufacturing activity contracted. Concerned with a potential economic slowdown, the Fed lowered interest rates another quarter point in late October—its third rate cut in four months. This helped push the S&P 500 Index to a new all-time high while emerging market equities rallied and global bonds declined overall, reflecting a broad pickup in risk appetite.
Equity markets continued to rally in November despite ongoing geopolitical risks. Hopes for a U.S.-China trade deal buoyed investor confidence. U.S. business sentiment improved slightly, and manufacturing and services activity picked up. While consumer confidence and purchasing manager activity rose in the eurozone, China reported weakening manufacturing and consumer data. Bond yields rose marginally, leading to slightly negative returns for global government and investment-grade corporate bonds.
Financial markets ended 2019 with a boost from the U.S. and China accord on a Phase One trade deal. That, along with the landslide win by the pro-Brexit U.K. Conservative Party in a national election and ongoing central bank support, gave investors greater confidence. U.S. economic indicators were generally positive, with the exception of manufacturing activity and business confidence. Consumer confidence was resilient, fed by a robust labor market, tame inflation, and lower interest rates, which boosted housing affordability and stimulated homebuyer activity. The impeachment of President Trump had little impact on markets. Meanwhile, slowing Chinese economic activity, partly attributable to the trade war, led to further government stimulus at year-end through lower reserve ratios, allowing banks to lend more money.
The year-end rally continued in early January 2020. However, capital market volatility picked up sharply in late January on concerns over the potential impact of the coronavirus on the global economy and stock markets. With sentiment somewhat souring, perceived safe havens did well in January. The U.S. dollar and Japanese yen both rose, and government bonds outperformed equities. While the S&P 500 Index held its ground, emerging market equities tumbled, including those in Asia.
In February, the coronavirus became the major market focus. Fears of the virus’s impact on global growth led to expectations of increased global central bank monetary policy support. That led the 10-year U.S. Treasury yield to fall to an all-time low of 1.1% by the end of the month. Although equity markets initially shrugged off concerns about the outbreak, focusing instead on strong fourth-quarter earnings and improving business confidence in January, market sentiment turned sharply lower toward month-end and the S&P 500 Index lost 8.2% for the month. Oil prices tumbled as Russia and the Organization of the Petroleum Exporting countries compounded a major decline in oil demand with a brutal price war, partly aimed at dissuading further U.S. shale production. As a result, the price of West Texas Intermediate crude oil fell 13% in February.
Wells Fargo California Limited-Term Tax-Free Fund | 3
Letter to shareholders (unaudited)
“The global spread of the coronavirus led country after country to clamp down on social and business-related activity in order to contain the virus from causing even greater devastation and overwhelming health care systems.”
“Despite ongoing economic weakness and high levels of uncertainty on the containment of the coronavirus and the timing of an effective vaccine, financial markets continued to post widely positive returns in June.”
The global spread of the coronavirus led country after country to clamp down on social and business-related activity in order to contain the virus from causing even greater devastation and overwhelming health care systems. This abrupt stoppage of economic activity led to the sharp deceleration of global output, sending economies into a deep contraction. Central bank responses were swift, as they slashed interest rates and expanded quantitative easing programs to restore liquidity and confidence to the markets. In the U.S., the Fed introduced several new lending programs, funding investment-grade bonds, money market mutual funds, and commercial paper while purchasing Treasuries, mortgage-backed securities, and overnight repurchase agreements. Meanwhile, stock markets tumbled quickly into a bear market, ending the longest bull stock market in U.S. history.
Markets rebounded strongly in April, with the S&P 500 Index gaining 12.8% for the month and the MSCI ACWI ex USA Index (Net) returning 7.6%. The rebound was fueled by unprecedented government and central bank stimulus measures taken to buffer the economic damage created by mass shutdowns enacted in order to contain the virus’s spread. The U.S. economy contracted by an annualized 5.0% pace in the first quarter, with 30 million new unemployment insurance claims in six weeks. In the eurozone, first-quarter real GDP shrank 3.8%, with the composite April Flash Purchasing Managers’ Index, a monthly survey of purchasing managers, falling to an all-time low of 13.5. The European Central Bank expanded its quantitative easing to include the purchase of additional government bonds of countries with the greatest virus-related need, including Italy and Spain. China’s first-quarter GDP fell by 6.8% year over year. However, retail sales, production, and investment showed signs of recovery. Extreme oil-price volatility continued as global supply far exceeded demand.
In May, the equity market rebound continued, with the S&P 500 Index climbing a further 4.8%. European and Japanese stock markets also had monthly gains. Investors regained confidence on reports of early signs of success in human trials of a coronavirus vaccine. Growth stocks continued to outperform value stocks while returns on global government bonds were generally flat. In the U.S., a gap grew between the stock market rebound and devastating economic data points, including an April unemployment rate of 14.7%, the highest level since World War II. Purchasing managers’ indices continued to reflect weakening activity in May in both the manufacturing and services sectors. U.S. corporate earnings reports indicated a 14% year-over-year contraction in earnings from the first quarter of 2019. However, high demand for technology, driven by remote activity, helped maintain robust information technology sector earnings, which helped drive powerful well-known technology stocks higher.
Despite ongoing economic weakness and high levels of uncertainty on the containment of the coronavirus and the timing of an effective vaccine, financial markets continued to post widely positive returns in June. As economies reopened, there were hopeful signs. U.S. retail sales rose 17% in May while retail sales in the U.K. rebounded by 12%. However, year over year, sales remained depressed. Vitally important to market sentiment was the ongoing commitment by central banks globally to do all they can to provide economic support through liquidity and low borrowing costs. U.S. economic activity was aided by one-time $1,200 stimulus checks and $600 bonus weekly unemployment benefits due to expire at the end of July. However, unemployment remained in the double digits, easing somewhat from 14.7% in April to 11.1% in June. At period-end, numerous states reported alarming increases of coronavirus cases. China’s economic recovery picked up momentum in June, though it remained far from a full recovery.
4 | Wells Fargo California Limited-Term Tax-Free Fund
Letter to shareholders (unaudited)
Don’t let short-term uncertainty derail long-term investment goals.
Periods of investment uncertainty can present challenges, but experience has taught us that maintaining long-term investment goals can be an effective way to plan for the future. To help you create a sound strategy based on your personal goals and risk tolerance, Wells Fargo Funds offers more than 100 mutual funds spanning a wide range of asset classes and investment styles. Although diversification cannot guarantee an investment profit or prevent losses, we believe it can be an effective way to manage investment risk and potentially smooth out overall portfolio performance. We encourage investors to know their investments and to understand that appropriate levels of risk-taking may unlock opportunities.
Thank you for choosing to invest with Wells Fargo Funds. We appreciate your confidence in us and remain committed to helping you meet your financial needs.
Sincerely,

Andrew Owen
President
Wells Fargo Funds
|
For further information about your Fund, contact your investment professional, visit our website at wfam.com, or call us directly at 1-800-222-8222. |
Notice to Shareholders
At a meeting held on August 10-12, 2020, the Board of Trustees of the Fund approved the following changes:
| ∎ | A change to the Fund’s automatic conversion feature for Class C shares in order to shorten the required holding period from 10 to 8 years. As a result, on a monthly basis beginning November 5, 2020, Class C shares will convert automatically into Class A shares 8 years after the initial date of purchase or, if you acquired your Class C shares through an exchange or conversion from another share class, 8 years after the date you acquired your Class C shares. When Class C shares that you acquired through a purchase or exchange convert, any other Class C shares that you purchased with reinvested dividends and distributions also will convert into Class A shares on a pro rata basis. |
Please note that a shorter holding period may apply depending on your intermediary. Please see “Appendix A—Sales Charge Reductions and Waivers for Certain Intermediaries” in the Fund’s prospectus for further information.
| ∎ | Changes to the Class A sales charge schedule for the Fund, effective with purchases made on or after September 21, 2020. |
NEW Class A Sales Charge Schedule effective September 21, 2020
Amount of Purchase | Front-end Sales Charge As % of Public Offering Price | Front-end Sales Charge As % of Net Amount Invested | Commission Paid to Intermediary As % of Public Offering Price | |||||||||
Less than $100,000 | 2.00 | % | 2.04 | % | 1.75 | % | ||||||
$100,000 but less than $250,000 | 1.00 | % | 1.01 | % | 0.85 | % | ||||||
$250,000 and over | 0.00 | %1 | 0.00 | % | 0.40 | %2 | ||||||
| 1 | If you redeem Class A shares purchased at or above the $250,000 breakpoint level within twelve months from the date of purchase, you will pay a CDSC of 0.40% of the NAV of the shares on the date of original purchase. Certain exceptions apply (see “CDSC Waivers” in the Fund’s Prospectus). For redemptions of Class A shares of the Fund purchased prior to August 1, 2018, the CDSC terms that were in place at the time of purchase will continue to apply. |
| 2 | The commission paid to an intermediary on purchases above the $250,000 breakpoint level includes an advance by Wells Fargo Funds Distributor of the first year’s shareholder servicing fee. |
Wells Fargo California Limited-Term Tax-Free Fund | 5
Performance highlights (unaudited)
Investment objective
The Fund seeks current income exempt from federal income tax and California individual income tax, consistent with capital preservation.
Manager
Wells Fargo Funds Management, LLC
Subadviser
Wells Capital Management Incorporated
Portfolio managers
Terry J. Goode
Brandon Pae
Adrian Van Poppel
Average annual total returns (%) as of June 30, 2020
| Including sales charge | Excluding sales charge | Expense ratios1 (%) | ||||||||||||||||||||||||||||||||
| Inception date | 1 year | 5 year | 10 year | 1 year | 5 year | 10 year | Gross | Net2 | ||||||||||||||||||||||||||
| Class A (SFCIX) | 11-18-1992 | -0.73 | 1.10 | 1.88 | 1.30 | 1.50 | 2.08 | 0.85 | 0.80 | |||||||||||||||||||||||||
| Class C (SFCCX) | 8-30-2002 | -0.46 | 0.74 | 1.33 | 0.54 | 0.74 | 1.33 | 1.60 | 1.55 | |||||||||||||||||||||||||
| Administrator Class (SCTIX) | 9-6-1996 | – | – | – | 1.50 | 1.72 | 2.30 | 0.79 | 0.60 | |||||||||||||||||||||||||
| Institutional Class (SFCNX)3 | 10-31-2014 | – | – | – | 1.60 | 1.80 | 2.35 | 0.52 | 0.50 | |||||||||||||||||||||||||
| Bloomberg Barclays Municipal 1-5 Year Blend Index4 | – | – | – | – | 3.14 | 2.11 | 2.04 | – | – | |||||||||||||||||||||||||
| Bloomberg Barclays California Municipal 1-5 Year Blend Index5 | – | – | – | – | 3.07 | 1.94 | 2.01 | – | – | |||||||||||||||||||||||||
Figures quoted represent past performance, which is no guarantee of future results, and do not reflect taxes that a shareholder may pay on an investment in a fund. Investment return and principal value of an investment will fluctuate so that an investor’s shares, when redeemed, may be worth more or less than their original cost. Performance shown without sales charges would be lower if sales charges were reflected. Current performance may be lower or higher than the performance data quoted, which assumes the reinvestment of dividends and capital gains. Current month-end performance is available on the Fund’s website, wfam.com.
Index returns do not include transaction costs associated with buying and selling securities, any mutual fund fees or expenses, or any taxes. It is not possible to invest directly in an index.
For Class A shares, the maximum front-end sales charge is 2.00%. For Class C shares, the maximum contingent deferred sales charge is 1.00%. Performance including a contingent deferred sales charge assumes the sales charge for the corresponding time period. Administrator Class and Institutional Class shares are sold without a front-end sales charge or contingent deferred sales charge.
Bond values fluctuate in response to the financial condition of individual issuers, general market and economic conditions, and changes in interest rates. Changes in market conditions and government policies may lead to periods of heightened volatility in the bond market and reduced liquidity for certain bonds held by the Fund. In general, when interest rates rise, bond values fall and investors may lose principal value. Interest rate changes and their impact on the Fund and its share price can be sudden and unpredictable. The use of derivatives may reduce returns and/or increase volatility. Certain investment strategies tend to increase the total risk of an investment (relative to the broader market). The Fund is exposed to California municipal securities risk and high-yield securities risk. Consult the Fund’s prospectus for additional information on these and other risks. A portion of the Fund’s income may be subject to federal, state, and/or local income taxes or the Alternative Minimum Tax (AMT). Any capital gains distributions may be taxable.
Please see footnotes on page 7.
6 | Wells Fargo California Limited-Term Tax-Free Fund
Performance highlights (unaudited)
| Growth of $10,000 investment as of June 30, 20206 |
|
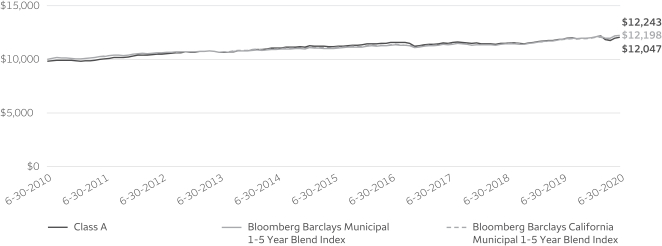
| 1 | Reflects the expense ratios as stated in the most recent prospectuses. The expense ratios shown are subject to change and may differ from the annualized expense ratios shown in the financial highlights of this report. |
| 2 | The manager has contractually committed through October 31, 2020, to waive fees and/or reimburse expenses to the extent necessary to cap total annual fund operating expenses after fee waivers at 0.80% for Class A, 1.55% for Class C, 0.60% for Administrator Class, and 0.50% for Institutional Class. Brokerage commissions, stamp duty fees, interest, taxes, acquired fund fees and expenses (if any), and extraordinary expenses are excluded from the expense caps. Prior to or after the commitment expiration date, the caps may be increased or the commitment to maintain the caps may be terminated only with the approval of the Board of Trustees. Without these caps, the Fund’s returns would have been lower. The expense ratio paid by an investor is the net expense ratio (the total annual fund operating expenses after fee waivers) as stated in the prospectuses. |
| 3 | Historical performance shown for the Institutional Class shares prior to their inception reflects the performance of the Administrator Class shares, and is not adjusted to reflect the Institutional Class share expenses. If these expenses had been included, returns for the Institutional Class shares would be higher. |
| 4 | The Bloomberg Barclays Municipal 1–5 Year Blend Index is the 1–5 Year component of the Bloomberg Barclays Municipal Bond Index. The Bloomberg Barclays Municipal Bond Index is an unmanaged index composed of long-term tax-exempt bonds with a minimum credit rating of Baa. You cannot invest directly in an index. |
| 5 | The Bloomberg Barclays California Municipal 1-5 Year Blend Index is the 1-5 Year component of the Bloomberg Barclays California Municipal Bond Index. You cannot invest directly in an index. |
| 6 | The chart compares the performance of Class A shares for the most recent ten years with the Bloomberg Barclays Municipal Bond 1-5 Year Blend Index and the Bloomberg Barclays California Municipal Bond 1-5 Year Blend Index. The chart assumes a hypothetical $10,000 investment in Class A shares and reflects all operating expenses and assumes the maximum initial sales charge of 2.00%. |
| 7 | Amounts are calculated based on the long-term total investments of the Fund. These amounts are subject to change and may have changed since the date specified. |
| 8 | The credit quality distribution of portfolio holdings reflected in the chart is based on ratings from Standard & Poor’s, Moody’s Investors Service, and/ or Fitch Ratings Ltd. Credit quality ratings apply to the underlying holdings of the Fund and not to the Fund itself. The percentages of the Fund’s portfolio with the ratings depicted in the chart are calculated based on the total market value of fixed income securities held by the Fund. If a security was rated by all three rating agencies, the middle rating was utilized. If rated by two of three rating agencies, the lower rating was utilized, and if rated by one of the rating agencies, that rating was utilized. Standard & Poor’s rates the creditworthiness of bonds, ranging from AAA (highest) to D (lowest). Ratings from A to CCC may be modified by the addition of a plus (+) or minus (-) sign to show relative standing within the rating categories. Standard & Poor’s rates the creditworthiness of short-term notes from SP-1 (highest) to SP-3 (lowest). Moody’s rates the creditworthiness of bonds, ranging from Aaa (highest) to C (lowest). Ratings Aa to B may be modified by the addition of a number 1 (highest) to 3 (lowest) to show relative standing within the ratings categories. Moody’s rates the creditworthiness of short-term U.S. tax-exempt municipal securities from MIG 1/VMIG 1 (highest) to SG (lowest). Fitch rates the creditworthiness of bonds, ranging from AAA (highest) to D (lowest). Credit quality distribution is subject to change and may have changed since the date specified. |
Wells Fargo California Limited-Term Tax-Free Fund | 7
Performance highlights (unaudited)
MANAGER’S DISCUSSION
Fund highlights
| ∎ | The Fund underperformed both of its benchmarks, the Bloomberg Barclays Municipal 1–5 Year Blend Index and the Bloomberg Barclays California Municipal 1–5 Year Blend Index, during the 12-month period that ended June 30, 2020. |
| ∎ | The primary drivers of performance were the Fund’s credit profile and sector selection. Credit positioning detracted from performance as we were overweight lower-investment-grade bonds (A-rated and BBB-rated) relative to higher-investment-grade bonds (AAA-rated and AA-rated). Higher-grade bonds outperformed over the period. Additionally, the Fund’s exposure to the industrial development revenue/pollution control revenue (IDR/PCR) and electric revenue sectors detracted from performance. |
| ∎ | We maintained the Fund’s duration slightly longer than that of the index throughout the year, which contributed to performance overall as yields across the curve ended the period lower by 68 to 99 basis points (bps; 100 bps equal 1.00%). The yield curve steepened as rates on shorter maturities declined more than longer maturities. As a result, the Fund’s underweight to the one- to five-year segment detracted for the period. |
| Effective maturity distribution as of June 30, 20207 |
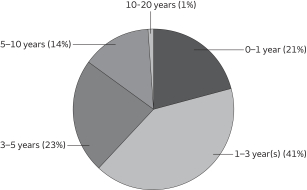 |
The coronavirus pandemic and the associated containment efforts became the dominant market influence over the 12-month period.
In 2019, market expectations moved the U.S. Federal Reserve (Fed) from a rate-hiking posture to multiple cuts in what was considered a “mid-cycle adjustment” at the time. Generally positive U.S. economic data was enough for most investors to expect continued slow growth and an extension of the economic expansion. Global trade tensions prompted a rise in market volatility, which subsided with the passage of a Phase One U.S.-China trade deal late in the calendar year. President Trump was formally impeached and ultimately acquitted by the U.S. Senate. By March, the coronavirus pandemic brought an end to the longest bull market on record.
The municipal bond market was heavily influenced by technical factors throughout the reporting period. Municipal mutual funds saw 61 straight weeks of net inflows, which pushed yields across ratings categories to all-time lows by late February. Low yields and ample demand drove municipal issuance higher but also altered the mix. Taxable municipal bonds as a proportion of new-issue municipal debt was at its highest level since 2010 by period-end. Pandemic-related volatility and liquidity pressures prompted record-setting outflows from municipal bonds in March. Strong support by the Fed, including a Municipal Liquidity Facility and more than $2.5 trillion in fiscal stimulus, buoyed markets and bolstered investor confidence. Several weeks of consecutive positive net flows for municipal funds and strong demand for new bonds drove yields back near the lows for highly rated issues. The period ended with the Fed pledging to keep short rates low for the foreseeable future, and the fundamental outlook for municipal issuers came into question as the path of recovery from the virus remains extraordinarily uncertain.
The Fund tactically extended duration over the period and used tax-loss swaps.
The positive momentum in the second half of 2019 pushed municipal yields lower and credit spreads tighter. As lower-rated deals began pricing at levels closer to higher-quality names, we became much more selective in adding lower-rated bonds. Although we did sell into this strength and reduced our A-rated exposure, this generally affected new purchases. We remained comfortable with older seasoned names already in the portfolio that have strong fundamentals and attractive purchase yields. We continued to be overweight lower investment grade (A-rated to BBB-rated) but did take up our AA-rated exposure over the period.
The portfolio duration was extended about 0.25 years going into the end of 2019. This is seasonally a strong period called the January Effect, as heavier calls/interest/maturities get reinvested when new-issue supply is often light. The strong performance of 2019 carried over into the beginning of 2020, and we began to move the duration back down while remaining longer than our index. By March, the pandemic-related volatility had moved yields sharply higher but did create several opportunities for us to use tax-loss swaps that helped improve book yields and tax efficiency. By the end of the period, we increased our airport and multifamily sector exposure and reduced our weightings in the local general obligation and lease revenue sectors.
Please see footnotes on page 7.
8 | Wells Fargo California Limited-Term Tax-Free Fund
Performance highlights (unaudited)
For the entire 12-month period, the Fund benefited from a longer relative duration and our exposure to the transportation and special tax sectors contributed to performance. Among the bottom performers, which detracted from performance, were our IDR/PCR and electric revenue sectors as well as our lower-rated exposure.
| Credit quality as of June 30, 20208 |
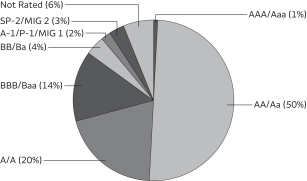 |
Rates are likely to remain low over the foreseeable future. Rating downgrades are expected, but defaults in the investment-grade space are expected to remain rare.
The longest economic expansion in history is over. The economic impact of the pandemic worldwide and nationally has yet to be fully realized. As we reopen the economy, we should see a boost versus the lows of April, but economic activity is likely to remain muted and pressure more troubled credits. Most states and municipalities came into this in the best financial shape they’ve been in for decades, notwithstanding the pension challenges of certain issuers. Municipal issuers have a long history of managing through
deep recessions, and many have already cut expenses, furloughed employees, and prepared to raise taxes. That doesn’t mean it will be easy. We have seen and will likely continue to see a deterioration of credit quality and resultant downgrades, but we don’t believe that will result in a material increase in defaults in the investment-grade space. We believe credit and individual security selection will be key drivers over the next year, and we will rely heavily on our deep analytical bench for exhaustive bottom-up analysis. We expect to manage duration tactically, moving between 95% and 105% of benchmark depending on technical factors and market opportunities. We will not be making wholesale sector changes but will look for prospects on a name-by-name basis across sectors, seeking credits that our analysts have vetted and that represent a strong relative-value opportunity.
Please see footnotes on page 7.
Wells Fargo California Limited-Term Tax-Free Fund | 9
As a shareholder of the Fund, you incur two types of costs: (1) transaction costs, including sales charges (loads) on purchase payments and contingent deferred sales charges (if any) on redemptions and (2) ongoing costs, including management fees, distribution (12b-1) and/or shareholder servicing fees, and other Fund expenses. This example is intended to help you understand your ongoing costs (in dollars) of investing in the Fund and to compare these costs with the ongoing costs of investing in other mutual funds.
The example is based on an investment of $1,000 invested at the beginning of the six-month period and held for the entire period from January 1, 2020 to June 30, 2020.
Actual expenses
The “Actual” line of the table below provides information about actual account values and actual expenses. You may use the information in this line, together with the amount you invested, to estimate the expenses that you paid over the period. Simply divide your account value by $1,000 (for example, an $8,600 account value divided by $1,000 = 8.6), then multiply the result by the number in the “Actual” line under the heading entitled “Expenses paid during period” for your applicable class of shares to estimate the expenses you paid on your account during this period.
Hypothetical example for comparison purposes
The “Hypothetical” line of the table below provides information about hypothetical account values and hypothetical expenses based on the Fund’s actual expense ratio and an assumed rate of return of 5% per year before expenses, which is not the Fund’s actual return. The hypothetical account values and expenses may not be used to estimate the actual ending account balance or expenses you paid for the period. You may use this information to compare the ongoing costs of investing in the Fund and other funds. To do so, compare this 5% hypothetical example with the 5% hypothetical examples that appear in the shareholder reports of the other funds.
Please note that the expenses shown in the table are meant to highlight your ongoing costs only and do not reflect any transactional costs, such as sales charges (loads) and contingent deferred sales charges. Therefore, the “Hypothetical” line of the table is useful in comparing ongoing costs only and will not help you determine the relative total costs of owning different funds. In addition, if these transactional costs were included, your costs would have been higher.
Beginning account value 1-1-2020 | Ending account value 6-30-2020 | Expenses paid during the period1 | Annualized net expense ratio | |||||||||||||
Class A | ||||||||||||||||
Actual | $ | 1,000.00 | $ | 1,003.28 | $ | 3.98 | 0.80 | % | ||||||||
Hypothetical (5% return before expenses) | $ | 1,000.00 | $ | 1,020.89 | $ | 4.02 | 0.80 | % | ||||||||
Class C | ||||||||||||||||
Actual | $ | 1,000.00 | $ | 999.55 | $ | 7.71 | 1.55 | % | ||||||||
Hypothetical (5% return before expenses) | $ | 1,000.00 | $ | 1,017.16 | $ | 7.77 | 1.55 | % | ||||||||
Administrator Class | ||||||||||||||||
Actual | $ | 1,000.00 | $ | 1,004.17 | $ | 2.99 | 0.60 | % | ||||||||
Hypothetical (5% return before expenses) | $ | 1,000.00 | $ | 1,021.88 | $ | 3.02 | 0.60 | % | ||||||||
Institutional Class | ||||||||||||||||
Actual | $ | 1,000.00 | $ | 1,004.69 | $ | 2.49 | 0.50 | % | ||||||||
Hypothetical (5% return before expenses) | $ | 1,000.00 | $ | 1,022.38 | $ | 2.51 | 0.50 | % | ||||||||
| 1 | Expenses paid is equal to the annualized net expense ratio of each class multiplied by the average account value over the period, multiplied by the number of days in the most recent fiscal half-year divided by the number of days in the fiscal year (to reflect the one-half-year period). |
10 | Wells Fargo California Limited-Term Tax-Free Fund
Portfolio of investments—June 30, 2020
Interest rate | Maturity date | Principal | Value | |||||||||||||
| Municipal Obligations: 98.18% | ||||||||||||||||
California: 91.67% | ||||||||||||||||
| Airport Revenue: 8.39% | ||||||||||||||||
California Municipal Finance Authority Revenue Senior Lien Linxs APM Project Series A | 5.00 | % | 12-31-2023 | $ | 750,000 | $ | 835,681 | |||||||||
California Municipal Finance Authority Revenue Senior Lien Linxs APM Project Series A | 5.00 | 6-30-2024 | 955,000 | 1,077,507 | ||||||||||||
California Municipal Finance Authority Revenue Senior Lien Linxs APM Project Series A | 5.00 | 12-31-2024 | 750,000 | 856,193 | ||||||||||||
Los Angeles CA Department of Airports AMT Series B | 5.00 | 5-15-2024 | 5,000,000 | 5,768,150 | ||||||||||||
Los Angeles CA Department of Airports AMT Series B | 5.00 | 5-15-2025 | 6,000,000 | 7,124,940 | ||||||||||||
Los Angeles CA Department of Airports AMT Series B | 5.00 | 5-15-2026 | 2,500,000 | 3,042,675 | ||||||||||||
Los Angeles CA Department of Airports AMT Subordinate Bond Series C | 5.00 | 5-15-2024 | 4,315,000 | 4,977,913 | ||||||||||||
Palm Springs CA Airport Passenger Facility Charge Revenue Palm Springs International Airport (BAM Insured) | 5.00 | 6-1-2027 | 1,205,000 | 1,398,776 | ||||||||||||
Port of Oakland Revenue Refunding Bond AMT Senior Lien Series P | 5.00 | 5-1-2026 | 1,000,000 | 1,057,200 | ||||||||||||
Port of Oakland Revenue Refunding Bond Intermediate Lien Series E | 5.00 | 11-1-2023 | 200,000 | 224,936 | ||||||||||||
Sacramento County CA Airport System Subordinate Refunding Bond AMT Series F | 5.00 | 7-1-2021 | 2,585,000 | 2,680,774 | ||||||||||||
Sacramento County CA Airport System Subordinate Refunding Bond AMT Series F | 5.00 | 7-1-2022 | 2,590,000 | 2,791,683 | ||||||||||||
Sacramento County CA Airport System Subordinate Refunding Bond AMT Series F | 5.00 | 7-1-2023 | 2,585,000 | 2,884,369 | ||||||||||||
Sacramento County CA Airport System Subordinate Refunding Bond AMT Series F | 5.00 | 7-1-2024 | 1,760,000 | 2,022,698 | ||||||||||||
San Diego County CA Regional Airport Authority Airport Revenue Refunding Bond AMT Subordinated Series C | 5.00 | 7-1-2028 | 1,000,000 | 1,257,890 | ||||||||||||
San Diego County CA Regional Airport Authority Airport Revenue Refunding Bond AMT Subordinated Series C | 5.00 | 7-1-2029 | 1,000,000 | 1,278,700 | ||||||||||||
San Diego County CA Regional Airport Authority Airport Revenue Refunding Bond AMT Subordinated Series C | 5.00 | 7-1-2027 | 750,000 | 925,433 | ||||||||||||
San Francisco CA City and Refunding Bond AMT Second Series A | 5.00 | 5-1-2025 | 740,000 | 792,140 | ||||||||||||
San Francisco CA City and Refunding Bond AMT Second Series A | 5.00 | 5-1-2030 | 3,850,000 | 4,090,856 | ||||||||||||
| 45,088,514 | ||||||||||||||||
|
| |||||||||||||||
| Education Revenue: 6.89% | ||||||||||||||||
California Municipal Finance Authority RAN Highlands Community 144A | 4.00 | 8-15-2020 | 2,000,000 | 2,006,740 | ||||||||||||
California Municipal Finance Authority RAN River Springs 144A | 4.00 | 8-15-2020 | 1,000,000 | 1,004,460 | ||||||||||||
California Municipal Finance Authority RAN River Springs 144A | 4.00 | 6-15-2021 | 2,250,000 | 2,271,173 | ||||||||||||
California Educational Facilities Authority Revenue Loma Linda University Series A | 5.00 | 4-1-2024 | 550,000 | 609,345 | ||||||||||||
California Educational Facilities Authority Revenue Loma Linda University Series A | 5.00 | 4-1-2026 | 325,000 | 373,155 | ||||||||||||
California Municipal Finance Authority California Baptist University Series A 144A | 4.00 | 11-1-2021 | 400,000 | 402,956 | ||||||||||||
California Municipal Finance Authority Charter School Albert Einstein Academies Project Series A | 6.00 | 8-1-2023 | 445,000 | 470,160 | ||||||||||||
California Municipal Finance Authority Charter School Revenue Palmdale Aerospace Academy Project Series A 144A | 3.88 | 7-1-2028 | 1,350,000 | 1,364,931 | ||||||||||||
California Municipal Finance Authority Revenue Refunding Bond Biola University | 5.00 | 10-1-2027 | 790,000 | 914,931 | ||||||||||||
California Municipal Finance Authority Revenue Refunding Bond California Lutheran University | 5.00 | 10-1-2021 | 250,000 | 259,155 | ||||||||||||
The accompanying notes are an integral part of these financial statements.
Wells Fargo California Limited-Term Tax-Free Fund | 11
Portfolio of investments—June 30, 2020
Interest rate | Maturity date | Principal | Value | |||||||||||||
| Education Revenue (continued) | ||||||||||||||||
California Municipal Finance Authority Revenue Refunding Bond California Lutheran University | 5.00 | % | 10-1-2022 | $ | 250,000 | $ | 266,830 | |||||||||
California Municipal Finance Authority Revenue Refunding Bond California Lutheran University | 5.00 | 10-1-2023 | 225,000 | 245,781 | ||||||||||||
California Municipal Finance Authority Revenue Refunding Bond California Lutheran University | 5.00 | 10-1-2024 | 275,000 | 306,155 | ||||||||||||
California Municipal Finance Authority Revenue Refunding Bond California Lutheran University | 5.00 | 10-1-2025 | 275,000 | 310,992 | ||||||||||||
California Municipal Finance Authority Revenue Refunding Bond California Lutheran University | 5.00 | 10-1-2026 | 300,000 | 343,134 | ||||||||||||
California School Finance Authority Bright Star School Obligation Group 144A | 5.00 | 6-1-2027 | 1,705,000 | 1,809,875 | ||||||||||||
California School Finance Authority Classical Academies Project Series A 144A | 3.25 | 10-1-2022 | 1,950,000 | 1,953,315 | ||||||||||||
California School Finance Authority Coastal Academy Project Series A 144A | 5.00 | 10-1-2022 | 200,000 | 207,768 | ||||||||||||
California School Finance Authority Rocketship Education Series A 144A | 5.00 | 6-1-2021 | 205,000 | 208,571 | ||||||||||||
California School Finance Authority Rocketship Education Series A 144A | 5.00 | 6-1-2026 | 500,000 | 531,715 | ||||||||||||
California Statewide CDA California Baptist University Series A | 5.13 | 11-1-2023 | 580,000 | 600,265 | ||||||||||||
California Statewide CDA Refunding Bond California Baptist University Series A 144A | 3.00 | 11-1-2022 | 1,300,000 | 1,297,062 | ||||||||||||
California Statewide CDA School Facilities | 5.88 | 7-1-2022 | 645,000 | 667,665 | ||||||||||||
University of California Series AR | 5.00 | 5-15-2032 | 6,000,000 | 7,321,440 | ||||||||||||
University of California Series AK | 5.00 | 5-15-2048 | 10,000,000 | 11,299,200 | ||||||||||||
| 37,046,774 | ||||||||||||||||
|
| |||||||||||||||
| GO Revenue: 22.93% | ||||||||||||||||
Alvord CA Unified School District Election of 2007 Series B (AGM Insured) | 6.50 | 8-1-2020 | 1,605,000 | 1,612,848 | ||||||||||||
Bassett CA Unified School District Refunding Bond Series B (BAM Insured) | 5.00 | 8-1-2021 | 550,000 | 578,606 | ||||||||||||
Bassett CA Unified School District Refunding Bond Series B (BAM Insured) | 5.00 | 8-1-2023 | 725,000 | 822,201 | ||||||||||||
California | 5.00 | 10-1-2021 | 6,795,000 | 7,193,119 | ||||||||||||
California | 5.00 | 11-1-2022 | 2,500,000 | 2,774,750 | ||||||||||||
California | 5.00 | 10-1-2023 | 8,400,000 | 9,670,500 | ||||||||||||
California | 5.25 | 10-1-2022 | 2,750,000 | 3,057,065 | ||||||||||||
California Refunding Bond Various Purpose Bidding Group C (BAM Insured) | 5.00 | 9-1-2027 | 8,500,000 | 10,678,975 | ||||||||||||
California Series B | 5.00 | 9-1-2023 | 10,730,000 | 12,313,963 | ||||||||||||
California Statewide Refunding Bond Various Purpose | 5.00 | 8-1-2025 | 3,500,000 | 4,290,405 | ||||||||||||
California Statewide Series B (1 Month LIBOR +0.76%) ± | 0.89 | 12-1-2031 | 2,500,000 | 2,498,600 | ||||||||||||
California Statewide Series E (SIFMA Municipal Swap +0.43%) ± | 0.56 | 12-1-2029 | 3,050,000 | 3,017,335 | ||||||||||||
Central California Unified School District Refunding Bond (AGM Insured) | 5.00 | 7-1-2021 | 400,000 | 418,912 | ||||||||||||
Central California Unified School District Refunding Bond (AGM Insured) | 5.00 | 7-1-2022 | 750,000 | 817,148 | ||||||||||||
Coachella Valley CA Unified School District (BAM Insured) | 4.00 | 8-1-2021 | 2,230,000 | 2,315,476 | ||||||||||||
Coachella Valley CA Unified School District (BAM Insured) | 4.00 | 8-1-2022 | 1,000,000 | 1,071,130 | ||||||||||||
Dixon CA Unified School District (AGM Insured) | 5.00 | 8-1-2021 | 1,210,000 | 1,270,222 | ||||||||||||
Dixon CA Unified School District (AGM Insured) | 5.00 | 8-1-2022 | 1,285,000 | 1,402,950 | ||||||||||||
El Monte CA City School District CAB BAN ¤ | 0.00 | 4-1-2023 | 2,000,000 | 1,955,880 | ||||||||||||
El Monte CA Union High School Refunding Bond | 5.00 | 6-1-2021 | 1,315,000 | 1,370,743 | ||||||||||||
Fowler CA Unified School District School Facilities Improvement District #1 (National Insured) | 5.20 | 7-1-2020 | 120,000 | 120,000 | ||||||||||||
Hayward CA Unified School District Certificate of Participation (AGM Insured) | 5.00 | 8-1-2022 | 500,000 | 545,895 | ||||||||||||
Hayward CA Unified School District Certificate of Participation (AGM Insured) | 5.00 | 8-1-2023 | 805,000 | 912,926 | ||||||||||||
Huntington Beach CA City School District Election of 2002 | 4.00 | 8-1-2021 | 505,000 | 525,816 | ||||||||||||
Inglewood CA Unified School District Election of 2012 Series B (BAM Insured) | 4.00 | 8-1-2021 | 320,000 | 332,586 | ||||||||||||
Inglewood CA Unified School District Election of 2012 Series B (BAM Insured) | 4.00 | 8-1-2022 | 200,000 | 214,874 | ||||||||||||
Inglewood CA Unified School District Election of 2012 Series B (BAM Insured) | 5.00 | 8-1-2023 | 195,000 | 221,852 | ||||||||||||
Inglewood CA Unified School District Election of 2012 Series B (BAM Insured) | 5.00 | 8-1-2024 | 150,000 | 176,529 | ||||||||||||
Inglewood CA Unified School District Election of 2012 Series B (BAM Insured) | 5.00 | 8-1-2025 | 170,000 | 206,009 | ||||||||||||
Inglewood CA Unified School District Election of 2012 Series B (BAM Insured) | 5.00 | 8-1-2026 | 235,000 | 291,797 | ||||||||||||
La Habra CA School District Refunding Bond | 5.00 | 8-1-2021 | 805,000 | 846,417 | ||||||||||||
The accompanying notes are an integral part of these financial statements.
12 | Wells Fargo California Limited-Term Tax-Free Fund
Portfolio of investments—June 30, 2020
Interest rate | Maturity date | Principal | Value | |||||||||||||
| GO Revenue (continued) | ||||||||||||||||
Long Beach CA Harbor Revenue AMT Series C | 5.00 | % | 5-15-2027 | $ | 500,000 | $ | 572,510 | |||||||||
Los Angeles CA Unified School District Refunding Bond Series D | 5.00 | 7-1-2023 | 6,180,000 | 7,035,312 | ||||||||||||
Mount San Antonio Community College District CAB ¤ | 0.00 | 4-1-2022 | 10,000,000 | 9,923,600 | ||||||||||||
Oak Valley CA Hospital District Refunding Bond Los Angeles County CA RDA | 4.00 | 7-1-2020 | 500,000 | 500,000 | ||||||||||||
Oak Valley CA Hospital District Refunding Bond Los Angeles County CA RDA | 5.00 | 7-1-2021 | 950,000 | 993,159 | ||||||||||||
Oak Valley CA Hospital District Refunding Bond Los Angeles County CA RDA | 5.00 | 7-1-2022 | 750,000 | 809,753 | ||||||||||||
Oak Valley CA Hospital District Refunding Bond Los Angeles County CA RDA | 5.00 | 7-1-2023 | 755,000 | 843,629 | ||||||||||||
Oakland CA Unified School District Alameda County Election of 2012 Series A | 5.00 | 8-1-2022 | 750,000 | 813,780 | ||||||||||||
Oakland CA Unified School District Alameda County Election of 2012 Series A | 5.00 | 8-1-2024 | 600,000 | 693,240 | ||||||||||||
Oakland CA Unified School District Refunding Bond | 5.00 | 8-1-2025 | 1,540,000 | 1,823,945 | ||||||||||||
Oakland CA Unified School District Refunding Bond Measure B Series B | 5.00 | 8-1-2026 | 500,000 | 604,060 | ||||||||||||
Oakland CA Unified School District Refunding Bond Measure J Series C | 5.00 | 8-1-2025 | 795,000 | 941,582 | ||||||||||||
Palomar Pomerado Health CA CAB Electric Series A (National Insured) ¤ | 0.00 | 8-1-2025 | 1,000,000 | 937,540 | ||||||||||||
Redondo Beach CA Unified School District CAB Election of 2008 Series E ¤ | 0.00 | 8-1-2020 | 460,000 | 459,857 | ||||||||||||
Riverside CA Community College District Election of 2004 CAB Series D ¤ | 0.00 | 8-1-2020 | 535,000 | 534,797 | ||||||||||||
Sacramento CA City Unified School Election of 2012 Measure Q Series E | 5.00 | 8-1-2029 | 1,500,000 | 1,833,330 | ||||||||||||
Sacramento CA City Unified School Refunding Bond | 5.00 | 7-1-2022 | 485,000 | 523,165 | ||||||||||||
Sacramento CA City Unified School Refunding Bond | 5.00 | 7-1-2026 | 2,430,000 | 2,515,366 | ||||||||||||
San Gorgonio CA Memorial Healthcare Refunding Bond | 5.00 | 8-1-2021 | 275,000 | 283,170 | ||||||||||||
San Gorgonio CA Memorial Healthcare Refunding Bond | 5.00 | 8-1-2022 | 500,000 | 528,140 | ||||||||||||
San Gorgonio CA Memorial Healthcare Refunding Bond | 5.00 | 8-1-2023 | 1,000,000 | 1,073,330 | ||||||||||||
Santa Ana CA Unified School District CAB Election of 2008 Series A ¤ | 0.00 | 8-1-2020 | 1,815,000 | 1,814,020 | ||||||||||||
Sierra Kings CA Health Care Refunding Bond | 4.00 | 8-1-2021 | 345,000 | 354,429 | ||||||||||||
Sierra Kings CA Health Care Refunding Bond | 4.00 | 8-1-2022 | 425,000 | 446,892 | ||||||||||||
Sierra Kings CA Health Care Refunding Bond | 4.00 | 8-1-2023 | 405,000 | 435,104 | ||||||||||||
Sierra Kings CA Health Care Refunding Bond | 4.00 | 8-1-2024 | 420,000 | 459,568 | ||||||||||||
Soledad CA Unified School District BAN ¤ | 0.00 | 8-1-2021 | 3,000,000 | 2,980,920 | ||||||||||||
SouthWestern Community College District Refunding Bond | 5.00 | 8-1-2021 | 2,710,000 | 2,850,947 | ||||||||||||
Sweetwater CA Union High School District PFA Refunding Bond (BAM Insured) | 5.00 | 8-1-2021 | 620,000 | 650,027 | ||||||||||||
Twin Rivers CA Unified School District Series A (BAM Insured) | 5.00 | 8-1-2020 | 510,000 | 511,897 | ||||||||||||
Vacaville CA Unified School District Series C (BAM Insured) | 5.00 | 8-1-2022 | 675,000 | 741,400 | ||||||||||||
Vallejo City CA Unified School District Refunding Bond Series A (National Insured) | 5.90 | 2-1-2022 | 3,905,000 | 4,197,367 | ||||||||||||
| 123,211,365 | ||||||||||||||||
|
| |||||||||||||||
| Health Revenue: 7.06% | ||||||||||||||||
California HFFA Catholic Healthcare West Series A | 5.25 | 3-1-2023 | 4,000,000 | 4,098,360 | ||||||||||||
California HFFA El Camino Hospital | 5.00 | 2-1-2025 | 1,000,000 | 1,180,460 | ||||||||||||
California HFFA Memorial Health Services Series A | 5.00 | 10-1-2023 | 2,475,000 | 2,716,832 | ||||||||||||
California HFFA Sutter Health Series A | 5.00 | 11-15-2023 | 2,500,000 | 2,845,225 | ||||||||||||
California Municipal Finance Authority Community Medical Centers Series A | 5.00 | 2-1-2023 | 735,000 | 807,596 | ||||||||||||
California Municipal Finance Authority Community Medical Centers Series A | 5.00 | 2-1-2024 | 500,000 | 566,910 | ||||||||||||
California Municipal Finance Authority Community Medical Centers Series A | 5.00 | 2-1-2025 | 1,000,000 | 1,158,540 | ||||||||||||
California Municipal Finance Authority Revenue Health Right 360 Series A 144A | 5.00 | 11-1-2029 | 1,170,000 | 1,312,529 | ||||||||||||
California Municipal Finance Authority Revenue Insured Channing House Project Series A | 5.00 | 5-15-2023 | 925,000 | 1,035,871 | ||||||||||||
California Municipal Finance Authority Revenue Insured Paradise Valley Estates Project Series B1 | 2.25 | 7-1-2025 | 2,200,000 | 2,207,238 | ||||||||||||
California Municipal Finance Authority Revenue Insured Paradise Valley Estates Project Series B2 | 2.00 | 7-1-2024 | 2,500,000 | 2,507,675 | ||||||||||||
California Municipal Finance Authority Revenue Refunding Bond Community Medical Centers Series A | 5.00 | 2-1-2022 | 1,000,000 | 1,061,580 | ||||||||||||
California Municipal Finance Authority Revenue Refunding Bond Eisenhower Medical Center Series A | 5.00 | 7-1-2027 | 1,650,000 | 2,000,510 | ||||||||||||
The accompanying notes are an integral part of these financial statements.
Wells Fargo California Limited-Term Tax-Free Fund | 13
Portfolio of investments—June 30, 2020
Interest rate | Maturity date | Principal | Value | |||||||||||||
| Health Revenue (continued) | ||||||||||||||||
California Municipal Finance Authority Revenue Refunding Bond Eisenhower Medical Center Series A | 5.00 | % | 7-1-2029 | $ | 400,000 | $ | 479,916 | |||||||||
California Statewide CDA Adventist Health Systems West Series A | 5.00 | 3-1-2024 | 800,000 | 912,672 | ||||||||||||
California Statewide CDA Health Facilities Catholic Series F (AGM Insured) (m) | 0.10 | 7-1-2040 | 1,000,000 | 1,000,000 | ||||||||||||
California Statewide CDA Henry Mayo Newhall Memorial Hospital Series A (AGM Insured) | 5.00 | 10-1-2021 | 500,000 | 524,975 | ||||||||||||
California Statewide CDA Henry Mayo Newhall Memorial Hospital Series A (AGM Insured) | 5.00 | 10-1-2022 | 395,000 | 430,175 | ||||||||||||
California Statewide CDA Henry Mayo Newhall Memorial Hospital Series A (AGM Insured) | 5.00 | 10-1-2023 | 500,000 | 563,145 | ||||||||||||
California Statewide CDA Huntington Memorial Hospital | 5.00 | 7-1-2025 | 500,000 | 582,035 | ||||||||||||
California Statewide CDA Huntington Memorial Hospital | 5.00 | 7-1-2026 | 500,000 | 593,735 | ||||||||||||
California Statewide CDA Loma Linda University Medical Center Series A 144A | 5.00 | 12-1-2026 | 250,000 | 284,238 | ||||||||||||
California Statewide CDA Loma Linda University Medical Center Series A 144A | 5.00 | 12-1-2027 | 300,000 | 329,364 | ||||||||||||
California Statewide CDA Loma Linda University Medical Center Series A 144A | 5.00 | 12-1-2028 | 250,000 | 279,843 | ||||||||||||
California Statewide CDA Viamonte Senior Living Project Series B | 3.00 | 7-1-2025 | 3,000,000 | 3,020,370 | ||||||||||||
Palomar Health California Certificate of Participation Health & Arch Health Partners Incorporated | 5.00 | 11-1-2020 | 250,000 | 253,280 | ||||||||||||
Palomar Health California Certificate of Participation Health & Arch Health Partners Incorporated | 5.00 | 11-1-2021 | 275,000 | 289,484 | ||||||||||||
Palomar Health California Certificate of Participation Health & Arch Health Partners Incorporated | 5.00 | 11-1-2022 | 375,000 | 409,313 | ||||||||||||
Palomar Health California Certificate of Participation Health & Arch Health Partners Incorporated | 5.00 | 11-1-2023 | 300,000 | 338,454 | ||||||||||||
Palomar Health California Certificate of Participation Health & Arch Health Partners Incorporated | 5.00 | 11-1-2024 | 300,000 | 348,525 | ||||||||||||
Palomar Health California Certificate of Participation Health & Arch Health Partners Incorporated | 5.00 | 11-1-2025 | 330,000 | 391,463 | ||||||||||||
San Buenaventura CA Community Mental Health System | 6.50 | 12-1-2021 | 2,585,000 | 2,748,346 | ||||||||||||
Washington Township CA Health Care District Refunding Bond Series A | 5.00 | 7-1-2023 | 600,000 | 669,864 | ||||||||||||
| 37,948,523 | ||||||||||||||||
|
| |||||||||||||||
| Housing Revenue: 8.22% | ||||||||||||||||
California Department of Veterans Affairs Home Purchase Series A | 3.50 | 12-1-2021 | 855,000 | 879,427 | ||||||||||||
California HFA Home Mortgage Series A (GNMA/FNMA/FHLMC Insured) | 3.75 | 8-1-2020 | 270,000 | 270,597 | ||||||||||||
California HFA Municipal Certificate of Participation Series 2 Class A | 4.00 | 3-20-2033 | 5,192,464 | 5,565,647 | ||||||||||||
California Independent Cities Finance Authority Mobile Home Park Revenue Refunding Bond Union City Tropics | 4.25 | 5-15-2024 | 745,000 | 830,452 | ||||||||||||
California Municipal Finance Authority Housing Revenue Dino Papavero Apartments Project | 1.50 | 6-1-2022 | 10,000,000 | 10,067,200 | ||||||||||||
California Municipal Finance Authority Multifamily Housing Revenue 1 Church Street Series B | 2.19 | 9-1-2021 | 10,000,000 | 10,026,300 | ||||||||||||
California Municipal Finance Authority Peppertree Senior Apartments Series A (FHLMC Insured, FHLMC LIQ) | 2.80 | 6-1-2023 | 2,500,000 | 2,665,375 | ||||||||||||
California Municipal Finance Authority Student Housing Davis I LLC West Village Student Housing Project | 5.00 | 5-15-2024 | 1,200,000 | 1,341,228 | ||||||||||||
California Municipal Finance Authority Student Housing Davis I LLC West Village Student Housing Project | 5.00 | 5-15-2025 | 3,435,000 | 3,914,183 | ||||||||||||
California Municipal Finance Authority Village Grove Apartments Series A (FHLMC Insured, FHLMC LIQ) | 3.10 | 12-1-2021 | 1,000,000 | 1,038,170 | ||||||||||||
California Statewide CDA College Housing Revenue Bonds 144A | 5.00 | 7-1-2024 | 500,000 | 514,810 | ||||||||||||
California Statewide CDA Lancer Educational Student Housing Project Series A 144A | 3.00 | 6-1-2029 | 750,000 | 691,020 | ||||||||||||
The accompanying notes are an integral part of these financial statements.
14 | Wells Fargo California Limited-Term Tax-Free Fund
Portfolio of investments—June 30, 2020
Interest rate | Maturity date | Principal | Value | |||||||||||||
| Housing Revenue (continued) | ||||||||||||||||
FHLMC Multifamily Variable Rate Certificates Series M 057 | 2.40 | % | 10-15-2029 | $ | 5,990,000 | $ | 6,373,360 | |||||||||
| 44,177,769 | ||||||||||||||||
|
| |||||||||||||||
| Industrial Development Revenue: 0.65% | ||||||||||||||||
San Francisco CA City and County Airports Commission International Airport Revenue AMT Special Facilities Lease SFO Fuel Company Series 2019A | 5.00 | 1-1-2025 | 3,000,000 | 3,512,700 | ||||||||||||
|
| |||||||||||||||
| Miscellaneous Revenue: 11.37% | ||||||||||||||||
Alameda County CA Joint Powers Authority Multiple Capital Projects Series A | 5.00 | 12-1-2021 | 1,000,000 | 1,067,880 | ||||||||||||
Brentwood CA Infrastructure Financing Authority Subordinate Bond Series B | 4.00 | 9-2-2021 | 1,135,000 | 1,184,009 | ||||||||||||
California | 5.00 | 9-1-2022 | 2,240,000 | 2,468,973 | ||||||||||||
California Infrastructure & Economic Development Bank Refunding Bond California Academy of Sciences Project Series C (1 Month LIBOR +0.38%) ± | 0.51 | 8-1-2047 | 4,000,000 | 3,973,080 | ||||||||||||
California Public Works Board Capital Project Series G | 5.00 | 11-1-2020 | 3,000,000 | 3,047,040 | ||||||||||||
California Public Works Board Department of Corrections & Rehabilitation Series C | 5.00 | 10-1-2022 | 1,500,000 | 1,655,880 | ||||||||||||
California Public Works Board Judicial Council Projects Series B | 5.00 | 10-1-2022 | 500,000 | 551,960 | ||||||||||||
California Statewide CDA Refunding Bond (AGM Insured) | 5.00 | 11-15-2021 | 200,000 | 213,150 | ||||||||||||
California Statewide CDA Refunding Bond (AGM Insured) | 5.00 | 11-15-2022 | 200,000 | 219,832 | ||||||||||||
California Statewide Community Monterey County Savers Bond (BAM Insured) | 5.00 | 8-1-2027 | 2,185,000 | 2,748,446 | ||||||||||||
Chula Vista CA Certificate of Participation Refunding Bond Police Facility Project | 5.00 | 10-1-2021 | 720,000 | 761,256 | ||||||||||||
Compton CA PFA Lease 144A | 4.00 | 9-1-2022 | 1,530,000 | 1,518,357 | ||||||||||||
Compton CA PFA Refunding Bond 144A | 4.00 | 9-1-2027 | 2,000,000 | 1,879,560 | ||||||||||||
Desert Sands CA Unified School District Certificate of Participation (BAM Insured) | 5.00 | 3-1-2024 | 1,500,000 | 1,738,845 | ||||||||||||
Golden Empire School California Financing Authority Refunding Bond Kern High School District | 5.00 | 5-1-2021 | 1,000,000 | 1,036,480 | ||||||||||||
Inglewood CA Unified School District School Facilities Authority (AGM Insured) | 5.25 | 10-15-2023 | 8,670,000 | 9,729,734 | ||||||||||||
Irvine CA Limited Obligation Improvement Bonds Reassessment District #15-2 | 5.00 | 9-2-2023 | 800,000 | 897,144 | ||||||||||||
Irvine CA Limited Obligation Improvement Bonds Reassessment District #15-2 | 5.00 | 9-2-2024 | 850,000 | 979,617 | ||||||||||||
Lodi CA PFA Electric Refunding Bond (AGM Insured) | 5.00 | 9-1-2024 | 1,100,000 | 1,309,077 | ||||||||||||
Los Angeles CA Public Works Series D | 5.00 | 12-1-2027 | 1,605,000 | 1,941,569 | ||||||||||||
Los Angeles CA Unified School District Certificate of Participation Headquarters Building Projects Series B | 5.00 | 10-1-2025 | 1,875,000 | 2,038,838 | ||||||||||||
Mountain HFA California Utility System Revenue Series A | 5.00 | 12-1-2029 | 520,000 | 665,189 | ||||||||||||
Mountain HFA California Utility System Revenue Series A | 5.00 | 12-1-2030 | 710,000 | 898,995 | ||||||||||||
Mountain HFA California Utility System Revenue Series A | 5.00 | 12-1-2031 | 745,000 | 933,917 | ||||||||||||
Palo Alto CA Improvement Bond Act of 1915 University Area Off-Street Parking Assessment District | 4.00 | 9-2-2021 | 450,000 | 469,539 | ||||||||||||
Sacramento CA City Financing Refunding Bond Master Lease Program Facilities (BAM Insured) | 5.00 | 12-1-2022 | 800,000 | 890,984 | ||||||||||||
Sacramento CA City Schools Joint Powers Financing Authority Series A (BAM Insured) | 5.00 | 3-1-2021 | 830,000 | 856,021 | ||||||||||||
Sacramento CA City Schools Joint Powers Financing Authority Series A (BAM Insured) | 5.00 | 3-1-2022 | 775,000 | 835,411 | ||||||||||||
Sacramento CA City Schools Joint Powers Financing Authority Series A (BAM Insured) | 5.00 | 3-1-2023 | 815,000 | 910,078 | ||||||||||||
San Joaquin CA Area Flood Control Agency Smith Canal Area Assessment District Assessment Revenue (AGM Insured) | 5.00 | 10-1-2025 | 250,000 | 292,138 | ||||||||||||
San Joaquin CA Area Flood Control Agency Smith Canal Area Assessment District Assessment Revenue (AGM Insured) | 5.00 | 10-1-2027 | 350,000 | 421,498 | ||||||||||||
San Joaquin CA Area Flood Control Agency Smith Canal Area Assessment District Assessment Revenue (AGM Insured) | 5.00 | 10-1-2029 | 380,000 | 472,397 | ||||||||||||
The accompanying notes are an integral part of these financial statements.
Wells Fargo California Limited-Term Tax-Free Fund | 15
Portfolio of investments—June 30, 2020
Interest rate | Maturity date | Principal | Value | |||||||||||||
| Miscellaneous Revenue (continued) | ||||||||||||||||
Santa Clara County CA Financing Capital Projects Series A | 4.00 | % | 2-1-2024 | $ | 6,000,000 | $ | 6,351,480 | |||||||||
Santa Cruz County CA Capital Financing Public Facilities Project (AGM Insured) | 4.00 | 8-1-2020 | 150,000 | 150,432 | ||||||||||||
Santa Cruz County CA Capital Financing Public Facilities Project (AGM Insured) | 5.00 | 8-1-2021 | 125,000 | 131,124 | ||||||||||||
Santa Cruz County CA Capital Financing Public Facilities Project (AGM Insured) | 5.00 | 8-1-2022 | 165,000 | 179,820 | ||||||||||||
Sutter Butte CA Flood Agency Assessment (BAM Insured) | 5.00 | 10-1-2023 | 1,280,000 | 1,471,347 | ||||||||||||
Sutter Butte CA Flood Agency Assessment (BAM Insured) | 5.00 | 10-1-2024 | 715,000 | 849,999 | ||||||||||||
Sutter Butte CA Flood Agency Assessment (BAM Insured) | 5.00 | 10-1-2025 | 1,575,000 | 1,927,438 | ||||||||||||
Ventura County CA PFA Series B | 5.00 | 11-1-2020 | 250,000 | 253,945 | ||||||||||||
Visalia CA Certificate of Participation (AGM Insured) | 4.00 | 12-1-2020 | 250,000 | 253,823 | ||||||||||||
Visalia CA Certificate of Participation (AGM Insured) | 4.00 | 12-1-2021 | 250,000 | 262,895 | ||||||||||||
Visalia CA Certificate of Participation (AGM Insured) | 5.00 | 12-1-2022 | 335,000 | 368,825 | ||||||||||||
West Sacramento CA Flood Control Agency | 5.00 | 9-1-2020 | 290,000 | 292,300 | ||||||||||||
| 61,100,322 | ||||||||||||||||
|
| |||||||||||||||
| Tax Revenue: 18.69% | ||||||||||||||||
California School Infrastructure Financing Agency Refunding Bond (AGM Insured) | 5.00 | 9-1-2021 | 1,300,000 | 1,372,813 | ||||||||||||
California Statewide Community Facilities District #2015-01 | 5.00 | 9-1-2027 | 500,000 | 558,915 | ||||||||||||
Carson CA RDA Project Area #1 Series A (AGM Insured) | 5.00 | 10-1-2020 | 775,000 | 783,758 | ||||||||||||
Carson CA RDA Project Area #1 Series A (AGM Insured) | 5.00 | 10-1-2021 | 855,000 | 903,213 | ||||||||||||
Carson CA RDA Project Area #1 Series A (AGM Insured) | 5.00 | 10-1-2022 | 600,000 | 659,358 | ||||||||||||
Cathedral City CA RDA Refunding Bond Merged Redevelopment Project Series A | 5.00 | 8-1-2021 | 2,425,000 | 2,543,801 | ||||||||||||
Cathedral City CA RDA Refunding Bond Merged Redevelopment Project Series A | 5.00 | 8-1-2022 | 2,550,000 | 2,775,726 | ||||||||||||
Cathedral City CA RDA Refunding Bond Merged Redevelopment Project Series A | 5.00 | 8-1-2023 | 1,735,000 | 1,961,921 | ||||||||||||
Cathedral City CA RDA Refunding Bond Merged Redevelopment Project Series A (AGM Insured) | 5.00 | 8-1-2024 | 1,770,000 | 2,076,794 | ||||||||||||
Chino CA PFA Local Agency Series A (AGM Insured) | 5.00 | 9-1-2022 | 1,830,000 | 1,996,201 | ||||||||||||
Chino CA PFA Local Agency Series A (AGM Insured) | 5.00 | 9-1-2024 | 660,000 | 768,181 | ||||||||||||
Commerce CA RDA CAB Project #1 ¤ | 0.00 | 8-1-2021 | 600,000 | 573,402 | ||||||||||||
Commerce CA Successor Agency to the Community Development Commission Refunding Bond Series A (AGM Insured) | 5.00 | 8-1-2023 | 600,000 | 680,442 | ||||||||||||
Dinuba CA RDA Successor Agency to Merged City Project #2 (BAM Insured) | 5.00 | 9-1-2021 | 250,000 | 263,793 | ||||||||||||
Dinuba CA RDA Successor Agency to Merged City Project #2 (BAM Insured) | 5.00 | 9-1-2022 | 250,000 | 273,840 | ||||||||||||
Fairfield CA RDA Successor Agency Tax Allocation Refunding Bond | 5.00 | 8-1-2020 | 1,000,000 | 1,003,860 | ||||||||||||
Fairfield CA RDA Successor Agency Tax Allocation Refunding Bond | 5.00 | 8-1-2021 | 3,170,000 | 3,333,097 | ||||||||||||
Fairfield CA RDA Successor Agency Tax Allocation Refunding Bond | 5.00 | 8-1-2022 | 2,395,000 | 2,609,616 | ||||||||||||
Fairfield CA RDA Successor Agency Tax Allocation Refunding Bond | 5.00 | 8-1-2023 | 1,025,000 | 1,159,060 | ||||||||||||
Fremont CA Community Facilities District | 5.00 | 9-1-2024 | 1,000,000 | 1,144,530 | ||||||||||||
Garden Grove CA Agency Community Refunding Bond Garden Grove Community Project (BAM Insured) | 4.00 | 10-1-2021 | 770,000 | 806,529 | ||||||||||||
Garden Grove CA Agency Community Refunding Bond Garden Grove Community Project (BAM Insured) | 5.00 | 10-1-2022 | 3,015,000 | 3,313,274 | ||||||||||||
Hollister CA RDA Refunding Bond Hollister Community Development Project (BAM Insured) | 5.00 | 10-1-2026 | 700,000 | 813,624 | ||||||||||||
Inglewood CA Redevelopment Refunding Bond Subordinate Lien Merged Redevelopment Project (BAM Insured) | 5.00 | 5-1-2025 | 1,000,000 | 1,200,870 | ||||||||||||
Irwindale CA CDA City Industrial Development Project (AGM Insured) | 5.00 | 7-15-2020 | 320,000 | 320,560 | ||||||||||||
Irwindale CA CDA City Industrial Development Project (AGM Insured) | 5.00 | 7-15-2021 | 340,000 | 356,956 | ||||||||||||
Irwindale CA CDA City Industrial Development Project (AGM Insured) | 5.00 | 7-15-2022 | 365,000 | 397,806 | ||||||||||||
Irwindale CA CDA City Industrial Development Project (AGM Insured) | 5.00 | 7-15-2023 | 375,000 | 424,601 | ||||||||||||
Jurupa CA PFA Series A | 5.00 | 9-1-2020 | 750,000 | 755,670 | ||||||||||||
La Quinta CA RDA Project Areas #1 & 2 Series A | 5.00 | 9-1-2020 | 1,045,000 | 1,053,182 | ||||||||||||
La Quinta CA RDA Project Areas #1 & 2 Series A | 5.00 | 9-1-2021 | 565,000 | 596,171 | ||||||||||||
La Quinta CA RDA Project Areas #1 & 2 Series A | 5.00 | 9-1-2022 | 615,000 | 673,646 | ||||||||||||
Lancaster CA RDA Refunding Bond Combined Redevelopment Project Areas (AGM Insured) | 5.00 | 8-1-2024 | 870,000 | 1,020,032 | ||||||||||||
The accompanying notes are an integral part of these financial statements.
16 | Wells Fargo California Limited-Term Tax-Free Fund
Portfolio of investments—June 30, 2020
Interest rate | Maturity date | Principal | Value | |||||||||||||
| Tax Revenue (continued) | ||||||||||||||||
Lancaster CA RDA Refunding Bond Combined Redevelopment Project Areas (AGM Insured) | 5.00 | % | 8-1-2029 | $ | 400,000 | $ | 484,944 | |||||||||
Lincoln CA Special Tax Refunding Bond Community Facilities District #2003-1 Lincoln Crossing Project | 4.00 | 9-1-2024 | 600,000 | 682,614 | ||||||||||||
Lincoln CA Special Tax Refunding Bond Community Facilities District #2003-1 Lincoln Crossing Project | 5.00 | 9-1-2025 | 550,000 | 666,496 | ||||||||||||
Menifee CA Union School District Public Series A | 4.00 | 9-1-2022 | 540,000 | 572,794 | ||||||||||||
Oakdale CA Successor Agency to Oakdale Community RDA Series A (AGM Insured) | 5.00 | 6-1-2027 | 350,000 | 428,764 | ||||||||||||
Orange County CA Community Facilities #2015-1 Esencia Village Series A | 5.00 | 8-15-2023 | 365,000 | 405,745 | ||||||||||||
Orange County CA Community Facilities #2015-1 Esencia Village Series A | 5.00 | 8-15-2025 | 325,000 | 379,649 | ||||||||||||
Orange County CA Development Agency Santa Ana Heights Project | 5.00 | 9-1-2020 | 1,140,000 | 1,148,482 | ||||||||||||
Pittsburg CA Successor Agency of Los Medanos Community Development (AGM Insured) | 5.00 | 8-1-2021 | 1,885,000 | 1,981,550 | ||||||||||||
Pittsburg CA Successor Agency of Los Medanos Community Development (AGM Insured) | 5.00 | 8-1-2022 | 1,305,000 | 1,424,786 | ||||||||||||
Pittsburg CA Successor Agency of Los Medanos Community Development (AGM Insured) | 5.00 | 8-1-2023 | 780,000 | 884,575 | ||||||||||||
Placentia CA RDA Project (BAM Insured) | 5.00 | 8-1-2020 | 600,000 | 602,340 | ||||||||||||
Poway CA Unified School District PFA | 4.00 | 9-15-2020 | 335,000 | 337,580 | ||||||||||||
Poway CA Unified School District PFA (BAM Insured) | 4.00 | 10-1-2020 | 300,000 | 302,853 | ||||||||||||
Poway CA Unified School District PFA (BAM Insured) | 4.00 | 10-1-2021 | 185,000 | 193,776 | ||||||||||||
Poway CA Unified School District PFA Series B (BAM Insured) | 5.00 | 9-1-2024 | 1,115,000 | 1,314,262 | ||||||||||||
Poway CA Unified School District PFA Series B (BAM Insured) | 5.00 | 9-1-2025 | 775,000 | 941,780 | ||||||||||||
Rialto CA RDA Successor Agency to Merged Project Area | 5.00 | 9-1-2022 | 475,000 | 519,218 | ||||||||||||
Riverside CA PFA Local Measure Certificate of Participation Riverside Pavement Rehabilitation Project (AGM Insured) | 5.00 | 6-1-2023 | 845,000 | 960,393 | ||||||||||||
Riverside County CA PFA Indian Wells Project Series A (AGM Insured) | 5.00 | 9-1-2020 | 1,610,000 | 1,622,606 | ||||||||||||
Roseville CA Finance Authority Special Refunding Bond Series A | 5.00 | 9-1-2023 | 400,000 | 459,048 | ||||||||||||
Roseville CA Finance Authority Special Refunding Bond Series A | 5.00 | 9-1-2029 | 300,000 | 386,181 | ||||||||||||
Roseville CA Special Tax Refunding Bond Community Facilities District | 5.00 | 9-1-2020 | 1,050,000 | 1,056,563 | ||||||||||||
Roseville CA Special Tax Refunding Bond Community Facilities District | 5.00 | 9-1-2021 | 500,000 | 522,110 | ||||||||||||
Roseville CA Special Tax Refunding Bond Fiddyment Ranch Community | 5.00 | 9-1-2024 | 1,905,000 | 2,181,987 | ||||||||||||
Roseville CA Special Tax Refunding Bond Fiddyment Ranch Community | 5.00 | 9-1-2029 | 1,595,000 | 1,917,924 | ||||||||||||
Sacramento CA Transient Occupancy Tax Revenue Convention Center Complex Senior | 5.00 | 6-1-2027 | 575,000 | 669,179 | ||||||||||||
San Francisco CA City & County RDA Successor Agency to Community Facilities District #6 Mission Bay South Series A | 5.00 | 8-1-2025 | 1,600,000 | 1,716,880 | ||||||||||||
San Francisco CA City & County RDA Successor Agency to Mission Bay South Redevelopment Project Series A | 5.00 | 8-1-2020 | 500,000 | 501,830 | ||||||||||||
San Francisco CA City & County RDA Successor Agency to Mission Bay South Redevelopment Project Series A | 5.00 | 8-1-2022 | 375,000 | 404,948 | ||||||||||||
San Francisco CA City & County RDA Successor Agency to Mission Bay South Redevelopment Project Subordinate Bond Series D 144A | 3.00 | 8-1-2021 | 1,020,000 | 1,038,309 | ||||||||||||
San Jose CA Convention Center Expansion & Renovation Project | 5.25 | 5-1-2023 | 1,465,000 | 1,501,684 | ||||||||||||
San Marcos CA Unified School District Community Facilities District #5 (BAM Insured) | 5.00 | 9-1-2021 | 270,000 | 285,123 | ||||||||||||
San Marcos CA Unified School District Community Facilities District #5 (BAM Insured) | 5.00 | 9-1-2022 | 250,000 | 274,125 | ||||||||||||
San Pablo CA RDA Series B (AGM Insured) | 5.00 | 6-15-2021 | 1,775,000 | 1,849,266 | ||||||||||||
San Pablo CA RDA Series B (AGM Insured) | 5.00 | 6-15-2022 | 1,865,000 | 2,021,399 | ||||||||||||
San Pablo CA RDA Series B (AGM Insured) | 5.00 | 6-15-2023 | 1,945,000 | 2,187,036 | ||||||||||||
Santa Cruz County CA Redevelopment Successor Agency Tax Allocation Refunding Bond (BAM Insured) | 5.00 | 9-1-2020 | 1,000,000 | 1,007,830 | ||||||||||||
Stockton CA RDA Refunding Bond Series A (AGM Insured) | 5.00 | 9-1-2025 | 1,675,000 | 2,030,720 | ||||||||||||
Successor Agency to the Morgan Hill CA RDA Series A | 5.00 | 9-1-2021 | 1,055,000 | 1,113,458 | ||||||||||||
The accompanying notes are an integral part of these financial statements.
Wells Fargo California Limited-Term Tax-Free Fund | 17
Portfolio of investments—June 30, 2020
Interest rate | Maturity date | Principal | Value | |||||||||||||
| Tax Revenue (continued) | ||||||||||||||||
Successor Agency to the Richmond CA Community RDA Series A (BAM Insured) | 4.50 | % | 9-1-2025 | $ | 160,000 | $ | 182,822 | |||||||||
Successor Agency to the Richmond CA Community RDA Series A (BAM Insured) | 5.00 | 9-1-2021 | 310,000 | 326,951 | ||||||||||||
Successor Agency to the Richmond CA Community RDA Series A (BAM Insured) | 5.00 | 9-1-2022 | 300,000 | 330,459 | ||||||||||||
Successor Agency to the Richmond CA Community RDA Series A (BAM Insured) | 5.00 | 9-1-2023 | 265,000 | 303,396 | ||||||||||||
Successor Agency to the Richmond CA Community RDA Series A (BAM Insured) | 5.00 | 9-1-2025 | 150,000 | 175,788 | ||||||||||||
Successor Agency to the Riverside County CA RDA Desert Communities Project Area Series D | 5.00 | 10-1-2022 | 445,000 | 482,238 | ||||||||||||
Successor Agency to the Riverside County CA RDA Desert Communities Project Area Series D | 5.00 | 10-1-2023 | 470,000 | 525,672 | ||||||||||||
Successor Agency to the Riverside County CA RDA Project Area #1 Series A | 5.00 | 10-1-2022 | 240,000 | 260,083 | ||||||||||||
Successor Agency to the Riverside County CA RDA Project Area #1 Series A | 5.00 | 10-1-2023 | 460,000 | 514,487 | ||||||||||||
Tracy CA Community Facilities District | 4.00 | 9-1-2021 | 140,000 | 143,772 | ||||||||||||
Tracy CA Community Facilities District | 4.00 | 9-1-2022 | 180,000 | 188,678 | ||||||||||||
Tracy CA Community Facilities District | 4.00 | 9-1-2024 | 135,000 | 145,715 | ||||||||||||
Tracy CA Community Facilities District | 4.00 | 9-1-2025 | 155,000 | 168,908 | ||||||||||||
Tracy CA Community Facilities District | 5.00 | 9-1-2028 | 425,000 | 491,921 | ||||||||||||
Transbay Joint Powers Authority Green Subordinated Bond Tax Allocation Bond Series B | 2.40 | 10-1-2049 | 2,000,000 | 1,995,980 | ||||||||||||
Transbay Joint Powers Authority Green Tax Allocation Bond Senior Series A | 5.00 | 10-1-2029 | 500,000 | 640,445 | ||||||||||||
Transbay Joint Powers Authority Green Tax Allocation Bond Senior Series A | 5.00 | 10-1-2030 | 500,000 | 642,185 | ||||||||||||
Transbay Joint Powers Authority Green Tax Allocation Bond Senior Series A | 5.00 | 10-1-2031 | 400,000 | 509,812 | ||||||||||||
Tustin CA Community Facilities District #6-1 Legacy Columbus Villages Series A | 5.00 | 9-1-2025 | 1,000,000 | 1,201,700 | ||||||||||||
Upland CA Successor Agency to Merged Project Tax Allocation Bond (AGM Insured) | 5.00 | 9-1-2023 | 1,000,000 | 1,137,430 | ||||||||||||
Vacaville CA RDA Tax Allocation Subordinate Refunding Bond Redevelopment Projects | 5.00 | 9-1-2020 | 600,000 | 604,566 | ||||||||||||
Vacaville CA RDA Tax Allocation Subordinate Refunding Bond Redevelopment Projects | 5.00 | 9-1-2021 | 600,000 | 632,160 | ||||||||||||
Vacaville CA RDA Tax Allocation Subordinate Refunding Bond Redevelopment Projects | 5.00 | 9-1-2022 | 1,050,000 | 1,137,087 | ||||||||||||
Val Verde CA Unified School District (BAM Insured) | 4.00 | 10-1-2020 | 350,000 | 353,266 | ||||||||||||
Val Verde CA Unified School District (BAM Insured) | 4.00 | 10-1-2021 | 375,000 | 391,969 | ||||||||||||
Val Verde CA Unified School District (BAM Insured) | 5.00 | 10-1-2022 | 665,000 | 730,788 | ||||||||||||
Western Placer CA Unified School District Special Tax BAN Community Facilities | 2.00 | 6-1-2025 | 2,000,000 | 2,049,440 | ||||||||||||
Western Placer CA Unified School District Special Tax BAN Community Facilities | 2.00 | 6-1-2025 | 5,000,000 | 5,101,900 | ||||||||||||
Yuba City CA RDA Refunding Bond (AGM Insured) | 5.00 | 9-1-2025 | 750,000 | 909,278 | ||||||||||||
| 100,434,945 | ||||||||||||||||
|
| |||||||||||||||
| Tobacco Revenue: 1.19% | ||||||||||||||||
California County CA Tobacco Securitization Agency Settlement Senior Refunding Bond Series A | 5.00 | 6-1-2030 | 450,000 | 591,188 | ||||||||||||
California County CA Tobacco Securitization Agency Settlement Senior Refunding Bond Series A | 5.00 | 6-1-2031 | 550,000 | 715,523 | ||||||||||||
California County CA Tobacco Securitization Agency Settlement Senior Refunding Bond Series A | 5.00 | 6-1-2032 | 300,000 | 387,249 | ||||||||||||
California County CA Tobacco Securitization Agency Settlement Subordinate Refunding Bond Series B1 | 1.75 | 6-1-2030 | 750,000 | 768,038 | ||||||||||||
Golden State Tobacco Securitization Corporation Tobacco Settlement Refunding Bond Series A1 | 5.00 | 6-1-2026 | 3,000,000 | 3,631,740 | ||||||||||||
Tobacco Securitization Authority Tobacco Settlement Revenue Refunding Bond Asset Backed Senior Series B1 Class 2 | 2.25 | 6-1-2029 | 290,000 | 307,626 | ||||||||||||
| 6,401,364 | ||||||||||||||||
|
| |||||||||||||||
The accompanying notes are an integral part of these financial statements.
18 | Wells Fargo California Limited-Term Tax-Free Fund
Portfolio of investments—June 30, 2020
Interest rate | Maturity date | Principal | Value | |||||||||||||
| Utilities Revenue: 2.15% | ||||||||||||||||
Southern California Public Power Authority Refunding Bond Canyon Power Project Series A | 2.25 | % | 7-1-2040 | $ | 6,000,000 | $ | 6,021,060 | |||||||||
Southern California Public Power Authority Refunding Bond Canyon Power Project Series A | 5.00 | 7-1-2027 | 1,000,000 | 1,045,630 | ||||||||||||
Southern California Public Power Authority Refunding Bond Canyon Power Project Series B (SIFMA Municipal Swap +0.25%) ± | 0.38 | 7-1-2040 | 4,000,000 | 3,970,520 | ||||||||||||
Walnut CA Energy Center Authority Refunding Bond Series A | 5.00 | 1-1-2021 | 500,000 | 511,870 | ||||||||||||
| 11,549,080 | ||||||||||||||||
|
| |||||||||||||||
| Water & Sewer Revenue: 4.13% | ||||||||||||||||
Eastern California Municipal Water District Refunding Bond Series C (SIFMA Municipal Swap +0.25%) ± | 0.38 | 7-1-2046 | 3,000,000 | 2,986,230 | ||||||||||||
Florin CA Resource Conservation District Series A (National Insured) | 5.00 | 9-1-2020 | 1,000,000 | 1,007,440 | ||||||||||||
Florin CA Resource Conservation District Series A (National Insured) | 5.00 | 9-1-2021 | 1,250,000 | 1,315,488 | ||||||||||||
Florin CA Resource Conservation District Series A (National Insured) | 5.00 | 9-1-2022 | 1,250,000 | 1,376,050 | ||||||||||||
Goleta CA Water District Certificate of Participation Series A (AGM Insured) | 5.00 | 12-1-2020 | 140,000 | 142,572 | ||||||||||||
Middle Fork CA Project Finance Authority Revenue Refunding Bond | 5.00 | 4-1-2029 | 3,525,000 | 4,238,883 | ||||||||||||
Oxnard CA Financing Authority Refunding Bond (AGM Insured) | 5.00 | 6-1-2021 | 735,000 | 766,921 | ||||||||||||
San Francisco City & County CA Public Utilities Commission Series C Green Bond | 2.13 | 10-1-2048 | 10,000,000 | 10,333,400 | ||||||||||||
| 22,166,984 | ||||||||||||||||
|
| |||||||||||||||
| 492,638,340 | ||||||||||||||||
|
| |||||||||||||||
Guam: 1.00% | ||||||||||||||||
| Airport Revenue: 0.26% | ||||||||||||||||
Guam Port Authority AMT Series B | 5.00 | 7-1-2023 | 540,000 | 579,987 | ||||||||||||
Guam Port Authority AMT Series B | 5.00 | 7-1-2024 | 750,000 | 819,488 | ||||||||||||
| 1,399,475 | ||||||||||||||||
|
| |||||||||||||||
| Miscellaneous Revenue: 0.74% | ||||||||||||||||
Guam Education Financing Foundation Certificate of Participation Refunding Bond Series A | 5.00 | 10-1-2023 | 3,840,000 | 3,983,501 | ||||||||||||
|
| |||||||||||||||
| 5,382,976 | ||||||||||||||||
|
| |||||||||||||||
Illinois: 2.45% | ||||||||||||||||
| Miscellaneous Revenue: 2.00% | ||||||||||||||||
Illinois Refunding Bond | 5.00 | 2-1-2025 | 10,000,000 | 10,750,800 | ||||||||||||
|
| |||||||||||||||
| Tax Revenue: 0.45% | ||||||||||||||||
Metropolitan Pier & Exposition Authority McCormick Place Expansion Project Series B | 5.00 | 12-15-2025 | 650,000 | 702,247 | ||||||||||||
Sales Tax Securitization Corporation Series 2017A | 5.00 | 1-1-2026 | 1,500,000 | 1,736,880 | ||||||||||||
| 2,439,127 | ||||||||||||||||
|
| |||||||||||||||
| 13,189,927 | ||||||||||||||||
|
| |||||||||||||||
New York: 1.00% | ||||||||||||||||
| Industrial Development Revenue: 1.00% | ||||||||||||||||
New York Transportation Development Corporation Special Facilities Revenue Delta Air Lines Incorporated LaGuardia Airport Terminals C&D Redevelopment | 5.00 | 1-1-2029 | 5,000,000 | 5,355,350 | ||||||||||||
|
| |||||||||||||||
The accompanying notes are an integral part of these financial statements.
Wells Fargo California Limited-Term Tax-Free Fund | 19
Portfolio of investments—June 30, 2020
Interest rate | Maturity date | Principal | Value | |||||||||||||
Texas: 2.06% | ||||||||||||||||
| Industrial Development Revenue: 0.57% | ||||||||||||||||
Houston TX Airport System AMT Revenue Refunding Bond United Airlines Incorporated Terminal E Project | 5.00 | % | 7-1-2029 | $ | 3,000,000 | $ | 3,074,490 | |||||||||
|
| |||||||||||||||
| Resource Recovery Revenue: 1.49% | ||||||||||||||||
Port Arthur TX Navigation District Jefferson County Environmental Facilities Motiva Enterprises LLC Project Series B ø | 0.90 | 4-1-2040 | 8,000,000 | 8,000,000 | ||||||||||||
|
| |||||||||||||||
| 11,074,490 | ||||||||||||||||
|
| |||||||||||||||
Total Municipal Obligations (Cost $510,762,822) | 527,641,083 | |||||||||||||||
|
| |||||||||||||||
Closed End Municipal Bond Fund Obligation: 0.19% | ||||||||||||||||
| California: 0.19% | ||||||||||||||||
Nuveen California AMT-Free Quality Municipal Income Fund MuniFund Preferred Shares Series A (10 shares) 0.92% 144Aø | 1,000,000 | 1,000,000 | ||||||||||||||
|
| |||||||||||||||
Total Closed End Municipal Bond Fund Obligation (Cost $1,000,000) | 1,000,000 | |||||||||||||||
|
| |||||||||||||||
| Total investments in securities (Cost $511,762,822) | 98.37 | % | 528,641,083 | |||||
Other assets and liabilities, net | 1.63 | 8,768,737 | ||||||
|
|
|
| |||||
| Total net assets | 100.00 | % | $ | 537,409,820 | ||||
|
|
|
| |||||
| 144A | The security may be resold in transactions exempt from registration, normally to qualified institutional buyers, pursuant to Rule 144A under the Securities Act of 1933. |
| ± | Variable rate investment. The rate shown is the rate in effect at period end. |
| ¤ | The security is issued in zero coupon form with no periodic interest payments. |
| (m) | The security is an auction-rate security which has an interest rate that resets at predetermined short-term intervals through a Dutch auction. The rate shown is the rate in effect at period end. |
| ø | Variable rate demand notes are subject to a demand feature which reduces the effective maturity. The maturity date shown represents the final maturity date of the security. The interest rate is determined and reset by the issuer daily, weekly, or monthly depending upon the terms of the security. The rate shown is the rate in effect at period end. |
Abbreviations:
| AGM | Assured Guaranty Municipal |
| AMT | Alternative minimum tax |
| BAM | Build America Mutual Assurance Company |
| BAN | Bond anticipation notes |
| CAB | Capital appreciation bond |
| CDA | Community Development Authority |
| FHLMC | Federal Home Loan Mortgage Corporation |
| FNMA | Federal National Mortgage Association |
| GNMA | Government National Mortgage Association |
| GO | General obligation |
| HFA | Housing Finance Authority |
| HFFA | Health Facilities Financing Authority |
| LIBOR | London Interbank Offered Rate |
| LIQ | Liquidity agreement |
| National | National Public Finance Guarantee Corporation |
| PFA | Public Finance Authority |
| RAN | Revenue Anticipation Notes |
| RDA | Redevelopment Authority |
| SIFMA | Securities Industry and Financial Markets Association |
The accompanying notes are an integral part of these financial statements.
20 | Wells Fargo California Limited-Term Tax-Free Fund
Portfolio of investments—June 30, 2020
Investments in Affiliates
An affiliated investment is an investment in which the Fund owns at least 5% of the outstanding voting shares of the issuer or as a result of other relationships, such as the Fund and the issuer having the same investment manager. Transactions with issuers that were either affiliated persons of the Fund at the beginning of the period or the end of the period were as follows:
Value, beginning of period | Purchases | Sales proceeds | Net realized gains (losses) | Net change in unrealized gains (losses) | Income from affiliated securities | Value, end of period | % of net assets | |||||||||||||||||||||||||
| Short-Term Investments | ||||||||||||||||||||||||||||||||
Investment Companies | ||||||||||||||||||||||||||||||||
Wells Fargo Municipal Cash Management Money Market Fund Institutional Class * | $ | 398,605 | $ | 182,332,010 | $ | (182,729,391 | ) | $ | (1,224 | ) | $ | 0 | $ | 24,523 | $ | 0 | 0.00 | % | ||||||||||||||
| * | No longer held at the end of the period |
The accompanying notes are an integral part of these financial statements.
Wells Fargo California Limited-Term Tax-Free Fund | 21
Statement of assets and liabilities—June 30, 2020
Assets | ||||
Investments in unaffiliated securities, at value (cost $511,762,822) | $ | 528,641,083 | ||
Cash | 1,045,197 | |||
Receivable for investments sold | 2,020,078 | |||
Receivable for Fund shares sold | 5,060,522 | |||
Receivable for interest | 5,907,397 | |||
Prepaid expenses and other assets | 1,561 | |||
|
| |||
Total assets | 542,675,838 | |||
|
| |||
Liabilities | ||||
Payable for Fund shares redeemed | 4,715,663 | |||
Management fee payable | 160,579 | |||
Dividends payable | 297,258 | |||
Administration fees payable | 44,637 | |||
Distribution fee payable | 7,346 | |||
Trustees’ fees and expenses payable | 3,849 | |||
Accrued expenses and other liabilities | 36,686 | |||
|
| |||
Total liabilities | 5,266,018 | |||
|
| |||
Total net assets | $ | 537,409,820 | ||
|
| |||
Net assets consist of | ||||
Paid-in capital | $ | 529,831,401 | ||
Total distributable earnings | 7,578,419 | |||
|
| |||
Total net assets | $ | 537,409,820 | ||
|
| |||
Computation of net asset value and offering price per share | ||||
Net assets – Class A | $ | 108,189,172 | ||
Shares outstanding – Class A1 | 10,103,333 | |||
Net asset value per share – Class A | $10.71 | |||
Maximum offering price per share – Class A2 | $10.93 | |||
Net assets – Class C | $ | 11,981,334 | ||
Shares outstanding – Class C1 | 1,119,057 | |||
Net asset value per share – Class C | $10.71 | |||
Net assets – Administrator Class | $ | 36,590,615 | ||
Shares outstanding – Administrator Class1 | 3,469,860 | |||
Net asset value per share – Administrator Class | $10.55 | |||
Net assets – Institutional Class | $ | 380,648,699 | ||
Shares outstanding – Institutional Class1 | 36,118,373 | |||
Net asset value per share – Institutional Class | $10.54 | |||
| 1 | The Fund has an unlimited number of authorized shares. |
| 2 | Maximum offering price is computed as 100/98 of net asset value. On investments of $50,000 or more, the offering price is reduced. |
The accompanying notes are an integral part of these financial statements.
22 | Wells Fargo California Limited-Term Tax-Free Fund
Statement of operations—year ended June 30, 2020
Investment income | ||||
Interest | $ | 13,850,970 | ||
Income from affiliated securities | 24,523 | |||
|
| |||
Total investment income | 13,875,493 | |||
|
| |||
Expenses | ||||
Management fee | 2,157,481 | |||
Administration fees | ||||
Class A | 177,244 | |||
Class C | 24,780 | |||
Administrator Class | 80,005 | |||
Institutional Class | 268,583 | |||
Shareholder servicing fees | ||||
Class A | 276,920 | |||
Class C | 38,672 | |||
Administrator Class | 199,041 | |||
Distribution fee | ||||
Class C | 115,991 | |||
Custody and accounting fees | 28,046 | |||
Professional fees | 45,694 | |||
Registration fees | 75,826 | |||
Shareholder report expenses | 30,436 | |||
Trustees’ fees and expenses | 21,541 | |||
Other fees and expenses | 15,411 | |||
|
| |||
Total expenses | 3,555,671 | |||
Less: Fee waivers and/or expense reimbursements | ||||
Fund-level | (100,737 | ) | ||
Class A | (33,187 | ) | ||
Class C | (4,243 | ) | ||
Administrator Class | (133,155 | ) | ||
|
| |||
Net expenses | 3,284,350 | |||
|
| |||
Net investment income | 10,591,143 | |||
|
| |||
Realized and unrealized gains (losses) on investments | ||||
Net realized losses on | ||||
Unaffiliated securities | (2,010,687 | ) | ||
Affiliated securities | (1,224 | ) | ||
|
| |||
Net realized losses on investments | (2,011,911 | ) | ||
Net change in unrealized gains (losses) on investments | 156,794 | |||
|
| |||
Net realized and unrealized gains (losses) on investments | (1,855,117 | ) | ||
|
| |||
Net increase in net assets resulting from operations | $ | 8,736,026 | ||
|
| |||
The accompanying notes are an integral part of these financial statements.
Wells Fargo California Limited-Term Tax-Free Fund | 23
Statement of changes in net assets
| Year ended June 30, 2020 | Year ended June 30, 2019 | |||||||||||||||
Operations | ||||||||||||||||
Net investment income | $ | 10,591,143 | $ | 11,668,055 | ||||||||||||
Net realized losses on investments | (2,011,911 | ) | (373,415 | ) | ||||||||||||
Net change in unrealized gains (losses) on investments | 156,794 | 7,937,606 | ||||||||||||||
|
| |||||||||||||||
Net increase in net assets resulting from operations | 8,736,026 | 19,232,246 | ||||||||||||||
|
| |||||||||||||||
Distributions to shareholders from net investment income and net realized gains | ||||||||||||||||
Class A | (1,951,518 | ) | (2,134,113 | ) | ||||||||||||
Class C | (155,931 | ) | (259,977 | ) | ||||||||||||
Administrator Class | (1,557,961 | ) | (2,322,335 | ) | ||||||||||||
Institutional Class | (6,927,187 | ) | (6,949,628 | ) | ||||||||||||
|
| |||||||||||||||
Total distributions to shareholders | (10,592,597 | ) | (11,666,053 | ) | ||||||||||||
|
| |||||||||||||||
Capital share transactions | Shares | Shares | ||||||||||||||
Proceeds from shares sold | ||||||||||||||||
Class A | 3,369,604 | 36,073,328 | 1,420,606 | 15,083,751 | ||||||||||||
Class C | 88,077 | 949,155 | 57,265 | 608,051 | ||||||||||||
Administrator Class | 1,703,444 | 18,088,534 | 3,778,231 | 39,543,664 | ||||||||||||
Institutional Class | 19,764,617 | 207,728,606 | 18,976,610 | 198,518,558 | ||||||||||||
|
| |||||||||||||||
| 262,839,623 | 253,754,024 | |||||||||||||||
|
| |||||||||||||||
Reinvestment of distributions | ||||||||||||||||
Class A | 167,382 | 1,796,887 | 174,915 | 1,858,738 | ||||||||||||
Class C | 13,502 | 145,080 | 22,692 | 240,998 | ||||||||||||
Administrator Class | 146,796 | 1,555,763 | 221,324 | 2,316,258 | ||||||||||||
Institutional Class | 351,574 | 3,712,830 | 318,708 | 3,334,607 | ||||||||||||
|
| |||||||||||||||
| 7,210,560 | 7,750,601 | |||||||||||||||
|
| |||||||||||||||
Payment for shares redeemed | ||||||||||||||||
Class A | (2,891,560 | ) | (30,846,221 | ) | (3,417,410 | ) | (36,369,774 | ) | ||||||||
Class C | (834,983 | ) | (8,963,587 | ) | (760,735 | ) | (8,078,258 | ) | ||||||||
Administrator Class | (8,618,652 | ) | (91,158,851 | ) | (6,547,996 | ) | (68,431,582 | ) | ||||||||
Institutional Class | (14,430,301 | ) | (152,265,703 | ) | (20,085,267 | ) | (209,818,936 | ) | ||||||||
|
| |||||||||||||||
| (283,234,362 | ) | (322,698,550 | ) | |||||||||||||
|
| |||||||||||||||
Net decrease in net assets resulting from capital share transactions | (13,184,179 | ) | (61,193,925 | ) | ||||||||||||
|
| |||||||||||||||
Total decrease in net assets | (15,040,750 | ) | (53,627,732 | ) | ||||||||||||
|
| |||||||||||||||
Net assets | ||||||||||||||||
Beginning of period | 552,450,570 | 606,078,302 | ||||||||||||||
|
| |||||||||||||||
End of period | $ | 537,409,820 | $ | 552,450,570 | ||||||||||||
|
| |||||||||||||||
The accompanying notes are an integral part of these financial statements.
24 | Wells Fargo California Limited-Term Tax-Free Fund
(For a share outstanding throughout each period)
| Year ended June 30 | ||||||||||||||||||||
| CLASS A | 2020 | 2019 | 2018 | 2017 | 2016 | |||||||||||||||
Net asset value, beginning of period | $10.76 | $10.61 | $10.79 | $11.04 | $10.83 | |||||||||||||||
Net investment income | 0.19 | 0.20 | 0.19 | 0.18 | 0.17 | |||||||||||||||
Net realized and unrealized gains (losses) on investments | (0.05 | ) | 0.15 | (0.18 | ) | (0.25 | ) | 0.21 | ||||||||||||
|
|
|
|
|
|
|
|
|
| |||||||||||
Total from investment operations | 0.14 | 0.35 | 0.01 | (0.07 | ) | 0.38 | ||||||||||||||
Distributions to shareholders from | ||||||||||||||||||||
Net investment income | (0.19 | ) | (0.20 | ) | (0.19 | ) | (0.18 | ) | (0.17 | ) | ||||||||||
Net asset value, end of period | $10.71 | $10.76 | $10.61 | $10.79 | $11.04 | |||||||||||||||
Total return1 | 1.30 | % | 3.33 | % | 0.05 | % | (0.64 | )% | 3.54 | % | ||||||||||
Ratios to average net assets (annualized) | ||||||||||||||||||||
Gross expenses | 0.85 | % | 0.85 | % | 0.84 | % | 0.83 | % | 0.83 | % | ||||||||||
Net expenses | 0.80 | % | 0.80 | % | 0.80 | % | 0.80 | % | 0.80 | % | ||||||||||
Net investment income | 1.76 | % | 1.87 | % | 1.73 | % | 1.65 | % | 1.56 | % | ||||||||||
Supplemental data | ||||||||||||||||||||
Portfolio turnover rate | 27 | % | 11 | % | 45 | % | 21 | % | 21 | % | ||||||||||
Net assets, end of period (000s omitted) | $108,189 | $101,765 | $119,657 | $148,933 | $196,629 | |||||||||||||||
| 1 | Total return calculations do not include any sales charges. |
The accompanying notes are an integral part of these financial statements.
Wells Fargo California Limited-Term Tax-Free Fund | 25
Financial highlights
(For a share outstanding throughout each period)
| Year ended June 30 | ||||||||||||||||||||
| CLASS C | 2020 | 2019 | 2018 | 2017 | 2016 | |||||||||||||||
Net asset value, beginning of period | $10.76 | $10.61 | $10.79 | $11.04 | $10.83 | |||||||||||||||
Net investment income | 0.11 | 1 | 0.12 | 0.11 | 0.10 | 0.09 | ||||||||||||||
Net realized and unrealized gains (losses) on investments | (0.05 | ) | 0.15 | (0.18 | ) | (0.25 | ) | 0.21 | ||||||||||||
|
|
|
|
|
|
|
|
|
| |||||||||||
Total from investment operations | 0.06 | 0.27 | (0.07 | ) | (0.15 | ) | 0.30 | |||||||||||||
Distributions to shareholders from | ||||||||||||||||||||
Net investment income | (0.11 | ) | (0.12 | ) | (0.11 | ) | (0.10 | ) | (0.09 | ) | ||||||||||
Net asset value, end of period | $10.71 | $10.76 | $10.61 | $10.79 | $11.04 | |||||||||||||||
Total return2 | 0.54 | % | 2.56 | % | (0.70 | )% | (1.38 | )% | 2.76 | % | ||||||||||
Ratios to average net assets (annualized) | ||||||||||||||||||||
Gross expenses | 1.60 | % | 1.60 | % | 1.59 | % | 1.58 | % | 1.58 | % | ||||||||||
Net expenses | 1.55 | % | 1.55 | % | 1.55 | % | 1.55 | % | 1.55 | % | ||||||||||
Net investment income | 1.01 | % | 1.12 | % | 0.98 | % | 0.90 | % | 0.81 | % | ||||||||||
Supplemental data | ||||||||||||||||||||
Portfolio turnover rate | 27 | % | 11 | % | 45 | % | 21 | % | 21 | % | ||||||||||
Net assets, end of period (000s omitted) | $11,981 | $19,929 | $26,868 | $34,113 | $40,098 | |||||||||||||||
| 1 | Calculated based upon average shares outstanding |
| 2 | Total return calculations do not include any sales charges. |
The accompanying notes are an integral part of these financial statements.
26 | Wells Fargo California Limited-Term Tax-Free Fund
Financial highlights
(For a share outstanding throughout each period)
| Year ended June 30 | ||||||||||||||||||||
| ADMINISTRATOR CLASS | 2020 | 2019 | 2018 | 2017 | 2016 | |||||||||||||||
Net asset value, beginning of period | $10.60 | $10.45 | $10.63 | $10.87 | $10.66 | |||||||||||||||
Net investment income | 0.21 | 1 | 0.22 | 0.20 | 1 | 0.20 | 0.19 | |||||||||||||
Net realized and unrealized gains (losses) on investments | (0.05 | ) | 0.15 | (0.18 | ) | (0.24 | ) | 0.21 | ||||||||||||
|
|
|
|
|
|
|
|
|
| |||||||||||
Total from investment operations | 0.16 | 0.37 | 0.02 | (0.04 | ) | 0.40 | ||||||||||||||
Distributions to shareholders from | ||||||||||||||||||||
Net investment income | (0.21 | ) | (0.22 | ) | (0.20 | ) | (0.20 | ) | (0.19 | ) | ||||||||||
Net asset value, end of period | $10.55 | $10.60 | $10.45 | $10.63 | $10.87 | |||||||||||||||
Total return | 1.50 | % | 3.56 | % | 0.23 | % | (0.38 | )% | 3.78 | % | ||||||||||
Ratios to average net assets (annualized) | ||||||||||||||||||||
Gross expenses | 0.78 | % | 0.79 | % | 0.78 | % | 0.77 | % | 0.77 | % | ||||||||||
Net expenses | 0.60 | % | 0.60 | % | 0.60 | % | 0.60 | % | 0.60 | % | ||||||||||
Net investment income | 1.95 | % | 2.07 | % | 1.93 | % | 1.84 | % | 1.75 | % | ||||||||||
Supplemental data | ||||||||||||||||||||
Portfolio turnover rate | 27 | % | 11 | % | 45 | % | 21 | % | 21 | % | ||||||||||
Net assets, end of period (000s omitted) | $36,591 | $108,484 | $133,581 | $162,747 | $226,581 | |||||||||||||||
| 1 | Calculated based upon average shares outstanding |
The accompanying notes are an integral part of these financial statements.
Wells Fargo California Limited-Term Tax-Free Fund | 27
Financial highlights
(For a share outstanding throughout each period)
| Year ended June 30 | ||||||||||||||||||||
| INSTITUTIONAL CLASS | 2020 | 2019 | 2018 | 2017 | 2016 | |||||||||||||||
Net asset value, beginning of period | $10.59 | $10.44 | $10.62 | $10.86 | $10.66 | |||||||||||||||
Net investment income | 0.22 | 0.23 | 0.21 | 0.21 | 0.20 | |||||||||||||||
Net realized and unrealized gains (losses) on investments | (0.05 | ) | 0.15 | (0.18 | ) | (0.24 | ) | 0.20 | ||||||||||||
|
|
|
|
|
|
|
|
|
| |||||||||||
Total from investment operations | 0.17 | 0.38 | 0.03 | (0.03 | ) | 0.40 | ||||||||||||||
Distributions to shareholders from | ||||||||||||||||||||
Net investment income | (0.22 | ) | (0.23 | ) | (0.21 | ) | (0.21 | ) | (0.20 | ) | ||||||||||
Net asset value, end of period | $10.54 | $10.59 | $10.44 | $10.62 | $10.86 | |||||||||||||||
Total return | 1.60 | % | 3.66 | % | 0.33 | % | (0.28 | )% | 3.79 | % | ||||||||||
Ratios to average net assets (annualized) | ||||||||||||||||||||
Gross expenses | 0.52 | % | 0.52 | % | 0.51 | % | 0.50 | % | 0.50 | % | ||||||||||
Net expenses | 0.50 | % | 0.50 | % | 0.50 | % | 0.50 | % | 0.50 | % | ||||||||||
Net investment income | 2.06 | % | 2.17 | % | 2.03 | % | 1.95 | % | 1.86 | % | ||||||||||
Supplemental data | ||||||||||||||||||||
Portfolio turnover rate | 27 | % | 11 | % | 45 | % | 21 | % | 21 | % | ||||||||||
Net assets, end of period (000s omitted) | $380,649 | $322,273 | $325,973 | $370,824 | $351,080 | |||||||||||||||
The accompanying notes are an integral part of these financial statements.
28 | Wells Fargo California Limited-Term Tax-Free Fund
1. ORGANIZATION
Wells Fargo Funds Trust (the “Trust”), a Delaware statutory trust organized on March 10, 1999, is an open-end management investment company registered under the Investment Company Act of 1940, as amended (the “1940 Act”). As an investment company, the Trust follows the accounting and reporting guidance in Financial Accounting Standards Board (“FASB”) Accounting Standards Codification Topic 946, Financial Services – Investment Companies. These financial statements report on the Wells Fargo California Limited-Term Tax-Free Fund (the “Fund”) which is a diversified series of the Trust.
2. SIGNIFICANT ACCOUNTING POLICIES
The following significant accounting policies, which are consistently followed in the preparation of the financial statements of the Fund, are in conformity with U.S. generally accepted accounting principles which require management to make estimates and assumptions that affect the reported amounts of assets and liabilities, disclosure of contingent assets and liabilities at the date of the financial statements, and the reported amounts of revenues and expenses during the reporting period. Actual results could differ from those estimates.
Securities valuation
All investments are valued each business day as of the close of regular trading on the New York Stock Exchange (generally 4 p.m. Eastern Time), although the Fund may deviate from this calculation time under unusual or unexpected circumstances.
Debt securities are valued at the evaluated bid price provided by an independent pricing service (e.g. taking into account various factors, including yields, maturities, or credit ratings) or, if a reliable price is not available, the quoted bid price from an independent broker-dealer.
Futures contracts that are listed on a foreign or domestic exchange or market are valued at the official closing price or, if none, the last sales price.
Investments in registered open-end investment companies are valued at net asset value.
Investments which are not valued using any of the methods discussed above are valued at their fair value, as determined in good faith by the Board of Trustees of the Fund. The Board of Trustees has established a Valuation Committee comprised of the Trustees and has delegated to it the authority to take any actions regarding the valuation of portfolio securities that the Valuation Committee deems necessary or appropriate, including determining the fair value of portfolio securities, unless the determination has been delegated to the Wells Fargo Asset Management Pricing Committee at Wells Fargo Funds Management, LLC (“Funds Management”). The Board of Trustees retains the authority to make or ratify any valuation decisions or approve any changes to the Valuation Procedures as it deems appropriate. On a quarterly basis, the Board of Trustees receives reports on any valuation actions taken by the Valuation Committee or the Wells Fargo Asset Management Pricing Committee which may include items for ratification.
When-issued transactions
The Fund may purchase securities on a forward commitment or when-issued basis. The Fund records a when-issued transaction on the trade date and will segregate assets in an amount at least equal in value to the Fund’s commitment to purchase when-issued securities. Securities purchased on a when-issued basis are marked-to-market daily and the Fund begins earning interest on the settlement date. Losses may arise due to changes in the market value of the underlying securities or if the counterparty does not perform under the contract.
Futures contracts
Futures contracts are agreements between the Fund and a counterparty to buy or sell a specific amount of a commodity, financial instrument or currency at a specified price and on a specified date. The Fund may buy and sell futures contracts in order to gain exposure to, or protect against, changes in interest rates and is subject to interest rate risk. The primary risks associated with the use of futures contracts are the imperfect correlation between changes in market values of securities held by the Fund and the prices of futures contracts, and the possibility of an illiquid market. Futures contracts are generally entered into on a regulated futures exchange and cleared through a clearinghouse associated with the exchange. With futures contracts, there is minimal counterparty risk to the Fund since futures contracts are exchange traded and the exchange’s clearinghouse, as the counterparty to all exchange traded futures, guarantees the futures contracts against default.
Upon entering into a futures contracts, the Fund is required to deposit either cash or securities (initial margin) with the broker in an amount equal to a certain percentage of the contract value. Subsequent payments (variation margin) are paid to or from the broker each day equal to the daily changes in the contract value. Such payments are recorded as unrealized gains or losses and, if any, shown as variation margin receivable (payable) in the Statement of Assets and Liabilities. Should the Fund fail to make requested variation margin payments, the broker can gain access to the initial margin to satisfy the Fund’s payment obligations. When the contracts are closed, a realized gain or loss is recorded in the Statement of Operations.
Wells Fargo California Limited-Term Tax-Free Fund | 29
Notes to financial statements
Security transactions and income recognition
Securities transactions are recorded on a trade date basis. Realized gains or losses are recorded on the basis of identified cost.
Interest income is accrued daily and bond discounts are accreted and premiums are amortized daily. To the extent debt obligations are placed on non-accrual status, any related interest income may be reduced by writing off interest receivables when the collection of all or a portion of interest has been determined to be doubtful based on consistently applied procedures and the fair value has decreased. If the issuer subsequently resumes interest payments or when the collectability of interest is reasonably assured, the debt obligation is removed from non-accrual status.
Distributions to shareholders
Distributions to shareholders from net investment income are declared daily and paid monthly. Distributions from net realized gains, if any, are recorded on the ex-dividend date and paid at least annually. Such distributions are determined in accordance with income tax regulations and may differ from U.S. generally accepted accounting principles. Dividend sources are estimated at the time of declaration. The tax character of distributions is determined as of the Fund’s fiscal year end. Therefore, a portion of the Fund’s distributions made prior to the Fund’s fiscal year end may be categorized as a tax return of capital at year end.
Federal and other taxes
The Fund intends to continue to qualify as a regulated investment company by distributing substantially all of its investment company taxable and tax-exempt income and any net realized capital gains (after reduction for capital loss carryforwards) sufficient to relieve it from all, or substantially all, federal income taxes. Accordingly, no provision for federal income taxes was required.
The Fund’s income and federal excise tax returns and all financial records supporting those returns for the prior three fiscal years are subject to examination by the federal and Delaware revenue authorities. Management has analyzed the Fund’s tax positions taken on federal, state, and foreign tax returns for all open tax years and does not believe that there are any uncertain tax positions that require recognition of a tax liability.
As of June 30, 2020, the aggregate cost of all investments for federal income tax purposes was $511,822,924 and the unrealized gains (losses) consisted of:
Gross unrealized gains | $ | 18,025,564 | ||
Gross unrealized losses | (1,207,405 | ) | ||
Net unrealized gains | $ | 16,818,159 | ||
As of June 30, 2020, the Fund had capital loss carryforwards which consisted of $7,970,774 in short-term capital losses and $2,043,017 in long-term capital losses.
Class allocations
The separate classes of shares offered by the Fund differ principally in applicable sales charges, distribution, shareholder servicing, and administration fees. Class specific expenses are charged directly to that share class. Investment income, common fund-level expenses, and realized and unrealized gains (losses) on investments are allocated daily to each class of shares based on the relative proportion of net assets of each class.
3. FAIR VALUATION MEASUREMENTS
Fair value measurements of investments are determined within a framework that has established a fair value hierarchy based upon the various data inputs utilized in determining the value of the Fund’s investments. The three-level hierarchy gives the highest priority to unadjusted quoted prices in active markets for identical assets or liabilities (Level 1) and the lowest priority to unobservable inputs (Level 3). The Fund’s investments are classified within the fair value hierarchy based on the lowest level of input that is significant to the fair value measurement. The inputs are summarized into three broad levels as follows:
| ∎ | Level 1 – quoted prices in active markets for identical securities |
| ∎ | Level 2 – other significant observable inputs (including quoted prices for similar securities, interest rates, prepayment speeds, credit risk, etc.) |
| ∎ | Level 3 – significant unobservable inputs (including the Fund’s own assumptions in determining the fair value of investments) |
The inputs or methodologies used for valuing investments in securities are not necessarily an indication of the risk associated with investing in those securities.
30 | Wells Fargo California Limited-Term Tax-Free Fund
Notes to financial statements
The following is a summary of the inputs used in valuing the Fund’s assets and liabilities as of June 30, 2020:
Quoted prices (Level 1) | Other significant observable inputs (Level 2) | Significant unobservable inputs (Level 3) | Total | |||||||||||||
Assets | ||||||||||||||||
Investments in: | ||||||||||||||||
Municipal obligations | $ | 0 | $ | 527,641,083 | $ | 0 | $ | 527,641,083 | ||||||||
Closed end municipal bond fund obligation | 0 | 1,000,000 | 0 | 1,000,000 | ||||||||||||
Total assets | $ | 0 | $ | 528,641,083 | $ | 0 | $ | 528,641,083 | ||||||||
Additional sector, industry or geographic detail is included in the Portfolio of Investments.
For the year ended June 30, 2020, the Fund did not have any transfers into/out of Level 3.
4. TRANSACTIONS WITH AFFILIATES
Management fee
Funds Management, an indirect wholly owned subsidiary of Wells Fargo & Company (“Wells Fargo”), is the manager of the Fund and provides advisory and fund-level administrative services under an investment management agreement. Under the investment management agreement, Funds Management is responsible for, among other services, implementing the investment objectives and strategies of the Fund, supervising the subadviser and providing fund-level administrative services in connection with the Fund’s operations. As compensation for its services under the investment management agreement, Funds Management is entitled to receive a management fee at the following annual rate based on the Fund’s average daily net assets:
| Average daily net assets | Management fee | |||
First $500 million | 0.400 | % | ||
Next $500 million | 0.375 | |||
Next $2 billion | 0.350 | |||
Next $2 billion | 0.325 | |||
Next $5 billion | 0.290 | |||
Over $10 billion | 0.280 | |||
For the year ended June 30, 2020, the management fee was equivalent to an annual rate of 0.40% of the Fund’s average daily net assets.
Funds Management has retained the services of a subadviser to provide daily portfolio management to the Fund. The fee for subadvisory services is borne by Funds Management. Wells Capital Management Incorporated, an affiliate of Funds Management and an indirect wholly owned subsidiary of Wells Fargo, is the subadviser to the Fund and is entitled to receive a fee from Funds Management at an annual rate starting at 0.15% and declining to 0.05% as the average daily net assets of the Fund increase.
Administration fees
Under a class-level administration agreement, Funds Management provides class-level administrative services to the Fund, which includes paying fees and expenses for services provided by the transfer agent, sub-transfer agents, omnibus account servicers and record-keepers. As compensation for its services under the class-level administration agreement, Funds Management receives an annual fee which is calculated based on the average daily net assets of each class as follows:
Class-level administration fee | ||||
Class A, Class C | 0.16 | % | ||
Administrator Class | 0.10 | |||
Institutional Class | 0.08 | |||
Wells Fargo California Limited-Term Tax-Free Fund | 31
Notes to financial statements
Waivers and/or expense reimbursements
Funds Management has contractually waived and/or reimbursed management and administration fees to the extent necessary to maintain certain net operating expense ratios for the Fund. When each class of the Fund has exceeded its expense cap, Funds Management has waived fees and/or reimbursed expenses from fund-level expenses on a proportionate basis and then from class specific expenses. When only certain classes exceed their expense caps, waivers and/or reimbursements are applied against class specific expenses before fund-level expenses. Funds Management has committed through October 31, 2020 to waive fees and/or reimburse expenses to the extent necessary to cap the Fund’s expenses at 0.80% for Class A shares, 1.55% for Class C shares, 0.60% for Administrator Class shares, and 0.50% for Institutional Class shares. Prior to or after the commitment expiration date, the cap may be increased or the commitment to maintain the cap may be terminated only with the approval of the Board of Trustees.
Distribution fee
The Trust has adopted a distribution plan for Class C shares of the Fund pursuant to Rule 12b-1 under the 1940 Act. A distribution fee is charged to Class C shares and paid to Wells Fargo Funds Distributor, LLC (“Funds Distributor”), the principal underwriter, at an annual rate of 0.75% of the average daily net assets of Class C shares.
In addition, Funds Distributor is entitled to receive the front-end sales charge from the purchase of Class A shares and a contingent deferred sales charge on the redemption of certain Class A shares. Funds Distributor is also entitled to receive the contingent deferred sales charges from redemptions of Class C shares. For the year ended June 30, 2020, Funds Distributor received $688 from the sale of Class A shares. No contingent deferred sales charges were incurred by Class A and Class C shares for the year ended June 30, 2020.
Shareholder servicing fees
The Trust has entered into contracts with one or more shareholder servicing agents, whereby Class A, Class C, and Administrator Class of the Fund are charged a fee at an annual rate of 0.25% of the average daily net assets of each respective class. A portion of these total shareholder servicing fees were paid to affiliates of Wells Fargo.
Interfund transactions
The Fund may purchase or sell portfolio investment securities to certain other Wells Fargo affiliates pursuant to Rule 17a-7 under the 1940 Act and under procedures adopted by the Board of Trustees. The procedures have been designed to ensure that these interfund transactions, which do not incur broker commissions, are effected at current market prices. Pursuant to these procedures, the Fund had $38,785,000 and $72,800,000 in interfund purchases and sales, respectively, during the year ended June 30, 2020.
5. INVESTMENT PORTFOLIO TRANSACTIONS
Purchases and sales of investments, excluding U.S. government obligations (if any) and short-term securities, for the year ended June 30, 2020 were $139,402,472 and $148,600,197, respectively.
6. BANK BORROWINGS
The Trust (excluding the money market funds), Wells Fargo Master Trust and Wells Fargo Variable Trust are parties to a $350,000,000 revolving credit agreement whereby the Fund is permitted to use bank borrowings for temporary or emergency purposes, such as to fund shareholder redemption requests. Interest under the credit agreement is charged to the Fund based on a borrowing rate equal to the higher of the Federal Funds rate in effect on that day plus 1.25% or the overnight LIBOR rate in effect on that day plus 1.25%. In addition, an annual commitment fee equal to 0.25% of the unused balance is allocated to each participating fund.
For the year ended June 30, 2020, there were no borrowings by the Fund under the agreement.
7. DISTRIBUTIONS TO SHAREHOLDERS
The tax character of distributions paid was $10,592,597 and $11,666,053 of tax-exempt income for the years ended June 30, 2020 and June 30, 2019, respectively.
As of June 30, 2020, the components of distributable earnings on a tax basis were as follows:
Undistributed tax-exempt income | Unrealized gains | Capital loss carryforward | ||
| $1,071,309 | $16,818,159 | $(10,013,791) | ||
32 | Wells Fargo California Limited-Term Tax-Free Fund
Notes to financial statements
8. CONCENTRATION RISK
The Fund invests a substantial portion of its assets in issuers of municipal debt securities located in a single state or territory of the U.S. Therefore, it may be more affected by economic and political developments in that state or region than would be a comparable general tax-exempt fund. As of the end of the period, the Fund invested a concentration of its portfolio in the state of California.
9. INDEMNIFICATION
Under the Fund’s organizational documents, the officers and Trustees have been granted certain indemnification rights against certain liabilities that may arise out of performance of their duties to the Fund. The Fund has entered into a separate agreement with each Trustee that converts indemnification rights currently existing under the Fund’s organizational documents into contractual rights that cannot be changed in the future without the consent of the Trustee. Additionally, in the normal course of business, the Fund may enter into contracts with service providers that contain a variety of indemnification clauses. The Fund’s maximum exposure under these arrangements is dependent on future claims that may be made against the Fund and, therefore, cannot be estimated.
10. NEW ACCOUNTING PRONOUNCEMENT
In August 2018, FASB issued Accounting Standards Update (“ASU”) No. 2018-13, Fair Value Measurement (Topic 820) Disclosure Framework—Changes to the Disclosure Requirements for Fair Value Measurement. ASU 2018-13 updates the disclosure requirements on fair value measurements in Topic 820, Fair Value Measurements. The amendments are effective for fiscal years, and interim periods within those fiscal years, beginning after December 15, 2019. Management has adopted this guidance which did not have a material impact on the financial statements.
11. CORONAVIRUS (COVID-19) PANDEMIC
On March 11, 2020, the World Health Organization announced that it had made the assessment that coronavirus disease 2019 (“COVID-19”) is a pandemic. The impacts of COVID-19 are adversely affecting the entire global economy, individual companies and investment products, and the market in general. There is significant uncertainty around the extent and duration of business disruptions related to COVID-19 and the impacts may be short term or may last for an extended period of time. The risk of further spreading of COVID-19 has led to significant uncertainty and volatility in the financial markets.
Wells Fargo California Limited-Term Tax-Free Fund | 33
Report of independent registered public accounting firm
To the Shareholders of the Fund and Board of Trustees
Wells Fargo Funds Trust:
Opinion on the Financial Statements
We have audited the accompanying statement of assets and liabilities of Wells Fargo California Limited-Term Tax-Free Fund (the Fund), one of the funds constituting Wells Fargo Funds Trust, including the portfolio of investments, as of June 30, 2020, the related statement of operations for the year then ended, the statements of changes in net assets for each of the years in the two-year period then ended, and the related notes (collectively, the financial statements) and the financial highlights for each of the years in the five-year period then ended. In our opinion, the financial statements and financial highlights present fairly, in all material respects, the financial position of the Fund as of June 30, 2020, the results of its operations for the year then ended, the changes in its net assets for each of the years in the two-year period then ended, and the financial highlights for each of the years in the five-year period then ended, in conformity with U.S. generally accepted accounting principles.
Basis for Opinion
These financial statements and financial highlights are the responsibility of the Fund’s management. Our responsibility is to express an opinion on these financial statements and financial highlights based on our audits. We are a public accounting firm registered with the Public Company Accounting Oversight Board (United States) (PCAOB) and are required to be independent with respect to the Fund in accordance with the U.S. federal securities laws and the applicable rules and regulations of the Securities and Exchange Commission and the PCAOB.
We conducted our audits in accordance with the standards of the PCAOB. Those standards require that we plan and perform the audit to obtain reasonable assurance about whether the financial statements and financial highlights are free of material misstatement, whether due to error or fraud. Our audits included performing procedures to assess the risks of material misstatement of the financial statements and financial highlights, whether due to error or fraud, and performing procedures that respond to those risks. Such procedures included examining, on a test basis, evidence regarding the amounts and disclosures in the financial statements and financial highlights. Such procedures also included confirmation of securities owned as of June 30, 2020, by correspondence with the custodian. Our audits also included evaluating the accounting principles used and significant estimates made by management, as well as evaluating the overall presentation of the financial statements and financial highlights. We believe that our audits provide a reasonable basis for our opinion.

We have not been able to determine the specific year that we began serving as the auditor of one or more Wells Fargo Funds investment companies; however we are aware that we have served as the auditor of one or more Wells Fargo Funds investment companies since at least 1955.
Boston, Massachusetts
August 29, 2020
34 | Wells Fargo California Limited-Term Tax-Free Fund
TAX INFORMATION
For federal and California income tax purposes, the Fund designates 100% of its distributions paid from net investment income during the fiscal year as exempt-interest dividends under Section 852(b)(5) of the Internal Revenue Code and under Section 17145 of the California Revenue and Taxation Code.
PROXY VOTING INFORMATION
A description of the policies and procedures used to determine how to vote proxies relating to portfolio securities is available, upon request, by calling 1-800-222-8222, visiting our website at wfam.com, or visiting the SEC website at sec.gov. Information regarding how the proxies related to portfolio securities were voted during the most recent 12-month period ended June 30 is available on the website at wfam.com or by visiting the SEC website at sec.gov.
QUARTERLY PORTFOLIO HOLDINGS INFORMATION
The Fund files its complete schedule of portfolio holdings with the SEC for the first and third quarters of each fiscal year as an exhibit to its reports on Form N-PORT. Shareholders may view the filed Form N-PORT by visiting the SEC website at sec.gov.
Wells Fargo California Limited-Term Tax-Free Fund | 35
Other information (unaudited)
BOARD OF TRUSTEES AND OFFICERS
Each of the Trustees and Officers1 listed in the table below acts in identical capacities for each fund in the Wells Fargo family of funds, which consists of 147 mutual funds comprising the Wells Fargo Funds Trust, Wells Fargo Variable Trust, Wells Fargo Master Trust and four closed-end funds (collectively the “Fund Complex”). This table should be read in conjunction with the Prospectus and the Statement of Additional Information2. The mailing address of each Trustee and Officer is 525 Market Street, 12th Floor, San Francisco, CA 94105. Each Trustee and Officer serves an indefinite term, however, each Trustee serves such term until reaching the mandatory retirement age established by the Trustees.
Independent Trustees
Name and year of birth | Position held and length of service* | Principal occupations during past five years or longer | Current other public company or investment company directorships | |||
William R. Ebsworth (Born 1957) | Trustee, since 2015 | Retired. From 1984 to 2013, equities analyst, portfolio manager, research director and chief investment officer at Fidelity Management and Research Company in Boston, Tokyo, and Hong Kong, and retired in 2013 as Chief Investment Officer of Fidelity Strategic Advisers, Inc. where he led a team of investment professionals managing client assets. Prior thereto, Board member of Hong Kong Securities Clearing Co., Hong Kong Options Clearing Corp., the Thailand International Fund, Ltd., Fidelity Investments Life Insurance Company, and Empire Fidelity Investments Life Insurance Company. Audit Committee Chair and Investment Committee Chair of the Vincent Memorial Hospital Endowment (non-profit organization). Mr. Ebsworth is a CFA® charterholder. | N/A | |||
Jane A. Freeman (Born 1953) | Trustee, since 2015; Chair Liaison, since 2018 | Retired. From 2012 to 2014 and 1999 to 2008, Chief Financial Officer of Scientific Learning Corporation. From 2008 to 2012, Ms. Freeman provided consulting services related to strategic business projects. Prior to 1999, Portfolio Manager at Rockefeller & Co. and Scudder, Stevens & Clark. Board member of the Harding Loevner Funds from 1996 to 2014, serving as both Lead Independent Director and chair of the Audit Committee. Board member of the Russell Exchange Traded Funds Trust from 2011 to 2012 and the chair of the Audit Committee. Ms. Freeman is also an inactive Chartered Financial Analyst. | N/A | |||
Isaiah Harris, Jr. (Born 1952) | Trustee, since 2009; Audit Committee Chairman, since 2019 | Retired. Chairman of the Board of CIGNA Corporation since 2009, and Director since 2005. From 2003 to 2011, Director of Deluxe Corporation. Prior thereto, President and CEO of BellSouth Advertising and Publishing Corp. from 2005 to 2007, President and CEO of BellSouth Enterprises from 2004 to 2005 and President of BellSouth Consumer Services from 2000 to 2003. Emeritus member of the Iowa State University Foundation Board of Governors. Emeritus Member of the Advisory Board of Iowa State University School of Business. Advisory Board Member, Palm Harbor Academy (private school). Advisory Board Member, Child Evangelism Fellowship (non-profit). Mr. Harris is a certified public accountant (inactive status). | CIGNA Corporation | |||
Judith M. Johnson (Born 1949) | Trustee, since 2008; Audit Committee Chairman, from 2009 to 2018 | Retired. Prior thereto, Chief Executive Officer and Chief Investment Officer of Minneapolis Employees Retirement Fund from 1996 to 2008. Ms. Johnson is an attorney, certified public accountant and a certified managerial accountant. | N/A | |||
36 | Wells Fargo California Limited-Term Tax-Free Fund
Other information (unaudited)
Name and year of birth | Position held and length of service* | Principal occupations during past five years or longer | Current other public company or investment company directorships | |||
David F. Larcker (Born 1950) | Trustee, since 2009 | James Irvin Miller Professor of Accounting at the Graduate School of Business, Stanford University, Director of the Corporate Governance Research Initiative and Senior Faculty of The Rock Center for Corporate Governance since 2006. From 2005 to 2008, Professor of Accounting at the Graduate School of Business, Stanford University. Prior thereto, Ernst & Young Professor of Accounting at The Wharton School, University of Pennsylvania from 1985 to 2005. | N/A | |||
Olivia S. Mitchell (Born 1953) | Trustee, since 2006; Nominating and Governance Committee Chair, since 2018 | International Foundation of Employee Benefit Plans Professor, Wharton School of the University of Pennsylvania since 1993. Director of Wharton’s Pension Research Council and Boettner Center on Pensions & Retirement Research, and Research Associate at the National Bureau of Economic Research. Previously, Cornell University Professor from 1978 to 1993. | N/A | |||
Timothy J. Penny (Born 1951) | Trustee, since 1996; Chairman, since 2018 | President and Chief Executive Officer of Southern Minnesota Initiative Foundation, a non-profit organization, since 2007. Member of the Board of Trustees of NorthStar Education Finance, Inc., a non-profit organization, since 2007. | N/A | |||
James G. Polisson (Born 1959) | Trustee, since 2018 | Retired. Chief Marketing Officer, Source (ETF) UK Services, Ltd, from 2015 to 2017. From 2012 to 2015, Principal of The Polisson Group, LLC, a management consulting, corporate advisory and principal investing company. Chief Executive Officer and Managing Director at Russell Investments, Global Exchange Traded Funds from 2010 to 2012. Managing Director of Barclays Global Investors from 1998 to 2010 and Global Chief Marketing Officer for iShares and Barclays Global Investors from 2000 to 2010. Trustee of the San Francisco Mechanics’ Institute, a non-profit organization, from 2013 to 2015. Board member of the Russell Exchange Traded Fund Trust from 2011 to 2012. Director of Barclays Global Investors Holdings Deutschland GmbH from 2006 to 2009. Mr. Polisson is an attorney and has a retired status with the Massachusetts and District of Columbia Bar Associations. | N/A | |||
Pamela Wheelock (Born 1959) | Trustee, since January 2020; previously Trustee from January 2018 to July 2019 | Board member of the Destination Medical Center Economic Development Agency, Rochester, Minnesota since 2019 and Interim President of the McKnight Foundation since 2020. Acting Commissioner, Minnesota Department of Human Services, July 2019 through September 2019. Human Services Manager (part-time), Minnesota Department of Human Services, October 2019 through December 2019. Chief Operating Officer, Twin Cities Habitat for Humanity from 2017 to 2019. Vice President of University Services, University of Minnesota from 2012 to 2016. Prior thereto, on the Board of Directors, Governance Committee and Finance Committee for the Minnesota Philanthropy Partners (Saint Paul Foundation) from 2012 to 2018, Interim Chief Executive Officer of Blue Cross Blue Shield of Minnesota from 2011 to 2012, Chairman of the Board from 2009 to 2012 and Board Director from 2003 to 2015. Vice President, Leadership and Community Engagement, Bush Foundation, Saint Paul, Minnesota (a private foundation) from 2009 to 2011. Executive Vice President and Chief Financial Officer, Minnesota Sports and Entertainment from 2004 to 2009 and Senior Vice President from 2002 to 2004. Executive Vice President of the Minnesota Wild Foundation from 2004 to 2008. Commissioner of Finance, State of Minnesota, from 1999 to 2002. Currently Board Chair of the Minnesota Wild Foundation since 2010. | N/A | |||
| * | Length of service dates reflect the Trustee’s commencement of service with the Trust’s predecessor entities, where applicable. |
Wells Fargo California Limited-Term Tax-Free Fund | 37
Other information (unaudited)
Officers
Name and year of birth | Position held and length of service | Principal occupations during past five years or longer | ||
Andrew Owen (Born 1960) | President, since 2017 | Executive Vice President of Wells Fargo & Company and Head of Affiliated Managers, Wells Fargo Asset Management, since 2014. In addition, Mr. Owen is currently President, Chief Executive Officer and Director of Wells Fargo Funds Management, LLC since 2017. Prior thereto, Executive Vice President responsible for marketing, investments and product development for Wells Fargo Funds Management, LLC, from 2009 to 2014. | ||
Nancy Wiser1 (Born 1967) | Treasurer, since 2012 | Executive Vice President of Wells Fargo Funds Management, LLC since 2011. Chief Operating Officer and Chief Compliance Officer at LightBox Capital Management LLC, from 2008 to 2011. | ||
Michelle Rhee (Born 1966) | Chief Legal Officer, since 2019 | Secretary of Wells Fargo Funds Management, LLC, Chief Legal Counsel of Wells Fargo Asset Management and Assistant General Counsel of Wells Fargo Bank, N.A. since 2018. Associate General Counsel and Managing Director of Bank of America Corporation from 2004 to 2018. | ||
Catherine Kennedy (Born 1969) | Secretary, since 2019 | Vice President of Wells Fargo Funds Management, LLC and Senior Counsel of the Wells Fargo Legal Department since 2010. Vice President and Senior Counsel of Evergreen Investment Management Company, LLC from 1998 to 2010. | ||
Michael H. Whitaker (Born 1967) | Chief Compliance Officer, since 2016 | Chief Compliance Officer of Wells Fargo Asset Management since 2016. Senior Vice President and Chief Compliance Officer for Fidelity Investments from 2007 to 2016. | ||
David Berardi (Born 1975) | Assistant Treasurer, since 2009 | Vice President of Wells Fargo Funds Management, LLC since 2009. Vice President of Evergreen Investment Management Company, LLC from 2008 to 2010. Manager of Fund Reporting and Control for Evergreen Investment Management Company, LLC from 2004 to 2010. | ||
Jeremy DePalma1 (Born 1974) | Assistant Treasurer, since 2009 | Senior Vice President of Wells Fargo Funds Management, LLC since 2009. Senior Vice President of Evergreen Investment Management Company, LLC from 2008 to 2010 and head of the Fund Reporting and Control Team within Fund Administration from 2005 to 2010. | ||
| 1 | Nancy Wiser acts as Treasurer of 65 funds in the Fund Complex. Jeremy DePalma acts as the Treasurer of 82 funds and Assistant Treasurer of 65 funds in the Fund Complex. |
| 2 | The Statement of Additional Information includes additional information about the Trustees and is available, without charge, upon request, by calling 1-800-222-8222 or by visiting the website at wfam.com. |
38 | Wells Fargo California Limited-Term Tax-Free Fund
Other information (unaudited)
BOARD CONSIDERATION OF INVESTMENT MANAGEMENT AND SUB-ADVISORY AGREEMENTS:
Wells Fargo California Limited-Term Tax-Free Fund
Under the Investment Company Act of 1940 (the “1940 Act”), the Board of Trustees (the “Board”) of Wells Fargo Funds Trust (the “Trust”) must determine annually whether to approve the continuation of the Trust’s investment management and sub-advisory agreements. In this regard, at a Board meeting held on May 26, 2020 and May 28, 2020 (together, the “Meeting”), the Board, all the members of which have no direct or indirect interest in the investment management and sub-advisory agreements and are not “interested persons” of the Trust, as defined in the 1940 Act (the “Independent Trustees”), reviewed and approved for Wells Fargo California Limited-Term Tax-Free Fund (the “Fund”): (i) an investment management agreement (the “Management Agreement”) with Wells Fargo Funds Management, LLC (“Funds Management”); and (ii) an investment sub-advisory agreement (the “Sub-Advisory Agreement”) with Wells Capital Management Incorporated (the “Sub-Adviser”), an affiliate of Funds Management. The Management Agreement and the Sub-Advisory Agreement are collectively referred to as the “Advisory Agreements.”
At the Meeting, the Board considered the factors and reached the conclusions described below relating to the selection of Funds Management and the Sub-Adviser and the approval of the Advisory Agreements. Prior to the Meeting, including at a Board meeting held in April 2020, the Trustees conferred extensively among themselves and with representatives of Funds Management about these matters. Also, the Board has adopted a team-based approach, with each team consisting of a sub-set of Trustees, to assist the full Board in the discharge of its duties in reviewing investment performance and other matters throughout the year. The Independent Trustees were assisted in their evaluation of the Advisory Agreements by independent legal counsel, from whom they received separate legal advice and with whom they met separately.
In providing information to the Board, Funds Management and the Sub-Adviser were guided by a detailed set of requests for information submitted to them by independent legal counsel on behalf of the Independent Trustees at the start of the Board’s annual contract renewal process earlier in 2020. In considering and approving the Advisory Agreements, the Trustees considered the information they believed relevant, including but not limited to the information discussed below. The Board considered not only the specific information presented in connection with the Meeting, but also the knowledge gained over time through interaction with Funds Management and the Sub-Adviser about various topics. In this regard, the Board reviewed reports of Funds Management at each of its quarterly meetings, which included, among other things, portfolio reviews and investment performance reports. In addition, the Board and the teams mentioned above confer with portfolio managers at various times throughout the year. The Board did not identify any particular information or consideration that was all-important or controlling, and each individual Trustee may have attributed different weights to various factors.
After its deliberations, the Board unanimously approved the continuation of the Advisory Agreements for a one-year term and determined that the compensation payable to Funds Management and the Sub-Adviser under each of the Advisory Agreements was reasonable. The Board considered the approval of the Advisory Agreements for the Fund as part of its consideration of agreements for funds across the complex, but its approvals were made on a fund-by-fund basis. The following summarizes a number of important, but not necessarily all, factors considered by the Board in support of its approvals.
Nature, extent and quality of services
The Board received and considered various information regarding the nature, extent and quality of services provided to the Fund by Funds Management and the Sub-Adviser under the Advisory Agreements. This information included a description of the investment advisory services and Fund-level administrative services covered by the Management Agreement, as well as, among other things, a summary of the background and experience of senior management of Wells Fargo Asset Management (“WFAM”), of which Funds Management and the Sub-Adviser are a part, and a summary of investments made in the business of WFAM. The Board also received a description of Funds Management’s and the Sub-Adviser’s business continuity plans and of their approaches to data privacy and cybersecurity, and related testing. The Board also received and reviewed information about Funds Management’s role as administrator of the Fund’s liquidity risk management program, Funds Management’s approach to risk management, and Funds Management’s intermediary and vendor oversight program.
The Board also considered the qualifications, background, tenure and responsibilities of each of the portfolio managers primarily responsible for the day-to-day portfolio management of the Fund. The Board evaluated the ability of Funds Management and the Sub-Adviser to attract and retain qualified investment professionals, including research, advisory and supervisory personnel. The Board further considered the compliance programs and compliance records of Funds Management and the Sub-Adviser. In addition, the Board took into account the full range of services provided to the Fund by Funds Management and its affiliates.
Wells Fargo California Limited-Term Tax-Free Fund | 39
Other information (unaudited)
Fund investment performance and expenses
The Board considered the investment performance results for the Fund over various time periods ended December 31, 2019. The Board also considered more current results for various time periods ended March 31, 2020. The Board considered these results in comparison to the investment performance of funds in a universe that was determined by Broadridge Inc. (“Broadridge”) to be similar to the Fund (the “Universe”), and in comparison to the Fund’s benchmark index and to other comparative data. Broadridge is an independent provider of investment company data. The Board received a description of the methodology used by Broadridge to select the mutual funds in the performance Universe. The Board noted that the investment performance of the Fund (Administrator Class) was higher than or in range of the average investment performance of the Universe for the one-, three-, five- and ten-year periods ended December 31, 2019. The Board also noted that the investment performance of the Fund (Administrator Class) was higher than or in range of the average investment performance of the Universe for the five- and ten-year periods ended March 31, 2020, and lower than the average investment performance of the Universe for the one- and three-year periods ended March 31, 2020. The Board also noted that the investment performance of the Fund was higher than or in range of its benchmark index, the Bloomberg Barclays Municipal 1-5 Year Index, for the five-and ten-year periods ended December 31, 2019, and lower than its benchmark index for the one-and five-year periods ended December 31, 2019. The Board also noted that the investment performance of the Fund was higher than its benchmark index, the Bloomberg Barclays Municipal 1-5 Year Index, for the ten-year period ended March 31, 2020, and lower than its benchmark index for the one-, three- and five-year periods ended March 31, 2020.
The Board received information concerning, and discussed factors contributing to, the underperformance of the Fund relative to the Universe and benchmark index for the periods identified above. The Board took note of the explanations for the relative underperformance during these periods, including with respect to investment decisions and market factors that affected the Fund’s investment performance.
The Board also received and considered information regarding the Fund’s net operating expense ratios and their various components, including actual management fees, custodian and other non-management fees, and Rule 12b-1 and non-Rule 12b-1 shareholder service fees. The Board considered these ratios in comparison to the median ratios of funds in class-specific expense groups that were determined by Broadridge to be similar to the Fund (the “Groups”). The Board received a description of the methodology used by Broadridge to select the mutual funds in the expense Groups and an explanation of how funds comprising expense groups and their expense ratios may vary from year-to-year. Based on the Broadridge reports, the Board noted that the net operating expense ratios of the Fund were in range of or equal to the median net operating expense ratios of the expense Groups for each share class.
The Board took into account the Fund’s investment performance and expense information provided to it among the factors considered in deciding to re-approve the Advisory Agreements.
Investment management and sub-advisory fee rates
The Board reviewed and considered the contractual fee rates payable by the Fund to Funds Management under the Management Agreement, as well as the contractual fee rates payable by the Fund to Funds Management for class-level administrative services under a Class-Level Administration Agreement, which include, among other things, class-level transfer agency and sub-transfer agency costs (collectively, the “Management Rates”). The Board also reviewed and considered the contractual investment sub-advisory fee rates that are payable by Funds Management to the Sub-Adviser for investment sub-advisory services.
Among other information reviewed by the Board was a comparison of the Fund’s Management Rates with the average contractual investment management fee rates of funds in the expense Groups at a common asset level as well as transfer agency costs of the funds in the expense Groups. The Board noted that the Management Rates of the Fund were lower than or in range of the sum of these average rates for the Fund’s expense Groups for all share classes.
The Board also received and considered information about the portion of the total management fee that was retained by Funds Management after payment of the fee to the Sub-Adviser for sub-advisory services. In assessing the reasonableness of this amount, the Board received and evaluated information about the nature and extent of responsibilities retained and risks assumed by Funds Management and not delegated to or assumed by the Sub-Adviser, and about Funds Management’s on-going oversight services. Given the affiliation between Funds Management and the Sub-Adviser, the Board ascribed limited relevance to the allocation of fees between them.
The Board also received and considered information about the nature and extent of services offered and fee rates charged by Funds Management and the Sub-Adviser to other types of clients with investment strategies similar to those of the Fund. In this regard, the Board received information about the significantly greater scope of services, and compliance, reporting and
40 | Wells Fargo California Limited-Term Tax-Free Fund
Other information (unaudited)
other legal burdens and risks of managing proprietary mutual funds compared with those associated with managing assets of other types of clients, including third-party sub-advised fund clients and non-mutual fund clients such as institutional separate accounts.
Based on its consideration of the factors and information it deemed relevant, including those described here, the Board determined that the compensation payable to Funds Management under the Management Agreement and to the Sub-Adviser under the Sub-Advisory Agreement was reasonable.
Profitability
The Board received and considered information concerning the profitability of Funds Management, as well as the profitability of both WFAM and Wells Fargo & Co. (“Wells Fargo”) from providing services to the fund family as a whole. The Board noted that the Sub-Adviser’s profitability information with respect to providing services to the Fund and other funds in the family was subsumed in the WFAM and Wells Fargo profitability analysis.
Funds Management reported on the methodologies and estimates used in calculating profitability, including a description of the methodology used to allocate certain expenses. Among other things, the Board noted that the levels of profitability reported on a fund-by-fund basis varied widely, depending on factors such as the size, type and age of fund.
Based on its review, the Board did not deem the profits reported by Funds Management, WFAM or Wells Fargo from services provided to the Fund to be at a level that would prevent it from approving the continuation of the Advisory Agreements.
Economies of scale
The Board received and considered information about the potential for Funds Management to experience economies of scale in the provision of management services to the Fund, the difficulties of calculating economies of scale at an individual fund level, and the extent to which potential scale benefits are shared with shareholders. The Board noted the existence of breakpoints in the Fund’s management fee structure, which operate generally to reduce the Fund’s expense ratios as the Fund grows in size, and the size of the Fund in relation to such breakpoints. The Board considered that in addition to management fee breakpoints, Funds Management shares potential economies of scale from its management business in a variety of ways, including through fee waiver and expense reimbursement arrangements, services that benefit shareholders, competitive management fee rates set at the outset without regard to breakpoints, and investments in the business intended to enhance services available to shareholders.
The Board concluded that Funds Management’s arrangements with respect to the Fund, including contractual breakpoints, constituted a reasonable approach to sharing potential economies of scale with the Fund and its shareholders.
Other benefits to Funds Management and the Sub-Adviser
The Board received and considered information regarding potential “fall-out” or ancillary benefits received by Funds Management and its affiliates, including the Sub-Adviser, as a result of their relationships with the Fund. Ancillary benefits could include, among others, benefits directly attributable to other relationships with the Fund and benefits potentially derived from an increase in Funds Management’s and the Sub-Adviser’s business as a result of their relationships with the Fund. The Board noted that various affiliates of Funds Management may receive distribution-related fees, shareholder servicing payments and sub-transfer agency fees in respect of shares sold or held through them and services provided.
The Board also reviewed information about soft dollar credits earned and utilized by the Sub-Adviser, fees earned by Funds Management and the Sub-Adviser from managing a private investment vehicle for the fund family’s securities lending collateral, and commissions earned by an affiliated broker from portfolio transactions.
Based on its consideration of the factors and information it deemed relevant, including those described here, the Board did not find that any ancillary benefits received by Funds Management and its affiliates, including the Sub-Adviser, were unreasonable.
Conclusion
At the Meeting, after considering the above-described factors and based on its deliberations and its evaluation of the information described above, the Board unanimously approved the continuation of the Advisory Agreements for a one-year term and determined that the compensation payable to Funds Management and the Sub-Adviser under each of the Advisory Agreements was reasonable.
Wells Fargo California Limited-Term Tax-Free Fund | 41
Other information (unaudited)
LIQUIDITY RISK MANAGEMENT PROGRAM
In accordance with Rule 22e-4 under the Investment Company Act of 1940, as amended (the “Liquidity Rule”), Wells Fargo Funds Trust (the “Trust”) has adopted and implemented a liquidity risk management program (the “Program”) on behalf of each of its series, including the Fund, which is reasonably designed to assess and manage the Fund’s liquidity risk. “Liquidity risk” is defined as the risk that the Fund is unable to meet redemption requests without significantly diluting remaining investors’ interests in the Fund. The Trust’s Board of Trustees (the “Board”) previously approved the designation of Wells Fargo Funds Management, LLC (“Funds Management”), the Fund’s investment manager, as the administrator of the Program, and Funds Management has established a Liquidity Risk Management Council composed of personnel from multiple departments within Funds Management and its affiliates to assist Funds Management in the implementation and on-going administration of the Program.
The Program is comprised of various components designed to support the assessment and/or management of liquidity risk, including: (1) the periodic assessment (no less frequently than annually) of certain factors that influence the Fund’s liquidity risk; (2) the periodic classification (no less frequently than monthly) of the Fund’s investments into one of four liquidity categories that reflect an estimate of their liquidity under current market conditions; (3) a 15% limit on the acquisition of “illiquid investments” (as defined under the Liquidity Rule); (4) to the extent the Fund does not invest primarily in “highly liquid investments” (as defined under the Liquidity Rule), the determination of a minimum percentage of the Fund’s assets that generally will be invested in highly liquid investments (an “HLIM”); (5) if the Fund has established an HLIM, the periodic review (no less frequently than annually) of the HLIM and the adoption of policies and procedures for responding to a shortfall of the Fund’s “highly liquid investments” below its HLIM; and (6) periodic reporting to the Board.
At a meeting of the Board held on May 26 and 28, 2020, the Board received a written report (the “Report”) from Funds Management that addressed the operation of the Program and assessed its adequacy and effectiveness of implementation. The Report covered the initial period from December 1, 2018 through December 31, 2019 (the “Reporting Period”). No significant liquidity events impacting the Fund were noted in the Report. There were no material changes to the Program during the Reporting Period. The Report concluded that the Program is operating effectively to assess and manage the Fund’s liquidity risk, and that the Program has been and continues to be adequately and effectively implemented to monitor and, as applicable, respond to the Fund’s liquidity developments.
There can be no assurance that the Program will achieve its objectives under all circumstances in the future. Please refer to the Fund’s prospectus for more information regarding the Fund’s exposure to liquidity risk and other risks to which an investment in the Fund may be subject.
42 | Wells Fargo California Limited-Term Tax-Free Fund
Effective on or after May 1, 2020, clients of Edward Jones (also referred to as “shareholders”) purchasing Fund shares on the Edward Jones commission and fee-based platforms are eligible only for the following sales charge discounts (also referred to as “breakpoints”) and waivers, which can differ from breakpoints and waivers described elsewhere in the Fund’s Prospectus or SAI or through another broker-dealer. In all instances, it is the shareholder’s responsibility to inform Edward Jones at the time of purchase of any relationship, holdings of Wells Fargo Funds or other facts qualifying the purchaser for breakpoints or waivers. Edward Jones can ask for documentation of such circumstance.
| Breakpoints available at Edward Jones |
| Rights of Accumulation (ROA) |
The applicable sales charge on a purchase of Class A shares is determined by taking into account all share classes (except any money market funds and retirement plan share classes) of Wells Fargo Funds held by the shareholder or in an account grouped by Edward Jones with other accounts for the purpose of providing certain pricing considerations (“pricing groups”). This includes all share classes held on the Edward Jones platform and/or held on another platform. The inclusion of eligible fund family assets in the rights of accumulation calculation is dependent on the shareholder notifying his or her financial advisor of such assets at the time of calculation. |
ROA is determined by calculating the higher of cost or market value (current shares x NAV). |
| Letter of Intent (LOI) |
Through a LOI, shareholders can receive the sales charge and breakpoint discounts for purchases shareholders intend to makeover a 13-month period from the date Edward Jones receives the LOI. The LOI is determined by calculating the higher of cost or market value of qualifying holdings at LOI initiation in combination with the value that the shareholder intends to buy over a 13-month period to calculate the front-end sales charge and any breakpoint discounts. Each purchase the shareholder makes during that 13-month period will receive the sales charge and breakpoint discount that applies to the total amount. The inclusion of eligible fund family assets in the LOI calculation is dependent on the shareholder notifying his or her financial advisor of such assets at the time of calculation. Purchases made before the LOI is received by Edward Jones are not covered under the LOI and will not reduce the sales charge previously paid. Sales charges will be adjusted if LOI is not met. |
| Sales charges are waived for the following shareholders and in the following situations at Edward Jones: |
● Associates of Edward Jones and its affiliates and their family members who are in the same pricing group (as determined by Edward Jones under its policies and procedures) as the associate. This waiver will continue for the remainder of the associate’s life if the associate retires from Edward Jones in good-standing. |
● Shares purchased in an Edward Jones fee-based program. |
● Shares purchased through reinvestment of capital gains distributions and dividend reinvestment. |
● Shares purchased from the proceeds of redeemed shares of the same fund family so long as the following conditions are met: 1) the proceeds are from the sale of shares within 60 days of the purchase, and 2) the sale and purchase are made in the same share class and the same account or the purchase is made in an individual retirement account with proceeds from liquidations in anon-retirement account. |
● Shares exchanged into Class A shares from another share class so long as the exchange is into the same fund and was initiated at the discretion of Edward Jones. Edward Jones is responsible for any remaining CDSC due to the fund company, if applicable. Any future purchases are subject to the applicable sales charge as disclosed in the prospectus. |
● Exchanges from Class C shares to Class A shares of the same fund, generally, in the 84th month following the anniversary of the purchase date or earlier at the discretion of Edward Jones. |
| If the shareholder purchases shares that are subject to a CDSC and those shares are redeemed before the CDSC is expired, the shareholder is responsible to pay the CDSC except in the following conditions available at Edward Jones: |
● The death or disability of the shareholder. |
● Systematic withdrawals with up to 10% per year of the account value. |
● Return of excess contributions from an Individual Retirement Account (IRA). |
● Shares sold as part of a required minimum distribution for IRA and retirement accounts if the redemption is taken in or after the year the shareholder reaches qualified age based on applicable IRS regulation. |
● Shares sold to pay Edward Jones fees or costs in such cases where the transaction is initiated by Edward Jones. |
● Shares exchanged in an Edward Jones fee-based program. |
● Shares acquired through NAV reinstatement. |
Wells Fargo California Limited-Term Tax-Free Fund | 43
Appendix I (unaudited)
| Other Important Information for accounts at Edward Jones: |
| Minimum Purchase Amounts |
● $250 initial purchase minimum |
● $50 subsequent purchase minimum |
| Minimum Balances |
| Edward Jones has the right to redeem at its discretion fund holdings with a balance of $250 or less. The following are examples of accounts that are not included in this policy: |
● A fee-based account held on an Edward Jones platform |
● A 529 account held on an Edward Jones platform |
● An account with an active systematic investment plan or letter of intent (LOI) |
| Changing Share Classes |
| At any time it deems necessary, Edward Jones has the authority to exchange at NAV a shareholder’s holdings in a fund to Class A shares. |
44 | Wells Fargo California Limited-Term Tax-Free Fund
Effective June 1, 2020, shareholders purchasing Fund shares through an Oppenheimer & Co. Inc. (“Oppenheimer”) platform or account are eligible only for the following load waivers (front-end sales charge waivers and contingent deferred or back-end, sales charge waivers) and discounts, which may differ from those disclosed in the Fund’s Prospectus or SAI.
| Front-end Sales Load Waivers on Class A Shares available at Oppenheimer |
| Employer-sponsored retirement, deferred compensation and employee benefit plans (including health savings accounts) and trusts used to fund those plans, provided that the shares are not held in a commission-based brokerage account and shares are held for the benefit of the plan. |
| Shares purchased by or through a 529 Plan. |
| Shares purchased through an Oppenheimer affiliated investment advisory program. |
| Shares purchased through reinvestment of capital gains distributions and dividend reinvestment when purchasing shares of the same fund (but not any other fund within the fund family). |
| Shares purchased from the proceeds of redemptions within the same fund family, provided (1) the repurchase occurs within 90 days following the redemption, (2) the redemption and purchase occur in the same account, and (3) redeemed shares were subject to a front-end or deferred sales load (known as Rights of Restatement). |
| A shareholder in the Fund’s Class C shares will have their shares exchanged at net asset value to Class A shares (or the appropriate share class) of the Fund if the shares are no longer subject to a CDSC and the exchange is in line with the policies and procedures of Oppenheimer. |
| Employees and registered representatives of Oppenheimer or its affiliates and their family members. |
| Directors or Trustees of the Fund, and employees of the Fund’s investment adviser or any of its affiliates, as described in the Prospectus. |
| CDSC Waivers on A and C Shares available at Oppenheimer |
| Death or disability of the shareholder. |
| Shares sold as part of a systematic withdrawal plan as described in the Prospectus. |
| Return of excess contributions from an IRA Account. |
| Shares sold as part of a required minimum distribution for IRA and retirement accounts due to the shareholder reaching the qualified age based on applicable IRS regulations as described in the Prospectus. |
| Shares sold to pay Oppenheimer fees but only if the transaction is initiated by Oppenheimer. |
| Shares acquired through a right of reinstatement. |
| Front-end load Discounts Available at Oppenheimer: Breakpoints, Rights of Accumulation & Letters of Intent |
| Breakpoints as described in the Prospectus. |
| Rights of Accumulation (ROA), which entitle shareholders to breakpoint discounts, will be automatically calculated based on the aggregated holding of fund family assets held by accounts within the purchaser’s household at Oppenheimer. Eligible fund family assets not held at Oppenheimer may be included in the ROA calculation only if the shareholder notifies his or her financial advisor about such assets. |
Wells Fargo California Limited-Term Tax-Free Fund | 45
Effective June 15, 2020, shareholders purchasing fund shares through a Robert W. Baird & Co. (“Baird”) platform or account will only be eligible for the following sales charge waivers (front-end sales charge waivers and CDSC waivers) and discounts, which may differ from those disclosed elsewhere in the Fund’s Prospectus or the SAI.
| Front-end Sales Load Waivers on Class A Shares available at Baird |
| Shares purchased through reinvestment of capital gains distributions and dividend reinvestment when purchasing share of the same fund. |
| Share purchase by employees and registers representatives of Baird or its affiliate and their family members as designated by Baird. |
| Shares purchase from the proceeds of redemptions within the same fund family, provided (1) the repurchase occurs within 90 days following the redemption, (2) the redemption and purchase occur in the same accounts, and (3) redeemed shares were subject to a front-end or deferred sales charge (known as rights of reinstatement). |
| A shareholder in the Funds Investor C Shares will have their share exchanged at net asset value to Investor A shares of the fund if the shares are no longer subject to CDSC and the exchange is in line with the policies and procedures of Baird. |
| Employer-sponsored retirement plans or charitable accounts in a transactional brokerage account at Baird, including 401(k) plans, 457 plans, employer-sponsored 403(b) plans, profit sharing and money purchase pension plans and defined benefit plans. For purposes of this provision, employer-sponsored retirement plans do not include SEP IRAs, Simple IRAs or SAR-SEPs. |
| CDSC Waivers on A and C Shares available at Baird |
| Shares sold due to death or disability of the shareholder. |
| Shares sold as part of a systematic withdrawal plan as described in the Fund’s Prospectus. |
| Shares bought due to returns of excess contributions from an IRA Account. |
| Shares sold as part of a required minimum distribution for IRA and retirement accounts due to the shareholder reaching age 72 as described in the Fund’s Prospectus. |
| Shares sold to pay Baird fees but only if the transaction is initiated by Baird. |
| Shares acquired through a right of reinstatement. |
| Front-end load Discounts Available at Baird: Breakpoint and/or Rights of Accumulation |
| Breakpoints as described in the Prospectus. |
| Rights of accumulations which entitles shareholders to breakpoint discounts will be automatically calculated based on the aggregated holding of fund family assets held by accounts within the purchaser’s household at Baird. Eligible fund family assets not held at Baird may be included in the rights of accumulations calculation only if the shareholder notifies his or her financial advisor about such assets. |
| Letters of Intent (LOI) allow for breakpoint discounts based on anticipated purchases within a fund family through Baird, over a 13-month period of time. |
46 | Wells Fargo California Limited-Term Tax-Free Fund
This page is intentionally left blank.
This page is intentionally left blank.
For more information
More information about Wells Fargo Funds is available free upon request. To obtain literature, please write, visit the Fund’s website, or call:
Wells Fargo Funds
P.O. Box 219967
Kansas City, MO 64121-9967
Website: wfam.com
Individual investors: 1-800-222-8222
Retail investment professionals: 1-888-877-9275
Institutional investment professionals: 1-866-765-0778

This report and the financial statements contained herein are submitted for the general information of the shareholders of the Fund. If this report is used for promotional purposes, distribution of the report must be accompanied or preceded by a current prospectus. Before investing, please consider the investment objectives, risks, charges, and expenses of the investment. For a current prospectus and, if available, a summary prospectus, containing this information, call 1-800-222-8222 or visit the Fund’s website at wfam.com. Read the prospectus carefully before you invest or send money.
Wells Fargo Asset Management (WFAM) is the trade name for certain investment advisory/management firms owned by Wells Fargo & Company. These firms include but are not limited to Wells Capital Management Incorporated and Wells Fargo Funds Management, LLC. Certain products managed by WFAM entities are distributed by Wells Fargo Funds Distributor, LLC (a broker-dealer and Member FINRA).
This material is for general informational and educational purposes only and is NOT intended to provide investment advice or a recommendation of any kind—including a recommendation for any specific investment, strategy, or plan.
INVESTMENT PRODUCTS: NOT FDIC INSURED ◾ NO BANK GUARANTEE ◾ MAY LOSE VALUE
© 2020 Wells Fargo & Company. All rights reserved.
PAR-0720-00239 08-20
A248/AR248 06-20

Annual Report
June 30, 2020
Wells Fargo
Intermediate Tax/AMT-Free Fund
Beginning on January 1, 2021, as permitted by new regulations adopted by the Securities and Exchange Commission, paper copies of the Wells Fargo Funds’ annual and semi-annual shareholder reports issued after this date will no longer be sent by mail, unless you specifically request paper copies of the reports. Instead, the reports will be made available on the Funds’ website, and you will be notified by mail each time a report is posted and provided with a website address to access the report.
If you already elected to receive shareholder reports electronically, you will not be affected by this change and you need not take any action. You may elect to receive shareholder reports and other communications from the Fund electronically at any time by contacting your financial intermediary (such as a broker-dealer or bank) or, if you are a direct investor, by calling 1-800-222-8222 or by enrolling at wellsfargo.com/advantagedelivery.
You may elect to receive all future reports in paper free of charge. If you invest through a financial intermediary, you can contact your financial intermediary to request that you continue to receive paper copies of your shareholder reports; if you invest directly with the Fund, you can call 1-800-222-8222. Your election to receive reports in paper will apply to all Wells Fargo Funds held in your account with your financial intermediary or, if you are a direct investor, to all Wells Fargo Funds that you hold.
|
Reduce clutter. Save trees. |
Sign up for electronic delivery of prospectuses and shareholder reports at wellsfargo.com/ |
The views expressed and any forward-looking statements are as of June 30, 2020, unless otherwise noted, and are those of the Fund managers and/or Wells Fargo Asset Management. Discussions of individual securities, or the markets generally, or any Wells Fargo Fund are not intended as individual recommendations. Future events or results may vary significantly from those expressed in any forward-looking statements. The views expressed are subject to change at any time in response to changing circumstances in the market. Wells Fargo Asset Management and the Fund disclaim any obligation to publicly update or revise any views expressed or forward-looking statements.
INVESTMENT PRODUCTS: NOT FDIC INSURED ◾ NO BANK GUARANTEE ◾ MAY LOSE VALUE
Wells Fargo Intermediate Tax/AMT-Free Fund | 1
Letter to shareholders (unaudited)

Andrew Owen
President
Wells Fargo Funds
Dear Shareholder:
We are pleased to offer you this annual report for the Wells Fargo Intermediate Tax/AMT-Free Fund for the 12-month period that ended June 30, 2020. Global stock markets saw earlier gains erased in February and March as governments around the world took unprecedented measures to stop the spread of the coronavirus at the expense of short-term economic output. However, markets rebounded from April through June to offset much of the losses as central banks attempted to bolster capital markets and confidence. Fixed-income markets generally performed better, with most achieving gains. Overall U.S. markets surpassed their international peers, while U.S. large-cap equity, as measured by the Russell 1000® Index1, easily outperformed small caps, as measured by the Russell 2000® Index2, for the 12-month period.
For the 12-month period, fixed-income securities generally had positive total returns while non-U.S. equities had broad losses and U.S. stocks performed strongly despite sharp volatility since late February. For the period, U.S. stocks, based on the S&P 500 Index,3 gained 7.51%. International stocks, as measured by the MSCI ACWI ex USA Index (Net),4 returned -4.80%, while the MSCI EM Index (Net)5 performed slightly better, with a -3.39% return. For bond investors, the Bloomberg Barclays U.S. Aggregate Bond Index6 returned a robust 8.74%, the Bloomberg Barclays Global Aggregate ex-USD Index7 gained a modest 0.71%, and the Bloomberg Barclays Municipal Bond Index8 returned 4.45% while the ICE BofA U.S. High Yield Index9 lost 1.10%.
The fiscal year began on a positive note.
The 12-month period began with the U.S. equity market advancing to new highs in July 2019. U.S. President Donald Trump initially backed off of earlier tariff threats against Mexico and China. However, later in July, the U.S. reversed course and threatened to impose higher tariffs on China’s exports after talks failed. China responded with tariff threats of its own and devalued the renminbi, roiling global markets. Major U.S. stock market indices closed July with the worst weekly results of the year. Bond prices gained as Treasury yields fell to multiyear lows, and the yield curve inverted at multiple points along the 30-year arc, with shorter term yields higher than longer-term. At the end of July, the U.S. Federal Reserve (Fed) cut its federal funds rate by 0.25%.
In August, U.S.-China trade tensions continued with no signs of compromise. Evidence of a continued global economic slowdown mounted, and central banks in China, New Zealand, and Thailand cut interest rates. Industrial and manufacturing data declined in China, Canada, Japan, and Germany. Adding to global uncertainty, Italy’s prime minister resigned,
| 1 | The Russell 1000® Index measures the performance of the 1,000 largest companies in the Russell 3000® Index, which represents approximately 92% of the total market capitalization of the Russell 3000® Index. You cannot invest directly in an index. |
| 2 | The Russell 2000® Index measures the performance of the 2,000 smallest companies in the Russell 3000® Index, which represents approximately 8% of the total market capitalization of the Russell 3000® Index. You cannot invest directly in an index. |
| 3 | The S&P 500 Index consists of 500 stocks chosen for market size, liquidity, and industry group representation. It is a market-value-weighted index with each stock’s weight in the index proportionate to its market value. You cannot invest directly in an index. |
| 4 | The Morgan Stanley Capital International (MSCI) All Country World Index (ACWI) ex USA Index (Net) is a free-float-adjusted market-capitalization-weighted index that is designed to measure the equity market performance of developed and emerging markets, excluding the United States. Source: MSCI. MSCI makes no express or implied warranties or representations and shall have no liability whatsoever with respect to any MSCI data contained herein. The MSCI data may not be further redistributed or used as a basis for other indices or any securities or financial products. This report is not approved, reviewed, or produced by MSCI. You cannot invest directly in an index. |
| 5 | The MSCI Emerging Markets (EM) Index (Net) is a free-float-adjusted market-capitalization-weighted index that is designed to measure equity market performance of emerging markets. You cannot invest directly in an index. |
| 6 | The Bloomberg Barclays U.S. Aggregate Bond Index is a broad-based benchmark that measures the investment-grade, U.S. dollar-denominated, fixed-rate taxable bond market, including Treasuries, government-related and corporate securities, mortgage-backed securities (agency fixed-rate and hybrid adjustable-rate mortgage pass-throughs), asset-backed securities, and commercial mortgage-backed securities. You cannot invest directly in an index. |
| 7 | The Bloomberg Barclays Global Aggregate ex-USD Index is an unmanaged index that provides a broad-based measure of the global investment-grade fixed-income markets excluding the U.S.-dollar-denominated debt market. You cannot invest directly in an index. |
| 8 | The Bloomberg Barclays Municipal Bond Index is an unmanaged index composed of long-term tax-exempt bonds with a minimum credit rating of Baa. You cannot invest directly in an index. |
| 9 | The ICE BofA U.S. High Yield Index is a market-capitalization-weighted index of domestic and Yankee high-yield bonds. The index tracks the performance of high-yield securities traded in the U.S. bond market. You cannot invest directly in an index. Copyright 2020. ICE Data Indices, LLC. All rights reserved. |
2 | Wells Fargo Intermediate Tax/AMT-Free Fund
Letter to shareholders (unaudited)
many feared a crackdown in Hong Kong as protestors sustained their calls for reform, and U.K. Prime Minister Boris Johnson planned to suspend Parliament as Brexit’s deadline neared.
In the U.S., the Fed cut interest rates a second time in September. U.S. manufacturing data disappointed investors. The U.S. Congress announced it would pursue an impeachment investigation of President Trump. Meanwhile, the Brexit impasse showed no signs of resolution. Officials in China said that hitting the country’s economic growth goals for the year would be difficult considering the weight of tariffs and trade restrictions. Although the S&P 500 Index finished the third quarter with the best year-to-date returns in more than 20 years, concerns about future returns remained.
The fourth quarter started on a strong note, with U.S.-China trade tensions relaxing in October along with renewed optimism for a U.K. Brexit deal and positive macroeconomic data. The initial estimate of U.S. third-quarter gross domestic product (GDP) growth was a resilient 1.9% annualized rate, while the U.S. unemployment rate fell to a 50-year low of 3.5% in September. However, despite resilience among U.S. consumers, business confidence declined while manufacturing activity contracted. Concerned with a potential economic slowdown, the Fed lowered interest rates another quarter point in late October—its third rate cut in four months. This helped push the S&P 500 Index to a new all-time high while emerging market equities rallied and global bonds declined overall, reflecting a broad pickup in risk appetite.
Equity markets continued to rally in November despite ongoing geopolitical risks. Hopes for a U.S.-China trade deal buoyed investor confidence. U.S. business sentiment improved slightly, and manufacturing and services activity picked up. While consumer confidence and purchasing manager activity rose in the eurozone, China reported weakening manufacturing and consumer data. Bond yields rose marginally, leading to slightly negative returns for global government and investment-grade corporate bonds.
Financial markets ended 2019 with a boost from the U.S. and China accord on a Phase One trade deal. That, along with the landslide win by the pro-Brexit U.K. Conservative Party in a national election and ongoing central bank support, gave investors greater confidence. U.S. economic indicators were generally positive, with the exception of manufacturing activity and business confidence. Consumer confidence was resilient, fed by a robust labor market, tame inflation, and lower interest rates, which boosted housing affordability and stimulated homebuyer activity. The impeachment of President Trump had little impact on markets. Meanwhile, slowing Chinese economic activity, partly attributable to the trade war, led to further government stimulus at year-end through lower reserve ratios, allowing banks to lend more money.
The year-end rally continued in early January 2020. However, capital market volatility picked up sharply in late January on concerns over the potential impact of the coronavirus on the global economy and stock markets. With sentiment somewhat souring, perceived safe havens did well in January. The U.S. dollar and Japanese yen both rose, and government bonds outperformed equities. While the S&P 500 Index held its ground, emerging market equities tumbled, including those in Asia.
In February, the coronavirus became the major market focus. Fears of the virus’s impact on global growth led to expectations of increased global central bank monetary policy support. That led the 10-year U.S. Treasury yield to fall to an all-time low of 1.1% by the end of the month. Although equity markets initially shrugged off concerns about the outbreak, focusing instead on strong fourth-quarter earnings and improving business confidence in January, market sentiment turned sharply lower toward month-end and the S&P 500 Index lost 8.2% for the month. Oil prices tumbled as Russia and the Organization of the Petroleum Exporting countries compounded a major decline in oil demand with a brutal price war, partly aimed at dissuading further U.S. shale production. As a result, the price of West Texas Intermediate crude oil fell 13% in February.
Wells Fargo Intermediate Tax/AMT-Free Fund | 3
Letter to shareholders (unaudited)
“The global spread of the coronavirus led country after country to clamp down on social and business-related activity in order to contain the virus from causing even greater devastation and overwhelming health care systems.”
“Despite ongoing economic weakness and high levels of uncertainty on the containment of the coronavirus and the timing of an effective vaccine, financial markets continued to post widely positive returns in June.”
The global spread of the coronavirus led country after country to clamp down on social and business-related activity in order to contain the virus from causing even greater devastation and overwhelming health care systems. This abrupt stoppage of economic activity led to the sharp deceleration of global output, sending economies into a deep contraction. Central bank responses were swift, as they slashed interest rates and expanded quantitative easing programs to restore liquidity and confidence to the markets. In the U.S., the Fed introduced several new lending programs, funding investment-grade bonds, money market mutual funds, and commercial paper while purchasing Treasuries, mortgage-backed securities, and overnight repurchase agreements. Meanwhile, stock markets tumbled quickly into a bear market, ending the longest bull stock market in U.S. history.
Markets rebounded strongly in April, with the S&P 500 Index gaining 12.8% for the month and the MSCI ACWI ex USA Index (Net) returning 7.6%. The rebound was fueled by unprecedented government and central bank stimulus measures taken to buffer the economic damage created by mass shutdowns enacted in order to contain the virus’s spread. The U.S. economy contracted by an annualized 5.0% pace in the first quarter, with 30 million new unemployment insurance claims in six weeks. In the eurozone, first-quarter real GDP shrank 3.8%, with the composite April Flash Purchasing Managers’ Index, a monthly survey of purchasing managers, falling to an all-time low of 13.5. The European Central Bank expanded its quantitative easing to include the purchase of additional government bonds of countries with the greatest virus-related need, including Italy and Spain. China’s first-quarter GDP fell by 6.8% year over year. However, retail sales, production, and investment showed signs of recovery. Extreme oil-price volatility continued as global supply far exceeded demand.
In May, the equity market rebound continued, with the S&P 500 Index climbing a further 4.8%. European and Japanese stock markets also had monthly gains. Investors regained confidence on reports of early signs of success in human trials of a coronavirus vaccine. Growth stocks continued to outperform value stocks while returns on global government bonds were generally flat. In the U.S., a gap grew between the stock market rebound and devastating economic data points, including an April unemployment rate of 14.7%, the highest level since World War II. Purchasing managers’ indices continued to reflect weakening activity in May in both the manufacturing and services sectors. U.S. corporate earnings reports indicated a 14% year-over-year contraction in earnings from the first quarter of 2019. However, high demand for technology, driven by remote activity, helped maintain robust information technology sector earnings, which helped drive powerful well-known technology stocks higher.
Despite ongoing economic weakness and high levels of uncertainty on the containment of the coronavirus and the timing of an effective vaccine, financial markets continued to post widely positive returns in June. As economies reopened, there were hopeful signs. U.S. retail sales rose 17% in May while retail sales in the U.K. rebounded by 12%. However, year over year, sales remained depressed. Vitally important to market sentiment was the ongoing commitment by central banks globally to do all they can to provide economic support through liquidity and low borrowing costs. U.S. economic activity was aided by one-time $1,200 stimulus checks and $600 bonus weekly unemployment benefits due to expire at the end of July. However, unemployment remained in the double digits, easing somewhat from 14.7% in April to 11.1% in June. At period-end, numerous states reported alarming increases of coronavirus cases. China’s economic recovery picked up momentum in June, though it remained far from a full recovery.
4 | Wells Fargo Intermediate Tax/AMT-Free Fund
Letter to shareholders (unaudited)
Don’t let short-term uncertainty derail long-term investment goals.
Periods of investment uncertainty can present challenges, but experience has taught us that maintaining long-term investment goals can be an effective way to plan for the future. To help you create a sound strategy based on your personal goals and risk tolerance, Wells Fargo Funds offers more than 100 mutual funds spanning a wide range of asset classes and investment styles. Although diversification cannot guarantee an investment profit or prevent losses, we believe it can be an effective way to manage investment risk and potentially smooth out overall portfolio performance. We encourage investors to know their investments and to understand that appropriate levels of risk-taking may unlock opportunities.
Thank you for choosing to invest with Wells Fargo Funds. We appreciate your confidence in us and remain committed to helping you meet your financial needs.
Sincerely,

Andrew Owen
President
Wells Fargo Funds
|
For further information about your Fund, contact your investment professional, visit our website at wfam.com, or call us directly at 1-800-222-8222. |
Notice to Shareholders
At a meeting held on August 10-12, 2020, the Board of Trustees of the Fund approved a change to the Fund’s automatic conversion feature for Class C shares in order to shorten the required holding period from 10 to 8 years. As a result, on a monthly basis beginning November 5, 2020, Class C shares will convert automatically into Class A shares 8 years after the initial date of purchase or, if you acquired your Class C shares through an exchange or conversion from another share class, 8 years after the date you acquired your Class C shares. When Class C shares that you acquired through a purchase or exchange convert, any other Class C shares that you purchased with reinvested dividends and distributions also will convert into Class A shares on a pro rata basis.
Please note that a shorter holding period may apply depending on your intermediary. Please see “Appendix A—Sales Charge Reductions and Waivers for Certain Intermediaries” in the Fund’s prospectus for further information.
Wells Fargo Intermediate Tax/AMT-Free Fund | 5
Performance highlights (unaudited)
Investment objective
The Fund seeks current income exempt from federal income tax.
Manager
Wells Fargo Funds Management, LLC
Subadviser
Wells Capital Management Incorporated
Portfolio managers
Bruce R. Johns
Robert J. Miller
Adrian Van Poppel
Average annual total returns (%) as of June 30, 2020
| Including sales charge | Excluding sales charge | Expense ratios1 (%) | ||||||||||||||||||||||||||||||||
| Inception date | 1 year | 5 year | 10 year | 1 year | 5 year | 10 year | Gross | Net2 | ||||||||||||||||||||||||||
| Class A (WFTAX) | 7-31-2007 | -0.36 | 2.18 | 3.18 | 2.72 | 2.80 | 3.49 | 0.80 | 0.70 | |||||||||||||||||||||||||
| Class C (WFTFX) | 7-31-2007 | 0.95 | 2.03 | 2.72 | 1.95 | 2.03 | 2.72 | 1.55 | 1.45 | |||||||||||||||||||||||||
| Class R6 (WFRTX)3 | 7-31-2018 | – | – | – | 3.11 | 3.08 | 3.78 | 0.42 | 0.40 | |||||||||||||||||||||||||
| Administrator Class (WFITX) | 3-31-2008 | – | – | – | 2.82 | 2.90 | 3.60 | 0.74 | 0.60 | |||||||||||||||||||||||||
| Institutional Class (WITIX) | 3-31-2008 | – | – | – | 2.97 | 3.06 | 3.77 | 0.47 | 0.45 | |||||||||||||||||||||||||
| Bloomberg Barclays Municipal Bond 1-15 Year Blend Index4 | – | – | – | – | 4.18 | 3.42 | 3.59 | – | – | |||||||||||||||||||||||||
Figures quoted represent past performance, which is no guarantee of future results, and do not reflect taxes that a shareholder may pay on an investment in a fund. Investment return and principal value of an investment will fluctuate so that an investor’s shares, when redeemed, may be worth more or less than their original cost. Performance shown without sales charges would be lower if sales charges were reflected. Current performance may be lower or higher than the performance data quoted, which assumes the reinvestment of dividends and capital gains. Current month-end performance is available on the Fund’s website, wfam.com.
Index returns do not include transaction costs associated with buying and selling securities, any mutual fund fees or expenses, or any taxes. It is not possible to invest directly in an index.
For Class A shares, the maximum front-end sales charge is 3.00%. For Class C shares, the maximum contingent deferred sales charge is 1.00%. Performance including a contingent deferred sales charge assumes the sales charge for the corresponding time period. Class R6, Administrator Class, and Institutional shares are sold without a front-end sales charge or contingent deferred sales charge.
Bond values fluctuate in response to the financial condition of individual issuers, general market and economic conditions, and changes in interest rates. Changes in market conditions and government policies may lead to periods of heightened volatility in the bond market and reduced liquidity for certain bonds held by the Fund. In general, when interest rates rise, bond values fall and investors may lose principal value. Interest rate changes and their impact on the Fund and its share price can be sudden and unpredictable. The use of derivatives may reduce returns and/or increase volatility. Certain investment strategies tend to increase the total risk of an investment (relative to the broader market). The Fund is exposed to high-yield securities risk and municipal securities risk. Consult the Fund’s prospectus for additional information on these and other risks. A portion of the Fund’s income may be subject to federal, state, and/or local income taxes or the Alternative Minimum Tax (AMT). Any capital gains distributions may be taxable.
Please see footnotes on page 7.
6 | Wells Fargo Intermediate Tax/AMT-Free Fund
Performance highlights (unaudited)
| Growth of $10,000 investment as of June 30, 20205 |
|
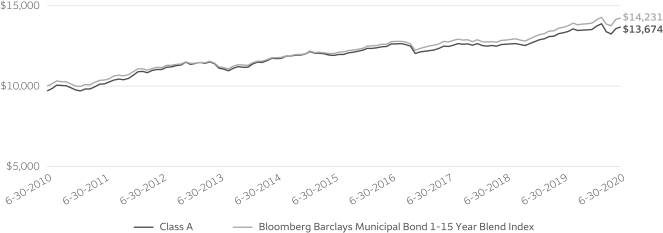
| 1 | Reflects the expense ratios as stated in the most recent prospectuses. The expense ratios shown are subject to change and may differ from the annualized expense ratios shown in the financial highlights of this report. |
| 2 | The manager has contractually committed through October 31, 2020, to waive fees and/or reimburse expenses to the extent necessary to cap total annual fund operating expenses after fee waivers at 0.70% for Class A, 1.45% for Class C, 0.40% for Class R6, 0.60% for Administrator Class, and 0.45% for Institutional Class. Brokerage commissions, stamp duty fees, interest, taxes, acquired fund fees and expenses (if any), and extraordinary expenses are excluded from the expense caps. Prior to or after the commitment expiration date, the caps may be increased or the commitment to maintain the caps may be terminated only with the approval of the Board of Trustees. Without these caps, the Fund’s returns would have been lower. The expense ratio paid by an investor is the net expense ratio (the total annual fund operating expenses after fee waivers) as stated in the prospectuses. |
| 3 | Historical performance shown for the Class R6 shares prior to their inception reflects the performance of the Institutional Class shares, and includes the higher expenses applicable to the Institutional Class shares. If these expenses had not been included, returns for the Class R6 shares would be higher. |
| 4 | The Bloomberg Barclays Municipal Bond 1–15 Year Blend Index is the 1–15 year component of the Bloomberg Barclays Municipal Bond Index. The Bloomberg Barclays Municipal Bond Index is an unmanaged index composed of long-term tax-exempt bonds with a minimum credit rating of Baa. You cannot invest directly in an index. |
| 5 | The chart compares the performance of Class A shares for the most recent ten years with the Bloomberg Barclays Municipal Bond 1–15 Year Blend Index. The chart assumes a hypothetical $10,000 investment in Class A shares and reflects all operating expenses and assumes the maximum initial sales charge of 3.00%. |
| 6 | Amounts are calculated based on the long-term total investments of the Fund. These amounts are subject to change and may have changed since the date specified. |
| 7 | The credit quality distribution of portfolio holdings reflected in the chart is based on ratings from Standard & Poor’s, Moody’s Investors Service, and/or Fitch Ratings Ltd. Credit quality ratings apply to the underlying holdings of the Fund and not to the Fund itself. The percentages of the Fund’s portfolio with the ratings depicted in the chart are calculated based on the total market value of fixed income securities held by the Fund. If a security was rated by all three rating agencies, the middle rating was utilized. If rated by two of three rating agencies, the lower rating was utilized, and if rated by one of the rating agencies, that rating was utilized. Standard & Poor’s rates the creditworthiness of bonds, ranging from AAA (highest) to D (lowest). Ratings from A to CCC may be modified by the addition of a plus (+) or minus (-) sign to show relative standing within the rating categories. Standard & Poor’s rates the creditworthiness of short-term notes from SP-1 (highest) to SP-3 (lowest). Moody’s rates the creditworthiness of bonds, ranging from Aaa (highest) to C (lowest). Ratings Aa to B may be modified by the addition of a number 1 (highest) to 3 (lowest) to show relative standing within the ratings categories. Moody’s rates the creditworthiness of short-term U.S. tax-exempt municipal securities from MIG 1/VMIG 1 (highest) to SG (lowest). Fitch rates the creditworthiness of bonds, ranging from AAA (highest) to D (lowest). Credit quality distribution is subject to change and may have changed since the date specified. |
Wells Fargo Intermediate Tax/AMT-Free Fund | 7
Performance highlights (unaudited)
MANAGER’S DISCUSSION
Fund highlights
| ∎ | The Fund underperformed its benchmark, the Bloomberg Barclays Municipal Bond 1–15 Year Blend Index, for the 12-month period that ended June 30, 2020. |
| ∎ | We tactically moved duration around during the period from modestly short to modestly long relative to the benchmark. Overall duration positioning during the period had no material impact on performance. |
| ∎ | Yield-curve positioning was a very modest detractor from performance as the yield curve steepened over the period. |
| ∎ | Credit positioning detracted from performance as we were overweight lower-investment-grade bonds (A-rated and BBB-rated) relative to higher-investment-grade bonds (AAA-rated and AA-rated). Higher-grade bonds outperformed over the period. |
| ∎ | Sector allocation was modestly positive, while security selection detracted from performance. Overweights to local general obligation (GO) and education bonds aided performance as did underweights to the housing, hospital, industrial development revenue/pollution control revenue, and transportation sectors. Despite the overweights to the local GO and education sectors, selection within the sectors was not optimal. |
| Effective maturity distribution as of June 30, 20206 |
|
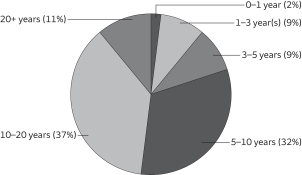
The coronavirus pandemic and the associated containment efforts became the dominant market influence over the 12-month period.
In 2019, market expectations moved the U.S. Federal Reserve (Fed) from a rate-hiking posture to multiple cuts in what was considered a “mid-cycle adjustment” at the time. Generally positive U.S. economic data was enough for most investors to expect continued slow growth and an extension of the economic expansion. Global trade tensions prompted a rise in market volatility, which subsided with the passage of a Phase One U.S.-China trade deal late in the calendar year. President Trump was formally impeached and ultimately acquitted by the U.S. Senate. By March, the coronavirus pandemic brought an end to the longest bull market on record.
The municipal bond market was heavily influenced by technical factors throughout the reporting period. Municipal mutual funds saw 61 straight weeks of net inflows, which pushed yields across ratings categories to all-time lows by late February. Low yields and ample demand drove municipal issuance higher but also altered the mix. Taxable municipal bonds as a proportion of new-issue municipal debt was at its highest level since 2010 by period-end. Pandemic-related volatility and liquidity pressures prompted record-setting outflows from municipal bonds in March. Strong support by the Fed, including a Municipal Liquidity Facility and more than $2.5 trillion in fiscal stimulus, buoyed markets and bolstered investor confidence. Several weeks of consecutive positive net flows for municipal funds and strong demand for new bonds drove yields back near the lows for highly rated issues. The period ended with the Fed pledging to keep short rates low for the foreseeable future, and the fundamental outlook for municipal issuers came into question as the path of recovery from the virus remains extraordinarily uncertain.
| Credit quality as of June 30, 20207 |
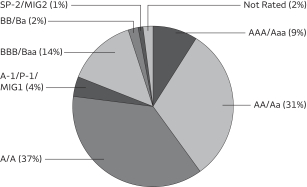 |
Factors across the market influenced Fund performance.
Coming into the year, municipal bonds had positive momentum in terms of technical factors, with reduced tax-exempt supply and positive fund flows. In fact, until the market volatility in March, the industry had more than 60 weeks of positive flows. This caused a supply/demand imbalance, which drove rates down and credit spreads tighter. There was a clear disconnect between technicals and fundamentals as investors reached for income wherever they could find it, which resulted in credit spreads near all-time tights and a very flat yield curve.
Please see footnotes on page 7.
8 | Wells Fargo Intermediate Tax/AMT-Free Fund
Performance highlights (unaudited)
As the year began, we continued an up-in-quality trade as we believed that higher-investment-grade bonds represented better relative value and that credit spreads were vulnerable as the economy slowed. Despite this, we chose to keep a moderate overweight to lower-investment-grade bonds, especially those that were seasoned and that we believed had good total return characteristics. In terms of the curve, we had been moving from a barbell structure, with greater exposure to both shorter- and longer-duration bonds to more key rate positions along the curve. We were a little early to this trade, and it was a modest detractor over the first half, although duration positioning contributed to relative performance over the full period.
The beginning of the second half of the year was a continuation of the first half. We did not reverse course, as we felt the market was ripe for correction. We did not anticipate that the country’s response to the pandemic would be the catalyst for a correction, but we were well positioned for it with duration short to the benchmark and higher overall credit quality, plus we had removed most of the barbell and had lightened up on credits that we thought would be vulnerable in an economic downturn. The market rally through February exceeded most market participants’ forecasts for the entire year.
March was a turning point for the market, and after 61 weeks of positive fund flows, which were supportive of municipal valuations, outflows began and were extreme as the risk-off trade took hold. According to Lipper, for the week of March 18, there were outflows of $12.2 billion, a new record that was broken the following week, with a $13.7 billion outflow. The Fund experienced outflows as well, but we were not forced sellers, as we had been maintaining about 5% cash equivalents in the portfolio.
With the markets in disarray and the short end of the market seizing up, the Fed began unprecedented support, first by cutting rates and then by announcing open-ended quantitative easing and targeted help to the municipal market through the Money Market Liquidity Facility and the Municipal Liquidity Facility. Not to be outdone, Congress passed four packages for about $3 trillion in aid across the economy.
This stabilized the markets, and by mid-April, the municipal market was on solid ground. High-grade bonds were in demand, but lower-investment-grade and high-yield bond spreads remained wide, as did certain sectors, including transportation, education, and hospitals. We took advantage of this dislocation and began adding to lower-investment-grade paper in late March that had been vetted by our analytical team and mispriced in the market, buying names such as New York Metropolitan Transportation Authority, King County Public Hospital District (WA), and Hillsborough County Aviation Authority (Tampa). We also used this opportunity to extend duration and focus on what we believed to be the sweet spot of the curve (12 to 15 years). Lower-investment-grade paper continued to lag through early June but caught a bid and did well late in the month. Rates for high-grade paper are now at or near historic lows and credit spreads are tightening rapidly as technical factors once again drive the market higher in price.
Rates are likely to remain low over the foreseeable future. Rating downgrades are expected, but defaults in the investment-grade space are expected to remain rare.
The longest economic expansion in history is over. The economic impact of the pandemic worldwide and nationally has yet to be fully realized. As we reopen the economy, we will see a boost versus the lows of April, but economic activity is likely to remain muted and pressure more troubled credits. Most states and municipalities came into this in the best financial shape they’ve been in for decades, notwithstanding the pension challenges of certain issuers. Municipal issuers have a long history of managing through deep recessions, and many have already cut expenses, furloughed employees, and prepared to raise taxes. That doesn’t mean it will be easy. We have seen and will continue to see a deterioration of credit quality and resultant downgrades, but we don’t believe that will result in a material increase in defaults in the investment-grade space. We believe credit and individual security selection will be key drivers over the next year, and we will rely heavily on our deep analytical bench for exhaustive bottom-up analysis. We expect to manage duration tactically, moving between 95% and 105% of benchmark depending on technical factors and market opportunities. We will not be making wholesale sector changes but will look for prospects on a name-by-name basis across sectors, seeking credits that our analysts have vetted and that represent a strong relative-value opportunity.
Please see footnotes on page 7.
Wells Fargo Intermediate Tax/AMT-Free Fund | 9
Fund expenses (unaudited)
As a shareholder of the Fund, you incur two types of costs: (1) transaction costs, including sales charges (loads) on purchase payments and contingent deferred sales charges (if any) on redemptions and (2) ongoing costs, including management fees, distribution (12b-1) and/or shareholder servicing fees, and other Fund expenses. This example is intended to help you understand your ongoing costs (in dollars) of investing in the Fund and to compare these costs with the ongoing costs of investing in other mutual funds.
The example is based on an investment of $1,000 invested at the beginning of the six-month period and held for the entire period from January 1, 2020 to June 30, 2020.
Actual expenses
The “Actual” line of the table below provides information about actual account values and actual expenses. You may use the information in this line, together with the amount you invested, to estimate the expenses that you paid over the period. Simply divide your account value by $1,000 (for example, an $8,600 account value divided by $1,000 = 8.6), then multiply the result by the number in the “Actual” line under the heading entitled “Expenses paid during period” for your applicable class of shares to estimate the expenses you paid on your account during this period.
Hypothetical example for comparison purposes
The “Hypothetical” line of the table below provides information about hypothetical account values and hypothetical expenses based on the Fund’s actual expense ratio and an assumed rate of return of 5% per year before expenses, which is not the Fund’s actual return. The hypothetical account values and expenses may not be used to estimate the actual ending account balance or expenses you paid for the period. You may use this information to compare the ongoing costs of investing in the Fund and other funds. To do so, compare this 5% hypothetical example with the 5% hypothetical examples that appear in the shareholder reports of the other funds.
Please note that the expenses shown in the table are meant to highlight your ongoing costs only and do not reflect any transactional costs, such as sales charges (loads) and contingent deferred sales charges. Therefore, the “Hypothetical” line of the table is useful in comparing ongoing costs only and will not help you determine the relative total costs of owning different funds. In addition, if these transactional costs were included, your costs would have been higher.
| Beginning account value 1-1-2020 | Ending account value 6-30-2020 | Expenses paid during the period1 | Annualized net expense ratio | |||||||||||||
Class A | ||||||||||||||||
Actual | $ | 1,000.00 | $ | 1,010.73 | $ | 3.45 | 0.69 | % | ||||||||
Hypothetical (5% return before expenses) | $ | 1,000.00 | $ | 1,021.43 | $ | 3.47 | 0.69 | % | ||||||||
Class C | ||||||||||||||||
Actual | $ | 1,000.00 | $ | 1,006.94 | $ | 7.24 | 1.45 | % | ||||||||
Hypothetical (5% return before expenses) | $ | 1,000.00 | $ | 1,017.65 | $ | 7.27 | 1.45 | % | ||||||||
Class R6 | ||||||||||||||||
Actual | $ | 1,000.00 | $ | 1,012.20 | $ | 2.00 | 0.40 | % | ||||||||
Hypothetical (5% return before expenses) | $ | 1,000.00 | $ | 1,022.87 | $ | 2.01 | 0.40 | % | ||||||||
Administrator Class | ||||||||||||||||
Actual | $ | 1,000.00 | $ | 1,011.20 | $ | 3.00 | 0.60 | % | ||||||||
Hypothetical (5% return before expenses) | $ | 1,000.00 | $ | 1,021.88 | $ | 3.02 | 0.60 | % | ||||||||
Institutional Class | ||||||||||||||||
Actual | $ | 1,000.00 | $ | 1,011.95 | $ | 2.25 | 0.45 | % | ||||||||
Hypothetical (5% return before expenses) | $ | 1,000.00 | $ | 1,022.63 | $ | 2.26 | 0.45 | % | ||||||||
| 1 | Expenses paid is equal to the annualized net expense ratio of each class multiplied by the average account value over the period, multiplied by the number of days in the most recent fiscal half-year divided by the number of days in the fiscal year (to reflect the one-half-year period). |
10 | Wells Fargo Intermediate Tax/AMT-Free Fund
Portfolio of investments—June 30, 2020
| Interest rate | Maturity date | Principal | Value | |||||||||||||
| Municipal Obligations: 99.60% |
| |||||||||||||||
Alabama: 1.32% |
| |||||||||||||||
| Education Revenue: 0.17% | ||||||||||||||||
Auburn AL Refunding Bond Series A | 4.00 | % | 6-1-2033 | $ | 1,000,000 | $ | 1,128,280 | |||||||||
University of West Alabama General Fee Bond (AGM Insured) | 4.00 | 1-1-2031 | 500,000 | 578,830 | ||||||||||||
University of West Alabama General Fee Bond (AGM Insured) | 4.00 | 1-1-2033 | 595,000 | 678,913 | ||||||||||||
University of West Alabama General Fee Bond (AGM Insured) | 4.00 | 1-1-2035 | 865,000 | 978,540 | ||||||||||||
University of West Alabama General Fee Bond (AGM Insured) | 4.00 | 1-1-2037 | 920,000 | 1,031,854 | ||||||||||||
| 4,396,417 | ||||||||||||||||
|
| |||||||||||||||
| Health Revenue: 0.06% | ||||||||||||||||
Alabama Health Care Authority for Baptist Health Series B ø | 1.32 | 11-1-2042 | 1,500,000 | 1,500,000 | ||||||||||||
|
| |||||||||||||||
| Tax Revenue: 0.09% | ||||||||||||||||
Alabama Federal Aid Highway Finance Authority Series A | 5.00 | 9-1-2035 | 2,000,000 | 2,411,700 | ||||||||||||
|
| |||||||||||||||
| Utilities Revenue: 1.00% | ||||||||||||||||
Alabama Black Belt Energy Gas District Project #5 Series A | 4.00 | 10-1-2049 | 3,000,000 | 3,459,240 | ||||||||||||
Lower Alabama Gas Supply District Project #2 | 4.00 | 12-1-2050 | 11,430,000 | 13,005,740 | ||||||||||||
Southeast Alabama Gas Supply District Project #2 Series B (1 Month LIBOR +0.85%) ± | 0.97 | 6-1-2049 | 10,000,000 | 9,762,900 | ||||||||||||
| 26,227,880 | ||||||||||||||||
|
| |||||||||||||||
| 34,535,997 | ||||||||||||||||
|
| |||||||||||||||
| Alaska: 0.20% | ||||||||||||||||
| Industrial Development Revenue: 0.04% | ||||||||||||||||
Valdez AK Marine Terminal BP Pipelines Project Series B | 5.00 | 1-1-2021 | 1,000,000 | 1,018,780 | ||||||||||||
|
| |||||||||||||||
| Miscellaneous Revenue: 0.16% | ||||||||||||||||
Matanuska Susitna Borough AK Goode Creek Correctional Project | 4.00 | 9-1-2030 | 3,870,000 | 4,270,235 | ||||||||||||
|
| |||||||||||||||
| 5,289,015 | ||||||||||||||||
|
| |||||||||||||||
Arizona: 2.03% |
| |||||||||||||||
| Education Revenue: 0.46% | ||||||||||||||||
Arizona Board of Regents University of Arizona System Series A | 5.00 | 6-1-2037 | 2,645,000 | 3,404,882 | ||||||||||||
McAllister AZ Arizona State University Hassayampa Academic Village Project | 5.00 | 7-1-2025 | 750,000 | 903,878 | ||||||||||||
Pima County AZ Community College District Series 2019 | 5.00 | 7-1-2033 | 450,000 | 570,735 | ||||||||||||
Pima County AZ Community College District Series 2019 | 5.00 | 7-1-2034 | 500,000 | 632,555 | ||||||||||||
Pima County AZ Community College District Series 2019 | 5.00 | 7-1-2035 | 600,000 | 756,042 | ||||||||||||
Pima County AZ Community College District Series 2019 | 5.00 | 7-1-2036 | 500,000 | 627,615 | ||||||||||||
Pima County AZ IDA New Plan Learning Project Series A | 7.00 | 7-1-2021 | 185,000 | 184,526 | ||||||||||||
Pima County AZ IDA New Plan Learning Project Series A | 7.75 | 7-1-2035 | 4,910,000 | 4,803,846 | ||||||||||||
| 11,884,079 | ||||||||||||||||
|
| |||||||||||||||
| GO Revenue: 0.39% | ||||||||||||||||
Estrella Mountain Ranch AZ Community Facilities District Refunding Bond (AGM Insured) | 5.00 | 7-15-2025 | 585,000 | 700,339 | ||||||||||||
Maricopa County AZ Elementary School District #28 Kyrene Elementary School Project 2010 Series B | 4.50 | 7-1-2024 | 1,575,000 | 1,771,229 | ||||||||||||
Maricopa County AZ Elementary School District #28 Kyrene Elementary School Project 2010 Series B | 4.50 | 7-1-2025 | 1,270,000 | 1,428,229 | ||||||||||||
Maricopa County AZ Elementary School District #28 Kyrene Elementary School Project 2010 Series B | 5.00 | 7-1-2027 | 420,000 | 478,586 | ||||||||||||
The accompanying notes are an integral part of these financial statements.
Wells Fargo Intermediate Tax/AMT-Free Fund | 11
Portfolio of investments—June 30, 2020
| Interest rate | Maturity date | Principal | Value | |||||||||||||
| GO Revenue (continued) | ||||||||||||||||
Maricopa County AZ Elementary School District #28 Kyrene Elementary School Project 2010 Series B | 5.50 | % | 7-1-2029 | $ | 960,000 | $ | 1,108,214 | |||||||||
Phoenix AZ | 5.00 | 7-1-2026 | 3,810,000 | 4,758,119 | ||||||||||||
| 10,244,716 | ||||||||||||||||
|
| |||||||||||||||
| Health Revenue: 0.09% | ||||||||||||||||
Arizona Health Facilities Authority Banner Health Series F (JPMorgan Chase & Company LOC) ø | 0.11 | 1-1-2029 | 1,250,000 | 1,250,000 | ||||||||||||
Maricopa County AZ IDA Bond | 5.00 | 1-1-2048 | 1,000,000 | 1,155,130 | ||||||||||||
| 2,405,130 | ||||||||||||||||
|
| |||||||||||||||
| Miscellaneous Revenue: 0.66% | ||||||||||||||||
Arizona Refunding Bond Certificate of Participation | 5.00 | 9-1-2027 | 3,040,000 | 3,663,382 | ||||||||||||
Phoenix AZ Civic Improvement Corporation Series A | 5.00 | 7-1-2029 | 5,000,000 | 5,000,000 | ||||||||||||
Phoenix AZ Civic Improvement Corporation Series D | 5.00 | 7-1-2024 | 190,000 | 220,784 | ||||||||||||
Phoenix AZ Civic Improvement Corporation Series D | 5.00 | 7-1-2036 | 7,000,000 | 8,365,490 | ||||||||||||
| 17,249,656 | ||||||||||||||||
|
| |||||||||||||||
| Tax Revenue: 0.33% | ||||||||||||||||
Arizona Sports & Tourism Authority Series A | 4.00 | 7-1-2020 | 1,365,000 | 1,365,000 | ||||||||||||
Arizona Sports & Tourism Authority Series A | 5.00 | 7-1-2021 | 795,000 | 822,038 | ||||||||||||
Arizona Sports & Tourism Authority Series A | 5.00 | 7-1-2022 | 1,000,000 | 1,065,550 | ||||||||||||
San Luis AZ Pledged Excise Tax Series A (BAM Insured) | 5.00 | 7-1-2027 | 450,000 | 519,071 | ||||||||||||
San Luis AZ Pledged Excise Tax Series A (BAM Insured) | 5.00 | 7-1-2028 | 700,000 | 804,482 | ||||||||||||
San Luis AZ Pledged Excise Tax Series A (BAM Insured) | 5.00 | 7-1-2034 | 3,680,000 | 4,152,365 | ||||||||||||
| 8,728,506 | ||||||||||||||||
|
| |||||||||||||||
| Utilities Revenue: 0.10% | ||||||||||||||||
Salt River Project AZ Electric System Revenue Bond 2017 Series A | 5.00 | 1-1-2034 | 2,000,000 | 2,542,520 | ||||||||||||
|
| |||||||||||||||
| 53,054,607 | ||||||||||||||||
|
| |||||||||||||||
California: 6.14% |
| |||||||||||||||
| Airport Revenue: 0.42% | ||||||||||||||||
Sacramento CA Airport System Senior Bond | 5.00 | 7-1-2025 | 2,000,000 | 2,006,860 | ||||||||||||
Sacramento CA Airport System Senior Bond Series A | 5.00 | 7-1-2026 | 1,315,000 | 1,583,983 | ||||||||||||
Sacramento CA Airport System Senior Bond Series A | 5.00 | 7-1-2041 | 395,000 | 450,328 | ||||||||||||
Sacramento CA Airport System Senior Bond Series B | 5.00 | 7-1-2032 | 600,000 | 727,746 | ||||||||||||
Sacramento CA Airport System Senior Bond Series B | 5.00 | 7-1-2033 | 500,000 | 603,105 | ||||||||||||
Sacramento CA Airport System Senior Bond Series B | 5.00 | 7-1-2034 | 1,000,000 | 1,203,190 | ||||||||||||
Sacramento CA Airport System Senior Bond Series E | 5.00 | 7-1-2026 | 750,000 | 901,028 | ||||||||||||
Sacramento CA Airport System Senior Bond Series E | 5.00 | 7-1-2027 | 1,750,000 | 2,142,403 | ||||||||||||
Sacramento CA Airport System Senior Bond Series E | 5.00 | 7-1-2028 | 1,000,000 | 1,246,830 | ||||||||||||
| 10,865,473 | ||||||||||||||||
|
| |||||||||||||||
| Education Revenue: 0.28% | ||||||||||||||||
California Statewide CDA Series A | 6.90 | 8-1-2031 | 1,670,000 | 1,750,561 | ||||||||||||
University of California General Project Unrefunded Bond Series Q | 5.25 | 5-15-2024 | 65,000 | 65,261 | ||||||||||||
University of California Limited Project Unrefunded Bond Series G | 5.00 | 5-15-2037 | 5,210,000 | 5,617,057 | ||||||||||||
| 7,432,879 | ||||||||||||||||
|
| |||||||||||||||
| GO Revenue: 2.65% | ||||||||||||||||
California | 5.25 | 3-1-2030 | 1,440,000 | 1,445,429 | ||||||||||||
California | 6.00 | 3-1-2033 | 525,000 | 527,357 | ||||||||||||
The accompanying notes are an integral part of these financial statements.
12 | Wells Fargo Intermediate Tax/AMT-Free Fund
Portfolio of investments—June 30, 2020
| Interest rate | Maturity date | Principal | Value | |||||||||||||
| GO Revenue (continued) | ||||||||||||||||
California Various Purposes | 5.00 | % | 8-1-2030 | $ | 1,575,000 | $ | 1,952,953 | |||||||||
California Various Purposes | 5.00 | 8-1-2032 | 6,700,000 | 8,227,667 | ||||||||||||
Cerritos CA Community College District CAB Series D ¤ | 0.00 | 8-1-2025 | 1,800,000 | 1,726,380 | ||||||||||||
Compton CA Community College District Election of 2002 CAB Series C ¤ | 0.00 | 8-1-2029 | 1,565,000 | 1,350,470 | ||||||||||||
Compton CA Community College District Election of 2002 CAB Series C ¤ | 0.00 | 8-1-2031 | 2,400,000 | 1,951,752 | ||||||||||||
Emery CA Unified School District Election of 2010 Series A (AGM Insured) | 6.25 | 8-1-2031 | 4,500,000 | 4,791,690 | ||||||||||||
Los Angeles CA Unified School District Los Angeles County Series RYQ | 4.00 | 7-1-2037 | 2,000,000 | 2,388,400 | ||||||||||||
Monterey County CA Alisal Union School District Series A (BAM Insured) | 5.25 | 8-1-2042 | 1,500,000 | 1,827,675 | ||||||||||||
New Haven CA Unified School District CAB Project (AGC Insured) ¤ | 0.00 | 8-1-2033 | 5,590,000 | 4,331,412 | ||||||||||||
Northern Humboldt CA High School District Election of 2010 Series A | 6.50 | 8-1-2034 | 1,145,000 | 1,221,658 | ||||||||||||
Oakland CA Unified School District Alameda County Election of 2012 | 6.25 | 8-1-2028 | 2,000,000 | 2,128,500 | ||||||||||||
Oakland CA Unified School District Alameda County Election of 2012 | 6.25 | 8-1-2030 | 2,000,000 | 2,128,500 | ||||||||||||
Oxnard CA School District Series A (National Insured) | 5.75 | 8-1-2030 | 1,825,000 | 2,034,948 | ||||||||||||
Patterson CA Unified School District CAB Election of 2008 Project Series B (AGM Insured) ¤ | 0.00 | 8-1-2033 | 3,000,000 | 2,265,120 | ||||||||||||
Peralta CA Community College District Alameda County | 5.00 | 8-1-2023 | 3,045,000 | 3,334,488 | ||||||||||||
Peralta CA Community College District Alameda County | 5.00 | 8-1-2024 | 3,000,000 | 3,281,280 | ||||||||||||
Rio Hondo CA Community College District ¤ | 0.00 | 8-1-2030 | 2,315,000 | 1,961,337 | ||||||||||||
San Diego CA Community College District Election of 2012 | 5.00 | 8-1-2032 | 3,095,000 | 3,535,573 | ||||||||||||
San Diego CA Unified School District Election of 1998 Series E-2 (AGM Insured) | 5.50 | 7-1-2027 | 5,000,000 | 6,628,050 | ||||||||||||
Sylvan CA Unified School District CAB Election of 2006 (AGM Insured) ¤ | 0.00 | 8-1-2031 | 2,590,000 | 2,134,212 | ||||||||||||
Sylvan CA Unified School District CAB Election of 2006 (AGM Insured) ¤ | 0.00 | 8-1-2032 | 2,800,000 | 2,233,112 | ||||||||||||
Tustin CA Unified School District #88-1 Election of 2008 Series B | 6.00 | 8-1-2036 | 1,500,000 | 1,593,180 | ||||||||||||
West Contra Costa CA Unified School District Election of 2005 Series C-1 (AGC Insured) ¤ | 0.00 | 8-1-2026 | 4,620,000 | 4,276,226 | ||||||||||||
| 69,277,369 | ||||||||||||||||
|
| |||||||||||||||
| Health Revenue: 1.25% | ||||||||||||||||
California Municipal Finance Authority Institute of Aging Project | 5.00 | 8-15-2032 | 975,000 | 1,202,760 | ||||||||||||
California Municipal Finance Authority Institute of Aging Project | 5.00 | 8-15-2033 | 1,150,000 | 1,411,993 | ||||||||||||
California Statewide CDA Series C | 5.25 | 8-15-2031 | 3,000,000 | 3,138,510 | ||||||||||||
California Tender Option Bond Trust Receipts/Floater Certificates Series 2017-XG0119 (Deutsche Bank LOC, Deutsche Bank LIQ) 144Aø | 0.28 | 7-1-2044 | 10,000,000 | 10,000,000 | ||||||||||||
University of California Medical Center Prerefunded Bond Series J | 5.25 | 5-15-2030 | 13,135,000 | 14,930,423 | ||||||||||||
University of California Medical Center Unrefunded Bond Series J | 5.25 | 5-15-2030 | 1,865,000 | 2,083,336 | ||||||||||||
| 32,767,022 | ||||||||||||||||
|
| |||||||||||||||
| Housing Revenue: 0.04% | ||||||||||||||||
California HFA Municipal Certificate of Participation Series 2 Class A | 4.00 | 3-20-2033 | 992,528 | 1,063,861 | ||||||||||||
|
| |||||||||||||||
| Miscellaneous Revenue: 0.26% | ||||||||||||||||
Anaheim CA PFA Convention Center Expansion Project Series A | 5.00 | 5-1-2039 | 2,500,000 | 2,743,950 | ||||||||||||
California Public Works Board Various Judicial Council Project Series D | 5.25 | 12-1-2026 | 1,000,000 | 1,067,490 | ||||||||||||
Foothill De Anza CA Community College District Certificate of Participation | 5.00 | 4-1-2033 | 500,000 | 584,520 | ||||||||||||
Gold Coast Transit District California Transit Finance Corporation Certificate of Participation | 5.00 | 7-1-2027 | 520,000 | 650,655 | ||||||||||||
San Diego CA Public Facilities Financing Authority Capital Improvement Projects Series B | 5.00 | 10-15-2027 | 500,000 | 611,680 | ||||||||||||
San Diego CA Public Facilities Financing Authority Capital Improvement Projects Series B | 5.00 | 10-15-2028 | 1,000,000 | 1,221,030 | ||||||||||||
| 6,879,325 | ||||||||||||||||
|
| |||||||||||||||
| Tax Revenue: 0.05% | ||||||||||||||||
San Jose CA RDA Series A-1 | 5.50 | 8-1-2030 | 1,355,000 | 1,360,650 | ||||||||||||
|
| |||||||||||||||
The accompanying notes are an integral part of these financial statements.
Wells Fargo Intermediate Tax/AMT-Free Fund | 13
Portfolio of investments—June 30, 2020
| Interest rate | Maturity date | Principal | Value | |||||||||||||
| Transportation Revenue: 0.37% |
| |||||||||||||||
Bay Area CA Toll Authority Toll Bridge Series A (SIFMA Municipal Swap +1.25%) ± | 1.38 | % | 4-1-2036 | $ | 9,810,000 | $ | 9,615,075 | |||||||||
|
| |||||||||||||||
| Utilities Revenue: 0.41% | ||||||||||||||||
California Municipal Finance Authority | 5.00 | 10-1-2025 | 1,500,000 | 1,812,390 | ||||||||||||
M-S-R California Energy Authority Gas Series B | 7.00 | 11-1-2034 | 2,035,000 | 3,074,295 | ||||||||||||
M-S-R California Energy Authority Gas Series C | 7.00 | 11-1-2034 | 3,000,000 | 4,532,130 | ||||||||||||
Sacramento CA Municipal Utility District Series B | 5.00 | 8-15-2030 | 1,075,000 | 1,222,598 | ||||||||||||
| 10,641,413 | ||||||||||||||||
|
| |||||||||||||||
| Water & Sewer Revenue: 0.41% | ||||||||||||||||
California Department of Water Resources Central Valley Project Series AT (SIFMA Municipal Swap +0.37%) ± | 0.50 | 12-1-2035 | 10,000,000 | 10,021,600 | ||||||||||||
Carpinteria Valley CA Water District Refunding Bond Series A | 5.00 | 7-1-2032 | 455,000 | 611,101 | ||||||||||||
| 10,632,701 | ||||||||||||||||
|
| |||||||||||||||
| 160,535,768 | ||||||||||||||||
|
| |||||||||||||||
Colorado: 1.04% |
| |||||||||||||||
| Education Revenue: 0.23% | ||||||||||||||||
Colorado ECFA University of Denver Project (National Insured) | 5.25 | 3-1-2025 | 1,110,000 | 1,281,484 | ||||||||||||
Colorado University Enterprise and Refunding Bond Series C | 2.00 | 6-1-2054 | 4,500,000 | 4,706,640 | ||||||||||||
| 5,988,124 | ||||||||||||||||
|
| |||||||||||||||
| GO Revenue: 0.29% | ||||||||||||||||
Adams County CO 12 Five Star Schools Series B | 5.00 | 12-15-2028 | 3,800,000 | 4,797,424 | ||||||||||||
Mesa County CO Valley School District # 51 Grand Junction | 5.50 | 12-1-2035 | 2,175,000 | 2,826,500 | ||||||||||||
| 7,623,924 | ||||||||||||||||
|
| |||||||||||||||
| Health Revenue: 0.11% | ||||||||||||||||
Colorado Health Facilities Authority Series B-2 | 5.00 | 8-1-2049 | 2,500,000 | 2,940,825 | ||||||||||||
|
| |||||||||||||||
| Industrial Development Revenue: 0.12% | ||||||||||||||||
Denver CO Convention Center Hotel Authority Refunding Bond | 5.00 | 12-1-2023 | 3,000,000 | 3,179,370 | ||||||||||||
|
| |||||||||||||||
| Miscellaneous Revenue: 0.29% | ||||||||||||||||
Adams County CO Refunding & Improvement Bond Certificate of Participation | 5.00 | 12-1-2021 | 830,000 | 883,527 | ||||||||||||
Colorado ECFA Variable Nature Conservancy Project Series 2012 ø | 0.13 | 7-1-2033 | 950,000 | 950,000 | ||||||||||||
Regents of the University of Colorado Certificate of Participation Series A | 5.00 | 11-1-2028 | 5,000,000 | 5,697,350 | ||||||||||||
| 7,530,877 | ||||||||||||||||
|
| |||||||||||||||
| 27,263,120 | ||||||||||||||||
|
| |||||||||||||||
Connecticut: 2.45% |
| |||||||||||||||
| Education Revenue: 0.90% | ||||||||||||||||
Connecticut HEFAR University of Hartford Issue Series N | 5.00 | 7-1-2029 | 480,000 | 539,362 | ||||||||||||
Connecticut HEFAR University of Hartford Issue Series N | 5.00 | 7-1-2030 | 870,000 | 968,954 | ||||||||||||
Connecticut HEFAR Yale University Issue Series A | 2.05 | 7-1-2035 | 10,735,000 | 10,918,676 | ||||||||||||
Connecticut HEFAR Yale University Issue Series A-2 | 2.00 | 7-1-2042 | 3,425,000 | 3,659,202 | ||||||||||||
Connecticut Higher Education Supplemental Loan Authority Chesla Loan Program Series D %% | 3.00 | 11-15-2035 | 1,000,000 | 986,280 | ||||||||||||
University of Connecticut Series A | 5.00 | 3-15-2027 | 1,065,000 | 1,284,390 | ||||||||||||
University of Connecticut Series A | 5.00 | 3-15-2032 | 4,355,000 | 5,154,709 | ||||||||||||
| 23,511,573 | ||||||||||||||||
|
| |||||||||||||||
The accompanying notes are an integral part of these financial statements.
14 | Wells Fargo Intermediate Tax/AMT-Free Fund
Portfolio of investments—June 30, 2020
| Interest rate | Maturity date | Principal | Value | |||||||||||||
| GO Revenue: 1.07% |
| |||||||||||||||
Bridgeport CT Series A | 5.00 | % | 6-1-2031 | $ | 1,855,000 | $ | 2,260,058 | |||||||||
Connecticut Series A | 5.00 | 3-1-2029 | 2,500,000 | 2,842,250 | ||||||||||||
Connecticut Series B | 5.00 | 6-15-2027 | 3,000,000 | 3,566,190 | ||||||||||||
Connecticut Series F | 5.00 | 11-15-2032 | 300,000 | 354,216 | ||||||||||||
Hamden CT | 4.00 | 8-15-2020 | 1,235,000 | 1,240,446 | ||||||||||||
Hamden CT | 4.00 | 8-15-2021 | 1,235,000 | 1,285,178 | ||||||||||||
Hamden CT (AGM Insured) | 5.00 | 8-15-2022 | 1,000,000 | 1,089,900 | ||||||||||||
Hamden CT Prerefunded Bond (AGM Insured) | 5.00 | 8-15-2021 | 125,000 | 131,474 | ||||||||||||
Hamden CT Refunding Bond Series A (BAM Insured) | 5.00 | 8-15-2029 | 500,000 | 630,535 | ||||||||||||
Hamden CT Refunding Bond Series A (BAM Insured) | 5.00 | 8-15-2030 | 1,200,000 | 1,504,848 | ||||||||||||
Hamden CT Series A (BAM Insured) | 5.00 | 8-15-2026 | 2,000,000 | 2,432,740 | ||||||||||||
Hamden CT Series A (BAM Insured) | 5.00 | 8-15-2027 | 1,200,000 | 1,493,040 | ||||||||||||
Hamden CT Unrefunded Bond (AGM Insured) | 5.00 | 8-15-2021 | 875,000 | 918,391 | ||||||||||||
Hartford CT Metropolitan District | 5.00 | 7-15-2035 | 1,000,000 | 1,214,680 | ||||||||||||
Hartford CT Series A (AGM Insured) | 5.00 | 4-1-2022 | 3,010,000 | 3,225,065 | ||||||||||||
Hartford CT Series A (AGM Insured) | 5.00 | 7-1-2026 | 1,050,000 | 1,234,664 | ||||||||||||
Hartford CT Series C (AGM Insured) | 5.00 | 7-15-2022 | 2,320,000 | 2,507,062 | ||||||||||||
| 27,930,737 | ||||||||||||||||
|
| |||||||||||||||
| Miscellaneous Revenue: 0.19% | ||||||||||||||||
Connecticut Series A (SIFMA Municipal Swap +0.85%) ± | 0.98 | 3-1-2022 | 3,000,000 | 3,002,940 | ||||||||||||
Connecticut Series G | 4.00 | 10-15-2026 | 1,985,000 | 2,111,683 | ||||||||||||
| 5,114,623 | ||||||||||||||||
|
| |||||||||||||||
| Tax Revenue: 0.29% | ||||||||||||||||
Connecticut Special Tax Obligation Bonds Series A | 4.00 | 9-1-2036 | 1,000,000 | 1,101,020 | ||||||||||||
Connecticut Special Tax Obligation Bonds Transportation Infrastructure Purposes Series A | 5.00 | 8-1-2030 | 1,000,000 | 1,182,210 | ||||||||||||
Connecticut Special Tax Obligation Bonds Transportation Infrastructure Purposes Series A | 5.00 | 8-1-2034 | 4,500,000 | 5,259,555 | ||||||||||||
| 7,542,785 | ||||||||||||||||
|
| |||||||||||||||
| 64,099,718 | ||||||||||||||||
|
| |||||||||||||||
Delaware: 0.08% |
| |||||||||||||||
| Education Revenue: 0.08% | ||||||||||||||||
Delaware EDA Odyssey Charter School Project Series B 144A | 6.75 | 9-1-2035 | 2,000,000 | 2,129,300 | ||||||||||||
|
| |||||||||||||||
District of Columbia: 1.38% |
| |||||||||||||||
| Education Revenue: 0.10% | ||||||||||||||||
District of Columbia Howard University Series A | 5.75 | 10-1-2026 | 2,510,000 | 2,522,450 | ||||||||||||
|
| |||||||||||||||
| GO Revenue: 0.55% | ||||||||||||||||
District of Columbia Series 2014C | 5.00 | 6-1-2034 | 3,000,000 | 3,456,900 | ||||||||||||
District of Columbia Series 2014C | 5.00 | 6-1-2035 | 1,620,000 | 1,862,692 | ||||||||||||
District of Columbia Series 2016A | 5.00 | 6-1-2033 | 5,000,000 | 6,082,000 | ||||||||||||
District of Columbia Series 2017A | 5.00 | 6-1-2033 | 2,400,000 | 3,001,560 | ||||||||||||
| 14,403,152 | ||||||||||||||||
|
| |||||||||||||||
| Miscellaneous Revenue: 0.42% | ||||||||||||||||
District of Columbia Federal Highway Grant Anticipation Bond | 5.00 | 12-1-2023 | 1,000,000 | 1,107,840 | ||||||||||||
District of Columbia Federal Highway Grant Anticipation Bond | 5.00 | 12-1-2025 | 3,520,000 | 3,895,091 | ||||||||||||
District of Columbia Federal Highway Grant Anticipation Bond | 5.25 | 12-1-2025 | 2,630,000 | 2,681,916 | ||||||||||||
District of Columbia Medical Association of Colleges Series B | 5.00 | 10-1-2024 | 3,095,000 | 3,273,520 | ||||||||||||
| 10,958,367 | ||||||||||||||||
|
| |||||||||||||||
The accompanying notes are an integral part of these financial statements.
Wells Fargo Intermediate Tax/AMT-Free Fund | 15
Portfolio of investments—June 30, 2020
| Interest rate | Maturity date | Principal | Value | |||||||||||||
| Transportation Revenue: 0.20% |
| |||||||||||||||
Washington Metropolitan Airport Authority Dulles Toll Road Series B | 5.00 | % | 10-1-2034 | $ | 1,250,000 | $ | 1,514,775 | |||||||||
Washington Metropolitan Area Transit Authority Series B | 5.00 | 7-1-2032 | 3,000,000 | 3,691,710 | ||||||||||||
| 5,206,485 | ||||||||||||||||
|
| |||||||||||||||
| Water & Sewer Revenue: 0.11% | ||||||||||||||||
District of Columbia Water & Sewer Authority Public Utility Senior Lien Series A | 5.00 | 10-1-2037 | 2,260,000 | 2,851,148 | ||||||||||||
|
| |||||||||||||||
| 35,941,602 | ||||||||||||||||
|
| |||||||||||||||
| Florida: 5.28% | ||||||||||||||||
| Airport Revenue: 0.45% | ||||||||||||||||
Hillsborough FL Aviation Authority Tampa International Airport Customer Facility Series A | 5.00 | 10-1-2044 | 8,335,000 | 9,218,593 | ||||||||||||
Jacksonville FL Port Authority Series B | 5.00 | 11-1-2035 | 2,045,000 | 2,444,041 | ||||||||||||
| 11,662,634 | ||||||||||||||||
|
| |||||||||||||||
| Education Revenue: 0.05% | ||||||||||||||||
Florida Development Finance Corporation Renaissance Charter School Series A | 5.00 | 9-15-2020 | 230,000 | 230,534 | ||||||||||||
Florida HEFAR | 4.00 | 4-1-2021 | 1,000,000 | 1,022,040 | ||||||||||||
| 1,252,574 | ||||||||||||||||
|
| |||||||||||||||
| GO Revenue: 0.06% | ||||||||||||||||
Plantation FL Ad Valorem Bond | 5.00 | 7-1-2031 | 1,155,000 | 1,458,788 | ||||||||||||
|
| |||||||||||||||
| Health Revenue: 0.64% | ||||||||||||||||
Florida Health System Lee Memorial Hospital Series A | 5.00 | 4-1-2036 | 4,500,000 | 5,427,990 | ||||||||||||
Florida Tender Option Bond Trust Receipts/Floater Certificates Series 2018-XF2523 (Barclays Bank plc LIQ) 144Aø | 0.23 | 8-15-2047 | 4,000,000 | 4,000,000 | ||||||||||||
Jacksonville FL HCFR Baptist Health Series D ø | 0.12 | 8-1-2036 | 3,000,000 | 3,000,000 | ||||||||||||
Lee Memorial Health System Series B ø | 0.78 | 4-1-2049 | 1,800,000 | 1,800,000 | ||||||||||||
Miami-Dade County FL Health Facilities Authority Nicklaus Children’s Hospital Project | 5.00 | 8-1-2031 | 500,000 | 598,035 | ||||||||||||
Miami-Dade County FL Health Facilities Authority Nicklaus Children’s Hospital Project | 5.00 | 8-1-2033 | 1,645,000 | 1,946,660 | ||||||||||||
| 16,772,685 | ||||||||||||||||
|
| |||||||||||||||
| Miscellaneous Revenue: 2.10% | ||||||||||||||||
Boynton FL PFA Capital Improvement Series 2018 | 4.00 | 7-1-2030 | 2,090,000 | 2,426,908 | ||||||||||||
Boynton FL PFA Capital Improvement Series 2018 | 5.00 | 7-1-2035 | 3,590,000 | 4,357,973 | ||||||||||||
Broward County FL School Board Certificate of Participation Series A | 5.00 | 7-1-2024 | 5,000,000 | 5,782,350 | ||||||||||||
Cityplace Florida Community Development District Special Assessment | 5.00 | 5-1-2021 | 2,945,000 | 3,051,933 | ||||||||||||
Duval County FL School Board Certificate of Participation Series B | 5.00 | 7-1-2028 | 2,500,000 | 2,980,450 | ||||||||||||
Duval County FL School Board Certificate of Participation Series B | 5.00 | 7-1-2029 | 5,000,000 | 5,958,250 | ||||||||||||
Miami-Dade County FL School Board Certificate of Participation Series A | 5.00 | 5-1-2031 | 3,000,000 | 3,486,300 | ||||||||||||
Miami-Dade County FL School Board Certificate of Participation Series D | 5.00 | 11-1-2027 | 6,600,000 | 7,774,668 | ||||||||||||
Monroe County FL School Board Certificate of Participation Series A | 5.00 | 6-1-2034 | 1,500,000 | 1,845,705 | ||||||||||||
Monroe County FL School Board Certificate of Participation Series A | 5.00 | 6-1-2035 | 1,000,000 | 1,225,540 | ||||||||||||
Orange County FL School Board Certificate of Participation Series C | 5.00 | 8-1-2029 | 2,000,000 | 2,422,540 | ||||||||||||
Orlando FL Senior Tourist Development 6th Cent Contract Payment Bond | 5.00 | 11-1-2032 | 2,000,000 | 2,367,940 | ||||||||||||
Orlando FL Senior Tourist Development 6th Cent Contract Payment Bond | 5.00 | 11-1-2033 | 4,500,000 | 5,305,590 | ||||||||||||
Orlando FL Senior Tourist Development 6th Cent Contract Payment Bond | 5.00 | 11-1-2034 | 600,000 | 705,450 | ||||||||||||
The accompanying notes are an integral part of these financial statements.
16 | Wells Fargo Intermediate Tax/AMT-Free Fund
Portfolio of investments—June 30, 2020
| Interest rate | Maturity date | Principal | Value | |||||||||||||
| Miscellaneous Revenue (continued) | ||||||||||||||||
Palm Beach County FL Refunding Bond | 5.00 | % | 5-1-2029 | $ | 2,000,000 | $ | 2,463,720 | |||||||||
University of South Florida Financing Corporation Certificate of Participation Master Lease Program Series A | 5.00 | 7-1-2022 | 1,730,000 | 1,862,812 | ||||||||||||
University of South Florida Financing Corporation Certificate of Participation Master Lease Program Series A | 5.00 | 7-1-2023 | 815,000 | 907,340 | ||||||||||||
| 54,925,469 | ||||||||||||||||
|
| |||||||||||||||
| Tax Revenue: 0.56% | �� | |||||||||||||||
Miami-Dade County FL Public Services (AGM Insured) | 4.00 | 10-1-2020 | 3,600,000 | 3,632,976 | ||||||||||||
Miami-Dade County FL Public Services (AGM Insured) | 4.00 | 4-1-2021 | 2,485,000 | 2,553,387 | ||||||||||||
Miami-Dade County FL Special Obligation Series A | 5.00 | 10-1-2023 | 700,000 | 764,274 | ||||||||||||
Polk County FL School District | 5.00 | 10-1-2033 | 2,900,000 | 3,768,695 | ||||||||||||
Tampa FL Sports Authority Stadium Project | 5.00 | 1-1-2025 | 3,550,000 | 4,018,103 | ||||||||||||
| 14,737,435 | ||||||||||||||||
|
| |||||||||||||||
| Transportation Revenue: 0.58% | ||||||||||||||||
Florida Department of Transportation Turnpike System Series A | 5.00 | 7-1-2023 | 3,910,000 | 4,454,937 | ||||||||||||
Florida Department of Transportation Turnpike System Series A | 5.00 | 7-1-2025 | 4,950,000 | 6,047,168 | ||||||||||||
Florida Mid-Bay Bridge Authority Series A | 5.00 | 10-1-2025 | 1,250,000 | 1,431,550 | ||||||||||||
Miami-Dade County FL Expressway Authority Toll System (AGM Insured, Citibank NA LIQ) 144Aø | 0.33 | 7-1-2035 | 1,050,000 | 1,050,000 | ||||||||||||
Osceola County FL Transportation Improvement & Refunding Bond Series A-1 | 5.00 | 10-1-2034 | 375,000 | 459,758 | ||||||||||||
Osceola County FL Transportation Improvement & Refunding Bond Series A-1 | 5.00 | 10-1-2035 | 400,000 | 488,244 | ||||||||||||
Osceola County FL Transportation Improvement & Refunding Bond Series A-1 | 5.00 | 10-1-2036 | 600,000 | 729,510 | ||||||||||||
Osceola County FL Transportation Improvement & Refunding Bond Series A-1 | 5.00 | 10-1-2037 | 525,000 | 636,027 | ||||||||||||
| 15,297,194 | ||||||||||||||||
|
| |||||||||||||||
| Water & Sewer Revenue: 0.84% | ||||||||||||||||
Daytona Beach FL Utility System (AGM Insured) | 5.00 | 11-1-2022 | 2,205,000 | 2,435,886 | ||||||||||||
North Sumter County FL Utility Dependent District Bond (BAM Insured) | 5.00 | 10-1-2031 | 500,000 | 661,665 | ||||||||||||
North Sumter County FL Utility Dependent District Bond (BAM Insured) | 5.00 | 10-1-2032 | 950,000 | 1,248,044 | ||||||||||||
North Sumter County FL Utility Dependent District Bond (BAM Insured) | 5.00 | 10-1-2035 | 1,290,000 | 1,672,472 | ||||||||||||
North Sumter County FL Utility Dependent District Bond (BAM Insured) | 5.00 | 10-1-2036 | 880,000 | 1,136,247 | ||||||||||||
Tohopekaliga FL Water Authority Utility System Bond 144A | 5.00 | 10-1-2025 | 12,000,000 | 14,761,920 | ||||||||||||
| 21,916,234 | ||||||||||||||||
|
| |||||||||||||||
| 138,023,013 | ||||||||||||||||
|
| |||||||||||||||
Georgia: 2.47% |
| |||||||||||||||
| Education Revenue: 0.13% | ||||||||||||||||
Private Colleges & Universities Authority of Georgia Series A | 5.00 | 10-1-2021 | 3,330,000 | 3,441,488 | ||||||||||||
|
| |||||||||||||||
| Health Revenue: 0.11% | ||||||||||||||||
Brookhaven GA Development Authority Children’s Healthcare Series A | 5.00 | 7-1-2034 | 1,010,000 | 1,278,923 | ||||||||||||
Brookhaven GA Development Authority Children’s Healthcare Series A | 5.00 | 7-1-2035 | 1,300,000 | 1,635,244 | ||||||||||||
| 2,914,167 | ||||||||||||||||
|
| |||||||||||||||
| Industrial Development Revenue: 0.08% | ||||||||||||||||
Monroe County GA PCR Georgia Power Company Plant Scherer Project | 2.35 | 10-1-2048 | 2,000,000 | 2,015,580 | ||||||||||||
|
| |||||||||||||||
The accompanying notes are an integral part of these financial statements.
Wells Fargo Intermediate Tax/AMT-Free Fund | 17
Portfolio of investments—June 30, 2020
| Interest rate | Maturity date | Principal | Value | |||||||||||||
| Utilities Revenue: 2.15% |
| |||||||||||||||
Bartow County GA Development Authority Pollution Control Georgia Power Company Plant Bowen Project | 1.55 | % | 8-1-2043 | $ | 3,000,000 | $ | 3,003,840 | |||||||||
Burke County GA Development Authority Georgia Power Company Plant Vogtle Project | 2.25 | 10-1-2032 | 4,800,000 | 4,900,368 | ||||||||||||
Burke County GA Development Authority Oglethorpe Power Corporation Vogtle Project Series E | 3.25 | 11-1-2045 | 6,000,000 | 6,410,220 | ||||||||||||
Floyd County GA PCR Georgia Power Company Plant Hammond Project | 2.35 | 7-1-2022 | 1,000,000 | 1,007,170 | ||||||||||||
Georgia Municipal Electric Authority Project One Series A | 5.00 | 1-1-2035 | 925,000 | 1,126,095 | ||||||||||||
Georgia Municipal Electric Authority Units 3 & 4 Project Series A | 5.00 | 1-1-2032 | 525,000 | 641,498 | ||||||||||||
Georgia Municipal Electric Authority Units 3 & 4 Project Series A | 5.00 | 1-1-2034 | 930,000 | 1,124,919 | ||||||||||||
Georgia Municipal Electric Authority Units 3 & 4 Project Series A | 5.00 | 1-1-2035 | 600,000 | 723,414 | ||||||||||||
Main Street Natural Gas Incorporated Georgia Gas Project Series A | 5.00 | 5-15-2029 | 2,600,000 | 3,189,498 | ||||||||||||
Main Street Natural Gas Incorporated Georgia Gas Project Series A | 5.50 | 9-15-2022 | 1,000,000 | 1,087,890 | ||||||||||||
Main Street Natural Gas Incorporated Georgia Gas Project Series B | 4.00 | 8-1-2049 | 10,000,000 | 11,284,900 | ||||||||||||
Main Street Natural Gas Incorporated Georgia Gas Project Series C (Royal Bank of Canada LIQ) | 4.00 | 8-1-2048 | 2,500,000 | 2,735,850 | ||||||||||||
Main Street Natural Gas Incorporated Georgia Gas Project Subordinate Bond | 4.00 | 4-1-2048 | 5,500,000 | 5,986,640 | ||||||||||||
Main Street Natural Gas Incorporated Georgia Gas Project Subordinate Bond | 0.87 | 4-1-2048 | 10,000,000 | 9,914,600 | ||||||||||||
Monroe County GA Development Authority Pollution Control Gulf Power Company Plant Scherer Project ø | 0.18 | 6-1-2049 | 3,000,000 | 3,000,000 | ||||||||||||
| 56,136,902 | ||||||||||||||||
|
| |||||||||||||||
| 64,508,137 | ||||||||||||||||
|
| |||||||||||||||
Guam: 0.21% |
| |||||||||||||||
| Airport Revenue: 0.09% | ||||||||||||||||
Guam International Airport Authority | 5.00 | 10-1-2022 | 1,000,000 | 1,010,220 | ||||||||||||
Guam International Airport Authority | 5.00 | 10-1-2023 | 1,480,000 | 1,486,897 | ||||||||||||
| 2,497,117 | ||||||||||||||||
|
| |||||||||||||||
| Water & Sewer Revenue: 0.12% | ||||||||||||||||
Guam Government Waterworks Authority | 5.25 | 7-1-2020 | 350,000 | 350,000 | ||||||||||||
Guam Government Waterworks Authority | 5.25 | 7-1-2033 | 2,500,000 | 2,728,625 | ||||||||||||
| 3,078,625 | ||||||||||||||||
|
| |||||||||||||||
| 5,575,742 | ||||||||||||||||
|
| |||||||||||||||
Illinois: 15.09% |
| |||||||||||||||
| Airport Revenue: 1.60% | ||||||||||||||||
Chicago IL Midway Airport Second Lien Refunding Bond Series B | 4.00 | 1-1-2035 | 2,860,000 | 3,074,042 | ||||||||||||
Chicago IL O’Hare International Airport Senior Lien (AGM Insured) | 5.13 | 1-1-2030 | 2,610,000 | 2,844,195 | ||||||||||||
Chicago IL O’Hare International Airport Senior Lien (AGM Insured) | 5.13 | 1-1-2031 | 3,335,000 | 3,626,512 | ||||||||||||
Chicago IL O’Hare International Airport Senior Lien | 5.25 | 1-1-2032 | 8,755,000 | 9,504,253 | ||||||||||||
Chicago IL O’Hare International Airport Senior Lien Series B | 5.00 | 1-1-2030 | 8,025,000 | 9,198,737 | ||||||||||||
Chicago IL O’Hare International Airport Senior Lien Series B | 5.00 | 1-1-2036 | 1,530,000 | 1,868,252 | ||||||||||||
Chicago IL O’Hare International Airport Third Lien Series A | 5.75 | 1-1-2039 | 4,065,000 | 4,146,178 | ||||||||||||
Chicago IL O’Hare International Airport Third Lien Series C (AGC Insured) | 5.25 | 1-1-2025 | 4,075,000 | 4,090,567 | ||||||||||||
Chicago IL O’Hare International Airport Third Lien Series F | 4.25 | 1-1-2021 | 735,000 | 737,242 | ||||||||||||
Peoria IL Metropolitan Airport Authority Series D | 5.00 | 12-1-2027 | 2,250,000 | 2,693,340 | ||||||||||||
| 41,783,318 | ||||||||||||||||
|
| |||||||||||||||
The accompanying notes are an integral part of these financial statements.
18 | Wells Fargo Intermediate Tax/AMT-Free Fund
Portfolio of investments—June 30, 2020
| Interest rate | Maturity date | Principal | Value | |||||||||||||
| Education Revenue: 0.41% |
| |||||||||||||||
Illinois Finance Authority Academic Facilities University of Illinois at Urbana-Champaign Project Series A | 5.00 | % | 10-1-2026 | $ | 450,000 | $ | 534,740 | |||||||||
Illinois Finance Authority Academic Facilities University of Illinois at Urbana-Champaign Project Series A | 5.00 | 10-1-2031 | 400,000 | 490,952 | ||||||||||||
Illinois Finance Authority Academic Facilities University of Illinois at Urbana-Champaign Project Series A | 5.00 | 10-1-2039 | 700,000 | 831,166 | ||||||||||||
Illinois Finance Authority Bradley University Project Series C | 5.00 | 8-1-2032 | 1,250,000 | 1,448,850 | ||||||||||||
Illinois Finance Authority North Park University Project (U.S. Bank NA LOC) ø | 0.14 | 10-1-2029 | 800,000 | 800,000 | ||||||||||||
Illinois Finance Authority Student Housing Illinois State University Project | 5.50 | 4-1-2021 | 990,000 | 1,025,878 | ||||||||||||
Illinois Finance Authority Wesleyan University | 5.00 | 9-1-2026 | 680,000 | 794,192 | ||||||||||||
Northern Illinois University Board of Trustees Certificate of Participation (AGM Insured) | 5.00 | 9-1-2022 | 1,325,000 | 1,423,951 | ||||||||||||
Northern Illinois University Board of Trustees Certificate of Participation (AGM Insured) | 5.00 | 9-1-2024 | 1,000,000 | 1,134,110 | ||||||||||||
University of Illinois Board of Trustees Auxiliary Facilities System Refunding Bond | 4.00 | 4-1-2030 | 2,000,000 | 2,123,240 | ||||||||||||
| 10,607,079 | ||||||||||||||||
|
| |||||||||||||||
| GO Revenue: 3.77% | ||||||||||||||||
Bolingbrook, Will & DuPage Counties IL Series A (AGM Insured) | 5.00 | 1-1-2023 | 650,000 | 720,896 | ||||||||||||
Chicago IL Board of Education CAB School Reform Series B-1 (National Insured) ¤ | 0.00 | 12-1-2025 | 3,380,000 | 2,886,689 | ||||||||||||
Chicago IL Board of Education CAB School Reform Series B-1 (National Insured) ¤ | 0.00 | 12-1-2026 | 4,030,000 | 3,318,302 | ||||||||||||
Chicago IL Board of Education Series F | 5.00 | 12-1-2020 | 2,375,000 | 2,394,689 | ||||||||||||
Chicago IL CAB Series C ¤ | 0.00 | 1-1-2023 | 2,500,000 | 2,269,400 | ||||||||||||
Chicago IL Metropolitan Reclamation Series B | 5.00 | 12-1-2025 | 2,500,000 | 2,644,550 | ||||||||||||
Chicago IL Park District Series A | 5.00 | 1-1-2036 | 2,250,000 | 2,313,720 | ||||||||||||
Chicago IL Park District Series B | 5.00 | 1-1-2021 | 3,765,000 | 3,831,339 | ||||||||||||
Chicago IL Park District Series B (BAM Insured) | 5.00 | 1-1-2029 | 2,000,000 | 2,218,820 | ||||||||||||
Chicago IL Park District Series C | 5.00 | 1-1-2022 | 1,615,000 | 1,697,397 | ||||||||||||
Chicago IL Series A | 5.00 | 1-1-2025 | 750,000 | 789,270 | ||||||||||||
Chicago IL Series C | 5.00 | 1-1-2026 | 5,000,000 | 5,385,050 | ||||||||||||
Cook County IL Community College District #508 | 5.25 | 12-1-2025 | 1,665,000 | 1,717,964 | ||||||||||||
Cook County IL Community College District #508 | 5.25 | 12-1-2027 | 1,295,000 | 1,333,591 | ||||||||||||
Cook County IL Community College District #508 | 5.25 | 12-1-2028 | 1,250,000 | 1,283,838 | ||||||||||||
Cook County IL Community College District #508 | 5.25 | 12-1-2030 | 3,000,000 | 3,077,970 | ||||||||||||
Cook County IL Community College District #508 | 5.25 | 12-1-2031 | 3,200,000 | 3,276,160 | ||||||||||||
Cook County IL Series A | 5.00 | 11-15-2029 | 1,000,000 | 1,122,920 | ||||||||||||
Cook County IL Series A | 5.00 | 11-15-2034 | 1,300,000 | 1,430,234 | ||||||||||||
Cook County IL Series A | 5.25 | 11-15-2022 | 7,240,000 | 7,320,002 | ||||||||||||
Cook County IL Series A | 5.25 | 11-15-2023 | 7,680,000 | 7,763,251 | ||||||||||||
Cook County IL Series A | 5.25 | 11-15-2024 | 2,200,000 | 2,285,030 | ||||||||||||
Cook County IL Series B | 5.00 | 11-15-2023 | 600,000 | 651,912 | ||||||||||||
Cook County IL Series C | 5.00 | 11-15-2021 | 1,460,000 | 1,499,639 | ||||||||||||
Cook County IL Series C | 5.00 | 11-15-2024 | 2,175,000 | 2,303,760 | ||||||||||||
Cook County IL Series C | 5.00 | 11-15-2025 | 2,450,000 | 2,588,817 | ||||||||||||
DuPage, Cook & Will Counties IL Community College District #502 Series A | 5.00 | 6-1-2022 | 2,650,000 | 2,871,010 | ||||||||||||
Illinois (AGM Insured) | 5.00 | 1-1-2023 | 2,450,000 | 2,455,488 | ||||||||||||
Illinois (AGM Insured) | 5.00 | 4-1-2026 | 5,000,000 | 5,468,350 | ||||||||||||
Illinois Series A | 5.00 | 4-1-2023 | 4,500,000 | 4,731,345 | ||||||||||||
Illinois Series A (AGM Insured) | 5.00 | 4-1-2024 | 2,500,000 | 2,680,100 | ||||||||||||
Kane, Cook & DuPage Counties IL School District #46 Prerefunded Balance Bond Series B | 4.50 | 1-1-2024 | 1,170,000 | 1,242,259 | ||||||||||||
The accompanying notes are an integral part of these financial statements.
Wells Fargo Intermediate Tax/AMT-Free Fund | 19
Portfolio of investments—June 30, 2020
| Interest rate | Maturity date | Principal | Value | |||||||||||||
| GO Revenue (continued) | ||||||||||||||||
Kane, Cook & DuPage Counties IL School District #46 Unrefunded Balance Bond Series B | 4.50 | % | 1-1-2024 | $ | 3,100,000 | $ | 3,281,598 | |||||||||
Kendall, Kane & Will Counties IL Unified School District Series A | 5.00 | 2-1-2023 | 1,000,000 | 1,027,360 | ||||||||||||
McHenry & Kane Counties IL Community Consolidated School District #158 | 5.63 | 1-15-2031 | 2,000,000 | 2,142,340 | ||||||||||||
Springfield IL | 5.00 | 12-1-2021 | 850,000 | 902,445 | ||||||||||||
Springfield IL | 5.00 | 12-1-2023 | 570,000 | 645,536 | ||||||||||||
Stephenson County IL School District #145 Series A (AGM Insured) | 5.00 | 2-1-2033 | 1,550,000 | 1,938,275 | ||||||||||||
Waukegan IL Series B (AGM Insured) | 4.00 | 12-30-2024 | 1,030,000 | 1,165,723 | ||||||||||||
| 98,677,039 | ||||||||||||||||
|
| |||||||||||||||
| Health Revenue: 0.28% | ||||||||||||||||
Illinois Finance Authority Advocate Health Care Network Series A | 4.00 | 11-1-2030 | 3,500,000 | 3,999,170 | ||||||||||||
Illinois Finance Authority Ann & Robert H. Laurie Children’s Hospital Project of Chicago | 5.00 | 8-15-2034 | 1,000,000 | 1,188,570 | ||||||||||||
Illinois Finance Authority Edward Elmhurst Healthcare Series A | 5.00 | 1-1-2026 | 1,000,000 | 1,185,990 | ||||||||||||
Illinois Finance Authority Lutheran Life Communities Obligated Group Series A | 5.00 | 11-1-2035 | 900,000 | 901,935 | ||||||||||||
| 7,275,665 | ||||||||||||||||
|
| |||||||||||||||
| Miscellaneous Revenue: 0.79% | ||||||||||||||||
Chicago IL Board of Education Series C | 5.00 | 12-1-2021 | 5,000,000 | 5,119,450 | ||||||||||||
Illinois | 5.00 | 7-1-2023 | 5,065,000 | 5,346,766 | ||||||||||||
Illinois | 5.00 | 8-1-2024 | 1,000,000 | 1,036,430 | ||||||||||||
Illinois | 5.50 | 7-1-2026 | 2,300,000 | 2,437,287 | ||||||||||||
Peoria IL Public Building Commission Illinois School District Facilities Refunding Bond (BAM Insured) | 5.00 | 12-1-2023 | 4,040,000 | 4,623,740 | ||||||||||||
Peoria IL Public Building Commission Illinois School District Facilities Refunding Bond (BAM Insured) | 5.00 | 12-1-2024 | 1,000,000 | 1,180,490 | ||||||||||||
University of Illinois Board of Trustees Certificate of Participation Unrefunded Bond Series B (AGM Insured) | 5.00 | 10-1-2020 | 955,000 | 958,409 | ||||||||||||
| 20,702,572 | ||||||||||||||||
|
| |||||||||||||||
| Tax Revenue: 5.19% | ||||||||||||||||
Chicago IL Sales Tax Refunding Bond | 5.00 | 1-1-2027 | 3,000,000 | 3,598,140 | ||||||||||||
Chicago IL Sales Tax Refunding Bond | 5.00 | 1-1-2030 | 2,075,000 | 2,488,714 | ||||||||||||
Chicago IL Sales Tax Securitization Bond Series A | 5.00 | 1-1-2029 | 1,000,000 | 1,219,350 | ||||||||||||
Chicago IL Sales Tax Securitization Bond Series C | 5.00 | 1-1-2027 | 4,370,000 | 5,147,729 | ||||||||||||
Chicago IL Sales Tax Securitization Bond Series C | 5.25 | 1-1-2035 | 4,700,000 | 5,619,179 | ||||||||||||
Chicago IL Transit Authority Sales Tax Receipts | 5.25 | 12-1-2027 | 2,600,000 | 2,723,318 | ||||||||||||
Cook County IL Sales Tax Bond | 5.00 | 11-15-2033 | 4,000,000 | 4,692,640 | ||||||||||||
Cook County IL Sales Tax Bond | 5.25 | 11-15-2035 | 2,000,000 | 2,370,460 | ||||||||||||
Illinois ## | 5.00 | 6-15-2023 | 16,150,000 | 17,245,939 | ||||||||||||
Illinois Junior Obligation | 5.00 | 6-15-2025 | 6,000,000 | 6,381,600 | ||||||||||||
Illinois Regional Transportation Authority (National Insured) | 6.50 | 7-1-2026 | 8,615,000 | 10,604,290 | ||||||||||||
Illinois Sales Tax Revenue Build Illinois Bond | 5.00 | 6-15-2029 | 1,000,000 | 1,016,710 | ||||||||||||
Illinois Series A | 5.00 | 1-1-2027 | 10,625,000 | 10,866,506 | ||||||||||||
Illinois Sports Facilities Authority Refunding Bond Insured State Tax Supported | 5.00 | 6-15-2028 | 1,000,000 | 1,068,540 | ||||||||||||
Illinois Sports Facilities Authority State Tax Supported Refunding Bond (AGM Insured) | 5.00 | 6-15-2028 | 2,500,000 | 2,736,400 | ||||||||||||
Illinois Sports Facilities Authority State Tax Supported Refunding Bond (AGM Insured) | 5.25 | 6-15-2030 | 4,000,000 | 4,391,920 | ||||||||||||
Illinois Sports Facilities Authority State Tax Supported Refunding Bond (AGM Insured) | 5.25 | 6-15-2032 | 3,000,000 | 3,272,730 | ||||||||||||
The accompanying notes are an integral part of these financial statements.
20 | Wells Fargo Intermediate Tax/AMT-Free Fund
Portfolio of investments—June 30, 2020
| Interest rate | Maturity date | Principal | Value | |||||||||||||
| Tax Revenue (continued) | ||||||||||||||||
Illinois Tender Option Bond Trust Receipts/Floater Certificates Series 2018-XF0603 (Royal Bank of Canada LIQ) 144Aø | 0.39 | % | 1-1-2026 | $ | 2,265,000 | $ | 2,265,000 | |||||||||
Illinois Tender Option Bond Trust Receipts/Floater Certificates Series 2018-XL0093 (Barclays Bank plc LIQ) 144Aø | 0.28 | 1-1-2048 | 2,000,000 | 2,000,000 | ||||||||||||
Metropolitan Pier & Exposition Authority CAB McCormick Place Expansion Project Series A (National Insured) ¤ | 0.00 | 12-15-2029 | 35,200,000 | 25,545,312 | ||||||||||||
Metropolitan Pier & Exposition Authority CAB McCormick Place Expansion Project Series A (National Insured) ¤ | 0.00 | 12-15-2030 | 12,800,000 | 8,859,008 | ||||||||||||
Metropolitan Pier & Exposition Authority CAB McCormick Place Expansion Project Series B | 5.00 | 12-15-2028 | 1,945,000 | 1,995,551 | ||||||||||||
Metropolitan Pier & Exposition Authority CAB McCormick Place Expansion Project Series B (National Insured) ¤ | 0.00 | 6-15-2029 | 10,000,000 | 7,407,200 | ||||||||||||
Southwestern Illinois Development Authority Local Government Program Collinsville Limited | 5.00 | 3-1-2025 | 2,950,000 | 2,229,905 | ||||||||||||
| 135,746,141 | ||||||||||||||||
|
| |||||||||||||||
| Tobacco Revenue: 0.13% | ||||||||||||||||
Railsplitter IL Tobacco Settlement Authority | 5.00 | 6-1-2024 | 3,000,000 | 3,406,170 | ||||||||||||
|
| |||||||||||||||
| Transportation Revenue: 1.27% | ||||||||||||||||
Illinois Toll Highway Authority Series B | 5.00 | 1-1-2028 | 6,020,000 | 7,540,893 | ||||||||||||
Illinois Toll Highway Authority Series B | 5.00 | 1-1-2030 | 5,825,000 | 7,585,024 | ||||||||||||
Illinois Toll Highway Authority Series C | 5.00 | 1-1-2031 | 14,000,000 | 18,000,080 | ||||||||||||
| 33,125,997 | ||||||||||||||||
|
| |||||||||||||||
| Water & Sewer Revenue: 1.65% | ||||||||||||||||
Chicago IL Second Lien | 5.00 | 11-1-2022 | 1,730,000 | 1,867,449 | ||||||||||||
Chicago IL Second Lien | 5.00 | 11-1-2023 | 1,515,000 | 1,633,367 | ||||||||||||
Chicago IL Second Lien | 5.00 | 11-1-2025 | 620,000 | 665,582 | ||||||||||||
Chicago IL Second Lien | 5.00 | 11-1-2026 | 2,000,000 | 2,141,780 | ||||||||||||
Chicago IL Second Lien | 5.00 | 11-1-2028 | 3,000,000 | 3,203,880 | ||||||||||||
Chicago IL Second Lien | 5.00 | 11-1-2029 | 1,490,000 | 1,587,014 | ||||||||||||
Chicago IL Second Lien | 5.00 | 11-1-2033 | 1,000,000 | 1,097,280 | ||||||||||||
Chicago IL Second Lien (AGM Insured) | 5.25 | 11-1-2033 | 2,000,000 | 2,388,560 | ||||||||||||
Chicago IL Waste Water Transmission Second Lien | 5.00 | 1-1-2022 | 1,440,000 | 1,514,117 | ||||||||||||
Chicago IL Waste Water Transmission Second Lien | 5.00 | 1-1-2023 | 2,335,000 | 2,454,599 | ||||||||||||
Chicago IL Waste Water Transmission Second Lien | 5.00 | 1-1-2024 | 2,000,000 | 2,101,540 | ||||||||||||
Chicago IL Waste Water Transmission Second Lien | 5.00 | 1-1-2027 | 2,670,000 | 2,964,528 | ||||||||||||
Chicago IL Waste Water Transmission Second Lien | 5.00 | 1-1-2028 | 3,500,000 | 3,674,475 | ||||||||||||
Chicago IL Waste Water Transmission Second Lien | 5.00 | 1-1-2029 | 4,700,000 | 4,932,885 | ||||||||||||
Chicago IL Waste Water Transmission Second Lien | 5.00 | 1-1-2032 | 1,000,000 | 1,102,430 | ||||||||||||
Chicago IL Waste Water Transmission Second Lien | 5.00 | 1-1-2033 | 1,000,000 | 1,099,230 | ||||||||||||
Chicago IL Waste Water Transmission Second Lien | 5.00 | 1-1-2034 | 1,000,000 | 1,097,100 | ||||||||||||
Illinois Finance Authority Clean Water Initiative Revolving Fund Bond | 5.25 | 7-1-2035 | 3,000,000 | 3,904,740 | ||||||||||||
Sangamon IL Water Commission Refunding Bond (AGM Insured) %% | 4.00 | 1-1-2029 | 525,000 | 595,135 | ||||||||||||
Sangamon IL Water Commission Refunding Bond (AGM Insured) %% | 4.00 | 1-1-2030 | 600,000 | 684,594 | ||||||||||||
Sangamon IL Water Commission Refunding Bond (AGM Insured) %% | 4.00 | 1-1-2031 | 625,000 | 716,238 | ||||||||||||
Sangamon IL Water Commission Refunding Bond (AGM Insured) %% | 4.00 | 1-1-2033 | 500,000 | 564,080 | ||||||||||||
Sangamon IL Water Commission Refunding Bond (AGM Insured) %% | 4.00 | 1-1-2036 | 570,000 | 633,926 | ||||||||||||
Sangamon IL Water Commission Refunding Bond (AGM Insured) %% | 4.00 | 1-1-2037 | 525,000 | 581,364 | ||||||||||||
| 43,205,893 | ||||||||||||||||
|
| |||||||||||||||
| 394,529,874 | ||||||||||||||||
|
| |||||||||||||||
The accompanying notes are an integral part of these financial statements.
Wells Fargo Intermediate Tax/AMT-Free Fund | 21
Portfolio of investments—June 30, 2020
| Interest rate | Maturity date | Principal | Value | |||||||||||||
Indiana: 1.42% |
| |||||||||||||||
| Health Revenue: 0.20% | ||||||||||||||||
Indiana Finance Authority Ascension Health Subordinate Credit Group Series E-5 ø | 0.12 | % | 11-15-2033 | $ | 500,000 | $ | 500,000 | |||||||||
Indiana HFFA Ascension Health Subordinate Bond Credit Group Series A-3 | 1.35 | 11-1-2027 | 2,240,000 | 2,241,837 | ||||||||||||
Knox County IN EDA Series A | 5.00 | 4-1-2022 | 925,000 | 978,955 | ||||||||||||
Knox County IN EDA Series A | 5.00 | 4-1-2023 | 665,000 | 702,446 | ||||||||||||
Knox County IN EDA Series A | 5.00 | 4-1-2026 | 750,000 | 787,260 | ||||||||||||
| 5,210,498 | ||||||||||||||||
|
| |||||||||||||||
| Housing Revenue: 0.27% | ||||||||||||||||
Indianapolis IN MFHR Regency Park Apartments Series A øø | 1.40 | 9-1-2022 | 7,000,000 | 7,056,490 | ||||||||||||
|
| |||||||||||||||
| Miscellaneous Revenue: 0.66% | ||||||||||||||||
Dubois IN Greater Jasper School Building Corporation First Mortgage Bond | 5.00 | 7-15-2029 | 1,625,000 | 2,064,384 | ||||||||||||
Indiana Bond Bank Special Program Series A (AGM Insured) | 5.00 | 9-1-2022 | 1,545,000 | 1,656,595 | ||||||||||||
Indiana Finance Authority Stadium Project Series A | 5.25 | 2-1-2028 | 2,000,000 | 2,365,780 | ||||||||||||
Indianapolis IN Local Public Improvement Bond Bank Series E | 5.00 | 1-1-2027 | 760,000 | 941,055 | ||||||||||||
Indianapolis IN Local Public Improvement Bond Bank Series E | 5.00 | 1-1-2028 | 1,000,000 | 1,236,130 | ||||||||||||
Indianapolis IN Local Public Improvement Bond Bank Series E | 5.00 | 1-1-2029 | 735,000 | 906,909 | ||||||||||||
Indianapolis IN Local Public Improvement Bond Bank Series E | 5.00 | 1-1-2030 | 1,375,000 | 1,692,969 | ||||||||||||
Indianapolis IN Local Public Improvement Bond Bank Series E | 5.00 | 1-1-2031 | 1,000,000 | 1,227,530 | ||||||||||||
Indianapolis IN Local Public Improvement Bond Bank Series E | 5.00 | 1-1-2033 | 1,545,000 | 1,877,005 | ||||||||||||
Indianapolis IN Local Public Improvement Bond Bank Series E | 5.00 | 1-1-2034 | 2,000,000 | 2,421,500 | ||||||||||||
Valparaiso IN Multi-Schools Building Corporation | 5.00 | 7-15-2024 | 750,000 | 882,345 | ||||||||||||
| 17,272,202 | ||||||||||||||||
|
| |||||||||||||||
| Utilities Revenue: 0.04% | ||||||||||||||||
Indiana Tender Option Bond Trust Receipts/Floater Certificates Series 2015-XF0115 (JPMorgan Chase & Company LIQ) 144Aø | 0.50 | 8-1-2020 | 875,000 | 875,000 | ||||||||||||
|
| |||||||||||||||
| Water & Sewer Revenue: 0.25% | ||||||||||||||||
Indiana Finance Authority First Lien Wastewater Utility Clean Water Project Series A | 5.00 | 10-1-2030 | 2,315,000 | 2,720,727 | ||||||||||||
Indiana Finance Authority First Lien Wastewater Utility Clean Water Project Series A | 5.00 | 10-1-2031 | 1,035,000 | 1,211,385 | ||||||||||||
Indiana Finance Authority First Lien Wastewater Utility Clean Water Project Series A | 5.25 | 10-1-2038 | 2,500,000 | 2,643,775 | ||||||||||||
| 6,575,887 | ||||||||||||||||
|
| |||||||||||||||
| 36,990,077 | ||||||||||||||||
|
| |||||||||||||||
Iowa: 0.25% |
| |||||||||||||||
| GO Revenue: 0.11% | ||||||||||||||||
Altoona IA Annual Appropriation Urban Renewal Refunding Bond | 5.00 | 6-1-2027 | 2,310,000 | 2,815,082 | ||||||||||||
|
| |||||||||||||||
| Utilities Revenue: 0.14% | ||||||||||||||||
Iowa Gas Project Public Expenditure and Financial Accountability Incorporated | 5.00 | 9-1-2049 | 3,000,000 | 3,620,340 | ||||||||||||
|
| |||||||||||||||
| 6,435,422 | ||||||||||||||||
|
| |||||||||||||||
Kansas: 0.29% |
| |||||||||||||||
| Health Revenue: 0.05% | ||||||||||||||||
Kansas Development Finance Authority Health Facilities Series F | 5.00 | 11-15-2021 | 1,300,000 | 1,370,356 | ||||||||||||
|
| |||||||||||||||
The accompanying notes are an integral part of these financial statements.
22 | Wells Fargo Intermediate Tax/AMT-Free Fund
Portfolio of investments—June 30, 2020
| Interest rate | Maturity date | Principal | Value | |||||||||||||
| Miscellaneous Revenue: 0.11% |
| |||||||||||||||
Kansas Development Finance Authority Agro-Defense Facility Series G | 5.00 | % | 4-1-2030 | $ | 2,650,000 | $ | 2,928,568 | |||||||||
|
| |||||||||||||||
| Tax Revenue: 0.05% | ||||||||||||||||
Wyandotte County & Kansas City KS Special Obligation Vacation Village Project Area 4 Major Multi-Sport Athletic Complex Project CAB Series 2015 144A¤ | 0.00 | 9-1-2034 | 3,350,000 | 1,369,380 | ||||||||||||
|
| |||||||||||||||
| Utilities Revenue: 0.08% | ||||||||||||||||
Burlington KS Environmental Impact Series A ø | 0.34 | 9-1-2035 | 2,000,000 | 2,000,000 | ||||||||||||
|
| |||||||||||||||
| 7,668,304 | ||||||||||||||||
|
| |||||||||||||||
Kentucky: 2.16% |
| |||||||||||||||
| Housing Revenue: 0.19% | ||||||||||||||||
Kentucky Housing MFHR City View Park Project øø | 1.16 | 2-1-2023 | 5,000,000 | 5,036,300 | ||||||||||||
|
| |||||||||||||||
| Transportation Revenue: 0.37% | ||||||||||||||||
Kentucky Public Transportation Infrastructure Authority Downtown Crossing Project CAB Series B ¤ | 0.00 | 7-1-2020 | 1,000,000 | 1,000,000 | ||||||||||||
Kentucky Public Transportation Infrastructure Authority Downtown Crossing Project CAB Series B ¤ | 0.00 | 7-1-2021 | 2,750,000 | 2,668,683 | ||||||||||||
Kentucky Public Transportation Infrastructure Authority Downtown Crossing Project CAB Series B ¤ | 0.00 | 7-1-2022 | 4,320,000 | 4,064,731 | ||||||||||||
Kentucky Public Transportation Infrastructure Authority Downtown Crossing Project CAB Series B ¤ | 0.00 | 7-1-2025 | 1,020,000 | 825,333 | ||||||||||||
Kentucky Public Transportation Infrastructure Authority Downtown Crossing Project CAB Series B ¤ | 0.00 | 7-1-2029 | 1,400,000 | 979,062 | ||||||||||||
| 9,537,809 | ||||||||||||||||
|
| |||||||||||||||
| Utilities Revenue: 1.60% | ||||||||||||||||
Kentucky Public Energy Authority Gas Supply Series A-1 | 4.00 | 12-1-2049 | 16,255,000 | 18,268,507 | ||||||||||||
Kentucky Public Energy Authority Gas Supply Series B | 4.00 | 1-1-2049 | 13,000,000 | 14,318,720 | ||||||||||||
Kentucky Public Energy Authority Gas Supply Series C-1 | 4.00 | 2-1-2050 | 8,000,000 | 9,347,360 | ||||||||||||
| 41,934,587 | ||||||||||||||||
|
| |||||||||||||||
| 56,508,696 | ||||||||||||||||
|
| |||||||||||||||
Louisiana: 1.52% |
| |||||||||||||||
| Airport Revenue: 0.13% | ||||||||||||||||
New Orleans LA Aviation Board Consolidated Rental Car Project (AGM Insured) | 5.00 | 1-1-2035 | 2,000,000 | 2,407,620 | ||||||||||||
New Orleans LA Aviation Board North Terminal Project Series A | 5.00 | 1-1-2033 | 750,000 | 886,665 | ||||||||||||
| 3,294,285 | ||||||||||||||||
|
| |||||||||||||||
| Education Revenue: 0.21% | ||||||||||||||||
Louisiana Public Facilities Authority Loyola University Project CAB ¤ | 0.00 | 10-1-2027 | 3,380,000 | 3,174,631 | ||||||||||||
Louisiana Public Facilities Authority Loyola University Project CAB ¤ | 0.00 | 10-1-2028 | 2,500,000 | 2,360,050 | ||||||||||||
| 5,534,681 | ||||||||||||||||
|
| |||||||||||||||
| Miscellaneous Revenue: 0.69% | ||||||||||||||||
Lafayette LA Communications System (AGM Insured) | 5.00 | 11-1-2025 | 1,500,000 | 1,806,780 | ||||||||||||
Louisiana Public Facilities Authority Archdiocese of New Orleans Project | 5.00 | 7-1-2024 | 1,000,000 | 690,000 | ||||||||||||
Louisiana Public Facilities Authority Archdiocese of New Orleans Project | 5.00 | 7-1-2025 | 600,000 | 414,000 | ||||||||||||
Louisiana Public Facilities Authority Archdiocese of New Orleans Project | 5.00 | 7-1-2026 | 500,000 | 345,000 | ||||||||||||
Louisiana Unclaimed Property Special Bond 1-49 South Project | 5.00 | 9-1-2026 | 2,000,000 | 2,361,540 | ||||||||||||
The accompanying notes are an integral part of these financial statements.
Wells Fargo Intermediate Tax/AMT-Free Fund | 23
Portfolio of investments—June 30, 2020
| Interest rate | Maturity date | Principal | Value | |||||||||||||
| Miscellaneous Revenue (continued) | ||||||||||||||||
Louisiana Unclaimed Property Special Bond 1-49 South Project | 5.00 | % | 9-1-2027 | $ | 2,700,000 | $ | 3,179,898 | |||||||||
Louisiana Unclaimed Property Special Bond 1-49 South Project | 5.00 | 9-1-2028 | 2,405,000 | 2,831,070 | ||||||||||||
Louisiana Unclaimed Property Special Bond 1-49 South Project | 5.00 | 9-1-2029 | 2,695,000 | 3,168,269 | ||||||||||||
Louisiana Unclaimed Property Special Bond 1-49 South Project | 5.00 | 9-1-2030 | 2,700,000 | 3,162,240 | ||||||||||||
| 17,958,797 | ||||||||||||||||
|
| |||||||||||||||
| Tax Revenue: 0.23% | ||||||||||||||||
Jefferson LA Sales Tax District Series B (AGM Insured) | 5.00 | 12-1-2031 | 1,000,000 | 1,226,030 | ||||||||||||
Jefferson LA Sales Tax District Series B (AGM Insured) | 5.00 | 12-1-2032 | 1,000,000 | 1,217,370 | ||||||||||||
St. Bernard Parish LA Sales Tax Refunding Bond | 4.00 | 3-1-2023 | 3,405,000 | 3,685,947 | ||||||||||||
| 6,129,347 | ||||||||||||||||
|
| |||||||||||||||
| Transportation Revenue: 0.14% | ||||||||||||||||
Greater New Orleans LA Expressway Commission Toll Subordinate Lien Bond (AGM Insured) | 5.00 | 11-1-2031 | 1,000,000 | 1,184,890 | ||||||||||||
Greater New Orleans LA Expressway Commission Toll Subordinate Lien Bond (AGM Insured) | 5.00 | 11-1-2032 | 1,000,000 | 1,179,650 | ||||||||||||
Greater New Orleans LA Expressway Commission Toll Subordinate Lien Bond (AGM Insured) | 5.00 | 11-1-2033 | 1,000,000 | 1,175,900 | ||||||||||||
| 3,540,440 | ||||||||||||||||
|
| |||||||||||||||
| Water & Sewer Revenue: 0.12% | ||||||||||||||||
Greater Ouachita LA Waterworks and Sewer System Refunding Bond (BAM Insured) | 4.00 | 9-1-2030 | 500,000 | 605,305 | ||||||||||||
Greater Ouachita LA Waterworks and Sewer System Refunding Bond (BAM Insured) | 4.00 | 9-1-2031 | 600,000 | 721,560 | ||||||||||||
Greater Ouachita LA Waterworks and Sewer System Refunding Bond (BAM Insured) | 4.00 | 9-1-2032 | 655,000 | 781,815 | ||||||||||||
Louisiana Local Government Environmental Facilities & CDA East Baton Rouge Series A | 5.00 | 2-1-2030 | 1,000,000 | 1,140,690 | ||||||||||||
| 3,249,370 | ||||||||||||||||
|
| |||||||||||||||
| 39,706,920 | ||||||||||||||||
|
| |||||||||||||||
Maine: 0.23% |
| |||||||||||||||
| Education Revenue: 0.23% | ||||||||||||||||
Maine Health and HEFAR University of New England Series A | 5.00 | 7-1-2029 | 1,015,000 | 1,206,825 | ||||||||||||
Maine Health and HEFAR University of New England Series A | 5.00 | 7-1-2030 | 1,200,000 | 1,419,828 | ||||||||||||
Maine Health and HEFAR University of New England Series A | 5.00 | 7-1-2032 | 1,415,000 | 1,651,206 | ||||||||||||
Maine Health and HEFAR University of New England Series A | 5.00 | 7-1-2033 | 1,485,000 | 1,719,214 | ||||||||||||
| 5,997,073 | ||||||||||||||||
|
| |||||||||||||||
Maryland: 2.26% |
| |||||||||||||||
| Education Revenue: 0.13% | ||||||||||||||||
Maryland Economic Development Corporation Salisbury University Project | 5.00 | 6-1-2027 | 500,000 | 523,485 | ||||||||||||
Westminster MD Educational Facilities McDaniel College | 5.00 | 11-1-2026 | 2,450,000 | 2,800,938 | ||||||||||||
| 3,324,423 | ||||||||||||||||
|
| |||||||||||||||
| GO Revenue: 1.72% | ||||||||||||||||
Anne Arundel MD General Improvements Bond | 4.00 | 10-1-2033 | 5,000,000 | 6,101,600 | ||||||||||||
Anne Arundel MD General Improvements Bond | 4.00 | 10-1-2034 | 2,350,000 | 2,855,861 | ||||||||||||
The accompanying notes are an integral part of these financial statements.
24 | Wells Fargo Intermediate Tax/AMT-Free Fund
Portfolio of investments—June 30, 2020
| Interest rate | Maturity date | Principal | Value | |||||||||||||
| GO Revenue (continued) | ||||||||||||||||
Howard County MD Metropolitan District Project Series B | 4.00 | % | 8-15-2030 | $ | 2,070,000 | $ | 2,552,269 | |||||||||
Howard County MD Metropolitan District Project Series B | 4.00 | 8-15-2032 | 1,430,000 | 1,740,753 | ||||||||||||
Maryland Series B | 4.00 | 8-1-2023 | 5,000,000 | 5,566,750 | ||||||||||||
Maryland Series B | 4.00 | 8-1-2024 | 15,000,000 | 17,193,150 | ||||||||||||
Prince Georges County MD Consolidated Public Improvement Bonds Series C | 4.00 | 8-1-2029 | 8,000,000 | 8,901,760 | ||||||||||||
| 44,912,143 | ||||||||||||||||
|
| |||||||||||||||
| Miscellaneous Revenue: 0.36% | ||||||||||||||||
Baltimore MD Public Schools Construction & Revitalization Program | 5.00 | 5-1-2041 | 5,000,000 | 5,754,400 | ||||||||||||
Maryland CDA Local Government Infrastructure Bond Series A-2 | 2.00 | 6-1-2022 | 460,000 | 473,124 | ||||||||||||
Prince Georges County MD Upper Marlboro Courthouse Project Series A | 5.00 | 5-1-2028 | 1,215,000 | 1,588,722 | ||||||||||||
Prince Georges County MD Upper Marlboro Courthouse Project Series A | 5.00 | 5-1-2029 | 1,275,000 | 1,660,139 | ||||||||||||
| 9,476,385 | ||||||||||||||||
|
| |||||||||||||||
| Tax Revenue: 0.05% | ||||||||||||||||
Howard County MD Downtown Columbia Project Series A 144A | 4.00 | 2-15-2028 | 500,000 | 504,850 | ||||||||||||
Howard County MD Downtown Columbia Project Series A 144A | 4.13 | 2-15-2034 | 1,000,000 | 984,090 | ||||||||||||
| 1,488,940 | ||||||||||||||||
|
| |||||||||||||||
| 59,201,891 | ||||||||||||||||
|
| |||||||||||||||
Massachusetts: 2.10% |
| |||||||||||||||
| Education Revenue: 0.06% | ||||||||||||||||
Massachusetts Development Finance Agency Lasell College | 5.00 | 7-1-2021 | 620,000 | 624,644 | ||||||||||||
Massachusetts Development Finance Agency Merrimack College Series A | 5.00 | 7-1-2021 | 1,035,000 | 1,058,784 | ||||||||||||
| 1,683,428 | ||||||||||||||||
|
| |||||||||||||||
| GO Revenue: 1.01% | ||||||||||||||||
Boston MA Series A | 4.00 | 4-1-2031 | 1,500,000 | 1,778,265 | ||||||||||||
Boston MA Series A | 5.00 | 4-1-2026 | 5,790,000 | 6,996,404 | ||||||||||||
Massachusetts Consolidated Loan Series D | 5.00 | 9-1-2028 | 10,000,000 | 12,155,100 | ||||||||||||
Massachusetts Series B | 5.00 | 7-1-2035 | 1,500,000 | 1,928,100 | ||||||||||||
Massachusetts Series B | 5.00 | 7-1-2036 | 2,700,000 | 3,456,540 | ||||||||||||
| 26,314,409 | ||||||||||||||||
|
| |||||||||||||||
| Miscellaneous Revenue: 0.50% | ||||||||||||||||
Massachusetts Consolidated Loan Series D øø | 1.05 | 8-1-2043 | 10,000,000 | 10,000,000 | ||||||||||||
Massachusetts Consolidated Loan Series I | 5.00 | 12-1-2030 | 2,570,000 | 3,223,680 | ||||||||||||
| 13,223,680 | ||||||||||||||||
|
| |||||||||||||||
| Tax Revenue: 0.53% | ||||||||||||||||
Massachusetts Bay Transportation Authority Series A | 5.25 | 7-1-2031 | 5,000,000 | 7,139,750 | ||||||||||||
Massachusetts Bay Transportation Authority Series A | 5.25 | 7-1-2033 | 1,555,000 | 2,260,348 | ||||||||||||
Massachusetts Bay Transportation Authority Series B-1 | 5.00 | 7-1-2032 | 3,250,000 | 4,379,473 | ||||||||||||
| 13,779,571 | ||||||||||||||||
|
| |||||||||||||||
| 55,001,088 | ||||||||||||||||
|
| |||||||||||||||
Michigan: 2.77% |
| |||||||||||||||
| Airport Revenue: 0.06% | ||||||||||||||||
Wayne County MI Airport Authority Detroit Metropolitan Bond Series A | 5.00 | 12-1-2032 | 800,000 | 959,176 | ||||||||||||
Wayne County MI Airport Authority Detroit Metropolitan Bond Series A | 5.00 | 12-1-2034 | 600,000 | 716,688 | ||||||||||||
| 1,675,864 | ||||||||||||||||
|
| |||||||||||||||
The accompanying notes are an integral part of these financial statements.
Wells Fargo Intermediate Tax/AMT-Free Fund | 25
Portfolio of investments—June 30, 2020
| Interest rate | Maturity date | Principal | Value | |||||||||||||
| Education Revenue: 0.30% |
| |||||||||||||||
Flint MI International Academy Public School | 5.38 | % | 10-1-2022 | $ | 1,440,000 | $ | 1,441,483 | |||||||||
Flint MI International Academy Public School | 5.50 | 10-1-2027 | 1,985,000 | 1,986,171 | ||||||||||||
Michigan State University Board of Trustees | 5.00 | 2-15-2036 | 1,325,000 | 1,664,783 | ||||||||||||
Western Michigan University Board of Trustees | 5.25 | 11-15-2027 | 600,000 | 689,556 | ||||||||||||
Western Michigan University Board of Trustees | 5.25 | 11-15-2029 | 1,000,000 | 1,147,450 | ||||||||||||
Western Michigan University Board of Trustees (AGM Insured) | 5.25 | 11-15-2033 | 750,000 | 863,565 | ||||||||||||
| 7,793,008 | ||||||||||||||||
|
| |||||||||||||||
| GO Revenue: 0.39% | ||||||||||||||||
Eaton Rapids MI Public Schools (School Bond Loan Fund Insured) | 5.00 | 5-1-2022 | 1,785,000 | 1,931,852 | ||||||||||||
Kent County MI Limited Tax Capital Improvement Bond | 5.00 | 6-1-2030 | 1,040,000 | 1,292,585 | ||||||||||||
Pinckney MI Community School District (School Bond Loan Fund Insured) | 5.00 | 5-1-2025 | 2,040,000 | 2,358,097 | ||||||||||||
Pinckney MI Community School District (School Bond Loan Fund Insured) | 5.00 | 5-1-2026 | 2,505,000 | 2,883,330 | ||||||||||||
Southfield MI 2015 Street Improvement | 4.00 | 5-1-2025 | 1,490,000 | 1,719,520 | ||||||||||||
| 10,185,384 | ||||||||||||||||
|
| |||||||||||||||
| Health Revenue: 0.66% | ||||||||||||||||
Michigan Finance Authority Bronson Healthcare Group Series B & C | 3.75 | 11-15-2049 | 5,000,000 | 5,704,300 | ||||||||||||
Michigan Finance Authority Sparrow Obligated Group | 5.00 | 11-15-2023 | 400,000 | 436,628 | ||||||||||||
Michigan Finance Authority Sparrow Obligated Group | 5.00 | 11-15-2026 | 800,000 | 867,280 | ||||||||||||
Michigan Finance Authority Trinity Health Credit Group Series MI-2 | 4.00 | 12-1-2035 | 3,000,000 | 3,471,810 | ||||||||||||
Michigan Hospital Finance Authority Ascension Health Senior Credit Group Series F-2 | 1.90 | 11-15-2047 | 6,570,000 | 6,632,546 | ||||||||||||
| 17,112,564 | ||||||||||||||||
|
| |||||||||||||||
| Miscellaneous Revenue: 0.44% | ||||||||||||||||
Michigan Building Authority Refunding Bond | 5.00 | 4-15-2036 | 3,000,000 | 3,895,770 | ||||||||||||
Michigan Finance Authority Local Government Loan Program Series F | 4.00 | 10-1-2024 | 3,000,000 | 3,135,600 | ||||||||||||
Michigan Strategic Fund Limited Obligation Cadillac Place Office Building Project | 5.25 | 10-15-2025 | 4,165,000 | 4,398,115 | ||||||||||||
| 11,429,485 | ||||||||||||||||
|
| |||||||||||||||
| Water & Sewer Revenue: 0.92% | ||||||||||||||||
Great Lakes MI Water Authority Sewage Disposal System Series C | 5.00 | 7-1-2030 | 3,350,000 | 4,080,401 | ||||||||||||
Michigan Finance Authority Local Government Loan Program Series D (National Insured) | 5.00 | 7-1-2025 | 1,000,000 | 1,170,620 | ||||||||||||
Michigan Finance Authority Local Government Loan Program Series D | 5.00 | 7-1-2030 | 12,000,000 | 13,510,560 | ||||||||||||
Michigan Finance Authority Local Government Loan Program Series D (AGM Insured) | 5.00 | 7-1-2035 | 2,750,000 | 3,095,043 | ||||||||||||
Michigan Finance Authority Local Government Loan Program Series D (AGM Insured) | 5.00 | 7-1-2037 | 2,000,000 | 2,241,880 | ||||||||||||
| 24,098,504 | ||||||||||||||||
|
| |||||||||||||||
| 72,294,809 | ||||||||||||||||
|
| |||||||||||||||
Minnesota: 0.02% |
| |||||||||||||||
| Education Revenue: 0.02% | ||||||||||||||||
Minnesota HEFAR Concordia University Series 6Q (U.S. Bank NA LOC) ø | 0.14 | 4-1-2037 | 600,000 | 600,000 | ||||||||||||
|
| |||||||||||||||
Mississippi: 0.72% |
| |||||||||||||||
| Health Revenue: 0.14% | ||||||||||||||||
Mississippi Hospital Equipment & Facilities Authority North Mississippi Health Services Series IV %% | 5.00 | 10-1-2037 | 1,000,000 | 1,210,160 | ||||||||||||
The accompanying notes are an integral part of these financial statements.
26 | Wells Fargo Intermediate Tax/AMT-Free Fund
Portfolio of investments—June 30, 2020
| Interest rate | Maturity date | Principal | Value | |||||||||||||
| Health Revenue (continued) | ||||||||||||||||
Mississippi Hospital Equipment & Facilities Authority North Mississippi Health Services Series IV %% | 5.00 | % | 10-1-2038 | $ | 1,000,000 | $ | 1,206,600 | |||||||||
Mississippi Hospital Equipment & Facilities Authority North Mississippi Health Services Series IV %% | 5.00 | 10-1-2039 | 1,000,000 | 1,203,340 | ||||||||||||
| 3,620,100 | ||||||||||||||||
|
| |||||||||||||||
| Water & Sewer Revenue: 0.58% | ||||||||||||||||
Mississippi Development Bank Special Obligation Jackson Water & Sewer System Project (AGM Insured) | 6.00 | 12-1-2023 | 1,145,000 | 1,320,861 | ||||||||||||
Mississippi Development Bank Special Obligation Jackson Water & Sewer System Project Series A (AGM Insured) | 5.00 | 9-1-2030 | 10,000,000 | 10,811,800 | ||||||||||||
West Rankin MS Utility Authority Series 2018 (AGM Insured) | 5.00 | 1-1-2026 | 525,000 | 617,479 | ||||||||||||
West Rankin MS Utility Authority Series 2018 (AGM Insured) | 5.00 | 1-1-2027 | 435,000 | 509,459 | ||||||||||||
West Rankin MS Utility Authority Series 2018 (AGM Insured) | 5.00 | 1-1-2034 | 750,000 | 860,048 | ||||||||||||
West Rankin MS Utility Authority Series 2018 (AGM Insured) | 5.00 | 1-1-2035 | 1,000,000 | 1,144,490 | ||||||||||||
| 15,264,137 | ||||||||||||||||
|
| |||||||||||||||
| 18,884,237 | ||||||||||||||||
|
| |||||||||||||||
Missouri: 1.32% |
| |||||||||||||||
| Education Revenue: 0.10% | ||||||||||||||||
Missouri HEFA Webster University Project | 5.00 | 4-1-2027 | 2,450,000 | 2,662,881 | ||||||||||||
|
| |||||||||||||||
| GO Revenue: 0.04% | ||||||||||||||||
Belton MO School District #124 Missouri Direct Deposit Program Project | 5.00 | 3-1-2026 | 750,000 | 930,795 | ||||||||||||
|
| |||||||||||||||
| Health Revenue: 0.93% | ||||||||||||||||
Missouri HEFA Series E ø | 0.13 | 5-15-2038 | 24,360,000 | 24,360,000 | ||||||||||||
|
| |||||||||||||||
| Miscellaneous Revenue: 0.25% | ||||||||||||||||
Kansas City MO Municipal Assistance Corporation CAB Series B-1 (Ambac Insured) ¤ | 0.00 | 4-15-2022 | 3,640,000 | 3,587,802 | ||||||||||||
Poplar Bluff MO School District (AGM Insured) | 5.00 | 3-1-2032 | 1,500,000 | 1,709,955 | ||||||||||||
Poplar Bluff MO School District (AGM Insured) | 5.00 | 3-1-2034 | 1,000,000 | 1,135,360 | ||||||||||||
| 6,433,117 | ||||||||||||||||
|
| |||||||||||||||
| 34,386,793 | ||||||||||||||||
|
| |||||||||||||||
Nebraska: 0.34% |
| |||||||||||||||
| Health Revenue: 0.09% | ||||||||||||||||
Douglas County NE Hospital Authority Children’s Hospital Obligated Group Series A | 4.00 | 11-15-2038 | 1,200,000 | 1,373,484 | ||||||||||||
Lincoln County NE Hospital Authority Great Plains Regional Medical Center | 5.00 | 11-1-2024 | 1,000,000 | 1,060,150 | ||||||||||||
| 2,433,634 | ||||||||||||||||
|
| |||||||||||||||
| Utilities Revenue: 0.25% | ||||||||||||||||
Nebraska Central Plains Energy Gas Project #1 (Royal Bank of Canada LIQ) | 4.00 | 12-1-2049 | 2,430,000 | 2,758,244 | ||||||||||||
Nebraska Central Plains Energy Gas Project #3 | 5.00 | 9-1-2027 | 1,290,000 | 1,380,042 | ||||||||||||
Nebraska Central Plains Energy Gas Project #4 | 5.00 | 3-1-2050 | 2,000,000 | 2,246,460 | ||||||||||||
| 6,384,746 | ||||||||||||||||
|
| |||||||||||||||
| 8,818,380 | ||||||||||||||||
|
| |||||||||||||||
The accompanying notes are an integral part of these financial statements.
Wells Fargo Intermediate Tax/AMT-Free Fund | 27
Portfolio of investments—June 30, 2020
| Interest rate | Maturity date | Principal | Value | |||||||||||||
Nevada: 1.37% |
| |||||||||||||||
| GO Revenue: 1.34% | ||||||||||||||||
Clark County NV Refunding Bond | 5.00 | % | 6-1-2030 | $ | 3,955,000 | $ | 4,929,117 | |||||||||
Clark County NV Refunding Bond Series B | 5.00 | 11-1-2028 | 5,000,000 | 6,187,200 | ||||||||||||
Clark County NV School District Building Bond Series A (AGM Insured) | 4.00 | 6-15-2034 | 6,790,000 | 7,704,070 | ||||||||||||
Clark County NV Stadium Improvement Bond Series A | 5.00 | 6-1-2032 | 1,615,000 | 2,028,925 | ||||||||||||
Clark County NV Stadium Improvement Bond Series A | 5.00 | 6-1-2033 | 3,900,000 | 4,872,114 | ||||||||||||
Clark County NV Water Reclamation District | 5.00 | 7-1-2027 | 4,155,000 | 5,018,825 | ||||||||||||
Las Vegas NV Series A | 5.00 | 5-1-2031 | 1,985,000 | 2,289,658 | ||||||||||||
Las Vegas NV Valley Water District Series A | 4.00 | 6-1-2028 | 1,665,000 | 1,906,192 | ||||||||||||
| 34,936,101 | ||||||||||||||||
|
| |||||||||||||||
| Miscellaneous Revenue: 0.03% | ||||||||||||||||
Las Vegas NV Special Improvement District #607 | 4.00 | 6-1-2021 | 615,000 | 622,755 | ||||||||||||
Las Vegas NV Special Improvement District #607 | 4.25 | 6-1-2024 | 200,000 | 209,078 | ||||||||||||
| 831,833 | ||||||||||||||||
|
| |||||||||||||||
| 35,767,934 | ||||||||||||||||
|
| |||||||||||||||
New Hampshire: 0.13% |
| |||||||||||||||
| Housing Revenue: 0.13% | ||||||||||||||||
New Hampshire HFA SFMR Acquisition Series E & F | 4.80 | 7-1-2028 | 690,000 | 699,598 | ||||||||||||
New Hampshire National Finance Authority Municipal Certificates Series A | 4.13 | 1-20-2034 | 2,486,397 | 2,665,020 | ||||||||||||
| 3,364,618 | ||||||||||||||||
|
| |||||||||||||||
New Jersey: 3.20% |
| |||||||||||||||
| Airport Revenue: 0.18% | ||||||||||||||||
South Jersey NJ Port Corporation Marine Terminal Refunding Bond Series S | 5.00 | 1-1-2028 | 2,130,000 | 2,371,819 | ||||||||||||
South Jersey NJ Port Corporation Marine Terminal Refunding Bond Series S | 5.00 | 1-1-2029 | 2,200,000 | 2,442,946 | ||||||||||||
| 4,814,765 | ||||||||||||||||
|
| |||||||||||||||
| GO Revenue: 0.48% | ||||||||||||||||
Montclair NJ School Refunding Bond Series B | 4.00 | 3-1-2026 | 500,000 | 594,620 | ||||||||||||
Trenton City NJ (BAM Insured) | 5.00 | 12-1-2022 | 1,630,000 | 1,795,820 | ||||||||||||
Trenton City NJ (BAM Insured) | 5.00 | 12-1-2024 | 1,775,000 | 2,081,046 | ||||||||||||
Trenton City NJ (BAM Insured) | 5.00 | 12-1-2025 | 1,860,000 | 2,239,626 | ||||||||||||
Trenton City NJ (BAM Insured) | 5.00 | 12-1-2026 | 1,000,000 | 1,196,540 | ||||||||||||
Union County NJ General Improvement Bond | 3.00 | 3-1-2026 | 4,165,000 | 4,626,024 | ||||||||||||
| 12,533,676 | ||||||||||||||||
|
| |||||||||||||||
| Miscellaneous Revenue: 1.52% | ||||||||||||||||
Essex County NJ Import Authority Series A | 6.00 | 11-1-2025 | 5,000,000 | 5,092,900 | ||||||||||||
New Jersey EDA Motor Vehicle Surcharges Revenue Refunding Bond Series A | 3.13 | 7-1-2029 | 725,000 | 721,752 | ||||||||||||
New Jersey EDA Motor Vehicle Surcharges Series A | 5.00 | 7-1-2033 | 2,500,000 | 2,774,275 | ||||||||||||
New Jersey EDA Motor Vehicle Surcharges Unrefunded Bond Series A (National Insured) | 5.25 | 7-1-2026 | 2,320,000 | 2,653,152 | ||||||||||||
New Jersey EDA School Facilities Construction Refunding Bond Series NN | 5.00 | 3-1-2021 | 1,210,000 | 1,244,231 | ||||||||||||
New Jersey EDA School Facilities Construction Refunding Bond Series NN | 5.00 | 3-1-2021 | 3,105,000 | 3,161,076 | ||||||||||||
New Jersey EDA School Facilities Construction Refunding Bond Series NN | 5.00 | 3-1-2023 | 3,000,000 | 3,208,560 | ||||||||||||
New Jersey EDA School Facilities Construction Refunding Bond Series NN | 5.00 | 3-1-2026 | 9,830,000 | 10,432,186 | ||||||||||||
New Jersey EDA School Facilities Construction Refunding Bond Series XX | 5.00 | 6-15-2022 | 5,020,000 | 5,279,283 | ||||||||||||
The accompanying notes are an integral part of these financial statements.
28 | Wells Fargo Intermediate Tax/AMT-Free Fund
Portfolio of investments—June 30, 2020
| Interest rate | Maturity date | Principal | Value | |||||||||||||
| Miscellaneous Revenue (continued) | ||||||||||||||||
New Jersey Educational Facilities Authority | 5.00 | % | 6-15-2026 | $ | 3,015,000 | $ | 3,280,410 | |||||||||
New Jersey Sports & Exposition Authority (National Insured) | 5.50 | 3-1-2022 | 1,755,000 | 1,904,508 | ||||||||||||
| 39,752,333 | ||||||||||||||||
|
| |||||||||||||||
| Tax Revenue: 0.24% | ||||||||||||||||
New Jersey Garden State Preservation Trust Open & Farmland Series A (AGM Insured) | 5.75 | 11-1-2028 | 5,000,000 | 6,214,450 | ||||||||||||
|
| |||||||||||||||
| Tobacco Revenue: 0.10% | ||||||||||||||||
New Jersey EDA Cigarette Tax Refunding Bond | 5.00 | 6-15-2021 | 2,500,000 | 2,550,600 | ||||||||||||
|
| |||||||||||||||
| Transportation Revenue: 0.68% | ||||||||||||||||
New Jersey TTFA CAB Series A ¤ | 0.00 | 12-15-2030 | 2,000,000 | 1,377,140 | ||||||||||||
New Jersey TTFA Series A | 5.00 | 12-15-2036 | 2,000,000 | 2,233,660 | ||||||||||||
New Jersey TTFA Series A | 5.25 | 12-15-2020 | 1,305,000 | 1,323,348 | ||||||||||||
New Jersey TTFA Series A | 5.25 | 6-15-2024 | 1,695,000 | 1,774,767 | ||||||||||||
New Jersey TTFA Series A | 5.25 | 6-15-2025 | 2,000,000 | 2,051,120 | ||||||||||||
New Jersey TTFA Series C | 5.25 | 6-15-2032 | 2,500,000 | 2,717,575 | ||||||||||||
New Jersey TTFA Unrefunded Balance Bond (National Insured) | 5.25 | 12-15-2021 | 6,000,000 | 6,254,880 | ||||||||||||
| 17,732,490 | ||||||||||||||||
|
| |||||||||||||||
| 83,598,314 | ||||||||||||||||
|
| |||||||||||||||
New Mexico: 0.77% |
| |||||||||||||||
| GO Revenue: 0.13% | ||||||||||||||||
Albuquerque, Bernalillo & Sandoval Counties NM Municipal School District #12 | 5.00 | 8-1-2025 | 400,000 | 484,952 | ||||||||||||
Albuquerque, Bernalillo & Sandoval Counties NM Municipal School District #12 | 5.00 | 8-1-2026 | 1,205,000 | 1,500,273 | ||||||||||||
Albuquerque, Bernalillo & Sandoval Counties NM Municipal School District #12 | 5.00 | 8-1-2034 | 1,150,000 | 1,462,375 | ||||||||||||
| 3,447,600 | ||||||||||||||||
|
| |||||||||||||||
| Housing Revenue: 0.03% | ||||||||||||||||
New Mexico Mortgage Finance Authority SFMR Class I Series A (GNMA/FNMA/FHLMC Insured) | 4.63 | 9-1-2025 | 520,000 | 522,855 | ||||||||||||
New Mexico Mortgage Finance Authority SFMR Class I Series B (GNMA/FNMA/FHLMC Insured) | 5.00 | 3-1-2028 | 235,000 | 236,462 | ||||||||||||
| 759,317 | ||||||||||||||||
|
| |||||||||||||||
| Miscellaneous Revenue: 0.45% | ||||||||||||||||
Clayton NM Jail Project Improvement & Refunding Bond (National Insured) | 5.00 | 11-1-2028 | 9,265,000 | 10,640,760 | ||||||||||||
Clayton NM Jail Project Improvement & Refunding Bond (National Insured) | 5.00 | 11-1-2029 | 1,000,000 | 1,144,680 | ||||||||||||
| 11,785,440 | ||||||||||||||||
|
| |||||||||||||||
| Utilities Revenue: 0.12% | ||||||||||||||||
New Mexico Municipal Energy Acquisition Authority Gas Supply Revenue Refunding Bond and Acquisition Subordinated Series A (Royal Bank of Canada LIQ) | 5.00 | 11-1-2039 | 2,570,000 | 3,021,935 | ||||||||||||
|
| |||||||||||||||
| Water & Sewer Revenue: 0.04% | ||||||||||||||||
Albuquerque & Bernalillo Counties NM Water Utility Authority Series B | 5.00 | 7-1-2024 | 1,000,000 | 1,178,860 | ||||||||||||
|
| |||||||||||||||
| 20,193,152 | ||||||||||||||||
|
| |||||||||||||||
The accompanying notes are an integral part of these financial statements.
Wells Fargo Intermediate Tax/AMT-Free Fund | 29
Portfolio of investments—June 30, 2020
| Interest rate | Maturity date | Principal | Value | |||||||||||||
New York: 8.39% |
| |||||||||||||||
| Education Revenue: 0.87% | ||||||||||||||||
Albany NY IDA Foundation State University Project Series A ø | 0.33 | % | 7-1-2032 | $ | 2,520,000 | $ | 2,520,000 | |||||||||
Dutchess County NY Local Development Corporation The Culinary Institute of America Project Series A-1 | 5.00 | 7-1-2027 | 335,000 | 375,428 | ||||||||||||
Hempstead NY Local Development Corporation The Academy Charter School Project Series A | 6.24 | 2-1-2047 | 1,750,000 | 1,824,515 | ||||||||||||
Hempstead Town NY Local Development Corporation The Academy Charter School Project Series A %% | 5.53 | 2-1-2040 | 2,725,000 | 2,730,886 | ||||||||||||
Hempstead Town NY Local Development Corporation The Academy Charter School Project Series A | 5.89 | 2-1-2032 | 2,745,000 | 2,885,132 | ||||||||||||
Hempstead Town NY Local Development Corporation The Academy Charter School Project Series A | 7.65 | 2-1-2044 | 2,660,000 | 2,770,895 | ||||||||||||
Hempstead Town NY Local Development Corporation The Academy Charter School Project Series B %% | 5.57 | 2-1-2041 | 4,140,000 | 4,148,942 | ||||||||||||
Monroe County NY Industrial Development Monroe Community College Project Series A (AGM Insured) | 5.00 | 1-15-2022 | 790,000 | 838,546 | ||||||||||||
Monroe County NY Industrial Development Monroe Community College Project Series A (AGM Insured) | 5.00 | 1-15-2023 | 645,000 | 710,732 | ||||||||||||
Monroe County NY Industrial Development Monroe Community College Project Series A (AGM Insured) | 5.00 | 1-15-2024 | 905,000 | 1,030,840 | ||||||||||||
Niagara NY Area Development Corporation | 5.00 | 5-1-2022 | 1,350,000 | 1,451,277 | ||||||||||||
Troy NY Capital Resource Corporation Rensselaer Polytechnic Series B | 5.00 | 9-1-2020 | 1,430,000 | 1,437,979 | ||||||||||||
| 22,725,172 | ||||||||||||||||
|
| |||||||||||||||
| GO Revenue: 0.95% | ||||||||||||||||
Hempstead Town Nassau County NY Public Improvement Series A | 4.00 | 6-15-2028 | 5,000,000 | 5,674,000 | ||||||||||||
Nassau County NY | 5.00 | 10-1-2024 | 4,965,000 | 5,788,495 | ||||||||||||
New York NY Series B | 5.00 | 12-1-2032 | 2,000,000 | 2,430,220 | ||||||||||||
New York NY Series C | 5.00 | 8-1-2031 | 5,000,000 | 5,824,100 | ||||||||||||
Suffolk County NY Series A | 5.00 | 3-19-2021 | 4,000,000 | 4,092,960 | ||||||||||||
Yonkers NY Series A (AGM Insured) | 5.00 | 10-1-2024 | 1,000,000 | 1,059,240 | ||||||||||||
| 24,869,015 | ||||||||||||||||
|
| |||||||||||||||
| Housing Revenue: 0.09% | ||||||||||||||||
East Rochester NY Housing Authority Home Good Shepherd Project Series A (Citizens Bank LOC) ø | 0.30 | 12-1-2036 | 2,420,000 | 2,420,000 | ||||||||||||
|
| |||||||||||||||
| Industrial Development Revenue: 0.13% | ||||||||||||||||
Monroe County NY IDA Continuing Development Services Project (Citizens Bank LOC) ø | 0.30 | 7-1-2027 | 900,000 | 900,000 | ||||||||||||
New York Liberty Development Corporation Refunding Bond | 2.80 | 9-15-2069 | 1,000,000 | 979,880 | ||||||||||||
Port Authority New York & New Jersey Special Obligation | 5.00 | 12-1-2020 | 1,575,000 | 1,587,474 | ||||||||||||
| 3,467,354 | ||||||||||||||||
|
| |||||||||||||||
| Miscellaneous Revenue: 0.31% | ||||||||||||||||
New York Dormitory Authority Series D | 5.00 | 10-1-2031 | 2,005,000 | 2,451,113 | ||||||||||||
New York NY Transitional Finance Authority Building Aid Bond Series S-1 | 5.00 | 7-15-2032 | 2,530,000 | 3,129,104 | ||||||||||||
New York NY Trust for Cultural Resources Series A-1 | 5.00 | 7-1-2031 | 2,475,000 | 2,518,486 | ||||||||||||
| 8,098,703 | ||||||||||||||||
|
| |||||||||||||||
| Tax Revenue: 2.79% | ||||||||||||||||
New York Convention Center Development Corporation | 5.00 | 11-15-2028 | 8,000,000 | 8,916,960 | ||||||||||||
New York Dormitory Authority Series A | 5.00 | 3-15-2028 | 5,000,000 | 5,915,200 | ||||||||||||
New York Dormitory Authority Series A | 5.00 | 2-15-2031 | 3,000,000 | 3,666,900 | ||||||||||||
The accompanying notes are an integral part of these financial statements.
30 | Wells Fargo Intermediate Tax/AMT-Free Fund
Portfolio of investments—June 30, 2020
| Interest rate | Maturity date | Principal | Value | |||||||||||||
| Tax Revenue (continued) | ||||||||||||||||
New York Dormitory Authority Series B (Ambac Insured) | 5.50 | % | 3-15-2025 | $ | 3,885,000 | $ | 4,749,995 | |||||||||
New York Dormitory Authority Series D | 4.00 | 2-15-2037 | 5,000,000 | 5,887,350 | ||||||||||||
New York Dormitory Authority Series D | 4.00 | 2-15-2039 | 5,000,000 | 5,845,000 | ||||||||||||
New York Dormitory Authority Series E | 5.00 | 3-15-2035 | 15,000,000 | 18,938,250 | ||||||||||||
New York NY Transitional Finance Authority Series B | 5.00 | 8-1-2027 | 1,145,000 | 1,335,402 | ||||||||||||
New York NY Transitional Finance Authority Series C | 5.00 | 11-1-2027 | 5,000,000 | 5,951,950 | ||||||||||||
New York NY Transitional Finance Authority Series C4 (Landesbank Hessen-Thüringen SPA) ø | 0.13 | 8-1-2031 | 200,000 | 200,000 | ||||||||||||
New York NY Transitional Finance Authority Subordinate Bond Series B-1 | 5.00 | 11-1-2028 | 1,000,000 | 1,206,830 | ||||||||||||
New York Urban Development Corporation Personal Income Tax Series A | 5.00 | 3-15-2031 | 3,815,000 | 4,367,870 | ||||||||||||
New York Urban Development Corporation Personal income Tax Series A | 5.00 | 3-15-2032 | 5,000,000 | 5,979,500 | ||||||||||||
| 72,961,207 | ||||||||||||||||
|
| |||||||||||||||
| Tobacco Revenue: 0.04% | ||||||||||||||||
Suffolk NY Tobacco Asset Securitization Corporation Tobacco Settlement Series B | 4.00 | 6-1-2022 | 420,000 | 429,240 | ||||||||||||
Suffolk NY Tobacco Asset Securitization Corporation Tobacco Settlement Series B | 5.00 | 6-1-2023 | 500,000 | 520,065 | ||||||||||||
| 949,305 | ||||||||||||||||
|
| |||||||||||||||
| Transportation Revenue: 2.73% | ||||||||||||||||
Metropolitan Transportation Authority Series A | 5.00 | 11-15-2024 | 6,010,000 | 6,550,479 | ||||||||||||
Metropolitan Transportation Authority Series A | 5.00 | 11-15-2027 | 12,640,000 | 14,354,616 | ||||||||||||
Metropolitan Transportation Authority Series A | 5.00 | 11-15-2030 | 4,010,000 | 4,203,202 | ||||||||||||
Metropolitan Transportation Authority Series C | 5.00 | 11-15-2034 | 4,205,000 | 4,790,084 | ||||||||||||
Metropolitan Transportation Authority Series C | 5.25 | 11-15-2029 | 3,460,000 | 3,885,269 | ||||||||||||
Metropolitan Transportation Authority Series C | 5.25 | 11-15-2031 | 11,540,000 | 13,041,700 | ||||||||||||
Metropolitan Transportation Authority Series D | 5.00 | 11-15-2027 | 2,000,000 | 2,268,360 | ||||||||||||
Metropolitan Transportation Authority Series F | 5.00 | 11-15-2028 | 2,450,000 | 2,572,500 | ||||||||||||
Triborough NY Bridges & Tunnels Authority Series B | 5.00 | 11-15-2030 | 6,030,000 | 8,114,812 | ||||||||||||
Triborough NY Bridges & Tunnels Authority Series C | 5.00 | 11-15-2034 | 4,165,000 | 5,223,493 | ||||||||||||
Triborough NY Bridges & Tunnels Authority Series C | 5.00 | 11-15-2035 | 5,015,000 | 6,255,009 | ||||||||||||
| 71,259,524 | ||||||||||||||||
|
| |||||||||||||||
| Utilities Revenue: 0.12% | ||||||||||||||||
New York Tender Option Bond Trust Bond Trust Receipts\Floater Certificates Series 2020-XF0945 (JPMorgan Chase & Company LIQ) 144Aø | 0.17 | 11-15-2027 | 1,750,000 | 1,750,000 | ||||||||||||
New York Utility Debt Securitization Authority | 5.00 | 12-15-2032 | 1,250,000 | 1,425,588 | ||||||||||||
| 3,175,588 | ||||||||||||||||
|
| |||||||||||||||
| Water & Sewer Revenue: 0.36% | ||||||||||||||||
New York NY Municipal Water Finance Authority Fiscal 2010 Series CC (Barclays Bank plc SPA) ø | 0.11 | 6-15-2041 | 900,000 | 900,000 | ||||||||||||
New York NY Municipal Water Finance Authority Series GG | 5.00 | 6-15-2029 | 1,295,000 | 1,559,361 | ||||||||||||
New York NY Municipal Water Finance Authority Series HH | 5.00 | 6-15-2037 | 4,000,000 | 4,718,400 | ||||||||||||
Western Nassau NY Water Authority Series A | 5.00 | 4-1-2027 | 385,000 | 454,069 | ||||||||||||
Western Nassau NY Water Authority Series A | 5.00 | 4-1-2028 | 300,000 | 352,968 | ||||||||||||
Western Nassau NY Water Authority Series B | 5.00 | 4-1-2024 | 430,000 | 497,286 | ||||||||||||
Western Nassau NY Water Authority Series B | 5.00 | 4-1-2026 | 755,000 | 893,988 | ||||||||||||
| 9,376,072 | ||||||||||||||||
|
| |||||||||||||||
| 219,301,940 | ||||||||||||||||
|
| |||||||||||||||
The accompanying notes are an integral part of these financial statements.
Wells Fargo Intermediate Tax/AMT-Free Fund | 31
Portfolio of investments—June 30, 2020
| Interest rate | Maturity date | Principal | Value | |||||||||||||
North Carolina: 0.12% |
| |||||||||||||||
| Miscellaneous Revenue: 0.12% | ||||||||||||||||
North Carolina Grant Anticipation Vehicle Bond | 5.00 | % | 3-1-2029 | $ | 2,470,000 | $ | 2,910,253 | |||||||||
Onslow County NC Limited Obligation Series A | 4.00 | 6-1-2022 | 90,000 | 96,404 | ||||||||||||
| 3,006,657 | ||||||||||||||||
|
| |||||||||||||||
Ohio: 1.86% |
| |||||||||||||||
| Education Revenue: 0.04% | ||||||||||||||||
Summit County OH Port Authority University of Akron Student Housing Project Prerefunded Bond | 5.25 | 1-1-2024 | 685,000 | 702,009 | ||||||||||||
Summit County OH Port Authority University of Akron Student Housing Project Unrefunded Bond | 5.25 | 1-1-2024 | 315,000 | 322,821 | ||||||||||||
| 1,024,830 | ||||||||||||||||
|
| |||||||||||||||
| GO Revenue: 0.09% | ||||||||||||||||
Columbus OH Various Purposes Series 2 | 5.00 | 7-1-2026 | 1,775,000 | 2,222,637 | ||||||||||||
|
| |||||||||||||||
| Health Revenue: 0.05% | ||||||||||||||||
Hamilton OH Hospital Facilities UC Health | 5.00 | 9-15-2035 | 1,100,000 | 1,361,888 | ||||||||||||
|
| |||||||||||||||
| Miscellaneous Revenue: 0.60% | ||||||||||||||||
Cincinnati OH City School District Improvement Project Certificate of Participation | 5.00 | 12-15-2024 | 4,815,000 | 5,739,576 | ||||||||||||
Cincinnati OH City School District Improvement Project Certificate of Participation | 5.00 | 12-15-2025 | 2,095,000 | 2,491,185 | ||||||||||||
Clermont County OH Port Authority West Clermont Local School District Project (BAM Insured) | 5.00 | 12-1-2025 | 500,000 | 607,920 | ||||||||||||
Clermont County OH Port Authority West Clermont Local School District Project (BAM Insured) | 5.00 | 12-1-2026 | 600,000 | 724,566 | ||||||||||||
Clermont County OH Port Authority West Clermont Local School District Project (BAM Insured) | 5.00 | 12-1-2028 | 1,250,000 | 1,505,125 | ||||||||||||
JobsOhio Beverage System Statewide Liquor Profits Senior Lien Series A | 5.00 | 1-1-2022 | 2,500,000 | 2,675,000 | ||||||||||||
Ohio Building Authority Series A | 5.00 | 10-1-2024 | 1,000,000 | 1,058,980 | ||||||||||||
RiverSouth OH Lazarus Building Redevelopment Series A | 5.75 | 12-1-2027 | 770,000 | 770,932 | ||||||||||||
| 15,573,284 | ||||||||||||||||
|
| |||||||||||||||
| Tax Revenue: 0.12% | ||||||||||||||||
Cleveland OH Subordinate Lien Income Tax Refunding Bond Series B-1 | 5.00 | 10-1-2030 | 2,500,000 | 3,138,725 | ||||||||||||
|
| |||||||||||||||
| Tobacco Revenue: 0.09% | ||||||||||||||||
Buckeye OH Tobacco Settlement Financing Authority Refunding Bond | 4.00 | 6-1-2038 | 2,100,000 | 2,406,810 | ||||||||||||
|
| |||||||||||||||
| Transportation Revenue: 0.04% | ||||||||||||||||
Ohio Turnpike Commission Junior Lien Infrastructure Projects Series A-1 | 5.25 | 2-15-2029 | 1,000,000 | 1,110,190 | ||||||||||||
|
| |||||||||||||||
| Utilities Revenue: 0.43% | ||||||||||||||||
Cleveland OH Public Power System Refunding Bond (AGM Insured) | 5.00 | 11-15-2033 | 625,000 | 792,069 | ||||||||||||
Hamilton OH Electric System Improvement & Refunding Bond (BAM Insured) | 4.00 | 10-1-2034 | 710,000 | 830,089 | ||||||||||||
Hamilton OH Electric System Improvement & Refunding Bond (BAM Insured) | 4.00 | 10-1-2035 | 1,000,000 | 1,159,240 | ||||||||||||
Lancaster OH Port Authority Gas Supply (Royal Bank of Canada LIQ) | 5.00 | 8-1-2049 | 3,000,000 | 3,500,730 | ||||||||||||
Ohio Air Quality Development Authority Ohio Valley Electric Corporation Project Series A | 3.25 | 9-1-2029 | 1,000,000 | 1,027,400 | ||||||||||||
The accompanying notes are an integral part of these financial statements.
32 | Wells Fargo Intermediate Tax/AMT-Free Fund
Portfolio of investments—June 30, 2020
| Interest rate | Maturity date | Principal | Value | |||||||||||||
| Utilities Revenue (continued) | ||||||||||||||||
Ohio Combined Hydroelectric Project American Municipal Power Series A | 5.00 | % | 2-15-2024 | $ | 400,000 | $ | 463,760 | |||||||||
Ohio Combined Hydroelectric Project American Municipal Power Series A | 5.00 | 2-15-2029 | 2,700,000 | 3,532,869 | ||||||||||||
| 11,306,157 | ||||||||||||||||
|
| |||||||||||||||
| Water & Sewer Revenue: 0.40% | ||||||||||||||||
Ohio Water Development Authority Pollution Control Series A | 5.00 | 12-1-2031 | 1,000,000 | 1,262,960 | ||||||||||||
Ohio Water Development Authority Pollution Control Series A | 5.00 | 12-1-2037 | 7,000,000 | 9,303,210 | ||||||||||||
| 10,566,170 | ||||||||||||||||
|
| |||||||||||||||
| 48,710,691 | ||||||||||||||||
|
| |||||||||||||||
Oklahoma: 2.55% |
| |||||||||||||||
| Education Revenue: 0.03% | ||||||||||||||||
Oklahoma Agricultural and Mechanical Colleges Refunding Bond Series A | 4.00 | 9-1-2036 | 750,000 | 888,383 | ||||||||||||
|
| |||||||||||||||
| Miscellaneous Revenue: 2.17% | ||||||||||||||||
Cache OK Educational Facilities Authority Cache Public Schools Project Series A | 5.00 | 9-1-2024 | 2,905,000 | 3,398,037 | ||||||||||||
Cache OK Educational Facilities Authority Cache Public Schools Project Series A | 5.00 | 9-1-2025 | 3,055,000 | 3,678,037 | ||||||||||||
Canadian County OK Education Facilities Authority Mustang Public Schools Project | 4.00 | 9-1-2025 | 1,110,000 | 1,285,413 | ||||||||||||
Canadian County OK Education Facilities Authority Mustang Public Schools Project | 5.00 | 9-1-2027 | 2,000,000 | 2,458,500 | ||||||||||||
Canadian County OK Education Facilities Authority Mustang Public Schools Project | 5.00 | 9-1-2028 | 2,180,000 | 2,668,037 | ||||||||||||
Carter County OK Public Facilities Authority Educational Facilities Plainview Public School Project | 5.00 | 12-1-2026 | 1,000,000 | 1,237,890 | ||||||||||||
Carter County OK Public Facilities Authority Educational Facilities Plainview Public School Project | 5.00 | 12-1-2027 | 1,000,000 | 1,229,750 | ||||||||||||
Carter County OK Public Facilities Authority Educational Facilities Plainview Public School Project | 5.00 | 12-1-2028 | 1,285,000 | 1,573,547 | ||||||||||||
Cleveland County OK Educational Facilities Authority Noble Public Schools Project | 5.00 | 9-1-2027 | 700,000 | 877,268 | ||||||||||||
Cleveland County OK Educational Facilities Authority Noble Public Schools Project | 5.00 | 9-1-2028 | 400,000 | 499,720 | ||||||||||||
Cleveland County OK Educational Facilities Authority Noble Public Schools Project | 5.00 | 9-1-2029 | 250,000 | 311,005 | ||||||||||||
Cleveland County OK Educational Facilities Authority Noble Public Schools Project | 5.00 | 9-1-2031 | 675,000 | 831,141 | ||||||||||||
Comanche County OK Educational Facilities Authority Elgin Public Schools Project Series A | 5.00 | 12-1-2032 | 1,600,000 | 1,900,224 | ||||||||||||
Cushing OK Educational Facilities Authority | 5.00 | 9-1-2022 | 2,210,000 | 2,416,723 | ||||||||||||
Custer County OK EDA Thomas-Fay-Custer Public Schools Project | 4.00 | 12-1-2027 | 1,255,000 | 1,487,915 | ||||||||||||
Custer County OK EDA Thomas-Fay-Custer Public Schools Project | 4.00 | 12-1-2029 | 1,430,000 | 1,734,762 | ||||||||||||
Dewey County OK Educational Facilities Authority Seiling Public Schools Project | 5.00 | 9-1-2026 | 1,230,000 | 1,462,396 | ||||||||||||
Dewey County OK Educational Facilities Authority Seiling Public Schools Project | 5.00 | 9-1-2027 | 1,240,000 | 1,468,272 | ||||||||||||
Garvin County OK Educational Facilities Authority Lindsay Public Schools Project | 5.00 | 9-1-2020 | 455,000 | 458,253 | ||||||||||||
Garvin County OK Educational Facilities Authority Lindsay Public Schools Project | 5.00 | 9-1-2026 | 1,000,000 | 1,191,230 | ||||||||||||
Garvin County OK Educational Facilities Authority Lindsay Public Schools Project | 5.00 | 9-1-2027 | 1,245,000 | 1,479,956 | ||||||||||||
Grady County OK Educational Facilities Tuttle Public Schools Project | 5.00 | 9-1-2023 | 1,000,000 | 1,139,800 | ||||||||||||
Grady County OK Educational Facilities Tuttle Public Schools Project | 5.00 | 9-1-2024 | 1,075,000 | 1,267,113 | ||||||||||||
The accompanying notes are an integral part of these financial statements.
Wells Fargo Intermediate Tax/AMT-Free Fund | 33
Portfolio of investments—June 30, 2020
| Interest rate | Maturity date | Principal | Value | |||||||||||||
| Miscellaneous Revenue (continued) | ||||||||||||||||
Grady County OK Educational Facilities Tuttle Public Schools Project | 5.00 | % | 9-1-2025 | $ | 500,000 | $ | 606,185 | |||||||||
Grady County OK Educational Facilities Tuttle Public Schools Project | 5.00 | 9-1-2028 | 1,160,000 | 1,388,508 | ||||||||||||
McClain County OK EDA Educational Facilities Blanchard Public Schools Project | 4.00 | 9-1-2027 | 600,000 | 699,390 | ||||||||||||
McClain County OK EDA Educational Facilities Blanchard Public Schools Project | 4.00 | 9-1-2028 | 670,000 | 789,863 | ||||||||||||
McClain County OK EDA Educational Facilities Blanchard Public Schools Project | 4.00 | 9-1-2029 | 615,000 | 730,706 | ||||||||||||
Muskogee OK Industrial Trust Educational Facilities | 4.00 | 9-1-2029 | 3,000,000 | 3,606,600 | ||||||||||||
Muskogee OK Industrial Trust Educational Facilities | 4.00 | 9-1-2032 | 3,000,000 | 3,484,140 | ||||||||||||
Muskogee OK Industrial Trust Educational Facilities | 5.00 | 9-1-2020 | 1,250,000 | 1,258,650 | ||||||||||||
Muskogee OK Industrial Trust Educational Facilities | 5.00 | 9-1-2021 | 1,000,000 | 1,048,670 | ||||||||||||
Muskogee OK Industrial Trust Educational Facilities | 5.00 | 9-1-2022 | 1,000,000 | 1,089,920 | ||||||||||||
Oklahoma Development Finance Authority | 4.00 | 6-1-2023 | 1,270,000 | 1,381,811 | ||||||||||||
Oklahoma Development Finance Authority | 5.00 | 6-1-2023 | 1,230,000 | 1,392,581 | ||||||||||||
Oklahoma Development Finance Authority State System of Higher Education Series B | 5.00 | 6-1-2030 | 500,000 | 659,280 | ||||||||||||
Oklahoma Development Finance Authority State System of Higher Education Series B | 5.00 | 6-1-2031 | 520,000 | 681,470 | ||||||||||||
Oklahoma Development Finance Authority State System of Higher Education Series B | 5.00 | 6-1-2032 | 550,000 | 714,494 | ||||||||||||
Tulsa County OK Industrial Authority Educational Facilities Glenpool Public Schools Project Series A | 5.00 | 9-1-2025 | 880,000 | 1,062,926 | ||||||||||||
| 56,650,183 | ||||||||||||||||
|
| |||||||||||||||
| Tax Revenue: 0.17% | ||||||||||||||||
Oklahoma City OK Public Property Authority | 5.00 | 10-1-2026 | 1,495,000 | 1,705,376 | ||||||||||||
Oklahoma City OK Public Property Authority | 5.00 | 10-1-2027 | 1,140,000 | 1,294,196 | ||||||||||||
Oklahoma City OK Public Property Authority | 5.00 | 10-1-2028 | 1,265,000 | 1,430,601 | ||||||||||||
| 4,430,173 | ||||||||||||||||
|
| |||||||||||||||
| Utilities Revenue: 0.15% | ||||||||||||||||
Claremore OK Public Works Authority | 4.00 | 6-1-2022 | 2,595,000 | 2,763,675 | ||||||||||||
Claremore OK Public Works Authority | 4.00 | 6-1-2023 | 1,010,000 | 1,076,044 | ||||||||||||
| 3,839,719 | ||||||||||||||||
|
| |||||||||||||||
| Water & Sewer Revenue: 0.03% | ||||||||||||||||
McGee Creek OK Water Authority (National Insured) | 6.00 | 1-1-2023 | 710,000 | 764,280 | ||||||||||||
|
| |||||||||||||||
| 66,572,738 | ||||||||||||||||
|
| |||||||||||||||
Oregon: 0.87% |
| |||||||||||||||
| Airport Revenue: 0.10% | ||||||||||||||||
Portland International Airport Refunding Bond Series 26A | 4.00 | 7-1-2037 | 565,000 | 650,778 | ||||||||||||
Portland International Airport Refunding Bond Series 26A | 5.00 | 7-1-2033 | 400,000 | 514,664 | ||||||||||||
Portland International Airport Refunding Bond Series 26B | 5.00 | 7-1-2033 | 530,000 | 681,930 | ||||||||||||
Portland International Airport Refunding Bond Series 26B | 5.00 | 7-1-2037 | 705,000 | 892,713 | ||||||||||||
| 2,740,085 | ||||||||||||||||
|
| |||||||||||||||
| GO Revenue: 0.66% | ||||||||||||||||
Benton & Linn Counties OR Corvallis School District Series B (AGM Insured) | 5.00 | 6-15-2031 | 5,110,000 | 6,644,840 | ||||||||||||
Multnomah, Washington, & Clackamas Counties OR Series A | 4.00 | 6-1-2034 | 7,000,000 | 8,664,180 | ||||||||||||
Washington & Multnomah Counties OR Beaverton School District Series D (AGM Insured) | 5.00 | 6-15-2035 | 1,500,000 | 1,870,080 | ||||||||||||
| 17,179,100 | ||||||||||||||||
|
| |||||||||||||||
The accompanying notes are an integral part of these financial statements.
34 | Wells Fargo Intermediate Tax/AMT-Free Fund
Portfolio of investments—June 30, 2020
| Interest rate | Maturity date | Principal | Value | |||||||||||||
| Health Revenue: 0.11% | ||||||||||||||||
Medford OR Hospital Facilities Authority | 5.00 | % | 10-1-2020 | $ | 1,155,000 | $ | 1,163,016 | |||||||||
Oregon Facilities Authority Samaritan Health Services Project Series A | 5.00 | 10-1-2026 | 1,500,000 | 1,790,295 | ||||||||||||
| 2,953,311 | ||||||||||||||||
|
| |||||||||||||||
| 22,872,496 | ||||||||||||||||
|
| |||||||||||||||
Pennsylvania: 9.82% |
| |||||||||||||||
| Airport Revenue: 0.04% | ||||||||||||||||
Philadelphia PA Airport Refunding Bond Series A | 5.00 | 7-1-2028 | 315,000 | 384,987 | ||||||||||||
Philadelphia PA Airport Refunding Bond Series A | 5.00 | 7-1-2031 | 450,000 | 540,464 | ||||||||||||
| 925,451 | ||||||||||||||||
|
| |||||||||||||||
| Education Revenue: 1.37% | ||||||||||||||||
Adams County PA IDA Gettysburg College Project | 5.00 | 8-15-2024 | 1,500,000 | 1,508,040 | ||||||||||||
Adams County PA IDA Gettysburg College Project | 5.00 | 8-15-2025 | 1,500,000 | 1,508,040 | ||||||||||||
Chester County PA IDA Collegium Charter School Project Series A | 5.00 | 10-15-2027 | 1,500,000 | 1,600,410 | ||||||||||||
Lycoming County PA Authority Pennsylvania College of Technology | 5.50 | 7-1-2026 | 4,000,000 | 4,196,240 | ||||||||||||
Northampton County PA General Purpose Authority College Refunding Bond | 5.00 | 11-1-2027 | 1,000,000 | 1,255,840 | ||||||||||||
Northeastern Pennsylvania Hospital & Education Authority Series A | 5.00 | 3-1-2026 | 885,000 | 943,136 | ||||||||||||
Northeastern Pennsylvania Hospital & Education Authority Series A | 5.00 | 3-1-2028 | 660,000 | 697,613 | ||||||||||||
Pennsylvania HEFAR Series AQ | 5.00 | 6-15-2023 | 6,090,000 | 6,809,899 | ||||||||||||
Pennsylvania HEFAR Series AR | 5.00 | 6-15-2025 | 1,000,000 | 1,184,350 | ||||||||||||
Pennsylvania HEFAR Series AS | 5.00 | 6-15-2025 | 1,575,000 | 1,865,351 | ||||||||||||
Pennsylvania HEFAR Series AS | 5.00 | 6-15-2027 | 2,190,000 | 2,643,418 | ||||||||||||
Pennsylvania HEFAR Series LL1 | 5.00 | 11-1-2020 | 590,000 | 592,289 | ||||||||||||
Pennsylvania HEFAR Series LL1 | 5.00 | 11-1-2022 | 1,310,000 | 1,341,152 | ||||||||||||
Pennsylvania Public School Building Authority | 5.00 | 5-1-2023 | 2,185,000 | 2,417,506 | ||||||||||||
Pennsylvania Public School Building Authority | 5.00 | 6-15-2025 | 2,265,000 | 2,617,525 | ||||||||||||
Philadelphia PA IDA | 6.13 | 6-15-2023 | 645,000 | 683,610 | ||||||||||||
Philadelphia PA IDA | 5.88 | 6-15-2022 | 510,000 | 530,543 | ||||||||||||
Philadelphia PA IDA | 7.00 | 5-1-2026 | 740,000 | 764,931 | ||||||||||||
Philadelphia PA IDA Master Charter School Aid | 5.00 | 8-1-2020 | 110,000 | 110,416 | ||||||||||||
Philadelphia PA IDA West Philadelphia Achievement Charter Elementary School Project | 6.25 | 5-1-2021 | 65,000 | 66,717 | ||||||||||||
Philadelphia PA Public School Building Authority (BAM Insured) | 5.00 | 6-15-2026 | 2,000,000 | 2,358,700 | ||||||||||||
| 35,695,726 | ||||||||||||||||
|
| |||||||||||||||
| GO Revenue: 3.92% | ||||||||||||||||
Allegheny County PA Moon Area School District Series A | 5.00 | 11-15-2024 | 3,425,000 | 4,015,162 | ||||||||||||
Allegheny County PA Series 72 | 5.25 | 12-1-2033 | 4,045,000 | 4,633,952 | ||||||||||||
Central Dauphin PA School District | 5.00 | 2-1-2030 | 1,110,000 | 1,377,532 | ||||||||||||
Chester & Lancaster Counties PA Octorara Area School District (AGM Insured) | 4.00 | 4-1-2029 | 1,020,000 | 1,250,163 | ||||||||||||
Johnstown PA School District (AGM Insured) | 5.00 | 8-1-2024 | 2,730,000 | 2,853,369 | ||||||||||||
Lancaster PA Series A | 4.00 | 11-1-2027 | 500,000 | 609,480 | ||||||||||||
Lancaster PA Series B | 4.00 | 11-1-2028 | 535,000 | 653,807 | ||||||||||||
Lancaster PA Series B | 4.00 | 11-1-2033 | 460,000 | 541,724 | ||||||||||||
Norristown PA Area School District Montgomery County Series 2018 (BAM Insured) | 5.00 | 9-1-2035 | 2,035,000 | 2,464,487 | ||||||||||||
Pennsylvania Hills PA School District (BAM Insured) | 4.00 | 10-1-2021 | 1,460,000 | 1,526,999 | ||||||||||||
Philadelphia PA (AGM Insured) | 5.00 | 8-1-2025 | 7,000,000 | 8,513,960 | ||||||||||||
Philadelphia PA School District Refunding Bond Series C | 5.00 | 9-1-2021 | 2,200,000 | 2,304,962 | ||||||||||||
Philadelphia PA School District Refunding Bond Series D | 5.00 | 9-1-2022 | 3,750,000 | 4,082,100 | ||||||||||||
Philadelphia PA School District Refunding Bond Series E | 5.25 | 9-1-2021 | 1,490,000 | 1,501,071 | ||||||||||||
The accompanying notes are an integral part of these financial statements.
Wells Fargo Intermediate Tax/AMT-Free Fund | 35
Portfolio of investments—June 30, 2020
| Interest rate | Maturity date | Principal | Value | |||||||||||||
| GO Revenue (continued) | ||||||||||||||||
Philadelphia PA School District Refunding Bond Series F | 5.00 | % | 9-1-2028 | $ | 5,000,000 | $ | 6,108,100 | |||||||||
Philadelphia PA School District Refunding Bond Series F | 5.00 | 9-1-2029 | 5,000,000 | 6,081,600 | ||||||||||||
Philadelphia PA School District Refunding Bond Series F | 5.00 | 9-1-2031 | 1,240,000 | 1,493,580 | ||||||||||||
Philadelphia PA School District Refunding Bond Series F | 5.00 | 9-1-2032 | 1,000,000 | 1,198,640 | ||||||||||||
Philadelphia PA Series A | 5.00 | 8-1-2024 | 1,000,000 | 1,164,110 | ||||||||||||
Philadelphia PA Series A | 5.00 | 7-15-2026 | 3,000,000 | 3,455,580 | ||||||||||||
Philadelphia PA Series A | 5.00 | 8-1-2027 | 1,685,000 | 2,119,174 | ||||||||||||
Philadelphia PA Series A | 5.00 | 8-1-2033 | 2,020,000 | 2,465,955 | ||||||||||||
Philadelphia PA Series A | 5.25 | 7-15-2028 | 2,590,000 | 2,987,228 | ||||||||||||
Philadelphia PA Series A | 5.25 | 7-15-2029 | 4,410,000 | 5,091,389 | ||||||||||||
Philadelphia PA Series A | 5.25 | 7-15-2032 | 4,380,000 | 5,036,869 | ||||||||||||
Philadelphia School District Series A | 5.00 | 9-1-2032 | 2,300,000 | 2,915,089 | ||||||||||||
Philadelphia School District Series C | 5.00 | 9-1-2033 | 6,180,000 | 7,788,407 | ||||||||||||
Pittsburgh PA Moon Area School District Series A | 5.00 | 11-15-2029 | 1,000,000 | 1,172,310 | ||||||||||||
Pittsburgh PA Series A | 4.00 | 9-1-2022 | 1,000,000 | 1,072,760 | ||||||||||||
Pittsburgh PA Series A | 5.00 | 9-1-2022 | 2,060,000 | 2,254,114 | ||||||||||||
Pittsburgh PA Series A | 5.00 | 9-1-2023 | 3,810,000 | 4,181,132 | ||||||||||||
Reading Berks PA Series A (BAM Insured) | 5.00 | 11-1-2026 | 1,000,000 | 1,219,660 | ||||||||||||
Reading PA School District | 5.00 | 4-1-2021 | 3,120,000 | 3,218,342 | ||||||||||||
Reading PA School District (AGM Insured) | 5.00 | 3-1-2037 | 2,000,000 | 2,392,160 | ||||||||||||
Reading PA School District (AGM Insured) | 5.00 | 3-1-2038 | 1,735,000 | 2,064,320 | ||||||||||||
Scranton Lackawanna County PA School District Bond Series A (BAM Insured) | 5.00 | 6-1-2037 | 500,000 | 612,620 | ||||||||||||
| 102,421,907 | ||||||||||||||||
|
| |||||||||||||||
| Health Revenue: 0.96% | ||||||||||||||||
Allegheny County PA Hospital Development Authority Series A | 4.00 | 7-15-2037 | 2,000,000 | 2,247,540 | ||||||||||||
Allegheny County PA Hospital Development Authority Series A | 4.00 | 7-15-2039 | 2,360,000 | 2,636,734 | ||||||||||||
Allegheny County PA Hospital Development Authority Series A | 5.00 | 7-15-2031 | 3,750,000 | 4,682,700 | ||||||||||||
Allegheny County PA Hospital Development Authority Series B (National Insured) | 6.00 | 7-1-2025 | 2,605,000 | 3,197,924 | ||||||||||||
Allegheny County PA Hospital Development Authority University of Pittsburgh Medical Center Series A | 5.00 | 7-15-2025 | 155,000 | 182,967 | ||||||||||||
Cumberland County PA Diakon Lutheran Social Ministries Project | 5.00 | 1-1-2025 | 1,340,000 | 1,432,835 | ||||||||||||
Cumberland County PA Diakon Lutheran Social Ministries Project | 5.00 | 1-1-2026 | 1,370,000 | 1,454,474 | ||||||||||||
Cumberland County PA Diakon Lutheran Social Ministries Project | 5.00 | 1-1-2027 | 1,225,000 | 1,296,099 | ||||||||||||
Montgomery County PA HEFA Thomas Jefferson University | 4.00 | 9-1-2037 | 1,000,000 | 1,099,880 | ||||||||||||
Pennsylvania EDFA University of Pittsburgh Medical Center Series A | 5.00 | 4-15-2031 | 1,000,000 | 1,269,560 | ||||||||||||
Pennsylvania EDFA University of Pittsburgh Medical Center Series A | 5.00 | 4-15-2034 | 1,650,000 | 2,055,389 | ||||||||||||
Pennsylvania EDFA University of Pittsburgh Medical Center Series A | 5.00 | 4-15-2035 | 1,450,000 | 1,798,435 | ||||||||||||
Pennsylvania Tender Option Bond Trust Receipts/Floater Certificates Series 2020-XM0876 (Royal Bank of Canada LIQ) 144Aø | 0.16 | 8-15-2027 | 1,750,000 | 1,750,000 | ||||||||||||
| 25,104,537 | ||||||||||||||||
|
| |||||||||||||||
| Miscellaneous Revenue: 1.80% | ||||||||||||||||
Delaware County PA Vocational & Technical School Authority (BAM Insured) | 5.25 | 11-1-2033 | 2,000,000 | 2,277,620 | ||||||||||||
Pennsylvania Certificate of Participation Municipal Real Estate Payment Series A | 5.00 | 7-1-2028 | 435,000 | 556,648 | ||||||||||||
Pennsylvania Certificate of Participation Municipal Real Estate Payment Series A | 5.00 | 7-1-2029 | 465,000 | 592,489 | ||||||||||||
Pennsylvania Certificate of Participation Municipal Real Estate Payment Series A | 5.00 | 7-1-2030 | 375,000 | 475,298 | ||||||||||||
Pennsylvania Certificate of Participation Retained Basic Lease Payment (AGM Insured) | 5.00 | 11-1-2022 | 3,015,000 | 3,317,344 | ||||||||||||
Pennsylvania Certificate of Participation Retained Basic Lease Payment (AGM Insured) | 5.00 | 11-1-2023 | 1,900,000 | 2,163,644 | ||||||||||||
The accompanying notes are an integral part of these financial statements.
36 | Wells Fargo Intermediate Tax/AMT-Free Fund
Portfolio of investments—June 30, 2020
| Interest rate | Maturity date | Principal | Value | |||||||||||||
| Miscellaneous Revenue (continued) | ||||||||||||||||
Pennsylvania Certificate of Participation Retained Basic Lease Payment (AGM Insured) | 5.00 | % | 11-1-2024 | $ | 1,660,000 | $ | 1,952,343 | |||||||||
Pennsylvania Public School Building Authority (BAM Insured) | 4.00 | 5-15-2021 | 500,000 | 515,740 | ||||||||||||
Pennsylvania Public School Building Authority (BAM Insured) | 4.00 | 5-15-2022 | 1,000,000 | 1,028,810 | ||||||||||||
Pennsylvania Public School Building Authority | 5.00 | 4-1-2029 | 1,000,000 | 1,078,730 | ||||||||||||
Pennsylvania Public School Building Authority Chester Upland School District Project Series B | 5.25 | 9-15-2030 | 1,995,000 | 2,499,037 | ||||||||||||
Pennsylvania Public School Building Authority City of Harrisburg Project Series A (AGM Insured) | 5.00 | 12-1-2028 | 3,500,000 | 4,233,845 | ||||||||||||
Pennsylvania Public School Building Authority City of Harrisburg Project Series A (AGM Insured) | 5.00 | 12-1-2033 | 4,425,000 | 5,234,111 | ||||||||||||
Pennsylvania Public School Building Authority Philadelphia School District Project | 5.00 | 4-1-2024 | 2,000,000 | 2,157,460 | ||||||||||||
Pennsylvania Public School Building Authority Series B (AGM Insured) | 5.00 | 6-1-2029 | 2,000,000 | 2,594,000 | ||||||||||||
Pennsylvania Public School Building Authority Series B-2 (BAM Insured) | 5.00 | 12-1-2024 | 1,250,000 | 1,461,400 | ||||||||||||
Pennsylvania Public School Building Authority Series B-2 (BAM Insured) | 5.00 | 12-1-2025 | 1,250,000 | 1,454,938 | ||||||||||||
Pennsylvania Public School Building Authority Series B-2 (BAM Insured) | 5.00 | 12-1-2026 | 1,250,000 | 1,448,500 | ||||||||||||
Pennsylvania Public School Building Authority Series B-2 (BAM Insured) | 5.00 | 12-1-2027 | 1,010,000 | 1,167,570 | ||||||||||||
Philadelphia PA Municipal Authority Juvenile Justice Services Center | 5.00 | 4-1-2031 | 3,630,000 | 4,469,583 | ||||||||||||
Philadelphia PA Municipal Authority Juvenile Justice Services Center | 5.00 | 4-1-2034 | 1,800,000 | 2,182,932 | ||||||||||||
Southeastern Pennsylvania Transportation Authority | 5.00 | 3-1-2028 | 725,000 | 933,575 | ||||||||||||
York County PA School of Technology Authority Series A (BAM Insured) | 5.00 | 2-15-2024 | 1,590,000 | 1,837,865 | ||||||||||||
York County PA School of Technology Authority Series B (BAM Insured) | 5.00 | 2-15-2027 | 800,000 | 931,672 | ||||||||||||
York County PA School of Technology Authority Series B (BAM Insured) | 5.00 | 2-15-2029 | 500,000 | 580,310 | ||||||||||||
| 47,145,464 | ||||||||||||||||
|
| |||||||||||||||
| Resource Recovery Revenue: 0.25% | ||||||||||||||||
Lancaster County PA Solid Waste Management Authority Series A | 5.25 | 12-15-2028 | 5,665,000 | 6,565,565 | ||||||||||||
|
| |||||||||||||||
| Tobacco Revenue: 0.24% | ||||||||||||||||
Commonwealth Financing Authority Tobacco Master Settlement Payment | 5.00 | 6-1-2027 | 2,500,000 | 3,094,200 | ||||||||||||
Commonwealth Financing Authority Tobacco Master Settlement Payment | 5.00 | 6-1-2028 | 2,500,000 | 3,160,500 | ||||||||||||
| 6,254,700 | ||||||||||||||||
|
| |||||||||||||||
| Transportation Revenue: 0.86% | ||||||||||||||||
Lancaster PA Parking Authority Series A (BAM Insured) | 4.00 | 9-1-2038 | 1,000,000 | 1,126,600 | ||||||||||||
Pennsylvania Turnpike Commission Refunding Bond | 5.00 | 6-1-2027 | 1,000,000 | 1,216,330 | ||||||||||||
Pennsylvania Turnpike Commission Refunding Bond | 5.00 | 12-1-2033 | 3,780,000 | 4,297,520 | ||||||||||||
Pennsylvania Turnpike Commission Refunding Bond (AGM Insured) | 6.00 | 12-1-2030 | 4,220,000 | 5,642,646 | ||||||||||||
Pennsylvania Turnpike Commission Subordinate Bond Series B | 5.00 | 6-1-2031 | 5,000,000 | 5,928,700 | ||||||||||||
Pennsylvania Turnpike Commission Subordinate Bond Series C (AGM Insured) | 6.25 | 6-1-2033 | 1,350,000 | 1,731,848 | ||||||||||||
Pennsylvania Turnpike Commission Subordinate Bond Series E | 6.38 | 12-1-2038 | 2,000,000 | 2,509,620 | ||||||||||||
| 22,453,264 | ||||||||||||||||
|
| |||||||||||||||
| Water & Sewer Revenue: 0.38% | ||||||||||||||||
Bucks County PA Water & Sewer Authority Water System (AGM Insured) | 5.00 | 12-1-2026 | 2,400,000 | 2,560,440 | ||||||||||||
Pennsylvania Capital Region Water System Series of 2017 | 5.00 | 7-15-2030 | 1,180,000 | 1,465,678 | ||||||||||||
Pennsylvania Capital Region Water System Series of 2018 | 5.00 | 7-15-2030 | 1,500,000 | 1,911,975 | ||||||||||||
Philadelphia PA Water and Wastewater Bond Series B | 5.00 | 11-1-2027 | 1,535,000 | 1,943,648 | ||||||||||||
Philadelphia PA Water and Wastewater Bond Series B | 5.00 | 11-1-2033 | 1,760,000 | 2,180,710 | ||||||||||||
| 10,062,451 | ||||||||||||||||
|
| |||||||||||||||
| 256,629,065 | ||||||||||||||||
|
| |||||||||||||||
The accompanying notes are an integral part of these financial statements.
Wells Fargo Intermediate Tax/AMT-Free Fund | 37
Portfolio of investments—June 30, 2020
| Interest rate | Maturity date | Principal | Value | |||||||||||||
South Carolina: 0.51% |
| |||||||||||||||
| Education Revenue: 0.30% | ||||||||||||||||
South Carolina Education Assistance Authority Student Loan Series I | 5.00 | % | 10-1-2024 | $ | 1,140,000 | $ | 1,140,673 | |||||||||
South Carolina Jobs EDA Furman University Project | 5.00 | 10-1-2028 | 700,000 | 814,555 | ||||||||||||
South Carolina Jobs EDA Furman University Project | 5.00 | 10-1-2030 | 1,885,000 | 2,178,023 | ||||||||||||
South Carolina Jobs EDA Furman University Project | 5.00 | 10-1-2031 | 2,155,000 | 2,479,996 | ||||||||||||
South Carolina Jobs EDA York Preparatory Academy Project Series A | 7.00 | 11-1-2033 | 1,090,000 | 1,192,013 | ||||||||||||
| 7,805,260 | ||||||||||||||||
|
| |||||||||||||||
| Miscellaneous Revenue: 0.21% | ||||||||||||||||
Laurens County SC Education Assistance for District #55 | 5.00 | 12-1-2021 | 1,000,000 | 1,064,200 | ||||||||||||
Laurens County SC Education Assistance for District #55 | 5.00 | 12-1-2022 | 1,250,000 | 1,373,050 | ||||||||||||
Laurens County SC Education Assistance for District #55 | 5.00 | 12-1-2025 | 1,000,000 | 1,202,930 | ||||||||||||
Scago SC Educational Facilities Corporation for Sumter County School District #17 | 5.00 | 12-1-2022 | 1,720,000 | 1,846,454 | ||||||||||||
| 5,486,634 | ||||||||||||||||
|
| |||||||||||||||
| 13,291,894 | ||||||||||||||||
|
| |||||||||||||||
Tennessee: 1.16% |
| |||||||||||||||
| Education Revenue: 0.03% | ||||||||||||||||
Franklin County TN HEFA | 4.00 | 9-1-2024 | 250,000 | 269,260 | ||||||||||||
Franklin County TN HEFA | 5.00 | 9-1-2030 | 560,000 | 612,002 | ||||||||||||
| 881,262 | ||||||||||||||||
|
| |||||||||||||||
| Housing Revenue: 0.16% | ||||||||||||||||
Chattanooga TN Health Educational & Housing Facilities University of Tennessee at Chattanooga Project | 5.00 | 10-1-2023 | 750,000 | 782,100 | ||||||||||||
Chattanooga TN Health Educational & Housing Facilities University of Tennessee at Chattanooga Project | 5.00 | 10-1-2028 | 1,000,000 | 1,040,600 | ||||||||||||
Greeneville TN HEFA People Road Portfolio Project | 1.45 | 12-1-2022 | 2,215,000 | 2,248,845 | ||||||||||||
| 4,071,545 | ||||||||||||||||
|
| |||||||||||||||
| Utilities Revenue: 0.97% | ||||||||||||||||
Tennessee Energy Acquisition Corporation Gas Project | 4.00 | 11-1-2049 | 11,000,000 | 12,454,750 | ||||||||||||
Tennessee Energy Acquisition Corporation Series A | 4.00 | 5-1-2048 | 12,120,000 | 13,045,241 | ||||||||||||
| 25,499,991 | ||||||||||||||||
|
| |||||||||||||||
| 30,452,798 | ||||||||||||||||
|
| |||||||||||||||
Texas: 8.72% |
| |||||||||||||||
| Airport Revenue: 0.48% | ||||||||||||||||
Galveston TX Wharves & Terminal | 5.00 | 2-1-2026 | 2,000,000 | 2,015,820 | ||||||||||||
Houston TX Airport System Subordinate Lien Refunding Bond Series D | 5.00 | 7-1-2033 | 3,010,000 | 3,705,129 | ||||||||||||
Houston TX Airport System Subordinate Lien Refunding Bond Series D | 5.00 | 7-1-2034 | 3,500,000 | 4,297,475 | ||||||||||||
Houston TX Airport System Subordinate Lien Refunding Bond Series D | 5.00 | 7-1-2035 | 2,000,000 | 2,445,980 | ||||||||||||
| 12,464,404 | ||||||||||||||||
|
| |||||||||||||||
| Education Revenue: 0.25% | ||||||||||||||||
Houston TX Higher Education Finance Corporation Series A | 4.00 | 2-15-2022 | 270,000 | 279,609 | ||||||||||||
Texas Woman’s University Financing System | 4.00 | 7-1-2020 | 1,000,000 | 1,000,000 | ||||||||||||
University of Houston Texas Series B | 5.25 | 7-1-2026 | 4,225,000 | 5,349,568 | ||||||||||||
| 6,629,177 | ||||||||||||||||
|
| |||||||||||||||
The accompanying notes are an integral part of these financial statements.
38 | Wells Fargo Intermediate Tax/AMT-Free Fund
Portfolio of investments—June 30, 2020
| Interest rate | Maturity date | Principal | Value | |||||||||||||
| GO Revenue: 4.01% |
| |||||||||||||||
Austin TX Independent School District Series B | 5.00 | % | 8-1-2023 | $ | 3,805,000 | $ | 4,341,505 | |||||||||
Austin TX Independent School District Series B | 5.00 | 8-1-2024 | 3,970,000 | 4,693,294 | ||||||||||||
Austin TX Independent School District Series B | 5.00 | 8-1-2025 | 2,050,000 | 2,501,410 | ||||||||||||
Austin TX Independent School District Series B | 5.00 | 8-1-2026 | 1,450,000 | 1,762,809 | ||||||||||||
Austin TX Public Improvement Bond | 5.00 | 9-1-2030 | 960,000 | 1,224,202 | ||||||||||||
Bexar County TX Combination Tax Certificate of Obligation | 5.00 | 6-15-2024 | 1,000,000 | 1,180,050 | ||||||||||||
Bexar County TX Hospital District Refunding Bond | 5.00 | 2-15-2037 | 1,250,000 | 1,557,150 | ||||||||||||
Collin County TX Unlimited Tax Road & Refunding Bond | 5.00 | 2-15-2023 | 1,350,000 | 1,514,349 | ||||||||||||
Collin County TX Unlimited Tax Road & Refunding Bond | 5.00 | 2-15-2026 | 1,000,000 | 1,204,350 | ||||||||||||
Collin County TX Unlimited Tax Road & Refunding Bond | 5.00 | 2-15-2027 | 1,300,000 | 1,563,679 | ||||||||||||
Crane County TX Water District Unlimited Tax Bond | 5.00 | 2-15-2023 | 1,395,000 | 1,555,495 | ||||||||||||
Crane County TX Water District Unlimited Tax Bond | 5.00 | 2-15-2026 | 1,000,000 | 1,181,010 | ||||||||||||
Crane County TX Water District Unlimited Tax Bond | 5.00 | 2-15-2030 | 1,130,000 | 1,312,755 | ||||||||||||
Crane County TX Water District Unlimited Tax Bond | 5.00 | 2-15-2031 | 1,000,000 | 1,157,770 | ||||||||||||
Del Rio TX Refunding Bond (BAM Insured) | 4.00 | 6-1-2023 | 720,000 | 792,360 | ||||||||||||
Del Rio TX Refunding Bond (BAM Insured) | 4.00 | 6-1-2024 | 745,000 | 841,284 | ||||||||||||
Denton County TX Permanent Improvement & Refunding Bond | 5.00 | 7-15-2023 | 1,990,000 | 2,266,809 | ||||||||||||
Denton County TX Permanent Improvement & Refunding Bond | 5.00 | 7-15-2024 | 1,145,000 | 1,352,073 | ||||||||||||
Denton County TX Permanent Improvement & Refunding Bond | 5.00 | 7-15-2025 | 1,000,000 | 1,173,830 | ||||||||||||
Denton County TX Permanent Improvement & Refunding Bond | 5.00 | 7-15-2030 | 1,000,000 | 1,172,520 | ||||||||||||
El Paso County TX Hospital District | 5.00 | 8-15-2028 | 2,045,000 | 2,164,244 | ||||||||||||
El Paso County TX Refunding Bond Series A | 5.00 | 2-15-2031 | 2,000,000 | 2,445,620 | ||||||||||||
El Paso County TX Refunding Bond Series A | 5.00 | 2-15-2032 | 2,120,000 | 2,581,969 | ||||||||||||
Flower Mound, Denton & Tarrant Counties TX Refunding Bond | 4.00 | 3-1-2026 | 755,000 | 869,081 | ||||||||||||
Flower Mound, Denton & Tarrant Counties TX Refunding Bond | 5.00 | 3-1-2022 | 1,000,000 | 1,077,070 | ||||||||||||
Flower Mound, Denton & Tarrant Counties TX Refunding Bond | 5.00 | 3-1-2023 | 620,000 | 696,018 | ||||||||||||
Flower Mound, Denton & Tarrant Counties TX Refunding Bond | 5.00 | 3-1-2024 | 1,660,000 | 1,932,871 | ||||||||||||
Fort Worth TX Independent School District Unlimited Tax Refunding and School Building Bond | 5.00 | 2-15-2026 | 3,000,000 | 3,699,870 | ||||||||||||
Harris County TX Tax Road Refunding Bond Series 2014-A | 5.00 | 10-1-2025 | 8,445,000 | 10,043,470 | ||||||||||||
Harris County TX Tax Road Refunding Bond Series 2015-A | 5.00 | 10-1-2025 | 4,215,000 | 5,172,859 | ||||||||||||
Harris County TX Toll Road Project Series C (AGM Insured) | 5.25 | 8-15-2027 | 4,000,000 | 5,227,520 | ||||||||||||
Hays County TX Limited Tax Bond | 5.00 | 2-15-2026 | 650,000 | 801,236 | ||||||||||||
Hays County TX Limited Tax Bond | 5.00 | 2-15-2027 | 1,000,000 | 1,264,370 | ||||||||||||
Hays County TX Limited Tax Refunding Bond | 5.00 | 2-15-2023 | 1,750,000 | 1,958,653 | ||||||||||||
Midlothian TX Independent School District Refunding Bond Series C | 2.00 | 8-1-2051 | 4,535,000 | 4,755,809 | ||||||||||||
Plano TX | 5.00 | 9-1-2030 | 2,155,000 | 2,722,325 | ||||||||||||
San Antonio TX Certificate of Obligation | 5.00 | 8-1-2036 | 3,990,000 | 5,065,505 | ||||||||||||
San Antonio TX Independent School District Unlimited Tax Series 2018 | 5.00 | 8-15-2037 | 2,000,000 | 2,380,780 | ||||||||||||
Texas Independent School District Refunding Bond | 5.00 | 8-15-2025 | 2,260,000 | 2,756,929 | ||||||||||||
Texas Veterans Bond Series B (FHLB SPA) ø | 0.12 | 6-1-2046 | 10,650,000 | 10,650,000 | ||||||||||||
Viridian TX Municipal Management District Unlimited Road Improvement Bond (BAM Insured) | 4.00 | 12-1-2026 | 610,000 | 687,775 | ||||||||||||
Viridian TX Municipal Management District Unlimited Road Improvement Bond (BAM Insured) | 4.00 | 12-1-2027 | 635,000 | 713,619 | ||||||||||||
Viridian TX Municipal Management District Unlimited Road Improvement Bond (BAM Insured) | 4.00 | 12-1-2030 | 710,000 | 784,018 | ||||||||||||
| 104,800,315 | ||||||||||||||||
|
| |||||||||||||||
| Health Revenue: 0.28% | ||||||||||||||||
Harris County TX Cultural Education Facilities Finance Corporation Memorial Hermann Health System Series B | 5.00 | 7-1-2049 | 4,000,000 | 4,807,160 | ||||||||||||
Residual Interest Bond Floater Trust Certificates Series 2019-010 (Barclays Bank plc LOC) 144Aø | 0.28 | 11-15-2046 | 2,500,000 | 2,500,000 | ||||||||||||
| 7,307,160 | ||||||||||||||||
|
| |||||||||||||||
The accompanying notes are an integral part of these financial statements.
Wells Fargo Intermediate Tax/AMT-Free Fund | 39
Portfolio of investments—June 30, 2020
| Interest rate | Maturity date | Principal | Value | |||||||||||||
| Housing Revenue: 0.53% |
| |||||||||||||||
Mizuho Tender Option Bond Trust Receipts/Floater Certificates Series2019-MIZ9010 (Mizuho Capital Markets LLC LOC, Mizuho Capital Markets LLC LIQ) 144Aø | 0.48 | % | 4-1-2034 | $ | 3,750,000 | $ | 3,750,000 | |||||||||
San Antonio TX Housing Trust Finance Corporation Majestic Ranch Apartments LP (FHA Insured) | 1.40 | 7-1-2022 | 10,000,000 | 10,100,100 | ||||||||||||
| 13,850,100 | ||||||||||||||||
|
| |||||||||||||||
| Miscellaneous Revenue: 0.28% | ||||||||||||||||
Austin TX Community College District Public Facility Corporation Bond Series C | 5.00 | 8-1-2026 | 565,000 | 705,346 | ||||||||||||
Austin TX Community College District Public Facility Corporation Bond Series C | 5.00 | 8-1-2029 | 400,000 | 509,100 | ||||||||||||
Austin TX Community College District Public Facility Corporation Bond Series C | 5.00 | 8-1-2030 | 500,000 | 633,205 | ||||||||||||
Lower Colorado River TX Authority | 5.50 | 5-15-2031 | 2,500,000 | 2,828,175 | ||||||||||||
Nueces River TX Water Supply Facility Corpus Christi Lake Texana Project | 5.00 | 7-15-2026 | 1,000,000 | 1,207,010 | ||||||||||||
Nueces River TX Water Supply Facility Corpus Christi Lake Texana Project | 5.00 | 7-15-2027 | 1,250,000 | 1,507,388 | ||||||||||||
| 7,390,224 | ||||||||||||||||
|
| |||||||||||||||
| Resource Recovery Revenue: 0.27% | ||||||||||||||||
Port Arthur TX Navigation District Jefferson County Environmental Facilities Motiva Enterprises LLC Project Subordinate Bond Series D ø | 1.95 | 11-1-2040 | 7,000,000 | 7,000,000 | ||||||||||||
|
| |||||||||||||||
| Tax Revenue: 0.51% | ||||||||||||||||
Houston TX Old Spanish Trail Almeda Corridors Redevelopment Authority (BAM Insured) | 4.00 | 9-1-2031 | 1,540,000 | 1,826,609 | ||||||||||||
Texas Midtown RDA Refunding Bond (BAM Insured) | 5.25 | 1-1-2027 | 1,880,000 | 2,088,755 | ||||||||||||
Texas Midtown RDA Refunding Bond (BAM Insured) | 5.25 | 1-1-2029 | 2,390,000 | 2,650,964 | ||||||||||||
Texas Midtown RDA Refunding Bond (BAM Insured) | 5.25 | 1-1-2030 | 1,500,000 | 1,662,210 | ||||||||||||
Texas Midtown RDA Refunding Bond (BAM Insured) | 5.25 | 1-1-2031 | 1,000,000 | 1,108,140 | ||||||||||||
Texas Transportation Commission Highway Fund Series A | 5.00 | 10-1-2025 | 3,250,000 | 3,981,023 | ||||||||||||
| 13,317,701 | ||||||||||||||||
|
| |||||||||||||||
| Transportation Revenue: 0.81% | ||||||||||||||||
Central Texas Regional Mobility Authority Series B | 5.00 | 1-1-2045 | 8,000,000 | 8,006,240 | ||||||||||||
Texas Grand Parkway Transportation Corporation System Series A | 5.00 | 10-1-2034 | 1,500,000 | 1,889,055 | ||||||||||||
Texas Private Activity Bond Surface Transportation Corporation | 7.50 | 6-30-2032 | 2,000,000 | 2,011,800 | ||||||||||||
Texas Private Activity Bond Surface Transportation Corporation | 7.50 | 6-30-2033 | 2,000,000 | 2,011,800 | ||||||||||||
Texas Private Activity Surface Transportation Corporation Senior Lien Series A | 5.00 | 12-31-2035 | 3,000,000 | 3,624,750 | ||||||||||||
Texas Private Activity Surface Transportation Corporation Senior Lien Series A | 5.00 | 12-31-2036 | 3,000,000 | 3,613,560 | ||||||||||||
| 21,157,205 | ||||||||||||||||
|
| |||||||||||||||
| Utilities Revenue: 0.77% | ||||||||||||||||
Austin TX Refunding Bond (National Insured) | 5.25 | 5-15-2025 | 1,400,000 | 1,573,096 | ||||||||||||
Brownsville TX Utilities System Refunding Bond | 5.00 | 9-1-2026 | 2,190,000 | 2,636,629 | ||||||||||||
Brownsville TX Utilities System Refunding Bond | 5.00 | 9-1-2029 | 1,500,000 | 1,796,700 | ||||||||||||
Brownsville TX Utilities System Refunding Bond | 5.00 | 9-1-2030 | 2,500,000 | 2,990,325 | ||||||||||||
Texas Municipal Gas Acquisition & Supply Corporation III Gas Supply Series 2012 | 5.00 | 12-15-2021 | 3,945,000 | 4,148,759 | ||||||||||||
Texas Municipal Gas Acquisition & Supply Corporation Series B | 5.00 | 12-15-2022 | 5,000,000 | 5,425,950 | ||||||||||||
Weatherford TX Utility System Improvement & Refunding Bond (AGM Insured) | 5.00 | 9-1-2025 | 1,000,000 | 1,207,870 | ||||||||||||
Weatherford TX Utility System Improvement & Refunding Bond (AGM Insured) | 5.00 | 9-1-2026 | 375,000 | 454,429 | ||||||||||||
| 20,233,758 | ||||||||||||||||
|
| |||||||||||||||
The accompanying notes are an integral part of these financial statements.
40 | Wells Fargo Intermediate Tax/AMT-Free Fund
Portfolio of investments—June 30, 2020
| Interest rate | Maturity date | Principal | Value | |||||||||||||
| Water & Sewer Revenue: 0.53% |
| |||||||||||||||
Amarillo TX Waterworks and Sewer System Bond Series B | 5.00 | % | 4-1-2028 | $ | 645,000 | $ | 834,320 | |||||||||
Houston TX Utilities Systems Series A | 5.25 | 11-15-2031 | 3,000,000 | 3,054,210 | ||||||||||||
North Harris County TX Regional Water Authority Senior Lien (BAM Insured) | 5.00 | 12-15-2029 | 1,215,000 | 1,343,037 | ||||||||||||
Tarrant TX Water Project Refunding Bond | 4.00 | 2-1-2027 | 1,000,000 | 1,173,920 | ||||||||||||
Texas Water Development Board State Implementation Series A | 4.00 | 10-15-2032 | 3,000,000 | 3,622,980 | ||||||||||||
Texas Water Development Board State Revolving Fund Bond | 4.00 | 8-1-2037 | 3,000,000 | 3,688,080 | ||||||||||||
| 13,716,547 | ||||||||||||||||
|
| |||||||||||||||
| 227,866,591 | ||||||||||||||||
|
| |||||||||||||||
Utah: 0.34% |
| |||||||||||||||
| Education Revenue: 0.11% | ||||||||||||||||
Utah Charter School Finance Authority Refunding Bond (CSCE Insured) | 4.00 | 4-15-2021 | 400,000 | 410,200 | ||||||||||||
Utah Charter School Finance Authority Refunding Bond (CSCE Insured) | 4.00 | 4-15-2022 | 400,000 | 422,872 | ||||||||||||
Utah Charter School Finance Authority Refunding Bond (CSCE Insured) | 4.00 | 4-15-2023 | 400,000 | 435,368 | ||||||||||||
Utah Charter School Finance Authority Refunding Bond (CSCE Insured) | 4.00 | 4-15-2024 | 450,000 | 501,633 | ||||||||||||
Utah Charter School Finance Authority Refunding Bond (CSCE Insured) 144A | 4.50 | 6-15-2027 | 1,025,000 | 1,095,592 | ||||||||||||
| 2,865,665 | ||||||||||||||||
|
| |||||||||||||||
| GO Revenue: 0.08% | ||||||||||||||||
Canyons UT Board of Education Utah School Bond Guaranty Program (AGM Insured) | 5.00 | 6-15-2022 | 1,860,000 | 2,030,841 | ||||||||||||
|
| |||||||||||||||
| Miscellaneous Revenue: 0.15% | ||||||||||||||||
West Valley City UT Municipal Building Authority (AGM Insured) | 5.00 | 2-1-2028 | 1,000,000 | 1,249,950 | ||||||||||||
West Valley City UT Municipal Building Authority (AGM Insured) | 5.00 | 2-1-2032 | 1,555,000 | 1,909,711 | ||||||||||||
West Valley City UT Municipal Building Authority (AGM Insured) | 5.00 | 2-1-2033 | 645,000 | 788,100 | ||||||||||||
| 3,947,761 | ||||||||||||||||
|
| |||||||||||||||
| 8,844,267 | ||||||||||||||||
|
| |||||||||||||||
Virginia: 0.50% |
| |||||||||||||||
| Education Revenue: 0.13% | ||||||||||||||||
Virginia Small Business Financing Authority | 5.25 | 10-1-2029 | 3,000,000 | 3,542,400 | ||||||||||||
|
| |||||||||||||||
| Tax Revenue: 0.08% | ||||||||||||||||
Greater Richmond VA Convention Center | 5.00 | 6-15-2025 | 1,000,000 | 1,117,300 | ||||||||||||
Marquis VA CDA CAB Series 2015 144A¤ | 0.00 | 9-1-2045 | 386,000 | 216,515 | ||||||||||||
Marquis VA CDA CAB Series C ¤ | 0.00 | 9-1-2041 | 1,772,000 | 79,456 | ||||||||||||
Marquis VA CDA Series B | 5.63 | 9-1-2041 | 1,274,000 | 691,757 | ||||||||||||
| 2,105,028 | ||||||||||||||||
|
| |||||||||||||||
| Transportation Revenue: 0.29% | ||||||||||||||||
Chesapeake VA Bay Bridge & Tunnel District First Tier Generation Resolution | 5.00 | 11-1-2023 | 7,000,000 | 7,550,620 | ||||||||||||
|
| |||||||||||||||
| 13,198,048 | ||||||||||||||||
|
| |||||||||||||||
Washington: 4.62% |
| |||||||||||||||
| Education Revenue: 0.05% | ||||||||||||||||
Washington EDFA | 5.00 | 6-1-2028 | 1,000,000 | 1,166,970 | ||||||||||||
|
| |||||||||||||||
| GO Revenue: 2.01% | ||||||||||||||||
King & Pierce Counties WA Auburn School District #408 (AGM Insured) | 4.00 | 12-1-2034 | 4,075,000 | 4,947,091 | ||||||||||||
King County WA Federal Way School District #210 (AGM Insured) | 4.00 | 12-1-2023 | 4,085,000 | 4,586,311 | ||||||||||||
The accompanying notes are an integral part of these financial statements.
Wells Fargo Intermediate Tax/AMT-Free Fund | 41
Portfolio of investments—June 30, 2020
| Interest rate | Maturity date | Principal | Value | |||||||||||||
| GO Revenue (continued) | ||||||||||||||||
King County WA Public Hospital District #1 Valley Medical Center Refunding Bond | 5.00 | % | 12-1-2026 | $ | 775,000 | $ | 922,886 | |||||||||
King County WA Public Hospital District #1 Valley Medical Center Refunding Bond | 5.00 | 12-1-2029 | 1,600,000 | 1,884,688 | ||||||||||||
King County WA Public Hospital District #1 Valley Medical Center Refunding Bond | 5.00 | 12-1-2031 | 6,665,000 | 7,776,722 | ||||||||||||
King County WA Public Hospital District #1 Valley Medical Center Refunding Bond | 5.00 | 12-1-2032 | 2,905,000 | 3,372,298 | ||||||||||||
King County WA Public Hospital District #1 Valley Medical Center Refunding Bond | 5.00 | 12-1-2033 | 7,045,000 | 8,149,515 | ||||||||||||
Seattle WA Refunding Bond Series A | 5.00 | 6-1-2024 | 6,345,000 | 7,479,930 | ||||||||||||
Washington Various Purposes Bond Series C | 5.00 | 2-1-2034 | 5,800,000 | 6,980,416 | ||||||||||||
Washington Various Purposes Refunding Bond Series B | 5.00 | 7-1-2028 | 4,000,000 | 4,912,400 | ||||||||||||
Yakima County WA West Valley School District #208 (AGM Insured) | 5.00 | 12-1-2032 | 1,200,000 | 1,559,568 | ||||||||||||
| 52,571,825 | ||||||||||||||||
|
| |||||||||||||||
| Health Revenue: 0.76% | ||||||||||||||||
Washington HCFR Fred Hutchinson Cancer Research Center (SIFMA Municipal Swap +1.05%) ± | 1.18 | 1-1-2042 | 10,000,000 | 10,027,900 | ||||||||||||
Washington HCFR Fred Hutchinson Cancer Research Center | 5.00 | 1-1-2023 | 4,000,000 | 4,386,000 | ||||||||||||
Washington HCFR Fred Hutchinson Cancer Research Center | 5.00 | 1-1-2026 | 2,250,000 | 2,641,275 | ||||||||||||
Washington HCFR Fred Hutchinson Cancer Research Center | 5.00 | 1-1-2027 | 1,050,000 | 1,226,883 | ||||||||||||
Washington HCFR Fred Hutchinson Cancer Research Center | 5.00 | 1-1-2028 | 1,350,000 | 1,572,858 | ||||||||||||
| 19,854,916 | ||||||||||||||||
|
| |||||||||||||||
| Housing Revenue: 0.20% | ||||||||||||||||
Snohomish County WA Housing Authority Carvel Apartments Project | 5.00 | 4-1-2032 | 1,955,000 | 2,453,760 | ||||||||||||
Snohomish County WA Housing Authority Carvel Apartments Project | 5.00 | 4-1-2033 | 1,550,000 | 1,933,222 | ||||||||||||
Snohomish County WA Housing Authority Carvel Apartments Project | 5.00 | 4-1-2034 | 655,000 | 814,067 | ||||||||||||
| 5,201,049 | ||||||||||||||||
|
| |||||||||||||||
| Miscellaneous Revenue: 0.81% | ||||||||||||||||
Washington Certificate of Participation Series B | 5.00 | 7-1-2035 | 1,335,000 | 1,709,788 | ||||||||||||
Washington Certificate of Participation Series B | 5.00 | 7-1-2037 | 1,585,000 | 2,014,820 | ||||||||||||
Washington Lease FYI Properties Refunding Bond | 5.00 | 6-1-2034 | 6,000,000 | 7,375,200 | ||||||||||||
Washington Motor Vehicle Fuel Tax Refunding Bond Series D | 5.00 | 7-1-2031 | 5,830,000 | 6,879,750 | ||||||||||||
Washington Office Building Refunding Bond | 5.00 | 7-1-2026 | 2,750,000 | 3,219,205 | ||||||||||||
| 21,198,763 | ||||||||||||||||
|
| |||||||||||||||
| Resource Recovery Revenue: 0.22% | ||||||||||||||||
Seattle WA Solid Waste System Improvement & Refunding Bond | 4.00 | 6-1-2033 | 1,175,000 | 1,334,941 | ||||||||||||
Tacoma WA Solid Waste Refunding Bond Series B | 5.00 | 12-1-2027 | 620,000 | 765,731 | ||||||||||||
Tacoma WA Solid Waste Refunding Bond Series B | 5.00 | 12-1-2028 | 1,455,000 | 1,795,121 | ||||||||||||
Tacoma WA Solid Waste Refunding Bond Series B | 5.00 | 12-1-2029 | 1,525,000 | 1,877,534 | ||||||||||||
| 5,773,327 | ||||||||||||||||
|
| |||||||||||||||
| Utilities Revenue: 0.57% | ||||||||||||||||
Chelan County WA Public Utility District #1 Refunding Bond Series A | 4.00 | 7-1-2037 | 2,750,000 | 3,320,268 | ||||||||||||
Chelan County WA Public Utility District #1 Refunding Bond Series A | 4.00 | 7-1-2038 | 2,805,000 | 3,375,341 | ||||||||||||
Energy Northwest Washington Wind Project | 5.00 | 7-1-2022 | 1,185,000 | 1,287,123 | ||||||||||||
Lewis County WA Public Utility District Refunding Bond | 5.25 | 4-1-2032 | 6,115,000 | 6,990,851 | ||||||||||||
| 14,973,583 | ||||||||||||||||
|
| |||||||||||||||
| 120,740,433 | ||||||||||||||||
|
| |||||||||||||||
The accompanying notes are an integral part of these financial statements.
42 | Wells Fargo Intermediate Tax/AMT-Free Fund
Portfolio of investments—June 30, 2020
| Interest rate | Maturity date | Principal | Value | |||||||||||||
West Virginia: 0.74% |
| |||||||||||||||
| GO Revenue: 0.31% | ||||||||||||||||
Ohio County WV Public School Bond | 3.00 | % | 6-1-2027 | $ | 2,740,000 | $ | 3,104,530 | |||||||||
West Virginia State Road Bond Series 2018 B | 5.00 | 12-1-2036 | 4,000,000 | 5,065,960 | ||||||||||||
| 8,170,490 | ||||||||||||||||
|
| |||||||||||||||
| Health Revenue: 0.06% | ||||||||||||||||
West Virginia Hospital Finance Authority West Virginia University Health System Series A | 5.00 | 6-1-2031 | 375,000 | 447,315 | ||||||||||||
West Virginia Hospital Finance Authority West Virginia University Health System Series A | 5.00 | 6-1-2032 | 980,000 | 1,162,231 | ||||||||||||
| 1,609,546 | ||||||||||||||||
|
| |||||||||||||||
| Miscellaneous Revenue: 0.37% | ||||||||||||||||
West Virginia EDA Excess Lottery Series A | 5.00 | 7-1-2038 | 2,980,000 | 3,696,899 | ||||||||||||
West Virginia School Building Authority Capital Improvement Bond Series A | 5.00 | 7-1-2026 | 1,520,000 | 1,831,858 | ||||||||||||
West Virginia School Building Authority Capital Improvement Bond Series A | 5.00 | 7-1-2027 | 1,595,000 | 1,924,862 | ||||||||||||
West Virginia School Building Authority Capital Improvement Bond Series A | 5.00 | 7-1-2029 | 1,755,000 | 2,106,491 | ||||||||||||
| 9,560,110 | ||||||||||||||||
|
| |||||||||||||||
| 19,340,146 | ||||||||||||||||
|
| |||||||||||||||
Wisconsin: 0.84% |
| |||||||||||||||
| Education Revenue: 0.26% | ||||||||||||||||
Wisconsin PFA Charter School Voyager Foundation Incorporate Project Series A | 6.00 | 10-1-2032 | 1,475,000 | 1,654,626 | ||||||||||||
Wisconsin PFA KU Campus Development Corporation Central District Development Project | 5.00 | 3-1-2032 | 4,315,000 | 5,070,039 | ||||||||||||
| 6,724,665 | ||||||||||||||||
|
| |||||||||||||||
| Health Revenue: 0.38% | ||||||||||||||||
Wisconsin HEFA Series A | 4.00 | 11-15-2039 | 2,250,000 | 2,458,755 | ||||||||||||
Wisconsin HEFA Series A | 5.00 | 7-15-2021 | 3,500,000 | 3,669,680 | ||||||||||||
Wisconsin HEFA Series A | 5.00 | 11-15-2023 | 3,500,000 | 3,957,065 | ||||||||||||
| 10,085,500 | ||||||||||||||||
|
| |||||||||||||||
| Housing Revenue: 0.15% | ||||||||||||||||
Wisconsin Tender Option Bond Trust Receipts/Certificates Series 2019-XF2821 (Mizuho Bank Limited LOC, Mizuho Bank Limited LIQ) 144Aø | 0.73 | 1-1-2026 | 3,860,000 | 3,860,000 | ||||||||||||
|
| |||||||||||||||
| Miscellaneous Revenue: 0.05% | ||||||||||||||||
Milwaukee WI RDA Public Schools | 5.00 | 11-15-2029 | 420,000 | 515,865 | ||||||||||||
Milwaukee WI RDA Public Schools | 5.00 | 11-15-2030 | 635,000 | 778,199 | ||||||||||||
| 1,294,064 | ||||||||||||||||
|
| |||||||||||||||
| 21,964,229 | ||||||||||||||||
|
| |||||||||||||||
Total Municipal Obligations (Cost $2,457,795,615) |
| 2,603,695,594 | ||||||||||||||
|
| |||||||||||||||
| Total investments in securities (Cost $2,457,795,615) | 99.60 | % | 2,603,695,594 | |||||
Other assets and liabilities, net | 0.40 | 10,507,656 | ||||||
|
|
|
| |||||
| Total net assets | 100.00 | % | $ | 2,614,203,250 | ||||
|
|
|
| |||||
The accompanying notes are an integral part of these financial statements.
Wells Fargo Intermediate Tax/AMT-Free Fund | 43
Portfolio of investments—June 30, 2020
| ø | Variable rate demand notes are subject to a demand feature which reduces the effective maturity. The maturity date shown represents the final maturity date of the security. The interest rate is determined and reset by the issuer daily, weekly, or monthly depending upon the terms of the security. The rate shown is the rate in effect at period end. |
| ± | Variable rate investment. The rate shown is the rate in effect at period end. |
| ¤ | The security is issued in zero coupon form with no periodic interest payments. |
| 144A | The security may be resold in transactions exempt from registration, normally to qualified institutional buyers, pursuant to Rule 144A under the Securities Act of 1933. |
| %% | The security is purchased on a when-issued basis. |
| ## | All or a portion of this security is segregated for when-issued securities. |
| øø | The interest rate is determined and reset by the issuer periodically depending upon the terms of the security. The rate shown is the rate in effect at period end. |
Abbreviations:
| AGC | Assured Guaranty Corporation |
| AGM | Assured Guaranty Municipal |
| Ambac | Ambac Financial Group Incorporated |
| BAM | Build America Mutual Assurance Company |
| CAB | Capital appreciation bond |
| CDA | Community Development Authority |
| CSCE | Charter School Credit Enhancement |
| ECFA | Educational & Cultural Facilities Authority |
| EDA | Economic Development Authority |
| EDFA | Economic Development Finance Authority |
| FHLMC | Federal Home Loan Mortgage Corporation |
| FNMA | Federal National Mortgage Association |
| GNMA | Government National Mortgage Association |
| GO | General obligation |
| HCFR | Healthcare facilities revenue |
| HEFA | Health & Educational Facilities Authority |
| HEFAR | Higher Education Facilities Authority Revenue |
| HFA | Housing Finance Authority |
| HFFA | Health Facilities Financing Authority |
| IDA | Industrial Development Authority |
| LIBOR | London Interbank Offered Rate |
| LIQ | Liquidity agreement |
| LOC | Letter of credit |
| MFHR | Multifamily housing revenue |
| National | National Public Finance Guarantee Corporation |
| PCR | Pollution control revenue |
| PFA | Public Finance Authority |
| RDA | Redevelopment Authority |
| SFMR | Single-family mortgage revenue |
| SIFMA | Securities Industry and Financial Markets Association |
| SPA | Standby purchase agreement |
| TTFA | Transportation Trust Fund Authority |
The accompanying notes are an integral part of these financial statements.
44 | Wells Fargo Intermediate Tax/AMT-Free Fund
Statement of assets and liabilities—June 30, 2020
Assets | ||||
Investments in unaffiliated securities, at value (cost $2,457,795,615) | $ | 2,603,695,594 | ||
Cash | 169,731 | |||
Receivable for investments sold | 975,000 | |||
Receivable for Fund shares sold | 2,771,766 | |||
Receivable for interest | 28,120,603 | |||
Prepaid expenses and other assets | 36,068 | |||
|
| |||
Total assets | 2,635,768,762 | |||
|
| |||
Liabilities | ||||
Payable for investments purchased | 15,284,619 | |||
Payable for Fund shares redeemed | 3,527,171 | |||
Management fee payable | 729,943 | |||
Dividends payable | 1,820,760 | |||
Administration fees payable | 143,205 | |||
Distribution fee payable | 12,075 | |||
Trustees’ fees and expenses payable | 3,561 | |||
Accrued expenses and other liabilities | 44,178 | |||
|
| |||
Total liabilities | 21,565,512 | |||
|
| |||
Total net assets | $ | 2,614,203,250 | ||
|
| |||
Net assets consist of | ||||
Paid-in capital | $ | 2,511,668,364 | ||
Total distributable earnings | 102,534,886 | |||
|
| |||
Total net assets | $ | 2,614,203,250 | ||
|
| |||
Computation of net asset value and offering price per share | ||||
Net assets – Class A | $ | 249,724,446 | ||
Shares outstanding – Class A1 | 21,304,037 | |||
Net asset value per share – Class A | $11.72 | |||
Maximum offering price per share – Class A2 | $12.08 | |||
Net assets – Class C | $ | 19,081,929 | ||
Shares outstanding – Class C1 | 1,627,910 | |||
Net asset value per share – Class C | $11.72 | |||
Net assets – Class R6 | $ | 1,159,305,004 | ||
Shares outstanding – Class R61 | 98,790,155 | |||
Net asset value per share – Class R6 | $11.74 | |||
Net assets – Administrator Class | $ | 60,434,942 | ||
Shares outstanding – Administrator Class1 | 5,152,377 | |||
Net asset value per share – Administrator Class | $11.73 | |||
Net assets – Institutional Class | $ | 1,125,656,929 | ||
Shares outstanding – Institutional Class1 | 95,892,427 | |||
Net asset value per share – Institutional Class | $11.74 | |||
| 1 | The Fund has an unlimited number of authorized shares. |
| 2 | Maximum offering price is computed as 100/97 of net asset value. On investments of $50,000 or more, the offering price is reduced. |
The accompanying notes are an integral part of these financial statements.
Wells Fargo Intermediate Tax/AMT-Free Fund | 45
Statement of operations—year ended June 30, 2020
Investment income | ||||
Interest | $ | 78,989,571 | ||
|
| |||
Expenses | ||||
Management fee | 9,983,255 | |||
Administration fees |
| |||
Class A | 417,455 | |||
Class C | 36,181 | |||
Class R6 | 334,733 | |||
Administrator Class | 174,710 | |||
Institutional Class | 936,965 | |||
Shareholder servicing fees |
| |||
Class A | 652,174 | |||
Class C | 56,518 | |||
Administrator Class | 436,775 | |||
Distribution fee |
| |||
Class C | 169,514 | |||
Custody and accounting fees | 91,684 | |||
Professional fees | 52,121 | |||
Registration fees | 123,853 | |||
Shareholder report expenses | 97,204 | |||
Trustees’ fees and expenses | 21,541 | |||
Other fees and expenses | 56,430 | |||
|
| |||
Total expenses | 13,641,113 | |||
Less: Fee waivers and/or expense reimbursements |
| |||
Fund-level | (266,236 | ) | ||
Class A | (216,167 | ) | ||
Class C | (17,910 | ) | ||
Class R6 | (3,219 | ) | ||
Administrator Class | (209,516 | ) | ||
|
| |||
Net expenses | 12,928,065 | |||
|
| |||
Net investment income | 66,061,506 | |||
|
| |||
Realized and unrealized gains (losses) on investments | ||||
Net realized losses on investments | (11,184,895 | ) | ||
Net change in unrealized gains (losses) on investments | 16,254,772 | |||
|
| |||
Net realized and unrealized gains (losses) on investments | 5,069,877 | |||
|
| |||
Net increase in net assets resulting from operations | $ | 71,131,383 | ||
|
| |||
The accompanying notes are an integral part of these financial statements.
46 | Wells Fargo Intermediate Tax/AMT-Free Fund
Statement of changes in net assets
| Year ended June 30, 2020 | Year ended June 30, 2019 | |||||||||||||||
Operations |
| |||||||||||||||
Net investment income | $ | 66,061,506 | $ | 65,737,994 | ||||||||||||
Net realized losses on investments | (11,184,895 | ) | (4,121,284 | ) | ||||||||||||
Net change in unrealized gains (losses) on investments | 16,254,772 | 78,795,074 | ||||||||||||||
|
| |||||||||||||||
Net increase in net assets resulting from operations | 71,131,383 | 140,411,784 | ||||||||||||||
|
| |||||||||||||||
Distributions to shareholders from net investment income and realized gains | ||||||||||||||||
Class A | (5,665,902 | ) | (6,656,236 | ) | ||||||||||||
Class C | (320,518 | ) | (537,102 | ) | ||||||||||||
Class R6 | (27,533,926 | ) | (13,953,353 | )1 | ||||||||||||
Administrator Class | (3,954,214 | ) | (4,326,110 | ) | ||||||||||||
Institutional Class | (28,315,374 | ) | (40,268,740 | ) | ||||||||||||
|
| |||||||||||||||
Total distributions to shareholders | (65,789,934 | ) | (65,741,541 | ) | ||||||||||||
|
| |||||||||||||||
Capital share transactions | Shares | Shares | ||||||||||||||
Proceeds from shares sold |
| |||||||||||||||
Class A | 2,965,506 | 34,620,862 | 2,268,249 | 25,839,853 | ||||||||||||
Class C | 144,337 | 1,694,521 | 236,883 | 2,686,470 | ||||||||||||
Class R6 | 46,910,464 | 549,315,972 | 96,158,706 | 1 | 1,084,942,320 | 1 | ||||||||||
Administrator Class | 5,072,549 | 59,288,034 | 6,429,407 | 73,171,373 | ||||||||||||
Institutional Class | 24,518,409 | 286,969,473 | 49,788,518 | 565,405,649 | ||||||||||||
|
| |||||||||||||||
| 931,888,862 | 1,752,045,665 | |||||||||||||||
|
| |||||||||||||||
Reinvestment of distributions |
| |||||||||||||||
Class A | 464,092 | 5,437,440 | 560,089 | 6,376,313 | ||||||||||||
Class C | 24,503 | 287,109 | 43,204 | 491,272 | ||||||||||||
Class R6 | 821,396 | 9,637,135 | 552,098 | 1 | 6,337,313 | 1 | ||||||||||
Administrator Class | 327,038 | 3,835,145 | 367,364 | 4,186,398 | ||||||||||||
Institutional Class | 2,101,021 | 24,658,105 | 2,596,341 | 29,571,995 | ||||||||||||
|
| |||||||||||||||
| 43,854,934 | 46,963,291 | |||||||||||||||
|
| |||||||||||||||
Payment for shares redeemed |
| |||||||||||||||
Class A | (4,686,618 | ) | (54,404,248 | ) | (5,668,788 | ) | (64,362,323 | ) | ||||||||
Class C | (833,633 | ) | (9,778,713 | ) | (1,118,105 | ) | (12,711,333 | ) | ||||||||
Class R6 | (34,293,227 | ) | (395,802,003 | ) | (11,359,282 | )1 | (129,862,171 | )1 | ||||||||
Administrator Class | (15,478,688 | ) | (180,152,457 | ) | (7,784,897 | ) | (87,831,846 | ) | ||||||||
Institutional Class | (33,441,703 | ) | (390,400,383 | ) | (120,238,740 | ) | (1,354,090,765 | ) | ||||||||
|
| |||||||||||||||
| (1,030,537,804 | ) | (1,648,858,438 | ) | |||||||||||||
|
| |||||||||||||||
Net increase (decrease) in net assets resulting from capital share transactions | (54,794,008 | ) | 150,150,518 | |||||||||||||
|
| |||||||||||||||
Total increase (decrease) in net assets | (49,452,559 | ) | 224,820,761 | |||||||||||||
|
| |||||||||||||||
Net assets | ||||||||||||||||
Beginning of period | 2,663,655,809 | 2,438,835,048 | ||||||||||||||
|
| |||||||||||||||
End of period | $ | 2,614,203,250 | $ | 2,663,655,809 | ||||||||||||
|
| |||||||||||||||
| 1 | For the period from July 31, 2018 (commencement of class operations) to June 30, 2019 |
The accompanying notes are an integral part of these financial statements.
Wells Fargo Intermediate Tax/AMT-Free Fund | 47
Financial highlights
(For a share outstanding throughout each period)
| Year ended June 30 | ||||||||||||||||||||
| CLASS A | 2020 | 2019 | 2018 | 2017 | 2016 | |||||||||||||||
Net asset value, beginning of period | $11.66 | $11.31 | $11.46 | $11.89 | $11.47 | |||||||||||||||
Net investment income | 0.26 | 0.28 | 0.27 | 0.27 | 0.26 | |||||||||||||||
Net realized and unrealized gains (losses) on investments | 0.05 | 0.35 | (0.15 | ) | (0.42 | ) | 0.42 | |||||||||||||
|
|
|
|
|
|
|
|
|
| |||||||||||
Total from investment operations | 0.31 | 0.63 | 0.12 | (0.15 | ) | 0.68 | ||||||||||||||
Distributions to shareholders from | ||||||||||||||||||||
Net investment income | (0.25 | ) | (0.28 | ) | (0.27 | ) | (0.27 | ) | (0.26 | ) | ||||||||||
Net realized gains | 0.00 | 0.00 | 0.00 | (0.01 | ) | 0.00 | ||||||||||||||
|
|
|
|
|
|
|
|
|
| |||||||||||
Total distributions to shareholders | (0.25 | ) | (0.28 | ) | (0.27 | ) | (0.28 | ) | (0.26 | ) | ||||||||||
Net asset value, end of period | $11.72 | $11.66 | $11.31 | $11.46 | $11.89 | |||||||||||||||
Total return1 | 2.72 | % | 5.67 | % | 1.08 | % | (1.27 | )% | 5.99 | % | ||||||||||
Ratios to average net assets (annualized) | ||||||||||||||||||||
Gross expenses | 0.79 | % | 0.80 | % | 0.80 | % | 0.79 | % | 0.80 | % | ||||||||||
Net expenses | 0.70 | % | 0.70 | % | 0.70 | % | 0.70 | % | 0.70 | % | ||||||||||
Net investment income | 2.18 | % | 2.47 | % | 2.38 | % | 2.31 | % | 2.23 | % | ||||||||||
Supplemental data | ||||||||||||||||||||
Portfolio turnover rate | 24 | % | 14 | % | 14 | % | 19 | % | 14 | % | ||||||||||
Net assets, end of period (000s omitted) | $249,724 | $263,113 | $287,408 | $359,649 | $556,673 | |||||||||||||||
| 1 | Total return calculations do not include any sales charges. |
The accompanying notes are an integral part of these financial statements.
48 | Wells Fargo Intermediate Tax/AMT-Free Fund
Financial highlights
(For a share outstanding throughout each period)
| Year ended June 30 | ||||||||||||||||||||
| CLASS C | 2020 | 2019 | 2018 | 2017 | 2016 | |||||||||||||||
Net asset value, beginning of period | $11.66 | $11.31 | $11.46 | $11.89 | $11.47 | |||||||||||||||
Net investment income | 0.17 | 0.20 | 0.19 | 0.18 | 0.17 | |||||||||||||||
Net realized and unrealized gains (losses) on investments | 0.06 | 0.35 | (0.15 | ) | (0.42 | ) | 0.42 | |||||||||||||
|
|
|
|
|
|
|
|
|
| |||||||||||
Total from investment operations | 0.23 | 0.55 | 0.04 | (0.24 | ) | 0.59 | ||||||||||||||
Distributions to shareholders from | ||||||||||||||||||||
Net investment income | (0.17 | ) | (0.20 | ) | (0.19 | ) | (0.18 | ) | (0.17 | ) | ||||||||||
Net realized gains | 0.00 | 0.00 | 0.00 | (0.01 | ) | 0.00 | ||||||||||||||
|
|
|
|
|
|
|
|
|
| |||||||||||
Total distributions to shareholders | (0.17 | ) | (0.20 | ) | (0.19 | ) | (0.19 | ) | (0.17 | ) | ||||||||||
Net asset value, end of period | $11.72 | $11.66 | $11.31 | $11.46 | $11.89 | |||||||||||||||
Total return1 | 1.95 | % | 4.88 | % | 0.32 | % | (2.01 | )% | 5.20 | % | ||||||||||
Ratios to average net assets (annualized) | ||||||||||||||||||||
Gross expenses | 1.54 | % | 1.55 | % | 1.55 | % | 1.54 | % | 1.55 | % | ||||||||||
Net expenses | 1.45 | % | 1.45 | % | 1.45 | % | 1.45 | % | 1.45 | % | ||||||||||
Net investment income | 1.43 | % | 1.73 | % | 1.63 | % | 1.56 | % | 1.48 | % | ||||||||||
Supplemental data | ||||||||||||||||||||
Portfolio turnover rate | 24 | % | 14 | % | 14 | % | 19 | % | 14 | % | ||||||||||
Net assets, end of period (000s omitted) | $19,082 | $26,737 | $35,421 | $44,462 | $56,601 | |||||||||||||||
| 1 | Total return calculations do not include any sales charges. |
The accompanying notes are an integral part of these financial statements.
Wells Fargo Intermediate Tax/AMT-Free Fund | 49
Financial highlights
(For a share outstanding throughout each period)
| Year ended June 30 | ||||||||
| CLASS R6 | 2020 | 20191 | ||||||
Net asset value, beginning of period | $11.67 | $11.33 | ||||||
Net investment income | 0.29 | 0.29 | ||||||
Net realized and unrealized gains (losses) on investments | 0.07 | 0.34 | ||||||
|
|
|
| |||||
Total from investment operations | 0.36 | 0.63 | ||||||
Distributions to shareholders from | ||||||||
Net investment income | (0.29 | ) | (0.29 | ) | ||||
Net asset value, end of period | $11.74 | $11.67 | ||||||
Total return2 | 3.11 | % | 5.65 | % | ||||
Ratios to average net assets (annualized) | ||||||||
Gross expenses | 0.41 | % | 0.41 | % | ||||
Net expenses | 0.40 | % | 0.40 | % | ||||
Net investment income | 2.48 | % | 2.75 | % | ||||
Supplemental data | ||||||||
Portfolio turnover rate | 24 | % | 14 | % | ||||
Net assets, end of period (000s omitted) | $1,159,305 | $996,477 | ||||||
| 1 | For the period from July 31, 2018 (commencement of class operations) to June 30, 2019. |
| 2 | Returns for periods of less than one year are not annualized. |
The accompanying notes are an integral part of these financial statements.
50 | Wells Fargo Intermediate Tax/AMT-Free Fund
Financial highlights
(For a share outstanding throughout each period)
| Year ended June 30 | ||||||||||||||||||||
| ADMINISTRATOR CLASS | 2020 | 2019 | 2018 | 2017 | 2016 | |||||||||||||||
Net asset value, beginning of period | $11.67 | $11.32 | $11.47 | $11.90 | $11.48 | |||||||||||||||
Net investment income | 0.27 | 0.29 | 0.28 | 0.28 | 0.27 | |||||||||||||||
Net realized and unrealized gains (losses) on investments | 0.06 | 0.35 | (0.15 | ) | (0.42 | ) | 0.42 | |||||||||||||
|
|
|
|
|
|
|
|
|
| |||||||||||
Total from investment operations | 0.33 | 0.64 | 0.13 | (0.14 | ) | 0.69 | ||||||||||||||
Distributions to shareholders from | ||||||||||||||||||||
Net investment income | (0.27 | ) | (0.29 | ) | (0.28 | ) | (0.28 | ) | (0.27 | ) | ||||||||||
Net realized gains | 0.00 | 0.00 | 0.00 | (0.01 | ) | 0.00 | ||||||||||||||
|
|
|
|
|
|
|
|
|
| |||||||||||
Total distributions to shareholders | (0.27 | ) | (0.29 | ) | (0.28 | ) | (0.29 | ) | (0.27 | ) | ||||||||||
Net asset value, end of period | $11.73 | $11.67 | $11.32 | $11.47 | $11.90 | |||||||||||||||
Total return | 2.82 | % | 5.77 | % | 1.18 | % | (1.17 | )% | 6.09 | % | ||||||||||
Ratios to average net assets (annualized) | ||||||||||||||||||||
Gross expenses | 0.73 | % | 0.74 | % | 0.73 | % | 0.73 | % | 0.74 | % | ||||||||||
Net expenses | 0.60 | % | 0.60 | % | 0.60 | % | 0.60 | % | 0.60 | % | ||||||||||
Net investment income | 2.28 | % | 2.57 | % | 2.48 | % | 2.39 | % | 2.33 | % | ||||||||||
Supplemental data | ||||||||||||||||||||
Portfolio turnover rate | 24 | % | 14 | % | 14 | % | 19 | % | 14 | % | ||||||||||
Net assets, end of period (000s omitted) | $60,435 | $177,742 | $183,624 | $309,793 | $802,527 | |||||||||||||||
The accompanying notes are an integral part of these financial statements.
Wells Fargo Intermediate Tax/AMT-Free Fund | 51
Financial highlights
(For a share outstanding throughout each period)
| Year ended June 30 | ||||||||||||||||||||
| INSTITUTIONAL CLASS | 2020 | 2019 | 2018 | 2017 | 2016 | |||||||||||||||
Net asset value, beginning of period | $11.68 | $11.33 | $11.47 | $11.91 | $11.49 | |||||||||||||||
Net investment income | 0.28 | 0.31 | 0.30 | 0.30 | 0.29 | |||||||||||||||
Net realized and unrealized gains (losses) on investments | 0.06 | 0.35 | (0.14 | ) | (0.43 | ) | 0.42 | |||||||||||||
|
|
|
|
|
|
|
|
|
| |||||||||||
Total from investment operations | 0.34 | 0.66 | 0.16 | (0.13 | ) | 0.71 | ||||||||||||||
Distributions to shareholders from | ||||||||||||||||||||
Net investment income | (0.28 | ) | (0.31 | ) | (0.30 | ) | (0.30 | ) | (0.29 | ) | ||||||||||
Net realized gains | 0.00 | 0.00 | 0.00 | (0.01 | ) | 0.00 | ||||||||||||||
|
|
|
|
|
|
|
|
|
| |||||||||||
Total distributions to shareholders | (0.28 | ) | (0.31 | ) | (0.30 | ) | (0.31 | ) | (0.29 | ) | ||||||||||
Net asset value, end of period | $11.74 | $11.68 | $11.33 | $11.47 | $11.91 | |||||||||||||||
Total return | 2.97 | % | 5.93 | % | 1.42 | % | (1.10 | )% | 6.26 | % | ||||||||||
Ratios to average net assets (annualized) | ||||||||||||||||||||
Gross expenses | 0.46 | % | 0.47 | % | 0.47 | % | 0.47 | % | 0.47 | % | ||||||||||
Net expenses | 0.45 | % | 0.45 | % | 0.45 | % | 0.45 | % | 0.44 | % | ||||||||||
Net investment income | 2.43 | % | 2.72 | % | 2.64 | % | 2.58 | % | 2.49 | % | ||||||||||
Supplemental data | ||||||||||||||||||||
Portfolio turnover rate | 24 | % | 14 | % | 14 | % | 19 | % | 14 | % | ||||||||||
Net assets, end of period (000s omitted) | $1,125,657 | $1,199,588 | $1,932,382 | $1,814,841 | $1,260,636 | |||||||||||||||
The accompanying notes are an integral part of these financial statements.
52 | Wells Fargo Intermediate Tax/AMT-Free Fund
Notes to financial statements
1. ORGANIZATION
Wells Fargo Funds Trust (the “Trust”), a Delaware statutory trust organized on March 10, 1999, is an open-end management investment company registered under the Investment Company Act of 1940, as amended (the “1940 Act”). As an investment company, the Trust follows the accounting and reporting guidance in Financial Accounting Standards Board (“FASB”) Accounting Standards Codification Topic 946, Financial Services – Investment Companies. These financial statements report on the Wells Fargo Intermediate Tax/AMT-Free Fund (the “Fund”) which is a diversified series of the Trust.
2. SIGNIFICANT ACCOUNTING POLICIES
The following significant accounting policies, which are consistently followed in the preparation of the financial statements of the Fund, are in conformity with U.S. generally accepted accounting principles which require management to make estimates and assumptions that affect the reported amounts of assets and liabilities, disclosure of contingent assets and liabilities at the date of the financial statements, and the reported amounts of revenues and expenses during the reporting period. Actual results could differ from those estimates.
Securities valuation
All investments are valued each business day as of the close of regular trading on the New York Stock Exchange (generally 4 p.m. Eastern Time), although the Fund may deviate from this calculation time under unusual or unexpected circumstances.
Debt securities are valued at the evaluated bid price provided by an independent pricing service (e.g. taking into account various factors, including yields, maturities, or credit ratings) or, if a reliable price is not available, the quoted bid price from an independent broker-dealer.
Investments which are not valued using the method discussed above are valued at their fair value, as determined in good faith by the Board of Trustees of the Fund. The Board of Trustees has established a Valuation Committee comprised of the Trustees and has delegated to it the authority to take any actions regarding the valuation of portfolio securities that the Valuation Committee deems necessary or appropriate, including determining the fair value of portfolio securities, unless the determination has been delegated to the Wells Fargo Asset Management Pricing Committee at Wells Fargo Funds Management, LLC (“Funds Management”). The Board of Trustees retains the authority to make or ratify any valuation decisions or approve any changes to the Valuation Procedures as it deems appropriate. On a quarterly basis, the Board of Trustees receives reports on any valuation actions taken by the Valuation Committee or the Wells Fargo Asset Management Pricing Committee which may include items for ratification.
When-issued transactions
The Fund may purchase securities on a forward commitment or when-issued basis. The Fund records a when-issued transaction on the trade date and will segregate assets in an amount at least equal in value to the Fund’s commitment to purchase when-issued securities. Securities purchased on a when-issued basis are marked-to-market daily and the Fund begins earning interest on the settlement date. Losses may arise due to changes in the market value of the underlying securities or if the counterparty does not perform under the contract.
Security transactions and income recognition
Securities transactions are recorded on a trade date basis. Realized gains or losses are recorded on the basis of identified cost.
Interest income is accrued daily and bond discounts are accreted and premiums are amortized daily. To the extent debt obligations are placed on non-accrual status, any related interest income may be reduced by writing off interest receivables when the collection of all or a portion of interest has been determined to be doubtful based on consistently applied procedures and the fair value has decreased. If the issuer subsequently resumes interest payments or when the collectability of interest is reasonably assured, the debt obligation is removed from non-accrual status.
Distributions to shareholders
Distributions to shareholders from net investment income are declared daily and paid monthly. Distributions from net realized gains, if any, are recorded on the ex-dividend date and paid at least annually. Such distributions are determined in accordance with income tax regulations and may differ from U.S. generally accepted accounting principles. Dividend sources are estimated at the time of declaration. The tax character of distributions is determined as of the Fund’s fiscal year end. Therefore, a portion of the Fund’s distributions made prior to the Fund’s fiscal year end may be categorized as a tax return of capital at year end.
Federal and other taxes
The Fund intends to continue to qualify as a regulated investment company by distributing substantially all of its investment company taxable and tax-exempt income and any net realized capital gains (after reduction for capital loss carryforwards) sufficient to relieve it from all, or substantially all, federal income taxes. Accordingly, no provision for federal income taxes was required.
Wells Fargo Intermediate Tax/AMT-Free Fund | 53
Notes to financial statements
The Fund’s income and federal excise tax returns and all financial records supporting those returns for the prior three fiscal years are subject to examination by the federal and Delaware revenue authorities. Management has analyzed the Fund’s tax positions taken on federal, state, and foreign tax returns for all open tax years and does not believe that there are any uncertain tax positions that require recognition of a tax liability.
As of June 30, 2020, the aggregate cost of all investments for federal income tax purposes was $2,458,828,634 and the unrealized gains (losses) consisted of:
Gross unrealized gains | $ | 149,359,192 | ||
Gross unrealized losses | (4,492,232 | ) | ||
Net unrealized gains | $ | 144,866,960 | ||
As of June 30, 2020, the Fund had capital loss carryforwards which consist of $18,062,193 in short-term capital losses and $24,484,632 in long-term capital losses.
Class allocations
The separate classes of shares offered by the Fund differ principally in applicable sales charges, distribution, shareholder servicing, and administration fees. Class specific expenses are charged directly to that share class. Investment income, common fund-level expenses, and realized and unrealized gains (losses) on investments are allocated daily to each class of shares based on the relative proportion of net assets of each class.
3. FAIR VALUATION MEASUREMENTS
Fair value measurements of investments are determined within a framework that has established a fair value hierarchy based upon the various data inputs utilized in determining the value of the Fund’s investments. The three-level hierarchy gives the highest priority to unadjusted quoted prices in active markets for identical assets or liabilities (Level 1) and the lowest priority to unobservable inputs (Level 3). The Fund’s investments are classified within the fair value hierarchy based on the lowest level of input that is significant to the fair value measurement. The inputs are summarized into three broad levels as follows:
| ∎ | Level 1 – quoted prices in active markets for identical securities |
| ∎ | Level 2 – other significant observable inputs (including quoted prices for similar securities, interest rates, prepayment speeds, credit risk, etc.) |
| ∎ | Level 3 – significant unobservable inputs (including the Fund’s own assumptions in determining the fair value of investments) |
The inputs or methodologies used for valuing investments in securities are not necessarily an indication of the risk associated with investing in those securities.
The following is a summary of the inputs used in valuing the Fund’s assets and liabilities as of June 30, 2020:
| Quoted prices (Level 1) | Other significant observable inputs (Level 2) | Significant (Level 3) | Total | |||||||||||||
Assets | ||||||||||||||||
Investments in: | ||||||||||||||||
Municipal obligations | $ | 0 | $ | 2,603,695,594 | $ | 0 | $ | 2,603,695,594 | ||||||||
Additional sector, industry or geographic detail is included in the Portfolio of Investments.
For the year ended June 30, 2020, the Fund did not have any transfers into/out of Level 3.
4. TRANSACTIONS WITH AFFILIATES
Management fee
Funds Management, an indirect wholly owned subsidiary of Wells Fargo & Company (“Wells Fargo”), is the manager of the Fund and provides advisory and fund-level administrative services under an investment management agreement. Under the investment management agreement, Funds Management is responsible for, among other services, implementing the investment objectives and strategies of the Fund, supervising the subadviser and providing fund-level administrative services in
54 | Wells Fargo Intermediate Tax/AMT-Free Fund
Notes to financial statements
connection with the Fund’s operations. As compensation for its services under the investment management agreement, Funds Management is entitled to receive a management fee at the following annual rate based on the Fund’s average daily net assets:
| Average daily net assets | Management fee | |||
First $500 million | 0.400 | % | ||
Next $500 million | 0.375 | |||
Next $2 billion | 0.350 | |||
Next $2 billion | 0.325 | |||
Next $5 billion | 0.290 | |||
Over $10 billion | 0.280 | |||
For the year ended June 30, 2020, the management fee was equivalent to an annual rate of 0.36% of the Fund’s average daily net assets.
Funds Management has retained the services of a subadviser to provide daily portfolio management to the Fund. The fee for subadvisory services is borne by Funds Management. Wells Capital Management Incorporated, an affiliate of Funds Management and an indirect wholly owned subsidiary of Wells Fargo, is the subadviser to the Fund and is entitled to receive a fee from Funds Management at an annual rate starting at 0.20% and declining to 0.10% as the average daily net assets of the Fund increase.
Administration fees
Under a class-level administration agreement, Funds Management provides class-level administrative services to the Fund, which includes paying fees and expenses for services provided by the transfer agent, sub-transfer agents, omnibus account servicers and record-keepers. As compensation for its services under the class-level administration agreement, Funds Management receives an annual fee which is calculated based on the average daily net assets of each class as follows:
| Class-level administration fee | ||||
Class A, Class C | 0.16 | % | ||
Class R6 | 0.03 | |||
Administrator Class | 0.10 | |||
Institutional Class | 0.08 | |||
Waivers and/or expense reimbursements
Funds Management has contractually waived and/or reimbursed management and administration fees to the extent necessary to maintain certain net operating expense ratios for the Fund. When each class of the Fund has exceeded its expense cap, Funds Management has waived fees and/or reimbursed expenses from fund-level expenses on a proportionate basis and then from class specific expenses. When only certain classes exceed their expense caps, waivers and/or reimbursements are applied against class specific expenses before fund-level expenses. Funds Management has committed through October 31, 2020 to waive fees and/or reimburse expenses to the extent necessary to cap the Fund’s expenses at 0.70% for Class A shares, 1.45% for Class C shares, 0.40% for Class R6 shares, 0.60% Administrator Class shares, and 0.45% for Institutional Class shares. Prior to or after the commitment expiration date, the cap may be increased or the commitment to maintain the cap may be terminated only with the approval of the Board of Trustees.
Distribution fee
The Trust has adopted a distribution plan for Class C shares of the Fund pursuant to Rule 12b-1 under the 1940 Act. A distribution fee is charged to Class C shares and paid to Wells Fargo Funds Distributor, LLC (“Funds Distributor”), the principal underwriter, at an annual rate of 0.75% of the average daily net assets of Class C shares.
In addition, Funds Distributor is entitled to receive the front-end sales charge from the purchase of Class A shares and a contingent deferred sales charge on the redemption of certain Class A shares. Funds Distributor is also entitled to receive the contingent deferred sales charges from redemptions of Class C shares. For the year ended June 30, 2020, Funds Distributor received $4,584 from the sale of Class A shares. No contingent deferred sales charges were incurred by Class A and Class C shares for the year ended June 30, 2020.
Wells Fargo Intermediate Tax/AMT-Free Fund | 55
Notes to financial statements
Shareholder servicing fees
The Trust has entered into contracts with one or more shareholder servicing agents, whereby Class A, Class C, and Administrator Class of the Fund are charged a fee at an annual rate of 0.25% of the average daily net assets of each respective class. A portion of these total shareholder servicing fees were paid to affiliates of Wells Fargo.
Interfund transactions
The Fund may purchase or sell portfolio investment securities to certain other Wells Fargo affiliates pursuant to Rule 17a-7 under the 1940 Act and under procedures adopted by the Board of Trustees. The procedures have been designed to ensure that these interfund transactions, which do not incur broker commissions, are effected at current market prices. Pursuant to these procedures, the Fund had $260,180,000 and $265,895,000 in interfund purchases and sales, respectively, during the year ended June 30, 2020.
5. INVESTMENT PORTFOLIO TRANSACTIONS
Purchases and sales of investments, excluding U.S. government obligations (if any) and short-term securities, for the year ended June 30, 2020 were $667,195,408 and $607,238,056, respectively.
6. BANK BORROWINGS
The Trust (excluding the money market funds), Wells Fargo Master Trust and Wells Fargo Variable Trust are parties to a $350,000,000 revolving credit agreement whereby the Fund is permitted to use bank borrowings for temporary or emergency purposes, such as to fund shareholder redemption requests. Interest under the credit agreement is charged to the Fund based on a borrowing rate equal to the higher of the Federal Funds rate in effect on that day plus 1.25% or the overnight LIBOR rate in effect on that day plus 1.25%. In addition, an annual commitment fee equal to 0.25% of the unused balance is allocated to each participating fund.
For the year ended June 30, 2020, there were no borrowings by the Fund under the agreement.
7. DISTRIBUTIONS TO SHAREHOLDERS
The tax character of distributions paid was $65,789,934 and $65,741,541 of tax-exempt income for the years ended June 30, 2020 and June 30, 2019, respectively.
As of June 30, 2020, the components of distributable earnings on a tax basis were as follows:
Undistributed tax-exempt income | Unrealized gains | Capital loss carryforward | ||
| $2,044,161 | $144,866,960 | $(42,546,825) | ||
8. INDEMNIFICATION
Under the Fund’s organizational documents, the officers and Trustees have been granted certain indemnification rights against certain liabilities that may arise out of performance of their duties to the Fund. The Fund has entered into a separate agreement with each Trustee that converts indemnification rights currently existing under the Fund’s organizational documents into contractual rights that cannot be changed in the future without the consent of the Trustee. Additionally, in the normal course of business, the Fund may enter into contracts with service providers that contain a variety of indemnification clauses. The Fund’s maximum exposure under these arrangements is dependent on future claims that may be made against the Fund and, therefore, cannot be estimated.
9. NEW ACCOUNTING PRONOUNCEMENT
In August 2018, FASB issued Accounting Standards Update (“ASU”) No. 2018-13, Fair Value Measurement (Topic 820) Disclosure Framework—Changes to the Disclosure Requirements for Fair Value Measurement. ASU 2018-13 updates the disclosure requirements on fair value measurements in Topic 820, Fair Value Measurements. The amendments are effective for fiscal years, and interim periods within those fiscal years, beginning after December 15, 2019. Management has adopted this guidance which did not have a material impact on the financial statements.
56 | Wells Fargo Intermediate Tax/AMT-Free Fund
Notes to financial statements
10. CORONAVIRUS (COVID-19) PANDEMIC
On March 11, 2020, the World Health Organization announced that it had made the assessment that coronavirus disease 2019 (“COVID-19”) is a pandemic. The impacts of COVID-19 are adversely affecting the entire global economy, individual companies and investment products, and the market in general. There is significant uncertainty around the extent and duration of business disruptions related to COVID-19 and the impacts may be short term or may last for an extended period of time. The risk of further spreading of COVID-19 has led to significant uncertainty and volatility in the financial markets.
Wells Fargo Intermediate Tax/AMT-Free Fund | 57
Report of independent registered public accounting firm
To the Shareholders of the Fund and Board of Trustees
Wells Fargo Funds Trust:
Opinion on the Financial Statements
We have audited the accompanying statement of assets and liabilities of Wells Fargo Intermediate Tax/AMT-Free Fund (the Fund), one of the funds constituting Wells Fargo Funds Trust, including the portfolio of investments, as of June 30, 2020, the related statement of operations for the year then ended, the statements of changes in net assets for each of the years in the two-year period then ended, and the related notes (collectively, the financial statements) and the financial highlights for each of the years or periods in the five-year period then ended. In our opinion, the financial statements and financial highlights present fairly, in all material respects, the financial position of the Fund as of June 30, 2020, the results of its operations for the year then ended, the changes in its net assets for each of the years in the two-year period then ended, and the financial highlights for each of the years or periods in the five-year period then ended, in conformity with U.S. generally accepted accounting principles.
Basis for Opinion
These financial statements and financial highlights are the responsibility of the Fund’s management. Our responsibility is to express an opinion on these financial statements and financial highlights based on our audits. We are a public accounting firm registered with the Public Company Accounting Oversight Board (United States) (PCAOB) and are required to be independent with respect to the Fund in accordance with the U.S. federal securities laws and the applicable rules and regulations of the Securities and Exchange Commission and the PCAOB.
We conducted our audits in accordance with the standards of the PCAOB. Those standards require that we plan and perform the audit to obtain reasonable assurance about whether the financial statements and financial highlights are free of material misstatement, whether due to error or fraud. Our audits included performing procedures to assess the risks of material misstatement of the financial statements and financial highlights, whether due to error or fraud, and performing procedures that respond to those risks. Such procedures included examining, on a test basis, evidence regarding the amounts and disclosures in the financial statements and financial highlights. Such procedures also included confirmation of securities owned as of June 30, 2020, by correspondence with the custodian and brokers, or by other appropriate auditing procedures. Our audits also included evaluating the accounting principles used and significant estimates made by management, as well as evaluating the overall presentation of the financial statements and financial highlights. We believe that our audits provide a reasonable basis for our opinion.

We have not been able to determine the specific year that we began serving as the auditor of one or more Wells Fargo Funds investment companies; however we are aware that we have served as the auditor of one or more Wells Fargo Funds investment companies since at least 1955.
Boston, Massachusetts
August 29, 2020
58 | Wells Fargo Intermediate Tax/AMT-Free Fund
Other information (unaudited)
TAX INFORMATION
Pursuant to Section 852 of the Internal Revenue Code, 100% of distributions paid from net investment income is designated as exempt-interest dividends for the fiscal year ended June 30, 2020.
PROXY VOTING INFORMATION
A description of the policies and procedures used to determine how to vote proxies relating to portfolio securities is available, upon request, by calling 1-800-222-8222, visiting our website at wfam.com, or visiting the SEC website at sec.gov. Information regarding how the proxies related to portfolio securities were voted during the most recent 12-month period ended June 30 is available on the website at wfam.com or by visiting the SEC website at sec.gov.
QUARTERLY PORTFOLIO HOLDINGS INFORMATION
The Fund files its complete schedule of portfolio holdings with the SEC for the first and third quarters of each fiscal year as an exhibit to its reports on Form N-PORT. Shareholders may view the filed Form N-PORT by visiting the SEC website at sec.gov.
Wells Fargo Intermediate Tax/AMT-Free Fund | 59
Other information (unaudited)
BOARD OF TRUSTEES AND OFFICERS
Each of the Trustees and Officers1 listed in the table below acts in identical capacities for each fund in the Wells Fargo family of funds, which consists of 147 mutual funds comprising the Wells Fargo Funds Trust, Wells Fargo Variable Trust, Wells Fargo Master Trust and four closed-end funds (collectively the “Fund Complex”). This table should be read in conjunction with the Prospectus and the Statement of Additional Information2. The mailing address of each Trustee and Officer is 525 Market Street, 12th Floor, San Francisco, CA 94105. Each Trustee and Officer serves an indefinite term, however, each Trustee serves such term until reaching the mandatory retirement age established by the Trustees.
Independent Trustees
Name and year of birth | Position held and length of service* | Principal occupations during past five years or longer | Current other public company or investment company directorships | |||
William R. Ebsworth (Born 1957) | Trustee, since 2015 | Retired. From 1984 to 2013, equities analyst, portfolio manager, research director and chief investment officer at Fidelity Management and Research Company in Boston, Tokyo, and Hong Kong, and retired in 2013 as Chief Investment Officer of Fidelity Strategic Advisers, Inc. where he led a team of investment professionals managing client assets. Prior thereto, Board member of Hong Kong Securities Clearing Co., Hong Kong Options Clearing Corp., the Thailand International Fund, Ltd., Fidelity Investments Life Insurance Company, and Empire Fidelity Investments Life Insurance Company. Audit Committee Chair and Investment Committee Chair of the Vincent Memorial Hospital Endowment (non-profit organization). Mr. Ebsworth is a CFA® charterholder. | N/A | |||
Jane A. Freeman (Born 1953) | Trustee, since 2015; Chair Liaison, since 2018 | Retired. From 2012 to 2014 and 1999 to 2008, Chief Financial Officer of Scientific Learning Corporation. From 2008 to 2012, Ms. Freeman provided consulting services related to strategic business projects. Prior to 1999, Portfolio Manager at Rockefeller & Co. and Scudder, Stevens & Clark. Board member of the Harding Loevner Funds from 1996 to 2014, serving as both Lead Independent Director and chair of the Audit Committee. Board member of the Russell Exchange Traded Funds Trust from 2011 to 2012 and the chair of the Audit Committee. Ms. Freeman is also an inactive Chartered Financial Analyst. | N/A | |||
Isaiah Harris, Jr. (Born 1952) | Trustee, since 2009; Audit Committee Chairman, since 2019 | Retired. Chairman of the Board of CIGNA Corporation since 2009, and Director since 2005. From 2003 to 2011, Director of Deluxe Corporation. Prior thereto, President and CEO of BellSouth Advertising and Publishing Corp. from 2005 to 2007, President and CEO of BellSouth Enterprises from 2004 to 2005 and President of BellSouth Consumer Services from 2000 to 2003. Emeritus member of the Iowa State University Foundation Board of Governors. Emeritus Member of the Advisory Board of Iowa State University School of Business. Advisory Board Member, Palm Harbor Academy (private school). Advisory Board Member, Child Evangelism Fellowship (non-profit). Mr. Harris is a certified public accountant (inactive status). | CIGNA Corporation | |||
Judith M. Johnson (Born 1949) | Trustee, since 2008; Audit Committee Chairman, from 2009 to 2018 | Retired. Prior thereto, Chief Executive Officer and Chief Investment Officer of Minneapolis Employees Retirement Fund from 1996 to 2008. Ms. Johnson is an attorney, certified public accountant and a certified managerial accountant. | N/A | |||
David F. Larcker (Born 1950) | Trustee, since 2009 | James Irvin Miller Professor of Accounting at the Graduate School of Business, Stanford University, Director of the Corporate Governance Research Initiative and Senior Faculty of The Rock Center for Corporate Governance since 2006. From 2005 to 2008, Professor of Accounting at the Graduate School of Business, Stanford University. Prior thereto, Ernst & Young Professor of Accounting at The Wharton School, University of Pennsylvania from 1985 to 2005. | N/A | |||
60 | Wells Fargo Intermediate Tax/AMT-Free Fund
Other information (unaudited)
Name and year of birth | Position held and length of service* | Principal occupations during past five years or longer | Current other public company or investment company directorships | |||
Olivia S. Mitchell (Born 1953) | Trustee, since 2006; Nominating and Governance Committee Chair, since 2018 | International Foundation of Employee Benefit Plans Professor, Wharton School of the University of Pennsylvania since 1993. Director of Wharton’s Pension Research Council and Boettner Center on Pensions & Retirement Research, and Research Associate at the National Bureau of Economic Research. Previously, Cornell University Professor from 1978 to 1993. | N/A | |||
Timothy J. Penny (Born 1951) | Trustee, since 1996; Chairman, since 2018 | President and Chief Executive Officer of Southern Minnesota Initiative Foundation, a non-profit organization, since 2007. Member of the Board of Trustees of NorthStar Education Finance, Inc., a non-profit organization, since 2007. | N/A | |||
James G. Polisson (Born 1959) | Trustee, since 2018 | Retired. Chief Marketing Officer, Source (ETF) UK Services, Ltd, from 2015 to 2017. From 2012 to 2015, Principal of The Polisson Group, LLC, a management consulting, corporate advisory and principal investing company. Chief Executive Officer and Managing Director at Russell Investments, Global Exchange Traded Funds from 2010 to 2012. Managing Director of Barclays Global Investors from 1998 to 2010 and Global Chief Marketing Officer for iShares and Barclays Global Investors from 2000 to 2010. Trustee of the San Francisco Mechanics’ Institute, a non-profit organization, from 2013 to 2015. Board member of the Russell Exchange Traded Fund Trust from 2011 to 2012. Director of Barclays Global Investors Holdings Deutschland GmbH from 2006 to 2009. Mr. Polisson is an attorney and has a retired status with the Massachusetts and District of Columbia Bar Associations. | N/A | |||
Pamela Wheelock (Born 1959) | Trustee, since January 2020; previously Trustee from January 2018 to July 2019 | Board member of the Destination Medical Center Economic Development Agency, Rochester, Minnesota since 2019 and Interim President of the McKnight Foundation since 2020. Acting Commissioner, Minnesota Department of Human Services, July 2019 through September 2019. Human Services Manager (part-time), Minnesota Department of Human Services, October 2019 through December 2019. Chief Operating Officer, Twin Cities Habitat for Humanity from 2017 to 2019. Vice President of University Services, University of Minnesota from 2012 to 2016. Prior thereto, on the Board of Directors, Governance Committee and Finance Committee for the Minnesota Philanthropy Partners (Saint Paul Foundation) from 2012 to 2018, Interim Chief Executive Officer of Blue Cross Blue Shield of Minnesota from 2011 to 2012, Chairman of the Board from 2009 to 2012 and Board Director from 2003 to 2015. Vice President, Leadership and Community Engagement, Bush Foundation, Saint Paul, Minnesota (a private foundation) from 2009 to 2011. Executive Vice President and Chief Financial Officer, Minnesota Sports and Entertainment from 2004 to 2009 and Senior Vice President from 2002 to 2004. Executive Vice President of the Minnesota Wild Foundation from 2004 to 2008. Commissioner of Finance, State of Minnesota, from 1999 to 2002. Currently Board Chair of the Minnesota Wild Foundation since 2010. | N/A | |||
| * | Length of service dates reflect the Trustee’s commencement of service with the Trust’s predecessor entities, where applicable. |
Wells Fargo Intermediate Tax/AMT-Free Fund | 61
Other information (unaudited)
Officers
Name and year of birth | Position held and length of service | Principal occupations during past five years or longer | ||
Andrew Owen (Born 1960) | President, since 2017 | Executive Vice President of Wells Fargo & Company and Head of Affiliated Managers, Wells Fargo Asset Management, since 2014. In addition, Mr. Owen is currently President, Chief Executive Officer and Director of Wells Fargo Funds Management, LLC since 2017. Prior thereto, Executive Vice President responsible for marketing, investments and product development for Wells Fargo Funds Management, LLC, from 2009 to 2014. | ||
Nancy Wiser1 (Born 1967) | Treasurer, since 2012 | Executive Vice President of Wells Fargo Funds Management, LLC since 2011. Chief Operating Officer and Chief Compliance Officer at LightBox Capital Management LLC, from 2008 to 2011. | ||
Michelle Rhee (Born 1966) | Chief Legal Officer, since 2019 | Secretary of Wells Fargo Funds Management, LLC, Chief Legal Counsel of Wells Fargo Asset Management and Assistant General Counsel of Wells Fargo Bank, N.A. since 2018. Associate General Counsel and Managing Director of Bank of America Corporation from 2004 to 2018. | ||
Catherine Kennedy (Born 1969) | Secretary, since 2019 | Vice President of Wells Fargo Funds Management, LLC and Senior Counsel of the Wells Fargo Legal Department since 2010. Vice President and Senior Counsel of Evergreen Investment Management Company, LLC from 1998 to 2010. | ||
Michael H. Whitaker (Born 1967) | Chief Compliance Officer, since 2016 | Chief Compliance Officer of Wells Fargo Asset Management since 2016. Senior Vice President and Chief Compliance Officer for Fidelity Investments from 2007 to 2016. | ||
David Berardi (Born 1975) | Assistant Treasurer, since 2009 | Vice President of Wells Fargo Funds Management, LLC since 2009. Vice President of Evergreen Investment Management Company, LLC from 2008 to 2010. Manager of Fund Reporting and Control for Evergreen Investment Management Company, LLC from 2004 to 2010. | ||
Jeremy DePalma1 (Born 1974) | Assistant Treasurer, since 2009 | Senior Vice President of Wells Fargo Funds Management, LLC since 2009. Senior Vice President of Evergreen Investment Management Company, LLC from 2008 to 2010 and head of the Fund Reporting and Control Team within Fund Administration from 2005 to 2010. | ||
| 1 | Nancy Wiser acts as Treasurer of 65 funds in the Fund Complex. Jeremy DePalma acts as the Treasurer of 82 funds and Assistant Treasurer of 65 funds in the Fund Complex. |
| 2 | The Statement of Additional Information includes additional information about the Trustees and is available, without charge, upon request, by calling 1-800-222-8222 or by visiting the website at wfam.com. |
62 | Wells Fargo Intermediate Tax/AMT-Free Fund
Other information (unaudited)
BOARD CONSIDERATION OF INVESTMENT MANAGEMENT AND SUB-ADVISORY AGREEMENTS:
Wells Fargo Intermediate Tax/AMT-Free Fund
Under the Investment Company Act of 1940 (the “1940 Act”), the Board of Trustees (the “Board”) of Wells Fargo Funds Trust (the “Trust”) must determine annually whether to approve the continuation of the Trust’s investment management and sub-advisory agreements. In this regard, at a Board meeting held on May 26, 2020 and May 28, 2020 (together, the “Meeting”), the Board, all the members of which have no direct or indirect interest in the investment management and sub-advisory agreements and are not “interested persons” of the Trust, as defined in the 1940 Act (the “Independent Trustees”), reviewed and approved for Wells Fargo Intermediate Tax/AMT-Free Fund (the “Fund”): (i) an investment management agreement (the “Management Agreement”) with Wells Fargo Funds Management, LLC (“Funds Management”); and (ii) an investment sub-advisory agreement (the “Sub-Advisory Agreement”) with Wells Capital Management Incorporated (the “Sub-Adviser”), an affiliate of Funds Management. The Management Agreement and the Sub-Advisory Agreement are collectively referred to as the “Advisory Agreements.”
At the Meeting, the Board considered the factors and reached the conclusions described below relating to the selection of Funds Management and the Sub-Adviser and the approval of the Advisory Agreements. Prior to the Meeting, including at a Board meeting held in April 2020, the Trustees conferred extensively among themselves and with representatives of Funds Management about these matters. Also, the Board has adopted a team-based approach, with each team consisting of a sub-set of Trustees, to assist the full Board in the discharge of its duties in reviewing investment performance and other matters throughout the year. The Independent Trustees were assisted in their evaluation of the Advisory Agreements by independent legal counsel, from whom they received separate legal advice and with whom they met separately.
In providing information to the Board, Funds Management and the Sub-Adviser were guided by a detailed set of requests for information submitted to them by independent legal counsel on behalf of the Independent Trustees at the start of the Board’s annual contract renewal process earlier in 2020. In considering and approving the Advisory Agreements, the Trustees considered the information they believed relevant, including but not limited to the information discussed below. The Board considered not only the specific information presented in connection with the Meeting, but also the knowledge gained over time through interaction with Funds Management and the Sub-Adviser about various topics. In this regard, the Board reviewed reports of Funds Management at each of its quarterly meetings, which included, among other things, portfolio reviews and investment performance reports. In addition, the Board and the teams mentioned above confer with portfolio managers at various times throughout the year. The Board did not identify any particular information or consideration that was all-important or controlling, and each individual Trustee may have attributed different weights to various factors.
After its deliberations, the Board unanimously approved the continuation of the Advisory Agreements for a one-year term and determined that the compensation payable to Funds Management and the Sub-Adviser under each of the Advisory Agreements was reasonable. The Board considered the approval of the Advisory Agreements for the Fund as part of its consideration of agreements for funds across the complex, but its approvals were made on a fund-by-fund basis. The following summarizes a number of important, but not necessarily all, factors considered by the Board in support of its approvals.
Nature, extent and quality of services
The Board received and considered various information regarding the nature, extent and quality of services provided to the Fund by Funds Management and the Sub-Adviser under the Advisory Agreements. This information included a description of the investment advisory services and Fund-level administrative services covered by the Management Agreement, as well as, among other things, a summary of the background and experience of senior management of Wells Fargo Asset Management (“WFAM”), of which Funds Management and the Sub-Adviser are a part, and a summary of investments made in the business of WFAM. The Board also received a description of Funds Management’s and the Sub-Adviser’s business continuity plans and of their approaches to data privacy and cybersecurity, and related testing. The Board also received and reviewed information about Funds Management’s role as administrator of the Fund’s liquidity risk management program, Funds Management’s approach to risk management, and Funds Management’s intermediary and vendor oversight program.
The Board also considered the qualifications, background, tenure and responsibilities of each of the portfolio managers primarily responsible for the day-to-day portfolio management of the Fund. The Board evaluated the ability of Funds Management and the Sub-Adviser to attract and retain qualified investment professionals, including research, advisory and supervisory personnel. The Board further considered the compliance programs and compliance records of Funds Management and the Sub-Adviser. In addition, the Board took into account the full range of services provided to the Fund by Funds Management and its affiliates.
Wells Fargo Intermediate Tax/AMT-Free Fund | 63
Other information (unaudited)
Fund investment performance and expenses
The Board considered the investment performance results for the Fund over various time periods ended December 31, 2019. The Board also considered more current results for various time periods ended March 31, 2020. The Board considered these results in comparison to the investment performance of funds in a universe that was determined by Broadridge Inc. (“Broadridge”) to be similar to the Fund (the “Universe”), and in comparison to the Fund’s benchmark index and to other comparative data. Broadridge is an independent provider of investment company data. The Board received a description of the methodology used by Broadridge to select the mutual funds in the performance Universe. The Board noted that the investment performance of the Fund (Administrator Class) was higher than or in range of the average investment performance of the Universe for the three-, five- and ten-year periods ended December 31, 2019, and lower than the average investment performance of the Universe for the one-year period ended December 31, 2019. The Board also noted that the investment performance of the Fund (Administrator Class) was higher than the average performance of the Universe for all periods ended March 31, 2020. The Board also noted that the investment performance of the Fund was higher than its benchmark index, the Bloomberg Barclays Municipal Bond 1-15 Year Blend Index, for the ten-year period ended December 31, 2019, and lower than its benchmark index for the one-, three, and five-year periods ended December 31, 2019. The Board also noted that the investment performance of the Fund was higher than its benchmark index, the Bloomberg Barclays Municipal Bond 1-15 Year Blend Index, for the ten-year period ended March 31, 2020, and lower than its benchmark index for the one-, three- and five-year periods ended March 31, 2020.
The Board received information concerning, and discussed factors contributing to, the underperformance of the Fund relative to the Universe and benchmark index for the periods identified above. The Board took note of the explanations for the relative underperformance during these periods, including with respect to investment decisions and market factors that affected the Fund’s investment performance.
The Board also received and considered information regarding the Fund’s net operating expense ratios and their various components, including actual management fees, custodian and other non-management fees, and Rule 12b-1 and non-Rule 12b-1 shareholder service fees. The Board considered these ratios in comparison to the median ratios of funds in class-specific expense groups that were determined by Broadridge to be similar to the Fund (the “Groups”). The Board received a description of the methodology used by Broadridge to select the mutual funds in the expense Groups and an explanation of how funds comprising expense groups and their expense ratios may vary from year-to-year. Based on the Broadridge reports, the Board noted that the net operating expense ratios of the Fund were lower than or equal to the median net operating expense ratios of the expense Groups for each share class.
The Board took into account the Fund’s investment performance and expense information provided to it among the factors considered in deciding to re-approve the Advisory Agreements.
Investment management and sub-advisory fee rates
The Board reviewed and considered the contractual fee rates payable by the Fund to Funds Management under the Management Agreement, as well as the contractual fee rates payable by the Fund to Funds Management for class-level administrative services under a Class-Level Administration Agreement, which include, among other things, class-level transfer agency and sub-transfer agency costs (collectively, the “Management Rates”). The Board also reviewed and considered the contractual investment sub-advisory fee rates that are payable by Funds Management to the Sub-Adviser for investment sub-advisory services.
Among other information reviewed by the Board was a comparison of the Fund’s Management Rates with the average contractual investment management fee rates of funds in the expense Groups at a common asset level as well as transfer agency costs of the funds in the expense Groups. The Board noted that the Management Rates of the Fund were lower than or in range of the sum of these average rates for the Fund’s expense Groups for all share classes.
The Board also received and considered information about the portion of the total management fee that was retained by Funds Management after payment of the fee to the Sub-Adviser for sub-advisory services. In assessing the reasonableness of this amount, the Board received and evaluated information about the nature and extent of responsibilities retained and risks assumed by Funds Management and not delegated to or assumed by the Sub-Adviser, and about Funds Management’s on-going oversight services. Given the affiliation between Funds Management and the Sub-Adviser, the Board ascribed limited relevance to the allocation of fees between them.
The Board also received and considered information about the nature and extent of services offered and fee rates charged by Funds Management and the Sub-Adviser to other types of clients with investment strategies similar to those of the Fund. In this regard, the Board received information about the significantly greater scope of services, and compliance, reporting and other legal burdens and risks of managing proprietary mutual funds compared with those associated with managing assets of other types of clients, including third-party sub-advised fund clients and non-mutual fund clients such as institutional separate accounts.
64 | Wells Fargo Intermediate Tax/AMT-Free Fund
Other information (unaudited)
Based on its consideration of the factors and information it deemed relevant, including those described here, the Board determined that the compensation payable to Funds Management under the Management Agreement and to the Sub-Adviser under the Sub-Advisory Agreement was reasonable.
Profitability
The Board received and considered information concerning the profitability of Funds Management, as well as the profitability of both WFAM and Wells Fargo & Co. (“Wells Fargo”) from providing services to the fund family as a whole. The Board noted that the Sub-Adviser’s profitability information with respect to providing services to the Fund and other funds in the family was subsumed in the WFAM and Wells Fargo profitability analysis.
Funds Management reported on the methodologies and estimates used in calculating profitability, including a description of the methodology used to allocate certain expenses. Among other things, the Board noted that the levels of profitability reported on a fund-by-fund basis varied widely, depending on factors such as the size, type and age of fund.
Based on its review, the Board did not deem the profits reported by Funds Management, WFAM or Wells Fargo from services provided to the Fund to be at a level that would prevent it from approving the continuation of the Advisory Agreements.
Economies of scale
The Board received and considered information about the potential for Funds Management to experience economies of scale in the provision of management services to the Fund, the difficulties of calculating economies of scale at an individual fund level, and the extent to which potential scale benefits are shared with shareholders. The Board noted the existence of breakpoints in the Fund’s management fee structure, which operate generally to reduce the Fund’s expense ratios as the Fund grows in size, and the size of the Fund in relation to such breakpoints. The Board considered that in addition to management fee breakpoints, Funds Management shares potential economies of scale from its management business in a variety of ways, including through fee waiver and expense reimbursement arrangements, services that benefit shareholders, competitive management fee rates set at the outset without regard to breakpoints, and investments in the business intended to enhance services available to shareholders.
The Board concluded that Funds Management’s arrangements with respect to the Fund, including contractual breakpoints, constituted a reasonable approach to sharing potential economies of scale with the Fund and its shareholders.
Other benefits to Funds Management and the Sub-Adviser
The Board received and considered information regarding potential “fall-out” or ancillary benefits received by Funds Management and its affiliates, including the Sub-Adviser, as a result of their relationships with the Fund. Ancillary benefits could include, among others, benefits directly attributable to other relationships with the Fund and benefits potentially derived from an increase in Funds Management’s and the Sub-Adviser’s business as a result of their relationships with the Fund. The Board noted that various affiliates of Funds Management may receive distribution-related fees, shareholder servicing payments and sub-transfer agency fees in respect of shares sold or held through them and services provided.
The Board also reviewed information about soft dollar credits earned and utilized by the Sub-Adviser, fees earned by Funds Management and the Sub-Adviser from managing a private investment vehicle for the fund family’s securities lending collateral, and commissions earned by an affiliated broker from portfolio transactions.
Based on its consideration of the factors and information it deemed relevant, including those described here, the Board did not find that any ancillary benefits received by Funds Management and its affiliates, including the Sub-Adviser, were unreasonable.
Conclusion
At the Meeting, after considering the above-described factors and based on its deliberations and its evaluation of the information described above, the Board unanimously approved the continuation of the Advisory Agreements for a one-year term and determined that the compensation payable to Funds Management and the Sub-Adviser under each of the Advisory Agreements was reasonable.
Wells Fargo Intermediate Tax/AMT-Free Fund | 65
Other information (unaudited)
LIQUIDITY RISK MANAGEMENT PROGRAM
In accordance with Rule 22e-4 under the Investment Company Act of 1940, as amended (the “Liquidity Rule”), Wells Fargo Funds Trust (the “Trust”) has adopted and implemented a liquidity risk management program (the “Program”) on behalf of each of its series, including the Fund, which is reasonably designed to assess and manage the Fund’s liquidity risk. “Liquidity risk” is defined as the risk that the Fund is unable to meet redemption requests without significantly diluting remaining investors’ interests in the Fund. The Trust’s Board of Trustees (the “Board”) previously approved the designation of Wells Fargo Funds Management, LLC (“Funds Management”), the Fund’s investment manager, as the administrator of the Program, and Funds Management has established a Liquidity Risk Management Council composed of personnel from multiple departments within Funds Management and its affiliates to assist Funds Management in the implementation and on-going administration of the Program.
The Program is comprised of various components designed to support the assessment and/or management of liquidity risk, including: (1) the periodic assessment (no less frequently than annually) of certain factors that influence the Fund’s liquidity risk; (2) the periodic classification (no less frequently than monthly) of the Fund’s investments into one of four liquidity categories that reflect an estimate of their liquidity under current market conditions; (3) a 15% limit on the acquisition of “illiquid investments” (as defined under the Liquidity Rule); (4) to the extent the Fund does not invest primarily in “highly liquid investments” (as defined under the Liquidity Rule), the determination of a minimum percentage of the Fund’s assets that generally will be invested in highly liquid investments (an “HLIM”); (5) if the Fund has established an HLIM, the periodic review (no less frequently than annually) of the HLIM and the adoption of policies and procedures for responding to a shortfall of the Fund’s “highly liquid investments” below its HLIM; and (6) periodic reporting to the Board.
At a meeting of the Board held on May 26 and 28, 2020, the Board received a written report (the “Report”) from Funds Management that addressed the operation of the Program and assessed its adequacy and effectiveness of implementation. The Report covered the initial period from December 1, 2018 through December 31, 2019 (the “Reporting Period”). No significant liquidity events impacting the Fund were noted in the Report. There were no material changes to the Program during the Reporting Period. The Report concluded that the Program is operating effectively to assess and manage the Fund’s liquidity risk, and that the Program has been and continues to be adequately and effectively implemented to monitor and, as applicable, respond to the Fund’s liquidity developments.
There can be no assurance that the Program will achieve its objectives under all circumstances in the future. Please refer to the Fund’s prospectus for more information regarding the Fund’s exposure to liquidity risk and other risks to which an investment in the Fund may be subject.
66 | Wells Fargo Intermediate Tax/AMT-Free Fund
Appendix I (unaudited)
Effective on or after May 1, 2020, clients of Edward Jones (also referred to as “shareholders”) purchasing Fund shares on the Edward Jones commission and fee-based platforms are eligible only for the following sales charge discounts (also referred to as “breakpoints”) and waivers, which can differ from breakpoints and waivers described elsewhere in the Fund’s Prospectus or SAI or through another broker-dealer. In all instances, it is the shareholder’s responsibility to inform Edward Jones at the time of purchase of any relationship, holdings of Wells Fargo Funds or other facts qualifying the purchaser for breakpoints or waivers. Edward Jones can ask for documentation of such circumstance.
| Breakpoints available at Edward Jones |
| Rights of Accumulation (ROA) |
The applicable sales charge on a purchase of Class A shares is determined by taking into account all share classes (except any money market funds and retirement plan share classes) of Wells Fargo Funds held by the shareholder or in an account grouped by Edward Jones with other accounts for the purpose of providing certain pricing considerations (“pricing groups”). This includes all share classes held on the Edward Jones platform and/or held on another platform. The inclusion of eligible fund family assets in the rights of accumulation calculation is dependent on the shareholder notifying his or her financial advisor of such assets at the time of calculation. |
ROA is determined by calculating the higher of cost or market value (current shares x NAV). |
| Letter of Intent (LOI) |
Through a LOI, shareholders can receive the sales charge and breakpoint discounts for purchases shareholders intend to makeover a 13-month period from the date Edward Jones receives the LOI. The LOI is determined by calculating the higher of cost or market value of qualifying holdings at LOI initiation in combination with the value that the shareholder intends to buy over a 13-month period to calculate the front-end sales charge and any breakpoint discounts. Each purchase the shareholder makes during that 13-month period will receive the sales charge and breakpoint discount that applies to the total amount. The inclusion of eligible fund family assets in the LOI calculation is dependent on the shareholder notifying his or her financial advisor of such assets at the time of calculation. Purchases made before the LOI is received by Edward Jones are not covered under the LOI and will not reduce the sales charge previously paid. Sales charges will be adjusted if LOI is not met. |
| Sales charges are waived for the following shareholders and in the following situations at Edward Jones: |
● Associates of Edward Jones and its affiliates and their family members who are in the same pricing group (as determined by Edward Jones under its policies and procedures) as the associate. This waiver will continue for the remainder of the associate’s life if the associate retires from Edward Jones in good-standing. |
● Shares purchased in an Edward Jones fee-based program. |
● Shares purchased through reinvestment of capital gains distributions and dividend reinvestment. |
● Shares purchased from the proceeds of redeemed shares of the same fund family so long as the following conditions are met: 1) the proceeds are from the sale of shares within 60 days of the purchase, and 2) the sale and purchase are made in the same share class and the same account or the purchase is made in an individual retirement account with proceeds from liquidations in anon-retirement account. |
● Shares exchanged into Class A shares from another share class so long as the exchange is into the same fund and was initiated at the discretion of Edward Jones. Edward Jones is responsible for any remaining CDSC due to the fund company, if applicable. Any future purchases are subject to the applicable sales charge as disclosed in the prospectus. |
● Exchanges from Class C shares to Class A shares of the same fund, generally, in the 84th month following the anniversary of the purchase date or earlier at the discretion of Edward Jones. |
| If the shareholder purchases shares that are subject to a CDSC and those shares are redeemed before the CDSC is expired, the shareholder is responsible to pay the CDSC except in the following conditions available at Edward Jones: |
● The death or disability of the shareholder. |
● Systematic withdrawals with up to 10% per year of the account value. |
● Return of excess contributions from an Individual Retirement Account (IRA). |
● Shares sold as part of a required minimum distribution for IRA and retirement accounts if the redemption is taken in or after the year the shareholder reaches qualified age based on applicable IRS regulation. |
● Shares sold to pay Edward Jones fees or costs in such cases where the transaction is initiated by Edward Jones. |
● Shares exchanged in an Edward Jones fee-based program. |
● Shares acquired through NAV reinstatement. |
Wells Fargo Intermediate Tax/AMT-Free Fund | 67
Appendix I (unaudited)
| Other Important Information for accounts at Edward Jones: |
| Minimum Purchase Amounts |
● $250 initial purchase minimum |
● $50 subsequent purchase minimum |
| Minimum Balances |
| Edward Jones has the right to redeem at its discretion fund holdings with a balance of $250 or less. The following are examples of accounts that are not included in this policy: |
● A fee-based account held on an Edward Jones platform ● A 529 account held on an Edward Jones platform ● An account with an active systematic investment plan or letter of intent (LOI) |
| Changing Share Classes |
| At any time it deems necessary, Edward Jones has the authority to exchange at NAV a shareholder’s holdings in a fund to Class A shares. |
68 | Wells Fargo Intermediate Tax/AMT-Free Fund
Appendix II (unaudited)
Effective June 1, 2020, shareholders purchasing Fund shares through an Oppenheimer & Co. Inc. (“Oppenheimer”) platform or account are eligible only for the following load waivers (front-end sales charge waivers and contingent deferred or back-end, sales charge waivers) and discounts, which may differ from those disclosed in the Fund’s Prospectus or SAI.
| Front-end Sales Load Waivers on Class A Shares available at Oppenheimer |
| Employer-sponsored retirement, deferred compensation and employee benefit plans (including health savings accounts) and trusts used to fund those plans, provided that the shares are not held in a commission-based brokerage account and shares are held for the benefit of the plan. |
| Shares purchased by or through a 529 Plan. |
| Shares purchased through an Oppenheimer affiliated investment advisory program. |
| Shares purchased through reinvestment of capital gains distributions and dividend reinvestment when purchasing shares of the same fund (but not any other fund within the fund family). |
| Shares purchased from the proceeds of redemptions within the same fund family, provided (1) the repurchase occurs within 90 days following the redemption, (2) the redemption and purchase occur in the same account, and (3) redeemed shares were subject to a front-end or deferred sales load (known as Rights of Restatement). |
| A shareholder in the Fund’s Class C shares will have their shares exchanged at net asset value to Class A shares (or the appropriate share class) of the Fund if the shares are no longer subject to a CDSC and the exchange is in line with the policies and procedures of Oppenheimer. |
| Employees and registered representatives of Oppenheimer or its affiliates and their family members. |
| Directors or Trustees of the Fund, and employees of the Fund’s investment adviser or any of its affiliates, as described in the Prospectus. |
| CDSC Waivers on A and C Shares available at Oppenheimer |
| Death or disability of the shareholder. |
| Shares sold as part of a systematic withdrawal plan as described in the Prospectus. |
| Return of excess contributions from an IRA Account. |
| Shares sold as part of a required minimum distribution for IRA and retirement accounts due to the shareholder reaching the qualified age based on applicable IRS regulations as described in the Prospectus. |
| Shares sold to pay Oppenheimer fees but only if the transaction is initiated by Oppenheimer. |
| Shares acquired through a right of reinstatement. |
| Front-end load Discounts Available at Oppenheimer: Breakpoints, Rights of Accumulation & Letters of Intent |
| Breakpoints as described in the Prospectus. |
| Rights of Accumulation (ROA), which entitle shareholders to breakpoint discounts, will be automatically calculated based on the aggregated holding of fund family assets held by accounts within the purchaser’s household at Oppenheimer. Eligible fund family assets not held at Oppenheimer may be included in the ROA calculation only if the shareholder notifies his or her financial advisor about such assets. |
Wells Fargo Intermediate Tax/AMT-Free Fund | 69
Appendix III (unaudited)
Effective June 15, 2020, shareholders purchasing fund shares through a Robert W. Baird & Co. (“Baird”) platform or account will only be eligible for the following sales charge waivers (front-end sales charge waivers and CDSC waivers) and discounts, which may differ from those disclosed elsewhere in the Fund’s Prospectus or the SAI.
| Front-end Sales Load Waivers on Class A Shares available at Baird |
| Shares purchased through reinvestment of capital gains distributions and dividend reinvestment when purchasing share of the same fund. |
| Share purchase by employees and registers representatives of Baird or its affiliate and their family members as designated by Baird. |
| Shares purchase from the proceeds of redemptions within the same fund family, provided (1) the repurchase occurs within 90 days following the redemption, (2) the redemption and purchase occur in the same accounts, and (3) redeemed shares were subject to a front-end or deferred sales charge (known as rights of reinstatement). |
| A shareholder in the Funds Investor C Shares will have their share exchanged at net asset value to Investor A shares of the fund if the shares are no longer subject to CDSC and the exchange is in line with the policies and procedures of Baird. |
| Employer-sponsored retirement plans or charitable accounts in a transactional brokerage account at Baird, including 401(k) plans, 457 plans, employer-sponsored 403(b) plans, profit sharing and money purchase pension plans and defined benefit plans. For purposes of this provision, employer-sponsored retirement plans do not include SEP IRAs, Simple IRAs or SAR-SEPs. |
| CDSC Waivers on A and C Shares available at Baird |
| Shares sold due to death or disability of the shareholder. |
| Shares sold as part of a systematic withdrawal plan as described in the Fund’s Prospectus. |
| Shares bought due to returns of excess contributions from an IRA Account. |
| Shares sold as part of a required minimum distribution for IRA and retirement accounts due to the shareholder reaching age 72 as described in the Fund’s Prospectus. |
| Shares sold to pay Baird fees but only if the transaction is initiated by Baird. |
| Shares acquired through a right of reinstatement. |
| Front-end load Discounts Available at Baird: Breakpoint and/or Rights of Accumulation |
| Breakpoints as described in the Prospectus. |
| Rights of accumulations which entitles shareholders to breakpoint discounts will be automatically calculated based on the aggregated holding of fund family assets held by accounts within the purchaser’s household at Baird. Eligible fund family assets not held at Baird may be included in the rights of accumulations calculation only if the shareholder notifies his or her financial advisor about such assets. |
| Letters of Intent (LOI) allow for breakpoint discounts based on anticipated purchases within a fund family through Baird, over a 13-month period of time. |
70 | Wells Fargo Intermediate Tax/AMT-Free Fund
This page is intentionally left blank.
This page is intentionally left blank.
For more information
More information about Wells Fargo Funds is available free upon request. To obtain literature, please write, visit the Fund’s website, or call:
Wells Fargo Funds
P.O. Box 219967
Kansas City, MO 64121-9967
Website: wfam.com
Individual investors: 1-800-222-8222
Retail investment professionals: 1-888-877-9275
Institutional investment professionals: 1-866-765-0778

This report and the financial statements contained herein are submitted for the general information of the shareholders of the Fund. If this report is used for promotional purposes, distribution of the report must be accompanied or preceded by a current prospectus. Before investing, please consider the investment objectives, risks, charges, and expenses of the investment. For a current prospectus and, if available, a summary prospectus, containing this information, call 1-800-222-8222 or visit the Fund’s website at wfam.com. Read the prospectus carefully before you invest or send money.
Wells Fargo Asset Management (WFAM) is the trade name for certain investment advisory/management firms owned by Wells Fargo & Company. These firms include but are not limited to Wells Capital Management Incorporated and Wells Fargo Funds Management, LLC. Certain products managed by WFAM entities are distributed by Wells Fargo Funds Distributor, LLC (a broker-dealer and Member FINRA).
This material is for general informational and educational purposes only and is NOT intended to provide investment advice or a recommendation of any kind—including a recommendation for any specific investment, strategy, or plan.
INVESTMENT PRODUCTS: NOT FDIC INSURED ◾ NO BANK GUARANTEE ◾ MAY LOSE VALUE
© 2020 Wells Fargo & Company. All rights reserved.
PAR-0720-00243 08-20
A251/AR251 06-20

Annual Report
June 30, 2020
Wells Fargo Municipal Bond Fund
Beginning on January 1, 2021, as permitted by new regulations adopted by the Securities and Exchange Commission, paper copies of the Wells Fargo Funds’ annual and semi-annual shareholder reports issued after this date will no longer be sent by mail, unless you specifically request paper copies of the reports. Instead, the reports will be made available on the Funds’ website, and you will be notified by mail each time a report is posted and provided with a website address to access the report.
If you already elected to receive shareholder reports electronically, you will not be affected by this change and you need not take any action. You may elect to receive shareholder reports and other communications from the Fund electronically at any time by contacting your financial intermediary (such as a broker-dealer or bank) or, if you are a direct investor, by calling 1-800-222-8222 or by enrolling at wellsfargo.com/advantagedelivery.
You may elect to receive all future reports in paper free of charge. If you invest through a financial intermediary, you can contact your financial intermediary to request that you continue to receive paper copies of your shareholder reports; if you invest directly with the Fund, you can call 1-800-222-8222. Your election to receive reports in paper will apply to all Wells Fargo Funds held in your account with your financial intermediary or, if you are a direct investor, to all Wells Fargo Funds that you hold.
|
Reduce clutter. Save trees. |
Sign up for electronic delivery of prospectuses and shareholder reports at wellsfargo.com/advantagedelivery |
The views expressed and any forward-looking statements are as of June 30, 2020, unless otherwise noted, and are those of the Fund managers and/or Wells Fargo Asset Management. Discussions of individual securities, or the markets generally, or any Wells Fargo Fund are not intended as individual recommendations. Future events or results may vary significantly from those expressed in any forward-looking statements. The views expressed are subject to change at any time in response to changing circumstances in the market. Wells Fargo Asset Management and the Fund disclaim any obligation to publicly update or revise any views expressed or forward-looking statements.
INVESTMENT PRODUCTS: NOT FDIC INSURED ◾ NO BANK GUARANTEE ◾ MAY LOSE VALUE
Wells Fargo Municipal Bond Fund | 1
Letter to shareholders (unaudited)

Andrew Owen
President
Wells Fargo Funds
Dear Shareholder:
We are pleased to offer you this annual report for the Wells Fargo Municipal Bond Fund for the 12-month period that ended June 30, 2020. Global stock markets saw earlier gains erased in February and March as governments around the world took unprecedented measures to stop the spread of the coronavirus at the expense of short-term economic output. However, markets rebounded from April through June to offset much of the losses as central banks attempted to bolster capital markets and confidence. Fixed-income markets generally performed better, with most achieving gains. Overall U.S. markets surpassed their international peers, while U.S. large-cap equity, as measured by the Russell 1000® Index1, easily outperformed small caps, as measured by the Russell 2000® Index2, for the 12-month period.
For the 12-month period, fixed-income securities generally had positive total returns while non-U.S. equities had broad losses and U.S. stocks performed strongly despite sharp volatility since late February. For the period, U.S. stocks, based on the S&P 500 Index,3 gained 7.51%. International stocks, as measured by the MSCI ACWI ex USA Index (Net),4 returned -4.80%, while the MSCI EM Index (Net)5 performed slightly better, with a -3.39% return. For bond investors, the Bloomberg Barclays U.S. Aggregate Bond Index6 returned a robust 8.74%, the Bloomberg Barclays Global Aggregate ex-USD Index7 gained a modest 0.71%, and the Bloomberg Barclays Municipal Bond Index8 returned 4.45% while the ICE BofA U.S. High Yield Index9 lost 1.10%.
The fiscal year began on a positive note.
The 12-month period began with the U.S. equity market advancing to new highs in July 2019. U.S. President Donald Trump initially backed off of earlier tariff threats against Mexico and China. However, later in July, the U.S. reversed course and threatened to impose higher tariffs on China’s exports after talks failed. China responded with tariff threats of its own and devalued the renminbi, roiling global markets. Major U.S. stock market indices closed July with the worst weekly results of the year. Bond prices gained as Treasury yields fell to multiyear lows, and the yield curve inverted at multiple points along the 30-year arc, with shorter term yields higher than longer-term. At the end of July, the U.S. Federal Reserve (Fed) cut its federal funds rate by 0.25%.
In August, U.S.-China trade tensions continued with no signs of compromise. Evidence of a continued global economic slowdown mounted, and central banks in China, New Zealand, and Thailand cut interest rates. Industrial and manufacturing data declined in China,
| 1 | The Russell 1000® Index measures the performance of the 1,000 largest companies in the Russell 3000® Index, which represents approximately 92% of the total market capitalization of the Russell 3000® Index. You cannot invest directly in an index. |
| 2 | The Russell 2000® Index measures the performance of the 2,000 smallest companies in the Russell 3000® Index, which represents approximately 8% of the total market capitalization of the Russell 3000® Index. You cannot invest directly in an index. |
| 3 | The S&P 500 Index consists of 500 stocks chosen for market size, liquidity, and industry group representation. It is a market-value-weighted index with each stock’s weight in the index proportionate to its market value. You cannot invest directly in an index. |
| 4 | The Morgan Stanley Capital International (MSCI) All Country World Index (ACWI) ex USA Index (Net) is a free-float-adjusted market-capitalization-weighted index that is designed to measure the equity market performance of developed and emerging markets, excluding the United States. Source: MSCI. MSCI makes no express or implied warranties or representations and shall have no liability whatsoever with respect to any MSCI data contained herein. The MSCI data may not be further redistributed or used as a basis for other indices or any securities or financial products. This report is not approved, reviewed, or produced by MSCI. You cannot invest directly in an index. |
| 5 | The MSCI Emerging Markets (EM) Index (Net) is a free-float-adjusted market-capitalization-weighted index that is designed to measure equity market performance of emerging markets. You cannot invest directly in an index. |
| 6 | The Bloomberg Barclays U.S. Aggregate Bond Index is a broad-based benchmark that measures the investment-grade, U.S. dollar-denominated, fixed-rate taxable bond market, including Treasuries, government-related and corporate securities, mortgage-backed securities (agency fixed-rate and hybrid adjustable-rate mortgage pass-throughs), asset-backed securities, and commercial mortgage-backed securities. You cannot invest directly in an index. |
| 7 | The Bloomberg Barclays Global Aggregate ex-USD Index is an unmanaged index that provides a broad-based measure of the global investment-grade fixed-income markets excluding the U.S.-dollar-denominated debt market. You cannot invest directly in an index. |
| 8 | The Bloomberg Barclays Municipal Bond Index is an unmanaged index composed of long-term tax-exempt bonds with a minimum credit rating of Baa. You cannot invest directly in an index. |
| 9 | The ICE BofA U.S. High Yield Index is a market-capitalization-weighted index of domestic and Yankee high-yield bonds. The index tracks the performance of high-yield securities traded in the U.S. bond market. You cannot invest directly in an index. Copyright 2020. ICE Data Indices, LLC. All rights reserved. |
2 | Wells Fargo Municipal Bond Fund
Letter to shareholders (unaudited)
Canada, Japan, and Germany. Adding to global uncertainty, Italy’s prime minister resigned, many feared a crackdown in Hong Kong as protestors sustained their calls for reform, and U.K. Prime Minister Boris Johnson planned to suspend Parliament as Brexit’s deadline neared.
In the U.S., the Fed cut interest rates a second time in September. U.S. manufacturing data disappointed investors. The U.S. Congress announced it would pursue an impeachment investigation of President Trump. Meanwhile, the Brexit impasse showed no signs of resolution. Officials in China said that hitting the country’s economic growth goals for the year would be difficult considering the weight of tariffs and trade restrictions. Although the S&P 500 Index finished the third quarter with the best year-to-date returns in more than 20 years, concerns about future returns remained.
The fourth quarter started on a strong note, with U.S.-China trade tensions relaxing in October along with renewed optimism for a U.K. Brexit deal and positive macroeconomic data. The initial estimate of U.S. third-quarter gross domestic product (GDP) growth was a resilient 1.9% annualized rate, while the U.S. unemployment rate fell to a 50-year low of 3.5% in September. However, despite resilience among U.S. consumers, business confidence declined while manufacturing activity contracted. Concerned with a potential economic slowdown, the Fed lowered interest rates another quarter point in late October—its third rate cut in four months. This helped push the S&P 500 Index to a new all-time high while emerging market equities rallied and global bonds declined overall, reflecting a broad pickup in risk appetite.
Equity markets continued to rally in November despite ongoing geopolitical risks. Hopes for a U.S.-China trade deal buoyed investor confidence. U.S. business sentiment improved slightly, and manufacturing and services activity picked up. While consumer confidence and purchasing manager activity rose in the eurozone, China reported weakening manufacturing and consumer data. Bond yields rose marginally, leading to slightly negative returns for global government and investment-grade corporate bonds.
Financial markets ended 2019 with a boost from the U.S. and China accord on a Phase One trade deal. That, along with the landslide win by the pro-Brexit U.K. Conservative Party in a national election and ongoing central bank support, gave investors greater confidence. U.S. economic indicators were generally positive, with the exception of manufacturing activity and business confidence. Consumer confidence was resilient, fed by a robust labor market, tame inflation, and lower interest rates, which boosted housing affordability and stimulated homebuyer activity. The impeachment of President Trump had little impact on markets. Meanwhile, slowing Chinese economic activity, partly attributable to the trade war, led to further government stimulus at year-end through lower reserve ratios, allowing banks to lend more money.
The year-end rally continued in early January 2020. However, capital market volatility picked up sharply in late January on concerns over the potential impact of the coronavirus on the global economy and stock markets. With sentiment somewhat souring, perceived safe havens did well in January. The U.S. dollar and Japanese yen both rose, and government bonds outperformed equities. While the S&P 500 Index held its ground, emerging market equities tumbled, including those in Asia.
In February, the coronavirus became the major market focus. Fears of the virus’s impact on global growth led to expectations of increased global central bank monetary policy support. That led the 10-year U.S. Treasury yield to fall to an all-time low of 1.1% by the end of the month. Although equity markets initially shrugged off concerns about the outbreak, focusing instead on strong fourth-quarter earnings and improving business confidence in January, market sentiment turned sharply lower toward month-end and the S&P 500 Index lost 8.2% for the month. Oil prices tumbled as Russia and the Organization of the Petroleum Exporting countries compounded a major decline in oil demand with a brutal price war, partly aimed at dissuading further U.S. shale production. As a result, the price of West Texas Intermediate crude oil fell 13% in February.
Wells Fargo Municipal Bond Fund | 3
Letter to shareholders (unaudited)
“The global spread of the coronavirus led country after country to clamp down on social and business-related activity in order to contain the virus from causing even greater devastation and overwhelming health care systems.”
“Despite ongoing economic weakness and high levels of uncertainty on the containment of the coronavirus and the timing of an effective vaccine, financial markets continued to post widely positive returns in June.”
The global spread of the coronavirus led country after country to clamp down on social and business-related activity in order to contain the virus from causing even greater devastation and overwhelming health care systems. This abrupt stoppage of economic activity led to the sharp deceleration of global output, sending economies into a deep contraction. Central bank responses were swift, as they slashed interest rates and expanded quantitative easing programs to restore liquidity and confidence to the markets. In the U.S., the Fed introduced several new lending programs, funding investment-grade bonds, money market mutual funds, and commercial paper while purchasing Treasuries, mortgage-backed securities, and overnight repurchase agreements. Meanwhile, stock markets tumbled quickly into a bear market, ending the longest bull stock market in U.S. history.
Markets rebounded strongly in April, with the S&P 500 Index gaining 12.8% for the month and the MSCI ACWI ex USA Index (Net) returning 7.6%. The rebound was fueled by unprecedented government and central bank stimulus measures taken to buffer the economic damage created by mass shutdowns enacted in order to contain the virus’s spread. The U.S. economy contracted by an annualized 5.0% pace in the first quarter, with 30 million new unemployment insurance claims in six weeks. In the eurozone, first-quarter real GDP shrank 3.8%, with the composite April Flash Purchasing Managers’ Index, a monthly survey of purchasing managers, falling to an all-time low of 13.5. The European Central Bank expanded its quantitative easing to include the purchase of additional government bonds of countries with the greatest virus-related need, including Italy and Spain. China’s first-quarter GDP fell by 6.8% year over year. However, retail sales, production, and investment showed signs of recovery. Extreme oil-price volatility continued as global supply far exceeded demand.
In May, the equity market rebound continued, with the S&P 500 Index climbing a further 4.8%. European and Japanese stock markets also had monthly gains. Investors regained confidence on reports of early signs of success in human trials of a coronavirus vaccine. Growth stocks continued to outperform value stocks while returns on global government bonds were generally flat. In the U.S., a gap grew between the stock market rebound and devastating economic data points, including an April unemployment rate of 14.7%, the highest level since World War II. Purchasing managers’ indices continued to reflect weakening activity in May in both the manufacturing and services sectors. U.S. corporate earnings reports indicated a 14% year-over-year contraction in earnings from the first quarter of 2019. However, high demand for technology, driven by remote activity, helped maintain robust information technology sector earnings, which helped drive powerful well-known technology stocks higher.
Despite ongoing economic weakness and high levels of uncertainty on the containment of the coronavirus and the timing of an effective vaccine, financial markets continued to post widely positive returns in June. As economies reopened, there were hopeful signs. U.S. retail sales rose 17% in May while retail sales in the U.K. rebounded by 12%. However, year over year, sales remained depressed. Vitally important to market sentiment was the ongoing commitment by central banks globally to do all they can to provide economic support through liquidity and low borrowing costs. U.S. economic activity was aided by one-time $1,200 stimulus checks and $600 bonus weekly unemployment benefits due to expire at the end of July. However, unemployment remained in the double digits, easing somewhat from 14.7% in April to 11.1% in June. At period-end, numerous states reported alarming increases of coronavirus cases. China’s economic recovery picked up momentum in June, though it remained far from a full recovery.
4 | Wells Fargo Municipal Bond Fund
Letter to shareholders (unaudited)
Don’t let short-term uncertainty derail long-term investment goals.
Periods of investment uncertainty can present challenges, but experience has taught us that maintaining long-term investment goals can be an effective way to plan for the future. To help you create a sound strategy based on your personal goals and risk tolerance, Wells Fargo Funds offers more than 100 mutual funds spanning a wide range of asset classes and investment styles. Although diversification cannot guarantee an investment profit or prevent losses, we believe it can be an effective way to manage investment risk and potentially smooth out overall portfolio performance. We encourage investors to know their investments and to understand that appropriate levels of risk-taking may unlock opportunities.
Thank you for choosing to invest with Wells Fargo Funds. We appreciate your confidence in us and remain committed to helping you meet your financial needs.
Sincerely,

Andrew Owen
President
Wells Fargo Funds
|
For further information about your Fund, contact your investment professional, visit our website at wfam.com, or call us directly at 1-800-222-8222. |
Notice to Shareholders
At a meeting held on August 10-12, 2020, the Board of Trustees of the Fund approved a change to the Fund’s automatic conversion feature for Class C shares in order to shorten the required holding period from 10 to 8 years. As a result, on a monthly basis beginning November 5, 2020, Class C shares will convert automatically into Class A shares 8 years after the initial date of purchase or, if you acquired your Class C shares through an exchange or conversion from another share class, 8 years after the date you acquired your Class C shares. When Class C shares that you acquired through a purchase or exchange convert, any other Class C shares that you purchased with reinvested dividends and distributions also will convert into Class A shares on a pro rata basis.
Please note that a shorter holding period may apply depending on your intermediary. Please see “Appendix A—Sales Charge Reductions and Waivers for Certain Intermediaries” in the Fund’s prospectus for further information.
Wells Fargo Municipal Bond Fund | 5
Performance highlights (unaudited)
Investment objective
The Fund seeks current income exempt from federal income tax.
Manager
Wells Fargo Funds Management, LLC
Subadviser
Wells Capital Management Incorporated
Portfolio managers
Terry J. Goode
Robert J. Miller
Average annual total returns (%) as of June 30, 2020
| Including sales charge | Excluding sales charge | Expense ratios1 (%) | ||||||||||||||||||||||||||||||||
| Inception date | 1 year | 5 year | 10 year | 1 year | 5 year | 10 year | Gross | Net2 | ||||||||||||||||||||||||||
| Class A (WMFAX) | 4-8-2005 | -2.10 | 2.90 | 4.23 | 2.54 | 3.84 | 4.72 | 0.78 | 0.75 | |||||||||||||||||||||||||
| Class C (WMFCX) | 4-8-2005 | 0.77 | 3.07 | 3.93 | 1.77 | 3.07 | 3.93 | 1.53 | 1.50 | |||||||||||||||||||||||||
| Class R6 (WMBRX)3 | 7-31-2018 | – | – | – | 3.00 | * | 4.19 | 5.04 | 0.40 | 0.40 | ||||||||||||||||||||||||
| Administrator Class (WMFDX) | 4-8-2005 | – | – | – | 2.78 | 4.00 | 4.89 | 0.72 | 0.60 | |||||||||||||||||||||||||
| Institutional Class (WMBIX) | 3-31-2008 | – | – | – | 2.85 | 4.15 | 5.02 | 0.45 | 0.45 | |||||||||||||||||||||||||
| Bloomberg Barclays Municipal Bond Index4 | – | – | – | – | 4.45 | 3.93 | 4.22 | – | – | |||||||||||||||||||||||||
| * | Total return differs from the return in the Financial Highlights in this report. The total return presented is calculated based on the NAV at which the shareholder transactions were processed. The NAV and total return presented in the Financial Highlights reflects certain adjustments made to the net assets of the Fund that are necessary under U.S. generally accepted accounting principles. |
Figures quoted represent past performance, which is no guarantee of future results, and do not reflect taxes that a shareholder may pay on an investment in a fund. Investment return and principal value of an investment will fluctuate so that an investor’s shares, when redeemed, may be worth more or less than their original cost. Performance shown without sales charges would be lower if sales charges were reflected. Current performance may be lower or higher than the performance data quoted, which assumes the reinvestment of dividends and capital gains. Current month-end performance is available on the Fund’s website, wfam.com.
Index returns do not include transaction costs associated with buying and selling securities, any mutual fund fees or expenses, or any taxes. It is not possible to invest directly in an index.
For Class A shares, the maximum front-end sales charge is 4.50%. For Class C shares, the maximum contingent deferred sales charge is 1.00%. Performance including a contingent deferred sales charge assumes the sales charge for the corresponding time period. Class R6, Administrator Class, and Institutional Class shares are sold without a front-end sales charge or contingent deferred sales charge.
Bond values fluctuate in response to the financial condition of individual issuers, general market and economic conditions, and changes in interest rates. Changes in market conditions and government policies may lead to periods of heightened volatility in the bond market and reduced liquidity for certain bonds held by the Fund. In general, when interest rates rise, bond values fall and investors may lose principal value. Interest rate changes and their impact on the Fund and its share price can be sudden and unpredictable. The use of derivatives may reduce returns and/or increase volatility. Certain investment strategies tend to increase the total risk of an investment (relative to the broader market). The Fund is exposed to high-yield securities risk and municipal securities risk. Consult the Fund’s prospectus for additional information on these and other risks. A portion of the Fund’s income may be subject to federal, state, and/ or local income taxes or the Alternative Minimum Tax (AMT). Any capital gains distributions may be taxable.
Please see footnotes on page 7.
6 | Wells Fargo Municipal Bond Fund
Performance highlights (unaudited)
| Growth of $10,000 investment as of June 30, 20205 |
|
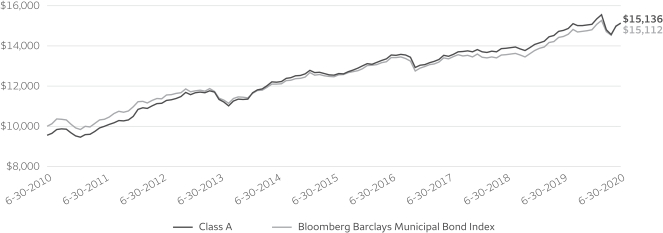
| 1 | Reflects the expense ratios as stated in the most recent prospectuses. The expense ratios shown are subject to change and may differ from the annualized expense ratios shown in the financial highlights of this report. |
| 2 | The manager has contractually committed through October 31, 2020, to waive fees and/or reimburse expenses to the extent necessary to cap total annual fund operating expenses after fee waivers at 0.75% for Class A, 1.50% for Class C, 0.43% for Class R6, 0.60% for Administrator Class, and 0.48% for Institutional Class. Brokerage commissions, stamp duty fees, interest, taxes, acquired fund fees and expenses (if any), and extraordinary expenses are excluded from the expense caps. Prior to or after the commitment expiration date, the caps may be increased or the commitment to maintain the caps may be terminated only with the approval of the Board of Trustees. Without these caps, the Fund’s returns would have been lower. The expense ratio paid by an investor is the net expense ratio (the total annual fund operating expenses after fee waivers) as stated in the prospectuses. |
| 3 | Historical performance shown for the Class R6 shares prior to their inception reflects the performance of the Institutional Class shares, and includes the higher expenses applicable to the Institutional Class shares. If these expenses had not been included, returns for the Class R6 shares would be higher. |
| 4 | The Bloomberg Barclays Municipal Bond Index is an unmanaged index composed of long-term tax-exempt bonds with a minimum credit rating of Baa. You cannot invest directly in an index. |
| 5 | The chart compares the performance of Class A shares for the most recent ten years with the Bloomberg Barclays Municipal Bond Index. The chart assumes a hypothetical $10,000 investment in Class A shares and reflects all operating expenses and assumes the maximum initial sales charge of 4.50%. |
| 6 | Amounts are calculated based on the long-term total investments of the Fund. These amounts are subject to change and may have changed since the date specified. |
| 7 | The credit quality distribution of portfolio holdings reflected in the chart is based on ratings from Standard & Poor’s, Moody’s Investors Service, and/or Fitch Ratings Ltd. Credit quality ratings apply to the underlying holdings of the Fund and not to the Fund itself. The percentages of the Fund’s portfolio with the ratings depicted in the chart are calculated based on the total market value of fixed income securities held by the Fund. If a security was rated by all three rating agencies, the middle rating was utilized. If rated by two of three rating agencies, the lower rating was utilized, and if rated by one of the rating agencies, that rating was utilized. Standard & Poor’s rates the creditworthiness of bonds, ranging from AAA (highest) to D (lowest). Ratings from A to CCC may be modified by the addition of a plus (+) or minus (-) sign to show relative standing within the rating categories. Standard & Poor’s rates the creditworthiness of short-term notes from SP-1 (highest) to SP-3 (lowest). Moody’s rates the creditworthiness of bonds, ranging from Aaa (highest) to C (lowest). Ratings Aa to B may be modified by the addition of a number 1 (highest) to 3 (lowest) to show relative standing within the ratings categories. Moody’s rates the creditworthiness of short-term U.S. tax-exempt municipal securities from MIG 1/VMIG 1 (highest) to SG (lowest). Fitch rates the creditworthiness of bonds, ranging from AAA (highest) to D (lowest). Credit quality distribution is subject to change and may have changed since the date specified. |
Wells Fargo Municipal Bond Fund | 7
Performance highlights (unaudited)
MANAGER’S DISCUSSION
Fund highlights
| ∎ | The Fund underperformed its benchmark, the Bloomberg Barclays Municipal Bond Index, for the 12-month period that ended June 30, 2020. |
| ∎ | We tactically moved duration around during the period from modestly short to neutral relative to the benchmark. Overall duration positioning was a modest detractor from performance. |
| ∎ | Credit positioning detracted from performance as we were overweight lower investment-grade bonds (A-rated and BBB-rated) relative to higher investment-grade bonds (AAA-rated and AA-rated). Higher-grade bonds outperformed over the period. |
| ∎ | Sector allocation and security selection were detractors over the period. Underweights to both local and state general obligation (GO) bonds, electric revenue bonds, and education bonds detracted from performance as these sectors outperformed. Overweights to the industrial development revenue/pollution control revenue, transportation, leasing, and special tax sectors detracted as these sectors underperformed. Despite overweights to the water and sewer sector, which outperformed, we underperformed, indicating suboptimal selection with the sector. |
| ∎ | Yield-curve positioning contributed to performance over the 12-month period. |
| Effective maturity distribution as of June 30, 20206 |
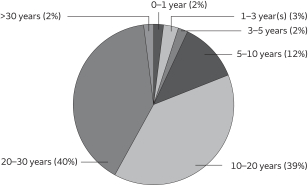 |
The coronavirus pandemic and the associated containment efforts became the dominant market influence over the 12-month period.
In 2019, market expectations moved the Federal Reserve (Fed) from a rate-hiking posture to multiple cuts in what was considered a “mid-cycle adjustment” at the time. Generally, positive U.S. economic data was enough for most investors to expect continued slow growth and an extension of the economic expansion. Global trade tensions prompted a rise in market volatility, which subsided with the passage of a Phase One U.S.-China trade deal late in the calendar year. President Trump was formally impeached and ultimately acquitted by the U.S. Senate. By March, the coronavirus pandemic brought an end to the longest bull market on record.
The municipal bond market was heavily influenced by technical factors throughout the reporting period. Municipal mutual funds saw 61 straight weeks of net inflows, which pushed yields across ratings categories to all-time lows by late February. Low yields and ample demand drove municipal issuance higher but also altered the mix. Taxable municipal bonds as a proportion of new issue municipal debt was at its highest level since 2010 by period-end. Pandemic-related volatility and liquidity pressures prompted record-setting outflows from municipal bonds in March. Strong support by the Fed, including a Municipal Liquidity Facility, and more than $2.5 trillion in fiscal stimulus buoyed markets and bolstered investor confidence. Several weeks of consecutive positive net flows for municipal funds and strong demand for new bonds drove yields back near the lows for highly rated issues. The period ended with the Fed pledging to keep short rates low for the foreseeable future. The fundamental outlook for municipal issuers came into question as the path of recovery from the virus remains extraordinarily uncertain.
Factors across the market influenced Fund performance.
Coming into the year, municipal bonds had positive momentum in terms of technical factors with reduced tax-exempt supply and positive fund flows. In fact, until the market volatility in March, the industry had more than 60 weeks of positive flows. This caused a supply/demand imbalance, which drove rates down and credit spreads tighter. There was a clear disconnect between technicals and fundamentals as investors reached for income wherever they could find it, which resulted in credit spreads near all-time tights and a very flat yield curve.
Please see footnotes on page 7.
8 | Wells Fargo Municipal Bond Fund
Performance highlights (unaudited)
| Credit quality as of June 30, 20207 |
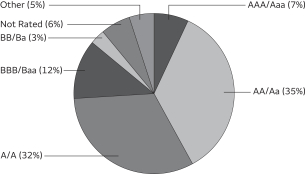 |
As the year began, we continued an up-in-quality trade as we believed that higher investment-grade bonds represented better relative value and that credit spreads were vulnerable as the economy slowed. Despite this, we chose to keep a moderate overweight in lower investment-grade bonds, especially those that were seasoned and that we believed had good total return characteristics. We were overweight longer-intermediate and the long end of the curve out to 25 years, which aided performance as the longer-dated bonds outperformed.
The beginning of the second half of the year was a continuation of the first half. We did not reverse course as we felt the market was ripe for correction. We did not anticipate that the country’s response to the pandemic would be the catalyst for a correction, but we were pretty well positioned for it with duration short to the benchmark and higher overall credit quality, and we had lightened up on credits that we thought would be vulnerable in an economic downturn. The market had rallied through February, exceeding most market participants’ forecast for the entire year.
March was a turning point for the market and after 61 weeks of positive fund flows, which were supportive of municipal valuations, outflows began and they were extreme as the risk-off trade took hold. According to Lipper, during the week of March 18 there were outflows of $12.2 billion, a new record that was broken the following week, with $13.7 billion of outflows. The Fund experienced outflows as well, but we were not forced sellers as we had been maintaining between 3% and 5% cash equivalents in the portfolio.
With the markets in disarray and the short end of the market seizing up, the Fed began unprecedented support, first by cutting rates and second by announcing open-ended quantitative easing and targeted help to the municipal market through the Money Market Liquidity Facility and the Municipal Liquidity Facility. Not to be outdone, Congress passed four packages for about $3 trillion in aid across the economy.
This stabilized the markets and by mid-April the municipal market was on solid ground. High-grade bonds were in demand, but lower investment-grade and high-yield bond spreads remained wide, as did certain sectors, including transportation, education, and hospitals. We took advantage of this dislocation and began adding to lower investment-grade paper in late March that had been vetted by our analytical team and mispriced in the market, buying names such as New York MTA, Trinity College, and Seattle Cancer Care Alliance. We also used this opportunity to extend duration and focus on what we believed to be the sweet spot of the curve (20 to 25 years). Lower investment-grade paper continued to lag through early June but caught a bid and did well late in the month. Rates for high-grade paper are now at or near historical lows and credit spreads are tightening rapidly as technical factors once again drive the market higher in price.
Rates are likely to remain low over the foreseeable future, and rating downgrades expected but defaults in the investment-grade space to remain rare.
The longest economic expansion in history is over. The economic impact of the pandemic worldwide and nationally has yet to be fully realized. As we reopen the economy, we should see a boost versus the lows of April, but economic activity is likely to remain muted and pressure more troubled credits. Most states and municipalities came into this in the best financial shape they’ve been in for decades, notwithstanding pension challenges of certain issuers. Municipal issuers have a long history of managing through deep recessions and many have already cut expenses and furloughed employees and are preparing to raise taxes. That doesn’t mean it will be easy, and we have seen and should continue to see a deterioration of credit quality and resultant downgrades, but we don’t believe that will result in a material increase in defaults in the investment-grade space. We believe a deep analytical bench and individual security selection will be important drivers of performance in the next year and we will rely heavily on our deep analytical bench for exhaustive bottom-up analysis. We expect to manage duration tactically, moving between 95% and 105% of benchmark depending on technicals and market opportunities. We will not be making wholesale sector changes but will look for prospects on a name-by-name basis across sectors seeking credits that our analysts have vetted and believe represent a strong relative-value opportunity.
Please see footnotes on page 7.
Wells Fargo Municipal Bond Fund | 9
As a shareholder of the Fund, you incur two types of costs: (1) transaction costs, including sales charges (loads) on purchase payments and contingent deferred sales charges (if any) on redemptions and (2) ongoing costs, including management fees, distribution (12b-1) and/or shareholder servicing fees, and other Fund expenses. This example is intended to help you understand your ongoing costs (in dollars) of investing in the Fund and to compare these costs with the ongoing costs of investing in other mutual funds.
The example is based on an investment of $1,000 invested at the beginning of the six-month period and held for the entire period from January 1, 2020 to June 30, 2020.
Actual expenses
The “Actual” line of the table below provides information about actual account values and actual expenses. You may use the information in this line, together with the amount you invested, to estimate the expenses that you paid over the period. Simply divide your account value by $1,000 (for example, an $8,600 account value divided by $1,000 = 8.6), then multiply the result by the number in the “Actual” line under the heading entitled “Expenses paid during period” for your applicable class of shares to estimate the expenses you paid on your account during this period.
Hypothetical example for comparison purposes
The “Hypothetical” line of the table below provides information about hypothetical account values and hypothetical expenses based on the Fund’s actual expense ratio and an assumed rate of return of 5% per year before expenses, which is not the Fund’s actual return. The hypothetical account values and expenses may not be used to estimate the actual ending account balance or expenses you paid for the period. You may use this information to compare the ongoing costs of investing in the Fund and other funds. To do so, compare this 5% hypothetical example with the 5% hypothetical examples that appear in the shareholder reports of the other funds.
Please note that the expenses shown in the table are meant to highlight your ongoing costs only and do not reflect any transactional costs, such as sales charges (loads) and contingent deferred sales charges. Therefore, the “Hypothetical” line of the table is useful in comparing ongoing costs only and will not help you determine the relative total costs of owning different funds. In addition, if these transactional costs were included, your costs would have been higher.
| Beginning account value 1-1-2020 | Ending account value 6-30-2020 | Expenses paid during the period1 | Annualized net expense ratio | |||||||||||||
Class A | ||||||||||||||||
Actual | $ | 1,000.00 | $ | 1,004.37 | $ | 3.69 | 0.74 | % | ||||||||
Hypothetical (5% return before expenses) | $ | 1,000.00 | $ | 1,021.18 | $ | 3.72 | 0.74 | % | ||||||||
Class C | ||||||||||||||||
Actual | $ | 1,000.00 | $ | 1,000.59 | $ | 7.46 | 1.50 | % | ||||||||
Hypothetical (5% return before expenses) | $ | 1,000.00 | $ | 1,017.40 | $ | 7.52 | 1.50 | % | ||||||||
Class R6 | ||||||||||||||||
Actual | $ | 1,000.00 | $ | 1,007.08 | $ | 1.95 | 0.39 | % | ||||||||
Hypothetical (5% return before expenses) | $ | 1,000.00 | $ | 1,022.92 | $ | 1.96 | 0.39 | % | ||||||||
Administrator Class | ||||||||||||||||
Actual | $ | 1,000.00 | $ | 1,006.01 | $ | 2.99 | 0.60 | % | ||||||||
Hypothetical (5% return before expenses) | $ | 1,000.00 | $ | 1,021.88 | $ | 3.02 | 0.60 | % | ||||||||
Institutional Class | ||||||||||||||||
Actual | $ | 1,000.00 | $ | 1,005.88 | $ | 2.14 | 0.43 | % | ||||||||
Hypothetical (5% return before expenses) | $ | 1,000.00 | $ | 1,022.73 | $ | 2.16 | 0.43 | % | ||||||||
| 1 | Expenses paid is equal to the annualized net expense ratio of each class multiplied by the average account value over the period, multiplied by the number of days in the most recent fiscal half-year divided by the number of days in the fiscal year (to reflect the one-half-year period). |
10 | Wells Fargo Municipal Bond Fund
Portfolio of investments—June 30, 2020
| Interest rate | Maturity date | Principal | Value | |||||||||||||
| Municipal Obligations: 98.88% |
| |||||||||||||||
Alabama: 2.46% |
| |||||||||||||||
| Airport Revenue: 0.10% | ||||||||||||||||
Birmingham AL Airport Authority Revenue (BAM Insured) %% | 4.00 | % | 7-1-2036 | $ | 500,000 | $ | 571,620 | |||||||||
Birmingham AL Airport Authority Revenue (BAM Insured) %% | 4.00 | 7-1-2037 | 500,000 | 570,035 | ||||||||||||
Birmingham AL Airport Authority Revenue (BAM Insured) %% | 4.00 | 7-1-2038 | 400,000 | 454,900 | ||||||||||||
Birmingham AL Airport Authority Revenue (BAM Insured) %% | 5.00 | 7-1-2028 | 700,000 | 875,938 | ||||||||||||
Birmingham AL Airport Authority Revenue (BAM Insured) %% | 5.00 | 7-1-2029 | 750,000 | 955,020 | ||||||||||||
Birmingham AL Airport Authority Revenue (BAM Insured) %% | 5.00 | 7-1-2030 | 500,000 | 646,880 | ||||||||||||
Birmingham AL Airport Authority Revenue (BAM Insured) %% | 5.00 | 7-1-2032 | 600,000 | 766,158 | ||||||||||||
Birmingham AL Airport Authority Revenue (BAM Insured) %% | 5.00 | 7-1-2033 | 650,000 | 824,473 | ||||||||||||
| 5,665,024 | ||||||||||||||||
|
| |||||||||||||||
| GO Revenue: 0.07% | ||||||||||||||||
Birmingham AL CAB Series A1 | 5.00 | 3-1-2045 | 3,160,000 | 3,699,981 | ||||||||||||
|
| |||||||||||||||
| Health Revenue: 0.05% | ||||||||||||||||
UAB Medicine Finance Authority Series B | 5.00 | 9-1-2034 | 1,000,000 | 1,272,740 | ||||||||||||
UAB Medicine Finance Authority Series B | 5.00 | 9-1-2035 | 1,000,000 | 1,267,100 | ||||||||||||
| 2,539,840 | ||||||||||||||||
|
| |||||||||||||||
| Tax Revenue: 0.72% | ||||||||||||||||
Alabama Federal Aid Highway Finance Authority Series A | 5.00 | 6-1-2037 | 9,000,000 | 11,077,920 | ||||||||||||
Alabama Federal Aid Highway Finance Authority Series A | 5.00 | 9-1-2035 | 24,000,000 | 28,940,400 | ||||||||||||
| 40,018,320 | ||||||||||||||||
|
| |||||||||||||||
| Utilities Revenue: 1.41% | ||||||||||||||||
Alabama Black Belt Energy Gas District Series A (Royal Bank of Canada LIQ) | 4.00 | 7-1-2046 | 16,960,000 | 17,404,691 | ||||||||||||
Lower Alabama Gas Supply District Project #2 | 4.00 | 12-1-2050 | 7,660,000 | 8,716,008 | ||||||||||||
Southeast Alabama Gas Supply District Project #2 Series A | 4.00 | 6-1-2049 | 28,850,000 | 31,778,564 | ||||||||||||
Tender Option Bond Trust Receipts/Floater Certificates Series 2016-XM0184 (Morgan Stanley Bank LIQ) 144Aø | 0.68 | 9-1-2046 | 20,000,000 | 20,000,000 | ||||||||||||
| 77,899,263 | ||||||||||||||||
|
| |||||||||||||||
| Water & Sewer Revenue: 0.11% | ||||||||||||||||
Jefferson County AL CAB Series B (AGM Insured) ¤ | 0.00 | 10-1-2025 | 710,000 | 640,654 | ||||||||||||
Jefferson County AL CAB Series B (AGM Insured) ¤ | 0.00 | 10-1-2026 | 3,000,000 | 2,534,940 | ||||||||||||
Jefferson County AL CAB Series B (AGM Insured) ¤ | 0.00 | 10-1-2029 | 4,115,000 | 2,831,984 | ||||||||||||
| 6,007,578 | ||||||||||||||||
|
| |||||||||||||||
| 135,830,006 | ||||||||||||||||
|
| |||||||||||||||
Alaska: 0.25% |
| |||||||||||||||
| Health Revenue: 0.25% | ||||||||||||||||
Alaska IDA Loan Anticipation YKHC Project | 3.50 | 12-1-2020 | 11,300,000 | 11,321,809 | ||||||||||||
Alaska IDA Tanana Chiefs Conference Project | 5.00 | 10-1-2033 | 1,930,000 | 2,426,589 | ||||||||||||
| 13,748,398 | ||||||||||||||||
|
| |||||||||||||||
Arizona: 1.98% |
| |||||||||||||||
| Education Revenue: 0.48% | ||||||||||||||||
Arizona Board of Regents University of Arizona Series C %% | 5.00 | 8-1-2027 | 1,000,000 | 1,230,170 | ||||||||||||
Arizona Board of Regents University of Arizona Series C %% | 5.00 | 8-1-2029 | 1,005,000 | 1,289,435 | ||||||||||||
The accompanying notes are an integral part of these financial statements.
Wells Fargo Municipal Bond Fund | 11
Portfolio of investments—June 30, 2020
| Interest rate | Maturity date | Principal | Value | |||||||||||||
| Education Revenue (continued) | ||||||||||||||||
La Paz County AZ IDA Educational Facility Imagine Schools West Middle Project Series A 144A | 5.75 | % | 6-15-2038 | $ | 1,085,000 | $ | 1,085,575 | |||||||||
La Paz County AZ IDA Educational Facility Imagine Schools West Middle Project Series A 144A | 5.88 | 6-15-2048 | 2,435,000 | 2,463,977 | ||||||||||||
Phoenix AZ IDA Legacy Traditional Schools Project Series A 144A | 6.50 | 7-1-2034 | 2,000,000 | 2,241,820 | ||||||||||||
Phoenix AZ IDA Rowan University Project Series 2012 | 5.25 | 6-1-2034 | 1,000,000 | 1,048,940 | ||||||||||||
Pima County AZ IDA New Plan Learning Project Series A | 7.75 | 7-1-2035 | 7,375,000 | 7,215,553 | ||||||||||||
Pima County AZ IDA New Plan Learning Project Series A | 8.13 | 7-1-2041 | 6,385,000 | 6,337,368 | ||||||||||||
Pima County AZ IDA Noah Webster Schools-Pima Project | 7.00 | 12-15-2043 | 3,225,000 | 3,532,955 | ||||||||||||
| 26,445,793 | ||||||||||||||||
|
| |||||||||||||||
| Health Revenue: 0.26% | ||||||||||||||||
Arizona Health Facilities Authority Revenue Bond Banner Health Series 2012A | 4.00 | 1-1-2043 | 5,565,000 | 5,657,769 | ||||||||||||
Arizona Health Facilities Authority Revenue Bond Banner Health Series A | 5.00 | 1-1-2044 | 5,000,000 | 5,443,000 | ||||||||||||
Tempe AZ IDA Friendship Village Project Series A | 5.25 | 12-1-2020 | 1,000,000 | 1,005,470 | ||||||||||||
Tempe AZ IDA Friendship Village Project Series A | 5.38 | 12-1-2021 | 1,000,000 | 1,019,510 | ||||||||||||
Tempe AZ IDA Friendship Village Project Series A | 5.50 | 12-1-2022 | 1,000,000 | 1,020,250 | ||||||||||||
| 14,145,999 | ||||||||||||||||
|
| |||||||||||||||
| Miscellaneous Revenue: 0.99% | ||||||||||||||||
Arizona Board Regents Certificates Refunding Bonds University Arizona Series C | 5.00 | 6-1-2028 | 3,250,000 | 3,500,835 | ||||||||||||
Navajo Nation AZ Refunding Bond Series A 144A | 5.50 | 12-1-2030 | 7,275,000 | 7,830,519 | ||||||||||||
Phoenix AZ Civic Improvement Corporation Junior Lien Refunding Bond | 5.00 | 7-1-2034 | 8,805,000 | 10,730,477 | ||||||||||||
Phoenix AZ Civic Improvement Corporation Rental Car Facility Charge Revenue Series A | 4.00 | 7-1-2045 | 9,135,000 | 9,485,784 | ||||||||||||
Phoenix AZ Civic Improvement Corporation Series A | 5.00 | 7-1-2034 | 13,875,000 | 16,511,666 | ||||||||||||
Phoenix AZ Civic Improvement Corporation Series B | 5.00 | 7-1-2049 | 5,570,000 | 6,653,421 | ||||||||||||
| 54,712,702 | ||||||||||||||||
|
| |||||||||||||||
| Resource Recovery Revenue: 0.06% | ||||||||||||||||
Yavapai County AZ IDA Waste Management Incorporated Project | 2.80 | 6-1-2027 | 3,200,000 | 3,240,800 | ||||||||||||
|
| |||||||||||||||
| Utilities Revenue: 0.19% | ||||||||||||||||
Salt River Agricultural Improvement & Power Project Series A | 5.00 | 12-1-2045 | 9,100,000 | 10,638,537 | ||||||||||||
|
| |||||||||||||||
| 109,183,831 | ||||||||||||||||
|
| |||||||||||||||
California: 5.34% |
| |||||||||||||||
| Airport Revenue: 1.06% | ||||||||||||||||
Los Angeles CA Department of Airports AMT Subordinate Revenue Bond | 5.00 | 5-15-2034 | 1,750,000 | 2,048,970 | ||||||||||||
Los Angeles CA Department of Airports Subordinate Revenue Bonds | 4.00 | 5-15-2036 | 2,000,000 | 2,194,660 | ||||||||||||
Los Angeles CA Department of Airports Subordinate Revenue Bonds | 5.00 | 5-15-2034 | 1,465,000 | 1,794,405 | ||||||||||||
Los Angeles CA Department of Airports Subordinate Revenue Bonds Series A | 5.25 | 5-15-2048 | 15,000,000 | 18,078,000 | ||||||||||||
San Francisco CA City & County Airport Commission San Francisco International Airport Series B | 5.00 | 5-1-2046 | 30,000,000 | 34,149,300 | ||||||||||||
| 58,265,335 | ||||||||||||||||
|
| |||||||||||||||
| Education Revenue: 0.15% | ||||||||||||||||
California Municipal Finance Authority Charter School Albert Einstein Academies Project Series A | 7.13 | 8-1-2043 | 2,230,000 | 2,448,317 | ||||||||||||
University of California Series K | 4.00 | 5-15-2046 | 5,075,000 | 5,613,458 | ||||||||||||
| 8,061,775 | ||||||||||||||||
|
| |||||||||||||||
The accompanying notes are an integral part of these financial statements.
12 | Wells Fargo Municipal Bond Fund
Portfolio of investments—June 30, 2020
| Interest rate | Maturity date | Principal | Value | |||||||||||||
| GO Revenue: 0.95% | ||||||||||||||||
Alhambra CA Unified School District CAB Election of 2008 Series B (AGC Insured) ¤ | 0.00 | % | 8-1-2031 | $ | 7,500,000 | $ | 6,105,975 | |||||||||
Alhambra CA Unified School District CAB Election of 2008 Series B (AGM Insured) ¤ | 0.00 | 8-1-2031 | 2,175,000 | 1,770,733 | ||||||||||||
Alhambra CA Unified School District CAB Election of 2008 Series B (AGM Insured) ¤ | 0.00 | 8-1-2032 | 3,795,000 | 2,972,813 | ||||||||||||
Alhambra CA Unified School District CAB Election of 2008 Series B (AGM Insured) ¤ | 0.00 | 8-1-2034 | 5,000,000 | 3,654,600 | ||||||||||||
Alhambra CA Unified School District CAB Election of 2008 Series B (AGM Insured) ¤ | 0.00 | 8-1-2035 | 6,700,000 | 4,726,649 | ||||||||||||
Colton CA Unified School District CAB Series B (AGM Insured) ¤ | 0.00 | 8-1-2031 | 1,000,000 | 824,930 | ||||||||||||
Colton CA Unified School District CAB Series B (AGM Insured) ¤ | 0.00 | 8-1-2032 | 1,000,000 | 801,360 | ||||||||||||
Colton CA Unified School District CAB Series B (AGM Insured) ¤ | 0.00 | 8-1-2033 | 1,000,000 | 774,850 | ||||||||||||
Compton CA Community College District CAB Election of 2002 Series C ¤ | 0.00 | 8-1-2032 | 2,515,000 | 1,977,218 | ||||||||||||
Compton CA Community College District CAB Election of 2002 Series C ¤ | 0.00 | 8-1-2033 | 2,000,000 | 1,519,880 | ||||||||||||
El Monte CA Union High School District CAB Election of 2008 (AGM Insured) ¤ | 0.00 | 6-1-2030 | 2,000,000 | 1,711,460 | ||||||||||||
El Monte CA Union High School District CAB Election of 2008 (AGM Insured) ¤ | 0.00 | 6-1-2031 | 2,000,000 | 1,666,320 | ||||||||||||
El Monte CA Union High School District CAB Election of 2008 (AGM Insured) ¤ | 0.00 | 6-1-2032 | 1,660,000 | 1,341,446 | ||||||||||||
El Monte CA Union High School District CAB Election of 2008 (AGM Insured) ¤ | 0.00 | 6-1-2033 | 1,230,000 | 963,508 | ||||||||||||
Los Angeles CA Unified School District Series R | 4.00 | 7-1-2044 | 11,000,000 | 12,871,210 | ||||||||||||
Ontario Montclair CA School District CAB (AGC Insured) ¤ | 0.00 | 8-1-2028 | 1,500,000 | 1,361,430 | ||||||||||||
Ontario Montclair CA School District CAB (AGC Insured) ¤ | 0.00 | 8-1-2030 | 2,000,000 | 1,728,700 | ||||||||||||
San Diego CA Unified School District CAB Series C ¤ | 0.00 | 7-1-2031 | 2,000,000 | 1,651,920 | ||||||||||||
San Diego CA Unified School District CAB Series C ¤ | 0.00 | 7-1-2033 | 1,000,000 | 773,420 | ||||||||||||
San Diego CA Unified School District CAB Series C ¤ | 0.00 | 7-1-2034 | 2,000,000 | 1,502,540 | ||||||||||||
Wiseburn CA School District CAB Election of 2010 Series B (AGM Insured) ¤ | 0.00 | 8-1-2034 | 2,530,000 | 1,872,478 | ||||||||||||
| 52,573,440 | ||||||||||||||||
|
| |||||||||||||||
| Health Revenue: 1.08% | ||||||||||||||||
California HFFA Revenue Stanford Health Care Series A | 4.00 | 8-15-2050 | 13,450,000 | 15,512,289 | ||||||||||||
California Statewide CDA Health Facilities Catholic Series E (AGM Insured) (m) | 1.02 | 7-1-2040 | 21,550,000 | 21,550,000 | ||||||||||||
California Statewide CDA Sutter Health Series A | 6.00 | 8-15-2042 | 4,900,000 | 4,933,712 | ||||||||||||
San Buenaventura CA Community Mental Health System | 6.25 | 12-1-2020 | 2,000,000 | 2,035,300 | ||||||||||||
University of California Regents University Medical Center Pooled Revenue Bonds 2016 Series L | 5.00 | 5-15-2047 | 3,885,000 | 4,501,899 | ||||||||||||
University of California Regents University Medical Center Pooled Revenue Bonds Series L | 4.00 | 5-15-2037 | 10,025,000 | 11,096,873 | ||||||||||||
| 59,630,073 | ||||||||||||||||
|
| |||||||||||||||
| Housing Revenue: 0.35% | ||||||||||||||||
California Community Housing Agency Essential Housing Revenue Serenity at Larkspur Series C 144A | 5.00 | 2-1-2050 | 1,000,000 | 1,073,960 | ||||||||||||
California HFA Municipal Certificate of Participation Series 2 Class A | 4.00 | 3-20-2033 | 3,225,717 | 3,457,549 | ||||||||||||
Mizuho Floater/Residual Trust Tender Option Bond (Mizuho Capital Markets LLC LIQ) 144A ø | 0.43 | 10-1-2036 | 14,934,000 | 14,934,000 | ||||||||||||
| 19,465,509 | ||||||||||||||||
|
| |||||||||||||||
| Miscellaneous Revenue: 0.58% | ||||||||||||||||
Anaheim CA PFA Convention Center Expansion Project Series A | 5.00 | 5-1-2046 | 8,500,000 | 9,261,600 | ||||||||||||
California Public Works Board Judicial Council Project Series A | 5.00 | 3-1-2031 | 3,260,000 | 3,597,345 | ||||||||||||
Mesa CA Water District Participation Certificates | 4.00 | 3-15-2039 | 500,000 | 603,575 | ||||||||||||
Mesa CA Water District Participation Certificates | 4.00 | 3-15-2040 | 500,000 | 601,870 | ||||||||||||
Mesa CA Water District Participation Certificates | 4.00 | 3-15-2045 | 1,200,000 | 1,425,636 | ||||||||||||
Pasadena CA PFA CAB Rose Bowl Series A ¤ | 0.00 | 3-1-2027 | 2,095,000 | 1,926,394 | ||||||||||||
The accompanying notes are an integral part of these financial statements.
Wells Fargo Municipal Bond Fund | 13
Portfolio of investments—June 30, 2020
| Interest rate | Maturity date | Principal | Value | |||||||||||||
| Miscellaneous Revenue (continued) | ||||||||||||||||
Pasadena CA PFA CAB Rose Bowl Series A ¤ | 0.00 | % | 3-1-2028 | $ | 4,450,000 | $ | 4,007,359 | |||||||||
Pasadena CA PFA CAB Rose Bowl Series A ¤ | 0.00 | 3-1-2029 | 4,520,000 | 3,977,419 | ||||||||||||
Pasadena CA PFA CAB Rose Bowl Series A ¤ | 0.00 | 3-1-2031 | 2,185,000 | 1,824,322 | ||||||||||||
Pasadena CA PFA CAB Rose Bowl Series A ¤ | 0.00 | 3-1-2032 | 2,000,000 | 1,620,540 | ||||||||||||
Pasadena CA PFA CAB Rose Bowl Series A ¤ | 0.00 | 3-1-2033 | 4,295,000 | 3,363,672 | ||||||||||||
| 32,209,732 | ||||||||||||||||
|
| |||||||||||||||
| Tax Revenue: 0.35% | ||||||||||||||||
Mizuho Tender Option Bond Trust Receipts/Floater Certificates Series 2019-MIZ9002 (Mizuho Capital Markets LLC LOC, Mizuho Capital Markets LLC LIQ) 144A ø | 0.35 | 3-1-2021 | 13,000,000 | 13,000,000 | ||||||||||||
Mizuho Tender Option Bond Trust Receipts/Floater Certificates Series 2019-MIZ9003 (Mizuho Capital Markets LLC LOC, Mizuho Capital Markets LLC LIQ) 144A ø | 0.35 | 3-1-2036 | 4,930,000 | 4,930,000 | ||||||||||||
San Diego County CA Regional Transportation Commission Limited Tax Series A | 5.00 | 4-1-2048 | 915,000 | 1,093,617 | ||||||||||||
| 19,023,617 | ||||||||||||||||
|
| |||||||||||||||
| Tobacco Revenue: 0.04% | ||||||||||||||||
California County CA Tobacco Securitization Agency | 4.00 | 6-1-2039 | 500,000 | 573,130 | ||||||||||||
California County CA Tobacco Securitization Agency | 4.00 | 6-1-2040 | 300,000 | 342,927 | ||||||||||||
California County CA Tobacco Securitization Agency | 4.00 | 6-1-2049 | 1,200,000 | 1,311,924 | ||||||||||||
| 2,227,981 | ||||||||||||||||
|
| |||||||||||||||
| Transportation Revenue: 0.42% | ||||||||||||||||
Bay Area CA Toll Authority Toll Bridge Series A (SIFMA Municipal Swap +1.25%) ± | 1.38 | 4-1-2036 | 23,545,000 | 23,077,161 | ||||||||||||
|
| |||||||||||||||
| Utilities Revenue: 0.36% | ||||||||||||||||
M-S-R California Energy Authority Gas Series B | 6.13 | 11-1-2029 | 15,805,000 | 19,969,459 | ||||||||||||
|
| |||||||||||||||
| 294,504,082 | ||||||||||||||||
|
| |||||||||||||||
Colorado: 4.01% |
| |||||||||||||||
| Airport Revenue: 0.42% | ||||||||||||||||
Denver CO City & County Airport System Revenue Series 2012A | 5.00 | 12-1-2034 | 12,855,000 | 17,416,725 | ||||||||||||
Denver CO City & County Airport System Revenue Series 2012A | 5.00 | 12-1-2037 | 3,130,000 | 3,778,786 | ||||||||||||
Denver CO City & County Airport System Revenue Series 2012B | 5.00 | 11-15-2030 | 2,000,000 | 2,168,260 | ||||||||||||
| 23,363,771 | ||||||||||||||||
|
| |||||||||||||||
| Education Revenue: 0.89% | ||||||||||||||||
Colorado Board of Governors State University Enterprise System Revenue Bonds Series 2013C | 5.25 | 3-1-2033 | 725,000 | 819,939 | ||||||||||||
Colorado Board of Governors State University Enterprise System Revenue Prerefunded Bond Series 2018 E-1 | 5.00 | 3-1-2040 | 555,000 | 669,702 | ||||||||||||
Colorado Board of Governors State University Enterprise System Revenue Prerefunded Bond Series E-1 | 5.00 | 3-1-2040 | 390,000 | 470,601 | ||||||||||||
Colorado Board of Governors State University Enterprise System Revenue Unrefunded Bond Series 2018 E-1 | 5.00 | 3-1-2040 | 1,055,000 | 1,278,470 | ||||||||||||
Colorado ECFA Alexander Dawson School LLC Project | 5.00 | 2-15-2040 | 1,000,000 | 1,003,240 | ||||||||||||
Colorado ECFA Charter School Aspen Ridge School Project Series 2015A 144A | 4.13 | 7-1-2026 | 425,000 | 430,313 | ||||||||||||
Colorado ECFA Charter School Banning Lewis Ranch Academy Project Series A | 6.00 | 12-15-2037 | 3,380,000 | 3,461,424 | ||||||||||||
Colorado ECFA Charter School Banning Lewis Ranch Academy Project Series B-2 | 7.00 | 12-15-2046 | 3,940,000 | 4,222,656 | ||||||||||||
Colorado ECFA Charter School Ben Franklin Academy Project | 5.00 | 7-1-2036 | 750,000 | 846,255 | ||||||||||||
The accompanying notes are an integral part of these financial statements.
14 | Wells Fargo Municipal Bond Fund
Portfolio of investments—June 30, 2020
| Interest rate | Maturity date | Principal | Value | |||||||||||||
| Education Revenue (continued) | ||||||||||||||||
Colorado ECFA Charter School Collegiate Project (AGC Insured) | 5.25 | % | 6-15-2024 | $ | 930,000 | $ | 932,725 | |||||||||
Colorado ECFA Charter School Community Leadership Academy Second Campus Project | 7.00 | 8-1-2033 | 1,190,000 | 1,302,574 | ||||||||||||
Colorado ECFA Charter School District Montessori Charter School Project | 5.00 | 7-15-2037 | 1,150,000 | 1,222,922 | ||||||||||||
Colorado ECFA Charter School Pinnacle High School Project Series 2009 | 5.13 | 12-1-2039 | 500,000 | 500,155 | ||||||||||||
Colorado ECFA Charter School Improvement & Refunding Bonds Skyview Academy Project 2014 144A | 4.13 | 7-1-2024 | 500,000 | 507,000 | ||||||||||||
Colorado ECFA Charter School Improvement & Refunding Bonds University Laboratory School Project 2015 | 5.00 | 12-15-2028 | 600,000 | 670,572 | ||||||||||||
Colorado ECFA Charter School Rocky Mountain Classical Academy Project Series A | 7.50 | 9-1-2033 | 5,015,000 | 6,110,226 | ||||||||||||
Colorado ECFA Charter School Rocky Mountain Classical Academy Project Series A | 8.00 | 9-1-2043 | 5,930,000 | 7,307,361 | ||||||||||||
Colorado ECFA Charter School Rocky Mountain Classical Academy Project Series A | 8.13 | 9-1-2048 | 3,795,000 | 4,691,341 | ||||||||||||
Colorado ECFA Charter School Twin Peaks Charter Academy | 6.50 | 3-15-2043 | 1,290,000 | 1,315,103 | ||||||||||||
Colorado ECFA Refunding Bonds The University Corporation for Atmosphere Research Project Series 2010 | 5.00 | 9-1-2032 | 1,265,000 | 1,274,728 | ||||||||||||
Colorado ECFA Refunding Bonds The University Corporation for Atmosphere Research Project Series B | 5.00 | 9-1-2030 | 1,770,000 | 1,895,121 | ||||||||||||
Colorado ECFA School Improvement & Refunding Bonds | 5.00 | 3-15-2035 | 2,000,000 | 2,472,020 | ||||||||||||
Colorado ECFA Union Colony School Project Revenue Bond Series 2018 | 5.00 | 4-1-2048 | 715,000 | 827,441 | ||||||||||||
Colorado PFA Charter School Highline Academy Project | 6.25 | 12-15-2020 | 80,000 | 82,145 | ||||||||||||
Colorado PFA Charter School Highline Academy Project | 6.75 | 12-15-2025 | 455,000 | 468,118 | ||||||||||||
Colorado PFA Charter School Highline Academy Project | 7.38 | 12-15-2040 | 4,010,000 | 4,136,395 | ||||||||||||
| 48,918,547 | ||||||||||||||||
|
| |||||||||||||||
| GO Revenue: 0.17% | ||||||||||||||||
Arapahoe County CO Copperleaf Metropolitan District #2 | 5.75 | 12-1-2045 | 500,000 | 509,415 | ||||||||||||
Aurora CO Cornerstar Metropolitan District Refunding Bond Series A | 5.25 | 12-1-2047 | 1,000,000 | 1,003,170 | ||||||||||||
Aurora CO Park 70 Metropolitan District | 5.00 | 12-1-2046 | 1,000,000 | 1,112,460 | ||||||||||||
Broadway Station Metropolitan District #3 Series A | 5.00 | 12-1-2049 | 1,250,000 | 1,196,100 | ||||||||||||
Colorado International Center Metropolitan District #3 Refunding Bonds | 4.63 | 12-1-2031 | 635,000 | 636,105 | ||||||||||||
Colorado Parker Homestead Metropolitan District Improvement & Refunding Bonds Series 2016 | 5.63 | 12-1-2044 | 1,000,000 | 1,027,620 | ||||||||||||
Thompson Crossing Metropolitan District #4 Improvement & Refunding Bonds | 5.00 | 12-1-2049 | 2,125,000 | 2,127,380 | ||||||||||||
Weld County CO Eaton Area Park & Recreation District Series 2015 | 5.50 | 12-1-2038 | 1,075,000 | 1,102,499 | ||||||||||||
Wheatlands CO Metropolitan District #2 Refunding Bond (BAM Insured) | 5.00 | 12-1-2030 | 650,000 | 783,803 | ||||||||||||
| 9,498,552 | ||||||||||||||||
|
| |||||||||||||||
| Health Revenue: 0.25% | ||||||||||||||||
Aspen Valley Hospital District Refunding Bonds Series 2012 | 5.00 | 10-15-2033 | 600,000 | 635,064 | ||||||||||||
Colorado Health facilities Authority Commonspirit Health Series A2 | 5.00 | 8-1-2044 | 4,000,000 | 4,695,480 | ||||||||||||
Colorado Health Facilities Authority Evangelical Lutheran Good Samaritan Society Series 2015A | 5.00 | 6-1-2040 | 1,000,000 | 1,217,610 | ||||||||||||
Colorado Health Facilities Authority Frasier Meadows Retirement Community Project Series 2017A | 5.25 | 5-15-2047 | 1,000,000 | 994,230 | ||||||||||||
Colorado Health Facilities Authority Revenue Hospital Advent Health Obligated Group Series A | 4.00 | 11-15-2043 | 3,500,000 | 3,926,090 | ||||||||||||
Colorado Health Facilities Authority Sisters of Charity Leavenworth Health System Series 2013A | 5.50 | 1-1-2035 | 1,000,000 | 1,125,480 | ||||||||||||
Colorado Health Facilities Authority Sunny Vista Living Center | 5.00 | 12-1-2025 | 670,000 | 673,531 | ||||||||||||
Denver CO Health & Hospital Authority Refunding Bonds Series 2017A 144A | 5.00 | 12-1-2034 | 500,000 | 574,325 | ||||||||||||
| 13,841,810 | ||||||||||||||||
|
| |||||||||||||||
The accompanying notes are an integral part of these financial statements.
Wells Fargo Municipal Bond Fund | 15
Portfolio of investments—June 30, 2020
| Interest rate | Maturity date | Principal | Value | |||||||||||||
| Miscellaneous Revenue: 0.47% | ||||||||||||||||
Colorado Bridge Enterprise Revenue | 4.00 | % | 12-31-2029 | $ | 2,705,000 | $ | 3,154,869 | |||||||||
Colorado Bridge Enterprise Revenue | 4.00 | 6-30-2030 | 3,115,000 | 3,623,430 | ||||||||||||
Colorado Bridge Enterprise Revenue | 4.00 | 6-30-2031 | 665,000 | 766,871 | ||||||||||||
Colorado Certificate of Participation Series A | 4.00 | 12-15-2039 | 3,250,000 | 3,903,315 | ||||||||||||
Colorado Regional Transportation District Certificate of Participation Series 2014A | 5.00 | 6-1-2044 | 2,000,000 | 2,191,600 | ||||||||||||
Denver CO School District #1 Certificate of Participation Series B | 5.00 | 12-15-2035 | 1,000,000 | 1,205,820 | ||||||||||||
Denver CO School District #1 Certificate of Participation Series B | 5.00 | 12-15-2045 | 1,200,000 | 1,425,288 | ||||||||||||
Fremont County CO Finance Corporation Certificate of Participation Series 2013 | 5.25 | 12-15-2038 | 1,265,000 | 1,346,593 | ||||||||||||
Longmont CO Certificate of Participation Series 2014 | 5.00 | 12-1-2034 | 1,000,000 | 1,127,490 | ||||||||||||
Platte Valley CO Fire Protection District Series 2012 | 5.00 | 12-1-2036 | 325,000 | 333,483 | ||||||||||||
Westminster CO Certificate of Participation Series 2015A | 5.00 | 12-1-2035 | 2,000,000 | 2,403,540 | ||||||||||||
Westminster CO Public Schools Certificate of Participation Series 2019 (AGM Insured) | 5.00 | 12-1-2048 | 3,500,000 | 4,265,450 | ||||||||||||
| 25,747,749 | ||||||||||||||||
|
| |||||||||||||||
| Tax Revenue: 1.24% | ||||||||||||||||
City of Commerce City CO Sales and Use Tax Revenue Bonds, Series 2014 (AGM Insured) | 5.00 | 8-1-2044 | 1,250,000 | 1,431,863 | ||||||||||||
Colorado Park Creek Metropolitan District Refunding Bonds Series A | 5.00 | 12-1-2045 | 500,000 | 572,575 | ||||||||||||
Colorado Regional Transportation District Fastracks Project Revenue Bonds Series 2013A | 5.00 | 11-1-2031 | 1,000,000 | 1,091,740 | ||||||||||||
Denver CO City & County Improvement & Refunding Bonds Series A | 5.00 | 8-1-2044 | 3,000,000 | 3,426,840 | ||||||||||||
Regional Transportation District Colorado Fastracks Project Series A | 5.00 | 11-1-2041 | 50,945,000 | 60,302,068 | ||||||||||||
Thornton CO Development Authority East 144th Avenue and I-25 Project Series B | 5.00 | 12-1-2034 | 1,375,000 | 1,615,336 | ||||||||||||
| 68,440,422 | ||||||||||||||||
|
| |||||||||||||||
| Transportation Revenue: 0.38% | ||||||||||||||||
Colorado E-470 Public Highway Authority CAB Series A (National Insured) ¤ | 0.00 | 9-1-2034 | 4,000,000 | 2,949,160 | ||||||||||||
Colorado E-470 Public Highway Authority CAB Series A | 5.00 | 9-1-2027 | 1,000,000 | 1,268,900 | ||||||||||||
Colorado E-470 Public Highway Authority CAB Series A | 5.00 | 9-1-2028 | 1,000,000 | 1,298,390 | ||||||||||||
Colorado E-470 Public Highway Authority CAB Series A | 5.00 | 9-1-2034 | 1,300,000 | 1,708,304 | ||||||||||||
Colorado E-470 Public Highway Authority CAB Series A | 5.00 | 9-1-2035 | 1,250,000 | 1,634,650 | ||||||||||||
Colorado E-470 Public Highway Authority CAB Series A | 5.00 | 9-1-2036 | 1,400,000 | 1,822,548 | ||||||||||||
Colorado E-470 Public Highway Authority CAB Series A | 5.00 | 9-1-2040 | 2,000,000 | 2,272,960 | ||||||||||||
Colorado E-470 Public Highway Authority CAB Series B (National Insured) ¤ | 0.00 | 9-1-2022 | 4,600,000 | 4,526,124 | ||||||||||||
Colorado High Performance Transportation Enterprise U.S. 36 & I-25 Managed Lanes | 5.75 | 1-1-2044 | 3,360,000 | 3,567,446 | ||||||||||||
| 21,048,482 | ||||||||||||||||
|
| |||||||||||||||
| Utilities Revenue: 0.06% | ||||||||||||||||
Colorado Springs CO Utilities System Improvement Bonds Series 2013 B-2 | 5.00 | 11-15-2038 | 3,000,000 | 3,402,450 | ||||||||||||
|
| |||||||||||||||
| Water & Sewer Revenue: 0.13% | ||||||||||||||||
Aurora CO Water Revenue Refunding Bond First Lien | 5.00 | 8-1-2046 | 5,000,000 | 5,960,250 | ||||||||||||
East Cherry Creek Valley CO Water and Sanitation District | 5.00 | 11-15-2032 | 750,000 | 897,323 | ||||||||||||
| 6,857,573 | ||||||||||||||||
|
| |||||||||||||||
| 221,119,356 | ||||||||||||||||
|
| |||||||||||||||
Connecticut: 1.30% |
| |||||||||||||||
| Education Revenue : 0.25% | ||||||||||||||||
Connecticut HEFA Trinity College Series R | 4.00 | 6-1-2045 | 2,500,000 | 2,814,175 | ||||||||||||
Connecticut HEFA Trinity College Series R | 5.00 | 6-1-2037 | 950,000 | 1,194,578 | ||||||||||||
The accompanying notes are an integral part of these financial statements.
16 | Wells Fargo Municipal Bond Fund
Portfolio of investments—June 30, 2020
| Interest rate | Maturity date | Principal | Value | |||||||||||||
| Education Revenue (continued) | ||||||||||||||||
Connecticut HEFA Trinity College Series R | 5.00 | % | 6-1-2038 | $ | 1,000,000 | $ | 1,253,390 | |||||||||
Connecticut HEFA Trinity College Series R | 5.00 | 6-1-2039 | 1,600,000 | 1,997,856 | ||||||||||||
Connecticut HEFA Trinity College Series R | 5.00 | 6-1-2040 | 1,100,000 | 1,369,786 | ||||||||||||
Connecticut HEFA University of Hartford Series N | 5.00 | 7-1-2031 | 75,000 | 82,850 | ||||||||||||
Connecticut HEFA University of Hartford Series N | 5.00 | 7-1-2032 | 550,000 | 602,327 | ||||||||||||
Connecticut HEFA University of Hartford Series N | 5.00 | 7-1-2033 | 470,000 | 509,786 | ||||||||||||
Connecticut HEFA University of Hartford Series N | 5.00 | 7-1-2034 | 450,000 | 486,774 | ||||||||||||
Connecticut Higher Education Supplemental Loan Authority AMT | 3.25 | 11-15-2036 | 1,400,000 | 1,383,298 | ||||||||||||
Connecticut Higher Education Supplemental Loan Authority AMT | 5.00 | 11-15-2027 | 610,000 | 716,177 | ||||||||||||
Connecticut Higher Education Supplemental Loan Authority AMT | 5.00 | 11-15-2028 | 530,000 | 628,506 | ||||||||||||
Connecticut Higher Education Supplemental Loan Authority AMT | 5.00 | 11-15-2029 | 535,000 | 641,449 | ||||||||||||
| 13,680,952 | ||||||||||||||||
|
| |||||||||||||||
| GO Revenue: 0.26% | ||||||||||||||||
Bridgeport CT Series A | 4.00 | 6-1-2039 | 1,750,000 | 1,873,463 | ||||||||||||
Hamden CT BAN | 5.00 | 8-15-2026 | 1,235,000 | 1,356,154 | ||||||||||||
Hartford CT Series A | 5.00 | 4-1-2028 | 3,165,000 | 3,433,803 | ||||||||||||
Hartford CT Series B | 5.00 | 4-1-2025 | 1,220,000 | 1,335,888 | ||||||||||||
Hartford CT Series B | 5.00 | 4-1-2026 | 1,470,000 | 1,603,461 | ||||||||||||
Hartford CT Series B | 5.00 | 4-1-2027 | 1,000,000 | 1,087,340 | ||||||||||||
New Haven CT Series A (AGM Insured) | 5.00 | 8-1-2039 | 3,000,000 | 3,470,940 | ||||||||||||
| 14,161,049 | ||||||||||||||||
|
| |||||||||||||||
| Miscellaneous Revenue: 0.09% | ||||||||||||||||
Connecticut General Obligation Bonds 2012 Series E | 5.00 | 9-15-2032 | 4,860,000 | 5,230,235 | ||||||||||||
|
| |||||||||||||||
| Tax Revenue: 0.70% | ||||||||||||||||
Connecticut Special Tax Obligation Revenue Transportation Infrastructure Purpose | 5.00 | 5-1-2040 | 1,700,000 | 2,134,758 | ||||||||||||
Connecticut Special Tax Obligation Revenue Transportation Infrastructure Purpose Series 2014A | 5.00 | 9-1-2028 | 10,105,000 | 11,685,220 | ||||||||||||
Connecticut Special Tax Obligation Revenue Transportation Infrastructure Purpose Series 2018B | 5.00 | 10-1-2036 | 5,000,000 | 6,148,050 | ||||||||||||
Connecticut Special Tax Obligation Revenue Transportation Infrastructure Purpose Series 2018B | 5.00 | 10-1-2037 | 7,500,000 | 9,195,000 | ||||||||||||
Connecticut Special Tax Obligation Revenue Transportation Infrastructure Purpose Series A | 5.00 | 8-1-2033 | 8,000,000 | 9,363,120 | ||||||||||||
| 38,526,148 | ||||||||||||||||
|
| |||||||||||||||
| 71,598,384 | ||||||||||||||||
|
| |||||||||||||||
Delaware: 0.26% |
| |||||||||||||||
| Education Revenue: 0.18% | ||||||||||||||||
Delaware EDA Odyssey Charter School Incorporated Project Series A 144A | 7.00 | 9-1-2045 | 7,500,000 | 7,972,350 | ||||||||||||
Kent County DE Charter School Incorporated Project | 7.38 | 5-1-2037 | 2,110,000 | 2,188,323 | ||||||||||||
| 10,160,673 | ||||||||||||||||
|
| |||||||||||||||
| Transportation Revenue: 0.08% | ||||||||||||||||
Delaware Transportation Authority U.S. 301 Project | 5.00 | 6-1-2055 | 3,950,000 | 4,449,636 | ||||||||||||
|
| |||||||||||||||
| 14,610,309 | ||||||||||||||||
|
| |||||||||||||||
District of Columbia: 0.93% |
| |||||||||||||||
| Education Revenue: 0.01% | ||||||||||||||||
District of Columbia Cesar Chavez Public Charter School | 6.50 | 11-15-2021 | 945,000 | 947,013 | ||||||||||||
|
| |||||||||||||||
The accompanying notes are an integral part of these financial statements.
Wells Fargo Municipal Bond Fund | 17
Portfolio of investments—June 30, 2020
| Interest rate | Maturity date | Principal | Value | |||||||||||||
| GO Revenue: 0.11% | ||||||||||||||||
District of Columbia Series A | 5.00 | % | 6-1-2037 | $ | 5,000,000 | $ | 6,179,050 | |||||||||
|
| |||||||||||||||
| Miscellaneous Revenue: 0.30% | ||||||||||||||||
District Columbia Revenue Refunding Bonds National Public Radio Incorporated | 4.00 | 4-1-2033 | 3,400,000 | 3,758,394 | ||||||||||||
District of Columbia Series A | 5.00 | 10-15-2044 | 10,000,000 | 12,662,500 | ||||||||||||
| 16,420,894 | ||||||||||||||||
|
| |||||||||||||||
| Tax Revenue: 0.29% | ||||||||||||||||
District of Columbia Income Tax Secured Series G | 5.00 | 12-1-2036 | 15,000,000 | 15,862,950 | ||||||||||||
|
| |||||||||||||||
| Transportation Revenue: 0.22% | ||||||||||||||||
Metropolitan Washington DC Airports Authority Subordinated Lien Series B (AGM Insured) | 4.00 | 10-1-2049 | 8,000,000 | 8,635,200 | ||||||||||||
Washington DC Metropolitan Area Transit Authroity Series A | 4.00 | 7-15-2045 | 1,000,000 | 1,169,220 | ||||||||||||
Washington DC Metropolitan Area Transit Authroity Series A | 5.00 | 7-15-2033 | 1,700,000 | 2,267,749 | ||||||||||||
| 12,072,169 | ||||||||||||||||
|
| |||||||||||||||
| 51,482,076 | ||||||||||||||||
|
| |||||||||||||||
Florida: 5.75% |
| |||||||||||||||
| Airport Revenue: 2.38% | ||||||||||||||||
Broward County FL Airport System Revenue Bond AMT Series 2015A | 5.00 | 10-1-2036 | 12,440,000 | 14,160,452 | ||||||||||||
Broward County FL Airport System Revenue Bond AMT Series A | 5.00 | 10-1-2034 | 1,750,000 | 2,159,850 | ||||||||||||
Broward County FL Port Facilities Revenue AMT Series B | 4.00 | 9-1-2039 | 10,000,000 | 10,784,300 | ||||||||||||
Broward County FL Port Facilities Revenue AMT Series B | 4.00 | 9-1-2044 | 3,425,000 | 3,647,077 | ||||||||||||
Greater Orlando FL Aviation Authority AMT Series A | 5.00 | 10-1-2046 | 3,000,000 | 3,462,270 | ||||||||||||
Hillsborough County FL Aviation Authority Revenue Tampa International Airport Series A | 5.00 | 10-1-2048 | 7,000,000 | 8,232,770 | ||||||||||||
Hillsborough County FL Aviation Authority Revenue Tampa International Airport Series B | 5.00 | 10-1-2040 | 1,000,000 | 1,118,460 | ||||||||||||
Hillsborough County FL Aviation Authority Revenue Tampa International Airport Series E | 5.00 | 10-1-2048 | 10,000,000 | 11,801,700 | ||||||||||||
Hillsborough County FL Aviation Authority Revenue Tampa International Airport Series F | 5.00 | 10-1-2048 | 17,000,000 | 20,342,200 | ||||||||||||
Jacksonville FL Port Authority Series B | 5.00 | 11-1-2044 | 4,080,000 | 4,699,303 | ||||||||||||
Jacksonville FL Port Authority Series B | 5.00 | 11-1-2048 | 9,870,000 | 11,320,199 | ||||||||||||
Miami -Dade County FL Aviation Refunding AMT | 5.00 | 10-1-2030 | 11,000,000 | 12,369,830 | ||||||||||||
Miami -Dade County FL Aviation Refunding AMT | 5.00 | 10-1-2032 | 14,000,000 | 15,628,200 | ||||||||||||
Miami -Dade County FL Aviation Refunding AMT Series A | 5.00 | 10-1-2033 | 5,000,000 | 5,564,300 | ||||||||||||
Miami -Dade County FL Aviation Refunding AMT Series A | 5.00 | 10-1-2049 | 4,500,000 | 5,337,945 | ||||||||||||
Miami-Dade County FL Seaport AMT Series B | 6.00 | 10-1-2033 | 500,000 | 565,515 | ||||||||||||
| 131,194,371 | ||||||||||||||||
|
| |||||||||||||||
| Education Revenue: 0.75% | ||||||||||||||||
Capital Trust Agency Florida Educational Facilities Revenue Renaissance Charter School Incorporated 144A | 5.00 | 6-15-2039 | 3,610,000 | 3,764,508 | ||||||||||||
Florida Development Finance Corporation Educational Facilities Renaissance Charter School Project Series A | 8.50 | 6-15-2044 | 13,290,000 | 14,945,535 | ||||||||||||
Florida Higher Educational Facilities Authority Jacksonville University Project Series A-1 144A | 5.00 | 6-1-2048 | 2,000,000 | 1,890,740 | ||||||||||||
Lakeland FL Educational Facilities Authority Florida Southern College Project Series A | 5.00 | 9-1-2025 | 530,000 | 566,946 | ||||||||||||
Lakeland FL Educational Facilities Authority Florida Southern College Project Series A | 5.00 | 9-1-2028 | 1,195,000 | 1,270,297 | ||||||||||||
The accompanying notes are an integral part of these financial statements.
18 | Wells Fargo Municipal Bond Fund
Portfolio of investments—June 30, 2020
| Interest rate | Maturity date | Principal | Value | |||||||||||||
| Education Revenue (continued) | ||||||||||||||||
Pinellas County FL Educational Facilities Authority Barry University Project | 5.00 | % | 10-1-2027 | $ | 1,600,000 | $ | 1,653,456 | |||||||||
Seminole County FL IDA Choices in Learning Series A | 6.20 | 11-15-2026 | 1,380,000 | 1,409,932 | ||||||||||||
Seminole County FL IDA Choices in Learning Series A | 7.38 | 11-15-2041 | 3,525,000 | 3,613,619 | ||||||||||||
Volusia County FL Educational Facility Authority Embry-Riddle Aeronautical University | 5.00 | 10-15-2044 | 6,500,000 | 7,655,310 | ||||||||||||
Volusia County FL Educational Facility Authority Embry-Riddle Aeronautical University | 5.00 | 10-15-2049 | 4,000,000 | 4,686,400 | ||||||||||||
| 41,456,743 | ||||||||||||||||
|
| |||||||||||||||
| GO Revenue: 0.60% | ||||||||||||||||
Miami-Dade County FL School District | 5.00 | 3-15-2046 | 15,000,000 | 17,597,100 | ||||||||||||
Miami-Dade County FL Series 2014-A | 5.00 | 7-1-2043 | 12,935,000 | 15,688,603 | ||||||||||||
| 33,285,703 | ||||||||||||||||
|
| |||||||||||||||
| Health Revenue: 0.65% | ||||||||||||||||
Atlantic Beach FL Health Care Facilities Fleet Landing Project Series B | 5.63 | 11-15-2043 | 5,000,000 | 5,218,200 | ||||||||||||
Collier County FL IDA NCH Healthcare System Project | 6.25 | 10-1-2039 | 17,015,000 | 17,520,175 | ||||||||||||
Holmes County FL Hospital Corporation Doctors Memorial Hospital Project | 6.00 | 11-1-2038 | 2,500,000 | 1,625,000 | ||||||||||||
Lee County FL IDA Shell Point Alliance | 5.00 | 11-15-2044 | 5,350,000 | 5,619,212 | ||||||||||||
Lee County FL IDA Shell Point Alliance | 5.00 | 11-15-2049 | 1,000,000 | 1,046,400 | ||||||||||||
Tampa FL Hospital Revenue H. Lee Moffitt Cancer Center Project | 4.00 | 7-1-2038 | 1,025,000 | 1,158,158 | ||||||||||||
Tampa FL Hospital Revenue H. Lee Moffitt Cancer Center Project | 4.00 | 7-1-2045 | 2,500,000 | 2,760,300 | ||||||||||||
Tampa FL Hospital Revenue H. Lee Moffitt Cancer Center Project | 5.00 | 7-1-2040 | 700,000 | 855,232 | ||||||||||||
| 35,802,677 | ||||||||||||||||
|
| |||||||||||||||
| Housing Revenue: 0.07% | ||||||||||||||||
Florida Housing Finance Corporation Journet Place Apartments Series 1 | 7.60 | 12-15-2047 | 785,000 | 914,572 | ||||||||||||
Florida Housing Finance Corporation Villa Capri Phase III | 7.60 | 12-15-2042 | 2,575,000 | 2,610,818 | ||||||||||||
| 3,525,390 | ||||||||||||||||
|
| |||||||||||||||
| Industrial Development Revenue: 0.04% | ||||||||||||||||
Florida Development Finance Corporation 144A | 5.00 | 5-1-2029 | 2,000,000 | 2,128,240 | ||||||||||||
|
| |||||||||||||||
| Miscellaneous Revenue: 0.43% | ||||||||||||||||
CityPlace Florida Community Development District | 5.00 | 5-1-2022 | 1,000,000 | 1,072,740 | ||||||||||||
Collier County FL School Board Refunding Bond Certificate of Participation (AGM Insured) | 5.25 | 2-15-2021 | 1,000,000 | 1,030,350 | ||||||||||||
Hillsborough County FL Communications Services | 5.00 | 10-1-2038 | 8,000,000 | 9,584,320 | ||||||||||||
Indigo FL Community Development District Series C | 7.00 | 5-1-2030 | 2,248,150 | 1,573,705 | ||||||||||||
Lakeside Plantation FL Community Development District Series A | 6.95 | 5-1-2031 | 981,000 | 982,265 | ||||||||||||
Marshall Creek Florida Community Development District | 5.00 | 5-1-2032 | 1,720,000 | 1,423,076 | ||||||||||||
Marshall Creek Florida Community Development District | 6.32 | 5-1-2045 | 120,000 | 93,304 | ||||||||||||
Orlando FL Capital Improvement Special Revenue Series B | 5.00 | 10-1-2033 | 1,525,000 | 1,792,531 | ||||||||||||
Orlando FL Capital Improvement Special Revenue Series B | 5.00 | 10-1-2035 | 1,680,000 | 1,970,119 | ||||||||||||
Orlando FL Capital Improvement Special Revenue Series B | 5.00 | 10-1-2036 | 1,765,000 | 2,067,380 | ||||||||||||
Pinellas County FL IDA Drs. Kiran & Pallavi Patel Project | 5.00 | 7-1-2039 | 2,000,000 | 2,218,440 | ||||||||||||
| 23,808,230 | ||||||||||||||||
|
| |||||||||||||||
| Resource Recovery Revenue: 0.08% | ||||||||||||||||
Florida Development Finance Corporation Solid Waste AMT Pro USA Incorporated 144A | 5.00 | 8-1-2029 | 4,000,000 | 4,085,360 | ||||||||||||
|
| |||||||||||||||
| Tax Revenue: 0.15% | ||||||||||||||||
Florida Board of Education Public Education Refunding Bond Capital Outlay Series D | 4.00 | 6-1-2031 | 8,000,000 | 8,477,440 | ||||||||||||
|
| |||||||||||||||
The accompanying notes are an integral part of these financial statements.
Wells Fargo Municipal Bond Fund | 19
Portfolio of investments—June 30, 2020
| Interest rate | Maturity date | Principal | Value | |||||||||||||
| Transportation Revenue: 0.18% | ||||||||||||||||
Florida Department of Transportation Series A (AGM Insured) | 4.00 | % | 7-1-2038 | $ | 4,185,000 | $ | 4,911,809 | |||||||||
Osceola County FL Transportation Revenue Improvement & Refunding Bonds Osceola Parkway Series 2019A-1 | 5.00 | 10-1-2044 | 4,250,000 | 5,060,348 | ||||||||||||
| 9,972,157 | ||||||||||||||||
|
| |||||||||||||||
| Utilities Revenue: 0.09% | ||||||||||||||||
Jacksonville FL Electric Authority Subordinate Revenue Bonds 2012 Series A | 4.00 | 10-1-2031 | 5,040,000 | 5,141,153 | ||||||||||||
|
| |||||||||||||||
| Water & Sewer Revenue: 0.33% | ||||||||||||||||
Daytona Beach FL Improvement & Refunding Bonds Project (AGM Insured) | 5.00 | 11-1-2031 | 1,155,000 | 1,272,533 | ||||||||||||
Daytona Beach FL Improvement & Refunding Bonds Project (AGM Insured) | 5.00 | 11-1-2032 | 1,465,000 | 1,613,712 | ||||||||||||
Florida Keys Aqueduct Authority Series A | 5.00 | 9-1-2041 | 2,750,000 | 3,213,953 | ||||||||||||
North Sumter County FL Utility Dependent District (BAM Insured) | 5.00 | 10-1-2044 | 3,000,000 | 3,696,360 | ||||||||||||
North Sumter County FL Utility Dependent District | 5.00 | 10-1-2049 | 3,250,000 | 3,950,050 | ||||||||||||
Viera East Florida Community Development District Water Management Project (National Insured) | 5.75 | 5-1-2021 | 2,140,000 | 2,218,003 | ||||||||||||
Viera East Florida Community Development District Water Management Project (National Insured) | 5.75 | 5-1-2022 | 2,265,000 | 2,446,698 | ||||||||||||
| 18,411,309 | ||||||||||||||||
|
| |||||||||||||||
| 317,288,773 | ||||||||||||||||
|
| |||||||||||||||
Georgia: 2.40% |
| |||||||||||||||
| Education Revenue: 0.17% | ||||||||||||||||
Cobb County GA Development Authority Charter Learning Center Foundation Central Project Series A †† | 6.38 | 7-1-2025 | 1,705,000 | 1,435,525 | ||||||||||||
Georgia Private Colleges & Universities Authority Mercer University Project | 5.00 | 10-1-2040 | 5,000,000 | 5,257,950 | ||||||||||||
Georgia Private Colleges & Universities Authority Mercer University Project Series A | 5.25 | 10-1-2027 | 2,655,000 | 2,732,685 | ||||||||||||
| 9,426,160 | ||||||||||||||||
|
| |||||||||||||||
| Energy Revenue: 0.08% | ||||||||||||||||
Municipal Electric Authority of GA Project I Series A | 5.00 | 1-1-2044 | 3,580,000 | 4,250,355 | ||||||||||||
|
| |||||||||||||||
| Health Revenue: 0.10% | ||||||||||||||||
Fulton County GA Development Authority Hospital Revenue Bond Series A | 5.00 | 4-1-2047 | 2,250,000 | 2,523,218 | ||||||||||||
The Glynn-Brunswick Memorial Hospital Authority Revenue Anticipation Certificates Series 2015 | 5.00 | 8-1-2034 | 2,580,000 | 2,900,513 | ||||||||||||
| 5,423,731 | ||||||||||||||||
|
| |||||||||||||||
| Transportation Revenue: 0.10% | ||||||||||||||||
Georgia Road & Tollway Authority CAB I-75 South Expressway Lanes Project Series A 144A¤ | 0.00 | 6-1-2034 | 3,750,000 | 1,528,013 | ||||||||||||
Georgia Road & Tollway Authority CCAB I-75 South Expressway Lanes Project Series B 144A¤ | 0.00 | 6-1-2049 | 5,600,000 | 4,268,040 | ||||||||||||
| 5,796,053 | ||||||||||||||||
|
| |||||||||||||||
| Utilities Revenue: 1.95% | ||||||||||||||||
Bartow County GA Development Authority Pollution Control Georgia Power Company Plant Bowen Project | 2.75 | 12-1-2032 | 20,000,000 | 20,653,200 | ||||||||||||
Burke County GA Development Authority Georgia Power Company Plant Vogtle Project | 2.93 | 11-1-2053 | 14,750,000 | 15,457,853 | ||||||||||||
Burke County GA Development Authority Georgia Power Company Plant Vogtle Project Series 2 | 2.93 | 11-1-2048 | 10,000,000 | 10,479,900 | ||||||||||||
The accompanying notes are an integral part of these financial statements.
20 | Wells Fargo Municipal Bond Fund
Portfolio of investments—June 30, 2020
| Interest rate | Maturity date | Principal | Value | |||||||||||||
| Utilities Revenue (continued) | ||||||||||||||||
Burke County GA Development Authority Oglethorpe Power Corporation Vogtle Project Series F | 3.00 | % | 11-1-2045 | $ | 5,000,000 | $ | 5,186,950 | |||||||||
Georgia Municipal Electric Authority Power Series EE (Ambac Insured) | 7.25 | 1-1-2024 | 400,000 | 474,084 | ||||||||||||
Main Street Natural Gas Incorporated Georgia Gas Project Series A (Royal Bank of Canada LIQ) | 4.00 | 3-1-2023 | 1,000,000 | 1,079,750 | ||||||||||||
Main Street Natural Gas Incorporated Georgia Gas Project Series A | 5.00 | 5-15-2032 | 3,745,000 | 4,498,007 | ||||||||||||
Main Street Natural Gas Incorporated Georgia Gas Project Series B | 4.00 | 8-1-2049 | 20,000,000 | 22,569,800 | ||||||||||||
Main Street Natural Gas Incorporated Georgia Gas Project Series C (Royal Bank of Canada LIQ) | 4.00 | 8-1-2048 | 15,000,000 | 16,415,100 | ||||||||||||
Main Street Natural Gas Incorporated Georgia Gas Project Subordinate Bond Series A (Royal Bank of Canada LIQ) | 4.00 | 4-1-2048 | 2,900,000 | 3,156,592 | ||||||||||||
Main Street Natural Gas Incorporated Georgia Gas Project Subordinate Bond Series B (1 Month LIBOR +0.75%) ± | 0.87 | 4-1-2048 | 5,100,000 | 5,056,446 | ||||||||||||
Municipal Electric Authority of Georgia Plant Vogtle Units 3&4 Project M | 5.00 | 1-1-2037 | 1,100,000 | 1,316,678 | ||||||||||||
Municipal Electric Authority of Georgia Plant Vogtle Units 3&4 Project M | 5.00 | 1-1-2038 | 1,100,000 | 1,312,993 | ||||||||||||
| 107,657,353 | ||||||||||||||||
|
| |||||||||||||||
| 132,553,652 | ||||||||||||||||
|
| |||||||||||||||
Guam: 0.08% |
| |||||||||||||||
| Airport Revenue: 0.01% | ||||||||||||||||
Guam Port Authority Private Activity Bond-AMT Bond Series 2018B | 5.00 | 7-1-2030 | 500,000 | 583,610 | ||||||||||||
|
| |||||||||||||||
| Housing Revenue: 0.00% | ||||||||||||||||
Guam Housing Corporation Guaranteed Mortgage-Backed Securities Series A (FHLMC Insured) | 5.75 | 9-1-2031 | 60,000 | 62,148 | ||||||||||||
|
| |||||||||||||||
| Tax Revenue: 0.02% | ||||||||||||||||
Guam Government Business Privilege Tax Series A | 5.00 | 1-1-2031 | 1,000,000 | 1,028,540 | ||||||||||||
|
| |||||||||||||||
| Water & Sewer Revenue: 0.05% | ||||||||||||||||
Guam Government Waterworks Authority Series 2013 | 5.25 | 7-1-2023 | 1,000,000 | 1,111,880 | ||||||||||||
Guam Government Waterworks Authority Series A | 5.00 | 1-1-2050 | 1,600,000 | 1,909,136 | ||||||||||||
| 3,021,016 | ||||||||||||||||
|
| |||||||||||||||
| 4,695,314 | ||||||||||||||||
|
| |||||||||||||||
Hawaii: 0.40% |
| |||||||||||||||
| Airport Revenue: 0.35% | ||||||||||||||||
Hawaii Airports System Revenue Series A | 5.00 | 7-1-2048 | 7,000,000 | 8,240,540 | ||||||||||||
Hawaii AMT Series A | 5.00 | 7-1-2041 | 9,500,000 | 10,755,615 | ||||||||||||
| 18,996,155 | ||||||||||||||||
|
| |||||||||||||||
| GO Revenue: 0.05% | ||||||||||||||||
Hawaii Prerefunded Bond Series DZ | 5.00 | 12-1-2031 | 1,670,000 | 1,780,404 | ||||||||||||
Hawaii Unrefunded Bond Series DZ | 5.00 | 12-1-2031 | 1,030,000 | 1,098,093 | ||||||||||||
| 2,878,497 | ||||||||||||||||
|
| |||||||||||||||
| 21,874,652 | ||||||||||||||||
|
| |||||||||||||||
Idaho: 0.09% |
| |||||||||||||||
| Education Revenue: 0.09% | ||||||||||||||||
Idaho Housing & Finance Association Idaho Arts Charter School Incorporated Project Series A | 5.75 | 12-1-2032 | 500,000 | 536,135 | ||||||||||||
Idaho Housing & Finance Association Legacy Public Charter School Incorporated Project Series A | 5.85 | 5-1-2033 | 635,000 | 647,859 | ||||||||||||
The accompanying notes are an integral part of these financial statements.
Wells Fargo Municipal Bond Fund | 21
Portfolio of investments—June 30, 2020
| Interest rate | Maturity date | Principal | Value | |||||||||||||
| Education Revenue (continued) | ||||||||||||||||
Idaho Housing & Finance Association Legacy Public Charter School Incorporated Project Series A | 6.25 | % | 5-1-2043 | $ | 1,365,000 | $ | 1,406,127 | |||||||||
Idaho Housing & Finance Association Liberty Charter School Series A | 6.00 | 6-1-2038 | 500,000 | 500,860 | ||||||||||||
Idaho Housing & Finance Association Nonprofit CAB North Star Charter School Series B 144A¤ | 0.00 | 7-1-2049 | 1,276,564 | 194,765 | ||||||||||||
Idaho Housing & Finance Association Nonprofit North Star Charter School Series A | 6.75 | 7-1-2048 | 1,322,876 | 1,418,890 | ||||||||||||
| 4,704,636 | ||||||||||||||||
|
| |||||||||||||||
Illinois: 12.80% |
| |||||||||||||||
| Airport Revenue: 0.54% | ||||||||||||||||
Chicago IL O’Hare International Airport AMT Passenger Facility Charge Series B | 5.00 | 1-1-2026 | 5,000,000 | 5,271,400 | ||||||||||||
Chicago IL O’Hare International Airport AMT Senior Lien Series C | 5.50 | 1-1-2044 | 4,000,000 | 4,301,520 | ||||||||||||
Chicago IL O’Hare International Airport Customer Facility Charge Senior Lien (AGM Insured) | 5.50 | 1-1-2043 | 4,530,000 | 4,896,658 | ||||||||||||
Chicago IL O’Hare International Airport Customer Facility Charge Senior Lien Series D | 5.75 | 1-1-2043 | 4,500,000 | 4,725,450 | ||||||||||||
Chicago IL O’Hare International Airport Senior Lien Series B | 5.00 | 1-1-2039 | 8,000,000 | 9,312,480 | ||||||||||||
Chicago IL O’Hare International Airport Transportation Infrastructure Properties Obligated Group | 5.00 | 7-1-2038 | 1,000,000 | 1,132,780 | ||||||||||||
| 29,640,288 | ||||||||||||||||
|
| |||||||||||||||
| Education Revenue: 0.42% | ||||||||||||||||
Illinois Finance Authority Charter Schools Project Series A | 6.25 | 9-1-2039 | 7,955,000 | 8,720,907 | ||||||||||||
Illinois Finance Authority Charter Schools Refunding & Improvement Bonds Series A | 6.88 | 10-1-2031 | 1,570,000 | 1,636,552 | ||||||||||||
Illinois Finance Authority Student Housing Illinois State University | 6.75 | 4-1-2031 | 8,000,000 | 8,369,280 | ||||||||||||
University of Illinois Auxiliary Facilities Systems CAB Series A (National Insured) ¤ | 0.00 | 4-1-2026 | 2,355,000 | 2,104,381 | ||||||||||||
University of Illinois Auxiliary Facilities Systems CAB Series A (National Insured) ¤ | 0.00 | 4-1-2027 | 2,435,000 | 2,113,507 | ||||||||||||
| 22,944,627 | ||||||||||||||||
|
| |||||||||||||||
| GO Revenue: 3.25% | ||||||||||||||||
Champaign & Piatt Counties IL School Series A (AGM Insured) | 5.00 | 10-1-2021 | 1,890,000 | 1,994,139 | ||||||||||||
Chicago IL Board of Education CAB City Colleges (National Insured) ¤ | 0.00 | 1-1-2025 | 9,935,000 | 8,434,120 | ||||||||||||
Chicago IL Board of Education CAB School Reform Series A (National Insured) ¤ | 0.00 | 12-1-2020 | 1,000,000 | 990,370 | ||||||||||||
Chicago IL Board of Education CAB School Reform Series B-1 (National Insured) ¤ | 0.00 | 12-1-2023 | 2,930,000 | 2,678,284 | ||||||||||||
Chicago IL Board of Education CAB School Reform Series B-1 (National Insured) ¤ | 0.00 | 12-1-2026 | 4,245,000 | 3,495,333 | ||||||||||||
Chicago IL CAB City Colleges (National Insured) ¤ | 0.00 | 1-1-2030 | 5,995,000 | 4,019,468 | ||||||||||||
Chicago IL CAB Project & Refunding Bond Series C (AGM Insured) ¤ | 0.00 | 1-1-2026 | 7,360,000 | 6,307,814 | ||||||||||||
Chicago IL Neighborhoods Alive 21 Program Series B | 5.50 | 1-1-2032 | 1,285,000 | 1,386,091 | ||||||||||||
Chicago IL Neighborhoods Alive 21 Program Series B | 5.50 | 1-1-2034 | 1,500,000 | 1,609,845 | ||||||||||||
Chicago IL Series A | 5.50 | 1-1-2034 | 7,330,000 | 7,856,441 | ||||||||||||
Chicago IL Series A | 5.50 | 1-1-2035 | 1,715,000 | 1,834,656 | ||||||||||||
Chicago IL Series A | 5.00 | 1-1-2027 | 1,410,000 | 1,531,965 | ||||||||||||
Chicago IL Series A | 5.50 | 1-1-2033 | 12,730,000 | 13,676,221 | ||||||||||||
Cook County IL Series A | 5.25 | 11-15-2022 | 3,000,000 | 3,033,150 | ||||||||||||
Cook County IL Series C (AGM Insured) | 5.00 | 11-15-2024 | 4,240,000 | 4,639,959 | ||||||||||||
Cook County IL Series C | 5.00 | 11-15-2025 | 3,490,000 | 3,687,743 | ||||||||||||
The accompanying notes are an integral part of these financial statements.
22 | Wells Fargo Municipal Bond Fund
Portfolio of investments—June 30, 2020
| Interest rate | Maturity date | Principal | Value | |||||||||||||
| GO Revenue (continued) | ||||||||||||||||
Cook County IL Series C | 5.00 | % | 11-15-2027 | $ | 325,000 | $ | 342,053 | |||||||||
Cook County IL Series G | 5.00 | 11-15-2028 | 27,320,000 | 27,547,849 | ||||||||||||
Illinois (AGM Insured) | 5.00 | 4-1-2026 | 3,000,000 | 3,281,010 | ||||||||||||
Illinois | 5.50 | 1-1-2030 | 2,900,000 | 3,300,664 | ||||||||||||
Illinois Series 1 (National Insured) | 6.00 | 11-1-2026 | 3,200,000 | 3,635,808 | ||||||||||||
Illinois Series A (AGM Insured) | 5.00 | 4-1-2024 | 3,000,000 | 3,216,120 | ||||||||||||
Illinois Series B | 5.00 | 10-1-2028 | 2,750,000 | 3,015,513 | ||||||||||||
Illinois Series B | 5.50 | 5-1-2024 | 2,500,000 | 2,710,000 | ||||||||||||
Kane, Cook & DuPage Counties IL Refunding Bond Series D | 5.00 | 1-1-2028 | 830,000 | 952,608 | ||||||||||||
Kane, Cook & DuPage Counties IL Refunding Bond Series D | 5.00 | 1-1-2033 | 2,000,000 | 2,285,000 | ||||||||||||
Kane, Cook & DuPage Counties IL School District #46 CAB Series B (Ambac Insured) ¤ | 0.00 | 1-1-2023 | 16,725,000 | 16,434,320 | ||||||||||||
Kane, Cook & DuPage Counties IL School District #46 Elgin Refunding Bond Series D | 5.00 | 1-1-2035 | 1,850,000 | 2,110,184 | ||||||||||||
Kendall, Kane & Will Counties IL CAB School District #308 (AGM Insured) ¤ | 0.00 | 2-1-2025 | 855,000 | 814,841 | ||||||||||||
Kendall, Kane & Will Counties IL CAB School District #308 (AGM Insured) ¤ | 0.00 | 2-1-2026 | 5,050,000 | 4,722,154 | ||||||||||||
Kendall, Kane & Will Counties IL CAB School District #308 (AGM Insured) ¤ | 0.00 | 2-1-2027 | 12,050,000 | 11,017,315 | ||||||||||||
Lake County IL School District #24 Millburn CAB (National Insured) ¤ | 0.00 | 1-1-2024 | 2,000,000 | 1,909,700 | ||||||||||||
Lake County IL School District #38 Big Hollow CAB (Ambac Insured) ¤ | 0.00 | 2-1-2021 | 1,325,000 | 1,313,777 | ||||||||||||
Lake County IL School District #38 Big Hollow CAB (Ambac Insured) ¤ | 0.00 | 2-1-2024 | 5,385,000 | 5,039,175 | ||||||||||||
McHenry & Kane Counties IL Community Consolidated School District #158 | 5.63 | 1-15-2032 | 2,500,000 | 2,674,325 | ||||||||||||
McHenry & Kane Counties IL Community Consolidated School District #158 CAB (AGM/FGIC Insured) ¤ | 0.00 | 1-1-2023 | 705,000 | 686,571 | ||||||||||||
Metropolitan Water Reclamation District of Greater Chicago Refunding Bond Series C | 5.25 | 12-1-2032 | 1,565,000 | 2,216,838 | ||||||||||||
Tazewell County IL School District #51 (National Insured) | 9.00 | 12-1-2023 | 350,000 | 444,168 | ||||||||||||
Will County IL Community High School CAB Series B (BAM Insured) ¤ | 0.00 | 1-1-2033 | 2,830,000 | 1,995,405 | ||||||||||||
Will County IL Community High School CAB Series B (BAM Insured) ¤ | 0.00 | 1-1-2032 | 400,000 | 294,016 | ||||||||||||
Will County IL Community High School CAB Series B (BAM Insured) | 5.00 | 1-1-2028 | 500,000 | 536,440 | ||||||||||||
Will County IL Community Unit School (National Insured) ¤ | 0.00 | 11-1-2020 | 2,110,000 | 2,105,822 | ||||||||||||
Will County IL Community Unit School District #201 Crete-Monee Prerefunded Bond CAB (National Insured) ¤ | 0.00 | 11-1-2023 | 430,000 | 420,110 | ||||||||||||
Will County IL Community Unit School District #201 Crete-Monee Unrefunded Bond CAB (National Insured) ¤ | 0.00 | 11-1-2023 | 1,070,000 | 1,036,006 | ||||||||||||
Will County IL Lincoln-Way Community High School District #210 Unrefunded Bond CAB (AGM Insured) ¤ | 0.00 | 1-1-2026 | 7,000,000 | 6,296,500 | ||||||||||||
| 179,529,891 | ||||||||||||||||
|
| |||||||||||||||
| Health Revenue: 0.20% | ||||||||||||||||
Illinois Finance Authority Centegra Health System Project | 5.00 | 9-1-2020 | 1,465,000 | 1,476,193 | ||||||||||||
Illinois Finance Authority Friendship Village of Schaumberg | 5.00 | 2-15-2022 | 1,680,000 | 1,657,118 | ||||||||||||
Illinois Finance Authority Lutheran Life Communities | 5.00 | 11-1-2040 | 4,900,000 | 4,819,836 | ||||||||||||
Illinois Finance Authority Prerefunded Bonds Advocate Health | 4.00 | 6-1-2047 | 1,895,000 | 2,023,803 | ||||||||||||
Illinois Finance Authority Prerefunded Bonds Advocate Health | 4.00 | 6-1-2047 | 40,000 | 42,719 | ||||||||||||
Illinois Finance Authority Unrefunded Balance 2020 | 4.00 | 6-1-2047 | 1,065,000 | 1,096,684 | ||||||||||||
| 11,116,353 | ||||||||||||||||
|
| |||||||||||||||
| Miscellaneous Revenue: 0.95% | ||||||||||||||||
Chicago IL Board of Education Series C | 5.00 | 12-1-2020 | 4,600,000 | 4,638,134 | ||||||||||||
Chicago IL Board of Education Series C | 5.00 | 12-1-2021 | 7,240,000 | 7,412,964 | ||||||||||||
Chicago IL Certificate of Participation River Point Plaza Redevelopment Project Series A 144A | 4.84 | 4-15-2028 | 4,793,000 | 4,817,828 | ||||||||||||
The accompanying notes are an integral part of these financial statements.
Wells Fargo Municipal Bond Fund | 23
Portfolio of investments—June 30, 2020
| Interest rate | Maturity date | Principal | Value | |||||||||||||
| Miscellaneous Revenue (continued) | ||||||||||||||||
Illinois | 5.00 | % | 8-1-2024 | $ | 2,000,000 | $ | 2,072,860 | |||||||||
Illinois | 5.00 | 8-1-2025 | 6,165,000 | 6,377,199 | ||||||||||||
Illinois | 5.25 | 7-1-2030 | 2,500,000 | 2,597,225 | ||||||||||||
Illinois | 5.50 | 7-1-2025 | 6,000,000 | 6,380,280 | ||||||||||||
Illinois | 5.50 | 7-1-2026 | 4,450,000 | 4,715,621 | ||||||||||||
Illinois | 5.50 | 7-1-2033 | 4,000,000 | 4,194,400 | ||||||||||||
Illinois Series 2017D | 5.00 | 11-1-2022 | 1,360,000 | 1,423,090 | ||||||||||||
Illinois Series C | 5.00 | 11-1-2029 | 2,965,000 | 3,200,480 | ||||||||||||
Illinois Series D | 5.00 | 11-1-2021 | 4,575,000 | 4,710,832 | ||||||||||||
| 52,540,913 | ||||||||||||||||
|
| |||||||||||||||
| Tax Revenue: 5.99% | ||||||||||||||||
Chicago IL Motor Fuel Refunding Bond | 5.00 | 1-1-2026 | 4,000,000 | 4,062,840 | ||||||||||||
Chicago IL Motor Fuel Refunding Bond | 5.00 | 1-1-2028 | 1,000,000 | 1,010,330 | ||||||||||||
Chicago IL Motor Fuel Tax Refunding Bonds Series 2013 | 5.00 | 1-1-2024 | 680,000 | 695,912 | ||||||||||||
Chicago IL Motor Fuel Tax Refunding Bonds Series 2013 | 5.00 | 1-1-2025 | 2,595,000 | 2,649,184 | ||||||||||||
Chicago IL Refunding Bonds Series 2002 | 5.00 | 1-1-2028 | 4,430,000 | 5,313,253 | ||||||||||||
Chicago IL Refunding Bonds Series 2002 | 5.00 | 1-1-2029 | 1,500,000 | 1,799,070 | ||||||||||||
Chicago IL Series A | 5.25 | 1-1-2038 | 6,000,000 | 6,437,700 | ||||||||||||
Chicago IL Transit Authority Sales Tax Receipts Bonds (AGM Insured) | 5.00 | 12-1-2044 | 4,000,000 | 4,431,760 | ||||||||||||
Chicago IL Transit Authority Sales Tax Receipts Bonds | 5.00 | 12-1-2046 | 18,250,000 | 19,957,470 | ||||||||||||
Cook County IL Sales Tax Revenue Bonds Series 2012 | 5.00 | 11-15-2037 | 2,500,000 | 2,703,000 | ||||||||||||
Illinois Regional Transportation Authority (AGM Insured) | 5.75 | 6-1-2023 | 400,000 | 439,384 | ||||||||||||
Illinois Regional Transportation Authority Series A | 5.00 | 6-1-2044 | 22,840,000 | 24,610,557 | ||||||||||||
Illinois Regional Transportation Authority Series A (AGM Insured) | 5.75 | 6-1-2034 | 19,000,000 | 26,282,700 | ||||||||||||
Illinois Regional Transportation Authority Series A (National Insured) | 6.00 | 7-1-2027 | 10,620,000 | 13,174,110 | ||||||||||||
Illinois Regional Transportation Authority Series A (National Insured) | 6.00 | 7-1-2033 | 5,000,000 | 7,159,400 | ||||||||||||
Illinois Regional Transportation Authority Series B (National Insured) | 5.50 | 6-1-2027 | 16,455,000 | 19,549,527 | ||||||||||||
Illinois Sales Tax Revenue Bond Junior Obligation Tax Exempt Series A (BAM Insured) | 4.00 | 6-15-2034 | 2,000,000 | 2,077,020 | ||||||||||||
Illinois Sales Tax Revenue Bond Junior Obligation Tax Exempt Series A (BAM Insured) | 4.13 | 6-15-2037 | 1,945,000 | 2,015,001 | ||||||||||||
Illinois Sales Tax Revenue Build Illinois Bonds | 5.00 | 6-15-2029 | 3,000,000 | 3,050,130 | ||||||||||||
Illinois Sales Tax Revenue Build Illinois Bonds Junior Obligation Series C | 4.00 | 6-15-2029 | 10,580,000 | 11,004,893 | ||||||||||||
Illinois Sales Tax Revenue Build Illinois Bonds Junior Obligation Tax Exempt Series C | 4.00 | 6-15-2032 | 5,820,000 | 5,906,136 | ||||||||||||
Illinois Sales Tax Securitization Series A | 5.00 | 1-1-2038 | 3,000,000 | 3,440,940 | ||||||||||||
Illinois Sales Tax Securitization Series C | 5.00 | 1-1-2022 | 2,000,000 | 2,092,300 | ||||||||||||
Illinois Sales Tax Securitization Series C | 5.00 | 1-1-2023 | 2,500,000 | 2,701,300 | ||||||||||||
Illinois Sales Tax Securitization Series C | 5.00 | 1-1-2024 | 2,500,000 | 2,773,975 | ||||||||||||
Illinois Sports Facilities Authority Refunding Bonds State Tax Supported CAB (Ambac Insured) ¤ | 0.00 | 6-15-2022 | 2,295,000 | 2,152,389 | ||||||||||||
Illinois Sports Facilities Authority Refunding Bonds State Tax Supported CAB (Ambac Insured) ¤ | 0.00 | 6-15-2026 | 2,030,000 | 1,606,095 | ||||||||||||
Illinois Sports Facilities Authority State Tax Supported CAB (Ambac Insured) ¤ | 0.00 | 6-15-2021 | 7,705,000 | 7,472,617 | ||||||||||||
Illinois Sports Facilities Authority State Tax Supported CAB (Ambac Insured) ¤ | 0.00 | 6-15-2024 | 17,570,000 | 15,280,278 | ||||||||||||
Illinois Sports Facilities Authority State Tax Supported CAB (Ambac Insured) ¤ | 0.00 | 6-15-2025 | 2,575,000 | 2,140,237 | ||||||||||||
Illinois Sports Facilities Authority State Tax Supported Refunding Bond (AGM Insured) | 5.00 | 6-15-2025 | 3,745,000 | 4,137,813 | ||||||||||||
Illinois Sports Facilities Authority State Tax Supported Refunding Bond (AGM Insured) | 5.00 | 6-15-2026 | 4,775,000 | 5,253,025 | ||||||||||||
Illinois Sports Facilities Authority State Tax Supported Refunding Bond (AGM Insured) | 5.00 | 6-15-2027 | 8,845,000 | 9,698,896 | ||||||||||||
Illinois Sports Facilities Authority State Tax Supported Refunding Bond (AGM Insured) | 5.00 | 6-15-2028 | 4,030,000 | 4,411,077 | ||||||||||||
Illinois Sports Facilities Authority State Tax Supported Refunding Bond (AGM Insured) | 5.25 | 6-15-2032 | 3,500,000 | 3,818,185 | ||||||||||||
The accompanying notes are an integral part of these financial statements.
24 | Wells Fargo Municipal Bond Fund
Portfolio of investments—June 30, 2020
| Interest rate | Maturity date | Principal | Value | |||||||||||||
| Tax Revenue (continued) | ||||||||||||||||
Metropolitan Pier & Exposition Authority CAB McCormick Place Expansion Project Series A (National Insured) ¤ | 0.00 | % | 12-15-2026 | $ | 12,245,000 | $ | 10,023,879 | |||||||||
Metropolitan Pier & Exposition Authority CAB McCormick Place Expansion Project Series A (National Insured) ¤ | 0.00 | 12-15-2030 | 25,700,000 | 17,787,227 | ||||||||||||
Metropolitan Pier & Exposition Authority CAB McCormick Place Expansion Project Series A (National Insured) ¤ | 0.00 | 6-15-2031 | 10,060,000 | 6,781,748 | ||||||||||||
Metropolitan Pier & Exposition Authority CAB McCormick Place Expansion Project Series A (National Insured) ¤ | 0.00 | 12-15-2031 | 9,800,000 | 6,453,398 | ||||||||||||
Metropolitan Pier & Exposition Authority CAB McCormick Place Expansion Project Series B | 5.00 | 12-15-2028 | 5,000,000 | 5,129,950 | ||||||||||||
Metropolitan Pier & Exposition Authority CAB McCormick Place Expansion Project Series B (National Insured) ¤ | 0.00 | 6-15-2029 | 12,085,000 | 8,951,601 | ||||||||||||
Sales Tax Securitization Corporation IL Second Lien Sales Tax | 4.00 | 1-1-2038 | 8,950,000 | 9,568,803 | ||||||||||||
Southwestern Illinois Development Authority Local Government Program Collinsville Limited | 5.00 | 3-1-2025 | 3,360,000 | 2,539,824 | ||||||||||||
Tender Option Bond Trust Receipts/Certificates Series 2018 (Barclays Bank plc LIQ) 144Aø | 0.23 | 11-15-2038 | 14,370,000 | 14,370,000 | ||||||||||||
Tender Option Bond Trust Receipts/Certificates Series 2018-YX1099 (Barclays Bank plc LIQ) 144Aø | 0.28 | 1-1-2035 | 18,000,000 | 18,000,000 | ||||||||||||
| 330,914,934 | ||||||||||||||||
|
| |||||||||||||||
| Tobacco Revenue: 0.06% | ||||||||||||||||
Railsplitter IL Tobacco Settlement Authority | 5.00 | 6-1-2024 | 3,000,000 | 3,406,170 | ||||||||||||
|
| |||||||||||||||
| Transportation Revenue: 0.28% | ||||||||||||||||
Chicago IL Public Building Commission Transit Authority (Ambac Insured) | 5.25 | 3-1-2025 | 2,960,000 | 3,380,438 | ||||||||||||
Chicago IL Public Building Commission Transit Authority (Ambac Insured) | 5.25 | 3-1-2027 | 3,400,000 | 4,027,130 | ||||||||||||
Illinois Toll Highway Authority | 5.00 | 1-1-2031 | 5,000,000 | 6,428,600 | ||||||||||||
Illinois Toll Highway Authority Toll Senior Series B | 5.00 | 1-1-2039 | 1,500,000 | 1,655,790 | ||||||||||||
| 15,491,958 | ||||||||||||||||
|
| |||||||||||||||
| Utilities Revenue: 0.32% | ||||||||||||||||
Illinois Municipal Electric Agency Power Supply System Series A | 5.00 | 2-1-2030 | 7,000,000 | 8,230,250 | ||||||||||||
Illinois Municipal Electric Agency Power Supply System Series A | 5.00 | 2-1-2031 | 8,000,000 | 9,376,000 | ||||||||||||
| 17,606,250 | ||||||||||||||||
|
| |||||||||||||||
| Water & Sewer Revenue: 0.79% | ||||||||||||||||
Chicago IL Second Lien | 5.00 | 11-1-2029 | 4,600,000 | 4,899,506 | ||||||||||||
Chicago IL Wastewater Refunding Bond Second Lien Bond Series C | 5.00 | 1-1-2039 | 5,000,000 | 5,525,200 | ||||||||||||
Chicago IL Wastewater Transmission Second Lien Series 2012 | 5.00 | 1-1-2027 | 5,000,000 | 5,250,800 | ||||||||||||
Chicago IL Wastewater Transmission Second Lien Series 2014 | 5.00 | 1-1-2039 | 11,525,000 | 12,546,461 | ||||||||||||
Chicago IL Waterworks Second Lien (AGM Insured) | 5.25 | 11-1-2032 | 3,250,000 | 3,897,628 | ||||||||||||
Chicago IL Waterworks Second Lien Series 2012 | 5.00 | 11-1-2030 | 5,000,000 | 5,310,150 | ||||||||||||
Illinois Finance Authority Clean Water Initiative | 4.00 | 7-1-2038 | 5,000,000 | 5,922,850 | ||||||||||||
| 43,352,595 | ||||||||||||||||
|
| |||||||||||||||
| 706,543,979 | ||||||||||||||||
|
| |||||||||||||||
Indiana: 1.28% |
| |||||||||||||||
| Health Revenue: 0.56% | ||||||||||||||||
Indiana Finance Authority Health System Revenue Bonds Franciscan Alliance Incorporated Obligated Group Series C | 4.00 | 11-1-2033 | 12,885,000 | 14,466,505 | ||||||||||||
Indiana Finance Authority Health System Revenue Bonds Franciscan Alliance Incorporated Obligated Group Series C | 4.00 | 11-1-2036 | 5,000,000 | 5,558,400 | ||||||||||||
Indiana Finance Authority Kings Daughters Hospital & Health Revenue | 5.50 | 8-15-2040 | 7,425,000 | 7,445,864 | ||||||||||||
The accompanying notes are an integral part of these financial statements.
Wells Fargo Municipal Bond Fund | 25
Portfolio of investments—June 30, 2020
| Interest rate | Maturity date | Principal | Value | |||||||||||||
| Health Revenue (continued) | ||||||||||||||||
Indiana HFFA Ascension Health Credit Group | 5.00 | % | 11-15-2034 | $ | 2,750,000 | $ | 3,217,528 | |||||||||
| 30,688,297 | ||||||||||||||||
|
| |||||||||||||||
| Industrial Development Revenue: 0.30% | ||||||||||||||||
Indiana Finance Authority Ohio River Bridges East End Crossing Project Series A | 5.00 | 7-1-2035 | 9,970,000 | 10,675,776 | ||||||||||||
Indiana Finance Authority Ohio River Bridges East End Crossing Project Series A | 5.00 | 7-1-2040 | 2,470,000 | 2,630,204 | ||||||||||||
Valparaiso IN Pratt Paper LLC Project | 5.88 | 1-1-2024 | 660,000 | 680,024 | ||||||||||||
Whiting IN | 5.00 | 3-1-2046 | 2,500,000 | 2,733,800 | ||||||||||||
| 16,719,804 | ||||||||||||||||
|
| |||||||||||||||
| Miscellaneous Revenue: 0.18% | ||||||||||||||||
Carmel IN Local Public Improvement Multipurpose Bonds | 5.00 | 7-15-2031 | 6,000,000 | 7,347,120 | ||||||||||||
Hobart Industry Building Corporation First Mortgage | 4.00 | 7-15-2035 | 2,295,000 | 2,649,899 | ||||||||||||
| 9,997,019 | ||||||||||||||||
|
| |||||||||||||||
| Tax Revenue: 0.09% | ||||||||||||||||
Indianapolis IN Industry Local Public Improvement Bond Bank Community Justice Campus Courthouse & Jail Project | 5.00 | 2-1-2049 | 4,000,000 | 4,931,880 | ||||||||||||
|
| |||||||||||||||
| Utilities Revenue: 0.15% | ||||||||||||||||
Indiana Finance Authority Midwestern Disaster Relief Ohio Valley Electric Corporation Project %% | 3.00 | 11-1-2030 | 4,000,000 | 4,107,240 | ||||||||||||
Indiana Finance Authority Ohio Valley Electric Corporation Project Series A %% | 3.00 | 11-1-2030 | 4,000,000 | 4,107,240 | ||||||||||||
| 8,214,480 | ||||||||||||||||
|
| |||||||||||||||
| 70,551,480 | ||||||||||||||||
|
| |||||||||||||||
Iowa: 0.51% |
| |||||||||||||||
| GO Revenue: 0.04% | ||||||||||||||||
Altoona IA Annual Appropriation Urban Renewal Series C | 5.00 | 6-1-2031 | 1,805,000 | 2,152,264 | ||||||||||||
|
| |||||||||||||||
| Industrial Development Revenue: 0.36% | ||||||||||||||||
Iowa Finance Authority Midwestern EDA CJ Bio America Incorporated Project (Korea Development Bank LOC) ø | 0.31 | 4-1-2022 | 20,000,000 | 20,000,000 | ||||||||||||
|
| |||||||||||||||
| Utilities Revenue: 0.11% | ||||||||||||||||
Iowa Gas Project Public Expenditure and Financial Accountability Incorporated | 5.00 | 9-1-2049 | 5,000,000 | 6,033,900 | ||||||||||||
|
| |||||||||||||||
| 28,186,164 | ||||||||||||||||
|
| |||||||||||||||
Kansas: 0.86% |
| |||||||||||||||
| Housing Revenue: 0.13% | ||||||||||||||||
Kansas Development Finance Authority MFHR Woodland Village Apartments Project Series J | 1.68 | 7-1-2022 | 7,250,000 | 7,313,945 | ||||||||||||
|
| |||||||||||||||
| Tax Revenue: 0.73% | ||||||||||||||||
Kansas Department of Transportation Series C | 4.00 | 9-1-2030 | 6,650,000 | 7,107,321 | ||||||||||||
Kansas Department of Transportation Series C | 4.00 | 9-1-2031 | 10,000,000 | 10,675,500 | ||||||||||||
Kansas Department of Transportation Series C | 4.00 | 9-1-2032 | 7,500,000 | 7,995,675 | ||||||||||||
Wyandotte County & Kansas City KS Special Obligation Vacation Village Project Area 4 Major Multi-Sport Athletic Complex Project CAB Series 2015 144A¤ | 0.00 | 9-1-2034 | 34,915,000 | 14,272,205 | ||||||||||||
| 40,050,701 | ||||||||||||||||
|
| |||||||||||||||
| 47,364,646 | ||||||||||||||||
|
| |||||||||||||||
The accompanying notes are an integral part of these financial statements.
26 | Wells Fargo Municipal Bond Fund
Portfolio of investments—June 30, 2020
| Interest rate | Maturity date | Principal | Value | |||||||||||||
Kentucky: 1.55% |
| |||||||||||||||
| Health Revenue: 0.23% | ||||||||||||||||
Kentucky EDFA Norton Healthcare Incorporated Series B (National Insured) ¤ | 0.00 | % | 10-1-2024 | $ | 9,260,000 | $ | 8,512,625 | |||||||||
Kentucky EDFA Norton Healthcare Incorporated Series B (National Insured) ¤ | 0.00 | 10-1-2028 | 5,140,000 | 4,172,703 | ||||||||||||
| 12,685,328 | ||||||||||||||||
|
| |||||||||||||||
| Transportation Revenue: 0.14% | ||||||||||||||||
Kentucky Public Transportation Infrastructure Authority Downtown Crossing Project CAB Series B ¤ | 0.00 | 7-1-2030 | 2,000,000 | 1,300,420 | ||||||||||||
Kentucky Public Transportation Infrastructure Authority Downtown Crossing Project CAB Series B ¤ | 0.00 | 7-1-2031 | 2,780,000 | 1,677,535 | ||||||||||||
Kentucky Public Transportation Infrastructure Authority Downtown Crossing Project CAB Series B ¤ | 0.00 | 7-1-2032 | 2,500,000 | 1,397,550 | ||||||||||||
Kentucky Public Transportation Infrastructure Authority Downtown Crossing Project CAB Series C ¤ | 0.00 | 7-1-2033 | 1,000,000 | 1,005,230 | ||||||||||||
Kentucky Public Transportation Infrastructure Authority Downtown Crossing Project CAB Series C ¤ | 0.00 | 7-1-2034 | 2,505,000 | 2,508,432 | ||||||||||||
| 7,889,167 | ||||||||||||||||
|
| |||||||||||||||
| Utilities Revenue: 1.18% | ||||||||||||||||
Kentucky Public Energy Authority Gas Supply Series A2 | 4.00 | 4-1-2048 | 8,190,000 | 8,993,275 | ||||||||||||
Kentucky Public Energy Authority Gas Supply Series B | 4.00 | 1-1-2049 | 23,250,000 | 25,608,480 | ||||||||||||
Kentucky Public Energy Authority Gas Supply Series C | 4.00 | 12-1-2049 | 5,350,000 | 6,007,676 | ||||||||||||
Kentucky Public Energy Authority Gas Supply Series C1 | 4.00 | 2-1-2050 | 21,000,000 | 24,536,820 | ||||||||||||
| 65,146,251 | ||||||||||||||||
|
| |||||||||||||||
| 85,720,746 | ||||||||||||||||
|
| |||||||||||||||
Louisiana: 0.63% |
| |||||||||||||||
| Airport Revenue: 0.27% | ||||||||||||||||
New Orleans LA Aviation Board AMT Series B (AGM Insured) | 5.00 | 1-1-2033 | 3,000,000 | 3,365,310 | ||||||||||||
New Orleans LA Aviation Board AMT Series B | 5.00 | 1-1-2034 | 4,500,000 | 5,056,200 | ||||||||||||
New Orleans LA Aviation Board General Airport North Terminal Project Series 2017B | 5.00 | 1-1-2048 | 1,145,000 | 1,302,529 | ||||||||||||
New Orleans LA Aviation Board Gulf Opportunity Zone Consolidated Rental Car Project (AGM Insured) | 5.00 | 1-1-2036 | 1,250,000 | 1,499,238 | ||||||||||||
New Orleans LA Aviation Board Gulf Opportunity Zone Consolidated Rental Car Project (AGM Insured) | 5.00 | 1-1-2037 | 1,750,000 | 2,092,248 | ||||||||||||
New Orleans LA Aviation Board Gulf Opportunity Zone Consolidated Rental Car Project (AGM Insured) | 5.00 | 1-1-2038 | 1,500,000 | 1,788,615 | ||||||||||||
| 15,104,140 | ||||||||||||||||
|
| |||||||||||||||
| GO Revenue: 0.03% | ||||||||||||||||
New Orleans LA (FGIC Insured) | 5.50 | 12-1-2021 | 1,405,000 | 1,465,106 | ||||||||||||
|
| |||||||||||||||
| Industrial Development Revenue: 0.10% | ||||||||||||||||
St. John the Baptist Parish Louisiana Series A | 2.20 | 6-1-2037 | 6,000,000 | 5,744,700 | ||||||||||||
|
| |||||||||||||||
| Miscellaneous Revenue: 0.19% | ||||||||||||||||
Louisiana Local Government Environmental Facilities and CDA Jefferson Parish Gomesa Project 144A | 4.00 | 11-1-2044 | 1,915,000 | 1,686,368 | ||||||||||||
Louisiana Series A | 4.00 | 5-1-2034 | 8,000,000 | 8,909,680 | ||||||||||||
| 10,596,048 | ||||||||||||||||
|
| |||||||||||||||
The accompanying notes are an integral part of these financial statements.
Wells Fargo Municipal Bond Fund | 27
Portfolio of investments—June 30, 2020
| Interest rate | Maturity date | Principal | Value | |||||||||||||
| Water & Sewer Revenue: 0.04% | ||||||||||||||||
Shreveport LA Series B (AGM Insured) | 4.00 | % | 12-1-2036 | $ | 730,000 | $ | 852,574 | |||||||||
Shreveport LA Series B (AGM Insured) | 4.00 | 12-1-2044 | 1,000,000 | 1,143,790 | ||||||||||||
| 1,996,364 | ||||||||||||||||
|
| |||||||||||||||
| 34,906,358 | ||||||||||||||||
|
| |||||||||||||||
Maine: 0.07% |
| |||||||||||||||
| Health Revenue: 0.07% | ||||||||||||||||
Maine HEFA Series A | 5.00 | 7-1-2028 | 1,445,000 | 1,743,754 | ||||||||||||
Maine HEFA Series A | 5.00 | 7-1-2029 | 1,535,000 | 1,927,776 | ||||||||||||
| 3,671,530 | ||||||||||||||||
|
| |||||||||||||||
Maryland: 1.18% |
| |||||||||||||||
| Education Revenue: 0.33% | ||||||||||||||||
Maryland Economic Development Corporation Salisbury University Project | 5.00 | 6-1-2027 | 235,000 | 246,038 | ||||||||||||
Maryland Economic Development Corporation Salisbury University Project | 5.00 | 6-1-2030 | 200,000 | 208,322 | ||||||||||||
Prince George’s County MD Chesapeake Lighthouse Charter School Project Series 2016-A | 5.75 | 8-1-2033 | 1,585,000 | 1,675,266 | ||||||||||||
Prince George’s County MD Chesapeake Lighthouse Charter School Project Series 2016-A 144A | 6.90 | 8-1-2041 | 8,480,000 | 9,362,514 | ||||||||||||
Prince George’s County MD Chesapeake Lighthouse Charter School Project Series 2016-A | 7.00 | 8-1-2046 | 6,085,000 | 6,712,729 | ||||||||||||
| 18,204,869 | ||||||||||||||||
|
| |||||||||||||||
| Health Revenue: 0.03% | ||||||||||||||||
Maryland HEFA Frederick Health System | 4.00 | 7-1-2045 | 745,000 | 818,479 | ||||||||||||
Maryland HEFA Frederick Health System | 4.00 | 7-1-2050 | 850,000 | 929,705 | ||||||||||||
| 1,748,184 | ||||||||||||||||
|
| |||||||||||||||
| Housing Revenue: 0.69% | ||||||||||||||||
Maryland CDA Department of Housing & Community Multifamily Development Bay Country Apartments 144A | 2.52 | 2-1-2021 | 9,000,000 | 9,064,260 | ||||||||||||
Maryland CDA Department of Housing & Community Multifamily Development Huntington Apartments Series C 144A | 2.34 | 4-1-2021 | 7,000,000 | 7,058,590 | ||||||||||||
Maryland CDA Department of Housing & Community Multifamily Development Park View Woodlawn Series E | 2.41 | 5-1-2021 | 7,450,000 | 7,519,285 | ||||||||||||
Maryland Tender Option Bond Trust Receipts/Floater Certificates Series 2019-XF2832 (Mizuho Capital Markets LLC LOC, Mizuho Capital Markets LLC LIQ) 144Aø | 0.35 | 7-1-2037 | 14,600,000 | 14,600,000 | ||||||||||||
| 38,242,135 | ||||||||||||||||
|
| |||||||||||||||
| Miscellaneous Revenue: 0.13% | ||||||||||||||||
Baltimore MD Public Schools Construction & Revitalization Program | 5.00 | 5-1-2041 | 6,000,000 | 6,905,280 | ||||||||||||
Howard County MD Certificate of Participation Agricultural Land Preservation #90-23 Series A | 8.00 | 8-15-2020 | 290,000 | 292,645 | ||||||||||||
| 7,197,925 | ||||||||||||||||
|
| |||||||||||||||
| 65,393,113 | ||||||||||||||||
|
| |||||||||||||||
Massachusetts: 2.90% |
| |||||||||||||||
| Airport Revenue: 0.03% | ||||||||||||||||
Massachusetts AMT Series B | 4.00 | 7-1-2046 | 1,750,000 | 1,859,008 | ||||||||||||
|
| |||||||||||||||
The accompanying notes are an integral part of these financial statements.
28 | Wells Fargo Municipal Bond Fund
Portfolio of investments—June 30, 2020
| Interest rate | Maturity date | Principal | Value | |||||||||||||
| Education Revenue: 0.06% | ||||||||||||||||
Lowell MA Collegiate Charter School Revenue | 5.00 | % | 6-15-2039 | $ | 1,000,000 | $ | 1,012,290 | |||||||||
Lowell MA Collegiate Charter School Revenue | 5.00 | 6-15-2049 | 1,750,000 | 1,750,840 | ||||||||||||
Massachusetts Educational Financing Authority Series I | 6.00 | 1-1-2028 | 455,000 | 455,491 | ||||||||||||
| 3,218,621 | ||||||||||||||||
|
| |||||||||||||||
| GO Revenue: 0.19% | ||||||||||||||||
Massachusetts | 5.00 | 3-1-2041 | 7,500,000 | 8,466,975 | ||||||||||||
Massachusetts Series E | 5.25 | 9-1-2048 | 1,765,000 | 2,234,455 | ||||||||||||
| 10,701,430 | ||||||||||||||||
|
| |||||||||||||||
| Health Revenue: 0.05% | ||||||||||||||||
Massachusetts Development Finance Agency Revenue Massachusetts General/Brigham & Women’s Hospital Series A-2 | 4.00 | 7-1-2040 | 1,000,000 | 1,135,930 | ||||||||||||
Massachusetts Development Finance Agency Revenue Massachusetts General/Brigham & Women’s Hospital Series A-2 | 4.00 | 7-1-2041 | 1,200,000 | 1,358,652 | ||||||||||||
| 2,494,582 | ||||||||||||||||
|
| |||||||||||||||
| Miscellaneous Revenue: 0.21% | ||||||||||||||||
Massachusetts Series A | 5.00 | 12-1-2036 | 10,850,000 | 11,483,749 | ||||||||||||
|
| |||||||||||||||
| Tax Revenue: 1.38% | ||||||||||||||||
Massachusetts Bay Transportation Authority Series B-1 | 5.00 | 7-1-2033 | 2,800,000 | 3,744,552 | ||||||||||||
Massachusetts Bay Transportation Authority Series B-1 | 5.00 | 7-1-2045 | 6,000,000 | 7,404,600 | ||||||||||||
Massachusetts School Building Authority | 5.00 | 8-15-2037 | 8,495,000 | 10,025,034 | ||||||||||||
Massachusetts Series F | 5.00 | 11-1-2041 | 5,000,000 | 6,186,100 | ||||||||||||
Massachusetts Transportation Fund Revenue Rail Enhancement & Accelerated Bridge Programs Series A | 5.00 | 6-1-2047 | 6,485,000 | 7,838,030 | ||||||||||||
Massachusetts Transportation Fund Revenue Rail Enhancement & Accelerated Bridge Programs Series A | 5.00 | 6-1-2048 | 11,510,000 | 14,190,334 | ||||||||||||
Massachusetts Transportation Fund Revenue Rail Enhancement & Accelerated Bridge Programs Series A | 5.00 | 6-1-2049 | 21,500,000 | 27,053,880 | ||||||||||||
| 76,442,530 | ||||||||||||||||
|
| |||||||||||||||
| Water & Sewer Revenue: 0.98% | ||||||||||||||||
Massachusetts Water Resources Authority General Revenue Refunding Bonds Series B (AGM Insured) | 5.25 | 8-1-2036 | 19,180,000 | 29,237,608 | ||||||||||||
Massachusetts Water Resources Authority General Revenue Refunding Bonds Series B (AGM Insured) | 5.25 | 8-1-2038 | 16,000,000 | 24,891,520 | ||||||||||||
| 54,129,128 | ||||||||||||||||
|
| |||||||||||||||
| 160,329,048 | ||||||||||||||||
|
| |||||||||||||||
Michigan: 4.15% |
| |||||||||||||||
| Airport Revenue: 0.13% | ||||||||||||||||
Wayne County MI Airport Authority AMT | 5.00 | 12-1-2029 | 6,000,000 | 6,943,980 | ||||||||||||
|
| |||||||||||||||
| Education Revenue: 0.34% | ||||||||||||||||
Michigan Finance Authority Limited Obligation Public School Holly Academy | 6.50 | 10-1-2020 | 35,000 | 35,277 | ||||||||||||
Michigan Finance Authority Limited Obligation Public School Holly Academy | 8.00 | 10-1-2040 | 1,350,000 | 1,401,206 | ||||||||||||
Michigan Finance Authority Limited Obligation Public School Madison Academy Project Series A | 7.50 | 12-1-2020 | 75,000 | 75,995 | ||||||||||||
Michigan Finance Authority Limited Obligation Public School Madison Academy Project Series A | 8.00 | 12-1-2030 | 1,135,000 | 1,148,836 | ||||||||||||
Michigan Finance Authority Limited Obligation Public School Madison Academy Project Series A | 8.25 | 12-1-2039 | 2,220,000 | 2,243,532 | ||||||||||||
The accompanying notes are an integral part of these financial statements.
Wells Fargo Municipal Bond Fund | 29
Portfolio of investments—June 30, 2020
| Interest rate | Maturity date | Principal | Value | |||||||||||||
| Education Revenue (continued) | ||||||||||||||||
Michigan Public Educational Facilities Authority Limited Obligation Bradford Academy Project 144A | 6.50 | % | 9-1-2037 | $ | 3,460,000 | $ | 2,698,800 | |||||||||
Michigan Public Educational Facilities Authority Limited Obligation Bradford Academy Project | 8.50 | 9-1-2029 | 1,500,000 | 1,170,000 | ||||||||||||
Michigan Public Educational Facilities Authority Limited Obligation Bradford Academy Project | 8.75 | 9-1-2039 | 3,500,000 | 2,730,000 | ||||||||||||
Michigan Public Educational Facilities Authority Limited Obligation Crescent Academy Project | 7.00 | 10-1-2036 | 1,082,500 | 1,083,485 | ||||||||||||
Michigan Public Educational Facilities Authority Limited Obligation Madison Academy Project | 8.38 | 12-1-2030 | 2,085,000 | 2,113,565 | ||||||||||||
Michigan Public Educational Facilities Authority Limited Obligation Madison Academy Project | 8.63 | 12-1-2039 | 4,170,000 | 4,220,499 | ||||||||||||
| 18,921,195 | ||||||||||||||||
|
| |||||||||||||||
| GO Revenue: 0.29% | ||||||||||||||||
Livonia MI Public Schools School District Building & Site Series I | 5.00 | 5-1-2026 | 1,075,000 | 1,196,077 | ||||||||||||
Livonia MI Public Schools School District Building & Site Series I | 5.00 | 5-1-2028 | 1,450,000 | 1,611,588 | ||||||||||||
Livonia MI Public Schools School District Building & Site Series I | 5.00 | 5-1-2029 | 1,350,000 | 1,499,648 | ||||||||||||
Livonia MI Public Schools School District Building & Site Series I | 5.00 | 5-1-2030 | 1,775,000 | 1,970,179 | ||||||||||||
Livonia MI Public Schools School District Building & Site Series I | 5.00 | 5-1-2031 | 1,425,000 | 1,579,997 | ||||||||||||
Wayne County MI Building Improvement Series A | 6.75 | 11-1-2039 | 8,020,000 | 8,034,436 | ||||||||||||
| 15,891,925 | ||||||||||||||||
|
| |||||||||||||||
| Health Revenue: 0.49% | ||||||||||||||||
Michigan Finance Authority Trinity Health Credit Group Series A | 5.00 | 12-1-2047 | 24,620,000 | 27,337,802 | ||||||||||||
|
| |||||||||||||||
| Miscellaneous Revenue: 1.07% | ||||||||||||||||
Michigan Building Authority Refunding Facilities Program Bond Series I | 5.00 | 4-15-2041 | 13,000,000 | 15,545,010 | ||||||||||||
Michigan Finance Authority Charter Company Wayne Criminal Justice Center Project | 4.00 | 11-1-2048 | 6,000,000 | 6,772,260 | ||||||||||||
Michigan Finance Authority Local Government Loan Program City of Detroit Financial Recovery Refunding Bond Series F | 4.50 | 10-1-2029 | 7,000,000 | 7,340,340 | ||||||||||||
Michigan Finance Authority Local Government Loan Program Series H-1 | 5.00 | 10-1-2031 | 1,340,000 | 1,554,387 | ||||||||||||
Michigan Finance Authority Local Government Loan Program Series H-1 | 5.00 | 10-1-2032 | 2,000,000 | 2,311,480 | ||||||||||||
Michigan Finance Authority Local Government Loan Program Series H-1 | 5.00 | 10-1-2033 | 2,975,000 | 3,428,896 | ||||||||||||
Michigan Finance Authority Local Government Loan Program Series H-1 | 5.00 | 10-1-2034 | 6,615,000 | 7,611,682 | ||||||||||||
Michigan Finance Authority Local Government Loan Program Series H-1 | 5.00 | 10-1-2039 | 7,955,000 | 9,072,916 | ||||||||||||
Michigan Municipal Bond Authority Local Government Loan Program Series A (Ambac Insured) | 4.00 | 11-1-2021 | 80,000 | 80,009 | ||||||||||||
Michigan Municipal Bond Authority Local Government Loan Program Series B Group A (Ambac Insured) | 5.25 | 12-1-2023 | 920,000 | 921,362 | ||||||||||||
Michigan Municipal Bond Authority Local Government Loan Program Series C (Ambac Insured) | 4.75 | 5-1-2027 | 4,610,000 | 4,611,660 | ||||||||||||
| 59,250,002 | ||||||||||||||||
|
| |||||||||||||||
| Tax Revenue: 0.52% | ||||||||||||||||
Detroit MI Downtown Development Authority CAB ¤## | 0.00 | 7-1-2020 | 2,070,000 | 2,070,000 | ||||||||||||
Detroit MI Downtown Development Authority Tax Increment Revenue Refunding Bonds Catalyst Development Project Series A (AGM Insured) | 5.00 | 7-1-2021 | 400,000 | 417,020 | ||||||||||||
Michigan Finance Authority Local Government Loan Program Public Lighting Authority Refunding Bonds Series B | 5.00 | 7-1-2044 | �� | 16,845,000 | 17,738,627 | |||||||||||
Michigan Finance Authority Refunding Bond Local Government Loan Program Public Lighting Authority Series B | 5.00 | 7-1-2039 | 7,895,000 | 8,376,121 | ||||||||||||
| 28,601,768 | ||||||||||||||||
|
| |||||||||||||||
The accompanying notes are an integral part of these financial statements.
30 | Wells Fargo Municipal Bond Fund
Portfolio of investments—June 30, 2020
| Interest rate | Maturity date | Principal | Value | |||||||||||||
| Utilities Revenue: 0.09% | ||||||||||||||||
Michigan Strategic Fund Limited Obligation Detroit Edison Company Exempt Facilities Project | 1.45 | % | 8-1-2029 | $ | 3,500,000 | $ | 3,516,135 | |||||||||
Michigan Strategic Fund Limited Obligation Detroit Edison Company Exempt Facilities Project Series KT | 5.63 | 7-1-2020 | 1,200,000 | 1,200,000 | ||||||||||||
| 4,716,135 | ||||||||||||||||
|
| |||||||||||||||
| Water & Sewer Revenue: 1.22% | ||||||||||||||||
Great Lakes Michigan Water Authority Sewage Disposal System Series 2016-C | 5.00 | 7-1-2036 | 8,500,000 | 10,141,605 | ||||||||||||
Great Lakes Michigan Water Authority Water Supply System Series 2016-D | 4.00 | 7-1-2032 | 11,000,000 | 12,346,840 | ||||||||||||
Great Lakes Michigan Water Authority Water Supply System Series 2016-D (AGM Insured) | 4.00 | 7-1-2033 | 11,000,000 | 12,546,820 | ||||||||||||
Michigan Finance Authority Local Government Loan Program Detroit Refunding Bond Series D-4 | 5.00 | 7-1-2031 | 6,500,000 | 7,391,020 | ||||||||||||
Michigan Finance Authority Local Government Loan Program Detroit Refunding Bond Series D-6 (National Insured) | 5.00 | 7-1-2036 | 3,250,000 | 3,690,083 | ||||||||||||
Michigan Finance Authority Local Government Loan Program Series C (National Insured) | 5.00 | 7-1-2025 | 2,000,000 | 2,341,240 | ||||||||||||
Michigan Finance Authority Local Government Loan Program Series C (National Insured) | 5.00 | 7-1-2026 | 1,945,000 | 2,275,183 | ||||||||||||
Michigan Finance Authority Local Government Loan Program Series C (National Insured) | 5.00 | 7-1-2027 | 2,260,000 | 2,635,861 | ||||||||||||
Michigan Finance Authority Local Government Loan Program Series C (National Insured) | 5.00 | 7-1-2028 | 3,480,000 | 4,049,780 | ||||||||||||
Michigan Finance Authority Local Government Loan Program Series C (National Insured) | 5.00 | 7-1-2032 | 5,750,000 | 6,610,660 | ||||||||||||
Michigan Finance Authority Local Government Loan Program Series C | 5.00 | 7-1-2035 | 2,000,000 | 2,330,240 | ||||||||||||
Michigan Finance Authority Refunding Bond Local Government Loan Program Detroit Series D-6 (National Insured) | 5.00 | 7-1-2027 | 1,000,000 | 1,166,310 | ||||||||||||
| 67,525,642 | ||||||||||||||||
|
| |||||||||||||||
| 229,188,449 | ||||||||||||||||
|
| |||||||||||||||
Minnesota: 0.39% |
| |||||||||||||||
| GO Revenue: 0.01% | ||||||||||||||||
Shakopee MN Independent School District # 720 Capital Facilities (State School District Credit Program Insured) | 4.00 | 2-1-2030 | 225,000 | 262,103 | ||||||||||||
Shakopee MN Independent School District # 720 Capital Facilities (State School District Credit Program Insured) | 4.00 | 2-1-2032 | 240,000 | 275,294 | ||||||||||||
| 537,397 | ||||||||||||||||
|
| |||||||||||||||
| Health Revenue: 0.29% | ||||||||||||||||
Minneapolis MN Fairview Health Services Series 2018A | 4.00 | 11-15-2048 | 2,315,000 | 2,480,870 | ||||||||||||
Shakopee MN Senior Housing Revenue Benedictine Living Community LLC Project 144A | 5.85 | 11-1-2058 | 14,000,000 | 13,710,900 | ||||||||||||
| 16,191,770 | ||||||||||||||||
|
| |||||||||||||||
| Utilities Revenue: 0.09% | ||||||||||||||||
Rochester MN Electric Utility Revenue Refunding Bond Series A | 5.00 | 12-1-2042 | 3,895,000 | 4,664,301 | ||||||||||||
|
| |||||||||||||||
| 21,393,468 | ||||||||||||||||
|
| |||||||||||||||
Mississippi: 0.16% |
| |||||||||||||||
| Miscellaneous Revenue: 0.16% | ||||||||||||||||
Mississippi Development Bank Special Obligation Jackson Water & Sewer System Project Series A (AGM Insured) | 5.00 | 9-1-2030 | 8,155,000 | 8,817,023 | ||||||||||||
|
| |||||||||||||||
The accompanying notes are an integral part of these financial statements.
Wells Fargo Municipal Bond Fund | 31
Portfolio of investments—June 30, 2020
| Interest rate | Maturity date | Principal | Value | |||||||||||||
Missouri: 0.64% |
| |||||||||||||||
GO Revenue: 0.10% |
| |||||||||||||||
St. Louis MO Special Administrative Board of The St. Louis School District | 4.00 | % | 4-1-2030 | $ | 4,840,000 | $ | 5,668,366 | |||||||||
|
| |||||||||||||||
Miscellaneous Revenue: 0.46% |
| |||||||||||||||
Kansas City MO IDA | 5.00 | 3-1-2037 | 3,000,000 | 3,615,210 | ||||||||||||
Kansas City MO IDA Series B (AGM Insured) | 5.00 | 3-1-2049 | 18,075,000 | 21,498,224 | ||||||||||||
| 25,113,434 | ||||||||||||||||
|
| |||||||||||||||
Tax Revenue: 0.08% |
| |||||||||||||||
Blue Springs MO Special Obligation Tax Refunding & Improvement Bonds Adams Farm Project Series A | 4.00 | 6-1-2026 | 4,740,000 | 4,608,370 | ||||||||||||
|
| |||||||||||||||
| 35,390,170 | ||||||||||||||||
|
| |||||||||||||||
Nebraska: 0.73% |
| |||||||||||||||
Health Revenue: 0.02% |
| |||||||||||||||
Douglas County NE Hospital Authority Series 2 | 4.00 | 11-15-2040 | 1,150,000 | 1,308,148 | ||||||||||||
|
| |||||||||||||||
| Utilities Revenue: 0.71% | ||||||||||||||||
Central Plains Energy Project Nebraska Refunding Bond Project #3 | 5.00 | 9-1-2033 | 6,000,000 | 7,710,360 | ||||||||||||
Central Plains Energy Project Nebraska Refunding Bond Project #3 Series 2012 | 5.00 | 9-1-2042 | 1,265,000 | 1,353,297 | ||||||||||||
Central Plains Energy Project Nebraska Refunding Bond Project #3 Series 2012 | 5.25 | 9-1-2037 | 1,800,000 | 1,935,144 | ||||||||||||
Nebraska Central Plains Energy Gas Project #1 (Royal Bank of Canada LIQ) | 4.00 | 12-1-2049 | 4,860,000 | 5,516,489 | ||||||||||||
Nebraska Central Plains Energy Gas Project #3 | 5.00 | 9-1-2027 | 1,020,000 | 1,091,196 | ||||||||||||
Tender Option Bond Trust Receipts/Certificates Series 2016 XF1053 (Deutsche Bank LIQ) 144Aø | 0.26 | 2-1-2049 | 21,345,000 | 21,345,000 | ||||||||||||
| 38,951,486 | ||||||||||||||||
|
| |||||||||||||||
| 40,259,634 | ||||||||||||||||
|
| |||||||||||||||
| Nevada: 2.24% | ||||||||||||||||
| GO Revenue: 2.22% | ||||||||||||||||
Clark County NV Refunding Bond Limited Tax | 4.00 | 7-1-2032 | 6,000,000 | 6,969,240 | ||||||||||||
Clark County NV School District Series A (AGM Insured) | 5.00 | 6-15-2029 | 1,100,000 | 1,433,113 | ||||||||||||
Clark County NV School District Series A (AGM Insured) | 4.00 | 6-15-2035 | 9,585,000 | 10,836,897 | ||||||||||||
Clark County NV School District Series A (AGM Insured) | 4.00 | 6-15-2036 | 850,000 | 995,486 | ||||||||||||
Clark County NV School District Series A (AGM Insured) | 4.00 | 6-15-2037 | 900,000 | 1,050,192 | ||||||||||||
Clark County NV School District Series A (AGM Insured) | 4.00 | 6-15-2038 | 850,000 | 988,550 | ||||||||||||
Clark County NV School District Series A (AGM Insured) | 4.00 | 6-15-2039 | 1,000,000 | 1,159,460 | ||||||||||||
Clark County NV School District Series A (AGM Insured) | 5.00 | 6-15-2030 | 875,000 | 1,159,900 | ||||||||||||
Clark County NV School District Series A (AGM Insured) | 5.00 | 6-15-2032 | 900,000 | 1,175,625 | ||||||||||||
Clark County NV School District Series A (AGM Insured) | 5.00 | 6-15-2033 | 825,000 | 1,070,396 | ||||||||||||
Clark County NV School District Series A (AGM Insured) | 5.00 | 6-15-2034 | 950,000 | 1,228,664 | ||||||||||||
Clark County NV School District Series A (AGM Insured) | 5.00 | 6-15-2035 | 1,000,000 | 1,282,010 | ||||||||||||
Clark County NV Series A | 5.00 | 6-1-2043 | 9,360,000 | 11,377,922 | ||||||||||||
Clark County NV Series A | 5.00 | 5-1-2048 | 50,215,000 | 60,843,507 | ||||||||||||
Henderson NV Limited Tax Utillity System Series A-1 | 4.00 | 6-1-2045 | 9,140,000 | 10,662,998 | ||||||||||||
Henderson NV Series B-1 | 4.00 | 6-1-2039 | 4,060,000 | 4,825,026 | ||||||||||||
Henderson NV Series B-1 | 4.00 | 6-1-2040 | 3,340,000 | 3,958,167 | ||||||||||||
Las Vegas NV Series A | 4.00 | 2-1-2038 | 1,335,000 | 1,572,737 | ||||||||||||
| 122,589,890 | ||||||||||||||||
|
| |||||||||||||||
| Miscellaneous Revenue: 0.02% | ||||||||||||||||
Las Vegas NV Special Improvement District #60 Local Improvement | 5.00 | 6-1-2022 | 370,000 | 385,832 | ||||||||||||
Las Vegas NV Special Improvement District #60 Local Improvement | 5.00 | 6-1-2023 | 295,000 | 313,373 | ||||||||||||
The accompanying notes are an integral part of these financial statements.
32 | Wells Fargo Municipal Bond Fund
Portfolio of investments—June 30, 2020
| Interest rate | Maturity date | Principal | Value | |||||||||||||
| Miscellaneous Revenue (continued) | ||||||||||||||||
Las Vegas NV Special Improvement District #60 Local Improvement | 5.00 | % | 6-1-2024 | $ | 170,000 | $ | 183,442 | |||||||||
| 882,647 | ||||||||||||||||
|
| |||||||||||||||
| 123,472,537 | ||||||||||||||||
|
| |||||||||||||||
| New Hampshire: 0.13% | ||||||||||||||||
| Housing Revenue: 0.13% | ||||||||||||||||
New Hampshire National Finance Authority Municipal Certificates Series A | 4.13 | 1-20-2034 | 6,464,633 | 6,929,053 | ||||||||||||
|
| |||||||||||||||
| New Jersey: 3.48% | ||||||||||||||||
| Airport Revenue: 0.02% | ||||||||||||||||
South Jersey Port Corporation Marine Terminal Refunding Bond Series 2016S | 5.00 | 1-1-2039 | 1,350,000 | 1,447,160 | ||||||||||||
|
| |||||||||||||||
| Education Revenue: 0.19% | ||||||||||||||||
New Jersey Educational Facilities Authority Higher Education Facilities Trust Fund | 5.00 | 6-15-2025 | 5,830,000 | 6,371,316 | ||||||||||||
Rutgers NJ State University Series L | 5.00 | 5-1-2033 | 3,560,000 | 4,029,066 | ||||||||||||
| 10,400,382 | ||||||||||||||||
|
| |||||||||||||||
| GO Revenue: 0.37% | ||||||||||||||||
Bayonne NJ School Refunding Bonds (AGM Insured) | 5.00 | 7-15-2023 | 2,505,000 | 2,831,477 | ||||||||||||
Newark NJ Qualified General Improvement Series A | 5.00 | 7-15-2025 | 5,000,000 | 5,498,950 | ||||||||||||
Newark NJ Qualified General Improvement Series A | 5.00 | 7-15-2026 | 2,205,000 | 2,411,609 | ||||||||||||
Newark NJ Qualified General Improvement Series A | 5.00 | 7-15-2027 | 6,035,000 | 6,577,003 | ||||||||||||
Newark NJ Qualified General Improvement Series A | 5.25 | 7-15-2024 | 1,325,000 | 1,450,120 | ||||||||||||
Newark NJ Qualified General Improvement Series B | 5.00 | 7-15-2025 | 385,000 | 433,029 | ||||||||||||
Newark NJ Qualified General Improvement Series B | 5.00 | 7-15-2026 | 395,000 | 443,478 | ||||||||||||
Newark NJ Qualified General Improvement Series B | 5.00 | 7-15-2027 | 405,000 | 453,888 | ||||||||||||
Newark NJ Qualified General Improvement Series B | 5.25 | 7-15-2024 | 375,000 | 418,001 | ||||||||||||
| 20,517,555 | ||||||||||||||||
|
| |||||||||||||||
| Housing Revenue: 0.16% | ||||||||||||||||
New Jersey Housing & Mortgage Finance Agency Villa Victoria Apartments Project Series F | 2.43 | 11-1-2021 | 9,000,000 | 9,049,140 | ||||||||||||
|
| |||||||||||||||
| Industrial Development Revenue: 0.19% | ||||||||||||||||
New Jersey EDA | 5.00 | 3-1-2025 | 4,000,000 | 4,257,080 | ||||||||||||
New Jersey EDA Continental Airlines Incorporated Project | 5.25 | 9-15-2029 | 5,960,000 | 6,072,525 | ||||||||||||
| 10,329,605 | ||||||||||||||||
|
| |||||||||||||||
| Miscellaneous Revenue: 0.99% | ||||||||||||||||
New Jersey EDA Motor Vehicle Surcharge Revenue Refunding Bond Series A | 3.13 | 7-1-2029 | 4,275,000 | 4,255,848 | ||||||||||||
New Jersey EDA Revenue Prerefunded Refunding Bonds School Facilities | 5.00 | 3-1-2026 | 580,000 | 625,611 | ||||||||||||
New Jersey EDA Revenue Unrefunded Refunding Bonds School Facilities | 5.00 | 3-1-2026 | 3,645,000 | 3,786,207 | ||||||||||||
New Jersey EDA School Facilities Construction Refunding Bond Series NN | 5.00 | 3-1-2026 | 11,000,000 | 11,673,860 | ||||||||||||
New Jersey TTFA Series A (National Insured) | 5.75 | 6-15-2023 | 2,000,000 | 2,195,240 | ||||||||||||
New Jersey TTFA Series A (National Insured) | 5.75 | 6-15-2025 | 10,000,000 | 11,496,400 | ||||||||||||
Newark NJ Housing Authority Port Authority Port Newark Marine Terminal Rental Refunding Bond Newark Redevelopment Project (National Insured) | 5.25 | 1-1-2024 | 1,225,000 | 1,340,775 | ||||||||||||
Newark NJ Housing Authority Port Newark Marine Terminal Rental (National Insured) | 5.00 | 1-1-2032 | 7,620,000 | 8,787,613 | ||||||||||||
Union County NJ Utilities Authority Refunding AMT Covanta Union Series A | 5.25 | 12-1-2031 | 10,000,000 | 10,491,500 | ||||||||||||
| 54,653,054 | ||||||||||||||||
|
| |||||||||||||||
The accompanying notes are an integral part of these financial statements.
Wells Fargo Municipal Bond Fund | 33
Portfolio of investments—June 30, 2020
| Interest rate | Maturity date | Principal | Value | |||||||||||||
| Tax Revenue: 0.34% | ||||||||||||||||
New Jersey Garden State Preservation Trust Open & Farmland Series A (AGM Insured) | 5.75 | % | 11-1-2028 | $ | 15,000,000 | $ | 18,643,350 | |||||||||
|
| |||||||||||||||
| Transportation Revenue: 1.07% | ||||||||||||||||
New Jersey Transportation Trust | 5.00 | 6-15-2038 | 4,035,000 | 4,149,634 | ||||||||||||
New Jersey TTFA CAB Series A ¤ | 0.00 | 12-15-2028 | 10,100,000 | 7,615,905 | ||||||||||||
New Jersey TTFA CAB Series A ¤ | 0.00 | 12-15-2029 | 11,875,000 | 8,569,950 | ||||||||||||
New Jersey TTFA CAB Series A ¤ | 0.00 | 12-15-2030 | 8,000,000 | 5,508,560 | ||||||||||||
New Jersey TTFA CAB Series A ¤ | 0.00 | 12-15-2031 | 4,500,000 | 2,950,020 | ||||||||||||
New Jersey TTFA CAB Series A ¤ | 0.00 | 12-15-2026 | 1,150,000 | 938,412 | ||||||||||||
New Jersey TTFA Series A | 5.00 | 12-15-2036 | 1,500,000 | 1,675,245 | ||||||||||||
New Jersey TTFA Series A | 5.00 | 6-15-2042 | 1,505,000 | 1,543,528 | ||||||||||||
New Jersey TTFA Series AA | 5.00 | 6-15-2044 | 1,000,000 | 1,048,070 | ||||||||||||
New Jersey TTFA Series AA | 5.25 | 6-15-2033 | 10,000,000 | 10,563,700 | ||||||||||||
New Jersey TTFA Series B | 5.25 | 6-15-2036 | 5,575,000 | 5,670,890 | ||||||||||||
New Jersey TTFA Series C | 5.25 | 6-15-2032 | 8,000,000 | 8,696,240 | ||||||||||||
| 58,930,154 | ||||||||||||||||
|
| |||||||||||||||
| Water & Sewer Revenue: 0.15% | ||||||||||||||||
New Jersey EDA | 2.20 | 10-1-2039 | 8,000,000 | 8,278,560 | ||||||||||||
|
| |||||||||||||||
| 192,248,960 | ||||||||||||||||
|
| |||||||||||||||
| New Mexico: 0.12% | ||||||||||||||||
| Housing Revenue: 0.01% | ||||||||||||||||
New Mexico Mortgage Finance Authority Single-Family Mortgage Revenue Class I (GNMA/FNMA/FHLMC Insured) | 5.35 | 3-1-2030 | 370,000 | 372,220 | ||||||||||||
|
| |||||||||||||||
| Utilities Revenue: 0.11% | ||||||||||||||||
New Mexico Municipal Energy Acquisition Authority Gas Supply Revenue Refunding Bond Subordinated Series A (Royal Bank of Canada LIQ) | 5.00 | 11-1-2039 | 5,140,000 | 6,043,869 | ||||||||||||
|
| |||||||||||||||
| 6,416,089 | ||||||||||||||||
|
| |||||||||||||||
| New York: 8.82% | ||||||||||||||||
| Airport Revenue: 0.45% | ||||||||||||||||
Port Authority of New York & New Jersey Series 193 | 5.00 | 10-15-2028 | 1,760,000 | 2,069,971 | ||||||||||||
Port Authority of New York & New Jersey Series 205 | 5.25 | 11-15-2039 | 16,580,000 | 20,419,928 | ||||||||||||
Port Authority of New York & New Jersey Series 211 | 5.00 | 9-1-2048 | 2,000,000 | 2,426,220 | ||||||||||||
| 24,916,119 | ||||||||||||||||
|
| |||||||||||||||
| Education Revenue: 0.65% | ||||||||||||||||
Hempstead Town NY Local Development Corporation The Academy Charter School Project Series A %% | 5.73 | 2-1-2050 | 10,030,000 | 10,051,464 | ||||||||||||
Hempstead Town NY Local Development Corporation The Academy Charter School Project Series A | 7.65 | 2-1-2044 | 3,430,000 | 3,572,997 | ||||||||||||
Hempstead Town NY Local Development Corporation The Academy Charter School Project Series A | 8.25 | 2-1-2041 | 9,205,000 | 9,619,133 | ||||||||||||
New York Dormitory Authority Barnard College Series A | 4.00 | 7-1-2045 | 1,270,000 | 1,421,689 | ||||||||||||
New York Dormitory Authority Barnard College Series A | 4.00 | 7-1-2049 | 1,000,000 | 1,114,620 | ||||||||||||
New York Dormitory Authority New York University Series A | 5.00 | 7-1-2049 | 4,265,000 | 5,276,061 | ||||||||||||
Westchester County NY Local Development Pace University Series B | 2.50 | 5-1-2044 | 5,000,000 | 5,000,000 | ||||||||||||
| 36,055,964 | ||||||||||||||||
|
| |||||||||||||||
The accompanying notes are an integral part of these financial statements.
34 | Wells Fargo Municipal Bond Fund
Portfolio of investments—June 30, 2020
| Interest rate | Maturity date | Principal | Value | |||||||||||||
| GO Revenue: 0.42% | ||||||||||||||||
New York NY Series F-1 | 5.00 | % | 3-1-2032 | $ | 3,000,000 | $ | 3,303,780 | |||||||||
New York NY Series S-2 | 5.00 | 7-15-2041 | 13,805,000 | 15,952,782 | ||||||||||||
Suffolk County NY Series A | 5.00 | 3-19-2021 | 4,000,000 | 4,092,960 | ||||||||||||
| 23,349,522 | ||||||||||||||||
|
| |||||||||||||||
| Health Revenue: 0.13% | ||||||||||||||||
Nassau County NY Local Economic Catholic Health Services | 5.00 | 7-1-2021 | 7,000,000 | 7,260,750 | ||||||||||||
|
| |||||||||||||||
| Industrial Development Revenue: 0.12% | ||||||||||||||||
New York Liberty Development Corporation Refunding Bond | 2.80 | 9-15-2069 | 1,000,000 | 979,880 | ||||||||||||
New York Transportation Development Corporation Special Facilities | 5.00 | 1-1-2032 | 5,000,000 | 5,351,950 | ||||||||||||
| 6,331,830 | ||||||||||||||||
|
| |||||||||||||||
| Miscellaneous Revenue: 0.06% | ||||||||||||||||
New York Dormitory Authority Non-State Supported School Districts Bond Financing Program Series A (AGM Insured) | 5.00 | 10-1-2034 | 1,750,000 | 2,183,703 | ||||||||||||
New York Dormitory Authority Non-State Supported School Districts Bond Financing Program Series A (AGM Insured) | 5.00 | 10-1-2035 | 1,000,000 | 1,241,920 | ||||||||||||
| 3,425,623 | ||||||||||||||||
|
| |||||||||||||||
| Tax Revenue: 2.37% | ||||||||||||||||
New York Dormitory Authority Series A | 5.00 | 2-15-2034 | 3,790,000 | 4,582,754 | ||||||||||||
New York Dormitory Authority Series D | 4.00 | 2-15-2037 | 4,480,000 | 5,275,066 | ||||||||||||
New York Dormitory Authority State Personal Income Tax General Purpose Series D | 4.00 | 2-15-2047 | 14,000,000 | 16,072,840 | ||||||||||||
New York Dormitory Authority State Personal Income Tax Series B | 5.00 | 2-15-2045 | 7,330,000 | 8,411,615 | ||||||||||||
New York Dormitory Authority State Personal Income Tax Series D | 4.00 | 2-15-2038 | 5,000,000 | 5,862,950 | ||||||||||||
New York Dormitory Authority State Personal Income Tax Series E | 5.00 | 2-15-2044 | 10,000 | 12,057 | ||||||||||||
New York Dormitory Authority State Personal Income Tax Series E | 5.00 | 2-15-2044 | 9,590,000 | 11,018,910 | ||||||||||||
New York Dormitory Authority State Personal Income Tax Unrefunded Bonds General Purpose Series D | 5.00 | 3-15-2042 | 1,500,000 | 1,590,810 | ||||||||||||
New York NY Transitional Finance Authority Building Aid Revenue Fiscal 2019 Subordinate Bond Series S 3 A | 4.00 | 7-15-2038 | 4,500,000 | 5,124,465 | ||||||||||||
New York NY Transitional Finance Authority Building Aid Revenue Fiscal Year 2015 Series S1 | 5.00 | 7-15-2040 | 3,155,000 | 3,604,840 | ||||||||||||
New York NY Transitional Finance Authority Future Tax Secured Revenue Series A2 | 5.00 | 8-1-2037 | 12,140,000 | 14,833,138 | ||||||||||||
New York NY Transitional Finance Authority Future Tax Secured Revenue Series I | 5.00 | 5-1-2033 | 5,395,000 | 5,988,234 | ||||||||||||
New York NY Transitional Finance Authority Future Tax Secured Subordinate Bond Series A | 5.00 | 8-1-2031 | 17,075,000 | 19,780,363 | ||||||||||||
New York NY Transitional Finance Authority Revenue Adjusted Future Tax Secured Sub | 5.00 | 5-1-2038 | 5,000,000 | 6,293,750 | ||||||||||||
New York NY Transitional Future Tax Secured Subordinate Bond Series F1 | 5.00 | 5-1-2042 | 2,390,000 | 2,873,210 | ||||||||||||
New York Urban Development Corporation Personal Income Tax General Purpose | 4.00 | 3-15-2045 | 17,000,000 | 19,678,690 | ||||||||||||
| 131,003,692 | ||||||||||||||||
|
| |||||||||||||||
| Tobacco Revenue: 0.01% | ||||||||||||||||
Suffolk NY Tobacco Securitization Corporation Series B | 4.50 | 6-1-2026 | 520,000 | 533,416 | ||||||||||||
|
| |||||||||||||||
| Transportation Revenue: 1.98% | ||||||||||||||||
Metropolitan Transportation Authority Revenue Various Refunding Bonds Subordinated Series G3 (SIFMA Municipal Swap +0.43%) ± | 0.56 | 11-1-2031 | 15,000,000 | 13,676,400 | ||||||||||||
Metropolitan Transportation Authority BAN | 4.00 | 2-1-2022 | 1,670,000 | 1,711,550 | ||||||||||||
The accompanying notes are an integral part of these financial statements.
Wells Fargo Municipal Bond Fund | 35
Portfolio of investments—June 30, 2020
| Interest rate | Maturity date | Principal | Value | |||||||||||||
| Transportation Revenue (continued) | ||||||||||||||||
Metropolitan Transportation Authority Series A | 5.00 | % | 11-15-2030 | $ | 950,000 | $ | 995,771 | |||||||||
Metropolitan Transportation Authority Series D | 5.00 | 11-15-2029 | 20,000,000 | 20,979,400 | ||||||||||||
Metropolitan Transportation Authority Sub Series A-1 | 5.00 | 11-15-2048 | 7,300,000 | 8,012,699 | ||||||||||||
Metropolitan Transportation Authority Subordinate Bond Series D (1 Month LIBOR +0.65%) ± | 0.77 | 11-1-2035 | 26,815,000 | 26,148,111 | ||||||||||||
Niagara Falls NY Bridge Commission (National Insured) | 6.25 | 10-1-2021 | 7,230,000 | 7,748,030 | ||||||||||||
Tender Option Bond Trust Receipts/Certificates (Barclays Bank plc LOC, Barclays Bank plc LIQ) 144Aø | 0.17 | 11-15-2042 | 16,200,000 | 16,200,000 | ||||||||||||
Tender Option Bond Trust Receipts/Certificates (Morgan Stanley Bank | 0.38 | 1-1-2053 | 4,250,000 | 4,250,000 | ||||||||||||
Triborough Bridge & Tunnel Authority | 5.00 | 11-15-2049 | 7,750,000 | 9,709,820 | ||||||||||||
| 109,431,781 | ||||||||||||||||
|
| |||||||||||||||
| Utilities Revenue: 0.65% | ||||||||||||||||
New York Utility Debt Securitization Authority Restructuring Bonds | 5.00 | 12-15-2037 | 3,780,000 | 4,529,196 | ||||||||||||
New York Utility Debt Securitization Authority Restructuring Bonds | 5.00 | 12-15-2032 | 22,785,000 | 27,501,267 | ||||||||||||
New York Utility Debt Securitization Authority Restructuring Bonds | 5.00 | 12-15-2040 | 2,870,000 | 3,584,888 | ||||||||||||
| 35,615,351 | ||||||||||||||||
|
| |||||||||||||||
| Water & Sewer Revenue: 1.98% | ||||||||||||||||
New York Environmental Facilities Corporation Municipal Water Trust | 4.00 | 6-15-2049 | 5,000,000 | 5,831,750 | ||||||||||||
New York Environmental Facilities Corporation Municipal Water Trust | 5.00 | 6-15-2048 | 10,035,000 | 12,491,167 | ||||||||||||
New York NY Municipal Water Finance Authority 2nd General Resolution Series 2018 | 5.00 | 6-15-2048 | 5,000,000 | 6,135,900 | ||||||||||||
New York NY Municipal Water Finance Authority 2nd General Resolution Series AA | 5.00 | 6-15-2035 | 25,000,000 | 32,548,500 | ||||||||||||
New York NY Municipal Water Finance Authority 2nd General Resolution Series BB | 5.00 | 6-15-2044 | 30,265,000 | 31,963,169 | ||||||||||||
New York NY Municipal Water Finance Authority 2nd General Resolution Series BB | 5.00 | 6-15-2047 | 2,330,000 | 2,546,224 | ||||||||||||
New York NY Municipal Water Finance Authority Water & Sewer System Series DD | 5.00 | 6-15-2026 | 3,255,000 | 3,395,323 | ||||||||||||
New York NY Water Finance Authority Series DD | 5.25 | 6-15-2047 | 11,490,000 | 14,070,309 | ||||||||||||
| 108,982,342 | ||||||||||||||||
|
| |||||||||||||||
| 486,906,390 | ||||||||||||||||
|
| |||||||||||||||
| North Carolina: 1.21% | ||||||||||||||||
| Airport Revenue: 0.12% | ||||||||||||||||
Charlotte NC Airport Series A | 5.50 | 7-1-2034 | 2,500,000 | 2,508,725 | ||||||||||||
Raleigh Durham NC Airport Authority Refunding AMT Series A | 5.00 | 5-1-2035 | 3,400,000 | 4,253,570 | ||||||||||||
| 6,762,295 | ||||||||||||||||
|
| |||||||||||||||
| Education Revenue: 0.12% | ||||||||||||||||
North Carolina Capital Facilities Finance Agency Forest University Series 2016 | 5.00 | 1-1-2033 | 1,000,000 | 1,209,230 | ||||||||||||
North Carolina Capital Facilities Finance Agency Meredith College Series 2018 | 5.00 | 6-1-2038 | 500,000 | 543,680 | ||||||||||||
University of North Carolina at Ashville Series 2017 | 5.00 | 6-1-2042 | 625,000 | 710,794 | ||||||||||||
University of North Carolina at Greensboro Series 2014 | 5.00 | 4-1-2033 | 2,000,000 | 2,262,200 | ||||||||||||
University of North Carolina at Greensboro Series 2014 | 5.00 | 4-1-2039 | 1,620,000 | 1,814,562 | ||||||||||||
| 6,540,466 | ||||||||||||||||
|
| |||||||||||||||
| Health Revenue: 0.69% | ||||||||||||||||
Charlotte-Mecklenburg Hospital Authority Health Care Refunding Bonds Series 2018 | 5.00 | 1-15-2036 | 500,000 | 621,920 | ||||||||||||
The accompanying notes are an integral part of these financial statements.
36 | Wells Fargo Municipal Bond Fund
Portfolio of investments—June 30, 2020
| Interest rate | Maturity date | Principal | Value | |||||||||||||
| Health Revenue (continued) | ||||||||||||||||
Charlotte-Mecklenburg Hospital Authority Atrium Health Series B | 5.00 | % | 1-15-2048 | $ | 10,000,000 | $ | 10,729,300 | |||||||||
Charlotte-Mecklenburg Hospital Authority Atrium Health Series C | 5.00 | 1-15-2048 | 20,000,000 | 22,220,600 | ||||||||||||
North Carolina Medical Care Commission Deerfield Episcopal Retirement Community Project Series 2016 | 5.00 | 11-1-2031 | 1,500,000 | 1,713,540 | ||||||||||||
North Carolina Medical Care Commission Presbyterian Homes Project | 4.00 | 10-1-2031 | 1,500,000 | 1,579,575 | ||||||||||||
North Carolina Medical Care Commission Southeastern Regional Medical Center Series 2012 | 5.00 | 6-1-2026 | 385,000 | 410,787 | ||||||||||||
North Carolina Medical Care Commission Southeastern Regional Medical Center Series 2012 | 5.00 | 6-1-2032 | 500,000 | 526,410 | ||||||||||||
| 37,802,132 | ||||||||||||||||
|
| |||||||||||||||
| Housing Revenue: 0.04% | ||||||||||||||||
North Carolina Facilities Finance Agency The Arc of North Carolina Project Series 2017A (HUD Insured) | 5.00 | 10-1-2034 | 1,000,000 | 1,117,620 | ||||||||||||
North Carolina Facilities Finance Agency The NCA&T University Foundation LLC Project Series 2015A (AGC Insured) | 5.00 | 6-1-2027 | 1,000,000 | 1,185,350 | ||||||||||||
North Carolina HFA Series 2 | 4.25 | 1-1-2028 | 150,000 | 152,246 | ||||||||||||
| 2,455,216 | ||||||||||||||||
|
| |||||||||||||||
| Miscellaneous Revenue: 0.11% | ||||||||||||||||
Cabarrus County NC Limited Obligation Installment Financing Contract | 5.00 | 6-1-2031 | 500,000 | 625,715 | ||||||||||||
Charlotte NC Certificate of Participation Equipment Acquisition and Public Facilities Series A | 5.00 | 12-1-2026 | 1,160,000 | 1,235,748 | ||||||||||||
Charlotte NC Certificate of Participation Transit Projects Series C | 5.00 | 6-1-2030 | 1,000,000 | 1,129,070 | ||||||||||||
Henderson County NC Limited Obligation Series A | 5.00 | 10-1-2030 | 500,000 | 615,885 | ||||||||||||
Orange County NC Limited Obligation Series 2018 | 5.00 | 10-1-2032 | 215,000 | �� | 278,474 | |||||||||||
Orange County NC Limited Obligation Series 2018 | 5.00 | 10-1-2033 | 220,000 | 283,543 | ||||||||||||
Orange County NC Limited Obligation Series 2018 | 5.00 | 10-1-2034 | 65,000 | 83,525 | ||||||||||||
Raleigh NC Limited Obligation Series A | 5.00 | 10-1-2033 | 1,000,000 | 1,152,570 | ||||||||||||
Wilmington NC Limited Obligation Series A | 5.00 | 6-1-2030 | 400,000 | 491,196 | ||||||||||||
| 5,895,726 | ||||||||||||||||
|
| |||||||||||||||
| Transportation Revenue: 0.13% | ||||||||||||||||
North Carolina Department of Transportation I-77 Hot Lanes Project | 5.00 | 6-30-2028 | 1,275,000 | 1,369,949 | ||||||||||||
North Carolina Turnpike Authority Monroe Expressway Toll Revenue Bond Series 2016A | 5.00 | 7-1-2042 | 500,000 | 542,750 | ||||||||||||
North Carolina Turnpike Authority Triangle Expressway System (AGM Insured) | 5.00 | 1-1-2049 | 4,500,000 | 5,384,250 | ||||||||||||
| 7,296,949 | ||||||||||||||||
|
| |||||||||||||||
| 66,752,784 | ||||||||||||||||
|
| |||||||||||||||
| North Dakota: 0.28% | ||||||||||||||||
| Miscellaneous Revenue: 0.19% | ||||||||||||||||
University of North Dakota Infrastructure Energy Improvement Project Green Certificates Series A | 5.00 | 4-1-2057 | 9,000,000 | 10,491,300 | ||||||||||||
|
| |||||||||||||||
| Water & Sewer Revenue: 0.09% | ||||||||||||||||
North Dakota PFA Revolving Fund Program Series A | 5.00 | 10-1-2038 | 3,780,000 | 4,792,284 | ||||||||||||
|
| |||||||||||||||
| 15,283,584 | ||||||||||||||||
|
| |||||||||||||||
The accompanying notes are an integral part of these financial statements.
Wells Fargo Municipal Bond Fund | 37
Portfolio of investments—June 30, 2020
| Interest rate | Maturity date | Principal | Value | |||||||||||||
| Ohio: 2.49% | ||||||||||||||||
| Airport Revenue: 0.15% | ||||||||||||||||
Cleveland OH Airport System Revenue Series A | 5.00 | % | 1-1-2025 | $ | 4,015,000 | $ | 4,299,182 | |||||||||
Cleveland OH Airport System Revenue Series A (AGM Insured) | 5.00 | 1-1-2031 | 3,600,000 | 3,854,808 | ||||||||||||
| 8,153,990 | ||||||||||||||||
|
| |||||||||||||||
| GO Revenue: 0.03% | ||||||||||||||||
Highland OH Local School District Medina County School Improvement Series A | 5.25 | 12-1-2054 | 1,500,000 | 1,709,595 | ||||||||||||
|
| |||||||||||||||
| Health Revenue: 0.87% | ||||||||||||||||
Allen County OH Catholic Healthcare Series B | 5.25 | 9-1-2027 | 3,825,000 | 3,856,289 | ||||||||||||
Allen County OH Hospital Facilities Revenue Bonds Series B | 5.00 | 8-1-2047 | 5,000,000 | 5,363,050 | ||||||||||||
Cleveland Cuyahoga County OH Facilities Improvement Centers for Dialysis | 5.00 | 12-1-2047 | 5,205,000 | 5,765,526 | ||||||||||||
Franklin County OH Trinity Health Credit Group | 4.00 | 12-1-2044 | 3,450,000 | 3,883,355 | ||||||||||||
Hamilton County OH Hospital Facilties Revenue Bonds | 5.00 | 9-15-2045 | 7,500,000 | 8,962,425 | ||||||||||||
Lucas County OH Hospital Revenue Promedica Healthcare Obligation | �� | 5.25 | 11-15-2048 | 15,000,000 | 16,700,550 | |||||||||||
Montgomery County OH Hospital Revenue Refunding Bonds | 4.00 | 11-15-2039 | 3,000,000 | 3,157,920 | ||||||||||||
| 47,689,115 | ||||||||||||||||
|
| |||||||||||||||
| Housing Revenue: 0.06% | ||||||||||||||||
Ohio HFA MFHR Chadwick Place & Union Square Apartments | 1.60 | 1-1-2022 | 3,120,000 | 3,132,418 | ||||||||||||
|
| |||||||||||||||
| Miscellaneous Revenue: 0.78% | ||||||||||||||||
Ohio Private Activity Bond AMT Portsmouth Bypass Project (AGM Insured) | 5.00 | 12-31-2026 | 2,030,000 | 2,399,338 | ||||||||||||
Ohio Private Activity Bond AMT Portsmouth Bypass Project (AGM Insured) | 5.00 | 12-31-2028 | 1,610,000 | 1,892,668 | ||||||||||||
Ohio Private Activity Bond AMT Portsmouth Bypass Project (AGM Insured) | 5.00 | 12-31-2030 | 2,250,000 | 2,624,895 | ||||||||||||
Ohio Private Activity Bond AMT Portsmouth Bypass Project (AGM Insured) | 5.00 | 12-31-2035 | 12,000,000 | 13,732,080 | ||||||||||||
Ohio Private Activity Bond AMT Portsmouth Bypass Project (AGM Insured) | 5.00 | 12-31-2039 | 2,500,000 | 2,839,175 | ||||||||||||
Ohio Series A | 5.00 | 2-1-2036 | 4,265,000 | 5,122,819 | ||||||||||||
Ohio Water Development Authority Drinking Water Assistance Fund | 5.00 | 12-1-2035 | 5,390,000 | 6,627,275 | ||||||||||||
Ohio Water Development Authority Drinking Water Assistance Fund | 5.00 | 12-1-2036 | 2,000,000 | 2,452,200 | ||||||||||||
Ohio Water Development Authority Fresh Water Series B | 5.00 | 12-1-2034 | 1,895,000 | 2,337,880 | ||||||||||||
RiverSouth OH Lazarus Building Redevelopment Series A | 5.75 | 12-1-2027 | 3,150,000 | 3,153,812 | ||||||||||||
| 43,182,142 | ||||||||||||||||
|
| |||||||||||||||
| Tax Revenue: 0.11% | ||||||||||||||||
Franklin County OH | 5.00 | 6-1-2048 | 5,000,000 | 6,205,950 | ||||||||||||
|
| |||||||||||||||
| Transportation Revenue: 0.19% | ||||||||||||||||
Ohio Turnpike Commission CAB Series A-4 ¤ | 0.00 | 2-15-2034 | 8,500,000 | 10,255,760 | ||||||||||||
|
| |||||||||||||||
| Utilities Revenue: 0.21% | ||||||||||||||||
Lancaster OH Port Authority Gas Supply (Royal Bank of Canada LIQ) | 5.00 | 8-1-2049 | 10,000,000 | 11,669,100 | ||||||||||||
|
| |||||||||||||||
| Water & Sewer Revenue: 0.09% | ||||||||||||||||
Ohio Water Development Authority Loan Fund Series A | 5.00 | 12-1-2050 | 4,000,000 | 5,167,360 | ||||||||||||
|
| |||||||||||||||
| 137,165,430 | ||||||||||||||||
|
| |||||||||||||||
Oklahoma: 1.06% |
| |||||||||||||||
| Airport Revenue: 0.63% | ||||||||||||||||
Oklahoma City OK Airport Trust Series 33 | 5.00 | 7-1-2043 | 9,000,000 | 10,637,100 | ||||||||||||
Oklahoma City OK Airport Trust Series 33 | 5.00 | 7-1-2047 | 11,500,000 | 13,526,760 | ||||||||||||
Tulsa OK Airports Improvement Trust AMT Series A (BAM Insured) | 5.00 | 6-1-2035 | 1,055,000 | 1,182,855 | ||||||||||||
Tulsa OK Airports Improvement Trust Series A (AGM Insured) | 5.00 | 6-1-2043 | 4,485,000 | 5,248,168 | ||||||||||||
The accompanying notes are an integral part of these financial statements.
38 | Wells Fargo Municipal Bond Fund
Portfolio of investments—June 30, 2020
| Interest rate | Maturity date | Principal | Value | |||||||||||||
| Airport Revenue (continued) | ||||||||||||||||
Tulsa OK Airports Improvement Trust Series A (AGM Insured) | 5.25 | % | 6-1-2048 | $ | 3,770,000 | $ | 4,451,955 | |||||||||
| 35,046,838 | ||||||||||||||||
|
| |||||||||||||||
| Miscellaneous Revenue: 0.37% | ||||||||||||||||
Garfield County OK Educational Facilities Authority Enid Public Schools Project Series A | 5.00 | 9-1-2030 | 2,000,000 | 2,445,140 | ||||||||||||
Garfield County OK Educational Facilities Authority Enid Public Schools Project Series A | 5.00 | 9-1-2031 | 1,145,000 | 1,394,186 | ||||||||||||
Muskogee OK Industrial Trust Educational Facilities | 4.00 | 9-1-2030 | 4,440,000 | 5,274,853 | ||||||||||||
Muskogee OK Industrial Trust Educational Facilities | 4.00 | 9-1-2032 | 4,000,000 | 4,645,520 | ||||||||||||
Muskogee OK Industrial Trust Educational Facilities Lease Muskogee Public Schools Project | 4.00 | 9-1-2031 | 5,520,000 | 6,489,257 | ||||||||||||
| 20,248,956 | ||||||||||||||||
|
| |||||||||||||||
| Transportation Revenue: 0.02% | ||||||||||||||||
Oklahoma Turnpike Authority Revenue Series A | 5.00 | 1-1-2042 | 1,000,000 | 1,177,260 | ||||||||||||
|
| |||||||||||||||
| Water & Sewer Revenue: 0.04% | ||||||||||||||||
McGee Creek Authority Oklahoma Water Revenue (National Insured) | 6.00 | 1-1-2023 | 1,820,000 | 1,959,139 | ||||||||||||
|
| |||||||||||||||
| 58,432,193 | ||||||||||||||||
|
| |||||||||||||||
| Oregon: 0.25% | ||||||||||||||||
| GO Revenue: 0.17% | ||||||||||||||||
Jackson County OR School District #005 (AGM Insured) | 5.00 | 6-15-2030 | 2,560,000 | 3,429,350 | ||||||||||||
Jackson County OR School District #005 (AGM Insured) | 5.00 | 6-15-2031 | 2,125,000 | 2,812,140 | ||||||||||||
Jackson County OR School District #005 (AGM Insured) | 5.00 | 6-15-2032 | 2,350,000 | 3,094,081 | ||||||||||||
| 9,335,571 | ||||||||||||||||
|
| |||||||||||||||
| Health Revenue: 0.04% | ||||||||||||||||
Clackamas County OR Hospital Facility Authority Senior Living Rose Ville Series A | 5.13 | 11-15-2040 | 500,000 | 509,645 | ||||||||||||
Clackamas County OR Hospital Facility Authority Senior Living Rose Ville Series A | 5.25 | 11-15-2050 | 500,000 | 505,140 | ||||||||||||
Clackamas County OR Hospital Facility Authority Senior Living Rose Ville Series A | 5.38 | 11-15-2055 | 1,000,000 | 1,011,750 | ||||||||||||
| 2,026,535 | ||||||||||||||||
|
| |||||||||||||||
| Utilities Revenue: 0.04% | ||||||||||||||||
Eugene OR Electric Utility Revenue Series A | 4.00 | 8-1-2045 | 1,260,000 | 1,489,030 | ||||||||||||
Eugene OR Electric Utility Revenue Series A | 4.00 | 8-1-2049 | 800,000 | 940,872 | ||||||||||||
| 2,429,902 | ||||||||||||||||
|
| |||||||||||||||
| 13,792,008 | ||||||||||||||||
|
| |||||||||||||||
Pennsylvania: 5.20% |
| |||||||||||||||
| Airport Revenue: 0.54% | ||||||||||||||||
Philadelphia PA Airport Series A | 5.00 | 6-15-2027 | 8,200,000 | 8,487,902 | ||||||||||||
Philadelphia PA Airport Series A | 5.00 | 7-1-2047 | 9,950,000 | 11,318,722 | ||||||||||||
Philadelphia PA Airport Series B | 5.00 | 7-1-2042 | 7,000,000 | 8,014,790 | ||||||||||||
Philadelphia PA Airport Series B | 5.00 | 7-1-2029 | 1,000,000 | 1,197,620 | ||||||||||||
Philadelphia PA Airport Series B | 5.00 | 7-1-2031 | 750,000 | 887,835 | ||||||||||||
| 29,906,869 | ||||||||||||||||
|
| |||||||||||||||
The accompanying notes are an integral part of these financial statements.
Wells Fargo Municipal Bond Fund | 39
Portfolio of investments—June 30, 2020
| Interest rate | Maturity date | Principal | Value | |||||||||||||
| Education Revenue: 0.15% | ||||||||||||||||
East Hempfield Township PA IDA Student Services Incorporated Student Housing Project of Millersville University | 5.00 | % | 7-1-2029 | $ | 500,000 | $ | 506,680 | |||||||||
Montgomery County PA Higher Education & Health Authority Arcadia University | 5.00 | 4-1-2024 | 1,540,000 | 1,643,811 | ||||||||||||
Montgomery County PA Higher Education & Health Authority Arcadia University | 5.00 | 4-1-2025 | 1,625,000 | 1,754,285 | ||||||||||||
Pennsylvania HEFAR Indiana University Student Housing Project Series A | 5.00 | 7-1-2032 | 1,000,000 | 1,088,480 | ||||||||||||
Philadelphia PA IDA 1st Philadelphia Preparatory Charter School Project Series A | 7.00 | 6-15-2033 | 2,000,000 | 2,239,800 | ||||||||||||
Philadelphia PA IDA New Foundations Charter School Project | 6.00 | 12-15-2027 | 275,000 | 306,944 | ||||||||||||
Philadelphia PA IDA University Revenue Refunding Bond St. Joesph’s University Project %% | 4.00 | 11-1-2038 | 1,000,000 | 1,092,520 | ||||||||||||
| 8,632,520 | ||||||||||||||||
|
| |||||||||||||||
| GO Revenue: 0.49% | ||||||||||||||||
Allegheny County PA West Mifflin Area School District (AGM Insured) | 5.00 | 4-1-2025 | 1,180,000 | 1,398,335 | ||||||||||||
Allegheny County PA West Mifflin Area School District (AGM Insured) | 5.00 | 4-1-2026 | 1,200,000 | 1,458,624 | ||||||||||||
Allegheny County PA West Mifflin Area School District (AGM Insured) | 5.00 | 4-1-2027 | 1,000,000 | 1,230,120 | ||||||||||||
North Pocono PA School District Notes Series A (AGM Insured) %% | 4.00 | 9-15-2029 | 2,170,000 | 2,541,634 | ||||||||||||
North Pocono PA School District Notes Series A (AGM Insured) %% | 4.00 | 9-15-2032 | 1,750,000 | 2,012,133 | ||||||||||||
Philadelphia PA School District Series A | 5.00 | 9-1-2024 | 2,075,000 | 2,411,441 | ||||||||||||
Philadelphia PA School District Series D | 5.00 | 9-1-2021 | 5,000,000 | 5,238,550 | ||||||||||||
Philadelphia PA School District Series F | 5.00 | 9-1-2035 | 3,820,000 | 4,531,933 | ||||||||||||
Williamsport PA Area School District (AGM Insured) | 4.00 | 3-1-2032 | 1,440,000 | 1,596,341 | ||||||||||||
Williamsport PA Area School District (AGM Insured) | 4.00 | 3-1-2033 | 1,490,000 | 1,644,915 | ||||||||||||
Williamsport PA Area School District (AGM Insured) | 4.00 | 3-1-2034 | 1,555,000 | 1,713,890 | ||||||||||||
Williamsport PA Area School District (AGM Insured) | 4.00 | 3-1-2035 | 1,205,000 | 1,327,030 | ||||||||||||
| 27,104,946 | ||||||||||||||||
|
| |||||||||||||||
| Health Revenue: 0.97% | ||||||||||||||||
Allegheny County PA Hospital Development Authority Series A | 4.00 | 7-15-2039 | 2,250,000 | 2,513,835 | ||||||||||||
Allegheny County PA Hospital Development Authority University of Pittsburgh Medical Center Series A | 5.00 | 7-15-2025 | 5,900,000 | 6,964,537 | ||||||||||||
Berks County PA Municipal Authority | 5.00 | 11-1-2044 | 2,065,000 | 2,108,220 | ||||||||||||
Chester County PA HEFA Main Line Health System Series A | 4.00 | 9-1-2050 | 3,500,000 | 3,980,725 | ||||||||||||
Geisinger PA Health System Series A-1 | 4.00 | 2-15-2047 | 10,000,000 | 10,892,400 | ||||||||||||
Geisinger PA Health System Series A-1 | 4.00 | 4-1-2050 | 8,000,000 | 8,916,320 | ||||||||||||
Montgomery County PA HEFA Thomas Jefferson University | 4.00 | 9-1-2035 | 2,750,000 | 3,047,440 | ||||||||||||
Montgomery County PA HEFA Thomas Jefferson University | 4.00 | 9-1-2038 | 1,000,000 | 1,096,560 | ||||||||||||
Montgomery County PA HEFA Thomas Jefferson University | 5.00 | 9-1-2031 | 4,100,000 | 5,139,678 | ||||||||||||
Pennsylvania EDFA Series A-1 | 4.00 | 4-15-2045 | 6,500,000 | 7,143,760 | ||||||||||||
Quakertown PA General Authority Health LifeQuest Obligated Group Series C | 4.50 | 7-1-2027 | 750,000 | 683,670 | ||||||||||||
Quakertown PA General Authority Health LifeQuest Obligated Group Series C | 5.00 | 7-1-2032 | 1,000,000 | 887,060 | ||||||||||||
| 53,374,205 | ||||||||||||||||
|
| |||||||||||||||
| Industrial Development Revenue: 0.34% | ||||||||||||||||
Pennsylvania EDFA Bridges Finco LP | 5.00 | 12-31-2030 | 600,000 | 674,304 | ||||||||||||
Pennsylvania EDFA Bridges Finco LP | 5.00 | 12-31-2034 | 16,375,000 | 17,977,785 | ||||||||||||
| 18,652,089 | ||||||||||||||||
|
| |||||||||||||||
| Miscellaneous Revenue: 1.52% | ||||||||||||||||
Delaware Valley PA Regional Finance Authority Local Government Public Improvements Project | 5.75 | 7-1-2032 | 8,635,000 | 12,238,126 | ||||||||||||
Delaware Valley PA Regional Finance Authority Local Government Series A (Ambac Insured) | 5.50 | 8-1-2028 | 22,830,000 | 29,527,181 | ||||||||||||
The accompanying notes are an integral part of these financial statements.
40 | Wells Fargo Municipal Bond Fund
Portfolio of investments—June 30, 2020
| Interest rate | Maturity date | Principal | Value | |||||||||||||
| Miscellaneous Revenue (continued) | ||||||||||||||||
Delaware Valley PA Regional Finance Authority Local Government Series C (Ambac Insured) | 7.75 | % | 7-1-2027 | $ | 4,025,000 | $ | 5,429,162 | |||||||||
Pennsylvania Finance Authority Pennsylvania Hills Project Series B (National Insured) ¤ | 0.00 | 12-1-2025 | 1,110,000 | 1,022,332 | ||||||||||||
Pennsylvania Public School Building Authority Philadelphia School District Project | 5.00 | 4-1-2024 | 3,960,000 | 4,271,771 | ||||||||||||
State Public School Building Authority Pennsylvania Philadelphia School District Project | 5.00 | 4-1-2022 | 2,635,000 | 2,822,296 | ||||||||||||
State Public School Building Authority Pennsylvania Philadelphia School District Project Series A | 5.00 | 6-1-2034 | 1,915,000 | 2,276,609 | ||||||||||||
State Public School Building Authority Pennsylvania Philadelphia School District Project Series A | 5.00 | 6-1-2024 | 2,250,000 | 2,588,018 | ||||||||||||
State Public School Building Authority Pennsylvania Philadelphia School District Project Series A | 5.00 | 6-1-2035 | 16,715,000 | 19,904,556 | ||||||||||||
Waverly Township Municipal Authority Career Technology Center (BAM Insured) | 4.00 | 2-15-2030 | 1,065,000 | 1,237,360 | ||||||||||||
Waverly Township Municipal Authority Career Technology Center (BAM Insured) | 4.00 | 2-15-2031 | 1,110,000 | 1,282,272 | ||||||||||||
Waverly Township Municipal Authority Career Technology Center (BAM Insured) | 4.00 | 2-15-2032 | 1,155,000 | 1,325,640 | ||||||||||||
| 83,925,323 | ||||||||||||||||
|
| |||||||||||||||
| Resource Recovery Revenue: 0.06% | ||||||||||||||||
Pennsylvania EDFA Solid Waste Disposal Republic Services Incoporated Project Series A ø | 1.95 | 4-1-2034 | 3,500,000 | 3,500,595 | ||||||||||||
|
| |||||||||||||||
| Tax Revenue: 0.13% | ||||||||||||||||
Pennsylvania State Turnpike Commission | 5.00 | 12-1-2043 | 6,000,000 | 7,129,980 | ||||||||||||
|
| |||||||||||||||
| Transportation Revenue: 0.72% | ||||||||||||||||
Lancaster PA Parking Authority Guaranteed Series A (BAM Insured) | 4.00 | 9-1-2044 | 2,000,000 | 2,219,380 | ||||||||||||
Pennsylvania Turnpike Commission Motor License Series B-1 | 5.00 | 12-1-2040 | 12,410,000 | 12,653,732 | ||||||||||||
Pennsylvania Turnpike Commission Motor License Series B-2 | 5.00 | 12-1-2035 | 9,900,000 | 11,970,288 | ||||||||||||
Pennsylvania Turnpike Commission Series A-1 | 5.00 | 12-1-2047 | 1,750,000 | 2,035,705 | ||||||||||||
Pennsylvania Turnpike Commission Subordinate Bond Series B-1 | 5.00 | 6-1-2027 | 1,150,000 | 1,400,459 | ||||||||||||
Pennsylvania Turnpike Commission Subordinate Bond Series B-1 | 5.00 | 6-1-2028 | 1,450,000 | 1,749,976 | ||||||||||||
Pennsylvania Turnpike Commission Subordinate Bond Series B-2 | 5.00 | 6-1-2027 | 1,260,000 | 1,534,415 | ||||||||||||
Pennsylvania Turnpike Commission Subordinate Bond Series B-2 | 5.00 | 6-1-2028 | 5,005,000 | 6,040,434 | ||||||||||||
| 39,604,389 | ||||||||||||||||
|
| |||||||||||||||
| Water & Sewer Revenue: 0.28% | ||||||||||||||||
Luzerne County PA IDA Revenue Refunding Bond AMT Pennsylvania American Water Company Project | 2.45 | 12-1-2039 | 5,500,000 | 5,951,275 | ||||||||||||
Philadelphia PA Series B | 5.00 | 7-1-2033 | 8,000,000 | 9,417,920 | ||||||||||||
| 15,369,195 | ||||||||||||||||
|
| |||||||||||||||
| 287,200,111 | ||||||||||||||||
|
| |||||||||||||||
Puerto Rico: 0.07% |
| |||||||||||||||
| Transportation Revenue: 0.07% | ||||||||||||||||
Puerto Rico Highway & Transportation Authority Series AA (National Insured) | 5.50 | 7-1-2020 | 3,015,000 | 3,015,000 | ||||||||||||
Puerto Rico Highway & Transportation Authority Series CC (AGM Insured) | 5.50 | 7-1-2029 | 825,000 | 911,427 | ||||||||||||
| 3,926,427 | ||||||||||||||||
|
| |||||||||||||||
Rhode Island: 0.04% |
| |||||||||||||||
| Airport Revenue: 0.04% | ||||||||||||||||
Rhode Island Commerce Corporation First Lien Special Facility Airport Corporation Intermodal Facility Project Series 2018 | 5.00 | 7-1-2031 | 2,115,000 | 2,321,297 | ||||||||||||
|
| |||||||||||||||
The accompanying notes are an integral part of these financial statements.
Wells Fargo Municipal Bond Fund | 41
Portfolio of investments—June 30, 2020
| Interest rate | Maturity date | Principal | Value | |||||||||||||
South Carolina: 0.68% |
| |||||||||||||||
| Education Revenue: 0.21% | ||||||||||||||||
South Carolina Education Assistance Authority Student Loan Series I | 5.10 | % | 10-1-2029 | $ | 760,000 | $ | 760,448 | |||||||||
South Carolina Jobs EDA York Preparatory Academy Project Series A | 7.25 | 11-1-2045 | 1,500,000 | 1,626,780 | ||||||||||||
University of South Carolina Athletic Facilities Series A | 5.00 | 5-1-2043 | 8,155,000 | 9,386,650 | ||||||||||||
| 11,773,878 | ||||||||||||||||
|
| |||||||||||||||
Resource Recovery Revenue: 0.08% |
| |||||||||||||||
South Carolina Jobs EDA | 8.00 | 12-6-2029 | 370,000 | 350,808 | ||||||||||||
South Carolina Jobs EDA Solid Waste Disposal AMT RePower South Berkeley LLC Project Green Bond 144A | 6.00 | 2-1-2035 | 1,880,000 | 1,573,861 | ||||||||||||
South Carolina Jobs EDA Solid Waste Disposal AMT RePower South Berkeley LLC Project Green Bond 144A | 6.25 | 2-1-2045 | 2,750,000 | 2,198,763 | ||||||||||||
| 4,123,432 | ||||||||||||||||
|
| |||||||||||||||
| Utilities Revenue: 0.18% | ||||||||||||||||
Patriots Energy Group Financing Agency South Carolina Series A (Royal Bank of Canada LIQ) | 4.00 | 10-1-2048 | 9,040,000 | 9,929,626 | ||||||||||||
|
| |||||||||||||||
| Water & Sewer Revenue: 0.21% | ||||||||||||||||
Columbia SC Waterworks & Sewer System | 5.00 | 2-1-2043 | 10,380,000 | 11,630,271 | ||||||||||||
|
| |||||||||||||||
| 37,457,207 | ||||||||||||||||
|
| |||||||||||||||
South Dakota: 0.40% |
| |||||||||||||||
| Health Revenue: 0.26% | ||||||||||||||||
South Dakota HEFA Sanford Health Project Series E | 5.00 | 11-1-2042 | 13,465,000 | 14,310,063 | ||||||||||||
|
| |||||||||||||||
| Housing Revenue: 0.14% | ||||||||||||||||
South Dakota Board of Regents Housing & Auxiliary Facilities System | 5.00 | 4-1-2023 | 750,000 | 829,718 | ||||||||||||
South Dakota Board of Regents Housing & Auxiliary Facilities System | 5.00 | 4-1-2024 | 1,100,000 | 1,253,285 | ||||||||||||
South Dakota Board of Regents Housing & Auxiliary Facilities System | 5.00 | 4-1-2025 | 1,000,000 | 1,168,320 | ||||||||||||
South Dakota Board of Regents Housing & Auxiliary Facilities System | 5.00 | 4-1-2026 | 1,540,000 | 1,840,623 | ||||||||||||
South Dakota Board of Regents Housing & Auxiliary Facilities System | 5.00 | 4-1-2032 | 1,010,000 | 1,212,687 | ||||||||||||
South Dakota Board of Regents Housing & Auxiliary Facilities System | 5.00 | 4-1-2033 | 1,250,000 | 1,492,838 | ||||||||||||
| 7,797,471 | ||||||||||||||||
|
| |||||||||||||||
| 22,107,534 | ||||||||||||||||
|
| |||||||||||||||
Tennessee: 0.92% |
| |||||||||||||||
Utilities Revenue: 0.92% |
| |||||||||||||||
Tennessee Energy Acquisition Corporation Gas Project | 4.00 | 11-1-2049 | 20,000,000 | 22,645,000 | ||||||||||||
Tennessee Energy Acquisition Corporation Series A | 4.00 | 5-1-2048 | 24,155,000 | 25,998,993 | ||||||||||||
Tennessee Energy Acquisition Corporation Series A | 5.25 | 9-1-2026 | 1,020,000 | 1,204,671 | ||||||||||||
Tennessee Energy Acquisition Corporation Series C | 5.00 | 2-1-2021 | 1,000,000 | 1,019,380 | ||||||||||||
| 50,868,044 | ||||||||||||||||
|
| |||||||||||||||
Texas: 9.78% |
| |||||||||||||||
| Airport Revenue: 1.02% | ||||||||||||||||
Austin TX Airport System AMT | 5.00 | 11-15-2039 | 8,000,000 | 8,895,200 | ||||||||||||
Austin TX Airport System AMT | 5.00 | 11-15-2044 | 3,500,000 | 3,867,115 | ||||||||||||
Dallas-Fort Worth TX International Airport AMT Series D | 5.00 | 11-1-2038 | 13,250,000 | 13,791,395 | ||||||||||||
Dallas-Fort Worth TX International Airport Series H | 5.00 | 11-1-2042 | 20,765,000 | 21,596,638 | ||||||||||||
Houston TX Airport System Subordinate Bond Lien AMT | 5.00 | 7-15-2027 | 2,500,000 | 2,600,625 | ||||||||||||
The accompanying notes are an integral part of these financial statements.
42 | Wells Fargo Municipal Bond Fund
Portfolio of investments—June 30, 2020
| Interest rate | Maturity date | Principal | Value | |||||||||||||
| Airport Revenue (continued) | ||||||||||||||||
Houston TX Airport System Subordinate Bond Lien AMT Series A | 5.00 | % | 7-1-2041 | $ | 4,750,000 | $ | 5,635,258 | |||||||||
| 56,386,231 | ||||||||||||||||
|
| |||||||||||||||
| Education Revenue: 0.41% | ||||||||||||||||
Clifton TX Higher Education Finance Corporation International Leadership Series A | 5.75 | 8-15-2038 | 2,000,000 | 2,196,380 | ||||||||||||
Clifton TX Higher Education Finance Corporation International Leadership Texas Series D | 6.00 | 8-15-2038 | 6,000,000 | 6,658,620 | ||||||||||||
Clifton TX Higher Education Finance Corporation International Leadership Texas Series D | 6.13 | 8-15-2048 | 6,750,000 | 7,443,833 | ||||||||||||
Newark TX Higher Education Finance Corporation Austin Achieve Public Schools Incorporated | 5.00 | 6-15-2048 | 750,000 | 760,178 | ||||||||||||
Southwest Texas Higher Education Authority Incorporated Southern Methodist University Project | 5.00 | 10-1-2030 | 1,460,000 | 1,823,861 | ||||||||||||
Southwest Texas Higher Education Authority Incorporated Southern Methodist University Project | 5.00 | 10-1-2032 | 650,000 | 802,887 | ||||||||||||
Southwest Texas Higher Education Authority Incorporated Southern Methodist University Project | 5.00 | 10-1-2039 | 750,000 | 906,893 | ||||||||||||
Southwest Texas Higher Education Authority Incorporated Southern Methodist University Project | 5.00 | 10-1-2040 | 1,000,000 | 1,206,530 | ||||||||||||
Southwest Texas Higher Education Authority Incorporated Southern Methodist University Project | 5.00 | 10-1-2041 | 900,000 | 1,083,321 | ||||||||||||
| 22,882,503 | ||||||||||||||||
|
| |||||||||||||||
| GO Revenue: 2.18% | ||||||||||||||||
El Paso TX | 4.00 | 8-15-2031 | 6,500,000 | 7,529,535 | ||||||||||||
Houston TX Public Improvement Refunding Bonds Series A | 4.00 | 3-1-2034 | 1,000,000 | 1,167,540 | ||||||||||||
Houston TX Public Improvement Refunding Bonds Series A | 5.00 | 3-1-2029 | 2,160,000 | 2,696,436 | ||||||||||||
Lewisville TX Independent School District Unlimited Tax Refunding Bonds Series A | 5.00 | 8-15-2022 | 2,640,000 | 2,902,073 | ||||||||||||
Lone Star College System Texas Refunding Bonds Limited Tax | 5.00 | 2-15-2028 | 4,055,000 | 4,978,445 | ||||||||||||
Nacogdoches TX Independent School District | 5.00 | 2-15-2049 | 8,560,000 | 10,387,389 | ||||||||||||
Port Isabel TX 144A | 5.10 | 2-15-2049 | 1,000,000 | 1,108,810 | ||||||||||||
Royse City TX Independent School District | 5.00 | 8-15-2034 | 3,025,000 | 3,624,253 | ||||||||||||
Salado TX Independent School District | 5.00 | 2-15-2049 | 1,605,000 | 1,959,063 | ||||||||||||
San Antonio TX Independent School District | 5.00 | 8-15-2048 | 13,000,000 | 15,276,950 | ||||||||||||
Sugar Land TX Refunding Bonds | 5.00 | 2-15-2030 | 1,250,000 | 1,566,350 | ||||||||||||
Temple TX | 5.00 | 8-1-2032 | 1,070,000 | 1,288,355 | ||||||||||||
Texas Refunding Bond Series B | 5.00 | 10-1-2036 | 24,500,000 | 29,310,575 | ||||||||||||
Travis County TX | 5.00 | 3-1-2036 | 12,470,000 | 16,120,468 | ||||||||||||
Travis County TX | 5.00 | 3-1-2039 | 6,250,000 | 7,999,875 | ||||||||||||
Viridian TX Municipal Management District Texas Road Improvement Project (BAM Insured) | 4.00 | 12-1-2033 | 555,000 | 603,940 | ||||||||||||
Viridian TX Municipal Management District Texas Road Improvement Project (BAM Insured) | 4.00 | 12-1-2034 | 630,000 | 682,769 | ||||||||||||
Viridian TX Municipal Management District Texas Road Improvement Project (BAM Insured) | 4.00 | 12-1-2034 | 835,000 | 904,940 | ||||||||||||
Viridian TX Municipal Management District Texas Road Improvement Project (BAM Insured) | 4.00 | 12-1-2035 | 655,000 | 706,987 | ||||||||||||
Viridian TX Municipal Management District Texas Road Improvement Project (BAM Insured) | 4.00 | 12-1-2035 | 865,000 | 933,655 | ||||||||||||
Viridian TX Municipal Management District Texas Road Improvement Project (BAM Insured) | 4.00 | 12-1-2036 | 680,000 | 731,292 | ||||||||||||
Viridian TX Municipal Management District Texas Road Improvement Project (BAM Insured) | 4.00 | 12-1-2036 | 905,000 | 973,264 | ||||||||||||
The accompanying notes are an integral part of these financial statements.
Wells Fargo Municipal Bond Fund | 43
Portfolio of investments—June 30, 2020
| Interest rate | Maturity date | Principal | Value | |||||||||||||
| GO Revenue (continued) | ||||||||||||||||
Williamson County TX | 4.00 | % | 2-15-2031 | $ | 6,195,000 | $ | 6,721,575 | |||||||||
| 120,174,539 | ||||||||||||||||
|
| |||||||||||||||
| Health Revenue: 0.16% | ||||||||||||||||
Harris County TX Texas Childrens Hospital Series A | 4.00 | 10-1-2037 | 3,000,000 | 3,525,780 | ||||||||||||
Harris County TX Texas Childrens Hospital Series A | 4.00 | 10-1-2038 | 2,300,000 | 2,694,841 | ||||||||||||
New Hope ECFA Children’s Health System of Texas Project Series A | 4.00 | 8-15-2033 | 2,050,000 | 2,354,323 | ||||||||||||
| 8,574,944 | ||||||||||||||||
|
| |||||||||||||||
| Housing Revenue: 0.31% | ||||||||||||||||
Alamito TX Public Facility Corporation Cramer Three Apartments Project | 2.50 | 11-1-2021 | 7,000,000 | 7,095,130 | ||||||||||||
Austin TX Affordable Public Facility Corporation Incorporated Commons at Goodnight Apartments | 1.85 | 1-1-2021 | 10,000,000 | 10,000,000 | ||||||||||||
| 17,095,130 | ||||||||||||||||
|
| |||||||||||||||
| Industrial Development Revenue: 0.03% | ||||||||||||||||
Houston TX Airport System Revenue AMT Series B2 | 5.00 | 7-15-2020 | 1,610,000 | 1,612,640 | ||||||||||||
|
| |||||||||||||||
| Miscellaneous Revenue: 0.56% | ||||||||||||||||
Lewisville TX Combination Contract Castle Hills Public Improvement Bonds District #5 144A | 6.50 | 9-1-2034 | 3,910,000 | 3,911,916 | ||||||||||||
Lewisville TX Combination Contract Castle Hills Public Improvement Bonds District #6 144A | 6.00 | 9-1-2037 | 9,005,000 | 9,045,703 | ||||||||||||
Lewisville TX Combination Contract Castle Hills Public Improvement Bonds District #6 144A | 5.50 | 9-1-2039 | 2,495,000 | 2,429,182 | ||||||||||||
Lewisville TX Combination Contract Castle Hills Public Improvement Bonds District #6 144A | 6.00 | 9-1-2037 | 1,845,000 | 1,853,339 | ||||||||||||
Lower Colorado TX River Authority Series A | 5.00 | 5-15-2033 | 2,475,000 | 2,749,973 | ||||||||||||
Texas PFA | 4.00 | 2-1-2034 | 5,000,000 | 6,066,400 | ||||||||||||
Texas PFA | 4.00 | 2-1-2035 | 2,000,000 | 2,417,620 | ||||||||||||
Texas PFA | 4.00 | 2-1-2036 | 2,175,000 | 2,617,982 | ||||||||||||
| 31,092,115 | ||||||||||||||||
|
| |||||||||||||||
| Tax Revenue: 0.76% | ||||||||||||||||
Dallas TX Area Rapid Transit Sales Tax Revenue Series A | 5.00 | 12-1-2048 | 5,000,000 | 5,789,450 | ||||||||||||
Dallas TX Area Rapid Transit Sales Tax Revenue Series A | 5.00 | 12-1-2046 | 28,455,000 | 32,995,280 | ||||||||||||
Old Spanish Trail/Almeda Corridors RDA (BAM Insured) | 4.00 | 9-1-2036 | 1,125,000 | 1,294,043 | ||||||||||||
Old Spanish Trail/Almeda Corridors RDA (BAM Insured) | 4.00 | 9-1-2037 | 1,430,000 | 1,634,147 | ||||||||||||
| 41,712,920 | ||||||||||||||||
|
| |||||||||||||||
| Transportation Revenue: 1.38% | ||||||||||||||||
Central Texas Regional Mobility Authority Senior Lien Series A | 5.00 | 1-1-2033 | 3,740,000 | 3,941,212 | ||||||||||||
Central Texas Regional Mobility Authority Senior Lien Series A | 5.00 | 1-1-2044 | 3,000,000 | 3,411,210 | ||||||||||||
Central Texas Regional Mobility Authority Senior Lien Series A | 5.00 | 1-1-2049 | 2,450,000 | 2,764,531 | ||||||||||||
Grand Parkway Transportation Corporation Texas CAB Series B ¤ | 0.00 | 10-1-2029 | 1,015,000 | 1,173,878 | ||||||||||||
Grand Parkway Transportation Corporation Texas Series B ¤ | 0.00 | 10-1-2030 | 2,000,000 | 2,307,940 | ||||||||||||
Grand Parkway Transportation Corporation Texas Series C | 4.00 | 10-1-2045 | 8,085,000 | 9,368,979 | ||||||||||||
Grand Parkway Transportation Corporation Texas Series C | 4.00 | 10-1-2049 | 19,265,000 | 22,219,673 | ||||||||||||
North Texas Tollway Authority Series A | 5.00 | 1-1-2033 | 3,600,000 | 4,121,496 | ||||||||||||
North Texas Tollway Authority Series A | 5.00 | 1-1-2035 | 4,000,000 | 4,568,240 | ||||||||||||
Texas Private Activity Bond Surface Transportation Corporation Project NTE Mobility Partners Segments LLC | 4.00 | 12-31-2037 | 3,000,000 | 3,297,900 | ||||||||||||
Texas Private Activity Bond Surface Transportation Corporation Project NTE Mobility Partners Segments LLC | 6.75 | 6-30-2043 | 4,000,000 | 4,546,560 | ||||||||||||
The accompanying notes are an integral part of these financial statements.
44 | Wells Fargo Municipal Bond Fund
Portfolio of investments—June 30, 2020
| Interest rate | Maturity date | Principal | Value | |||||||||||||
| Transportation Revenue (continued) | ||||||||||||||||
Texas Private Activity Bond Surface Transportation Corporation Project NTE Mobility Partners Segments LLC | 7.00 | % | 12-31-2038 | $ | 12,500,000 | $ | 14,323,625 | |||||||||
| 76,045,244 | ||||||||||||||||
|
| |||||||||||||||
| Utilities Revenue: 0.40% | ||||||||||||||||
San Antonio TX Electric & Gas Systems Junior Lien Refunding Bond | 2.75 | 2-1-2048 | 11,000,000 | 11,565,950 | ||||||||||||
Texas Municipal Gas Acquisition & Supply Corporation III | 5.00 | 12-15-2029 | 5,115,000 | 5,460,109 | ||||||||||||
Texas Municipal Gas Acquisition & Supply Corporation III | 5.00 | 12-15-2031 | 5,000,000 | 5,312,550 | ||||||||||||
| 22,338,609 | ||||||||||||||||
|
| |||||||||||||||
| Water & Sewer Revenue: 2.57% | ||||||||||||||||
Austin TX Water & Wastewater Refunding Bond | 5.00 | 11-15-2045 | 15,065,000 | 18,145,341 | ||||||||||||
Dallas TX Waterworks & Sewer System Refunding Bond Series A | 5.00 | 10-1-2030 | 3,810,000 | 4,596,879 | ||||||||||||
Tarrant TX Regional Water District | 5.00 | 9-1-2034 | 3,500,000 | 4,098,710 | ||||||||||||
Tarrant TX Regional Water District | 5.00 | 3-1-2049 | 15,000,000 | 17,141,700 | ||||||||||||
Texas Series A | 4.00 | 10-15-2036 | 5,000,000 | 5,900,700 | ||||||||||||
Texas Series B | 5.00 | 4-15-2049 | 40,000,000 | 50,015,200 | ||||||||||||
Texas Water Development Board | 4.00 | 8-1-2038 | 2,500,000 | 3,060,475 | ||||||||||||
Texas Water Development Board Series A | 4.00 | 10-15-2037 | 11,650,000 | 13,711,351 | ||||||||||||
Texas Water Implementation Fund Series A | 4.00 | 10-15-2036 | 1,015,000 | 1,236,991 | ||||||||||||
Texas Water Implementation Fund Series A | 4.00 | 10-15-2037 | 4,000,000 | 4,874,000 | ||||||||||||
Texas Water Implementation Fund Series A | 4.00 | 10-15-2038 | 6,500,000 | 7,895,875 | ||||||||||||
Texas Water Implementation Fund Series A | 4.00 | 10-15-2044 | 9,500,000 | 11,278,495 | ||||||||||||
| 141,955,717 | ||||||||||||||||
|
| |||||||||||||||
| 539,870,592 | ||||||||||||||||
|
| |||||||||||||||
| Utah: 1.07% | ||||||||||||||||
| Airport Revenue: 0.39% | ||||||||||||||||
Salt Lake City UT Series A | 5.00 | 7-1-2036 | 2,500,000 | 3,019,150 | ||||||||||||
Salt Lake City UT Series A | 5.00 | 7-1-2043 | 2,500,000 | 2,968,700 | ||||||||||||
Salt Lake City UT Series A | 5.00 | 7-1-2043 | 1,500,000 | 1,811,520 | ||||||||||||
Salt Lake City UT Series A | 5.00 | 7-1-2048 | 5,500,000 | 6,487,800 | ||||||||||||
Salt Lake City UT Series A | 5.00 | 7-1-2048 | 3,000,000 | 3,598,890 | ||||||||||||
Salt Lake City UT Series A | 5.25 | 7-1-2048 | 3,000,000 | 3,592,830 | ||||||||||||
| 21,478,890 | ||||||||||||||||
|
| |||||||||||||||
| Health Revenue: 0.59% | ||||||||||||||||
Utah County UT Hospital Revenue Bond IHC Health Services Incorporated Series 2012 | 5.00 | 5-15-2043 | 32,000,000 | 32,944,960 | ||||||||||||
|
| |||||||||||||||
| Tax Revenue: 0.09% | ||||||||||||||||
Utah Transit Authority Series A | 5.00 | 6-15-2030 | 4,000,000 | 4,899,240 | ||||||||||||
|
| |||||||||||||||
| 59,323,090 | ||||||||||||||||
|
| |||||||||||||||
Vermont: 0.21% |
| |||||||||||||||
| Education Revenue: 0.21% | ||||||||||||||||
Vermont Student Assistance Corporation Series B (1 Month LIBOR +1.00%) ± | 1.17 | 6-2-2042 | 12,152,881 | 11,743,572 | ||||||||||||
|
| |||||||||||||||
Virginia: 0.53% |
| |||||||||||||||
| GO Revenue: 0.29% | ||||||||||||||||
Fairfax County VA Series A | 4.00 | 10-1-2034 | 8,450,000 | 9,468,394 | ||||||||||||
Norfolk VA Series C | 4.00 | 9-1-2032 | 5,810,000 | 6,820,998 | ||||||||||||
| 16,289,392 | ||||||||||||||||
|
| |||||||||||||||
The accompanying notes are an integral part of these financial statements.
Wells Fargo Municipal Bond Fund | 45
Portfolio of investments—June 30, 2020
| Interest rate | Maturity date | Principal | Value | |||||||||||||
| Health Revenue: 0.03% | ||||||||||||||||
Roanoke VA EDA Residential Care Facility Revenue Richfield Living Prooject | 5.00 | % | 9-1-2040 | $ | 1,645,000 | $ | 1,586,175 | |||||||||
|
| |||||||||||||||
| Tax Revenue: 0.02% | ||||||||||||||||
Marquis VA CDA CAB Series 2015 144A¤ | 0.00 | 9-1-2045 | 397,000 | 222,685 | ||||||||||||
Marquis VA CDA CAB Series C ¤ | 0.00 | 9-1-2041 | 1,824,000 | 81,788 | ||||||||||||
Marquis VA CDA Series B | 5.63 | 9-1-2041 | 1,310,000 | 711,304 | ||||||||||||
| 1,015,777 | ||||||||||||||||
|
| |||||||||||||||
| Transportation Revenue: 0.15% | ||||||||||||||||
Virginia Small Business Financing Authority AMT 95 Express Lanes LLC Project | 5.00 | 7-1-2049 | 4,000,000 | 4,110,360 | ||||||||||||
Virginia Small Business Financing Authority Senior Lien 95 Express Lanes LLC Project | 5.00 | 7-1-2034 | 4,000,000 | 4,116,280 | ||||||||||||
| 8,226,640 | ||||||||||||||||
|
| |||||||||||||||
| Utilities Revenue: 0.04% | ||||||||||||||||
Wise County IDA Waste & Sewage Disposal Revenue | 1.20 | 11-1-2040 | 2,000,000 | 2,004,940 | ||||||||||||
|
| |||||||||||||||
| 29,122,924 | ||||||||||||||||
|
| |||||||||||||||
Washington: 3.69% |
| |||||||||||||||
| Airport Revenue: 0.34% | ||||||||||||||||
Port Of Seattle WA Revenue AMT Intermediate Lien | 5.00 | 4-1-2044 | 16,000,000 | 18,896,800 | ||||||||||||
|
| |||||||||||||||
| Education Revenue: 0.05% | ||||||||||||||||
Washington HEFA Seattle University Project %% | 4.00 | 5-1-2045 | 1,000,000 | 1,100,240 | ||||||||||||
Washington HEFA Seattle University Project %% | 5.00 | 5-1-2030 | 760,000 | 961,689 | ||||||||||||
Washington HEFA Seattle University Project %% | 5.00 | 5-1-2032 | 335,000 | 417,899 | ||||||||||||
Washington HEFA Seattle University Project %% | 5.00 | 5-1-2033 | 300,000 | 371,697 | ||||||||||||
| 2,851,525 | ||||||||||||||||
|
| |||||||||||||||
| GO Revenue: 1.64% | ||||||||||||||||
Clark County WA School District #114 (AGM Insured) | 4.00 | 12-1-2031 | 9,000,000 | 10,823,850 | ||||||||||||
Clark County WA School District #114 (AGM Insured) | 4.00 | 12-1-2034 | 2,500,000 | 2,954,875 | ||||||||||||
King and Pierce County WA School District #408 Auburn (AGM Insured) | 4.00 | 12-1-2035 | 2,470,000 | 2,984,723 | ||||||||||||
King and Pierce County WA School District #408 Auburn (AGM Insured) | 4.00 | 12-1-2036 | 5,000,000 | 5,993,150 | ||||||||||||
King County WA Public Hospital District #1 Valley Medical Center Refunding Bond | 5.00 | 12-1-2029 | 8,940,000 | 10,530,694 | ||||||||||||
King County WA Public Hospital District #1 Valley Medical Center Refunding Bond | 5.00 | 12-1-2035 | 9,430,000 | 10,845,537 | ||||||||||||
King County WA School District #210 Federal Way (AGM Insured) | 4.00 | 12-1-2033 | 10,000,000 | 11,823,200 | ||||||||||||
King County WA School District #414 Lake Washington (AGM Insured) | 5.00 | 12-1-2033 | 570,000 | 728,010 | ||||||||||||
King County WA School District #414 Lake Washington (AGM Insured) | 5.00 | 12-1-2034 | 1,000,000 | 1,273,240 | ||||||||||||
Seattle WA | 4.00 | 12-1-2040 | 2,500,000 | 2,762,650 | ||||||||||||
Snohomish County WA School District (AGM Insured) | 5.00 | 12-1-2031 | 1,500,000 | 1,810,605 | ||||||||||||
Washington Motor Vehicle Fuel Tax Series B | 5.00 | 8-1-2032 | 8,545,000 | 10,204,183 | ||||||||||||
Washington Series 2017-A | 5.00 | 8-1-2040 | 3,500,000 | 4,205,810 | ||||||||||||
Washington Series 2017-A | 5.00 | 8-1-2041 | 2,500,000 | 2,997,725 | ||||||||||||
Washington Series 2017-A | 5.00 | 8-1-2033 | 1,500,000 | 1,832,715 | ||||||||||||
Washington Series RA | 4.00 | 7-1-2030 | 7,950,000 | 8,408,318 | ||||||||||||
| 90,179,285 | ||||||||||||||||
|
| |||||||||||||||
| Health Revenue: 0.19% | ||||||||||||||||
Spokane WA Housing Finance Commission Riverview Retirement Community Project | 5.00 | 1-1-2023 | 725,000 | 737,506 | ||||||||||||
Washington HCFR Providence Health & Services Series 2012A | 5.00 | 10-1-2042 | 2,160,000 | 2,286,058 | ||||||||||||
The accompanying notes are an integral part of these financial statements.
46 | Wells Fargo Municipal Bond Fund
Portfolio of investments—June 30, 2020
| Interest rate | Maturity date | Principal | Value | |||||||||||||
| Health Revenue (continued) | ||||||||||||||||
Washington Health Care Facilities Authority Commonspirit Health Series A-2 | 5.00 | % | 8-1-2038 | $ | 3,000,000 | $ | 3,572,340 | |||||||||
Washington Health Care Facilities Authority Seattle Cancer Care Alliance %% | 4.00 | 9-1-2045 | 2,500,000 | 2,817,225 | ||||||||||||
Washington Health Care Facilities Authority Seattle Cancer Care Alliance %% | 5.00 | 9-1-2040 | 1,000,000 | 1,245,300 | ||||||||||||
| 10,658,429 | ||||||||||||||||
|
| |||||||||||||||
| Miscellaneous Revenue: 0.22% | ||||||||||||||||
Washington Certificate of Participation | 5.00 | 7-1-2038 | 1,660,000 | 2,103,884 | ||||||||||||
Washington Certificate of Participation | 5.00 | 7-1-2039 | 1,745,000 | 2,205,575 | ||||||||||||
Washington Certificate of Participation | 5.00 | 7-1-2040 | 1,480,000 | 1,865,940 | ||||||||||||
Washington Certificate of Participation | 5.00 | 7-1-2041 | 1,555,000 | 1,954,495 | ||||||||||||
Washington Certificate of Participation Series A | 5.00 | 7-1-2038 | 3,265,000 | 3,991,822 | ||||||||||||
| 12,121,716 | ||||||||||||||||
|
| |||||||||||||||
| Tax Revenue: 0.54% | ||||||||||||||||
Central Puget Sound WA Regional Transportation Authority Series S1 | 5.00 | 11-1-2035 | 9,485,000 | 11,316,174 | ||||||||||||
Washington Convention Center Public Facilities District Lodging Tax | 5.00 | 7-1-2058 | 10,000,000 | 10,949,300 | ||||||||||||
Washington Series B | 5.00 | 8-1-2037 | 6,400,000 | 7,736,064 | ||||||||||||
| 30,001,538 | ||||||||||||||||
|
| |||||||||||||||
| Utilities Revenue: 0.10% | ||||||||||||||||
Chelan County WA Public Utility District #1 Refunding Bond AMT Series C | 5.00 | 7-1-2026 | 1,285,000 | 1,566,839 | ||||||||||||
Seattle WA Municipal Light & Power Authority | 4.00 | 9-1-2040 | 3,290,000 | 3,613,966 | ||||||||||||
| 5,180,805 | ||||||||||||||||
|
| |||||||||||||||
| Water & Sewer Revenue: 0.61% | ||||||||||||||||
King County WA | 5.00 | 7-1-2047 | 7,510,000 | 8,761,091 | ||||||||||||
King County WA | 2.60 | 1-1-2043 | 19,000,000 | 19,232,180 | ||||||||||||
King County WA | 5.00 | 7-1-2042 | 4,660,000 | 5,683,709 | ||||||||||||
| 33,676,980 | ||||||||||||||||
|
| |||||||||||||||
| 203,567,078 | ||||||||||||||||
|
| |||||||||||||||
West Virginia: 0.14% |
| |||||||||||||||
| GO Revenue: 0.08% | ||||||||||||||||
Ohio County WV Board of Education | 3.00 | 6-1-2025 | 1,205,000 | 1,334,634 | ||||||||||||
Ohio County WV Board of Education | 3.00 | 6-1-2026 | 2,680,000 | 3,000,367 | ||||||||||||
| 4,335,001 | ||||||||||||||||
|
| |||||||||||||||
| Tax Revenue: 0.06% | ||||||||||||||||
Monongalia County WV Commission Refunding & Improvement Bonds University Town Center Series A 144A | 5.50 | 6-1-2037 | 2,500,000 | 2,575,150 | ||||||||||||
Monongalia County WV Commission Refunding & Improvement Bonds University Town Center Series A 144A | 5.75 | 6-1-2043 | 675,000 | 696,688 | ||||||||||||
| 3,271,838 | ||||||||||||||||
|
| |||||||||||||||
| 7,606,839 | ||||||||||||||||
|
| |||||||||||||||
Wisconsin: 2.93% |
| |||||||||||||||
| Education Revenue: 0.35% | ||||||||||||||||
Milwaukee WI RDA Science Education Consortium Incorporated Project Series A | 6.00 | 8-1-2033 | 2,120,000 | 2,323,456 | ||||||||||||
Milwaukee WI RDA Science Education Consortium Incorporated Project | 6.25 | 8-1-2043 | 4,650,000 | 5,069,663 | ||||||||||||
PFA Wisconsin Charter School Revenue American Preparatory Academy 144A | 5.00 | 7-15-2039 | 1,375,000 | 1,399,448 | ||||||||||||
The accompanying notes are an integral part of these financial statements.
Wells Fargo Municipal Bond Fund | 47
Portfolio of investments—June 30, 2020
| Interest rate | Maturity date | Principal | Value | |||||||||||||
| Education Revenue (continued) | ||||||||||||||||
Wisconsin PFA Carolina International School Series A 144A | 6.00 | % | 8-1-2023 | $ | 310,000 | $ | 327,800 | |||||||||
Wisconsin PFA Carolina International School Series A 144A | 6.75 | 8-1-2033 | 2,430,000 | 2,678,808 | ||||||||||||
Wisconsin PFA Carolina International School Series A 144A | 7.00 | 8-1-2043 | 1,575,000 | 1,728,326 | ||||||||||||
Wisconsin PFA Carolina International School Series A 144A | 7.20 | 8-1-2048 | 940,000 | 1,034,630 | ||||||||||||
Wisconsin PFA Wisland Revenue Northwest Nazarene University | 4.25 | 10-1-2049 | 5,410,000 | 4,937,058 | ||||||||||||
| 19,499,189 | ||||||||||||||||
|
| |||||||||||||||
| GO Revenue: 0.18% | ||||||||||||||||
Verona WI Area School District Building & Improvement Bonds | 4.00 | 4-1-2027 | 3,385,000 | 3,942,577 | ||||||||||||
Verona WI Area School District Building & Improvement Bonds | 4.00 | 4-1-2028 | 1,380,000 | 1,603,463 | ||||||||||||
Verona WI Area School District Building & Improvement Bonds | 5.00 | 4-1-2026 | 3,310,000 | 4,098,243 | ||||||||||||
| 9,644,283 | ||||||||||||||||
|
| |||||||||||||||
| Health Revenue: 0.91% | ||||||||||||||||
Wisconsin HEFA Ascension Senior Credit Group Series A | 4.50 | 11-15-2039 | 4,580,000 | 5,129,966 | ||||||||||||
Wisconsin HEFA Ascension Senior Credit Group Series A | 5.00 | 11-15-2035 | 12,000,000 | 14,127,000 | ||||||||||||
Wisconsin HEFA Marshfield Clinic Health System | 5.00 | 2-15-2052 | 4,000,000 | 4,567,640 | ||||||||||||
Wisconsin PFA Series A | 4.00 | 10-1-2049 | 24,500,000 | 26,372,780 | ||||||||||||
| 50,197,386 | ||||||||||||||||
|
| |||||||||||||||
| Housing Revenue: 0.63% | ||||||||||||||||
Wisconsin PFA Student Housing Revenue (AGM Insured) | 4.00 | 7-1-2023 | 350,000 | 375,617 | ||||||||||||
Wisconsin PFA Student Housing Revenue (AGM Insured) | 4.00 | 7-1-2024 | 800,000 | 875,120 | ||||||||||||
Wisconsin PFA Student Housing Revenue (AGM Insured) | 4.00 | 7-1-2025 | 920,000 | 1,022,690 | ||||||||||||
Wisconsin PFA Student Housing Revenue (AGM Insured) | 5.00 | 7-1-2026 | 1,360,000 | 1,609,846 | ||||||||||||
Wisconsin PFA Student Housing Revenue (AGM Insured) | 5.00 | 7-1-2027 | 1,675,000 | 2,021,022 | ||||||||||||
Wisconsin PFA Student Housing Revenue (AGM Insured) | 5.00 | 7-1-2028 | 2,025,000 | 2,494,172 | ||||||||||||
Wisconsin PFA Student Housing Revenue (AGM Insured) | 5.00 | 7-1-2029 | 2,190,000 | 2,685,400 | ||||||||||||
Wisconsin PFA Student Housing Revenue (AGM Insured) | 5.00 | 7-1-2030 | 2,300,000 | 2,804,850 | ||||||||||||
Wisconsin PFA Student Housing Revenue (AGM Insured) | 5.00 | 7-1-2031 | 1,415,000 | 1,716,070 | ||||||||||||
Wisconsin PFA Student Housing Revenue (AGM Insured) | 5.00 | 7-1-2048 | 16,775,000 | 19,354,156 | ||||||||||||
| 34,958,943 | ||||||||||||||||
|
| |||||||||||||||
| Miscellaneous Revenue: 0.12% | ||||||||||||||||
Wisconsin Series 1 | 4.50 | 7-1-2033 | 2,085,000 | 2,230,804 | ||||||||||||
Wisconsin Series A | 5.00 | 6-1-2033 | 3,420,000 | 4,111,661 | ||||||||||||
| 6,342,465 | ||||||||||||||||
|
| |||||||||||||||
| Tax Revenue: 0.74% | ||||||||||||||||
Mount Pleasant WI Series A | 5.00 | 4-1-2038 | 5,495,000 | 6,809,569 | ||||||||||||
Mount Pleasant WI Series A ## | 5.00 | 4-1-2043 | 20,205,000 | 24,759,207 | ||||||||||||
Mount Pleasant WI Series A | 5.00 | 4-1-2048 | 7,855,000 | 9,467,369 | ||||||||||||
| 41,036,145 | ||||||||||||||||
|
| |||||||||||||||
| 161,678,411 | ||||||||||||||||
|
| |||||||||||||||
Wyoming: 0.04% |
| |||||||||||||||
| Education Revenue: 0.03% | ||||||||||||||||
Wyoming CDA | 6.50 | 7-1-2043 | 1,600,000 | 1,629,808 | ||||||||||||
|
| |||||||||||||||
| Health Revenue: 0.01% | ||||||||||||||||
West Park Hospital District Wyoming Series B | 6.50 | 6-1-2027 | 500,000 | 521,555 | ||||||||||||
|
| |||||||||||||||
| 2,151,363 | ||||||||||||||||
|
| |||||||||||||||
Total Municipal Obligations (Cost $5,170,972,196) |
| 5,457,252,794 | ||||||||||||||
|
| |||||||||||||||
The accompanying notes are an integral part of these financial statements.
48 | Wells Fargo Municipal Bond Fund
Portfolio of investments—June 30, 2020
| Principal | Value | |||||||||||||||
Closed End Municipal Bond Fund Obligations: 0.11% |
| |||||||||||||||
| California: 0.11% | ||||||||||||||||
Nuveen California AMT-Free Quality Municipal Income Fund MuniFund Preferred Shares Series A (60 shares) 0.92% 144Aø | $ | 6,000,000 | $ | 6,000,000 | ||||||||||||
|
| |||||||||||||||
Total Closed End Municipal Bond Fund Obligations (Cost $6,000,000) |
| 6,000,000 | ||||||||||||||
|
| |||||||||||||||
| Yield | Shares | |||||||||||||||
| Short-Term Investments: 0.61% | ||||||||||||||||
| Investment Companies: 0.61% | ||||||||||||||||
Wells Fargo Municipal Cash Management Money Market Fund Institutional Class ##(l)(u) | 0.10 | % | 33,847,674 | 33,857,829 | ||||||||||||
|
| |||||||||||||||
Total Short-Term Investments (Cost $33,857,299) |
| 33,857,829 | ||||||||||||||
|
| |||||||||||||||
| Total investments in securities (Cost $5,210,829,495) | 99.60 | % | 5,497,110,623 | |||||
Other assets and liabilities, net | 0.40 | 22,292,729 | ||||||
|
|
|
| |||||
| Total net assets | 100.00 | % | $ | 5,519,403,352 | ||||
|
|
|
| |||||
| %% | The security is purchased on a when-issued basis. |
| 144A | The security may be resold in transactions exempt from registration, normally to qualified institutional buyers, pursuant to Rule 144A under the Securities Act of 1933. |
| ø | Variable rate demand notes are subject to a demand feature which reduces the effective maturity. The maturity date shown represents the final maturity date of the security. The interest rate is determined and reset by the issuer daily, weekly, or monthly depending upon the terms of the security. The rate shown is the rate in effect at period end. |
| ¤ | The security is issued in zero coupon form with no periodic interest payments. |
| (m) | The security is an auction-rate security which has an interest rate that resets at predetermined short-term intervals through a Dutch auction. The rate shown is the rate in effect at period end. |
| ± | Variable rate investment. The rate shown is the rate in effect at period end. |
| †† | On the last interest date, partial interest was paid. |
| ## | All or a portion of this security is segregated for when-issued securities. |
| (l) | The issuer of the security is an affiliated person of the Fund as defined in the Investment Company Act of 1940. |
| (u) | The rate represents the 7-day annualized yield at period end. |
The accompanying notes are an integral part of these financial statements.
Wells Fargo Municipal Bond Fund | 49
Portfolio of investments—June 30, 2020
Abbreviations:
| AGC | Assured Guaranty Corporation |
| AGM | Assured Guaranty Municipal |
| Ambac | Ambac Financial Group Incorporated |
| AMT | Alternative minimum tax |
| BAM | Build America Mutual Assurance Company |
| BAN | Bond anticipation notes |
| CAB | Capital appreciation bond |
| CCAB | Convertible capital appreciation bond |
| CDA | Community Development Authority |
| ECFA | Educational & Cultural Facilities Authority |
| EDA | Economic Development Authority |
| EDFA | Economic Development Finance Authority |
| FGIC | Financial Guaranty Insurance Corporation |
| FHLMC | Federal Home Loan Mortgage Corporation |
| FNMA | Federal National Mortgage Association |
| GNMA | Government National Mortgage Association |
| GO | General obligation |
| HCFR | Healthcare facilities revenue |
| HEFA | Health & Educational Facilities Authority |
| HEFAR | Higher Education Facilities Authority Revenue |
| HFA | Housing Finance Authority |
| HFFA | Health Facilities Financing Authority |
| IDA | Industrial Development Authority |
| LIBOR | London Interbank Offered Rate |
| LIQ | Liquidity agreement |
| LOC | Letter of credit |
| MFHR | Multifamily housing revenue |
| National | National Public Finance Guarantee Corporation |
| PFA | Public Finance Authority |
| RDA | Redevelopment Authority |
| SIFMA | Securities Industry and Financial Markets Association |
| TTFA | Transportation Trust Fund Authority |
Investments in Affiliates
An affiliated investment is an investment in which the Fund owns at least 5% of the outstanding voting shares of the issuer or as a result of other relationships, such as the Fund and the issuer having the same investment manager. Transactions with issuers that were either affiliated persons of the Fund at the beginning of the period or the end of the period were as follows:
| Value, beginning of period | Purchases | Sales proceeds | Net realized gains (losses) | Net change in unrealized gains (losses) | Income from affiliated securities | Value, end of period | % of net assets | |||||||||||||||||||||||||
| Short-Term Investments | ||||||||||||||||||||||||||||||||
Investment Companies | ||||||||||||||||||||||||||||||||
Wells Fargo Municipal Cash Management Money Market Fund Institutional Class | $ | 24,276,293 | $ | 1,090,058,394 | $ | (1,080,502,061 | ) | $ | 25,330 | $ | (127 | ) | $ | 296,610 | $ | 33,857,829 | 0.61 | % | ||||||||||||||
The accompanying notes are an integral part of these financial statements.
50 | Wells Fargo Municipal Bond Fund
Statement of assets and liabilities—June 30, 2020
Assets | ||||
Investments in unaffiliated securities, at value (cost $5,176,972,196) | $ | 5,463,252,794 | ||
Investments in affiliated securities, at value (cost $33,857,299) | 33,857,829 | |||
Receivable for investments sold | 211,000 | |||
Receivable for Fund shares sold | 24,956,520 | |||
Receivable for interest | 52,909,659 | |||
Prepaid expenses and other assets | 386,433 | |||
|
| |||
Total assets | 5,575,574,235 | |||
|
| |||
Liabilities | ||||
Payable for investments purchased | 38,513,343 | |||
Payable for Fund shares redeemed | 8,879,699 | |||
Overdraft due to custodian bank | 4,653,798 | |||
Management fee payable | 1,411,645 | |||
Dividends payable | 1,976,706 | |||
Administration fees payable | 451,047 | |||
Distribution fee payable | 49,481 | |||
Trustees’ fees and expenses payable | 3,541 | |||
Accrued expenses and other liabilities | 231,623 | |||
|
| |||
Total liabilities | 56,170,883 | |||
|
| |||
Total net assets | $ | 5,519,403,352 | ||
|
| |||
Net assets consist of | ||||
Paid-in capital | $ | 5,287,992,877 | ||
Total distributable earnings | 231,410,475 | |||
|
| |||
Total net assets | $ | 5,519,403,352 | ||
|
| |||
Computation of net asset value and offering price per share | ||||
Net assets – Class A | $ | 1,138,933,579 | ||
Shares outstanding – Class A1 | 107,918,319 | |||
Net asset value per share – Class A | $10.55 | |||
Maximum offering price per share – Class A2 | $11.05 | |||
Net assets – Class C | $ | 79,862,906 | ||
Shares outstanding – Class C1 | 7,570,322 | |||
Net asset value per share – Class C | $10.55 | |||
Net assets – Class R6 | $ | 276,203,732 | ||
Shares outstanding – Class R61 | 26,168,654 | |||
Net asset value per share – Class R6 | $10.55 | |||
Net assets – Administrator Class | $ | 1,017,781,082 | ||
Shares outstanding – Administrator Class1 | 96,408,877 | |||
Net asset value per share – Administrator Class | $10.56 | |||
Net assets – Institutional Class | $ | 3,006,622,053 | ||
Shares outstanding – Institutional Class1 | 284,908,273 | |||
Net asset value per share – Institutional Class | $10.55 | |||
| 1 | The Fund has an unlimited number of authorized shares. |
| 2 | Maximum offering price is computed as 100/95.50 of net asset value. On investments of $50,000 or more, the offering price is reduced. |
The accompanying notes are an integral part of these financial statements.
Wells Fargo Municipal Bond Fund | 51
Statement of operations—year ended June 30, 2020
Investment income | ||||
Interest | $ | 166,501,265 | ||
Dividends | 1,241,055 | |||
Income from affiliated securities | 296,610 | |||
|
| |||
Total investment income | 168,038,930 | |||
|
| |||
Expenses | ||||
Management fee | 18,382,337 | |||
Administration fees |
| |||
Class A | 1,897,938 | |||
Class C | 142,147 | |||
Class R6 | 47,168 | |||
Administrator Class | 930,664 | |||
Institutional Class | 2,387,565 | |||
Shareholder servicing fees |
| |||
Class A | 2,961,659 | |||
Class C | 222,083 | |||
Administrator Class | 2,326,661 | |||
Distribution fee |
| |||
Class C | 666,137 | |||
Custody and accounting fees | 154,625 | |||
Professional fees | 78,384 | |||
Registration fees | 208,839 | |||
Shareholder report expenses | 111,311 | |||
Trustees’ fees and expenses | 21,541 | |||
Other fees and expenses | 52,928 | |||
|
| |||
Total expenses | 30,591,987 | |||
Less: Fee waivers and/or expense reimbursements |
| |||
Class A | (240,353 | ) | ||
Class C | (13,489 | ) | ||
Administrator Class | (985,411 | ) | ||
|
| |||
Net expenses | 29,352,734 | |||
|
| |||
Net investment income | 138,686,196 | |||
|
| |||
Realized and unrealized gains (losses) on investments | ||||
Net realized gains (losses) on |
| |||
Unaffiliated securities | (48,160,468 | ) | ||
Affiliated securities | 25,330 | |||
Futures contracts | (19,404 | ) | ||
|
| |||
Net realized losses on investments | (48,154,542 | ) | ||
|
| |||
Net change in unrealized gains (losses) on |
| |||
Unaffiliated securities | 47,393,039 | |||
Affiliated securities | (127 | ) | ||
|
| |||
Net change in unrealized gains (losses) on investments | 47,392,912 | |||
|
| |||
Net realized and unrealized gains (losses) on investments | (761,630 | ) | ||
|
| |||
Net increase in net assets resulting from operations | $ | 137,924,566 | ||
|
| |||
The accompanying notes are an integral part of these financial statements.
52 | Wells Fargo Municipal Bond Fund
Statement of changes in net assets
| Year ended June 30, 2020 | Year ended June 30, 2019 | |||||||||||||||
Operations | ||||||||||||||||
Net investment income | $ | 138,686,196 | $ | 111,379,445 | ||||||||||||
Net realized gains (losses) on investments | (48,154,542 | ) | 8,102,223 | |||||||||||||
Net change in unrealized gains (losses) on investments | 47,392,912 | 141,181,173 | ||||||||||||||
|
| |||||||||||||||
Net increase in net assets resulting from operations | 137,924,566 | 260,662,841 | ||||||||||||||
|
| |||||||||||||||
Distributions to shareholders from net investment income and net realized gains | ||||||||||||||||
Class A | (29,825,578 | ) | (33,496,628 | ) | ||||||||||||
Class C | (1,560,718 | ) | (2,452,735 | ) | ||||||||||||
Class R6 | (4,491,029 | ) | (1,008,740 | )1 | ||||||||||||
Administrator Class | (24,748,374 | ) | (18,574,895 | ) | ||||||||||||
Institutional Class | (84,244,945 | ) | (55,765,959 | ) | ||||||||||||
|
| |||||||||||||||
Total distributions to shareholders | (144,870,644 | ) | (111,298,957 | ) | ||||||||||||
|
| |||||||||||||||
Capital share transactions | Shares | Shares | ||||||||||||||
Proceeds from shares sold |
| |||||||||||||||
Class A | 9,167,275 | 97,235,133 | 10,207,001 | 104,731,394 | ||||||||||||
Class C | 766,819 | 8,149,104 | 1,091,183 | 11,211,311 | ||||||||||||
Class R6 | 30,650,559 | 319,865,253 | 7,773,111 | 1 | 79,416,075 | 1 | ||||||||||
Administrator Class | 45,240,283 | 475,573,522 | 65,531,996 | 662,326,993 | ||||||||||||
Institutional Class | 97,270,327 | 1,027,760,067 | 182,281,519 | 1,881,539,606 | ||||||||||||
|
| |||||||||||||||
| 1,928,583,079 | 2,739,225,379 | |||||||||||||||
|
| |||||||||||||||
Reinvestment of distributions |
| |||||||||||||||
Class A | 2,496,084 | 26,471,883 | 2,863,370 | 29,385,655 | ||||||||||||
Class C | 129,353 | 1,371,694 | 214,607 | 2,196,994 | ||||||||||||
Class R6 | 2,722 | 28,842 | 53 | 1 | 556 | 1 | ||||||||||
Administrator Class | 2,305,325 | 24,441,713 | 1,744,840 | 17,964,156 | ||||||||||||
Institutional Class | 6,798,581 | 72,103,950 | 4,420,261 | 45,500,840 | ||||||||||||
|
| |||||||||||||||
| 124,418,082 | 95,048,201 | |||||||||||||||
|
| |||||||||||||||
Payment for shares redeemed |
| |||||||||||||||
Class A | (18,119,157 | ) | (190,725,711 | ) | (19,298,194 | ) | (197,545,478 | ) | ||||||||
Class C | (2,656,976 | ) | (28,073,292 | ) | (5,723,382 | ) | (58,571,623 | ) | ||||||||
Class R6 | (11,370,139 | ) | (117,923,335 | ) | (887,652 | )1 | (9,156,468 | )1 | ||||||||
Administrator Class | (29,998,773 | ) | (314,967,801 | ) | (12,413,823 | ) | (127,080,850 | ) | ||||||||
Institutional Class | (90,500,756 | ) | (947,650,502 | ) | (58,145,370 | ) | (593,888,764 | ) | ||||||||
|
| |||||||||||||||
| (1,599,340,641 | ) | (986,243,183 | ) | |||||||||||||
|
| |||||||||||||||
Net asset value of shares issued in acquisition |
| |||||||||||||||
Class A | 0 | 0 | 5,041,496 | 51,955,343 | ||||||||||||
Class C | 0 | 0 | 764,390 | 7,874,457 | ||||||||||||
Administrator Class | 0 | 0 | 1,758,364 | 18,126,777 | ||||||||||||
Institutional Class | 0 | 0 | 3,124,015 | 32,190,161 | ||||||||||||
|
| |||||||||||||||
| 0 | 110,146,738 | |||||||||||||||
|
| |||||||||||||||
Net increase in net assets resulting from capital share transactions | 453,660,520 | 1,958,177,135 | ||||||||||||||
|
| |||||||||||||||
Total increase in net assets | 446,714,442 | 2,107,541,019 | ||||||||||||||
|
| |||||||||||||||
Net assets | ||||||||||||||||
Beginning of period | 5,072,688,910 | 2,965,147,891 | ||||||||||||||
|
| |||||||||||||||
End of period | $ | 5,519,403,352 | $ | 5,072,688,910 | ||||||||||||
|
| |||||||||||||||
| 1. | For the period from July 31, 2018 (commencement of class operations) to June 30, 2019 |
The accompanying notes are an integral part of these financial statements.
Wells Fargo Municipal Bond Fund | 53
(For a share outstanding throughout each period)
| Year ended June 30 | ||||||||||||||||||||
| CLASS A | 2020 | 2019 | 2018 | 2017 | 2016 | |||||||||||||||
Net asset value, beginning of period | $10.55 | $10.21 | $10.25 | $10.70 | $10.25 | |||||||||||||||
Net investment income | 0.25 | 0.30 | 1 | 0.32 | 0.33 | 0.31 | ||||||||||||||
Net realized and unrealized gains (losses) on investments | 0.01 | 0.34 | (0.02 | ) | (0.38 | ) | 0.50 | |||||||||||||
|
|
|
|
|
|
|
|
|
| |||||||||||
Total from investment operations | 0.26 | 0.64 | 0.30 | (0.05 | ) | 0.81 | ||||||||||||||
Distributions to shareholders from | ||||||||||||||||||||
Net investment income | (0.25 | ) | (0.30 | ) | (0.32 | ) | (0.33 | ) | (0.31 | ) | ||||||||||
Net realized gains | (0.01 | ) | 0.00 | (0.02 | ) | (0.07 | ) | (0.05 | ) | |||||||||||
|
|
|
|
|
|
|
|
|
| |||||||||||
Total distributions to shareholders | (0.26 | ) | (0.30 | ) | (0.34 | ) | (0.40 | ) | (0.36 | ) | ||||||||||
Net asset value, end of period | $10.55 | $10.55 | $10.21 | $10.25 | $10.70 | |||||||||||||||
Total return2 | 2.54 | % | 6.35 | % | 2.97 | % | (0.47 | )% | 8.04 | % | ||||||||||
Ratios to average net assets (annualized) | ||||||||||||||||||||
Gross expenses | 0.77 | % | 0.78 | % | 0.79 | % | 0.79 | % | 0.79 | % | ||||||||||
Net expenses | 0.74 | % | 0.75 | % | 0.75 | % | 0.75 | % | 0.75 | % | ||||||||||
Net investment income | 2.40 | % | 2.89 | % | 3.10 | % | 3.13 | % | 2.99 | % | ||||||||||
Supplemental data | ||||||||||||||||||||
Portfolio turnover rate | 24 | % | 20 | % | 19 | % | 24 | % | 16 | % | ||||||||||
Net assets, end of period (000s omitted) | $1,138,934 | $1,206,717 | $1,179,800 | $1,244,267 | $1,529,884 | |||||||||||||||
| 1 | Calculated based upon average shares outstanding |
| 2 | Total return calculations do not include any sales charges. |
The accompanying notes are an integral part of these financial statements.
54 | Wells Fargo Municipal Bond Fund
Financial highlights
(For a share outstanding throughout each period)
| Year ended June 30 | ||||||||||||||||||||
| CLASS C | 2020 | 2019 | 2018 | 2017 | 2016 | |||||||||||||||
Net asset value, beginning of period | $10.55 | $10.21 | $10.24 | $10.69 | $10.25 | |||||||||||||||
Net investment income | 0.17 | 0.22 | 0.24 | 0.25 | 0.23 | |||||||||||||||
Net realized and unrealized gains (losses) on investments | 0.01 | 0.34 | (0.01 | ) | (0.38 | ) | 0.49 | |||||||||||||
|
|
|
|
|
|
|
|
|
| |||||||||||
Total from investment operations | 0.18 | 0.56 | 0.23 | (0.13 | ) | 0.72 | ||||||||||||||
Distributions to shareholders from | ||||||||||||||||||||
Net investment income | (0.17 | ) | (0.22 | ) | (0.24 | ) | (0.25 | ) | (0.23 | ) | ||||||||||
Net realized gains | (0.01 | ) | 0.00 | (0.02 | ) | (0.07 | ) | (0.05 | ) | |||||||||||
|
|
|
|
|
|
|
|
|
| |||||||||||
Total distributions to shareholders | (0.18 | ) | (0.22 | ) | (0.26 | ) | (0.32 | ) | (0.28 | ) | ||||||||||
Net asset value, end of period | $10.55 | $10.55 | $10.21 | $10.24 | $10.69 | |||||||||||||||
Total return1 | 1.77 | % | 5.56 | % | 2.30 | % | (1.21 | )% | 7.14 | % | ||||||||||
Ratios to average net assets (annualized) | ||||||||||||||||||||
Gross expenses | 1.51 | % | 1.53 | % | 1.54 | % | 1.54 | % | 1.54 | % | ||||||||||
Net expenses | 1.50 | % | 1.50 | % | 1.50 | % | 1.50 | % | 1.50 | % | ||||||||||
Net investment income | 1.64 | % | 2.15 | % | 2.35 | % | 2.38 | % | 2.24 | % | ||||||||||
Supplemental data | ||||||||||||||||||||
Portfolio turnover rate | 24 | % | 20 | % | 19 | % | 24 | % | 16 | % | ||||||||||
Net assets, end of period (000s omitted) | $79,863 | $98,411 | $132,529 | $148,944 | $186,036 | |||||||||||||||
| 1 | Total return calculations do not include any sales charges. |
The accompanying notes are an integral part of these financial statements.
Wells Fargo Municipal Bond Fund | 55
Financial highlights
(For a share outstanding throughout each period)
| Year ended June 30 | ||||||||
| CLASS R6 | 2020 | 20191 | ||||||
Net asset value, beginning of period | $10.55 | $10.21 | ||||||
Net investment income | 0.29 | 0.30 | ||||||
Net realized and unrealized gains (losses) on investments | 0.01 | 0.34 | ||||||
|
|
|
| |||||
Total from investment operations | 0.30 | 0.64 | ||||||
Distributions to shareholders from | ||||||||
Net investment income | (0.29 | ) | (0.30 | ) | ||||
Net realized gains | (0.01 | ) | 0.00 | |||||
|
|
|
| |||||
Total distributions to shareholders | (0.30 | ) | (0.30 | ) | ||||
Net asset value, end of period | $10.55 | $10.55 | ||||||
Total return2 | 2.90 | % | 6.43 | % | ||||
Ratios to average net assets (annualized) | ||||||||
Gross expenses | 0.39 | % | 0.40 | % | ||||
Net expenses | 0.39 | % | 0.40 | % | ||||
Net investment income | 2.76 | % | 3.16 | % | ||||
Supplemental data | ||||||||
Portfolio turnover rate | 24 | % | 20 | % | ||||
Net assets, end of period (000s omitted) | $276,204 | $72,655 | ||||||
| 1. | For the period from July 31, 2018 (commencement of class operations) to June 30, 2019 |
| 2. | Returns for periods of less than one year are not annualized. |
The accompanying notes are an integral part of these financial statements.
56 | Wells Fargo Municipal Bond Fund
Financial highlights
(For a share outstanding throughout each period)
| Year ended June 30 | ||||||||||||||||||||
| ADMINISTRATOR CLASS | 2020 | 2019 | 2018 | 2017 | 2016 | |||||||||||||||
Net asset value, beginning of period | $10.55 | $10.21 | $10.25 | $10.70 | $10.26 | |||||||||||||||
Net investment income | 0.27 | 0.31 | 1 | 0.33 | 1 | 0.34 | 0.33 | |||||||||||||
Net realized and unrealized gains (losses) on investments | 0.02 | 0.34 | (0.02 | ) | (0.38 | ) | 0.49 | |||||||||||||
|
|
|
|
|
|
|
|
|
| |||||||||||
Total from investment operations | 0.29 | 0.65 | 0.31 | (0.04 | ) | 0.82 | ||||||||||||||
Distributions to shareholders from | ||||||||||||||||||||
Net investment income | (0.27 | ) | (0.31 | ) | (0.33 | ) | (0.34 | ) | (0.33 | ) | ||||||||||
Net realized gains | (0.01 | ) | 0.00 | (0.02 | ) | (0.07 | ) | (0.05 | ) | |||||||||||
|
|
|
|
|
|
|
|
|
| |||||||||||
Total distributions to shareholders | (0.28 | ) | (0.31 | ) | (0.35 | ) | (0.41 | ) | (0.38 | ) | ||||||||||
Net asset value, end of period | $10.56 | $10.55 | $10.21 | $10.25 | $10.70 | |||||||||||||||
Total return | 2.78 | % | 6.51 | % | 3.13 | % | (0.32 | )% | 8.10 | % | ||||||||||
Ratios to average net assets (annualized) | ||||||||||||||||||||
Gross expenses | 0.71 | % | 0.72 | % | 0.73 | % | 0.73 | % | 0.73 | % | ||||||||||
Net expenses | 0.60 | % | 0.60 | % | 0.60 | % | 0.60 | % | 0.60 | % | ||||||||||
Net investment income | 2.54 | % | 3.02 | % | 3.27 | % | 3.18 | % | 3.15 | % | ||||||||||
Supplemental data | ||||||||||||||||||||
Portfolio turnover rate | 24 | % | 20 | % | 19 | % | 24 | % | 16 | % | ||||||||||
Net assets, end of period (000s omitted) | $1,017,781 | $832,318 | $227,116 | $108,715 | $270,304 | |||||||||||||||
| 1. | Calculated based upon average shares outstanding |
The accompanying notes are an integral part of these financial statements.
Wells Fargo Municipal Bond Fund | 57
Financial highlights
(For a share outstanding throughout each period)
| Year ended June 30 | ||||||||||||||||||||
| INSTITUTIONAL CLASS | 2020 | 2019 | 2018 | 2017 | 2016 | |||||||||||||||
Net asset value, beginning of period | $10.55 | $10.21 | $10.24 | $10.70 | $10.25 | |||||||||||||||
Net investment income | 0.29 | 0.33 | 0.35 | 0.36 | 0.34 | |||||||||||||||
Net realized and unrealized gains (losses) on investments | 0.01 | 0.34 | (0.01 | ) | (0.39 | ) | 0.50 | |||||||||||||
|
|
|
|
|
|
|
|
|
| |||||||||||
Total from investment operations | 0.30 | 0.67 | 0.34 | (0.03 | ) | 0.84 | ||||||||||||||
Distributions to shareholders from | ||||||||||||||||||||
Net investment income | (0.29 | ) | (0.33 | ) | (0.35 | ) | (0.36 | ) | (0.34 | ) | ||||||||||
Net realized gains | (0.01 | ) | 0.00 | (0.02 | ) | (0.07 | ) | (0.05 | ) | |||||||||||
|
|
|
|
|
|
|
|
|
| |||||||||||
Total distributions to shareholders | (0.30 | ) | (0.33 | ) | (0.37 | ) | (0.43 | ) | (0.39 | ) | ||||||||||
Net asset value, end of period | $10.55 | $10.55 | $10.21 | $10.24 | $10.70 | |||||||||||||||
Total return | 2.85 | % | 6.67 | % | 3.37 | % | (0.28 | )% | 8.35 | % | ||||||||||
Ratios to average net assets (annualized) | ||||||||||||||||||||
Gross expenses | 0.44 | % | 0.45 | % | 0.46 | % | 0.46 | % | 0.46 | % | ||||||||||
Net expenses | 0.44 | % | 0.45 | % | 0.46 | % | 0.46 | % | 0.46 | % | ||||||||||
Net investment income | 2.71 | % | 3.15 | % | 3.40 | % | 3.44 | % | 3.27 | % | ||||||||||
Supplemental data | ||||||||||||||||||||
Portfolio turnover rate | 24 | % | 20 | % | 19 | % | 24 | % | 16 | % | ||||||||||
Net assets, end of period (000s omitted) | $3,006,622 | $2,862,588 | $1,425,703 | $1,149,911 | $961,289 | |||||||||||||||
The accompanying notes are an integral part of these financial statements.
58 | Wells Fargo Municipal Bond Fund
1. ORGANIZATION
Wells Fargo Funds Trust (the “Trust”), a Delaware statutory trust organized on March 10, 1999, is an open-end management investment company registered under the Investment Company Act of 1940, as amended (the “1940 Act”). As an investment company, the Trust follows the accounting and reporting guidance in Financial Accounting Standards Board (“FASB”) Accounting Standards Codification Topic 946, Financial Services – Investment Companies. These financial statements report on the Wells Fargo Municipal Bond Fund (the “Fund”) which is a diversified series of the Trust.
2. SIGNIFICANT ACCOUNTING POLICIES
The following significant accounting policies, which are consistently followed in the preparation of the financial statements of the Fund, are in conformity with U.S. generally accepted accounting principles which require management to make estimates and assumptions that affect the reported amounts of assets and liabilities, disclosure of contingent assets and liabilities at the date of the financial statements, and the reported amounts of revenues and expenses during the reporting period. Actual results could differ from those estimates.
Securities valuation
All investments are valued each business day as of the close of regular trading on the New York Stock Exchange (generally 4 p.m. Eastern Time), although the Fund may deviate from this calculation time under unusual or unexpected circumstances.
Debt securities are valued at the evaluated bid price provided by an independent pricing service (e.g. taking into account various factors, including yields, maturities, or credit ratings) or, if a reliable price is not available, the quoted bid price from an independent broker-dealer.
Equity securities and futures contracts that are listed on a foreign or domestic exchange or market are valued at the official closing price or, if none, the last sales price. If no sale occurs on the principal exchange or market that day, a fair value price will be determined in accordance with the Fund’s Valuation Procedures.
Investments in registered open-end investment companies are valued at net asset value.
Investments which are not valued using any of the methods discussed above are valued at their fair value, as determined in good faith by the Board of Trustees of the Fund. The Board of Trustees has established a Valuation Committee comprised of the Trustees and has delegated to it the authority to take any actions regarding the valuation of portfolio securities that the Valuation Committee deems necessary or appropriate, including determining the fair value of portfolio securities, unless the determination has been delegated to the Wells Fargo Asset Management Pricing Committee at Wells Fargo Funds Management, LLC (“Funds Management”). The Board of Trustees retains the authority to make or ratify any valuation decisions or approve any changes to the Valuation Procedures as it deems appropriate. On a quarterly basis, the Board of Trustees receives reports on any valuation actions taken by the Valuation Committee or the Wells Fargo Asset Management Pricing Committee which may include items for ratification.
When-issued transactions
The Fund may purchase securities on a forward commitment or when-issued basis. The Fund records a when-issued transaction on the trade date and will segregate assets in an amount at least equal in value to the Fund’s commitment to purchase when-issued securities. Securities purchased on a when-issued basis are marked-to-market daily and the Fund begins earning interest on the settlement date. Losses may arise due to changes in the market value of the underlying securities or if the counterparty does not perform under the contract.
Futures contracts
Futures contracts are agreements between the Fund and a counterparty to buy or sell a specific amount of a commodity, financial instrument or currency at a specified price and on a specified date. The Fund may buy and sell futures contracts in order to gain exposure to, or protect against, changes in interest rates and is subject to interest rate risk. The primary risks associated with the use of futures contracts are the imperfect correlation between changes in market values of securities held by the Fund and the prices of futures contracts, and the possibility of an illiquid market. Futures contracts are generally entered into on a regulated futures exchange and cleared through a clearinghouse associated with the exchange. With futures contracts, there is minimal counterparty risk to the Fund since futures contracts are exchange traded and the exchange’s clearinghouse, as the counterparty to all exchange traded futures, guarantees the futures contracts against default.
Upon entering into a futures contracts, the Fund is required to deposit either cash or securities (initial margin) with the broker in an amount equal to a certain percentage of the contract value. Subsequent payments (variation margin) are paid to or from the broker each day equal to the daily changes in the contract value. Such payments are recorded as unrealized gains or losses and, if any, shown as variation margin receivable (payable) in the Statement of Assets and Liabilities. Should the Fund fail to
Wells Fargo Municipal Bond Fund | 59
Notes to financial statements
make requested variation margin payments, the broker can gain access to the initial margin to satisfy the Fund’s payment obligations. When the contracts are closed, a realized gain or loss is recorded in the Statement of Operations.
Security transactions and income recognition
Securities transactions are recorded on a trade date basis. Realized gains or losses are recorded on the basis of identified cost.
Interest income is accrued daily and bond discounts are accreted and premiums are amortized daily. To the extent debt obligations are placed on non-accrual status, any related interest income may be reduced by writing off interest receivables when the collection of all or a portion of interest has been determined to be doubtful based on consistently applied procedures and the fair value has decreased. If the issuer subsequently resumes interest payments or when the collectability of interest is reasonably assured, the debt obligation is removed from non-accrual status.
Income dividends and capital gain distributions from investment companies are recorded on the ex-dividend date. Capital gain distributions from investment companies are treated as realized gains.
Distributions to shareholders
Distributions to shareholders from net investment income are declared daily and paid monthly. Distributions from net realized gains, if any, are recorded on the ex-dividend date and paid at least annually. Such distributions are determined in accordance with income tax regulations and may differ from U.S. generally accepted accounting principles. Dividend sources are estimated at the time of declaration. The tax character of distributions is determined as of the Fund’s fiscal year end. Therefore, a portion of the Fund’s distributions made prior to the Fund’s fiscal year end may be categorized as a tax return of capital at year end.
Federal and other taxes
The Fund intends to continue to qualify as a regulated investment company by distributing substantially all of its investment company taxable income and any net realized capital gains (after reduction for capital loss carryforwards) sufficient to relieve it from all, or substantially all, federal income taxes. Accordingly, no provision for federal income taxes was required.
The Fund’s income and federal excise tax returns and all financial records supporting those returns for the prior three fiscal years are subject to examination by the federal and Delaware revenue authorities. Management has analyzed the Fund’s tax positions taken on federal, state, and foreign tax returns for all open tax years and does not believe that there are any uncertain tax positions that require recognition of a tax liability.
As of June 30, 2020, the aggregate cost of all investments for federal income tax purposes was $5,212,001,718 and the unrealized gains (losses) consisted of:
Gross unrealized gains | $ | 302,309,220 | ||
Gross unrealized losses | (17,200,315 | ) | ||
Net unrealized gains | $ | 285,108,905 | ||
Reclassifications are made to the Fund’s capital accounts for permanent tax differences to reflect income and gains available for distribution (or available capital loss carryforwards) under federal income tax regulations. U.S. generally accepted accounting principles require that certain components of net assets be adjusted to reflect permanent differences between financial and tax reporting. These reclassifications have no effect on net assets or net asset values per share. At June 30, 2020, as a result of permanent book-to-tax differences, the following reclassification adjustments were made on the Statement of Assets and Liabilities:
| Paid-in capital | Total distributable earnings | |
| $(168,502) | $168,502 | |
As of June 30, 2020, the Fund had current year deferred post-October capital losses consisting of $46,943,296 in short-term losses and $5,605,214 in long-term losses which will be recognized on the first day of the following fiscal year.
Class allocations
The separate classes of shares offered by the Fund differ principally in applicable sales charges, distribution, shareholder servicing, and administration fees. Class specific expenses are charged directly to that share class. Investment income, common fund-level expenses, and realized and unrealized gains (losses) on investments are allocated daily to each class of shares based on the relative proportion of net assets of each class.
60 | Wells Fargo Municipal Bond Fund
Notes to financial statements
3. FAIR VALUATION MEASUREMENTS
Fair value measurements of investments are determined within a framework that has established a fair value hierarchy based upon the various data inputs utilized in determining the value of the Fund’s investments. The three-level hierarchy gives the highest priority to unadjusted quoted prices in active markets for identical assets or liabilities (Level 1) and the lowest priority to unobservable inputs (Level 3). The Fund’s investments are classified within the fair value hierarchy based on the lowest level of input that is significant to the fair value measurement. The inputs are summarized into three broad levels as follows:
| ∎ | Level 1 – quoted prices in active markets for identical securities |
| ∎ | Level 2 – other significant observable inputs (including quoted prices for similar securities, interest rates, prepayment speeds, credit risk, etc.) |
| ∎ | Level 3 – significant unobservable inputs (including the Fund’s own assumptions in determining the fair value of investments) |
The inputs or methodologies used for valuing investments in securities are not necessarily an indication of the risk associated with investing in those securities.
The following is a summary of the inputs used in valuing the Fund’s assets and liabilities as of June 30, 2020:
| Quoted prices (Level 1) | Other significant observable inputs (Level 2) | Significant (Level 3) | Total | |||||||||||||
Assets | ||||||||||||||||
Investments in: | ||||||||||||||||
Municipal obligations | $ | 0 | $ | 5,457,252,794 | $ | 0 | $ | 5,457,252,794 | ||||||||
Closed end municipal bond fund obligations | 0 | 6,000,000 | 0 | 6,000,000 | ||||||||||||
Short-term investments | ||||||||||||||||
Investment companies | 33,857,829 | 0 | 0 | 33,857,829 | ||||||||||||
Total assets | $ | 33,857,829 | $ | 5,463,252,794 | $ | 0 | $ | 5,497,110,623 | ||||||||
Additional sector, industry or geographic detail is included in the Portfolio of Investments.
For the year ended June 30, 2020, the Fund did not have any transfers into/out of Level 3.
4. TRANSACTIONS WITH AFFILIATES
Management fee
Funds Management, an indirect wholly owned subsidiary of Wells Fargo & Company (“Wells Fargo”), is the manager of the Fund and provides advisory and fund-level administrative services under an investment management agreement. Under the investment management agreement, Funds Management is responsible for, among other services, implementing the investment objectives and strategies of the Fund, supervising the subadviser and providing fund-level administrative services in connection with the Fund’s operations. As compensation for its services under the investment management agreement, Funds Management is entitled to receive a management fee at the following annual rate based on the Fund’s average daily net assets:
| Average daily net assets | Management fee | |||
First $500 million | 0.400 | % | ||
Next $500 million | 0.375 | |||
Next $2 billion | 0.350 | |||
Next $2 billion | 0.325 | |||
Next $5 million | 0.290 | |||
Over $10 billion | 0.280 | |||
For the year ended June 30, 2020, the management fee was equivalent to an annual rate of 0.34% of the Fund’s average daily net assets.
Wells Fargo Municipal Bond Fund | 61
Notes to financial statements
Funds Management has retained the services of a subadviser to provide daily portfolio management to the Fund. The fee for subadvisory services is borne by Funds Management. Wells Capital Management Incorporated, an affiliate of Funds Management and an indirect wholly owned subsidiary of Wells Fargo, is the subadviser to the Fund and is entitled to receive a fee from Funds Management at an annual rate starting at 0.20% and declining to 0.10% as the average daily net assets of the Fund increase.
Administration fees
Under a class-level administration agreement, Funds Management provides class-level administrative services to the Fund, which includes paying fees and expenses for services provided by the transfer agent, sub-transfer agents, omnibus account servicers and record-keepers. As compensation for its services under the class-level administration agreement, Funds Management receives an annual fee which is calculated based on the average daily net assets of each class as follows:
| Class-level administration fee | ||||
Class A, Class C | 0.16 | % | ||
Class R6 | 0.03 | |||
Administrator Class | 0.10 | |||
Institutional Class | 0.08 | |||
Waivers and/or expense reimbursements
Funds Management has contractually waived and/or reimbursed management and administration fees to the extent necessary to maintain certain net operating expense ratios for the Fund. When each class of the Fund has exceeded its expense cap, Funds Management has waived fees and/or reimbursed expenses from fund-level expenses on a proportionate basis and then from class specific expenses. When only certain classes exceed their expense caps, waivers and/or reimbursements are applied against class specific expenses before fund-level expenses. Funds Management has committed through October 31, 2020 to waive fees and/or reimburse expenses to the extent necessary to cap the Fund’s expenses at 0.75% for Class A shares, 1.50% for Class C shares, 0.43% for Class R6 shares, 0.60% for Administrator Class shares and 0.48% for Institutional Class shares. Prior to or after the commitment expiration date, the cap may be increased or the commitment to maintain the cap may be terminated only with the approval of the Board of Trustees.
Distribution fee
The Trust has adopted a distribution plan for Class C shares of the Fund pursuant to Rule 12b-1 under the 1940 Act. A distribution fee is charged to Class C shares and paid to Wells Fargo Funds Distributor, LLC (“Funds Distributor”), the principal underwriter, at an annual rate of 0.75% of the average daily net assets of Class C shares.
In addition, Funds Distributor is entitled to receive the front-end sales charge from the purchase of Class A shares and a contingent deferred sales charge on the redemption of certain Class A shares. Funds Distributor is also entitled to receive the contingent deferred sales charges from redemptions of Class C shares. For the year ended June 30, 2020, Funds Distributor received $26,524 from the sale of Class A shares. No contingent deferred sales charges were incurred by Class A and Class C shares for the year ended June 30, 2020.
Shareholder servicing fees
The Trust has entered into contracts with one or more shareholder servicing agents, whereby Class A, Class C, and Administrator Class of the Fund are charged a fee at an annual rate of 0.25% of the average daily net assets of each respective class. A portion of these total shareholder servicing fees were paid to affiliates of Wells Fargo.
Interfund transactions
The Fund may purchase or sell portfolio investment securities to certain other Wells Fargo affiliates pursuant to Rule 17a-7 under the 1940 Act and under procedures adopted by the Board of Trustees. The procedures have been designed to ensure that these interfund transactions, which do not incur broker commissions, are effected at current market prices. Pursuant to these procedures, the Fund had $305,366,000 and $302,120,000 in interfund purchases and sales, respectively, during the year ended June 30, 2020.
5. INVESTMENT PORTFOLIO TRANSACTIONS
Purchases and sales of investments, excluding U.S. government obligations (if any) and short-term securities, for the year ended June 30, 2020 were $1,834,965,422 and $1,233,590,216, respectively.
62 | Wells Fargo Municipal Bond Fund
Notes to financial statements
6. DERIVATIVE TRANSACTIONS
During the year ended June 30, 2020, the Fund entered into futures contracts to take advantage of the differences between municipal and treasury yields and to help manage the duration of the portfolio. The Fund had an average notional amount of $5,916 in short futures contracts during the year ended June 30, 2020.
The fair value, realized gains or losses and change in unrealized gains or losses, if any, on derivative instruments are reflected in the corresponding financial statement captions.
7. ACQUISITIONS
After the close of business on March 15, 2019, the Fund acquired the net assets of Wells Fargo Colorado Tax-Free Fund and Wells Fargo North Carolina Tax-Free Fund (collectively, the “Acquired Funds”). The purpose of the transactions was to combine three funds with similar investment objectives and strategies. The Fund became the accounting and performance survivor in the transaction. The acquisitions were accomplished by a tax-free exchange of all of the shares of the Acquired Funds for shares of the Fund. Shareholders holding Class A, Class C and Institutional Class shares of the Acquired Funds each received Class A, Class C, and Institutional Class shares, respectively, of the Fund in the reorganizations. Administrator Class Shares of Wells Fargo Colorado Tax-Free Fund received Administrator Class shares of the Fund. The investment portfolio of Wells Fargo Colorado Tax-Free Fund and Wells Fargo North Carolina Tax-Free Fund with fair values of $67,159,606 and $39,269,320, respectively, and identified costs of $63,687,809 and $37,881,620, respectively, at March 15, 2019 were the principal assets acquired by the Fund. For financial reporting purposes, assets received and shares issued by the Fund were recorded at fair value; however, the cost basis of the investments received from the Acquired Funds were carried forward to align ongoing reporting of the Fund’s realized and unrealized gains and losses with amounts distributable to shareholders for tax purposes. The value of net assets acquired, unrealized gains acquired, exchange ratio and number of shares issued were as follows:
| Acquired fund | Value of net assets acquired | Unrealized gains | Exchange ratio | Number of shares issued | ||||||||||||||
Wells Fargo Colorado Tax-Free Fund | $ | 69,585,137 | $ | 3,471,797 | 1.04 | 2,805,719 | Class A | |||||||||||
| 1.05 | 578,776 | Class C | ||||||||||||||||
| 1.04 | 1,758,364 | AdministratorClass | ||||||||||||||||
| 1.05 | 1,609,227 | Institutional Class | ||||||||||||||||
Wells Fargo North Carolina Tax-Free Fund | 40,561,601 | 1,387,700 | 0.97 | 2,235,777 | Class A | |||||||||||||
| 0.97 | 185,614 | Class C | ||||||||||||||||
| 0.97 | 1,514,788 | Institutional Class | ||||||||||||||||
The aggregate net assets of the Fund immediately before and after the acquisitions were $3,786,391,719 and $3,896,538,457, respectively.
Assuming the acquisitions had been completed July 1, 2018, the beginning of the annual reporting period for the Fund, the pro forma results of operations for the year ended June 30, 2019 would have been
Net investment income | $ | 114,397,248 | ||
Net realized and unrealized gains on investments | $ | 149,990,955 | ||
Net increase in net assets resulting from operations | $ | 264,388,203 | ||
8. BANK BORROWINGS
The Trust (excluding the money market funds), Wells Fargo Master Trust and Wells Fargo Variable Trust are parties to a $350,000,000 revolving credit agreement whereby the Fund is permitted to use bank borrowings for temporary or emergency purposes, such as to fund shareholder redemption requests. Interest under the credit agreement is charged to the Fund based on a borrowing rate equal to the higher of the Federal Funds rate in effect on that day plus 1.25% or the overnight LIBOR rate in effect on that day plus 1.25%. In addition, an annual commitment fee equal to 0.25% of the unused balance is allocated to each participating fund.
For the year ended June 30, 2020, there were no borrowings by the Fund under the agreement.
Wells Fargo Municipal Bond Fund | 63
Notes to financial statements
9. DISTRIBUTIONS TO SHAREHOLDERS
The tax character of distributions paid during the years ended June 30, 2020 and June 30, 2019 were as follows:
| Year ended June 30 | ||||||||
| 2020 | 2019 | |||||||
Ordinary income | $ | 5,608,097 | $ | 0 | ||||
Tax-exempt income | 139,262,547 | 111,298,957 | ||||||
As of June 30, 2020, the components of distributable earnings on a tax basis were as follows:
Undistributed tax-exempt income | Unrealized gains | Post-October capital | ||
$907,771 | $285,108,905 | $(52,548,510) | ||
10. INDEMNIFICATION
Under the Fund’s organizational documents, the officers and Trustees have been granted certain indemnification rights against certain liabilities that may arise out of performance of their duties to the Fund. The Fund has entered into a separate agreement with each Trustee that converts indemnification rights currently existing under the Fund’s organizational documents into contractual rights that cannot be changed in the future without the consent of the Trustee. Additionally, in the normal course of business, the Fund may enter into contracts with service providers that contain a variety of indemnification clauses. The Fund’s maximum exposure under these arrangements is dependent on future claims that may be made against the Fund and, therefore, cannot be estimated.
11. NEW ACCOUNTING PRONOUNCEMENT
In August 2018, FASB issued Accounting Standards Update (“ASU”) No. 2018-13, Fair Value Measurement (Topic 820) Disclosure Framework—Changes to the Disclosure Requirements for Fair Value Measurement. ASU 2018-13 updates the disclosure requirements on fair value measurements in Topic 820, Fair Value Measurements. The amendments are effective for fiscal years, and interim periods within those fiscal years, beginning after December 15, 2019. Management has adopted this guidance which did not have a material impact on the financial statements.
12. CORONAVIRUS (COVID-19) PANDEMIC
On March 11, 2020, the World Health Organization announced that it had made the assessment that coronavirus disease 2019 (“COVID-19”) is a pandemic. The impacts of COVID-19 are adversely affecting the entire global economy, individual companies and investment products, and the market in general. There is significant uncertainty around the extent and duration of business disruptions related to COVID-19 and the impacts may be short term or may last for an extended period of time. The risk of further spreading of COVID-19 has led to significant uncertainty and volatility in the financial markets.
64 | Wells Fargo Municipal Bond Fund
Report of independent registered public accounting firm
To the Shareholders of the Fund and Board of Trustees
Wells Fargo Funds Trust:
Opinion on the Financial Statements
We have audited the accompanying statement of assets and liabilities of Wells Fargo Municipal Bond Fund (the Fund), one of the funds constituting Wells Fargo Funds Trust, including the portfolio of investments, as of June 30, 2020, the related statement of operations for the year then ended, the statements of changes in net assets for each of the years in the two-year period then ended, and the related notes (collectively, the financial statements) and the financial highlights for each of the years or periods in the five-year period then ended. In our opinion, the financial statements and financial highlights present fairly, in all material respects, the financial position of the Fund as of June 30, 2020, the results of its operations for the year then ended, the changes in its net assets for each of the years in the two-year period then ended, and the financial highlights for each of the years or periods in the five-year period then ended, in conformity with U.S. generally accepted accounting principles.
Basis for Opinion
These financial statements and financial highlights are the responsibility of the Fund’s management. Our responsibility is to express an opinion on these financial statements and financial highlights based on our audits. We are a public accounting firm registered with the Public Company Accounting Oversight Board (United States) (PCAOB) and are required to be independent with respect to the Fund in accordance with the U.S. federal securities laws and the applicable rules and regulations of the Securities and Exchange Commission and the PCAOB.
We conducted our audits in accordance with the standards of the PCAOB. Those standards require that we plan and perform the audit to obtain reasonable assurance about whether the financial statements and financial highlights are free of material misstatement, whether due to error or fraud. Our audits included performing procedures to assess the risks of material misstatement of the financial statements and financial highlights, whether due to error or fraud, and performing procedures that respond to those risks. Such procedures included examining, on a test basis, evidence regarding the amounts and disclosures in the financial statements and financial highlights. Such procedures also included confirmation of securities owned as of June 30, 2020, by correspondence with the custodian, transfer agent and brokers, or by other appropriate auditing procedures. Our audits also included evaluating the accounting principles used and significant estimates made by management, as well as evaluating the overall presentation of the financial statements and financial highlights. We believe that our audits provide a reasonable basis for our opinion.

We have not been able to determine the specific year that we began serving as the auditor of one or more Wells Fargo Funds investment companies; however we are aware that we have served as the auditor of one or more Wells Fargo Funds investment companies since at least 1955.
Boston, Massachusetts
August 29, 2020
Wells Fargo Municipal Bond Fund | 65
TAX INFORMATION
For the fiscal year ended June 30, 2020, $170,848 has been designated as interest-related dividends for nonresident alien shareholders pursuant to Section 871 of the Internal Revenue Code.
For the fiscal year ended June 30, 2020, $1,577,042 has been designated as short-term capital gain dividends for nonresident alien shareholders pursuant to Section 871 of the Internal Revenue Code.
Pursuant to Section 852 of the Internal Revenue Code, 100% of distributions paid from net investment income is designated as exempt-interest dividends for the fiscal year ended June 30, 2020.
PROXY VOTING INFORMATION
A description of the policies and procedures used to determine how to vote proxies relating to portfolio securities is available, upon request, by calling 1-800-222-8222, visiting our website at wfam.com, or visiting the SEC website at sec.gov. Information regarding how the proxies related to portfolio securities were voted during the most recent 12-month period ended June 30 is available on the website at wfam.com or by visiting the SEC website at sec.gov.
QUARTERLY PORTFOLIO HOLDINGS INFORMATION
The Fund files its complete schedule of portfolio holdings with the SEC for the first and third quarters of each fiscal year as an exhibit to its reports on Form N-PORT. Shareholders may view the filed Form N-PORT by visiting the SEC website at sec.gov.
66 | Wells Fargo Municipal Bond Fund
Other information (unaudited)
BOARD OF TRUSTEES AND OFFICERS
Each of the Trustees and Officers1 listed in the table below acts in identical capacities for each fund in the Wells Fargo family of funds, which consists of 147 mutual funds comprising the Wells Fargo Funds Trust, Wells Fargo Variable Trust, Wells Fargo Master Trust and four closed-end funds (collectively the “Fund Complex”). This table should be read in conjunction with the Prospectus and the Statement of Additional Information2. The mailing address of each Trustee and Officer is 525 Market Street, 12th Floor, San Francisco, CA 94105. Each Trustee and Officer serves an indefinite term, however, each Trustee serves such term until reaching the mandatory retirement age established by the Trustees.
Independent Trustees
Name and year of birth | Position held and length of service* | Principal occupations during past five years or longer | Current other public company or investment company directorships | |||
| William R. Ebsworth (Born 1957) | Trustee, since 2015 | Retired. From 1984 to 2013, equities analyst, portfolio manager, research director and chief investment officer at Fidelity Management and Research Company in Boston, Tokyo, and Hong Kong, and retired in 2013 as Chief Investment Officer of Fidelity Strategic Advisers, Inc. where he led a team of investment professionals managing client assets. Prior thereto, Board member of Hong Kong Securities Clearing Co., Hong Kong Options Clearing Corp., the Thailand International Fund, Ltd., Fidelity Investments Life Insurance Company, and Empire Fidelity Investments Life Insurance Company. Audit Committee Chair and Investment Committee Chair of the Vincent Memorial Hospital Endowment (non-profit organization). Mr. Ebsworth is a CFA® charterholder. | N/A | |||
| Jane A. Freeman (Born 1953) | Trustee, since 2015; Chair Liaison, since 2018 | Retired. From 2012 to 2014 and 1999 to 2008, Chief Financial Officer of Scientific Learning Corporation. From 2008 to 2012, Ms. Freeman provided consulting services related to strategic business projects. Prior to 1999, Portfolio Manager at Rockefeller & Co. and Scudder, Stevens & Clark. Board member of the Harding Loevner Funds from 1996 to 2014, serving as both Lead Independent Director and chair of the Audit Committee. Board member of the Russell Exchange Traded Funds Trust from 2011 to 2012 and the chair of the Audit Committee. Ms. Freeman is also an inactive Chartered Financial Analyst. | N/A | |||
| Isaiah Harris, Jr. (Born 1952) | Trustee, since 2009; Audit Committee Chairman, since 2019 | Retired. Chairman of the Board of CIGNA Corporation since 2009, and Director since 2005. From 2003 to 2011, Director of Deluxe Corporation. Prior thereto, President and CEO of BellSouth Advertising and Publishing Corp. from 2005 to 2007, President and CEO of BellSouth Enterprises from 2004 to 2005 and President of BellSouth Consumer Services from 2000 to 2003. Emeritus member of the Iowa State University Foundation Board of Governors. Emeritus Member of the Advisory Board of Iowa State University School of Business. Advisory Board Member, Palm Harbor Academy (private school). Advisory Board Member, Child Evangelism Fellowship (non-profit). Mr. Harris is a certified public accountant (inactive status). | CIGNA Corporation | |||
| Judith M. Johnson (Born 1949) | Trustee, since 2008; Audit Committee Chairman, from 2009 to 2018 | Retired. Prior thereto, Chief Executive Officer and Chief Investment Officer of Minneapolis Employees Retirement Fund from 1996 to 2008. Ms. Johnson is an attorney, certified public accountant and a certified managerial accountant. | N/A | |||
Wells Fargo Municipal Bond Fund | 67
Other information (unaudited)
Name and year of birth | Position held and length of service* | Principal occupations during past five years or longer | Current other public company or investment company directorships | |||
| David F. Larcker (Born 1950) | Trustee, since 2009 | James Irvin Miller Professor of Accounting at the Graduate School of Business, Stanford University, Director of the Corporate Governance Research Initiative and Senior Faculty of The Rock Center for Corporate Governance since 2006. From 2005 to 2008, Professor of Accounting at the Graduate School of Business, Stanford University. Prior thereto, Ernst & Young Professor of Accounting at The Wharton School, University of Pennsylvania from 1985 to 2005. | N/A | |||
| Olivia S. Mitchell (Born 1953) | Trustee, since 2006; Nominating and Governance Committee Chair, since 2018 | International Foundation of Employee Benefit Plans Professor, Wharton School of the University of Pennsylvania since 1993. Director of Wharton’s Pension Research Council and Boettner Center on Pensions & Retirement Research, and Research Associate at the National Bureau of Economic Research. Previously, Cornell University Professor from 1978 to 1993. | N/A | |||
| Timothy J. Penny (Born 1951) | Trustee, since 1996; Chairman, since 2018 | President and Chief Executive Officer of Southern Minnesota Initiative Foundation, a non-profit organization, since 2007. Member of the Board of Trustees of NorthStar Education Finance, Inc., a non-profit organization, since 2007. | N/A | |||
| James G. Polisson (Born 1959) | Trustee, since 2018 | Retired. Chief Marketing Officer, Source (ETF) UK Services, Ltd, from 2015 to 2017. From 2012 to 2015, Principal of The Polisson Group, LLC, a management consulting, corporate advisory and principal investing company. Chief Executive Officer and Managing Director at Russell Investments, Global Exchange Traded Funds from 2010 to 2012. Managing Director of Barclays Global Investors from 1998 to 2010 and Global Chief Marketing Officer for iShares and Barclays Global Investors from 2000 to 2010. Trustee of the San Francisco Mechanics’ Institute, a non-profit organization, from 2013 to 2015. Board member of the Russell Exchange Traded Fund Trust from 2011 to 2012. Director of Barclays Global Investors Holdings Deutschland GmbH from 2006 to 2009. Mr. Polisson is an attorney and has a retired status with the Massachusetts and District of Columbia Bar Associations. | N/A | |||
| Pamela Wheelock (Born 1959) | Trustee, since January 2020; previously Trustee from January 2018 to July 2019 | Board member of the Destination Medical Center Economic Development Agency, Rochester, Minnesota since 2019 and Interim President of the McKnight Foundation since 2020. Acting Commissioner, Minnesota Department of Human Services, July 2019 through September 2019. Human Services Manager (part-time), Minnesota Department of Human Services, October 2019 through December 2019. Chief Operating Officer, Twin Cities Habitat for Humanity from 2017 to 2019. Vice President of University Services, University of Minnesota from 2012 to 2016. Prior thereto, on the Board of Directors, Governance Committee and Finance Committee for the Minnesota Philanthropy Partners (Saint Paul Foundation) from 2012 to 2018, Interim Chief Executive Officer of Blue Cross Blue Shield of Minnesota from 2011 to 2012, Chairman of the Board from 2009 to 2012 and Board Director from 2003 to 2015. Vice President, Leadership and Community Engagement, Bush Foundation, Saint Paul, Minnesota (a private foundation) from 2009 to 2011. Executive Vice President and Chief Financial Officer, Minnesota Sports and Entertainment from 2004 to 2009 and Senior Vice President from 2002 to 2004. Executive Vice President of the Minnesota Wild Foundation from 2004 to 2008. Commissioner of Finance, State of Minnesota, from 1999 to 2002. Currently Board Chair of the Minnesota Wild Foundation since 2010. | N/A | |||
| * | Length of service dates reflect the Trustee’s commencement of service with the Trust’s predecessor entities, where applicable. |
68 | Wells Fargo Municipal Bond Fund
Other information (unaudited)
Officers
Name and year of birth | Position held and length of service | Principal occupations during past five years or longer | ||
Andrew Owen (Born 1960) | President, since 2017 | Executive Vice President of Wells Fargo & Company and Head of Affiliated Managers, Wells Fargo Asset Management, since 2014. In addition, Mr. Owen is currently President, Chief Executive Officer and Director of Wells Fargo Funds Management, LLC since 2017. Prior thereto, Executive Vice President responsible for marketing, investments and product development for Wells Fargo Funds Management, LLC, from 2009 to 2014. | ||
Nancy Wiser1 (Born 1967) | Treasurer, since 2012 | Executive Vice President of Wells Fargo Funds Management, LLC since 2011. Chief Operating Officer and Chief Compliance Officer at LightBox Capital Management LLC, from 2008 to 2011. | ||
Michelle Rhee (Born 1966) | Chief Legal Officer, since 2019 | Secretary of Wells Fargo Funds Management, LLC, Chief Legal Counsel of Wells Fargo Asset Management and Assistant General Counsel of Wells Fargo Bank, N.A. since 2018. Associate General Counsel and Managing Director of Bank of America Corporation from 2004 to 2018. | ||
Catherine Kennedy (Born 1969) | Secretary, since 2019 | Vice President of Wells Fargo Funds Management, LLC and Senior Counsel of the Wells Fargo Legal Department since 2010. Vice President and Senior Counsel of Evergreen Investment Management Company, LLC from 1998 to 2010. | ||
Michael H. Whitaker (Born 1967) | Chief Compliance Officer, since 2016 | Chief Compliance Officer of Wells Fargo Asset Management since 2016. Senior Vice President and Chief Compliance Officer for Fidelity Investments from 2007 to 2016. | ||
David Berardi (Born 1975) | Assistant Treasurer, since 2009 | Vice President of Wells Fargo Funds Management, LLC since 2009. Vice President of Evergreen Investment Management Company, LLC from 2008 to 2010. Manager of Fund Reporting and Control for Evergreen Investment Management Company, LLC from 2004 to 2010. | ||
Jeremy DePalma1 (Born 1974) | Assistant Treasurer, since 2009 | Senior Vice President of Wells Fargo Funds Management, LLC since 2009. Senior Vice President of Evergreen Investment Management Company, LLC from 2008 to 2010 and head of the Fund Reporting and Control Team within Fund Administration from 2005 to 2010. | ||
| 1 | Nancy Wiser acts as Treasurer of 65 funds in the Fund Complex. Jeremy DePalma acts as the Treasurer of 82 funds and Assistant Treasurer of 65 funds in the Fund Complex. |
| 2 | The Statement of Additional Information includes additional information about the Trustees and is available, without charge, upon request, by calling 1-800-222-8222 or by visiting the website at wfam.com. |
Wells Fargo Municipal Bond Fund | 69
Other information (unaudited)
BOARD CONSIDERATION OF INVESTMENT MANAGEMENT AND SUB-ADVISORY AGREEMENTS:
Wells Fargo Municipal Bond Fund
Under the Investment Company Act of 1940 (the “1940 Act”), the Board of Trustees (the “Board”) of Wells Fargo Funds Trust (the “Trust”) must determine annually whether to approve the continuation of the Trust’s investment management and sub-advisory agreements. In this regard, at a Board meeting held on May 26, 2020 and May 28, 2020 (together, the “Meeting”), the Board, all the members of which have no direct or indirect interest in the investment management and sub-advisory agreements and are not “interested persons” of the Trust, as defined in the 1940 Act (the “Independent Trustees”), reviewed and approved for Wells Fargo Municipal Bond Fund (the “Fund”): (i) an investment management agreement (the “Management Agreement”) with Wells Fargo Funds Management, LLC (“Funds Management”); and (ii) an investment sub-advisory agreement (the “Sub-Advisory Agreement”) with Wells Capital Management Incorporated (the “Sub-Adviser”), an affiliate of Funds Management. The Management Agreement and the Sub-Advisory Agreement are collectively referred to as the “Advisory Agreements.”
At the Meeting, the Board considered the factors and reached the conclusions described below relating to the selection of Funds Management and the Sub-Adviser and the approval of the Advisory Agreements. Prior to the Meeting, including at a Board meeting held in April 2020, the Trustees conferred extensively among themselves and with representatives of Funds Management about these matters. Also, the Board has adopted a team-based approach, with each team consisting of a sub-set of Trustees, to assist the full Board in the discharge of its duties in reviewing investment performance and other matters throughout the year. The Independent Trustees were assisted in their evaluation of the Advisory Agreements by independent legal counsel, from whom they received separate legal advice and with whom they met separately.
In providing information to the Board, Funds Management and the Sub-Adviser were guided by a detailed set of requests for information submitted to them by independent legal counsel on behalf of the Independent Trustees at the start of the Board’s annual contract renewal process earlier in 2020. In considering and approving the Advisory Agreements, the Trustees considered the information they believed relevant, including but not limited to the information discussed below. The Board considered not only the specific information presented in connection with the Meeting, but also the knowledge gained over time through interaction with Funds Management and the Sub-Adviser about various topics. In this regard, the Board reviewed reports of Funds Management at each of its quarterly meetings, which included, among other things, portfolio reviews and investment performance reports. In addition, the Board and the teams mentioned above confer with portfolio managers at various times throughout the year. The Board did not identify any particular information or consideration that was all-important or controlling, and each individual Trustee may have attributed different weights to various factors.
After its deliberations, the Board unanimously approved the continuation of the Advisory Agreements for a one-year term and determined that the compensation payable to Funds Management and the Sub-Adviser under each of the Advisory Agreements was reasonable. The Board considered the approval of the Advisory Agreements for the Fund as part of its consideration of agreements for funds across the complex, but its approvals were made on a fund-by-fund basis. The following summarizes a number of important, but not necessarily all, factors considered by the Board in support of its approvals.
Nature, extent and quality of services
The Board received and considered various information regarding the nature, extent and quality of services provided to the Fund by Funds Management and the Sub-Adviser under the Advisory Agreements. This information included a description of the investment advisory services and Fund-level administrative services covered by the Management Agreement, as well as, among other things, a summary of the background and experience of senior management of Wells Fargo Asset Management (“WFAM”), of which Funds Management and the Sub-Adviser are a part, and a summary of investments made in the business of WFAM. The Board also received a description of Funds Management’s and the Sub-Adviser’s business continuity plans and of their approaches to data privacy and cybersecurity, and related testing. The Board also received and reviewed information about Funds Management’s role as administrator of the Fund’s liquidity risk management program, Funds Management’s approach to risk management, and Funds Management’s intermediary and vendor oversight program.
The Board also considered the qualifications, background, tenure and responsibilities of each of the portfolio managers primarily responsible for the day-to-day portfolio management of the Fund. The Board evaluated the ability of Funds Management and the Sub-Adviser to attract and retain qualified investment professionals, including research, advisory and supervisory personnel. The Board further considered the compliance programs and compliance records of Funds Management and the Sub-Adviser. In addition, the Board took into account the full range of services provided to the Fund by Funds Management and its affiliates.
70 | Wells Fargo Municipal Bond Fund
Other information (unaudited)
Fund investment performance and expenses
The Board considered the investment performance results for the Fund over various time periods ended December 31, 2019. The Board also considered more current results for various time periods ended March 31, 2020. The Board considered these results in comparison to the investment performance of funds in a universe that was determined by Broadridge Inc. (“Broadridge”) to be similar to the Fund (the “Universe”), and in comparison to the Fund’s benchmark index and to other comparative data. Broadridge is an independent provider of investment company data. The Board received a description of the methodology used by Broadridge to select the mutual funds in the performance Universe. The Board noted that the investment performance of the Fund (Administrator Class) was higher than the average investment performance of the Universe for the three-, five- and ten-year periods ended December 31, 2019, and lower than the average investment performance of the Universe for the one-year period ended December 31, 2019. The Board also noted that the investment performance of the Fund (Administrator Class) was higher than the average investment performance of the Universe for all periods ended March 31, 2020. The Board also noted that the investment performance of the Fund was higher than its benchmark index, the Bloomberg Barclays Municipal Bond Index, for the three-, five- and ten-year periods ended December 31, 2019, and lower than its benchmark index for the one-year period ended December 31, 2019. The Board also noted that the investment performance of the Fund was higher than its benchmark index, the Bloomberg Barclays Municipal Bond Index, for the three-, five- and ten-year periods ended March 31, 2020, and lower than its benchmark index for the one-year period ended March 31, 2020.
The Board also received and considered information regarding the Fund’s net operating expense ratios and their various components, including actual management fees, custodian and other non-management fees, and Rule 12b-1 and non-Rule 12b-1 shareholder service fees. The Board considered these ratios in comparison to the median ratios of funds in class-specific expense groups that were determined by Broadridge to be similar to the Fund (the “Groups”). The Board received a description of the methodology used by Broadridge to select the mutual funds in the expense Groups and an explanation of how funds comprising expense groups and their expense ratios may vary from year-to-year. Based on the Broadridge reports, the Board noted that the net operating expense ratios of the Fund were lower than or equal to the median net operating expense ratios of the expense Groups for each share class.
The Board took into account the Fund’s investment performance and expense information provided to it among the factors considered in deciding to re-approve the Advisory Agreements.
Investment management and sub-advisory fee rates
The Board reviewed and considered the contractual fee rates payable by the Fund to Funds Management under the Management Agreement, as well as the contractual fee rates payable by the Fund to Funds Management for class-level administrative services under a Class-Level Administration Agreement, which include, among other things, class-level transfer agency and sub-transfer agency costs (collectively, the “Management Rates”). The Board also reviewed and considered the contractual investment sub-advisory fee rates that are payable by Funds Management to the Sub-Adviser for investment sub-advisory services.
Among other information reviewed by the Board was a comparison of the Fund’s Management Rates with the average contractual investment management fee rates of funds in the expense Groups at a common asset level as well as transfer agency costs of the funds in the expense Groups. The Board noted that the Management Rates of the Fund were lower than or in range of the sum of these average rates for the Fund’s expense Groups for all share classes.
The Board also received and considered information about the portion of the total management fee that was retained by Funds Management after payment of the fee to the Sub-Adviser for sub-advisory services. In assessing the reasonableness of this amount, the Board received and evaluated information about the nature and extent of responsibilities retained and risks assumed by Funds Management and not delegated to or assumed by the Sub-Adviser, and about Funds Management’s on-going oversight services. Given the affiliation between Funds Management and the Sub-Adviser, the Board ascribed limited relevance to the allocation of fees between them.
The Board also received and considered information about the nature and extent of services offered and fee rates charged by Funds Management and the Sub-Adviser to other types of clients with investment strategies similar to those of the Fund. In this regard, the Board received information about the significantly greater scope of services, and compliance, reporting and other legal burdens and risks of managing proprietary mutual funds compared with those associated with managing assets of other types of clients, including third-party sub-advised fund clients and non-mutual fund clients such as institutional separate accounts.
Based on its consideration of the factors and information it deemed relevant, including those described here, the Board determined that the compensation payable to Funds Management under the Management Agreement and to the Sub-Adviser under the Sub-Advisory Agreement was reasonable.
Wells Fargo Municipal Bond Fund | 71
Other information (unaudited)
Profitability
The Board received and considered information concerning the profitability of Funds Management, as well as the profitability of both WFAM and Wells Fargo & Co. (“Wells Fargo”) from providing services to the fund family as a whole. The Board noted that the Sub-Adviser’s profitability information with respect to providing services to the Fund and other funds in the family was subsumed in the WFAM and Wells Fargo profitability analysis.
Funds Management reported on the methodologies and estimates used in calculating profitability, including a description of the methodology used to allocate certain expenses. Among other things, the Board noted that the levels of profitability reported on a fund-by-fund basis varied widely, depending on factors such as the size, type and age of fund.
Based on its review, the Board did not deem the profits reported by Funds Management, WFAM or Wells Fargo from services provided to the Fund to be at a level that would prevent it from approving the continuation of the Advisory Agreements.
Economies of scale
The Board received and considered information about the potential for Funds Management to experience economies of scale in the provision of management services to the Fund, the difficulties of calculating economies of scale at an individual fund level, and the extent to which potential scale benefits are shared with shareholders. The Board noted the existence of breakpoints in the Fund’s management fee structure, which operate generally to reduce the Fund’s expense ratios as the Fund grows in size, and the size of the Fund in relation to such breakpoints. The Board considered that in addition to management fee breakpoints, Funds Management shares potential economies of scale from its management business in a variety of ways, including through fee waiver and expense reimbursement arrangements, services that benefit shareholders, competitive management fee rates set at the outset without regard to breakpoints, and investments in the business intended to enhance services available to shareholders.
The Board concluded that Funds Management’s arrangements with respect to the Fund, including contractual breakpoints, constituted a reasonable approach to sharing potential economies of scale with the Fund and its shareholders.
Other benefits to Funds Management and the Sub-Adviser
The Board received and considered information regarding potential “fall-out” or ancillary benefits received by Funds Management and its affiliates, including the Sub-Adviser, as a result of their relationships with the Fund. Ancillary benefits could include, among others, benefits directly attributable to other relationships with the Fund and benefits potentially derived from an increase in Funds Management’s and the Sub-Adviser’s business as a result of their relationships with the Fund. The Board noted that various affiliates of Funds Management may receive distribution-related fees, shareholder servicing payments and sub-transfer agency fees in respect of shares sold or held through them and services provided.
The Board also reviewed information about soft dollar credits earned and utilized by the Sub-Adviser, fees earned by Funds Management and the Sub-Adviser from managing a private investment vehicle for the fund family’s securities lending collateral, and commissions earned by an affiliated broker from portfolio transactions.
Based on its consideration of the factors and information it deemed relevant, including those described here, the Board did not find that any ancillary benefits received by Funds Management and its affiliates, including the Sub-Adviser, were unreasonable.
Conclusion
At the Meeting, after considering the above-described factors and based on its deliberations and its evaluation of the information described above, the Board unanimously approved the continuation of the Advisory Agreements for a one-year term and determined that the compensation payable to Funds Management and the Sub-Adviser under each of the Advisory Agreements was reasonable.
72 | Wells Fargo Municipal Bond Fund
Other information (unaudited)
LIQUIDITY RISK MANAGEMENT PROGRAM
In accordance with Rule 22e-4 under the Investment Company Act of 1940, as amended (the “Liquidity Rule”), Wells Fargo Funds Trust (the “Trust”) has adopted and implemented a liquidity risk management program (the “Program”) on behalf of each of its series, including the Fund, which is reasonably designed to assess and manage the Fund’s liquidity risk. “Liquidity risk” is defined as the risk that the Fund is unable to meet redemption requests without significantly diluting remaining investors’ interests in the Fund. The Trust’s Board of Trustees (the “Board”) previously approved the designation of Wells Fargo Funds Management, LLC (“Funds Management”), the Fund’s investment manager, as the administrator of the Program, and Funds Management has established a Liquidity Risk Management Council composed of personnel from multiple departments within Funds Management and its affiliates to assist Funds Management in the implementation and on-going administration of the Program.
The Program is comprised of various components designed to support the assessment and/or management of liquidity risk, including: (1) the periodic assessment (no less frequently than annually) of certain factors that influence the Fund’s liquidity risk; (2) the periodic classification (no less frequently than monthly) of the Fund’s investments into one of four liquidity categories that reflect an estimate of their liquidity under current market conditions; (3) a 15% limit on the acquisition of “illiquid investments” (as defined under the Liquidity Rule); (4) to the extent the Fund does not invest primarily in “highly liquid investments” (as defined under the Liquidity Rule), the determination of a minimum percentage of the Fund’s assets that generally will be invested in highly liquid investments (an “HLIM”); (5) if the Fund has established an HLIM, the periodic review (no less frequently than annually) of the HLIM and the adoption of policies and procedures for responding to a shortfall of the Fund’s “highly liquid investments” below its HLIM; and (6) periodic reporting to the Board.
At a meeting of the Board held on May 26 and 28, 2020, the Board received a written report (the “Report”) from Funds Management that addressed the operation of the Program and assessed its adequacy and effectiveness of implementation. The Report covered the initial period from December 1, 2018 through December 31, 2019 (the “Reporting Period”). No significant liquidity events impacting the Fund were noted in the Report. There were no material changes to the Program during the Reporting Period. The Report concluded that the Program is operating effectively to assess and manage the Fund’s liquidity risk, and that the Program has been and continues to be adequately and effectively implemented to monitor and, as applicable, respond to the Fund’s liquidity developments.
There can be no assurance that the Program will achieve its objectives under all circumstances in the future. Please refer to the Fund’s prospectus for more information regarding the Fund’s exposure to liquidity risk and other risks to which an investment in the Fund may be subject.
Wells Fargo Municipal Bond Fund | 73
Effective on or after May 1, 2020, clients of Edward Jones (also referred to as “shareholders”) purchasing Fund shares on the Edward Jones commission and fee-based platforms are eligible only for the following sales charge discounts (also referred to as “breakpoints”) and waivers, which can differ from breakpoints and waivers described elsewhere in the Fund’s Prospectus or SAI or through another broker-dealer. In all instances, it is the shareholder’s responsibility to inform Edward Jones at the time of purchase of any relationship, holdings of Wells Fargo Funds or other facts qualifying the purchaser for breakpoints or waivers. Edward Jones can ask for documentation of such circumstance.
| Breakpoints available at Edward Jones |
| Rights of Accumulation (ROA) |
The applicable sales charge on a purchase of Class A shares is determined by taking into account all share classes (except any money market funds and retirement plan share classes) of Wells Fargo Funds held by the shareholder or in an account grouped by Edward Jones with other accounts for the purpose of providing certain pricing considerations (“pricing groups”). This includes all share classes held on the Edward Jones platform and/or held on another platform. The inclusion of eligible fund family assets in the rights of accumulation calculation is dependent on the shareholder notifying his or her financial advisor of such assets at the time of calculation. |
ROA is determined by calculating the higher of cost or market value (current shares x NAV). |
| Letter of Intent (LOI) |
Through a LOI, shareholders can receive the sales charge and breakpoint discounts for purchases shareholders intend to makeover a 13-month period from the date Edward Jones receives the LOI. The LOI is determined by calculating the higher of cost or market value of qualifying holdings at LOI initiation in combination with the value that the shareholder intends to buy over a 13-month period to calculate the front-end sales charge and any breakpoint discounts. Each purchase the shareholder makes during that 13-month period will receive the sales charge and breakpoint discount that applies to the total amount. The inclusion of eligible fund family assets in the LOI calculation is dependent on the shareholder notifying his or her financial advisor of such assets at the time of calculation. Purchases made before the LOI is received by Edward Jones are not covered under the LOI and will not reduce the sales charge previously paid. Sales charges will be adjusted if LOI is not met. |
| Sales charges are waived for the following shareholders and in the following situations at Edward Jones: |
● Associates of Edward Jones and its affiliates and their family members who are in the same pricing group (as determined by Edward Jones under its policies and procedures) as the associate. This waiver will continue for the remainder of the associate’s life if the associate retires from Edward Jones in good-standing. |
● Shares purchased in an Edward Jones fee-based program. |
● Shares purchased through reinvestment of capital gains distributions and dividend reinvestment. |
● Shares purchased from the proceeds of redeemed shares of the same fund family so long as the following conditions are met: 1) the proceeds are from the sale of shares within 60 days of the purchase, and 2) the sale and purchase are made in the same share class and the same account or the purchase is made in an individual retirement account with proceeds from liquidations in anon-retirement account. |
● Shares exchanged into Class A shares from another share class so long as the exchange is into the same fund and was initiated at the discretion of Edward Jones. Edward Jones is responsible for any remaining CDSC due to the fund company, if applicable. Any future purchases are subject to the applicable sales charge as disclosed in the prospectus. |
● Exchanges from Class C shares to Class A shares of the same fund, generally, in the 84th month following the anniversary of the purchase date or earlier at the discretion of Edward Jones. |
| If the shareholder purchases shares that are subject to a CDSC and those shares are redeemed before the CDSC is expired, the shareholder is responsible to pay the CDSC except in the following conditions available at Edward Jones: |
● The death or disability of the shareholder. |
● Systematic withdrawals with up to 10% per year of the account value. |
● Return of excess contributions from an Individual Retirement Account (IRA). |
● Shares sold as part of a required minimum distribution for IRA and retirement accounts if the redemption is taken in or after the year the shareholder reaches qualified age based on applicable IRS regulation. |
● Shares sold to pay Edward Jones fees or costs in such cases where the transaction is initiated by Edward Jones. |
● Shares exchanged in an Edward Jones fee-based program. |
● Shares acquired through NAV reinstatement. |
74 | Wells Fargo Municipal Bond Fund
Appendix I (unaudited)
| Other Important Information for accounts at Edward Jones: |
| Minimum Purchase Amounts |
● $250 initial purchase minimum |
● $50 subsequent purchase minimum |
| Minimum Balances |
| Edward Jones has the right to redeem at its discretion fund holdings with a balance of $250 or less. The following are examples of accounts that are not included in this policy: |
● A fee-based account held on an Edward Jones platform |
● A 529 account held on an Edward Jones platform |
● An account with an active systematic investment plan or letter of intent (LOI) |
| Changing Share Classes |
| At any time it deems necessary, Edward Jones has the authority to exchange at NAV a shareholder’s holdings in a fund to Class A shares. |
Wells Fargo Municipal Bond Fund | 75
Effective June 1, 2020, shareholders purchasing Fund shares through an Oppenheimer & Co. Inc. (“Oppenheimer”) platform or account are eligible only for the following load waivers (front-end sales charge waivers and contingent deferred or back-end, sales charge waivers) and discounts, which may differ from those disclosed in the Fund’s Prospectus or SAI.
| Front-end Sales Load Waivers on Class A Shares available at Oppenheimer |
| Employer-sponsored retirement, deferred compensation and employee benefit plans (including health savings accounts) and trusts used to fund those plans, provided that the shares are not held in a commission-based brokerage account and shares are held for the benefit of the plan. |
| Shares purchased by or through a 529 Plan. |
| Shares purchased through an Oppenheimer affiliated investment advisory program. |
| Shares purchased through reinvestment of capital gains distributions and dividend reinvestment when purchasing shares of the same fund (but not any other fund within the fund family). |
| Shares purchased from the proceeds of redemptions within the same fund family, provided (1) the repurchase occurs within 90 days following the redemption, (2) the redemption and purchase occur in the same account, and (3) redeemed shares were subject to a front-end or deferred sales load (known as Rights of Restatement). |
| A shareholder in the Fund’s Class C shares will have their shares exchanged at net asset value to Class A shares (or the appropriate share class) of the Fund if the shares are no longer subject to a CDSC and the exchange is in line with the policies and procedures of Oppenheimer. |
| Employees and registered representatives of Oppenheimer or its affiliates and their family members. |
| Directors or Trustees of the Fund, and employees of the Fund’s investment adviser or any of its affiliates, as described in the Prospectus. |
| CDSC Waivers on A and C Shares available at Oppenheimer |
| Death or disability of the shareholder. |
| Shares sold as part of a systematic withdrawal plan as described in the Prospectus. |
| Return of excess contributions from an IRA Account. |
| Shares sold as part of a required minimum distribution for IRA and retirement accounts due to the shareholder reaching the qualified age based on applicable IRS regulations as described in the Prospectus. |
| Shares sold to pay Oppenheimer fees but only if the transaction is initiated by Oppenheimer. |
| Shares acquired through a right of reinstatement. |
| Front-end load Discounts Available at Oppenheimer: Breakpoints, Rights of Accumulation & Letters of Intent |
| Breakpoints as described in the Prospectus. |
| Rights of Accumulation (ROA), which entitle shareholders to breakpoint discounts, will be automatically calculated based on the aggregated holding of fund family assets held by accounts within the purchaser’s household at Oppenheimer. Eligible fund family assets not held at Oppenheimer may be included in the ROA calculation only if the shareholder notifies his or her financial advisor about such assets. |
76 | Wells Fargo Municipal Bond Fund
Effective June 15, 2020, shareholders purchasing fund shares through a Robert W. Baird & Co. (“Baird”) platform or account will only be eligible for the following sales charge waivers (front-end sales charge waivers and CDSC waivers) and discounts, which may differ from those disclosed elsewhere in the Fund’s Prospectus or the SAI.
| Front-end Sales Load Waivers on Class A Shares available at Baird |
| Shares purchased through reinvestment of capital gains distributions and dividend reinvestment when purchasing share of the same fund. |
| Share purchase by employees and registers representatives of Baird or its affiliate and their family members as designated by Baird. |
| Shares purchase from the proceeds of redemptions within the same fund family, provided (1) the repurchase occurs within 90 days following the redemption, (2) the redemption and purchase occur in the same accounts, and (3) redeemed shares were subject to a front-end or deferred sales charge (known as rights of reinstatement). |
| A shareholder in the Funds Investor C Shares will have their share exchanged at net asset value to Investor A shares of the fund if the shares are no longer subject to CDSC and the exchange is in line with the policies and procedures of Baird. |
| Employer-sponsored retirement plans or charitable accounts in a transactional brokerage account at Baird, including 401(k) plans, 457 plans, employer-sponsored 403(b) plans, profit sharing and money purchase pension plans and defined benefit plans. For purposes of this provision, employer-sponsored retirement plans do not include SEP IRAs, Simple IRAs or SAR-SEPs. |
| CDSC Waivers on A and C Shares available at Baird |
| Shares sold due to death or disability of the shareholder. |
| Shares sold as part of a systematic withdrawal plan as described in the Fund’s Prospectus. |
| Shares bought due to returns of excess contributions from an IRA Account. |
| Shares sold as part of a required minimum distribution for IRA and retirement accounts due to the shareholder reaching age 72 as described in the Fund’s Prospectus. |
| Shares sold to pay Baird fees but only if the transaction is initiated by Baird. |
| Shares acquired through a right of reinstatement. |
| Front-end load Discounts Available at Baird: Breakpoint and/or Rights of Accumulation |
| Breakpoints as described in the Prospectus. |
| Rights of accumulations which entitles shareholders to breakpoint discounts will be automatically calculated based on the aggregated holding of fund family assets held by accounts within the purchaser’s household at Baird. Eligible fund family assets not held at Baird may be included in the rights of accumulations calculation only if the shareholder notifies his or her financial advisor about such assets. |
| Letters of Intent (LOI) allow for breakpoint discounts based on anticipated purchases within a fund family through Baird, over a13-month period of time. |
Wells Fargo Municipal Bond Fund | 77
This page is intentionally left blank.
This page is intentionally left blank.
This page is intentionally left blank.
For more information
More information about Wells Fargo Funds is available free upon request. To obtain literature, please write, visit the Fund’s website, or call:
Wells Fargo Funds
P.O. Box 219967
Kansas City, MO 64121-9967
Website: wfam.com
Individual investors: 1-800-222-8222
Retail investment professionals: 1-888-877-9275
Institutional investment professionals: 1-866-765-0778

This report and the financial statements contained herein are submitted for the general information of the shareholders of the Fund. If this report is used for promotional purposes, distribution of the report must be accompanied or preceded by a current prospectus. Before investing, please consider the investment objectives, risks, charges, and expenses of the investment. For a current prospectus and, if available, a summary prospectus, containing this information, call 1-800-222-8222 or visit the Fund’s website at wfam.com. Read the prospectus carefully before you invest or send money.
Wells Fargo Asset Management (WFAM) is the trade name for certain investment advisory/management firms owned by Wells Fargo & Company. These firms include but are not limited to Wells Capital Management Incorporated and Wells Fargo Funds Management, LLC. Certain products managed by WFAM entities are distributed by Wells Fargo Funds Distributor, LLC (a broker-dealer and Member FINRA).
This material is for general informational and educational purposes only and is NOT intended to provide investment advice or a recommendation of any kind—including a recommendation for any specific investment, strategy, or plan.
INVESTMENT PRODUCTS: NOT FDIC INSURED ◾ NO BANK GUARANTEE ◾ MAY LOSE VALUE
© 2020 Wells Fargo & Company. All rights reserved.
PAR-0720-00245 08-20
A253/AR253 06-20

Annual Report
June 30, 2020
Wells Fargo
Short-Term Municipal Bond Fund
Beginning on January 1, 2021, as permitted by new regulations adopted by the Securities and Exchange Commission, paper copies of the Wells Fargo Funds’ annual and semi-annual shareholder reports issued after this date will no longer be sent by mail, unless you specifically request paper copies of the reports. Instead, the reports will be made available on the Funds’ website, and you will be notified by mail each time a report is posted and provided with a website address to access the report.
If you already elected to receive shareholder reports electronically, you will not be affected by this change and you need not take any action. You may elect to receive shareholder reports and other communications from the Fund electronically at any time by contacting your financial intermediary (such as a broker-dealer or bank) or, if you are a direct investor, by calling 1-800-222-8222 or by enrolling at wellsfargo.com/advantagedelivery.
You may elect to receive all future reports in paper free of charge. If you invest through a financial intermediary, you can contact your financial intermediary to request that you continue to receive paper copies of your shareholder reports; if you invest directly with the Fund, you can call 1-800-222-8222. Your election to receive reports in paper will apply to all Wells Fargo Funds held in your account with your financial intermediary or, if you are a direct investor, to all Wells Fargo Funds that you hold.
|
Reduce clutter. Save trees. |
Sign up for electronic delivery of prospectuses and shareholder reports at wellsfargo.com/advantagedelivery |
The views expressed and any forward-looking statements are as of June 30, 2020, unless otherwise noted, and are those of the Fund managers and/or Wells Fargo Asset Management. Discussions of individual securities, or the markets generally, or any Wells Fargo Fund are not intended as individual recommendations. Future events or results may vary significantly from those expressed in any forward-looking statements. The views expressed are subject to change at any time in response to changing circumstances in the market. Wells Fargo Asset Management and the Fund disclaim any obligation to publicly update or revise any views expressed or forward-looking statements.
INVESTMENT PRODUCTS: NOT FDIC INSURED ◾ NO BANK GUARANTEE ◾ MAY LOSE VALUE
Wells Fargo Short-Term Municipal Bond Fund | 1
Letter to shareholders (unaudited)

Andrew Owen
President
Wells Fargo Funds
Dear Shareholder:
We are pleased to offer you this annual report for the Wells Fargo Short-Term Municipal Bond Fund for the 12-month period that ended June 30, 2020. Global stock markets saw earlier gains erased in February and March as governments around the world took unprecedented measures to stop the spread of the coronavirus at the expense of short-term economic output. However, markets rebounded from April through June to offset much of the losses as central banks attempted to bolster capital markets and confidence. Fixed-income markets generally performed better, with most achieving gains. Overall U.S. markets surpassed their international peers, while U.S. large-cap equity, as measured by the Russell 1000® Index1, easily outperformed small caps, as measured by the Russell 2000® Index2, for the 12-month period.
For the 12-month period, fixed-income securities generally had positive total returns while non-U.S. equities had broad losses and U.S. stocks performed strongly despite sharp volatility since late February. For the period, U.S. stocks, based on the S&P 500 Index,3 gained 7.51%. International stocks, as measured by the MSCI ACWI ex USA Index (Net),4 returned -4.80%, while the MSCI EM Index (Net)5 performed slightly better, with a -3.39% return. For bond investors, the Bloomberg Barclays U.S. Aggregate Bond Index6 returned a robust 8.74%, the Bloomberg Barclays Global Aggregate ex-USD Index7 gained a modest 0.71%, and the Bloomberg Barclays Municipal Bond Index8 returned 4.45% while the ICE BofA U.S. High Yield Index9 lost 1.10%.
The fiscal year began on a positive note.
The 12-month period began with the U.S. equity market advancing to new highs in July 2019. U.S. President Donald Trump initially backed off of earlier tariff threats against Mexico and China. However, later in July, the U.S. reversed course and threatened to impose higher tariffs on China’s exports after talks failed. China responded with tariff threats of its own and devalued the renminbi, roiling global markets. Major U.S. stock market indices closed July with the worst weekly results of the year. Bond prices gained as Treasury yields fell to multiyear lows, and the yield curve inverted at multiple points along the 30-year arc, with shorter term yields higher than longer-term. At the end of July, the U.S. Federal Reserve (Fed) cut its federal funds rate by 0.25%.
In August, U.S.-China trade tensions continued with no signs of compromise. Evidence of a continued global economic slowdown mounted, and central banks in China, New Zealand, and Thailand cut interest rates. Industrial and manufacturing data declined in China,
| 1 | The Russell 1000® Index measures the performance of the 1,000 largest companies in the Russell 3000® Index, which represents approximately 92% of the total market capitalization of the Russell 3000® Index. You cannot invest directly in an index. |
| 2 | The Russell 2000® Index measures the performance of the 2,000 smallest companies in the Russell 3000® Index, which represents approximately 8% of the total market capitalization of the Russell 3000® Index. You cannot invest directly in an index. |
| 3 | The S&P 500 Index consists of 500 stocks chosen for market size, liquidity, and industry group representation. It is a market-value-weighted index with each stock’s weight in the index proportionate to its market value. You cannot invest directly in an index. |
| 4 | The Morgan Stanley Capital International (MSCI) All Country World Index (ACWI) ex USA Index (Net) is a free-float-adjusted market-capitalization-weighted index that is designed to measure the equity market performance of developed and emerging markets, excluding the United States. Source: MSCI. MSCI makes no express or implied warranties or representations and shall have no liability whatsoever with respect to any MSCI data contained herein. The MSCI data may not be further redistributed or used as a basis for other indices or any securities or financial products. This report is not approved, reviewed, or produced by MSCI. You cannot invest directly in an index. |
| 5 | The MSCI Emerging Markets (EM) Index (Net) is a free-float-adjusted market-capitalization-weighted index that is designed to measure equity market performance of emerging markets. You cannot invest directly in an index. |
| 6 | The Bloomberg Barclays U.S. Aggregate Bond Index is a broad-based benchmark that measures the investment-grade, U.S. dollar-denominated, fixed-rate taxable bond market, including Treasuries, government-related and corporate securities, mortgage-backed securities (agency fixed-rate and hybrid adjustable-rate mortgage pass-throughs), asset-backed securities, and commercial mortgage-backed securities. You cannot invest directly in an index. |
| 7 | The Bloomberg Barclays Global Aggregate ex-USD Index is an unmanaged index that provides a broad-based measure of the global investment-grade fixed-income markets excluding the U.S.-dollar-denominated debt market. You cannot invest directly in an index. |
| 8 | The Bloomberg Barclays Municipal Bond Index is an unmanaged index composed of long-term tax-exempt bonds with a minimum credit rating of Baa. You cannot invest directly in an index. |
| 9 | The ICE BofA U.S. High Yield Index is a market-capitalization-weighted index of domestic and Yankee high-yield bonds. The index tracks the performance of high-yield securities traded in the U.S. bond market. You cannot invest directly in an index. Copyright 2020. ICE Data Indices, LLC. All rights reserved. |
2 | Wells Fargo Short-Term Municipal Bond Fund
Letter to shareholders (unaudited)
Canada, Japan, and Germany. Adding to global uncertainty, Italy’s prime minister resigned, many feared a crackdown in Hong Kong as protestors sustained their calls for reform, and U.K. Prime Minister Boris Johnson planned to suspend Parliament as Brexit’s deadline neared.
In the U.S., the Fed cut interest rates a second time in September. U.S. manufacturing data disappointed investors. The U.S. Congress announced it would pursue an impeachment investigation of President Trump. Meanwhile, the Brexit impasse showed no signs of resolution. Officials in China said that hitting the country’s economic growth goals for the year would be difficult considering the weight of tariffs and trade restrictions. Although the S&P 500 Index finished the third quarter with the best year-to-date returns in more than 20 years, concerns about future returns remained.
The fourth quarter started on a strong note, with U.S.-China trade tensions relaxing in October along with renewed optimism for a U.K. Brexit deal and positive macroeconomic data. The initial estimate of U.S. third-quarter gross domestic product (GDP) growth was a resilient 1.9% annualized rate, while the U.S. unemployment rate fell to a 50-year low of 3.5% in September. However, despite resilience among U.S. consumers, business confidence declined while manufacturing activity contracted. Concerned with a potential economic slowdown, the Fed lowered interest rates another quarter point in late October—its third rate cut in four months. This helped push the S&P 500 Index to a new all-time high while emerging market equities rallied and global bonds declined overall, reflecting a broad pickup in risk appetite.
Equity markets continued to rally in November despite ongoing geopolitical risks. Hopes for a U.S.-China trade deal buoyed investor confidence. U.S. business sentiment improved slightly, and manufacturing and services activity picked up. While consumer confidence and purchasing manager activity rose in the eurozone, China reported weakening manufacturing and consumer data. Bond yields rose marginally, leading to slightly negative returns for global government and investment-grade corporate bonds.
Financial markets ended 2019 with a boost from the U.S. and China accord on a Phase One trade deal. That, along with the landslide win by the pro-Brexit U.K. Conservative Party in a national election and ongoing central bank support, gave investors greater confidence. U.S. economic indicators were generally positive, with the exception of manufacturing activity and business confidence. Consumer confidence was resilient, fed by a robust labor market, tame inflation, and lower interest rates, which boosted housing affordability and stimulated homebuyer activity. The impeachment of President Trump had little impact on markets. Meanwhile, slowing Chinese economic activity, partly attributable to the trade war, led to further government stimulus at year-end through lower reserve ratios, allowing banks to lend more money.
The year-end rally continued in early January 2020. However, capital market volatility picked up sharply in late January on concerns over the potential impact of the coronavirus on the global economy and stock markets. With sentiment somewhat souring, perceived safe havens did well in January. The U.S. dollar and Japanese yen both rose, and government bonds outperformed equities. While the S&P 500 Index held its ground, emerging market equities tumbled, including those in Asia.
In February, the coronavirus became the major market focus. Fears of the virus’s impact on global growth led to expectations of increased global central bank monetary policy support. That led the 10-year U.S. Treasury yield to fall to an all-time low of 1.1% by the end of the month. Although equity markets initially shrugged off concerns about the outbreak, focusing instead on strong fourth-quarter earnings and improving business confidence in January, market sentiment turned sharply lower toward month-end and the S&P 500 Index lost 8.2% for the month. Oil prices tumbled as Russia and the Organization of the Petroleum Exporting countries compounded a major decline in oil demand with a brutal price war, partly aimed at dissuading further U.S. shale production. As a result, the price of West Texas Intermediate crude oil fell 13% in February.
Wells Fargo Short-Term Municipal Bond Fund | 3
Letter to shareholders (unaudited)
“The global spread of the coronavirus led country after country to clamp down on social and business-related activity in order to contain the virus from causing even greater devastation and overwhelming health care systems.”
“Despite ongoing economic weakness and high levels of uncertainty on the containment of the coronavirus and the timing of an effective vaccine, financial markets continued to post widely positive returns in June.”
The global spread of the coronavirus led country after country to clamp down on social and business-related activity in order to contain the virus from causing even greater devastation and overwhelming health care systems. This abrupt stoppage of economic activity led to the sharp deceleration of global output, sending economies into a deep contraction. Central bank responses were swift, as they slashed interest rates and expanded quantitative easing programs to restore liquidity and confidence to the markets. In the U.S., the Fed introduced several new lending programs, funding investment-grade bonds, money market mutual funds, and commercial paper while purchasing Treasuries, mortgage-backed securities, and overnight repurchase agreements. Meanwhile, stock markets tumbled quickly into a bear market, ending the longest bull stock market in U.S. history.
Markets rebounded strongly in April, with the S&P 500 Index gaining 12.8% for the month and the MSCI ACWI ex USA Index (Net) returning 7.6%. The rebound was fueled by unprecedented government and central bank stimulus measures taken to buffer the economic damage created by mass shutdowns enacted in order to contain the virus’s spread. The U.S. economy contracted by an annualized 5.0% pace in the first quarter, with 30 million new unemployment insurance claims in six weeks. In the eurozone, first-quarter real GDP shrank 3.8%, with the composite April Flash Purchasing Managers’ Index, a monthly survey of purchasing managers, falling to an all-time low of 13.5. The European Central Bank expanded its quantitative easing to include the purchase of additional government bonds of countries with the greatest virus-related need, including Italy and Spain. China’s first-quarter GDP fell by 6.8% year over year. However, retail sales, production, and investment showed signs of recovery. Extreme oil-price volatility continued as global supply far exceeded demand.
In May, the equity market rebound continued, with the S&P 500 Index climbing a further 4.8%. European and Japanese stock markets also had monthly gains. Investors regained confidence on reports of early signs of success in human trials of a coronavirus vaccine. Growth stocks continued to outperform value stocks while returns on global government bonds were generally flat. In the U.S., a gap grew between the stock market rebound and devastating economic data points, including an April unemployment rate of 14.7%, the highest level since World War II. Purchasing managers’ indices continued to reflect weakening activity in May in both the manufacturing and services sectors. U.S. corporate earnings reports indicated a 14% year-over-year contraction in earnings from the first quarter of 2019. However, high demand for technology, driven by remote activity, helped maintain robust information technology sector earnings, which helped drive powerful well-known technology stocks higher.
Despite ongoing economic weakness and high levels of uncertainty on the containment of the coronavirus and the timing of an effective vaccine, financial markets continued to post widely positive returns in June. As economies reopened, there were hopeful signs. U.S. retail sales rose 17% in May while retail sales in the U.K. rebounded by 12%. However, year over year, sales remained depressed. Vitally important to market sentiment was the ongoing commitment by central banks globally to do all they can to provide economic support through liquidity and low borrowing costs. U.S. economic activity was aided by one-time $1,200 stimulus checks and $600 bonus weekly unemployment benefits due to expire at the end of July. However, unemployment remained in the double digits, easing somewhat from 14.7% in April to 11.1% in June. At period-end, numerous states reported alarming increases of coronavirus cases. China’s economic recovery picked up momentum in June, though it remained far from a full recovery.
4 | Wells Fargo Short-Term Municipal Bond Fund
Letter to shareholders (unaudited)
Don’t let short-term uncertainty derail long-term investment goals.
Periods of investment uncertainty can present challenges, but experience has taught us that maintaining long-term investment goals can be an effective way to plan for the future. To help you create a sound strategy based on your personal goals and risk tolerance, Wells Fargo Funds offers more than 100 mutual funds spanning a wide range of asset classes and investment styles. Although diversification cannot guarantee an investment profit or prevent losses, we believe it can be an effective way to manage investment risk and potentially smooth out overall portfolio performance. We encourage investors to know their investments and to understand that appropriate levels of risk-taking may unlock opportunities.
Thank you for choosing to invest with Wells Fargo Funds. We appreciate your confidence in us and remain committed to helping you meet your financial needs.
Sincerely,

Andrew Owen
President
Wells Fargo Funds
|
For further information about your Fund, contact your investment professional, visit our website at wfam.com, or call us directly at 1-800-222-8222. |
Notice to Shareholders
At a meeting held on August 10-12, 2020, the Board of Trustees of the Fund approved the following changes:
| ∎ | At a meeting held on August 10-12, 2020, the Board of Trustees of the Fund approved a change to the Fund’s automatic conversion feature for Class C shares in order to shorten the required holding period from 10 to 8 years. As a result, on a monthly basis beginning November 5, 2020, Class C shares will convert automatically into Class A shares 8 years after the initial date of purchase or, if you acquired your Class C shares through an exchange or conversion from another share class, 8 years after the date you acquired your Class C shares. When Class C shares that you acquired through a purchase or exchange convert, any other Class C shares that you purchased with reinvested dividends and distributions also will convert into Class A shares on a pro rata basis. |
Please note that a shorter holding period may apply depending on your intermediary. Please see “Appendix A—Sales Charge Reductions and Waivers for Certain Intermediaries” in the Fund’s prospectus for further information.
| ∎ | Changes to the Class A sales charge schedule for the Fund, effective with purchases made on or after September 21, 2020. |
NEW Class A Sales Charge Schedule effective September 21, 2020
| Amount of Purchase | Front-end Sales Charge As% of Public Offering Price | Front-end Sales Charge As% of Net Amount Invested | Commission Paid to Intermediary As% of Public Offering Price | |||||||||
Less than $100,000 | 2.00 | % | 2.04 | % | 1.75 | % | ||||||
$100,000 but less than $250,000 | 1.00 | % | 1.01 | % | 0.85 | % | ||||||
$250,000 and over | 0.00 | %1 | 0.00 | % | 0.40 | %2 | ||||||
| 1 | If you redeem Class A shares purchased at or above the $250,000 breakpoint level within twelve months from the date of purchase, you will pay a CDSC of 0.40% of the NAV of the shares on the date of original purchase. Certain exceptions apply (see “CDSC Waivers” in the Fund’s Prospectus). For redemptions of Class A shares of the Fund purchased prior to August 1, 2018, the CDSC terms that were in place at the time of purchase will continue to apply. |
| 2 | The commission paid to an intermediary on purchases above the $250,000 breakpoint level includes an advance by Wells Fargo Funds Distributor of the first year’s shareholder servicing fee. |
Wells Fargo Short-Term Municipal Bond Fund | 5
Performance highlights (unaudited)
Investment objective
The Fund seeks current income exempt from federal income tax consistent with capital preservation.
Manager
Wells Fargo Funds Management, LLC
Subadviser
Wells Capital Management Incorporated
Portfolio manager
Bruce R. Johns
Average annual total returns (%) as of June 30, 2020
| Including sales charge | Excluding sales charge | Expense ratios1 (%) | ||||||||||||||||||||||||||||||||
| Inception date | 1 year | 5 year | 10 year | 1 year | 5 year | 10 year | Gross | Net2 | ||||||||||||||||||||||||||
| Class A (WSMAX) | 7-18-2008 | -0.56 | 0.95 | 1.36 | 1.47 | 1.36 | 1.56 | 0.76 | 0.63 | |||||||||||||||||||||||||
| Class C (WSSCX) | 1-31-2003 | -0.29 | 0.60 | 0.80 | 0.71 | 0.60 | 0.80 | 1.51 | 1.38 | |||||||||||||||||||||||||
| Class R6 (WSSRX)3 | 7-31-2018 | – | – | – | 1.75 | 1.61 | 1.79 | 0.38 | 0.35 | |||||||||||||||||||||||||
| Administrator Class (WSTMX)4 | 7-30-2010 | – | – | – | 1.39 | 1.35 | 1.56 | 0.70 | 0.60 | |||||||||||||||||||||||||
| Institutional Class (WSBIX) | 3-31-2008 | – | – | – | 1.70 | 1.59 | 1.78 | 0.43 | 0.40 | |||||||||||||||||||||||||
| Bloomberg Barclays 1-3 Year Composite Municipal Bond Index5 | – | – | – | – | 2.64 | 1.68 | 1.48 | – | – | |||||||||||||||||||||||||
Figures quoted represent past performance, which is no guarantee of future results, and do not reflect taxes that a shareholder may pay on an investment in a fund. Investment return and principal value of an investment will fluctuate so that an investor’s shares, when redeemed, may be worth more or less than their original cost. Performance shown without sales charges would be lower if sales charges were reflected. Current performance may be lower or higher than the performance data quoted, which assumes the reinvestment of dividends and capital gains. Current month-end performance is available on the Fund’s website, wfam.com.
Index returns do not include transaction costs associated with buying and selling securities, any mutual fund fees or expenses, or any taxes. It is not possible to invest directly in an index.
For Class A shares, the maximum front-end sales charge is 2.00%. For Class C shares, the maximum contingent deferred sales charge is 1.00%. Performance including a contingent deferred sales charge assumes the sales charge for the corresponding time period. Class R6, Administrator Class, and Institutional Class shares are sold without a front-end sales charge or contingent deferred sales charge.
Bond values fluctuate in response to the financial condition of individual issuers, general market and economic conditions, and changes in interest rates. Changes in market conditions and government policies may lead to periods of heightened volatility in the bond market and reduced liquidity for certain bonds held by the Fund. In general, when interest rates rise, bond values fall and investors may lose principal value. Interest rate changes and their impact on the Fund and its share price can be sudden and unpredictable. The use of derivatives may reduce returns and/or increase volatility. Certain investment strategies tend to increase the total risk of an investment (relative to the broader market). The Fund is exposed to high-yield securities risk and municipal securities risk. Consult the Fund’s prospectus for additional information on these and other risks. A portion of the Fund’s income may be subject to federal, state, and/or local income taxes or the Alternative Minimum Tax (AMT). Any capital gains distributions may be taxable.
Please see footnotes on page 7.
6 | Wells Fargo Short-Term Municipal Bond Fund
Performance highlights (unaudited)
| Growth of $10,000 investment as of June 30, 20206 |
|
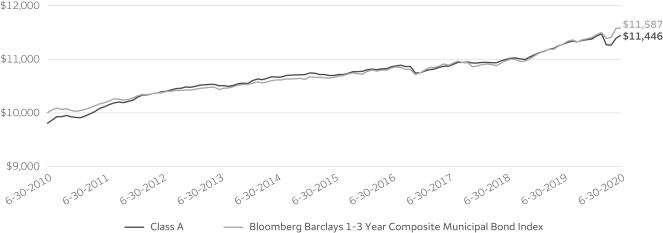
| 1 | Reflects the expense ratios as stated in the most recent prospectuses. The expense ratios shown are subject to change and may differ from the annualized expense ratios shown in the financial highlights of this report. |
| 2 | The manager has contractually committed through October 31, 2020, to waive fees and/or reimburse expenses to the extent necessary to cap total annual fund operating expenses after fee waivers at 0.63% for Class A, 1.38% for Class C, 0.35% for Class R6, 0.60% for Administrator Class, and 0.40% for Institutional Class. Brokerage commissions, stamp duty fees, interest, taxes, acquired fund fees and expenses (if any), and extraordinary expenses are excluded from the expense caps. Prior to or after the commitment expiration date, the caps may be increased or the commitment to maintain the caps may be terminated only with the approval of the Board of Trustees. Without these caps, the Fund’s returns would have been lower. The expense ratio paid by an investor is the net expense ratio (the total annual fund operating expenses after fee waivers) as stated in the prospectuses. |
| 3 | Historical performance shown for the Class R6 shares prior to their inception reflects the performance of the Institutional Class shares, and includes the higher expenses applicable to the Institutional Class shares. If these expenses had not been included, returns for the Class R6 shares would be higher. |
| 4 | Historical performance shown for the Administrator Class shares prior to their inception reflects the performance of the Institutional Class shares, adjusted to reflect the higher expenses applicable to the Administrator Class shares. |
| 5 | The Bloomberg Barclays 1-3 Year Composite Municipal Bond Index is a blended index weighted 50% in the Bloomberg Barclays 1-Year Municipal Bond Index and 50% in the Barclays 3-Year Municipal Bond Index. You cannot invest directly in an index. |
| 6 | The chart compares the performance of Class A shares for the most recent ten years with the Bloomberg Barclays 1-3 Year Composite Municipal Bond Index. The chart assumes a hypothetical $10,000 investment in Class A shares and reflects all operating expenses and assumes the maximum initial sales charge of 2.00%. |
| 7 | Amounts are calculated based on the total long-term investments of the Fund. These amounts are subject to change and may have changed since the date specified. |
| 8 | The credit quality distribution of portfolio holdings reflected in the chart is based on ratings from Standard & Poor’s, Moody’s Investors Service, and/or Fitch Ratings Ltd. Credit quality ratings apply to the underlying holdings of the Fund and not to the Fund itself. The percentages of the Fund’s portfolio with the ratings depicted in the chart are calculated based on the total market value of fixed income securities held by the Fund. If a security was rated by all three rating agencies, the middle rating was utilized. If rated by two of three rating agencies, the lower rating was utilized, and if rated by one of the rating agencies, that rating was utilized. Standard & Poor’s rates the creditworthiness of bonds, ranging from AAA (highest) to D (lowest). Ratings from A to CCC may be modified by the addition of a plus (+) or minus (-) sign to show relative standing within the rating categories. Standard & Poor’s rates the creditworthiness of short-term notes from SP-1 (highest) to SP-3 (lowest). Moody’s rates the creditworthiness of bonds, ranging from Aaa (highest) to C (lowest). Ratings Aa to B may be modified by the addition of a number 1 (highest) to 3 (lowest) to show relative standing within the ratings categories. Moody’s rates the creditworthiness of short-term U.S. tax-exempt municipal securities from MIG 1/VMIG 1 (highest) to SG (lowest). Fitch rates the creditworthiness of bonds, ranging from AAA (highest) to D (lowest). Credit quality distribution is subject to change and may have changed since the date specified. |
Wells Fargo Short-Term Municipal Bond Fund | 7
Performance highlights (unaudited)
MANAGER’S DISCUSSION
Fund highlights
| ∎ | The Fund underperformed its benchmark, the Bloomberg Barclays 1–3 Year Composite Municipal Bond Index, for the 12-month period that ended June 30, 2020. |
| ∎ | The Fund’s conservative duration positioning detracted from performance as yields moved considerably lower over the period. However, yield-curve positioning modestly contributed to performance. |
| ∎ | Credit positioning detracted from performance as we were overweight lower investment-grade bonds (A- rated and BBB-rated) relative to higher investment-grade bonds. Higher-rated bonds outperformed over the period. |
| ∎ | The Fund’s underweight to pre-refunded bonds and overweight to revenue bonds as well as underweight to state and local general obligation bonds detracted from performance. Specifically, within the revenue bond sector, electric, education, and water and sewer bonds were the best-performing bonds in the index. The Fund’s underweight to those sectors detracted from performance over the period. An overweight to industrial development revenue bonds contributed to performance. |
| Effective maturity distribution as of June 30, 20207 |
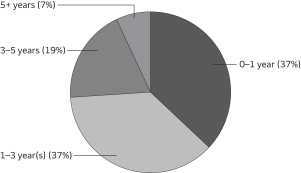 |
The coronavirus pandemic and the associated containment efforts became the dominant market influence over the 12-month period.
In 2019, market expectations moved the Federal Reserve (Fed) from a rate-hiking posture to multiple cuts in what was considered a “mid-cycle adjustment” at the time. Generally, positive U.S. economic data was enough for most investors to expect continued slow growth and an extension of the economic expansion. Global trade tensions prompted a rise in market volatility, which subsided with the passage of a Phase One U.S.-China trade deal late in the calendar year. President Trump was formally impeached and ultimately acquitted by the U.S. Senate. By March, the coronavirus pandemic brought an end to the longest bull market on record.
The municipal bond market was heavily influenced by technical factors throughout the reporting period. Municipal mutual funds saw 61 straight weeks of net inflows, which pushed yields across ratings categories to all-time lows by late February. Low yields and ample demand drove municipal issuance higher but also altered the mix. Taxable municipal bonds as a proportion of new issue municipal debt was at its highest level since 2010 by period-end. Pandemic-related volatility and liquidity pressures prompted record-setting outflows from municipal bonds in March. Strong support by the Fed, including a Municipal Liquidity Facility, and more than $2.5 trillion in fiscal stimulus buoyed markets and bolstered investor confidence. Several weeks of consecutive positive net flows for municipal funds and strong demand for new bonds drove yields back near the lows for highly rated issues. The period ended with the Fed pledging to keep short rates low for the foreseeable future. The fundamental outlook for municipal issuers came into question as the path of recovery from the virus remains extraordinarily uncertain.
| Credit quality as of June 30, 20208 |
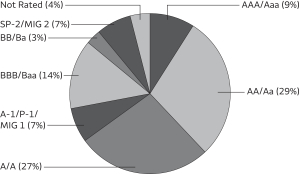 |
Factors across the market influenced Fund performance.
Coming into the year, municipal bonds had positive momentum in terms of technical factors with reduced tax-exempt supply and positive fund flows. In fact, until the market volatility in March, the industry had more than 60 weeks of positive flows. This caused a supply/demand imbalance, which drove rates down and credit spreads tighter. There was a clear disconnect between technicals and fundamentals as investors reached for income wherever they could find it, which resulted in credit spreads near all-time tights and a very flat yield curve.
Please see footnotes on page 7.
8 | Wells Fargo Short-Term Municipal Bond Fund
Performance highlights (unaudited)
As the year began, we continued an up-in-quality trade as we believed that higher investment-grade bonds represented better relative value and that credit spreads were vulnerable as the economy slowed. Despite this, we chose to keep a moderate overweight in lower investment-grade bonds, especially those that were seasoned and that we believed had good total return characteristics. In terms of the curve, we had been moving from a barbell structure with greater exposure to both shorter- and longer-duration bonds, to more key rate positions along the curve. We also slightly extended duration but remained defensively positioned. We were a little early to this trade and it was a modest detractor over the first half although we did outperform in terms of duration positioning for the full period.
The beginning of the second half of the year was a continuation of the first half. We did not reverse course as we felt the market was ripe for correction. We did not anticipate that the country’s response to the pandemic would be the catalyst for a correction, but we were pretty well positioned for it with duration short to the benchmark and higher overall credit quality, and we had removed most of the barbell and had lightened up on credits that we thought would be vulnerable in an economic downturn. The market had rallied pretty hard through February, which already had returns in excess of 100 basis points (bps; 100 bps equal 1.00%) of what many had forecast for the year.
March was a turning point for the market and after 61 weeks of positive fund flows, which were supportive of municipal valuations, outflows began and they were extreme as the risk-off trade took hold. According to Lipper, during the week of March 18 there were outflows of $12.2 billion, a new record that was broken the following week, with $13.7 billion of outflows. The Fund experienced small outflows as well but we were not forced sellers as we had been maintaining adequate cash equivalents in the portfolio.
With the markets in disarray and the short end of the market seizing up, the Fed began unprecedented support, first by cutting rates and second by announcing open-ended quantitative easing and targeted help to the municipal market through the Money Market Liquidity Facility and the Municipal Liquidity Facility. Not to be outdone, Congress passed four packages for about $3 trillion in aid across the economy.
This stabilized the markets and by mid-April, the municipal market was firmly on solid ground. High-grade bonds were in demand, but lower investment-grade and high-yield bond spreads remained wide, as did certain sectors, including transportation, education, and hospitals. We took advantage of this dislocation and began adding to lower investment-grade paper in late March that had been vetted by our analytical team and mispriced in the market, buying names such as New York Metropolitan Transportation Authority and prepaid gas bonds. Lower investment-grade paper continued to lag through early June but caught a bid and did well in June. Rates for high-grade paper are now at or near historical lows and credit spreads are tightening rapidly as technical factors are once again driving the market higher in price.
Rates are likely to remain low over the foreseeable future, and rating downgrades expected but defaults in the investment-grade space to remain rare.
The longest economic expansion in history is over. The economic impact of the pandemic worldwide and nationally has yet to be fully realized. As we reopen the economy, we should see a boost versus the lows of April, but economic activity is likely to remain muted and pressure more troubled credits. Most states and municipalities came into this in the best financial shape they’ve been in for decades, notwithstanding pension challenges of certain issuers. Municipal issuers have a long history of managing through deep recessions and many have already cut expenses and furloughed employees and are preparing to raise taxes. That doesn’t mean it will be easy, and we have seen and should continue to see a deterioration of credit quality and resultant downgrades, but we don’t believe that will result in a material increase in defaults in the investment-grade space. We believe a deep analytical bench and individual security selection will be important drivers of performance in the next year. We expect to manage duration tactically depending on technical factors and market opportunities. Credit exposure will also vary depending on the work of our analytical team and where we find relative value in the market.
Wells Fargo Short-Term Municipal Bond Fund | 9
As a shareholder of the Fund, you incur two types of costs: (1) transaction costs, including sales charges (loads) on purchase payments and contingent deferred sales charges (if any) on redemptions and (2) ongoing costs, including management fees, distribution (12b-1) and/or shareholder servicing fees, and other Fund expenses. This example is intended to help you understand your ongoing costs (in dollars) of investing in the Fund and to compare these costs with the ongoing costs of investing in other mutual funds.
The example is based on an investment of $1,000 invested at the beginning of the six-month period and held for the entire period from January 1, 2020 to June 30, 2020.
Actual expenses
The “Actual” line of the table below provides information about actual account values and actual expenses. You may use the information in this line, together with the amount you invested, to estimate the expenses that you paid over the period. Simply divide your account value by $1,000 (for example, an $8,600 account value divided by $1,000 = 8.6), then multiply the result by the number in the “Actual” line under the heading entitled “Expenses paid during period” for your applicable class of shares to estimate the expenses you paid on your account during this period.
Hypothetical example for comparison purposes
The “Hypothetical” line of the table below provides information about hypothetical account values and hypothetical expenses based on the Fund’s actual expense ratio and an assumed rate of return of 5% per year before expenses, which is not the Fund’s actual return. The hypothetical account values and expenses may not be used to estimate the actual ending account balance or expenses you paid for the period. You may use this information to compare the ongoing costs of investing in the Fund and other funds. To do so, compare this 5% hypothetical example with the 5% hypothetical examples that appear in the shareholder reports of the other funds.
Please note that the expenses shown in the table are meant to highlight your ongoing costs only and do not reflect any transactional costs, such as sales charges (loads) and contingent deferred sales charges. Therefore, the “Hypothetical” line of the table is useful in comparing ongoing costs only and will not help you determine the relative total costs of owning different funds. In addition, if these transactional costs were included, your costs would have been higher.
| Beginning account value 1-1-2020 | Ending account value 6-30-2020 | Expenses paid during the period1 | Annualized net expense ratio | |||||||||||||
Class A | ||||||||||||||||
Actual | $ | 1,000.00 | $ | 1,005.81 | $ | 3.09 | 0.62 | % | ||||||||
Hypothetical (5% return before expenses) | $ | 1,000.00 | $ | 1,021.78 | $ | 3.12 | 0.62 | % | ||||||||
Class C | ||||||||||||||||
Actual | $ | 1,000.00 | $ | 1,002.03 | $ | 6.87 | 1.38 | % | ||||||||
Hypothetical (5% return before expenses) | $ | 1,000.00 | $ | 1,018.00 | $ | 6.92 | 1.38 | % | ||||||||
Class R6 | ||||||||||||||||
Actual | $ | 1,000.00 | $ | 1,007.18 | $ | 1.75 | 0.35 | % | ||||||||
Hypothetical (5% return before expenses) | $ | 1,000.00 | $ | 1,023.12 | $ | 1.76 | 0.35 | % | ||||||||
Administrator Class | ||||||||||||||||
Actual | $ | 1,000.00 | $ | 1,004.92 | $ | 2.99 | 0.60 | % | ||||||||
Hypothetical (5% return before expenses) | $ | 1,000.00 | $ | 1,021.88 | $ | 3.02 | 0.60 | % | ||||||||
Institutional Class | ||||||||||||||||
Actual | $ | 1,000.00 | $ | 1,006.93 | $ | 2.00 | 0.40 | % | ||||||||
Hypothetical (5% return before expenses) | $ | 1,000.00 | $ | 1,022.87 | $ | 2.01 | 0.40 | % | ||||||||
| 1 | Expenses paid is equal to the annualized net expense ratio of each class multiplied by the average account value over the period, multiplied by the number of days in the most recent fiscal half-year divided by the number of days in the fiscal year (to reflect the one-half-year period). |
10 | Wells Fargo Short-Term Municipal Bond Fund
Portfolio of investments—June 30, 2020
| Interest rate | Maturity date | Principal | Value | |||||||||||||
| Municipal Obligations: 98.90% | ||||||||||||||||
Alabama: 2.65% | ||||||||||||||||
| Airport Revenue: 0.07% | ||||||||||||||||
Birmingham AL Airport Authority Series 2020 (BAM Insured) %% | 5.00 | % | 7-1-2023 | $ | 475,000 | $ | 530,699 | |||||||||
Birmingham AL Airport Authority Series 2020 (BAM Insured) %% | 5.00 | 7-1-2026 | 900,000 | 1,085,814 | ||||||||||||
Birmingham AL Airport Authority Series 2020 (BAM Insured) %% | 5.00 | 7-1-2027 | 500,000 | 614,785 | ||||||||||||
| 2,231,298 | ||||||||||||||||
|
| |||||||||||||||
| Health Revenue: 0.56% | ||||||||||||||||
Alabama Health Care Authority for Baptist Health Series B ø | 1.32 | 11-1-2042 | 6,500,000 | 6,500,000 | ||||||||||||
East Alabama Health Care Authority Series B ø | 0.61 | 9-1-2039 | 12,267,000 | 12,267,000 | ||||||||||||
| 18,767,000 | ||||||||||||||||
|
| |||||||||||||||
| Industrial Development Revenue: 0.29% | ||||||||||||||||
Mobile AL Industrial Development Board Alabama Power Company Barry Plant Project Series A | 1.00 | 6-1-2034 | 8,500,000 | 8,500,000 | ||||||||||||
Selma AL Industrial Development Board Refunding Bonds Gulf Opportunity Zone International Paper Company | 2.00 | 11-1-2033 | 1,000,000 | 1,033,020 | ||||||||||||
| 9,533,020 | ||||||||||||||||
|
| |||||||||||||||
| Utilities Revenue: 1.73% | ||||||||||||||||
Alabama Black Belt Energy Gas District Series A | 4.00 | 6-1-2024 | 3,640,000 | 4,034,358 | ||||||||||||
Alabama Black Belt Energy Gas District Series A (Royal Bank of Canada LIQ) | 4.00 | 8-1-2047 | 3,880,000 | 4,102,712 | ||||||||||||
Alabama Black Belt Energy Gas District Series A | 4.00 | 12-1-2048 | 8,000,000 | 8,728,960 | ||||||||||||
Alabama Black Belt Energy Gas District Series A | 4.00 | 10-1-2049 | 9,500,000 | 10,954,260 | ||||||||||||
Chatom AL Industrial Development Board Alabama Electric Series A (National Rural Utilities Cooperative Finance SPA) ø | 1.15 | 8-1-2037 | 7,745,000 | 7,745,000 | ||||||||||||
Southeast Alabama Gas Supply District Project #2 Series A | 4.00 | 6-1-2049 | 20,060,000 | 22,096,291 | ||||||||||||
| 57,661,581 | ||||||||||||||||
|
| |||||||||||||||
| 88,192,899 | ||||||||||||||||
|
| |||||||||||||||
Alaska: 1.04% | ||||||||||||||||
| Health Revenue: 0.82% | ||||||||||||||||
Alaska IDA Loan Anticipation YKHC Project | 3.50 | 12-1-2020 | 22,300,000 | 22,343,039 | ||||||||||||
Alaska Industrial Development and Export Authority Tanana Chiefs Conference Project | 5.00 | 10-1-2023 | 600,000 | 675,774 | ||||||||||||
Alaska Industrial Development and Export Authority Tanana Chiefs Conference Project | 5.00 | 10-1-2024 | 750,000 | 870,315 | ||||||||||||
Alaska Industrial Development and Export Authority Tanana Chiefs Conference Project | 5.00 | 10-1-2025 | 1,310,000 | 1,560,590 | ||||||||||||
Alaska Industrial Development and Export Authority Tanana Chiefs Conference Project | 5.00 | 10-1-2026 | 1,385,000 | 1,682,304 | ||||||||||||
| 27,132,022 | ||||||||||||||||
|
| |||||||||||||||
| Miscellaneous Revenue: 0.10% | ||||||||||||||||
Alaska Municipal Bond Bank Refunding Bond Series 2020-1 %% | 5.00 | 12-1-2025 | 1,470,000 | 1,778,715 | ||||||||||||
Alaska Municipal Bond Bank Refunding Bond Series 2020-1 %% | 5.00 | 12-1-2026 | 1,350,000 | 1,666,724 | ||||||||||||
| 3,445,439 | ||||||||||||||||
|
| |||||||||||||||
| Utilities Revenue: 0.04% | ||||||||||||||||
Alaska IDA Snettisham Hydroelectric Project | 5.00 | 1-1-2021 | 1,400,000 | 1,424,668 | ||||||||||||
|
| |||||||||||||||
The accompanying notes are an integral part of these financial statements.
Wells Fargo Short-Term Municipal Bond Fund | 11
Portfolio of investments—June 30, 2020
| Interest rate | Maturity date | Principal | Value | |||||||||||||
| Water & Sewer Revenue: 0.08% | ||||||||||||||||
North Slope Borough Service Area Water & Wastewater Facilities | 5.25 | % | 6-30-2034 | $ | 2,445,000 | $ | 2,554,218 | |||||||||
|
| |||||||||||||||
| 34,556,347 | ||||||||||||||||
|
| |||||||||||||||
Arizona: 2.61% | ||||||||||||||||
| Education Revenue: 0.10% | ||||||||||||||||
Cochise County AZ Community College District of Cochise County Series 2016A (BAM Insured) | 5.00 | 7-1-2020 | 405,000 | 405,000 | ||||||||||||
Cochise County AZ Community College District of Cochise County Series 2016A (BAM Insured) | 5.00 | 7-1-2021 | 425,000 | 439,454 | ||||||||||||
PIMA County AZ IDA Education Facility Odyssey Preparatory Academy Goodyear Project | 7.00 | 6-1-2034 | 312,000 | 330,311 | ||||||||||||
PIMA County AZ IDA Education Facility Odyssey Preparatory Academy Goodyear Project | 7.13 | 6-1-2049 | 1,950,000 | 2,066,669 | ||||||||||||
| 3,241,434 | ||||||||||||||||
|
| |||||||||||||||
| Health Revenue: 0.72% | ||||||||||||||||
Maricopa County AZ IDA Series 2019C (SIFMA Municipal Swap +0.57%) ± | 0.70 | 1-1-2035 | 4,865,000 | 4,813,577 | ||||||||||||
Maricopa County AZ IDA Series 2019C (SIFMA Municipal Swap +0.80%) ± | 0.93 | 9-1-2048 | 9,000,000 | 8,825,850 | ||||||||||||
Scottsdale AZ IDA Healthcare Series F (AGM Insured) (m) | 0.98 | 9-1-2045 | 4,500,000 | 4,500,000 | ||||||||||||
Tempe AZ IDA Mirabella Arizona State University Project Series B1 144A | 4.00 | 10-1-2023 | 6,000,000 | 5,879,820 | ||||||||||||
| 24,019,247 | ||||||||||||||||
|
| |||||||||||||||
| Industrial Development Revenue: 1.56% | ||||||||||||||||
Chandler AZ IDA Intel Corporation Project | 2.70 | 12-1-2037 | 1,175,000 | 1,234,514 | ||||||||||||
Chandler AZ IDA Intel Corporation Project | 2.40 | 12-1-2035 | 32,885,000 | 34,125,422 | ||||||||||||
Chandler AZ IDA Intel Corporation Project | 5.00 | 6-1-2049 | 2,000,000 | 2,303,300 | ||||||||||||
Phoenix AZ IDA Various Republic Services Incorporated Projects | 2.10 | 12-1-2035 | 14,000,000 | 14,005,880 | ||||||||||||
| 51,669,116 | ||||||||||||||||
|
| |||||||||||||||
| Miscellaneous Revenue: 0.23% | ||||||||||||||||
Arizona Board of Regents Certificate of Participation Series A | 5.00 | 6-1-2021 | 3,000,000 | 3,120,390 | ||||||||||||
Navajo Nation AZ Refunding Bond Series A 144A | 2.90 | 12-1-2020 | 3,025,000 | 3,030,143 | ||||||||||||
Navajo Nation AZ Tribal Utility Authority (Municipal Government Guaranty Insured) | 4.00 | 1-1-2021 | 1,621,000 | 1,624,307 | ||||||||||||
| 7,774,840 | ||||||||||||||||
|
| |||||||||||||||
| 86,704,637 | ||||||||||||||||
|
| |||||||||||||||
Arkansas: 0.53% | ||||||||||||||||
| Health Revenue: 0.14% | ||||||||||||||||
Boone County AR Hospital Construction Series 2006 (BOKF NA LOC) ø | 3.00 | 5-1-2037 | 4,700,000 | 4,700,000 | ||||||||||||
|
| |||||||||||||||
| Housing Revenue: 0.39% | ||||||||||||||||
Arkansas Development Finance Authority MFHR Texarkana Rental Assistance Demonstration Convertible Bond Series A | 2.10 | 6-1-2022 | 5,100,000 | 5,132,181 | ||||||||||||
Mizuho Floater/Residual Trust Various States Series 2020-MIZ9008 (Mizuho Capital Markets LLC LOC, Mizuho Capital Markets LLC LIQ) 144Aø | 0.36 | 4-1-2025 | 7,860,000 | 7,860,000 | ||||||||||||
| 12,992,181 | ||||||||||||||||
|
| |||||||||||||||
| 17,692,181 | ||||||||||||||||
|
| |||||||||||||||
The accompanying notes are an integral part of these financial statements.
12 | Wells Fargo Short-Term Municipal Bond Fund
Portfolio of investments—June 30, 2020
| Interest rate | Maturity date | Principal | Value | |||||||||||||
California: 4.87% | ||||||||||||||||
| GO Revenue: 1.39% | ||||||||||||||||
California Refunding Bond Series A (SIFMA Municipal Swap+0.25%) ± | 0.38 | % | 5-1-2033 | $ | 26,000,000 | $ | 25,901,980 | |||||||||
California Series B (SIFMA Municipal Swap +0.38%) ± | 0.51 | 12-1-2027 | 20,000,000 | 19,818,400 | ||||||||||||
San Ysidro CA School District (AGM Insured) ¤ | 0.00 | 8-1-2047 | 3,610,000 | 511,032 | ||||||||||||
| 46,231,412 | ||||||||||||||||
|
| |||||||||||||||
| Health Revenue: 0.23% | ||||||||||||||||
California HFFA Providence St. Joseph Series B1 | 1.25 | 10-1-2036 | 5,785,000 | 5,796,396 | ||||||||||||
Palomar CA Pomerado Health Care District Certificate of Participation Series C (AGM Insured) (m) | 1.54 | 11-1-2036 | 1,100,000 | 1,100,000 | ||||||||||||
Washington Township CA Health Care District Series B | 5.00 | 7-1-2020 | 600,000 | 600,000 | ||||||||||||
| 7,496,396 | ||||||||||||||||
|
| |||||||||||||||
| Miscellaneous Revenue: 1.26% | ||||||||||||||||
California Infrastructure & Economic Development Bank The J. Paul Getty Trust Series A-1 (1 Month LIBOR +0.33%) ± | 0.45 | 10-1-2047 | 19,000,000 | 18,855,030 | ||||||||||||
California Infrastructure & Economic Development Bank The J. Paul Getty Trust Series B-2 (1 Month LIBOR +0.20%) ± | 0.32 | 10-1-2047 | 8,000,000 | 7,968,880 | ||||||||||||
Deutsche Bank Spears/Lifers Tender Option Bond Trust Series DBE-8049 (Deutsche Bank LIQ) 144Aø | 0.48 | 12-1-2052 | 15,000,000 | 15,000,000 | ||||||||||||
| 41,823,910 | ||||||||||||||||
|
| |||||||||||||||
| Tax Revenue: 0.10% | ||||||||||||||||
Commerce CA RDA CAB Project #1 ¤ | 0.00 | 8-1-2021 | 1,440,000 | 1,376,165 | ||||||||||||
Sacramento CA Transportation Authority Sales Tax Refunding Bond Series A (Sumitomo Mitsui Banking LOC) ø | 0.06 | 10-1-2038 | 2,000,000 | 2,000,000 | ||||||||||||
| 3,376,165 | ||||||||||||||||
|
| |||||||||||||||
| Transportation Revenue: 0.76% | ||||||||||||||||
Bay Area Toll Authority San Francisco Bay Area Series C-1 (SIFMA Municipal Swap +0.90%) ± | 1.03 | 4-1-2045 | 25,500,000 | 25,421,970 | ||||||||||||
|
| |||||||||||||||
| Utilities Revenue: 0.06% | ||||||||||||||||
Long Beach CA Bond Finance Authority Natural Gas Series B (3 Month | 1.69 | 11-15-2026 | 2,000,000 | 1,982,480 | ||||||||||||
|
| |||||||||||||||
| Water & Sewer Revenue: 1.07% | ||||||||||||||||
California Department of Water Resources Central Valley Project Series AT (SIFMA Municipal Swap +0.37%) ± | 0.50 | 12-1-2035 | 35,500,000 | 35,576,680 | ||||||||||||
|
| |||||||||||||||
| 161,909,013 | ||||||||||||||||
|
| |||||||||||||||
Colorado: 1.20% | ||||||||||||||||
| Airport Revenue: 0.03% | ||||||||||||||||
Denver CO City & County Department of Aviation Airport System Series A | 5.00 | 11-15-2024 | 1,000,000 | 1,091,490 | ||||||||||||
|
| |||||||||||||||
| GO Revenue: 0.09% | ||||||||||||||||
Grand River CO Hospital District (AGM Insured) | 5.00 | 12-1-2022 | 1,450,000 | 1,590,897 | ||||||||||||
Grand River CO Hospital District (AGM Insured) | 5.00 | 12-1-2024 | 1,140,000 | 1,322,104 | ||||||||||||
| 2,913,001 | ||||||||||||||||
|
| |||||||||||||||
| Health Revenue: 0.87% | ||||||||||||||||
Colorado HCFR Catholic Health Initiatives Series C2 (1 Month LIBOR +1.25%) ± | 1.37 | 10-1-2039 | 8,730,000 | 8,657,978 | ||||||||||||
Colorado HCFR Catholic Health Initiatives Series C4 (1 Month LIBOR +1.25%) ± | 1.37 | 10-1-2039 | 3,495,000 | 3,466,201 | ||||||||||||
The accompanying notes are an integral part of these financial statements.
Wells Fargo Short-Term Municipal Bond Fund | 13
Portfolio of investments—June 30, 2020
| Interest rate | Maturity date | Principal | Value | |||||||||||||
| Health Revenue (continued) | ||||||||||||||||
Colorado Health Facilities Authority Hospital Adventhealth Obligated Group Series B | 5.00 | % | 11-15-2049 | $ | 900,000 | $ | 1,108,818 | |||||||||
Colorado Health Facilities Authority Improvement Christian Living | 4.00 | 1-1-2025 | 325,000 | 318,061 | ||||||||||||
University of Colorado Hospital Authority Series 2017C-1 | 5.00 | 11-15-2038 | 14,630,000 | 15,317,464 | ||||||||||||
| 28,868,522 | ||||||||||||||||
|
| |||||||||||||||
| Miscellaneous Revenue: 0.04% | ||||||||||||||||
Colorado Bridge Enterprise Central 70 Project | 4.00 | 12-31-2023 | 1,285,000 | 1,413,179 | ||||||||||||
|
| |||||||||||||||
| Transportation Revenue: 0.17% | ||||||||||||||||
E-470 Public Highway Authority Colorado Series A | 5.00 | 9-1-2024 | 450,000 | 529,407 | ||||||||||||
E-470 Public Highway Authority Colorado Series A | 5.00 | 9-1-2025 | 300,000 | 362,865 | ||||||||||||
E-470 Public Highway Authority Colorado Series A | 5.00 | 9-1-2026 | 1,750,000 | 2,171,855 | ||||||||||||
E-470 Public Highway Authority Colorado Series A | 5.38 | 9-1-2026 | 2,700,000 | 2,722,653 | ||||||||||||
| 5,786,780 | ||||||||||||||||
|
| |||||||||||||||
| 40,072,972 | ||||||||||||||||
|
| |||||||||||||||
Connecticut: 2.27% | ||||||||||||||||
| Education Revenue: 1.09% | ||||||||||||||||
Connecticut HEFAR University of Hartford Series N | 5.00 | 7-1-2024 | 120,000 | 129,742 | ||||||||||||
Connecticut HEFAR University of Hartford Series N | 5.00 | 7-1-2025 | 140,000 | 152,883 | ||||||||||||
Connecticut HEFAR Yale University Issue Series A | 1.10 | 7-1-2048 | 7,000,000 | 7,123,270 | ||||||||||||
Connecticut HEFAR Yale University Issue Series A | 2.05 | 7-1-2035 | 25,000,000 | 25,427,750 | ||||||||||||
Connecticut Higher Education Supplemental Loan Authority Chesla Loan Program Series A | 3.60 | 11-15-2023 | 1,265,000 | 1,339,736 | ||||||||||||
Connecticut Higher Education Supplemental Loan Authority Chesla Loan Program Series B | 5.00 | 11-15-2024 | 250,000 | 281,860 | ||||||||||||
Connecticut Higher Education Supplemental Loan Authority Chesla Loan Program Series B | 5.00 | 11-15-2025 | 400,000 | 458,376 | ||||||||||||
Connecticut Higher Education Supplemental Loan Authority Chesla Loan Program Series B | 5.00 | 11-15-2026 | 585,000 | 678,471 | ||||||||||||
Connecticut Higher Education Supplemental Loan Authority Chesla Loan Program Series D %% | 5.00 | 11-15-2025 | 500,000 | 574,000 | ||||||||||||
| 36,166,088 | ||||||||||||||||
|
| |||||||||||||||
| GO Revenue: 0.44% | ||||||||||||||||
Connecticut Refunding Bond Series B | 4.00 | 5-15-2021 | 11,190,000 | 11,530,288 | ||||||||||||
Connecticut Series C | 4.00 | 6-1-2025 | 1,000,000 | 1,146,860 | ||||||||||||
New Haven CT Series A | 5.25 | 8-1-2021 | 1,830,000 | 1,904,261 | ||||||||||||
| 14,581,409 | ||||||||||||||||
|
| |||||||||||||||
| Health Revenue: 0.27% | ||||||||||||||||
Connecticut HEFAR Hartford Healthcare Series B1 | 5.00 | 7-1-2053 | 7,500,000 | 8,859,000 | ||||||||||||
|
| |||||||||||||||
| Housing Revenue: 0.30% | ||||||||||||||||
Meriden CT MFHR Yale Acres Project | 1.73 | 8-1-2022 | 10,000,000 | 10,150,900 | ||||||||||||
|
| |||||||||||||||
| Tax Revenue: 0.17% | ||||||||||||||||
Connecticut Special Tax Obligation Transportation Infrastructure Purposes Series A | 5.00 | 5-1-2026 | 1,200,000 | 1,469,052 | ||||||||||||
Connecticut Special Tax Obligation Transportation Infrastructure Purposes Series A | 5.00 | 5-1-2027 | 3,400,000 | 4,248,232 | ||||||||||||
| 5,717,284 | ||||||||||||||||
|
| |||||||||||||||
| 75,474,681 | ||||||||||||||||
|
| |||||||||||||||
The accompanying notes are an integral part of these financial statements.
14 | Wells Fargo Short-Term Municipal Bond Fund
Portfolio of investments—June 30, 2020
| Interest rate | Maturity date | Principal | Value | |||||||||||||
Delaware: 0.12% | ||||||||||||||||
| Utilities Revenue: 0.12% | ||||||||||||||||
Delaware EDA Gas Facilities Delmarva Power & Light Company Project | 1.05 | % | 1-1-2031 | $ | 4,000,000 | $ | 4,018,440 | |||||||||
|
| |||||||||||||||
District of Columbia: 0.75% | ||||||||||||||||
| Airport Revenue: 0.11% | ||||||||||||||||
Metropolitan Washington DC Airport Authority Series A | 5.00 | 10-1-2024 | 3,450,000 | 3,762,053 | ||||||||||||
|
| |||||||||||||||
| Housing Revenue: 0.37% | ||||||||||||||||
District of Columbia HFA MFHR Liberty Place Apartments Project | 2.13 | 6-1-2021 | 9,800,000 | 9,858,604 | ||||||||||||
District of Columbia HFA MFHR Strand Residences Project | 1.45 | 2-1-2039 | 2,500,000 | 2,537,800 | ||||||||||||
| 12,396,404 | ||||||||||||||||
|
| |||||||||||||||
| Transportation Revenue: 0.08% | ||||||||||||||||
Metropolitan Washington Transit Authority Series A | 5.00 | 7-15-2025 | 2,000,000 | 2,437,220 | ||||||||||||
|
| |||||||||||||||
| Water & Sewer Revenue: 0.19% | ||||||||||||||||
District of Columbia Water and Sewer Authority Public Utility Subordinated Lien Bond Series C | 1.75 | 10-1-2054 | 6,000,000 | 6,205,260 | ||||||||||||
|
| |||||||||||||||
| �� | 24,800,937 | |||||||||||||||
|
| |||||||||||||||
Florida: 2.89% | ||||||||||||||||
| Airport Revenue: 0.14% | ||||||||||||||||
Broward County FL Airport System Series C | 5.00 | 10-1-2022 | 2,000,000 | 2,176,220 | ||||||||||||
Greater Orlando Aviation Authority Florida Airport Facilities Series A | 5.00 | 10-1-2025 | 2,000,000 | 2,383,700 | ||||||||||||
| 4,559,920 | ||||||||||||||||
|
| |||||||||||||||
| Education Revenue: 0.31% | ||||||||||||||||
Florida Gulf Coast University Financing Corporation Housing Project Series A | 5.00 | 8-1-2020 | 2,055,000 | 2,060,302 | ||||||||||||
Florida Higher Educational Facilities Financing Authority Educational Facilities Institute Technology | 5.00 | 10-1-2025 | 500,000 | 555,465 | ||||||||||||
Florida Higher Educational Facilities Financing Authority Educational Facilities Institute Technology | 5.00 | 10-1-2026 | 750,000 | 839,895 | ||||||||||||
University of North Florida Financing Corporation Capital Housing Project (AGM Insured) | 5.00 | 11-1-2020 | 3,125,000 | 3,162,000 | ||||||||||||
University of North Florida Financing Corporation Capital Housing Project (AGM Insured) | 5.00 | 11-1-2021 | 3,440,000 | 3,601,233 | ||||||||||||
| 10,218,895 | ||||||||||||||||
|
| |||||||||||||||
| Health Revenue: 0.29% | ||||||||||||||||
North Broward FL Hospital District Series B | 5.00 | 1-1-2022 | 1,570,000 | 1,663,180 | ||||||||||||
North Broward FL Hospital District Series B | 5.00 | 1-1-2023 | 1,700,000 | 1,866,260 | ||||||||||||
North Broward FL Hospital District Series B | 5.00 | 1-1-2024 | 2,000,000 | 2,267,960 | ||||||||||||
Palm Beach County FL HCFR Retirement Life Communities Series 2016 | 5.00 | 11-15-2021 | 3,515,000 | 3,671,769 | ||||||||||||
| 9,469,169 | ||||||||||||||||
|
| |||||||||||||||
| Housing Revenue: 0.51% | ||||||||||||||||
Capital Trust Agency Florida Council Towers Apartments Project Series A | 0.80 | 3-1-2023 | 10,450,000 | 10,432,967 | ||||||||||||
Miami-Dade County FL HFA MFHR Liberty Square Phase Two Project | 1.42 | 11-1-2040 | 6,500,000 | 6,584,890 | ||||||||||||
| 17,017,857 | ||||||||||||||||
|
| |||||||||||||||
The accompanying notes are an integral part of these financial statements.
Wells Fargo Short-Term Municipal Bond Fund | 15
Portfolio of investments—June 30, 2020
| Interest rate | Maturity date | Principal | Value | |||||||||||||
| Miscellaneous Revenue: 0.50% | ||||||||||||||||
Manatee County FL School Board Certificate of Participation Series A | 5.00 | % | 7-1-2020 | $ | 1,225,000 | $ | 1,225,000 | |||||||||
Miami-Dade County FL School Board Certificate of Participation Series A | 5.00 | 5-1-2031 | 10,115,000 | 11,754,642 | ||||||||||||
St. Johns County FL School Board Refunding Bond Certificate of Participation | 5.00 | 7-1-2020 | 2,010,000 | 2,010,000 | ||||||||||||
St. Johns County FL School Board Refunding Bond Certificate of Participation | 5.00 | 7-1-2021 | 1,670,000 | 1,747,238 | ||||||||||||
| 16,736,880 | ||||||||||||||||
|
| |||||||||||||||
| Resource Recovery Revenue: 0.06% | ||||||||||||||||
Lee County FL Solid Waste System Refunding Bond | 5.00 | 10-1-2023 | 1,750,000 | 1,960,858 | ||||||||||||
|
| |||||||||||||||
| Tax Revenue: 0.45% | ||||||||||||||||
Department of Environmental Protection Florida Forever Series A | 5.00 | 7-1-2023 | 7,720,000 | 8,433,328 | ||||||||||||
Leon County FL School District | 4.00 | 9-1-2026 | 6,000,000 | 6,586,260 | ||||||||||||
| 15,019,588 | ||||||||||||||||
|
| |||||||||||||||
| Transportation Revenue: 0.06% | ||||||||||||||||
Florida Mid-Bay Bridge Authority Series C | 5.00 | 10-1-2020 | 785,000 | 789,561 | ||||||||||||
Osceola County FL Improvement Osceola Parkway Series | 5.00 | 10-1-2024 | 300,000 | 342,045 | ||||||||||||
Osceola County FL Improvement Osceola Parkway Series | 5.00 | 10-1-2026 | 735,000 | 880,758 | ||||||||||||
| 2,012,364 | ||||||||||||||||
|
| |||||||||||||||
| Utilities Revenue: 0.05% | ||||||||||||||||
JEA Bulk Power Supply System Scherer 4 Project Series A | 3.00 | 10-1-2022 | 1,800,000 | 1,803,150 | ||||||||||||
|
| |||||||||||||||
| Water & Sewer Revenue: 0.52% | ||||||||||||||||
Tohopekaliga FL Water Authority Utility System Bond 144A | 5.00 | 10-1-2025 | 14,160,000 | 17,419,066 | ||||||||||||
|
| |||||||||||||||
| 96,217,747 | ||||||||||||||||
|
| |||||||||||||||
Georgia: 3.24% | ||||||||||||||||
| Housing Revenue: 0.32% | ||||||||||||||||
Cobb County GA Housing Authority MFHR White Circle Phase 2 Project | 1.65 | 12-1-2022 | 6,000,000 | 6,048,000 | ||||||||||||
Northwest GA Housing Authority MFHR Park Homes Apartments Project (FHA Insured) | 1.54 | 8-1-2022 | 4,500,000 | 4,537,170 | ||||||||||||
| 10,585,170 | ||||||||||||||||
|
| |||||||||||||||
| Industrial Development Revenue: 0.66% | ||||||||||||||||
Monroe County GA PCR Georgia Power Company Plant Scherer Project | 2.35 | 10-1-2048 | 16,360,000 | 16,487,444 | ||||||||||||
Savannah GA EDA PCR International Paper Company Project Series B | 1.90 | 8-1-2024 | 4,250,000 | 4,368,108 | ||||||||||||
Savannah GA EDA Recovery Zone Facility International | 2.00 | 11-1-2033 | 1,000,000 | 1,033,020 | ||||||||||||
| 21,888,572 | ||||||||||||||||
|
| |||||||||||||||
| Utilities Revenue: 2.26% | ||||||||||||||||
Bartow County GA Development Authority Georgia Power Company Bowen Project | 2.05 | 9-1-2029 | 4,100,000 | 4,148,134 | ||||||||||||
Burke County GA Development Authority Georgia Power Company Plant Vogtle Project | 1.55 | 12-1-2049 | 4,000,000 | 4,005,120 | ||||||||||||
Burke County GA Development Authority Oglethorpe Power Corporation Vogtle Project Series F | 3.00 | 11-1-2045 | 22,050,000 | 22,874,450 | ||||||||||||
Floyd County GA PCR Georgia Power Company Plant Hammond Project | 2.35 | 7-1-2022 | 11,250,000 | 11,330,663 | ||||||||||||
Georgia Municipal Electric Authority Plant Vogtle Units 3&4 Project M | 5.00 | 1-1-2025 | 200,000 | 231,228 | ||||||||||||
Georgia Municipal Electric Authority Plant Vogtle Units 3&4 Project M | 5.00 | 1-1-2026 | 300,000 | 354,927 | ||||||||||||
Georgia Municipal Electric Authority Plant Vogtle Units 3&4 Project P | 5.00 | 1-1-2023 | 250,000 | 272,635 | ||||||||||||
Georgia Municipal Electric Authority Plant Vogtle Units 3&4 Project P | 5.00 | 1-1-2024 | 400,000 | 449,484 | ||||||||||||
Georgia Municipal Electric Authority Plant Vogtle Units 3&4 Project P | 5.00 | 1-1-2025 | 1,000,000 | 1,153,780 | ||||||||||||
The accompanying notes are an integral part of these financial statements.
16 | Wells Fargo Short-Term Municipal Bond Fund
Portfolio of investments—June 30, 2020
| Interest rate | Maturity date | Principal | Value | |||||||||||||
| Utilities Revenue (continued) | ||||||||||||||||
Main Street Natural Gas Incorporated Georgia Gas Project Series B | 5.00 | % | 3-15-2021 | $ | 2,800,000 | $ | 2,870,588 | |||||||||
Main Street Natural Gas Incorporated Georgia Gas Project Series C (Royal Bank of Canada LIQ) | 4.00 | 8-1-2048 | 6,225,000 | 6,812,267 | ||||||||||||
Main Street Natural Gas Incorporated Georgia Gas Project Series C | 4.00 | 3-1-2050 | 18,000,000 | 20,667,060 | ||||||||||||
| 75,170,336 | ||||||||||||||||
|
| |||||||||||||||
| 107,644,078 | ||||||||||||||||
|
| |||||||||||||||
Hawaii: 0.45% | ||||||||||||||||
| Housing Revenue: 0.22% | ||||||||||||||||
Hawaii Housing Finance & Development Corporation MFHR Hale Kewalo Apartments Series A (GNMA Insured) | 1.90 | 1-1-2021 | 7,160,000 | 7,174,606 | ||||||||||||
|
| |||||||||||||||
| Miscellaneous Revenue: 0.23% | ||||||||||||||||
Hawaii Department of Transportation Airports Division Series 2013 | 5.25 | 8-1-2025 | 1,945,000 | 2,143,293 | ||||||||||||
Hawaii Department of Transportation Airports Division Series 2013 | 5.25 | 8-1-2026 | 5,150,000 | 5,657,172 | ||||||||||||
| 7,800,465 | ||||||||||||||||
|
| |||||||||||||||
| 14,975,071 | ||||||||||||||||
|
| |||||||||||||||
Illinois: 7.50% | ||||||||||||||||
| Airport Revenue: 1.05% | ||||||||||||||||
Chicago IL Midway Airport Refunding Bond Second Lien Series A | 5.00 | 1-1-2022 | 6,100,000 | 6,445,748 | ||||||||||||
Chicago IL Midway Airport Refunding Bond Second Lien Series A | 5.00 | 1-1-2025 | 5,000,000 | 5,574,950 | ||||||||||||
Chicago IL O’Hare International Airport Refunding Bond General Senior Lien Series B | 5.00 | 1-1-2023 | 5,000,000 | 5,282,900 | ||||||||||||
Chicago IL O’Hare International Airport Refunding Bond General Senior Lien Series B | 5.00 | 1-1-2024 | 1,550,000 | 1,637,219 | ||||||||||||
Chicago IL O’Hare International Airport Refunding Bond Passenger Facility | 5.00 | 1-1-2023 | 13,720,000 | 14,496,278 | ||||||||||||
Chicago IL O’Hare International Airport Refunding Bond Passenger Facility | 5.00 | 1-1-2024 | 1,335,000 | 1,506,000 | ||||||||||||
| 34,943,095 | ||||||||||||||||
|
| |||||||||||||||
| Education Revenue: 0.15% | ||||||||||||||||
Illinois State University Auxiliary Facilities System Series A | 5.00 | 4-1-2024 | 2,325,000 | 2,577,263 | ||||||||||||
Illinois State University Auxiliary Facilities System Series A (AGM Insured) | 5.00 | 4-1-2025 | 700,000 | 818,531 | ||||||||||||
Illinois State University Auxiliary Facilities System Series B (AGM Insured) | 5.00 | 4-1-2024 | 415,000 | 472,341 | ||||||||||||
Western Illinois University Refunding Bond Auxiliary Facilities System (BAM Insured) | 4.00 | 4-1-2024 | 1,000,000 | 1,102,810 | ||||||||||||
| 4,970,945 | ||||||||||||||||
|
| |||||||||||||||
| GO Revenue: 2.06% | ||||||||||||||||
Chicago IL Board of Education Refunding Bond Series A (AGM Insured) | 5.00 | 12-1-2022 | 500,000 | 534,315 | ||||||||||||
Chicago IL Board of Education Refunding Bond Series A (AGM Insured) | 5.00 | 12-1-2023 | 2,000,000 | 2,188,100 | ||||||||||||
Chicago IL Park District Harbor Facility Series C | 5.00 | 1-1-2022 | 3,155,000 | 3,208,856 | ||||||||||||
Chicago IL Park District Refunding Bond Series D | 5.00 | 1-1-2021 | 1,000,000 | 1,017,620 | ||||||||||||
Chicago IL Park District Series A | 4.50 | 1-1-2023 | 250,000 | 250,000 | ||||||||||||
Chicago IL Prerefunded Refunding Bond Series C | 5.00 | 1-1-2022 | 10,505,000 | 11,232,156 | ||||||||||||
Chicago IL Prerefunded Refunding Bond Series C | 5.00 | 1-1-2023 | 1,450,000 | 1,615,184 | ||||||||||||
Chicago IL Refunding Bond Series A | 5.00 | 1-1-2026 | 5,000,000 | 5,385,050 | ||||||||||||
Chicago IL Refunding Bond Series B (Ambac Insured) | 5.13 | 1-1-2022 | 1,595,000 | 1,653,680 | ||||||||||||
Chicago IL Series C | 5.00 | 1-1-2021 | 3,000,000 | 3,069,240 | ||||||||||||
Chicago IL Unrefunded Balance Refunding Bond Series C | 5.00 | 1-1-2022 | 5,340,000 | 5,427,736 | ||||||||||||
Chicago IL Unrefunded Balance Refunding Bond Series C | 5.00 | 1-1-2023 | 3,300,000 | 3,435,366 | ||||||||||||
Cook County IL Refunding Bond Series 2016 A | 5.00 | 11-15-2020 | 5,430,000 | 5,477,567 | ||||||||||||
The accompanying notes are an integral part of these financial statements.
Wells Fargo Short-Term Municipal Bond Fund | 17
Portfolio of investments—June 30, 2020
| Interest rate | Maturity date | Principal | Value | |||||||||||||
| GO Revenue (continued) | ||||||||||||||||
Dekalb & Kane Counties IL Community Unit School District Series B (AGM Insured) ¤ | 0.00 | % | 1-1-2025 | $ | 3,235,000 | $ | 3,028,089 | |||||||||
Illinois Series 2014 | 5.00 | 4-1-2022 | 3,000,000 | 3,108,540 | ||||||||||||
Illinois Series 2016 | 5.00 | 11-1-2021 | 5,000,000 | 5,148,450 | ||||||||||||
Illinois Series 2020 | 5.13 | 5-1-2022 | 2,000,000 | 2,079,780 | ||||||||||||
Illinois Series 2020 | 5.38 | 5-1-2023 | 1,000,000 | 1,062,910 | ||||||||||||
Kane County IL School District Series B | 2.00 | 2-1-2021 | 880,000 | 885,386 | ||||||||||||
Kane, McHenry, Cook & Dekalb Counties IL Community Unit School District #300 | 4.25 | 1-1-2023 | 1,000,000 | 1,016,360 | ||||||||||||
Kendall, Kane & Will Counties IL Refunding Bond Series B | 5.00 | 10-1-2022 | 1,660,000 | 1,813,650 | ||||||||||||
Kendall, Kane & Will Counties IL Refunding Bond Series B | 5.00 | 10-1-2023 | 825,000 | 932,019 | ||||||||||||
Waukegan IL Series B (AGM Insured) | 4.00 | 12-30-2023 | 500,000 | 554,020 | ||||||||||||
Whiteside & Lee Counties IL Community Unit School District Series A (BAM Insured) | 4.00 | 12-1-2024 | 1,490,000 | 1,673,121 | ||||||||||||
Will County IL Community High School District #161 | 4.00 | 1-1-2024 | 2,000,000 | 2,206,020 | ||||||||||||
Winnebago Boone County IL Community College District Rock Valley College Series A (AGM Insured) | 5.00 | 1-1-2022 | 500,000 | 531,500 | ||||||||||||
| 68,534,715 | ||||||||||||||||
|
| |||||||||||||||
| Health Revenue: 0.25% | ||||||||||||||||
Illinois Finance Authority Ascension Health Alliance Senior Credit Group Series E-2 | 1.75 | 11-15-2042 | 2,000,000 | 2,016,820 | ||||||||||||
Illinois Finance Authority Revenue Advocate Health Care Network | 4.00 | 11-1-2030 | 3,600,000 | 4,112,964 | ||||||||||||
Southwestern Illinois Development Authority Health Facility Memorial Group Incorporated | 6.38 | 11-1-2023 | 1,950,000 | 2,146,287 | ||||||||||||
| 8,276,071 | ||||||||||||||||
|
| |||||||||||||||
| Housing Revenue: 0.23% | ||||||||||||||||
Illinois Housing Development Authority (SIFMA Municipal Swap +1.00%) (FNMA LOC, FNMA LIQ) ± | 1.13 | 5-15-2050 | 7,500,000 | 7,506,675 | ||||||||||||
Illinois Housing Development Authority (GNMA Insured) | 5.00 | 8-1-2028 | 80,000 | 80,250 | ||||||||||||
| 7,586,925 | ||||||||||||||||
|
| |||||||||||||||
| Miscellaneous Revenue: 1.78% | ||||||||||||||||
Chicago IL Board of Education Refunding Bond Series B | 5.00 | 12-1-2024 | 2,270,000 | 2,415,666 | ||||||||||||
Chicago IL Board of Education Refunding Bond Series B | 5.00 | 12-1-2025 | 2,460,000 | 2,636,874 | ||||||||||||
Illinois Refunding Bond (BAM Insured) | 5.00 | 8-1-2020 | 9,175,000 | 9,195,736 | ||||||||||||
Illinois Refunding Bond | 5.00 | 2-1-2022 | 4,375,000 | 4,519,244 | ||||||||||||
Illinois Refunding Bond | 5.00 | 2-1-2023 | 8,775,000 | 9,201,465 | ||||||||||||
Illinois Refunding Bond Series 2012 (AGM Insured) | 5.00 | 8-1-2020 | 5,000,000 | 5,011,300 | ||||||||||||
Illinois Series 2014 | 5.00 | 5-1-2021 | 2,000,000 | 2,038,940 | ||||||||||||
Illinois Tender Option Bond Trust Receipts/Floater Certificates Series 2020-XF2854 (Barclays Bank plc LOC, Barclays Bank plc LIQ) 144Aø | 0.31 | 6-15-2050 | 24,160,000 | 24,160,000 | ||||||||||||
| 59,179,225 | ||||||||||||||||
|
| |||||||||||||||
| Tax Revenue: 1.58% | ||||||||||||||||
Build Illinois Bond Junior Obligation Series C | 5.00 | 6-15-2022 | 2,985,000 | 3,123,176 | ||||||||||||
Chicago IL Motor Fuel Tax Refunding Bond Series 2013 | 5.00 | 1-1-2021 | 380,000 | 381,406 | ||||||||||||
Chicago IL Motor Fuel Tax Refunding Bond Series 2013 | 5.00 | 1-1-2022 | 955,000 | 965,142 | ||||||||||||
Chicago IL Transit Authority Sales Tax Receipts | 5.25 | 12-1-2024 | 6,705,000 | 7,036,495 | ||||||||||||
Hillside IL Refunding Bond Series 2018 | 5.00 | 1-1-2024 | 1,215,000 | 1,236,736 | ||||||||||||
Huntley IL Special Service Area #6 Special Tax Refunding Bond (BAM Insured) | 2.20 | 3-1-2024 | 1,525,000 | 1,577,491 | ||||||||||||
Illinois Refunding Bond | 5.00 | 1-1-2021 | 1,760,000 | 1,780,645 | ||||||||||||
Illinois Regional Transportation Authority Refunding Bond (AGM Insured) | 5.75 | 6-1-2021 | 3,000,000 | 3,130,140 | ||||||||||||
The accompanying notes are an integral part of these financial statements.
18 | Wells Fargo Short-Term Municipal Bond Fund
Portfolio of investments—June 30, 2020
| Interest rate | Maturity date | Principal | Value | |||||||||||||
| Tax Revenue (continued) | ||||||||||||||||
Illinois Sales Tax Revenue Junior Obligation Series A | 5.00 | % | 6-15-2023 | $ | 5,825,000 | $ | 6,220,285 | |||||||||
Illinois Sales Tax Revenue Junior Obligation Series C | 4.00 | 6-15-2025 | 4,000,000 | 4,231,400 | ||||||||||||
Illinois Sales Tax Revenue Refunding Bond Series C | 4.00 | 6-15-2023 | 3,315,000 | 3,446,340 | ||||||||||||
Illinois Series 2013 | 5.00 | 6-15-2024 | 485,000 | 517,126 | ||||||||||||
Illinois Series A | 4.00 | 1-1-2021 | 2,715,000 | 2,733,516 | ||||||||||||
Metropolitan Pier & Exposition Authority McCormick Place Project Non-Callable Bond Series B | 5.00 | 12-15-2022 | 7,000,000 | 7,310,870 | ||||||||||||
Metropolitan Pier & Exposition Authority McCormick Place Project Series A (National Insured) ¤ | 0.00 | 12-15-2021 | 920,000 | 885,785 | ||||||||||||
Metropolitan Pier & Exposition Authority McCormick Place Project Series B | 5.00 | 12-15-2020 | 1,845,000 | 1,860,756 | ||||||||||||
Sales Tax Securitization Corporation Second Lien Sales Tax | 5.00 | 1-1-2028 | 5,000,000 | 5,999,550 | ||||||||||||
| 52,436,859 | ||||||||||||||||
|
| |||||||||||||||
| Tobacco Revenue: 0.38% | ||||||||||||||||
Illinois Railsplitter Tobacco Settlement Authority | 5.00 | 6-1-2022 | 12,000,000 | 12,840,720 | ||||||||||||
|
| |||||||||||||||
| Water & Sewer Revenue: 0.02% | ||||||||||||||||
Chicago IL Second Lien | 5.00 | 11-1-2020 | 740,000 | 748,562 | ||||||||||||
|
| |||||||||||||||
| 249,517,117 | ||||||||||||||||
|
| |||||||||||||||
Indiana: 0.97% | ||||||||||||||||
| GO Revenue: 0.06% | ||||||||||||||||
Hammond IN Local Public Improvement Advance Program Series A | 2.38 | 12-31-2020 | 2,000,000 | 2,012,520 | ||||||||||||
|
| |||||||||||||||
| Health Revenue: 0.53% | ||||||||||||||||
Indiana Finance Authority Health System Franciscan Alliance Incorporated Series B | 5.00 | 11-1-2022 | 1,000,000 | 1,087,140 | ||||||||||||
Indiana Finance Authority Health System Franciscan Alliance Incorporated Series B | 5.00 | 11-1-2023 | 1,270,000 | 1,424,800 | ||||||||||||
Indiana Finance Authority Health System Franciscan Alliance Incorporated Series B | 5.00 | 11-1-2024 | 3,000,000 | 3,460,530 | ||||||||||||
Indiana Finance Authority Health System Franciscan Alliance Incorporated Series C | 5.00 | 11-1-2021 | 1,000,000 | 1,056,010 | ||||||||||||
Indiana Finance Authority Health System Franciscan Alliance Incorporated Series C | 5.00 | 11-1-2023 | 800,000 | 897,512 | ||||||||||||
Indiana Finance Authority Health System Franciscan Alliance Incorporated Series C | 5.00 | 11-1-2024 | 1,000,000 | 1,153,510 | ||||||||||||
Indiana Finance Authority Parkview Health Series A | 5.00 | 5-1-2021 | 1,020,000 | 1,056,598 | ||||||||||||
Indiana Finance Authority Parkview Health Series A | 5.00 | 5-1-2023 | 1,010,000 | 1,126,766 | ||||||||||||
Indiana Finance Authority Refunding Bond University Health Obligated Group Series B | 1.65 | 12-1-2042 | 5,130,000 | 5,196,280 | ||||||||||||
Indiana Finance Authority Senior Living Series A | 5.00 | 11-15-2022 | 500,000 | 518,505 | ||||||||||||
Indiana Finance Authority Senior Living Series A | 5.00 | 11-15-2023 | 500,000 | 524,920 | ||||||||||||
| 17,502,571 | ||||||||||||||||
|
| |||||||||||||||
| Miscellaneous Revenue: 0.06% | ||||||||||||||||
Indiana Bond Bank Special Program Series A | 5.25 | 10-15-2021 | 2,000,000 | 2,104,260 | ||||||||||||
|
| |||||||||||||||
| Resource Recovery Revenue: 0.12% | ||||||||||||||||
Indiana Finance Authority Economic Republic Services Project ø | 0.65 | 12-1-2037 | 4,000,000 | 3,999,520 | ||||||||||||
|
| |||||||||||||||
| Utilities Revenue: 0.20% | ||||||||||||||||
Warrick County IN Environment Import Vectra Energy Delivery of Indiana Incorporated | 2.38 | 9-1-2055 | 6,550,000 | 6,551,048 | ||||||||||||
|
| |||||||||||||||
| 32,169,919 | ||||||||||||||||
|
| |||||||||||||||
The accompanying notes are an integral part of these financial statements.
Wells Fargo Short-Term Municipal Bond Fund | 19
Portfolio of investments—June 30, 2020
| Interest rate | Maturity date | Principal | Value | |||||||||||||
Iowa: 0.66% | ||||||||||||||||
| Education Revenue: 0.07% | ||||||||||||||||
Iowa Student Loan Liquidity Corporation AMT Senior Series B | 5.00 | % | 12-1-2022 | $ | 500,000 | $ | 534,190 | |||||||||
Iowa Student Loan Liquidity Corporation AMT Senior Series B | 5.00 | 12-1-2023 | 700,000 | 765,597 | ||||||||||||
Iowa Student Loan Liquidity Corporation AMT Senior Series B | 5.00 | 12-1-2024 | 1,000,000 | 1,116,830 | ||||||||||||
| 2,416,617 | ||||||||||||||||
|
| |||||||||||||||
| Housing Revenue: 0.23% | ||||||||||||||||
Iowa Finance Authority SFMR Series D (1 Month LIBOR +0.35%) (GNMA/FNMA/FHLMC Insured) ± | 0.48 | 7-1-2048 | 7,500,000 | 7,429,200 | ||||||||||||
|
| |||||||||||||||
| Utilities Revenue: 0.36% | ||||||||||||||||
Iowa Gas Project Public Expenditure and Financial Accountability Incorporated | 5.00 | 9-1-2049 | 10,000,000 | 12,067,800 | ||||||||||||
|
| |||||||||||||||
| 21,913,617 | ||||||||||||||||
|
| |||||||||||||||
Kansas: 0.21% | ||||||||||||||||
| Health Revenue: 0.06% | ||||||||||||||||
Wichita KS Health Care Facilities Presbyterian Manors Incorporated | 4.00 | 5-15-2024 | 1,015,000 | 999,237 | ||||||||||||
Wichita KS Health Care Facilities Presbyterian Manors Incorporated | 5.00 | 5-15-2025 | 1,055,000 | 1,075,467 | ||||||||||||
| 2,074,704 | ||||||||||||||||
|
| |||||||||||||||
| Housing Revenue: 0.15% | ||||||||||||||||
Kansas Development Finance Authority MFHR Woodland Village Apartments Project Series J | 1.68 | 7-1-2022 | 5,000,000 | 5,044,100 | ||||||||||||
|
| |||||||||||||||
| 7,118,804 | ||||||||||||||||
|
| |||||||||||||||
Kentucky: 2.82% | ||||||||||||||||
| Health Revenue: 0.40% | ||||||||||||||||
Louisville & Jefferson Counties KY Catholic Health Initiatives Series A | 5.00 | 12-1-2021 | 8,210,000 | 8,728,626 | ||||||||||||
Louisville & Jefferson Counties KY Metro Health System Revenue Norton Healthcare Incorporated Series C | 5.00 | 10-1-2047 | 4,000,000 | 4,645,400 | ||||||||||||
| 13,374,026 | ||||||||||||||||
|
| |||||||||||||||
| Housing Revenue: 1.15% | ||||||||||||||||
Kentucky Housing Corporation Beecher Phase I Project | 2.00 | 3-1-2022 | 5,500,000 | 5,578,705 | ||||||||||||
Kentucky Housing Corporation Jefferson Green Apartments Project | 2.20 | 9-1-2022 | 20,250,000 | 20,443,995 | ||||||||||||
Kentucky Housing Corporation MFHR Chapel House Apartments Project | 0.80 | 9-1-2022 | 3,070,000 | 3,084,797 | ||||||||||||
Kentucky Housing Corporation MFHR City View Park Project | 1.16 | 2-1-2023 | 9,000,000 | 9,065,340 | ||||||||||||
| 38,172,837 | ||||||||||||||||
|
| |||||||||||||||
| Miscellaneous Revenue: 0.24% | ||||||||||||||||
Lexington Fayette KY Urban County Lease Eastern State Hospital Series A | 5.25 | 6-1-2026 | 6,620,000 | 6,857,393 | ||||||||||||
Pendleton County KY School District Finance Corporation | 2.00 | 2-1-2021 | 1,200,000 | 1,209,444 | ||||||||||||
| 8,066,837 | ||||||||||||||||
|
| |||||||||||||||
| Utilities Revenue: 1.03% | ||||||||||||||||
Kentucky Public Energy Authority Gas Supply Series B | 4.00 | 1-1-2049 | 26,085,000 | 28,731,062 | ||||||||||||
Louisville & Jefferson Counties KY Metro Government PCR Series B | 2.55 | 11-1-2027 | 5,500,000 | 5,575,845 | ||||||||||||
| 34,306,907 | ||||||||||||||||
|
| |||||||||||||||
| 93,920,607 | ||||||||||||||||
|
| |||||||||||||||
The accompanying notes are an integral part of these financial statements.
20 | Wells Fargo Short-Term Municipal Bond Fund
Portfolio of investments—June 30, 2020
| Interest rate | Maturity date | Principal | Value | |||||||||||||
Louisiana: 1.86% | ||||||||||||||||
| Industrial Development Revenue: 1.66% | ||||||||||||||||
St John Baptist Parish LA Marathon Oil Corporation Project | 2.10 | % | 6-1-2037 | $ | 14,450,000 | $ | 14,118,228 | |||||||||
St. James Parish LA Nucor Steel LLC Project Gulf Opportunity Zone Series A-1 ø | 0.31 | 11-1-2040 | 41,025,000 | 41,025,000 | ||||||||||||
| 55,143,228 | ||||||||||||||||
|
| |||||||||||||||
| Tax Revenue: 0.08% | ||||||||||||||||
Louisiana Local Government Environmental Facilities & CDA Series 2015 (BAM Insured) | 5.00 | 12-1-2020 | 1,135,000 | 1,156,656 | ||||||||||||
Louisiana Regional Transit Authority CAB (National Insured) ¤ | 0.00 | 12-1-2021 | 1,615,000 | 1,546,201 | ||||||||||||
| 2,702,857 | ||||||||||||||||
|
| |||||||||||||||
| Utilities Revenue: 0.12% | ||||||||||||||||
Lafayette LA Refunding Bond | 5.00 | 11-1-2023 | 3,680,000 | 4,074,422 | ||||||||||||
|
| |||||||||||||||
| 61,920,507 | ||||||||||||||||
|
| |||||||||||||||
Maine: 0.04% |
| |||||||||||||||
| Education Revenue: 0.01% | ||||||||||||||||
Maine Finance Authority Supplemental Education Loan Program Class A Series A-1 (AGM Insured) | 5.00 | 12-1-2025 | 425,000 | 498,789 | ||||||||||||
|
| |||||||||||||||
| Health Revenue: 0.03% | ||||||||||||||||
Maine Health & Higher Educational Facilities Authority Series A | 5.00 | 7-1-2025 | 800,000 | 939,672 | ||||||||||||
|
| |||||||||||||||
| 1,438,461 | ||||||||||||||||
|
| |||||||||||||||
Maryland: 2.11% |
| |||||||||||||||
| Health Revenue: 0.02% | ||||||||||||||||
Rockville MD Mayor and Council Economic Development Ingleside King Farm Project Series A-1 | 5.00 | 11-1-2020 | 850,000 | 852,287 | ||||||||||||
|
| |||||||||||||||
| Housing Revenue: 1.58% | ||||||||||||||||
Maryland CDA Department of Housing & Community Multifamily Development Huntington Apartments Series C 144A | 2.34 | 4-1-2021 | 7,500,000 | 7,562,775 | ||||||||||||
Maryland CDA Department of Housing & Community Multifamily Development Lakeview Victoria Park Series H | 3.00 | 11-1-2020 | 9,000,000 | 9,050,760 | ||||||||||||
Maryland CDA Department of Housing & Community Multifamily Development Orchard Mews | 2.06 | 9-1-2021 | 5,500,000 | 5,556,870 | ||||||||||||
Maryland CDA Department of Housing & Community Multifamily Development Orchard Park Series F | 2.52 | 8-1-2020 | 15,000,000 | 15,015,000 | ||||||||||||
Maryland CDA Department of Housing & Community Multifamily Development Park Square Homes Series E | 2.53 | 8-1-2020 | 7,500,000 | 7,507,500 | ||||||||||||
Maryland CDA Department of Housing & Community Multifamily Development Park View | 1.75 | 2-1-2022 | 7,700,000 | 7,753,130 | ||||||||||||
| 52,446,035 | ||||||||||||||||
|
| |||||||||||||||
| Transportation Revenue: 0.10% | ||||||||||||||||
Maryland Transportation Authority Refunding Bond AMT | 5.00 | 3-1-2022 | 2,995,000 | 3,183,415 | ||||||||||||
|
| |||||||||||||||
| Utilities Revenue: 0.41% | ||||||||||||||||
Maryland Economic Development Corporation PCR Potomac Electric Power Company Project | 1.70 | 9-1-2022 | 13,250,000 | 13,531,165 | ||||||||||||
|
| |||||||||||||||
| 70,012,902 | ||||||||||||||||
|
| |||||||||||||||
The accompanying notes are an integral part of these financial statements.
Wells Fargo Short-Term Municipal Bond Fund | 21
Portfolio of investments—June 30, 2020
| Interest rate | Maturity date | Principal | Value | |||||||||||||
Massachusetts: 2.55% |
| |||||||||||||||
| Education Revenue: 0.20% | ||||||||||||||||
Massachusetts Educational Financing Authority AMT Issue J | 5.00 | % | 7-1-2021 | $ | 1,280,000 | $ | 1,321,203 | |||||||||
Massachusetts Educational Financing Authority AMT Issue K Series A | 5.00 | 7-1-2022 | 1,000,000 | 1,063,660 | ||||||||||||
Massachusetts Educational Financing Authority Series A | 5.00 | 1-1-2022 | 4,115,000 | 4,312,643 | ||||||||||||
| 6,697,506 | ||||||||||||||||
|
| |||||||||||||||
| Health Revenue: 0.49% | ||||||||||||||||
Massachusetts Development Finance Agency Partners Healthcare System Series S-3 (SIFMA Municipal Swap +0.50%) ± | 0.63 | 7-1-2038 | 5,000,000 | 4,982,200 | ||||||||||||
Massachusetts Development Finance Agency Partners Healthcare System Series S-5 (SIFMA Municipal Swap +0.42%) ± | 0.55 | 7-1-2044 | 11,230,000 | 11,196,984 | ||||||||||||
| 16,179,184 | ||||||||||||||||
|
| |||||||||||||||
| Housing Revenue: 0.63% | ||||||||||||||||
Massachusetts HFA Construction Loan Notes Series B | 2.05 | 12-1-2021 | 13,675,000 | 13,684,573 | ||||||||||||
Massachusetts HFA Single Family Series 200 (1 Month LIBOR +0.38%) ± | 0.50 | 12-1-2048 | 7,500,000 | 7,432,275 | ||||||||||||
| 21,116,848 | ||||||||||||||||
|
| |||||||||||||||
| Miscellaneous Revenue: 0.76% | ||||||||||||||||
Massachusetts Consolidated Loan Subordinate Bond Series D-2 | 1.70 | 8-1-2043 | 24,550,000 | 25,155,649 | ||||||||||||
|
| |||||||||||||||
| Tax Revenue: 0.08% | ||||||||||||||||
Massachusetts Bay Transportation Authority Series B Subseries B-1 | 5.00 | 7-1-2025 | 2,300,000 | 2,803,424 | ||||||||||||
|
| |||||||||||||||
| Transportation Revenue: 0.39% | ||||||||||||||||
Massachusetts Department of Transportation Refunding Bond | 5.00 | 1-1-2039 | 11,685,000 | 12,944,176 | ||||||||||||
|
| |||||||||||||||
| 84,896,787 | ||||||||||||||||
|
| |||||||||||||||
Michigan: 1.57% |
| |||||||||||||||
| Education Revenue: 0.03% | ||||||||||||||||
Western Michigan University Refunding Bond | 5.00 | 11-15-2020 | 1,000,000 | 1,015,080 | ||||||||||||
|
| |||||||||||||||
| GO Revenue: 0.17% | ||||||||||||||||
Allendale MI Public School District Series A (Qualified School Board Loan Fund Insured) | 3.00 | 11-1-2021 | 895,000 | 924,508 | ||||||||||||
Caledonia MI Community Schools (Qualified School Board Loan Fund Insured) | 5.00 | 5-1-2021 | 1,140,000 | 1,183,822 | ||||||||||||
Detroit MI Series 2018 | 5.00 | 4-1-2021 | 620,000 | 626,907 | ||||||||||||
Flushing MI Community School District (Qualified School Board Loan Fund Insured) | 4.00 | 5-1-2021 | 1,135,000 | 1,168,937 | ||||||||||||
Haslett MI Public Schools (Qualified School Board Loan Fund Insured) | 5.00 | 5-1-2021 | 500,000 | 518,880 | ||||||||||||
Lake Orion MI Community School District 2016 Refunding Bond (Qualified School Board Loan Fund Insured) | 5.00 | 5-1-2021 | 1,385,000 | 1,437,879 | ||||||||||||
| 5,860,933 | ||||||||||||||||
|
| |||||||||||||||
| Health Revenue: 0.42% | ||||||||||||||||
Michigan Finance Authority Bronson Healthcare Group Series B & C | 3.75 | 11-15-2049 | 7,600,000 | 8,670,536 | ||||||||||||
Michigan Finance Authority Crittenden Hospital Medical Center Series A | 4.13 | 6-1-2032 | 4,290,000 | 4,600,339 | ||||||||||||
Michigan Strategic Limited Obligation Refunding Bond Holland Home Project | 4.00 | 11-15-2024 | 580,000 | 586,705 | ||||||||||||
| 13,857,580 | ||||||||||||||||
|
| |||||||||||||||
| Industrial Development Revenue: 0.61% | ||||||||||||||||
Michigan Strategic Limited Obligation Consumers Energy Company Project | 1.80 | 10-1-2049 | 19,500,000 | 20,196,930 | ||||||||||||
|
| |||||||||||||||
The accompanying notes are an integral part of these financial statements.
22 | Wells Fargo Short-Term Municipal Bond Fund
Portfolio of investments—June 30, 2020
| Interest rate | Maturity date | Principal | Value | |||||||||||||
| Miscellaneous Revenue: 0.07% | ||||||||||||||||
Michigan Finance Authority Local Government Loan Program Series 2014H-1 | 5.00 | % | 10-1-2022 | $ | 1,075,000 | $ | 1,136,275 | |||||||||
Michigan Finance Authority Senior Lien Distributable State Aid Charter County of Wayne Criminal Justice Center Project | 5.00 | 11-1-2022 | 1,150,000 | 1,272,682 | ||||||||||||
| 2,408,957 | ||||||||||||||||
|
| |||||||||||||||
| Water & Sewer Revenue: 0.27% | ||||||||||||||||
Michigan Finance Authority Refunding Bond Local Government Loan Program Detroit Water & Sewer Series D-6 (National Insured) | 5.00 | 7-1-2020 | 1,800,000 | 1,800,000 | ||||||||||||
Michigan Finance Authority Refunding Bond Second Lien Detroit Water & Sewer Series C-7 (National Insured) | 5.00 | 7-1-2020 | 3,835,000 | 3,835,000 | ||||||||||||
Michigan Finance Authority Refunding Bond Second Lien Detroit Water & Sewer Series C-7 (National Insured) | 5.00 | 7-1-2021 | 3,095,000 | 3,233,996 | ||||||||||||
| 8,868,996 | ||||||||||||||||
|
| |||||||||||||||
| 52,208,476 | ||||||||||||||||
|
| |||||||||||||||
Minnesota: 1.02% |
| |||||||||||||||
| Education Revenue: 0.03% | ||||||||||||||||
Minnesota HEFAR Concordia University Series 6Q (U.S. Bank NA LOC) ø | 0.14 | 4-1-2037 | 1,000,000 | 1,000,000 | ||||||||||||
|
| |||||||||||||||
| GO Revenue: 0.18% | ||||||||||||||||
Hastings MN Independent School District #200 Series A (South Dakota Credit Program Insured) ¤ | 0.00 | 2-1-2023 | 815,000 | 800,917 | ||||||||||||
Hastings MN Independent School District #200 Series A (South Dakota Credit Program Insured) ¤ | 0.00 | 2-1-2024 | 1,015,000 | 986,306 | ||||||||||||
JPMorgan Chase Puttable Tax-Exempt Receipts Trust Series 5027 (JPMorgan Chase & Company LIQ) 144Aø | 0.38 | 6-1-2021 | 4,300,000 | 4,300,000 | ||||||||||||
| 6,087,223 | ||||||||||||||||
|
| |||||||||||||||
| Housing Revenue: 0.78% | ||||||||||||||||
Brooklyn Center MN MFHR Development Sonder House Apartments Project | 1.35 | 1-1-2037 | 2,355,000 | 2,362,819 | ||||||||||||
Dakota County MN Community Development Agency Senior MFHR West St. Paul Apartments Project Series A | 2.25 | 1-1-2022 | 6,285,000 | 6,290,154 | ||||||||||||
Dakota County MN Community Development Agency Senior MFHR West St. Paul Apartments Project Series B | 3.80 | 7-1-2022 | 6,325,000 | 6,248,278 | ||||||||||||
Minnesota HFA Series D (SIFMA Municipal Swap +0.43%) (GNMA/FNMA/FHLMC Insured) ± | 0.56 | 1-1-2045 | 11,000,000 | 10,967,000 | ||||||||||||
| 25,868,251 | ||||||||||||||||
|
| |||||||||||||||
| Miscellaneous Revenue: 0.03% | ||||||||||||||||
Duluth MN Independent School District Certificate of Participation Series B (South Dakota Credit Program Insured) | 5.00 | 2-1-2024 | 425,000 | 485,894 | ||||||||||||
Duluth MN Independent School District Certificate of Participation Series B (South Dakota Credit Program Insured) | 5.00 | 2-1-2025 | 375,000 | 441,750 | ||||||||||||
| 927,644 | ||||||||||||||||
|
| |||||||||||||||
| 33,883,118 | ||||||||||||||||
|
| |||||||||||||||
Mississippi: 0.84% |
| |||||||||||||||
| Health Revenue: 0.08% | ||||||||||||||||
Mississippi Hospital Equipment and Facilities Authority Revenue Refunding Bond Baptist Memorial Health Care | 5.00 | 9-1-2044 | 2,500,000 | 2,815,875 | ||||||||||||
|
| |||||||||||||||
The accompanying notes are an integral part of these financial statements.
Wells Fargo Short-Term Municipal Bond Fund | 23
Portfolio of investments—June 30, 2020
| Interest rate | Maturity date | Principal | Value | |||||||||||||
| Industrial Development Revenue: 0.55% | ||||||||||||||||
Mississippi Business Finance Corporation Solid Waste Disposal Facilities Mississippi Power Company Project ø | 0.45 | % | 7-1-2025 | $ | 7,600,000 | $ | 7,600,000 | |||||||||
Mississippi Business Finance Corporation Solid Waste Disposal Facilities Mississippi Power Company Project ø | 0.45 | 5-1-2028 | 10,520,000 | 10,520,000 | ||||||||||||
| 18,120,000 | ||||||||||||||||
|
| |||||||||||||||
| Utilities Revenue: 0.21% | ||||||||||||||||
Mississippi Business Finance Corporation Mississippi Power Company Project Series 2010 | 2.75 | 12-1-2040 | 6,750,000 | 6,856,988 | ||||||||||||
|
| |||||||||||||||
| 27,792,863 | ||||||||||||||||
|
| |||||||||||||||
Missouri: 1.06% |
| |||||||||||||||
| GO Revenue: 0.16% | ||||||||||||||||
St. Louis MO Special Administrative Board The Transitional School Direct Deposit Program | 4.00 | 4-1-2022 | 5,030,000 | 5,356,799 | ||||||||||||
|
| |||||||||||||||
| Health Revenue: 0.09% | ||||||||||||||||
RBC Municipal Products Incorporated (Royal Bank of Canada LOC, Royal Bank of Canada LIQ) 144A ø | 0.20 | 9-1-2039 | 3,000,000 | 3,000,000 | ||||||||||||
|
| |||||||||||||||
| Industrial Development Revenue: 0.72% | ||||||||||||||||
Missouri Environmental Improvement and Energy Resources Authority Kansas City Power and Light Company Project | 2.75 | 5-1-2038 | 23,400,000 | 24,030,864 | ||||||||||||
|
| |||||||||||||||
| Tax Revenue: 0.09% | ||||||||||||||||
Arnold MO Real Property Arnold Triangle Redevelopment Project Series A | 3.75 | 5-1-2023 | 980,000 | 968,044 | ||||||||||||
Bi State Development Agency Missouri Illinois Metropolitan District Refunding Bond St. Clair County Metrolink Project (AGM Insured) | 5.25 | 7-1-2020 | 2,000,000 | 2,000,000 | ||||||||||||
| 2,968,044 | ||||||||||||||||
|
| |||||||||||||||
| 35,355,707 | ||||||||||||||||
|
| |||||||||||||||
Nebraska: 0.15% | ||||||||||||||||
| Health Revenue: 0.12% | ||||||||||||||||
Douglas County NE Hospital Authority Children’s Hospital Obligated Group Series B | 5.00 | 11-15-2053 | 3,250,000 | 3,814,460 | ||||||||||||
|
| |||||||||||||||
| Utilities Revenue: 0.03% | ||||||||||||||||
Central Plains Energy Project Nebraska Refunding Bond Project #3 Series 2012 | 5.00 | 9-1-2042 | 1,075,000 | 1,150,035 | ||||||||||||
|
| |||||||||||||||
| 4,964,495 | ||||||||||||||||
|
| |||||||||||||||
Nevada: 0.53% |
| |||||||||||||||
| Airport Revenue: 0.03% | ||||||||||||||||
Clark County NV Airport Jet Aviation Fuel Tax Series A | 5.00 | 7-1-2020 | 1,000,000 | 1,000,000 | ||||||||||||
|
| |||||||||||||||
| GO Revenue: 0.33% | ||||||||||||||||
Clark County NV School District Series B (AGM Insured) | 5.00 | 6-15-2027 | 5,000,000 | 6,234,800 | ||||||||||||
Clark County NV School District Series C | 5.00 | 6-15-2022 | 2,000,000 | 2,167,320 | ||||||||||||
Clark County NV School District Series D | 5.00 | 6-15-2021 | 2,395,000 | 2,494,033 | ||||||||||||
| 10,896,153 | ||||||||||||||||
|
| |||||||||||||||
| Resource Recovery Revenue: 0.09% | ||||||||||||||||
Director Nevada Department Business & Industry Solid Waste Disposal Republic Services Incorporated Project 144A ø | 0.88 | 12-1-2026 | 3,000,000 | 2,999,130 | ||||||||||||
|
| |||||||||||||||
The accompanying notes are an integral part of these financial statements.
24 | Wells Fargo Short-Term Municipal Bond Fund
Portfolio of investments—June 30, 2020
| Interest rate | Maturity date | Principal | Value | |||||||||||||
| Utilities Revenue: 0.08% | ||||||||||||||||
Washoe County NV Sierra Pacific Power Series B | 3.00 | % | 3-1-2036 | $ | 560,000 | $ | 579,550 | |||||||||
Washoe County NV Water Facility Refunding Bond Series F | 2.05 | 3-1-2036 | 2,000,000 | 2,028,520 | ||||||||||||
| 2,608,070 | ||||||||||||||||
|
| |||||||||||||||
| 17,503,353 | ||||||||||||||||
|
| |||||||||||||||
New Hampshire: 0.08% |
| |||||||||||||||
| Industrial Development Revenue: 0.08% | ||||||||||||||||
National Finance Authority New Hampshire Exempt Facilities Emerald Renewable Diesel LLC Project 144A | 2.00 | 6-1-2049 | 2,575,000 | 2,578,373 | ||||||||||||
|
| |||||||||||||||
New Jersey: 7.04% |
| |||||||||||||||
| Airport Revenue: 0.22% | ||||||||||||||||
New Jersey EDA Refunding Bond Port Newark Container Terminal LLC Project | 5.00 | 10-1-2021 | 1,500,000 | 1,549,830 | ||||||||||||
New Jersey EDA Refunding Bond Port Newark Container Terminal LLC Project | 5.00 | 10-1-2022 | 1,755,000 | 1,855,368 | ||||||||||||
New Jersey EDA Refunding Bond Port Newark Container Terminal LLC Project | 5.00 | 10-1-2023 | 1,500,000 | 1,618,155 | ||||||||||||
New Jersey EDA Refunding Bond Port Newark Container Terminal LLC Project | 5.00 | 10-1-2024 | 2,000,000 | 2,198,520 | ||||||||||||
| 7,221,873 | ||||||||||||||||
|
| |||||||||||||||
| Education Revenue: 0.33% | ||||||||||||||||
New Jersey Higher Education Assistance Authority Student Loan Series 2011-1 | 5.50 | 12-1-2021 | 1,000,000 | 1,056,380 | ||||||||||||
New Jersey Higher Education Assistance Authority Series A1 | 5.00 | 12-1-2020 | 9,775,000 | 9,921,625 | ||||||||||||
| 10,978,005 | ||||||||||||||||
|
| |||||||||||||||
| GO Revenue: 0.10% | ||||||||||||||||
Trenton City NJ Refunding Bond | 4.00 | 7-15-2020 | 1,685,000 | 1,686,618 | ||||||||||||
Trenton City NJ Refunding Bond (BAM Insured) | 5.00 | 12-1-2020 | 1,675,000 | 1,706,189 | ||||||||||||
| 3,392,807 | ||||||||||||||||
|
| |||||||||||||||
| Housing Revenue: 2.50% | ||||||||||||||||
New Jersey Housing & Mortgage Finance Agency MFHR Series A | 2.00 | 11-1-2021 | 325,000 | 331,263 | ||||||||||||
New Jersey Housing & Mortgage Finance Agency MFHR Series B | 2.00 | 5-1-2021 | 14,335,000 | 14,508,167 | ||||||||||||
New Jersey Housing & Mortgage Finance Agency MFHR Series C | 2.41 | 10-1-2021 | 27,500,000 | 27,616,875 | ||||||||||||
New Jersey Housing & Mortgage Finance Agency Single Family Housing Revenue Series B | 2.60 | 10-1-2021 | 5,660,000 | 5,786,614 | ||||||||||||
New Jersey Housing & Mortgage Finance Agency Single Family Housing Revenue Series B | 2.70 | 4-1-2022 | 5,780,000 | 5,970,162 | ||||||||||||
New Jersey Housing & Mortgage Finance Agency Single Family Housing Revenue Series B | 2.80 | 10-1-2022 | 5,390,000 | 5,627,969 | ||||||||||||
New Jersey Housing & Mortgage Finance Agency Single Family Housing Revenue Series B | 2.90 | 4-1-2023 | 5,950,000 | 6,283,200 | ||||||||||||
New Jersey Housing & Mortgage Finance Agency Single Family Housing Revenue Series B | 2.95 | 10-1-2023 | 5,570,000 | 5,941,129 | ||||||||||||
New Jersey Housing & Mortgage Finance Agency Single Family Housing Revenue Series B | 3.10 | 4-1-2024 | 2,635,000 | 2,842,401 | ||||||||||||
New Jersey Housing & Mortgage Finance Agency Single Family Housing Revenue Series B | 3.25 | 4-1-2025 | 2,995,000 | 3,292,164 | ||||||||||||
New Jersey Housing & Mortgage Finance Agency Villa Victoria Apartments Project Series F | 2.43 | 11-1-2021 | 5,000,000 | 5,027,300 | ||||||||||||
| 83,227,244 | ||||||||||||||||
|
| |||||||||||||||
| Miscellaneous Revenue: 2.04% | ||||||||||||||||
New Jersey EDA School Facilities Construction Bond Series DDD | 5.00 | 6-15-2023 | 3,000,000 | 3,229,020 | ||||||||||||
New Jersey EDA School Facilities Construction Bond Series DDD | 5.00 | 6-15-2024 | 2,605,000 | 2,857,346 | ||||||||||||
The accompanying notes are an integral part of these financial statements.
Wells Fargo Short-Term Municipal Bond Fund | 25
Portfolio of investments—June 30, 2020
| Interest rate | Maturity date | Principal | Value | |||||||||||||
| Miscellaneous Revenue (continued) | ||||||||||||||||
New Jersey EDA School Facilities Construction Bond Series K (National Insured) | 5.25 | % | 12-15-2021 | $ | 1,040,000 | $ | 1,084,179 | |||||||||
New Jersey EDA School Facilities Construction Bond Series NN | 5.00 | 3-1-2022 | 405,000 | 422,942 | ||||||||||||
New Jersey EDA School Facilities Construction Refunding Bond Series NN | 5.00 | 3-1-2021 | 1,410,000 | 1,449,889 | ||||||||||||
New Jersey EDA School Facilities Construction Refunding Bond Series NN | 5.00 | 3-1-2021 | 3,610,000 | 3,675,197 | ||||||||||||
New Jersey EDA School Facilities Construction Refunding Bond Series XX | 5.00 | 6-15-2022 | 7,500,000 | 7,887,375 | ||||||||||||
New Jersey EDA Series BBB | 5.00 | 6-15-2022 | 6,000,000 | 6,309,900 | ||||||||||||
New Jersey EDA Series BBB | 5.00 | 6-15-2023 | 4,000,000 | 4,305,360 | ||||||||||||
New Jersey EDA Transportation Project New Jersey Transit Corporation Project Series B | 5.00 | 11-1-2021 | 2,490,000 | 2,578,843 | ||||||||||||
New Jersey EDA Transportation Project New Jersey Transit Corporation Project Series B | 5.00 | 11-1-2022 | 26,000,000 | 27,599,000 | ||||||||||||
New Jersey School Facilities Construction Prerefunded Bond Series EE | 5.00 | 9-1-2020 | 1,650,000 | 1,662,969 | ||||||||||||
Newark NJ Housing Authority Newark Redevelopment Project Refunding Bond (National Insured) | 5.25 | 1-1-2021 | 4,570,000 | 4,677,212 | ||||||||||||
| 67,739,232 | ||||||||||||||||
|
| |||||||||||||||
| Tax Revenue: 0.02% | ||||||||||||||||
New Jersey EDA School Facilities Construction Unrefunded Bond Series EE | 5.00 | 9-1-2020 | 610,000 | 612,843 | ||||||||||||
|
| |||||||||||||||
| Transportation Revenue: 1.83% | ||||||||||||||||
New Jersey TTFA Series A | 5.25 | 12-15-2020 | 33,465,000 | 33,935,518 | ||||||||||||
New Jersey TTFA Series A1 | 5.00 | 6-15-2021 | 5,000,000 | 5,146,100 | ||||||||||||
New Jersey Turnpike Authority Series C-6 (1 Month LIBOR +0.75%) ± | 0.87 | 1-1-2030 | 21,820,000 | 21,719,410 | ||||||||||||
| 60,801,028 | ||||||||||||||||
|
| |||||||||||||||
| 233,973,032 | ||||||||||||||||
|
| |||||||||||||||
New Mexico: 0.02% | ||||||||||||||||
| Health Revenue: 0.02% | ||||||||||||||||
Santa Fe NM Retirement Facility El Castillo Retirement | 2.25 | 5-15-2024 | 600,000 | 566,400 | ||||||||||||
|
| |||||||||||||||
New York: 5.70% | ||||||||||||||||
| Education Revenue: 0.09% | ||||||||||||||||
Hempstead Town NY Local Development Corporation Education Revenue Refunding Bond Academy Charter School Project %% | 4.76 | 2-1-2027 | 2,000,000 | 2,003,280 | ||||||||||||
St. Lawrence County NY Industrial Development Clarkson University Project Series B | 1.55 | 9-1-2042 | 1,000,000 | 915,690 | ||||||||||||
| 2,918,970 | ||||||||||||||||
|
| |||||||||||||||
| GO Revenue: 0.46% | ||||||||||||||||
Suffolk County NY Tax Anticipation Notes Series I | 2.50 | 7-23-2020 | 14,000,000 | 14,012,880 | ||||||||||||
Suffolk County NY Tax Anticipation Notes Series II | 2.50 | 8-20-2020 | 1,165,000 | 1,167,388 | ||||||||||||
| 15,180,268 | ||||||||||||||||
|
| |||||||||||||||
| Health Revenue: 0.13% | ||||||||||||||||
New York Dormitory Authority Non State Supported Debt Northwell Health | 5.00 | 5-1-2048 | 4,000,000 | 4,498,720 | ||||||||||||
|
| |||||||||||||||
| Housing Revenue: 0.43% | ||||||||||||||||
New York HFA Affordable Housing Series L (GNMA/FNMA/FHLMC Insured) | 1.65 | 5-1-2021 | 6,400,000 | 6,453,440 | ||||||||||||
New York HFA Affordable Housing Series M-1 (GNMA/FNMA/FHLMC Insured) | 2.00 | 5-1-2021 | 5,000,000 | 5,057,050 | ||||||||||||
New York NY Housing Development Corporation MFHR AMT Sustainable Neighborhood | 1.75 | 11-1-2023 | 400,000 | 410,180 | ||||||||||||
The accompanying notes are an integral part of these financial statements.
26 | Wells Fargo Short-Term Municipal Bond Fund
Portfolio of investments—June 30, 2020
| Interest rate | Maturity date | Principal | Value | |||||||||||||
| Housing Revenue (continued) | ||||||||||||||||
New York NY Housing Development Corporation MFHR AMT Sustainable Neighborhood | 1.80 | % | 5-1-2024 | $ | 400,000 | $ | 411,792 | |||||||||
New York NY Housing Development Corporation MFHR AMT Sustainable Neighborhood | 1.85 | 11-1-2024 | 400,000 | 413,352 | ||||||||||||
New York NY Housing Development Corporation MFHR AMT Sustainable Neighborhood | 1.90 | 5-1-2025 | 515,000 | 534,153 | ||||||||||||
New York NY Housing Development Corporation MFHR AMT Sustainable Neighborhood | 1.95 | 11-1-2025 | 520,000 | 541,034 | ||||||||||||
New York NY Housing Development Corporation MFHR AMT Sustainable Neighborhood | 2.00 | 5-1-2026 | 535,000 | 558,166 | ||||||||||||
| 14,379,167 | ||||||||||||||||
|
| |||||||||||||||
| Industrial Development Revenue: 0.96% | ||||||||||||||||
New York Transportation Development Corporation Special Facilities Revenue Delta Airlines Incorporated LaGuardia Airport Terminals C&D Redevelopment Project | 5.00 | 1-1-2024 | 7,205,000 | 7,597,673 | ||||||||||||
New York Transportation Development Corporation Special Facilities Revenue Delta Airlines Incorporated LaGuardia Airport Terminals C&D Redevelopment Project | 5.00 | 1-1-2025 | 22,925,000 | 24,282,619 | ||||||||||||
| 31,880,292 | ||||||||||||||||
|
| |||||||||||||||
| Miscellaneous Revenue: 0.09% | ||||||||||||||||
Suffolk County NY Judicial Facilities Agency Leases H. Lee Dennison Building | 5.00 | 11-1-2020 | 2,915,000 | 2,957,559 | ||||||||||||
|
| |||||||||||||||
| Tax Revenue: 0.79% | ||||||||||||||||
New York Metropolitan Transportation Authority Subordinate Bond Series A2A (SIFMA Municipal Swap +0.45%) ± | 0.58 | 11-1-2026 | 6,065,000 | 5,885,961 | ||||||||||||
New York NY Transitional Finance Authority Subordinate Bond Series 1-B (SIFMA Municipal Swap +0.80%) ± | 0.93 | 11-1-2022 | 14,225,000 | 14,231,828 | ||||||||||||
New York Tender Option Bond Trust Receipts/Floater Certificates Series 2020-XM0824 (JPMorgan Chase & Company LIQ) 144A ø | 0.17 | 2-15-2028 | 6,000,000 | 6,000,000 | ||||||||||||
| 26,117,789 | ||||||||||||||||
|
| |||||||||||||||
| Transportation Revenue: 2.57% | ||||||||||||||||
New York Metropolitan Transportation Authority BAN | 4.00 | 2-1-2022 | 9,600,000 | 9,838,848 | ||||||||||||
New York Metropolitan Transportation Authority BAN | 5.00 | 2-1-2023 | 10,400,000 | 11,018,904 | ||||||||||||
New York Metropolitan Transportation Authority Subordinate Bond Series C2 | 4.00 | 11-15-2033 | 8,530,000 | 8,538,018 | ||||||||||||
New York Metropolitan Transportation Authority Subordinate Bond Series D-2A-2 (1 Month LIBOR +0.68%) (AGM Insured) ± | 0.80 | 11-1-2032 | 20,000,000 | 19,781,200 | ||||||||||||
New York Metropolitan Transportation Authority Subordinate Bond Series D-2B (1 Month LIBOR +0.30%) (AGM Insured) ± | 0.42 | 11-1-2032 | 6,000,000 | 5,919,420 | ||||||||||||
New York Metropolitan Transportation Authority Subordinate Bond Series D2 (SIFMA Municipal Swap +0.45%) ± | 0.58 | 11-15-2044 | 22,545,000 | 21,546,933 | ||||||||||||
Niagara Falls NY Board Community Toll (National Insured) | 6.25 | 10-1-2020 | 8,685,000 | 8,811,888 | ||||||||||||
| 85,455,211 | ||||||||||||||||
|
| |||||||||||||||
| Utilities Revenue: 0.18% | ||||||||||||||||
Long Island NY Power Authority Electric System General Series B | 1.65 | 9-1-2049 | 6,000,000 | 5,979,960 | ||||||||||||
|
| |||||||||||||||
| 189,367,936 | ||||||||||||||||
|
| |||||||||||||||
North Carolina: 0.26% | ||||||||||||||||
| Health Revenue: 0.23% | ||||||||||||||||
Charlotte-Mecklenburg NC Hospital Authority Atrium Health Series B | 5.00 | 1-15-2048 | 7,000,000 | 7,510,510 | ||||||||||||
|
| |||||||||||||||
The accompanying notes are an integral part of these financial statements.
Wells Fargo Short-Term Municipal Bond Fund | 27
Portfolio of investments—June 30, 2020
| Interest rate | Maturity date | Principal | Value | |||||||||||||
| Industrial Development Revenue: 0.03% | ||||||||||||||||
Columbus County NC Industrial Facilities & PCFA Environmental Improvement Revenue Refunding Bond International Paper Company Project Series A | 2.00 | % | 11-1-2033 | $ | 1,000,000 | $ | 1,033,020 | |||||||||
|
| |||||||||||||||
| 8,543,530 | ||||||||||||||||
|
| |||||||||||||||
Ohio: 2.50% | ||||||||||||||||
| GO Revenue: 0.01% | ||||||||||||||||
Springfield OH Refunding Bond (AGC Insured) | 4.00 | 12-1-2020 | 225,000 | 225,610 | ||||||||||||
|
| |||||||||||||||
| Health Revenue: 0.15% | ||||||||||||||||
Hamilton County OH Hospital Facilities UC Health Series 2020 | 5.00 | 9-15-2026 | 655,000 | 791,332 | ||||||||||||
Lake County OH Lake Hospital System Incorporated | 5.00 | 8-15-2020 | 905,000 | 909,281 | ||||||||||||
Ohio Hospital University Hospital Health System Series B | 5.00 | 1-15-2050 | 2,820,000 | 3,301,374 | ||||||||||||
| 5,001,987 | ||||||||||||||||
|
| |||||||||||||||
| Housing Revenue: 0.94% | ||||||||||||||||
Lucas OH Metropolitan Housing Authority Certificate of Participation | 2.25 | 11-1-2020 | 270,000 | 271,207 | ||||||||||||
Ohio HFA Multifamily SEM Manor Project | 1.40 | 9-1-2020 | 6,000,000 | 6,002,400 | ||||||||||||
Ohio HFA Multifamily Southwick Place Townhomes Project | 1.55 | 3-1-2022 | 4,975,000 | 4,999,626 | ||||||||||||
Ohio HFA Multifamily Wesley Tower Apartments Project | 1.40 | 6-1-2022 | 10,500,000 | 10,564,890 | ||||||||||||
Trumbull Metropolitan Housing Authority Multifamily Housing Apartments Project Series A | 1.70 | 6-1-2022 | 9,250,000 | 9,331,585 | ||||||||||||
| 31,169,708 | ||||||||||||||||
|
| |||||||||||||||
| Industrial Development Revenue: 0.11% | ||||||||||||||||
Ohio Air Quality Development Authority Ohio Valley Electric Corporation Series A | 2.88 | 2-1-2026 | 3,750,000 | 3,794,138 | ||||||||||||
|
| |||||||||||||||
| Miscellaneous Revenue: 0.08% | ||||||||||||||||
Ohio Portsmouth Bypass Project ## | 5.00 | 12-31-2020 | 1,320,000 | 1,347,456 | ||||||||||||
Ohio Portsmouth Bypass Project | 5.00 | 12-31-2021 | 1,205,000 | 1,279,059 | ||||||||||||
| 2,626,515 | ||||||||||||||||
|
| |||||||||||||||
| Resource Recovery Revenue: 0.36% | ||||||||||||||||
Ohio Air Quality Development Authority Refunding Bond American Electric Power Company Project | 1.90 | 5-1-2026 | 12,000,000 | 12,093,840 | ||||||||||||
|
| |||||||||||||||
| Utilities Revenue: 0.85% | ||||||||||||||||
American Municipal Power Ohio Incorporated Hydroelectric Projects Series A | 5.00 | 2-15-2025 | 1,200,000 | 1,431,888 | ||||||||||||
American Municipal Power Ohio Incorporated Hydroelectric Projects Series A | 5.00 | 2-15-2026 | 1,500,000 | 1,836,060 | ||||||||||||
American Municipal Power Ohio Incorporated Hydroelectric Projects Series A | 5.00 | 2-15-2027 | 1,600,000 | 2,003,120 | ||||||||||||
American Municipal Power Ohio Incorporated Prairie Energy Campus | 2.30 | 2-15-2038 | 8,825,000 | 8,846,445 | ||||||||||||
Lancaster OH Port Authority Gas Supply (Royal Bank of Canada LIQ) | 5.00 | 8-1-2049 | 12,000,000 | 14,002,920 | ||||||||||||
| 28,120,433 | ||||||||||||||||
|
| |||||||||||||||
| 83,032,231 | ||||||||||||||||
|
| |||||||||||||||
Oklahoma: 1.03% | ||||||||||||||||
| Education Revenue: 0.02% | ||||||||||||||||
Oklahoma Development Finance Authority Refunding Bond Oklahoma City University Project | 4.00 | 8-1-2022 | 535,000 | 558,069 | ||||||||||||
|
| |||||||||||||||
| GO Revenue: 0.32% | ||||||||||||||||
Oklahoma County OK Independent School District #52 Series A | 2.50 | 1-1-2021 | 3,535,000 | 3,572,895 | ||||||||||||
Oklahoma County OK Independent School District #52 Series A | 3.00 | 1-1-2022 | 3,535,000 | 3,674,208 | ||||||||||||
Oklahoma County OK Independent School District #52 Series A | 3.00 | 1-1-2023 | 3,135,000 | 3,340,311 | ||||||||||||
| 10,587,414 | ||||||||||||||||
|
| |||||||||||||||
The accompanying notes are an integral part of these financial statements.
28 | Wells Fargo Short-Term Municipal Bond Fund
Portfolio of investments—June 30, 2020
| Interest rate | Maturity date | Principal | Value | |||||||||||||
| Health Revenue: 0.05% | ||||||||||||||||
Oklahoma Development Finance Authority Oklahoma University Medicine Project Series B | 5.00 | % | 8-15-2022 | $ | 500,000 | $ | 532,385 | |||||||||
Oklahoma Development Finance Authority Oklahoma University Medicine Project Series B | 5.00 | 8-15-2023 | 500,000 | 546,495 | ||||||||||||
Oklahoma Development Finance Authority Oklahoma University Medicine Project Series B | 5.00 | 8-15-2024 | 600,000 | 670,848 | ||||||||||||
| 1,749,728 | ||||||||||||||||
|
| |||||||||||||||
| Miscellaneous Revenue: 0.64% | ||||||||||||||||
Blaine County OK Educational Facilities Authority Watonga Public Schools Project | 5.00 | 12-1-2020 | 750,000 | 763,553 | ||||||||||||
Blaine County OK Educational Facilities Authority Watonga Public Schools Project | 5.00 | 12-1-2021 | 945,000 | 1,004,696 | ||||||||||||
Creek County OK Educational Facilities Authority Sapulpa Public School Project | 5.00 | 9-1-2020 | 2,550,000 | 2,569,100 | ||||||||||||
Grady County OK School Finance Authority Tuttle Public School Project | 5.00 | 9-1-2021 | 1,065,000 | 1,121,179 | ||||||||||||
Kay County OK Public Buildings Authority | 2.25 | 4-1-2024 | 720,000 | 739,692 | ||||||||||||
Kay County OK Public Buildings Authority | 2.25 | 4-1-2025 | 735,000 | 757,124 | ||||||||||||
Kay County OK Public Buildings Authority | 2.38 | 4-1-2026 | 750,000 | 774,368 | ||||||||||||
Kingfisher OK Special Projects Authority Educational Facilities Kingfisher Public Schools Project | 4.00 | 3-1-2026 | 2,005,000 | 2,335,745 | ||||||||||||
Oklahoma County OK Finance Authority Educational Facilities Jones Public Schools Project | 4.00 | 9-1-2025 | 550,000 | 609,571 | ||||||||||||
Oklahoma County OK Finance Authority Educational Facilities Jones Public Schools Project | 4.00 | 9-1-2026 | 590,000 | 658,735 | ||||||||||||
Ottawa County OK Educational Facilities Authority Educational Facilities Lease Miami Public Schools Project | 5.00 | 9-1-2023 | 830,000 | 938,473 | ||||||||||||
Ottawa County OK Educational Facilities Authority Educational Facilities Lease Miami Public Schools Project | 5.00 | 9-1-2024 | 1,080,000 | 1,258,956 | ||||||||||||
Ottawa County OK Educational Facilities Authority Educational Facilities Lease Miami Public Schools Project | 5.00 | 9-1-2025 | 930,000 | 1,113,433 | ||||||||||||
Tulsa County OK Industrial Authority Educational Broken Arrow Public Schools Project | 5.00 | 9-1-2025 | 3,000,000 | 3,423,450 | ||||||||||||
Wagoner County OK School Development Authority Wagoner Public Schools Project | 4.00 | 9-1-2025 | 1,255,000 | 1,425,429 | ||||||||||||
Weatherford OK Industrial Trust Educational Facilities Lease Weatherford Public Schools Project | 5.00 | 3-1-2027 | 1,475,000 | 1,827,260 | ||||||||||||
| 21,320,764 | ||||||||||||||||
|
| |||||||||||||||
| 34,215,975 | ||||||||||||||||
|
| |||||||||||||||
Oregon: 0.04% | ||||||||||||||||
| Airport Revenue: 0.04% | ||||||||||||||||
Port of Portland OR International Airport Series C | 5.00 | 7-1-2026 | 1,240,000 | 1,499,991 | ||||||||||||
|
| |||||||||||||||
Other: 1.30% | ||||||||||||||||
| Miscellaneous Revenue: 1.30% | ||||||||||||||||
FHLMC Multiclass Mortgage Certificate of Participation Series M012 Class A1A øø | 1.60 | 8-15-2051 | 3,286,732 | 3,351,021 | ||||||||||||
FHLMC Multiclass Mortgage Certificate of Participation Series M012 Class A1B1 øø | 2.25 | 8-15-2051 | 15,201,136 | 15,618,407 | ||||||||||||
Public Housing Capital Fund Trust I (HUD Insured) 144A | 4.50 | 7-1-2022 | 3,011,643 | 3,062,510 | ||||||||||||
Public Housing Capital Fund Trust II (HUD Insured) 144A | 4.50 | 7-1-2022 | 469,641 | 479,067 | ||||||||||||
Tender Option Bond Trust Receipts/Floater Certificates Series 2016-XG0094 (Deutsche Bank LIQ) 144A ø | 0.36 | 10-1-2041 | 20,560,000 | 20,560,000 | ||||||||||||
| 43,071,005 | ||||||||||||||||
|
| |||||||||||||||
The accompanying notes are an integral part of these financial statements.
Wells Fargo Short-Term Municipal Bond Fund | 29
Portfolio of investments—June 30, 2020
| Interest rate | Maturity date | Principal | Value | |||||||||||||
Pennsylvania: 6.55% | ||||||||||||||||
| Education Revenue: 0.63% | ||||||||||||||||
Lehigh County PA General Purpose Authority (SIFMA Municipal Swap +0.58%) ± | 0.71 | % | 11-1-2037 | $ | 11,025,000 | $ | 10,882,006 | |||||||||
Philadelphia PA IDA Thomas Jefferson University Series B ø | 0.82 | 9-1-2050 | 10,000,000 | 10,000,000 | ||||||||||||
| 20,882,006 | ||||||||||||||||
|
| |||||||||||||||
| GO Revenue: 1.80% | ||||||||||||||||
Albert Gallatin PA School District Series A (AGM Insured) %% | 4.00 | 9-1-2025 | 1,130,000 | 1,275,759 | ||||||||||||
Albert Gallatin PA School District Series B (AGM Insured) %% | 4.00 | 9-1-2025 | 350,000 | 395,147 | ||||||||||||
Butler PA Area School District (AGM Insured) | 5.00 | 10-1-2023 | 1,280,000 | 1,458,406 | ||||||||||||
Butler PA Area School District (AGM Insured) | 5.00 | 10-1-2024 | 2,965,000 | 3,490,606 | ||||||||||||
Butler PA Area School District (AGM Insured) | 5.00 | 10-1-2025 | 4,695,000 | 5,686,208 | ||||||||||||
Coatesville PA Area School District (AGM Insured) | 5.00 | 8-1-2023 | 1,000,000 | 1,126,540 | ||||||||||||
Lackawanna County PA Riverside School District Project (BAM Insured) | 4.00 | 10-15-2020 | 1,455,000 | 1,468,517 | ||||||||||||
Manheim Township PA School District Series A (1 Month LIBOR +0.47%) ± | 0.59 | 5-1-2025 | 3,760,000 | 3,735,259 | ||||||||||||
Penn Hills PA School District (BAM Insured) | 5.00 | 11-15-2020 | 825,000 | 838,926 | ||||||||||||
Penn Hills PA School District (BAM Insured) | 5.00 | 11-15-2021 | 1,275,000 | 1,351,934 | ||||||||||||
Philadelphia PA School District Refunding Bond | 5.00 | 9-1-2023 | 4,500,000 | 5,071,500 | ||||||||||||
Philadelphia PA School District Series A | 5.00 | 9-1-2022 | 1,000,000 | 1,088,560 | ||||||||||||
Philadelphia PA School District Series A | 5.00 | 9-1-2024 | 800,000 | 929,712 | ||||||||||||
Philadelphia PA School District Series C | 5.00 | 9-1-2020 | 1,125,000 | 1,132,639 | ||||||||||||
Philadelphia PA School District Series D | 5.00 | 9-1-2020 | 1,500,000 | 1,510,185 | ||||||||||||
Philadelphia PA School District Series D | 5.00 | 9-1-2021 | 1,750,000 | 1,833,493 | ||||||||||||
Philadelphia PA School District Series E (State Aid Withholding Insured) | 5.00 | 9-1-2020 | 2,225,000 | 2,240,108 | ||||||||||||
Philadelphia PA School District Series E | 5.25 | 9-1-2023 | 7,000,000 | 7,052,010 | ||||||||||||
Philadelphia PA School District Series F | 5.00 | 9-1-2020 | 2,750,000 | 2,768,673 | ||||||||||||
Philadelphia PA School District Series F | 5.00 | 9-1-2021 | 3,580,000 | 3,750,802 | ||||||||||||
Philadelphia Tender Option Bond Trust Receipts/Floaters Certificates Series 2020-SM0860 (JPMorgan Chase & Company LOC, JPMorgan Chase & Company LIQ) 144A ø | 0.17 | 9-1-2027 | 4,275,000 | 4,275,000 | ||||||||||||
Scranton PA 144A | 5.00 | 9-1-2020 | 2,205,000 | 2,216,246 | ||||||||||||
Scranton PA School District Series A | 5.00 | 6-1-2021 | 680,000 | 705,507 | ||||||||||||
Scranton PA School District Series A | 5.00 | 6-1-2022 | 730,000 | 783,765 | ||||||||||||
Scranton PA School District Series A | 5.00 | 6-1-2023 | 835,000 | 931,434 | ||||||||||||
Scranton PA School District Series B | 5.00 | 6-1-2021 | 580,000 | 601,756 | ||||||||||||
Scranton PA School District Series B (National Insured) | 5.00 | 6-1-2022 | 870,000 | 937,529 | ||||||||||||
Scranton PA School District Series B (National Insured) | 5.00 | 6-1-2023 | 615,000 | 686,026 | ||||||||||||
Scranton PA School District Series C | 5.00 | 6-1-2021 | 590,000 | 612,131 | ||||||||||||
| 59,954,378 | ||||||||||||||||
|
| |||||||||||||||
| Health Revenue: 1.61% | ||||||||||||||||
Allegheny County PA Hospital Development Authority University of Pittsburgh Medical Center Series A-1 (3 Month LIBOR +0.72%) ± | 1.18 | 2-1-2021 | 680,000 | 678,688 | ||||||||||||
Berks County PA IDA Health System Tower Health Project | 5.00 | 11-1-2023 | 1,000,000 | 1,108,050 | ||||||||||||
Berks County PA IDA Health System Tower Health Project | 5.00 | 11-1-2024 | 1,000,000 | 1,131,860 | ||||||||||||
Berks County PA Municipal Authority Tower Health Project Series B1 | 5.00 | 2-1-2040 | 3,000,000 | 3,338,070 | ||||||||||||
Berks County PA Municipal Authority Tower Health Project Series B2 | 5.00 | 2-1-2040 | 5,500,000 | 6,301,570 | ||||||||||||
Franklin County PA IDA Menno-Haven Incorporated Project | 5.00 | 12-1-2021 | 230,000 | 231,737 | ||||||||||||
Geisinger Authority PA Health System Series B | 5.00 | 4-1-2043 | 10,000,000 | 12,209,800 | ||||||||||||
Lancaster County PA Hospital Authority Healthcare Facilities Moravian Manors Incorporated Project | 2.88 | 12-15-2023 | 1,200,000 | 1,155,348 | ||||||||||||
Montgomery County PA Higher Education & Health Authority Thomas Jefferson University Series A | 5.00 | 9-1-2023 | 1,050,000 | 1,170,792 | ||||||||||||
Montgomery County PA Higher Education & Health Authority Thomas Jefferson University Series C (SIFMA Municipal Swap +0.72%) ± | 0.85 | 9-1-2051 | 10,000,000 | 9,999,000 | ||||||||||||
The accompanying notes are an integral part of these financial statements.
30 | Wells Fargo Short-Term Municipal Bond Fund
Portfolio of investments—June 30, 2020
| Interest rate | Maturity date | Principal | Value | |||||||||||||
| Health Revenue (continued) | ||||||||||||||||
Philadelphia PA Hospitals & HEFAR Temple University Health System | 5.00 | % | 7-1-2021 | $ | 1,250,000 | $ | 1,290,488 | |||||||||
Philadelphia PA Hospitals & HEFAR Temple University Health System | 5.00 | 7-1-2022 | 2,000,000 | 2,127,320 | ||||||||||||
Quakertown PA Health Facilities Authority Series A | 3.13 | 7-1-2021 | 3,250,000 | 3,189,290 | ||||||||||||
Residual Interest Bond Floater Trust Series 2019-003 (Barclays Bank plc LOC, Barclays Bank plc LIQ) 144A ø | 0.28 | 8-15-2038 | 9,615,000 | 9,615,000 | ||||||||||||
| 53,547,013 | ||||||||||||||||
|
| |||||||||||||||
| Housing Revenue: 1.08% | ||||||||||||||||
Pennsylvania HFA Limited Obligation Norris Homes Phase V | 1.40 | 1-1-2043 | 10,000,000 | 10,157,200 | ||||||||||||
Pennsylvania HFA Single Family Series 125A | 2.38 | 10-1-2025 | 16,950,000 | 17,584,439 | ||||||||||||
Pennsylvania HFA Single Family Series 128A | 4.75 | 4-1-2033 | 7,400,000 | 8,119,872 | ||||||||||||
| 35,861,511 | ||||||||||||||||
|
| |||||||||||||||
| Industrial Development Revenue: 0.25% | ||||||||||||||||
Lehigh County PA IDA Electric Utilities Corporation Series B | 1.80 | 2-15-2027 | 2,500,000 | 2,526,575 | ||||||||||||
Montgomery County PA IDA Peco Energy Company Project Series A | 2.60 | 3-1-2034 | 2,125,000 | 2,131,524 | ||||||||||||
Pennsylvania EDFA Bridges Finco LP | 5.00 | 12-31-2020 | 2,020,000 | 2,048,320 | ||||||||||||
Pennsylvania EDFA Bridges Finco LP | 5.00 | 12-31-2021 | 1,525,000 | 1,587,784 | ||||||||||||
| 8,294,203 | ||||||||||||||||
|
| |||||||||||||||
| Miscellaneous Revenue: 0.33% | ||||||||||||||||
Bethlehem PA Area School District Authority Bethlehem Area School District Refunding Bond Project (1 Month LIBOR +0.49%) ± | 0.62 | 1-1-2030 | 4,970,000 | 4,925,866 | ||||||||||||
Delaware County PA Authority Neumann University | 4.00 | 10-1-2021 | 1,365,000 | 1,356,578 | ||||||||||||
Philadelphia PA Public School Building Authority Harrisburg School District Project Series A (AGM Insured) | 5.00 | 12-1-2023 | 2,505,000 | 2,842,398 | ||||||||||||
Scranton PA RDA Series A (Municipal Government Guaranty Insured) | 5.00 | 11-15-2021 | 1,765,000 | 1,766,747 | ||||||||||||
| 10,891,589 | ||||||||||||||||
|
| |||||||||||||||
| Resource Recovery Revenue: 0.28% | ||||||||||||||||
Pennsylvania EDFA Solid Waste Disposal Series A | 1.70 | 8-1-2037 | 9,420,000 | 9,422,449 | ||||||||||||
|
| |||||||||||||||
| Transportation Revenue: 0.12% | ||||||||||||||||
Lancaster PA Parking Authority Series A (BAM Insured) | 4.00 | 9-1-2025 | 530,000 | 609,707 | ||||||||||||
Lancaster PA Parking Authority Series A (BAM Insured) | 4.00 | 9-1-2026 | 545,000 | 637,078 | ||||||||||||
Pennsylvania Turnpike Commission Series B (SIFMA Municipal Swap +0.70%) ± | 0.83 | 12-1-2023 | 2,880,000 | 2,827,843 | ||||||||||||
| 4,074,628 | ||||||||||||||||
|
| |||||||||||||||
| Water & Sewer Revenue: 0.45% | ||||||||||||||||
Pittsburgh PA Water & Sewer Authority Series C (1 Month LIBOR +0.64%) (AGM Insured) ± | 0.77 | 9-1-2040 | 15,000,000 | 14,936,850 | ||||||||||||
|
| |||||||||||||||
| 217,864,627 | ||||||||||||||||
|
| |||||||||||||||
Rhode Island: 0.30% | ||||||||||||||||
| Education Revenue: 0.04% | ||||||||||||||||
Rhode Island Student Loan Authority AMT Series A | 5.00 | 12-1-2023 | 1,175,000 | 1,292,853 | ||||||||||||
|
| |||||||||||||||
| Miscellaneous Revenue: 0.26% | ||||||||||||||||
Rhode Island & Providence Plantations Consolidated Capital Development Series A | 5.00 | 8-1-2023 | 8,045,000 | 8,799,299 | ||||||||||||
|
| |||||||||||||||
| 10,092,152 | ||||||||||||||||
|
| |||||||||||||||
The accompanying notes are an integral part of these financial statements.
Wells Fargo Short-Term Municipal Bond Fund | 31
Portfolio of investments—June 30, 2020
| Interest rate | Maturity date | Principal | Value | |||||||||||||
South Carolina: 0.36% | ||||||||||||||||
| Miscellaneous Revenue: 0.19% | ||||||||||||||||
South Carolina Transportation Infrastructure Bank Refunding Bond Series B (1 Month LIBOR +0.45%) ± | 0.57 | % �� | 10-1-2031 | $ | 6,455,000 | $ | 6,372,311 | |||||||||
|
| |||||||||||||||
| Utilities Revenue: 0.17% | ||||||||||||||||
Piedmont SC Municipal Power Agency (National Insured) | 5.38 | 1-1-2025 | 4,760,000 | 5,632,365 | ||||||||||||
|
| |||||||||||||||
| 12,004,676 | ||||||||||||||||
|
| |||||||||||||||
Tennessee: 1.88% | ||||||||||||||||
| Health Revenue: 0.26% | ||||||||||||||||
Chattanooga TN Health & Education Housing Facilities Tender Option Bond Trust Receipts/Certificates Series 2015-XF1023 (Barclays Bank plc LOC) 144A øø | 0.17 | 1-1-2045 | 5,910,000 | 5,910,000 | ||||||||||||
Greeneville TN Health and Educational Ballad Health Series A | 5.00 | 7-1-2023 | 1,600,000 | 1,766,320 | ||||||||||||
Knox County TN Health Educational & Housing Facility University Health System Incorporate | 5.00 | 4-1-2024 | 1,000,000 | 1,115,180 | ||||||||||||
| 8,791,500 | ||||||||||||||||
|
| |||||||||||||||
| Housing Revenue: 0.20% | ||||||||||||||||
Kingsport TN Housing & RDA Collateralized MFHR Series B | 2.22 | 1-1-2022 | 6,700,000 | 6,794,336 | ||||||||||||
|
| |||||||||||||||
| Utilities Revenue: 1.42% | ||||||||||||||||
Tennessee Energy Acquisition Corporation Gas Project | 4.00 | 11-1-2049 | 7,500,000 | 8,491,875 | ||||||||||||
Tennessee Energy Acquisition Corporation Series A | 4.00 | 5-1-2048 | 35,840,000 | 38,576,026 | ||||||||||||
| 47,067,901 | ||||||||||||||||
|
| |||||||||||||||
| 62,653,737 | ||||||||||||||||
|
| |||||||||||||||
Texas: 12.80% | ||||||||||||||||
| Airport Revenue: 0.44% | ||||||||||||||||
Dallas-Fort Worth TX International Airport Series B | 5.00 | 11-1-2023 | 500,000 | 546,115 | ||||||||||||
El Paso TX Airport Series 2018 | 5.00 | 8-15-2025 | 3,110,000 | 3,631,267 | ||||||||||||
Houston TX Airport System Refunding Bond Subordinated Lien Bond Series A | 5.00 | 7-1-2024 | 3,620,000 | 3,901,636 | ||||||||||||
Houston TX Airport System Refunding Bond Subordinated Lien Bond Series B | 5.00 | 7-1-2027 | 6,090,000 | 6,553,754 | ||||||||||||
| 14,632,772 | ||||||||||||||||
|
| |||||||||||||||
| Education Revenue: 0.36% | ||||||||||||||||
Clifton TX Higher Education Finance Corporation Education International Leadership Series D | 5.00 | 8-15-2021 | 665,000 | 684,039 | ||||||||||||
Clifton TX Higher Education Finance Corporation Education International Leadership Series D | 5.00 | 8-15-2022 | 1,000,000 | 1,051,900 | ||||||||||||
Clifton TX Higher Education Finance Corporation Education International Leadership Series D | 5.00 | 8-15-2023 | 1,510,000 | 1,621,151 | ||||||||||||
Clifton TX Higher Education Finance Corporation Education International Leadership Series D | 5.00 | 8-15-2024 | 3,125,000 | 3,414,844 | ||||||||||||
Texas A&M University System Permanent University Series A | 5.00 | 7-1-2021 | 4,870,000 | 5,097,721 | ||||||||||||
| 11,869,655 | ||||||||||||||||
|
| |||||||||||||||
| GO Revenue: 5.99% | ||||||||||||||||
Cypress-Fairbanks TX Independent School District Series A-1 | 2.13 | 2-15-2027 | 5,845,000 | 5,949,158 | ||||||||||||
Cypress-Fairbanks TX Independent School District Series B-2 | 2.13 | 2-15-2040 | 17,000,000 | 17,302,940 | ||||||||||||
Dallas TX Unrefunded Balance Refunding Bond | 5.00 | 2-15-2021 | 3,580,000 | 3,684,715 | ||||||||||||
Denton TX Independent School District School Building Series B | 2.00 | 8-1-2044 | 4,070,000 | 4,268,168 | ||||||||||||
The accompanying notes are an integral part of these financial statements.
32 | Wells Fargo Short-Term Municipal Bond Fund
Portfolio of investments—June 30, 2020
| Interest rate | Maturity date | Principal | Value | |||||||||||||
| GO Revenue (continued) | ||||||||||||||||
Denton TX Independent School District Unlimited Tax School Building Bond Series 2013 | 2.00 | % | 8-1-2043 | $ | 1,220,000 | $ | 1,221,562 | |||||||||
Denton TX Independent School District Unlimited Tax School Building Bond Series 2013 | 2.00 | 8-1-2043 | 2,780,000 | 2,783,280 | ||||||||||||
Eanes TX Independent School District School Building Series B | 1.75 | 8-1-2039 | 7,465,000 | 7,741,429 | ||||||||||||
Fort Bend TX Independent School District Series C | 1.35 | 8-1-2042 | 4,525,000 | 4,527,987 | ||||||||||||
Fort Bend TX Independent School District Series D | 1.50 | 8-1-2042 | 10,530,000 | 10,639,933 | ||||||||||||
Harris County TX Cypress-Fairbanks Independent High School Series B-1 | 2.13 | 2-15-2040 | 4,800,000 | 4,885,536 | ||||||||||||
Hays TX Consolidated Independent School District Building Bond Series B | 2.70 | 8-15-2042 | 7,370,000 | 7,686,173 | ||||||||||||
Houston TX Public Improvement Series A | 5.00 | 3-1-2021 | 4,000,000 | 4,126,200 | ||||||||||||
Houston TX Public Improvement Series A | 5.00 | 3-1-2022 | 5,000,000 | 5,392,350 | ||||||||||||
Houston TX Public Improvement Series A | 5.00 | 3-1-2023 | 3,500,000 | 3,918,215 | ||||||||||||
Hurst Euless Bedford TX Independent School District Prerefunded Bond | 5.00 | 8-15-2022 | 2,140,000 | 2,151,856 | ||||||||||||
Hutto TX Independent School District Series 2015 | 3.00 | 2-1-2055 | 23,725,000 | 23,771,976 | ||||||||||||
Lake Travis TX Independent School District Prefunded Bond Series B | 2.63 | 2-15-2048 | 1,010,000 | 1,046,734 | ||||||||||||
Lake Travis TX Independent School District Series B | 2.63 | 2-15-2048 | 1,720,000 | 1,782,556 | ||||||||||||
Lake Travis TX Independent School District Series B | 2.63 | 2-15-2048 | 7,270,000 | 7,493,771 | ||||||||||||
Leander TX Independent School District Refunding CAB ¤ | 0.00 | 8-15-2023 | 1,065,000 | 1,046,778 | ||||||||||||
Mansfield TX Independent School District | 2.50 | 8-1-2042 | 8,500,000 | 8,680,200 | ||||||||||||
McAllen TX Independent School District Series A | 5.00 | 2-15-2024 | 2,620,000 | 2,931,099 | ||||||||||||
New Caney TX Independent School District School Building Bond | 3.00 | 2-15-2050 | 1,100,000 | 1,130,283 | ||||||||||||
North East TX Independent School District | 2.20 | 8-1-2049 | 4,800,000 | 5,062,272 | ||||||||||||
North East TX Independent School District | 2.38 | 8-1-2047 | 7,135,000 | 7,339,989 | ||||||||||||
Northside TX Independent School District School Building Bond Series 2018 | 2.75 | 8-1-2048 | 19,985,000 | 21,105,359 | ||||||||||||
Northside TX Independent School District School Building Bond | 1.75 | 6-1-2032 | 5,675,000 | 5,677,100 | ||||||||||||
Northside TX Independent School District School Building Bond | 2.00 | 6-1-2046 | 10,845,000 | 10,990,106 | ||||||||||||
Pflugerville TX Independent School District School Building Bond Series A | 2.25 | 8-15-2037 | 3,450,000 | 3,570,578 | ||||||||||||
Texas Transportation Commission Mobility Fund Series B (SIFMA Municipal Swap +0.30%) ± | 0.43 | 10-1-2041 | 4,500,000 | 4,460,850 | ||||||||||||
Tomball TX Independent School District Series B2 | 2.13 | 2-15-2039 | 6,750,000 | 6,870,285 | ||||||||||||
| 199,239,438 | ||||||||||||||||
|
| |||||||||||||||
| Health Revenue: 0.67% | ||||||||||||||||
Harris County TX Cultural Education Facilities Finance Corporation Hospital Memorial Hermann Health System (SIFMA Municipal Swap +0.57%) ± | 0.70 | 12-1-2049 | 11,000,000 | 10,658,780 | ||||||||||||
Harris County TX Cultural Education Facilities Finance Corporation Hospital Memorial Hermann Health System | 5.00 | 7-1-2049 | 7,750,000 | 8,941,795 | ||||||||||||
Tarrant County TX ECFA Hendrick Medical Center Group | 5.00 | 9-1-2020 | 920,000 | 925,962 | ||||||||||||
Tarrant County TX ECFA Hendrick Medical Center Group | 5.00 | 11-15-2020 | 1,045,000 | 1,042,597 | ||||||||||||
Travis County TX Health Facilities Development Corporation Longhorn Village Project Series A | 7.13 | 1-1-2046 | 845,000 | 873,375 | ||||||||||||
| 22,442,509 | ||||||||||||||||
|
| |||||||||||||||
| Housing Revenue: 1.58% | ||||||||||||||||
Alamito TX Public Facility Corporation Cramer Three Apartments Project | 2.50 | 11-1-2021 | 20,000,000 | 20,271,800 | ||||||||||||
Austin TX Affordable PFC Incorporated Multifamily Housing Bridge Cameron Apartments | 1.45 | 12-1-2021 | 25,000,000 | 25,010,250 | ||||||||||||
Dallas TX Housing Finance Corporation Multifamily Housing Estates at Shiloh | 1.51 | 7-1-2037 | 7,000,000 | 7,131,460 | ||||||||||||
| 52,413,510 | ||||||||||||||||
|
| |||||||||||||||
| Industrial Development Revenue: 0.25% | ||||||||||||||||
Houston TX Airport System Refunding Bond United Airlines Incorporated Terminal E Project | 4.50 | 7-1-2020 | 3,750,000 | 3,750,000 | ||||||||||||
Houston TX Airport System Revenue AMT Series B2 | 5.00 | 7-15-2020 | 1,200,000 | 1,201,968 | ||||||||||||
Houston TX Airport System Revenue AMT Series C | 5.00 | 7-15-2020 | 3,245,000 | 3,250,322 | ||||||||||||
| 8,202,290 | ||||||||||||||||
|
| |||||||||||||||
The accompanying notes are an integral part of these financial statements.
Wells Fargo Short-Term Municipal Bond Fund | 33
Portfolio of investments—June 30, 2020
| Interest rate | Maturity date | Principal | Value | |||||||||||||
| Miscellaneous Revenue: 0.09% | ||||||||||||||||
Texas Subordinate Bond Series E2 | 2.25 | % | 8-1-2029 | $ | 2,960,000 | $ | 2,964,470 | |||||||||
|
| |||||||||||||||
| Resource Recovery Revenue: 1.38% | ||||||||||||||||
Mission TX Economic Development Corporation Waste Management Project | 2.50 | 8-1-2020 | 11,000,000 | 11,013,640 | ||||||||||||
Port Arthur TX Navigation District Jefferson County Environmental Facilities Motiva Enterprises LLC Project Series A ø | 0.90 | 4-1-2040 | 26,785,000 | 26,785,000 | ||||||||||||
Port Arthur TX Navigation District Jefferson County Environmental Facilities Motiva Enterprises LLC Project Series E ø | 1.99 | 11-1-2040 | 8,100,000 | 8,100,000 | ||||||||||||
| 45,898,640 | ||||||||||||||||
|
| |||||||||||||||
| Transportation Revenue: 0.25% | ||||||||||||||||
Central Texas Regional Mobility Authority Series B | 5.00 | 1-1-2045 | 410,000 | 410,320 | ||||||||||||
Central Texas Regional Mobility Authority Subordinate Bond | 4.00 | 1-1-2022 | 6,000,000 | 6,096,420 | ||||||||||||
North Texas Tollway Authority Series A | 5.00 | 1-1-2021 | 1,860,000 | 1,901,980 | ||||||||||||
| 8,408,720 | ||||||||||||||||
|
| |||||||||||||||
| Utilities Revenue: 1.22% | ||||||||||||||||
San Antonio TX Electric & Gas Revenue Various Refunding Bond Junior Lien Series 2020 | 1.75 | 2-1-2049 | 11,500,000 | 11,711,830 | ||||||||||||
San Antonio TX Electric & Gas Systems Junior Lien Refunding Bond | 2.75 | 2-1-2048 | 6,000,000 | 6,308,700 | ||||||||||||
San Antonio TX Junior Lien Series D | 3.00 | 12-1-2045 | 12,325,000 | 12,451,701 | ||||||||||||
Texas Municipal Gas Acquisition & Supply Corporation Series A (SIFMA Municipal Swap +0.55%) ± | 0.68 | 9-15-2027 | 10,345,000 | 10,047,892 | ||||||||||||
| 40,520,123 | ||||||||||||||||
|
| |||||||||||||||
| Water & Sewer Revenue: 0.57% | ||||||||||||||||
San Antonio TX Water System Junior Lien Series A | 2.63 | 5-1-2049 | 12,250,000 | 13,008,888 | ||||||||||||
San Antonio TX Water System Junior Lien Series B | 2.00 | 5-1-2044 | 5,805,000 | 5,987,799 | ||||||||||||
| 18,996,687 | ||||||||||||||||
|
| |||||||||||||||
| 425,588,814 | ||||||||||||||||
|
| |||||||||||||||
Utah: 0.35% | ||||||||||||||||
| Airport Revenue: 0.26% | ||||||||||||||||
Salt Lake City UT International Airport Series A | 5.00 | 7-1-2023 | 3,150,000 | 3,525,732 | ||||||||||||
Salt Lake City UT International Airport Series A | 5.00 | 7-1-2024 | 2,000,000 | 2,307,840 | ||||||||||||
Salt Lake City UT International Airport Series A | 5.00 | 7-1-2025 | 2,300,000 | 2,726,006 | ||||||||||||
| 8,559,578 | ||||||||||||||||
|
| |||||||||||||||
| Housing Revenue: 0.09% | ||||||||||||||||
Utah Housing Corporation Multifamily Lincoln Tower Apartments Project | 1.54 | 8-1-2022 | 3,000,000 | 3,024,780 | ||||||||||||
|
| |||||||||||||||
| 11,584,358 | ||||||||||||||||
|
| |||||||||||||||
Vermont: 0.02% | ||||||||||||||||
| Education Revenue: 0.02% | ||||||||||||||||
Vermont Educational & Health Buildings Financing Agency Saint Michael’s College Project | 5.00 | 10-1-2026 | 575,000 | 603,250 | ||||||||||||
|
| |||||||||||||||
Virginia: 3.79% | ||||||||||||||||
| Health Revenue: 0.03% | ||||||||||||||||
Lexington VA IDA Residential Care Facility Kendal at Lexington Refunding Bond | 4.00 | 1-1-2021 | 440,000 | 440,493 | ||||||||||||
Lexington VA IDA Residential Care Facility Kendal at Lexington Refunding Bond | 4.00 | 1-1-2022 | 525,000 | 526,664 | ||||||||||||
| 967,157 | ||||||||||||||||
|
| |||||||||||||||
The accompanying notes are an integral part of these financial statements.
34 | Wells Fargo Short-Term Municipal Bond Fund
Portfolio of investments—June 30, 2020
| Interest rate | Maturity date | Principal | Value | |||||||||||||
| Housing Revenue: 0.87% | ||||||||||||||||
Fairfax County VA Redevelopment & Housing Authority Parkwood Project | 2.21 | % | 2-1-2021 | $ | 15,000,000 | $ | 15,019,050 | |||||||||
Spotsylvania County VA EDA Palmers Creek Apartments Project (FHA/GNMA Insured) | 1.45 | 8-1-2022 | 13,700,000 | 13,855,221 | ||||||||||||
| 28,874,271 | ||||||||||||||||
|
| |||||||||||||||
| Industrial Development Revenue: 0.10% | ||||||||||||||||
Peninsula VA Ports Authority Coal Terminal Refunding Bond Dominion Terminal Associates Project | 1.70 | 10-1-2033 | 3,300,000 | 3,332,340 | ||||||||||||
|
| |||||||||||||||
| Miscellaneous Revenue: 0.63% | ||||||||||||||||
Franklin County VA IDA Public Facility Lease BAN | 3.00 | 10-15-2023 | 3,000,000 | 3,020,460 | ||||||||||||
Westmoreland County VA IDA Lease BAN High School Project | 2.00 | 6-1-2022 | 17,510,000 | 17,909,578 | ||||||||||||
| 20,930,038 | ||||||||||||||||
|
| |||||||||||||||
| Tax Revenue: 0.05% | ||||||||||||||||
Marquis VA CDA CAB Series 2015 144A¤ | 0.00 | 9-1-2045 | 680,000 | 381,426 | ||||||||||||
Marquis VA CDA CAB Series A | 5.10 | 9-1-2036 | 2,169,000 | 1,191,085 | ||||||||||||
Marquis VA CDA CAB Series C ¤ | 0.00 | 9-1-2041 | 3,493,000 | 156,626 | ||||||||||||
| 1,729,137 | ||||||||||||||||
|
| |||||||||||||||
| Transportation Revenue: 0.51% | ||||||||||||||||
Chesapeake VA Bay Bridge & Tunnel District First Tier Generation Resolution | 5.00 | 11-1-2023 | 14,115,000 | 15,225,286 | ||||||||||||
Virginia Commonwealth Transportation Board Refunding Bond Series A | 5.00 | 5-15-2023 | 1,500,000 | 1,701,345 | ||||||||||||
| 16,926,631 | ||||||||||||||||
|
| |||||||||||||||
| Utilities Revenue: 1.60% | ||||||||||||||||
Halifax County VA IDA | 2.15 | 12-1-2041 | 44,450,000 | 44,464,224 | ||||||||||||
York County VA EDA PCR Virginia Electric and Power Company Project | 1.90 | 5-1-2033 | 8,500,000 | 8,770,470 | ||||||||||||
| 53,234,694 | ||||||||||||||||
|
| |||||||||||||||
| 125,994,268 | ||||||||||||||||
|
| |||||||||||||||
Washington: 4.28% | ||||||||||||||||
| Airport Revenue: 0.34% | ||||||||||||||||
Metropolitan Washington Airports Authority Refunding Bond Series 2014A | 3.00 | 10-1-2022 | 6,500,000 | 6,806,930 | ||||||||||||
Port of Seattle WA Refunding Bond Series B | 5.00 | 8-1-2023 | 4,155,000 | 4,473,398 | ||||||||||||
| 11,280,328 | ||||||||||||||||
|
| |||||||||||||||
| Education Revenue: 0.65% | ||||||||||||||||
University of Washington Series A | 5.00 | 5-1-2048 | 20,500,000 | 21,747,220 | ||||||||||||
|
| |||||||||||||||
| GO Revenue: 0.25% | ||||||||||||||||
Washington Refunding Bond %% | 5.00 | 6-1-2025 | 1,000,000 | 1,181,120 | ||||||||||||
Washington Refunding Bond %% | 5.00 | 6-1-2026 | 1,570,000 | 1,909,026 | ||||||||||||
Washington Series A | 5.00 | 8-1-2022 | 4,800,000 | 5,272,176 | ||||||||||||
| 8,362,322 | ||||||||||||||||
|
| |||||||||||||||
| Health Revenue: 0.83% | ||||||||||||||||
Washington HCFR Catholic Health Initiatives Series B (SIFMA Municipal Swap +1.00%) ± | 1.13 | 1-1-2035 | 8,650,000 | 8,611,681 | ||||||||||||
Washington Health Care Facilities Authority Catholic Health Initiatives Series A | 5.00 | 2-1-2023 | 1,025,000 | 1,052,552 | ||||||||||||
Washington Health Care Facilities Authority Commonspirit Health Series B1 | 5.00 | 8-1-2049 | 2,500,000 | 2,808,850 | ||||||||||||
The accompanying notes are an integral part of these financial statements.
Wells Fargo Short-Term Municipal Bond Fund | 35
Portfolio of investments—June 30, 2020
| Interest rate | Maturity date | Principal | Value | |||||||||||||
| Health Revenue (continued) | ||||||||||||||||
Washington Health Care Facilities Authority Commonspirit Health Series B3 | 5.00 | % | 8-1-2049 | $ | 4,000,000 | $ | 4,705,320 | |||||||||
Washington Health Care Facilities Authority Fred Hutchinson Cancer Research (1 Month LIBOR +1.10%) ± | 1.22 | 1-1-2042 | 9,500,000 | 9,494,110 | ||||||||||||
Washington Health Care Facilities Authority Series 2015 | 5.00 | 7-1-2020 | 850,000 | 850,000 | ||||||||||||
| 27,522,513 | ||||||||||||||||
|
| |||||||||||||||
| Housing Revenue: 0.74% | ||||||||||||||||
Snohomish County WA Housing Authority Carvel Apartments Project | 5.00 | 4-1-2025 | 500,000 | 588,955 | ||||||||||||
Snohomish County WA Housing Authority Carvel Apartments Project | 5.00 | 4-1-2026 | 730,000 | 879,657 | ||||||||||||
Washington Housing Finance Commission MFHR College Glen Apartments Project Series A (FHA Insured) | 1.55 | 7-1-2022 | 5,880,000 | 5,981,136 | ||||||||||||
Washington Housing Finance Commission MFHR Sanford Hildebrandt Towers Project | 2.25 | 7-1-2021 | 17,025,000 | 17,156,603 | ||||||||||||
| 24,606,351 | ||||||||||||||||
|
| |||||||||||||||
| Miscellaneous Revenue: 0.04% | ||||||||||||||||
FYI Properties Refunding Bond State of Washington District Project | 5.00 | 6-1-2027 | 1,000,000 | 1,239,910 | ||||||||||||
|
| |||||||||||||||
| Utilities Revenue: 1.07% | ||||||||||||||||
Seattle WA Municipal Light & Power Refunding Bond Series B-2 (SIFMA Municipal Swap +0.29%) ± | 0.42 | 5-1-2045 | 12,635,000 | 12,555,905 | ||||||||||||
Seattle WA Municipal Light & Power Refunding Bond Series C-1 (SIFMA Municipal Swap +0.49%) ± | 0.62 | 11-1-2046 | 23,190,000 | 22,924,475 | ||||||||||||
| 35,480,380 | ||||||||||||||||
|
| |||||||||||||||
| Water & Sewer Revenue: 0.36% | ||||||||||||||||
King County WA Junior Lien Series 2011 | 2.45 | 1-1-2042 | 12,000,000 | 12,018,480 | ||||||||||||
|
| |||||||||||||||
| 142,257,504 | ||||||||||||||||
|
| |||||||||||||||
West Virginia: 0.32% | ||||||||||||||||
| GO Revenue: 0.06% | ||||||||||||||||
Berkeley County WV Board of Education Public School Series 2020 | 2.00 | 5-1-2023 | 1,000,000 | 1,045,940 | ||||||||||||
Berkeley County WV Board of Education Public School Series 2020 | 2.00 | 5-1-2024 | 1,000,000 | 1,057,880 | ||||||||||||
| 2,103,820 | ||||||||||||||||
|
| |||||||||||||||
Utilities Revenue: 0.26% | ||||||||||||||||
West Virginia EDA Solid Waste Disposal Facilities Wheeling Power Company Mitchell Project Series A | 3.00 | 6-1-2037 | 8,300,000 | 8,512,397 | ||||||||||||
|
| |||||||||||||||
| 10,616,217 | ||||||||||||||||
|
| |||||||||||||||
Wisconsin: 3.77% | ||||||||||||||||
| Airport Revenue: 0.13% | ||||||||||||||||
Wisconsin Airport Facilities PFA Senior Obligation Group Series B | 5.00 | 7-1-2022 | 4,210,000 | 4,290,537 | ||||||||||||
|
| |||||||||||||||
| Education Revenue: 0.04% | ||||||||||||||||
Wisconsin PFA Guilford College | 5.00 | 1-1-2021 | 650,000 | 653,517 | ||||||||||||
Wisconsin PFA Guilford College | 5.00 | 1-1-2022 | 625,000 | 634,356 | ||||||||||||
| 1,287,873 | ||||||||||||||||
|
| |||||||||||||||
| Health Revenue: 1.38% | ||||||||||||||||
Wisconsin HEFA Advocate Aurora Health Credit Group Series B-3 | 5.00 | 8-15-2054 | 2,000,000 | 2,295,720 | ||||||||||||
Wisconsin HEFA Advocate Aurora Health Credit Group Series B-4 | 5.00 | 8-15-2054 | 1,450,000 | 1,716,394 | ||||||||||||
The accompanying notes are an integral part of these financial statements.
36 | Wells Fargo Short-Term Municipal Bond Fund
Portfolio of investments—June 30, 2020
| Interest rate | Maturity date | Principal | Value | |||||||||||||
| Health Revenue (continued) | ||||||||||||||||
Wisconsin HEFA Advocate Aurora Health Credit Group Series C-4 (SIFMA Municipal Swap +0.65%) ± | 0.78 | % | 8-15-2054 | $ | 4,200,000 | $ | 4,180,848 | |||||||||
Wisconsin HEFA Ascension Health Alliance | 5.00 | 11-15-2033 | 12,000,000 | 14,173,800 | ||||||||||||
Wisconsin HEFA Beloit Health System Incorporated | 5.00 | 7-1-2025 | 1,000,000 | 1,174,590 | ||||||||||||
Wisconsin HEFA Beloit Health System Incorporated | 5.00 | 7-1-2026 | 1,060,000 | 1,270,081 | ||||||||||||
Wisconsin HEFA Marshfield Clinic Health System Incorporated | 5.00 | 2-15-2052 | 3,000,000 | 3,425,730 | ||||||||||||
Wisconsin HEFA Marshfield Clinic Health System Incorporated Series B2 | 5.00 | 2-15-2051 | 14,300,000 | 17,013,961 | ||||||||||||
Wisconsin HEFA St. Camillus Health System Incorporated | 5.00 | 11-1-2024 | 155,000 | 160,850 | ||||||||||||
Wisconsin HEFA St. Camillus Health System Incorporated | 5.00 | 11-1-2025 | 245,000 | 255,329 | ||||||||||||
Wisconsin HEFA St. Camillus Health System Incorporated | 5.00 | 11-1-2026 | 355,000 | 370,425 | ||||||||||||
| 46,037,728 | ||||||||||||||||
|
| |||||||||||||||
| Housing Revenue: 1.02% | ||||||||||||||||
Wisconsin Tender Option Bond Trust Receipts/Floater Certificates Series 2020-XF2871 (Mizuho Capital Markets LLC LOC, Mizuho Capital Markets LLC LIQ) 144Aø | 0.73 | 11-1-2025 | 33,928,000 | 33,928,000 | ||||||||||||
|
| |||||||||||||||
| Miscellaneous Revenue: 0.99% | ||||||||||||||||
Waukesha County WI Anticipation Notes Series C | 3.00 | 5-1-2022 | 3,035,000 | 3,041,374 | ||||||||||||
Waukesha County WI Series B | 3.00 | 5-1-2021 | 11,890,000 | 11,915,564 | ||||||||||||
Wisconsin State Refunding Bond Series A | 5.00 | 5-1-2022 | 8,040,000 | 8,732,405 | ||||||||||||
Wisconsin State Refunding Bond Series A | 5.00 | 5-1-2023 | 8,015,000 | 9,079,152 | ||||||||||||
| 32,768,495 | ||||||||||||||||
|
| |||||||||||||||
| Resource Recovery Revenue: 0.21% | ||||||||||||||||
Wisconsin PFA Series A-2 | 1.90 | 10-1-2025 | 7,000,000 | 7,003,010 | ||||||||||||
|
| |||||||||||||||
| 125,315,643 | ||||||||||||||||
|
| |||||||||||||||
Total Municipal Obligations (Cost $3,248,453,426) |
| 3,288,299,455 | ||||||||||||||
|
| |||||||||||||||
Closed End Municipal Bond Fund Obligations: 0.74% | ||||||||||||||||
| California: 0.44% | ||||||||||||||||
Nuveen California AMT-Free Quality Municipal Income Fund MuniFund Preferred Shares Series A (144 shares) 0.92% 144Aø | 14,400,000 | 14,400,000 | ||||||||||||||
|
| |||||||||||||||
Other: 0.30% | ||||||||||||||||
Nuveen AMT-Free Municipal Credit Income Fund MuniFund Preferred Shares Series B (10,000 shares) 0.92% 144Aø | 10,000,000 | 10,000,000 | ||||||||||||||
|
| |||||||||||||||
Total Closed End Municipal Bond Fund Obligations (Cost $24,400,000) |
| 24,400,000 | ||||||||||||||
|
| |||||||||||||||
| Yield | Shares | |||||||||||||||
| Short-Term Investments: 0.15% | ||||||||||||||||
Investment Companies: 0.15% |
| |||||||||||||||
Wells Fargo Municipal Cash Management Money Market Fund Institutional Class (l)(u)## | 0.10 | 5,067,192 | 5,068,712 | |||||||||||||
|
| |||||||||||||||
Total Short-Term Investments (Cost $5,067,963) |
| 5,068,712 | ||||||||||||||
|
| |||||||||||||||
| Total investments in securities (Cost $3,277,921,389) | 99.79 | % | 3,317,768,167 | |||||
Other assets and liabilities, net | 0.21 | 7,126,448 | ||||||
|
|
|
| |||||
| Total net assets | 100.00 | % | $ | 3,324,894,615 | ||||
|
|
|
| |||||
The accompanying notes are an integral part of these financial statements.
Wells Fargo Short-Term Municipal Bond Fund | 37
Portfolio of investments—June 30, 2020
| %% | The security is purchased on a when-issued basis. |
| ø | Variable rate demand notes are subject to a demand feature which reduces the effective maturity. The maturity date shown represents the final maturity date of the security. The interest rate is determined and reset by the issuer daily, weekly, or monthly depending upon the terms of the security. The rate shown is the rate in effect at period end. |
| ± | Variable rate investment. The rate shown is the rate in effect at period end. |
| 144A | The security may be resold in transactions exempt from registration, normally to qualified institutional buyers, pursuant to Rule 144A under the Securities Act of 1933. |
| ¤ | The security is issued in zero coupon form with no periodic interest payments. |
| (m) | The security is an auction-rate security which has an interest rate that resets at predetermined short-term intervals through a Dutch auction. The rate shown is the rate in effect at period end. |
| øø | The interest rate is determined and reset by the issuer periodically depending upon the terms of the security. The rate shown is the rate in effect at period end. |
| ## | All or a portion of this security is segregated for when-issued securities. |
| (l) | The issuer of the security is an affiliated person of the Fund as defined in the Investment Company Act of 1940. |
| (u) | The rate represents the 7-day annualized yield at period end. |
Abbreviations:
| AGC | Assured Guaranty Corporation |
| AGM | Assured Guaranty Municipal |
| Ambac | Ambac Financial Group Incorporated |
| AMT | Alternative minimum tax |
| BAM | Build America Mutual Assurance Company |
| BAN | Bond anticipation notes |
| CAB | Capital appreciation bond |
| CDA | Community Development Authority |
| ECFA | Educational & Cultural Facilities Authority |
| EDA | Economic Development Authority |
| EDFA | Economic Development Finance Authority |
| FHA | Federal Housing Administration |
| FHLMC | Federal Home Loan Mortgage Corporation |
| FNMA | Federal National Mortgage Association |
| GNMA | Government National Mortgage Association |
| GO | General obligation |
| HCFR | Healthcare facilities revenue |
| HEFA | Health & Educational Facilities Authority |
| HEFAR | Higher Education Facilities Authority Revenue |
| HFA | Housing Finance Authority |
| HFFA | Health Facilities Financing Authority |
| IDA | Industrial Development Authority |
| LIBOR | London Interbank Offered Rate |
| LIQ | Liquidity agreement |
| LOC | Letter of credit |
| MFHR | Multifamily housing revenue |
| National | National Public Finance Guarantee Corporation |
| PCFA | Pollution Control Financing Authority |
| PCR | Pollution control revenue |
| PFA | Public Finance Authority |
| RDA | Redevelopment Authority |
| SIFMA | Securities Industry and Financial Markets Association |
| SPA | Standby purchase agreement |
| TTFA | Transportation Trust Fund Authority |
The accompanying notes are an integral part of these financial statements.
38 | Wells Fargo Short-Term Municipal Bond Fund
Portfolio of investments—June 30, 2020
Investments in Affiliates
An affiliated investment is an investment in which the Fund owns at least 5% of the outstanding voting shares of the issuer or as a result of other relationships, such as the Fund and the issuer having the same investment manager. Transactions with issuers that were either affiliated persons of the Fund at the beginning of the period or the end of the period were as follows:
| Value, beginning of period | Purchases | Sales proceeds | Net realized losses | Net change in unrealized gains (losses) | Income from affiliated securities | Value, end of period | % of net assets | |||||||||||||||||||||||||
| Short-Term Investments | ||||||||||||||||||||||||||||||||
Investment Companies | ||||||||||||||||||||||||||||||||
Wells Fargo Municipal Cash Management Money Market Fund Institutional Class | $9,947,441 | $1,113,271,158 | $(1,118,148,696 | ) | $(1,940 | ) | $ | 749 | $ | 231,170 | $ | 5,068,712 | 0.15 | % | ||||||||||||||||||
The accompanying notes are an integral part of these financial statements.
Wells Fargo Short-Term Municipal Bond Fund | 39
Statement of assets and liabilities—June 30, 2020
Assets | ||||
Investments in unaffiliated securities, at value (cost $3,272,853,426) | $ | 3,312,699,455 | ||
Investments in affiliated securities, at value (cost $5,067,963) | 5,068,712 | |||
Cash | 623 | |||
Receivable for investments sold | 10,302,622 | |||
Receivable for Fund shares sold | 3,269,682 | |||
Receivable for interest | 24,195,933 | |||
|
| |||
Total assets | 3,355,537,027 | |||
|
| |||
Liabilities | ||||
Payable for investments purchased | 21,789,053 | |||
Payable for Fund shares redeemed | 6,549,792 | |||
Management fee payable | 752,889 | |||
Dividends payable | 685,471 | |||
Administration fees payable | 242,924 | |||
Distribution fee payable | 10,562 | |||
Trustees’ fees and expenses payable | 3,396 | |||
Accrued expenses and other liabilities | 608,325 | |||
|
| |||
Total liabilities | 30,642,412 | |||
|
| |||
Total net assets | $ | 3,324,894,615 | ||
|
| |||
Net assets consist of | ||||
Paid-in capital | $ | 3,338,154,209 | ||
Total distributable loss | (13,259,594 | ) | ||
|
| |||
Total net assets | $ | 3,324,894,615 | ||
|
| |||
Computation of net asset value and offering price per share | ||||
Net assets – Class A | $ | 743,254,412 | ||
Shares outstanding – Class A1 | 74,936,540 | |||
Net asset value per share – Class A | $9.92 | |||
Maximum offering price per share – Class A2 | $10.12 | |||
Net assets – Class C | $ | 16,870,338 | ||
Shares outstanding – Class C1 | 1,700,654 | |||
Net asset value per share – Class C | $9.92 | |||
Net assets – Class R6 | $ | 626,311,944 | ||
Shares outstanding – Class R61 | 63,027,263 | |||
Net asset value per share – Class R6 | $9.94 | |||
Net assets – Administrator Class | $ | 18,559,647 | ||
Shares outstanding – Administrator Class1 | 1,870,080 | |||
Net asset value per share – Administrator Class | $9.92 | |||
Net assets – Institutional Class | $ | 1,919,898,274 | ||
Shares outstanding – Institutional Class1 | 193,223,291 | |||
Net asset value per share – Institutional Class | $9.94 | |||
| 1 | The Fund has an unlimited number of authorized shares. |
| 2 | Maximum offering price is computed as 100/98 of net asset value. On investments of $50,000 or more, the offering price is reduced. |
The accompanying notes are an integral part of these financial statements.
40 | Wells Fargo Short-Term Municipal Bond Fund
Statement of operations—year ended June 30, 2020
Investment income | ||||
Interest | $ | 78,076,381 | ||
Income from affiliated securities | 231,170 | |||
|
| |||
Total investment income | 78,307,551 | |||
|
| |||
Expenses | ||||
Management fee | 12,116,777 | |||
Administration fees | ||||
Class A | 1,398,750 | |||
Class C | 38,597 | |||
Class R6 | 208,043 | |||
Administrator Class | 27,734 | |||
Institutional Class | 1,625,410 | |||
Shareholder servicing fees | ||||
Class A | 2,184,443 | |||
Class C | 60,275 | |||
Administrator Class | 69,163 | |||
Distribution fee | ||||
Class C | 180,656 | |||
Custody and accounting fees | 147,486 | |||
Professional fees | 72,371 | |||
Registration fees | 155,926 | |||
Shareholder report expenses | 78,251 | |||
Trustees’ fees and expenses | 21,541 | |||
Other fees and expenses | 53,009 | |||
|
| |||
Total expenses | 18,438,432 | |||
Less: Fee waivers and/or expense reimbursements | ||||
Fund-level | (963,492 | ) | ||
Class A | (895,817 | ) | ||
Class C | (23,634 | ) | ||
Class R6 | 0 | |||
Administrator Class | (19,268 | ) | ||
|
| |||
Net expenses | 16,536,221 | |||
|
| |||
Net investment income | 61,771,330 | |||
|
| |||
Realized and unrealized gains (losses) on investments | ||||
Net realized losses on | ||||
Unaffiliated securities | (10,301,987 | ) | ||
Affiliated securities | (1,940 | ) | ||
|
| |||
Net realized losses on investments | (10,303,927 | ) | ||
|
| |||
Net change in unrealized gains (losses) on | ||||
Unaffiliated securities | 4,039,346 | |||
Affiliated securities | 749 | |||
|
| |||
Net change in unrealized gains (losses) on investments | 4,040,095 | |||
|
| |||
Net realized and unrealized gains (losses) on investments | (6,263,832 | ) | ||
|
| |||
Net increase in net assets resulting from operations | $ | 55,507,498 | ||
|
| |||
The accompanying notes are an integral part of these financial statements.
Wells Fargo Short-Term Municipal Bond Fund | 41
Statement of changes in net assets
| Year ended June 30, 2020 | Year ended June 30, 2019 | |||||||||||||||
Operations | ||||||||||||||||
Net investment income | $ | 61,771,330 | $ | 75,850,167 | ||||||||||||
Net realized losses on investments | (10,303,927 | ) | (1,493,623 | ) | ||||||||||||
Net change in unrealized gains (losses) on investments | 4,040,095 | 38,387,952 | ||||||||||||||
|
| |||||||||||||||
Net increase in net assets resulting from operations | 55,507,498 | 112,744,496 | ||||||||||||||
|
| |||||||||||||||
Distributions to shareholders from |
| |||||||||||||||
Net investment income and net realized gains |
| |||||||||||||||
Class A | (12,821,770 | ) | (17,363,867 | ) | ||||||||||||
Class C | (174,616 | ) | (356,754 | ) | ||||||||||||
Class R6 | (12,105,361 | ) | (9,948,747 | )1 | ||||||||||||
Administrator Class | (417,282 | ) | (627,989 | ) | ||||||||||||
Institutional Class | (34,358,443 | ) | (48,911,304 | ) | ||||||||||||
Tax basis return of capital |
| |||||||||||||||
Class A | 0 | (55,677 | ) | |||||||||||||
Class C | 0 | (2,136 | ) | |||||||||||||
Class R6 | 0 | (28,538 | )1 | |||||||||||||
Administrator Class | 0 | (1,978 | ) | |||||||||||||
Institutional Class | 0 | (138,654 | ) | |||||||||||||
|
| |||||||||||||||
Total distributions to shareholders | (59,877,472 | ) | (77,435,644 | ) | ||||||||||||
|
| |||||||||||||||
Capital share transactions | Shares | Shares | ||||||||||||||
Proceeds from shares sold |
| |||||||||||||||
Class A | 8,784,206 | 87,069,338 | 15,173,031 | 149,334,296 | ||||||||||||
Class C | 232,715 | 2,303,946 | 326,154 | 3,208,375 | ||||||||||||
Class R6 | 26,743,010 | 265,860,662 | 115,656,991 | 1 | 1,137,354,364 | 1 | ||||||||||
Administrator Class | 403,245 | 4,002,941 | 1,329,160 | 13,078,968 | ||||||||||||
Institutional Class | 69,711,947 | 690,696,127 | 96,293,045 | 949,084,420 | ||||||||||||
|
| |||||||||||||||
| 1,049,933,014 | 2,252,060,423 | |||||||||||||||
|
| |||||||||||||||
Reinvestment of distributions | ||||||||||||||||
Class A | 1,217,651 | 12,072,188 | 1,662,426 | 16,372,098 | ||||||||||||
Class C | 15,450 | 153,234 | 32,936 | 324,400 | ||||||||||||
Class R6 | 763,747 | 7,588,226 | 693,507 | 1 | 6,860,337 | 1 | ||||||||||
Administrator Class | 40,545 | 402,421 | 62,343 | 614,431 | ||||||||||||
Institutional Class | 2,922,853 | 29,035,946 | 4,066,630 | 40,106,697 | ||||||||||||
|
| |||||||||||||||
| 49,252,015 | 64,277,963 | |||||||||||||||
|
| |||||||||||||||
Payment for shares redeemed | ||||||||||||||||
Class A | (35,025,616 | ) | (346,670,591 | ) | (39,869,171 | ) | (392,102,587 | ) | ||||||||
Class C | (2,013,422 | ) | (19,947,015 | ) | (1,785,847 | ) | (17,588,416 | ) | ||||||||
Class R6 | (43,721,125 | ) | (433,057,352 | ) | (37,108,867 | )1 | (367,046,299 | )1 | ||||||||
Administrator Class | (2,152,095 | ) | (21,342,631 | ) | (2,304,976 | ) | (22,689,537 | ) | ||||||||
Institutional Class | (96,689,449 | ) | (956,952,570 | ) | (230,454,242 | ) | (2,266,785,603 | ) | ||||||||
|
| |||||||||||||||
| (1,777,970,159 | ) | (3,066,212,442 | ) | |||||||||||||
|
| |||||||||||||||
Net decrease in net assets resulting from capital share transactions | (678,785,130 | ) | (749,874,056 | ) | ||||||||||||
|
| |||||||||||||||
Total decrease in net assets | (683,155,104 | ) | (714,565,204 | ) | ||||||||||||
|
| |||||||||||||||
Net assets | ||||||||||||||||
Beginning of period | 4,008,049,719 | 4,722,614,923 | ||||||||||||||
|
| |||||||||||||||
End of period | $ | 3,324,894,615 | $ | 4,008,049,719 | ||||||||||||
|
| |||||||||||||||
| 1 | For the period from July 31, 2018 (commencement of class operations) to June 30, 2019 |
The accompanying notes are an integral part of these financial statements.
42 | Wells Fargo Short-Term Municipal Bond Fund
(For a share outstanding throughout each period)
| Year ended June 30 | ||||||||||||||||||||
| CLASS A | 2020 | 2019 | 2018 | 2017 | 2016 | |||||||||||||||
Net asset value, beginning of period | $9.92 | $9.83 | $9.85 | $9.96 | $9.93 | |||||||||||||||
Net investment income | 0.15 | 0.15 | 0.13 | 0.12 | 0.11 | |||||||||||||||
Net realized and unrealized gains (losses) on investments | (0.01 | ) | 0.10 | (0.02 | ) | (0.11 | ) | 0.04 | ||||||||||||
|
|
|
|
|
|
|
|
|
| |||||||||||
Total from investment operations | 0.14 | 0.25 | 0.11 | 0.01 | 0.15 | |||||||||||||||
Distributions to shareholders from | ||||||||||||||||||||
Net investment income | (0.14 | ) | (0.16 | ) | (0.13 | ) | (0.12 | ) | (0.11 | ) | ||||||||||
Net realized gains | 0.00 | 0.00 | 0.00 | 0.00 | (0.01 | ) | ||||||||||||||
Tax basis return of capital | 0.00 | (0.00 | )1 | 0.00 | 0.00 | 0.00 | ||||||||||||||
|
|
|
|
|
|
|
|
|
| |||||||||||
Total distributions to shareholders | (0.14 | ) | (0.16 | ) | (0.13 | ) | (0.12 | ) | (0.12 | ) | ||||||||||
Net asset value, end of period | $9.92 | $9.92 | $9.83 | $9.85 | $9.96 | |||||||||||||||
Total return2 | 1.47 | % | 2.57 | % | 1.15 | % | 0.14 | % | 1.49 | % | ||||||||||
Ratios to average net assets (annualized) | ||||||||||||||||||||
Gross expenses | 0.76 | % | 0.76 | % | 0.77 | % | 0.76 | % | 0.75 | % | ||||||||||
Net expenses | 0.63 | % | 0.63 | % | 0.63 | % | 0.63 | % | 0.62 | % | ||||||||||
Net investment income | 1.52 | % | 1.59 | % | 1.34 | % | 1.23 | % | 1.11 | % | ||||||||||
Supplemental data | ||||||||||||||||||||
Portfolio turnover rate | 35 | % | 33 | % | 31 | % | 23 | % | 16 | % | ||||||||||
Net assets, end of period (000s omitted) | $743,254 | $991,514 | $1,209,079 | $1,619,974 | $3,362,147 | |||||||||||||||
| 1 | Amount is less than $0.005. |
| 2 | Total return calculations do not include any sales charges. |
The accompanying notes are an integral part of these financial statements.
Wells Fargo Short-Term Municipal Bond Fund | 43
Financial highlights
(For a share outstanding throughout each period)
| Year ended June 30 | ||||||||||||||||||||
| CLASS C | 2020 | 2019 | 2018 | 2017 | 2016 | |||||||||||||||
Net asset value, beginning of period | $9.92 | $9.83 | $9.85 | $9.96 | $9.93 | |||||||||||||||
Net investment income | 0.08 | 0.08 | 0.06 | 0.05 | 0.04 | |||||||||||||||
Net realized and unrealized gains (losses) on investments | (0.01 | ) | 0.10 | (0.02 | ) | (0.11 | ) | 0.04 | ||||||||||||
|
|
|
|
|
|
|
|
|
| |||||||||||
Total from investment operations | 0.07 | 0.18 | 0.04 | (0.06 | ) | 0.08 | ||||||||||||||
Distributions to shareholders from | ||||||||||||||||||||
Net investment income | (0.07 | ) | (0.09 | ) | (0.06 | ) | (0.05 | ) | (0.04 | ) | ||||||||||
Net realized gains | 0.00 | 0.00 | 0.00 | 0.00 | (0.01 | ) | ||||||||||||||
Tax basis return of capital | 0.00 | (0.00 | )1 | 0.00 | 0.00 | 0.00 | ||||||||||||||
|
|
|
|
|
|
|
|
|
| |||||||||||
Total distributions to shareholders | (0.07 | ) | (0.09 | ) | (0.06 | ) | (0.05 | ) | (0.05 | ) | ||||||||||
Net asset value, end of period | $9.92 | $9.92 | $9.83 | $9.85 | $9.96 | |||||||||||||||
Total return2 | 0.71 | % | 1.81 | % | 0.40 | % | (0.61 | )% | 0.73 | % | ||||||||||
Ratios to average net assets (annualized) | ||||||||||||||||||||
Gross expenses | 1.50 | % | 1.51 | % | 1.52 | % | 1.51 | % | 1.50 | % | ||||||||||
Net expenses | 1.38 | % | 1.38 | % | 1.38 | % | 1.38 | % | 1.37 | % | ||||||||||
Net investment income | 0.77 | % | 0.84 | % | 0.59 | % | 0.49 | % | 0.35 | % | ||||||||||
Supplemental data | ||||||||||||||||||||
Portfolio turnover rate | 35 | % | 33 | % | 31 | % | 23 | % | 16 | % | ||||||||||
Net assets, end of period (000s omitted) | $16,870 | $34,381 | $48,101 | $62,796 | $82,111 | |||||||||||||||
| 1 | Amount is less than $0.005. |
| 2 | Total return calculations do not include any sales charges. |
The accompanying notes are an integral part of these financial statements.
44 | Wells Fargo Short-Term Municipal Bond Fund
Financial highlights
(For a share outstanding throughout each period)
| Year ended June 30 | ||||||||
| CLASS R6 | 2020 | 20191 | ||||||
Net asset value, beginning of period | $9.94 | $9.86 | ||||||
Net investment income | 0.18 | 0.17 | ||||||
Net realized and unrealized gains (losses) on investments | (0.01 | ) | 0.08 | |||||
|
|
|
| |||||
Total from investment operations | 0.17 | 0.25 | ||||||
Distributions to shareholders from | ||||||||
Net investment income | (0.17 | ) | (0.17 | ) | ||||
Tax basis return of capital | 0.00 | (0.00 | )2 | |||||
|
|
|
| |||||
Total distributions to shareholders | (0.17 | ) | (0.17 | ) | ||||
Net asset value, end of period | $9.94 | $9.94 | ||||||
Total return3 | 1.75 | % | 2.60 | % | ||||
Ratios to average net assets (annualized) | ||||||||
Gross expenses | 0.38 | % | 0.38 | % | ||||
Net expenses | 0.35 | % | 0.35 | % | ||||
Net investment income | 1.80 | % | 1.94 | % | ||||
Supplemental data | ||||||||
Portfolio turnover rate | 35 | % | 33 | % | ||||
Net assets, end of period (000s omitted) | $626,312 | $787,524 | ||||||
| 1 | For the period from July 31, 2018 (commencement of class operations) to June 30, 2019 |
| 2 | Amount is less than $0.005. |
| 3 | Returns for periods of less than one year are not annualized. |
The accompanying notes are an integral part of these financial statements.
Wells Fargo Short-Term Municipal Bond Fund | 45
Financial highlights
(For a share outstanding throughout each period)
| Year ended June 30 | ||||||||||||||||||||
| ADMINISTRATOR CLASS | 2020 | 2019 | 2018 | 2017 | 2016 | |||||||||||||||
Net asset value, beginning of period | $9.93 | $9.84 | $9.86 | $9.97 | $9.95 | |||||||||||||||
Net investment income | 0.16 | 0.16 | 0.14 | 0.13 | 0.11 | 1 | ||||||||||||||
Net realized and unrealized gains (losses) on investments | (0.02 | ) | 0.09 | (0.02 | ) | (0.11 | ) | 0.03 | ||||||||||||
|
|
|
|
|
|
|
|
|
| |||||||||||
Total from investment operations | 0.14 | 0.25 | 0.12 | 0.02 | 0.14 | |||||||||||||||
Distributions to shareholders from | ||||||||||||||||||||
Net investment income | (0.15 | ) | (0.16 | ) | (0.14 | ) | (0.13 | ) | (0.11 | ) | ||||||||||
Net realized gains | 0.00 | 0.00 | 0.00 | 0.00 | (0.01 | ) | ||||||||||||||
Tax basis return of capital | 0.00 | (0.00 | )2 | 0.00 | 0.00 | 0.00 | ||||||||||||||
|
|
|
|
|
|
|
|
|
| |||||||||||
Total distributions to shareholders | (0.15 | ) | (0.16 | ) | (0.14 | ) | (0.13 | ) | (0.12 | ) | ||||||||||
Net asset value, end of period | $9.92 | $9.93 | $9.84 | $9.86 | $9.97 | |||||||||||||||
Total return | 1.39 | % | 2.60 | % | 1.18 | % | 0.17 | % | 1.42 | % | ||||||||||
Ratios to average net assets (annualized) | ||||||||||||||||||||
Gross expenses | 0.69 | % | 0.70 | % | 0.71 | % | 0.70 | % | 0.66 | % | ||||||||||
Net expenses | 0.60 | % | 0.60 | % | 0.60 | % | 0.60 | % | 0.59 | % | ||||||||||
Net investment income | 1.55 | % | 1.62 | % | 1.36 | % | 1.27 | % | 1.08 | % | ||||||||||
Supplemental data | ||||||||||||||||||||
Portfolio turnover rate | 35 | % | 33 | % | 31 | % | 23 | % | 16 | % | ||||||||||
Net assets, end of period (000s omitted) | $18,560 | $35,517 | $44,186 | $68,621 | $95,121 | |||||||||||||||
| 1 | Calculated based upon average shares outstanding |
| 2 | Amount is less than $0.005. |
The accompanying notes are an integral part of these financial statements.
46 | Wells Fargo Short-Term Municipal Bond Fund
Financial highlights
(For a share outstanding throughout each period)
| Year ended June 30 | ||||||||||||||||||||
| INSTITUTIONAL CLASS | 2020 | 2019 | 2018 | 2017 | 2016 | |||||||||||||||
Net asset value, beginning of period | $9.94 | $9.85 | $9.87 | $9.98 | $9.95 | |||||||||||||||
Net investment income | 0.17 | 0.18 | 0.16 | 0.15 | 0.13 | |||||||||||||||
Net realized and unrealized gains (losses) on investments | (0.00 | )1 | 0.09 | (0.02 | ) | (0.11 | ) | 0.04 | ||||||||||||
|
|
|
|
|
|
|
|
|
| |||||||||||
Total from investment operations | 0.17 | 0.27 | 0.14 | 0.04 | 0.17 | |||||||||||||||
Distributions to shareholders from | ||||||||||||||||||||
Net investment income | (0.17 | ) | (0.18 | ) | (0.16 | ) | (0.15 | ) | (0.13 | ) | ||||||||||
Net realized gains | 0.00 | 0.00 | 0.00 | 0.00 | (0.01 | ) | ||||||||||||||
Tax basis return of capital | 0.00 | (0.00 | )2 | 0.00 | 0.00 | 0.00 | ||||||||||||||
|
|
|
|
|
|
|
|
|
| |||||||||||
Total distributions to shareholders | (0.17 | ) | (0.18 | ) | (0.16 | ) | (0.15 | ) | (0.14 | ) | ||||||||||
Net asset value, end of period | $9.94 | $9.94 | $9.85 | $9.87 | $9.98 | |||||||||||||||
Total return | 1.70 | % | 2.81 | % | 1.39 | % | 0.37 | % | 1.71 | % | ||||||||||
Ratios to average net assets (annualized) | ||||||||||||||||||||
Gross expenses | 0.43 | % | 0.43 | % | 0.44 | % | 0.43 | % | 0.42 | % | ||||||||||
Net expenses | 0.40 | % | 0.40 | % | 0.40 | % | 0.40 | % | 0.40 | % | ||||||||||
Net investment income | 1.74 | % | 1.80 | % | 1.58 | % | 1.48 | % | 1.33 | % | ||||||||||
Supplemental data | ||||||||||||||||||||
Portfolio turnover rate | 35 | % | 33 | % | 31 | % | 23 | % | 16 | % | ||||||||||
Net assets, end of period (000s omitted) | $1,919,898 | $2,159,113 | $3,421,249 | $3,427,060 | $2,261,092 | |||||||||||||||
| 1 | Amount is more than $(0.005). |
| 2 | Amount is less than $0.005. |
The accompanying notes are an integral part of these financial statements.
Wells Fargo Short-Term Municipal Bond Fund | 47
1. ORGANIZATION
Wells Fargo Funds Trust (the “Trust”), a Delaware statutory trust organized on March 10, 1999, is an open-end management investment company registered under the Investment Company Act of 1940, as amended (the “1940 Act”). As an investment company, the Trust follows the accounting and reporting guidance in Financial Accounting Standards Board (“FASB”) Accounting Standards Codification Topic 946, Financial Services – Investment Companies. These financial statements report on the Wells Fargo Short-Term Municipal Bond Fund (the “Fund”) which is a diversified series of the Trust.
2. SIGNIFICANT ACCOUNTING POLICIES
The following significant accounting policies, which are consistently followed in the preparation of the financial statements of the Fund, are in conformity with U.S. generally accepted accounting principles which require management to make estimates and assumptions that affect the reported amounts of assets and liabilities, disclosure of contingent assets and liabilities at the date of the financial statements, and the reported amounts of revenues and expenses during the reporting period. Actual results could differ from those estimates.
Securities valuation
All investments are valued each business day as of the close of regular trading on the New York Stock Exchange (generally 4 p.m. Eastern Time), although the Fund may deviate from this calculation time under unusual or unexpected circumstances.
Debt securities are valued at the evaluated bid price provided by an independent pricing service (e.g. taking into account various factors, including yields, maturities, or credit ratings) or, if a reliable price is not available, the quoted bid price from an independent broker-dealer.
Futures contracts that are listed on a foreign or domestic exchange or market are valued at the official closing price or, if none, the last sales price.
Investments in registered open-end investment companies are valued at net asset value.
Investments which are not valued using any of the methods discussed above are valued at their fair value, as determined in good faith by the Board of Trustees of the Fund. The Board of Trustees has established a Valuation Committee comprised of the Trustees and has delegated to it the authority to take any actions regarding the valuation of portfolio securities that the Valuation Committee deems necessary or appropriate, including determining the fair value of portfolio securities, unless the determination has been delegated to the Wells Fargo Asset Management Pricing Committee at Wells Fargo Funds Management, LLC (“Funds Management”). The Board of Trustees retains the authority to make or ratify any valuation decisions or approve any changes to the Valuation Procedures as it deems appropriate. On a quarterly basis, the Board of Trustees receives reports on any valuation actions taken by the Valuation Committee or the Wells Fargo Asset Management Pricing Committee which may include items for ratification.
When-issued transactions
The Fund may purchase securities on a forward commitment or when-issued basis. The Fund records a when-issued transaction on the trade date and will segregate assets in an amount at least equal in value to the Fund’s commitment to purchase when-issued securities. Securities purchased on a when-issued basis are marked-to-market daily and the Fund begins earning interest on the settlement date. Losses may arise due to changes in the market value of the underlying securities or if the counterparty does not perform under the contract.
Futures contracts
Futures contracts are agreements between the Fund and a counterparty to buy or sell a specific amount of a commodity, financial instrument or currency at a specified price and on a specified date. The Fund may buy and sell futures contracts in order to gain exposure to, or protect against, changes in interest rates and is subject to interest rate risk. The primary risks associated with the use of futures contracts are the imperfect correlation between changes in market values of securities held by the Fund and the prices of futures contracts, and the possibility of an illiquid market. Futures contracts are generally entered into on a regulated futures exchange and cleared through a clearinghouse associated with the exchange. With futures contracts, there is minimal counterparty risk to the Fund since futures contracts are exchange traded and the exchange’s clearinghouse, as the counterparty to all exchange traded futures, guarantees the futures contracts against default.
Upon entering into a futures contracts, the Fund is required to deposit either cash or securities (initial margin) with the broker in an amount equal to a certain percentage of the contract value. Subsequent payments (variation margin) are paid to or from the broker each day equal to the daily changes in the contract value. Such payments are recorded as unrealized gains or losses and, if any, shown as variation margin receivable (payable) in the Statement of Assets and Liabilities. Should the Fund fail to make requested variation margin payments, the broker can gain access to the initial margin to satisfy the Fund’s payment obligations. When the contracts are closed, a realized gain or loss is recorded in the Statement of Operations.
48 | Wells Fargo Short-Term Municipal Bond Fund
Notes to financial statements
Security transactions and income recognition
Securities transactions are recorded on a trade date basis. Realized gains or losses are recorded on the basis of identified cost.
Interest income is accrued daily and bond discounts are accreted and premiums are amortized daily. To the extent debt obligations are placed on non-accrual status, any related interest income may be reduced by writing off interest receivables when the collection of all or a portion of interest has been determined to be doubtful based on consistently applied procedures and the fair value has decreased. If the issuer subsequently resumes interest payments or when the collectability of interest is reasonably assured, the debt obligation is removed from non-accrual status.
Distributions to shareholders
Distributions to shareholders from net investment income are declared daily and paid monthly. Distributions from net realized gains, if any, are recorded on the ex-dividend date and paid at least annually. Such distributions are determined in accordance with income tax regulations and may differ from U.S. generally accepted accounting principles. Dividend sources are estimated at the time of declaration. The tax character of distributions is determined as of the Fund’s fiscal year end. Therefore, a portion of the Fund’s distributions made prior to the Fund’s fiscal year end may be categorized as a tax return of capital at year end.
Federal and other taxes
The Fund intends to continue to qualify as a regulated investment company by distributing substantially all of its investment company taxable and tax-exempt income and any net realized capital gains (after reduction for capital loss carryforwards) sufficient to relieve it from all, or substantially all, federal income taxes. Accordingly, no provision for federal income taxes was required.
The Fund’s income and federal excise tax returns and all financial records supporting those returns for the prior three fiscal years are subject to examination by the federal and Delaware revenue authorities. Management has analyzed the Fund’s tax positions taken on federal, state, and foreign tax returns for all open tax years and does not believe that there are any uncertain tax positions that require recognition of a tax liability.
As of June 30, 2020, the aggregate cost of all investments for federal income tax purposes was $3,278,499,789 and the unrealized gains (losses) consisted of:
Gross unrealized gains | $ | 49,428,341 | ||
Gross unrealized losses | (10,159,963 | ) | ||
Net unrealized gains | $ | 39,268,378 | ||
Reclassifications are made to the Fund’s capital accounts for permanent tax differences to reflect income and gains available for distribution (or available capital loss carryforwards) under federal income tax regulations. U.S. generally accepted accounting principles require that certain components of net assets be adjusted to reflect permanent differences between financial and tax reporting. These reclassifications have no effect on net assets or net asset values per share. At June 30, 2020, as a result of permanent book-to-tax differences, the following reclassification adjustments were made on the Statement of Assets and Liabilities:
| Paid-in capital | Total distributable loss | |
| $206,409 | $(206,409) | |
As of June 30, 2020, the Fund had capital loss carryforwards which consist of $4,358,707 in short-term capital losses and $49,074,399 in long-term capital losses.
Class allocations
The separate classes of shares offered by the Fund differ principally in applicable sales charges, distribution, shareholder servicing, and administration fees. Class specific expenses are charged directly to that share class. Investment income, common fund-level expenses, and realized and unrealized gains (losses) on investments are allocated daily to each class of shares based on the relative proportion of net assets of each class.
3. FAIR VALUATION MEASUREMENTS
Fair value measurements of investments are determined within a framework that has established a fair value hierarchy based upon the various data inputs utilized in determining the value of the Fund’s investments. The three-level hierarchy gives the highest priority to unadjusted quoted prices in active markets for identical assets or liabilities (Level 1) and the lowest priority to
Wells Fargo Short-Term Municipal Bond Fund | 49
Notes to financial statements
unobservable inputs (Level 3). The Fund’s investments are classified within the fair value hierarchy based on the lowest level of input that is significant to the fair value measurement. The inputs are summarized into three broad levels as follows:
| ∎ | Level 1 – quoted prices in active markets for identical securities |
| ∎ | Level 2 – other significant observable inputs (including quoted prices for similar securities, interest rates, prepayment speeds, credit risk, etc.) |
| ∎ | Level 3 – significant unobservable inputs (including the Fund’s own assumptions in determining the fair value of investments) |
The inputs or methodologies used for valuing investments in securities are not necessarily an indication of the risk associated with investing in those securities.
The following is a summary of the inputs used in valuing the Fund’s assets and liabilities as of June 30, 2020:
Quoted prices (Level 1) | Other significant observable inputs (Level 2) | Significant (Level 3) | Total | |||||||||||||
Assets | ||||||||||||||||
Investments in: | ||||||||||||||||
Municipal obligations | $ | 0 | $ | 3,288,299,455 | $ | 0 | $ | 3,288,299,455 | ||||||||
Closed end municipal bond fund obligations | 0 | 24,400,000 | 0 | 24,400,000 | ||||||||||||
Short-term investments | ||||||||||||||||
Investment companies | 5,068,712 | 0 | 0 | 5,068,712 | ||||||||||||
Total assets | $ | 5,068,712 | $ | 3,312,699,455 | $ | 0 | $ | 3,317,768,167 | ||||||||
Additional sector, industry or geographic detail is included in the Portfolio of Investments.
For the year ended June 30, 2020, the Fund did not have any transfers into/out of Level 3.
4. TRANSACTIONS WITH AFFILIATES
Management fee
Funds Management, an indirect wholly owned subsidiary of Wells Fargo & Company (“Wells Fargo”), is the manager of the Fund and provides advisory and fund-level administrative services under an investment management agreement. Under the investment management agreement, Funds Management is responsible for, among other services, implementing the investment objectives and strategies of the Fund, supervising the subadviser and providing fund-level administrative services in connection with the Fund’s operations. As compensation for its services under the investment management agreement, Funds Management is entitled to receive a management fee at the following annual rate based on the Fund’s average daily net assets:
| Average daily net assets | Management fee | |||
First $1 billion | 0.350 | % | ||
Next $4 billion | 0.325 | |||
Next $3 billion | 0.290 | |||
Next $2 billion | 0.265 | |||
Over $10 billion | 0.255 | |||
For the year ended June 30, 2020, the management fee was equivalent to an annual rate of 0.33% of the Fund’s average daily net assets.
Funds Management has retained the services of a subadviser to provide daily portfolio management to the Fund. The fee for subadvisory services is borne by Funds Management. Wells Capital Management Incorporated, an affiliate of Funds Management and an indirect wholly owned subsidiary of Wells Fargo, is the subadviser to the Fund and is entitled to receive a fee from Funds Management at an annual rate starting at 0.15% and declining to 0.05% as the average daily net assets of the Fund increase.
50 | Wells Fargo Short-Term Municipal Bond Fund
Notes to financial statements
Administration fees
Under a class-level administration agreement, Funds Management provides class-level administrative services to the Fund, which includes paying fees and expenses for services provided by the transfer agent, sub-transfer agents, omnibus account servicers and record-keepers. As compensation for its services under the class-level administration agreement, Funds Management receives an annual fee which is calculated based on the average daily net assets of each class as follows:
| Class-level administration fee | ||||
Class A, Class C | 0.16 | % | ||
Class R6 | 0.03 | |||
Administrator Class | 0.10 | |||
Institutional Class | 0.08 | |||
Waivers and/or expense reimbursements
Funds Management has contractually waived and/or reimbursed management and administration fees to the extent necessary to maintain certain net operating expense ratios for the Fund. When each class of the Fund has exceeded its expense cap, Funds Management has waived fees and/or reimbursed expenses from fund-level expenses on a proportionate basis and then from class specific expenses. When only certain classes exceed their expense caps, waivers and/or reimbursements are applied against class specific expenses before fund-level expenses. Funds Management has committed through October 31, 2020 to waive fees and/or reimburse expenses to the extent necessary to cap the Fund’s expenses at 0.63% for Class A shares, 1.38% for Class C shares, 0.35% for Class R6 shares, 0.60% for Administrator Class shares, and 0.40% for Institutional Class shares. Prior to or after the commitment expiration date, the cap may be increased or the commitment to maintain the cap may be terminated only with the approval of the Board of Trustees.
Distribution fee
The Trust has adopted a distribution plan for Class C shares of the Fund pursuant to Rule 12b-1 under the 1940 Act. A distribution fee is charged to Class C shares and paid to Wells Fargo Funds Distributor, LLC (“Funds Distributor”), the principal underwriter, at an annual rate of 0.75% of the average daily net assets of Class C shares.
In addition, Funds Distributor is entitled to receive the front-end sales charge from the purchase of Class A shares and a contingent deferred sales charge on the redemption of certain Class A shares. Funds Distributor is also entitled to receive the contingent deferred sales charges from redemptions of Class C shares. For the year ended June 30, 2020, Funds Distributor received $1,760 from the sale of Class A shares. No contingent deferred sales charges were incurred by Class A and Class C shares for the year ended June 30, 2020.
Shareholder servicing fees
The Trust has entered into contracts with one or more shareholder servicing agents, whereby Class A, Class C, and Administrator Class of the Fund are charged a fee at an annual rate of 0.25% of the average daily net assets of each respective class. A portion of these total shareholder servicing fees were paid to affiliates of Wells Fargo.
Interfund transactions
The Fund may purchase or sell portfolio investment securities to certain other Wells Fargo affiliates pursuant to Rule 17a-7 under the 1940 Act and under procedures adopted by the Board of Trustees. The procedures have been designed to ensure that these interfund transactions, which do not incur broker commissions, are effected at current market prices. Pursuant to these procedures, the Fund had $120,615,000 and $210,217,000 in interfund purchases and sales, respectively, during the year ended June 30, 2020.
5. INVESTMENT PORTFOLIO TRANSACTIONS
Purchases and sales of investments, excluding U.S. government obligations (if any) and short-term securities, for the year ended June 30, 2020 were $1,200,340,839 and $1,248,547,899, respectively.
6. BANK BORROWINGS
The Trust (excluding the money market funds), Wells Fargo Master Trust and Wells Fargo Variable Trust are parties to a $350,000,000 revolving credit agreement whereby the Fund is permitted to use bank borrowings for temporary or emergency purposes, such as to fund shareholder redemption requests. Interest under the credit agreement is charged to the Fund based
Wells Fargo Short-Term Municipal Bond Fund | 51
Notes to financial statements
on a borrowing rate equal to the higher of the Federal Funds rate in effect on that day plus 1.25% or the overnight LIBOR rate in effect on that day plus 1.25%. In addition, an annual commitment fee equal to 0.25% of the unused balance is allocated to each participating fund.
For the year ended June 30, 2020, there were no borrowings by the Fund under the agreement.
7. DISTRIBUTIONS TO SHAREHOLDERS
The tax character of distributions paid during the years ended June 30, 2020 and June 30, 2019 were as follows:
| Year ended June 30 | ||||||||
| 2020 | 2019 | |||||||
Tax-exempt income | $ | 59,877,472 | $ | 77,208,661 | ||||
Tax basis return of capital | 0 | 226,983 | ||||||
As of June 30, 2020, the components of distributable earnings on a tax basis were as follows:
| Undistributed tax-exempt income | Unrealized gains | Capital loss carryforward | ||
| $1,601,742 | $39,268,378 | $(53,433,106) | ||
8. INDEMNIFICATION
Under the Fund’s organizational documents, the officers and Trustees have been granted certain indemnification rights against certain liabilities that may arise out of performance of their duties to the Fund. The Fund has entered into a separate agreement with each Trustee that converts indemnification rights currently existing under the Fund’s organizational documents into contractual rights that cannot be changed in the future without the consent of the Trustee. Additionally, in the normal course of business, the Fund may enter into contracts with service providers that contain a variety of indemnification clauses. The Fund’s maximum exposure under these arrangements is dependent on future claims that may be made against the Fund and, therefore, cannot be estimated.
9. NEW ACCOUNTING PRONOUNCEMENT
In August 2018, FASB issued Accounting Standards Update (“ASU”) No. 2018-13, Fair Value Measurement (Topic 820) Disclosure Framework—Changes to the Disclosure Requirements for Fair Value Measurement. ASU 2018-13 updates the disclosure requirements on fair value measurements in Topic 820, Fair Value Measurements. The amendments are effective for fiscal years, and interim periods within those fiscal years, beginning after December 15, 2019. Management has adopted this guidance which did not have a material impact on the financial statements.
10. CORONAVIRUS (COVID-19) PANDEMIC
On March 11, 2020, the World Health Organization announced that it had made the assessment that coronavirus disease 2019 (“COVID-19”) is a pandemic. The impacts of COVID-19 are adversely affecting the entire global economy, individual companies and investment products, and the market in general. There is significant uncertainty around the extent and duration of business disruptions related to COVID-19 and the impacts may be short term or may last for an extended period of time. The risk of further spreading of COVID-19 has led to significant uncertainty and volatility in the financial markets.
52 | Wells Fargo Short-Term Municipal Bond Fund
Report of independent registered public accounting firm
To the Shareholders of the Fund and Board of Trustees
Wells Fargo Funds Trust:
Opinion on the Financial Statements
We have audited the accompanying statement of assets and liabilities of Wells Fargo Short-Term Municipal Bond Fund (the Fund), one of the funds constituting Wells Fargo Funds Trust, including the portfolio of investments, as of June 30, 2020, the related statement of operations for the year then ended, the statements of changes in net assets for each of the years in the two-year period then ended, and the related notes (collectively, the financial statements) and the financial highlights for each of the years or periods in the five-year period then ended. In our opinion, the financial statements and financial highlights present fairly, in all material respects, the financial position of the Fund as of June 30, 2020, the results of its operations for the year then ended, the changes in its net assets for each of the years in the two-year period then ended, and the financial highlights for each of the years or periods in the five-year period then ended, in conformity with U.S. generally accepted accounting principles.
Basis for Opinion
These financial statements and financial highlights are the responsibility of the Fund’s management. Our responsibility is to express an opinion on these financial statements and financial highlights based on our audits. We are a public accounting firm registered with the Public Company Accounting Oversight Board (United States) (PCAOB) and are required to be independent with respect to the Fund in accordance with the U.S. federal securities laws and the applicable rules and regulations of the Securities and Exchange Commission and the PCAOB.
We conducted our audits in accordance with the standards of the PCAOB. Those standards require that we plan and perform the audit to obtain reasonable assurance about whether the financial statements and financial highlights are free of material misstatement, whether due to error or fraud. Our audits included performing procedures to assess the risks of material misstatement of the financial statements and financial highlights, whether due to error or fraud, and performing procedures that respond to those risks. Such procedures included examining, on a test basis, evidence regarding the amounts and disclosures in the financial statements and financial highlights. Such procedures also included confirmation of securities owned as of June 30, 2020, by correspondence with the custodian, transfer agent and brokers, or by other appropriate auditing procedures. Our audits also included evaluating the accounting principles used and significant estimates made by management, as well as evaluating the overall presentation of the financial statements and financial highlights. We believe that our audits provide a reasonable basis for our opinion.

We have not been able to determine the specific year that we began serving as the auditor of one or more Wells Fargo Funds investment companies; however we are aware that we have served as the auditor of one or more Wells Fargo Funds investment companies since at least 1955.
Boston, Massachusetts
August 29, 2020
Wells Fargo Short-Term Municipal Bond Fund | 53
TAX INFORMATION
Pursuant to Section 852 of the Internal Revenue Code, 100% of distributions paid from net investment income is designated as exempt-interest dividends for the fiscal year ended June 30, 2020.
PROXY VOTING INFORMATION
A description of the policies and procedures used to determine how to vote proxies relating to portfolio securities is available, upon request, by calling 1-800-222-8222, visiting our website at wfam.com, or visiting the SEC website at sec.gov. Information regarding how the proxies related to portfolio securities were voted during the most recent 12-month period ended June 30 is available on the website at wfam.com or by visiting the SEC website at sec.gov.
QUARTERLY PORTFOLIO HOLDINGS INFORMATION
The Fund files its complete schedule of portfolio holdings with the SEC for the first and third quarters of each fiscal year as an exhibit to its reports on Form N-PORT. Shareholders may view the filed Form N-PORT by visiting the SEC website at sec.gov.
54 | Wells Fargo Short-Term Municipal Bond Fund
Other information (unaudited)
BOARD OF TRUSTEES AND OFFICERS
Each of the Trustees and Officers1 listed in the table below acts in identical capacities for each fund in the Wells Fargo family of funds, which consists of 147 mutual funds comprising the Wells Fargo Funds Trust, Wells Fargo Variable Trust, Wells Fargo Master Trust and four closed-end funds (collectively the “Fund Complex”). This table should be read in conjunction with the Prospectus and the Statement of Additional Information2. The mailing address of each Trustee and Officer is 525 Market Street, 12th Floor, San Francisco, CA 94105. Each Trustee and Officer serves an indefinite term, however, each Trustee serves such term until reaching the mandatory retirement age established by the Trustees.
Independent Trustees
| Name and year of birth | Position held and length of service* | Principal occupations during past five years or longer | Current other public company or investment company directorships | |||
William R. Ebsworth (Born 1957) | Trustee, since 2015 | Retired. From 1984 to 2013, equities analyst, portfolio manager, research director and chief investment officer at Fidelity Management and Research Company in Boston, Tokyo, and Hong Kong, and retired in 2013 as Chief Investment Officer of Fidelity Strategic Advisers, Inc. where he led a team of investment professionals managing client assets. Prior thereto, Board member of Hong Kong Securities Clearing Co., Hong Kong Options Clearing Corp., the Thailand International Fund, Ltd., Fidelity Investments Life Insurance Company, and Empire Fidelity Investments Life Insurance Company. Audit Committee Chair and Investment Committee Chair of the Vincent Memorial Hospital Endowment (non-profit organization). Mr. Ebsworth is a CFA® charterholder. | N/A | |||
| Jane A. Freeman (Born 1953) | Trustee, since 2015; Chair Liaison, since 2018 | Retired. From 2012 to 2014 and 1999 to 2008, Chief Financial Officer of Scientific Learning Corporation. From 2008 to 2012, Ms. Freeman provided consulting services related to strategic business projects. Prior to 1999, Portfolio Manager at Rockefeller & Co. and Scudder, Stevens & Clark. Board member of the Harding Loevner Funds from 1996 to 2014, serving as both Lead Independent Director and chair of the Audit Committee. Board member of the Russell Exchange Traded Funds Trust from 2011 to 2012 and the chair of the Audit Committee. Ms. Freeman is also an inactive Chartered Financial Analyst. | N/A | |||
| Isaiah Harris, Jr. (Born 1952) | Trustee, since 2009; Audit Committee Chairman, since 2019 | Retired. Chairman of the Board of CIGNA Corporation since 2009, and Director since 2005. From 2003 to 2011, Director of Deluxe Corporation. Prior thereto, President and CEO of BellSouth Advertising and Publishing Corp. from 2005 to 2007, President and CEO of BellSouth Enterprises from 2004 to 2005 and President of BellSouth Consumer Services from 2000 to 2003. Emeritus member of the Iowa State University Foundation Board of Governors. Emeritus Member of the Advisory Board of Iowa State University School of Business. Advisory Board Member, Palm Harbor Academy (private school). Advisory Board Member, Child Evangelism Fellowship (non-profit). Mr. Harris is a certified public accountant (inactive status). | CIGNA Corporation | |||
| Judith M. Johnson (Born 1949) | Trustee, since 2008; Audit Committee Chairman, from 2009 to 2018 | Retired. Prior thereto, Chief Executive Officer and Chief Investment Officer of Minneapolis Employees Retirement Fund from 1996 to 2008. Ms. Johnson is an attorney, certified public accountant and a certified managerial accountant. | N/A | |||
Wells Fargo Short-Term Municipal Bond Fund | 55
Other information (unaudited)
Name and year of birth | Position held and length of service* | Principal occupations during past five years or longer | Current other public company or investment company directorships | |||
| David F. Larcker (Born 1950) | Trustee, since 2009 | James Irvin Miller Professor of Accounting at the Graduate School of Business, Stanford University, Director of the Corporate Governance Research Initiative and Senior Faculty of The Rock Center for Corporate Governance since 2006. From 2005 to 2008, Professor of Accounting at the Graduate School of Business, Stanford University. Prior thereto, Ernst & Young Professor of Accounting at The Wharton School, University of Pennsylvania from 1985 to 2005. | N/A | |||
| Olivia S. Mitchell (Born 1953) | Trustee, since 2006; Nominating and Governance Committee Chair, since 2018 | International Foundation of Employee Benefit Plans Professor, Wharton School of the University of Pennsylvania since 1993. Director of Wharton’s Pension Research Council and Boettner Center on Pensions & Retirement Research, and Research Associate at the National Bureau of Economic Research. Previously, Cornell University Professor from 1978 to 1993. | N/A | |||
| Timothy J. Penny (Born 1951) | Trustee, since 1996; Chairman, since 2018 | President and Chief Executive Officer of Southern Minnesota Initiative Foundation, a non-profit organization, since 2007. Member of the Board of Trustees of NorthStar Education Finance, Inc., a non-profit organization, since 2007. | N/A | |||
| James G. Polisson (Born 1959) | Trustee, since 2018 | Retired. Chief Marketing Officer, Source (ETF) UK Services, Ltd, from 2015 to 2017. From 2012 to 2015, Principal of The Polisson Group, LLC, a management consulting, corporate advisory and principal investing company. Chief Executive Officer and Managing Director at Russell Investments, Global Exchange Traded Funds from 2010 to 2012. Managing Director of Barclays Global Investors from 1998 to 2010 and Global Chief Marketing Officer for iShares and Barclays Global Investors from 2000 to 2010. Trustee of the San Francisco Mechanics’ Institute, a non-profit organization, from 2013 to 2015. Board member of the Russell Exchange Traded Fund Trust from 2011 to 2012. Director of Barclays Global Investors Holdings Deutschland GmbH from 2006 to 2009. Mr. Polisson is an attorney and has a retired status with the Massachusetts and District of Columbia Bar Associations. | N/A | |||
| Pamela Wheelock (Born 1959) | Trustee, since January 2020; previously Trustee from January 2018 to July 2019 | Board member of the Destination Medical Center Economic Development Agency, Rochester, Minnesota since 2019 and Interim President of the McKnight Foundation since 2020. Acting Commissioner, Minnesota Department of Human Services, July 2019 through September 2019. Human Services Manager (part-time), Minnesota Department of Human Services, October 2019 through December 2019. Chief Operating Officer, Twin Cities Habitat for Humanity from 2017 to 2019. Vice President of University Services, University of Minnesota from 2012 to 2016. Prior thereto, on the Board of Directors, Governance Committee and Finance Committee for the Minnesota Philanthropy Partners (Saint Paul Foundation) from 2012 to 2018, Interim Chief Executive Officer of Blue Cross Blue Shield of Minnesota from 2011 to 2012, Chairman of the Board from 2009 to 2012 and Board Director from 2003 to 2015. Vice President, Leadership and Community Engagement, Bush Foundation, Saint Paul, Minnesota (a private foundation) from 2009 to 2011. Executive Vice President and Chief Financial Officer, Minnesota Sports and Entertainment from 2004 to 2009 and Senior Vice President from 2002 to 2004. Executive Vice President of the Minnesota Wild Foundation from 2004 to 2008. Commissioner of Finance, State of Minnesota, from 1999 to 2002. Currently Board Chair of the Minnesota Wild Foundation since 2010. | N/A | |||
| * | Length of service dates reflect the Trustee’s commencement of service with the Trust’s predecessor entities, where applicable. |
56 | Wells Fargo Short-Term Municipal Bond Fund
Other information (unaudited)
Officers
| Name and year of birth | Position held and length of service | Principal occupations during past five years or longer | ||
Andrew Owen (Born 1960) | President, since 2017 | Executive Vice President of Wells Fargo & Company and Head of Affiliated Managers, Wells Fargo Asset Management, since 2014. In addition, Mr. Owen is currently President, Chief Executive Officer and Director of Wells Fargo Funds Management, LLC since 2017. Prior thereto, Executive Vice President responsible for marketing, investments and product development for Wells Fargo Funds Management, LLC, from 2009 to 2014. | ||
Nancy Wiser1 (Born 1967) | Treasurer, since 2012 | Executive Vice President of Wells Fargo Funds Management, LLC since 2011. Chief Operating Officer and Chief Compliance Officer at LightBox Capital Management LLC, from 2008 to 2011. | ||
Michelle Rhee (Born 1966) | Chief Legal Officer, since 2019 | Secretary of Wells Fargo Funds Management, LLC, Chief Legal Counsel of Wells Fargo Asset Management and Assistant General Counsel of Wells Fargo Bank, N.A. since 2018. Associate General Counsel and Managing Director of Bank of America Corporation from 2004 to 2018. | ||
Catherine Kennedy (Born 1969) | Secretary, since 2019 | Vice President of Wells Fargo Funds Management, LLC and Senior Counsel of the Wells Fargo Legal Department since 2010. Vice President and Senior Counsel of Evergreen Investment Management Company, LLC from 1998 to 2010. | ||
Michael H. Whitaker (Born 1967) | Chief Compliance Officer, since 2016 | Chief Compliance Officer of Wells Fargo Asset Management since 2016. Senior Vice President and Chief Compliance Officer for Fidelity Investments from 2007 to 2016. | ||
David Berardi (Born 1975) | Assistant Treasurer, since 2009 | Vice President of Wells Fargo Funds Management, LLC since 2009. Vice President of Evergreen Investment Management Company, LLC from 2008 to 2010. Manager of Fund Reporting and Control for Evergreen Investment Management Company, LLC from 2004 to 2010. | ||
Jeremy DePalma1 (Born 1974) | Assistant Treasurer, since 2009 | Senior Vice President of Wells Fargo Funds Management, LLC since 2009. Senior Vice President of Evergreen Investment Management Company, LLC from 2008 to 2010 and head of the Fund Reporting and Control Team within Fund Administration from 2005 to 2010. | ||
| 1 | Nancy Wiser acts as Treasurer of 65 funds in the Fund Complex. Jeremy DePalma acts as the Treasurer of 82 funds and Assistant Treasurer of 65 funds in the Fund Complex. |
| 2 | The Statement of Additional Information includes additional information about the Trustees and is available, without charge, upon request, by calling 1-800-222-8222 or by visiting the website at wfam.com. |
Wells Fargo Short-Term Municipal Bond Fund | 57
Other information (unaudited)
BOARD CONSIDERATION OF INVESTMENT MANAGEMENT AND SUB-ADVISORY AGREEMENTS:
Wells Fargo Short-Term Municipal Bond Fund
Under the Investment Company Act of 1940 (the “1940 Act”), the Board of Trustees (the “Board”) of Wells Fargo Funds Trust (the “Trust”) must determine annually whether to approve the continuation of the Trust’s investment management and sub-advisory agreements. In this regard, at a Board meeting held on May 26, 2020 and May 28, 2020 (together, the “Meeting”), the Board, all the members of which have no direct or indirect interest in the investment management and sub-advisory agreements and are not “interested persons” of the Trust, as defined in the 1940 Act (the “Independent Trustees”), reviewed and approved for Wells Fargo Short-Term Municipal Bond Fund (the “Fund”): (i) an investment management agreement (the “Management Agreement”) with Wells Fargo Funds Management, LLC (“Funds Management”); and (ii) an investment sub-advisory agreement (the “Sub-Advisory Agreement”) with Wells Capital Management Incorporated (the “Sub-Adviser”), an affiliate of Funds Management. The Management Agreement and the Sub-Advisory Agreement are collectively referred to as the “Advisory Agreements.”
At the Meeting, the Board considered the factors and reached the conclusions described below relating to the selection of Funds Management and the Sub-Adviser and the approval of the Advisory Agreements. Prior to the Meeting, including at a Board meeting held in April 2020, the Trustees conferred extensively among themselves and with representatives of Funds Management about these matters. Also, the Board has adopted a team-based approach, with each team consisting of a sub-set of Trustees, to assist the full Board in the discharge of its duties in reviewing investment performance and other matters throughout the year. The Independent Trustees were assisted in their evaluation of the Advisory Agreements by independent legal counsel, from whom they received separate legal advice and with whom they met separately.
In providing information to the Board, Funds Management and the Sub-Adviser were guided by a detailed set of requests for information submitted to them by independent legal counsel on behalf of the Independent Trustees at the start of the Board’s annual contract renewal process earlier in 2020. In considering and approving the Advisory Agreements, the Trustees considered the information they believed relevant, including but not limited to the information discussed below. The Board considered not only the specific information presented in connection with the Meeting, but also the knowledge gained over time through interaction with Funds Management and the Sub-Adviser about various topics. In this regard, the Board reviewed reports of Funds Management at each of its quarterly meetings, which included, among other things, portfolio reviews and investment performance reports. In addition, the Board and the teams mentioned above confer with portfolio managers at various times throughout the year. The Board did not identify any particular information or consideration that was all-important or controlling, and each individual Trustee may have attributed different weights to various factors.
After its deliberations, the Board unanimously approved the continuation of the Advisory Agreements for a one-year term and determined that the compensation payable to Funds Management and the Sub-Adviser under each of the Advisory Agreements was reasonable. The Board considered the approval of the Advisory Agreements for the Fund as part of its consideration of agreements for funds across the complex, but its approvals were made on a fund-by-fund basis. The following summarizes a number of important, but not necessarily all, factors considered by the Board in support of its approvals.
Nature, extent and quality of services
The Board received and considered various information regarding the nature, extent and quality of services provided to the Fund by Funds Management and the Sub-Adviser under the Advisory Agreements. This information included a description of the investment advisory services and Fund-level administrative services covered by the Management Agreement, as well as, among other things, a summary of the background and experience of senior management of Wells Fargo Asset Management (“WFAM”), of which Funds Management and the Sub-Adviser are a part, and a summary of investments made in the business of WFAM. The Board also received a description of Funds Management’s and the Sub-Adviser’s business continuity plans and of their approaches to data privacy and cybersecurity, and related testing. The Board also received and reviewed information about Funds Management’s role as administrator of the Fund’s liquidity risk management program, Funds Management’s approach to risk management, and Funds Management’s intermediary and vendor oversight program.
The Board also considered the qualifications, background, tenure and responsibilities of each of the portfolio managers primarily responsible for the day-to-day portfolio management of the Fund. The Board evaluated the ability of Funds Management and the Sub-Adviser to attract and retain qualified investment professionals, including research, advisory and supervisory personnel. The Board further considered the compliance programs and compliance records of Funds Management and the Sub-Adviser. In addition, the Board took into account the full range of services provided to the Fund by Funds Management and its affiliates.
58 | Wells Fargo Short-Term Municipal Bond Fund
Other information (unaudited)
Fund investment performance and expenses
The Board considered the investment performance results for the Fund over various time periods ended December 31, 2019. The Board also considered more current results for various time periods ended March 31, 2020. The Board considered these results in comparison to the investment performance of funds in a universe that was determined by Broadridge Inc. (“Broadridge”) to be similar to the Fund (the “Universe”), and in comparison to the Fund’s benchmark index and to other comparative data. Broadridge is an independent provider of investment company data. The Board received a description of the methodology used by Broadridge to select the mutual funds in the performance Universe. The Board noted that the investment performance of the Fund (Class A) was higher than or in range of the average investment performance of the Universe for the one-, three-, five- and ten-year periods ended December 31, 2019. The Board also noted that the investment performance of the Fund (Administrator Class) was higher than the average investment performance of the Universe for the three-, five- and ten-year periods ended March 31, 2020, and lower than the average investment performance of the Universe for the one-year period ended March 31, 2020. The Board also noted that the investment performance of the Fund was higher than or in range of its benchmark index, the Bloomberg Barclays 1-3 Year Composite Municipal Bond Index, for the three- and ten-year periods ended December 31, 2019, and lower than its benchmark index for the one- and five-year periods ended December 31, 2019. The Board also noted that the investment performance of the Fund was higher than or in range of its benchmark index, the Bloomberg Barclays 1-3 Year Composite Municipal Bond Index, for the three- and ten-year periods ended March 31, 2020, and lower than its benchmark index for the one- and five-year periods ended March 31, 2020.
The Board also received and considered information regarding the Fund’s net operating expense ratios and their various components, including actual management fees, custodian and other non-management fees, and Rule 12b-1 and non-Rule 12b-1 shareholder service fees. The Board considered these ratios in comparison to the median ratios of funds in class-specific expense groups that were determined by Broadridge to be similar to the Fund (the “Groups”). The Board received a description of the methodology used by Broadridge to select the mutual funds in the expense Groups and an explanation of how funds comprising expense groups and their expense ratios may vary from year-to-year. Based on the Broadridge reports, the Board noted that the net operating expense ratios of the Fund were lower than the median net operating expense ratios of the expense Groups for each share class.
The Board took into account the Fund’s investment performance and expense information provided to it among the factors considered in deciding to re-approve the Advisory Agreements.
Investment management and sub-advisory fee rates
The Board reviewed and considered the contractual fee rates payable by the Fund to Funds Management under the Management Agreement, as well as the contractual fee rates payable by the Fund to Funds Management for class-level administrative services under a Class-Level Administration Agreement, which include, among other things, class-level transfer agency and sub-transfer agency costs (collectively, the “Management Rates”). The Board also reviewed and considered the contractual investment sub-advisory fee rates that are payable by Funds Management to the Sub-Adviser for investment sub-advisory services.
Among other information reviewed by the Board was a comparison of the Fund’s Management Rates with the average contractual investment management fee rates of funds in the expense Groups at a common asset level as well as transfer agency costs of the funds in the expense Groups. The Board noted that the Management Rates of the Fund were lower than, in range of or equal to the sum of these average rates for the Fund’s expense Groups for all share classes.
The Board also received and considered information about the portion of the total management fee that was retained by Funds Management after payment of the fee to the Sub-Adviser for sub-advisory services. In assessing the reasonableness of this amount, the Board received and evaluated information about the nature and extent of responsibilities retained and risks assumed by Funds Management and not delegated to or assumed by the Sub-Adviser, and about Funds Management’s on-going oversight services. Given the affiliation between Funds Management and the Sub-Adviser, the Board ascribed limited relevance to the allocation of fees between them.
The Board also received and considered information about the nature and extent of services offered and fee rates charged by Funds Management and the Sub-Adviser to other types of clients with investment strategies similar to those of the Fund. In this regard, the Board received information about the significantly greater scope of services, and compliance, reporting and other legal burdens and risks of managing proprietary mutual funds compared with those associated with managing assets of other types of clients, including third-party sub-advised fund clients and non-mutual fund clients such as institutional separate accounts.
Based on its consideration of the factors and information it deemed relevant, including those described here, the Board determined that the compensation payable to Funds Management under the Management Agreement and to the Sub-Adviser under the Sub-Advisory Agreement was reasonable.
Wells Fargo Short-Term Municipal Bond Fund | 59
Other information (unaudited)
Profitability
The Board received and considered information concerning the profitability of Funds Management, as well as the profitability of both WFAM and Wells Fargo & Co. (“Wells Fargo”) from providing services to the fund family as a whole. The Board noted that the Sub-Adviser’s profitability information with respect to providing services to the Fund and other funds in the family was subsumed in the WFAM and Wells Fargo profitability analysis.
Funds Management reported on the methodologies and estimates used in calculating profitability, including a description of the methodology used to allocate certain expenses. Among other things, the Board noted that the levels of profitability reported on a fund-by-fund basis varied widely, depending on factors such as the size, type and age of fund.
Based on its review, the Board did not deem the profits reported by Funds Management, WFAM or Wells Fargo from services provided to the Fund to be at a level that would prevent it from approving the continuation of the Advisory Agreements.
Economies of scale
The Board received and considered information about the potential for Funds Management to experience economies of scale in the provision of management services to the Fund, the difficulties of calculating economies of scale at an individual fund level, and the extent to which potential scale benefits are shared with shareholders. The Board noted the existence of breakpoints in the Fund’s management fee structure, which operate generally to reduce the Fund’s expense ratios as the Fund grows in size, and the size of the Fund in relation to such breakpoints. The Board considered that in addition to management fee breakpoints, Funds Management shares potential economies of scale from its management business in a variety of ways, including through fee waiver and expense reimbursement arrangements, services that benefit shareholders, competitive management fee rates set at the outset without regard to breakpoints, and investments in the business intended to enhance services available to shareholders.
The Board concluded that Funds Management’s arrangements with respect to the Fund, including contractual breakpoints, constituted a reasonable approach to sharing potential economies of scale with the Fund and its shareholders.
Other benefits to Funds Management and the Sub-Adviser
The Board received and considered information regarding potential “fall-out” or ancillary benefits received by Funds Management and its affiliates, including the Sub-Adviser, as a result of their relationships with the Fund. Ancillary benefits could include, among others, benefits directly attributable to other relationships with the Fund and benefits potentially derived from an increase in Funds Management’s and the Sub-Adviser’s business as a result of their relationships with the Fund. The Board noted that various affiliates of Funds Management may receive distribution-related fees, shareholder servicing payments and sub-transfer agency fees in respect of shares sold or held through them and services provided.
The Board also reviewed information about soft dollar credits earned and utilized by the Sub-Adviser, fees earned by Funds Management and the Sub-Adviser from managing a private investment vehicle for the fund family’s securities lending collateral, and commissions earned by an affiliated broker from portfolio transactions.
Based on its consideration of the factors and information it deemed relevant, including those described here, the Board did not find that any ancillary benefits received by Funds Management and its affiliates, including the Sub-Adviser, were unreasonable.
Conclusion
At the Meeting, after considering the above-described factors and based on its deliberations and its evaluation of the information described above, the Board unanimously approved the continuation of the Advisory Agreements for a one-year term and determined that the compensation payable to Funds Management and the Sub-Adviser under each of the Advisory Agreements was reasonable.
60 | Wells Fargo Short-Term Municipal Bond Fund
Other information (unaudited)
LIQUIDITY RISK MANAGEMENT PROGRAM
In accordance with Rule 22e-4 under the Investment Company Act of 1940, as amended (the “Liquidity Rule”), Wells Fargo Funds Trust (the “Trust”) has adopted and implemented a liquidity risk management program (the “Program”) on behalf of each of its series, including the Fund, which is reasonably designed to assess and manage the Fund’s liquidity risk. “Liquidity risk” is defined as the risk that the Fund is unable to meet redemption requests without significantly diluting remaining investors’ interests in the Fund. The Trust’s Board of Trustees (the “Board”) previously approved the designation of Wells Fargo Funds Management, LLC (“Funds Management”), the Fund’s investment manager, as the administrator of the Program, and Funds Management has established a Liquidity Risk Management Council composed of personnel from multiple departments within Funds Management and its affiliates to assist Funds Management in the implementation and on-going administration of the Program.
The Program is comprised of various components designed to support the assessment and/or management of liquidity risk, including: (1) the periodic assessment (no less frequently than annually) of certain factors that influence the Fund’s liquidity risk; (2) the periodic classification (no less frequently than monthly) of the Fund’s investments into one of four liquidity categories that reflect an estimate of their liquidity under current market conditions; (3) a 15% limit on the acquisition of “illiquid investments” (as defined under the Liquidity Rule); (4) to the extent the Fund does not invest primarily in “highly liquid investments” (as defined under the Liquidity Rule), the determination of a minimum percentage of the Fund’s assets that generally will be invested in highly liquid investments (an “HLIM”); (5) if the Fund has established an HLIM, the periodic review (no less frequently than annually) of the HLIM and the adoption of policies and procedures for responding to a shortfall of the Fund’s “highly liquid investments” below its HLIM; and (6) periodic reporting to the Board.
At a meeting of the Board held on May 26 and 28, 2020, the Board received a written report (the “Report”) from Funds Management that addressed the operation of the Program and assessed its adequacy and effectiveness of implementation. The Report covered the initial period from December 1, 2018 through December 31, 2019 (the “Reporting Period”). No significant liquidity events impacting the Fund were noted in the Report. There were no material changes to the Program during the Reporting Period. The Report concluded that the Program is operating effectively to assess and manage the Fund’s liquidity risk, and that the Program has been and continues to be adequately and effectively implemented to monitor and, as applicable, respond to the Fund’s liquidity developments.
There can be no assurance that the Program will achieve its objectives under all circumstances in the future. Please refer to the Fund’s prospectus for more information regarding the Fund’s exposure to liquidity risk and other risks to which an investment in the Fund may be subject.
Wells Fargo Short-Term Municipal Bond Fund | 61
Effective on or after May 1, 2020, clients of Edward Jones (also referred to as “shareholders”) purchasing Fund shares on the Edward Jones commission and fee-based platforms are eligible only for the following sales charge discounts (also referred to as “breakpoints”) and waivers, which can differ from breakpoints and waivers described elsewhere in the Fund’s Prospectus or SAI or through another broker-dealer. In all instances, it is the shareholder’s responsibility to inform Edward Jones at the time of purchase of any relationship, holdings of Wells Fargo Funds or other facts qualifying the purchaser for breakpoints or waivers. Edward Jones can ask for documentation of such circumstance.
| Breakpoints available at Edward Jones |
| Rights of Accumulation (ROA) |
The applicable sales charge on a purchase of Class A shares is determined by taking into account all share classes (except any money market funds and retirement plan share classes) of Wells Fargo Funds held by the shareholder or in an account grouped by Edward Jones with other accounts for the purpose of providing certain pricing considerations (“pricing groups”). This includes all share classes held on the Edward Jones platform and/or held on another platform. The inclusion of eligible fund family assets in the rights of accumulation calculation is dependent on the shareholder notifying his or her financial advisor of such assets at the time of calculation. |
ROA is determined by calculating the higher of cost or market value (current shares x NAV). |
| Letter of Intent (LOI) |
Through a LOI, shareholders can receive the sales charge and breakpoint discounts for purchases shareholders intend to makeover a 13-month period from the date Edward Jones receives the LOI. The LOI is determined by calculating the higher of cost or market value of qualifying holdings at LOI initiation in combination with the value that the shareholder intends to buy over a 13-month period to calculate the front-end sales charge and any breakpoint discounts. Each purchase the shareholder makes during that 13-month period will receive the sales charge and breakpoint discount that applies to the total amount. The inclusion of eligible fund family assets in the LOI calculation is dependent on the shareholder notifying his or her financial advisor of such assets at the time of calculation. Purchases made before the LOI is received by Edward Jones are not covered under the LOI and will not reduce the sales charge previously paid. Sales charges will be adjusted if LOI is not met. |
| Sales charges are waived for the following shareholders and in the following situations at Edward Jones: |
● Associates of Edward Jones and its affiliates and their family members who are in the same pricing group (as determined by Edward Jones under its policies and procedures) as the associate. This waiver will continue for the remainder of the associate’s life if the associate retires from Edward Jones in good-standing. |
● Shares purchased in an Edward Jones fee-based program. |
● Shares purchased through reinvestment of capital gains distributions and dividend reinvestment. |
● Shares purchased from the proceeds of redeemed shares of the same fund family so long as the following conditions are met: 1)the proceeds are from the sale of shares within 60 days of the purchase, and 2) the sale and purchase are made in the same share class and the same account or the purchase is made in an individual retirement account with proceeds from liquidations in anon-retirement account. |
● Shares exchanged into Class A shares from another share class so long as the exchange is into the same fund and was initiated at the discretion of Edward Jones. Edward Jones is responsible for any remaining CDSC due to the fund company, if applicable. Any future purchases are subject to the applicable sales charge as disclosed in the prospectus. |
● Exchanges from Class C shares to Class A shares of the same fund, generally, in the 84th month following the anniversary of the purchase date or earlier at the discretion of Edward Jones. |
| If the shareholder purchases shares that are subject to a CDSC and those shares are redeemed before the CDSC is expired, the shareholder is responsible to pay the CDSC except in the following conditions available at Edward Jones: |
● The death or disability of the shareholder. |
● Systematic withdrawals with up to 10% per year of the account value. |
● Return of excess contributions from an Individual Retirement Account (IRA). |
● Shares sold as part of a required minimum distribution for IRA and retirement accounts if the redemption is taken in or after the year the shareholder reaches qualified age based on applicable IRS regulation. |
● Shares sold to pay Edward Jones fees or costs in such cases where the transaction is initiated by Edward Jones. |
● Shares exchanged in an Edward Jones fee-based program. |
● Shares acquired through NAV reinstatement. |
62 | Wells Fargo Short-Term Municipal Bond Fund
Appendix I (unaudited)
| Other Important Information for accounts at Edward Jones: |
| Minimum Purchase Amounts |
● $250 initial purchase minimum |
● $50 subsequent purchase minimum |
| Minimum Balances |
| Edward Jones has the right to redeem at its discretion fund holdings with a balance of $250 or less. The following are examples of accounts that are not included in this policy: |
● A fee-based account held on an Edward Jones platform |
● A 529 account held on an Edward Jones platform |
● An account with an active systematic investment plan or letter of intent (LOI) |
| Changing Share Classes |
| At any time it deems necessary, Edward Jones has the authority to exchange at NAV a shareholder’s holdings in a fund to Class A shares. |
Wells Fargo Short-Term Municipal Bond Fund | 63
Effective June 1, 2020, shareholders purchasing Fund shares through an Oppenheimer & Co. Inc. (“Oppenheimer”) platform or account are eligible only for the following load waivers (front-end sales charge waivers and contingent deferred or back-end, sales charge waivers) and discounts, which may differ from those disclosed in the Fund’s Prospectus or SAI.
| Front-end Sales Load Waivers on Class A Shares available at Oppenheimer |
| Employer-sponsored retirement, deferred compensation and employee benefit plans (including health savings accounts) and trusts used to fund those plans, provided that the shares are not held in a commission-based brokerage account and shares are held for the benefit of the plan. |
| Shares purchased by or through a 529 Plan. |
| Shares purchased through an Oppenheimer affiliated investment advisory program. |
| Shares purchased through reinvestment of capital gains distributions and dividend reinvestment when purchasing shares of the same fund (but not any other fund within the fund family). |
| Shares purchased from the proceeds of redemptions within the same fund family, provided (1) the repurchase occurs within 90 days following the redemption, (2) the redemption and purchase occur in the same account, and (3) redeemed shares were subject to a front-end or deferred sales load (known as Rights of Restatement). |
| A shareholder in the Fund’s Class C shares will have their shares exchanged at net asset value to Class A shares (or the appropriate share class) of the Fund if the shares are no longer subject to a CDSC and the exchange is in line with the policies and procedures of Oppenheimer. |
| Employees and registered representatives of Oppenheimer or its affiliates and their family members. |
| Directors or Trustees of the Fund, and employees of the Fund’s investment adviser or any of its affiliates, as described in the Prospectus. |
| CDSC Waivers on A and C Shares available at Oppenheimer |
| Death or disability of the shareholder. |
| Shares sold as part of a systematic withdrawal plan as described in the Prospectus. |
| Return of excess contributions from an IRA Account. |
| Shares sold as part of a required minimum distribution for IRA and retirement accounts due to the shareholder reaching the qualified age based on applicable IRS regulations as described in the Prospectus. |
| Shares sold to pay Oppenheimer fees but only if the transaction is initiated by Oppenheimer. |
| Shares acquired through a right of reinstatement. |
| Front-end load Discounts Available at Oppenheimer: Breakpoints, Rights of Accumulation & Letters of Intent |
| Breakpoints as described in the Prospectus. |
| Rights of Accumulation (ROA), which entitle shareholders to breakpoint discounts, will be automatically calculated based on the aggregated holding of fund family assets held by accounts within the purchaser’s household at Oppenheimer. Eligible fund family assets not held at Oppenheimer may be included in the ROA calculation only if the shareholder notifies his or her financial advisor about such assets. |
64 | Wells Fargo Short-Term Municipal Bond Fund
Effective June 15, 2020, shareholders purchasing fund shares through a Robert W. Baird & Co. (“Baird”) platform or account will only be eligible for the following sales charge waivers (front-end sales charge waivers and CDSC waivers) and discounts, which may differ from those disclosed elsewhere in the Fund’s Prospectus or the SAI.
| Front-end Sales Load Waivers on Class A Shares available at Baird |
| Shares purchased through reinvestment of capital gains distributions and dividend reinvestment when purchasing share of the same fund. |
| Share purchase by employees and registers representatives of Baird or its affiliate and their family members as designated by Baird. |
| Shares purchase from the proceeds of redemptions within the same fund family, provided (1) the repurchase occurs within 90 days following the redemption, (2) the redemption and purchase occur in the same accounts, and (3) redeemed shares were subject to a front-end or deferred sales charge (known as rights of reinstatement). |
| A shareholder in the Funds Investor C Shares will have their share exchanged at net asset value to Investor A shares of the fund if the shares are no longer subject to CDSC and the exchange is in line with the policies and procedures of Baird. |
| Employer-sponsored retirement plans or charitable accounts in a transactional brokerage account at Baird, including 401(k)plans, 457 plans, employer-sponsored 403(b) plans, profit sharing and money purchase pension plans and defined benefit plans. For purposes of this provision, employer-sponsored retirement plans do not include SEP IRAs, Simple IRAs or SAR-SEPs. |
| CDSC Waivers on A and C Shares available at Baird |
| Shares sold due to death or disability of the shareholder. |
| Shares sold as part of a systematic withdrawal plan as described in the Fund’s Prospectus. |
| Shares bought due to returns of excess contributions from an IRA Account. |
| Shares sold as part of a required minimum distribution for IRA and retirement accounts due to the shareholder reaching age 72as described in the Fund’s Prospectus. |
| Shares sold to pay Baird fees but only if the transaction is initiated by Baird. |
| Shares acquired through a right of reinstatement. |
| Front-end load Discounts Available at Baird: Breakpoint and/or Rights of Accumulation |
| Breakpoints as described in the Prospectus. |
| Rights of accumulations which entitles shareholders to breakpoint discounts will be automatically calculated based on the aggregated holding of fund family assets held by accounts within the purchaser’s household at Baird. Eligible fund family assets not held at Baird may be included in the rights of accumulations calculation only if the shareholder notifies his or her financial advisor about such assets. |
| Letters of Intent (LOI) allow for breakpoint discounts based on anticipated purchases within a fund family through Baird, over a13-month period of time. |
Wells Fargo Short-Term Municipal Bond Fund | 65
This page is intentionally left blank.
This page is intentionally left blank.
This page is intentionally left blank.
For more information
More information about Wells Fargo Funds is available free upon request. To obtain literature, please write, visit the Fund’s website, or call:
Wells Fargo Funds
P.O. Box 219967
Kansas City, MO 64121-9967
Website: wfam.com
Individual investors: 1-800-222-8222
Retail investment professionals: 1-888-877-9275
Institutional investment professionals: 1-866-765-0778

This report and the financial statements contained herein are submitted for the general information of the shareholders of the Fund. If this report is used for promotional purposes, distribution of the report must be accompanied or preceded by a current prospectus. Before investing, please consider the investment objectives, risks, charges, and expenses of the investment. For a current prospectus and, if available, a summary prospectus, containing this information, call 1-800-222-8222 or visit the Fund’s website at wfam.com. Read the prospectus carefully before you invest or send money.
Wells Fargo Asset Management (WFAM) is the trade name for certain investment advisory/management firms owned by Wells Fargo & Company. These firms include but are not limited to Wells Capital Management Incorporated and Wells Fargo Funds Management, LLC. Certain products managed by WFAM entities are distributed by Wells Fargo Funds Distributor, LLC (a broker-dealer and Member FINRA).
This material is for general informational and educational purposes only and is NOT intended to provide investment advice or a recommendation of any kind—including a recommendation for any specific investment, strategy, or plan.
INVESTMENT PRODUCTS: NOT FDIC INSURED ◾ NO BANK GUARANTEE ◾ MAY LOSE VALUE
© 2020 Wells Fargo & Company. All rights reserved.
PAR-0720-00248 08-20
A256/AR256 06-20

Annual Report
June 30, 2020
Wells Fargo
Ultra Short-Term Municipal Income Fund
Beginning on January 1, 2021, as permitted by new regulations adopted by the Securities and Exchange Commission, paper copies of the Wells Fargo Funds’ annual and semi-annual shareholder reports issued after this date will no longer be sent by mail, unless you specifically request paper copies of the reports. Instead, the reports will be made available on the Funds’ website, and you will be notified by mail each time a report is posted and provided with a website address to access the report.
If you already elected to receive shareholder reports electronically, you will not be affected by this change and you need not take any action. You may elect to receive shareholder reports and other communications from the Fund electronically at any time by contacting your financial intermediary (such as a broker-dealer or bank) or, if you are a direct investor, by calling 1-800-222-8222 or by enrolling at wellsfargo.com/advantagedelivery.
You may elect to receive all future reports in paper free of charge. If you invest through a financial intermediary, you can contact your financial intermediary to request that you continue to receive paper copies of your shareholder reports; if you invest directly with the Fund, you can call 1-800-222-8222. Your election to receive reports in paper will apply to all Wells Fargo Funds held in your account with your financial intermediary or, if you are a direct investor, to all Wells Fargo Funds that you hold.
|
Reduce clutter. Save trees. |
Sign up for electronic delivery of prospectuses and shareholder reports at wellsfargo.com/ |
The views expressed and any forward-looking statements are as of June 30, 2020, unless otherwise noted, and are those of the Fund managers and/or Wells Fargo Asset Management. Discussions of individual securities, or the markets generally, or any Wells Fargo Fund are not intended as individual recommendations. Future events or results may vary significantly from those expressed in any forward-looking statements. The views expressed are subject to change at any time in response to changing circumstances in the market. Wells Fargo Asset Management and the Fund disclaim any obligation to publicly update or revise any views expressed or forward-looking statements.
INVESTMENT PRODUCTS: NOT FDIC INSURED ◾ NO BANK GUARANTEE ◾ MAY LOSE VALUE
Wells Fargo Ultra Short-Term Municipal Income Fund | 1
Letter to shareholders (unaudited)

Andrew Owen
President
Wells Fargo Funds
Dear Shareholder:
We are pleased to offer you this annual report for the Wells Fargo Ultra Short-Term Municipal Income Fund for the 12-month period that ended June 30, 2020. Global stock markets saw earlier gains erased in February and March as governments around the world took unprecedented measures to stop the spread of the coronavirus at the expense of short-term economic output. However, markets rebounded from April through June to offset much of the losses as central banks attempted to bolster capital markets and confidence. Fixed-income markets generally performed better, with most achieving gains. Overall U.S. markets surpassed their international peers, while U.S. large-cap equity, as measured by the Russell 1000® Index1, easily outperformed small caps, as measured by the Russell 2000® Index2, for the 12-month period.
For the 12-month period, fixed-income securities generally had positive total returns while non-U.S. equities had broad losses and U.S. stocks performed strongly despite sharp volatility since late February. For the period, U.S. stocks, based on the S&P 500 Index,3 gained 7.51%. International stocks, as measured by the MSCI ACWI ex USA Index (Net),4 returned -4.80%, while the MSCI EM Index (Net)5 performed slightly better, with a -3.39% return. For bond investors, the Bloomberg Barclays U.S. Aggregate Bond Index6 returned a robust 8.74%, the Bloomberg Barclays Global Aggregate ex-USD Index7 gained a modest 0.71%, and the Bloomberg Barclays Municipal Bond Index8 returned 4.45% while the ICE BofA U.S. High Yield Index9 lost 1.10%.
The fiscal year began on a positive note.
The 12-month period began with the U.S. equity market advancing to new highs in July 2019. U.S. President Donald Trump initially backed off of earlier tariff threats against Mexico and China. However, later in July, the U.S. reversed course and threatened to impose higher tariffs on China’s exports after talks failed. China responded with tariff threats of its own and devalued the renminbi, roiling global markets. Major U.S. stock market indices closed July with the worst weekly results of the year. Bond prices gained as Treasury yields fell to multiyear lows, and the yield curve inverted at multiple points along the 30-year arc, with shorter term yields higher than longer-term. At the end of July, the U.S. Federal Reserve (Fed) cut its federal funds rate by 0.25%.
In August, U.S.-China trade tensions continued with no signs of compromise. Evidence of a continued global economic slowdown mounted, and central banks in China, New Zealand, and Thailand cut interest rates. Industrial and manufacturing data declined in China, Canada, Japan, and Germany. Adding to global uncertainty, Italy’s prime minister resigned,
| 1 | The Russell 1000® Index measures the performance of the 1,000 largest companies in the Russell 3000® Index, which represents approximately 92% of the total market capitalization of the Russell 3000® Index. You cannot invest directly in an index. |
| 2 | The Russell 2000® Index measures the performance of the 2,000 smallest companies in the Russell 3000® Index, which represents approximately 8% of the total market capitalization of the Russell 3000® Index. You cannot invest directly in an index. |
| 3 | The S&P 500 Index consists of 500 stocks chosen for market size, liquidity, and industry group representation. It is a market-value-weighted index with each stock’s weight in the index proportionate to its market value. You cannot invest directly in an index. |
| 4 | The Morgan Stanley Capital International (MSCI) All Country World Index (ACWI) ex USA Index (Net) is a free-float-adjusted market-capitalization-weighted index that is designed to measure the equity market performance of developed and emerging markets, excluding the United States. Source: MSCI. MSCI makes no express or implied warranties or representations and shall have no liability whatsoever with respect to any MSCI data contained herein. The MSCI data may not be further redistributed or used as a basis for other indices or any securities or financial products. This report is not approved, reviewed, or produced by MSCI. You cannot invest directly in an index. |
| 5 | The MSCI Emerging Markets (EM) Index (Net) is a free-float-adjusted market-capitalization-weighted index that is designed to measure equity market performance of emerging markets. You cannot invest directly in an index. |
| 6 | The Bloomberg Barclays U.S. Aggregate Bond Index is a broad-based benchmark that measures the investment-grade, U.S. dollar-denominated, fixed-rate taxable bond market, including Treasuries, government-related and corporate securities, mortgage-backed securities (agency fixed-rate and hybrid adjustable-rate mortgage pass-throughs), asset-backed securities, and commercial mortgage-backed securities. You cannot invest directly in an index. |
| 7 | The Bloomberg Barclays Global Aggregate ex-USD Index is an unmanaged index that provides a broad-based measure of the global investment-grade fixed-income markets excluding the U.S.-dollar-denominated debt market. You cannot invest directly in an index. |
| 8 | The Bloomberg Barclays Municipal Bond Index is an unmanaged index composed of long-term tax-exempt bonds with a minimum credit rating of Baa. You cannot invest directly in an index. |
| 9 | The ICE BofA U.S. High Yield Index is a market-capitalization-weighted index of domestic and Yankee high-yield bonds. The index tracks the performance of high-yield securities traded in the U.S. bond market. You cannot invest directly in an index. Copyright 2020. ICE Data Indices, LLC. All rights reserved. |
2 | Wells Fargo Ultra Short-Term Municipal Income Fund
Letter to shareholders (unaudited)
many feared a crackdown in Hong Kong as protestors sustained their calls for reform, and U.K. Prime Minister Boris Johnson planned to suspend Parliament as Brexit’s deadline neared.
In the U.S., the Fed cut interest rates a second time in September. U.S. manufacturing data disappointed investors. The U.S. Congress announced it would pursue an impeachment investigation of President Trump. Meanwhile, the Brexit impasse showed no signs of resolution. Officials in China said that hitting the country’s economic growth goals for the year would be difficult considering the weight of tariffs and trade restrictions. Although the S&P 500 Index finished the third quarter with the best year-to-date returns in more than 20 years, concerns about future returns remained.
The fourth quarter started on a strong note, with U.S.-China trade tensions relaxing in October along with renewed optimism for a U.K. Brexit deal and positive macroeconomic data. The initial estimate of U.S. third-quarter gross domestic product (GDP) growth was a resilient 1.9% annualized rate, while the U.S. unemployment rate fell to a 50-year low of 3.5% in September. However, despite resilience among U.S. consumers, business confidence declined while manufacturing activity contracted. Concerned with a potential economic slowdown, the Fed lowered interest rates another quarter point in late October—its third rate cut in four months. This helped push the S&P 500 Index to a new all-time high while emerging market equities rallied and global bonds declined overall, reflecting a broad pickup in risk appetite.
Equity markets continued to rally in November despite ongoing geopolitical risks. Hopes for a U.S.-China trade deal buoyed investor confidence. U.S. business sentiment improved slightly, and manufacturing and services activity picked up. While consumer confidence and purchasing manager activity rose in the eurozone, China reported weakening manufacturing and consumer data. Bond yields rose marginally, leading to slightly negative returns for global government and investment-grade corporate bonds.
Financial markets ended 2019 with a boost from the U.S. and China accord on a Phase One trade deal. That, along with the landslide win by the pro-Brexit U.K. Conservative Party in a national election and ongoing central bank support, gave investors greater confidence. U.S. economic indicators were generally positive, with the exception of manufacturing activity and business confidence. Consumer confidence was resilient, fed by a robust labor market, tame inflation, and lower interest rates, which boosted housing affordability and stimulated homebuyer activity. The impeachment of President Trump had little impact on markets. Meanwhile, slowing Chinese economic activity, partly attributable to the trade war, led to further government stimulus at year-end through lower reserve ratios, allowing banks to lend more money.
The year-end rally continued in early January 2020. However, capital market volatility picked up sharply in late January on concerns over the potential impact of the coronavirus on the global economy and stock markets. With sentiment somewhat souring, perceived safe havens did well in January. The U.S. dollar and Japanese yen both rose, and government bonds outperformed equities. While the S&P 500 Index held its ground, emerging market equities tumbled, including those in Asia.
In February, the coronavirus became the major market focus. Fears of the virus’s impact on global growth led to expectations of increased global central bank monetary policy support. That led the 10-year U.S. Treasury yield to fall to an all-time low of 1.1% by the end of the month. Although equity markets initially shrugged off concerns about the outbreak, focusing instead on strong fourth-quarter earnings and improving business confidence in January, market sentiment turned sharply lower toward month-end and the S&P 500 Index lost 8.2% for the month. Oil prices tumbled as Russia and the Organization of the Petroleum Exporting countries compounded a major decline in oil demand with a brutal price war, partly aimed at dissuading further U.S. shale production. As a result, the price of West Texas Intermediate crude oil fell 13% in February.
Wells Fargo Ultra Short-Term Municipal Income Fund | 3
Letter to shareholders (unaudited)
“The global spread of the coronavirus led country after country to clamp down on social and business-related activity in order to contain the virus from causing even greater devastation and overwhelming health care systems.”
“Despite ongoing economic weakness and high levels of uncertainty on the containment of the coronavirus and the timing of an effective vaccine, financial markets continued to post widely positive returns in June.”
The global spread of the coronavirus led country after country to clamp down on social and business-related activity in order to contain the virus from causing even greater devastation and overwhelming health care systems. This abrupt stoppage of economic activity led to the sharp deceleration of global output, sending economies into a deep contraction. Central bank responses were swift, as they slashed interest rates and expanded quantitative easing programs to restore liquidity and confidence to the markets. In the U.S., the Fed introduced several new lending programs, funding investment-grade bonds, money market mutual funds, and commercial paper while purchasing Treasuries, mortgage-backed securities, and overnight repurchase agreements. Meanwhile, stock markets tumbled quickly into a bear market, ending the longest bull stock market in U.S. history.
Markets rebounded strongly in April, with the S&P 500 Index gaining 12.8% for the month and the MSCI ACWI ex USA Index (Net) returning 7.6%. The rebound was fueled by unprecedented government and central bank stimulus measures taken to buffer the economic damage created by mass shutdowns enacted in order to contain the virus’s spread. The U.S. economy contracted by an annualized 5.0% pace in the first quarter, with 30 million new unemployment insurance claims in six weeks. In the eurozone, first-quarter real GDP shrank 3.8%, with the composite April Flash Purchasing Managers’ Index, a monthly survey of purchasing managers, falling to an all-time low of 13.5. The European Central Bank expanded its quantitative easing to include the purchase of additional government bonds of countries with the greatest virus-related need, including Italy and Spain. China’s first-quarter GDP fell by 6.8% year over year. However, retail sales, production, and investment showed signs of recovery. Extreme oil-price volatility continued as global supply far exceeded demand.
In May, the equity market rebound continued, with the S&P 500 Index climbing a further 4.8%. European and Japanese stock markets also had monthly gains. Investors regained confidence on reports of early signs of success in human trials of a coronavirus vaccine. Growth stocks continued to outperform value stocks while returns on global government bonds were generally flat. In the U.S., a gap grew between the stock market rebound and devastating economic data points, including an April unemployment rate of 14.7%, the highest level since World War II. Purchasing managers’ indices continued to reflect weakening activity in May in both the manufacturing and services sectors. U.S. corporate earnings reports indicated a 14% year-over-year contraction in earnings from the first quarter of 2019. However, high demand for technology, driven by remote activity, helped maintain robust information technology sector earnings, which helped drive powerful well-known technology stocks higher.
Despite ongoing economic weakness and high levels of uncertainty on the containment of the coronavirus and the timing of an effective vaccine, financial markets continued to post widely positive returns in June. As economies reopened, there were hopeful signs. U.S. retail sales rose 17% in May while retail sales in the U.K. rebounded by 12%. However, year over year, sales remained depressed. Vitally important to market sentiment was the ongoing commitment by central banks globally to do all they can to provide economic support through liquidity and low borrowing costs. U.S. economic activity was aided by one-time $1,200 stimulus checks and $600 bonus weekly unemployment benefits due to expire at the end of July. However, unemployment remained in the double digits, easing somewhat from 14.7% in April to 11.1% in June. At period-end, numerous states reported alarming increases of coronavirus cases. China’s economic recovery picked up momentum in June, though it remained far from a full recovery.
4 | Wells Fargo Ultra Short-Term Municipal Income Fund
Letter to shareholders (unaudited)
Don’t let short-term uncertainty derail long-term investment goals.
Periods of investment uncertainty can present challenges, but experience has taught us that maintaining long-term investment goals can be an effective way to plan for the future. To help you create a sound strategy based on your personal goals and risk tolerance, Wells Fargo Funds offers more than 100 mutual funds spanning a wide range of asset classes and investment styles. Although diversification cannot guarantee an investment profit or prevent losses, we believe it can be an effective way to manage investment risk and potentially smooth out overall portfolio performance. We encourage investors to know their investments and to understand that appropriate levels of risk-taking may unlock opportunities.
Thank you for choosing to invest with Wells Fargo Funds. We appreciate your confidence in us and remain committed to helping you meet your financial needs.
Sincerely,

Andrew Owen
President
Wells Fargo Funds
|
For further information about your Fund, contact your investment professional, visit our website at wfam.com, or call us directly at 1-800-222-8222. |
Notice to Shareholders
At a meeting held on August 10-12, 2020, the Board of Trustees of the Fund approved the following changes:
| ∎ | A change to the Fund’s automatic conversion feature for Class C shares in order to shorten the required holding period from 10 to 8 years. As a result, on a monthly basis beginning November 5, 2020, Class C shares will convert automatically into Class A shares 8 years after the initial date of purchase or, if you acquired your Class C shares through an exchange or conversion from another share class, 8 years after the date you acquired your Class C shares. When Class C shares that you acquired through a purchase or exchange convert, any other Class C shares that you purchased with reinvested dividends and distributions also will convert into Class A shares on a pro rata basis. |
Please note that a shorter holding period may apply depending on your intermediary. Please see “Appendix A—Sales Charge Reductions and Waivers for Certain Intermediaries” in the Fund’s prospectus for further information.
| ∎ | Changes to the Class A sales charge schedule for the Fund, effective with purchases made on or after September 21, 2020. |
NEW Class A Sales Charge Schedule effective September 21, 2020
Amount of Purchase | Front-end Sales Charge As % of Public Offering Price | Front-end Sales Charge As % of Net Amount Invested | Commission Paid to Intermediary As % of Public Offering Price | |||||||||
Less than $100,000 | 2.00 | % | 2.04 | % | 1.75 | % | ||||||
$100,000 but less than $250,000 | 1.00 | % | 1.01 | % | 0.85 | % | ||||||
$250,000 and over | 0.00 | %1 | 0.00 | % | 0.40 | %2 | ||||||
| 1 | If you redeem Class A shares purchased at or above the $250,000 breakpoint level within twelve months from the date of purchase, you will pay a CDSC of 0.40% of the NAV of the shares on the date of original purchase. Certain exceptions apply (see “CDSC Waivers” in the Fund’s Prospectus). For redemptions of Class A shares of the Fund purchased prior to August 1, 2018, the CDSC terms that were in place at the time of purchase will continue to apply. |
| 2 | The commission paid to an intermediary on purchases above the $250,000 breakpoint level includes an advance by Wells Fargo Funds Distributor of the first year’s shareholder servicing fee. |
Wells Fargo Ultra Short-Term Municipal Income Fund | 5
Performance highlights (unaudited)
Investment objective
The Fund seeks current income exempt from federal income tax, consistent with capital preservation.
Manager
Wells Fargo Funds Management, LLC
Subadviser
Wells Capital Management Incorporated
Portfolio managers
Bruce R. Johns
James Randazzo
Average annual total returns (%) as of June 30, 2020
| Including sales charge | Excluding sales charge | Expense ratios1 (%) | ||||||||||||||||||||||||||||||||
| Inception date | 1 year | 5 year | 10 year | 1 year | 5 year | 10 year | Gross | Net2 | ||||||||||||||||||||||||||
| Class A (SMAVX) | 10-2-2000 | -0.89 | 0.43 | 0.52 | 1.13 | 0.84 | 0.72 | 0.67 | 0.50 | |||||||||||||||||||||||||
| Class A2 (WFUNX)3 | 5-29-2020 | – | – | – | 1.12 | 0.84 | 0.72 | 0.77 | 0.50 | |||||||||||||||||||||||||
| Class C (WFUSX) | 3-31-2008 | -0.74 | 0.07 | -0.02 | 0.26 | 0.07 | -0.02 | 1.42 | 1.25 | |||||||||||||||||||||||||
| Class R6 (WUSRX)4 | 7-31-2018 | – | – | – | 1.47 | 1.16 | 1.03 | 0.29 | 0.20 | |||||||||||||||||||||||||
| Administrator Class (WUSMX)5 | 7-30-2010 | – | – | – | 1.19 | 0.91 | 0.79 | 0.61 | 0.50 | |||||||||||||||||||||||||
| Institutional Class (SMAIX) | 7-31-2000 | – | – | – | 1.42 | 1.14 | 1.02 | 0.34 | 0.25 | |||||||||||||||||||||||||
| Ultra Short-Term Municipal Income Blended Index6 | – | – | – | – | 1.61 | 1.13 | 0.78 | – | – | |||||||||||||||||||||||||
| Bloomberg Barclays 1-Year Municipal Bond Index7 | – | – | – | – | 2.16 | 1.42 | 1.14 | – | – | |||||||||||||||||||||||||
| iMoneyNet Tax-Free National Institutional Money Market Funds Average8 | – | – | – | – | 1.06 | 0.84 | 0.43 | – | – | |||||||||||||||||||||||||
Figures quoted represent past performance, which is no guarantee of future results, and do not reflect taxes that a shareholder may pay on an investment in a fund. Investment return and principal value of an investment will fluctuate so that an investor’s shares, when redeemed, may be worth more or less than their original cost. Performance shown without sales charges would be lower if sales charges were reflected. Current performance may be lower or higher than the performance data quoted, which assumes the reinvestment of dividends and capital gains. Current month-end performance is available on the Fund’s website, wfam.com.
Index returns do not include transaction costs associated with buying and selling securities, any mutual fund fees or expenses, or any taxes. It is not possible to invest directly in an index.
For Class A shares, the maximum front-end sales charge is 2.00%. For Class C shares, the maximum contingent deferred sales charge is 1.00%. Performance including a contingent deferred sales charge assumes the sales charge for the corresponding time period. Class A2, Class R6, Administrator Class, and Institutional Class shares are sold without a front-end sales charge or contingent deferred sales charge.
Bond values fluctuate in response to the financial condition of individual issuers, general market and economic conditions, and changes in interest rates. Changes in market conditions and government policies may lead to periods of heightened volatility in the bond market and reduced liquidity for certain bonds held by the Fund. In general, when interest rates rise, bond values fall and investors may lose principal value. Interest rate changes and their impact on the Fund and its share price can be sudden and unpredictable. The use of derivatives may reduce returns and/or increase volatility. Certain investment strategies tend to increase the total risk of an investment (relative to the broader market). The Fund is exposed to high-yield securities risk and municipal securities risk. Consult the Fund’s prospectus for additional information on these and other risks. A portion of the Fund’s income may be subject to federal, state, and/ or local income taxes or the Alternative Minimum Tax (AMT). Any capital gains distributions may be taxable.
Please see footnotes on page 7.
6 | Wells Fargo Ultra Short-Term Municipal Income Fund
Performance highlights (unaudited)
| Growth of $10,000 investment as of June 30, 20209 |
|
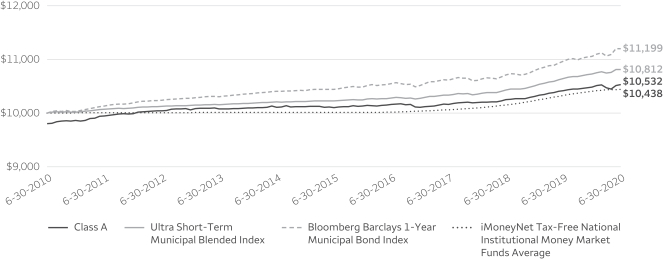
| 1 | Reflects the expense ratios as stated in the most recent prospectuses. The expense ratios shown are subject to change and may differ from the annualized expense ratios shown in the financial highlights of this report. |
| 2 | The manager has contractually committed through October 31, 2020 (October 31, 2021 for Class A2), to waive fees and/or reimburse expenses to the extent necessary to cap total annual fund operating expenses after fee waivers at 0.50% for Class A, 0.50% for Class A2, 1.25% for Class C, 0.20% for Class R6, 0.50% for Administrator Class, and 0.25% for Institutional Class. Brokerage commissions, stamp duty fees, interest, taxes, acquired fund fees and expenses (if any), and extraordinary expenses are excluded from the expense caps. Prior to or after the commitment expiration date, the caps may be increased or the commitment to maintain the caps may be terminated only with the approval of the Board of Trustees. Without these caps, the Fund’s returns would have been lower. The expense ratio paid by an investor is the net expense ratio (the total annual fund operating expenses after fee waivers) as stated in the prospectuses. |
| 3 | Historical performance shown for the Class A2 shares prior to their inception reflects the performance of Class A shares, and it is not adjusted to reflect the higher expenses applicable to the Class A shares. |
| 4 | Historical performance shown for the Class R6 shares prior to their inception reflects the performance of the Institutional Class shares, and includes the higher expenses applicable to the Institutional Class shares. If these expenses had not been included, returns for the Class R6 shares would be higher. |
| 5 | Historical performance shown for Administrator Class shares prior to their inception reflects the performance of Institutional Class shares, adjusted to reflect the higher expenses applicable to Administrator Class shares. |
| 6 | Source: Wells Fargo Funds Management LLC. The Ultra Short-Term Municipal Income Blended Index is composed 50% of the Bloomberg Barclays 1-Year Municipal Bond Index and 50% of the iMoneyNet Tax-Free National Institutional Money Market Funds Average. You cannot invest directly in an index. |
| 7 | The Bloomberg Barclays 1-Year Municipal Bond Index is the one-year component of the Bloomberg Barclays Municipal Bond Index, which is an unmanaged index composed of long-term tax-exempt bonds with a minimum credit rating of Baa. You cannot invest directly in an index. |
| 8 | iMoneyNet Tax-Free National Institutional Money Market Funds Average is the return of an unmanaged group of money market funds. You cannot invest directly in this average. |
| 9 | The chart compares the performance of Class A shares for the most recent ten years with the Ultra Short-Term Municipal Blended Index, Bloomberg Barclays 1-Year Municipal Bond Index, and the iMoneyNet Tax-Free National Institutional Money Markets Funds Average. The chart assumes a hypothetical $10,000 investment in Class A shares and reflects all operating expenses and assumes the maximum initial sales charge of 2.00%. |
| 10 | Amounts are calculated based on the long-term total investments of the Fund. These amounts are subject to change and may have changed since the date specified. |
| 11 | The credit quality distribution of portfolio holdings reflected in the chart is based on ratings from Standard & Poor’s, Moody’s Investors Service, and/or Fitch Ratings Ltd. Credit quality ratings apply to the underlying holdings of the Fund and not to the Fund itself. The percentages of the Fund’s portfolio with the ratings depicted in the chart are calculated based on the total market value of fixed income securities held by the Fund. If a security was rated by all three rating agencies, the middle rating was utilized. If rated by two of three rating agencies, the lower rating was utilized, and if rated by one of the rating agencies, that rating was utilized. Standard & Poor’s rates the creditworthiness of bonds, ranging from AAA (highest) to D (lowest). Ratings from A to CCC may be modified by the addition of a plus (+) or minus (-) sign to show relative standing within the rating categories. Standard & Poor’s rates the creditworthiness of short-term notes from SP-1 (highest) to SP-3 (lowest). Moody’s rates the creditworthiness of bonds, ranging from Aaa (highest) to C (lowest). Ratings Aa to B may be modified by the addition of a number 1 (highest) to 3 (lowest) to show relative standing within the ratings categories. Moody’s rates the creditworthiness of short-term U.S. tax-exempt municipal securities from MIG 1/VMIG 1 (highest) to SG (lowest). Fitch rates the creditworthiness of bonds, ranging from AAA (highest) to D (lowest). Credit quality distribution is subject to change and may have changed since the date specified. |
Wells Fargo Ultra Short-Term Municipal Income Fund | 7
Performance highlights (unaudited)
MANAGER’S DISCUSSION
Fund highlights
| ∎ | The Fund underperformed two of its three benchmarks, the Ultra Short-Term Municipal Income Blended Index and the Bloomberg Barclays 1-Year Municipal Bond Index, and (Class A, excluding sales charges) outperformed the iMoneyNet Tax-Free National Institutional Money Market Funds Average, for the 12-month period that ended June 30, 2020. |
| ∎ | The Fund’s overweight to BBB-rated bonds, which underperformed, and underweight to AAA-rated and AA-rated bonds, which outperformed, detracted from performance. |
| ∎ | Sector and security selection detracted from performance as we were overweight revenue bonds, which underperformed, and underweight general obligation (GO) bonds, which outperformed during the coronavirus pandemic. |
| ∎ | The Fund’s duration was shorter than the Bloomberg Barclays 1-Year Municipal Bond Index, and despite rates declining across the yield curve over the past year, our short duration contributed to performance as the bonds on the very short end outperformed. |
| ∎ | Yield-curve positioning contributed to performance over the period. This Fund will invest only in securities with a maturity of five years or shorter. We had a barbell strategy of being overweight bonds under one year, which underperformed, and overweight three- to five-year bonds, which outperformed; this strategy contributed to performance. |
| Effective maturity distribution as of June 30, 202010 |
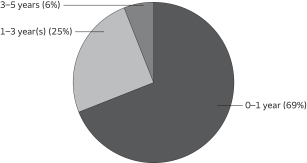 |
The coronavirus pandemic and the associated containment efforts became the dominant market influence over the 12-month period.
In 2019, market expectations moved the U.S. Federal Reserve (Fed) from a rate-hiking posture to multiple cuts in what was considered a “mid-cycle adjustment” at the time. Generally positive U.S. economic data was enough for most investors to expect continued slow growth and an extension of the economic expansion. Global trade tensions prompted a rise in market volatility, which subsided with the passage of a Phase One U.S.-China trade deal late in the year. President Trump was formally impeached and ultimately acquitted by the U.S. Senate. By March, the coronavirus pandemic brought an end to the longest bull market on record.
| Credit quality as of June 30, 202011 |
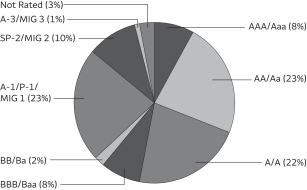 |
The municipal bond market was heavily influenced by technical factors throughout the reporting period. Municipal mutual funds saw 61 straight weeks of net inflows, which pushed yields across ratings categories to all-time lows by late February. Low yields and ample demand drove municipal issuance higher but also altered the mix. Taxable municipal bonds as a proportion of new-issue municipal debt was at its highest level since 2010 by period-end. Pandemic-related volatility and liquidity pressures prompted record-setting outflows from municipal bonds in March. Strong support by the Fed, including a Municipal Liquidity Facility and more than $2.5 trillion in fiscal stimulus, buoyed markets and bolstered investor confidence. Several weeks of consecutive positive net flows for municipal funds and strong demand
for new bonds drove yields back near the lows for highly rated issues. The period ended with the Fed pledging to keep short rates low for the foreseeable future, and the fundamental outlook for municipal issuers came into question as the path of recovery from the virus remains extraordinarily uncertain.
Please see footnotes on page 7.
8 | Wells Fargo Ultra Short-Term Municipal Income Fund
Performance highlights (unaudited)
Sector allocation, credit quality, and security selection detracted from performance while duration and yield curve contributed.
As the period began, we started to modestly increase interest rate exposure into market weakness. We took advantage of seasonally high issuance at year-end to get closer to a neutral duration positioning. Also, as credit spreads continued to tighten, we began buying higher-quality bonds but maintained an overweight to BBB-rated bonds. The Fund’s overweight to BBB-rated debt detracted from performance as lower-rated bonds underperformed higher-quality bonds at the end of the period, but we feel investors are being compensated for taking additional credit risk at this time. Also, the Fund’s overweight to lower-quality bonds with relatively short maturities allowed a competitive yield without significant duration risk. Sector positioning detracted from performance during the period due to an underweight to GO bonds and prerefunded bonds, which outperformed, and an overweight to revenue bonds, which underperformed. We expect this trend to reverse in the second half of 2020 as revenue is restored in the recovery and GO bond issuers deal with added expense due to the coronavirus pandemic. Some of the better-performing bonds for the year were hospital bonds in Arizona and California, along with Alabama gas bonds that offer an attractive yield. Also, a sector that added to performance was industrial development revenue/pollution control revenue bonds in Oregon. Bonds that detracted from performance included NY-Metropolitan Transit Authority and Chicago, Illinois, GOs. However, we expect pricing to rebound as the phased reopenings have begun in most states.
Our outlook is for lower rates for longer in the recovery.
Overall, technical factors remain strong in the municipal bond market, and we expect the Fed to be on hold for the balance of 2020 and 2021 to support economic growth. We will look to maintain a neutral duration positioning and maintain the barbell yield-curve positioning.
While we will continue our bias to overweighting lower-quality investment-grade bonds in holdings and purchases, it will be issuer-dependent with our research process. We will add some higher-quality bonds in the AAA-rated and AA-rated areas as opportunities arise in cash flow notes, as many issuers will need to issue short-term debt to balance the budget with the challenges presented by the coronavirus pandemic. We will monitor the economy to see how the recovery proceeds, with an eye on the technical market and fundamental credit quality, to see if any changes are warranted in duration, yield-curve positioning, and sector and credit-quality selections over the next year.
Please see footnotes on page 7.
Wells Fargo Ultra Short-Term Municipal Income Fund | 9
As a shareholder of the Fund, you incur two types of costs: (1) transaction costs, including sales charges (loads) on purchase payments and contingent deferred sales charges (if any) on redemptions and (2) ongoing costs, including management fees, distribution (12b-1) and/or shareholder servicing fees, and other Fund expenses. This example is intended to help you understand your ongoing costs (in dollars) of investing in the Fund and to compare these costs with the ongoing costs of investing in other mutual funds.
The example is based on an investment of $1,000 invested at the beginning of the six-month period and held for the entire period from January 1, 2020 to June 30, 2020.
Actual expenses
The “Actual” line of the table below provides information about actual account values and actual expenses. You may use the information in this line, together with the amount you invested, to estimate the expenses that you paid over the period. Simply divide your account value by $1,000 (for example, an $8,600 account value divided by $1,000 = 8.6), then multiply the result by the number in the “Actual” line under the heading entitled “Expenses paid during period” for your applicable class of shares to estimate the expenses you paid on your account during this period.
Hypothetical example for comparison purposes
The “Hypothetical” line of the table below provides information about hypothetical account values and hypothetical expenses based on the Fund’s actual expense ratio and an assumed rate of return of 5% per year before expenses, which is not the Fund’s actual return. The hypothetical account values and expenses may not be used to estimate the actual ending account balance or expenses you paid for the period. You may use this information to compare the ongoing costs of investing in the Fund and other funds. To do so, compare this 5% hypothetical example with the 5% hypothetical examples that appear in the shareholder reports of the other funds.
Please note that the expenses shown in the table are meant to highlight your ongoing costs only and do not reflect any transactional costs, such as sales charges (loads) and contingent deferred sales charges. Therefore, the “Hypothetical” line of the table is useful in comparing ongoing costs only and will not help you determine the relative total costs of owning different funds. In addition, if these transactional costs were included, your costs would have been higher.
| Beginning account value 1-1-2020 | Ending account value 6-30-2020 | Expenses paid during the period1 | Annualized net expense ratio | |||||||||||||
Class A | ||||||||||||||||
Actual | $ | 1,000.00 | $ | 1,004.94 | $ | 3.14 | 0.63 | % | ||||||||
Hypothetical (5% return before expenses) | $ | 1,000.00 | $ | 1,021.73 | $ | 3.17 | 0.63 | % | ||||||||
Class A2 | ||||||||||||||||
Actual | $ | 1,000.00 | $ | 1,004.85 | $ | 0.44 | 0.50 | % | ||||||||
Hypothetical (5% return before expenses) | $ | 1,000.00 | $ | 1,003.93 | $ | 0.44 | 0.50 | % | ||||||||
Class C | ||||||||||||||||
Actual | $ | 1,000.00 | $ | 1,000.05 | $ | 6.96 | 1.40 | % | ||||||||
Hypothetical (5% return before expenses) | $ | 1,000.00 | $ | 1,017.90 | $ | 7.02 | 1.40 | % | ||||||||
Class R6 | ||||||||||||||||
Actual | $ | 1,000.00 | $ | 1,006.60 | $ | 1.50 | 0.30 | % | ||||||||
Hypothetical (5% return before expenses) | $ | 1,000.00 | $ | 1,023.37 | $ | 1.51 | 0.30 | % | ||||||||
Administrator Class | ||||||||||||||||
Actual | $ | 1,000.00 | $ | 1,005.18 | $ | 2.89 | 0.58 | % | ||||||||
Hypothetical (5% return before expenses) | $ | 1,000.00 | $ | 1,021.98 | $ | 2.92 | 0.58 | % | ||||||||
Institutional Class | ||||||||||||||||
Actual | $ | 1,000.00 | $ | 1,005.30 | $ | 1.75 | 0.35 | % | ||||||||
Hypothetical (5% return before expenses) | $ | 1,000.00 | $ | 1,023.12 | $ | 1.76 | 0.35 | % | ||||||||
| 1 | Expenses paid is equal to the annualized net expense ratio of each class multiplied by the average account value over the period, multiplied by the number of days in the most recent fiscal half-year divided by the number of days in the fiscal year (to reflect the one-half-year period). |
10 | Wells Fargo Ultra Short-Term Municipal Income Fund
Portfolio of investments—June 30, 2020
| Interest rate | Maturity date | Principal | Value | |||||||||||||
| Municipal Obligations: 98.19% |
| |||||||||||||||
Alabama: 3.44% |
| |||||||||||||||
| Health Revenue: 1.57% | ||||||||||||||||
Alabama Health Care Authority for Baptist Health Series B (AGC Insured) (m) | 0.50 | % | 11-15-2037 | $ | 11,600,000 | $ | 11,600,000 | |||||||||
Alabama Health Care Authority for Baptist Health Series B ø | 1.32 | 11-1-2042 | 8,200,000 | 8,200,000 | ||||||||||||
East Alabama Health Care Authority Series B ø | 0.61 | 9-1-2039 | 10,000,000 | 10,000,000 | ||||||||||||
| 29,800,000 | ||||||||||||||||
|
| |||||||||||||||
| Utilities Revenue: 1.87% | ||||||||||||||||
Alabama Black Belt Energy Gas District Series A (Royal Bank of Canada LIQ) | 4.00 | 7-1-2046 | 18,635,000 | 19,123,610 | ||||||||||||
Alabama Black Belt Energy Gas District Series A (Royal Bank of Canada LIQ) | 4.00 | 8-1-2047 | 4,415,000 | 4,668,421 | ||||||||||||
Black Belt Energy Gas District Project 4 Series A-1 | 4.00 | 6-1-2022 | 500,000 | 528,150 | ||||||||||||
Chatom AL Industrial Development Board Alabama Electric Series A (National Rural Utilities Cooperative Finance SPA) ø | 1.15 | 8-1-2037 | 7,000,000 | 7,000,000 | ||||||||||||
Southeast Alabama Gas Supply District Project #1 Series A | 4.00 | 4-1-2049 | 4,000,000 | 4,384,280 | ||||||||||||
| 35,704,461 | ||||||||||||||||
|
| |||||||||||||||
| 65,504,461 | ||||||||||||||||
|
| |||||||||||||||
Alaska: 0.48% |
| |||||||||||||||
| Airport Revenue: 0.15% | ||||||||||||||||
Alaska International Airports AMT Refunding Bond Series A | 5.00 | 10-1-2020 | 2,830,000 | 2,856,461 | ||||||||||||
|
| |||||||||||||||
| Health Revenue: 0.11% | ||||||||||||||||
Alaska IDA Loan Anticipation YKHC Project | 3.50 | 12-1-2020 | 2,000,000 | 2,003,860 | ||||||||||||
|
| |||||||||||||||
| Miscellaneous Revenue: 0.22% | ||||||||||||||||
Alaska Municipal Bond Bank Series 1 %% | 5.00 | 12-1-2023 | 1,900,000 | 2,172,042 | ||||||||||||
Alaska Municipal Bond Bank Series 1 %% | 5.00 | 12-1-2024 | 1,750,000 | 2,064,055 | ||||||||||||
| 4,236,097 | ||||||||||||||||
|
| |||||||||||||||
| 9,096,418 | ||||||||||||||||
|
| |||||||||||||||
Arizona: 1.98% |
| |||||||||||||||
| Education Revenue: 0.04% | ||||||||||||||||
Phoenix AZ IDA BASIS Schools Incorporated Project Series A 144A | 3.00 | 7-1-2020 | 790,000 | 790,000 | ||||||||||||
|
| |||||||||||||||
| Health Revenue: 1.76% | ||||||||||||||||
Arizona Health Facilities Authority Catholic West Series A (JPMorgan Chase & Company LOC) ø | 0.17 | 7-1-2035 | 8,845,000 | 8,845,000 | ||||||||||||
Maricopa County AZ IDA Series A | 5.00 | 1-1-2048 | 3,910,000 | 4,254,940 | ||||||||||||
Scottsdale AZ IDA Healthcare Series F (AGM Insured) (m) | 0.98 | 9-1-2045 | 20,500,000 | 20,500,000 | ||||||||||||
| 33,599,940 | ||||||||||||||||
|
| |||||||||||||||
| Industrial Development Revenue: 0.18% | ||||||||||||||||
Chandler AZ IDA Intel Corporation Project | 2.70 | 12-1-2037 | 3,200,000 | 3,362,080 | ||||||||||||
|
| |||||||||||||||
| 37,752,020 | ||||||||||||||||
|
| |||||||||||||||
Arkansas: 0.73% |
| |||||||||||||||
| Housing Revenue: 0.73% | ||||||||||||||||
Arkansas Development Finance Authority Multifamily Housing Homes Project (HUD Insured) | 1.20 | 3-1-2024 | 6,000,000 | 6,061,740 | ||||||||||||
The accompanying notes are an integral part of these financial statements.
Wells Fargo Ultra Short-Term Municipal Income Fund | 11
Portfolio of investments—June 30, 2020
| Interest rate | Maturity date | Principal | Value | |||||||||||||
| Housing Revenue (continued) | ||||||||||||||||
Mizuho Floater/Residual Trust Various States Series 2020-MIZ9008 (Mizuho Capital Markets LLC LOC, Mizuho Capital Markets LLC LIQ) 144Aø | 0.38 | % | 4-1-2025 | $ | 7,860,000 | $ | 7,860,000 | |||||||||
| 13,921,740 | ||||||||||||||||
|
| |||||||||||||||
California: 8.03% |
| |||||||||||||||
| Airport Revenue: 0.04% | ||||||||||||||||
San Francisco CA City & County Airports Commission AMT Series H | 5.00 | 5-1-2021 | 735,000 | 758,373 | ||||||||||||
|
| |||||||||||||||
| GO Revenue: 1.12% | ||||||||||||||||
California Refunding Bond Series A (SIFMA Municipal Swap +0.25%) ± | 0.38 | 5-1-2033 | 21,505,000 | 21,423,926 | ||||||||||||
|
| |||||||||||||||
| Health Revenue: 4.14% | ||||||||||||||||
California HFFA Kaiser Permanente Series C | 5.00 | 8-1-2031 | 2,450,000 | 2,696,299 | ||||||||||||
California Statewide CDA Health Facilities Catholic Series D (AGM Insured) (m) | 1.03 | 7-1-2041 | 21,175,000 | 21,175,000 | ||||||||||||
California Statewide CDA Health Facilities Catholic Series F (AGM Insured) (m) | 0.10 | 7-1-2040 | 15,025,000 | 15,025,000 | ||||||||||||
California Tender Option Bond Trust Receipts/Floater Certificates Series 2017-XG0119 (Deutsche Bank LIQ) 144Aø | 0.28 | 7-1-2044 | 4,900,000 | 4,900,000 | ||||||||||||
Palomar CA Pomerado Health Care District Certificate of Participation Series A (AGM Insured) (m) | 1.56 | 11-1-2036 | 9,850,000 | 9,850,000 | ||||||||||||
Palomar CA Pomerado Health Care District Certificate of Participation Series B (AGM Insured) (m) | 0.01 | 11-1-2036 | 1,325,000 | 1,325,000 | ||||||||||||
Palomar CA Pomerado Health Care District Certificate of Participation Series C (AGM Insured) (m) | 1.54 | 11-1-2036 | 825,000 | 825,000 | ||||||||||||
Tender Option Bond Trust Receipts/Certificates HCFR Series 2016-XG0048 (Deutsche Bank LIQ) 144Aø | 0.26 | 8-15-2042 | 23,000,000 | 23,000,000 | ||||||||||||
| 78,796,299 | ||||||||||||||||
|
| |||||||||||||||
| Housing Revenue: 1.68% | ||||||||||||||||
California HFA MFHR | 1.45 | 4-1-2024 | 3,500,000 | 3,530,660 | ||||||||||||
California Municipal Finance Authority Housing Revenue Dino Papavero Apartments Project | 1.50 | 6-1-2022 | 8,700,000 | 8,758,464 | ||||||||||||
Mizuho Floater/Residual Interest Bond Series 2019-MIZ9007 (Mizuho Capital Markets LLC LOC, Mizuho Capital Markets LLC LIQ) 144Aø | 0.38 | 1-1-2040 | 11,250,000 | 11,250,000 | ||||||||||||
Mizuho Floater/Residual Trust Tender Option Bond (Mizuho Capital Markets LLC LOC, Mizuho Capital Markets LLC LIQ) 144Aø | 0.38 | 10-15-2037 | 8,500,000 | 8,500,000 | ||||||||||||
| 32,039,124 | ||||||||||||||||
|
| |||||||||||||||
| Miscellaneous Revenue: 0.52% | ||||||||||||||||
California Infrastructure & Economic Development Bank The J. Paul Getty Trust Series A-1 (1 Month LIBOR +0.33%) ± | 0.45 | 10-1-2047 | 5,000,000 | 4,961,850 | ||||||||||||
California Infrastructure & Economic Development Bank The J. Paul Getty Trust Series B-2 (1 Month LIBOR +0.20%) ± | 0.32 | 10-1-2047 | 5,000,000 | 4,980,550 | ||||||||||||
| 9,942,400 | ||||||||||||||||
|
| |||||||||||||||
| Tax Revenue: 0.53% | ||||||||||||||||
Mizuho Tender Option Bond Trust Receipts/Floater Certificates Series 2019-MIZ9002 (Mizuho Capital Markets LLC LOC, Mizuho Capital Markets LLC LIQ) 144Aø | 0.35 | 3-1-2021 | 10,000,000 | 10,000,000 | ||||||||||||
|
| |||||||||||||||
| 152,960,122 | ||||||||||||||||
|
| |||||||||||||||
The accompanying notes are an integral part of these financial statements.
12 | Wells Fargo Ultra Short-Term Municipal Income Fund
Portfolio of investments—June 30, 2020
| Interest rate | Maturity date | Principal | Value | |||||||||||||
| Colorado: 1.12% |
| |||||||||||||||
| Airport Revenue: 0.40% | ||||||||||||||||
Denver CO City & County Airport Subordinate Bond Series F-2 (AGC Insured) (m) | 0.99 | % | 11-15-2025 | $ | 7,525,000 | $ | 7,525,000 | |||||||||
|
| |||||||||||||||
| Health Revenue: 0.40% | ||||||||||||||||
Colorado Health Facilities Authority Catholic Health Initiatives Series B-3 | 4.00 | 1-1-2024 | 530,000 | 522,018 | ||||||||||||
Colorado Health Facilities Authority Catholic Health Initiatives Series 2008-D2 (Morgan Stanley Bank LIQ) 144Aø | 0.31 | 10-1-2037 | 6,000,000 | 6,000,000 | ||||||||||||
Denver CO Health & Hospital Authority Refunding Bond Series A 144A | 5.00 | 12-1-2020 | 1,175,000 | 1,192,085 | ||||||||||||
| 7,714,103 | ||||||||||||||||
|
| |||||||||||||||
| Miscellaneous Revenue: 0.09% | ||||||||||||||||
Colorado ECFA Variable Nature Conservancy Project Series 2012 ø | 0.13 | 7-1-2033 | 1,660,000 | 1,660,000 | ||||||||||||
|
| |||||||||||||||
| Transportation Revenue: 0.23% | ||||||||||||||||
Colorado E-470 Public Highway Authority Series A (1 Month LIBOR +0.42%) ± | 0.54 | 9-1-2039 | 4,500,000 | 4,469,445 | ||||||||||||
|
| |||||||||||||||
| 21,368,548 | ||||||||||||||||
|
| |||||||||||||||
Connecticut: 1.81% |
| |||||||||||||||
| Education Revenue: 0.96% | ||||||||||||||||
Connecticut HEFAR Yale University Issue Series A | 1.10 | 7-1-2048 | 7,000,000 | 7,123,270 | ||||||||||||
Connecticut HEFAR Yale University issue Series B %% | 0.55 | 7-1-2037 | 8,000,000 | 8,011,440 | ||||||||||||
Connecticut Higher Education Supplemental Loan Authority Chesla Loan | 5.00 | 11-15-2022 | 1,350,000 | 1,451,318 | ||||||||||||
Connecticut Higher Education Supplemental Loan Authority Chesla Loan | 5.00 | 11-15-2024 | 585,000 | 659,745 | ||||||||||||
Connecticut Higher Education Supplemental Loan Authority Chesla Loan Program Series B | 5.00 | 11-15-2021 | 545,000 | 570,713 | ||||||||||||
Connecticut Higher Education Supplemental Loan Authority Chesla Loan Program Series B | 5.00 | 11-15-2023 | 440,000 | 486,050 | ||||||||||||
| 18,302,536 | ||||||||||||||||
|
| |||||||||||||||
| GO Revenue: 0.45% | ||||||||||||||||
Bridgeport CT Series A | 5.00 | 6-1-2023 | 655,000 | 719,714 | ||||||||||||
Bridgeport CT Series A | 5.00 | 6-1-2024 | 800,000 | 902,448 | ||||||||||||
Bridgeport CT Series A | 5.00 | 6-1-2025 | 2,695,000 | 3,102,215 | ||||||||||||
Connecticut Series C | 3.00 | 6-1-2022 | 1,050,000 | 1,099,319 | ||||||||||||
Connecticut Series C | 3.00 | 6-1-2023 | 600,000 | 640,806 | ||||||||||||
Connecticut Series C | 3.00 | 6-1-2024 | 1,055,000 | 1,145,519 | ||||||||||||
Connecticut Series C | 4.00 | 6-1-2023 | 400,000 | 438,732 | ||||||||||||
Connecticut Series C | 4.00 | 6-1-2024 | 500,000 | 561,730 | ||||||||||||
| 8,610,483 | ||||||||||||||||
|
| |||||||||||||||
| Housing Revenue: 0.24% | ||||||||||||||||
Connecticut HFA Housing Mortgage Finance Program Series A | 2.40 | 11-15-2020 | 980,000 | 986,537 | ||||||||||||
Connecticut HFA Series 25 | 2.30 | 6-15-2021 | 950,000 | 964,953 | ||||||||||||
Connecticut HFA Series 25 | 2.50 | 6-15-2022 | 840,000 | 870,064 | ||||||||||||
Connecticut HFA Subordinate Bond Series E-3 (GNMA/FNMA/FHLMC Insured) | 1.50 | 11-15-2047 | 1,805,000 | 1,806,354 | ||||||||||||
| 4,627,908 | ||||||||||||||||
|
| |||||||||||||||
The accompanying notes are an integral part of these financial statements.
Wells Fargo Ultra Short-Term Municipal Income Fund | 13
Portfolio of investments—June 30, 2020
| Interest rate | Maturity date | Principal | Value | |||||||||||||
| Tax Revenue: 0.16% |
| |||||||||||||||
Connecticutial Tax Obligation Revenue Transportation Infrastructure Purpose | 5.00 | % | 5-1-2023 | $ | 375,000 | $ | 420,259 | |||||||||
Connecticutial Tax Obligation Revenue Transportation Infrastructure Purpose | 5.00 | 5-1-2024 | 1,000,000 | 1,159,630 | ||||||||||||
Connecticutial Tax Obligation Revenue Transportation Infrastructure Purpose | 5.00 | 5-1-2025 | 1,150,000 | 1,374,963 | ||||||||||||
| 2,954,852 | ||||||||||||||||
|
| |||||||||||||||
| 34,495,779 | ||||||||||||||||
|
| |||||||||||||||
District of Columbia: 1.39% |
| |||||||||||||||
| Housing Revenue: 1.05% | ||||||||||||||||
District of Columbia HFA Park Southern Apartments Project (FHA Insured) | 0.70 | 6-1-2024 | 20,000,000 | 19,982,600 | ||||||||||||
|
| |||||||||||||||
| Transportation Revenue: 0.34% | ||||||||||||||||
Washington DC Metropolitan Area Transit Authority Series A | 5.00 | 7-15-2023 | 3,600,000 | 4,098,420 | ||||||||||||
Washington DC Metropolitan Area Transit Authority Series A | 5.00 | 7-15-2024 | 2,000,000 | 2,359,940 | ||||||||||||
| 6,458,360 | ||||||||||||||||
|
| |||||||||||||||
| 26,440,960 | ||||||||||||||||
|
| |||||||||||||||
Florida: 2.54% |
| |||||||||||||||
| Airport Revenue: 0.05% | ||||||||||||||||
Miami-Dade County FL Seaport Series A | 5.00 | 10-1-2021 | 855,000 | 897,818 | ||||||||||||
|
| |||||||||||||||
| Education Revenue: 0.04% | ||||||||||||||||
Florida HEFAR Florida Institute of Technology | 5.00 | 10-1-2023 | 500,000 | 540,160 | ||||||||||||
Florida HEFAR Florida Institute of Technology | 5.00 | 10-1-2024 | 250,000 | 274,355 | ||||||||||||
| 814,515 | ||||||||||||||||
|
| |||||||||||||||
| Health Revenue: 0.96% | ||||||||||||||||
Lee Memorial Health System Series B ø | 0.78 | 4-1-2049 | 13,500,000 | 13,500,000 | ||||||||||||
Miami FL HFFA Miami Jewish Health Systems Incorporate Project | 5.00 | 7-1-2020 | 390,000 | 390,000 | ||||||||||||
Miami-Dade County FL Health Facilities Authority Miami Children’s Hospital Project Series A | 5.25 | 8-1-2021 | 290,000 | 290,974 | ||||||||||||
North Broward FL Hospital District Series B | 5.00 | 1-1-2021 | 925,000 | 943,260 | ||||||||||||
Tender Option Bond Trust Receipts/Certificates (JPMorgan Chase & Company LIQ) 144Aø | 0.28 | 2-15-2026 | 3,225,000 | 3,225,000 | ||||||||||||
| 18,349,234 | ||||||||||||||||
|
| |||||||||||||||
| Housing Revenue: 0.73% | ||||||||||||||||
Florida Housing Finance Corporation Multifamily Mortgage Parrish Oaks Series A | 1.25 | 2-1-2023 | 500,000 | 507,185 | ||||||||||||
Florida Housing Finance Corporation Series 1 (GNMA/FNMA/FHLMC Insured) | 1.95 | 1-1-2021 | 1,400,000 | 1,409,436 | ||||||||||||
Florida Housing Finance Corporation Series 1 (GNMA/FNMA/FHLMC Insured) | 2.00 | 7-1-2021 | 1,230,000 | 1,246,605 | ||||||||||||
Florida Housing Finance Corporation Series 1 (GNMA/FNMA/FHLMC Insured) | 2.05 | 1-1-2022 | 900,000 | 918,792 | ||||||||||||
Jacksonville FL HFA Desert-Silver LLC Project | 2.25 | 12-1-2021 | 7,250,000 | 7,292,123 | ||||||||||||
Miami-Dade County FL HFA Multifamily Housing Revenue %% | 0.60 | 12-1-2022 | 2,500,000 | 2,499,450 | ||||||||||||
| 13,873,591 | ||||||||||||||||
|
| |||||||||||||||
| Resource Recovery Revenue: 0.02% | ||||||||||||||||
Lee County FL Solid Waste System | 5.00 | 10-1-2020 | 470,000 | 474,789 | ||||||||||||
|
| |||||||||||||||
| Tax Revenue: 0.06% | ||||||||||||||||
Miami FL Special Obligation Refunding Bond Street & Sidewalk Improvement Program (AGM Insured) 144A | 5.00 | 1-1-2021 | 1,060,000 | 1,081,836 | ||||||||||||
|
| |||||||||||||||
The accompanying notes are an integral part of these financial statements.
14 | Wells Fargo Ultra Short-Term Municipal Income Fund
Portfolio of investments—June 30, 2020
| Interest rate | Maturity date | Principal | Value | |||||||||||||
| Water & Sewer Revenue: 0.68% |
| |||||||||||||||
Jea FL Water & Sewer Systems Revenue Series B (JPMorgan Chase & Company SPA) ø | 0.16 | % | 10-1-2041 | $ | 5,000,000 | $ | 5,000,000 | |||||||||
Miami-Dade County FL Water and Waterwaste System (AGM Insured, Credit Suisse LIQ) 144Aø | 0.16 | 10-1-2033 | 8,000,000 | 8,000,000 | ||||||||||||
| 13,000,000 | ||||||||||||||||
|
| |||||||||||||||
| 48,491,783 | ||||||||||||||||
|
| |||||||||||||||
| Georgia: 3.25% | ||||||||||||||||
| Health Revenue: 0.55% | ||||||||||||||||
Georgia Tender Option Bond Trust Receipts/Floater Certificates Series 2015-XF1016 (Barclays Bank plc LIQ) 144Aø | 0.18 | 8-15-2049 | 10,520,000 | 10,520,000 | ||||||||||||
|
| |||||||||||||||
| Housing Revenue: 1.38% | ||||||||||||||||
Atlanta GA Urban Residential Finance Authority Bethel Towers I LP Apartments Project | 2.07 | 7-1-2021 | 3,500,000 | 3,502,590 | ||||||||||||
Clayton County GA Housing Authority Renaissance at Garden Walk Apartments Project | 2.30 | 6-1-2022 | 13,000,000 | 13,178,360 | ||||||||||||
Douglas County GA Housing Authority Douglass Village Apartments Project | 2.25 | 12-1-2021 | 9,500,000 | 9,557,950 | ||||||||||||
| 26,238,900 | ||||||||||||||||
|
| |||||||||||||||
| Industrial Development Revenue: 0.39% | ||||||||||||||||
Monroe County GA PCR Georgia Power Company Plant Scherer Project | 2.35 | 10-1-2048 | 7,430,000 | 7,487,880 | ||||||||||||
|
| |||||||||||||||
| Utilities Revenue: 0.93% | ||||||||||||||||
Burke County GA Development Authority Georgia Power Company Plant Vogtle Project | 1.55 | 12-1-2049 | 4,000,000 | 4,005,120 | ||||||||||||
Burke County GA Development Authority Georgia Power Company Plant Vogtle Project Fifth Series 1995 | 2.05 | 10-1-2032 | 1,850,000 | 1,871,719 | ||||||||||||
Burke County GA Development Authority Georgia Power Company Plant Vogtle Project First Series 1996 | 2.35 | 10-1-2032 | 5,315,000 | 5,342,053 | ||||||||||||
Burke County GA Development Authority Georgia Power Company Plant Vogtle Project First Series 2008 | 1.65 | 11-1-2048 | 2,795,000 | 2,807,242 | ||||||||||||
Monroe County GA Development Authority Power Company Plant Scherer Project First Series 2009 | 2.05 | 7-1-2049 | 2,545,000 | 2,574,878 | ||||||||||||
Municipal Electric Authority Georgia Combined Cycle Project Series A | 5.00 | 11-1-2020 | 1,000,000 | 1,012,240 | ||||||||||||
| 17,613,252 | ||||||||||||||||
|
| |||||||||||||||
| 61,860,032 | ||||||||||||||||
|
| |||||||||||||||
Guam: 0.13% |
| |||||||||||||||
| Airport Revenue: 0.13% | ||||||||||||||||
Guam International Airport Authority AMT Refunding Bond Series A | 3.00 | 10-1-2020 | 50,000 | 49,820 | ||||||||||||
Guam International Airport Authority AMT Refunding Bond Series A | 3.00 | 10-1-2021 | 55,000 | 53,947 | ||||||||||||
Guam International Airport Authority AMT Refunding Bond Series A | 5.00 | 10-1-2022 | 1,000,000 | 1,005,130 | ||||||||||||
Guam International Airport Authority AMT Refunding Bond Series A | 5.00 | 10-1-2023 | 1,395,000 | 1,396,353 | ||||||||||||
| 2,505,250 | ||||||||||||||||
|
| |||||||||||||||
Hawaii: 0.10% |
| |||||||||||||||
| Health Revenue: 0.10% | ||||||||||||||||
Hawaii Department of Budget & Finance Queens Health System Series B (SIFMA Municipal Swap +0.45%) ± | 0.58 | 7-1-2039 | 1,955,000 | 1,955,000 | ||||||||||||
|
| |||||||||||||||
The accompanying notes are an integral part of these financial statements.
Wells Fargo Ultra Short-Term Municipal Income Fund | 15
Portfolio of investments—June 30, 2020
| Interest rate | Maturity date | Principal | Value | |||||||||||||
Idaho: 0.26% |
| |||||||||||||||
| Housing Revenue: 0.26% | ||||||||||||||||
Idaho Housing & Finance Association Series A (FNMA LOC) ø | 0.33 | % | 1-1-2038 | $ | 4,915,000 | $ | 4,915,000 | |||||||||
|
| |||||||||||||||
Illinois: 7.01% |
| |||||||||||||||
| Education Revenue: 0.43% | ||||||||||||||||
Illinois Development Finance Authority Revenue Adjusted American College Surgeons (Northern Trust Company LOC) ø | 0.13 | 8-1-2026 | 6,700,000 | 6,700,000 | ||||||||||||
University of Illinois Auxiliary Facilities Series A | 5.00 | 4-1-2022 | 1,070,000 | 1,146,259 | ||||||||||||
University of Illinois Auxiliary Facilities Series A | 5.00 | 4-1-2024 | 350,000 | 360,427 | ||||||||||||
| 8,206,686 | ||||||||||||||||
|
| |||||||||||||||
| GO Revenue: 1.91% | ||||||||||||||||
Chicago IL Series A | 5.00 | 1-1-2025 | 2,500,000 | 2,665,575 | ||||||||||||
Chicago IL Series C | 5.00 | 1-1-2021 | 1,565,000 | 1,601,120 | ||||||||||||
Cook County IL Refunding Bond Series C | 5.00 | 11-15-2022 | 3,045,000 | 3,236,500 | ||||||||||||
Illinois | 5.00 | 2-1-2021 | 3,115,000 | 3,157,551 | ||||||||||||
Illinois | 5.00 | 1-1-2022 | 5,915,000 | 6,100,080 | ||||||||||||
Illinois Series 2016 | 5.00 | 11-1-2021 | 5,380,000 | 5,539,732 | ||||||||||||
Lake County IL Water Sewerage System Grainger Incorporated Project (Northern Trust Company LIQ) ø | 0.38 | 4-1-2021 | 1,500,000 | 1,500,000 | ||||||||||||
Tender Option Bond Trust Receipts/Certficiates (BAM Insured, JPMorgan Chase & Company LIQ) 144Aø | 0.17 | 12-1-2026 | 6,375,000 | 6,375,000 | ||||||||||||
Waukegan IL Series 2018B (AGM Insured) | 3.00 | 12-30-2020 | 2,340,000 | 2,366,278 | ||||||||||||
Waukegan IL Series 2018B (AGM Insured) | 4.00 | 12-30-2021 | 800,000 | 838,440 | ||||||||||||
Whiteside & Lee County IL Community Unit School District 5 Series A (BAM Insured) | 4.00 | 12-1-2022 | 1,375,000 | 1,475,526 | ||||||||||||
Whiteside & Lee County IL Community Unit School District 5 Series A (BAM Insured) | 4.00 | 12-1-2023 | 1,435,000 | 1,576,147 | ||||||||||||
| 36,431,949 | ||||||||||||||||
|
| |||||||||||||||
| Health Revenue: 0.62% | ||||||||||||||||
Illinois Finance Authority Ascension Health Alliance Senior Credit Group Series E-2 | 1.75 | 11-15-2042 | 2,970,000 | 2,994,978 | ||||||||||||
Illinois Finance Authority Mercy Health Corporation | 5.00 | 12-1-2021 | 1,165,000 | 1,219,976 | ||||||||||||
Illinois Finance Authority Presbyterian Homes Obligated Group Series B (1 Month LIBOR +1.35%) ± | 1.47 | 5-1-2036 | 6,410,000 | 6,412,885 | ||||||||||||
Illinois Finance Authority Rehabilitation Institute of Chicago | 5.00 | 7-1-2023 | 1,100,000 | 1,210,253 | ||||||||||||
| 11,838,092 | ||||||||||||||||
|
| |||||||||||||||
| Miscellaneous Revenue: 0.96% | ||||||||||||||||
Chicago IL Board of Education Series B | 5.00 | 12-1-2022 | 1,500,000 | 1,559,325 | ||||||||||||
Chicago IL Board of Education Series B | 5.00 | 12-1-2023 | 1,150,000 | 1,211,180 | ||||||||||||
Illinois Refunding Bond | 5.00 | 8-1-2022 | 2,290,000 | 2,385,882 | ||||||||||||
Illinois Series D | 5.00 | 11-1-2021 | 7,820,000 | 8,052,176 | ||||||||||||
Illinois Tender Option Bond Trust Receipts/Floater Certificates Series 2020-XF2854 (Barclays Bank plc LOC, Barclays Bank plc LIQ) 144Aø | 0.31 | 6-15-2050 | 5,000,000 | 5,000,000 | ||||||||||||
| 18,208,563 | ||||||||||||||||
|
| |||||||||||||||
| Tax Revenue: 2.79% | ||||||||||||||||
Illinois Series A | 5.00 | 6-1-2021 | 1,455,000 | 1,486,166 | ||||||||||||
Illinois Tender Option Bond Trust Receipts/Floater Certificates Series 2018-XL0093 (Barclays Bank plc LIQ) 144Aø | 0.28 | 1-1-2048 | 8,000,000 | 8,000,000 | ||||||||||||
The accompanying notes are an integral part of these financial statements.
16 | Wells Fargo Ultra Short-Term Municipal Income Fund
Portfolio of investments—June 30, 2020
| Interest rate | Maturity date | Principal | Value | |||||||||||||
| Tax Revenue (continued) | ||||||||||||||||
lllinois Tender Option Bond Trust Receipts/Floater Certificates Series 2018-XM0713 (Morgan Stanley Bank LIQ) 144Aø | 0.33 | % | 1-1-2043 | $ | 8,000,000 | $ | 8,000,000 | |||||||||
Metropolitan Pier & Exposition Authority McCormick Place Project Non-Callable Bond Series B | 5.00 | 12-15-2022 | 5,925,000 | 6,188,129 | ||||||||||||
Regional Transportation Authority Illinois Series B-RMKT ø | 0.80 | 6-1-2025 | 29,530,000 | 29,530,000 | ||||||||||||
| 53,204,295 | ||||||||||||||||
|
| |||||||||||||||
| Water & Sewer Revenue: 0.30% | ||||||||||||||||
Chicago IL Wastewater Transmission Revenue CAB Refunding Series A (National Insured) ¤ | 0.00 | 1-1-2022 | 3,265,000 | 3,159,932 | ||||||||||||
Chicago IL Waterworks Refunding Bond Series 2017-2 | 5.00 | 11-1-2020 | 1,500,000 | 1,517,355 | ||||||||||||
South Sangamon IL Water Commission (AGM Insured) %% | 4.00 | 1-1-2023 | 500,000 | 533,600 | ||||||||||||
South Sangamon IL Water Commission (AGM Insured) %% | 4.00 | 1-1-2026 | 500,000 | 557,575 | ||||||||||||
| 5,768,462 | ||||||||||||||||
|
| |||||||||||||||
| 133,658,047 | ||||||||||||||||
|
| |||||||||||||||
| Indiana: 1.05% | ||||||||||||||||
| Education Revenue: 0.02% | ||||||||||||||||
Purdue University Indiana Student Facilities System Series C ø | 0.09 | 7-1-2032 | 400,000 | 400,000 | ||||||||||||
|
| |||||||||||||||
| Health Revenue: 0.34% | ||||||||||||||||
Indiana HFFA Ascension Health Subordinate Bond Credit Group Series A-3 | 1.35 | 11-1-2027 | 585,000 | 585,480 | ||||||||||||
Indiana HFFA Ascension Health Subordinate Bond Credit Group Series A-5 | 1.35 | 11-1-2027 | 5,950,000 | 5,954,879 | ||||||||||||
| 6,540,359 | ||||||||||||||||
|
| |||||||||||||||
| Industrial Development Revenue: 0.14% | ||||||||||||||||
Whiting IN Environmental Facilities North America Incorporated Project | 5.00 | 11-1-2047 | 2,250,000 | 2,578,950 | ||||||||||||
|
| |||||||||||||||
| Miscellaneous Revenue: 0.55% | ||||||||||||||||
Indiana Bond Bank Advance Funding Program Series A | 3.00 | 1-11-2021 | 1,000,000 | 1,013,470 | ||||||||||||
Indiana Bond Bank Advance Funding Program Series A | 3.00 | 1-11-2021 | 4,520,000 | 4,529,944 | ||||||||||||
Indianapolis IN Local Public Improvement Bond Bank Fieldhouse Project Series B | 1.45 | 6-1-2021 | 5,000,000 | 5,000,550 | ||||||||||||
| 10,543,964 | ||||||||||||||||
|
| |||||||||||||||
| 20,063,273 | ||||||||||||||||
|
| |||||||||||||||
Kansas: 0.80% |
| |||||||||||||||
| Health Revenue: 0.20% | ||||||||||||||||
University of Kansas Hospital Authority Health System (U.S. Bank NA LOC) ø | 0.13 | 9-1-2034 | 1,250,000 | 1,250,000 | ||||||||||||
Wichita KS HCFR Presbyterian Manors Obligated Group | 4.00 | 5-15-2022 | 1,250,000 | 1,243,500 | ||||||||||||
Wichita KS HCFR Series I | 3.75 | 5-15-2023 | 1,410,000 | 1,387,355 | ||||||||||||
| 3,880,855 | ||||||||||||||||
|
| |||||||||||||||
| Housing Revenue: 0.44% | ||||||||||||||||
Kansas HFA Forest Glen Apartments Project Series B | 1.66 | 7-1-2022 | 8,300,000 | 8,373,206 | ||||||||||||
|
| |||||||||||||||
| Utilities Revenue: 0.16% | ||||||||||||||||
Burlington KS Environmental Impact Series A ø | 0.34 | 9-1-2035 | 3,000,000 | 3,000,000 | ||||||||||||
|
| |||||||||||||||
| 15,254,061 | ||||||||||||||||
|
| |||||||||||||||
The accompanying notes are an integral part of these financial statements.
Wells Fargo Ultra Short-Term Municipal Income Fund | 17
Portfolio of investments—June 30, 2020
| Interest rate | Maturity date | Principal | Value | |||||||||||||
Kentucky: 1.23% |
| |||||||||||||||
| Airport Revenue: 0.07% | ||||||||||||||||
Louisville KY Regional Airport Authority Refunding Bond AMT Series A | 5.00 | % | 7-1-2021 | $ | 1,250,000 | $ | 1,300,638 | |||||||||
|
| |||||||||||||||
| Health Revenue: 0.04% | ||||||||||||||||
Kentucky EDFA Owensboro Health Incorporated Series A | 5.00 | 6-1-2021 | 825,000 | 843,802 | ||||||||||||
|
| |||||||||||||||
| Housing Revenue: 0.53% | ||||||||||||||||
Kentucky Housing MFHR City View Park Project | 1.16 | 2-1-2023 | 10,000,000 | 10,072,600 | ||||||||||||
|
| |||||||||||||||
| Utilities Revenue: 0.59% | ||||||||||||||||
Louisville & Jefferson Counties KY Metro Government PCR Series B | 2.55 | 11-1-2027 | 6,500,000 | 6,589,635 | ||||||||||||
Paducah KY Electric Plant Board Refunding Bond | 5.00 | 10-1-2021 | 2,305,000 | 2,430,507 | ||||||||||||
Paducah KY Electric Plant Board Refunding Bond | 5.00 | 10-1-2023 | 1,995,000 | 2,267,537 | ||||||||||||
| 11,287,679 | ||||||||||||||||
|
| |||||||||||||||
| 23,504,719 | ||||||||||||||||
|
| |||||||||||||||
Louisiana: 1.71% |
| |||||||||||||||
| Airport Revenue: 0.32% | ||||||||||||||||
Louisiana Offshore Terminal Authority Deepwater Loop LLC Project Series B-1A | 2.00 | 10-1-2040 | 5,540,000 | 5,480,556 | ||||||||||||
New Orleans LA Aviation Board Series D-2 | 5.00 | 1-1-2021 | 590,000 | 601,706 | ||||||||||||
| 6,082,262 | ||||||||||||||||
|
| |||||||||||||||
| Housing Revenue: 0.21% | ||||||||||||||||
Louisiana Housing Corporation Hollywood Acres & Hollywood Heights Project Series 2019 | 1.44 | 12-1-2023 | 4,000,000 | 4,040,680 | ||||||||||||
|
| |||||||||||||||
| Industrial Development Revenue: 1.18% | ||||||||||||||||
Saint John The Baptist Parish LA Revenue Refunding Bond Marathon Oil Corporation Project | 2.00 | 6-1-2037 | 8,045,000 | 7,972,515 | ||||||||||||
St. James Parish LA Nucor Steel LLC Project Gulf Opportunity Zone Series A-1 ø | 0.31 | 11-1-2040 | 14,550,000 | 14,550,000 | ||||||||||||
| 22,522,515 | ||||||||||||||||
|
| |||||||||||||||
| 32,645,457 | ||||||||||||||||
|
| |||||||||||||||
Maine: 0.13% |
| |||||||||||||||
| Education Revenue: 0.05% | ||||||||||||||||
Maine Student Loan Authority AMT Refunding Student Loan Revenue Bond Class A Series 2019A-1 (AGM Insured) | 5.00 | 12-1-2020 | 200,000 | 203,058 | ||||||||||||
Maine Student Loan Authority AMT Refunding Student Loan Revenue Bond Class A Series 2019A-1 (AGM Insured) | 5.00 | 12-1-2021 | 300,000 | 315,258 | ||||||||||||
Maine Student Loan Authority AMT Refunding Student Loan Revenue Bond Class A Series 2019A-1 (AGM Insured) | 5.00 | 12-1-2022 | 370,000 | 401,687 | ||||||||||||
| 920,003 | ||||||||||||||||
|
| |||||||||||||||
| Health Revenue: 0.08% | ||||||||||||||||
Maine HEFA Series A | 4.00 | 7-1-2024 | 755,000 | 833,928 | ||||||||||||
Maine HEFA Series A | 5.00 | 7-1-2023 | 575,000 | 642,862 | ||||||||||||
| 1,476,790 | ||||||||||||||||
|
| |||||||||||||||
| 2,396,793 | ||||||||||||||||
|
| |||||||||||||||
The accompanying notes are an integral part of these financial statements.
18 | Wells Fargo Ultra Short-Term Municipal Income Fund
Portfolio of investments—June 30, 2020
| Interest rate | Maturity date | Principal | Value | |||||||||||||
Maryland: 3.53% |
| |||||||||||||||
| Health Revenue: 1.34% | ||||||||||||||||
Tender Option Bond Trust Receipts/Certificates (Deutsche Bank LIQ) 144Aø | 0.28 | % | 8-15-2042 | $ | 10,590,000 | $ | 10,590,000 | |||||||||
Tender Option Bond Trust Receipts/Certificates (JPMorgan Chase & Company LIQ) 144Aø | 0.17 | 5-1-2026 | 15,000,000 | 15,000,000 | ||||||||||||
| 25,590,000 | ||||||||||||||||
|
| |||||||||||||||
| Housing Revenue: 1.51% | ||||||||||||||||
Maryland CDA Department of Housing & Community Multifamily Development Orchard Park Series F | 2.52 | 8-1-2020 | 6,000,000 | 6,006,000 | ||||||||||||
Maryland Community Development Administration Heritage Crossing II Series G | 2.93 | 11-1-2020 | 7,600,000 | 7,641,648 | ||||||||||||
Maryland Community Development Administration Willow Manor at Fairland Series I | 2.93 | 11-1-2020 | 10,000,000 | 10,054,100 | ||||||||||||
Maryland Community Development Department Housing Rosemont Tower LLC Series F (FHA/GNMA Insured) | 2.01 | 11-1-2021 | 5,000,000 | 5,048,350 | ||||||||||||
| 28,750,098 | ||||||||||||||||
|
| |||||||||||||||
| Transportation Revenue: 0.55% | ||||||||||||||||
Maryland Transportation Authority Refunding Bond AMT | 5.00 | 3-1-2021 | 4,000,000 | 4,103,640 | ||||||||||||
Maryland Transportation Authority Refunding Bond AMT | 5.00 | 3-1-2022 | 6,000,000 | 6,377,460 | ||||||||||||
| 10,481,100 | ||||||||||||||||
|
| |||||||||||||||
| Water & Sewer Revenue: 0.13% | ||||||||||||||||
Baltimore MD Series A (National Insured) | 5.65 | 7-1-2020 | 2,400,000 | 2,400,000 | ||||||||||||
|
| |||||||||||||||
| 67,221,198 | ||||||||||||||||
|
| |||||||||||||||
Massachusetts: 1.17% |
| |||||||||||||||
| Health Revenue: 0.26% | ||||||||||||||||
Massachusetts HEFA Partners Healthcare Series G-2 (AGM Insured) (m) | 0.97 | 7-1-2042 | 5,020,000 | 5,020,000 | ||||||||||||
|
| |||||||||||||||
| Housing Revenue: 0.11% | ||||||||||||||||
Massachusetts HFA Series 212 | 1.45 | 12-1-2049 | 2,000,000 | 2,025,020 | ||||||||||||
|
| |||||||||||||||
| Tax Revenue: 0.24% | ||||||||||||||||
Massachusetts Bay Transportation Authority Series B-1 | 5.00 | 7-1-2023 | 1,775,000 | 2,019,524 | ||||||||||||
Massachusetts Bay Transportation Authority Series B-1 | 5.00 | 7-1-2024 | 2,200,000 | 2,595,406 | ||||||||||||
| 4,614,930 | ||||||||||||||||
|
| |||||||||||||||
| Transportation Revenue: 0.56% | ||||||||||||||||
Massachusetts Department of Transportation Refunding Bond | 5.00 | 1-1-2039 | 9,525,000 | 10,551,414 | ||||||||||||
|
| |||||||||||||||
| 22,211,364 | ||||||||||||||||
|
| |||||||||||||||
Michigan: 0.98% |
| |||||||||||||||
| Health Revenue: 0.05% | ||||||||||||||||
Michigan Finance Authority Bronson Healthcare Group Incorporated Series 2019B | 3.50 | 11-15-2044 | 800,000 | 849,656 | ||||||||||||
|
| |||||||||||||||
| Housing Revenue: 0.21% | ||||||||||||||||
Michigan Housing Development Authority Series A | 2.30 | 10-1-2021 | 4,000,000 | 4,005,160 | ||||||||||||
|
| |||||||||||||||
The accompanying notes are an integral part of these financial statements.
Wells Fargo Ultra Short-Term Municipal Income Fund | 19
Portfolio of investments—June 30, 2020
| Interest rate | Maturity date | Principal | Value | |||||||||||||
| Tax Revenue: 0.49% | ||||||||||||||||
Tender Option Bond Trust Receipts/Certificates (AGM Insured, Morgan Stanley Bank LIQ) 144Aø | 0.43 | % | 7-1-2043 | $ | 9,410,000 | $ | 9,410,000 | |||||||||
|
| |||||||||||||||
| Utilities Revenue: 0.23% | ||||||||||||||||
Michigan Strategic Fund Limited Obligation Detroit Edison Company Facilities Project | 1.45 | 8-1-2029 | 4,300,000 | 4,319,823 | ||||||||||||
|
| |||||||||||||||
| 18,584,639 | ||||||||||||||||
|
| |||||||||||||||
Minnesota: 2.38% |
| |||||||||||||||
| GO Revenue: 2.10% | ||||||||||||||||
JPMorgan Chase Puttable Tax-Exempt Receipts Trust Series 5027 (JPMorgan Chase & Company LIQ) 144Aø | 0.38 | 6-1-2021 | 40,000,000 | 40,000,000 | ||||||||||||
|
| |||||||||||||||
| Health Revenue: 0.12% | ||||||||||||||||
Apple Valley MN Senior Living LLC Project Series B | 4.00 | 1-1-2021 | 545,000 | 534,803 | ||||||||||||
Apple Valley MN Senior Living LLC Project Series B | 4.00 | 1-1-2022 | 565,000 | 534,298 | ||||||||||||
Minnesota HCFR Maple Grove Hospital Corporation | 4.00 | 5-1-2021 | 390,000 | 398,631 | ||||||||||||
Minnesota HCFR Maple Grove Hospital Corporation | 4.00 | 5-1-2022 | 390,000 | 408,615 | ||||||||||||
Minnesota HCFR Maple Grove Hospital Corporation | 5.00 | 5-1-2023 | 390,000 | 428,403 | ||||||||||||
| 2,304,750 | ||||||||||||||||
|
| |||||||||||||||
| Miscellaneous Revenue: 0.16% | ||||||||||||||||
Minnesota Rural Water Finance Authority Public Projects Construction | 1.00 | 8-1-2021 | 3,000,000 | 3,010,590 | ||||||||||||
|
| |||||||||||||||
| 45,315,340 | ||||||||||||||||
|
| |||||||||||||||
Mississippi: 0.83% |
| |||||||||||||||
| Health Revenue: 0.25% | ||||||||||||||||
Mississippi Hospital Equipment & Facilities Authority Baptist Memorial Health Care Project | 1.98 | 9-1-2036 | 4,760,000 | 4,759,429 | ||||||||||||
|
| |||||||||||||||
| Housing Revenue: 0.58% | ||||||||||||||||
Mississippi Home Corporation Jackson Housing Authority Project (Housing & Urban Development Insured) | 2.21 | 2-1-2022 | 11,000,000 | 11,013,420 | ||||||||||||
|
| |||||||||||||||
| 15,772,849 | ||||||||||||||||
|
| |||||||||||||||
Missouri: 0.76% |
| |||||||||||||||
| Health Revenue: 0.21% | ||||||||||||||||
Missouri State HEFA Ascension Health Series C-3 ø | 0.13 | 11-15-2039 | 600,000 | 600,000 | ||||||||||||
RBC Municipal Products Incorporated (Royal Bank of Canada LOC, Royal Bank of Canada LIQ) 144Aø | 0.20 | 9-1-2039 | 3,500,000 | 3,500,000 | ||||||||||||
| 4,100,000 | ||||||||||||||||
|
| |||||||||||||||
| Miscellaneous Revenue: 0.55% | ||||||||||||||||
Bridgeton MO IDA Mestek Machinery Incorporated (Santander Bank NA LOC) ø | 0.55 | 7-1-2030 | 2,425,000 | 2,425,000 | ||||||||||||
Missouri Public Utilities Commission Interim Construction Series 2019 | 1.50 | 3-1-2021 | 8,000,000 | 8,012,640 | ||||||||||||
| 10,437,640 | ||||||||||||||||
|
| |||||||||||||||
| 14,537,640 | ||||||||||||||||
|
| |||||||||||||||
The accompanying notes are an integral part of these financial statements.
20 | Wells Fargo Ultra Short-Term Municipal Income Fund
Portfolio of investments—June 30, 2020
| Interest rate | Maturity date | Principal | Value | |||||||||||||
Montana: 0.24% |
| |||||||||||||||
| Miscellaneous Revenue: 0.24% | ||||||||||||||||
Montana Board Investment Municipal Finance Consolidation Act INTERCAP | 1.00 | % | 3-1-2042 | $ | 4,500,000 | $ | 4,501,755 | |||||||||
|
| |||||||||||||||
Nebraska: 0.17% |
| |||||||||||||||
| Housing Revenue: 0.17% | ||||||||||||||||
Nebraska Investment Finance Authority Series D (GNMA/FNMA/FHLMC Insured) | 3.30 | 9-1-2020 | 460,000 | 461,835 | ||||||||||||
Nebraska Investment Finance Authority Series D (GNMA/FNMA/FHLMC Insured) | 3.65 | 3-1-2021 | 1,265,000 | 1,288,137 | ||||||||||||
Nebraska Investment Finance Authority Series D (GNMA/FNMA/FHLMC Insured) | 3.65 | 9-1-2021 | 1,390,000 | 1,434,105 | ||||||||||||
| 3,184,077 | ||||||||||||||||
|
| |||||||||||||||
Nevada: 1.00% |
| |||||||||||||||
| GO Revenue: 0.15% | ||||||||||||||||
Clark County NV School District Refunding Bond Limited Tax Series A | 5.00 | 6-15-2023 | 2,095,000 | 2,348,516 | ||||||||||||
Clark County NV School District Refunding Bond Limited Tax Series C | 5.00 | 6-15-2023 | 500,000 | 560,505 | ||||||||||||
| 2,909,021 | ||||||||||||||||
|
| |||||||||||||||
| Housing Revenue: 0.32% | ||||||||||||||||
Nevada Housing Division Multi Unit Housing Silver Terrace | 1.19 | 10-1-2022 | 6,000,000 | 6,021,840 | ||||||||||||
|
| |||||||||||||||
| Tax Revenue: 0.21% | ||||||||||||||||
Tender Option Bond Trust Receipts/Certificates (Royal Bank of Canada LOC, Royal Bank of Canada LIQ) 144Aø | 0.17 | 7-1-2026 | 4,100,000 | 4,100,000 | ||||||||||||
|
| |||||||||||||||
| Utilities Revenue: 0.32% | ||||||||||||||||
Washoe County NV Water Facility Refunding Bond Series F | 2.05 | 3-1-2036 | 6,000,000 | 6,085,560 | ||||||||||||
|
| |||||||||||||||
| 19,116,421 | ||||||||||||||||
|
| |||||||||||||||
New Hampshire: 0.32% |
| |||||||||||||||
| Industrial Development Revenue: 0.32% | ||||||||||||||||
National Finance Authority New Hampshire Exempt Facilities Emerald Renewable Diesel LLC Project 144A | 2.00 | 6-1-2049 | 6,000,000 | 6,007,860 | ||||||||||||
|
| |||||||||||||||
New Jersey: 5.02% |
| |||||||||||||||
| Education Revenue: 0.11% | ||||||||||||||||
New Jersey Higher Education Assistance Authority Series B | 5.00 | 12-1-2021 | 2,000,000 | 2,098,820 | ||||||||||||
|
| |||||||||||||||
| Health Revenue: 0.12% | ||||||||||||||||
New Jersey HFFA St. Joseph’s Healthcare System Group | 4.00 | 7-1-2020 | 1,540,000 | 1,540,000 | ||||||||||||
New Jersey HFFA St. Joseph’s Healthcare System Group | 5.00 | 7-1-2021 | 780,000 | 806,052 | ||||||||||||
| 2,346,052 | ||||||||||||||||
|
| |||||||||||||||
| Housing Revenue: 1.78% | ||||||||||||||||
New Jersey Housing & Mortgage Finance Agency Multifamily Conduit Post Road Gardens Series A | 0.75 | 5-1-2023 | 3,000,000 | 3,010,740 | ||||||||||||
New Jersey Housing & Mortgage Finance Agency Peter J McGuire Gardens Preservation Project Series G | 1.45 | 11-1-2022 | 13,160,000 | 13,338,844 | ||||||||||||
New Jersey Housing & Mortgage Finance Agency Series A | 1.75 | 11-1-2020 | 6,455,000 | 6,481,788 | ||||||||||||
New Jersey Housing & Mortgage Finance Agency Series E | 2.30 | 11-1-2020 | 1,040,000 | 1,045,138 | ||||||||||||
The accompanying notes are an integral part of these financial statements.
Wells Fargo Ultra Short-Term Municipal Income Fund | 21
Portfolio of investments—June 30, 2020
| Interest rate | Maturity date | Principal | Value | |||||||||||||
| Housing Revenue (continued) | ||||||||||||||||
New Jersey Housing & Mortgage Finance Agency Villa Victoria Apartments Project Series F | 2.43 | % | 11-1-2021 | $ | 10,000,000 | $ | 10,054,600 | |||||||||
| 33,931,110 | ||||||||||||||||
|
| |||||||||||||||
| Miscellaneous Revenue: 1.41% | ||||||||||||||||
New Jersey EDA School Facilities Construction Notes Series BBB | 5.00 | 6-15-2021 | 3,910,000 | 4,011,113 | ||||||||||||
New Jersey EDA School Facilities Construction Notes Series DDD | 5.00 | 6-15-2022 | 780,000 | 820,287 | ||||||||||||
New Jersey EDA Transportation Project Series B | 5.00 | 11-1-2020 | 10,820,000 | 10,922,033 | ||||||||||||
New Jersey TTFA Series A | 5.25 | 12-15-2022 | 1,295,000 | 1,386,181 | ||||||||||||
Tender Option Bond Trust Receipts Series 2017-XI0052 (Barclays Bank plc LOC, Barclays Bank plc LIQ) 144Aø | 0.16 | 6-15-2042 | 9,725,000 | 9,725,000 | ||||||||||||
| 26,864,614 | ||||||||||||||||
|
| |||||||||||||||
| Transportation Revenue: 1.34% | ||||||||||||||||
New Jersey Transportation Trust Fund Series B | 5.00 | 6-15-2021 | 2,290,000 | 2,349,219 | ||||||||||||
New Jersey Transportation Trust Fund Series D | 5.25 | 12-15-2023 | 2,500,000 | 2,739,700 | ||||||||||||
New Jersey Turnpike Authority Series C-5 (1 Month LIBOR +0.46%) ± | 0.58 | 1-1-2028 | 20,330,000 | 20,312,923 | ||||||||||||
| 25,401,842 | ||||||||||||||||
|
| |||||||||||||||
| Water & Sewer Revenue: 0.26% | ||||||||||||||||
New Jersey EDA Refunding Bond AMT American Water Company Incorporated | 1.20 | 11-1-2034 | 5,000,000 | 4,992,800 | ||||||||||||
|
| |||||||||||||||
| 95,635,238 | ||||||||||||||||
|
| |||||||||||||||
New York: 10.44% |
| |||||||||||||||
| Airport Revenue: 0.13% | ||||||||||||||||
New York Transportation Development Corporation Special Refunding Bond Terminal One Group Association | 5.00 | 1-1-2021 | 2,500,000 | 2,519,675 | ||||||||||||
|
| |||||||||||||||
| GO Revenue: 3.16% | ||||||||||||||||
Elmira City NY Tax Anticipation Notes | 4.00 | 5-27-2021 | 790,000 | 790,885 | ||||||||||||
Hempstead NY Union Free School District Anticipation Notes | 1.75 | 12-15-2020 | 1,625,000 | 1,627,941 | ||||||||||||
Nassau County NY General Improvement Series B | 5.00 | 10-1-2020 | 1,305,000 | 1,319,747 | ||||||||||||
New York NY Adjusted Fiscal 2008 Subordinate Bond Series A-4 (AGM Insured) (m) | 0.97 | 8-1-2026 | 1,000,000 | 1,000,000 | ||||||||||||
New York NY Adjusted Fiscal 2008 Subordinate Bond Series C-4 (AGC Insured) (m) | 0.97 | 10-1-2027 | 14,400,000 | 14,400,000 | ||||||||||||
New York NY Series J Subordinate Bond Series J3 (AGM Insured) (m) | 0.97 | 6-1-2036 | 4,750,000 | 4,750,000 | ||||||||||||
New York NY Subordinate Bond Series C-4 (AGM Insured) (m) | 0.97 | 1-1-2032 | 800,000 | 800,000 | ||||||||||||
Oyster Bay NY Public Improvement Series B | 3.00 | 2-1-2021 | 2,260,000 | 2,276,091 | ||||||||||||
Oyster Bay NY Water District Series B | 2.00 | 3-12-2021 | 5,000,000 | 5,055,650 | ||||||||||||
Suffolk County NY Series A | 5.00 | 3-19-2021 | 6,000,000 | 6,139,440 | ||||||||||||
Suffolk County NY Tax Anticipation Notes Series I | 2.00 | 9-25-2020 | 2,125,000 | 2,130,015 | ||||||||||||
Suffolk County NY Tax Anticipation Notes Series I | 2.50 | 7-23-2020 | 20,000,000 | 20,018,400 | ||||||||||||
| 60,308,169 | ||||||||||||||||
|
| |||||||||||||||
| Health Revenue: 0.04% | ||||||||||||||||
New York Dormitory Authority Orange Regional Medical Center 144A | 4.00 | 12-1-2020 | 800,000 | 808,680 | ||||||||||||
|
| |||||||||||||||
| Housing Revenue: 0.81% | ||||||||||||||||
New York Mortgage Agency Homeowner Revenue Series 183 | 3.50 | 4-1-2022 | 1,200,000 | 1,253,964 | ||||||||||||
New York Mortgage Agency Homeowner Revenue Series 198 | 1.50 | 10-1-2020 | 2,235,000 | 2,239,403 | ||||||||||||
New York NY Housing Development Corporation Series A-3 | 1.13 | 5-1-2060 | 4,000,000 | 4,000,960 | ||||||||||||
The accompanying notes are an integral part of these financial statements.
22 | Wells Fargo Ultra Short-Term Municipal Income Fund
Portfolio of investments—June 30, 2020
| Interest rate | Maturity date | Principal | Value | |||||||||||||
| Housing Revenue (continued) | ||||||||||||||||
New York NY Housing Development Corporation Series G-2 | 2.00 | % | 11-1-2057 | $ | 7,970,000 | $ | 7,978,289 | |||||||||
| 15,472,616 | ||||||||||||||||
|
| |||||||||||||||
| Industrial Development Revenue: 1.15% | ||||||||||||||||
New York Energy Research & Development Authority PCR Keyspan Generation Series A (Ambac Insured) (m) | 2.75 | 10-1-2028 | 900,000 | 900,000 | ||||||||||||
New York Transportation Development Corporation Series 2018 | 5.00 | 1-1-2022 | 2,000,000 | 2,078,460 | ||||||||||||
New York Transportation Development Corporation Series 2018 | 5.00 | 1-1-2023 | 12,750,000 | 13,336,245 | ||||||||||||
New York Transportation Development Corporation Special Facilities Revenue Delta Airlines Incorporated LaGuardia Airport Terminals C&D Redevelopment | 5.00 | 1-1-2024 | 5,250,000 | 5,536,125 | ||||||||||||
| 21,850,830 | ||||||||||||||||
|
| |||||||||||||||
| Tax Revenue: 1.51% | ||||||||||||||||
New York Dormitory Authority Personal Income Tax Revenue Series B | 5.00 | 3-31-2021 | 18,000,000 | 18,633,240 | ||||||||||||
New York NY Transitional Finance Authority Subordinate Bond Series 1-B (SIFMA Municipal Swap +0.80%) ± | 0.93 | 11-1-2022 | 10,075,000 | 10,079,836 | ||||||||||||
| 28,713,076 | ||||||||||||||||
|
| |||||||||||||||
| Transportation Revenue: 3.55% | ||||||||||||||||
New York Metropolitan Transportation Authority BAN | 4.00 | 2-1-2022 | 3,950,000 | 4,048,276 | ||||||||||||
New York Metropolitan Transportation Authority BAN | 5.00 | 2-1-2023 | 4,050,000 | 4,291,016 | ||||||||||||
New York Metropolitan Transportation Authority Series B (1 Month LIBOR +0.55%) ± | 0.67 | 11-1-2041 | 6,255,000 | 5,897,402 | ||||||||||||
New York Metropolitan Transportation Authority Subordinate Bond Series D2 (SIFMA Municipal Swap +0.45%) ±## | 0.58 | 11-15-2044 | 18,460,000 | 17,642,776 | ||||||||||||
New York Metropolitan Transportation Authority Subordinate Bond Series G-1F (1 Month LIBOR +0.65%) ± | 0.77 | 11-1-2026 | 24,965,000 | 24,344,120 | ||||||||||||
Triborough Bridge & Tunnel Authority Series A | 5.00 | 11-15-2023 | 1,570,000 | 1,751,994 | ||||||||||||
Triborough Bridge & Tunnel Authority Series B-4 (1 Month LIBOR +0.70%) ± | 0.82 | 1-1-2032 | 9,730,000 | 9,694,388 | ||||||||||||
| 67,669,972 | ||||||||||||||||
|
| |||||||||||||||
| Utilities Revenue: 0.09% | ||||||||||||||||
Tender Option Bond Trust Receipts/Certificates (JPMorgan Chase & Company LIQ) 144Aø | 0.17 | 11-15-2050 | 1,650,000 | 1,650,000 | ||||||||||||
|
| |||||||||||||||
| 198,993,018 | ||||||||||||||||
|
| |||||||||||||||
North Carolina: 2.11% |
| |||||||||||||||
| Airport Revenue: 0.39% | ||||||||||||||||
North Carolina Tender Option Bond Trust Receipts/Floater Certificates Series 2017-ZF2490 (Barclays Bank plc LIQ) 144Aø | 0.16 | 7-1-2042 | 7,500,000 | 7,500,000 | ||||||||||||
|
| |||||||||||||||
| Housing Revenue: 1.38% | ||||||||||||||||
Charlotte NC Housing Authority Heritage Park Housing LP | 1.45 | 6-1-2022 | 7,500,000 | 7,551,150 | ||||||||||||
Charlotte NC Housing Authority West Tyvola Seniors LLC | 2.23 | 12-1-2021 | 6,000,000 | 6,035,580 | ||||||||||||
Durham NC Housing Authority Morreene Road Apartments Project | 1.30 | 1-1-2021 | 3,100,000 | 3,105,177 | ||||||||||||
Raleigh NC Housing Authority Sir Walter Apartments Project Series A | 2.15 | 7-1-2021 | 9,600,000 | 9,600,000 | ||||||||||||
| 26,291,907 | ||||||||||||||||
|
| |||||||||||||||
| Resource Recovery Revenue: 0.34% | ||||||||||||||||
North Carolina Capital Finance Republic Services Incorporated Project Series 2013 | 0.70 | 6-1-2038 | 6,500,000 | 6,500,130 | ||||||||||||
|
| |||||||||||||||
| 40,292,037 | ||||||||||||||||
|
| |||||||||||||||
The accompanying notes are an integral part of these financial statements.
Wells Fargo Ultra Short-Term Municipal Income Fund | 23
Portfolio of investments—June 30, 2020
| Interest rate | Maturity date | Principal | Value | |||||||||||||
North Dakota: 0.45% |
| |||||||||||||||
| Housing Revenue: 0.45% | ||||||||||||||||
North Dakota Housing Finance Agency Home Mortgage Finance Program Series B (SIFMA Municipal Swap +0.40%) ± | 0.53 | % | 1-1-2043 | $ | 8,500,000 | $ | 8,485,635 | |||||||||
|
| |||||||||||||||
Ohio: 1.47% |
| |||||||||||||||
| Education Revenue: 0.03% | ||||||||||||||||
The Ohio State University Series B-1 ø | 0.12 | 12-1-2039 | 500,000 | 500,000 | ||||||||||||
|
| |||||||||||||||
| GO Revenue: 0.49% | ||||||||||||||||
Fairfield OH BAN | 2.25 | 4-27-2021 | 1,770,000 | 1,791,275 | ||||||||||||
Lorain County OH BAN | 3.00 | 2-6-2021 | 4,510,000 | 4,570,344 | ||||||||||||
North Olmsted OH BAN Capital Improvement and Equipment | 2.00 | 3-10-2021 | 1,025,000 | 1,032,893 | ||||||||||||
Tipp City OH BAN | 2.00 | 2-11-2021 | 2,000,000 | 2,020,120 | ||||||||||||
| 9,414,632 | ||||||||||||||||
|
| |||||||||||||||
| Health Revenue: 0.33% | ||||||||||||||||
Allen County OH Mercy Health Hospital | 5.00 | 12-1-2024 | 2,325,000 | 2,703,998 | ||||||||||||
Allen County OH Mercy Health Hospital Series A | 5.00 | 8-1-2021 | 2,795,000 | 2,917,924 | ||||||||||||
Lucas County OH Hospital Promedica Healthcare Series D | 5.00 | 11-15-2021 | 715,000 | 747,189 | ||||||||||||
| 6,369,111 | ||||||||||||||||
|
| |||||||||||||||
| Housing Revenue: 0.48% | ||||||||||||||||
Cuyahoga OH Metropolitan Housing Authority Multifamily Housing Riverside Park Phase 2 Project | 2.00 | 4-1-2022 | 4,750,000 | 4,789,140 | ||||||||||||
Mizuho Floater/Residual Trust Various States Series 2019-MIZ9001 (Mizuho Capital Markets LLC LOC, Mizuho Capital Markets LLC LIQ) 144Aø | 0.33 | 7-1-2059 | 4,375,000 | 4,375,000 | ||||||||||||
| 9,164,140 | ||||||||||||||||
|
| |||||||||||||||
| Miscellaneous Revenue: 0.14% | ||||||||||||||||
Village of Orange OH BAN | 2.00 | 8-27-2020 | 2,575,000 | 2,581,232 | ||||||||||||
|
| |||||||||||||||
| 28,029,115 | ||||||||||||||||
|
| |||||||||||||||
Oklahoma: 0.19% |
| |||||||||||||||
| Education Revenue: 0.03% | ||||||||||||||||
Oklahoma Development Finance Authority Oklahoma City University Project | 3.00 | 8-1-2020 | 500,000 | 500,385 | ||||||||||||
|
| |||||||||||||||
| GO Revenue: 0.05% | ||||||||||||||||
Oklahoma County OK Independent School District | 1.75 | 7-1-2020 | 950,000 | 950,000 | ||||||||||||
|
| |||||||||||||||
| Miscellaneous Revenue: 0.11% | ||||||||||||||||
Kay County OK Public Building Authority | 4.00 | 4-1-2021 | 350,000 | 356,762 | ||||||||||||
Kay County OK Public Building Authority | 4.00 | 4-1-2022 | 400,000 | 417,244 | ||||||||||||
Kay County OK Public Building Authority | 4.00 | 4-1-2023 | 450,000 | 479,988 | ||||||||||||
Oklahoma County OK Finance Authority Jones Public School Project | 4.00 | 9-1-2023 | 330,000 | 354,994 | ||||||||||||
Oklahoma County OK Finance Authority Jones Public School Project | 4.00 | 9-1-2024 | 525,000 | 574,145 | ||||||||||||
| 2,183,133 | ||||||||||||||||
|
| |||||||||||||||
| 3,633,518 | ||||||||||||||||
|
| |||||||||||||||
Oregon: 0.62% |
| |||||||||||||||
| Airport Revenue: 0.07% | ||||||||||||||||
Port of Portland OR Portland International Airport AMT | 5.00 | 7-1-2022 | 1,200,000 | 1,292,700 | ||||||||||||
|
| |||||||||||||||
The accompanying notes are an integral part of these financial statements.
24 | Wells Fargo Ultra Short-Term Municipal Income Fund
Portfolio of investments—June 30, 2020
| Interest rate | Maturity date | Principal | Value | |||||||||||||
| Industrial Development Revenue: 0.55% |
| |||||||||||||||
Oregon Business Development Commission Intel Corporation Project Series 232 | 2.40 | % | 12-1-2040 | $ | 10,000,000 | $ | 10,458,700 | |||||||||
|
| |||||||||||||||
| 11,751,400 | ||||||||||||||||
|
| |||||||||||||||
Pennsylvania: 4.23% |
| |||||||||||||||
| Education Revenue: 0.71% | ||||||||||||||||
Chester County PA HEFA Immaculata University Project | 5.00 | 11-1-2020 | 550,000 | 547,267 | ||||||||||||
Chester County PA HEFA Immaculata University Project | 5.00 | 11-1-2021 | 580,000 | 568,812 | ||||||||||||
Cumberland County PA Authority Association of Independent Colleges & Universities of Pennsylvania Financing Program Series T-1 | 3.75 | 5-1-2044 | 2,000,000 | 2,012,640 | ||||||||||||
Pennsylvania HEFA Association of Independent Colleges & Universities of Pennsylvania Financing Program Series T-3 ø | 3.00 | 5-1-2033 | 2,000,000 | 2,020,600 | ||||||||||||
Pennsylvania HEFA Independent Colleges Series I4 | 2.72 | 11-1-2031 | 3,000,000 | 3,013,170 | ||||||||||||
Pennsylvania HEFA Wilkes University Project Series A | 5.00 | 3-1-2021 | 390,000 | 394,196 | ||||||||||||
Pennsylvania HEFAR Association of Independent Colleges and Universities of Pennsylvania Financing Program Mount Aloysius College Project Series R-1 | 2.25 | 11-1-2041 | 5,000,000 | 5,033,050 | ||||||||||||
| 13,589,735 | ||||||||||||||||
|
| |||||||||||||||
| GO Revenue: 0.26% | ||||||||||||||||
Albert Gallatin PA Area School District Series A (AGM Insured) %% | 4.00 | 9-1-2024 | 725,000 | 804,605 | ||||||||||||
Albert Gallatin PA Area School District Series A (AGM Insured) %% | 4.00 | 9-1-2023 | 1,000,000 | 1,087,910 | ||||||||||||
Allentown PA City School District Tax & Revenue Anticipation Notes %% | 2.38 | 3-31-2021 | 1,800,000 | 1,800,000 | ||||||||||||
Hollidaysburg PA Area School District %% | 4.00 | 7-15-2023 | 525,000 | 574,481 | ||||||||||||
Octorara PA Area School District (AGM Insured) | 4.00 | 4-1-2025 | 600,000 | 689,286 | ||||||||||||
| 4,956,282 | ||||||||||||||||
|
| |||||||||||||||
| Health Revenue: 0.33% | ||||||||||||||||
Berks County PA Municipal Authority Tower Health Project Series A | 5.00 | 2-1-2022 | 500,000 | 527,085 | ||||||||||||
Montgomery County PA Higher Education & Health Authority Presbytery Homes Incorporated Project | 2.00 | 12-1-2020 | 505,000 | 501,980 | ||||||||||||
Montgomery County PA Higher Education & Health Authority Presbytery Homes Incorporated Project | 3.00 | 12-1-2021 | 560,000 | 556,086 | ||||||||||||
Montgomery County PA Higher Education & Health Authority Series 2018A | 5.00 | 9-1-2022 | 1,250,000 | 1,350,313 | ||||||||||||
Philadelphia PA Hospital & Higher Education Facilities Authority | 5.00 | 7-1-2020 | 780,000 | 780,000 | ||||||||||||
Quakertown PA Health Facilities Authority Series A | 3.13 | 7-1-2021 | 2,595,000 | 2,546,525 | ||||||||||||
| 6,261,989 | ||||||||||||||||
|
| |||||||||||||||
| Housing Revenue: 1.07% | ||||||||||||||||
Pennsylvania HFA Limited Obligation Norris Homes Phase V | 1.40 | 1-1-2043 | 10,500,000 | 10,665,047 | ||||||||||||
Pennsylvania HFA Series 114A | 2.90 | 10-1-2021 | 3,145,000 | 3,223,090 | ||||||||||||
Pennsylvania Housing Finance Agency Sharpsburg Towers Series B | 2.40 | 12-1-2021 | 2,500,000 | 2,516,475 | ||||||||||||
Pittsburgh PA Urban RDA Crawford Square Apartments Project | 0.60 | 12-1-2020 | 4,000,000 | 3,999,280 | ||||||||||||
| 20,403,892 | ||||||||||||||||
|
| |||||||||||||||
| Industrial Development Revenue: 0.21% | ||||||||||||||||
Montgomery County PA IDA Peco Energy Company Project Series A | 2.60 | 3-1-2034 | 3,910,000 | 3,922,004 | ||||||||||||
|
| |||||||||||||||
| Miscellaneous Revenue: 0.74% | ||||||||||||||||
Bethlehem PA School District Revenue (1 Month LIBOR +0.48%) ± | 0.61 | 7-1-2031 | 9,975,000 | 9,885,125 | ||||||||||||
Butler County General Authority Hampton Township School District Project Series 2007 (AGM Insured, PNC Bank NA SPA) ø | 0.11 | 9-1-2027 | 4,250,000 | 4,250,000 | ||||||||||||
| 14,135,125 | ||||||||||||||||
|
| |||||||||||||||
The accompanying notes are an integral part of these financial statements.
Wells Fargo Ultra Short-Term Municipal Income Fund | 25
Portfolio of investments—June 30, 2020
| Interest rate | Maturity date | Principal | Value | |||||||||||||
| Tobacco Revenue: 0.30% |
| |||||||||||||||
Tender Option Bond Trust Receipts/Certificates (Barclays Bank plc LOC, Barclays Bank plc LIQ) 144Aø | 0.23 | % | 6-1-2034 | $ | 5,650,000 | $ | 5,650,000 | |||||||||
|
| |||||||||||||||
| Water & Sewer Revenue: 0.61% | ||||||||||||||||
Pittsburgh PA Water & Sewer Authority Series C (1 Month LIBOR +0.64%) (AGM Insured) ± | 0.77 | 9-1-2040 | 11,730,000 | 11,680,617 | ||||||||||||
|
| |||||||||||||||
| 80,599,644 | ||||||||||||||||
|
| |||||||||||||||
Rhode Island: 0.29% |
| |||||||||||||||
| Health Revenue: 0.29% | ||||||||||||||||
Rhode Island Health & Educational Building Hospital Financing Lifespan Obligation Refunding Bond | 5.00 | 5-15-2022 | 1,250,000 | 1,333,650 | ||||||||||||
Rhode Island Health & Educational Building Hospital Financing Lifespan Obligation Refunding Bond | 5.00 | 5-15-2023 | 1,300,000 | 1,427,361 | ||||||||||||
Rhode Island Health & Educational Building Hospital Financing Lifespan Obligation Refunding Bond | 5.00 | 5-15-2024 | 2,475,000 | 2,781,875 | ||||||||||||
| 5,542,886 | ||||||||||||||||
|
| |||||||||||||||
South Carolina: 2.05% |
| |||||||||||||||
| Health Revenue: 1.45% | ||||||||||||||||
South Carolina Jobs EDA Episcopal Home at Still Hopes Series A | 5.00 | 4-1-2021 | 425,000 | 428,196 | ||||||||||||
South Carolina Jobs EDA Episcopal Home at Still Hopes Series A | 5.00 | 4-1-2022 | 455,000 | 462,271 | ||||||||||||
South Carolina Jobs EDA Prisma Health Obligated Group Series C ø | 0.92 | 5-1-2048 | 26,700,000 | 26,700,000 | ||||||||||||
| 27,590,467 | ||||||||||||||||
|
| |||||||||||||||
| Housing Revenue: 0.39% | ||||||||||||||||
South Carolina Housing Finance & Development Authority Lorick Place Apartments Project | 2.43 | 11-1-2021 | 7,500,000 | 7,540,950 | ||||||||||||
|
| |||||||||||||||
| Water & Sewer Revenue: 0.21% | ||||||||||||||||
Laurens County SC Water and Sewer Commission Waterworks Distribution System BAN | 1.38 | 2-1-2022 | 4,000,000 | 4,031,560 | ||||||||||||
|
| |||||||||||||||
| 39,162,977 | ||||||||||||||||
|
| |||||||||||||||
| Tennessee: 1.20% | ||||||||||||||||
| Health Revenue: 0.15% | ||||||||||||||||
Greeneville TN HEFA Board Series 2018A | 5.00 | 7-1-2022 | 1,280,000 | 1,370,368 | ||||||||||||
Metropolitan Government of Nashville & Davidson County TN Health & Educational Facilities Board Series 2001B-1 | 1.55 | 11-15-2030 | 1,500,000 | 1,505,685 | ||||||||||||
| 2,876,053 | ||||||||||||||||
|
| |||||||||||||||
| Housing Revenue: 0.71% | ||||||||||||||||
Chattanooga TN Health Educational & Housing Facility Board Ridgeway Apartments Project | 1.63 | 12-1-2021 | 500,000 | 503,700 | ||||||||||||
Memphis TN Health Educational & Housing Facility Board Keystone Landing & Pendleton Place Apartments | 2.03 | 8-1-2021 | 8,000,000 | 8,008,560 | ||||||||||||
Murfreesboro TN Housing Authority Westbrook Towers II LP Project | 2.13 | 9-1-2021 | 5,000,000 | 5,011,850 | ||||||||||||
| 13,524,110 | ||||||||||||||||
|
| |||||||||||||||
| Utilities Revenue: 0.34% | ||||||||||||||||
Tennessee Energy Acquisition Corporation Series A | 4.00 | 5-1-2048 | 4,690,000 | 5,048,035 | ||||||||||||
The accompanying notes are an integral part of these financial statements.
26 | Wells Fargo Ultra Short-Term Municipal Income Fund
Portfolio of investments—June 30, 2020
| Interest rate | Maturity date | Principal | Value | |||||||||||||
| Utilities Revenue (continued) | ||||||||||||||||
Tennessee Energy Acquisition Corporation Series A | 5.00 | % | 2-1-2022 | $ | 1,300,000 | $ | 1,367,912 | |||||||||
| 6,415,947 | ||||||||||||||||
|
| |||||||||||||||
| 22,816,110 | ||||||||||||||||
|
| |||||||||||||||
Texas: 15.39% |
| |||||||||||||||
| Airport Revenue: 0.14% | ||||||||||||||||
Houston TX Airport System Series C | 5.00 | 7-1-2022 | 2,500,000 | 2,688,975 | ||||||||||||
|
| |||||||||||||||
| Education Revenue: 0.21% | ||||||||||||||||
University of Texas Board of Regents Series C | 5.00 | 8-15-2020 | 3,910,000 | 3,932,483 | ||||||||||||
|
| |||||||||||||||
| GO Revenue: 4.67% | ||||||||||||||||
Burleson TX Independent School District | 2.50 | 2-1-2047 | 7,885,000 | 8,133,456 | ||||||||||||
Cypress-Fairbanks TX Independent School District Series A-1 | 2.13 | 2-15-2027 | 4,355,000 | 4,432,606 | ||||||||||||
Cypress-Fairbanks TX Independent School District Series A-3 | 3.00 | 2-15-2043 | 2,470,000 | 2,477,608 | ||||||||||||
Cypress-Fairbanks TX Independent School District Series B-2 | 2.13 | 2-15-2040 | 7,015,000 | 7,140,007 | ||||||||||||
El Paso TX Independent School District Maintenance Tax Notes | 2.50 | 2-1-2040 | 3,500,000 | 3,574,200 | ||||||||||||
Galveston TX Dickinson Independent High School District | 1.35 | 8-1-2037 | 3,200,000 | 3,228,320 | ||||||||||||
Grapevine-Colleyville TX Independent School District Prerefunded Bond Series B | 2.00 | 8-1-2036 | 3,150,000 | 3,154,158 | ||||||||||||
Grapevine-Colleyville TX Independent School District Unrefunded Bond | 2.00 | 8-1-2036 | 3,495,000 | 3,499,124 | ||||||||||||
Harlandale TX Independent School District | 3.00 | 8-15-2045 | 8,775,000 | 8,800,799 | ||||||||||||
Harris County TX Cypress-Fairbanks Independent High School Series 2014B-2 | 1.40 | 2-15-2040 | 4,070,000 | 4,074,396 | ||||||||||||
Katy TX Independent School District Series 2015C (1 Month LIBOR +0.28%) ± | 0.40 | 8-15-2036 | 9,500,000 | 9,459,530 | ||||||||||||
North East TX Independent School District Series B | 1.42 | 8-1-2040 | 1,205,000 | 1,205,856 | ||||||||||||
Northside TX Independent School District Building Project | 1.60 | 8-1-2049 | 2,860,000 | 2,946,401 | ||||||||||||
Northside TX Independent School District Building Project | 2.00 | 6-1-2046 | 2,135,000 | 2,163,566 | ||||||||||||
Northside TX Independent School District Building Project | 2.13 | 8-1-2040 | 1,490,000 | 1,492,235 | ||||||||||||
Plainview TX Idependent School District Series B | 1.50 | 2-15-2050 | 9,000,000 | 9,223,470 | ||||||||||||
Sherman TX Independent School District | 3.00 | 8-1-2048 | 725,000 | 726,566 | ||||||||||||
Sherman TX Independent School District | 3.00 | 8-1-2048 | 13,010,000 | 13,035,760 | ||||||||||||
Sherman TX Independent School District Prerefunded Bond Series B | 3.00 | 8-1-2048 | 265,000 | 265,572 | ||||||||||||
| 89,033,630 | ||||||||||||||||
|
| |||||||||||||||
| Health Revenue: 0.85% | ||||||||||||||||
Board of Managers Joint Guadalupe Improvement & Refunding Project | 5.00 | 12-1-2021 | 1,000,000 | 1,047,250 | ||||||||||||
Coastal Bend TX Health Facilities Development Corporation (AGM Insured) (m) | 1.00 | 7-1-2031 | 5,650,000 | 5,650,000 | ||||||||||||
Harris County TX Health Facilities Development Corporation Series A3 (AGM Insured) (m) | 0.97 | 7-1-2031 | 925,000 | 925,000 | ||||||||||||
Harris County TX Health Facilities Development Corporation Series A4 (AGM Insured) (m) | 0.94 | 7-1-2031 | 4,625,000 | 4,625,000 | ||||||||||||
Residual Interest Bond Floater Trust Certificates Series 2019-010 (Barclays Bank plc LOC) 144Aø | 0.28 | 11-15-2046 | 4,000,000 | 4,000,000 | ||||||||||||
| 16,247,250 | ||||||||||||||||
|
| |||||||||||||||
| Housing Revenue: 3.80% | ||||||||||||||||
Alamito TX Public Facilities Corporation MFHR HACEP RAD Conversion Program (Housing & Urban Development Insured) | 1.51 | 5-1-2037 | 10,000,000 | 10,097,600 | ||||||||||||
Alamito TX Public Facility Corporation Cramer Three Apartments Project | 2.50 | 11-1-2021 | 2,000,000 | 2,027,180 | ||||||||||||
Austin TX Affordable PFC Incorporated MFHR Bridge Granada Apartments | 1.46 | 6-1-2023 | 2,125,000 | 2,165,779 | ||||||||||||
Capital Area Housing Finance Corporation TX Hills Leander Apartments | 2.05 | 8-1-2021 | 7,000,000 | 7,007,630 | ||||||||||||
The accompanying notes are an integral part of these financial statements.
Wells Fargo Ultra Short-Term Municipal Income Fund | 27
Portfolio of investments—June 30, 2020
| Interest rate | Maturity date | Principal | Value | |||||||||||||
| Housing Revenue (continued) | ||||||||||||||||
Mizuho Floater/Residual Trust Series 2019 (Mizuho Capital Markets LLC LOC, Mizuho Capital Markets LLC LIQ) 144Aø | 0.38 | % | 9-1-2039 | $ | 3,910,000 | $ | 3,910,000 | |||||||||
Mizuho Tender Option Bond Trust Receipts/Floater Certificates Series 2019-MIZ9010 (Mizuho Capital Markets LLC LOC, Mizuho Capital Markets LLC LIQ) 144Aø | 0.48 | 4-1-2034 | 17,000,000 | 17,000,000 | ||||||||||||
Port Aransas TX Public Facilities Corporation MFHR Palladium Port Aransas Apartments | 0.70 | 1-1-2024 | 6,200,000 | 6,199,504 | ||||||||||||
San Antonio TX Housing Trust Finance Corporation Majestic Ranch Apartments LP (FHA Insured) | 1.40 | 7-1-2022 | 6,000,000 | 6,060,060 | ||||||||||||
Southeast Texas Housing Finance Corporation Bayshore Towers Apartments (HUD Insured) | 2.20 | 1-1-2022 | 8,025,000 | 8,025,000 | ||||||||||||
Texas Capital Area Housing Finance Agency MFHR Mission Trail at El Camino Real Apartments | 2.10 | 9-1-2037 | 9,750,000 | 9,894,593 | ||||||||||||
| 72,387,346 | ||||||||||||||||
|
| |||||||||||||||
| Industrial Development Revenue: 1.34% | ||||||||||||||||
Austin TX Convention First Tier Series A | 5.00 | 1-1-2022 | 400,000 | 400,420 | ||||||||||||
Austin TX Convention First Tier Series A | 5.00 | 1-1-2023 | 750,000 | 750,638 | ||||||||||||
Houston TX Airport System Refunding Bond United Airlines Incorporated Terminal E Project | 4.50 | 7-1-2020 | 2,500,000 | 2,500,000 | ||||||||||||
Houston TX Airport System Revenue AMT Series C | 5.00 | 7-15-2020 | 1,500,000 | 1,502,460 | ||||||||||||
Matagorda County TX Navigation District Central Power & Light Company Project | 1.75 | 5-1-2030 | 5,280,000 | 5,284,330 | ||||||||||||
Port Arthur TX Navigation District Industrial Development Corporation Total Petrochemicals USA Incorporated Project ø | 0.26 | 6-1-2041 | 15,000,000 | 15,000,000 | ||||||||||||
| 25,437,848 | ||||||||||||||||
|
| |||||||||||||||
| Miscellaneous Revenue: 0.06% | ||||||||||||||||
Dallas TX Performing Arts Cultural Facilities Corporation Dallas Center for Performing Arts Foundation Project Series 2008B (JPMorgan Chase & Company LOC) ø | 0.17 | 9-1-2041 | 1,175,000 | 1,175,000 | ||||||||||||
|
| |||||||||||||||
| Resource Recovery Revenue: 1.36% | ||||||||||||||||
Mission TX Economic Development Corporation Republic Services Incorporated Project | 2.05 | 1-1-2026 | 15,000,000 | 15,006,150 | ||||||||||||
Port Arthur TX Navigation District Jefferson County Environmental Facilities Motiva Enterprises LLC Project Series E ø | 1.99 | 11-1-2040 | 11,000,000 | 11,000,000 | ||||||||||||
| 26,006,150 | ||||||||||||||||
|
| |||||||||||||||
| Transportation Revenue: 1.61% | ||||||||||||||||
Harris County TX Senior Lien Toll Road Series B | 1.45 | 8-15-2021 | 15,000,000 | 15,036,450 | ||||||||||||
Tender Option Bond Trust Receipts Series 2019-XM0753 (Deutsche Bank LIQ) 144Aø | 0.38 | 8-1-2057 | 9,635,000 | 9,635,000 | ||||||||||||
Tender Option Bond Trust Receipts Series 2019-XM0756 (Deutsche Bank LIQ) 144Aø | 1.44 | 6-30-2058 | 6,000,000 | 6,000,000 | ||||||||||||
| 30,671,450 | ||||||||||||||||
|
| |||||||||||||||
| Utilities Revenue: 1.14% | ||||||||||||||||
San Antonio TX Electric & Gas Systems Refunding Bond Series B | 2.00 | 2-1-2033 | 11,440,000 | 11,594,097 | ||||||||||||
San Antonio TX Junior Lien Series D | 3.00 | 12-1-2045 | 10,000,000 | 10,102,800 | ||||||||||||
| 21,696,897 | ||||||||||||||||
|
| |||||||||||||||
The accompanying notes are an integral part of these financial statements.
28 | Wells Fargo Ultra Short-Term Municipal Income Fund
Portfolio of investments—June 30, 2020
| Interest rate | Maturity date | Principal | Value | |||||||||||||
| Water & Sewer Revenue: 0.21% | ||||||||||||||||
Houston TX Combined Utility System Revenue Series C (1 Month LIBOR +0.36%) ± | 0.49 | % | 5-15-2034 | $ | 4,000,000 | $ | 3,948,280 | |||||||||
|
| |||||||||||||||
| 293,225,309 | ||||||||||||||||
|
| |||||||||||||||
Vermont: 0.10% |
| |||||||||||||||
| Education Revenue: 0.10% | ||||||||||||||||
Vermont Educational & Health Buildings Saint Michaels College Project | 5.00 | 10-1-2023 | 1,185,000 | 1,250,246 | ||||||||||||
Vermont Educational & Health Buildings Saint Michaels College Project | 5.00 | 10-1-2024 | 675,000 | 711,308 | ||||||||||||
| 1,961,554 | ||||||||||||||||
|
| |||||||||||||||
Virginia: 1.65% |
| |||||||||||||||
| Education Revenue: 0.05% | ||||||||||||||||
Virginia College Building Authority Marymount University Project Series A 144A | 5.00 | 7-1-2020 | 525,000 | 525,000 | ||||||||||||
Virginia College Building Authority Marymount University Project Series B 144A | 5.00 | 7-1-2020 | 500,000 | 500,000 | ||||||||||||
| 1,025,000 | ||||||||||||||||
|
| |||||||||||||||
| Housing Revenue: 1.09% | ||||||||||||||||
Fairfax County VA Redevelopment & Housing Authority Murraygate Village Apartment Project | 2.26 | 2-1-2021 | 12,500,000 | 12,516,375 | ||||||||||||
Fairfax County VA Redevelopment & Housing Authority Parkwood Project | 2.21 | 2-1-2021 | 5,500,000 | 5,506,985 | ||||||||||||
Newport News VA Redevelopment & Housing Authority Soundview Townhouses | 2.05 | 8-1-2021 | 2,690,000 | 2,693,040 | ||||||||||||
| 20,716,400 | ||||||||||||||||
|
| |||||||||||||||
| Industrial Development Revenue: 0.22% | ||||||||||||||||
Louisa VA IDA Pollution Control Virginia Electric & Power Company Series A | 1.90 | 11-1-2035 | 4,000,000 | 4,116,960 | ||||||||||||
|
| |||||||||||||||
| Utilities Revenue: 0.29% | ||||||||||||||||
Halifax County VA IDA | 2.15 | 12-1-2041 | 2,000,000 | 2,000,640 | ||||||||||||
Wise County IDA Waste & Sewage Disposal Revenue | 1.20 | 11-1-2040 | 3,525,000 | 3,533,707 | ||||||||||||
| 5,534,347 | ||||||||||||||||
|
| |||||||||||||||
| 31,392,707 | ||||||||||||||||
|
| |||||||||||||||
Washington: 1.76% |
| |||||||||||||||
| Airport Revenue: 0.15% | ||||||||||||||||
Port of Seattle Washington AMT Intermediate Lien Series C | 5.00 | 4-1-2025 | 2,500,000 | 2,864,100 | ||||||||||||
|
| |||||||||||||||
| Health Revenue: 0.37% | ||||||||||||||||
Tender Option Bond Trust Receipts/Certificates (JPMorgan Chase & Company LIQ) 144Aø | 0.50 | 9-6-2020 | 7,000,000 | 7,000,000 | ||||||||||||
|
| |||||||||||||||
| Housing Revenue: 0.61% | ||||||||||||||||
Washington Housing Finance Commission Columbia Park Apartments Project (FHA/GNMA Insured) | 1.39 | 7-1-2022 | 5,200,000 | 5,236,088 | ||||||||||||
Washington Housing Finance Commission SAG Portfolio Project | 2.55 | 7-1-2022 | 6,250,000 | 6,343,375 | ||||||||||||
| 11,579,463 | ||||||||||||||||
|
| |||||||||||||||
The accompanying notes are an integral part of these financial statements.
Wells Fargo Ultra Short-Term Municipal Income Fund | 29
Portfolio of investments—June 30, 2020
| Interest rate | Maturity date | Principal | Value | |||||||||||||
| Utilities Revenue: 0.63% | ||||||||||||||||
Seattle WA Municipal Light & Power Refunding Bond Series B-2 (SIFMA Municipal Swap +0.29%) ± | 0.42 | % | 5-1-2045 | $ | 10,000,000 | $ | 9,937,400 | |||||||||
Seattle WA Municipal Light & Power Series C1 (SIFMA Municipal Swap +0.25%) ± | 0.38 | 11-1-2021 | 1,055,000 | 1,048,396 | ||||||||||||
Seattle WA Municipal Light & Power Series C2 (SIFMA Municipal Swap +0.25%) ± | 0.38 | 11-1-2021 | 1,055,000 | 1,048,396 | ||||||||||||
| 12,034,192 | ||||||||||||||||
|
| |||||||||||||||
| 33,477,755 | ||||||||||||||||
|
| |||||||||||||||
West Virginia: 0.73% |
| |||||||||||||||
| Housing Revenue: 0.26% | ||||||||||||||||
West Virginia Housing Development Brookpark Place Project | 1.65 | 8-1-2022 | 5,000,000 | 5,047,750 | ||||||||||||
|
| |||||||||||||||
| Utilities Revenue: 0.47% | ||||||||||||||||
West Virginia EDA Solid Waste Disposal Facilities Appalachian Power Company Series A | 1.70 | 1-1-2041 | 5,620,000 | 5,622,979 | ||||||||||||
West Virginia EDA Solid Waste Disposal Facilities Wheeling Power Company Mitchell Project Series A | 3.00 | 6-1-2037 | 3,250,000 | 3,333,168 | ||||||||||||
| 8,956,147 | ||||||||||||||||
|
| |||||||||||||||
| 14,003,897 | ||||||||||||||||
|
| |||||||||||||||
Wisconsin: 1.84% |
| |||||||||||||||
| Education Revenue: 0.07% | ||||||||||||||||
Wisconsin PFA Gardner Webb University 144A | 5.00 | 7-1-2021 | 1,360,000 | 1,371,574 | ||||||||||||
|
| |||||||||||||||
| GO Revenue: 0.20% | ||||||||||||||||
Dane County WI AMT Promissory Notes Apartment Project Series D | 2.50 | 6-1-2022 | 445,000 | 452,979 | ||||||||||||
Dane County WI AMT Promissory Notes Apartment Project Series D | 2.63 | 6-1-2023 | 980,000 | 997,689 | ||||||||||||
Dane County WI AMT Promissory Notes Apartment Project Series D | 3.50 | 6-1-2021 | 735,000 | 755,624 | ||||||||||||
Lake Country WI School District Tax Revenue Anticipation Notes | 2.00 | 9-9-2020 | 1,600,000 | 1,605,072 | ||||||||||||
| 3,811,364 | ||||||||||||||||
|
| |||||||||||||||
| Health Revenue: 0.69% | ||||||||||||||||
Wisconsin HEFA Advocate Aurora Health Credit Group Series C3 (SIFMA Municipal Swap +0.55%) ± | 0.68 | 8-15-2054 | 7,065,000 | 7,046,772 | ||||||||||||
Wisconsin HEFA Marshfield Clinic Health System | 5.00 | 2-15-2052 | 4,000,000 | 4,567,640 | ||||||||||||
Wisconsin HEFA St. Camillus Health System Series A | 5.00 | 11-1-2020 | 100,000 | 100,385 | ||||||||||||
Wisconsin HEFA St. Camillus Health System Series A | 5.00 | 11-1-2021 | 110,000 | 111,634 | ||||||||||||
Wisconsin HEFA St. Camillus Health System Series A | 5.00 | 11-1-2022 | 120,000 | 122,880 | ||||||||||||
Wisconsin HEFA St. Camillus Health System Series A | 5.00 | 11-1-2023 | 125,000 | 128,934 | ||||||||||||
Wisconsin HEFA St. Camillus Health System Series A | 5.00 | 7-1-2024 | 945,000 | 1,084,454 | ||||||||||||
| 13,162,699 | ||||||||||||||||
|
| |||||||||||||||
| Housing Revenue: 0.06% | ||||||||||||||||
Wisconsin Housing & EDA Series A | 2.80 | 3-1-2022 | 1,070,000 | 1,101,544 | ||||||||||||
|
| |||||||||||||||
| Miscellaneous Revenue: 0.25% | ||||||||||||||||
Osceola WI Anticipation Notes | 3.00 | 12-1-2021 | 1,800,000 | 1,828,602 | ||||||||||||
Sauk Prairie WI School District BAN | 2.00 | 12-9-2020 | 3,000,000 | 3,009,150 | ||||||||||||
| 4,837,752 | ||||||||||||||||
|
| |||||||||||||||
The accompanying notes are an integral part of these financial statements.
30 | Wells Fargo Ultra Short-Term Municipal Income Fund
Portfolio of investments—June 30, 2020
| Interest rate | Maturity date | Principal | Value | |||||||||||||
| Resource Recovery Revenue: 0.48% |
| |||||||||||||||
La Crosse WI Resource Recovery Northern States Power Company Project | 6.00 | % | 11-1-2021 | $ | 2,500,000 | $ | 2,673,075 | |||||||||
Wisconsin PFA Series A-2 | 1.90 | 10-1-2025 | 6,535,000 | 6,537,810 | ||||||||||||
| 9,210,885 | ||||||||||||||||
|
| |||||||||||||||
| Tax Revenue: 0.09% | ||||||||||||||||
Whitehall WI School District Tax Revenue Anticipation Notes | 2.00 | 10-26-2020 | 1,650,000 | 1,657,095 | ||||||||||||
|
| |||||||||||||||
| 35,152,913 | ||||||||||||||||
|
| |||||||||||||||
Wyoming: 0.08% |
| |||||||||||||||
| Utilities Revenue: 0.08% | ||||||||||||||||
Converse County WY Pollution Control PacifiCorp Projects ø | 0.22 | 12-1-2020 | 1,485,000 | 1,485,000 | ||||||||||||
|
| |||||||||||||||
Total Municipal Obligations (Cost $1,866,097,580) |
| 1,870,883,319 | ||||||||||||||
|
| |||||||||||||||
| Closed End Municipal Bond Fund Obligations: 1.90% | ||||||||||||||||
| California: 0.37% | ||||||||||||||||
Nuveen California AMT-Free Quality Municipal Income Fund MuniFund Preferred Shares Series A (70 shares) 0.92% 144Aø | 7,000,000 | 7,000,000 | ||||||||||||||
|
| |||||||||||||||
| New York: 1.27% | ||||||||||||||||
Nuveen New York AMT-Free Quality Municipal Income Fund MuniFund Preferred Shares Series A (242 shares) 0.92% 144Aø | 24,200,000 | 24,200,000 | ||||||||||||||
|
| |||||||||||||||
| Other: 0.26% | ||||||||||||||||
Nuveen AMT-Free Municipal Credit Income Fund MuniFund Preferred Shares Series B (5,000 shares) 0.92% 144Aø | 5,000,000 | 5,000,000 | ||||||||||||||
|
| |||||||||||||||
Total Closed End Municipal Bond Fund Obligations (Cost $36,200,000) |
| 36,200,000 | ||||||||||||||
|
| |||||||||||||||
| Yield | Shares | |||||||||||||||
| Short-Term Investments: 0.34% | ||||||||||||||||
Investment Companies: 0.34% | ||||||||||||||||
Wells Fargo Municipal Cash Management Money Market Fund Institutional Class (l)(u)## | 0.10 | 6,554,934 | 6,556,901 | |||||||||||||
|
| |||||||||||||||
Total Short-Term Investments (Cost $6,556,811) | 6,556,901 | |||||||||||||||
|
| |||||||||||||||
| Total investments in securities (Cost $1,908,854,391) | 100.43 | % | 1,913,640,220 | |||||
Other assets and liabilities, net | (0.43 | ) | (8,177,875 | ) | ||||
|
|
|
| |||||
| Total net assets | 100.00 | % | $ | 1,905,462,345 | ||||
|
|
|
| |||||
| (m) | The security is an auction-rate security which has an interest rate that resets at predetermined short-term intervals through a Dutch auction. The rate shown is the rate in effect at period end. |
| ø | Variable rate demand notes are subject to a demand feature which reduces the effective maturity. The maturity date shown represents the final maturity date of the security. The interest rate is determined and reset by the issuer daily, weekly, or monthly depending upon the terms of the security. The rate shown is the rate in effect at period end. |
| %% | The security is purchased on a when-issued basis. |
| 144A | The security may be resold in transactions exempt from registration, normally to qualified institutional buyers, pursuant to Rule 144A under the Securities Act of 1933. |
| ± | Variable rate investment. The rate shown is the rate in effect at period end. |
| ¤ | The security is issued in zero coupon form with no periodic interest payments. |
| ## | All or a portion of this security is segregated for when-issued securities. |
| (l) | The issuer of the security is an affiliated person of the Fund as defined in the Investment Company Act of 1940. |
| (u) | The rate represents the 7-day annualized yield at period end. |
The accompanying notes are an integral part of these financial statements.
Wells Fargo Ultra Short-Term Municipal Income Fund | 31
Portfolio of investments—June 30, 2020
Abbreviations:
| AGC | Assured Guaranty Corporation |
| AGM | Assured Guaranty Municipal |
| Ambac | Ambac Financial Group Incorporated |
| AMT | Alternative minimum tax |
| BAM | Build America Mutual Assurance Company |
| BAN | Bond anticipation notes |
| CAB | Capital appreciation bond |
| CDA | Community Development Authority |
| ECFA | Educational & Cultural Facilities Authority |
| EDA | Economic Development Authority |
| EDFA | Economic Development Finance Authority |
| FHA | Federal Housing Administration |
| FHLMC | Federal Home Loan Mortgage Corporation |
| FNMA | Federal National Mortgage Association |
| GNMA | Government National Mortgage Association |
| GO | General obligation |
| HCFR | Healthcare facilities revenue |
| HEFA | Health & Educational Facilities Authority |
| HEFAR | Higher Education Facilities Authority Revenue |
| HFA | Housing Finance Authority |
| HFFA | Health Facilities Financing Authority |
| IDA | Industrial Development Authority |
| LIBOR | London Interbank Offered Rate |
| LIQ | Liquidity agreement |
| LOC | Letter of credit |
| MFHR | Multifamily housing revenue |
| National | National Public Finance Guarantee Corporation |
| PCR | Pollution control revenue |
| PFA | Public Finance Authority |
| RDA | Redevelopment Authority |
| SIFMA | Securities Industry and Financial Markets Association |
| SPA | Standby purchase agreement |
| TTFA | Transportation Trust Fund Authority |
Investments in Affiliates
An affiliated investment is an investment in which the Fund owns at least 5% of the outstanding voting shares of the issuer or as a result of other relationships, such as the Fund and the issuer having the same investment manager. Transactions with issuers that were either affiliated persons of the Fund at the beginning of the period or the end of the period were as follows:
| Value, beginning of period | Purchases | Sales proceeds | Net realized gains (losses) | Net change in unrealized gains (losses) | Income from affiliated securities | Value, end of period | % of net assets | |||||||||||||||||||||||||
| Short-Term Investments | ||||||||||||||||||||||||||||||||
Investment Companies | ||||||||||||||||||||||||||||||||
Wells Fargo Municipal Cash Management Money Market Fund Institutional Class | $ | 4,471,458 | $ | 817,211,491 | $ | (815,120,702 | ) | $ | (5,436 | ) | $ | 90 | $ | 142,603 | $ | 6,556,901 | 0.34 | % | ||||||||||||||
The accompanying notes are an integral part of these financial statements.
32 | Wells Fargo Ultra Short-Term Municipal Income Fund
Statement of assets and liabilities—June 30, 2020
Assets | ||||
Investments in unaffiliated securities, at value (cost $1,902,297,580) | $ | 1,907,083,319 | ||
Investments in affiliated securities, at value (cost $6,556,811) | 6,556,901 | |||
Cash | 117,306 | |||
Receivable for investments sold | 4,272,420 | |||
Receivable for Fund shares sold | 11,150,827 | |||
Receivable for interest | 8,867,391 | |||
|
| |||
Total assets | 1,938,048,164 | |||
|
| |||
Liabilities | ||||
Payable for investments purchased | 27,029,038 | |||
Payable for Fund shares redeemed | 3,617,809 | |||
Management fee payable | 203,500 | |||
Dividends payable | 910,857 | |||
Administration fees payable | 114,708 | |||
Distribution fee payable | 1,824 | |||
Trustees’ fees and expenses payable | 3,856 | |||
Accrued expenses and other liabilities | 704,227 | |||
|
| |||
Total liabilities | 32,585,819 | |||
|
| |||
Total net assets | $ | 1,905,462,345 | ||
|
| |||
Net assets consist of | ||||
Paid-in capital | $ | 1,928,858,910 | ||
Total distributable loss | (23,396,565 | ) | ||
|
| |||
Total net assets | $ | 1,905,462,345 | ||
|
| |||
Computation of net asset value and offering price per share | ||||
Net assets – Class A | $ | 376,202,691 | ||
Shares outstanding – Class A1 | 39,241,265 | |||
Net asset value per share – Class A | $9.59 | |||
Maximum offering price per share – Class A2 | $9.79 | |||
Net assets – Class A2 | $ | 25,029 | ||
Shares outstanding – Class A21 | 2,610 | |||
Net asset value per share – Class A2 | $9.59 | |||
Net assets – Class C | $ | 2,924,987 | ||
Shares outstanding – Class C1 | 310,759 | |||
Net asset value per share – Class C | $9.41 | |||
Net assets – Class R6 | $ | 822,985,609 | ||
Shares outstanding – Class R61 | 85,850,512 | |||
Net asset value per share – Class R6 | $9.59 | |||
Net assets – Administrator Class | $ | 18,242,884 | ||
Shares outstanding – Administrator Class1 | 1,902,732 | |||
Net asset value per share – Administrator Class | $9.59 | |||
Net assets – Institutional Class | $ | 685,081,145 | ||
Shares outstanding – Institutional Class1 | 71,447,632 | |||
Net asset value per share – Institutional Class | $9.59 | |||
| 1 | The Fund has an unlimited number of authorized shares. |
| 2 | Maximum offering price is computed as 100/98 of net asset value. On investments of $50,000 or more, the offering price is reduced. |
The accompanying notes are an integral part of these financial statements.
Wells Fargo Ultra Short-Term Municipal Income Fund | 33
Statement of operations—year ended June 30, 2020
Investment income | ||||
Interest | $ | 31,998,532 | ||
Income from affiliated securities | 142,603 | |||
|
| |||
Total investment income | 32,141,135 | |||
|
| |||
Expenses | ||||
Management fee | 5,723,901 | |||
Administration fees | ||||
Class A | 650,733 | |||
Class A2 | 3 | 1 | ||
Class C | 8,071 | |||
Class R6 | 209,397 | |||
Administrator Class | 20,375 | |||
Institutional Class | 480,909 | |||
Shareholder servicing fees | ||||
Class A | 1,016,205 | |||
Class A2 | 5 | 1 | ||
Class C | 12,584 | |||
Administrator Class | 50,619 | |||
Distribution fee | ||||
Class C | 37,654 | |||
Custody and accounting fees | 184,355 | |||
Professional fees | 56,946 | |||
Registration fees | 81,051 | |||
Shareholder report expenses | 28,557 | |||
Trustees’ fees and expenses | 21,541 | |||
Other fees and expenses | 49,518 | |||
|
| |||
Total expenses | 8,632,424 | |||
Less: Fee waivers and/or expense reimbursements | ||||
Fund-level | (1,309,889 | ) | ||
Class A | (155,556 | ) | ||
Class C | (1,355 | ) | ||
Administrator Class | (7,444 | ) | ||
|
| |||
Net expenses | 7,158,180 | |||
|
| |||
Net investment income | 24,982,955 | |||
|
| |||
Realized and unrealized gains (losses) on investments | ||||
Net realized losses on | ||||
Unaffiliated securities | (827,929 | ) | ||
Affiliated securities | (5,436 | ) | ||
|
| |||
Net realized losses on investments | (833,365 | ) | ||
|
| |||
Net change in unrealized gains (losses) on | ||||
Unaffiliated securities | (1,876,341 | ) | ||
Affiliated securities | 90 | |||
|
| |||
Net change in unrealized gains (losses) on investments | (1,876,251 | ) | ||
|
| |||
Net realized and unrealized gains (losses) on investments | (2,709,616 | ) | ||
|
| |||
Net increase in net assets resulting from operations | $ | 22,273,339 | ||
|
| |||
| 1 | For the period from May 29, 2020 (commencement of class operations) to June 30, 2020 |
The accompanying notes are an integral part of these financial statements.
34 | Wells Fargo Ultra Short-Term Municipal Income Fund
Statement of changes in net assets
| Year ended June 30, 2020 | Year ended June 30, 2019 | |||||||||||||||
Operations | ||||||||||||||||
Net investment income | $ | 24,982,955 | $ | 39,692,474 | ||||||||||||
Net realized losses on investments | (833,365 | ) | (472,657 | ) | ||||||||||||
Net change in unrealized gains (losses) on investments | (1,876,251 | ) | 8,239,186 | |||||||||||||
|
| |||||||||||||||
Net increase in net assets resulting from operations | 22,273,339 | 47,459,003 | ||||||||||||||
|
| |||||||||||||||
Distributions to shareholders from net investment income and net realized gains | ||||||||||||||||
Class A | (5,002,816 | ) | (7,184,383 | ) | ||||||||||||
Class A2 | (19 | )1 | N/A | |||||||||||||
Class C | (24,530 | ) | (81,918 | ) | ||||||||||||
Class R6 | (10,901,380 | ) | (9,194,218 | )2 | ||||||||||||
Administrator Class | (263,819 | ) | (489,384 | ) | ||||||||||||
Institutional Class | (9,119,360 | ) | (22,722,426 | ) | ||||||||||||
|
| |||||||||||||||
Total distributions to shareholders | (25,311,924 | ) | (39,672,329 | ) | ||||||||||||
|
| |||||||||||||||
Capital share transactions | Shares | Shares | ||||||||||||||
Proceeds from shares sold | ||||||||||||||||
Class A | 6,982,039 | 66,981,049 | 5,347,278 | 51,171,356 | ||||||||||||
Class A2 | 2,610 | 1 | 25,000 | 1 | N/A | N/A | ||||||||||
Class C | 20,765 | 195,705 | 391,712 | 3,675,907 | ||||||||||||
Class R6 | 114,021,707 | 1,093,480,689 | 172,266,423 | 2 | 1,647,488,263 | 2 | ||||||||||
Administrator Class | 672,542 | 6,422,333 | 951,130 | 9,106,545 | ||||||||||||
Institutional Class | 56,534,508 | 541,850,398 | 124,072,823 | 1,187,607,605 | ||||||||||||
|
| |||||||||||||||
| 1,708,955,174 | 2,899,049,676 | |||||||||||||||
|
| |||||||||||||||
Reinvestment of distributions | ||||||||||||||||
Class A | 491,863 | 4,718,388 | 715,680 | 6,852,879 | ||||||||||||
Class C | 1,927 | 18,164 | 7,174 | 67,438 | ||||||||||||
Class R6 | 22,585 | 216,591 | 12,244 | 2 | 117,351 | 2 | ||||||||||
Administrator Class | 26,926 | 258,320 | 49,856 | 477,408 | ||||||||||||
Institutional Class | 809,047 | 7,763,721 | 1,731,479 | 16,580,749 | ||||||||||||
|
| |||||||||||||||
| 12,975,184 | 24,095,825 | |||||||||||||||
|
| |||||||||||||||
Payment for shares redeemed | ||||||||||||||||
Class A | (14,529,551 | ) | (139,266,683 | ) | (33,178,529 | ) | (317,470,659 | ) | ||||||||
Class C | (786,807 | ) | (7,418,979 | ) | (1,149,710 | ) | (10,810,966 | ) | ||||||||
Class R6 | (108,448,304 | ) | (1,040,161,896 | ) | (92,024,143 | )2 | (881,492,500 | )2 | ||||||||
Administrator Class | (1,467,495 | ) | (14,059,616 | ) | (3,945,902 | ) | (37,776,949 | ) | ||||||||
Institutional Class | (52,922,721 | ) | (507,283,441 | ) | (282,486,053 | ) | (2,703,286,719 | ) | ||||||||
|
| |||||||||||||||
| (1,708,190,615 | ) | (3,950,837,793 | ) | |||||||||||||
|
| |||||||||||||||
Net increase (decrease) in net assets resulting from capital share transactions | 13,739,743 | (1,027,692,292 | ) | |||||||||||||
|
| |||||||||||||||
Total increase (decrease) in net assets | 10,701,158 | (1,019,905,618 | ) | |||||||||||||
|
| |||||||||||||||
Net assets | ||||||||||||||||
Beginning of period | 1,894,761,187 | 2,914,666,805 | ||||||||||||||
|
| |||||||||||||||
End of period | $ | 1,905,462,345 | $ | 1,894,761,187 | ||||||||||||
|
| |||||||||||||||
| 1 | For the period from May 29, 2020 (commencement of class operations) to June 30, 2020 |
| 2 | For the period from July 31, 2018 (commencement of class operations) to June 30, 2019 |
The accompanying notes are an integral part of these financial statements.
Wells Fargo Ultra Short-Term Municipal Income Fund | 35
(For a share outstanding throughout each period)
| Year ended June 30 | ||||||||||||||||||||
| CLASS A | 2020 | 2019 | 2018 | 2017 | 2016 | |||||||||||||||
Net asset value, beginning of period | $9.60 | $9.57 | $9.57 | $9.63 | $9.61 | |||||||||||||||
Net investment income | 0.12 | 0.12 | 1 | 0.08 | 0.06 | 0.04 | ||||||||||||||
Net realized and unrealized gains (losses) on investments | (0.01 | ) | 0.03 | 0.00 | 2 | (0.06 | ) | 0.02 | ||||||||||||
|
|
|
|
|
|
|
|
|
| |||||||||||
Total from investment operations | 0.11 | 0.15 | 0.08 | 0.00 | 0.06 | |||||||||||||||
Distributions to shareholders from | ||||||||||||||||||||
Net investment income | (0.12 | ) | (0.12 | ) | (0.08 | ) | (0.06 | ) | (0.04 | ) | ||||||||||
Net realized gains | 0.00 | 0.00 | 0.00 | (0.00 | )2 | (0.00 | )2 | |||||||||||||
|
|
|
|
|
|
|
|
|
| |||||||||||
Total distributions to shareholders | (0.12 | ) | (0.12 | ) | (0.08 | ) | (0.06 | ) | (0.04 | ) | ||||||||||
Net asset value, end of period | $9.59 | $9.60 | $9.57 | $9.57 | $9.63 | |||||||||||||||
Total return3 | 1.13 | % | 1.63 | % | 0.88 | % | (0.04 | )% | 0.61 | % | ||||||||||
Ratios to average net assets (annualized) | ||||||||||||||||||||
Gross expenses | 0.77 | % | 0.77 | % | 0.77 | % | 0.75 | % | 0.75 | % | ||||||||||
Net expenses | 0.65 | % | 0.67 | % | 0.67 | % | 0.67 | % | 0.67 | % | ||||||||||
Net investment income | 1.21 | % | 1.28 | % | 0.86 | % | 0.57 | % | 0.38 | % | ||||||||||
Supplemental data | ||||||||||||||||||||
Portfolio turnover rate | 55 | % | 55 | % | 50 | % | 56 | % | 41 | % | ||||||||||
Net assets, end of period (000s omitted) | $376,203 | $444,581 | $702,570 | $971,189 | $1,209,818 | |||||||||||||||
| 1 | Calculated based upon average shares outstanding |
| 2 | Amount is less than $0.005. |
| 3 | Total return calculations do not include any sales charges. |
The accompanying notes are an integral part of these financial statements.
36 | Wells Fargo Ultra Short-Term Municipal Income Fund
Financial highlights
(For a share outstanding throughout the period)
| CLASS A2 | Year ended June 30, 20201 | |||
Net asset value, beginning of period | $9.58 | |||
Net investment income | 0.01 | |||
Net realized and unrealized gains (losses) on investments | 0.01 | |||
|
| |||
Total from investment operations | 0.02 | |||
Distributions to shareholders from | ||||
Net investment income | (0.01 | ) | ||
Net asset value, end of period | $9.59 | |||
Total return2 | 0.18 | % | ||
Ratios to average net assets (annualized) | ||||
Gross expenses | 0.65 | % | ||
Net expenses | 0.50 | % | ||
Net investment income | 0.88 | % | ||
Supplemental data | ||||
Portfolio turnover rate | 55 | % | ||
Net assets, end of period (000s omitted) | $25 | |||
| 1 | For the period from May 29, 2020 (commencement of class operations) to June 30, 2020 |
| 2 | Returns for period of less than one year are not annualized. |
The accompanying notes are an integral part of these financial statements.
Wells Fargo Ultra Short-Term Municipal Income Fund | 37
Financial highlights
(For a share outstanding throughout each period)
| Year ended June 30 | ||||||||||||||||||||
| CLASS C | 2020 | 2019 | 2018 | 2017 | 2016 | |||||||||||||||
Net asset value, beginning of period | $9.43 | $9.40 | $9.40 | $9.47 | $9.49 | |||||||||||||||
Net investment income (loss) | 0.04 | 1 | 0.05 | 1 | 0.01 | 1 | (0.02 | )1 | (0.04 | )1 | ||||||||||
Net realized and unrealized gains (losses) on investments | (0.02 | ) | 0.03 | 0.00 | 2 | (0.05 | ) | 0.02 | ||||||||||||
|
|
|
|
|
|
|
|
|
| |||||||||||
Total from investment operations | 0.02 | 0.08 | 0.01 | (0.07 | ) | (0.02 | ) | |||||||||||||
Distributions to shareholders from | ||||||||||||||||||||
Net investment income | (0.04 | ) | (0.05 | ) | (0.01 | ) | (0.00 | )2 | 0.00 | |||||||||||
Net realized gains | 0.00 | 0.00 | 0.00 | (0.00 | )2 | (0.00 | )2 | |||||||||||||
|
|
|
|
|
|
|
|
|
| |||||||||||
Total distributions to shareholders | (0.04 | ) | (0.05 | ) | (0.01 | ) | (0.00 | )2 | (0.00 | )2 | ||||||||||
Net asset value, end of period | $9.41 | $9.43 | $9.40 | $9.40 | $9.47 | |||||||||||||||
Total return3 | 0.26 | % | 0.87 | % | 0.16 | % | (0.73 | )% | (0.19 | )% | ||||||||||
Ratios to average net assets (annualized) | ||||||||||||||||||||
Gross expenses | 1.51 | % | 1.52 | % | 1.52 | % | 1.50 | % | 1.50 | % | ||||||||||
Net expenses | 1.41 | % | 1.42 | % | 1.42 | % | 1.42 | % | 1.42 | % | ||||||||||
Net investment income (loss) | 0.47 | % | 0.54 | % | 0.11 | % | (0.18 | )% | (0.37 | )% | ||||||||||
Supplemental data | ||||||||||||||||||||
Portfolio turnover rate | 55 | % | 55 | % | 50 | % | 56 | % | 41 | % | ||||||||||
Net assets, end of period (000s omitted) | $2,925 | $10,135 | $17,154 | $23,650 | $31,837 | |||||||||||||||
| 1 | Calculated based upon average shares outstanding |
| 2 | Amount is less than $0.005. |
| 3 | Total return calculations do not include any sales charges. |
The accompanying notes are an integral part of these financial statements.
38 | Wells Fargo Ultra Short-Term Municipal Income Fund
Financial highlights
(For a share outstanding throughout each period)
| Year ended June 30 | ||||||||
| CLASS R6 | 2020 | 20191 | ||||||
Net asset value, beginning of period | $9.60 | $9.58 | ||||||
Net investment income | 0.15 | 0.15 | 2 | |||||
Net realized and unrealized gains (losses) on investments | (0.01 | ) | 0.02 | |||||
|
|
|
| |||||
Total from investment operations | 0.14 | 0.17 | ||||||
Distributions to shareholders from | ||||||||
Net investment income | (0.15 | ) | (0.15 | ) | ||||
Net asset value, end of period | $9.59 | $9.60 | ||||||
Total return3 | 1.47 | % | 1.76 | % | ||||
Ratios to average net assets (annualized) | ||||||||
Gross expenses | 0.38 | % | 0.39 | % | ||||
Net expenses | 0.31 | % | 0.32 | % | ||||
Net investment income | 1.54 | % | 1.73 | % | ||||
Supplemental data | ||||||||
Portfolio turnover rate | 55 | % | 55 | % | ||||
Net assets, end of period (000s omitted) | $822,986 | $770,634 | ||||||
| 1 | For the period from July 31, 2018 (commencement of class operations) to June 30, 2019 |
| 2 | Calculated based upon average shares outstanding |
| 3 | Returns for periods less than one year are not annualized. |
The accompanying notes are an integral part of these financial statements.
Wells Fargo Ultra Short-Term Municipal Income Fund | 39
Financial highlights
(For a share outstanding throughout each period)
| Year ended June 30 | ||||||||||||||||||||
| ADMINISTRATOR CLASS | 2020 | 2019 | 2018 | 2017 | 2016 | |||||||||||||||
Net asset value, beginning of period | $9.60 | $9.57 | $9.57 | $9.63 | $9.61 | |||||||||||||||
Net investment income | 0.12 | 1 | 0.13 | 1 | 0.08 | 1 | 0.06 | 0.04 | ||||||||||||
Net realized and unrealized gains (losses) on investments | (0.01 | ) | 0.03 | 0.01 | (0.06 | ) | 0.02 | |||||||||||||
|
|
|
|
|
|
|
|
|
| |||||||||||
Total from investment operations | 0.11 | 0.16 | 0.09 | 0.00 | 0.06 | |||||||||||||||
Distributions to shareholders from | ||||||||||||||||||||
Net investment income | (0.12 | ) | (0.13 | ) | (0.09 | ) | (0.06 | ) | (0.04 | ) | ||||||||||
Net realized gains | 0.00 | 0.00 | 0.00 | (0.00 | )2 | (0.00 | )2 | |||||||||||||
|
|
|
|
|
|
|
|
|
| |||||||||||
Total distributions to shareholders | (0.12 | ) | (0.13 | ) | (0.09 | ) | (0.06 | ) | (0.04 | ) | ||||||||||
Net asset value, end of period | $9.59 | $9.60 | $9.57 | $9.57 | $9.63 | |||||||||||||||
Total return | 1.19 | % | 1.70 | % | 0.95 | % | 0.03 | % | 0.68 | % | ||||||||||
Ratios to average net assets (annualized) | ||||||||||||||||||||
Gross expenses | 0.70 | % | 0.70 | % | 0.70 | % | 0.70 | % | 0.68 | % | ||||||||||
Net expenses | 0.59 | % | 0.60 | % | 0.60 | % | 0.60 | % | 0.60 | % | ||||||||||
Net investment income | 1.28 | % | 1.34 | % | 0.82 | % | 0.69 | % | 0.45 | % | ||||||||||
Supplemental data | ||||||||||||||||||||
Portfolio turnover rate | 55 | % | 55 | % | 50 | % | 56 | % | 41 | % | ||||||||||
Net assets, end of period (000s omitted) | $18,243 | $25,649 | $53,746 | $1,946,987 | $226,125 | |||||||||||||||
| 1 | Calculated based upon average shares outstanding |
| 2 | Amount is less than $0.005. |
The accompanying notes are an integral part of these financial statements.
40 | Wells Fargo Ultra Short-Term Municipal Income Fund
Financial highlights
(For a share outstanding throughout each period)
| Year ended June 30 | ||||||||||||||||||||
| INSTITUTIONAL CLASS | 2020 | 2019 | 2018 | 2017 | 2016 | |||||||||||||||
Net asset value, beginning of period | $9.60 | $9.57 | $9.58 | $9.63 | $9.61 | |||||||||||||||
Net investment income | 0.14 | 0.15 | 1 | 0.11 | 0.08 | 1 | 0.07 | |||||||||||||
Net realized and unrealized gains (losses) on investments | 0.00 | 0.03 | (0.01 | ) | (0.05 | ) | 0.02 | |||||||||||||
|
|
|
|
|
|
|
|
|
| |||||||||||
Total from investment operations | 0.14 | 0.18 | 0.10 | 0.03 | 0.09 | |||||||||||||||
Distributions to shareholders from | ||||||||||||||||||||
Net investment income | (0.15 | ) | (0.15 | ) | (0.11 | ) | (0.08 | ) | (0.07 | ) | ||||||||||
Net realized gains | 0.00 | 0.00 | 0.00 | (0.00 | )2 | (0.00 | )2 | |||||||||||||
|
|
|
|
|
|
|
|
|
| |||||||||||
Total distributions to shareholders | (0.15 | ) | (0.15 | ) | (0.11 | ) | (0.08 | ) | (0.07 | ) | ||||||||||
Net asset value, end of period | $9.59 | $9.60 | $9.57 | $9.58 | $9.63 | |||||||||||||||
Total return | 1.42 | % | 1.93 | % | 1.07 | % | 0.36 | % | 0.91 | % | ||||||||||
Ratios to average net assets (annualized) | ||||||||||||||||||||
Gross expenses | 0.43 | % | 0.44 | % | 0.44 | % | 0.42 | % | 0.42 | % | ||||||||||
Net expenses | 0.36 | % | 0.37 | % | 0.37 | % | 0.37 | % | 0.37 | % | ||||||||||
Net investment income | 1.50 | % | 1.56 | % | 1.16 | % | 0.86 | % | 0.68 | % | ||||||||||
Supplemental data | ||||||||||||||||||||
Portfolio turnover rate | 55 | % | 55 | % | 50 | % | 56 | % | 41 | % | ||||||||||
Net assets, end of period (000s omitted) | $685,081 | $643,762 | $2,141,197 | $2,713,317 | $4,061,647 | |||||||||||||||
| 1 | Calculated based upon average shares outstanding |
| 2 | Amount is less than $0.005. |
The accompanying notes are an integral part of these financial statements.
Wells Fargo Ultra Short-Term Municipal Income Fund | 41
1. ORGANIZATION
Wells Fargo Funds Trust (the “Trust”), a Delaware statutory trust organized on March 10, 1999, is an open-end management investment company registered under the Investment Company Act of 1940, as amended (the “1940 Act”). As an investment company, the Trust follows the accounting and reporting guidance in Financial Accounting Standards Board (“FASB”) Accounting Standards Codification Topic 946, Financial Services – Investment Companies. These financial statements report on the Wells Fargo Ultra-Short Municipal Income Fund (the “Fund”) which is a diversified series of the Trust.
2. SIGNIFICANT ACCOUNTING POLICIES
The following significant accounting policies, which are consistently followed in the preparation of the financial statements of the Fund, are in conformity with U.S. generally accepted accounting principles which require management to make estimates and assumptions that affect the reported amounts of assets and liabilities, disclosure of contingent assets and liabilities at the date of the financial statements, and the reported amounts of revenues and expenses during the reporting period. Actual results could differ from those estimates.
Securities valuation
All investments are valued each business day as of the close of regular trading on the New York Stock Exchange (generally 4 p.m. Eastern Time), although the Fund may deviate from this calculation time under unusual or unexpected circumstances.
Debt securities are valued at the evaluated bid price provided by an independent pricing service (e.g. taking into account various factors, including yields, maturities, or credit ratings) or, if a reliable price is not available, the quoted bid price from an independent broker-dealer.
Investments in registered open-end investment companies are valued at net asset value.
Investments which are not valued using any of the methods discussed above are valued at their fair value, as determined in good faith by the Board of Trustees of the Fund. The Board of Trustees has established a Valuation Committee comprised of the Trustees and has delegated to it the authority to take any actions regarding the valuation of portfolio securities that the Valuation Committee deems necessary or appropriate, including determining the fair value of portfolio securities, unless the determination has been delegated to the Wells Fargo Asset Management Pricing Committee at Wells Fargo Funds Management, LLC (“Funds Management”). The Board of Trustees retains the authority to make or ratify any valuation decisions or approve any changes to the Valuation Procedures as it deems appropriate. On a quarterly basis, the Board of Trustees receives reports on any valuation actions taken by the Valuation Committee or the Wells Fargo Asset Management Pricing Committee which may include items for ratification.
When-issued transactions
The Fund may purchase securities on a forward commitment or when-issued basis. The Fund records a when-issued transaction on the trade date and will segregate assets in an amount at least equal in value to the Fund’s commitment to purchase when-issued securities. Securities purchased on a when-issued basis are marked-to-market daily and the Fund begins earning interest on the settlement date. Losses may arise due to changes in the market value of the underlying securities or if the counterparty does not perform under the contract.
Security transactions and income recognition
Securities transactions are recorded on a trade date basis. Realized gains or losses are recorded on the basis of identified cost.
Interest income is accrued daily and bond discounts are accreted and premiums are amortized daily. To the extent debt obligations are placed on non-accrual status, any related interest income may be reduced by writing off interest receivables when the collection of all or a portion of interest has been determined to be doubtful based on consistently applied procedures and the fair value has decreased. If the issuer subsequently resumes interest payments or when the collectability of interest is reasonably assured, the debt obligation is removed from non-accrual status.
Distributions to shareholders
Distributions to shareholders from net investment income are declared daily and paid monthly. Distributions from net realized gains, if any, are recorded on the ex-dividend date and paid at least annually. Such distributions are determined in accordance with income tax regulations and may differ from U.S. generally accepted accounting principles. Dividend sources are estimated at the time of declaration. The tax character of distributions is determined as of the Fund’s fiscal year end. Therefore, a portion of the Fund’s distributions made prior to the Fund’s fiscal year end may be categorized as a tax return of capital at year end.
Federal and other taxes
The Fund intends to continue to qualify as a regulated investment company by distributing substantially all of its investment company taxable and tax-exempt income and any net realized capital gains (after reduction for capital loss carryforwards) sufficient to relieve it from all, or substantially all, federal income taxes. Accordingly, no provision for federal income taxes was required.
42 | Wells Fargo Ultra Short-Term Municipal Income Fund
Notes to financial statements
The Fund’s income and federal excise tax returns and all financial records supporting those returns for the prior three fiscal years are subject to examination by the federal and Delaware revenue authorities. Management has analyzed the Fund’s tax positions taken on federal, state, and foreign tax returns for all open tax years and does not believe that there are any uncertain tax positions that require recognition of a tax liability.
As of June 30, 2020, the aggregate cost of all investments for federal income tax purposes was $1,909,046,661 and the unrealized gains (losses) consisted of:
Gross unrealized gains | $ | 8,054,872 | ||
Gross unrealized losses | (3,461,313 | ) | ||
Net unrealized gains | $ | 4,593,559 | ||
As of June 30, 2020, the Fund had capital loss carryforwards which consist of $3,461,404 in short-term capital losses and $23,743,779 in long-term capital losses.
Class allocations
The separate classes of shares offered by the Fund differ principally in applicable sales charges, distribution, shareholder servicing, and administration fees. Class specific expenses are charged directly to that share class. Investment income, common fund-level expenses, and realized and unrealized gains (losses) on investments are allocated daily to each class of shares based on the relative proportion of net assets of each class.
3. FAIR VALUATION MEASUREMENTS
Fair value measurements of investments are determined within a framework that has established a fair value hierarchy based upon the various data inputs utilized in determining the value of the Fund’s investments. The three-level hierarchy gives the highest priority to unadjusted quoted prices in active markets for identical assets or liabilities (Level 1) and the lowest priority to unobservable inputs (Level 3). The Fund’s investments are classified within the fair value hierarchy based on the lowest level of input that is significant to the fair value measurement. The inputs are summarized into three broad levels as follows:
| ∎ | Level 1 – quoted prices in active markets for identical securities |
| ∎ | Level 2 – other significant observable inputs (including quoted prices for similar securities, interest rates, prepayment speeds, credit risk, etc.) |
| ∎ | Level 3 – significant unobservable inputs (including the Fund’s own assumptions in determining the fair value of investments) |
The inputs or methodologies used for valuing investments in securities are not necessarily an indication of the risk associated with investing in those securities.
The following is a summary of the inputs used in valuing the Fund’s assets and liabilities as of June 30, 2020:
| Quoted prices (Level 1) | Other significant observable inputs (Level 2) | Significant (Level 3) | Total | |||||||||||||
Assets | ||||||||||||||||
Investments in: | ||||||||||||||||
Municipal obligations | $ | 0 | $ | 1,870,883,319 | $ | 0 | $ | 1,870,883,319 | ||||||||
Closed end municipal bond fund obligations | 0 | 36,200,000 | 0 | 36,200,000 | ||||||||||||
Short-term investments | ||||||||||||||||
Investment companies | 6,556,901 | 0 | 0 | 6,556,901 | ||||||||||||
Total assets | $ | 6,556,901 | $ | 1,907,083,319 | $ | 0 | $ | 1,913,640,220 | ||||||||
Additional sector, industry or geographic detail is included in the Portfolio of Investments.
For the year ended June 30, 2020, the Fund did not have any transfers into/out of Level 3.
Wells Fargo Ultra Short-Term Municipal Income Fund | 43
Notes to financial statements
4. TRANSACTIONS WITH AFFILIATES
Management fee
Funds Management, an indirect wholly owned subsidiary of Wells Fargo & Company (“Wells Fargo”), is the manager of the Fund and provides advisory and fund-level administrative services under an investment management agreement. Under the investment management agreement, Funds Management is responsible for, among other services, implementing the investment objectives and strategies of the Fund, supervising the subadviser and providing fund-level administrative services in connection with the Fund’s operations. As compensation for its services under the investment management agreement, Funds Management is entitled to receive a management fee at the following annual rate based on the Fund’s average daily net assets:
| Average daily net assets | Management fee | |||
First $1 billion | 0.250 | % | ||
Next $4 billion | 0.225 | |||
Next $5 billion | 0.190 | |||
Over $10 billion | 0.180 | |||
Prior to June 1, 2020, the management fee rate was as follows:
| Average daily net assets | Management fee | |||
First $1 billion | 0.350 | % | ||
Next $4 billion | 0.325 | |||
Next $3 billion | 0.290 | |||
Next $2 billion | 0.265 | |||
Over $10 billion | 0.255 | |||
For the year ended June 30, 2020, the management fee was equivalent to an annual rate of 0.33% of the Fund’s average daily net assets.
Funds Management has retained the services of a subadviser to provide daily portfolio management to the Fund. The fee for subadvisory services is borne by Funds Management. Wells Capital Management Incorporated, an affiliate of Funds Management and an indirect wholly owned subsidiary of Wells Fargo, is the subadviser to the Fund and is entitled to receive a fee from Funds Management at an annual rate starting at 0.15% and declining to 0.05% as the average daily net assets of the Fund increase.
Administration fees
Under a class-level administration agreement, Funds Management provides class-level administrative services to the Fund, which includes paying fees and expenses for services provided by the transfer agent, sub-transfer agents, omnibus account servicers and record-keepers. As compensation for its services under the class-level administration agreement, Funds Management receives an annual fee which is calculated based on the average daily net assets of each class as follows:
| Class-level administration fee | ||||
Class A, Class A2, Class C | 0.16 | % | ||
Class R6 | 0.03 | |||
Administrator Class | 0.10 | |||
Institutional Class | 0.08 | |||
Waivers and/or expense reimbursements
Funds Management has contractually waived and/or reimbursed management and administration fees to the extent necessary to maintain certain net operating expense ratios for the Fund. When each class of the Fund has exceeded its expense cap, Funds Management has waived fees and/or reimbursed expenses from fund-level expenses on a proportionate basis and then from class specific expenses. When only certain classes exceed their expense caps, waivers and/or reimbursements are applied against class specific expenses before fund-level expenses. Funds Management has committed through October 31, 2020
44 | Wells Fargo Ultra Short-Term Municipal Income Fund
Notes to financial statements
(October 31, 2021 for Class A2 shares) to waive fees and/or reimburse expenses to the extent necessary to cap the Fund’s expenses at 0.50% for Class A shares, 0.50% for Class A2 shares, 1.25% for Class C shares, 0.20% for Class R6 shares, 0.50% for Administrator Class shares, and 0.25% for Institutional Class shares. Prior to or after the commitment expiration date, the cap may be increased or the commitment to maintain the cap may be terminated only with the approval of the Board of Trustees. Prior to June 1, 2020, the Fund’s expenses were capped at 0.67% for Class A shares, 1.42% for Class C shares, 0.32% for Class R6 shares, 0.60% for Administrator Class shares, and 0.37% for Institutional Class shares.
Distribution fee
The Trust has adopted a distribution plan for Class C shares of the Fund pursuant to Rule 12b-1 under the 1940 Act. A distribution fee is charged to Class C shares and paid to Wells Fargo Funds Distributor, LLC (“Funds Distributor”), the principal underwriter, at an annual rate of 0.75% of the average daily net assets of Class C shares.
In addition, Funds Distributor is entitled to receive the front-end sales charge from the purchase of Class A shares and a contingent deferred sales charge on the redemption of certain Class A shares. Funds Distributor is also entitled to receive the contingent deferred sales charges from redemptions of Class C shares. For the year ended June 30, 2020, Funds Distributor received $2,097 from the sale of Class A shares. No contingent deferred sales charges were incurred by Class A and Class C shares for the year ended June 30, 2020.
Shareholder servicing fees
The Trust has entered into contracts with one or more shareholder servicing agents, whereby Class A, Class A2, Class C, and Administrator Class of the Fund are charged a fee at an annual rate of 0.25% of the average daily net assets of each respective class. A portion of these total shareholder servicing fees were paid to affiliates of Wells Fargo.
Interfund transactions
The Fund may purchase or sell portfolio investment securities to certain other Wells Fargo affiliates pursuant to Rule 17a-7 under the 1940 Act and under procedures adopted by the Board of Trustees. The procedures have been designed to ensure that these interfund transactions, which do not incur broker commissions, are effected at current market prices. Pursuant to these procedures, the Fund had $314,252,000 and $280,801,000 in interfund purchases and sales, respectively, during the year ended June 30, 2020.
5. INVESTMENT PORTFOLIO TRANSACTIONS
Purchases and sales of investments, excluding U.S. government obligations (if any) and short-term securities, for the year ended June 30, 2020 were $1,068,224,784 and $847,508,842, respectively.
6. BANK BORROWINGS
The Trust (excluding the money market funds), Wells Fargo Master Trust and Wells Fargo Variable Trust are parties to a $350,000,000 revolving credit agreement whereby the Fund is permitted to use bank borrowings for temporary or emergency purposes, such as to fund shareholder redemption requests. Interest under the credit agreement is charged to the Fund based on a borrowing rate equal to the higher of the Federal Funds rate in effect on that day plus 1.25% or the overnight LIBOR rate in effect on that day plus 1.25%. In addition, an annual commitment fee equal to 0.25% of the unused balance is allocated to each participating fund.
For the year ended June 30, 2020, there were no borrowings by the Fund under the agreement.
7. DISTRIBUTIONS TO SHAREHOLDERS
The tax character of distributions paid was $25,311,924 and $39,672,329 of tax-exempt income for the years ended June 30, 2020 and June 30, 2019, respectively.
As of June 30, 2020, the components of distributable earnings on a tax basis were as follows:
Undistributed tax-exempt income | Unrealized gains | Capital loss carryforward | ||
| $125,916 | $4,593,559 | $(27,205,183) | ||
Wells Fargo Ultra Short-Term Municipal Income Fund | 45
Notes to financial statements
8. INDEMNIFICATION
Under the Fund’s organizational documents, the officers and Trustees have been granted certain indemnification rights against certain liabilities that may arise out of performance of their duties to the Fund. The Fund has entered into a separate agreement with each Trustee that converts indemnification rights currently existing under the Fund’s organizational documents into contractual rights that cannot be changed in the future without the consent of the Trustee. Additionally, in the normal course of business, the Fund may enter into contracts with service providers that contain a variety of indemnification clauses. The Fund’s maximum exposure under these arrangements is dependent on future claims that may be made against the Fund and, therefore, cannot be estimated.
9. NEW ACCOUNTING PRONOUNCEMENT
In August 2018, FASB issued Accounting Standards Update (“ASU”) No. 2018-13, Fair Value Measurement (Topic 820) Disclosure Framework—Changes to the Disclosure Requirements for Fair Value Measurement. ASU 2018-13 updates the disclosure requirements on fair value measurements in Topic 820, Fair Value Measurements. The amendments are effective for fiscal years, and interim periods within those fiscal years, beginning after December 15, 2019. Management has adopted this guidance which did not have a material impact on the financial statements.
10. CORONAVIRUS (COVID-19) PANDEMIC
On March 11, 2020, the World Health Organization announced that it had made the assessment that coronavirus disease 2019 (“COVID-19”) is a pandemic. The impacts of COVID-19 are adversely affecting the entire global economy, individual companies and investment products, and the market in general. There is significant uncertainty around the extent and duration of business disruptions related to COVID-19 and the impacts may be short term or may last for an extended period of time. The risk of further spreading of COVID-19 has led to significant uncertainty and volatility in the financial markets.
11. SUBSEQUENT EVENT
On August 14, 2020, Class C of the Fund was reimbursed by Funds Management in the amount of $12,001. The reimbursement was made in connection with resolving certain fee reimbursements.
46 | Wells Fargo Ultra Short-Term Municipal Income Fund
Report of independent registered public accounting firm
To the Shareholders of the Fund and Board of Trustees
Wells Fargo Funds Trust:
Opinion on the Financial Statements
We have audited the accompanying statement of assets and liabilities of Wells Fargo Ultra Short-Term Municipal Income Fund (the Fund), one of the funds constituting Wells Fargo Funds Trust, including the portfolio of investments, as of June 30, 2020, the related statement of operations for the year then ended, the statements of changes in net assets for each of the years in the two-year period then ended, and the related notes (collectively, the financial statements) and the financial highlights for each of the years or periods in the five-year period then ended. In our opinion, the financial statements and financial highlights present fairly, in all material respects, the financial position of the Fund as of June 30, 2020, the results of its operations for the year then ended, the changes in its net assets for each of the years in the two-year period then ended, and the financial highlights for each of the years or periods in the five-year period then ended, in conformity with U.S. generally accepted accounting principles.
Basis for Opinion
These financial statements and financial highlights are the responsibility of the Fund’s management. Our responsibility is to express an opinion on these financial statements and financial highlights based on our audits. We are a public accounting firm registered with the Public Company Accounting Oversight Board (United States) (PCAOB) and are required to be independent with respect to the Fund in accordance with the U.S. federal securities laws and the applicable rules and regulations of the Securities and Exchange Commission and the PCAOB.
We conducted our audits in accordance with the standards of the PCAOB. Those standards require that we plan and perform the audit to obtain reasonable assurance about whether the financial statements and financial highlights are free of material misstatement, whether due to error or fraud. Our audits included performing procedures to assess the risks of material misstatement of the financial statements and financial highlights, whether due to error or fraud, and performing procedures that respond to those risks. Such procedures included examining, on a test basis, evidence regarding the amounts and disclosures in the financial statements and financial highlights. Such procedures also included confirmation of securities owned as of June 30, 2020, by correspondence with the custodian, transfer agent and brokers, or by other appropriate auditing procedures. Our audits also included evaluating the accounting principles used and significant estimates made by management, as well as evaluating the overall presentation of the financial statements and financial highlights. We believe that our audits provide a reasonable basis for our opinion.

We have not been able to determine the specific year that we began serving as the auditor of one or more Wells Fargo Funds investment companies; however we are aware that we have served as the auditor of one or more Wells Fargo Funds investment companies since at least 1955.
Boston, Massachusetts
August 29, 2020
Wells Fargo Ultra Short-Term Municipal Income Fund | 47
TAX INFORMATION
Pursuant to Section 852 of the Internal Revenue Code, 100% of distributions paid from net investment income is designated as exempt-interest dividends for the fiscal year ended June 30, 2020.
PROXY VOTING INFORMATION
A description of the policies and procedures used to determine how to vote proxies relating to portfolio securities is available, upon request, by calling 1-800-222-8222, visiting our website at wfam.com, or visiting the SEC website at sec.gov. Information regarding how the proxies related to portfolio securities were voted during the most recent 12-month period ended June 30 is available on the website at wfam.com or by visiting the SEC website at sec.gov.
QUARTERLY PORTFOLIO HOLDINGS INFORMATION
The Fund files its complete schedule of portfolio holdings with the SEC for the first and third quarters of each fiscal year as an exhibit to its reports on Form N-PORT. Shareholders may view the filed Form N-PORT by visiting the SEC website at sec.gov.
48 | Wells Fargo Ultra Short-Term Municipal Income Fund
Other information (unaudited)
BOARD OF TRUSTEES AND OFFICERS
Each of the Trustees and Officers1 listed in the table below acts in identical capacities for each fund in the Wells Fargo family of funds, which consists of 147 mutual funds comprising the Wells Fargo Funds Trust, Wells Fargo Variable Trust, Wells Fargo Master Trust and four closed-end funds (collectively the “Fund Complex”). This table should be read in conjunction with the Prospectus and the Statement of Additional Information2. The mailing address of each Trustee and Officer is 525 Market Street, 12th Floor, San Francisco, CA 94105. Each Trustee and Officer serves an indefinite term, however, each Trustee serves such term until reaching the mandatory retirement age established by the Trustees.
Independent Trustees
Name and year of birth | Position held and length of service* | Principal occupations during past five years or longer | Current other public company or investment company directorships | |||
William R. Ebsworth (Born 1957) | Trustee, since 2015 | Retired. From 1984 to 2013, equities analyst, portfolio manager, research director and chief investment officer at Fidelity Management and Research Company in Boston, Tokyo, and Hong Kong, and retired in 2013 as Chief Investment Officer of Fidelity Strategic Advisers, Inc. where he led a team of investment professionals managing client assets. Prior thereto, Board member of Hong Kong Securities Clearing Co., Hong Kong Options Clearing Corp., the Thailand International Fund, Ltd., Fidelity Investments Life Insurance Company, and Empire Fidelity Investments Life Insurance Company. Audit Committee Chair and Investment Committee Chair of the Vincent Memorial Hospital Endowment (non-profit organization). Mr. Ebsworth is a CFA® charterholder. | N/A | |||
Jane A. Freeman (Born 1953) | Trustee, since 2015; Chair Liaison, since 2018 | Retired. From 2012 to 2014 and 1999 to 2008, Chief Financial Officer of Scientific Learning Corporation. From 2008 to 2012, Ms. Freeman provided consulting services related to strategic business projects. Prior to 1999, Portfolio Manager at Rockefeller & Co. and Scudder, Stevens & Clark. Board member of the Harding Loevner Funds from 1996 to 2014, serving as both Lead Independent Director and chair of the Audit Committee. Board member of the Russell Exchange Traded Funds Trust from 2011 to 2012 and the chair of the Audit Committee. Ms. Freeman is also an inactive Chartered Financial Analyst. | N/A | |||
Isaiah Harris, Jr. (Born 1952) | Trustee, since 2009; Audit Committee Chairman, since 2019 | Retired. Chairman of the Board of CIGNA Corporation since 2009, and Director since 2005. From 2003 to 2011, Director of Deluxe Corporation. Prior thereto, President and CEO of BellSouth Advertising and Publishing Corp. from 2005 to 2007, President and CEO of BellSouth Enterprises from 2004 to 2005 and President of BellSouth Consumer Services from 2000 to 2003. Emeritus member of the Iowa State University Foundation Board of Governors. Emeritus Member of the Advisory Board of Iowa State University School of Business. Advisory Board Member, Palm Harbor Academy (private school). Advisory Board Member, Child Evangelism Fellowship (non-profit). Mr. Harris is a certified public accountant (inactive status). | CIGNA Corporation | |||
Judith M. Johnson (Born 1949) | Trustee, since 2008; Audit Committee Chairman, from 2009 to 2018 | Retired. Prior thereto, Chief Executive Officer and Chief Investment Officer of Minneapolis Employees Retirement Fund from 1996 to 2008. Ms. Johnson is an attorney, certified public accountant and a certified managerial accountant. | N/A | |||
David F. Larcker (Born 1950) | Trustee, since 2009 | James Irvin Miller Professor of Accounting at the Graduate School of Business, Stanford University, Director of the Corporate Governance Research Initiative and Senior Faculty of The Rock Center for Corporate Governance since 2006. From 2005 to 2008, Professor of Accounting at the Graduate School of Business, Stanford University. Prior thereto, Ernst & Young Professor of Accounting at The Wharton School, University of Pennsylvania from 1985 to 2005. | N/A | |||
Wells Fargo Ultra Short-Term Municipal Income Fund | 49
Other information (unaudited)
Name and year of birth | Position held and length of service* | Principal occupations during past five years or longer | Current other public company or investment company directorships | |||
Olivia S. Mitchell (Born 1953) | Trustee, since 2006; Nominating and Governance Committee Chair, since 2018 | International Foundation of Employee Benefit Plans Professor, Wharton School of the University of Pennsylvania since 1993. Director of Wharton’s Pension Research Council and Boettner Center on Pensions & Retirement Research, and Research Associate at the National Bureau of Economic Research. Previously, Cornell University Professor from 1978 to 1993. | N/A | |||
Timothy J. Penny (Born 1951) | Trustee, since 1996; Chairman, since 2018 | President and Chief Executive Officer of Southern Minnesota Initiative Foundation, a non-profit organization, since 2007. Member of the Board of Trustees of NorthStar Education Finance, Inc., a non-profit organization, since 2007. | N/A | |||
James G. Polisson (Born 1959) | Trustee, since 2018 | Retired. Chief Marketing Officer, Source (ETF) UK Services, Ltd, from 2015 to 2017. From 2012 to 2015, Principal of The Polisson Group, LLC, a management consulting, corporate advisory and principal investing company. Chief Executive Officer and Managing Director at Russell Investments, Global Exchange Traded Funds from 2010 to 2012. Managing Director of Barclays Global Investors from 1998 to 2010 and Global Chief Marketing Officer for iShares and Barclays Global Investors from 2000 to 2010. Trustee of the San Francisco Mechanics’ Institute, a non-profit organization, from 2013 to 2015. Board member of the Russell Exchange Traded Fund Trust from 2011 to 2012. Director of Barclays Global Investors Holdings Deutschland GmbH from 2006 to 2009. Mr. Polisson is an attorney and has a retired status with the Massachusetts and District of Columbia Bar Associations. | N/A | |||
Pamela Wheelock (Born 1959) | Trustee, since January 2020; previously Trustee from January 2018 to July 2019 | Board member of the Destination Medical Center Economic Development Agency, Rochester, Minnesota since 2019 and Interim President of the McKnight Foundation since 2020. Acting Commissioner, Minnesota Department of Human Services, July 2019 through September 2019. Human Services Manager (part-time), Minnesota Department of Human Services, October 2019 through December 2019. Chief Operating Officer, Twin Cities Habitat for Humanity from 2017 to 2019. Vice President of University Services, University of Minnesota from 2012 to 2016. Prior thereto, on the Board of Directors, Governance Committee and Finance Committee for the Minnesota Philanthropy Partners (Saint Paul Foundation) from 2012 to 2018, Interim Chief Executive Officer of Blue Cross Blue Shield of Minnesota from 2011 to 2012, Chairman of the Board from 2009 to 2012 and Board Director from 2003 to 2015. Vice President, Leadership and Community Engagement, Bush Foundation, Saint Paul, Minnesota (a private foundation) from 2009 to 2011. Executive Vice President and Chief Financial Officer, Minnesota Sports and Entertainment from 2004 to 2009 and Senior Vice President from 2002 to 2004. Executive Vice President of the Minnesota Wild Foundation from 2004 to 2008. Commissioner of Finance, State of Minnesota, from 1999 to 2002. Currently Board Chair of the Minnesota Wild Foundation since 2010. | N/A | |||
| * | Length of service dates reflect the Trustee’s commencement of service with the Trust’s predecessor entities, where applicable. |
50 | Wells Fargo Ultra Short-Term Municipal Income Fund
Other information (unaudited)
Officers
Name and year of birth | Position held and length of service | Principal occupations during past five years or longer | ||
Andrew Owen (Born 1960) | President, since 2017 | Executive Vice President of Wells Fargo & Company and Head of Affiliated Managers, Wells Fargo Asset Management, since 2014. In addition, Mr. Owen is currently President, Chief Executive Officer and Director of Wells Fargo Funds Management, LLC since 2017. Prior thereto, Executive Vice President responsible for marketing, investments and product development for Wells Fargo Funds Management, LLC, from 2009 to 2014. | ||
Nancy Wiser1 (Born 1967) | Treasurer, since 2012 | Executive Vice President of Wells Fargo Funds Management, LLC since 2011. Chief Operating Officer and Chief Compliance Officer at LightBox Capital Management LLC, from 2008 to 2011. | ||
Michelle Rhee (Born 1966) | Chief Legal Officer, since 2019 | Secretary of Wells Fargo Funds Management, LLC, Chief Legal Counsel of Wells Fargo Asset Management and Assistant General Counsel of Wells Fargo Bank, N.A. since 2018. Associate General Counsel and Managing Director of Bank of America Corporation from 2004 to 2018. | ||
Catherine Kennedy (Born 1969) | Secretary, since 2019 | Vice President of Wells Fargo Funds Management, LLC and Senior Counsel of the Wells Fargo Legal Department since 2010. Vice President and Senior Counsel of Evergreen Investment Management Company, LLC from 1998 to 2010. | ||
Michael H. Whitaker (Born 1967) | Chief Compliance Officer, since 2016 | Chief Compliance Officer of Wells Fargo Asset Management since 2016. Senior Vice President and Chief Compliance Officer for Fidelity Investments from 2007 to 2016. | ||
David Berardi (Born 1975) | Assistant Treasurer, since 2009 | Vice President of Wells Fargo Funds Management, LLC since 2009. Vice President of Evergreen Investment Management Company, LLC from 2008 to 2010. Manager of Fund Reporting and Control for Evergreen Investment Management Company, LLC from 2004 to 2010. | ||
Jeremy DePalma1 (Born 1974) | Assistant Treasurer, since 2009 | Senior Vice President of Wells Fargo Funds Management, LLC since 2009. Senior Vice President of Evergreen Investment Management Company, LLC from 2008 to 2010 and head of the Fund Reporting and Control Team within Fund Administration from 2005 to 2010. | ||
| 1 | Nancy Wiser acts as Treasurer of 65 funds in the Fund Complex. Jeremy DePalma acts as the Treasurer of 82 funds and Assistant Treasurer of 65 funds in the Fund Complex. |
| 2 | The Statement of Additional Information includes additional information about the Trustees and is available, without charge, upon request, by calling 1-800-222-8222 or by visiting the website at wfam.com. |
Wells Fargo Ultra Short-Term Municipal Income Fund | 51
Other information (unaudited)
BOARD CONSIDERATION OF INVESTMENT MANAGEMENT AND SUB-ADVISORY AGREEMENTS:
Wells Fargo Ultra Short-Term Municipal Income Fund
Under the Investment Company Act of 1940 (the “1940 Act”), the Board of Trustees (the “Board”) of Wells Fargo Funds Trust (the “Trust”) must determine annually whether to approve the continuation of the Trust’s investment management and sub-advisory agreements. In this regard, at a Board meeting held on May 26, 2020 and May 28, 2020 (together, the “Meeting”), the Board, all the members of which have no direct or indirect interest in the investment management and sub-advisory agreements and are not “interested persons” of the Trust, as defined in the 1940 Act (the “Independent Trustees”), reviewed and approved for Wells Fargo Ultra Short-Term Municipal Income Fund (the “Fund”): (i) an investment management agreement (the “Management Agreement”) with Wells Fargo Funds Management, LLC (“Funds Management”); and (ii) an investment sub-advisory agreement (the “Sub-Advisory Agreement”) with Wells Capital Management Incorporated (the “Sub-Adviser”), an affiliate of Funds Management. The Management Agreement and the Sub-Advisory Agreement are collectively referred to as the “Advisory Agreements.”
At the Meeting, the Board considered the factors and reached the conclusions described below relating to the selection of Funds Management and the Sub-Adviser and the approval of the Advisory Agreements. Prior to the Meeting, including at a Board meeting held in April 2020, the Trustees conferred extensively among themselves and with representatives of Funds Management about these matters. Also, the Board has adopted a team-based approach, with each team consisting of a sub-set of Trustees, to assist the full Board in the discharge of its duties in reviewing investment performance and other matters throughout the year. The Independent Trustees were assisted in their evaluation of the Advisory Agreements by independent legal counsel, from whom they received separate legal advice and with whom they met separately.
In providing information to the Board, Funds Management and the Sub-Adviser were guided by a detailed set of requests for information submitted to them by independent legal counsel on behalf of the Independent Trustees at the start of the Board’s annual contract renewal process earlier in 2020. In considering and approving the Advisory Agreements, the Trustees considered the information they believed relevant, including but not limited to the information discussed below. The Board considered not only the specific information presented in connection with the Meeting, but also the knowledge gained over time through interaction with Funds Management and the Sub-Adviser about various topics. In this regard, the Board reviewed reports of Funds Management at each of its quarterly meetings, which included, among other things, portfolio reviews and investment performance reports. In addition, the Board and the teams mentioned above confer with portfolio managers at various times throughout the year. The Board did not identify any particular information or consideration that was all-important or controlling, and each individual Trustee may have attributed different weights to various factors.
After its deliberations, the Board unanimously approved the continuation of the Advisory Agreements for a one-year term and determined that the compensation payable to Funds Management and the Sub-Adviser under each of the Advisory Agreements was reasonable. The Board considered the approval of the Advisory Agreements for the Fund as part of its consideration of agreements for funds across the complex, but its approvals were made on a fund-by-fund basis. The following summarizes a number of important, but not necessarily all, factors considered by the Board in support of its approvals.
Nature, extent and quality of services
The Board received and considered various information regarding the nature, extent and quality of services provided to the Fund by Funds Management and the Sub-Adviser under the Advisory Agreements. This information included a description of the investment advisory services and Fund-level administrative services covered by the Management Agreement, as well as, among other things, a summary of the background and experience of senior management of Wells Fargo Asset Management (“WFAM”), of which Funds Management and the Sub-Adviser are a part, and a summary of investments made in the business of WFAM. The Board also received a description of Funds Management’s and the Sub-Adviser’s business continuity plans and of their approaches to data privacy and cybersecurity, and related testing. The Board also received and reviewed information about Funds Management’s role as administrator of the Fund’s liquidity risk management program, Funds Management’s approach to risk management, and Funds Management’s intermediary and vendor oversight program.
The Board also considered the qualifications, background, tenure and responsibilities of each of the portfolio managers primarily responsible for the day-to-day portfolio management of the Fund. The Board evaluated the ability of Funds Management and the Sub-Adviser to attract and retain qualified investment professionals, including research, advisory and supervisory personnel. The Board further considered the compliance programs and compliance records of Funds Management and the Sub-Adviser. In addition, the Board took into account the full range of services provided to the Fund by Funds Management and its affiliates.
52 | Wells Fargo Ultra Short-Term Municipal Income Fund
Other information (unaudited)
Fund investment performance and expenses
The Board considered the investment performance results for the Fund over various time periods ended December 31, 2019. The Board also considered more current results for various time periods ended March 31, 2020. The Board considered these results in comparison to the investment performance of funds in a universe that was determined by Broadridge Inc. (“Broadridge”) to be similar to the Fund (the “Universe”), and in comparison to the Fund’s benchmark index and to other comparative data. Broadridge is an independent provider of investment company data. The Board received a description of the methodology used by Broadridge to select the mutual funds in the performance Universe. The Board noted that the investment performance of the Fund (Class A) was lower than the average investment performance of the Universe for the one-, three-, five- and ten- year periods ended December 31, 2019. The Board also noted that the investment performance of the Fund (Class Admin) was higher than the average investment performance of the Universe for the one- and three-year periods ended March 31, 2020, and lower than the average investment performance of the Universe for the five- and ten-year periods ended March 31, 2020. The Board also noted that the investment performance of the Fund was lower than its benchmark index, the Bloomberg Barclays 1-Year Municipal Bond Index, for all periods ended December 31, 2019. The Board also noted that the investment performance of the Fund was lower than its benchmark index, the Bloomberg Barclays 1-Year Municipal Bond Index, for all periods ended March 31, 2020.
The Board received information concerning, and discussed factors contributing to, the underperformance of the Fund relative to the Universe and benchmark index for the periods identified above. The Board took note of the explanations for the relative underperformance during these periods, including with respect to investment decisions and market factors that affected the Fund’s investment performance.
The Board also received and considered information regarding the Fund’s net operating expense ratios and their various components, including actual management fees, custodian and other non-management fees, and Rule 12b-1 and non-Rule 12b-1 shareholder service fees. The Board considered these ratios in comparison to the median ratios of funds in class-specific expense groups that were determined by Broadridge to be similar to the Fund (the “Groups”). The Board received a description of the methodology used by Broadridge to select the mutual funds in the expense Groups and an explanation of how funds comprising expense groups and their expense ratios may vary from year-to-year. Based on the Broadridge reports, the Board noted that the net operating expense ratios of the Fund were lower than or in range of the median net operating expense ratios of the expense Groups for each share class.
The Board took into account the Fund’s investment performance and expense information provided to it among the factors considered in deciding to re-approve the Advisory Agreements.
Investment management and sub-advisory fee rates
The Board reviewed and considered the contractual fee rates payable by the Fund to Funds Management under the Management Agreement, as well as the contractual fee rates payable by the Fund to Funds Management for class-level administrative services under a Class-Level Administration Agreement, which include, among other things, class-level transfer agency and sub-transfer agency costs (collectively, the “Management Rates”). The Board also reviewed and considered the contractual investment sub-advisory fee rates that are payable by Funds Management to the Sub-Adviser for investment sub-advisory services.
Among other information reviewed by the Board was a comparison of the Fund’s Management Rates with the average contractual investment management fee rates of funds in the expense Groups at a common asset level as well as transfer agency costs of the funds in the expense Groups. The Board noted that the Management Rates of the Fund were lower than or in range of the sum of these average rates for the Fund’s expense Groups for all share classes.
The Board also received and considered information about the portion of the total management fee that was retained by Funds Management after payment of the fee to the Sub-Adviser for sub-advisory services. In assessing the reasonableness of this amount, the Board received and evaluated information about the nature and extent of responsibilities retained and risks assumed by Funds Management and not delegated to or assumed by the Sub-Adviser, and about Funds Management’s on-going oversight services. Given the affiliation between Funds Management and the Sub-Adviser, the Board ascribed limited relevance to the allocation of fees between them.
The Board also received and considered information about the nature and extent of services offered and fee rates charged by Funds Management and the Sub-Adviser to other types of clients with investment strategies similar to those of the Fund. In this regard, the Board received information about the significantly greater scope of services, and compliance, reporting and other legal burdens and risks of managing proprietary mutual funds compared with those associated with managing assets of other types of clients, including third-party sub-advised fund clients and non-mutual fund clients such as institutional separate accounts.
Wells Fargo Ultra Short-Term Municipal Income Fund | 53
Other information (unaudited)
Based on its consideration of the factors and information it deemed relevant, including those described here, the Board determined that the compensation payable to Funds Management under the Management Agreement and to the Sub-Adviser under the Sub-Advisory Agreement was reasonable.
Profitability
The Board received and considered information concerning the profitability of Funds Management, as well as the profitability of both WFAM and Wells Fargo & Co. (“Wells Fargo”) from providing services to the fund family as a whole. The Board noted that the Sub-Adviser’s profitability information with respect to providing services to the Fund and other funds in the family was subsumed in the WFAM and Wells Fargo profitability analysis.
Funds Management reported on the methodologies and estimates used in calculating profitability, including a description of the methodology used to allocate certain expenses. Among other things, the Board noted that the levels of profitability reported on a fund-by-fund basis varied widely, depending on factors such as the size, type and age of fund.
Based on its review, the Board did not deem the profits reported by Funds Management, WFAM or Wells Fargo from services provided to the Fund to be at a level that would prevent it from approving the continuation of the Advisory Agreements.
Economies of scale
The Board received and considered information about the potential for Funds Management to experience economies of scale in the provision of management services to the Fund, the difficulties of calculating economies of scale at an individual fund level, and the extent to which potential scale benefits are shared with shareholders. The Board noted the existence of breakpoints in the Fund’s management fee structure, which operate generally to reduce the Fund’s expense ratios as the Fund grows in size, and the size of the Fund in relation to such breakpoints. The Board considered that in addition to management fee breakpoints, Funds Management shares potential economies of scale from its management business in a variety of ways, including through fee waiver and expense reimbursement arrangements, services that benefit shareholders, competitive management fee rates set at the outset without regard to breakpoints, and investments in the business intended to enhance services available to shareholders.
The Board concluded that Funds Management’s arrangements with respect to the Fund, including contractual breakpoints, constituted a reasonable approach to sharing potential economies of scale with the Fund and its shareholders.
Other benefits to Funds Management and the Sub-Adviser
The Board received and considered information regarding potential “fall-out” or ancillary benefits received by Funds Management and its affiliates, including the Sub-Adviser, as a result of their relationships with the Fund. Ancillary benefits could include, among others, benefits directly attributable to other relationships with the Fund and benefits potentially derived from an increase in Funds Management’s and the Sub-Adviser’s business as a result of their relationships with the Fund. The Board noted that various affiliates of Funds Management may receive distribution-related fees, shareholder servicing payments and sub-transfer agency fees in respect of shares sold or held through them and services provided.
The Board also reviewed information about soft dollar credits earned and utilized by the Sub-Adviser, fees earned by Funds Management and the Sub-Adviser from managing a private investment vehicle for the fund family’s securities lending collateral, and commissions earned by an affiliated broker from portfolio transactions.
Based on its consideration of the factors and information it deemed relevant, including those described here, the Board did not find that any ancillary benefits received by Funds Management and its affiliates, including the Sub-Adviser, were unreasonable.
Conclusion
At the Meeting, after considering the above-described factors and based on its deliberations and its evaluation of the information described above, the Board unanimously approved the continuation of the Advisory Agreements for a one-year term and determined that the compensation payable to Funds Management and the Sub-Adviser under each of the Advisory Agreements was reasonable.
54 | Wells Fargo Ultra Short-Term Municipal Income Fund
Other information (unaudited)
LIQUIDITY RISK MANAGEMENT PROGRAM
In accordance with Rule 22e-4 under the Investment Company Act of 1940, as amended (the “Liquidity Rule”), Wells Fargo Funds Trust (the “Trust”) has adopted and implemented a liquidity risk management program (the “Program”) on behalf of each of its series, including the Fund, which is reasonably designed to assess and manage the Fund’s liquidity risk. “Liquidity risk” is defined as the risk that the Fund is unable to meet redemption requests without significantly diluting remaining investors’ interests in the Fund. The Trust’s Board of Trustees (the “Board”) previously approved the designation of Wells Fargo Funds Management, LLC (“Funds Management”), the Fund’s investment manager, as the administrator of the Program, and Funds Management has established a Liquidity Risk Management Council composed of personnel from multiple departments within Funds Management and its affiliates to assist Funds Management in the implementation and on-going administration of the Program.
The Program is comprised of various components designed to support the assessment and/or management of liquidity risk, including: (1) the periodic assessment (no less frequently than annually) of certain factors that influence the Fund’s liquidity risk; (2) the periodic classification (no less frequently than monthly) of the Fund’s investments into one of four liquidity categories that reflect an estimate of their liquidity under current market conditions; (3) a 15% limit on the acquisition of “illiquid investments” (as defined under the Liquidity Rule); (4) to the extent the Fund does not invest primarily in “highly liquid investments” (as defined under the Liquidity Rule), the determination of a minimum percentage of the Fund’s assets that generally will be invested in highly liquid investments (an “HLIM”); (5) if the Fund has established an HLIM, the periodic review (no less frequently than annually) of the HLIM and the adoption of policies and procedures for responding to a shortfall of the Fund’s “highly liquid investments” below its HLIM; and (6) periodic reporting to the Board.
At a meeting of the Board held on May 26 and 28, 2020, the Board received a written report (the “Report”) from Funds Management that addressed the operation of the Program and assessed its adequacy and effectiveness of implementation. The Report covered the initial period from December 1, 2018 through December 31, 2019 (the “Reporting Period”). No significant liquidity events impacting the Fund were noted in the Report. There were no material changes to the Program during the Reporting Period. The Report concluded that the Program is operating effectively to assess and manage the Fund’s liquidity risk, and that the Program has been and continues to be adequately and effectively implemented to monitor and, as applicable, respond to the Fund’s liquidity developments.
There can be no assurance that the Program will achieve its objectives under all circumstances in the future. Please refer to the Fund’s prospectus for more information regarding the Fund’s exposure to liquidity risk and other risks to which an investment in the Fund may be subject.
Wells Fargo Ultra Short-Term Municipal Income Fund | 55
Effective on or after May 1, 2020, clients of Edward Jones (also referred to as “shareholders”) purchasing Fund shares on the Edward Jones commission and fee-based platforms are eligible only for the following sales charge discounts (also referred to as “breakpoints”) and waivers, which can differ from breakpoints and waivers described elsewhere in the Fund’s Prospectus or SAI or through another broker-dealer. In all instances, it is the shareholder’s responsibility to inform Edward Jones at the time of purchase of any relationship, holdings of Wells Fargo Funds or other facts qualifying the purchaser for breakpoints or waivers. Edward Jones can ask for documentation of such circumstance.
| Breakpoints available at Edward Jones |
| Rights of Accumulation (ROA) |
The applicable sales charge on a purchase of Class A shares is determined by taking into account all share classes (except any money market funds and retirement plan share classes) of Wells Fargo Funds held by the shareholder or in an account grouped by Edward Jones with other accounts for the purpose of providing certain pricing considerations (“pricing groups”). This includes all share classes held on the Edward Jones platform and/or held on another platform. The inclusion of eligible fund family assets in the rights of accumulation calculation is dependent on the shareholder notifying his or her financial advisor of such assets at the time of calculation. |
ROA is determined by calculating the higher of cost or market value (current shares x NAV). |
| Letter of Intent (LOI) |
Through a LOI, shareholders can receive the sales charge and breakpoint discounts for purchases shareholders intend to makeover a 13-month period from the date Edward Jones receives the LOI. The LOI is determined by calculating the higher of cost or market value of qualifying holdings at LOI initiation in combination with the value that the shareholder intends to buy over a 13-month period to calculate the front-end sales charge and any breakpoint discounts. Each purchase the shareholder makes during that 13-month period will receive the sales charge and breakpoint discount that applies to the total amount. The inclusion of eligible fund family assets in the LOI calculation is dependent on the shareholder notifying his or her financial advisor of such assets at the time of calculation. Purchases made before the LOI is received by Edward Jones are not covered under the LOI and will not reduce the sales charge previously paid. Sales charges will be adjusted if LOI is not met. |
| Sales charges are waived for the following shareholders and in the following situations at Edward Jones: |
● Associates of Edward Jones and its affiliates and their family members who are in the same pricing group (as determined by Edward Jones under its policies and procedures) as the associate. This waiver will continue for the remainder of the associate’s life if the associate retires from Edward Jones in good-standing. |
● Shares purchased in an Edward Jones fee-based program. |
● Shares purchased through reinvestment of capital gains distributions and dividend reinvestment. |
● Shares purchased from the proceeds of redeemed shares of the same fund family so long as the following conditions are met: 1) the proceeds are from the sale of shares within 60 days of the purchase, and 2) the sale and purchase are made in the same share class and the same account or the purchase is made in an individual retirement account with proceeds from liquidations in anon-retirement account. |
● Shares exchanged into Class A shares from another share class so long as the exchange is into the same fund and was initiated at the discretion of Edward Jones. Edward Jones is responsible for any remaining CDSC due to the fund company, if applicable. Any future purchases are subject to the applicable sales charge as disclosed in the prospectus. |
● Exchanges from Class C shares to Class A shares of the same fund, generally, in the 84th month following the anniversary of the purchase date or earlier at the discretion of Edward Jones. |
| If the shareholder purchases shares that are subject to a CDSC and those shares are redeemed before the CDSC is expired, the shareholder is responsible to pay the CDSC except in the following conditions available at Edward Jones: |
● The death or disability of the shareholder. |
● Systematic withdrawals with up to 10% per year of the account value. |
● Return of excess contributions from an Individual Retirement Account (IRA). |
● Shares sold as part of a required minimum distribution for IRA and retirement accounts if the redemption is taken in or after the year the shareholder reaches qualified age based on applicable IRS regulation. |
● Shares sold to pay Edward Jones fees or costs in such cases where the transaction is initiated by Edward Jones. |
● Shares exchanged in an Edward Jones fee-based program. |
● Shares acquired through NAV reinstatement. |
56 | Wells Fargo Ultra Short-Term Municipal Income Fund
Appendix I (unaudited)
| Other Important Information for accounts at Edward Jones: |
| Minimum Purchase Amounts |
● $250 initial purchase minimum |
● $50 subsequent purchase minimum |
| Minimum Balances |
| Edward Jones has the right to redeem at its discretion fund holdings with a balance of $250 or less. The following are examples of accounts that are not included in this policy: |
● A fee-based account held on an Edward Jones platform ● A 529 account held on an Edward Jones platform ● An account with an active systematic investment plan or letter of intent (LOI) |
| Changing Share Classes |
| At any time it deems necessary, Edward Jones has the authority to exchange at NAV a shareholder’s holdings in a fund to Class A shares. |
Wells Fargo Ultra Short-Term Municipal Income Fund | 57
Effective June 1, 2020, shareholders purchasing Fund shares through an Oppenheimer & Co. Inc. (“Oppenheimer”) platform or account are eligible only for the following load waivers (front-end sales charge waivers and contingent deferred or back-end, sales charge waivers) and discounts, which may differ from those disclosed in the Fund’s Prospectus or SAI.
| Front-end Sales Load Waivers on Class A Shares available at Oppenheimer |
| Employer-sponsored retirement, deferred compensation and employee benefit plans (including health savings accounts) and trusts used to fund those plans, provided that the shares are not held in a commission-based brokerage account and shares are held for the benefit of the plan. |
| Shares purchased by or through a 529 Plan. |
| Shares purchased through an Oppenheimer affiliated investment advisory program. |
| Shares purchased through reinvestment of capital gains distributions and dividend reinvestment when purchasing shares of the same fund (but not any other fund within the fund family). |
| Shares purchased from the proceeds of redemptions within the same fund family, provided (1) the repurchase occurs within 90 days following the redemption, (2) the redemption and purchase occur in the same account, and (3) redeemed shares were subject to a front-end or deferred sales load (known as Rights of Restatement). |
| A shareholder in the Fund’s Class C shares will have their shares exchanged at net asset value to Class A shares (or the appropriate share class) of the Fund if the shares are no longer subject to a CDSC and the exchange is in line with the policies and procedures of Oppenheimer. |
| Employees and registered representatives of Oppenheimer or its affiliates and their family members. |
| Directors or Trustees of the Fund, and employees of the Fund’s investment adviser or any of its affiliates, as described in the Prospectus. |
| CDSC Waivers on A and C Shares available at Oppenheimer |
| Death or disability of the shareholder. |
| Shares sold as part of a systematic withdrawal plan as described in the Prospectus. |
| Return of excess contributions from an IRA Account. |
| Shares sold as part of a required minimum distribution for IRA and retirement accounts due to the shareholder reaching the qualified age based on applicable IRS regulations as described in the Prospectus. |
| Shares sold to pay Oppenheimer fees but only if the transaction is initiated by Oppenheimer. |
| Shares acquired through a right of reinstatement. |
| Front-end load Discounts Available at Oppenheimer: Breakpoints, Rights of Accumulation & Letters of Intent |
| Breakpoints as described in the Prospectus. |
| Rights of Accumulation (ROA), which entitle shareholders to breakpoint discounts, will be automatically calculated based on the aggregated holding of fund family assets held by accounts within the purchaser’s household at Oppenheimer. Eligible fund family assets not held at Oppenheimer may be included in the ROA calculation only if the shareholder notifies his or her financial advisor about such assets. |
58 | Wells Fargo Ultra Short-Term Municipal Income Fund
Effective June 15, 2020, shareholders purchasing fund shares through a Robert W. Baird & Co. (“Baird”) platform or account will only be eligible for the following sales charge waivers (front-end sales charge waivers and CDSC waivers) and discounts, which may differ from those disclosed elsewhere in the Fund’s Prospectus or the SAI.
| Front-end Sales Load Waivers on Class A Shares available at Baird |
| Shares purchased through reinvestment of capital gains distributions and dividend reinvestment when purchasing share of the same fund. |
| Share purchase by employees and registers representatives of Baird or its affiliate and their family members as designated by Baird. |
| Shares purchase from the proceeds of redemptions within the same fund family, provided (1) the repurchase occurs within 90 days following the redemption, (2) the redemption and purchase occur in the same accounts, and (3) redeemed shares were subject to a front-end or deferred sales charge (known as rights of reinstatement). |
| A shareholder in the Funds Investor C Shares will have their share exchanged at net asset value to Investor A shares of the fund if the shares are no longer subject to CDSC and the exchange is in line with the policies and procedures of Baird. |
| Employer-sponsored retirement plans or charitable accounts in a transactional brokerage account at Baird, including 401(k) plans, 457 plans, employer-sponsored 403(b) plans, profit sharing and money purchase pension plans and defined benefit plans. For purposes of this provision, employer-sponsored retirement plans do not include SEP IRAs, Simple IRAs or SAR-SEPs. |
| CDSC Waivers on A and C Shares available at Baird |
| Shares sold due to death or disability of the shareholder. |
| Shares sold as part of a systematic withdrawal plan as described in the Fund’s Prospectus. |
| Shares bought due to returns of excess contributions from an IRA Account. |
| Shares sold as part of a required minimum distribution for IRA and retirement accounts due to the shareholder reaching age 72 as described in the Fund’s Prospectus. |
| Shares sold to pay Baird fees but only if the transaction is initiated by Baird. |
| Shares acquired through a right of reinstatement. |
| Front-end load Discounts Available at Baird: Breakpoint and/or Rights of Accumulation |
| Breakpoints as described in the Prospectus. |
| Rights of accumulations which entitles shareholders to breakpoint discounts will be automatically calculated based on the aggregated holding of fund family assets held by accounts within the purchaser’s household at Baird. Eligible fund family assets not held at Baird may be included in the rights of accumulations calculation only if the shareholder notifies his or her financial advisor about such assets. |
| Letters of Intent (LOI) allow for breakpoint discounts based on anticipated purchases within a fund family through Baird, over a 13-month period of time. |
Wells Fargo Ultra Short-Term Municipal Income Fund | 59
This page is intentionally left blank.
For more information
More information about Wells Fargo Funds is available free upon request. To obtain literature, please write, visit the Fund’s website, or call:
Wells Fargo Funds
P.O. Box 219967
Kansas City, MO 64121-9967
Website: wfam.com
Individual investors: 1-800-222-8222
Retail investment professionals: 1-888-877-9275
Institutional investment professionals: 1-866-765-0778

This report and the financial statements contained herein are submitted for the general information of the shareholders of the Fund. If this report is used for promotional purposes, distribution of the report must be accompanied or preceded by a current prospectus. Before investing, please consider the investment objectives, risks, charges, and expenses of the investment. For a current prospectus and, if available, a summary prospectus, containing this information, call 1-800-222-8222 or visit the Fund’s website at wfam.com. Read the prospectus carefully before you invest or send money.
Wells Fargo Asset Management (WFAM) is the trade name for certain investment advisory/management firms owned by Wells Fargo & Company. These firms include but are not limited to Wells Capital Management Incorporated and Wells Fargo Funds Management, LLC. Certain products managed by WFAM entities are distributed by Wells Fargo Funds Distributor, LLC (a broker-dealer and Member FINRA).
This material is for general informational and educational purposes only and is NOT intended to provide investment advice or a recommendation of any kind—including a recommendation for any specific investment, strategy, or plan.
INVESTMENT PRODUCTS: NOT FDIC INSURED ◾ NO BANK GUARANTEE ◾ MAY LOSE VALUE
© 2020 Wells Fargo & Company. All rights reserved.
PAR-0720-00250 08-20
A258/AR258 06-20

Annual Report
June 30, 2020
Wells Fargo
Wisconsin Tax-Free Fund
Beginning on January 1, 2021, as permitted by new regulations adopted by the Securities and Exchange Commission, paper copies of the Wells Fargo Funds’ annual and semi-annual shareholder reports issued after this date will no longer be sent by mail, unless you specifically request paper copies of the reports. Instead, the reports will be made available on the Funds’ website, and you will be notified by mail each time a report is posted and provided with a website address to access the report.
If you already elected to receive shareholder reports electronically, you will not be affected by this change and you need not take any action. You may elect to receive shareholder reports and other communications from the Fund electronically at any time by contacting your financial intermediary (such as a broker-dealer or bank) or, if you are a direct investor, by calling 1-800-222-8222 or by enrolling at wellsfargo.com/advantagedelivery.
You may elect to receive all future reports in paper free of charge. If you invest through a financial intermediary, you can contact your financial intermediary to request that you continue to receive paper copies of your shareholder reports; if you invest directly with the Fund, you can call 1-800-222-8222. Your election to receive reports in paper will apply to all Wells Fargo Funds held in your account with your financial intermediary or, if you are a direct investor, to all Wells Fargo Funds that you hold.
|
Reduce clutter. Save trees. |
Sign up for electronic delivery of prospectuses and shareholder reports at wellsfargo.com/ |
The views expressed and any forward-looking statements are as of June 30, 2020, unless otherwise noted, and are those of the Fund managers and/or Wells Fargo Asset Management. Discussions of individual securities, or the markets generally, or any Wells Fargo Fund are not intended as individual recommendations. Future events or results may vary significantly from those expressed in any forward-looking statements. The views expressed are subject to change at any time in response to changing circumstances in the market. Wells Fargo Asset Management and the Fund disclaim any obligation to publicly update or revise any views expressed or forward-looking statements.
INVESTMENT PRODUCTS: NOT FDIC INSURED ◾ NO BANK GUARANTEE ◾ MAY LOSE VALUE
Wells Fargo Wisconsin Tax-Free Fund | 1
Letter to shareholders (unaudited)

Andrew Owen
President
Wells Fargo Funds
Dear Shareholder:
We are pleased to offer you this annual report for the Wells Fargo Wisconsin Tax-Free Fund for the 12-month period that ended June 30, 2020. Global stock markets saw earlier gains erased in February and March as governments around the world took unprecedented measures to stop the spread of the coronavirus at the expense of short-term economic output. However, markets rebounded from April through June to offset much of the losses as central banks attempted to bolster capital markets and confidence. Fixed-income markets generally performed better, with most achieving gains. Overall U.S. markets surpassed their international peers, while U.S. large-cap equity, as measured by the Russell 1000® Index1, easily outperformed small caps, as measured by the Russell 2000® Index2, for the 12-month period.
For the 12-month period, fixed-income securities generally had positive total returns while non-U.S. equities had broad losses and U.S. stocks performed strongly despite sharp volatility since late February. For the period, U.S. stocks, based on the S&P 500 Index,3 gained 7.51%. International stocks, as measured by the MSCI ACWI ex USA Index (Net),4 returned -4.80%, while the MSCI EM Index (Net)5 performed slightly better, with a -3.39% return. For bond investors, the Bloomberg Barclays U.S. Aggregate Bond Index6 returned a robust 8.74%, the Bloomberg Barclays Global Aggregate ex-USD Index7 gained a modest 0.71%, and the Bloomberg Barclays Municipal Bond Index8 returned 4.45% while the ICE BofA U.S. High Yield Index9 lost 1.10%.
The fiscal year began on a positive note.
The 12-month period began with the U.S. equity market advancing to new highs in July 2019. U.S. President Donald Trump initially backed off of earlier tariff threats against Mexico and China. However, later in July, the U.S. reversed course and threatened to impose higher tariffs on China’s exports after talks failed. China responded with tariff threats of its own and devalued the renminbi, roiling global markets. Major U.S. stock market indices closed July with the worst weekly results of the year. Bond prices gained as Treasury yields fell to multiyear lows, and the yield curve inverted at multiple points along the 30-year arc, with shorter term yields higher than longer-term. At the end of July, the U.S. Federal Reserve (Fed) cut its federal funds rate by 0.25%.
In August, U.S.-China trade tensions continued with no signs of compromise. Evidence of a continued global economic slowdown mounted, and central banks in China, New Zealand, and Thailand cut interest rates. Industrial and manufacturing data declined in China,
| 1 | The Russell 1000® Index measures the performance of the 1,000 largest companies in the Russell 3000® Index, which represents approximately 92% of the total market capitalization of the Russell 3000® Index. You cannot invest directly in an index. |
| 2 | The Russell 2000® Index measures the performance of the 2,000 smallest companies in the Russell 3000® Index, which represents approximately 8% of the total market capitalization of the Russell 3000® Index. You cannot invest directly in an index. |
| 3 | The S&P 500 Index consists of 500 stocks chosen for market size, liquidity, and industry group representation. It is a market-value-weighted index with each stock’s weight in the index proportionate to its market value. You cannot invest directly in an index. |
| 4 | The Morgan Stanley Capital International (MSCI) All Country World Index (ACWI) ex USA Index (Net) is a free-float-adjusted market-capitalization-weighted index that is designed to measure the equity market performance of developed and emerging markets, excluding the United States. Source: MSCI. MSCI makes no express or implied warranties or representations and shall have no liability whatsoever with respect to any MSCI data contained herein. The MSCI data may not be further redistributed or used as a basis for other indices or any securities or financial products. This report is not approved, reviewed, or produced by MSCI. You cannot invest directly in an index. |
| 5 | The MSCI Emerging Markets (EM) Index (Net) is a free-float-adjusted market-capitalization-weighted index that is designed to measure equity market performance of emerging markets. You cannot invest directly in an index. |
| 6 | The Bloomberg Barclays U.S. Aggregate Bond Index is a broad-based benchmark that measures the investment-grade, U.S. dollar-denominated, fixed-rate taxable bond market, including Treasuries, government-related and corporate securities, mortgage-backed securities (agency fixed-rate and hybrid adjustable-rate mortgage pass-throughs), asset-backed securities, and commercial mortgage-backed securities. You cannot invest directly in an index. |
| 7 | The Bloomberg Barclays Global Aggregate ex-USD Index is an unmanaged index that provides a broad-based measure of the global investment-grade fixed-income markets excluding the U.S.-dollar-denominated debt market. You cannot invest directly in an index. |
| 8 | The Bloomberg Barclays Municipal Bond Index is an unmanaged index composed of long-term tax-exempt bonds with a minimum credit rating of Baa. You cannot invest directly in an index. |
| 9 | The ICE BofA U.S. High Yield Index is a market-capitalization-weighted index of domestic and Yankee high-yield bonds. The index tracks the performance of high-yield securities traded in the U.S. bond market. You cannot invest directly in an index. Copyright 2020. ICE Data Indices, LLC. All rights reserved. |
2 | Wells Fargo Wisconsin Tax-Free Fund
Letter to shareholders (unaudited)
Canada, Japan, and Germany. Adding to global uncertainty, Italy’s prime minister resigned, many feared a crackdown in Hong Kong as protestors sustained their calls for reform, and U.K. Prime Minister Boris Johnson planned to suspend Parliament as Brexit’s deadline neared.
In the U.S., the Fed cut interest rates a second time in September. U.S. manufacturing data disappointed investors. The U.S. Congress announced it would pursue an impeachment investigation of President Trump. Meanwhile, the Brexit impasse showed no signs of resolution. Officials in China said that hitting the country’s economic growth goals for the year would be difficult considering the weight of tariffs and trade restrictions. Although the S&P 500 Index finished the third quarter with the best year-to-date returns in more than 20 years, concerns about future returns remained.
The fourth quarter started on a strong note, with U.S.-China trade tensions relaxing in October along with renewed optimism for a U.K. Brexit deal and positive macroeconomic data. The initial estimate of U.S. third-quarter gross domestic product (GDP) growth was a resilient 1.9% annualized rate, while the U.S. unemployment rate fell to a 50-year low of 3.5% in September. However, despite resilience among U.S. consumers, business confidence declined while manufacturing activity contracted. Concerned with a potential economic slowdown, the Fed lowered interest rates another quarter point in late October—its third rate cut in four months. This helped push the S&P 500 Index to a new all-time high while emerging market equities rallied and global bonds declined overall, reflecting a broad pickup in risk appetite.
Equity markets continued to rally in November despite ongoing geopolitical risks. Hopes for a U.S.-China trade deal buoyed investor confidence. U.S. business sentiment improved slightly, and manufacturing and services activity picked up. While consumer confidence and purchasing manager activity rose in the eurozone, China reported weakening manufacturing and consumer data. Bond yields rose marginally, leading to slightly negative returns for global government and investment-grade corporate bonds.
Financial markets ended 2019 with a boost from the U.S. and China accord on a Phase One trade deal. That, along with the landslide win by the pro-Brexit U.K. Conservative Party in a national election and ongoing central bank support, gave investors greater confidence. U.S. economic indicators were generally positive, with the exception of manufacturing activity and business confidence. Consumer confidence was resilient, fed by a robust labor market, tame inflation, and lower interest rates, which boosted housing affordability and stimulated homebuyer activity. The impeachment of President Trump had little impact on markets. Meanwhile, slowing Chinese economic activity, partly attributable to the trade war, led to further government stimulus at year-end through lower reserve ratios, allowing banks to lend more money.
The year-end rally continued in early January 2020. However, capital market volatility picked up sharply in late January on concerns over the potential impact of the coronavirus on the global economy and stock markets. With sentiment somewhat souring, perceived safe havens did well in January. The U.S. dollar and Japanese yen both rose, and government bonds outperformed equities. While the S&P 500 Index held its ground, emerging market equities tumbled, including those in Asia.
In February, the coronavirus became the major market focus. Fears of the virus’s impact on global growth led to expectations of increased global central bank monetary policy support. That led the 10-year U.S. Treasury yield to fall to an all-time low of 1.1% by the end of the month. Although equity markets initially shrugged off concerns about the outbreak, focusing instead on strong fourth-quarter earnings and improving business confidence in January, market sentiment turned sharply lower toward month-end and the S&P 500 Index lost 8.2% for the month. Oil prices tumbled as Russia and the Organization of the Petroleum Exporting countries compounded a major decline in oil demand with a brutal price war, partly aimed at dissuading further U.S. shale production. As a result, the price of West Texas Intermediate crude oil fell 13% in February.
Wells Fargo Wisconsin Tax-Free Fund | 3
Letter to shareholders (unaudited)
“The global spread of the coronavirus led country after country to clamp down on social and business-related activity in order to contain the virus from causing even greater devastation and overwhelming health care systems.”
“Despite ongoing economic weakness and high levels of uncertainty on the containment of the coronavirus and the timing of an effective vaccine, financial markets continued to post widely positive returns in June.”
The global spread of the coronavirus led country after country to clamp down on social and business-related activity in order to contain the virus from causing even greater devastation and overwhelming health care systems. This abrupt stoppage of economic activity led to the sharp deceleration of global output, sending economies into a deep contraction. Central bank responses were swift, as they slashed interest rates and expanded quantitative easing programs to restore liquidity and confidence to the markets. In the U.S., the Fed introduced several new lending programs, funding investment-grade bonds, money market mutual funds, and commercial paper while purchasing Treasuries, mortgage-backed securities, and overnight repurchase agreements. Meanwhile, stock markets tumbled quickly into a bear market, ending the longest bull stock market in U.S. history.
Markets rebounded strongly in April, with the S&P 500 Index gaining 12.8% for the month and the MSCI ACWI ex USA Index (Net) returning 7.6%. The rebound was fueled by unprecedented government and central bank stimulus measures taken to buffer the economic damage created by mass shutdowns enacted in order to contain the virus’s spread. The U.S. economy contracted by an annualized 5.0% pace in the first quarter, with 30 million new unemployment insurance claims in six weeks. In the eurozone, first-quarter real GDP shrank 3.8%, with the composite April Flash Purchasing Managers’ Index, a monthly survey of purchasing managers, falling to an all-time low of 13.5. The European Central Bank expanded its quantitative easing to include the purchase of additional government bonds of countries with the greatest virus-related need, including Italy and Spain. China’s first-quarter GDP fell by 6.8% year over year. However, retail sales, production, and investment showed signs of recovery. Extreme oil-price volatility continued as global supply far exceeded demand.
In May, the equity market rebound continued, with the S&P 500 Index climbing a further 4.8%. European and Japanese stock markets also had monthly gains. Investors regained confidence on reports of early signs of success in human trials of a coronavirus vaccine. Growth stocks continued to outperform value stocks while returns on global government bonds were generally flat. In the U.S., a gap grew between the stock market rebound and devastating economic data points, including an April unemployment rate of 14.7%, the highest level since World War II. Purchasing managers’ indices continued to reflect weakening activity in May in both the manufacturing and services sectors. U.S. corporate earnings reports indicated a 14% year-over-year contraction in earnings from the first quarter of 2019. However, high demand for technology, driven by remote activity, helped maintain robust information technology sector earnings, which helped drive powerful well-known technology stocks higher.
Despite ongoing economic weakness and high levels of uncertainty on the containment of the coronavirus and the timing of an effective vaccine, financial markets continued to post widely positive returns in June. As economies reopened, there were hopeful signs. U.S. retail sales rose 17% in May while retail sales in the U.K. rebounded by 12%. However, year over year, sales remained depressed. Vitally important to market sentiment was the ongoing commitment by central banks globally to do all they can to provide economic support through liquidity and low borrowing costs. U.S. economic activity was aided by one-time $1,200 stimulus checks and $600 bonus weekly unemployment benefits due to expire at the end of July. However, unemployment remained in the double digits, easing somewhat from 14.7% in April to 11.1% in June. At period-end, numerous states reported alarming increases of coronavirus cases. China’s economic recovery picked up momentum in June, though it remained far from a full recovery.
4 | Wells Fargo Wisconsin Tax-Free Fund
Letter to shareholders (unaudited)
Don’t let short-term uncertainty derail long-term investment goals.
Periods of investment uncertainty can present challenges, but experience has taught us that maintaining long-term investment goals can be an effective way to plan for the future. To help you create a sound strategy based on your personal goals and risk tolerance, Wells Fargo Funds offers more than 100 mutual funds spanning a wide range of asset classes and investment styles. Although diversification cannot guarantee an investment profit or prevent losses, we believe it can be an effective way to manage investment risk and potentially smooth out overall portfolio performance. We encourage investors to know their investments and to understand that appropriate levels of risk-taking may unlock opportunities.
Thank you for choosing to invest with Wells Fargo Funds. We appreciate your confidence in us and remain committed to helping you meet your financial needs.
Sincerely,

Andrew Owen
President
Wells Fargo Funds
|
For further information about your Fund, contact your investment professional, visit our website at wfam.com, or call us directly at 1-800-222-8222. |
Notice to Shareholders
At a meeting held on August 10-12, 2020, the Board of Trustees of the Fund approved a change to the Fund’s automatic conversion feature for Class C shares in order to shorten the required holding period from 10 to 8 years. As a result, on a monthly basis beginning November 5, 2020, Class C shares will convert automatically into Class A shares 8 years after the initial date of purchase or, if you acquired your Class C shares through an exchange or conversion from another share class, 8 years after the date you acquired your Class C shares. When Class C shares that you acquired through a purchase or exchange convert, any other Class C shares that you purchased with reinvested dividends and distributions also will convert into Class A shares on a pro rata basis.
Please note that a shorter holding period may apply depending on your intermediary. Please see “Appendix A—Sales Charge Reductions and Waivers for Certain Intermediaries” in the Fund’s prospectus for further information.
Wells Fargo Wisconsin Tax-Free Fund | 5
Performance highlights (unaudited)
Investment objective
The Fund seeks current income exempt from federal income tax and Wisconsin individual income tax.
Manager
Wells Fargo Funds Management, LLC
Subadviser
Wells Capital Management Incorporated
Portfolio managers
Bruce R. Johns
Thomas Stoeckmann
Average annual total returns (%) as of June 30, 2020
| Including sales charge | Excluding sales charge | Expense ratios1 (%) | ||||||||||||||||||||||||||||||||
| Inception date | 1 year | 5 year | 10 year | 1 year | 5 year | 10 year | Gross | Net2 | ||||||||||||||||||||||||||
| Class A (WWTFX) | 3-31-2008 | -1.59 | 2.10 | 2.84 | 3.05 | 3.04 | 3.31 | 0.94 | 0.70 | |||||||||||||||||||||||||
| Class C (WWTCX) | 12-26-2002 | 1.27 | 2.27 | 2.54 | 2.27 | 2.27 | 2.54 | 1.69 | 1.45 | |||||||||||||||||||||||||
| Institutional Class (WWTIX)3 | 10-31-2016 | – | – | – | 3.23 | 3.18 | 3.38 | 0.61 | 0.52 | |||||||||||||||||||||||||
| Bloomberg Barclays Municipal Bond Index4 | – | – | – | – | 4.45 | 3.93 | 4.22 | – | – | |||||||||||||||||||||||||
| Bloomberg Barclays Wisconsin Municipal Bond Index5 | – | – | – | – | 4.55 | 3.59 | 3.92 | – | – | |||||||||||||||||||||||||
Figures quoted represent past performance, which is no guarantee of future results, and do not reflect taxes that a shareholder may pay on an investment in a fund. Investment return and principal value of an investment will fluctuate so that an investor’s shares, when redeemed, may be worth more or less than their original cost. Performance shown without sales charges would be lower if sales charges were reflected. Current performance may be lower or higher than the performance data quoted, which assumes the reinvestment of dividends and capital gains. Current month-end performance is available on the Fund’s website, wfam.com.
Index returns do not include transaction costs associated with buying and selling securities, any mutual fund fees or expenses, or any taxes. It is not possible to invest directly in an index.
For Class A shares, the maximum front-end sales charge is 4.50%. For Class C shares, the maximum contingent deferred sales charge is 1.00%. Performance including a contingent deferred sales charge assumes the sales charge for the corresponding time period. Institutional Class shares are sold without a front-end sales charge or contingent deferred sales charge.
Bond values fluctuate in response to the financial condition of individual issuers, general market and economic conditions, and changes in interest rates. Changes in market conditions and government policies may lead to periods of heightened volatility in the bond market and reduced liquidity for certain bonds held by the Fund. In general, when interest rates rise, bond values fall and investors may lose principal value. Interest rate changes and their impact on the Fund and its share price can be sudden and unpredictable. The use of derivatives may reduce returns and/or increase volatility. Certain investment strategies tend to increase the total risk of an investment (relative to the broader market). The Fund is exposed to Wisconsin and Puerto Rico municipal securities risk, high-yield securities risk, and nondiversification risk. Consult the Fund’s prospectus for additional information on these and other risks. A portion of the Fund’s income may be subject to federal, state, and/or local income taxes or the Alternative Minimum Tax (AMT). Any capital gains distributions may be taxable.
Please see footnotes on page 7.
6 | Wells Fargo Wisconsin Tax-Free Fund
Performance highlights (unaudited)
| Growth of $10,000 investment as of June 30, 20206 |
|
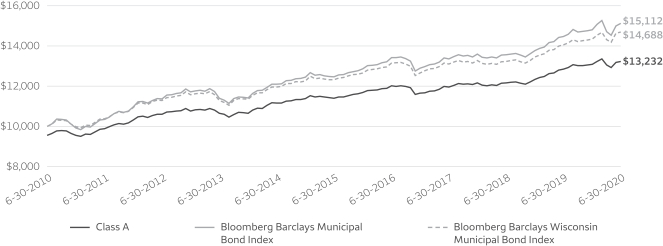
| 1 | Reflects the expense ratios as stated in the most recent prospectuses. The expense ratios shown are subject to change and may differ from the annualized expense ratios shown in the financial highlights of this report. |
| 2 | The manager has contractually committed through October 31, 2020, to waive fees and/or reimburse expenses to the extent necessary to cap total annual fund operating expenses after fee waivers at 0.70% for Class A, 1.45% for Class C, and 0.52% for Institutional Class. Brokerage commissions, stamp duty fees, interest, taxes, acquired fund fees and expenses (if any), and extraordinary expenses are excluded from the expense caps. Prior to or after the commitment expiration date, the caps may be increased or the commitment to maintain the caps may be terminated only with the approval of the Board of Trustees. Without these caps, the Fund’s returns would have been lower. The expense ratio paid by an investor is the net expense ratio (the total annual fund operating expenses after fee waivers) as stated in the prospectuses. |
| 3 | Historical performance shown for the Institutional Class shares prior to their inception reflects the performance of the Class A shares, and is not adjusted to reflect the Institutional Class expenses. If these expenses had been included, returns for the Institutional Class would be higher. |
| 4 | The Bloomberg Barclays Municipal Bond Index is an unmanaged index composed of long-term tax-exempt bonds with a minimum credit rating of Baa. You cannot invest directly in an index. |
| 5 | The Bloomberg Barclays Wisconsin Municipal Bond Index is the Wisconsin component of the Bloomberg Barclays Municipal Bond Index. You cannot invest directly in an index. |
| 6 | The chart compares the performance of Class A shares for the most recent ten years with the Bloomberg Barclays Municipal Bond Index and the Bloomberg Barclays Wisconsin Municipal Bond Index. The chart assumes a hypothetical $10,000 investment in Class A shares and reflects all operating expenses and assumes the maximum initial sales charge of 4.50%. |
| 7 | Amounts are calculated based on the long-term total investments of the Fund. These amounts are subject to change and may have changed since the date specified. |
| 8 | The credit quality distribution of portfolio holdings reflected in the chart is based on ratings from Standard & Poor’s, Moody’s Investors Service, and/or Fitch Ratings Ltd. Credit quality ratings apply to the underlying holdings of the Fund and not to the Fund itself. The percentages of the Fund’s portfolio with the ratings depicted in the chart are calculated based on the total market value of fixed income securities held by the Fund. If a security was rated by all three rating agencies, the middle rating was utilized. If rated by two of three rating agencies, the lower rating was utilized, and if rated by one of the rating agencies, that rating was utilized. Standard & Poor’s rates the creditworthiness of bonds, ranging from AAA (highest) to D (lowest). Ratings from A to CCC may be modified by the addition of a plus (+) or minus (-) sign to show relative standing within the rating categories. Standard & Poor’s rates the creditworthiness of short-term notes from SP-1 (highest) to SP-3 (lowest). Moody’s rates the creditworthiness of bonds, ranging from Aaa (highest) to C (lowest). Ratings Aa to B may be modified by the addition of a number 1 (highest) to 3 (lowest) to show relative standing within the ratings categories. Moody’s rates the creditworthiness of short-term U.S. tax-exempt municipal securities from MIG 1/VMIG 1 (highest) to SG (lowest). Fitch rates the creditworthiness of bonds, ranging from AAA (highest) to D (lowest). Credit quality distribution is subject to change and may have changed since the date specified. |
Wells Fargo Wisconsin Tax-Free Fund | 7
Performance highlights (unaudited)
MANAGER’S DISCUSSION
Fund highlights
| ∎ | The Fund underperformed its benchmarks, the Bloomberg Barclays Municipal Bond Index and the Bloomberg Barclays Wisconsin Municipal Bond Index, for the 12-month period that ended June 30, 2020. |
| ∎ | The Fund’s conservative short-duration and yield-curve positioning detracted from performance as all rates rallied and declined across the yield curve. We were overweight short to intermediate bonds, which underperformed, and underweight longer-term bonds, which outperformed. |
| ∎ | The Fund’s overweight to bonds rated A and BBB detracted from performance, as lower-rated investment-grade bonds underperformed bonds rated AAA and AA during the year as there was a flight to quality in response to the coronavirus pandemic. |
| ∎ | Selectivity of individual bonds along with sector allocation drove performance. The Fund’s overweight to housing and local general obligations (GOs) contributed to performance. |
| Effective maturity distribution as of June 30, 20207 |
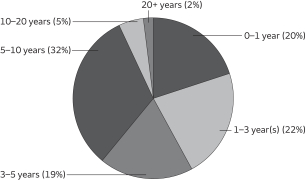 |
The coronavirus pandemic and the associated containment efforts became the dominant market influence over the 12-month period.
In 2019, market expectations moved the Federal Reserve (Fed) from a rate-hiking posture to multiple cuts in what was considered a “mid-cycle adjustment” at the time. Generally, positive U.S. economic data was enough for most investors to expect continued slow growth and an extension of the economic expansion. Global trade tensions prompted a rise in market volatility, which subsided with the passage of a Phase One U.S.-China trade deal late in the calendar year. President Trump was formally impeached and ultimately acquitted by the U.S. Senate. By March, the coronavirus pandemic brought an end to the longest bull market on record.
The municipal bond market was heavily influenced by technical factors throughout the reporting period. Municipal mutual funds saw 61 straight weeks of net inflows, which pushed yields across ratings categories to all-time lows by late February. Low yields and ample demand drove municipal issuance higher but also altered the mix. Taxable municipal bonds as a proportion of new issue municipal debt was at its highest level since 2010 by period-end. Pandemic-related volatility and liquidity pressures prompted record-setting outflows from municipal bonds in March. Strong support by the Fed, including a Municipal Liquidity Facility, and more than $2.5 trillion in fiscal stimulus buoyed markets and bolstered investor confidence. Several weeks of consecutive positive net flows for municipal funds and strong demand for new bonds drove yields back near the lows for highly rated issues. The period ended with the Fed pledging to keep short rates low for the foreseeable future. The fundamental outlook for municipal issuers came into question as the path of recovery from the virus remains extraordinarily uncertain.
Wisconsin offers municipal bond investing opportunities.
Wisconsin is the 21st-largest state by gross domestic product and 20th by population, rated AA by S&P and Aa1 by Moody’s. The state’s largest employment sector is manufacturing, although it has been successful at diversifying away from that exposure mainly into the health care industry. Despite its significant exposure to the manufacturing industry, during the coronavirus pandemic, the state has had a better employment situation than national levels, with unemployment currently at 12.0% compared with 13.3% according to Bureau of Labor Statistics data. Positively, the rate of coronavirus cases in the state has been lower than other areas, with an incidence rate of 554.3 per 100,000 people versus 817.4 per 100,000 nationally. As a result, the state may see marginal economic improvement relative to other areas of the country depending on the continuing severity of the coronavirus. Wisconsin is forecasting a decline of 7.5% in employment levels for the year, with personal income slowing to 2.2% in fiscal-year 2020 and 0.9% in fiscal-year 2021 as fiscal stimulus fades. The state is in the midpoint of the biennial 2020–2021 budget and thus far has not made any budget cuts for the current cycle. The income tax deadline was shifted from April 15 to July 15, so the full financial impact of the coronavirus will not be known until later in the summer. The state has a budget stabilization fund balance of $649.1 million, the strongest ever. However, it may be drawn down to avoid some cuts. Debt levels remain modestly elevated, although Wisconsin benefits from having a fully funded pension plan.
Please see footnotes on page 7.
8 | Wells Fargo Wisconsin Tax-Free Fund
Performance highlights (unaudited)
| Credit quality as of June 30, 20208 |
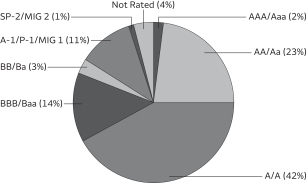 |
Conservative duration positioning, yield-curve positioning, credit quality, and security selection detracted from performance while sector allocation benefited performance.
We purchased many state issuers over the year, including Ashwaubenon, WI, Community Development Authority lease bonds, Wisconsin State Health and Educational Facilities Authority bonds, and Marshfield Clinic, Rogers Memorial Hospital. With the limited supply of double-tax-exempt bonds issued over the year, we’ve found some opportunities in other states as we were attracted by their relative value. We purchased the state of Illinois GO bonds; Guam government waterworks; and Suffolk County, New York, revenue anticipation notes.
In anticipation of the Fed continuing to normalize rates, we kept the Fund’s duration short relative to its primary benchmark in the first half of the year, but when the coronavirus pandemic became a U.S. health threat in March 2020, we started extending duration as the Fed cut rates in response to the pandemic as the economy contracted and unemployment surged. With both the Congress Coronavirus Aid, Relief, and Economic Security Act and Treasury supplying liquidity to the market, all rates rallied at the end of the period. The Fund was still short to its primary benchmark at the end of the period, which detracted from performance. The Fund’s yield-curve positioning detracted slightly from performance as we were overweight short- to intermediate-term bonds, which underperformed, and underweight longer-term bonds, which outperformed. The credit-quality allocation was the single-largest detractor from performance as A-rated and BBB-rated bonds, which we are overweight to, underperformed as the flight to quality drove AAA and AA to outperform as the coronavirus pandemic disrupted and disjointed all markets but affected lower-tier investment-grade credits more. Some of the worst-performing bonds were BBB-rated bonds, including Wisconsin State Health & Educational Facilities Authority Revenue bonds for Charter School Hmong American Peace Academy Limited 2020 and Wisconsin State Health & Educational Facilities Authority Revenue bonds for Lawrence University 2020. We would expect these bonds to continue to recover in pricing as the economy reopens and rebounds in the second half of 2020 and 2021.
Sector allocation contributed to overall performance, as we were overweight local GO bonds in Wisconsin, which outperformed, and pre-refunded bonds, which underperformed. Still, our security selection in pre-refunded bonds was positive. We were underweight revenue bonds, which underperformed. The most significant driver of performance was security selection. In many categories, even when the sector underperformed the main index, we outperformed with security selection driving performance in housing, water, sewer bonds, and local GOs. Some of the better-performing bonds for the year were Wisconsin Housing & Economic Development Authority Multifamily-Madison Pool Project and Wisconsin State Health & Educational Facilities Authority bonds Rogers Memorial Hospital. Denton, Texas, Independent Schools Bonds was one of the better-performing bonds from an out-of-state issuer for the year.
Market technicals are driving performance. We believe issue selection remains critical in state-specific funds.
We believe the U.S. economy will rebound in the second half of 2020 at a slow pace, and the recovery will be uneven. Wisconsin’s economy is slightly trailing the national average, even with unemployment faring better than the national average with the coronavirus disruptions. The economy will reopen with coronavirus driving the headlines as the phased reopening process will be choppy at times, affecting credit quality and sectors in many different ways. Prudent debt issuance discipline in cash flow notes should stabilize many municipalities along with continued improvement in management. We expect the Fed to be on hold for the balance of 2020 and 2021 to support the recovery of economic growth. Some municipalities may do well while others struggle. That is why we feel credit security selection and sector allocation will remain relevant. We expect to remain overweight in lower-quality investment-grade bonds. We believe investors are being compensated in adding to new investments in some of these areas as some sectors remained elevated in credit spreads. In our view, the long-term drivers of valuations will be supply and demand trends, absolute yield levels, the shape of the yield curve, and credit fundamentals as the coronavirus pandemic slows in 2021. We will continue to extend the Fund’s duration slightly. While we will continue our bias to overweighting lower-quality investment-grade bonds, it will be issuer-dependent based on our research process. We will add some higher-quality bonds in the AAA and AA areas as opportunities arise. We will monitor the economy to see how the recovery proceeds, with an eye on the technical market and fundamental credit quality to see if any changes are warranted in duration, yield-curve positioning, and sector or credit-quality selections over the next year.
Please see footnotes on page 7.
Wells Fargo Wisconsin Tax-Free Fund | 9
As a shareholder of the Fund, you incur two types of costs: (1) transaction costs, including sales charges (loads) on purchase payments and contingent deferred sales charges (if any) on redemptions and (2) ongoing costs, including management fees, distribution (12b-1) and/or shareholder servicing fees, and other Fund expenses. This example is intended to help you understand your ongoing costs (in dollars) of investing in the Fund and to compare these costs with the ongoing costs of investing in other mutual funds.
The example is based on an investment of $1,000 invested at the beginning of the six-month period and held for the entire period from January 1, 2020 to June 30, 2020.
Actual expenses
The “Actual” line of the table below provides information about actual account values and actual expenses. You may use the information in this line, together with the amount you invested, to estimate the expenses that you paid over the period. Simply divide your account value by $1,000 (for example, an $8,600 account value divided by $1,000 = 8.6), then multiply the result by the number in the “Actual” line under the heading entitled “Expenses paid during period” for your applicable class of shares to estimate the expenses you paid on your account during this period.
Hypothetical example for comparison purposes
The “Hypothetical” line of the table below provides information about hypothetical account values and hypothetical expenses based on the Fund’s actual expense ratio and an assumed rate of return of 5% per year before expenses, which is not the Fund’s actual return. The hypothetical account values and expenses may not be used to estimate the actual ending account balance or expenses you paid for the period. You may use this information to compare the ongoing costs of investing in the Fund and other funds. To do so, compare this 5% hypothetical example with the 5% hypothetical examples that appear in the shareholder reports of the other funds.
Please note that the expenses shown in the table are meant to highlight your ongoing costs only and do not reflect any transactional costs, such as sales charges (loads) and contingent deferred sales charges. Therefore, the “Hypothetical” line of the table is useful in comparing ongoing costs only and will not help you determine the relative total costs of owning different funds. In addition, if these transactional costs were included, your costs would have been higher.
Beginning account value 1-1-2020 | Ending account value 6-30-2020 | Expenses paid during the period1 | Annualized net expense ratio | |||||||||||||
Class A | ||||||||||||||||
Actual | $ | 1,000.00 | $ | 1,011.59 | $ | 3.45 | 0.69 | % | ||||||||
Hypothetical (5% return before expenses) | $ | 1,000.00 | $ | 1,021.43 | $ | 3.47 | 0.69 | % | ||||||||
Class C | ||||||||||||||||
Actual | $ | 1,000.00 | $ | 1,007.78 | $ | 7.24 | 1.45 | % | ||||||||
Hypothetical (5% return before expenses) | $ | 1,000.00 | $ | 1,017.65 | $ | 7.27 | 1.45 | % | ||||||||
Institutional Class | ||||||||||||||||
Actual | $ | 1,000.00 | $ | 1,012.44 | $ | 2.60 | 0.52 | % | ||||||||
Hypothetical (5% return before expenses) | $ | 1,000.00 | $ | 1,022.28 | $ | 2.61 | 0.52 | % | ||||||||
| 1 | Expenses paid is equal to the annualized net expense ratio of each class multiplied by the average account value over the period, multiplied by the number of days in the most recent fiscal half-year divided by the number of days in the fiscal year (to reflect the one-half-year period). |
10 | Wells Fargo Wisconsin Tax-Free Fund
Portfolio of investments—June 30, 2020
Interest rate | Maturity date | Principal | Value | |||||||||||||
| Municipal Obligations: 94.63% | ||||||||||||||||
Guam: 4.80% | ||||||||||||||||
| Airport Revenue: 2.10% | ||||||||||||||||
Guam International Airport Authority Series C (AGM Insured) | 6.13 | % | 10-1-2043 | $ | 1,500,000 | $ | 1,643,557 | |||||||||
Guam Port Authority AMT Series A | 5.00 | 7-1-2048 | 1,000,000 | 1,112,870 | ||||||||||||
Guam Port Authority AMT Series B | 5.00 | 7-1-2034 | 445,000 | 507,741 | ||||||||||||
| 3,264,168 | ||||||||||||||||
|
| |||||||||||||||
| Miscellaneous Revenue: 0.93% | ||||||||||||||||
Guam Education Financing Foundation Refunding Bond Certificate of Participation Series 2016A | 5.00 | 10-1-2022 | 1,400,000 | 1,439,340 | ||||||||||||
|
| |||||||||||||||
| Tax Revenue: 0.83% | ||||||||||||||||
Guam Government Business Privilege Tax Revenue Series 2011A | 5.00 | 1-1-2021 | 670,000 | 677,658 | ||||||||||||
Guam Government Limited Obligation Bonds Section 30 Series A | 5.00 | 12-1-2021 | 600,000 | 619,212 | ||||||||||||
| 1,296,870 | ||||||||||||||||
|
| |||||||||||||||
| Utilities Revenue: 0.33% | ||||||||||||||||
Guam Power Authority Series A (AGM Insured) | 5.00 | 10-1-2020 | 500,000 | 505,495 | ||||||||||||
|
| |||||||||||||||
| Water & Sewer Revenue: 0.61% | ||||||||||||||||
Guam Government Waterworks Authority Series A | 5.00 | 1-1-2050 | 300,000 | 357,963 | ||||||||||||
Guam Government Waterworks Authority Water and Wastewater Refunding Bond | 5.00 | 7-1-2034 | 500,000 | 582,450 | ||||||||||||
| 940,413 | ||||||||||||||||
|
| |||||||||||||||
| 7,446,286 | ||||||||||||||||
|
| |||||||||||||||
Illinois: 3.05% | ||||||||||||||||
| GO Revenue: 1.57% | ||||||||||||||||
Chicago IL CAB City Colleges (National Insured) ¤ | 0.00 | 1-1-2027 | 1,000,000 | 774,130 | ||||||||||||
Chicago IL Park District Special Recreation Activity Series E | 5.00 | 11-15-2027 | 1,000,000 | 1,149,650 | ||||||||||||
Illinois Refunding Bond Series 2018A | 5.00 | 10-1-2021 | 500,000 | 513,930 | ||||||||||||
| 2,437,710 | ||||||||||||||||
|
| |||||||||||||||
| Miscellaneous Revenue: 0.78% | ||||||||||||||||
Illinois | 5.50 | 7-1-2026 | 250,000 | 264,923 | ||||||||||||
Illinois Series C | 5.00 | 11-1-2029 | 630,000 | 680,035 | ||||||||||||
Illinois Series D | 5.00 | 11-1-2021 | 250,000 | 257,423 | ||||||||||||
| 1,202,381 | ||||||||||||||||
|
| |||||||||||||||
| Tax Revenue: 0.64% | ||||||||||||||||
Metropolitan Pier & Exposition Authority CAB McCormick Place Expansion Project Series B | 5.00 | 12-15-2028 | 970,000 | 995,210 | ||||||||||||
|
| |||||||||||||||
| Water & Sewer Revenue: 0.06% | ||||||||||||||||
Chicago IL Waterworks Unrefunded Bond (AGM Insured) | 5.00 | 11-1-2020 | 95,000 | 95,366 | ||||||||||||
|
| |||||||||||||||
| 4,730,667 | ||||||||||||||||
| �� |
|
| ||||||||||||||
Michigan: 0.07% | ||||||||||||||||
| Miscellaneous Revenue: 0.07% | ||||||||||||||||
Michigan Municipal Bond Authority Local Government Loan Program Series A (Ambac Insured) | 4.00 | 11-1-2021 | 110,000 | 110,012 | ||||||||||||
|
| |||||||||||||||
The accompanying notes are an integral part of these financial statements.
Wells Fargo Wisconsin Tax-Free Fund | 11
Portfolio of investments—June 30, 2020
Interest rate | Maturity date | Principal | Value | |||||||||||||
New Jersey: 1.55% | ||||||||||||||||
| Miscellaneous Revenue: 0.70% | ||||||||||||||||
New Jersey EDA Series EE | 5.00 | % | 9-1-2023 | $ | 1,070,000 | $ | 1,092,331 | |||||||||
|
| |||||||||||||||
| Transportation Revenue: 0.85% | ||||||||||||||||
New Jersey TTFA CAB Series A ¤ | 0.00 | 12-15-2031 | 2,000,000 | 1,311,120 | ||||||||||||
|
| |||||||||||||||
| 2,403,451 | ||||||||||||||||
|
| |||||||||||||||
New York: 1.66% | ||||||||||||||||
| Education Revenue: 0.67% | ||||||||||||||||
Hempstead NY Local Development Corporation The Academy Charter School Project Series A | 6.24 | 2-1-2047 | 1,000,000 | 1,042,580 | ||||||||||||
|
| |||||||||||||||
| GO Revenue: 0.99% | ||||||||||||||||
Suffolk County NY Series A | 5.00 | 3-19-2021 | 1,500,000 | 1,534,860 | ||||||||||||
|
| |||||||||||||||
| 2,577,440 | ||||||||||||||||
|
| |||||||||||||||
Puerto Rico: 0.20% | ||||||||||||||||
| Transportation Revenue: 0.20% | ||||||||||||||||
Puerto Rico Highway & Transportation Authority Refunding Bond Series L (BHAC/FGIC Insured) | 5.25 | 7-1-2021 | 300,000 | 312,099 | ||||||||||||
|
| |||||||||||||||
Texas: 1.49% | ||||||||||||||||
| GO Revenue: 1.49% | ||||||||||||||||
Denton TX Independent School District School Building | 4.00 | 8-15-2048 | 2,000,000 | 2,317,900 | ||||||||||||
|
| |||||||||||||||
Virgin Islands: 2.32% | ||||||||||||||||
| Miscellaneous Revenue: 0.48% | ||||||||||||||||
Virgin Islands PFA 144A | 5.00 | 9-1-2020 | 750,000 | 751,320 | ||||||||||||
|
| |||||||||||||||
| Tax Revenue: 1.84% | ||||||||||||||||
Virgin Islands PFA Gross Receipts Taxes Loan Notes (National Insured) | 4.00 | 10-1-2020 | 450,000 | 451,089 | ||||||||||||
Virgin Islands PFA Gross Receipts Taxes Loan Notes (AGM Insured) | 4.00 | 10-1-2022 | 310,000 | 323,349 | ||||||||||||
Virgin Islands PFA Matching Fund Loan Notes Senior Lien Series B (AGM Insured) | 5.00 | 10-1-2025 | 2,000,000 | 2,076,780 | ||||||||||||
| 2,851,218 | ||||||||||||||||
|
| |||||||||||||||
| 3,602,538 | ||||||||||||||||
|
| |||||||||||||||
Wisconsin: 79.49% | ||||||||||||||||
| Education Revenue: 9.58% | ||||||||||||||||
Milwaukee WI RDA Milwaukee School of Engineering Project (AGM Insured) | 2.75 | 4-1-2021 | 1,080,000 | 1,099,894 | ||||||||||||
Milwaukee WI RDA Milwaukee School of Engineering Project (AGM Insured) | 4.10 | 4-1-2032 | 1,500,000 | 1,569,375 | ||||||||||||
Milwaukee WI RDA Science Education Consortium Incorporated Project Series A | 6.25 | 8-1-2043 | 2,100,000 | 2,289,525 | ||||||||||||
Platteville WI RDA University of Wisconsin Platteville Real Estate Foundation Incorporated | 5.00 | 7-1-2022 | 675,000 | 695,851 | ||||||||||||
Platteville WI RDA University of Wisconsin Platteville Real Estate Foundation Incorporated | 5.00 | 7-1-2032 | 1,500,000 | 1,556,505 | ||||||||||||
Platteville WI RDA University of Wisconsin Platteville Real Estate Foundation Incorporated | 5.00 | 7-1-2042 | 1,000,000 | 1,028,330 | ||||||||||||
Wisconsin HEFA Revenue Lawrence University | 4.00 | 2-1-2021 | 425,000 | 430,270 | ||||||||||||
Wisconsin HEFA Revenue Lawrence University | 4.00 | 2-1-2022 | 280,000 | 289,288 | ||||||||||||
Wisconsin HEFA Revenue Lawrence University | 4.00 | 3-15-2040 | 1,555,000 | 1,641,800 | ||||||||||||
Wisconsin HEFA Revenue Lawrence University | 4.00 | 2-1-2045 | 1,685,000 | 1,767,245 | ||||||||||||
The accompanying notes are an integral part of these financial statements.
12 | Wells Fargo Wisconsin Tax-Free Fund
Portfolio of investments—June 30, 2020
Interest rate | Maturity date | Principal | Value | |||||||||||||
| Education Revenue (continued) | ||||||||||||||||
Wisconsin HEFA Revenue Various Refunding Bond Medical College Series B (U.S. Bank NA LOC) ø | 0.13 | % | 12-1-2033 | $ | 2,500,000 | $ | 2,500,000 | |||||||||
| 14,868,083 | ||||||||||||||||
|
| |||||||||||||||
| GO Revenue: 1.60% | ||||||||||||||||
Milwaukee WI Series B6 | 2.00 | 4-1-2021 | 175,000 | 176,876 | ||||||||||||
Milwaukee WI Series B6 | 3.00 | 4-1-2024 | 570,000 | 621,802 | ||||||||||||
Milwaukee WI Series B6 | 5.00 | 4-1-2022 | 350,000 | 376,789 | ||||||||||||
Milwaukee WI Series B6 | 5.00 | 4-1-2023 | 580,000 | 652,251 | ||||||||||||
Milwaukee WI Series B6 | 5.00 | 4-1-2025 | 550,000 | 663,119 | ||||||||||||
| 2,490,837 | ||||||||||||||||
|
| |||||||||||||||
| Health Revenue: 15.85% | ||||||||||||||||
Wisconsin HEFA Bellin Memorial Hospital Incorporated Series A | 5.00 | 12-1-2027 | 175,000 | 216,304 | ||||||||||||
Wisconsin HEFA Bellin Memorial Hospital Incorporated Series A | 5.00 | 12-1-2028 | 150,000 | 188,987 | ||||||||||||
Wisconsin HEFA Bellin Memorial Hospital Incorporated Series A | 5.00 | 12-1-2029 | 150,000 | 192,182 | ||||||||||||
Wisconsin HEFA Bellin Memorial Hospital Incorporated Series A | 5.00 | 12-1-2030 | 275,000 | 350,653 | ||||||||||||
Wisconsin HEFA Beloit Health System Incorporated | 4.00 | 7-1-2036 | 3,000,000 | 3,299,910 | ||||||||||||
Wisconsin HEFA Beloit Health System Incorporated | 5.00 | 7-1-2029 | 1,270,000 | 1,604,569 | ||||||||||||
Wisconsin HEFA Marshfield Clinic Health System | 5.00 | 2-15-2047 | 3,385,000 | 3,847,966 | ||||||||||||
Wisconsin HEFA Marshfield Clinic Health System Obligated Group Series C | 5.00 | 2-15-2027 | 400,000 | 482,308 | ||||||||||||
Wisconsin HEFA Marshfield Clinic Health System Obligated Group Series C | 5.00 | 2-15-2028 | 650,000 | 778,798 | ||||||||||||
Wisconsin HEFA Marshfield Clinic Health System Obligated Group Series C | 5.00 | 2-15-2029 | 500,000 | 597,040 | ||||||||||||
Wisconsin HEFA Monroe Clinic Incorporated | 3.00 | 2-15-2035 | 520,000 | 583,102 | ||||||||||||
Wisconsin HEFA Monroe Clinic Incorporated | 4.00 | 2-15-2031 | 900,000 | 1,056,024 | ||||||||||||
Wisconsin HEFA Monroe Clinic Incorporated | 4.00 | 2-15-2033 | 550,000 | 645,348 | ||||||||||||
Wisconsin HEFA Monroe Clinic Incorporated | 5.00 | 2-15-2028 | 900,000 | 1,101,384 | ||||||||||||
Wisconsin HEFA Monroe Clinic Incorporated | 5.00 | 2-15-2029 | 575,000 | 703,662 | ||||||||||||
Wisconsin HEFA Monroe Clinic Incorporated | 5.00 | 2-15-2030 | 300,000 | 367,128 | ||||||||||||
Wisconsin HEFA Refunding Bond Bellin Memorial Hospital Incorporated | 4.00 | 12-1-2035 | 1,000,000 | 1,064,970 | ||||||||||||
Wisconsin HEFA Refunding Bond Bellin Memorial Hospital Incorporated | 5.00 | 12-1-2025 | 1,500,000 | 1,709,535 | ||||||||||||
Wisconsin HEFA Refunding Bond Bellin Memorial Hospital Incorporated | 5.00 | 12-1-2026 | 1,740,000 | 1,975,422 | ||||||||||||
Wisconsin HEFA Rogers Memorial Hospital Incorporated Series A | 5.00 | 7-1-2049 | 250,000 | 282,300 | ||||||||||||
Wisconsin HEFA Rogers Memorial Hospital Incorporated Series B | 5.00 | 7-1-2044 | 3,250,000 | 3,560,603 | ||||||||||||
| 24,608,195 | ||||||||||||||||
|
| |||||||||||||||
| Housing Revenue: 17.65% | ||||||||||||||||
Wisconsin HEFA Aspirus Wausau Hospital Incorporated Obligated Group Series 2004B (JPMorgan Chase & Company LOC) ø | 0.12 | 8-15-2034 | 4,000,000 | 4,000,000 | ||||||||||||
Wisconsin Housing & EDA AMT Series A | 4.63 | 11-1-2037 | 25,000 | 25,041 | ||||||||||||
Wisconsin Housing & EDA Madison Pool Project Series A | 4.55 | 7-1-2037 | 165,000 | 179,291 | ||||||||||||
Wisconsin Housing & EDA Madison Pool Project Series A | 4.70 | 7-1-2047 | 2,300,000 | 2,501,687 | ||||||||||||
Wisconsin Housing & EDA Madison Pool Project Series A | 4.85 | 7-1-2052 | 3,000,000 | 3,273,480 | ||||||||||||
Wisconsin Housing & EDA President House Project (Associated Trust Company NA LOC) ø | 0.23 | 8-1-2046 | 1,535,000 | 1,535,000 | ||||||||||||
Wisconsin Housing & EDA Series A (FHLB SPA) ø | 0.13 | 4-1-2046 | 2,960,000 | 2,960,000 | ||||||||||||
Wisconsin Housing & EDA Series A | 1.70 | 11-1-2052 | 1,500,000 | 1,519,770 | ||||||||||||
Wisconsin Housing & EDA Series A | 1.95 | 12-1-2020 | 55,000 | 55,329 | ||||||||||||
Wisconsin Housing & EDA Series A | 3.00 | 5-1-2022 | 100,000 | 104,361 | ||||||||||||
Wisconsin Housing & EDA Series A | 3.00 | 11-1-2022 | 125,000 | 131,883 | ||||||||||||
Wisconsin Housing & EDA Series A | 3.40 | 11-1-2032 | 2,450,000 | 2,686,278 | ||||||||||||
Wisconsin Housing & EDA Series A | 3.95 | 11-1-2038 | 2,000,000 | 2,210,900 | ||||||||||||
Wisconsin Housing & EDA Series A | 4.05 | 12-1-2049 | 800,000 | 838,656 | ||||||||||||
Wisconsin Housing & EDA Series A | 5.75 | 11-1-2043 | 2,830,000 | 2,837,386 | ||||||||||||
The accompanying notes are an integral part of these financial statements.
Wells Fargo Wisconsin Tax-Free Fund | 13
Portfolio of investments—June 30, 2020
Interest rate | Maturity date | Principal | Value | |||||||||||||
| Housing Revenue (continued) | ||||||||||||||||
Wisconsin Housing & EDA Series B (FHLB SPA) ø | 0.13 | % | 5-1-2055 | $ | 1,465,000 | $ | 1,465,000 | |||||||||
Wisconsin Housing & EDA Series C | 3.88 | 11-1-2035 | 1,000,000 | 1,076,290 | ||||||||||||
| 27,400,352 | ||||||||||||||||
|
| |||||||||||||||
| Industrial Development Revenue: 2.58% | ||||||||||||||||
Appleton WI Recovery Zone Facilities Foremost Farms Project Series 2010 (CoBank ACB LOC) ø | 0.16 | 5-1-2037 | 4,000,000 | 4,000,000 | ||||||||||||
|
| |||||||||||||||
| Miscellaneous Revenue: 18.09% | ||||||||||||||||
Ashwaubenon WI CDA Lease Revenue Brown County Expo Center Project | 4.00 | 6-1-2031 | 1,310,000 | 1,471,759 | ||||||||||||
Ashwaubenon WI CDA Lease Revenue Brown County Expo Center Project | 4.00 | 6-1-2035 | 900,000 | 990,072 | ||||||||||||
Ashwaubenon WI CDA Lease Revenue CAB Brown County Expo Center ¤ | 0.00 | 6-1-2049 | 8,000,000 | 2,719,120 | ||||||||||||
Glendale WI CDA Refunding Bond | 2.75 | 9-1-2022 | 685,000 | 687,610 | ||||||||||||
Kaukauna WI RDA | 3.75 | 6-1-2032 | 850,000 | 921,910 | ||||||||||||
Kaukauna WI RDA | 4.00 | 6-1-2021 | 310,000 | 320,112 | ||||||||||||
Kaukauna WI RDA | 4.00 | 6-1-2022 | 235,000 | 250,832 | ||||||||||||
Kaukauna WI RDA | 4.00 | 6-1-2023 | 200,000 | 219,002 | ||||||||||||
Kaukauna WI RDA | 4.00 | 6-1-2025 | 425,000 | 485,877 | ||||||||||||
Kaukauna WI RDA | 4.00 | 6-1-2028 | 425,000 | 478,724 | ||||||||||||
Kaukauna WI RDA | 4.00 | 6-1-2035 | 900,000 | 980,865 | ||||||||||||
Milwaukee WI RDA Lease Public Schools Series A | 5.00 | 11-15-2026 | 220,000 | 274,641 | ||||||||||||
Milwaukee WI RDA Lease Revenue Public Schools | 5.00 | 11-15-2033 | 750,000 | 910,950 | ||||||||||||
Milwaukee WI RDA Milwaukee Public Schools | 5.00 | 11-15-2028 | 325,000 | 399,854 | ||||||||||||
Milwaukee WI RDA Milwaukee Public Schools | 5.00 | 11-15-2034 | 675,000 | 817,567 | ||||||||||||
Milwaukee WI RDA Milwaukee Public Schools | 5.00 | 11-15-2035 | 1,000,000 | 1,207,160 | ||||||||||||
Milwaukee WI RDA Milwaukee Public Schools | 5.00 | 11-15-2036 | 500,000 | 602,570 | ||||||||||||
Milwaukee WI RDA Milwaukee Public Schools Series A | 5.00 | 11-15-2027 | 1,020,000 | 1,257,731 | ||||||||||||
Milwaukee WI RDA Milwaukee Public Schools Series A | 5.00 | 11-15-2028 | 1,000,000 | 1,230,320 | ||||||||||||
Milwaukee WI RDA Milwaukee Public Schools Series A | 5.00 | 11-15-2031 | 750,000 | 917,078 | ||||||||||||
Milwaukee WI RDA Public Schools Series A | 5.00 | 8-1-2020 | 1,300,000 | 1,304,810 | ||||||||||||
Milwaukee WI RDA Public Schools Series A | 5.00 | 8-1-2021 | 3,330,000 | 3,493,869 | ||||||||||||
Milwaukee WI RDA Revenue Refunding Bond Milwaukee Public Schools (National Insured) | 4.00 | 8-1-2023 | 925,000 | 1,021,126 | ||||||||||||
Prairie du Chien WI RDA Series B | 1.65 | 9-1-2020 | 205,000 | 205,369 | ||||||||||||
Warrens WI CDA Economic Improvements | 5.10 | 11-1-2020 | 70,000 | 68,799 | ||||||||||||
Weston WI CDA Series A | 1.50 | 10-1-2020 | 500,000 | 501,145 | ||||||||||||
Weston WI CDA Series A | 1.60 | 10-1-2021 | 340,000 | 344,175 | ||||||||||||
Weston WI CDA Series A | 1.75 | 10-1-2022 | 200,000 | 206,066 | ||||||||||||
Weston WI CDA Series A | 1.90 | 10-1-2023 | 800,000 | 837,760 | ||||||||||||
Weston WI CDA Series A | 2.00 | 10-1-2024 | 625,000 | 663,500 | ||||||||||||
Weston WI CDA Series A | 2.15 | 10-1-2025 | 615,000 | 663,351 | ||||||||||||
Weston WI CDA Series A | 2.25 | 10-1-2026 | 940,000 | 1,018,011 | ||||||||||||
Weston WI CDA Series A | 2.40 | 10-1-2027 | 570,000 | 616,102 | ||||||||||||
| 28,087,837 | ||||||||||||||||
|
| |||||||||||||||
| Tax Revenue: 14.14% | ||||||||||||||||
Mount Pleasant WI Tax Increment Series 2018A | 4.00 | 4-1-2035 | 1,295,000 | 1,499,364 | ||||||||||||
Southeast Wisconsin Professional Baseball Park District Series A (National Insured) | 5.50 | 12-15-2021 | 2,000,000 | 2,147,300 | ||||||||||||
Southeast Wisconsin Professional Baseball Park District Series A (National Insured) | 5.50 | 12-15-2023 | 1,600,000 | 1,875,312 | ||||||||||||
Southeast Wisconsin Professional Baseball Park District Series A (National Insured) | 5.50 | 12-15-2026 | 2,435,000 | 3,003,256 | ||||||||||||
Warrens WI CDA Interim Workout Extension | 3.70 | 11-1-2029 | 155,045 | 88,901 | ||||||||||||
Wisconsin Center District CAB (AGM Insured) ¤ | 0.00 | 12-15-2030 | 295,000 | 231,994 | ||||||||||||
The accompanying notes are an integral part of these financial statements.
14 | Wells Fargo Wisconsin Tax-Free Fund
Portfolio of investments—June 30, 2020
Interest rate | Maturity date | Principal | Value | |||||||||||||
| Tax Revenue (continued) | ||||||||||||||||
Wisconsin Center District CAB Senior Dedicated Milwaukee Arena Project Series A (BAM Insured) ¤ | 0.00 | % | 12-15-2033 | $ | 2,985,000 | $ | 1,933,355 | |||||||||
Wisconsin Center District CAB Series A (National Insured) ¤ | 0.00 | 12-15-2027 | 100,000 | 85,319 | ||||||||||||
Wisconsin Center District Junior Dedicated Bond Series A | 5.00 | 12-15-2022 | 730,000 | 798,678 | ||||||||||||
Wisconsin Center District Junior Dedicated Bond Series A | 5.00 | 12-15-2030 | 2,100,000 | 2,241,603 | ||||||||||||
Wisconsin Center District Junior Dedicated Tax Revenue Prerefunded Bond (AGM Insured) | 5.25 | 12-15-2023 | 1,545,000 | 1,673,683 | ||||||||||||
Wisconsin Center District Junior Dedicated Tax Revenue Prerefunded Bond (AGM Insured) | 5.25 | 12-15-2027 | 220,000 | 276,201 | ||||||||||||
Wisconsin Center District Junior Dedicated Tax Revenue Unrefunded Balance Refunding Bond (AGM Insured) | 5.25 | 12-15-2023 | 605,000 | 686,330 | ||||||||||||
Wisconsin Center District Junior Dedicated Tax Revenue Unrefunded Balance Refunding Bond (AGM Insured) | 5.25 | 12-15-2027 | 785,000 | 979,476 | ||||||||||||
Wisconsin Center District Milwaukee Arena Project | 4.00 | 12-15-2032 | 1,100,000 | 1,226,665 | ||||||||||||
Wisconsin Center District Milwaukee Arena Project | 4.00 | 12-15-2033 | 920,000 | 1,017,134 | ||||||||||||
Wisconsin Center District Milwaukee Arena Project | 4.00 | 12-15-2034 | 2,000,000 | 2,193,900 | ||||||||||||
| 21,958,471 | ||||||||||||||||
|
| |||||||||||||||
| 123,413,775 | ||||||||||||||||
|
| |||||||||||||||
Total Municipal Obligations (Cost $140,657,199) | 146,914,168 | |||||||||||||||
|
| |||||||||||||||
| Total investments in securities (Cost $140,657,199) | 94.63 | % | 146,914,168 | |||||
Other assets and liabilities, net | 5.37 | 8,331,266 | ||||||
|
|
|
| |||||
| Total net assets | 100.00 | % | $ | 155,245,434 | ||||
|
|
|
| |||||
| ¤ | The security is issued in zero coupon form with no periodic interest payments. |
| 144A | The security may be resold in transactions exempt from registration, normally to qualified institutional buyers, pursuant to Rule 144A under the Securities Act of 1933. |
| ø | Variable rate demand notes are subject to a demand feature which reduces the effective maturity. The maturity date shown represents the final maturity date of the security. The interest rate is determined and reset by the issuer daily, weekly, or monthly depending upon the terms of the security. The rate shown is the rate in effect at period end. |
Abbreviations:
| AGM | Assured Guaranty Municipal |
| Ambac | Ambac Financial Group Incorporated |
| AMT | Alternative minimum tax |
| BHAC | Berkshire Hathaway Assurance Corporation |
| CAB | Capital appreciation bond |
| CDA | Community Development Authority |
| EDA | Economic Development Authority |
| FGIC | Financial Guaranty Insurance Corporation |
| FHLB | Federal Home Loan Bank |
| GO | General obligation |
| HEFA | Health & Educational Facilities Authority |
| LOC | Letter of credit |
| National | National Public Finance Guarantee Corporation |
| PFA | Public Finance Authority |
| RDA | Redevelopment Authority |
| TTFA | Transportation Trust Fund Authority |
The accompanying notes are an integral part of these financial statements.
Wells Fargo Wisconsin Tax-Free Fund | 15
Statement of assets and liabilities—June 30, 2020
Assets | ||||
Investments in unaffiliated securities, at value (cost $140,657,199) | $ | 146,914,168 | ||
Cash | 7,052,705 | |||
Receivable for investments sold | 275,000 | |||
Receivable for Fund shares sold | 156,340 | |||
Receivable for interest | 1,327,420 | |||
Prepaid expenses and other assets | 40,567 | |||
|
| |||
Total assets | 155,766,200 | |||
|
| |||
Liabilities | ||||
Payable for investments purchased | 283,600 | |||
Payable for Fund shares redeemed | 146,303 | |||
Management fee payable | 30,439 | |||
Dividends payable | 25,829 | |||
Administration fees payable | 15,763 | |||
Distribution fee payable | 3,613 | |||
Trustees’ fees and expenses payable | 3,795 | |||
Accrued expenses and other liabilities | 11,424 | |||
|
| |||
Total liabilities | 520,766 | |||
|
| |||
Total net assets | $ | 155,245,434 | ||
|
| |||
Net assets consist of | ||||
Paid-in capital | $ | 149,012,181 | ||
Total distributable earnings | 6,233,253 | |||
|
| |||
Total net assets | $ | 155,245,434 | ||
|
| |||
Computation of net asset value and offering price per share | ||||
Net assets – Class A | $ | 81,173,051 | ||
Shares outstanding – Class A1 | 7,299,022 | |||
Net asset value per share – Class A | $11.12 | |||
Maximum offering price per share – Class A2 | $11.64 | |||
Net assets – Class C | $ | 5,842,037 | ||
Shares outstanding – Class C1 | 525,303 | |||
Net asset value per share – Class C | $11.12 | |||
Net assets – Institutional Class | $ | 68,230,346 | ||
Shares outstanding – Institutional Class1 | 6,134,400 | |||
Net asset value per share – Institutional Class | $11.12 | |||
| 1 | The Fund has an unlimited number of authorized shares. |
| 2 | Maximum offering price is computed as 100/95.50 of net asset value. On investments of $50,000 or more, the offering price is reduced. |
The accompanying notes are an integral part of these financial statements.
16 | Wells Fargo Wisconsin Tax-Free Fund
Statement of operations—year ended June 30, 2020
Investment income | ||||
Interest | $ | 4,275,244 | ||
|
| |||
Expenses | ||||
Management fee | 583,266 | |||
Administration fees | ||||
Class A | 135,425 | |||
Class C | 10,013 | |||
Institutional Class | 43,934 | |||
Shareholder servicing fees | ||||
Class A | 211,569 | |||
Class C | 15,643 | |||
Distribution fee | ||||
Class C | 46,927 | |||
Custody and accounting fees | 6,247 | |||
Professional fees | 53,465 | |||
Registration fees | 88,190 | |||
Shareholder report expenses | 23,569 | |||
Trustees’ fees and expenses | 21,541 | |||
Other fees and expenses | 11,616 | |||
|
| |||
Total expenses | 1,251,405 | |||
Less: Fee waivers and/or expense reimbursements | ||||
Fund-level | (146,319 | ) | ||
Class A | (131,414 | ) | ||
Class C | (9,396 | ) | ||
|
| |||
Net expenses | 964,276 | |||
|
| |||
Net investment income | 3,310,968 | |||
|
| |||
Realized and unrealized gains (losses) on investments | ||||
Net realized gains on investments | 74,869 | |||
Net change in unrealized gains (losses) on investments | 755,258 | |||
|
| |||
Net realized and unrealized gains (losses) on investments | 830,127 | |||
|
| |||
Net increase in net assets resulting from operations | $ | 4,141,095 | ||
|
| |||
The accompanying notes are an integral part of these financial statements.
Wells Fargo Wisconsin Tax-Free Fund | 17
Statement of changes in net assets
| Year ended June 30, 2020 | Year ended June 30, 2019 | |||||||||||||||
Operations | ||||||||||||||||
Net investment income | $ | 3,310,968 | $ | 3,516,403 | ||||||||||||
Net realized gains on investments | 74,869 | 126,558 | ||||||||||||||
Net change in unrealized gains (losses) on investments | 755,258 | 3,483,261 | ||||||||||||||
|
| |||||||||||||||
Net increase in net assets resulting from operations | 4,141,095 | 7,126,222 | ||||||||||||||
|
| |||||||||||||||
Distributions to shareholders from net investment income and net realized gains | ||||||||||||||||
Class A | (1,934,145 | ) | (2,238,227 | ) | ||||||||||||
Class C | (95,769 | ) | (143,110 | ) | ||||||||||||
Institutional Class | (1,341,692 | ) | (1,134,640 | ) | ||||||||||||
|
| |||||||||||||||
Total distributions to shareholders | (3,371,606 | ) | (3,515,977 | ) | ||||||||||||
|
| |||||||||||||||
Capital share transactions | Shares | Shares | ||||||||||||||
Proceeds from shares sold | ||||||||||||||||
Class A | 1,482,669 | 16,452,135 | 1,158,956 | 12,526,702 | ||||||||||||
Class C | 86,182 | 958,748 | 74,617 | 800,958 | ||||||||||||
Institutional Class | 3,006,711 | 33,400,716 | 1,478,452 | 15,865,780 | ||||||||||||
|
| |||||||||||||||
| 50,811,599 | 29,193,440 | |||||||||||||||
|
| |||||||||||||||
Reinvestment of distributions | ||||||||||||||||
Class A | 148,360 | 1,649,205 | 172,502 | 1,862,955 | ||||||||||||
Class C | 8,593 | 95,503 | 13,234 | 142,770 | ||||||||||||
Institutional Class | 117,088 | 1,301,290 | 104,377 | 1,127,881 | ||||||||||||
|
| |||||||||||||||
| 3,045,998 | 3,133,606 | |||||||||||||||
|
| |||||||||||||||
Payment for shares redeemed | ||||||||||||||||
Class A | (2,022,543 | ) | (22,260,904 | ) | (1,815,160 | ) | (19,476,467 | ) | ||||||||
Class C | (174,988 | ) | (1,938,589 | ) | (236,996 | ) | (2,549,096 | ) | ||||||||
Institutional Class | (971,526 | ) | (10,771,669 | ) | (969,212 | ) | (10,399,087 | ) | ||||||||
|
| |||||||||||||||
| (34,971,162 | ) | (32,424,650 | ) | |||||||||||||
|
| |||||||||||||||
Net increase (decrease) in net assets resulting from capital share transactions | 18,886,435 | (97,604 | ) | |||||||||||||
|
| |||||||||||||||
Total increase in net assets | 19,655,924 | 3,512,641 | ||||||||||||||
|
| |||||||||||||||
Net assets | ||||||||||||||||
Beginning of period | 135,589,510 | 132,076,869 | ||||||||||||||
|
| |||||||||||||||
End of period | $ | 155,245,434 | $ | 135,589,510 | ||||||||||||
|
| |||||||||||||||
The accompanying notes are an integral part of these financial statements.
18 | Wells Fargo Wisconsin Tax-Free Fund
(For a share outstanding throughout each period)
| Year ended June 30 | ||||||||||||||||||||
| CLASS A | 2020 | 2019 | 2018 | 2017 | 2016 | |||||||||||||||
Net asset value, beginning of period | $11.04 | $10.74 | $10.83 | $11.16 | $10.83 | |||||||||||||||
Net investment income | 0.25 | 0.29 | 0.28 | 0.26 | 0.25 | |||||||||||||||
Net realized and unrealized gains (losses) on investments | 0.08 | 0.30 | (0.09 | ) | (0.32 | ) | 0.33 | |||||||||||||
|
|
|
|
|
|
|
|
|
| |||||||||||
Total from investment operations | 0.33 | 0.59 | 0.19 | (0.06 | ) | 0.58 | ||||||||||||||
Distributions to shareholders from | ||||||||||||||||||||
Net investment income | (0.25 | ) | (0.29 | ) | (0.28 | ) | (0.26 | ) | (0.25 | ) | ||||||||||
Net realized gains | (0.00 | )1 | 0.00 | 0.00 | (0.01 | ) | (0.00 | )1 | ||||||||||||
|
|
|
|
|
|
|
|
|
| |||||||||||
Total distributions to shareholders | (0.25 | ) | (0.29 | ) | (0.28 | ) | (0.27 | ) | (0.25 | ) | ||||||||||
Net asset value, end of period | $11.12 | $11.04 | $10.74 | $10.83 | $11.16 | |||||||||||||||
Total return2 | 3.05 | % | 5.56 | % | 1.76 | % | (0.48 | )% | 5.44 | % | ||||||||||
Ratios to average net assets (annualized) | ||||||||||||||||||||
Gross expenses | 0.95 | % | 0.94 | % | 0.88 | % | 0.93 | % | 0.94 | % | ||||||||||
Net expenses | 0.69 | % | 0.70 | % | 0.70 | % | 0.70 | % | 0.70 | % | ||||||||||
Net investment income | 2.24 | % | 2.66 | % | 2.57 | % | 2.41 | % | 2.26 | % | ||||||||||
Supplemental data | ||||||||||||||||||||
Portfolio turnover rate | 24 | % | 8 | % | 11 | % | 27 | % | 16 | % | ||||||||||
Net assets, end of period (000s omitted) | $81,173 | $84,924 | $87,790 | $131,518 | $160,480 | |||||||||||||||
| 1 | Amount is less than $0.005. |
| 2 | Total return calculations do not include any sales charges. |
The accompanying notes are an integral part of these financial statements.
Wells Fargo Wisconsin Tax-Free Fund | 19
Financial highlights
(For a share outstanding throughout each period)
| Year ended June 30 | ||||||||||||||||||||
| CLASS C | 2020 | 2019 | 2018 | 2017 | 2016 | |||||||||||||||
Net asset value, beginning of period | $11.04 | $10.74 | $10.83 | $11.16 | $10.83 | |||||||||||||||
Net investment income | 0.17 | 1 | 0.21 | 0.20 | 0.18 | 0.17 | ||||||||||||||
Net realized and unrealized gains (losses) on investments | 0.08 | 0.30 | (0.09 | ) | (0.32 | ) | 0.33 | |||||||||||||
|
|
|
|
|
|
|
|
|
| |||||||||||
Total from investment operations | 0.25 | 0.51 | 0.11 | (0.14 | ) | 0.50 | ||||||||||||||
Distributions to shareholders from | ||||||||||||||||||||
Net investment income | (0.17 | ) | (0.21 | ) | (0.20 | ) | (0.18 | ) | (0.17 | ) | ||||||||||
Net realized gains | (0.00 | )2 | 0.00 | 0.00 | (0.01 | ) | (0.00 | )2 | ||||||||||||
|
|
|
|
|
|
|
|
|
| |||||||||||
Total distributions to shareholders | (0.17 | ) | (0.21 | ) | (0.20 | ) | (0.19 | ) | (0.17 | ) | ||||||||||
Net asset value, end of period | $11.12 | $11.04 | $10.74 | $10.83 | $11.16 | |||||||||||||||
Total return3 | 2.27 | % | 4.78 | % | 1.01 | % | (1.22 | )% | 4.66 | % | ||||||||||
Ratios to average net assets (annualized) | ||||||||||||||||||||
Gross expenses | 1.70 | % | 1.69 | % | 1.63 | % | 1.68 | % | 1.68 | % | ||||||||||
Net expenses | 1.45 | % | 1.45 | % | 1.45 | % | 1.45 | % | 1.45 | % | ||||||||||
Net investment income | 1.49 | % | 1.92 | % | 1.83 | % | 1.67 | % | 1.52 | % | ||||||||||
Supplemental data | ||||||||||||||||||||
Portfolio turnover rate | 24 | % | 8 | % | 11 | % | 27 | % | 16 | % | ||||||||||
Net assets, end of period (000s omitted) | $5,842 | $6,687 | $8,105 | $9,449 | $10,949 | |||||||||||||||
| 1 | Calculated based upon average shares outstanding |
| 2 | Amount is less than $0.005. |
| 3 | Total return calculations do not include any sales charges. |
The accompanying notes are an integral part of these financial statements.
20 | Wells Fargo Wisconsin Tax-Free Fund
Financial highlights
(For a share outstanding throughout each period)
| Year ended June 30 | ||||||||||||||||
| INSTITUTIONAL CLASS | 2020 | 2019 | 2018 | 20171 | ||||||||||||
Net asset value, beginning of period | $11.04 | $10.74 | $10.83 | $10.99 | ||||||||||||
Net investment income | 0.27 | 0.31 | 0.30 | 0.20 | ||||||||||||
Net realized and unrealized gains (losses) on investments | 0.08 | 0.30 | (0.09 | ) | (0.15 | ) | ||||||||||
|
|
|
|
|
|
|
| |||||||||
Total from investment operations | 0.35 | 0.61 | 0.21 | 0.05 | ||||||||||||
Distributions to shareholders from | ||||||||||||||||
Net investment income | (0.27 | ) | (0.31 | ) | (0.30 | ) | (0.20 | ) | ||||||||
Net realized gains | (0.00 | )2 | 0.00 | 0.00 | (0.01 | ) | ||||||||||
|
|
|
|
|
|
|
| |||||||||
Total distributions to shareholders | (0.27 | ) | (0.31 | ) | (0.30 | ) | (0.21 | ) | ||||||||
Net asset value, end of period | $11.12 | $11.04 | $10.74 | $10.83 | ||||||||||||
Total return3 | 3.23 | % | 5.75 | % | 1.95 | % | 0.44 | % | ||||||||
Ratios to average net assets (annualized) | ||||||||||||||||
Gross expenses | 0.62 | % | 0.61 | % | 0.55 | % | 0.54 | % | ||||||||
Net expenses | 0.52 | % | 0.52 | % | 0.52 | % | 0.52 | % | ||||||||
Net investment income | 2.40 | % | 2.85 | % | 2.79 | % | 2.74 | % | ||||||||
Supplemental data | ||||||||||||||||
Portfolio turnover rate | 24 | % | 8 | % | 11 | % | 27 | % | ||||||||
Net assets, end of period (000s omitted) | $68,230 | $43,978 | $36,181 | $13,573 | ||||||||||||
| 1 | For the period from October 31, 2016 (commencement of class operations) to June 30, 2017 |
| 2 | Amount is less than $0.005. |
| 3 | Returns for periods of less than one year are not annualized. |
The accompanying notes are an integral part of these financial statements.
Wells Fargo Wisconsin Tax-Free Fund | 21
1. ORGANIZATION
Wells Fargo Funds Trust (the “Trust”), a Delaware statutory trust organized on March 10, 1999, is an open-end management investment company registered under the Investment Company Act of 1940, as amended (the “1940 Act”). As an investment company, the Trust follows the accounting and reporting guidance in Financial Accounting Standards Board (“FASB”) Accounting Standards Codification Topic 946, Financial Services – Investment Companies. These financial statements report on the Wells Fargo Wisconsin Tax-Free Fund (the “Fund”) which is a non-diversified series of the Trust.
2. SIGNIFICANT ACCOUNTING POLICIES
The following significant accounting policies, which are consistently followed in the preparation of the financial statements of the Fund, are in conformity with U.S. generally accepted accounting principles which require management to make estimates and assumptions that affect the reported amounts of assets and liabilities, disclosure of contingent assets and liabilities at the date of the financial statements, and the reported amounts of revenues and expenses during the reporting period. Actual results could differ from those estimates.
Securities valuation
All investments are valued each business day as of the close of regular trading on the New York Stock Exchange (generally 4 p.m. Eastern Time), although the Fund may deviate from this calculation time under unusual or unexpected circumstances.
Debt securities are valued at the evaluated bid price provided by an independent pricing service (e.g. taking into account various factors, including yields, maturities, or credit ratings) or, if a reliable price is not available, the quoted bid price from an independent broker-dealer.
Futures contracts that are listed on a foreign or domestic exchange or market are valued at the official closing price or, if none, the last sales price.
Investments which are not valued using any of the methods discussed above are valued at their fair value, as determined in good faith by the Board of Trustees of the Fund. The Board of Trustees has established a Valuation Committee comprised of the Trustees and has delegated to it the authority to take any actions regarding the valuation of portfolio securities that the Valuation Committee deems necessary or appropriate, including determining the fair value of portfolio securities, unless the determination has been delegated to the Wells Fargo Asset Management Pricing Committee at Wells Fargo Funds Management, LLC (“Funds Management”). The Board of Trustees retains the authority to make or ratify any valuation decisions or approve any changes to the Valuation Procedures as it deems appropriate. On a quarterly basis, the Board of Trustees receives reports on any valuation actions taken by the Valuation Committee or the Wells Fargo Asset Management Pricing Committee which may include items for ratification.
When-issued transactions
The Fund may purchase securities on a forward commitment or when-issued basis. The Fund records a when-issued transaction on the trade date and will segregate assets in an amount at least equal in value to the Fund’s commitment to purchase when-issued securities. Securities purchased on a when-issued basis are marked-to-market daily and the Fund begins earning interest on the settlement date. Losses may arise due to changes in the market value of the underlying securities or if the counterparty does not perform under the contract.
Futures contracts
Futures contracts are agreements between the Fund and a counterparty to buy or sell a specific amount of a commodity, financial instrument or currency at a specified price and on a specified date. The Fund may buy and sell futures contracts in order to gain exposure to, or protect against, changes in interest rates and is subject to interest rate risk. The primary risks associated with the use of futures contracts are the imperfect correlation between changes in market values of securities held by the Fund and the prices of futures contracts, and the possibility of an illiquid market. Futures contracts are generally entered into on a regulated futures exchange and cleared through a clearinghouse associated with the exchange. With futures contracts, there is minimal counterparty risk to the Fund since futures contracts are exchange traded and the exchange’s clearinghouse, as the counterparty to all exchange traded futures, guarantees the futures contracts against default.
Upon entering into a futures contracts, the Fund is required to deposit either cash or securities (initial margin) with the broker in an amount equal to a certain percentage of the contract value. Subsequent payments (variation margin) are paid to or from the broker each day equal to the daily changes in the contract value. Such payments are recorded as unrealized gains or losses and, if any, shown as variation margin receivable (payable) in the Statement of Assets and Liabilities. Should the Fund fail to make requested variation margin payments, the broker can gain access to the initial margin to satisfy the Fund’s payment obligations. When the contracts are closed, a realized gain or loss is recorded in the Statement of Operations.
22 | Wells Fargo Wisconsin Tax-Free Fund
Notes to financial statements
Security transactions and income recognition
Securities transactions are recorded on a trade date basis. Realized gains or losses are recorded on the basis of identified cost.
Interest income is accrued daily and bond discounts are accreted and premiums are amortized daily. To the extent debt obligations are placed on non-accrual status, any related interest income may be reduced by writing off interest receivables when the collection of all or a portion of interest has been determined to be doubtful based on consistently applied procedures and the fair value has decreased. If the issuer subsequently resumes interest payments or when the collectability of interest is reasonably assured, the debt obligation is removed from non-accrual status.
Distributions to shareholders
Distributions to shareholders from net investment income are declared daily and paid monthly. Distributions from net realized gains, if any, are recorded on the ex-dividend date and paid at least annually. Such distributions are determined in accordance with income tax regulations and may differ from U.S. generally accepted accounting principles. Dividend sources are estimated at the time of declaration. The tax character of distributions is determined as of the Fund’s fiscal year end. Therefore, a portion of the Fund’s distributions made prior to the Fund’s fiscal year end may be categorized as a tax return of capital at year end.
Federal and other taxes
The Fund intends to continue to qualify as a regulated investment company by distributing substantially all of its investment company taxable and tax-exempt income and any net realized capital gains (after reduction for capital loss carryforwards) sufficient to relieve it from all, or substantially all, federal income taxes. Accordingly, no provision for federal income taxes was required.
The Fund’s income and federal excise tax returns and all financial records supporting those returns for the prior three fiscal years are subject to examination by the federal and Delaware revenue authorities. Management has analyzed the Fund’s tax positions taken on federal, state, and foreign tax returns for all open tax years and does not believe that there are any uncertain tax positions that require recognition of a tax liability.
As of June 30, 2020, the aggregate cost of all investments for federal income tax purposes was $140,656,714 and the unrealized gains (losses) consisted of:
Gross unrealized gains | $ | 6,582,716 | ||
Gross unrealized losses | (325,262 | ) | ||
Net unrealized gains | $ | 6,257,454 | ||
As of June 30, 2020, the Fund had current year deferred post-October capital losses consisting of $11,591 in short-term losses which will be recognized on the first day of the following fiscal year.
Class allocations
The separate classes of shares offered by the Fund differ principally in applicable sales charges, distribution, shareholder servicing, and administration fees. Class specific expenses are charged directly to that share class. Investment income, common fund-level expenses, and realized and unrealized gains (losses) on investments are allocated daily to each class of shares based on the relative proportion of net assets of each class.
3. FAIR VALUATION MEASUREMENTS
Fair value measurements of investments are determined within a framework that has established a fair value hierarchy based upon the various data inputs utilized in determining the value of the Fund’s investments. The three-level hierarchy gives the highest priority to unadjusted quoted prices in active markets for identical assets or liabilities (Level 1) and the lowest priority to unobservable inputs (Level 3). The Fund’s investments are classified within the fair value hierarchy based on the lowest level of input that is significant to the fair value measurement. The inputs are summarized into three broad levels as follows:
| ∎ | Level 1 – quoted prices in active markets for identical securities |
| ∎ | Level 2 – other significant observable inputs (including quoted prices for similar securities, interest rates, prepayment speeds, credit risk, etc.) |
| ∎ | Level 3 – significant unobservable inputs (including the Fund’s own assumptions in determining the fair value of investments) |
The inputs or methodologies used for valuing investments in securities are not necessarily an indication of the risk associated with investing in those securities.
Wells Fargo Wisconsin Tax-Free Fund | 23
Notes to financial statements
The following is a summary of the inputs used in valuing the Fund’s assets and liabilities as of June 30, 2020:
Quoted prices (Level 1) | Other significant observable inputs (Level 2) | Significant unobservable inputs (Level 3) | Total | |||||||||||||
Assets | ||||||||||||||||
Investments in: | ||||||||||||||||
Municipal obligations | $ | 0 | $ | 146,914,168 | $ | 0 | $ | 146,914,168 | ||||||||
Additional sector, industry or geographic detail is included in the Portfolio of Investments.
For the year ended June 30, 2020, the Fund did not have any transfers into/out of Level 3.
4. TRANSACTIONS WITH AFFILIATES
Management fee
Funds Management, an indirect wholly owned subsidiary of Wells Fargo & Company (“Wells Fargo”), is the manager of the Fund and provides advisory and fund-level administrative services under an investment management agreement. Under the investment management agreement, Funds Management is responsible for, among other services, implementing the investment objectives and strategies of the Fund, supervising the subadviser and providing fund-level administrative services in connection with the Fund’s operations. As compensation for its services under the investment management agreement, Funds Management is entitled to receive a management fee at the following annual rate based on the Fund’s average daily net assets:
| Average daily net assets | Management fee | |||
First $500 million | 0.400 | % | ||
Next $500 million | 0.375 | |||
Next $2 billion | 0.350 | |||
Next $2 billion | 0.325 | |||
Next $5 billion | 0.290 | |||
Over $10 billion | 0.280 | |||
For the year ended June 30, 2020, the management fee was equivalent to an annual rate of 0.40% of the Fund’s average daily net assets.
Funds Management has retained the services of a subadviser to provide daily portfolio management to the Fund. The fee for subadvisory services is borne by Funds Management. Wells Capital Management Incorporated, an affiliate of Funds Management and an indirect wholly owned subsidiary of Wells Fargo, is the subadviser to the Fund and is entitled to receive a fee from Funds Management at an annual rate starting at 0.20% and declining to 0.10% as the average daily net assets of the Fund increase.
Administration fees
Under a class-level administration agreement, Funds Management provides class-level administrative services to the Fund, which includes paying fees and expenses for services provided by the transfer agent, sub-transfer agents, omnibus account servicers and record-keepers. As compensation for its services under the class-level administration agreement, Funds Management receives an annual fee which is calculated based on the average daily net assets of each class as follows:
Class-level administration fee | ||||
Class A, Class C | 0.16 | % | ||
Institutional Class | 0.08 | |||
Waivers and/or expense reimbursements
Funds Management has contractually waived and/or reimbursed management and administration fees to the extent necessary to maintain certain net operating expense ratios for the Fund. When each class of the Fund has exceeded its expense cap, Funds Management has waived fees and/or reimbursed expenses from fund-level expenses on a proportionate basis and then from
24 | Wells Fargo Wisconsin Tax-Free Fund
Notes to financial statements
class specific expenses. When only certain classes exceed their expense caps, waivers and/or reimbursements are applied against class specific expenses before fund-level expenses. Funds Management has committed through October 31, 2020 to waive fees and/or reimburse expenses to the extent necessary to cap the Fund’s expenses at 0.70% for Class A shares, 1.45% for Class C shares, and 0.52% for Institutional Class shares. Prior to or after the commitment expiration date, the cap may be increased or the commitment to maintain the cap may be terminated only with the approval of the Board of Trustees.
Distribution fee
The Trust has adopted a distribution plan for Class C shares of the Fund pursuant to Rule 12b-1 under the 1940 Act. A distribution fee is charged to Class C shares and paid to Wells Fargo Funds Distributor, LLC (“Funds Distributor”), the principal underwriter, at an annual rate of 0.75% of the average daily net assets of Class C shares.
In addition, Funds Distributor is entitled to receive the front-end sales charge from the purchase of Class A shares and a contingent deferred sales charge on the redemption of certain Class A shares. Funds Distributor is also entitled to receive the contingent deferred sales charges from redemptions of Class C shares. For the year ended June 30, 2020, Funds Distributor received $3,976 from the sale of Class A shares and $66 in contingent deferred sales charges from redemptions Class C shares. No contingent deferred sales charges were incurred by Class A shares for the year ended June 30, 2020.
Shareholder servicing fees
The Trust has entered into contracts with one or more shareholder servicing agents, whereby Class A and Class C of the Fund are charged a fee at an annual rate of 0.25% of the average daily net assets of each respective class. A portion of these total shareholder servicing fees were paid to affiliates of Wells Fargo.
Interfund transactions
The Fund may purchase or sell portfolio investment securities to certain other Wells Fargo affiliates pursuant to Rule 17a-7 under the 1940 Act and under procedures adopted by the Board of Trustees. The procedures have been designed to ensure that these interfund transactions, which do not incur broker commissions, are effected at current market prices. Pursuant to these procedures, the Fund had $8,535,000 and $6,500,000 in interfund purchases and sales, respectively, during the year ended June 30, 2020.
5. INVESTMENT PORTFOLIO TRANSACTIONS
Purchases and sales of investments, excluding U.S. government obligations (if any) and short-term securities, for the year ended June 30, 2020 were $29,767,411 and $29,851,138, respectively.
6. BANK BORROWINGS
The Trust (excluding the money market funds), Wells Fargo Master Trust and Wells Fargo Variable Trust are parties to a $350,000,000 revolving credit agreement whereby the Fund is permitted to use bank borrowings for temporary or emergency purposes, such as to fund shareholder redemption requests. Interest under the credit agreement is charged to the Fund based on a borrowing rate equal to the higher of the Federal Funds rate in effect on that day plus 1.25% or the overnight LIBOR rate in effect on that day plus 1.25%. In addition, an annual commitment fee equal to 0.25% of the unused balance is allocated to each participating fund.
For the year ended June 30, 2020, there were no borrowings by the Fund under the agreement.
7. DISTRIBUTIONS TO SHAREHOLDERS
The tax character of distributions paid during the years ended June 30, 2020 and June 30, 2019 were as follows:
| Year ended June 30 | ||||||||
| 2020 | 2019 | |||||||
Tax-exempt income | $ | 3,313,425 | $ | 3,515,977 | ||||
Long-term capital gain | 58,181 | 0 | ||||||
As of June 30, 2020, the components of distributable earnings on a tax basis were as follows:
Undistributed tax-exempt income | Unrealized gains | Post-October capital losses deferred | ||
| $13,219 | $6,257,454 | $(11,591) | ||
Wells Fargo Wisconsin Tax-Free Fund | 25
Notes to financial statements
8. CONCENTRATION RISK
The Fund invests a substantial portion of its assets in issuers of municipal debt securities located in a single state or territory of the U.S. Therefore, it may be more affected by economic and political developments in that state or region than would be a comparable general tax-exempt fund. As of the end of the period, the Fund invested a concentration of its portfolio in the state of Wisconsin.
9. INDEMNIFICATION
Under the Fund’s organizational documents, the officers and Trustees have been granted certain indemnification rights against certain liabilities that may arise out of performance of their duties to the Fund. The Fund has entered into a separate agreement with each Trustee that converts indemnification rights currently existing under the Fund’s organizational documents into contractual rights that cannot be changed in the future without the consent of the Trustee. Additionally, in the normal course of business, the Fund may enter into contracts with service providers that contain a variety of indemnification clauses. The Fund’s maximum exposure under these arrangements is dependent on future claims that may be made against the Fund and, therefore, cannot be estimated.
10. NEW ACCOUNTING PRONOUNCEMENT
In August 2018, FASB issued Accounting Standards Update (“ASU”) No. 2018-13, Fair Value Measurement (Topic 820) Disclosure Framework—Changes to the Disclosure Requirements for Fair Value Measurement. ASU 2018-13 updates the disclosure requirements on fair value measurements in Topic 820, Fair Value Measurements. The amendments are effective for fiscal years, and interim periods within those fiscal years, beginning after December 15, 2019. Management has adopted this guidance which did not have a material impact on the financial statements.
11. CORONAVIRUS (COVID-19) PANDEMIC
On March 11, 2020, the World Health Organization announced that it had made the assessment that coronavirus disease 2019 (“COVID-19”) is a pandemic. The impacts of COVID-19 are adversely affecting the entire global economy, individual companies and investment products, and the market in general. There is significant uncertainty around the extent and duration of business disruptions related to COVID-19 and the impacts may be short term or may last for an extended period of time. The risk of further spreading of COVID-19 has led to significant uncertainty and volatility in the financial markets.
26 | Wells Fargo Wisconsin Tax-Free Fund
Report of independent registered public accounting firm
To the Shareholders of the Fund and Board of Trustees
Wells Fargo Funds Trust:
Opinion on the Financial Statements
We have audited the accompanying statement of assets and liabilities of Wells Fargo Wisconsin Tax-Free Fund (the Fund), one of the funds constituting Wells Fargo Funds Trust, including the portfolio of investments, as of June 30, 2020, the related statement of operations for the year then ended, the statements of changes in net assets for each of the years in the two-year period then ended, and the related notes (collectively, the financial statements) and the financial highlights for each of the years or periods in the five-year period then ended. In our opinion, the financial statements and financial highlights present fairly, in all material respects, the financial position of the Fund as of June 30, 2020, the results of its operations for the year then ended, the changes in its net assets for each of the years in the two-year period then ended, and the financial highlights for each of the years or periods in the five-year period then ended, in conformity with U.S. generally accepted accounting principles.
Basis for Opinion
These financial statements and financial highlights are the responsibility of the Fund’s management. Our responsibility is to express an opinion on these financial statements and financial highlights based on our audits. We are a public accounting firm registered with the Public Company Accounting Oversight Board (United States) (PCAOB) and are required to be independent with respect to the Fund in accordance with the U.S. federal securities laws and the applicable rules and regulations of the Securities and Exchange Commission and the PCAOB.
We conducted our audits in accordance with the standards of the PCAOB. Those standards require that we plan and perform the audit to obtain reasonable assurance about whether the financial statements and financial highlights are free of material misstatement, whether due to error or fraud. Our audits included performing procedures to assess the risks of material misstatement of the financial statements and financial highlights, whether due to error or fraud, and performing procedures that respond to those risks. Such procedures included examining, on a test basis, evidence regarding the amounts and disclosures in the financial statements and financial highlights. Such procedures also included confirmation of securities owned as of June 30, 2020, by correspondence with the custodian and brokers, or by other appropriate auditing procedures. Our audits also included evaluating the accounting principles used and significant estimates made by management, as well as evaluating the overall presentation of the financial statements and financial highlights. We believe that our audits provide a reasonable basis for our opinion.

We have not been able to determine the specific year that we began serving as the auditor of one or more Wells Fargo Funds investment companies; however we are aware that we have served as the auditor of one or more Wells Fargo Funds investment companies since at least 1955.
Boston, Massachusetts
August 29, 2020
Wells Fargo Wisconsin Tax-Free Fund | 27
TAX INFORMATION
Pursuant to Section 852 of the Internal Revenue Code, 100% of distributions paid from net investment income is designated as exempt-interest dividends for the fiscal year ended June 30, 2020.
Pursuant to Section 852 of the Internal Revenue Code, $58,181 was designated as a 20% rate gain distribution for the fiscal year ended June 30, 2020.
PROXY VOTING INFORMATION
A description of the policies and procedures used to determine how to vote proxies relating to portfolio securities is available, upon request, by calling 1-800-222-8222, visiting our website at wfam.com, or visiting the SEC website at sec.gov. Information regarding how the proxies related to portfolio securities were voted during the most recent 12-month period ended June 30 is available on the website at wfam.com or by visiting the SEC website at sec.gov.
QUARTERLY PORTFOLIO HOLDINGS INFORMATION
The Fund files its complete schedule of portfolio holdings with the SEC for the first and third quarters of each fiscal year as an exhibit to its reports on Form N-PORT. Shareholders may view the filed Form N-PORT by visiting the SEC website at sec.gov.
28 | Wells Fargo Wisconsin Tax-Free Fund
Other information (unaudited)
BOARD OF TRUSTEES AND OFFICERS
Each of the Trustees and Officers1 listed in the table below acts in identical capacities for each fund in the Wells Fargo family of funds, which consists of 147 mutual funds comprising the Wells Fargo Funds Trust, Wells Fargo Variable Trust, Wells Fargo Master Trust and four closed-end funds (collectively the “Fund Complex”). This table should be read in conjunction with the Prospectus and the Statement of Additional Information2. The mailing address of each Trustee and Officer is 525 Market Street, 12th Floor, San Francisco, CA 94105. Each Trustee and Officer serves an indefinite term, however, each Trustee serves such term until reaching the mandatory retirement age established by the Trustees.
Independent Trustees
Name and year of birth | Position held and length of service* | Principal occupations during past five years or longer | Current other public company or investment company directorships | |||
William R. Ebsworth (Born 1957) | Trustee, since 2015 | Retired. From 1984 to 2013, equities analyst, portfolio manager, research director and chief investment officer at Fidelity Management and Research Company in Boston, Tokyo, and Hong Kong, and retired in 2013 as Chief Investment Officer of Fidelity Strategic Advisers, Inc. where he led a team of investment professionals managing client assets. Prior thereto, Board member of Hong Kong Securities Clearing Co., Hong Kong Options Clearing Corp., the Thailand International Fund, Ltd., Fidelity Investments Life Insurance Company, and Empire Fidelity Investments Life Insurance Company. Audit Committee Chair and Investment Committee Chair of the Vincent Memorial Hospital Endowment (non-profit organization). Mr. Ebsworth is a CFA® charterholder. | N/A | |||
Jane A. Freeman (Born 1953) | Trustee, since 2015; Chair Liaison, since 2018 | Retired. From 2012 to 2014 and 1999 to 2008, Chief Financial Officer of Scientific Learning Corporation. From 2008 to 2012, Ms. Freeman provided consulting services related to strategic business projects. Prior to 1999, Portfolio Manager at Rockefeller & Co. and Scudder, Stevens & Clark. Board member of the Harding Loevner Funds from 1996 to 2014, serving as both Lead Independent Director and chair of the Audit Committee. Board member of the Russell Exchange Traded Funds Trust from 2011 to 2012 and the chair of the Audit Committee. Ms. Freeman is also an inactive Chartered Financial Analyst. | N/A | |||
Isaiah Harris, Jr. (Born 1952) | Trustee, since 2009; Audit Committee Chairman, since 2019 | Retired. Chairman of the Board of CIGNA Corporation since 2009, and Director since 2005. From 2003 to 2011, Director of Deluxe Corporation. Prior thereto, President and CEO of BellSouth Advertising and Publishing Corp. from 2005 to 2007, President and CEO of BellSouth Enterprises from 2004 to 2005 and President of BellSouth Consumer Services from 2000 to 2003. Emeritus member of the Iowa State University Foundation Board of Governors. Emeritus Member of the Advisory Board of Iowa State University School of Business. Advisory Board Member, Palm Harbor Academy (private school). Advisory Board Member, Child Evangelism Fellowship (non-profit). Mr. Harris is a certified public accountant (inactive status). | CIGNA Corporation | |||
Judith M. Johnson (Born 1949) | Trustee, since 2008; Audit Committee Chairman, from 2009 to 2018 | Retired. Prior thereto, Chief Executive Officer and Chief Investment Officer of Minneapolis Employees Retirement Fund from 1996 to 2008. Ms. Johnson is an attorney, certified public accountant and a certified managerial accountant. | N/A | |||
Wells Fargo Wisconsin Tax-Free Fund | 29
Other information (unaudited)
Name and year of birth | Position held and length of service* | Principal occupations during past five years or longer | Current other public company or investment company directorships | |||
David F. Larcker (Born 1950) | Trustee, since 2009 | James Irvin Miller Professor of Accounting at the Graduate School of Business, Stanford University, Director of the Corporate Governance Research Initiative and Senior Faculty of The Rock Center for Corporate Governance since 2006. From 2005 to 2008, Professor of Accounting at the Graduate School of Business, Stanford University. Prior thereto, Ernst & Young Professor of Accounting at The Wharton School, University of Pennsylvania from 1985 to 2005. | N/A | |||
Olivia S. Mitchell (Born 1953) | Trustee, since 2006; Nominating and Governance Committee Chair, since 2018 | International Foundation of Employee Benefit Plans Professor, Wharton School of the University of Pennsylvania since 1993. Director of Wharton’s Pension Research Council and Boettner Center on Pensions & Retirement Research, and Research Associate at the National Bureau of Economic Research. Previously, Cornell University Professor from 1978 to 1993. | N/A | |||
Timothy J. Penny (Born 1951) | Trustee, since 1996; Chairman, since 2018 | President and Chief Executive Officer of Southern Minnesota Initiative Foundation, a non-profit organization, since 2007. Member of the Board of Trustees of NorthStar Education Finance, Inc., a non-profit organization, since 2007. | N/A | |||
James G. Polisson (Born 1959) | Trustee, since 2018 | Retired. Chief Marketing Officer, Source (ETF) UK Services, Ltd, from 2015 to 2017. From 2012 to 2015, Principal of The Polisson Group, LLC, a management consulting, corporate advisory and principal investing company. Chief Executive Officer and Managing Director at Russell Investments, Global Exchange Traded Funds from 2010 to 2012. Managing Director of Barclays Global Investors from 1998 to 2010 and Global Chief Marketing Officer for iShares and Barclays Global Investors from 2000 to 2010. Trustee of the San Francisco Mechanics’ Institute, a non-profit organization, from 2013 to 2015. Board member of the Russell Exchange Traded Fund Trust from 2011 to 2012. Director of Barclays Global Investors Holdings Deutschland GmbH from 2006 to 2009. Mr. Polisson is an attorney and has a retired status with the Massachusetts and District of Columbia Bar Associations. | N/A | |||
Pamela Wheelock (Born 1959) | Trustee, since January 2020; previously Trustee from January 2018 to July 2019 | Board member of the Destination Medical Center Economic Development Agency, Rochester, Minnesota since 2019 and Interim President of the McKnight Foundation since 2020. Acting Commissioner, Minnesota Department of Human Services, July 2019 through September 2019. Human Services Manager (part-time), Minnesota Department of Human Services, October 2019 through December 2019. Chief Operating Officer, Twin Cities Habitat for Humanity from 2017 to 2019. Vice President of University Services, University of Minnesota from 2012 to 2016. Prior thereto, on the Board of Directors, Governance Committee and Finance Committee for the Minnesota Philanthropy Partners (Saint Paul Foundation) from 2012 to 2018, Interim Chief Executive Officer of Blue Cross Blue Shield of Minnesota from 2011 to 2012, Chairman of the Board from 2009 to 2012 and Board Director from 2003 to 2015. Vice President, Leadership and Community Engagement, Bush Foundation, Saint Paul, Minnesota (a private foundation) from 2009 to 2011. Executive Vice President and Chief Financial Officer, Minnesota Sports and Entertainment from 2004 to 2009 and Senior Vice President from 2002 to 2004. Executive Vice President of the Minnesota Wild Foundation from 2004 to 2008. Commissioner of Finance, State of Minnesota, from 1999 to 2002. Currently Board Chair of the Minnesota Wild Foundation since 2010. | N/A | |||
| * | Length of service dates reflect the Trustee’s commencement of service with the Trust’s predecessor entities, where applicable. |
30 | Wells Fargo Wisconsin Tax-Free Fund
Other information (unaudited)
Officers
Name and year of birth | Position held and length of service | Principal occupations during past five years or longer | ||
Andrew Owen (Born 1960) | President, since 2017 | Executive Vice President of Wells Fargo & Company and Head of Affiliated Managers, Wells Fargo Asset Management, since 2014. In addition, Mr. Owen is currently President, Chief Executive Officer and Director of Wells Fargo Funds Management, LLC since 2017. Prior thereto, Executive Vice President responsible for marketing, investments and product development for Wells Fargo Funds Management, LLC, from 2009 to 2014. | ||
Nancy Wiser1 (Born 1967) | Treasurer, since 2012 | Executive Vice President of Wells Fargo Funds Management, LLC since 2011. Chief Operating Officer and Chief Compliance Officer at LightBox Capital Management LLC, from 2008 to 2011. | ||
Michelle Rhee (Born 1966) | Chief Legal Officer, since 2019 | Secretary of Wells Fargo Funds Management, LLC, Chief Legal Counsel of Wells Fargo Asset Management and Assistant General Counsel of Wells Fargo Bank, N.A. since 2018. Associate General Counsel and Managing Director of Bank of America Corporation from 2004 to 2018. | ||
Catherine Kennedy (Born 1969) | Secretary, since 2019 | Vice President of Wells Fargo Funds Management, LLC and Senior Counsel of the Wells Fargo Legal Department since 2010. Vice President and Senior Counsel of Evergreen Investment Management Company, LLC from 1998 to 2010. | ||
Michael H. Whitaker (Born 1967) | Chief Compliance Officer, since 2016 | Chief Compliance Officer of Wells Fargo Asset Management since 2016. Senior Vice President and Chief Compliance Officer for Fidelity Investments from 2007 to 2016. | ||
David Berardi (Born 1975) | Assistant Treasurer, since 2009 | Vice President of Wells Fargo Funds Management, LLC since 2009. Vice President of Evergreen Investment Management Company, LLC from 2008 to 2010. Manager of Fund Reporting and Control for Evergreen Investment Management Company, LLC from 2004 to 2010. | ||
Jeremy DePalma1 (Born 1974) | Assistant Treasurer, since 2009 | Senior Vice President of Wells Fargo Funds Management, LLC since 2009. Senior Vice President of Evergreen Investment Management Company, LLC from 2008 to 2010 and head of the Fund Reporting and Control Team within Fund Administration from 2005 to 2010. | ||
| 1 | Nancy Wiser acts as Treasurer of 65 funds in the Fund Complex. Jeremy DePalma acts as the Treasurer of 82 funds and Assistant Treasurer of 65 funds in the Fund Complex. |
| 2 | The Statement of Additional Information includes additional information about the Trustees and is available, without charge, upon request, by calling 1-800-222-8222 or by visiting the website at wfam.com. |
Wells Fargo Wisconsin Tax-Free Fund | 31
Other information (unaudited)
BOARD CONSIDERATION OF INVESTMENT MANAGEMENT AND SUB-ADVISORY AGREEMENTS:
Wells Fargo Wisconsin Tax-Free Fund
Under the Investment Company Act of 1940 (the “1940 Act”), the Board of Trustees (the “Board”) of Wells Fargo Funds Trust (the “Trust”) must determine annually whether to approve the continuation of the Trust’s investment management and sub-advisory agreements. In this regard, at a Board meeting held on May 26, 2020 and May 28, 2020 (together, the “Meeting”), the Board, all the members of which have no direct or indirect interest in the investment management and sub-advisory agreements and are not “interested persons” of the Trust, as defined in the 1940 Act (the “Independent Trustees”), reviewed and approved for Wells Fargo Wisconsin Tax-Free Fund (the “Fund”): (i) an investment management agreement (the “Management Agreement”) with Wells Fargo Funds Management, LLC (“Funds Management”); and (ii) an investment sub-advisory agreement (the “Sub-Advisory Agreement”) with Wells Capital Management Incorporated (the “Sub-Adviser”), an affiliate of Funds Management. The Management Agreement and the Sub-Advisory Agreement are collectively referred to as the “Advisory Agreements.”
At the Meeting, the Board considered the factors and reached the conclusions described below relating to the selection of Funds Management and the Sub-Adviser and the approval of the Advisory Agreements. Prior to the Meeting, including at a Board meeting held in April 2020, the Trustees conferred extensively among themselves and with representatives of Funds Management about these matters. Also, the Board has adopted a team-based approach, with each team consisting of a sub-set of Trustees, to assist the full Board in the discharge of its duties in reviewing investment performance and other matters throughout the year. The Independent Trustees were assisted in their evaluation of the Advisory Agreements by independent legal counsel, from whom they received separate legal advice and with whom they met separately.
In providing information to the Board, Funds Management and the Sub-Adviser were guided by a detailed set of requests for information submitted to them by independent legal counsel on behalf of the Independent Trustees at the start of the Board’s annual contract renewal process earlier in 2020. In considering and approving the Advisory Agreements, the Trustees considered the information they believed relevant, including but not limited to the information discussed below. The Board considered not only the specific information presented in connection with the Meeting, but also the knowledge gained over time through interaction with Funds Management and the Sub-Adviser about various topics. In this regard, the Board reviewed reports of Funds Management at each of its quarterly meetings, which included, among other things, portfolio reviews and investment performance reports. In addition, the Board and the teams mentioned above confer with portfolio managers at various times throughout the year. The Board did not identify any particular information or consideration that was all-important or controlling, and each individual Trustee may have attributed different weights to various factors.
After its deliberations, the Board unanimously approved the continuation of the Advisory Agreements for a one-year term and determined that the compensation payable to Funds Management and the Sub-Adviser under each of the Advisory Agreements was reasonable. The Board considered the approval of the Advisory Agreements for the Fund as part of its consideration of agreements for funds across the complex, but its approvals were made on a fund-by-fund basis. The following summarizes a number of important, but not necessarily all, factors considered by the Board in support of its approvals.
Nature, extent and quality of services
The Board received and considered various information regarding the nature, extent and quality of services provided to the Fund by Funds Management and the Sub-Adviser under the Advisory Agreements. This information included a description of the investment advisory services and Fund-level administrative services covered by the Management Agreement, as well as, among other things, a summary of the background and experience of senior management of Wells Fargo Asset Management (“WFAM”), of which Funds Management and the Sub-Adviser are a part, and a summary of investments made in the business of WFAM. The Board also received a description of Funds Management’s and the Sub-Adviser’s business continuity plans and of their approaches to data privacy and cybersecurity, and related testing. The Board also received and reviewed information about Funds Management’s role as administrator of the Fund’s liquidity risk management program, Funds Management’s approach to risk management, and Funds Management’s intermediary and vendor oversight program.
The Board also considered the qualifications, background, tenure and responsibilities of each of the portfolio managers primarily responsible for the day-to-day portfolio management of the Fund. The Board evaluated the ability of Funds Management and the Sub-Adviser to attract and retain qualified investment professionals, including research, advisory and supervisory personnel. The Board further considered the compliance programs and compliance records of Funds Management and the Sub-Adviser. In addition, the Board took into account the full range of services provided to the Fund by Funds Management and its affiliates.
32 | Wells Fargo Wisconsin Tax-Free Fund
Other information (unaudited)
Fund investment performance and expenses
The Board considered the investment performance results for the Fund over various time periods ended December 31, 2019. The Board also considered more current results for various time periods ended March 31, 2020. The Board considered these results in comparison to the investment performance of funds in a universe that was determined by Broadridge Inc. (“Broadridge”) to be similar to the Fund (the “Universe”), and in comparison to the Fund’s benchmark index and to other comparative data. Broadridge is an independent provider of investment company data. The Board received a description of the methodology used by Broadridge to select the mutual funds in the performance Universe. The Board noted that the investment performance of the Fund (Class A) was higher than or in range of the average investment performance of the Universe for the three-, five- and ten-year periods ended December 31, 2019, and lower than the average investment performance of the Universe for the one-year period ended December 31, 2019. The Board also noted that the investment performance of the Fund (Class A) was higher than or in range of the average investment performance of the Universe for all periods ended March 31, 2020. The Board also noted that the investment performance of the Fund was lower than its benchmark index, the Bloomberg Barclays Municipal Bond Index, for all periods ended December 31, 2019. The Board also noted that the investment performance of the Fund was lower than its benchmark index, the Bloomberg Barclays Municipal Bond Index, for all periods ended March 31, 2020.
The Board received information concerning, and discussed factors contributing to, the underperformance of the Fund relative to the Universe and benchmark index for the periods identified above. The Board took note of the explanations for the relative underperformance during these periods, including with respect to investment decisions and market factors that affected the Fund’s investment performance.
The Board also received and considered information regarding the Fund’s net operating expense ratios and their various components, including actual management fees, custodian and other non-management fees, and Rule 12b-1 and non-Rule 12b-1 shareholder service fees. The Board considered these ratios in comparison to the median ratios of funds in class-specific expense groups that were determined by Broadridge to be similar to the Fund (the “Groups”). The Board received a description of the methodology used by Broadridge to select the mutual funds in the expense Groups and an explanation of how funds comprising expense groups and their expense ratios may vary from year-to-year. Based on the Broadridge reports, the Board noted that the net operating expense ratios of the Fund were lower than the median net operating expense ratios of the expense Groups for each share class.
The Board took into account the Fund’s investment performance and expense information provided to it among the factors considered in deciding to re-approve the Advisory Agreements.
Investment management and sub-advisory fee rates
The Board reviewed and considered the contractual fee rates payable by the Fund to Funds Management under the Management Agreement, as well as the contractual fee rates payable by the Fund to Funds Management for class-level administrative services under a Class-Level Administration Agreement, which include, among other things, class-level transfer agency and sub-transfer agency costs (collectively, the “Management Rates”). The Board also reviewed and considered the contractual investment sub-advisory fee rates that are payable by Funds Management to the Sub-Adviser for investment sub-advisory services.
Among other information reviewed by the Board was a comparison of the Fund’s Management Rates with the average contractual investment management fee rates of funds in the expense Groups at a common asset level as well as transfer agency costs of the funds in the expense Groups. The Board noted that the Management Rates of the Fund were lower than the sum of these average rates for the Fund’s expense Groups for all share classes.
The Board also received and considered information about the portion of the total management fee that was retained by Funds Management after payment of the fee to the Sub-Adviser for sub-advisory services. In assessing the reasonableness of this amount, the Board received and evaluated information about the nature and extent of responsibilities retained and risks assumed by Funds Management and not delegated to or assumed by the Sub-Adviser, and about Funds Management’s on-going oversight services. Given the affiliation between Funds Management and the Sub-Adviser, the Board ascribed limited relevance to the allocation of fees between them.
The Board also received and considered information about the nature and extent of services offered and fee rates charged by Funds Management and the Sub-Adviser to other types of clients with investment strategies similar to those of the Fund. In this regard, the Board received information about the significantly greater scope of services, and compliance, reporting and other legal burdens and risks of managing proprietary mutual funds compared with those associated with managing assets of other types of clients, including third-party sub-advised fund clients and non-mutual fund clients such as institutional separate accounts.
Wells Fargo Wisconsin Tax-Free Fund | 33
Other information (unaudited)
Based on its consideration of the factors and information it deemed relevant, including those described here, the Board determined that the compensation payable to Funds Management under the Management Agreement and to the Sub-Adviser under the Sub-Advisory Agreement was reasonable.
Profitability
The Board received and considered information concerning the profitability of Funds Management, as well as the profitability of both WFAM and Wells Fargo & Co. (“Wells Fargo”) from providing services to the fund family as a whole. The Board noted that the Sub-Adviser’s profitability information with respect to providing services to the Fund and other funds in the family was subsumed in the WFAM and Wells Fargo profitability analysis.
Funds Management reported on the methodologies and estimates used in calculating profitability, including a description of the methodology used to allocate certain expenses. Among other things, the Board noted that the levels of profitability reported on a fund-by-fund basis varied widely, depending on factors such as the size, type and age of fund.
Based on its review, the Board did not deem the profits reported by Funds Management, WFAM or Wells Fargo from services provided to the Fund to be at a level that would prevent it from approving the continuation of the Advisory Agreements.
Economies of scale
The Board received and considered information about the potential for Funds Management to experience economies of scale in the provision of management services to the Fund, the difficulties of calculating economies of scale at an individual fund level, and the extent to which potential scale benefits are shared with shareholders. The Board noted the existence of breakpoints in the Fund’s management fee structure, which operate generally to reduce the Fund’s expense ratios as the Fund grows in size, and the size of the Fund in relation to such breakpoints. The Board considered that in addition to management fee breakpoints, Funds Management shares potential economies of scale from its management business in a variety of ways, including through fee waiver and expense reimbursement arrangements, services that benefit shareholders, competitive management fee rates set at the outset without regard to breakpoints, and investments in the business intended to enhance services available to shareholders.
The Board concluded that Funds Management’s arrangements with respect to the Fund, including contractual breakpoints, constituted a reasonable approach to sharing potential economies of scale with the Fund and its shareholders.
Other benefits to Funds Management and the Sub-Adviser
The Board received and considered information regarding potential “fall-out” or ancillary benefits received by Funds Management and its affiliates, including the Sub-Adviser, as a result of their relationships with the Fund. Ancillary benefits could include, among others, benefits directly attributable to other relationships with the Fund and benefits potentially derived from an increase in Funds Management’s and the Sub-Adviser’s business as a result of their relationships with the Fund. The Board noted that various affiliates of Funds Management may receive distribution-related fees, shareholder servicing payments and sub-transfer agency fees in respect of shares sold or held through them and services provided.
The Board also reviewed information about soft dollar credits earned and utilized by the Sub-Adviser, fees earned by Funds Management and the Sub-Adviser from managing a private investment vehicle for the fund family’s securities lending collateral, and commissions earned by an affiliated broker from portfolio transactions.
Based on its consideration of the factors and information it deemed relevant, including those described here, the Board did not find that any ancillary benefits received by Funds Management and its affiliates, including the Sub-Adviser, were unreasonable.
Conclusion
At the Meeting, after considering the above-described factors and based on its deliberations and its evaluation of the information described above, the Board unanimously approved the continuation of the Advisory Agreements for a one-year term and determined that the compensation payable to Funds Management and the Sub-Adviser under each of the Advisory Agreements was reasonable.
34 | Wells Fargo Wisconsin Tax-Free Fund
Other information (unaudited)
LIQUIDITY RISK MANAGEMENT PROGRAM
In accordance with Rule 22e-4 under the Investment Company Act of 1940, as amended (the “Liquidity Rule”), Wells Fargo Funds Trust (the “Trust”) has adopted and implemented a liquidity risk management program (the “Program”) on behalf of each of its series, including the Fund, which is reasonably designed to assess and manage the Fund’s liquidity risk. “Liquidity risk” is defined as the risk that the Fund is unable to meet redemption requests without significantly diluting remaining investors’ interests in the Fund. The Trust’s Board of Trustees (the “Board”) previously approved the designation of Wells Fargo Funds Management, LLC (“Funds Management”), the Fund’s investment manager, as the administrator of the Program, and Funds Management has established a Liquidity Risk Management Council composed of personnel from multiple departments within Funds Management and its affiliates to assist Funds Management in the implementation and on-going administration of the Program.
The Program is comprised of various components designed to support the assessment and/or management of liquidity risk, including: (1) the periodic assessment (no less frequently than annually) of certain factors that influence the Fund’s liquidity risk; (2) the periodic classification (no less frequently than monthly) of the Fund’s investments into one of four liquidity categories that reflect an estimate of their liquidity under current market conditions; (3) a 15% limit on the acquisition of “illiquid investments” (as defined under the Liquidity Rule); (4) to the extent the Fund does not invest primarily in “highly liquid investments” (as defined under the Liquidity Rule), the determination of a minimum percentage of the Fund’s assets that generally will be invested in highly liquid investments (an “HLIM”); (5) if the Fund has established an HLIM, the periodic review (no less frequently than annually) of the HLIM and the adoption of policies and procedures for responding to a shortfall of the Fund’s “highly liquid investments” below its HLIM; and (6) periodic reporting to the Board.
At a meeting of the Board held on May 26 and 28, 2020, the Board received a written report (the “Report”) from Funds Management that addressed the operation of the Program and assessed its adequacy and effectiveness of implementation. The Report covered the initial period from December 1, 2018 through December 31, 2019 (the “Reporting Period”). No significant liquidity events impacting the Fund were noted in the Report. There were no material changes to the Program during the Reporting Period. The Report concluded that the Program is operating effectively to assess and manage the Fund’s liquidity risk, and that the Program has been and continues to be adequately and effectively implemented to monitor and, as applicable, respond to the Fund’s liquidity developments.
There can be no assurance that the Program will achieve its objectives under all circumstances in the future. Please refer to the Fund’s prospectus for more information regarding the Fund’s exposure to liquidity risk and other risks to which an investment in the Fund may be subject.
Wells Fargo Wisconsin Tax-Free Fund | 35
Effective on or after May 1, 2020, clients of Edward Jones (also referred to as “shareholders”) purchasing Fund shares on the Edward Jones commission and fee-based platforms are eligible only for the following sales charge discounts (also referred to as “breakpoints”) and waivers, which can differ from breakpoints and waivers described elsewhere in the Fund’s Prospectus or SAI or through another broker-dealer. In all instances, it is the shareholder’s responsibility to inform Edward Jones at the time of purchase of any relationship, holdings of Wells Fargo Funds or other facts qualifying the purchaser for breakpoints or waivers. Edward Jones can ask for documentation of such circumstance.
| Breakpoints available at Edward Jones |
| Rights of Accumulation (ROA) |
The applicable sales charge on a purchase of Class A shares is determined by taking into account all share classes (except any money market funds and retirement plan share classes) of Wells Fargo Funds held by the shareholder or in an account grouped by Edward Jones with other accounts for the purpose of providing certain pricing considerations (“pricing groups”). This includes all share classes held on the Edward Jones platform and/or held on another platform. The inclusion of eligible fund family assets in the rights of accumulation calculation is dependent on the shareholder notifying his or her financial advisor of such assets at the time of calculation. |
ROA is determined by calculating the higher of cost or market value (current shares x NAV). |
| Letter of Intent (LOI) |
Through a LOI, shareholders can receive the sales charge and breakpoint discounts for purchases shareholders intend to makeover a 13-month period from the date Edward Jones receives the LOI. The LOI is determined by calculating the higher of cost or market value of qualifying holdings at LOI initiation in combination with the value that the shareholder intends to buy over a 13-month period to calculate the front-end sales charge and any breakpoint discounts. Each purchase the shareholder makes during that 13-month period will receive the sales charge and breakpoint discount that applies to the total amount. The inclusion of eligible fund family assets in the LOI calculation is dependent on the shareholder notifying his or her financial advisor of such assets at the time of calculation. Purchases made before the LOI is received by Edward Jones are not covered under the LOI and will not reduce the sales charge previously paid. Sales charges will be adjusted if LOI is not met. |
| Sales charges are waived for the following shareholders and in the following situations at Edward Jones: |
● Associates of Edward Jones and its affiliates and their family members who are in the same pricing group (as determined by Edward Jones under its policies and procedures) as the associate. This waiver will continue for the remainder of the associate’s life if the associate retires from Edward Jones in good-standing. |
● Shares purchased in an Edward Jones fee-based program. |
● Shares purchased through reinvestment of capital gains distributions and dividend reinvestment. |
● Shares purchased from the proceeds of redeemed shares of the same fund family so long as the following conditions are met: 1) the proceeds are from the sale of shares within 60 days of the purchase, and 2) the sale and purchase are made in the same share class and the same account or the purchase is made in an individual retirement account with proceeds from liquidations in anon-retirement account. |
● Shares exchanged into Class A shares from another share class so long as the exchange is into the same fund and was initiated at the discretion of Edward Jones. Edward Jones is responsible for any remaining CDSC due to the fund company, if applicable. Any future purchases are subject to the applicable sales charge as disclosed in the prospectus. |
● Exchanges from Class C shares to Class A shares of the same fund, generally, in the 84th month following the anniversary of the purchase date or earlier at the discretion of Edward Jones. |
| If the shareholder purchases shares that are subject to a CDSC and those shares are redeemed before the CDSC is expired, the shareholder is responsible to pay the CDSC except in the following conditions available at Edward Jones: |
● The death or disability of the shareholder. |
● Systematic withdrawals with up to 10% per year of the account value. |
● Return of excess contributions from an Individual Retirement Account (IRA). |
● Shares sold as part of a required minimum distribution for IRA and retirement accounts if the redemption is taken in or after the year the shareholder reaches qualified age based on applicable IRS regulation. |
● Shares sold to pay Edward Jones fees or costs in such cases where the transaction is initiated by Edward Jones. |
● Shares exchanged in an Edward Jones fee-based program. |
● Shares acquired through NAV reinstatement. |
36 | Wells Fargo Wisconsin Tax-Free Fund
Appendix I (unaudited)
| Other Important Information for accounts at Edward Jones: |
| Minimum Purchase Amounts |
● $250 initial purchase minimum |
● $50 subsequent purchase minimum |
| Minimum Balances |
| Edward Jones has the right to redeem at its discretion fund holdings with a balance of $250 or less. The following are examples of accounts that are not included in this policy: |
● A fee-based account held on an Edward Jones platform |
● A 529 account held on an Edward Jones platform |
● An account with an active systematic investment plan or letter of intent (LOI) |
| Changing Share Classes |
| At any time it deems necessary, Edward Jones has the authority to exchange at NAV a shareholder’s holdings in a fund to Class A shares. |
Wells Fargo Wisconsin Tax-Free Fund | 37
Effective June 1, 2020, shareholders purchasing Fund shares through an Oppenheimer & Co. Inc. (“Oppenheimer”) platform or account are eligible only for the following load waivers (front-end sales charge waivers and contingent deferred or back-end, sales charge waivers) and discounts, which may differ from those disclosed in the Fund’s Prospectus or SAI.
| Front-end Sales Load Waivers on Class A Shares available at Oppenheimer |
| Employer-sponsored retirement, deferred compensation and employee benefit plans (including health savings accounts) and trusts used to fund those plans, provided that the shares are not held in a commission-based brokerage account and shares are held for the benefit of the plan. |
| Shares purchased by or through a 529 Plan. |
| Shares purchased through an Oppenheimer affiliated investment advisory program. |
| Shares purchased through reinvestment of capital gains distributions and dividend reinvestment when purchasing shares of the same fund (but not any other fund within the fund family). |
| Shares purchased from the proceeds of redemptions within the same fund family, provided (1) the repurchase occurs within 90 days following the redemption, (2) the redemption and purchase occur in the same account, and (3) redeemed shares were subject to a front-end or deferred sales load (known as Rights of Restatement). |
| A shareholder in the Fund’s Class C shares will have their shares exchanged at net asset value to Class A shares (or the appropriate share class) of the Fund if the shares are no longer subject to a CDSC and the exchange is in line with the policies and procedures of Oppenheimer. |
| Employees and registered representatives of Oppenheimer or its affiliates and their family members. |
| Directors or Trustees of the Fund, and employees of the Fund’s investment adviser or any of its affiliates, as described in the Prospectus. |
| CDSC Waivers on A and C Shares available at Oppenheimer |
| Death or disability of the shareholder. |
| Shares sold as part of a systematic withdrawal plan as described in the Prospectus. |
| Return of excess contributions from an IRA Account. |
| Shares sold as part of a required minimum distribution for IRA and retirement accounts due to the shareholder reaching the qualified age based on applicable IRS regulations as described in the Prospectus. |
| Shares sold to pay Oppenheimer fees but only if the transaction is initiated by Oppenheimer. |
| Shares acquired through a right of reinstatement. |
| Front-end load Discounts Available at Oppenheimer: Breakpoints, Rights of Accumulation & Letters of Intent |
| Breakpoints as described in the Prospectus. |
| Rights of Accumulation (ROA), which entitle shareholders to breakpoint discounts, will be automatically calculated based on the aggregated holding of fund family assets held by accounts within the purchaser’s household at Oppenheimer. Eligible fund family assets not held at Oppenheimer may be included in the ROA calculation only if the shareholder notifies his or her financial advisor about such assets. |
38 | Wells Fargo Wisconsin Tax-Free Fund
Effective June 15, 2020, shareholders purchasing fund shares through a Robert W. Baird & Co. (“Baird”) platform or account will only be eligible for the following sales charge waivers (front-end sales charge waivers and CDSC waivers) and discounts, which may differ from those disclosed elsewhere in the Fund’s Prospectus or the SAI.
| Front-end Sales Load Waivers on Class A Shares available at Baird |
| Shares purchased through reinvestment of capital gains distributions and dividend reinvestment when purchasing share of the same fund. |
| Share purchase by employees and registers representatives of Baird or its affiliate and their family members as designated by Baird. |
| Shares purchase from the proceeds of redemptions within the same fund family, provided (1) the repurchase occurs within 90 days following the redemption, (2) the redemption and purchase occur in the same accounts, and (3) redeemed shares were subject to a front-end or deferred sales charge (known as rights of reinstatement). |
| A shareholder in the Funds Investor C Shares will have their share exchanged at net asset value to Investor A shares of the fund if the shares are no longer subject to CDSC and the exchange is in line with the policies and procedures of Baird. |
| Employer-sponsored retirement plans or charitable accounts in a transactional brokerage account at Baird, including 401(k) plans, 457 plans, employer-sponsored 403(b) plans, profit sharing and money purchase pension plans and defined benefit plans. For purposes of this provision, employer-sponsored retirement plans do not include SEP IRAs, Simple IRAs or SAR-SEPs. |
| CDSC Waivers on A and C Shares available at Baird |
| Shares sold due to death or disability of the shareholder. |
| Shares sold as part of a systematic withdrawal plan as described in the Fund’s Prospectus. |
| Shares bought due to returns of excess contributions from an IRA Account. |
| Shares sold as part of a required minimum distribution for IRA and retirement accounts due to the shareholder reaching age 72 as described in the Fund’s Prospectus. |
| Shares sold to pay Baird fees but only if the transaction is initiated by Baird. |
| Shares acquired through a right of reinstatement. |
| Front-end load Discounts Available at Baird: Breakpoint and/or Rights of Accumulation |
| Breakpoints as described in the Prospectus. |
| Rights of accumulations which entitles shareholders to breakpoint discounts will be automatically calculated based on the aggregated holding of fund family assets held by accounts within the purchaser’s household at Baird. Eligible fund family assets not held at Baird may be included in the rights of accumulations calculation only if the shareholder notifies his or her financial advisor about such assets. |
| Letters of Intent (LOI) allow for breakpoint discounts based on anticipated purchases within a fund family through Baird, over a 13-month period of time. |
Wells Fargo Wisconsin Tax-Free Fund | 39
This page is intentionally left blank.
For more information
More information about Wells Fargo Funds is available free upon request. To obtain literature, please write, visit the Fund’s website, or call:
Wells Fargo Funds
P.O. Box 219967
Kansas City, MO 64121-9967
Website: wfam.com
Individual investors: 1-800-222-8222
Retail investment professionals: 1-888-877-9275
Institutional investment professionals: 1-866-765-0778

This report and the financial statements contained herein are submitted for the general information of the shareholders of the Fund. If this report is used for promotional purposes, distribution of the report must be accompanied or preceded by a current prospectus. Before investing, please consider the investment objectives, risks, charges, and expenses of the investment. For a current prospectus and, if available, a summary prospectus, containing this information, call 1-800-222-8222 or visit the Fund’s website at wfam.com. Read the prospectus carefully before you invest or send money.
Wells Fargo Asset Management (WFAM) is the trade name for certain investment advisory/management firms owned by Wells Fargo & Company. These firms include but are not limited to Wells Capital Management Incorporated and Wells Fargo Funds Management, LLC. Certain products managed by WFAM entities are distributed by Wells Fargo Funds Distributor, LLC (a broker-dealer and Member FINRA).
This material is for general informational and educational purposes only and is NOT intended to provide investment advice or a recommendation of any kind—including a recommendation for any specific investment, strategy, or plan.
INVESTMENT PRODUCTS: NOT FDIC INSURED ◾ NO BANK GUARANTEE ◾ MAY LOSE VALUE
© 2020 Wells Fargo & Company. All rights reserved.
PAR-0720-00251 08-20
A259/AR259 06-20

Annual Report
June 30, 2020
Wells Fargo
Pennsylvania Tax-Free Fund
Beginning on January 1, 2021, as permitted by new regulations adopted by the Securities and Exchange Commission, paper copies of the Wells Fargo Funds’ annual and semi-annual shareholder reports issued after this date will no longer be sent by mail, unless you specifically request paper copies of the reports. Instead, the reports will be made available on the Funds’ website, and you will be notified by mail each time a report is posted and provided with a website address to access the report.
If you already elected to receive shareholder reports electronically, you will not be affected by this change and you need not take any action. You may elect to receive shareholder reports and other communications from the Fund electronically at any time by contacting your financial intermediary (such as a broker-dealer or bank) or, if you are a direct investor, by calling 1-800-222-8222 or by enrolling at wellsfargo.com/advantagedelivery.
You may elect to receive all future reports in paper free of charge. If you invest through a financial intermediary, you can contact your financial intermediary to request that you continue to receive paper copies of your shareholder reports; if you invest directly with the Fund, you can call 1-800-222-8222. Your election to receive reports in paper will apply to all Wells Fargo Funds held in your account with your financial intermediary or, if you are a direct investor, to all Wells Fargo Funds that you hold.
|
Reduce clutter. Save trees. |
Sign up for electronic delivery of prospectuses and shareholder reports at wellsfargo.com/advantagedelivery |
The views expressed and any forward-looking statements are as of June 30, 2020, unless otherwise noted, and are those of the Fund managers and/or Wells Fargo Asset Management. Discussions of individual securities, or the markets generally, or any Wells Fargo Fund are not intended as individual recommendations. Future events or results may vary significantly from those expressed in any forward-looking statements. The views expressed are subject to change at any time in response to changing circumstances in the market. Wells Fargo Asset Management and the Fund disclaim any obligation to publicly update or revise any views expressed or forward-looking statements.
INVESTMENT PRODUCTS: NOT FDIC INSURED ◾ NO BANK GUARANTEE ◾ MAY LOSE VALUE
Wells Fargo Pennsylvania Tax-Free Fund | 1
Letter to shareholders (unaudited)

Andrew Owen
President
Wells Fargo Funds
Dear Shareholder:
We are pleased to offer you this annual report for the Wells Fargo Pennsylvania Tax-Free Fund for the 12-month period that ended June 30, 2020. Global stock markets saw earlier gains erased in February and March as governments around the world took unprecedented measures to stop the spread of the coronavirus at the expense of short-term economic output. However, markets rebounded from April through June to offset much of the losses as central banks attempted to bolster capital markets and confidence. Fixed-income markets generally performed better, with most achieving gains. Overall U.S. markets surpassed their international peers, while U.S. large-cap equity, as measured by the Russell 1000® Index1, easily outperformed small caps, as measured by the Russell 2000® Index2, for the 12-month period.
For the 12-month period, fixed-income securities generally had positive total returns while non-U.S. equities had broad losses and U.S. stocks performed strongly despite sharp volatility since late February. For the period, U.S. stocks, based on the S&P 500 Index,3 gained 7.51%. International stocks, as measured by the MSCI ACWI ex USA Index (Net),4 returned -4.80%, while the MSCI EM Index (Net)5 performed slightly better, with a -3.39% return. For bond investors, the Bloomberg Barclays U.S. Aggregate Bond Index6 returned a robust 8.74%, the Bloomberg Barclays Global Aggregate ex-USD Index7 gained a modest 0.71%, and the Bloomberg Barclays Municipal Bond Index8 returned 4.45% while the ICE BofA U.S. High Yield Index9 lost 1.10%.
The fiscal year began on a positive note.
The 12-month period began with the U.S. equity market advancing to new highs in July 2019. U.S. President Donald Trump initially backed off of earlier tariff threats against Mexico and China. However, later in July, the U.S. reversed course and threatened to impose higher tariffs on China’s exports after talks failed. China responded with tariff threats of its own and devalued the renminbi, roiling global markets. Major U.S. stock market indices closed July with the worst weekly results of the year. Bond prices gained as Treasury yields fell to multiyear lows, and the yield curve inverted at multiple points along the 30-year arc, with shorter term yields higher than longer-term. At the end of July, the U.S. Federal Reserve (Fed) cut its federal funds rate by 0.25%.
In August, U.S.-China trade tensions continued with no signs of compromise. Evidence of a continued global economic slowdown mounted, and central banks in China, New Zealand,
| 1 | The Russell 1000® Index measures the performance of the 1,000 largest companies in the Russell 3000® Index, which represents approximately 92% of the total market capitalization of the Russell 3000® Index. You cannot invest directly in an index. |
| 2 | The Russell 2000® Index measures the performance of the 2,000 smallest companies in the Russell 3000® Index, which represents approximately 8% of the total market capitalization of the Russell 3000® Index. You cannot invest directly in an index. |
| 3 | The S&P 500 Index consists of 500 stocks chosen for market size, liquidity, and industry group representation. It is a market-value-weighted index with each stock’s weight in the index proportionate to its market value. You cannot invest directly in an index. |
| 4 | The Morgan Stanley Capital International (MSCI) All Country World Index (ACWI) ex USA Index (Net) is a free-float-adjusted market-capitalization-weighted index that is designed to measure the equity market performance of developed and emerging markets, excluding the United States. Source: MSCI. MSCI makes no express or implied warranties or representations and shall have no liability whatsoever with respect to any MSCI data contained herein. The MSCI data may not be further redistributed or used as a basis for other indices or any securities or financial products. This report is not approved, reviewed, or produced by MSCI. You cannot invest directly in an index. |
| 5 | The MSCI Emerging Markets (EM) Index (Net) is a free-float-adjusted market-capitalization-weighted index that is designed to measure equity market performance of emerging markets. You cannot invest directly in an index. |
| 6 | The Bloomberg Barclays U.S. Aggregate Bond Index is a broad-based benchmark that measures the investment-grade, U.S. dollar-denominated, fixed-rate taxable bond market, including Treasuries, government-related and corporate securities, mortgage-backed securities (agency fixed-rate and hybrid adjustable-rate mortgage pass-throughs), asset-backed securities, and commercial mortgage-backed securities. You cannot invest directly in an index. |
| 7 | The Bloomberg Barclays Global Aggregate ex-USD Index is an unmanaged index that provides a broad-based measure of the global investment-grade fixed-income markets excluding the U.S.-dollar-denominated debt market. You cannot invest directly in an index. |
| 8 | The Bloomberg Barclays Municipal Bond Index is an unmanaged index composed of long-term tax-exempt bonds with a minimum credit rating of Baa. You cannot invest directly in an index. |
| 9 | The ICE BofA U.S. High Yield Index is a market-capitalization-weighted index of domestic and Yankee high-yield bonds. The index tracks the performance of high-yield securities traded in the U.S. bond market. You cannot invest directly in an index. Copyright 2020. ICE Data Indices, LLC. All rights reserved. |
2 | Wells Fargo Pennsylvania Tax-Free Fund
Letter to shareholders (unaudited)
and Thailand cut interest rates. Industrial and manufacturing data declined in China, Canada, Japan, and Germany. Adding to global uncertainty, Italy’s prime minister resigned, many feared a crackdown in Hong Kong as protestors sustained their calls for reform, and U.K. Prime Minister Boris Johnson planned to suspend Parliament as Brexit’s deadline neared.
In the U.S., the Fed cut interest rates a second time in September. U.S. manufacturing data disappointed investors. The U.S. Congress announced it would pursue an impeachment investigation of President Trump. Meanwhile, the Brexit impasse showed no signs of resolution. Officials in China said that hitting the country’s economic growth goals for the year would be difficult considering the weight of tariffs and trade restrictions. Although the S&P 500 Index finished the third quarter with the best year-to-date returns in more than 20 years, concerns about future returns remained.
The fourth quarter started on a strong note, with U.S.-China trade tensions relaxing in October along with renewed optimism for a U.K. Brexit deal and positive macroeconomic data. The initial estimate of U.S. third-quarter gross domestic product (GDP) growth was a resilient 1.9% annualized rate, while the U.S. unemployment rate fell to a 50-year low of 3.5% in September. However, despite resilience among U.S. consumers, business confidence declined while manufacturing activity contracted. Concerned with a potential economic slowdown, the Fed lowered interest rates another quarter point in late October—its third rate cut in four months. This helped push the S&P 500 Index to a new all-time high while emerging market equities rallied and global bonds declined overall, reflecting a broad pickup in risk appetite.
Equity markets continued to rally in November despite ongoing geopolitical risks. Hopes for a U.S.-China trade deal buoyed investor confidence. U.S. business sentiment improved slightly, and manufacturing and services activity picked up. While consumer confidence and purchasing manager activity rose in the eurozone, China reported weakening manufacturing and consumer data. Bond yields rose marginally, leading to slightly negative returns for global government and investment-grade corporate bonds.
Financial markets ended 2019 with a boost from the U.S. and China accord on a Phase One trade deal. That, along with the landslide win by the pro-Brexit U.K. Conservative Party in a national election and ongoing central bank support, gave investors greater confidence. U.S. economic indicators were generally positive, with the exception of manufacturing activity and business confidence. Consumer confidence was resilient, fed by a robust labor market, tame inflation, and lower interest rates, which boosted housing affordability and stimulated homebuyer activity. The impeachment of President Trump had little impact on markets. Meanwhile, slowing Chinese economic activity, partly attributable to the trade war, led to further government stimulus at year-end through lower reserve ratios, allowing banks to lend more money.
The year-end rally continued in early January 2020. However, capital market volatility picked up sharply in late January on concerns over the potential impact of the coronavirus on the global economy and stock markets. With sentiment somewhat souring, perceived safe havens did well in January. The U.S. dollar and Japanese yen both rose, and government bonds outperformed equities. While the S&P 500 Index held its ground, emerging market equities tumbled, including those in Asia.
In February, the coronavirus became the major market focus. Fears of the virus’s impact on global growth led to expectations of increased global central bank monetary policy support. That led the 10-year U.S. Treasury yield to fall to an all-time low of 1.1% by the end of the month. Although equity markets initially shrugged off concerns about the outbreak, focusing instead on strong fourth-quarter earnings and improving business confidence in January, market sentiment turned sharply lower toward month-end and the S&P 500 Index lost 8.2% for the month. Oil prices tumbled as Russia and the Organization of the Petroleum Exporting countries compounded a major decline in oil demand with a brutal price war, partly aimed at dissuading further U.S. shale production. As a result, the price of West Texas Intermediate crude oil fell 13% in February.
Wells Fargo Pennsylvania Tax-Free Fund | 3
Letter to shareholders (unaudited)
“The global spread of the coronavirus led country after country to clamp down on social and business-related activity in order to contain the virus from causing even greater devastation and overwhelming health care systems.”
“Despite ongoing economic weakness and high levels of uncertainty on the containment of the coronavirus and the timing of an effective vaccine, financial markets continued to post widely positive returns in June.”
The global spread of the coronavirus led country after country to clamp down on social and business-related activity in order to contain the virus from causing even greater devastation and overwhelming health care systems. This abrupt stoppage of economic activity led to the sharp deceleration of global output, sending economies into a deep contraction. Central bank responses were swift, as they slashed interest rates and expanded quantitative easing programs to restore liquidity and confidence to the markets. In the U.S., the Fed introduced several new lending programs, funding investment-grade bonds, money market mutual funds, and commercial paper while purchasing Treasuries, mortgage-backed securities, and overnight repurchase agreements. Meanwhile, stock markets tumbled quickly into a bear market, ending the longest bull stock market in U.S. history.
Markets rebounded strongly in April, with the S&P 500 Index gaining 12.8% for the month and the MSCI ACWI ex USA Index (Net) returning 7.6%. The rebound was fueled by unprecedented government and central bank stimulus measures taken to buffer the economic damage created by mass shutdowns enacted in order to contain the virus’s spread. The U.S. economy contracted by an annualized 5.0% pace in the first quarter, with 30 million new unemployment insurance claims in six weeks. In the eurozone, first-quarter real GDP shrank 3.8%, with the composite April Flash Purchasing Managers’ Index, a monthly survey of purchasing managers, falling to an all-time low of 13.5. The European Central Bank expanded its quantitative easing to include the purchase of additional government bonds of countries with the greatest virus-related need, including Italy and Spain. China’s first-quarter GDP fell by 6.8% year over year. However, retail sales, production, and investment showed signs of recovery. Extreme oil-price volatility continued as global supply far exceeded demand.
In May, the equity market rebound continued, with the S&P 500 Index climbing a further 4.8%. European and Japanese stock markets also had monthly gains. Investors regained confidence on reports of early signs of success in human trials of a coronavirus vaccine. Growth stocks continued to outperform value stocks while returns on global government bonds were generally flat. In the U.S., a gap grew between the stock market rebound and devastating economic data points, including an April unemployment rate of 14.7%, the highest level since World War II. Purchasing managers’ indices continued to reflect weakening activity in May in both the manufacturing and services sectors. U.S. corporate earnings reports indicated a 14% year-over-year contraction in earnings from the first quarter of 2019. However, high demand for technology, driven by remote activity, helped maintain robust information technology sector earnings, which helped drive powerful well-known technology stocks higher.
Despite ongoing economic weakness and high levels of uncertainty on the containment of the coronavirus and the timing of an effective vaccine, financial markets continued to post widely positive returns in June. As economies reopened, there were hopeful signs. U.S. retail sales rose 17% in May while retail sales in the U.K. rebounded by 12%. However, year over year, sales remained depressed. Vitally important to market sentiment was the ongoing commitment by central banks globally to do all they can to provide economic support through liquidity and low borrowing costs. U.S. economic activity was aided by one-time $1,200 stimulus checks and $600 bonus weekly unemployment benefits due to expire at the end of July. However, unemployment remained in the double digits, easing somewhat from 14.7% in April to 11.1% in June. At period-end, numerous states reported alarming increases of coronavirus cases. China’s economic recovery picked up momentum in June, though it remained far from a full recovery.
4 | Wells Fargo Pennsylvania Tax-Free Fund
Letter to shareholders (unaudited)
Don’t let short-term uncertainty derail long-term investment goals.
Periods of investment uncertainty can present challenges, but experience has taught us that maintaining long-term investment goals can be an effective way to plan for the future. To help you create a sound strategy based on your personal goals and risk tolerance, Wells Fargo Funds offers more than 100 mutual funds spanning a wide range of asset classes and investment styles. Although diversification cannot guarantee an investment profit or prevent losses, we believe it can be an effective way to manage investment risk and potentially smooth out overall portfolio performance. We encourage investors to know their investments and to understand that appropriate levels of risk-taking may unlock opportunities.
Thank you for choosing to invest with Wells Fargo Funds. We appreciate your confidence in us and remain committed to helping you meet your financial needs.
Sincerely,

Andrew Owen
President
Wells Fargo Funds
|
For further information about your Fund, contact your investment professional, visit our website at wfam.com, or call us directly at 1-800-222-8222. |
Notice to Shareholders
At a meeting held on August 10-12, 2020, the Board of Trustees of the Fund approved a change to the Fund’s automatic conversion feature for Class C shares in order to shorten the required holding period from 10 to 8 years. As a result, on a monthly basis beginning November 5, 2020, Class C shares will convert automatically into Class A shares 8 years after the initial date of purchase or, if you acquired your Class C shares through an exchange or conversion from another share class, 8 years after the date you acquired your Class C shares. When Class C shares that you acquired through a purchase or exchange convert, any other Class C shares that you purchased with reinvested dividends and distributions also will convert into Class A shares on a pro rata basis.
Please note that a shorter holding period may apply depending on your intermediary. Please see “Appendix A—Sales Charge Reductions and Waivers for Certain Intermediaries” in the Fund’s prospectus for further information.
Wells Fargo Pennsylvania Tax-Free Fund | 5
Performance highlights (unaudited)
Investment objective
The Fund seeks current income exempt from federal income tax and Pennsylvania individual income tax.
Manager
Wells Fargo Funds Management, LLC
Subadviser
Wells Capital Management Incorporated
Portfolio managers
Bruce R. Johns
Robert J. Miller
Average annual total returns (%) as of June 30, 20201
| Including sales charge | Excluding sales charge | Expense ratios2 (%) | ||||||||||||||||||||||||||||||||
| Inception date | 1 year | 5 year | 10 year | 1 year | 5 year | 10 year | Gross | Net3 | ||||||||||||||||||||||||||
| Class A (EKVAX) | 12-27-1990 | -2.01 | 2.24 | 3.70 | 2.65 | 3.18 | 4.18 | 0.95 | 0.74 | |||||||||||||||||||||||||
| Class C (EKVCX) | 2-1-1993 | 0.89 | 2.41 | 3.40 | 1.89 | 2.41 | 3.40 | 1.70 | 1.49 | |||||||||||||||||||||||||
| Institutional Class (EKVYX) | 11-24-1997 | – | – | – | 2.91 | 3.43 | 4.44 | 0.62 | 0.49 | |||||||||||||||||||||||||
| Bloomberg Barclays Municipal Bond Index4 | – | – | – | – | 4.45 | 3.93 | 4.22 | – | – | |||||||||||||||||||||||||
| Bloomberg Barclays Pennsylvania Municipal Bond Index5 | – | – | – | – | 4.68 | 4.27 | 4.45 | – | – | |||||||||||||||||||||||||
Figures quoted represent past performance, which is no guarantee of future results, and do not reflect taxes that a shareholder may pay on an investment in a fund. Investment return and principal value of an investment will fluctuate so that an investor’s shares, when redeemed, may be worth more or less than their original cost. Performance shown without sales charges would be lower if sales charges were reflected. Current performance may be lower or higher than the performance data quoted, which assumes the reinvestment of dividends and capital gains. Current month-end performance is available on the Fund’s website, wfam.com.
Index returns do not include transaction costs associated with buying and selling securities, any mutual fund fees or expenses, or any taxes. It is not possible to invest directly in an index.
For Class A shares, the maximum front-end sales charge is 4.50%. For Class C shares, the maximum contingent deferred sales charge is 1.00%. Performance including a contingent deferred sales charge assumes the sales charge for the corresponding time period. Institutional Class shares are sold without a front-end sales charge or contingent deferred sales charge.
Bond values fluctuate in response to the financial condition of individual issuers, general market and economic conditions, and changes in interest rates. Changes in market conditions and government policies may lead to periods of heightened volatility in the bond market and reduced liquidity for certain bonds held by the Fund. In general, when interest rates rise, bond values fall and investors may lose principal value. Interest rate changes and their impact on the Fund and its share price can be sudden and unpredictable. The use of derivatives may reduce returns and/or increase volatility. Certain investment strategies tend to increase the total risk of an investment (relative to the broader market). The Fund is exposed to Pennsylvania municipal securities risk and high-yield securities risk. Consult the Fund’s prospectus for additional information on these and other risks. A portion of the Fund’s income may be subject to federal, state, and/or local income taxes or the Alternative Minimum Tax (AMT). Any capital gains distributions may be taxable.
Please see footnotes on page 7.
6 | Wells Fargo Pennsylvania Tax-Free Fund
Performance highlights (unaudited)
| Growth of $10,000 investment as of June 30, 20206 |
|
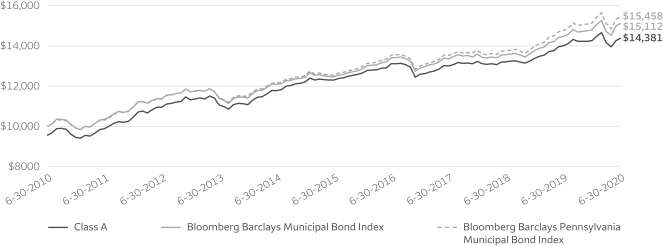
| 1 | Historical performance prior to July 12, 2010, is based on the performance of the Fund’s predecessor, Evergreen Pennsylvania Municipal Bond Fund. |
| 2 | Reflects the expense ratios as stated in the most recent prospectuses. The expense ratios shown are subject to change and may differ from the annualized expense ratios shown in the financial highlights of this report. |
| 3 | The manager has contractually committed through October 31, 2020, to waive fees and/or reimburse expenses to the extent necessary to cap total annual fund operating expenses after fee waivers at 0.74% for Class A, 1.49% for Class C, and 0.49% for Institutional Class. Brokerage commissions, stamp duty fees, interest, taxes, acquired fund fees and expenses (if any), and extraordinary expenses are excluded from the expense caps. Prior to or after the commitment expiration date, the caps may be increased or the commitment to maintain the caps may be terminated only with the approval of the Board of Trustees. Without these caps, the Fund’s returns would have been lower. The expense ratio paid by an investor is the net expense ratio (the total annual fund operating expenses after fee waivers) as stated in the prospectuses. |
| 4 | The Bloomberg Barclays Municipal Bond Index is an unmanaged index composed of long-term tax-exempt bonds with a minimum credit rating of Baa. You cannot invest directly in an index. |
| 5 | The Bloomberg Barclays Pennsylvania Municipal Bond Index is a Pennsylvania-specific total return index. The index is composed of Pennsylvania bonds. The bonds are all investment-grade, fixed-rate, long-term maturities (greater than two years) and are selected from issues larger than $50 million dated since January 1984. Bonds are added to the index and weighted and updated monthly, with a one-month lag. You cannot invest directly in an index. |
| 6 | The chart compares the performance of Class A shares for the most recent ten years with the Bloomberg Barclays Municipal Bond Index and the Bloomberg Barclays Pennsylvania Municipal Bond Index. The chart assumes a hypothetical $10,000 investment in Class A shares and reflects all operating expenses and assumes the maximum initial sales charge of 4.50%. |
| 7 | Amounts are calculated based on the long-term total investments of the Fund. These amounts are subject to change and may have changed since the date specified. |
| 8 | The credit quality distribution of portfolio holdings reflected in the chart is based on ratings from Standard & Poor’s, Moody’s Investors Service, and/or Fitch Ratings Ltd. Credit quality ratings apply to the underlying holdings of the Fund and not to the Fund itself. The percentages of the Fund’s portfolio with the ratings depicted in the chart are calculated based on the total market value of fixed income securities held by the Fund. If a security was rated by all three rating agencies, the middle rating was utilized. If rated by two of three rating agencies, the lower rating was utilized, and if rated by one of the rating agencies, that rating was utilized. Standard & Poor’s rates the creditworthiness of bonds, ranging from AAA (highest) to D (lowest). Ratings from A to CCC may be modified by the addition of a plus (+) or minus (-) sign to show relative standing within the rating categories. Standard & Poor’s rates the creditworthiness of short-term notes from SP-1 (highest) to SP-3 (lowest). Moody’s rates the creditworthiness of bonds, ranging from Aaa (highest) to C (lowest). Ratings Aa to B may be modified by the addition of a number 1 (highest) to 3 (lowest) to show relative standing within the ratings categories. Moody’s rates the creditworthiness of short-term U.S. tax-exempt municipal securities from MIG 1/VMIG 1 (highest) to SG (lowest). Fitch rates the creditworthiness of bonds, ranging from AAA (highest) to D (lowest). Credit quality distribution is subject to change and may have changed since the date specified. |
Wells Fargo Pennsylvania Tax-Free Fund | 7
Performance highlights (unaudited)
MANAGER’S DISCUSSION
Fund highlights
| ∎ | The Fund underperformed its benchmarks, the Bloomberg Barclays Municipal Bond Index and the Bloomberg Barclays Pennsylvania Municipal Bond Index, for the 12-month period that ended June 30, 2020. |
| ∎ | The Fund’s conservative duration positioning detracted from performance as rates rallied. Yield-curve positioning modestly detracted from performance as we were overweight the shortest bonds, which underperformed, and overweight intermediate bonds, which offered the best risk-adjusted returns. However, we were underweight the longest-maturity bonds, which performed the best. |
| ∎ | We were overweight AAA-rated and BBB-rated bonds, which underperformed, and underweight AA-rated and A-rated bonds, which outperformed. |
| ∎ | The Fund’s overweight to sectors in local general obligation (GO), education, and leasing bonds, which outperformed, contributed to performance. Security selection within industrial development revenue/pollution control revenue (IDR/PCR) and water/sewer bonds added to overall performance. |
| Effective maturity distribution as of June 30, 20207 |
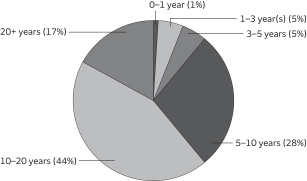 |
The coronavirus pandemic and the associated containment efforts became the dominant market influence over the 12-month period.
In 2019, market expectations moved the U.S. Federal Reserve (Fed) from a rate-hiking posture to multiple cuts in what was considered a “mid-cycle adjustment” at the time. Generally, positive U.S. economic data was enough for most investors to expect continued slow growth and an extension of the economic expansion. Global trade tensions prompted a rise in market volatility, which subsided with the passage of a Phase One U.S.-China trade deal late in the calendar year. President Trump was formally impeached and ultimately acquitted by the U.S. Senate. By March, the coronavirus pandemic brought an end to the longest bull market on record.
The municipal bond market was heavily influenced by technical factors throughout the reporting period. Municipal mutual funds saw 61 straight weeks of net inflows, which pushed yields across ratings categories to all-time lows by late February. Low yields and ample demand drove municipal issuance higher but also altered the mix. Taxable municipal bonds as a proportion of new-issue municipal debt was at its highest level since 2010 by period-end. Pandemic-related volatility and liquidity pressures prompted record-setting outflows from municipal bonds in March. Strong support by the Fed, including a Municipal Liquidity Facility and more than $2.5 trillion in fiscal stimulus, buoyed markets and bolstered investor confidence. Several weeks of consecutive positive net flows for municipal funds and strong demand for new bonds drove yields back near the lows for highly rated issues. The period ended with the Fed pledging to keep short rates low for the foreseeable future. The fundamental outlook for municipal issuers came into question as the path of recovery from the virus remains extraordinarily uncertain.
The State of Pennsylvania offers municipal bond investing opportunities.
The Commonwealth of Pennsylvania is rated Aa3 (stable), A+ (stable), and AA- (stable) by Moody’s Investors Service, Inc.; Standard & Poor’s Financial Services LLC; and Fitch Ratings Inc., respectively. Pennsylvania is the sixth-largest state by population, according to the U.S. Census Bureau, as well as by gross domestic product. Pennsylvania’s economy is diversified and stable in health care and higher education sectors, primarily in the cities of Philadelphia and Pittsburgh. We note that the state’s population, revenue, and employment growth have historically lagged national growth averages, although the growth gap has narrowed over the past couple of years. The outbreak of the coronavirus, the corresponding business closures, and other mitigation efforts had a significant impact on Pennsylvania’s economy and finances. The current unemployment rate mirrors that of the nation at 13.3% (as of May 31, 2020). We note that Pennsylvania will be receiving a disproportionately higher share of dollars from the federal government based on a much lower case volume than that of its neighboring states of New York and New Jersey. Pennsylvania has a very narrow rainy-day fund of approximately 1% of general fund expenditures. However, we note that the state’s Treasury has a long history of providing short-term borrowing to the state’s general fund, which mitigates short-term liquidity concerns. Pennsylvania ended fiscal-year 2019 with a small operating surplus, which has further reduced the
Please see footnotes on page 7.
8 | Wells Fargo Pennsylvania Tax-Free Fund
Performance highlights (unaudited)
structural imbalance. The state’s latest revenue assumptions portray a budget gap of roughly $4 billion for fiscal-year 2021 based on the previous year’s spending levels. The legislature recently passed a partial-year budget for 2021, including a full pension contribution payment. The state passed an on-time budget three years in a row, which we view as a decisive credit factor.
| Credit quality as of June 30, 20208 |
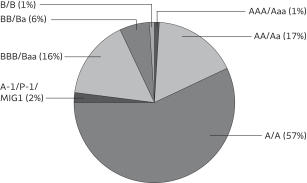 |
Conservative duration positioning, yield-curve positioning, credit quality, and security selection detracted from performance. while sector allocation benefited performance.
In anticipation of the Fed continuing to normalize rates, we kept the Fund’s duration short relative to its primary benchmark in the first half of the year, but when the coronavirus pandemic became a U.S. health threat in March 2020, we started extending duration as the Fed cut rates in response to the pandemic as the economy contracted and unemployment surged. With both the Congress Coronavirus Aid, Relief, and Economic Security Act and Treasury
supplying unprecedented liquidity to the market, all rates rallied across the curve. The Fund was still short to its primary benchmark at period-end, which detracted from performance. The Fund’s yield-curve positioning detracted slightly from performance. We were overweight short- and intermediate-term bonds, which underperformed, and underweight longer bonds, which outperformed. The credit-quality allocation was the largest single detractor from performance, as AAA-rated and BBB-rated bonds, which we are overweight, underperformed. AA-rated and A-rated bonds, which we are underweight, outperformed as the coronavirus pandemic disrupted and disjointed all markets. Lower-tier investment-grade credits deteriorated faster during the period. Credit spread widening affected BBB-rated and below-investment-grade credits more at year-end. Some of the worst-performing bonds were hospitals and universities rated A and BBB, including Allegheny County, Pennsylvania, Hospital Development Authority Revenue bonds-University of Pittsburgh Medical Center; Delaware County, Pennsylvania, Authority University Revenue Neumann University; and Allegheny County, Pennsylvania, Higher Educational Building Authority University Revenue bonds; and Duquesne University. Many of these revenue sector bonds are driven by a functioning economy purchasing services, which was essentially shut down during the stay-at-home orders. We would expect these bonds to continue to recover in pricing as the economy reopens and rebounds in the second half of 2020 and 2021.
Sector allocation contributed to performance overall, as we were overweight local GO bonds, leasing bonds, and education bonds, all of which outperformed, and we were underweight revenue bonds, which underperformed. While we got sector allocation correct, the bonds we held modestly underperformed, leading to subpar security selection as the market continues to recover. Some of the better-performing bonds for the year were Delaware Valley Regional Finance Authority, PA, (lease) bonds, Philadelphia Water and Wastewater revenue bonds, and local GO bonds for Central Dauphin PA School District (Education) bonds.
Going forward, we like lower-investment-grade credits and certain higher-yielding bonds as we believe investors are being compensated in credit spread premium. We plan to continue to extend the Fund’s duration with the expectation that the Fed will be on a pause in the second half of 2020 and into 2021 to stabilize the economy and support future growth.
Market technicals are driving performance. We believe issue selection remains a key driver in state-specific funds.
We believe the U.S. economy will rebound in the second half of 2020 at a slow pace, and the recovery will be uneven at times due to the coronavirus pandemic. Pennsylvania’s economy is slightly trailing the national average. The economy’s rebound will likely be choppy with the coronavirus making headlines with businesses opening and closing through the phased process. Prudent debt issuance discipline in cash flow notes should stabilize many municipalities along with continued management improvement. We expect the Fed to be on hold for the balance of 2020 and 2021 to support the recovery of economic growth. Some municipalities may do well, and others may continue to struggle. That is why we feel credit security selection and sector allocation will remain relevant. We expect to remain overweight lower-quality investment-grade bonds. We believe investors are being compensated, adding new investments in some of these areas. We expect to continue to remain overweight seasoned lower-quality investment-grade bonds in the portfolio. We believe the long-term drivers of valuations will be supply and demand trends, absolute yield levels, the shape of the yield curve, and credit fundamentals. We expect to continue to extend the Fund’s duration toward its benchmark as the cycle unfolds. We will monitor the economy to see how the recovery proceeds, with an eye on the technical market and fundamental credit quality to see if any changes are warranted in duration, yield-curve positioning, or credit-quality selections over the next year.
Please see footnotes on page 7.
Wells Fargo Pennsylvania Tax-Free Fund | 9
As a shareholder of the Fund, you incur two types of costs: (1) transaction costs, including sales charges (loads) on purchase payments and contingent deferred sales charges (if any) on redemptions and (2) ongoing costs, including management fees, distribution (12b-1) and/or shareholder servicing fees, and other Fund expenses. This example is intended to help you understand your ongoing costs (in dollars) of investing in the Fund and to compare these costs with the ongoing costs of investing in other mutual funds.
The example is based on an investment of $1,000 invested at the beginning of the six-month period and held for the entire period from January 1, 2020 to June 30, 2020.
Actual expenses
The “Actual” line of the table below provides information about actual account values and actual expenses. You may use the information in this line, together with the amount you invested, to estimate the expenses that you paid over the period. Simply divide your account value by $1,000 (for example, an $8,600 account value divided by $1,000 = 8.6), then multiply the result by the number in the “Actual” line under the heading entitled “Expenses paid during period” for your applicable class of shares to estimate the expenses you paid on your account during this period.
Hypothetical example for comparison purposes
The “Hypothetical” line of the table below provides information about hypothetical account values and hypothetical expenses based on the Fund’s actual expense ratio and an assumed rate of return of 5% per year before expenses, which is not the Fund’s actual return. The hypothetical account values and expenses may not be used to estimate the actual ending account balance or expenses you paid for the period. You may use this information to compare the ongoing costs of investing in the Fund and other funds. To do so, compare this 5% hypothetical example with the 5% hypothetical examples that appear in the shareholder reports of the other funds.
Please note that the expenses shown in the table are meant to highlight your ongoing costs only and do not reflect any transactional costs, such as sales charges (loads) and contingent deferred sales charges. Therefore, the “Hypothetical” line of the table is useful in comparing ongoing costs only and will not help you determine the relative total costs of owning different funds. In addition, if these transactional costs were included, your costs would have been higher.
| Beginning account value 1-1-2020 | Ending account value 6-30-2020 | Expenses paid during the period1 | Annualized net expense ratio | |||||||||||||
Class A | ||||||||||||||||
Actual | $ | 1,000.00 | $ | 1,007.97 | $ | 3.69 | 0.74 | % | ||||||||
Hypothetical (5% return before expenses) | $ | 1,000.00 | $ | 1,021.18 | $ | 3.72 | 0.74 | % | ||||||||
Class C | ||||||||||||||||
Actual | $ | 1,000.00 | $ | 1,004.20 | $ | 7.42 | 1.49 | % | ||||||||
Hypothetical (5% return before expenses) | $ | 1,000.00 | $ | 1,017.45 | $ | 7.47 | 1.49 | % | ||||||||
Institutional Class | ||||||||||||||||
Actual | $ | 1,000.00 | $ | 1,009.19 | $ | 2.45 | 0.49 | % | ||||||||
Hypothetical (5% return before expenses) | $ | 1,000.00 | $ | 1,022.43 | $ | 2.46 | 0.49 | % | ||||||||
| 1 | Expenses paid is equal to the annualized net expense ratio of each class multiplied by the average account value over the period, multiplied by the number of days in the most recent fiscal half-year divided by the number of days in the fiscal year (to reflect the one-half-year period). |
10 | Wells Fargo Pennsylvania Tax-Free Fund
Portfolio of investments—June 30, 2020
Interest rate | Maturity date | Principal | Value | |||||||||||||
| Municipal Obligations: 100.02% | ||||||||||||||||
Florida: 0.77% | ||||||||||||||||
| Industrial Development Revenue: 0.77% | ||||||||||||||||
Jacksonville FL Economic Development AMT Metropolitan Parking Solutions Project (ACA Insured) | 5.50 | % | 10-1-2030 | $ | 1,000,000 | $ | 1,003,190 | |||||||||
|
| |||||||||||||||
Guam: 0.48% | ||||||||||||||||
| Airport Revenue: 0.48% | ||||||||||||||||
Guam Port Authority AMT Series B | 5.00 | 7-1-2032 | 550,000 | 633,837 | ||||||||||||
|
| |||||||||||||||
Illinois: 0.79% | ||||||||||||||||
| Miscellaneous Revenue: 0.79% | ||||||||||||||||
Illinois Series D | 5.00 | 11-1-2021 | 1,000,000 | 1,029,690 | ||||||||||||
|
| |||||||||||||||
Pennsylvania: 97.98% | ||||||||||||||||
| Airport Revenue: 1.31% | ||||||||||||||||
Philadelphia PA Airport Refunding Bond AMT Series A | 5.00 | 6-15-2030 | 1,500,000 | 1,708,965 | ||||||||||||
|
| |||||||||||||||
| Education Revenue: 23.78% | ||||||||||||||||
Allegheny County PA Higher Education Robert Morris University | 5.00 | 10-15-2037 | 750,000 | 780,593 | ||||||||||||
Chester County PA IDA Avon Grove Charter School Project Refunding Bond Series A | 5.00 | 12-15-2047 | 1,160,000 | 1,242,743 | ||||||||||||
Chester County PA IDA Collegium Charter School Project Refunding Bond Series A | 5.00 | 10-15-2022 | 1,065,000 | 1,091,252 | ||||||||||||
Chester County PA IDA Collegium Charter School Project Series A | 5.13 | 10-15-2037 | 1,000,000 | 1,050,450 | ||||||||||||
Chester County PA IDA Renaissance Academy Charter School Project | 3.75 | 10-1-2024 | 600,000 | 616,944 | ||||||||||||
Delaware County PA IDA Chester Community Charter School Series A | 5.00 | 8-15-2020 | 635,000 | 635,184 | ||||||||||||
Lycoming County PA Authority Pennsylvania College of Technology | 5.50 | 7-1-2026 | 3,000,000 | 3,147,180 | ||||||||||||
Montgomery County PA Higher Education & Health Authority Refunding Bond Arcadia University | 5.00 | 4-1-2030 | 1,500,000 | 1,603,635 | ||||||||||||
North Eastern PA Hospital & Education Authority Refunding Bond Wilkes University Project Series B | 5.25 | 3-1-2037 | 1,000,000 | 1,037,950 | ||||||||||||
Pennsylvania HEFAR Shippensburg University Project | 6.00 | 10-1-2031 | 1,500,000 | 1,601,850 | ||||||||||||
Pennsylvania HEFAR Temple University First Series | 5.00 | 4-1-2032 | 1,000,000 | 1,081,470 | ||||||||||||
Pennsylvania Public School Building Authority Northampton County Area Community College Project | 5.50 | 3-1-2031 | 5,000,000 | 5,143,000 | ||||||||||||
Pennsylvania Public School Building Authority Northampton County Area Community College Project Series A (BAM Insured) | 5.00 | 6-15-2027 | 1,610,000 | 1,738,720 | ||||||||||||
Pennsylvania State University Refunding Bond Series B | 5.00 | 9-1-2034 | 2,175,000 | 2,636,753 | ||||||||||||
Philadelphia PA IDA 1st Philadelphia Preparatory Charter School Project Series A | 7.00 | 6-15-2033 | 1,000,000 | 1,119,900 | ||||||||||||
Philadelphia PA IDA Global Leadership Academy Project | 5.13 | 11-15-2020 | 270,000 | 271,836 | ||||||||||||
Philadelphia PA IDA Global Leadership Academy Project | 5.75 | 11-15-2030 | 1,000,000 | 1,006,410 | ||||||||||||
Philadelphia PA IDA Independence Charter School Project | 5.00 | 6-15-2039 | 250,000 | 253,988 | ||||||||||||
Philadelphia PA IDA La Salle University | 5.00 | 5-1-2036 | 1,355,000 | 1,403,834 | ||||||||||||
Philadelphia PA IDA Tacony Academy Charter School Project | 6.88 | 6-15-2033 | 1,000,000 | 1,082,480 | ||||||||||||
Philadelphia PA IDA Temple University 1st Series 2016 | 5.00 | 4-1-2029 | 1,000,000 | 1,167,920 | ||||||||||||
Philadelphia PA IDA West Philadelphia Achievement Charter Elementary School Project | 7.50 | 5-1-2031 | 1,285,000 | 1,326,621 | ||||||||||||
| 31,040,713 | ||||||||||||||||
|
| |||||||||||||||
| GO Revenue: 17.53% | ||||||||||||||||
Central Dauphin PA School District | 5.00 | 2-1-2037 | 2,075,000 | 2,440,283 | ||||||||||||
Coatesville PA Area School District CAB Series C (BAM Insured) %%¤ | 0.00 | 10-1-2033 | 1,000,000 | 611,160 | ||||||||||||
The accompanying notes are an integral part of these financial statements.
Wells Fargo Pennsylvania Tax-Free Fund | 11
Portfolio of investments—June 30, 2020
Interest rate | Maturity date | Principal | Value | |||||||||||||
| GO Revenue (continued) | ||||||||||||||||
Downingtown PA Area School District Series C ## | 5.00 | % | 8-1-2032 | $ | 1,000,000 | $ | 1,243,700 | |||||||||
Erie PA City School District Limited Tax Series A (AGM Insured) | 5.00 | 4-1-2034 | 515,000 | 651,413 | ||||||||||||
North Allegheny PA School District | 5.00 | 5-1-2030 | 100,000 | 132,821 | ||||||||||||
North Allegheny PA School District | 5.00 | 5-1-2031 | 290,000 | 382,562 | ||||||||||||
North Pocono PA School District Refunding Notes Series A (AGM Insured)%% | 4.00 | 9-15-2031 | 890,000 | 1,030,211 | ||||||||||||
Penn-Delco PA School District | 4.00 | 6-1-2045 | 1,000,000 | 1,111,680 | ||||||||||||
Philadelphia PA Refunding Bond Series A | 5.25 | 7-15-2033 | 1,500,000 | 1,724,955 | ||||||||||||
Philadelphia PA School District Refunding Bond Series A (AGM/FGIC Insured) | 5.00 | 6-1-2024 | 1,410,000 | 1,624,644 | ||||||||||||
Philadelphia PA School District Refunding Bond Series C | 5.00 | 9-1-2021 | 1,395,000 | 1,461,555 | ||||||||||||
Philadelphia PA School District Series B | 5.00 | 9-1-2043 | 1,235,000 | 1,475,319 | ||||||||||||
Philadelphia PA Series A | 5.00 | 8-1-2036 | 1,250,000 | 1,511,788 | ||||||||||||
Pittsburgh PA (BAM Insured) | 5.00 | 9-1-2030 | 500,000 | 583,965 | ||||||||||||
Pittsburgh PA Moon Area School District Series A | 5.00 | 11-15-2029 | 1,445,000 | 1,693,988 | ||||||||||||
Reading PA School District Series A (AGM Insured) | 5.00 | 2-1-2033 | 1,500,000 | 1,753,800 | ||||||||||||
West Mifflin PA Area School District (AGM Insured) | 5.00 | 4-1-2028 | 1,000,000 | 1,227,420 | ||||||||||||
West Shore PA School District | 5.00 | 11-15-2048 | 1,500,000 | 1,783,830 | ||||||||||||
Wilkes-Barre School District Luzerne County PA Series 2019 (BAM Insured) | 5.00 | 4-15-2027 | 100,000 | 124,817 | ||||||||||||
Wilkes-Barre School District Luzerne County PA Series 2019 (BAM Insured) | 5.00 | 4-15-2028 | 120,000 | 153,206 | ||||||||||||
Wilkes-Barre School District Luzerne County PA Series 2019 (BAM Insured) | 5.00 | 4-15-2029 | 50,000 | 65,218 | ||||||||||||
Wilkes-Barre School District Luzerne County PA Series 2019 (BAM Insured) | 5.00 | 4-15-2030 | 70,000 | 90,780 | ||||||||||||
| 22,879,115 | ||||||||||||||||
|
| |||||||||||||||
| Health Revenue: 18.79% | ||||||||||||||||
Allegheny County PA Hospital Development Authority Allegheny Health Network | 4.00 | 4-1-2044 | 1,810,000 | 1,956,936 | ||||||||||||
Allegheny County PA Hospital Development Authority Health Center Series B (National Insured) | 6.00 | 7-1-2027 | 1,800,000 | 2,326,464 | ||||||||||||
Berks County PA IDA Tower Health Project | 5.00 | 11-1-2037 | 1,930,000 | 2,184,238 | ||||||||||||
Bucks County PA IDA St. Lukes University Health Network | 4.00 | 8-15-2050 | 400,000 | 429,420 | ||||||||||||
Cumberland County PA Municipal Authority Diakon Lutheran Ministries Project | 5.00 | 1-1-2028 | 2,090,000 | 2,207,960 | ||||||||||||
Dauphin County PA General Authority Pinnacle Health System Project | 5.00 | 6-1-2042 | 500,000 | 530,945 | ||||||||||||
Dauphin County PA General Authority Pinnacle Health System Project Series A | 5.00 | 6-1-2035 | 1,000,000 | 1,152,810 | ||||||||||||
Doylestown PA Hospital Authority Doylestown Hospital Series A | 5.00 | 7-1-2049 | 250,000 | 276,385 | ||||||||||||
East Hempfield Township PA IDA Willow Valley Communities Project Refunding Bond | 5.00 | 12-1-2028 | 450,000 | 513,725 | ||||||||||||
East Hempfield Township PA IDA Willow Valley Communities Project Refunding Bond | 5.00 | 12-1-2029 | 375,000 | 426,870 | ||||||||||||
Geisinger PA Health System Series A-1 | 4.00 | 4-1-2050 | 1,000,000 | 1,114,540 | ||||||||||||
Lancaster County PA Hospital Authority Healthcare Facilities Moravian Manors Incorporated Project | 2.88 | 12-15-2023 | 500,000 | 481,395 | ||||||||||||
Lancaster County PA Hospital Authority St. Annes Retirement Community Incorporated | 5.00 | 3-1-2045 | 500,000 | 500,315 | ||||||||||||
Montgomery County PA IDA ACTS Retirement Life Communities %% | 5.00 | 11-15-2045 | 1,000,000 | 1,151,220 | ||||||||||||
Montgomery County PA IDA Jefferson Health System Series A | 5.00 | 10-1-2027 | 1,000,000 | 1,082,390 | ||||||||||||
Montgomery County PA IDA Waverly Heights Limited Project | 5.00 | 12-1-2044 | 1,000,000 | 1,073,330 | ||||||||||||
Northampton County PA St. Luke’s Hospital of Bethlehem Series A | 5.00 | 8-15-2033 | 1,435,000 | 1,555,856 | ||||||||||||
Pennsylvania Economic Development Financing Authority Series A-1 | 4.00 | 4-15-2037 | 700,000 | 785,911 | ||||||||||||
Pennsylvania Higher Educational University Pennsylvania Health System Series A | 5.00 | 8-15-2047 | 1,500,000 | 1,770,780 | ||||||||||||
South Central Pennsylvania General Authority WellSpan Health Obligated Group Series 2019E (U.S. Bank NA SPA) ø | 0.13 | 6-1-2035 | 3,000,000 | 3,000,000 | ||||||||||||
| 24,521,490 | ||||||||||||||||
|
| |||||||||||||||
The accompanying notes are an integral part of these financial statements.
12 | Wells Fargo Pennsylvania Tax-Free Fund
Portfolio of investments—June 30, 2020
Interest rate | Maturity date | Principal | Value | |||||||||||||
| Housing Revenue: 0.63% | ||||||||||||||||
Chester County PA IDA University Student Housing LLC Project Series A | 5.00 | % | 8-1-2030 | $ | 555,000 | $ | 574,364 | |||||||||
Pennsylvania Housing Finance Agency Single-Family Mortgage Revenue Series 112 | 5.00 | 4-1-2028 | 245,000 | 249,817 | ||||||||||||
| 824,181 | ||||||||||||||||
|
| |||||||||||||||
| Miscellaneous Revenue: 18.87% | ||||||||||||||||
Butler County General Authority Hampton Township School District Project Series 2007 (AGM Insured, PNC Bank NA SPA) ø | 0.11 | 9-1-2027 | 2,000,000 | 2,000,000 | ||||||||||||
Delaware County PA Authority Neumann University Refunding Bond | 5.00 | 10-1-2031 | 1,500,000 | 1,483,380 | ||||||||||||
Delaware County PA Vocational & Technical School Authority (BAM Insured) | 5.25 | 11-1-2033 | 1,000,000 | 1,138,810 | ||||||||||||
Delaware Valley Regional Finance Authority Pennsylvania Local Government Series A (Ambac Insured) | 5.50 | 8-1-2028 | 3,980,000 | 5,147,530 | ||||||||||||
Pennsylvania Certificate of Participation Series A | 5.00 | 7-1-2038 | 1,000,000 | 1,223,990 | ||||||||||||
Pennsylvania Financing Authority Pennsylvania Hills Project CAB Series B (National Insured) ¤ | 0.00 | 12-1-2022 | 1,200,000 | 1,168,080 | ||||||||||||
Pennsylvania Financing Authority Pennsylvania Hills Project CAB Series B (National Insured) ¤ | 0.00 | 12-1-2023 | 3,790,000 | 3,634,800 | ||||||||||||
Pennsylvania Public School Building Authority Chester Upland School District Project Series B | 5.25 | 9-15-2030 | 540,000 | 676,431 | ||||||||||||
Pennsylvania Public School Building Authority Chester Upland School District Project Series C (AGM Insured) | 5.00 | 9-15-2026 | 875,000 | 918,969 | ||||||||||||
Pennsylvania Public School Building Authority Series B-2 (BAM Insured) | 5.00 | 12-1-2027 | 1,010,000 | 1,167,570 | ||||||||||||
Pennsylvania Turnpike Commission Series A (AGM Insured) | 5.25 | 7-15-2021 | 2,000,000 | 2,103,420 | ||||||||||||
Philadelphia PA IDA City Agreement Green Bond Museum Art Energy Saving Program Series A | 5.00 | 2-15-2038 | 785,000 | 953,932 | ||||||||||||
Philadelphia PA IDA Refunding Bond Cultural & Commercial Corridors Program Series A | 5.00 | 12-1-2028 | 2,500,000 | 3,019,023 | ||||||||||||
| 24,635,935 | ||||||||||||||||
|
| |||||||||||||||
| Tax Revenue: 4.68% | ||||||||||||||||
Allegheny County PA Port Authority Refunding Bond | 5.75 | 3-1-2029 | 3,000,000 | 3,100,950 | ||||||||||||
Pittsburgh & Allegheny Counties PA Sports & Exhibition Authority (AGM Insured) | 5.00 | 2-1-2031 | 3,000,000 | 3,006,090 | ||||||||||||
| 6,107,040 | ||||||||||||||||
|
| |||||||||||||||
| Transportation Revenue: 6.81% | ||||||||||||||||
Delaware River PA Joint Toll Bridge Commission | 5.00 | 7-1-2042 | 580,000 | 706,133 | ||||||||||||
Lancaster PA Parking Authority Series A (BAM Insured) | 4.00 | 9-1-2038 | 1,000,000 | 1,126,600 | ||||||||||||
Pennsylvania Turnpike Commission Series A-1 | 5.00 | 12-1-2047 | 1,000,000 | 1,163,260 | ||||||||||||
Pennsylvania Turnpike Commission Series A-2 | 5.00 | 12-1-2048 | 2,000,000 | 2,363,100 | ||||||||||||
Pennsylvania Turnpike Commission Subordinate Bond Series A | 5.50 | 12-1-2042 | 3,000,000 | 3,531,630 | ||||||||||||
| 8,890,723 | ||||||||||||||||
|
| |||||||||||||||
| Water & Sewer Revenue: 5.58% | ||||||||||||||||
Capital Region Pennsylvania Water & Sewer System Refunding Bond | 5.00 | 7-15-2037 | 1,000,000 | 1,208,120 | ||||||||||||
Lehigh County PA General Purpose Authority CAB Allentown Project ¤ | 0.00 | 12-1-2030 | 2,000,000 | 1,634,300 | ||||||||||||
Luzerne County PA IDA Refunding Bond AMT Pennsylvania American Water Company Project | 2.45 | 12-1-2039 | 500,000 | 541,025 | ||||||||||||
Pennsylvania Commonwealth Financing Authority Refunding Bond Series B | 5.00 | 6-1-2031 | 250,000 | 339,000 | ||||||||||||
Pennsylvania Commonwealth Financing Authority Series B | 5.00 | 6-1-2026 | 1,000,000 | 1,088,010 | ||||||||||||
Philadelphia PA Water & Wastewater Refunding Bond Series A | 5.00 | 10-1-2038 | 2,000,000 | 2,474,460 | ||||||||||||
| 7,284,915 | ||||||||||||||||
|
| |||||||||||||||
| 127,893,077 | ||||||||||||||||
|
| |||||||||||||||
Total Municipal Obligations (Cost $122,581,020) |
| 130,559,794 | ||||||||||||||
|
| |||||||||||||||
The accompanying notes are an integral part of these financial statements.
Wells Fargo Pennsylvania Tax-Free Fund | 13
Portfolio of investments—June 30, 2020
| Yield | Shares | Value | ||||||||||||||
| Short-Term Investments: 1.20% | ||||||||||||||||
| Investment Companies: 1.20% | ||||||||||||||||
Wells Fargo Municipal Cash Management Money Market Fund Institutional Class (l)(u)## | 0.10 | % | 1,562,665 | $ | 1,563,134 | |||||||||||
|
| |||||||||||||||
Total Short-Term Investments (Cost $1,563,035) |
| 1,563,134 | ||||||||||||||
|
| |||||||||||||||
| Total investments in securities (Cost $124,144,055) | 101.22 | % | 132,122,928 | |||||
Other assets and liabilities, net | (1.22 | ) | (1,587,479 | ) | ||||
|
|
|
| |||||
| Total net assets | 100.00 | % | $ | 130,535,449 | ||||
|
|
|
| |||||
| %% | The security is purchased on a when-issued basis. |
| ¤ | The security is issued in zero coupon form with no periodic interest payments. |
| ## | All or a portion of this security is segregated for when-issued securities. |
| ø | Variable rate demand notes are subject to a demand feature which reduces the effective maturity. The maturity date shown represents the final maturity date of the security. The interest rate is determined and reset by the issuer daily, weekly, or monthly depending upon the terms of the security. The rate shown is the rate in effect at period end. |
| (l) | The issuer of the security is an affiliated person of the Fund as defined in the Investment Company Act of 1940. |
| (u) | The rate represents the 7-day annualized yield at period end. |
Abbreviations:
| ACA | ACA Financial Guaranty Corporation |
| AGM | Assured Guaranty Municipal |
| Ambac | Ambac Financial Group Incorporated |
| AMT | Alternative minimum tax |
| BAM | Build America Mutual Assurance Company |
| CAB | Capital appreciation bond |
| FGIC | Financial Guaranty Insurance Corporation |
| GO | General obligation |
| HEFAR | Higher Education Facilities Authority Revenue |
| IDA | Industrial Development Authority |
| National | National Public Finance Guarantee Corporation |
| SPA | Standby purchase agreement |
Investments in Affiliates
An affiliated investment is an investment in which the Fund owns at least 5% of the outstanding voting shares of the issuer or as a result of other relationships, such as the Fund and the issuer having the same investment manager. Transactions with issuers that were either affiliated persons of the Fund at the beginning of the period or the end of the period were as follows:
| Value, beginning of period | Purchases | Sales proceeds | Net realized gains (losses) | Net change in unrealized gains (losses) | Income from affiliated securities | Value, end of period | % of net assets | |||||||||||||||||||||||||
| Short-Term Investments | ||||||||||||||||||||||||||||||||
Investment Companies | ||||||||||||||||||||||||||||||||
Wells Fargo Municipal Cash Management Money Market Fund Institutional Class | $ | 929,302 | $ | 29,120,292 | $ | (28,486,788 | ) | $ | 231 | $ | 97 | $ | 17,248 | $ | 1,563,134 | 1.20 | % | |||||||||||||||
The accompanying notes are an integral part of these financial statements.
14 | Wells Fargo Pennsylvania Tax-Free Fund
Statement of assets and liabilities—June 30, 2020
Assets | ||||
Investments in unaffiliated securities, at value (cost $122,581,020) | $ | 130,559,794 | ||
Investments in affiliated securities, at value (cost $1,563,035) | 1,563,134 | |||
Receivable for Fund shares sold | 5,438 | |||
Receivable for interest | 1,429,605 | |||
Prepaid expenses and other assets | 11,260 | |||
|
| |||
Total assets | 133,569,231 | |||
|
| |||
Liabilities | ||||
Payable for investments purchased | 2,761,748 | |||
Payable for Fund shares redeemed | 79,445 | |||
Management fee payable | 26,476 | |||
Dividends payable | 121,205 | |||
Administration fees payable | 11,819 | |||
Distribution fee payable | 5,160 | |||
Trustees’ fees and expenses payable | 3,415 | |||
Accrued expenses and other liabilities | 24,514 | |||
|
| |||
Total liabilities | 3,033,782 | |||
|
| |||
Total net assets | $ | 130,535,449 | ||
|
| |||
Net assets consist of | ||||
Paid-in capital | $ | 123,371,785 | ||
Total distributable earnings | 7,163,664 | |||
|
| |||
Total net assets | $ | 130,535,449 | ||
|
| |||
Computation of net asset value and offering price per share | ||||
Net assets – Class A | $ | 41,549,512 | ||
Shares outstanding – Class A1 | 3,536,932 | |||
Net asset value per share – Class A | $11.75 | |||
Maximum offering price per share – Class A2 | $12.30 | |||
Net assets – Class C | $ | 8,394,331 | ||
Shares outstanding – Class C1 | 715,838 | |||
Net asset value per share – Class C | $11.73 | |||
Net assets – Institutional Class | $ | 80,591,606 | ||
Shares outstanding – Institutional Class1 | 6,860,173 | |||
Net asset value per share – Institutional Class | $11.75 | |||
| 1 | The Fund has an unlimited number of authorized shares. |
| 2 | Maximum offering price is computed as 100/95.50 of net asset value. On investments of $50,000 or more, the offering price is reduced. |
The accompanying notes are an integral part of these financial statements.
Wells Fargo Pennsylvania Tax-Free Fund | 15
Statement of operations—year ended June 30, 2020
Investment income | ||||
Interest | $ | 4,800,714 | ||
Income from affiliated securities | 17,248 | |||
|
| |||
Total investment income | 4,817,962 | |||
|
| |||
Expenses | ||||
Management fee | 525,544 | |||
Administration fees |
| |||
Class A | 65,167 | |||
Class C | 13,881 | |||
Institutional Class | 65,585 | |||
Shareholder servicing fees |
| |||
Class A | 101,686 | |||
Class C | 21,689 | |||
Distribution fee |
| |||
Class C | 64,995 | |||
Custody and accounting fees | 12,662 | |||
Professional fees | 51,264 | |||
Registration fees | 70,588 | |||
Shareholder report expenses | 31,401 | |||
Trustees’ fees and expenses | 21,541 | |||
Other fees and expenses | 21,504 | |||
|
| |||
Total expenses | 1,067,507 | |||
Less: Fee waivers and/or expense reimbursements |
| |||
Fund-level | (196,294 | ) | ||
Class A | (33,287 | ) | ||
Class C | (6,907 | ) | ||
|
| |||
Net expenses | 831,019 | |||
|
| |||
Net investment income | 3,986,943 | |||
|
| |||
Realized and unrealized gains (losses) on investments | ||||
Net realized gains (losses) on |
| |||
Unaffiliated securities | (262,419 | ) | ||
Affiliated securities | 231 | |||
|
| |||
Net realized losses on investments | (262,188 | ) | ||
|
| |||
Net change in unrealized gains (losses) on |
| |||
Unaffiliated securities | (211,546 | ) | ||
Affiiliated securities | 97 | |||
|
| |||
Net change in unrealized gains (losses) on investments | (211,449 | ) | ||
|
| |||
Net realized and unrealized gains (losses) on investments | (473,637 | ) | ||
|
| |||
Net increase in net assets resulting from operations | $ | 3,513,306 | ||
|
| |||
The accompanying notes are an integral part of these financial statements.
16 | Wells Fargo Pennsylvania Tax-Free Fund
Statement of changes in net assets
| Year ended June 30, 2020 | Year ended June 30, 2019 | |||||||||||||||
Operations |
| |||||||||||||||
Net investment income | $ | 3,986,943 | $ | 4,173,389 | ||||||||||||
Net realized gains (losses) on investments | (262,188 | ) | 922,543 | |||||||||||||
Net change in unrealized gains (losses) on investments | (211,449 | ) | 2,670,920 | |||||||||||||
|
| |||||||||||||||
Net increase in net assets resulting from operations | 3,513,306 | 7,766,852 | ||||||||||||||
|
| |||||||||||||||
Distributions to shareholders from | ||||||||||||||||
Net investment income and net realized gains | ||||||||||||||||
Class A | (1,173,120 | ) | (1,201,265 | ) | ||||||||||||
Class C | (184,695 | ) | (249,698 | ) | ||||||||||||
Institutional Class | (2,565,155 | ) | (2,668,988 | ) | ||||||||||||
Tax basis return of capital | ||||||||||||||||
Class A | 0 | (93,277 | ) | |||||||||||||
Class C | 0 | (25,736 | ) | |||||||||||||
Institutional Class | 0 | (191,507 | ) | |||||||||||||
|
| |||||||||||||||
Total distributions to shareholders | (3,922,970 | ) | (4,430,471 | ) | ||||||||||||
|
| |||||||||||||||
Capital share transactions | Shares | Shares | ||||||||||||||
Proceeds from shares sold | ||||||||||||||||
Class A | 488,464 | 5,729,161 | 523,363 | 6,021,000 | ||||||||||||
Class C | 101,019 | 1,188,807 | 72,566 | 834,358 | ||||||||||||
Institutional Class | 1,171,692 | 13,830,091 | 483,892 | 5,555,083 | ||||||||||||
|
| |||||||||||||||
| 20,748,059 | 12,410,441 | |||||||||||||||
|
| |||||||||||||||
Reinvestment of distributions |
| |||||||||||||||
Class A | 92,310 | 1,090,759 | 104,956 | 1,208,144 | ||||||||||||
Class C | 14,791 | 174,514 | 22,977 | 263,459 | ||||||||||||
Institutional Class | 88,777 | 1,048,900 | 94,002 | 1,081,975 | ||||||||||||
|
| |||||||||||||||
| 2,314,173 | 2,553,578 | |||||||||||||||
|
| |||||||||||||||
Payment for shares redeemed |
| |||||||||||||||
Class A | (544,701 | ) | (6,432,927 | ) | (670,936 | ) | (7,708,019 | ) | ||||||||
Class C | (145,323 | ) | (1,715,156 | ) | (523,498 | ) | (5,993,137 | ) | ||||||||
Institutional Class | (1,114,671 | ) | (13,119,929 | ) | (1,589,650 | ) | (18,215,765 | ) | ||||||||
|
| |||||||||||||||
| (21,268,012 | ) | (31,916,921 | ) | |||||||||||||
|
| |||||||||||||||
Net increase (decrease) in net assets resulting from capital share transactions | 1,794,220 | (16,952,902 | ) | |||||||||||||
|
| |||||||||||||||
Total increase (decrease) in net assets | 1,384,556 | (13,616,521 | ) | |||||||||||||
|
| |||||||||||||||
Net assets | ||||||||||||||||
Beginning of period | 129,150,893 | 142,767,414 | ||||||||||||||
|
| |||||||||||||||
End of period | $ | 130,535,449 | $ | 129,150,893 | ||||||||||||
|
| |||||||||||||||
The accompanying notes are an integral part of these financial statements.
Wells Fargo Pennsylvania Tax-Free Fund | 17
(For a share outstanding throughout each period)
| Year ended June 30 | ||||||||||||||||||||
| CLASS A | 2020 | 2019 | 2018 | 2017 | 2016 | |||||||||||||||
Net asset value, beginning of period | $11.78 | $11.48 | $11.67 | $12.13 | $11.75 | |||||||||||||||
Net investment income | 0.35 | 0.35 | 0.38 | 0.36 | 0.38 | |||||||||||||||
Net realized and unrealized gains (losses) on investments | (0.04 | ) | 0.32 | (0.19 | ) | (0.46 | ) | 0.38 | ||||||||||||
|
|
|
|
|
|
|
|
|
| |||||||||||
Total from investment operations | 0.31 | 0.67 | 0.19 | (0.10 | ) | 0.76 | ||||||||||||||
Distributions to shareholders from | ||||||||||||||||||||
Net investment income | (0.34 | ) | (0.34 | ) | (0.38 | ) | (0.36 | ) | (0.38 | ) | ||||||||||
Tax basis return of capital | 0.00 | (0.03 | ) | 0.00 | 0.00 | 0.00 | ||||||||||||||
|
|
|
|
|
|
|
|
|
| |||||||||||
Total distributions to shareholders | (0.34 | ) | (0.37 | ) | (0.38 | ) | (0.36 | ) | (0.38 | ) | ||||||||||
Net asset value, end of period | $11.75 | $11.78 | $11.48 | $11.67 | $12.13 | |||||||||||||||
Total return1 | 2.65 | % | 6.00 | % | 1.62 | % | (0.83 | )% | 6.62 | % | ||||||||||
Ratios to average net assets (annualized) | ||||||||||||||||||||
Gross expenses | 0.97 | % | 0.96 | % | 0.91 | % | 0.90 | % | 0.90 | % | ||||||||||
Net expenses | 0.74 | % | 0.74 | % | 0.74 | % | 0.74 | % | 0.74 | % | ||||||||||
Net investment income | 2.92 | % | 3.07 | % | 3.25 | % | 3.02 | % | 3.23 | % | ||||||||||
Supplemental data | ||||||||||||||||||||
Portfolio turnover rate | 14 | % | 9 | % | 10 | % | 20 | % | 13 | % | ||||||||||
Net assets, end of period (000s omitted) | $41,550 | $41,255 | $40,664 | $45,381 | $55,352 | |||||||||||||||
| 1 | Total return calculations do not include any sales charges. |
The accompanying notes are an integral part of these financial statements.
18 | Wells Fargo Pennsylvania Tax-Free Fund
Financial highlights
(For a share outstanding throughout each period)
| Year ended June 30 | ||||||||||||||||||||
| CLASS C | 2020 | 2019 | 2018 | 2017 | 2016 | |||||||||||||||
Net asset value, beginning of period | $11.76 | $11.45 | $11.65 | $12.11 | $11.73 | |||||||||||||||
Net investment income | 0.27 | 0.26 | 1 | 0.29 | 1 | 0.27 | 1 | 0.29 | 1 | |||||||||||
Net realized and unrealized gains (losses) on investments | (0.05 | ) | 0.34 | (0.20 | ) | (0.46 | ) | 0.38 | ||||||||||||
|
|
|
|
|
|
|
|
|
| |||||||||||
Total from investment operations | 0.22 | 0.60 | 0.09 | (0.19 | ) | 0.67 | ||||||||||||||
Distributions to shareholders from | ||||||||||||||||||||
Net investment income | (0.25 | ) | (0.26 | ) | (0.29 | ) | (0.27 | ) | (0.29 | ) | ||||||||||
Tax basis return of capital | 0.00 | (0.03 | ) | 0.00 | 0.00 | 0.00 | ||||||||||||||
|
|
|
|
|
|
|
|
|
| |||||||||||
Total distributions to shareholders | (0.25 | ) | (0.29 | ) | (0.29 | ) | (0.27 | ) | (0.29 | ) | ||||||||||
Net asset value, end of period | $11.73 | $11.76 | $11.45 | $11.65 | $12.11 | |||||||||||||||
Total return2 | 1.89 | % | 5.31 | % | 0.77 | % | (1.58 | )% | 5.83 | % | ||||||||||
Ratios to average net assets (annualized) | ||||||||||||||||||||
Gross expenses | 1.72 | % | 1.70 | % | 1.66 | % | 1.65 | % | 1.65 | % | ||||||||||
Net expenses | 1.49 | % | 1.49 | % | 1.49 | % | 1.49 | % | 1.49 | % | ||||||||||
Net investment income | 2.23 | % | 2.32 | % | 2.50 | % | 2.27 | % | 2.46 | % | ||||||||||
Supplemental data | ||||||||||||||||||||
Portfolio turnover rate | 14 | % | 9 | % | 10 | % | 20 | % | 13 | % | ||||||||||
Net assets, end of period (000s omitted) | $8,394 | $8,768 | $13,440 | $16,323 | $19,493 | |||||||||||||||
| 1 | Calculated based upon average shares outstanding |
| 2 | Total return calculations do not include any sales charges. |
The accompanying notes are an integral part of these financial statements.
Wells Fargo Pennsylvania Tax-Free Fund | 19
Financial highlights
(For a share outstanding throughout each period)
| Year ended June 30 | ||||||||||||||||||||
| INSTITUTIONAL CLASS | 2020 | 2019 | 2018 | 2017 | 2016 | |||||||||||||||
Net asset value, beginning of period | $11.78 | $11.48 | $11.67 | $12.13 | $11.75 | |||||||||||||||
Net investment income | 0.38 | 0.38 | 0.40 | 0.39 | 1 | 0.41 | 1 | |||||||||||||
Net realized and unrealized gains (losses) on investments | (0.04 | ) | 0.32 | (0.18 | ) | (0.46 | ) | 0.38 | ||||||||||||
|
|
|
|
|
|
|
|
|
| |||||||||||
Total from investment operations | 0.34 | 0.70 | 0.22 | (0.07 | ) | 0.79 | ||||||||||||||
Distributions to shareholders from | ||||||||||||||||||||
Net investment income | (0.37 | ) | (0.37 | ) | (0.41 | ) | (0.39 | ) | (0.41 | ) | ||||||||||
Tax basis return of capital | 0.00 | (0.03 | ) | 0.00 | 0.00 | 0.00 | ||||||||||||||
|
|
|
|
|
|
|
|
|
| |||||||||||
Total distributions to shareholders | (0.37 | ) | (0.40 | ) | (0.41 | ) | (0.39 | ) | (0.41 | ) | ||||||||||
Net asset value, end of period | $11.75 | $11.78 | $11.48 | $11.67 | $12.13 | |||||||||||||||
Total return | 2.91 | % | 6.27 | % | 1.88 | % | (0.58 | )% | 6.88 | % | ||||||||||
Ratios to average net assets (annualized) | ||||||||||||||||||||
Gross expenses | 0.64 | % | 0.62 | % | 0.58 | % | 0.57 | % | 0.57 | % | ||||||||||
Net expenses | 0.49 | % | 0.49 | % | 0.49 | % | 0.49 | % | 0.49 | % | ||||||||||
Net investment income | 3.18 | % | 3.31 | % | 3.50 | % | 3.27 | % | 3.47 | % | ||||||||||
Supplemental data | ||||||||||||||||||||
Portfolio turnover rate | 14 | % | 9 | % | 10 | % | 20 | % | 13 | % | ||||||||||
Net assets, end of period (000s omitted) | $80,592 | $79,128 | $88,663 | $102,672 | $132,844 | |||||||||||||||
| 1 | Calculated based upon average shares outstanding |
The accompanying notes are an integral part of these financial statements.
20 | Wells Fargo Pennsylvania Tax-Free Fund
1. ORGANIZATION
Wells Fargo Funds Trust (the “Trust”), a Delaware statutory trust organized on March 10, 1999, is an open-end management investment company registered under the Investment Company Act of 1940, as amended (the “1940 Act”). As an investment company, the Trust follows the accounting and reporting guidance in Financial Accounting Standards Board (“FASB”) Accounting Standards Codification Topic 946, Financial Services – Investment Companies. These financial statements report on the Wells Fargo Pennsylvania Tax-Free Fund (the “Fund”) which is a diversified series of the Trust.
2. SIGNIFICANT ACCOUNTING POLICIES
The following significant accounting policies, which are consistently followed in the preparation of the financial statements of the Fund, are in conformity with U.S. generally accepted accounting principles which require management to make estimates and assumptions that affect the reported amounts of assets and liabilities, disclosure of contingent assets and liabilities at the date of the financial statements, and the reported amounts of revenues and expenses during the reporting period. Actual results could differ from those estimates.
Securities valuation
All investments are valued each business day as of the close of regular trading on the New York Stock Exchange (generally 4 p.m. Eastern Time), although the Fund may deviate from this calculation time under unusual or unexpected circumstances.
Debt securities are valued at the evaluated bid price provided by an independent pricing service (e.g. taking into account various factors, including yields, maturities, or credit ratings) or, if a reliable price is not available, the quoted bid price from an independent broker-dealer.
Investments in registered open-end investment companies are valued at net asset value.
Investments which are not valued using any of the methods discussed above are valued at their fair value, as determined in good faith by the Board of Trustees of the Fund. The Board of Trustees has established a Valuation Committee comprised of the Trustees and has delegated to it the authority to take any actions regarding the valuation of portfolio securities that the Valuation Committee deems necessary or appropriate, including determining the fair value of portfolio securities, unless the determination has been delegated to the Wells Fargo Asset Management Pricing Committee at Wells Fargo Funds Management, LLC (“Funds Management”). The Board of Trustees retains the authority to make or ratify any valuation decisions or approve any changes to the Valuation Procedures as it deems appropriate. On a quarterly basis, the Board of Trustees receives reports on any valuation actions taken by the Valuation Committee or the Wells Fargo Asset Management Pricing Committee which may include items for ratification.
When-issued transactions
The Fund may purchase securities on a forward commitment or when-issued basis. The Fund records a when-issued transaction on the trade date and will segregate assets in an amount at least equal in value to the Fund’s commitment to purchase when-issued securities. Securities purchased on a when-issued basis are marked-to-market daily and the Fund begins earning interest on the settlement date. Losses may arise due to changes in the market value of the underlying securities or if the counterparty does not perform under the contract.
Security transactions and income recognition
Securities transactions are recorded on a trade date basis. Realized gains or losses are recorded on the basis of identified cost.
Interest income is accrued daily and bond discounts are accreted and premiums are amortized daily. To the extent debt obligations are placed on non-accrual status, any related interest income may be reduced by writing off interest receivables when the collection of all or a portion of interest has been determined to be doubtful based on consistently applied procedures and the fair value has decreased. If the issuer subsequently resumes interest payments or when the collectability of interest is reasonably assured, the debt obligation is removed from non-accrual status.
Distributions to shareholders
Distributions to shareholders from net investment income are declared daily and paid monthly. Distributions from net realized gains, if any, are recorded on the ex-dividend date and paid at least annually. Such distributions are determined in accordance with income tax regulations and may differ from U.S. generally accepted accounting principles. Dividend sources are estimated at the time of declaration. The tax character of distributions is determined as of the Fund’s fiscal year end. Therefore, a portion of the Fund’s distributions made prior to the Fund’s fiscal year end may be categorized as a tax return of capital at year end.
Wells Fargo Pennsylvania Tax-Free Fund | 21
Notes to financial statements
Federal and other taxes
The Fund intends to continue to qualify as a regulated investment company by distributing substantially all of its investment company taxable and tax-exempt income and any net realized capital gains (after reduction for capital loss carryforwards) sufficient to relieve it from all, or substantially all, federal income taxes. Accordingly, no provision for federal income taxes was required.
The Fund’s income and federal excise tax returns and all financial records supporting those returns for the prior three fiscal years are subject to examination by the federal and Delaware revenue authorities. Management has analyzed the Fund’s tax positions taken on federal, state, and foreign tax returns for all open tax years and does not believe that there are any uncertain tax positions that require recognition of a tax liability.
As of June 30, 2020, the aggregate cost of all investments for federal income tax purposes was $124,144,055 and the unrealized gains (losses) consisted of:
Gross unrealized gains | $ | 8,286,154 | ||
Gross unrealized losses | (307,281 | ) | ||
Net unrealized gains | $ | 7,978,873 | ||
Reclassifications are made to the Fund’s capital accounts for permanent tax differences to reflect income and gains available for distribution (or available capital loss carryforwards) under federal income tax regulations. U.S. generally accepted accounting principles require that certain components of net assets be adjusted to reflect permanent differences between financial and tax reporting. These reclassifications have no effect on net assets or net asset values per share. At June 30, 2020, as a result of permanent book-to-tax differences, the following reclassification adjustments were made on the Statement of Assets and Liabilities:
| Paid-in capital | Total distributable earnings | |
| $105,291 | $(105,291) | |
As of June 30, 2020, the Fund had capital loss carryforwards which consist of $732,081 in short-term capital losses.
Class allocations
The separate classes of shares offered by the Fund differ principally in applicable sales charges, distribution, shareholder servicing, and administration fees. Class specific expenses are charged directly to that share class. Investment income, common fund-level expenses, and realized and unrealized gains (losses) on investments are allocated daily to each class of shares based on the relative proportion of net assets of each class.
3. FAIR VALUATION MEASUREMENTS
Fair value measurements of investments are determined within a framework that has established a fair value hierarchy based upon the various data inputs utilized in determining the value of the Fund’s investments. The three-level hierarchy gives the highest priority to unadjusted quoted prices in active markets for identical assets or liabilities (Level 1) and the lowest priority to unobservable inputs (Level 3). The Fund’s investments are classified within the fair value hierarchy based on the lowest level of input that is significant to the fair value measurement. The inputs are summarized into three broad levels as follows:
| ∎ | Level 1 – quoted prices in active markets for identical securities |
| ∎ | Level 2 – other significant observable inputs (including quoted prices for similar securities, interest rates, prepayment speeds, credit risk, etc.) |
| ∎ | Level 3 – significant unobservable inputs (including the Fund’s own assumptions in determining the fair value of investments) |
The inputs or methodologies used for valuing investments in securities are not necessarily an indication of the risk associated with investing in those securities.
22 | Wells Fargo Pennsylvania Tax-Free Fund
Notes to financial statements
The following is a summary of the inputs used in valuing the Fund’s assets and liabilities as of June 30, 2020:
| Quoted prices (Level 1) | Other significant observable inputs (Level 2) | Significant (Level 3) | Total | |||||||||||||
Assets | ||||||||||||||||
Investments in: | ||||||||||||||||
Municipal obligations | $ | 0 | $ | 130,559,794 | $ | 0 | $ | 130,559,794 | ||||||||
Short-term investments | ||||||||||||||||
Investment companies | 1,563,134 | 0 | 0 | 1,563,134 | ||||||||||||
Total assets | $ | 1,563,134 | $ | 130,559,794 | $ | 0 | $ | 132,122,928 | ||||||||
Additional sector, industry or geographic detail is included in the Portfolio of Investments.
For the year ended June 30, 2020, the Fund did not have any transfers into/out of Level 3.
4. TRANSACTIONS WITH AFFILIATES
Management fee
Funds Management, an indirect wholly owned subsidiary of Wells Fargo & Company (“Wells Fargo”), is the manager of the Fund and provides advisory and fund-level administrative services under an investment management agreement. Under the investment management agreement, Funds Management is responsible for, among other services, implementing the investment objectives and strategies of the Fund, supervising the subadviser and providing fund-level administrative services in connection with the Fund’s operations. As compensation for its services under the investment management agreement, Funds Management is entitled to receive a management fee at the following annual rate based on the Fund’s average daily net assets:
| Average daily net assets | Management fee | |||
First $500 million | 0.400 | % | ||
Next $500 million | 0.375 | |||
Next $2 billion | 0.350 | |||
Next $2 billion | 0.325 | |||
Next $5 billion | 0.290 | |||
Over $10 billion | 0.280 | |||
For the year ended June 30, 2020, the management fee was equivalent to an annual rate of 0.40% of the Fund’s average daily net assets.
Funds Management has retained the services of a subadviser to provide daily portfolio management to the Fund. The fee for subadvisory services is borne by Funds Management. Wells Capital Management Incorporated, an affiliate of Funds Management and an indirect wholly owned subsidiary of Wells Fargo, is the subadviser to the Fund and is entitled to receive a fee from Funds Management at an annual rate starting at 0.20% and declining to 0.10% as the average daily net assets of the Fund increase.
Administration fees
Under a class-level administration agreement, Funds Management provides class-level administrative services to the Fund, which includes paying fees and expenses for services provided by the transfer agent, sub-transfer agents, omnibus account servicers and record-keepers. As compensation for its services under the class-level administration agreement, Funds Management receives an annual fee which is calculated based on the average daily net assets of each class as follows:
| Class-level administration fee | ||||
Class A, Class C | 0.16 | % | ||
Institutional Class | 0.08 | |||
Wells Fargo Pennsylvania Tax-Free Fund | 23
Notes to financial statements
Waivers and/or expense reimbursements
Funds Management has contractually waived and/or reimbursed management and administration fees to the extent necessary to maintain certain net operating expense ratios for the Fund. When each class of the Fund has exceeded its expense cap, Funds Management has waived fees and/or reimbursed expenses from fund-level expenses on a proportionate basis and then from class specific expenses. When only certain classes exceed their expense caps, waivers and/or reimbursements are applied against class specific expenses before fund-level expenses. Funds Management has committed through October 31, 2020 to waive fees and/or reimburse expenses to the extent necessary to cap the Fund’s expenses at 0.74% for Class A shares, 1.49% for Class C shares, and 0.49% for Institutional Class shares. Prior to or after the commitment expiration date, the cap may be increased or the commitment to maintain the cap may be terminated only with the approval of the Board of Trustees.
Distribution fee
The Trust has adopted a distribution plan for Class C shares of the Fund pursuant to Rule 12b-1 under the 1940 Act. A distribution fee is charged to Class C shares and paid to Wells Fargo Funds Distributor, LLC (“Funds Distributor”), the principal underwriter, at an annual rate of 0.75% of the average daily net assets of Class C shares.
In addition, Funds Distributor is entitled to receive the front-end sales charge from the purchase of Class A shares and a contingent deferred sales charge on the redemption of certain Class A shares. Funds Distributor is also entitled to receive the contingent deferred sales charges from redemptions of Class C shares. For the year ended June 30, 2020, Funds Distributor received $5,242 from the sale of Class A shares. No contingent deferred sales charges were incurred by Class A and Class C shares for the year ended June 30, 2020.
Shareholder servicing fees
The Trust has entered into contracts with one or more shareholder servicing agents, whereby Class A and Class C of the Fund are charged a fee at an annual rate of 0.25% of the average daily net assets of each respective class. A portion of these total shareholder servicing fees were paid to affiliates of Wells Fargo.
Interfund transactions
The Fund may purchase or sell portfolio investment securities to certain other Wells Fargo affiliates pursuant to Rule 17a-7 under the 1940 Act and under procedures adopted by the Board of Trustees. The procedures have been designed to ensure that these interfund transactions, which do not incur broker commissions, are effected at current market prices. Pursuant to these procedures, the Fund had $4,250,000 and $1,000,000 in interfund purchases and sales, respectively, during the year ended June 30, 2020.
5. INVESTMENT PORTFOLIO TRANSACTIONS
Purchases and sales of investments, excluding U.S. government obligations (if any) and short-term securities, for the year ended June 30, 2020 were $17,424,169 and $18,889,775, respectively.
6. BANK BORROWINGS
The Trust (excluding the money market funds), Wells Fargo Master Trust and Wells Fargo Variable Trust are parties to a $350,000,000 revolving credit agreement whereby the Fund is permitted to use bank borrowings for temporary or emergency purposes, such as to fund shareholder redemption requests. Interest under the credit agreement is charged to the Fund based on a borrowing rate equal to the higher of the Federal Funds rate in effect on that day plus 1.25% or the overnight LIBOR rate in effect on that day plus 1.25%. In addition, an annual commitment fee equal to 0.25% of the unused balance is allocated to each participating fund.
For the year ended June 30, 2020, there were no borrowings by the Fund under the agreement.
7. DISTRIBUTIONS TO SHAREHOLDERS
The tax character of distributions paid during the years ended June 30, 2020 and June 30, 2019 were as follows:
| Year ended June 30 | ||||||||
| 2020 | 2019 | |||||||
Tax-exempt income | $ | 3,922,970 | $ | 4,119,951 | ||||
Tax basis return of capital | 0 | 310,520 | ||||||
24 | Wells Fargo Pennsylvania Tax-Free Fund
Notes to financial statements
As of June 30, 2020, the components of distributable earnings on a tax basis were as follows:
Undistributed tax-exempt income | Unrealized gains | Capital loss carryforward | ||
| $50,469 | $7,978,873 | $(732,081) | ||
8. CONCENTRATION RISK
The Fund invests a substantial portion of its assets in issuers of municipal debt securities located in a single state or territory of the U.S. Therefore, it may be more affected by economic and political developments in that state or region than would be a comparable general tax-exempt fund. As of the end of the period, the Fund invested a concentration of its portfolio in the state of Pennsylvania.
9. INDEMNIFICATION
Under the Fund’s organizational documents, the officers and Trustees have been granted certain indemnification rights against certain liabilities that may arise out of performance of their duties to the Fund. The Fund has entered into a separate agreement with each Trustee that converts indemnification rights currently existing under the Fund’s organizational documents into contractual rights that cannot be changed in the future without the consent of the Trustee. Additionally, in the normal course of business, the Fund may enter into contracts with service providers that contain a variety of indemnification clauses. The Fund’s maximum exposure under these arrangements is dependent on future claims that may be made against the Fund and, therefore, cannot be estimated.
10. NEW ACCOUNTING PRONOUNCEMENT
In August 2018, FASB issued Accounting Standards Update (“ASU”) No. 2018-13, Fair Value Measurement (Topic 820) Disclosure Framework—Changes to the Disclosure Requirements for Fair Value Measurement. ASU 2018-13 updates the disclosure requirements on fair value measurements in Topic 820, Fair Value Measurements. The amendments are effective for fiscal years, and interim periods within those fiscal years, beginning after December 15, 2019. Management has adopted this guidance which did not have a material impact on the financial statements.
11. CORONAVIRUS (COVID-19) PANDEMIC
On March 11, 2020, the World Health Organization announced that it had made the assessment that coronavirus disease 2019 (“COVID-19”) is a pandemic. The impacts of COVID-19 are adversely affecting the entire global economy, individual companies and investment products, and the market in general. There is significant uncertainty around the extent and duration of business disruptions related to COVID-19 and the impacts may be short term or may last for an extended period of time. The risk of further spreading of COVID-19 has led to significant uncertainty and volatility in the financial markets.
Wells Fargo Pennsylvania Tax-Free Fund | 25
Report of independent registered public accounting firm
To the Shareholders of the Fund and Board of Trustees
Wells Fargo Funds Trust:
Opinion on the Financial Statements
We have audited the accompanying statement of assets and liabilities of Wells Fargo Pennsylvania Tax-Free Fund (the Fund), one of the funds constituting Wells Fargo Funds Trust, including the portfolio of investments, as of June 30, 2020, the related statement of operations for the year then ended, the statements of changes in net assets for each of the years in the two-year period then ended, and the related notes (collectively, the financial statements) and the financial highlights for each of the years in the five-year period then ended. In our opinion, the financial statements and financial highlights present fairly, in all material respects, the financial position of the Fund as of June 30, 2020, the results of its operations for the year then ended, the changes in its net assets for each of the years in the two-year period then ended, and the financial highlights for each of the years in the five-year period then ended, in conformity with U.S. generally accepted accounting principles.
Basis for Opinion
These financial statements and financial highlights are the responsibility of the Fund’s management. Our responsibility is to express an opinion on these financial statements and financial highlights based on our audits. We are a public accounting firm registered with the Public Company Accounting Oversight Board (United States) (PCAOB) and are required to be independent with respect to the Fund in accordance with the U.S. federal securities laws and the applicable rules and regulations of the Securities and Exchange Commission and the PCAOB.
We conducted our audits in accordance with the standards of the PCAOB. Those standards require that we plan and perform the audit to obtain reasonable assurance about whether the financial statements and financial highlights are free of material misstatement, whether due to error or fraud. Our audits included performing procedures to assess the risks of material misstatement of the financial statements and financial highlights, whether due to error or fraud, and performing procedures that respond to those risks. Such procedures included examining, on a test basis, evidence regarding the amounts and disclosures in the financial statements and financial highlights. Such procedures also included confirmation of securities owned as of June 30, 2020, by correspondence with the custodian, transfer agent and brokers, or by other appropriate auditing procedures. Our audits also included evaluating the accounting principles used and significant estimates made by management, as well as evaluating the overall presentation of the financial statements and financial highlights. We believe that our audits provide a reasonable basis for our opinion.

We have not been able to determine the specific year that we began serving as the auditor of one or more Wells Fargo Funds investment companies; however we are aware that we have served as the auditor of one or more Wells Fargo Funds investment companies since at least 1955.
Boston, Massachusetts
August 29, 2020
26 | Wells Fargo Pennsylvania Tax-Free Fund
TAX INFORMATION
Pursuant to Section 852 of the Internal Revenue Code, 100% of distributions paid from net investment income is designated as exempt-interest dividends for the fiscal year ended June 30, 2020.
PROXY VOTING INFORMATION
A description of the policies and procedures used to determine how to vote proxies relating to portfolio securities is available, upon request, by calling 1-800-222-8222, visiting our website at wfam.com, or visiting the SEC website at sec.gov. Information regarding how the proxies related to portfolio securities were voted during the most recent 12-month period ended June 30 is available on the website at wfam.com or by visiting the SEC website at sec.gov.
QUARTERLY PORTFOLIO HOLDINGS INFORMATION
The Fund files its complete schedule of portfolio holdings with the SEC for the first and third quarters of each fiscal year as an exhibit to its reports on Form N-PORT. Shareholders may view the filed Form N-PORT by visiting the SEC website at sec.gov.
Wells Fargo Pennsylvania Tax-Free Fund | 27
Other information (unaudited)
BOARD OF TRUSTEES AND OFFICERS
Each of the Trustees and Officers1 listed in the table below acts in identical capacities for each fund in the Wells Fargo family of funds, which consists of 147 mutual funds comprising the Wells Fargo Funds Trust, Wells Fargo Variable Trust, Wells Fargo Master Trust and four closed-end funds (collectively the “Fund Complex”). This table should be read in conjunction with the Prospectus and the Statement of Additional Information2. The mailing address of each Trustee and Officer is 525 Market Street, 12th Floor, San Francisco, CA 94105. Each Trustee and Officer serves an indefinite term, however, each Trustee serves such term until reaching the mandatory retirement age established by the Trustees.
Independent Trustees
| Name and year of birth | Position held and length of service* | Principal occupations during past five years or longer | Current other public company or investment company directorships | |||
| William R. Ebsworth (Born 1957) | Trustee, since 2015 | Retired. From 1984 to 2013, equities analyst, portfolio manager, research director and chief investment officer at Fidelity Management and Research Company in Boston, Tokyo, and Hong Kong, and retired in 2013 as Chief Investment Officer of Fidelity Strategic Advisers, Inc. where he led a team of investment professionals managing client assets. Prior thereto, Board member of Hong Kong Securities Clearing Co., Hong Kong Options Clearing Corp., the Thailand International Fund, Ltd., Fidelity Investments Life Insurance Company, and Empire Fidelity Investments Life Insurance Company. Audit Committee Chair and Investment Committee Chair of the Vincent Memorial Hospital Endowment (non-profit organization). Mr. Ebsworth is a CFA® charterholder. | N/A | |||
| Jane A. Freeman (Born 1953) | Trustee, since 2015; Chair Liaison, since 2018 | Retired. From 2012 to 2014 and 1999 to 2008, Chief Financial Officer of Scientific Learning Corporation. From 2008 to 2012, Ms. Freeman provided consulting services related to strategic business projects. Prior to 1999, Portfolio Manager at Rockefeller & Co. and Scudder, Stevens & Clark. Board member of the Harding Loevner Funds from 1996 to 2014, serving as both Lead Independent Director and chair of the Audit Committee. Board member of the Russell Exchange Traded Funds Trust from 2011 to 2012 and the chair of the Audit Committee. Ms. Freeman is also an inactive Chartered Financial Analyst. | N/A | |||
| Isaiah Harris, Jr. (Born 1952) | Trustee, since 2009; Audit Committee Chairman, since 2019 | Retired. Chairman of the Board of CIGNA Corporation since 2009, and Director since 2005. From 2003 to 2011, Director of Deluxe Corporation. Prior thereto, President and CEO of BellSouth Advertising and Publishing Corp. from 2005 to 2007, President and CEO of BellSouth Enterprises from 2004 to 2005 and President of BellSouth Consumer Services from 2000 to 2003. Emeritus member of the Iowa State University Foundation Board of Governors. Emeritus Member of the Advisory Board of Iowa State University School of Business. Advisory Board Member, Palm Harbor Academy (private school). Advisory Board Member, Child Evangelism Fellowship (non-profit). Mr. Harris is a certified public accountant (inactive status). | CIGNA Corporation | |||
| Judith M. Johnson (Born 1949) | Trustee, since 2008; Audit Committee Chairman, from 2009 to 2018 | Retired. Prior thereto, Chief Executive Officer and Chief Investment Officer of Minneapolis Employees Retirement Fund from 1996 to 2008. Ms. Johnson is an attorney, certified public accountant and a certified managerial accountant. | N/A | |||
28 | Wells Fargo Pennsylvania Tax-Free Fund
Other information (unaudited)
| Name and year of birth | Position held and length of service* | Principal occupations during past five years or longer | Current other public company or investment company directorships | |||
| David F. Larcker (Born 1950) | Trustee, since 2009 | James Irvin Miller Professor of Accounting at the Graduate School of Business, Stanford University, Director of the Corporate Governance Research Initiative and Senior Faculty of The Rock Center for Corporate Governance since 2006. From 2005 to 2008, Professor of Accounting at the Graduate School of Business, Stanford University. Prior thereto, Ernst & Young Professor of Accounting at The Wharton School, University of Pennsylvania from 1985 to 2005. | N/A | |||
| Olivia S. Mitchell (Born 1953) | Trustee, since 2006; Nominating and Governance Committee Chair, since 2018 | International Foundation of Employee Benefit Plans Professor, Wharton School of the University of Pennsylvania since 1993. Director of Wharton’s Pension Research Council and Boettner Center on Pensions & Retirement Research, and Research Associate at the National Bureau of Economic Research. Previously, Cornell University Professor from 1978 to 1993. | N/A | |||
| Timothy J. Penny (Born 1951) | Trustee, since 1996; Chairman, since 2018 | President and Chief Executive Officer of Southern Minnesota Initiative Foundation, a non-profit organization, since 2007. Member of the Board of Trustees of NorthStar Education Finance, Inc., a non-profit organization, since 2007. | N/A | |||
| James G. Polisson (Born 1959) | Trustee, since 2018 | Retired. Chief Marketing Officer, Source (ETF) UK Services, Ltd, from 2015 to 2017. From 2012 to 2015, Principal of The Polisson Group, LLC, a management consulting, corporate advisory and principal investing company. Chief Executive Officer and Managing Director at Russell Investments, Global Exchange Traded Funds from 2010 to 2012. Managing Director of Barclays Global Investors from 1998 to 2010 and Global Chief Marketing Officer for iShares and Barclays Global Investors from 2000 to 2010. Trustee of the San Francisco Mechanics’ Institute, a non-profit organization, from 2013 to 2015. Board member of the Russell Exchange Traded Fund Trust from 2011 to 2012. Director of Barclays Global Investors Holdings Deutschland GmbH from 2006 to 2009. Mr. Polisson is an attorney and has a retired status with the Massachusetts and District of Columbia Bar Associations. | N/A | |||
| Pamela Wheelock (Born 1959) | Trustee, since January 2020; previously Trustee from January 2018 to July 2019 | Board member of the Destination Medical Center Economic Development Agency, Rochester, Minnesota since 2019 and Interim President of the McKnight Foundation since 2020. Acting Commissioner, Minnesota Department of Human Services, July 2019 through September 2019. Human Services Manager (part-time), Minnesota Department of Human Services, October 2019 through December 2019. Chief Operating Officer, Twin Cities Habitat for Humanity from 2017 to 2019. Vice President of University Services, University of Minnesota from 2012 to 2016. Prior thereto, on the Board of Directors, Governance Committee and Finance Committee for the Minnesota Philanthropy Partners (Saint Paul Foundation) from 2012 to 2018, Interim Chief Executive Officer of Blue Cross Blue Shield of Minnesota from 2011 to 2012, Chairman of the Board from 2009 to 2012 and Board Director from 2003 to 2015. Vice President, Leadership and Community Engagement, Bush Foundation, Saint Paul, Minnesota (a private foundation) from 2009 to 2011. Executive Vice President and Chief Financial Officer, Minnesota Sports and Entertainment from 2004 to 2009 and Senior Vice President from 2002 to 2004. Executive Vice President of the Minnesota Wild Foundation from 2004 to 2008. Commissioner of Finance, State of Minnesota, from 1999 to 2002. Currently Board Chair of the Minnesota Wild Foundation since 2010. | N/A | |||
| * | Length of service dates reflect the Trustee’s commencement of service with the Trust’s predecessor entities, where applicable. |
Wells Fargo Pennsylvania Tax-Free Fund | 29
Other information (unaudited)
Officers
| Name and year of birth | Position held and length of service | Principal occupations during past five years or longer | ||
| Andrew Owen (Born 1960) | President, since 2017 | Executive Vice President of Wells Fargo & Company and Head of Affiliated Managers, Wells Fargo Asset Management, since 2014. In addition, Mr. Owen is currently President, Chief Executive Officer and Director of Wells Fargo Funds Management, LLC since 2017. Prior thereto, Executive Vice President responsible for marketing, investments and product development for Wells Fargo Funds Management, LLC, from 2009 to 2014. | ||
| Nancy Wiser1 (Born 1967) | Treasurer, since 2012 | Executive Vice President of Wells Fargo Funds Management, LLC since 2011. Chief Operating Officer and Chief Compliance Officer at LightBox Capital Management LLC, from 2008 to 2011. | ||
| Michelle Rhee (Born 1966) | Chief Legal Officer, since 2019 | Secretary of Wells Fargo Funds Management, LLC, Chief Legal Counsel of Wells Fargo Asset Management and Assistant General Counsel of Wells Fargo Bank, N.A. since 2018. Associate General Counsel and Managing Director of Bank of America Corporation from 2004 to 2018. | ||
| Catherine Kennedy (Born 1969) | Secretary, since 2019 | Vice President of Wells Fargo Funds Management, LLC and Senior Counsel of the Wells Fargo Legal Department since 2010. Vice President and Senior Counsel of Evergreen Investment Management Company, LLC from 1998 to 2010. | ||
| Michael H. Whitaker (Born 1967) | Chief Compliance Officer, since 2016 | Chief Compliance Officer of Wells Fargo Asset Management since 2016. Senior Vice President and Chief Compliance Officer for Fidelity Investments from 2007 to 2016. | ||
| David Berardi (Born 1975) | Assistant Treasurer, since 2009 | Vice President of Wells Fargo Funds Management, LLC since 2009. Vice President of Evergreen Investment Management Company, LLC from 2008 to 2010. Manager of Fund Reporting and Control for Evergreen Investment Management Company, LLC from 2004 to 2010. | ||
| Jeremy DePalma1 (Born 1974) | Assistant Treasurer, since 2009 | Senior Vice President of Wells Fargo Funds Management, LLC since 2009. Senior Vice President of Evergreen Investment Management Company, LLC from 2008 to 2010 and head of the Fund Reporting and Control Team within Fund Administration from 2005 to 2010. | ||
| 1 | Nancy Wiser acts as Treasurer of 65 funds in the Fund Complex. Jeremy DePalma acts as the Treasurer of 82 funds and Assistant Treasurer of 65 funds in the Fund Complex. |
| 2 | The Statement of Additional Information includes additional information about the Trustees and is available, without charge, upon request, by calling 1-800-222-8222 or by visiting the website at wfam.com. |
30 | Wells Fargo Pennsylvania Tax-Free Fund
Other information (unaudited)
BOARD CONSIDERATION OF INVESTMENT MANAGEMENT AND SUB-ADVISORY AGREEMENTS:
Wells Fargo Pennsylvania Tax-Free Fund
Under the Investment Company Act of 1940 (the “1940 Act”), the Board of Trustees (the “Board”) of Wells Fargo Funds Trust (the “Trust”) must determine annually whether to approve the continuation of the Trust’s investment management and sub-advisory agreements. In this regard, at a Board meeting held on May 26, 2020 and May 28, 2020 (together, the “Meeting”), the Board, all the members of which have no direct or indirect interest in the investment management and sub-advisory agreements and are not “interested persons” of the Trust, as defined in the 1940 Act (the “Independent Trustees”), reviewed and approved for Wells Fargo Pennsylvania Tax-Free Fund (the “Fund”): (i) an investment management agreement (the “Management Agreement”) with Wells Fargo Funds Management, LLC (“Funds Management”); and (ii) an investment sub-advisory agreement (the “Sub-Advisory Agreement”) with Wells Capital Management Incorporated (the “Sub-Adviser”), an affiliate of Funds Management. The Management Agreement and the Sub-Advisory Agreement are collectively referred to as the “Advisory Agreements.”
At the Meeting, the Board considered the factors and reached the conclusions described below relating to the selection of Funds Management and the Sub-Adviser and the approval of the Advisory Agreements. Prior to the Meeting, including at a Board meeting held in April 2020, the Trustees conferred extensively among themselves and with representatives of Funds Management about these matters. Also, the Board has adopted a team-based approach, with each team consisting of a sub-set of Trustees, to assist the full Board in the discharge of its duties in reviewing investment performance and other matters throughout the year. The Independent Trustees were assisted in their evaluation of the Advisory Agreements by independent legal counsel, from whom they received separate legal advice and with whom they met separately.
In providing information to the Board, Funds Management and the Sub-Adviser were guided by a detailed set of requests for information submitted to them by independent legal counsel on behalf of the Independent Trustees at the start of the Board’s annual contract renewal process earlier in 2020. In considering and approving the Advisory Agreements, the Trustees considered the information they believed relevant, including but not limited to the information discussed below. The Board considered not only the specific information presented in connection with the Meeting, but also the knowledge gained over time through interaction with Funds Management and the Sub-Adviser about various topics. In this regard, the Board reviewed reports of Funds Management at each of its quarterly meetings, which included, among other things, portfolio reviews and investment performance reports. In addition, the Board and the teams mentioned above confer with portfolio managers at various times throughout the year. The Board did not identify any particular information or consideration that was all-important or controlling, and each individual Trustee may have attributed different weights to various factors.
After its deliberations, the Board unanimously approved the continuation of the Advisory Agreements for a one-year term and determined that the compensation payable to Funds Management and the Sub-Adviser under each of the Advisory Agreements was reasonable. The Board considered the approval of the Advisory Agreements for the Fund as part of its consideration of agreements for funds across the complex, but its approvals were made on a fund-by-fund basis. The following summarizes a number of important, but not necessarily all, factors considered by the Board in support of its approvals.
Nature, extent and quality of services
The Board received and considered various information regarding the nature, extent and quality of services provided to the Fund by Funds Management and the Sub-Adviser under the Advisory Agreements. This information included a description of the investment advisory services and Fund-level administrative services covered by the Management Agreement, as well as, among other things, a summary of the background and experience of senior management of Wells Fargo Asset Management (“WFAM”), of which Funds Management and the Sub-Adviser are a part, and a summary of investments made in the business of WFAM. The Board also received a description of Funds Management’s and the Sub-Adviser’s business continuity plans and of their approaches to data privacy and cybersecurity, and related testing. The Board also received and reviewed information about Funds Management’s role as administrator of the Fund’s liquidity risk management program, Funds Management’s approach to risk management, and Funds Management’s intermediary and vendor oversight program.
The Board also considered the qualifications, background, tenure and responsibilities of each of the portfolio managers primarily responsible for the day-to-day portfolio management of the Fund. The Board evaluated the ability of Funds Management and the Sub-Adviser to attract and retain qualified investment professionals, including research, advisory and supervisory personnel. The Board further considered the compliance programs and compliance records of Funds Management and the Sub-Adviser. In addition, the Board took into account the full range of services provided to the Fund by Funds Management and its affiliates.
Wells Fargo Pennsylvania Tax-Free Fund | 31
Other information (unaudited)
Fund investment performance and expenses
The Board considered the investment performance results for the Fund over various time periods ended December 31, 2019. The Board also considered more current results for various time periods ended March 31, 2020. The Board considered these results in comparison to the investment performance of funds in a universe that was determined by Broadridge Inc. (“Broadridge”) to be similar to the Fund (the “Universe”), and in comparison to the Fund’s benchmark index and to other comparative data. Broadridge is an independent provider of investment company data. The Board received a description of the methodology used by Broadridge to select the mutual funds in the performance Universe. The Board noted that the investment performance of the Fund (Class A) was higher than or in range of the average investment performance of the Universe for the three-, five- and ten-year periods ended December 31, 2019, and lower than the average investment performance of the Universe for the one-year period ended December 31, 2019. The Board also noted that the investment performance of the Fund (Class A) was higher than the average investment performance of the Universe for all periods ended March 31, 2020. The Board also noted that the investment performance of the Fund was higher than its benchmark index, the Bloomberg Barclays Municipal Bond Index, for the ten-year period ended December 31, 2019, and lower than its benchmark index for the one-, three- and five-year periods ended December 31, 2019. The Board also noted that the investment performance of the Fund was higher than its benchmark index, the Bloomberg Barclays Municipal Bond Index, for the ten-year period ended March 31, 2020, and lower than its benchmark index for the one-, three- and five -year period ended March 31, 2020.
The Board also received and considered information regarding the Fund’s net operating expense ratios and their various components, including actual management fees, custodian and other non-management fees, and Rule 12b-1 and non-Rule 12b-1 shareholder service fees. The Board considered these ratios in comparison to the median ratios of funds in class-specific expense groups that were determined by Broadridge to be similar to the Fund (the “Groups”). The Board received a description of the methodology used by Broadridge to select the mutual funds in the expense Groups and an explanation of how funds comprising expense groups and their expense ratios may vary from year-to-year. Based on the Broadridge reports, the Board noted that the net operating expense ratios of the Fund were lower than the median net operating expense ratios of the expense Groups for each share class.
The Board took into account the Fund’s investment performance and expense information provided to it among the factors considered in deciding to re-approve the Advisory Agreements.
Investment management and sub-advisory fee rates
The Board reviewed and considered the contractual fee rates payable by the Fund to Funds Management under the Management Agreement, as well as the contractual fee rates payable by the Fund to Funds Management for class-level administrative services under a Class-Level Administration Agreement, which include, among other things, class-level transfer agency and sub-transfer agency costs (collectively, the “Management Rates”). The Board also reviewed and considered the contractual investment sub-advisory fee rates that are payable by Funds Management to the Sub-Adviser for investment sub-advisory services.
Among other information reviewed by the Board was a comparison of the Fund’s Management Rates with the average contractual investment management fee rates of funds in the expense Groups at a common asset level as well as transfer agency costs of the funds in the expense Groups. The Board noted that the Management Rates of the Fund were lower than or in range of the sum of these average rates for the Fund’s expense Groups for all share classes.
The Board also received and considered information about the portion of the total management fee that was retained by Funds Management after payment of the fee to the Sub-Adviser for sub-advisory services. In assessing the reasonableness of this amount, the Board received and evaluated information about the nature and extent of responsibilities retained and risks assumed by Funds Management and not delegated to or assumed by the Sub-Adviser, and about Funds Management’s on-going oversight services. Given the affiliation between Funds Management and the Sub-Adviser, the Board ascribed limited relevance to the allocation of fees between them.
The Board also received and considered information about the nature and extent of services offered and fee rates charged by Funds Management and the Sub-Adviser to other types of clients with investment strategies similar to those of the Fund. In this regard, the Board received information about the significantly greater scope of services, and compliance, reporting and other legal burdens and risks of managing proprietary mutual funds compared with those associated with managing assets of other types of clients, including third-party sub-advised fund clients and non-mutual fund clients such as institutional separate accounts.
Based on its consideration of the factors and information it deemed relevant, including those described here, the Board determined that the compensation payable to Funds Management under the Management Agreement and to the Sub-Adviser under the Sub-Advisory Agreement was reasonable.
32 | Wells Fargo Pennsylvania Tax-Free Fund
Other information (unaudited)
Profitability
The Board received and considered information concerning the profitability of Funds Management, as well as the profitability of both WFAM and Wells Fargo & Co. (“Wells Fargo”) from providing services to the fund family as a whole. The Board noted that the Sub-Adviser’s profitability information with respect to providing services to the Fund and other funds in the family was subsumed in the WFAM and Wells Fargo profitability analysis.
Funds Management reported on the methodologies and estimates used in calculating profitability, including a description of the methodology used to allocate certain expenses. Among other things, the Board noted that the levels of profitability reported on a fund-by-fund basis varied widely, depending on factors such as the size, type and age of fund.
Based on its review, the Board did not deem the profits reported by Funds Management, WFAM or Wells Fargo from services provided to the Fund to be at a level that would prevent it from approving the continuation of the Advisory Agreements.
Economies of scale
The Board received and considered information about the potential for Funds Management to experience economies of scale in the provision of management services to the Fund, the difficulties of calculating economies of scale at an individual fund level, and the extent to which potential scale benefits are shared with shareholders. The Board noted the existence of breakpoints in the Fund’s management fee structure, which operate generally to reduce the Fund’s expense ratios as the Fund grows in size, and the size of the Fund in relation to such breakpoints. The Board considered that in addition to management fee breakpoints, Funds Management shares potential economies of scale from its management business in a variety of ways, including through fee waiver and expense reimbursement arrangements, services that benefit shareholders, competitive management fee rates set at the outset without regard to breakpoints, and investments in the business intended to enhance services available to shareholders.
The Board concluded that Funds Management’s arrangements with respect to the Fund, including contractual breakpoints, constituted a reasonable approach to sharing potential economies of scale with the Fund and its shareholders.
Other benefits to Funds Management and the Sub-Adviser
The Board received and considered information regarding potential “fall-out” or ancillary benefits received by Funds Management and its affiliates, including the Sub-Adviser, as a result of their relationships with the Fund. Ancillary benefits could include, among others, benefits directly attributable to other relationships with the Fund and benefits potentially derived from an increase in Funds Management’s and the Sub-Adviser’s business as a result of their relationships with the Fund. The Board noted that various affiliates of Funds Management may receive distribution-related fees, shareholder servicing payments and sub-transfer agency fees in respect of shares sold or held through them and services provided.
The Board also reviewed information about soft dollar credits earned and utilized by the Sub-Adviser, fees earned by Funds Management and the Sub-Adviser from managing a private investment vehicle for the fund family’s securities lending collateral, and commissions earned by an affiliated broker from portfolio transactions.
Based on its consideration of the factors and information it deemed relevant, including those described here, the Board did not find that any ancillary benefits received by Funds Management and its affiliates, including the Sub-Adviser, were unreasonable.
Conclusion
At the Meeting, after considering the above-described factors and based on its deliberations and its evaluation of the information described above, the Board unanimously approved the continuation of the Advisory Agreements for a one-year term and determined that the compensation payable to Funds Management and the Sub-Adviser under each of the Advisory Agreements was reasonable.
Wells Fargo Pennsylvania Tax-Free Fund | 33
Other information (unaudited)
LIQUIDITY RISK MANAGEMENT PROGRAM
In accordance with Rule 22e-4 under the Investment Company Act of 1940, as amended (the “Liquidity Rule”), Wells Fargo Funds Trust (the “Trust”) has adopted and implemented a liquidity risk management program (the “Program”) on behalf of each of its series, including the Fund, which is reasonably designed to assess and manage the Fund’s liquidity risk. “Liquidity risk” is defined as the risk that the Fund is unable to meet redemption requests without significantly diluting remaining investors’ interests in the Fund. The Trust’s Board of Trustees (the “Board”) previously approved the designation of Wells Fargo Funds Management, LLC (“Funds Management”), the Fund’s investment manager, as the administrator of the Program, and Funds Management has established a Liquidity Risk Management Council composed of personnel from multiple departments within Funds Management and its affiliates to assist Funds Management in the implementation and on-going administration of the Program.
The Program is comprised of various components designed to support the assessment and/or management of liquidity risk, including: (1) the periodic assessment (no less frequently than annually) of certain factors that influence the Fund’s liquidity risk; (2) the periodic classification (no less frequently than monthly) of the Fund’s investments into one of four liquidity categories that reflect an estimate of their liquidity under current market conditions; (3) a 15% limit on the acquisition of “illiquid investments” (as defined under the Liquidity Rule); (4) to the extent the Fund does not invest primarily in “highly liquid investments” (as defined under the Liquidity Rule), the determination of a minimum percentage of the Fund’s assets that generally will be invested in highly liquid investments (an “HLIM”); (5) if the Fund has established an HLIM, the periodic review (no less frequently than annually) of the HLIM and the adoption of policies and procedures for responding to a shortfall of the Fund’s “highly liquid investments” below its HLIM; and (6) periodic reporting to the Board.
At a meeting of the Board held on May 26 and 28, 2020, the Board received a written report (the “Report”) from Funds Management that addressed the operation of the Program and assessed its adequacy and effectiveness of implementation. The Report covered the initial period from December 1, 2018 through December 31, 2019 (the “Reporting Period”). No significant liquidity events impacting the Fund were noted in the Report. There were no material changes to the Program during the Reporting Period. The Report concluded that the Program is operating effectively to assess and manage the Fund’s liquidity risk, and that the Program has been and continues to be adequately and effectively implemented to monitor and, as applicable, respond to the Fund’s liquidity developments.
There can be no assurance that the Program will achieve its objectives under all circumstances in the future. Please refer to the Fund’s prospectus for more information regarding the Fund’s exposure to liquidity risk and other risks to which an investment in the Fund may be subject.
34 | Wells Fargo Pennsylvania Tax-Free Fund
Effective on or after May 1, 2020, clients of Edward Jones (also referred to as “shareholders”) purchasing Fund shares on the Edward Jones commission and fee-based platforms are eligible only for the following sales charge discounts (also referred to as “breakpoints”) and waivers, which can differ from breakpoints and waivers described elsewhere in the Fund’s Prospectus or SAI or through another broker-dealer. In all instances, it is the shareholder’s responsibility to inform Edward Jones at the time of purchase of any relationship, holdings of Wells Fargo Funds or other facts qualifying the purchaser for breakpoints or waivers. Edward Jones can ask for documentation of such circumstance.
| Breakpoints available at Edward Jones |
| Rights of Accumulation (ROA) |
The applicable sales charge on a purchase of Class A shares is determined by taking into account all share classes (except any money market funds and retirement plan share classes) of Wells Fargo Funds held by the shareholder or in an account grouped by Edward Jones with other accounts for the purpose of providing certain pricing considerations (“pricing groups”). This includes all share classes held on the Edward Jones platform and/or held on another platform. The inclusion of eligible fund family assets in the rights of accumulation calculation is dependent on the shareholder notifying his or her financial advisor of such assets at the time of calculation. |
ROA is determined by calculating the higher of cost or market value (current shares x NAV). |
| Letter of Intent (LOI) |
Through a LOI, shareholders can receive the sales charge and breakpoint discounts for purchases shareholders intend to makeover a 13-month period from the date Edward Jones receives the LOI. The LOI is determined by calculating the higher of cost or market value of qualifying holdings at LOI initiation in combination with the value that the shareholder intends to buy over a 13-month period to calculate the front-end sales charge and any breakpoint discounts. Each purchase the shareholder makes during that 13-month period will receive the sales charge and breakpoint discount that applies to the total amount. The inclusion of eligible fund family assets in the LOI calculation is dependent on the shareholder notifying his or her financial advisor of such assets at the time of calculation. Purchases made before the LOI is received by Edward Jones are not covered under the LOI and will not reduce the sales charge previously paid. Sales charges will be adjusted if LOI is not met. |
| Sales charges are waived for the following shareholders and in the following situations at Edward Jones: |
● Associates of Edward Jones and its affiliates and their family members who are in the same pricing group (as determined by Edward Jones under its policies and procedures) as the associate. This waiver will continue for the remainder of the associate’s life if the associate retires from Edward Jones in good-standing. |
● Shares purchased in an Edward Jones fee-based program. |
● Shares purchased through reinvestment of capital gains distributions and dividend reinvestment. |
● Shares purchased from the proceeds of redeemed shares of the same fund family so long as the following conditions are met: 1) the proceeds are from the sale of shares within 60 days of the purchase, and 2) the sale and purchase are made in the same share class and the same account or the purchase is made in an individual retirement account with proceeds from liquidations in anon-retirement account. |
● Shares exchanged into Class A shares from another share class so long as the exchange is into the same fund and was initiated at the discretion of Edward Jones. Edward Jones is responsible for any remaining CDSC due to the fund company, if applicable. Any future purchases are subject to the applicable sales charge as disclosed in the prospectus. |
● Exchanges from Class C shares to Class A shares of the same fund, generally, in the 84th month following the anniversary of the purchase date or earlier at the discretion of Edward Jones. |
| If the shareholder purchases shares that are subject to a CDSC and those shares are redeemed before the CDSC is expired, the shareholder is responsible to pay the CDSC except in the following conditions available at Edward Jones: |
● The death or disability of the shareholder. |
● Systematic withdrawals with up to 10% per year of the account value. |
● Return of excess contributions from an Individual Retirement Account (IRA). |
● Shares sold as part of a required minimum distribution for IRA and retirement accounts if the redemption is taken in or after the year the shareholder reaches qualified age based on applicable IRS regulation. |
● Shares sold to pay Edward Jones fees or costs in such cases where the transaction is initiated by Edward Jones. |
● Shares exchanged in an Edward Jones fee-based program. |
● Shares acquired through NAV reinstatement. |
Wells Fargo Pennsylvania Tax-Free Fund | 35
Appendix I (unaudited)
| Other Important Information for accounts at Edward Jones: |
| Minimum Purchase Amounts |
● $250 initial purchase minimum |
● $50 subsequent purchase minimum |
| Minimum Balances |
| Edward Jones has the right to redeem at its discretion fund holdings with a balance of $250 or less. The following are examples of accounts that are not included in this policy: |
● A fee-based account held on an Edward Jones platform |
● A 529 account held on an Edward Jones platform |
● An account with an active systematic investment plan or letter of intent (LOI) |
| Changing Share Classes |
| At any time it deems necessary, Edward Jones has the authority to exchange at NAV a shareholder’s holdings in a fund to Class A shares. |
36 | Wells Fargo Pennsylvania Tax-Free Fund
Effective June 1, 2020, shareholders purchasing Fund shares through an Oppenheimer & Co. Inc. (“Oppenheimer”) platform or account are eligible only for the following load waivers (front-end sales charge waivers and contingent deferred or back-end, sales charge waivers) and discounts, which may differ from those disclosed in the Fund’s Prospectus or SAI.
| Front-end Sales Load Waivers on Class A Shares available at Oppenheimer |
| Employer-sponsored retirement, deferred compensation and employee benefit plans (including health savings accounts) and trusts used to fund those plans, provided that the shares are not held in a commission-based brokerage account and shares are held for the benefit of the plan. |
| Shares purchased by or through a 529 Plan. |
| Shares purchased through an Oppenheimer affiliated investment advisory program. |
| Shares purchased through reinvestment of capital gains distributions and dividend reinvestment when purchasing shares of the same fund (but not any other fund within the fund family). |
| Shares purchased from the proceeds of redemptions within the same fund family, provided (1) the repurchase occurs within 90 days following the redemption, (2) the redemption and purchase occur in the same account, and (3) redeemed shares were subject to a front-end or deferred sales load (known as Rights of Restatement). |
| A shareholder in the Fund’s Class C shares will have their shares exchanged at net asset value to Class A shares (or the appropriate share class) of the Fund if the shares are no longer subject to a CDSC and the exchange is in line with the policies and procedures of Oppenheimer. |
| Employees and registered representatives of Oppenheimer or its affiliates and their family members. |
| Directors or Trustees of the Fund, and employees of the Fund’s investment adviser or any of its affiliates, as described in the Prospectus. |
| CDSC Waivers on A and C Shares available at Oppenheimer |
| Death or disability of the shareholder. |
| Shares sold as part of a systematic withdrawal plan as described in the Prospectus. |
| Return of excess contributions from an IRA Account. |
| Shares sold as part of a required minimum distribution for IRA and retirement accounts due to the shareholder reaching the qualified age based on applicable IRS regulations as described in the Prospectus. |
| Shares sold to pay Oppenheimer fees but only if the transaction is initiated by Oppenheimer. |
| Shares acquired through a right of reinstatement. |
| Front-end load Discounts Available at Oppenheimer: Breakpoints, Rights of Accumulation & Letters of Intent |
| Breakpoints as described in the Prospectus. |
| Rights of Accumulation (ROA), which entitle shareholders to breakpoint discounts, will be automatically calculated based on the aggregated holding of fund family assets held by accounts within the purchaser’s household at Oppenheimer. Eligible fund family assets not held at Oppenheimer may be included in the ROA calculation only if the shareholder notifies his or her financial advisor about such assets. |
Wells Fargo Pennsylvania Tax-Free Fund | 37
Effective June 15, 2020, shareholders purchasing fund shares through a Robert W. Baird & Co. (“Baird”) platform or account will only be eligible for the following sales charge waivers (front-end sales charge waivers and CDSC waivers) and discounts, which may differ from those disclosed elsewhere in the Fund’s Prospectus or the SAI.
| Front-end Sales Load Waivers on Class A Shares available at Baird |
| Shares purchased through reinvestment of capital gains distributions and dividend reinvestment when purchasing share of the same fund. |
| Share purchase by employees and registers representatives of Baird or its affiliate and their family members as designated by Baird. |
| Shares purchase from the proceeds of redemptions within the same fund family, provided (1) the repurchase occurs within 90 days following the redemption, (2) the redemption and purchase occur in the same accounts, and (3) redeemed shares were subject to a front-end or deferred sales charge (known as rights of reinstatement). |
| A shareholder in the Funds Investor C Shares will have their share exchanged at net asset value to Investor A shares of the fund if the shares are no longer subject to CDSC and the exchange is in line with the policies and procedures of Baird. |
| Employer-sponsored retirement plans or charitable accounts in a transactional brokerage account at Baird, including 401(k) plans, 457 plans, employer-sponsored 403(b) plans, profit sharing and money purchase pension plans and defined benefit plans. For purposes of this provision, employer-sponsored retirement plans do not include SEP IRAs, Simple IRAs or SAR-SEPs. |
| CDSC Waivers on A and C Shares available at Baird |
| Shares sold due to death or disability of the shareholder. |
| Shares sold as part of a systematic withdrawal plan as described in the Fund’s Prospectus. |
| Shares bought due to returns of excess contributions from an IRA Account. |
| Shares sold as part of a required minimum distribution for IRA and retirement accounts due to the shareholder reaching age 72 as described in the Fund’s Prospectus. |
| Shares sold to pay Baird fees but only if the transaction is initiated by Baird. |
| Shares acquired through a right of reinstatement. |
| Front-end load Discounts Available at Baird: Breakpoint and/or Rights of Accumulation |
| Breakpoints as described in the Prospectus. |
| Rights of accumulations which entitles shareholders to breakpoint discounts will be automatically calculated based on the aggregated holding of fund family assets held by accounts within the purchaser’s household at Baird. Eligible fund family assets not held at Baird may be included in the rights of accumulations calculation only if the shareholder notifies his or her financial advisor about such assets. |
| Letters of Intent (LOI) allow for breakpoint discounts based on anticipated purchases within a fund family through Baird, over a 13-month period of time. |
38 | Wells Fargo Pennsylvania Tax-Free Fund
This page is intentionally left blank.
This page is intentionally left blank.
For more information
More information about Wells Fargo Funds is available free upon request. To obtain literature, please write, visit the Fund’s website, or call:
Wells Fargo Funds
P.O. Box 219967
Kansas City, MO 64121-9967
Website: wfam.com
Individual investors: 1-800-222-8222
Retail investment professionals: 1-888-877-9275
Institutional investment professionals: 1-866-765-0778

This report and the financial statements contained herein are submitted for the general information of the shareholders of the Fund. If this report is used for promotional purposes, distribution of the report must be accompanied or preceded by a current prospectus. Before investing, please consider the investment objectives, risks, charges, and expenses of the investment. For a current prospectus and, if available, a summary prospectus, containing this information, call 1-800-222-8222 or visit the Fund’s website at wfam.com. Read the prospectus carefully before you invest or send money.
Wells Fargo Asset Management (WFAM) is the trade name for certain investment advisory/management firms owned by Wells Fargo & Company. These firms include but are not limited to Wells Capital Management Incorporated and Wells Fargo Funds Management, LLC. Certain products managed by WFAM entities are distributed by Wells Fargo Funds Distributor, LLC (a broker-dealer and Member FINRA).
This material is for general informational and educational purposes only and is NOT intended to provide investment advice or a recommendation of any kind— including a recommendation for any specific investment, strategy, or plan.
INVESTMENT PRODUCTS: NOT FDIC INSURED ◾ NO BANK GUARANTEE ◾ MAY LOSE VALUE
© 2020 Wells Fargo & Company. All rights reserved.
PAR-0720-00247 08-20
A255/AR255 06-20

Annual Report
June 30, 2020
Wells Fargo
Strategic Municipal Bond Fund
Beginning on January 1, 2021, as permitted by new regulations adopted by the Securities and Exchange Commission, paper copies of the Wells Fargo Funds’ annual and semi-annual shareholder reports issued after this date will no longer be sent by mail, unless you specifically request paper copies of the reports. Instead, the reports will be made available on the Funds’ website, and you will be notified by mail each time a report is posted and provided with a website address to access the report.
If you already elected to receive shareholder reports electronically, you will not be affected by this change and you need not take any action. You may elect to receive shareholder reports and other communications from the Fund electronically at any time by contacting your financial intermediary (such as a broker-dealer or bank) or, if you are a direct investor, by calling 1-800-222-8222 or by enrolling at wellsfargo.com/advantagedelivery.
You may elect to receive all future reports in paper free of charge. If you invest through a financial intermediary, you can contact your financial intermediary to request that you continue to receive paper copies of your shareholder reports; if you invest directly with the Fund, you can call 1-800-222-8222. Your election to receive reports in paper will apply to all Wells Fargo Funds held in your account with your financial intermediary or, if you are a direct investor, to all Wells Fargo Funds that you hold.
|
Reduce clutter. Save trees. |
Sign up for electronic delivery of prospectuses and |
The views expressed and any forward-looking statements are as of June 30, 2020, unless otherwise noted, and are those of the Fund managers and/or Wells Fargo Asset Management. Discussions of individual securities, or the markets generally, or any Wells Fargo Fund are not intended as individual recommendations. Future events or results may vary significantly from those expressed in any forward-looking statements. The views expressed are subject to change at any time in response to changing circumstances in the market. Wells Fargo Asset Management and the Fund disclaim any obligation to publicly update or revise any views expressed or forward-looking statements.
INVESTMENT PRODUCTS: NOT FDIC INSURED ◾ NO BANK GUARANTEE ◾ MAY LOSE VALUE
Wells Fargo Strategic Municipal Bond Fund | 1
Letter to shareholders (unaudited)

Andrew Owen
President
Wells Fargo Funds
Dear Shareholder:
We are pleased to offer you this annual report for the Wells Fargo Strategic Municipal Bond Fund for the 12-month period that ended June 30, 2020. Global stock markets saw earlier gains erased in February and March as governments around the world took unprecedented measures to stop the spread of the coronavirus at the expense of short-term economic output. However, markets rebounded from April through June to offset much of the losses as central banks attempted to bolster capital markets and confidence. Fixed-income markets generally performed better, with most achieving gains. Overall U.S. markets surpassed their international peers, while U.S. large-cap equity , as measured by the Russell 1000® Index1, easily outperformed small caps, as measured by the Russell 2000® Index2, for the 12-month period.
For the 12-month period, fixed-income securities generally had positive total returns while non-U.S. equities had broad losses and U.S. stocks performed strongly despite sharp volatility since late February. For the period, U.S. stocks, based on the S&P 500 Index,3 gained 7.51%. International stocks, as measured by the MSCI ACWI ex USA Index (Net),4 returned -4.80%, while the MSCI EM Index (Net)5 performed slightly better, with a -3.39% return. For bond investors, the Bloomberg Barclays U.S. Aggregate Bond Index6 returned a robust 8.74%, the Bloomberg Barclays Global Aggregate ex-USD Index7 gained a modest 0.71%, and the Bloomberg Barclays Municipal Bond Index8 returned 4.45% while the ICE BofA U.S. High Yield Index9 lost 1.10%.
The fiscal year began on a positive note.
The 12-month period began with the U.S. equity market advancing to new highs in July 2019. U.S. President Donald Trump initially backed off of earlier tariff threats against Mexico and China. However, later in July, the U.S. reversed course and threatened to impose higher tariffs on China’s exports after talks failed. China responded with tariff threats of its own and devalued the renminbi, roiling global markets. Major U.S. stock market indices closed July with the worst weekly results of the year. Bond prices gained as Treasury yields fell to multiyear lows, and the yield curve inverted at multiple points along the 30-year arc, with shorter term yields higher than longer-term. At the end of July, the U.S. Federal Reserve (Fed) cut its federal funds rate by 0.25%.
In August, U.S.-China trade tensions continued with no signs of compromise. Evidence of a continued global economic slowdown mounted, and central banks in China, New Zealand, and Thailand cut interest rates. Industrial and manufacturing data declined in China,
| 1 | The Russell 1000® Index measures the performance of the 1,000 largest companies in the Russell 3000® Index, which represents approximately 92% of the total market capitalization of the Russell 3000® Index. You cannot invest directly in an index. |
| 2 | The Russell 2000® Index measures the performance of the 2,000 smallest companies in the Russell 3000® Index, which represents approximately 8% of the total market capitalization of the Russell 3000® Index. You cannot invest directly in an index. |
| 3 | The S&P 500 Index consists of 500 stocks chosen for market size, liquidity, and industry group representation. It is a market-value-weighted index with each stock’s weight in the index proportionate to its market value. You cannot invest directly in an index. |
| 4 | The Morgan Stanley Capital International (MSCI) All Country World Index (ACWI) ex USA Index (Net) is a free-float-adjusted market-capitalization-weighted index that is designed to measure the equity market performance of developed and emerging markets, excluding the United States. Source: MSCI. MSCI makes no express or implied warranties or representations and shall have no liability whatsoever with respect to any MSCI data contained herein. The MSCI data may not be further redistributed or used as a basis for other indices or any securities or financial products. This report is not approved, reviewed, or produced by MSCI. You cannot invest directly in an index. |
| 5 | The MSCI Emerging Markets (EM) Index (Net) is a free-float-adjusted market-capitalization-weighted index that is designed to measure equity market performance of emerging markets. You cannot invest directly in an index. |
| 6 | The Bloomberg Barclays U.S. Aggregate Bond Index is a broad-based benchmark that measures the investment-grade, U.S. dollar-denominated, fixed-rate taxable bond market, including Treasuries, government-related and corporate securities, mortgage-backed securities (agency fixed-rate and hybrid adjustable-rate mortgage pass-throughs), asset-backed securities, and commercial mortgage-backed securities. You cannot invest directly in an index. |
| 7 | The Bloomberg Barclays Global Aggregate ex-USD Index is an unmanaged index that provides a broad-based measure of the global investment-grade fixed-income markets excluding the U.S.-dollar-denominated debt market. You cannot invest directly in an index. |
| 8 | The Bloomberg Barclays Municipal Bond Index is an unmanaged index composed of long-term tax-exempt bonds with a minimum credit rating of Baa. You cannot invest directly in an index. |
| 9 | The ICE BofA U.S. High Yield Index is a market-capitalization-weighted index of domestic and Yankee high-yield bonds. The index tracks the performance of high-yield securities traded in the U.S. bond market. You cannot invest directly in an index. Copyright 2020. ICE Data Indices, LLC. All rights reserved. |
2 | Wells Fargo Strategic Municipal Bond Fund
Letter to shareholders (unaudited)
Canada, Japan, and Germany. Adding to global uncertainty, Italy’s prime minister resigned, many feared a crackdown in Hong Kong as protestors sustained their calls for reform, and U.K. Prime Minister Boris Johnson planned to suspend Parliament as Brexit’s deadline neared.
In the U.S., the Fed cut interest rates a second time in September. U.S. manufacturing data disappointed investors. The U.S. Congress announced it would pursue an impeachment investigation of President Trump. Meanwhile, the Brexit impasse showed no signs of resolution. Officials in China said that hitting the country’s economic growth goals for the year would be difficult considering the weight of tariffs and trade restrictions. Although the S&P 500 Index finished the third quarter with the best year-to-date returns in more than 20 years, concerns about future returns remained.
The fourth quarter started on a strong note, with U.S.-China trade tensions relaxing in October along with renewed optimism for a U.K. Brexit deal and positive macroeconomic data. The initial estimate of U.S. third-quarter gross domestic product (GDP) growth was a resilient 1.9% annualized rate, while the U.S. unemployment rate fell to a 50-year low of 3.5% in September. However, despite resilience among U.S. consumers, business confidence declined while manufacturing activity contracted. Concerned with a potential economic slowdown, the Fed lowered interest rates another quarter point in late October—its third rate cut in four months. This helped push the S&P 500 Index to a new all-time high while emerging market equities rallied and global bonds declined overall, reflecting a broad pickup in risk appetite.
Equity markets continued to rally in November despite ongoing geopolitical risks. Hopes for a U.S.-China trade deal buoyed investor confidence. U.S. business sentiment improved slightly, and manufacturing and services activity picked up. While consumer confidence and purchasing manager activity rose in the eurozone, China reported weakening manufacturing and consumer data. Bond yields rose marginally, leading to slightly negative returns for global government and investment-grade corporate bonds.
Financial markets ended 2019 with a boost from the U.S. and China accord on a Phase One trade deal. That, along with the landslide win by the pro-Brexit U.K. Conservative Party in a national election and ongoing central bank support, gave investors greater confidence. U.S. economic indicators were generally positive, with the exception of manufacturing activity and business confidence. Consumer confidence was resilient, fed by a robust labor market, tame inflation, and lower interest rates, which boosted housing affordability and stimulated homebuyer activity. The impeachment of President Trump had little impact on markets. Meanwhile, slowing Chinese economic activity, partly attributable to the trade war, led to further government stimulus at year-end through lower reserve ratios, allowing banks to lend more money.
The year-end rally continued in early January 2020. However, capital market volatility picked up sharply in late January on concerns over the potential impact of the coronavirus on the global economy and stock markets. With sentiment somewhat souring, perceived safe havens did well in January. The U.S. dollar and Japanese yen both rose, and government bonds outperformed equities. While the S&P 500 Index held its ground, emerging market equities tumbled, including those in Asia.
In February, the coronavirus became the major market focus. Fears of the virus’s impact on global growth led to expectations of increased global central bank monetary policy support. That led the 10-year U.S. Treasury yield to fall to an all-time low of 1.1% by the end of the month. Although equity markets initially shrugged off concerns about the outbreak, focusing instead on strong fourth-quarter earnings and improving business confidence in January, market sentiment turned sharply lower toward month-end and the S&P 500 Index lost 8.2% for the month. Oil prices tumbled as Russia and the Organization of the Petroleum Exporting countries compounded a major decline in oil demand with a brutal price war, partly aimed at dissuading further U.S. shale production. As a result, the price of West Texas Intermediate crude oil fell 13% in February.
Wells Fargo Strategic Municipal Bond Fund | 3
Letter to shareholders (unaudited)
“The global spread of the coronavirus led country after country to clamp down on social and business-related activity in order to contain the virus from causing even greater devastation and overwhelming health care systems.”
“Despite ongoing economic weakness and high levels of uncertainty on the containment of the coronavirus and the timing of an effective vaccine, financial markets continued to post widely positive returns in June.”
The global spread of the coronavirus led country after country to clamp down on social and business-related activity in order to contain the virus from causing even greater devastation and overwhelming health care systems. This abrupt stoppage of economic activity led to the sharp deceleration of global output, sending economies into a deep contraction. Central bank responses were swift, as they slashed interest rates and expanded quantitative easing programs to restore liquidity and confidence to the markets. In the U.S., the Fed introduced several new lending programs, funding investment-grade bonds, money market mutual funds, and commercial paper while purchasing Treasuries, mortgage-backed securities, and overnight repurchase agreements. Meanwhile, stock markets tumbled quickly into a bear market, ending the longest bull stock market in U.S. history.
Markets rebounded strongly in April, with the S&P 500 Index gaining 12.8% for the month and the MSCI ACWI ex USA Index (Net) returning 7.6%. The rebound was fueled by unprecedented government and central bank stimulus measures taken to buffer the economic damage created by mass shutdowns enacted in order to contain the virus’s spread. The U.S. economy contracted by an annualized 5.0% pace in the first quarter, with 30 million new unemployment insurance claims in six weeks. In the eurozone, first-quarter real GDP shrank 3.8%, with the composite April Flash Purchasing Managers’ Index, a monthly survey of purchasing managers, falling to an all-time low of 13.5. The European Central Bank expanded its quantitative easing to include the purchase of additional government bonds of countries with the greatest virus-related need, including Italy and Spain. China’s first-quarter GDP fell by 6.8% year over year. However, retail sales, production, and investment showed signs of recovery. Extreme oil-price volatility continued as global supply far exceeded demand.
In May, the equity market rebound continued, with the S&P 500 Index climbing a further 4.8%. European and Japanese stock markets also had monthly gains. Investors regained confidence on reports of early signs of success in human trials of a coronavirus vaccine. Growth stocks continued to outperform value stocks while returns on global government bonds were generally flat. In the U.S., a gap grew between the stock market rebound and devastating economic data points, including an April unemployment rate of 14.7%, the highest level since World War II. Purchasing managers’ indices continued to reflect weakening activity in May in both the manufacturing and services sectors. U.S. corporate earnings reports indicated a 14% year-over-year contraction in earnings from the first quarter of 2019. However, high demand for technology, driven by remote activity, helped maintain robust information technology sector earnings, which helped drive powerful well-known technology stocks higher.
Despite ongoing economic weakness and high levels of uncertainty on the containment of the coronavirus and the timing of an effective vaccine, financial markets continued to post widely positive returns in June. As economies reopened, there were hopeful signs. U.S. retail sales rose 17% in May while retail sales in the U.K. rebounded by 12%. However, year over year, sales remained depressed. Vitally important to market sentiment was the ongoing commitment by central banks globally to do all they can to provide economic support through liquidity and low borrowing costs. U.S. economic activity was aided by one-time $1,200 stimulus checks and $600 bonus weekly unemployment benefits due to expire at the end of July. However, unemployment remained in the double digits, easing somewhat from 14.7% in April to 11.1% in June. At period-end, numerous states reported alarming increases of coronavirus cases. China’s economic recovery picked up momentum in June, though it remained far from a full recovery.
4 | Wells Fargo Strategic Municipal Bond Fund
Letter to shareholders (unaudited)
Don’t let short-term uncertainty derail long-term investment goals.
Periods of investment uncertainty can present challenges, but experience has taught us that maintaining long-term investment goals can be an effective way to plan for the future. To help you create a sound strategy based on your personal goals and risk tolerance, Wells Fargo Funds offers more than 100 mutual funds spanning a wide range of asset classes and investment styles. Although diversification cannot guarantee an investment profit or prevent losses, we believe it can be an effective way to manage investment risk and potentially smooth out overall portfolio performance. We encourage investors to know their investments and to understand that appropriate levels of risk-taking may unlock opportunities.
Thank you for choosing to invest with Wells Fargo Funds. We appreciate your confidence in us and remain committed to helping you meet your financial needs.
Sincerely,

Andrew Owen
President
Wells Fargo Funds
|
For further information about your Fund, contact your investment professional, visit our website at wfam.com, or call us directly at 1-800-222-8222. |
Notice to Shareholders
At a meeting held on August 10-12, 2020, the Board of Trustees of the Fund approved a change to the Fund’s automatic conversion feature for Class C shares in order to shorten the required holding period from 10 to 8 years. As a result, on a monthly basis beginning November 5, 2020, Class C shares will convert automatically into Class A shares 8 years after the initial date of purchase or, if you acquired your Class C shares through an exchange or conversion from another share class, 8 years after the date you acquired your Class C shares. When Class C shares that you acquired through a purchase or exchange convert, any other Class C shares that you purchased with reinvested dividends and distributions also will convert into Class A shares on a pro rata basis.
Please note that a shorter holding period may apply depending on your intermediary. Please see “Appendix A—Sales Charge Reductions and Waivers for Certain Intermediaries” in the Fund’s prospectus for further information.
Wells Fargo Strategic Municipal Bond Fund | 5
Performance highlights (unaudited)
Investment objective
The Fund seeks current income exempt from regular federal income tax.
Manager
Wells Fargo Funds Management, LLC
Subadviser
Wells Capital Management Incorporated
Portfolio managers
Terry J. Goode
Robert J. Miller
Average annual total returns (%) as of June 30, 20201
| Including sales charge | Excluding sales charge | Expense ratios2 (%) | ||||||||||||||||||||||||||||||||
| Inception date | 1 year | 5 year | 10 year | 1 year | 5 year | 10 year | Gross | Net3 | ||||||||||||||||||||||||||
| Class A (VMPAX) | 12-1-1994 | -1.85 | 1.72 | 2.37 | 2.23 | 2.55 | 2.78 | 0.80 | 0.80 | |||||||||||||||||||||||||
| Class C (DHICX) | 8-18-1997 | 0.47 | 1.76 | 2.01 | 1.47 | 1.76 | 2.01 | 1.55 | 1.55 | |||||||||||||||||||||||||
| Class R6 (VMPRX)4 | 7-31-2018 | – | – | – | 2.51 | 2.76 | 2.97 | 0.42 | 0.42 | |||||||||||||||||||||||||
| Administrator Class (VMPYX) | 10-6-1997 | – | – | – | 2.34 | 2.68 | 2.93 | 0.74 | 0.68 | |||||||||||||||||||||||||
| Institutional Class (STRIX)5 | 11-30-2012 | – | – | – | 2.57 | 2.89 | 3.09 | 0.47 | 0.47 | |||||||||||||||||||||||||
| Bloomberg Barclays Short-Intermediate Municipal Bond Index6 | – | – | – | – | 3.65 | 2.73 | 2.81 | – | – | |||||||||||||||||||||||||
Figures quoted represent past performance, which is no guarantee of future results, and do not reflect taxes that a shareholder may pay on an investment in a fund. Investment return and principal value of an investment will fluctuate so that an investor’s shares, when redeemed, may be worth more or less than their original cost. Performance shown without sales charges would be lower if sales charges were reflected. Current performance may be lower or higher than the performance data quoted, which assumes the reinvestment of dividends and capital gains. Current month-end performance is available on the Fund’s website, wfam.com.
Index returns do not include transaction costs associated with buying and selling securities, any mutual fund fees or expenses, or any taxes. It is not possible to invest directly in an index.
For Class A shares, the maximum front-end sales charge is 4.00%. For Class C shares, the maximum contingent deferred sales charge is 1.00%. Performance including a contingent deferred sales charge assumes the sales charge for the corresponding time period. Class R6, Administrator Class, and Institutional Class shares are sold without a front-end sales charge or contingent deferred sales charge.
Bond values fluctuate in response to the financial condition of individual issuers, general market and economic conditions, and changes in interest rates. Changes in market conditions and government policies may lead to periods of heightened volatility in the bond market and reduced liquidity for certain bonds held by the Fund. In general, when interest rates rise, bond values fall and investors may lose principal value. Interest rate changes and their impact on the Fund and its share price can be sudden and unpredictable. High-yield securities have a greater risk of default and tend to be more volatile than higher-rated debt securities. The use of derivatives may reduce returns and/or increase volatility. Certain investment strategies tend to increase the total risk of an investment (relative to the broader market). The Fund is exposed to municipal securities risk. Consult the Fund’s prospectus for additional information on these and other risks. A portion of the Fund’s income may be subject to federal, state, and/or local income taxes or the Alternative Minimum Tax (AMT). Any capital gains distributions may be taxable.
Please see footnotes on page 7.
6 | Wells Fargo Strategic Municipal Bond Fund
Performance highlights (unaudited)
| Growth of $10,000 investment as of June 30, 20207 |
|
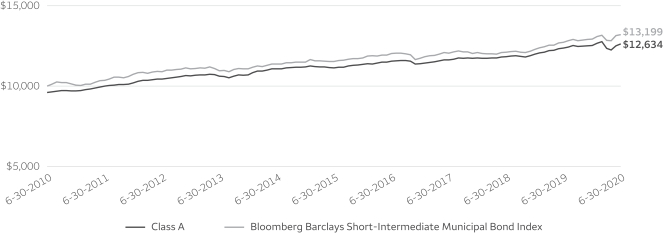
| 1 | Historical performance shown for this class prior to July 12, 2010, is based on the performance of the Fund’s predecessor, Evergreen Strategic Municipal Bond Fund. |
| 2 | Reflects the expense ratios as stated in the most recent prospectuses. The expense ratios shown are subject to change and may differ from the annualized expense ratios shown in the financial highlights of this report. |
| 3 | The manager has contractually committed through October 31, 2020, to waive fees and/or reimburse expenses to the extent necessary to cap total annual fund operating expenses after fee waivers at 0.81% for Class A, 1.56% for Class C, 0.43% for Class R6, 0.68% for Administrator Class, and 0.48% for Institutional Class. Brokerage commissions, stamp duty fees, interest, taxes, acquired fund fees and expenses (if any), and extraordinary expenses are excluded from the expense caps. Prior to or after the commitment expiration date, the caps may be increased or the commitment to maintain the caps may be terminated only with the approval of the Board of Trustees. Without these caps, the Fund’s returns would have been lower. The expense ratio paid by an investor is the net expense ratio (the total annual fund operating expenses after fee waivers) as stated in the prospectuses. |
| 4 | Historical performance shown for the Class R6 shares prior to their inception reflects the performance of the Institutional Class shares, and includes the higher expenses applicable to the Institutional Class shares. If these expenses had not been included, returns for the Class R6 shares would be higher. |
| 5 | Historical performance shown for the Institutional class shares prior to their inception reflects the performance of the Administrator Class shares, and includes the higher expenses applicable to the Administrator Class shares. If these expenses had not been included, returns for Institutional Class shares would be higher. |
| 6 | The Bloomberg Barclays Short-Intermediate Municipal Bond Index is a rules-based, market-value-weighted index composed of publicly traded municipal bonds that cover the U.S. dollar–denominated short-term tax-exempt bond market, including state and local general obligation bonds, revenue bonds, insured bonds, and prefunded bonds. You cannot invest directly in an index. |
| 7 | The chart compares the performance of Class A shares for the most recent ten years with the Bloomberg Barclays Short-Intermediate Municipal Bond Index. The chart assumes a hypothetical $10,000 investment in Class A shares and reflects all operating expenses and assumes the maximum initial sales charge of 4.00%. |
| 8 | Amounts are calculated based on the long-term total investments of the Fund. These amounts are subject to change and may have changed since the date specified. |
| 9 | The credit quality distribution of portfolio holdings reflected in the chart is based on ratings from Standard & Poor’s, Moody’s Investors Service, and/or Fitch Ratings Ltd. Credit quality ratings apply to the underlying holdings of the Fund and not to the Fund itself. The percentages of the Fund’s portfolio with the ratings depicted in the chart are calculated based on the total market value of fixed income securities held by the Fund. If a security was rated by all three rating agencies, the middle rating was utilized. If rated by two of three rating agencies, the lower rating was utilized, and if rated by one of the rating agencies, that rating was utilized. Standard & Poor’s rates the creditworthiness of bonds, ranging from AAA (highest) to D (lowest). Ratings from A to CCC may be modified by the addition of a plus (+) or minus (-) sign to show relative standing within the rating categories. Standard & Poor’s rates the creditworthiness of short-term notes from SP-1 (highest) to SP-3 (lowest). Moody’s rates the creditworthiness of bonds, ranging from Aaa (highest) to C (lowest). Ratings Aa to B may be modified by the addition of a number 1 (highest) to 3 (lowest) to show relative standing within the ratings categories. Moody’s rates the creditworthiness of short-term U.S. tax-exempt municipal securities from MIG 1/VMIG 1 (highest) to SG (lowest). Fitch rates the creditworthiness of bonds, ranging from AAA (highest) to D (lowest). Credit quality distribution is subject to change and may have changed since the date specified. |
Wells Fargo Strategic Municipal Bond Fund | 7
Performance highlights (unaudited)
MANAGER’S DISCUSSION
Fund highlights
| ∎ | The Fund underperformed its benchmark, the Bloomberg Barclays Short-Intermediate Municipal Bond Index, for the 12-month period that ended June 30, 2020. |
| ∎ | The Fund’s conservative duration positioning detracted from performance as yields moved considerably lower over the 12-month period ending June 30, 2020. However, yield-curve positioning modestly contributed to performance. |
| ∎ | Credit positioning detracted from performance as we were overweight lower investment-grade bonds (A- rated and BBB- rated) relative to higher investment-grade bonds. Higher-rated bonds outperformed over the 12-month period. |
| ∎ | The Fund’s underweight to pre-refunded bonds and overweight to revenue bonds positively affected performance, while the underweight to state and local general obligation bonds detracted from performance. Specifically, within the revenue bond sector, electric, education, and water and sewer bonds were the best-performing bonds in the index. The Fund’s underweight to those sectors detracted from performance. |
| Effective maturity distribution as of June 30, 20208 |
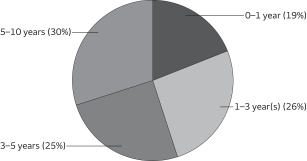 |
The coronavirus pandemic and the associated containment efforts became the dominant market influence over the 12-month period.
In 2019, market expectations moved the Federal Reserve (Fed) from a rate-hiking posture to multiple cuts in what was considered a “mid-cycle adjustment” at the time. Generally, positive U.S. economic data was enough for most investors to expect continued slow growth and an extension of the economic expansion. Global trade tensions prompted a rise in market volatility, which subsided with the passage of a Phase One U.S.-China trade deal late in the calendar year. President Trump was formally impeached and ultimately acquitted by the U.S. Senate. By March, the coronavirus pandemic brought an end to the longest bull market on record.
The municipal bond market was heavily influenced by technical factors throughout the reporting period. Municipal mutual funds saw 61 straight weeks of net inflows, which pushed yields across ratings categories to all-time lows by late February. Low yields and ample demand drove municipal issuance higher but also altered the mix. Taxable municipal bonds as a proportion of new issue municipal debt was at its highest level since 2010 by period-end. Pandemic-related volatility and liquidity pressures prompted record-setting outflows from municipal bonds in March. Strong support by the Fed, including a Municipal Liquidity Facility, and more than $2.5 trillion in fiscal stimulus buoyed markets and bolstered investor confidence. Several weeks of consecutive positive net flows for municipal funds and strong demand for new bonds drove yields back near the lows for highly rated issues. The period ended with the Fed pledging to keep short rates low for the foreseeable future. The fundamental outlook for municipal issuers came into question as the path of recovery from the virus remains extraordinarily uncertain.
Factors across the market influenced Fund performance.
Coming into the year, municipal bonds had positive momentum in terms of technical factors with reduced tax-exempt supply and positive fund flows. In fact, until the market volatility in March, the industry had more than 60 weeks of positive flows. This caused a supply/demand imbalance, which drove rates down and credit spreads tighter. There was a clear disconnect between technicals and fundamentals as investors reached for income wherever they could find it, which resulted in credit spreads near all-time tights and a very flat yield curve.
Please see footnotes on page 7.
8 | Wells Fargo Strategic Municipal Bond Fund
Performance highlights (unaudited)
| Credit quality as of June 30, 20209 |
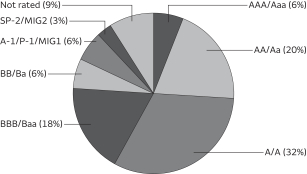 |
As the year began, we continued an up-in-quality trade as we believed that higher investment-grade bonds represented better relative value and that credit spreads were vulnerable as the economy slowed. Despite this, we chose to keep a moderate overweight in lower investment-grade bonds, especially those that were seasoned and that we believed had good total return characteristics. In terms of the curve, we had been moving from a barbell structure, with greater exposure to both shorter- and longer-duration bonds, to more key rate positions along the curve. We also slightly extended duration but remained defensively positioned. We were a little early to this trade and it was a modest detractor over the fiscal year although duration positioning was positive overall for the full period.
The beginning of the second half of the period was a continuation of the first half. We did not reverse course as we felt the market was ripe for correction. We did not anticipate that the country’s response to the pandemic would be the catalyst for a correction, but we were pretty well positioned for it with duration short to the benchmark and higher overall credit quality, and we had removed most of the barbell and had lightened up on credits that we thought would be vulnerable in an economic downturn. The market had rallied pretty hard through February, which already had returns in excess of 100 basis points (bps; 100 bps equal 1.00%) of what many had forecast for the year.
March was a turning point for the market and after 61 weeks of positive fund flows, which were supportive of municipal valuations, outflows began and they were extreme as the risk-off trade took hold. According to Lipper, during the week of March 18 there were outflows of $12.2 billion, a new record that was broken the following week, with $13.7 billion of outflows. The Fund experienced small outflows as well but we were not forced sellers as we had been maintaining adequate cash equivalents in the portfolio.
With the markets in disarray and the short end of the market seizing up, the Fed began unprecedented support, first by cutting rates and second by announcing open-ended quantitative easing and targeted help to the municipal market through the Money Market Liquidity Facility and the Municipal Liquidity Facility. Not to be outdone, Congress passed four packages for about $3 trillion in aid across the economy.
This stabilized the markets and by mid-April the municipal market was firmly on solid ground. High-grade bonds were in demand, but lower investment-grade and high-yield bond spreads remained wide, as did certain sectors, including transportation, education, and hospitals. We took advantage of this dislocation and began adding to lower investment-grade paper in late March that had been vetted by our analytical team and we felt were mispriced in the market buying names such as New York MTA and Chicago O’Hare International Airport. Lower investment-grade paper continued to lag thorough early June but caught a bid and did well in June. Rates for high-grade paper are now at or near historical lows and credit spreads are tightening rapidly as technical factors are once again driving the market higher in price.
Rates are likely to remain low over the foreseable future, and rating downgrades expected but defaults in the investment-grade space to remain rare.
The longest economic expansion in history is over. The economic impact of the pandemic worldwide and nationally has yet to be fully realized. As we reopen the economy, we will see a boost versus the lows of April, but economic activity is likely to remain muted and pressure more troubled credits. Most states and municipalities came into this in the best financial shape they’ve been in for decades, notwithstanding pension challenges of certain issuers. Municipal issuers have a long history of managing through deep recessions and many have already cut expenses and furloughed employees and are preparing to raise taxes. That doesn’t mean it will be easy, and we have seen and will continue to see a deterioration of credit quality and resultant downgrades, but we don’t believe that will result in a material increase in defaults in the investment-grade space. We believe a deep analytical bench and individual security selection will be important drivers of performance in the next year. We expect to manage duration tactically depending on technical factors and market opportunities. Credit exposure will also vary depending on the work of our analytical team and where we find relative value in the market.
Please see footnotes on page 7.
Wells Fargo Strategic Municipal Bond Fund | 9
As a shareholder of the Fund, you incur two types of costs: (1) transaction costs, including sales charges (loads) on purchase payments and contingent deferred sales charges (if any) on redemptions and (2) ongoing costs, including management fees, distribution (12b-1) and/or shareholder servicing fees, and other Fund expenses. This example is intended to help you understand your ongoing costs (in dollars) of investing in the Fund and to compare these costs with the ongoing costs of investing in other mutual funds.
The example is based on an investment of $1,000 invested at the beginning of the six-month period and held for the entire period from January 1, 2020 to June 30, 2020.
Actual expenses
The “Actual” line of the table below provides information about actual account values and actual expenses. You may use the information in this line, together with the amount you invested, to estimate the expenses that you paid over the period. Simply divide your account value by $1,000 (for example, an $8,600 account value divided by $1,000 = 8.6), then multiply the result by the number in the “Actual” line under the heading entitled “Expenses paid during period” for your applicable class of shares to estimate the expenses you paid on your account during this period.
Hypothetical example for comparison purposes
The “Hypothetical” line of the table below provides information about hypothetical account values and hypothetical expenses based on the Fund’s actual expense ratio and an assumed rate of return of 5% per year before expenses, which is not the Fund’s actual return. The hypothetical account values and expenses may not be used to estimate the actual ending account balance or expenses you paid for the period. You may use this information to compare the ongoing costs of investing in the Fund and other funds. To do so, compare this 5% hypothetical example with the 5% hypothetical examples that appear in the shareholder reports of the other funds.
Please note that the expenses shown in the table are meant to highlight your ongoing costs only and do not reflect any transactional costs, such as sales charges (loads) and contingent deferred sales charges. Therefore, the “Hypothetical” line of the table is useful in comparing ongoing costs only and will not help you determine the relative total costs of owning different funds. In addition, if these transactional costs were included, your costs would have been higher.
| Beginning account value 1-1-2020 | Ending account value 6-30-2020 | Expenses paid during the period1 | Annualized net expense ratio | |||||||||||||
Class A | ||||||||||||||||
Actual | $ | 1,000.00 | $ | 1,007.92 | $ | 3.94 | 0.79 | % | ||||||||
Hypothetical (5% return before expenses) | $ | 1,000.00 | $ | 1,020.93 | $ | 3.97 | 0.79 | % | ||||||||
Class C | ||||||||||||||||
Actual | $ | 1,000.00 | $ | 1,004.18 | $ | 7.67 | 1.54 | % | ||||||||
Hypothetical (5% return before expenses) | $ | 1,000.00 | $ | 1,017.21 | $ | 7.72 | 1.54 | % | ||||||||
Class R6 | ||||||||||||||||
Actual | $ | 1,000.00 | $ | 1,009.82 | $ | 2.05 | 0.41 | % | ||||||||
Hypothetical (5% return before expenses) | $ | 1,000.00 | $ | 1,022.82 | $ | 2.06 | 0.41 | % | ||||||||
Administrator Class | ||||||||||||||||
Actual | $ | 1,000.00 | $ | 1,008.46 | $ | 3.40 | 0.68 | % | ||||||||
Hypothetical (5% return before expenses) | $ | 1,000.00 | $ | 1,021.48 | $ | 3.42 | 0.68 | % | ||||||||
Institutional Class | ||||||||||||||||
Actual | $ | 1,000.00 | $ | 1,009.56 | $ | 2.30 | 0.46 | % | ||||||||
Hypothetical (5% return before expenses) | $ | 1,000.00 | $ | 1,022.58 | $ | 2.31 | 0.46 | % | ||||||||
| 1 | Expenses paid is equal to the annualized net expense ratio of each class multiplied by the average account value over the period, multiplied by the number of days in the most recent fiscal half-year divided by the number of days in the fiscal year (to reflect the one-half-year period). |
10 | Wells Fargo Strategic Municipal Bond Fund
Portfolio of investments—June 30, 2020
| Interest rate | Maturity date | Principal | Value | |||||||||||||
| Municipal Obligations: 98.15% |
| |||||||||||||||
Alabama: 1.43% |
| |||||||||||||||
| Health Revenue: 0.21% | ||||||||||||||||
Birmingham AL Special Care Facilities Ascension Senior Credit Group Series C-1 | 1.85 | % | 11-15-2046 | $ | 5,395,000 | $ | 5,549,998 | |||||||||
|
| |||||||||||||||
| Industrial Development Revenue: 0.15% | ||||||||||||||||
Selma AL Industrial Development Board Refunding Bonds Gulf Opportunity Zone International Paper Company | 2.00 | 11-1-2033 | 3,675,000 | 3,796,349 | ||||||||||||
|
| |||||||||||||||
| Utilities Revenue: 1.07% | ||||||||||||||||
Alabama Black Belt Energy Gas District Series A | 4.00 | 12-1-2048 | 2,000,000 | 2,182,240 | ||||||||||||
Alabama Black Belt Energy Gas District Series A (Royal Bank of Canada LIQ) | 4.00 | 7-1-2046 | 2,050,000 | 2,103,751 | ||||||||||||
Lower Alabama Gas Supply District Project #2 | 4.00 | 12-1-2050 | 8,660,000 | 9,853,868 | ||||||||||||
Southeast Alabama Gas Supply District Project #2 Series A | 4.00 | 6-1-2049 | 12,150,000 | 13,383,347 | ||||||||||||
| 27,523,206 | ||||||||||||||||
|
| |||||||||||||||
| 36,869,553 | ||||||||||||||||
|
| |||||||||||||||
Alaska: 0.84% |
| |||||||||||||||
| Health Revenue: 0.49% | ||||||||||||||||
Alaska Industrial Development & Export Authority Loan Anticipation Notes YKHC Project | 3.50 | 12-1-2020 | 6,000,000 | 6,011,580 | ||||||||||||
Alaska Industrial Development & Export Authority Tanana Chiefs Conference Project Series 2019A | 5.00 | 10-1-2027 | 1,455,000 | 1,808,885 | ||||||||||||
Alaska Industrial Development & Export Authority Tanana Chiefs Conference Project Series 2019A | 5.00 | 10-1-2028 | 1,530,000 | 1,942,014 | ||||||||||||
Alaska Industrial Development & Export Authority Tanana Chiefs Conference Project Series 2019A | 5.00 | 10-1-2029 | 2,220,000 | 2,869,949 | ||||||||||||
| 12,632,428 | ||||||||||||||||
|
| |||||||||||||||
| Industrial Development Revenue: 0.16% | ||||||||||||||||
Valdez AK Marine Terminal BP Pipelines Project Series B | 5.00 | 1-1-2021 | 4,000,000 | 4,075,120 | ||||||||||||
|
| |||||||||||||||
| Utilities Revenue: 0.19% | ||||||||||||||||
Alaska Industrial Development & Export Authority Power Refunding Bonds Snettisham Hydroelectric Project Series 2015 | 5.00 | 1-1-2022 | 1,735,000 | 1,825,203 | ||||||||||||
Alaska Industrial Development & Export Authority Power Refunding Bonds Snettisham Hydroelectric Project Series 2015 | 5.00 | 1-1-2023 | 2,835,000 | 3,072,715 | ||||||||||||
| 4,897,918 | ||||||||||||||||
|
| |||||||||||||||
| 21,605,466 | ||||||||||||||||
|
| |||||||||||||||
Arizona: 2.25% |
| |||||||||||||||
| Education Revenue: 0.55% | ||||||||||||||||
Arizona Board Regents University Arizona System Revenue Refunding Bond Speed Series C %% | 5.00 | 8-1-2023 | 1,000,000 | 1,096,140 | ||||||||||||
Arizona Board Regents University Arizona System Revenue Refunding Bond Speed Series C %% | 5.00 | 8-1-2025 | 600,000 | 700,980 | ||||||||||||
Arizona IDA Agribusiness & Equine Center Incorporated Project Series 2017B 144A | 4.00 | 3-1-2027 | 1,195,000 | 1,209,734 | ||||||||||||
Arizona IDA Education Facility Leman Academy of Excellence Incorporated Project 144A | 4.50 | 7-1-2029 | 765,000 | 768,993 | ||||||||||||
Maricopa County AZ IDA Educational Horizon Community Learning Center Project | 2.63 | 7-1-2021 | 550,000 | 547,454 | ||||||||||||
The accompanying notes are an integral part of these financial statements.
Wells Fargo Strategic Municipal Bond Fund | 11
Portfolio of investments—June 30, 2020
| Interest rate | Maturity date | Principal | Value | |||||||||||||
| Education Revenue (continued) | ||||||||||||||||
Phoenix AZ IDA BASIS Schools Incorporated Project Series A 144A | 3.00 | % | 7-1-2020 | $ | 120,000 | $ | 120,000 | |||||||||
Phoenix AZ IDA BASIS Schools Incorporated Project Series A 144A | 3.00 | 7-1-2020 | 670,000 | 670,000 | ||||||||||||
Phoenix AZ IDA Great Hearts Academies Project | 5.20 | 7-1-2022 | 240,000 | 247,099 | ||||||||||||
Phoenix AZ IDA Legacy Traditional School Project Series 2015 144A | 3.00 | 7-1-2020 | 305,000 | 305,000 | ||||||||||||
Pima County AZ IDA American Leadership Academy Project Series 2015 144A | 4.60 | 6-15-2025 | 940,000 | 953,038 | ||||||||||||
Pima County AZ IDA Charter Schools Project Series 2013 | 4.50 | 7-1-2020 | 530,000 | 530,000 | ||||||||||||
Pima County AZ IDA Charter Schools Project Series 2013 | 4.50 | 7-1-2021 | 1,210,000 | 1,249,337 | ||||||||||||
Pima County AZ IDA Charter Schools Project Series 2013 | 4.50 | 7-1-2022 | 1,245,000 | 1,263,526 | ||||||||||||
Pima County AZ IDA New Plan Learning Project Series A | 7.75 | 7-1-2035 | 985,000 | 963,704 | ||||||||||||
Pima County AZ IDA New Plan Learning Project Series A | 8.13 | 7-1-2041 | 2,945,000 | 2,923,030 | ||||||||||||
Pima County AZ IDA Noah Webster Schools Project Series A | 5.50 | 12-15-2023 | 785,000 | 819,964 | ||||||||||||
| 14,367,999 | ||||||||||||||||
|
| |||||||||||||||
| GO Revenue: 0.05% | ||||||||||||||||
Verrado AZ Community Facilities District #1 Series A 144A | 5.00 | 7-15-2020 | 700,000 | 700,273 | ||||||||||||
Verrado AZ Community Facilities District #1 Series A 144A | 5.00 | 7-15-2021 | 500,000 | 504,865 | ||||||||||||
| 1,205,138 | ||||||||||||||||
|
| |||||||||||||||
| Health Revenue: 0.50% | ||||||||||||||||
Maricopa County AZ IDA Senior Living Facilities Christian Care Retirement Apartments Incorporated Project | 5.00 | 1-1-2022 | 1,065,000 | 1,131,168 | ||||||||||||
Maricopa County AZ IDA Senior Living Facilities Christian Care Retirement Apartments Incorporated Project | 5.00 | 1-1-2023 | 1,120,000 | 1,232,750 | ||||||||||||
Maricopa County AZ IDA Senior Living Facilities Christian Care Surprise Incorporated Project 144A | 5.00 | 1-1-2026 | 3,015,000 | 2,965,313 | ||||||||||||
Maricopa County AZ IDA Series 2019C (SIFMA Municipal Swap +0.57%) ± | 0.70 | 1-1-2035 | 5,840,000 | 5,778,271 | ||||||||||||
Tempe AZ IDA Mirabella Arizona State University Project Series B1 144A | 4.00 | 10-1-2023 | 1,810,000 | 1,773,746 | ||||||||||||
| 12,881,248 | ||||||||||||||||
|
| |||||||||||||||
| Industrial Development Revenue: 0.49% | ||||||||||||||||
Chandler AZ IDA | 5.00 | 6-1-2049 | 10,980,000 | 12,645,117 | ||||||||||||
|
| |||||||||||||||
| Miscellaneous Revenue: 0.66% | ||||||||||||||||
Arizona IDA Revenue Lincoln South Beltway Project | 5.00 | 2-1-2027 | 1,255,000 | 1,561,132 | ||||||||||||
Arizona IDA Revenue Lincoln South Beltway Project | 5.00 | 5-1-2027 | 1,125,000 | 1,407,746 | ||||||||||||
Arizona IDA Revenue Lincoln South Beltway Project | 5.00 | 8-1-2027 | 1,205,000 | 1,516,866 | ||||||||||||
Arizona IDA Revenue Lincoln South Beltway Project | 5.00 | 11-1-2027 | 1,000,000 | 1,266,610 | ||||||||||||
Navajo Nation AZ Series A 144A | 4.00 | 12-1-2022 | 6,345,000 | 6,492,267 | ||||||||||||
Navajo Nation AZ Series A 144A | 5.00 | 12-1-2025 | 4,110,000 | 4,437,320 | ||||||||||||
Navajo Nation AZ Tribal Utility Authority (Municipal Government Guaranty Insured) | 4.00 | 1-1-2021 | 406,000 | 406,828 | ||||||||||||
| 17,088,769 | ||||||||||||||||
|
| |||||||||||||||
| 58,188,271 | ||||||||||||||||
|
| |||||||||||||||
Arkansas: 0.25% |
| |||||||||||||||
| Tax Revenue: 0.25% | ||||||||||||||||
Fayetteville AR Sales and Use Tax Capital Improvement Refunding Bonds Series A | 1.60 | 11-1-2035 | 6,120,000 | 6,390,259 | ||||||||||||
|
| |||||||||||||||
California: 1.76% |
| |||||||||||||||
| Airport Revenue: 0.20% | ||||||||||||||||
San Francisco County CA AMT Series A | 5.00 | 5-1-2027 | 4,775,000 | 5,092,538 | ||||||||||||
|
| |||||||||||||||
The accompanying notes are an integral part of these financial statements.
12 | Wells Fargo Strategic Municipal Bond Fund
Portfolio of investments—June 30, 2020
| Interest rate | Maturity date | Principal | Value | |||||||||||||
| Education Revenue: 0.04% |
| |||||||||||||||
California Municipal Finance Authority Charter School Nova Academy Project Series 2016A 144A | 4.00 | % | 6-15-2026 | $ | 760,000 | $ | 779,038 | |||||||||
California School Finance Authority Charter School Rocketship Education Obligated Group Series 2017A 144A | 4.50 | 6-1-2027 | 250,000 | 260,395 | ||||||||||||
| 1,039,433 | ||||||||||||||||
|
| |||||||||||||||
| Health Revenue: 0.72% | ||||||||||||||||
California Statewide CDA Health Facilities Catholic Series D (AGM Insured) (m) | 1.03 | 7-1-2041 | 8,700,000 | 8,700,000 | ||||||||||||
California Statewide CDA Health Facilities Catholic Series E (AGM Insured) (m) | 1.02 | 7-1-2040 | 8,525,000 | 8,525,000 | ||||||||||||
San Buenaventura CA Community Mental Health System | 6.50 | 12-1-2021 | 1,250,000 | 1,328,988 | ||||||||||||
| 18,553,988 | ||||||||||||||||
|
| |||||||||||||||
| Housing Revenue: 0.06% | ||||||||||||||||
California HFA Municipal Certificate of Participation Series 2 Class A | 4.00 | 3-20-2033 | 1,488,792 | 1,595,792 | ||||||||||||
|
| |||||||||||||||
| Miscellaneous Revenue: 0.13% | ||||||||||||||||
Compton CA PFA Lease 144A | 4.00 | 9-1-2022 | 3,390,000 | 3,364,202 | ||||||||||||
|
| |||||||||||||||
| Tax Revenue: 0.61% | ||||||||||||||||
Mizuho Tender Option Bond Trust Receipts/Floater Certificates Series 2019-MIZ9002 (Mizuho Capital Markets LLC LOC, Mizuho Capital Markets LLC LIQ) 144Aø | 0.35 | 3-1-2021 | 13,800,000 | 13,800,000 | ||||||||||||
Transbay Joint Powers Authority CA Green Subordinated Bond Tax Allocation Bond Series B | 2.40 | 10-1-2049 | 2,000,000 | 1,995,980 | ||||||||||||
| 15,795,980 | ||||||||||||||||
|
| |||||||||||||||
| 45,441,933 | ||||||||||||||||
|
| |||||||||||||||
Colorado: 1.27% |
| |||||||||||||||
| Education Revenue: 0.42% | ||||||||||||||||
Colorado ECFA Eagle Ridge Academy Project 144A | 3.63 | 11-1-2026 | 1,935,000 | 1,937,303 | ||||||||||||
Colorado ECFA Rocky Mountain Classical Academy Project | 6.38 | 9-1-2023 | 1,190,000 | 1,297,314 | ||||||||||||
Colorado ECFA Vanguard School Project | 4.00 | 6-15-2021 | 250,000 | 257,360 | ||||||||||||
Colorado ECFA Vanguard School Project | 4.00 | 6-15-2022 | 515,000 | 545,524 | ||||||||||||
Colorado ECFA Windsor Charter Academy 144A | 3.88 | 9-1-2026 | 1,085,000 | 1,077,611 | ||||||||||||
Colorado School of Mines Institutional Enterprise Refunding Bonds Series 2018A (1 Month LIBOR +0.50%) ± | 0.62 | 2-1-2023 | 5,820,000 | 5,726,531 | ||||||||||||
| 10,841,643 | ||||||||||||||||
|
| |||||||||||||||
| GO Revenue: 0.13% | ||||||||||||||||
Aviation Station North Metropolitan District #2 Colorado Improvement & Refunding Bonds Limited Tax Series A | 4.00 | 12-1-2029 | 500,000 | 487,525 | ||||||||||||
Centennial CO Southglenn Metropolitan District | 3.00 | 12-1-2021 | 463,000 | 458,898 | ||||||||||||
Grand River CO Hospital District (AGM Insured) | 5.00 | 12-1-2025 | 1,000,000 | 1,182,730 | ||||||||||||
Mirabelle Metropolitan District #2 Colorado Senior Series A | 5.00 | 12-1-2039 | 700,000 | 699,951 | ||||||||||||
Thompson Crossing Metropolitan District #4 Colorado Improvement & Refunding Bonds Limited Tax | 3.50 | 12-1-2029 | 515,000 | 497,274 | ||||||||||||
| 3,326,378 | ||||||||||||||||
|
| |||||||||||||||
| Health Revenue: 0.48% | ||||||||||||||||
Colorado Health Facilities Authority Catholic Health Initiatives Series 2011A | 5.00 | 2-1-2022 | 3,415,000 | 3,507,820 | ||||||||||||
Colorado Health Facilities Authority Catholic Health Initiatives Series 2011A | 5.25 | 2-1-2031 | 5,150,000 | 5,297,445 | ||||||||||||
Colorado Health Facilities Authority Series B-2 | 5.00 | 8-1-2049 | 3,000,000 | 3,528,990 | ||||||||||||
| 12,334,255 | ||||||||||||||||
|
| |||||||||||||||
The accompanying notes are an integral part of these financial statements.
Wells Fargo Strategic Municipal Bond Fund | 13
Portfolio of investments—June 30, 2020
| Interest rate | Maturity date | Principal | Value | |||||||||||||
| Miscellaneous Revenue: 0.07% | ||||||||||||||||
Colorado State Bridge Enterprise Senior Revenue Bonds AMT Central 70 Project Private Activity | 4.00 | % | 12-31-2024 | $ | 1,610,000 | $ | 1,804,907 | |||||||||
|
| |||||||||||||||
| Tax Revenue: 0.13% | ||||||||||||||||
Centerra CO Metropolitan District #1 Series 2017 144A | 5.00 | 12-1-2021 | 1,440,000 | 1,468,699 | ||||||||||||
Centerra CO Metropolitan District #1 Series 2017 144A | 5.00 | 12-1-2022 | 1,940,000 | 1,998,122 | ||||||||||||
| 3,466,821 | ||||||||||||||||
|
| |||||||||||||||
| Transportation Revenue: 0.04% | ||||||||||||||||
Colorado E-470 Public Highway Authority CAB Series A | 5.00 | 9-1-2040 | 800,000 | 909,184 | ||||||||||||
|
| |||||||||||||||
| 32,683,188 | ||||||||||||||||
|
| |||||||||||||||
Connecticut: 3.06% |
| |||||||||||||||
| Education Revenue: 0.24% | ||||||||||||||||
Connecticut HEFAR Yale University Issue Series A-2 | 2.00 | 7-1-2042 | 1,500,000 | 1,602,570 | ||||||||||||
Connecticut State HEFA University of Hartford Project Series N | 5.00 | 7-1-2026 | 575,000 | 630,781 | ||||||||||||
Connecticut State HEFA University of Hartford Project Series N | 5.00 | 7-1-2027 | 430,000 | 475,344 | ||||||||||||
Connecticut State HEFA University of Hartford Project Series N | 5.00 | 7-1-2028 | 530,000 | 591,395 | ||||||||||||
Connecticut State Higher Education Supplemental Loan Authority AMT Chelsea Loan Program Series B | 5.00 | 11-15-2026 | 940,000 | 1,090,193 | ||||||||||||
Connecticut State Higher Education Supplemental Loan Authority AMT Chelsea Loan Program Series B | 5.00 | 11-15-2027 | 500,000 | 587,030 | ||||||||||||
Connecticut State Higher Education Supplemental Loan Authority AMT Chelsea Loan Program Series C | 5.00 | 11-15-2025 | 480,000 | 556,397 | ||||||||||||
Connecticut State Higher Education Supplemental Loan Authority AMT Chelsea Loan Program Series C | 5.00 | 11-15-2026 | 385,000 | 453,006 | ||||||||||||
Connecticut State Higher Education Supplemental Loan Authority AMT Chelsea Loan Program Series C | 5.00 | 11-15-2027 | 125,000 | 146,278 | ||||||||||||
| 6,132,994 | ||||||||||||||||
|
| |||||||||||||||
| GO Revenue: 0.37% | ||||||||||||||||
Bridgeport CT Series A | 5.00 | 6-1-2026 | 1,220,000 | 1,426,241 | ||||||||||||
Bridgeport CT Series A | 5.00 | 6-1-2027 | 1,425,000 | 1,684,265 | ||||||||||||
Bridgeport CT Series A | 5.00 | 6-1-2028 | 1,605,000 | 1,921,554 | ||||||||||||
Hartford CT Series A | 5.00 | 4-1-2025 | 2,500,000 | 2,737,475 | ||||||||||||
Hartford CT Series A | 5.00 | 4-1-2027 | 1,650,000 | 1,794,111 | ||||||||||||
| 9,563,646 | ||||||||||||||||
|
| |||||||||||||||
| Health Revenue: 0.39% | ||||||||||||||||
Connecticut HEFA Bridgeport Hospital Series D | 5.00 | 7-1-2020 | 500,000 | 500,000 | ||||||||||||
Connecticut HEFA Revenue Hartford Healthcare Series B2 | 5.00 | 7-1-2053 | 7,800,000 | 9,684,870 | ||||||||||||
| 10,184,870 | ||||||||||||||||
|
| |||||||||||||||
| Housing Revenue: 0.38% | ||||||||||||||||
Meriden CT MFHR Yale Acres Project | 1.73 | 8-1-2022 | 9,635,000 | 9,780,392 | ||||||||||||
|
| |||||||||||||||
| Miscellaneous Revenue: 0.10% | ||||||||||||||||
Connecticut Series A (SIFMA Municipal Swap +0.75%) ± | 0.88 | 3-1-2021 | 2,700,000 | 2,701,080 | ||||||||||||
|
| |||||||||||||||
| Tax Revenue: 1.58% | ||||||||||||||||
Connecticut State Special Tax Obligation Revenue Transportation Infrastructure Purpose Series A | 5.00 | 8-1-2029 | 16,280,000 | 19,317,034 | ||||||||||||
Connecticut State Special Tax Obligation Revenue Transportation Infrastructure Purpose Series B | 5.00 | 10-1-2030 | 3,000,000 | 3,794,340 | ||||||||||||
The accompanying notes are an integral part of these financial statements.
14 | Wells Fargo Strategic Municipal Bond Fund
Portfolio of investments—June 30, 2020
| Interest rate | Maturity date | Principal | Value | |||||||||||||
| Tax Revenue (continued) | ||||||||||||||||
Connecticut State Special Tax Obligation Revenue Transportation Infrastructure Purpose Series B | 5.00 | % | 10-1-2031 | $ | 9,000,000 | $ | 11,314,980 | |||||||||
Connecticut State Special Tax Obligation Revenue Transportation Infrastructure Purpose Series B | 5.00 | 10-1-2032 | 5,000,000 | 6,244,900 | ||||||||||||
| 40,671,254 | ||||||||||||||||
|
| |||||||||||||||
| 79,034,236 | ||||||||||||||||
|
| |||||||||||||||
Delaware: 0.07% |
| |||||||||||||||
| Education Revenue: 0.07% | ||||||||||||||||
Delaware EDA Odyssey Charter School Project Series A 144A | 6.25 | 9-1-2025 | 1,730,000 | 1,838,454 | ||||||||||||
|
| |||||||||||||||
District of Columbia: 0.79% |
| |||||||||||||||
| Housing Revenue: 0.63% | ||||||||||||||||
District of Columbia HFA MFHR 1550 First Street Project | 1.46 | 6-1-2039 | 16,100,000 | 16,313,003 | ||||||||||||
|
| |||||||||||||||
| Water & Sewer Revenue: 0.16% | ||||||||||||||||
District of Columbia Water and Sewer Authority Public Utility Subordinated Lien Bond Series C | 1.75 | 10-1-2054 | 4,000,000 | 4,136,840 | ||||||||||||
|
| |||||||||||||||
| 20,449,843 | ||||||||||||||||
|
| |||||||||||||||
Florida: 2.72% |
| |||||||||||||||
| Airport Revenue: 0.72% | ||||||||||||||||
Broward County FL Port Facilities Revenue Refunding Bond Series C | 5.00 | 9-1-2027 | 2,330,000 | 2,820,628 | ||||||||||||
Miami Dade County FL Aviation Refunding Bond AMT | 5.00 | 10-1-2029 | 11,000,000 | 12,412,950 | ||||||||||||
Miami Dade County FL Seaport AMT Series B | 6.00 | 10-1-2032 | 1,385,000 | 1,569,288 | ||||||||||||
Miami-Dade County FL Seaport AMT Series B | 6.00 | 10-1-2033 | 1,500,000 | 1,696,545 | ||||||||||||
| 18,499,411 | ||||||||||||||||
|
| |||||||||||||||
| Education Revenue: 0.31% | ||||||||||||||||
Capital Trust Agency Educational Facilities Renaissance Charter School Incorporated Projects Series 2017A 144A | 4.38 | 6-15-2027 | 1,275,000 | 1,299,314 | ||||||||||||
Capital Trust Agency Educational Facilities Renaissance Charter School Incorporated Projects Series A 144A | 4.00 | 6-15-2029 | 2,410,000 | 2,444,415 | ||||||||||||
Capital Trust Agency FL Educational Facilities Revenue Imagine School at Land O’ Lakes 144A | 3.00 | 12-15-2029 | 420,000 | 383,473 | ||||||||||||
Florida State HEFAR Educational Facilities Florida Institute of Technology | 5.00 | 10-1-2027 | 650,000 | 734,949 | ||||||||||||
Florida State HEFAR Educational Facilities Florida Institute of Technology | 5.00 | 10-1-2028 | 1,050,000 | 1,197,000 | ||||||||||||
Florida State HEFAR Educational Facilities Florida Institute of Technology | 5.00 | 10-1-2029 | 1,000,000 | 1,146,910 | ||||||||||||
Miami-Dade County FL IDA Youth Charter Schools Project Series 2015A 144A | 5.00 | 9-15-2025 | 800,000 | 821,304 | ||||||||||||
| 8,027,365 | ||||||||||||||||
|
| |||||||||||||||
| Health Revenue: 0.49% | ||||||||||||||||
Jacksonville FL HCFR Baptist Health Series D ø | 0.12 | 8-1-2036 | 8,000,000 | 8,000,000 | ||||||||||||
Lakeland FL Hospital System Lakeland Regional Health System | 5.00 | 11-15-2022 | 4,495,000 | 4,744,068 | ||||||||||||
| 12,744,068 | ||||||||||||||||
|
| |||||||||||||||
| Housing Revenue: 0.16% | ||||||||||||||||
University of West Florida Foundation Incorporated Dormitory Series A | 5.00 | 6-1-2021 | 1,265,000 | 1,315,524 | ||||||||||||
University of West Florida Foundation Incorporated Dormitory Series A | 5.00 | 6-1-2022 | 1,325,000 | 1,434,445 | ||||||||||||
University of West Florida Foundation Incorporated Dormitory Series A | 5.00 | 6-1-2023 | 1,190,000 | 1,338,429 | ||||||||||||
| 4,088,398 | ||||||||||||||||
|
| |||||||||||||||
The accompanying notes are an integral part of these financial statements.
Wells Fargo Strategic Municipal Bond Fund | 15
Portfolio of investments—June 30, 2020
| Interest rate | Maturity date | Principal | Value | |||||||||||||
| Industrial Development Revenue: 0.11% | ||||||||||||||||
Escambia County FL Environmental Improvement Refunding Bonds International Paper Company Project Series B | 2.00 | % | 11-1-2033 | $ | 825,000 | $ | 852,242 | |||||||||
Florida Development Finance Corporation 144A | 5.00 | 5-1-2029 | 2,000,000 | 2,128,240 | ||||||||||||
| 2,980,482 | ||||||||||||||||
|
| |||||||||||||||
| Miscellaneous Revenue: 0.15% | ||||||||||||||||
Florida Village Community Development District #10 Special Assessment Bonds | 5.13 | 5-1-2024 | 1,785,000 | 1,897,491 | ||||||||||||
Florida Village Community Development District #12 Special Assessment Bonds Series 2016 | 2.88 | 5-1-2021 | 330,000 | 331,980 | ||||||||||||
Florida Village Community Development District #13 Special Assessment Bonds | 2.63 | 5-1-2024 | 500,000 | 497,730 | ||||||||||||
Pinellas County FL IDA 2017 Foundation for Global Understanding Incorporated Project | 5.00 | 7-1-2029 | 1,000,000 | 1,100,770 | ||||||||||||
| 3,827,971 | ||||||||||||||||
|
| |||||||||||||||
| Resource Recovery Revenue: 0.14% | ||||||||||||||||
Florida Development Finance Corporation Solid Waste AMT Pro USA Incorporated 144A | 5.00 | 8-1-2029 | 3,500,000 | 3,574,690 | ||||||||||||
|
| |||||||||||||||
| Transportation Revenue: 0.07% | ||||||||||||||||
Osceola County FL Transportation Revenue Improvement & Refunding Bonds Osceola Parkway Series 2019A-1 | 5.00 | 10-1-2027 | 950,000 | 1,164,615 | ||||||||||||
Osceola County FL Transportation Revenue Improvement & Refunding Bonds Osceola Parkway Series 2019A-1 | 5.00 | 10-1-2029 | 450,000 | 569,331 | ||||||||||||
| 1,733,946 | ||||||||||||||||
|
| |||||||||||||||
| Water & Sewer Revenue: 0.57% | ||||||||||||||||
Tohopekaliga FL Water Authority Utility System Bond 144A | 5.00 | 10-1-2025 | 12,000,000 | 14,761,920 | ||||||||||||
|
| |||||||||||||||
| 70,238,251 | ||||||||||||||||
|
| |||||||||||||||
Georgia: 4.16% |
| |||||||||||||||
| Housing Revenue: 0.04% | ||||||||||||||||
Northwest Georgia Housing Authority MFHR Charles Hight Apartments Project (FHA Insured) | 1.54 | 8-1-2022 | 1,000,000 | 1,008,260 | ||||||||||||
|
| |||||||||||||||
| Transportation Revenue: 0.09% | ||||||||||||||||
Georgia Road & Tollway Authority I-75 S Express Lanes Project Series A 144A¤ | 0.00 | 6-1-2024 | 2,500,000 | 2,252,425 | ||||||||||||
|
| |||||||||||||||
| Utilities Revenue: 4.03% | ||||||||||||||||
Bartow County GA Development Authority Pollution Control Georgia Power Company Plant Bowen Project | 1.55 | 8-1-2043 | 6,500,000 | 6,508,320 | ||||||||||||
Bartow County GA Development Authority Pollution Control Georgia Power Company Plant Bowen Project | 2.75 | 12-1-2032 | 4,500,000 | 4,646,970 | ||||||||||||
Burke County GA Development Authority Georgia Power Company Plant Vogtle Project | 2.25 | 10-1-2032 | 1,500,000 | 1,531,365 | ||||||||||||
Burke County GA Development Authority Oglethorpe Power Corporation Vogtle Project Series E | 3.25 | 11-1-2045 | 3,000,000 | 3,205,110 | ||||||||||||
Burke County GA Development Authority Oglethorpe Power Corporation Vogtle Project Series F | 3.00 | 11-1-2045 | 14,955,000 | 15,514,157 | ||||||||||||
Burke County GA Development Authority PCR Bonds Georgia Power Company Plant Vogtle Project | 1.70 | 12-1-2049 | 3,500,000 | 3,515,225 | ||||||||||||
Floyd County GA PCR Georgia Power Company Plant Hammond Project | 2.35 | 7-1-2022 | 8,875,000 | 8,938,634 | ||||||||||||
Main Street Natural Gas Incorporated Georgia Gas Project Series B | 4.00 | 8-1-2049 | 10,000,000 | 11,284,900 | ||||||||||||
The accompanying notes are an integral part of these financial statements.
16 | Wells Fargo Strategic Municipal Bond Fund
Portfolio of investments—June 30, 2020
| Interest rate | Maturity date | Principal | Value | |||||||||||||
| Utilities Revenue (continued) | ||||||||||||||||
Main Street Natural Gas Incorporated Georgia Gas Project Series C (Royal Bank of Canada LIQ) | 4.00 | % | 8-1-2048 | $ | 14,485,000 | $ | 15,851,515 | |||||||||
Main Street Natural Gas Incorporated Georgia Gas Project Series C | 4.00 | 3-1-2050 | 10,500,000 | 12,055,785 | ||||||||||||
Main Street Natural Gas Incorporated Georgia Gas Project Subordinate Bond Series A (Royal Bank of Canada LIQ) | 4.00 | 4-1-2048 | 2,640,000 | 2,873,587 | ||||||||||||
Main Street Natural Gas Incorporated Georgia Gas Project Subordinate Bond Series B (1 Month LIBOR +0.75%) ± | 0.87 | 4-1-2048 | 4,700,000 | 4,659,862 | ||||||||||||
Municipal Electric Authority Georgia General Resolution Projects Subordinate Bonds Series A | 5.00 | 1-1-2028 | 1,035,000 | 1,275,793 | ||||||||||||
Municipal Electric Authority Georgia General Resolution Projects Subordinated Bonds Series A | 5.00 | 1-1-2027 | 1,010,000 | 1,219,757 | ||||||||||||
Municipal Electric Authority Georgia Plant Vogtle Units 3&4 Project M Series A | 5.00 | 1-1-2027 | 300,000 | 362,304 | ||||||||||||
Municipal Electric Authority Georgia Plant Vogtle Units 3&4 Project M Series A | 5.00 | 1-1-2028 | 400,000 | 493,060 | ||||||||||||
Municipal Electric Authority Georgia Plant Vogtle Units 3&4 Project M Series A | 5.00 | 1-1-2029 | 400,000 | 496,944 | ||||||||||||
Municipal Electric Authority Georgia Plant Vogtle Units 3&4 Project P Series B | 5.00 | 1-1-2028 | 1,000,000 | 1,228,700 | ||||||||||||
Municipal Electric Authority Georgia Plant Vogtle Units 3&4 Project P Series B | 5.00 | 1-1-2029 | 910,000 | 1,126,717 | ||||||||||||
Municipal Electric Authority Georgia Project One Subordinated Bonds Series A | 5.00 | 1-1-2027 | 1,150,000 | 1,388,832 | ||||||||||||
Municipal Electric Authority Georgia Project One Subordinated Bonds Series A | 5.00 | 1-1-2028 | 1,270,000 | 1,565,466 | ||||||||||||
Municipal Electric Authority Georgia Project One Subordinated Bonds Series A | 5.00 | 1-1-2029 | 1,140,000 | 1,432,319 | ||||||||||||
Municipal Electric Authority Georgia Project One Subordinated Bonds Series A | 5.00 | 1-1-2030 | 1,025,000 | 1,281,086 | ||||||||||||
Municipal Electric Authority Georgia Project One Subordinated Bonds Series A | 5.00 | 1-1-2031 | 1,385,000 | 1,721,001 | ||||||||||||
| 104,177,409 | ||||||||||||||||
|
| |||||||||||||||
| 107,438,094 | ||||||||||||||||
|
| |||||||||||||||
Guam: 0.04% |
| |||||||||||||||
| Water & Sewer Revenue: 0.04% | ||||||||||||||||
Guam Government Waterworks Authority Water & Wastewater System Series 2014A | 5.00 | 7-1-2020 | 1,000,000 | 1,000,000 | ||||||||||||
|
| |||||||||||||||
Hawaii: 0.38% |
| |||||||||||||||
| Airport Revenue: 0.04% | ||||||||||||||||
Hawaii Airports System Revenue Refunding Bond AMT | 5.00 | 7-1-2024 | 1,000,000 | 1,040,920 | ||||||||||||
|
| |||||||||||||||
| Health Revenue: 0.34% | ||||||||||||||||
Hawaii Department of Budget & Finance Queens Health System Series B (SIFMA Municipal Swap +0.45%) ± | 0.58 | 7-1-2039 | 8,815,000 | 8,815,000 | ||||||||||||
|
| |||||||||||||||
| 9,855,920 | ||||||||||||||||
|
| |||||||||||||||
Illinois: 19.24% |
| |||||||||||||||
| Airport Revenue: 2.14% | ||||||||||||||||
Chicago IL Midway Airport Second Lien Refunding Bonds Series 2013A | 5.50 | 1-1-2027 | 3,925,000 | 4,287,827 | ||||||||||||
Chicago IL Midway Airport Second Lien Refunding Bonds Series 2014A | 5.00 | 1-1-2026 | 7,000,000 | 7,777,210 | ||||||||||||
Chicago IL Midway Airport Second Lien Refunding Bonds Series 2014A | 5.00 | 1-1-2030 | 5,175,000 | 5,690,327 | ||||||||||||
Chicago IL O’Hare International Airport AMT Passenger Facility Charge Refunding Bonds Series B | 5.00 | 1-1-2032 | 5,125,000 | 5,371,923 | ||||||||||||
Chicago IL O’Hare International Airport Senior Lien Bonds Series 2015 C | 5.00 | 1-1-2022 | 695,000 | 734,497 | ||||||||||||
Chicago IL O’Hare International Airport Senior Lien Bonds Series 2015 D | 5.00 | 1-1-2021 | 500,000 | 510,475 | ||||||||||||
Chicago IL O’Hare International Airport Senior Lien Refunding Bonds Series 2013A | 5.00 | 1-1-2026 | 2,690,000 | 2,929,383 | ||||||||||||
Chicago IL O’Hare International Airport Senior Lien Refunding Bonds Series 2015A | 5.00 | 1-1-2028 | 10,000,000 | 11,434,600 | ||||||||||||
Chicago IL O’Hare International Airport Senior Lien Refunding Bonds Series 2017D | 5.00 | 1-1-2025 | 1,700,000 | 1,969,450 | ||||||||||||
The accompanying notes are an integral part of these financial statements.
Wells Fargo Strategic Municipal Bond Fund | 17
Portfolio of investments—June 30, 2020
| Interest rate | Maturity date | Principal | Value | |||||||||||||
| Airport Revenue (continued) | ||||||||||||||||
Chicago IL O’Hare International Airport Customer Facility Charge | 5.25 | % | 1-1-2023 | $ | 1,350,000 | $ | 1,444,986 | |||||||||
Chicago IL O’Hare International Airport Customer Facility Charge | 5.25 | 1-1-2024 | 1,665,000 | 1,777,537 | ||||||||||||
Chicago lL O’Hare International Airport Passenger Facility Charge | 4.00 | 1-1-2029 | 10,955,000 | 11,310,052 | ||||||||||||
| 55,238,267 | ||||||||||||||||
|
| |||||||||||||||
| Education Revenue: 0.21% | ||||||||||||||||
University of Illinois Board of Trustees Auxiliary Facilities System Refunding Bond | 4.00 | 4-1-2030 | 5,000,000 | 5,308,100 | ||||||||||||
|
| |||||||||||||||
| GO Revenue: 7.01% | ||||||||||||||||
Bensenville IL Series B (AGM Insured) | 5.00 | 12-30-2025 | 435,000 | 463,997 | ||||||||||||
Berwyn IL Series A | 5.00 | 12-1-2028 | 3,000,000 | 3,322,950 | ||||||||||||
Chicago IL Board of Education Unlimited Tax General Obligation Refunding Bonds Series 2018A (AGM Insured) | 5.00 | 12-1-2024 | 3,000,000 | 3,349,140 | ||||||||||||
Chicago IL CAB City Colleges (National Insured) ¤ | 0.00 | 1-1-2027 | 7,720,000 | 5,976,284 | ||||||||||||
Chicago IL CAB City Colleges (National Insured) ¤ | 0.00 | 1-1-2024 | 9,800,000 | 8,672,510 | ||||||||||||
Chicago IL Park District General Obligation Limited Series A | 5.00 | 1-1-2022 | 400,000 | 420,408 | ||||||||||||
Chicago IL Park District General Obligation Limited Series A | 5.00 | 1-1-2023 | 800,000 | 864,416 | ||||||||||||
Chicago IL Park District General Obligation Limited Series A | 5.00 | 1-1-2024 | 550,000 | 610,077 | ||||||||||||
Chicago IL Park District General Obligation Limited Series A | 5.00 | 1-1-2025 | 625,000 | 707,988 | ||||||||||||
Chicago IL Park District General Obligation Limited Series C | 5.00 | 1-1-2022 | 1,000,000 | 1,051,020 | ||||||||||||
Chicago IL Park District General Obligation Limited Series C | 5.00 | 1-1-2023 | 1,000,000 | 1,080,520 | ||||||||||||
Chicago IL Park District General Obligation Limited Series C | 5.00 | 1-1-2024 | 410,000 | 454,784 | ||||||||||||
Chicago IL Park District Harbor Facilities Series D | 5.00 | 1-1-2022 | 1,645,000 | 1,728,928 | ||||||||||||
Chicago IL Park District Harbor Facilities Series D | 5.00 | 1-1-2023 | 1,175,000 | 1,269,611 | ||||||||||||
Chicago IL Park District Limited Tax Series B | 5.00 | 1-1-2022 | 4,675,000 | 4,913,519 | ||||||||||||
Chicago IL Park District Unlimited Tax Series E | 5.00 | 11-15-2022 | 1,235,000 | 1,329,589 | ||||||||||||
Chicago IL Park District Unlimited Tax Series E | 5.00 | 11-15-2023 | 1,295,000 | 1,432,322 | ||||||||||||
Chicago IL Prerefunded Refunding Bond Series C | 5.00 | 1-1-2022 | 1,490,000 | 1,593,138 | ||||||||||||
Chicago IL Prerefunded Refunding Bond Series C | 5.00 | 1-1-2023 | 765,000 | 852,149 | ||||||||||||
Chicago IL Refunding Bond Project Series B | 5.13 | 1-1-2027 | 1,700,000 | 1,808,936 | ||||||||||||
Chicago IL Series A | 5.00 | 1-1-2027 | 1,325,000 | 1,387,951 | ||||||||||||
Chicago IL Series A | 5.00 | 1-1-2027 | 8,000,000 | 8,692,000 | ||||||||||||
Chicago IL Series A | 5.00 | 1-1-2028 | 6,125,000 | 6,705,099 | ||||||||||||
Chicago IL Series C | 5.00 | 1-1-2021 | 1,000,000 | 1,023,080 | ||||||||||||
Chicago IL Unrefunded Balance Refunding Bond Series C | 5.00 | 1-1-2022 | 760,000 | 772,487 | ||||||||||||
Chicago IL Unrefunded Balance Refunding Bond Series C | 5.00 | 1-1-2023 | 1,735,000 | 1,806,170 | ||||||||||||
Cook County IL Community Consolidated School District #15 Limited Tax | 5.00 | 12-1-2026 | 2,540,000 | 3,119,907 | ||||||||||||
Cook County IL Refunding Bonds Series 2010 G | 5.00 | 11-15-2026 | 1,000,000 | 1,008,800 | ||||||||||||
Cook County IL School District #123 Oak Lawn CAB (National Insured) ¤ | 0.00 | 12-1-2021 | 1,090,000 | 1,073,138 | ||||||||||||
Cook County IL School District #153 Homewood Series A (AGM Insured) ¤ | 0.00 | 12-15-2023 | 1,225,000 | 1,177,372 | ||||||||||||
Cook County IL School District #227 Rich Township Refunding Bonds Series 2015 | 3.00 | 12-1-2024 | 965,000 | 1,043,464 | ||||||||||||
Cook County IL School District #99 Cicero Limited Tax (BAM Insured) | 5.00 | 12-1-2026 | 3,030,000 | 3,710,902 | ||||||||||||
Cook County IL School District #99 Cicero Limited Tax (BAM Insured) | 5.00 | 12-1-2027 | 2,950,000 | 3,683,636 | ||||||||||||
Cook County IL School District #99 Cicero Limited Tax (BAM Insured) | 5.00 | 12-1-2028 | 2,285,000 | 2,903,550 | ||||||||||||
Cook County IL School District #99 Cicero Refunding Bonds Limited Tax Series B | 5.00 | 12-1-2022 | 1,000,000 | 1,100,710 | ||||||||||||
Cook County IL School District #99 Cicero Refunding Bonds Limited Tax Series B | 5.00 | 12-1-2024 | 1,000,000 | 1,170,530 | ||||||||||||
Cook County IL School District #99 Cicero Refunding Bonds Limited Tax Series B | 5.00 | 12-1-2025 | 1,000,000 | 1,198,280 | ||||||||||||
Cook County IL Series A | 5.00 | 11-15-2021 | 2,250,000 | 2,311,088 | ||||||||||||
Cook County IL Series A | 5.00 | 11-15-2030 | 2,200,000 | 2,459,380 | ||||||||||||
Cook County IL Series A | 5.25 | 11-15-2022 | 10,040,000 | 10,150,942 | ||||||||||||
The accompanying notes are an integral part of these financial statements.
18 | Wells Fargo Strategic Municipal Bond Fund
Portfolio of investments—June 30, 2020
| Interest rate | Maturity date | Principal | Value | |||||||||||||
| GO Revenue (continued) | ||||||||||||||||
Cook County IL Series A | 5.25 | % | 11-15-2022 | $ | 1,000,000 | $ | 1,063,770 | |||||||||
Decatur IL Macon County General Obligation Refunding Bonds Series 2013 | 5.00 | 3-1-2024 | 1,405,000 | 1,557,850 | ||||||||||||
Decatur IL Macon County School District #061 Series 2011A (AGM Insured) | 5.25 | 1-1-2026 | 715,000 | 731,116 | ||||||||||||
Decatur IL Macon County School District #061 Series 2011A (AGM Insured) | 5.25 | 1-1-2027 | 1,495,000 | 1,527,950 | ||||||||||||
DeKalb & Kane Counties IL Community Unit School District #427 Sycamore Prerefunded Bond Balance CAB (AGM Insured) ¤ | 0.00 | 1-1-2024 | 455,000 | 444,635 | ||||||||||||
DeKalb & Kane Counties IL Community (AGM Insured) ¤ | 0.00 | 1-1-2024 | 2,345,000 | 2,295,567 | ||||||||||||
DeKalb & Kane Counties IL Community (AGM Insured) ¤ | 0.00 | 1-1-2024 | 2,830,000 | 2,699,396 | ||||||||||||
DuPage & Cook Counties IL Township High School District #86 Hinsdale | 4.00 | 1-15-2034 | 2,815,000 | 3,315,451 | ||||||||||||
Illinois Series A | 5.00 | 4-1-2023 | 3,500,000 | 3,679,935 | ||||||||||||
Illinois State | 5.00 | 11-1-2025 | 5,000,000 | 5,410,850 | ||||||||||||
Illinois State Series 2012 | 5.00 | 3-1-2028 | 6,000,000 | 6,134,040 | ||||||||||||
Kane, Cook & DuPage Counties IL School District #46 Elgin Series 2015A | 5.00 | 1-1-2028 | 1,555,000 | 1,784,705 | ||||||||||||
Kane, Cook & DuPage Counties IL School District #46 Elgin Series 2015D | 5.00 | 1-1-2032 | 1,025,000 | 1,172,200 | ||||||||||||
Kane, Cook & DuPage Counties IL School District #46 Elgin Unrefunded Bond Balance Series 2012B | 4.50 | 1-1-2025 | 4,295,000 | 4,539,300 | ||||||||||||
Kane, Cook & DuPage Counties IL School District #46 Prerefunded CAB Series B (Ambac Insured) ¤ | 0.00 | 1-1-2021 | 510,000 | 509,036 | ||||||||||||
Kane, Cook & DuPage Counties IL School District #46 Unrefunded CAB Series B (Ambac Insured) ¤ | 0.00 | 1-1-2021 | 595,000 | 593,376 | ||||||||||||
Madison-Macoupin Etc Counties IL Community College District #536 Series A (BAM Insured) | 5.00 | 11-1-2025 | 1,620,000 | 1,903,030 | ||||||||||||
Madison-Macoupin Etc Counties IL Community College District #536 Series A (BAM Insured) | 5.00 | 11-1-2026 | 1,410,000 | 1,655,030 | ||||||||||||
Peoria County IL School District # 150 Peoria Series A (AGM Insured) | 4.00 | 12-1-2028 | 950,000 | 1,115,329 | ||||||||||||
Peoria County IL School District #150 Peoria Series A (AGM Insured) | 4.00 | 12-1-2027 | 1,000,000 | 1,178,450 | ||||||||||||
Peoria County IL School District #150 Peoria Series A (AGM Insured) | 4.00 | 12-1-2029 | 2,500,000 | 2,897,850 | ||||||||||||
Rockford IL Waterworks System Series B (BAM Insured) | 5.00 | 12-15-2020 | 1,000,000 | 1,019,030 | ||||||||||||
Rockford IL Waterworks System Series B (BAM Insured) | 5.00 | 12-15-2021 | 1,015,000 | 1,075,230 | ||||||||||||
Rockford IL Waterworks System Series B (BAM Insured) | 5.00 | 12-15-2022 | 1,065,000 | 1,171,468 | ||||||||||||
Waukegan IL Series 2015A (AGM Insured) | 5.00 | 12-30-2031 | 1,000,000 | 1,172,250 | ||||||||||||
Will County IL | 4.00 | 11-15-2035 | 2,490,000 | 2,765,967 | ||||||||||||
Will County IL Lincoln-Way Community High School District # 210 Refunded Bond (AGM Insured) | 4.00 | 1-1-2022 | 600,000 | 618,996 | ||||||||||||
Will County IL Lincoln-Way Community High School District #210 Unrefunded Bond CAB (AGM Insured) ¤ | 0.00 | 1-1-2026 | 8,295,000 | 7,461,353 | ||||||||||||
Will County IL Lincoln-Way Community High School District #210 Unrefunded CAB (AGM Insured) ¤ | 0.00 | 1-1-2021 | 2,185,000 | 2,170,317 | ||||||||||||
Will County IL Lincoln-Way Community High School District #210 Unrefunded CAB (AGM Insured) ¤ | 0.00 | 1-1-2025 | 14,385,000 | 13,280,088 | ||||||||||||
Will County IL School District #114 Manhattan CAB Series C (National Insured) ¤ | 0.00 | 12-1-2021 | 1,055,000 | 1,037,666 | ||||||||||||
Winnebago & Boone Counties IL School District #205 Series A ¤ | 0.00 | 2-1-2021 | 1,305,000 | 1,297,235 | ||||||||||||
Winnebago & Boone Counties IL School District #205 Series B ¤ | 0.00 | 2-1-2021 | 3,400,000 | 3,379,770 | ||||||||||||
| 181,059,008 | ||||||||||||||||
|
| |||||||||||||||
| Health Revenue: 0.40% | ||||||||||||||||
Illinois Finance Authority Ascension Health Alliance Senior Credit Group Bonds Series A | 5.00 | 11-15-2027 | 1,000,000 | 1,064,040 | ||||||||||||
Illinois Finance Authority Friendship Village of Schaumburg Series 2017 | 5.00 | 2-15-2021 | 2,555,000 | 2,542,123 | ||||||||||||
Illinois Finance Authority Revenue Advocate Health Care Network | 4.00 | 11-1-2030 | 3,000,000 | 3,427,470 | ||||||||||||
Illinois Finance Authority Revenue Bonds Lutheran Life Communities | 4.00 | 11-1-2020 | 320,000 | 320,099 | ||||||||||||
Illinois Finance Authority Revenue Bonds Lutheran Life Communities | 4.00 | 11-1-2022 | 390,000 | 389,809 | ||||||||||||
Illinois Finance Authority Revenue Bonds Lutheran Life Communities | 4.00 | 11-1-2024 | 420,000 | 417,341 | ||||||||||||
Illinois Finance Authority Revenue Bonds Series 2014 | 5.00 | 8-1-2038 | 1,520,000 | 1,795,941 | ||||||||||||
The accompanying notes are an integral part of these financial statements.
Wells Fargo Strategic Municipal Bond Fund | 19
Portfolio of investments—June 30, 2020
| Interest rate | Maturity date | Principal | Value | |||||||||||||
| Health Revenue (continued) | ||||||||||||||||
Illinois Finance Authority Rosalind Franklin University of Medicine & Science Series A | 3.25 | % | 2-15-2022 | $ | 260,000 | $ | 251,508 | |||||||||
| 10,208,331 | ||||||||||||||||
|
| |||||||||||||||
| Housing Revenue: 0.04% | ||||||||||||||||
Housing Development Authority Illinois Homeowner Mortgage 2016 Series C | 2.90 | 8-1-2031 | 1,000,000 | 1,062,830 | ||||||||||||
|
| |||||||||||||||
| Miscellaneous Revenue: 1.95% | ||||||||||||||||
Chicago IL Board of Education Refunding Bonds Series A | 4.00 | 12-1-2027 | 1,750,000 | 1,792,595 | ||||||||||||
Chicago IL Board of Education Refunding Bonds Series B | 5.00 | 12-1-2026 | 2,000,000 | 2,164,340 | ||||||||||||
Chicago IL Board of Education Refunding Bonds Series B | 5.00 | 12-1-2027 | 1,625,000 | 1,773,785 | ||||||||||||
Chicago IL Transit Authority Capital Grant Receipts Refunding Bond Series 2011 (AGM Insured) | 5.25 | 6-1-2024 | 4,450,000 | 4,603,748 | ||||||||||||
Illinois | 5.50 | 7-1-2033 | 4,000,000 | 4,194,400 | ||||||||||||
Illinois Refunding Bonds Series 2012 (AGM Insured) | 5.00 | 8-1-2020 | 5,050,000 | 5,061,413 | ||||||||||||
Illinois Refunding Bonds Series 2016 | 5.00 | 2-1-2026 | 2,000,000 | 2,168,080 | ||||||||||||
Illinois Series 2012 | 5.00 | 8-1-2021 | 5,620,000 | 5,761,455 | ||||||||||||
Illinois Series 2013 (AGM Insured) | 5.00 | 7-1-2023 | 4,875,000 | 5,270,850 | ||||||||||||
Illinois Series 2017D | 5.00 | 11-1-2022 | 1,805,000 | 1,888,734 | ||||||||||||
Illinois Series A | 5.00 | 11-1-2023 | 8,955,000 | 9,497,315 | ||||||||||||
Illinois Series D | 5.00 | 11-1-2021 | 6,080,000 | 6,260,515 | ||||||||||||
| 50,437,230 | ||||||||||||||||
|
| |||||||||||||||
| Tax Revenue: 5.74% | ||||||||||||||||
Chicago IL Motor Fuel Tax Refunding Bonds Series 2013 | 5.00 | 1-1-2021 | 1,450,000 | 1,455,365 | ||||||||||||
Chicago IL Motor Fuel Tax Refunding Bonds Series 2013 | 5.00 | 1-1-2022 | 1,810,000 | 1,829,222 | ||||||||||||
Chicago IL Motor Fuel Tax Refunding Bonds Series 2013 | 5.00 | 1-1-2023 | 2,400,000 | 2,444,136 | ||||||||||||
Chicago IL Motor Fuel Tax Refunding Bonds Series 2013 | 5.00 | 1-1-2024 | 2,475,000 | 2,532,915 | ||||||||||||
Chicago IL Motor Fuel Tax Refunding Bonds Series 2013 | 5.00 | 1-1-2025 | 1,000,000 | 1,020,880 | ||||||||||||
Chicago IL Tax Increment Bond Pilson Redevelopment Project Series A | 5.00 | 6-1-2022 | 1,635,000 | 1,661,683 | ||||||||||||
Chicago IL Transit Authority Sales Tax Receipts Series 2011 | 5.25 | 12-1-2036 | 17,415,000 | 18,081,995 | ||||||||||||
Cook County IL Sales Tax Revenue | 5.00 | 11-15-2029 | 1,000,000 | 1,196,730 | ||||||||||||
Illinois Junior Obligation | 5.00 | 6-15-2025 | 9,025,000 | 9,598,990 | ||||||||||||
Illinois Regional Transportation Authority Series A (AGM Insured) | 5.25 | 6-1-2024 | 9,995,000 | 11,500,747 | ||||||||||||
Illinois Sales Tax First Series (National Insured) | 6.00 | 6-15-2024 | 515,000 | 579,287 | ||||||||||||
Illinois Sales Tax First Series (National Insured) | 6.00 | 6-15-2025 | 8,365,000 | 9,618,746 | ||||||||||||
Illinois Sports Facilities Authority Refunding Bonds Insured State Tax Supported | 5.00 | 6-15-2028 | 1,000,000 | 1,068,540 | ||||||||||||
Illinois Sports Facilities Authority Refunding Bonds Insured State Tax Supported (BAM Insured) | 5.00 | 6-15-2028 | 1,500,000 | 1,768,245 | ||||||||||||
Illinois Sports Facilities Authority Refunding Bonds Insured State Tax Supported (BAM Insured) | 5.00 | 6-15-2028 | 1,515,000 | 1,785,927 | ||||||||||||
Illinois Sports Facilities Authority Refunding Bonds Insured State Tax Supported (BAM Insured) | 5.00 | 6-15-2030 | 3,250,000 | 3,854,793 | ||||||||||||
Illinois Sports Facilities Authority Refunding Bonds Insured State Tax Supported (BAM Insured) | 5.00 | 6-15-2030 | 2,000,000 | 2,372,180 | ||||||||||||
Illinois Sports Facilities Authority Refunding Bonds Insured State Tax Supported CAB (Ambac Insured) ¤ | 0.00 | 6-15-2022 | 3,795,000 | 3,559,179 | ||||||||||||
Illinois Sports Facilities Authority Refunding Bonds Insured State Tax Supported CAB (Ambac Insured) ¤ | 0.00 | 6-15-2026 | 1,740,000 | 1,376,653 | ||||||||||||
Illinois Sports Facilities Authority Refunding Bonds Insured State Tax Supported Series 2014 | 5.00 | 6-15-2022 | 3,395,000 | 3,506,492 | ||||||||||||
Illinois Sports Facilities Authority Refunding Bonds Insured State Tax Supported Series 2014 | 5.00 | 6-15-2023 | 3,220,000 | 3,387,408 | ||||||||||||
Illinois Sports Facilities Authority Refunding Bonds Insured State Tax Supported Series 2014 | 5.00 | 6-15-2024 | 4,135,000 | 4,397,573 | ||||||||||||
The accompanying notes are an integral part of these financial statements.
20 | Wells Fargo Strategic Municipal Bond Fund
Portfolio of investments—June 30, 2020
| Interest rate | Maturity date | Principal | Value | |||||||||||||
| Tax Revenue (continued) | ||||||||||||||||
Metropolitan Pier & Exposition Authority CAB McCormick Place Expansion Project Series A (National Insured) ¤ | 0.00 | % | 12-15-2029 | $ | 1,750,000 | $ | 1,270,010 | |||||||||
Metropolitan Pier & Exposition Authority CAB McCormick Place Expansion Project Series B | 5.00 | 12-15-2028 | 19,090,000 | 19,586,149 | ||||||||||||
Metropolitan Pier & Exposition Authority CAB McCormick Place Project Series A (National Insured) ¤ | 0.00 | 12-15-2022 | 1,390,000 | 1,301,137 | ||||||||||||
Metropolitan Pier & Exposition Authority Prerefunded Bond (National Insured) ¤ | 0.00 | 12-15-2023 | 20,000 | 19,523 | ||||||||||||
Metropolitan Pier & Exposition Authority Prerefunded Bond (National Insured) | 5.70 | 6-15-2025 | 220,000 | 244,473 | ||||||||||||
Metropolitan Pier & Exposition Authority Unrefunded Bond (National Insured) ¤ | 0.00 | 12-15-2023 | 1,105,000 | 1,004,125 | ||||||||||||
Metropolitan Pier & Exposition Authority Unrefunded Bond (National Insured) | 5.70 | 6-15-2025 | 780,000 | 839,069 | ||||||||||||
Regional Transportation Authority Illinois Series B-RMKT øø | 0.80 | 6-1-2025 | 8,580,000 | 8,580,000 | ||||||||||||
Sales Tax Securitization Corporation Second Lien Sales Tax | 5.00 | 1-1-2028 | 5,000,000 | 5,999,550 | ||||||||||||
Sales Tax Securitization Corporation Series 2017A | 5.00 | 1-1-2026 | 4,815,000 | 5,575,385 | ||||||||||||
Sales Tax Securitization Corporation Series 2017A | 5.00 | 1-1-2028 | 5,265,000 | 6,317,526 | ||||||||||||
Sales Tax Securitization Corporation Series A | 5.00 | 1-1-2027 | 1,000,000 | 1,177,970 | ||||||||||||
St. Charles, Kane & DuPage Counties IL Series 2016 | 4.00 | 1-1-2021 | 790,000 | 791,351 | ||||||||||||
St. Charles, Kane & DuPage Counties IL Series 2016 | 4.00 | 1-1-2022 | 820,000 | 819,885 | ||||||||||||
St. Charles, Kane & DuPage Counties IL Series 2016 | 4.00 | 1-1-2023 | 855,000 | 851,990 | ||||||||||||
St. Charles, Kane & DuPage Counties IL Series 2016 | 4.00 | 1-1-2024 | 885,000 | 877,433 | ||||||||||||
St. Charles, Kane & DuPage Counties IL Series 2016 | 4.00 | 1-1-2025 | 925,000 | 910,052 | ||||||||||||
Tender Option Bond Trust Receipts/Certificates Series 2018-YX1099 (Barclays Bank plc LIQ) 144Aø | 0.28 | 1-1-2035 | 3,365,000 | 3,365,000 | ||||||||||||
| 148,128,314 | ||||||||||||||||
|
| |||||||||||||||
| Tobacco Revenue: 0.77% | ||||||||||||||||
Railsplitter Tobacco Settlement Authority | 5.00 | 6-1-2023 | 18,000,000 | 19,876,140 | ||||||||||||
|
| |||||||||||||||
| Transportation Revenue: 0.59% | ||||||||||||||||
Illinois State Toll Highway Authority Senior Revenue Refunding Bonds Series B | 5.00 | 1-1-2029 | 11,990,000 | 15,336,649 | ||||||||||||
|
| |||||||||||||||
| Water & Sewer Revenue: 0.39% | ||||||||||||||||
Chicago IL Wastewater Transmission Series B (AGM Insured) | 5.00 | 1-1-2031 | 3,140,000 | 3,814,598 | ||||||||||||
Chicago IL Waterworks Second Lien | 5.00 | 11-1-2028 | 2,560,000 | 3,014,528 | ||||||||||||
Chicago IL Waterworks Second Lien Series 2017-2 (AGM Insured) | 5.00 | 11-1-2030 | 2,620,000 | 3,125,450 | ||||||||||||
| 9,954,576 | ||||||||||||||||
|
| |||||||||||||||
| 496,609,445 | ||||||||||||||||
|
| |||||||||||||||
Indiana: 0.56% |
| |||||||||||||||
| GO Revenue: 0.05% | ||||||||||||||||
Hammond IN Local Public Improvement Advance Program Series A | 2.38 | 12-31-2020 | 1,375,000 | 1,383,608 | ||||||||||||
|
| |||||||||||||||
| Health Revenue: 0.01% | ||||||||||||||||
Indiana HFFA Ancilla System Incorporated (National Insured) | 5.25 | 7-1-2022 | 150,000 | 150,510 | ||||||||||||
|
| |||||||||||||||
| Housing Revenue: 0.27% | ||||||||||||||||
Hobart Industry MFHR A Safe Haven Veterans Apartments øø | 0.75 | 9-1-2022 | 7,100,000 | 7,122,862 | ||||||||||||
|
| |||||||||||||||
| Miscellaneous Revenue: 0.15% | ||||||||||||||||
Indiana Bond Bank Revenue CAB Hamilton Company Projects Series B ¤ | 0.00 | 7-15-2026 | 735,000 | 684,528 | ||||||||||||
Indiana Bond Bank Revenue CAB Hamilton Company Projects Series B ¤ | 0.00 | 7-15-2027 | 630,000 | 575,026 | ||||||||||||
Michigan IN City School Building Corporation Series 2016A | 5.00 | 1-15-2025 | 1,000,000 | 1,167,730 | ||||||||||||
The accompanying notes are an integral part of these financial statements.
Wells Fargo Strategic Municipal Bond Fund | 21
Portfolio of investments—June 30, 2020
| Interest rate | Maturity date | Principal | Value | |||||||||||||
| Miscellaneous Revenue (continued) | ||||||||||||||||
Westfield-Washington IN Multi-School Building Corporation First Mortgage Series B 144A | 1.50 | % | 1-15-2022 | $ | 1,360,000 | $ | 1,367,167 | |||||||||
| 3,794,451 | ||||||||||||||||
|
| |||||||||||||||
| Utilities Revenue: 0.08% | ||||||||||||||||
Indiana Finance Authority Midwestern Disaster Relief Revenue Various Ohio Valley Electric Corporation Project %% | 3.00 | 11-1-2030 | 2,000,000 | 2,053,620 | ||||||||||||
|
| |||||||||||||||
| 14,505,051 | ||||||||||||||||
|
| |||||||||||||||
Iowa: 0.90% |
| |||||||||||||||
| Education Revenue: 0.11% | ||||||||||||||||
Iowa Student Loan Liquidity Corporation Senior Revenue Bonds AMT Series B | 5.00 | 12-1-2025 | 1,295,000 | 1,472,324 | ||||||||||||
Iowa Student Loan Liquidity Corporation Senior Revenue Bonds AMT Series B | 5.00 | 12-1-2026 | 1,215,000 | 1,403,082 | ||||||||||||
| 2,875,406 | ||||||||||||||||
|
| |||||||||||||||
| GO Revenue: 0.35% | ||||||||||||||||
Coralville IA Taxable-Annual Appropriation Series 2018E | 7.00 | 6-1-2025 | 8,485,000 | 8,734,035 | ||||||||||||
Coralville IA Taxable-Annual Appropriation Series B | 4.40 | 5-1-2023 | 410,000 | 401,853 | ||||||||||||
| 9,135,888 | ||||||||||||||||
|
| |||||||||||||||
| Health Revenue: 0.06% | ||||||||||||||||
Iowa Finance Authority Revenue Bonds Lifespace Commnunities Incorporated Series A2 | 2.88 | 5-15-2049 | 1,500,000 | 1,454,790 | ||||||||||||
|
| |||||||||||||||
| Utilities Revenue: 0.30% | ||||||||||||||||
Iowa Gas Project Public Expenditure and Financial Accountability Incorporated | 5.00 | 9-1-2049 | 6,500,000 | 7,844,070 | ||||||||||||
|
| |||||||||||||||
| Water & Sewer Revenue: 0.08% | ||||||||||||||||
Xenia Dallas County IA Rural Water District Capital Loan Notes | 5.00 | 12-1-2031 | 1,615,000 | 1,913,032 | ||||||||||||
|
| |||||||||||||||
| 23,223,186 | ||||||||||||||||
|
| |||||||||||||||
Kansas: 0.70% |
| |||||||||||||||
| Health Revenue: 0.09% | ||||||||||||||||
Wichita KS Health Care Facilities Presbyterian Manors Obligated Group | 5.00 | 5-15-2026 | 1,105,000 | 1,124,039 | ||||||||||||
Wichita KS Health Care Facilities Presbyterian Manors Obligated Group | 5.00 | 5-15-2028 | 1,220,000 | 1,241,362 | ||||||||||||
| 2,365,401 | ||||||||||||||||
|
| |||||||||||||||
| Housing Revenue: 0.20% | ||||||||||||||||
Kansas Development Finance Authority MFHR Woodland Village Apartments Project Series J | 1.68 | 7-1-2022 | 5,000,000 | 5,044,100 | ||||||||||||
|
| |||||||||||||||
| Tax Revenue: 0.41% | ||||||||||||||||
Wyandotte County & Kansas City KS Special Obligation Refunding & Improvement Bonds Plaza Redevelopment Project | 4.00 | 12-1-2028 | 605,000 | 575,016 | ||||||||||||
Wyandotte County & Kansas City KS Special Obligation Vacation Village Project Area 4 Major Multi-Sport Athletic Complex Project CAB Series 2015 144A¤ | 0.00 | 9-1-2034 | 24,725,000 | 10,106,838 | ||||||||||||
| 10,681,854 | ||||||||||||||||
|
| |||||||||||||||
| 18,091,355 | ||||||||||||||||
|
| |||||||||||||||
The accompanying notes are an integral part of these financial statements.
22 | Wells Fargo Strategic Municipal Bond Fund
Portfolio of investments—June 30, 2020
| Interest rate | Maturity date | Principal | Value | |||||||||||||
| Kentucky: 2.26% |
| |||||||||||||||
| Education Revenue: 0.15% | ||||||||||||||||
Columbia KY Educational Development Lindsey Wilson College Incorporated Project | 3.00 | % | 12-1-2024 | $ | 3,795,000 | $ | 3,809,649 | |||||||||
|
| |||||||||||||||
| Health Revenue: 0.34% | ||||||||||||||||
Kentucky EDFA Health System Revenue Norton Healthcare Incorporate Series B (National Insured) ¤ | 0.00 | 10-1-2026 | 3,000,000 | 2,595,930 | ||||||||||||
Kentucky EDFA Healthcare Facilities Rosedale Green Project Series 2015 | 3.35 | 11-15-2020 | 335,000 | 332,183 | ||||||||||||
Kentucky EDFA Healthcare Facilities Rosedale Green Project Series 2015 | 5.00 | 11-15-2025 | 1,500,000 | 1,435,875 | ||||||||||||
Kentucky EDFA Norton Healthcare Incorporated Series B (National Insured) ¤ | 0.00 | 10-1-2022 | 1,000,000 | 961,320 | ||||||||||||
Louisville & Jefferson County KY Metro Health System Revenue Norton Healthcare Incorporated Series C | 5.00 | 10-1-2047 | 3,000,000 | 3,484,050 | ||||||||||||
| 8,809,358 | ||||||||||||||||
|
| |||||||||||||||
| Utilities Revenue: 1.77% | ||||||||||||||||
Kentucky Public Energy Authority Gas Supply Series A-1 | 4.00 | 12-1-2049 | 3,755,000 | 4,220,132 | ||||||||||||
Kentucky Public Energy Authority Gas Supply Series B | 4.00 | 1-1-2049 | 14,725,000 | 16,218,704 | ||||||||||||
Kentucky Public Energy Authority Gas Supply Series C | 4.00 | 12-1-2049 | 4,605,000 | 5,171,093 | ||||||||||||
Kentucky Public Energy Authority Gas Supply Series C1 | 4.00 | 2-1-2050 | 17,150,000 | 20,038,403 | ||||||||||||
| 45,648,332 | ||||||||||||||||
|
| |||||||||||||||
| 58,267,339 | ||||||||||||||||
|
| |||||||||||||||
Louisiana: 1.83% |
| |||||||||||||||
| Airport Revenue: 0.20% | ||||||||||||||||
New Orleans LA Aviation Board General North Terminal Project Series A | 5.00 | 1-1-2032 | 1,000,000 | 1,139,730 | ||||||||||||
New Orleans LA Aviation Board Gulf Opportunity Zone Controlled Foreign Corporation Revenue Refunding Bonds Consolidated Rental Car Project (AGM Insured) | 5.00 | 1-1-2031 | 1,250,000 | 1,534,738 | ||||||||||||
New Orleans LA Aviation Board Gulf Opportunity Zone Controlled Foreign Corporation Revenue Refunding Bonds Consolidated Rental Car Project (AGM Insured) | 5.00 | 1-1-2032 | 2,000,000 | 2,438,280 | ||||||||||||
| 5,112,748 | ||||||||||||||||
|
| |||||||||||||||
| Education Revenue: 0.28% | ||||||||||||||||
Louisiana Public Facilities Authority Loyola University Project Series 2011 | 5.25 | 10-1-2025 | 2,815,000 | 2,900,773 | ||||||||||||
Louisiana Public Facilities Authority Loyola University Project Series 2017 ¤ | 0.00 | 10-1-2020 | 1,000,000 | 994,540 | ||||||||||||
Louisiana Public Facilities Authority Loyola University Project Series 2017 ¤ | 0.00 | 10-1-2021 | 1,950,000 | 1,896,102 | ||||||||||||
Louisiana Public Facilities Authority Loyola University Project Series 2017 ¤ | 0.00 | 10-1-2022 | 1,500,000 | 1,403,130 | ||||||||||||
| 7,194,545 | ||||||||||||||||
|
| |||||||||||||||
| Industrial Development Revenue: 1.23% | ||||||||||||||||
St. James Parish Louisiana Nucor Steel LLC Project Gulf Opportunity Zone Series A-1 ø | 0.31 | 11-1-2040 | 25,000,000 | 25,000,000 | ||||||||||||
St. John the Baptist Parish Louisiana Series A | 2.20 | 6-1-2037 | 7,000,000 | 6,702,150 | ||||||||||||
| 31,702,150 | ||||||||||||||||
|
| |||||||||||||||
| Miscellaneous Revenue: 0.05% | ||||||||||||||||
Louisiana Local Government Environmental Facilities and CDA Jefferson Parish Gomesa Project 144A | 4.00 | 11-1-2044 | 1,440,000 | 1,268,078 | ||||||||||||
|
| |||||||||||||||
The accompanying notes are an integral part of these financial statements.
Wells Fargo Strategic Municipal Bond Fund | 23
Portfolio of investments—June 30, 2020
| Interest rate | Maturity date | Principal | Value | |||||||||||||
| Water & Sewer Revenue: 0.07% | ||||||||||||||||
Greater Ouachita Water Company Incorporate Louisiana Waterworks and Sewer System Refunding Bonds (BAM Insured) | 3.00 | % | 9-1-2023 | $ | 250,000 | $ | 267,815 | |||||||||
Greater Ouachita Water Company Incorporate Louisiana Waterworks and Sewer System Refunding Bonds (BAM Insured) | 5.00 | 9-1-2021 | 550,000 | 578,221 | ||||||||||||
Greater Ouachita Water Company Incorporate Louisiana Waterworks and Sewer System Refunding Bonds (BAM Insured) | 5.00 | 9-1-2024 | 460,000 | 538,278 | ||||||||||||
Greater Ouachita Water Company Incorporate Louisiana Waterworks and Sewer System Refunding Bonds (BAM Insured) | 5.00 | 9-1-2025 | 510,000 | 612,867 | ||||||||||||
| 1,997,181 | ||||||||||||||||
|
| |||||||||||||||
| 47,274,702 | ||||||||||||||||
|
| |||||||||||||||
Maine: 0.04% |
| |||||||||||||||
| Health Revenue: 0.04% | ||||||||||||||||
Maine Health & HEFAR Series A | 5.00 | 7-1-2027 | 750,000 | 910,425 | ||||||||||||
|
| |||||||||||||||
Maryland: 3.13% |
| |||||||||||||||
| Education Revenue: 0.10% | ||||||||||||||||
Prince George’s County MD Chesapeake Lighthouse Charter School Project Series 2015 144A | 5.25 | 8-1-2022 | 1,285,000 | 1,311,805 | ||||||||||||
Prince George’s County MD Chesapeake Lighthouse Charter School Project Series 2016 | 5.00 | 8-1-2026 | 1,335,000 | 1,382,513 | ||||||||||||
| 2,694,318 | ||||||||||||||||
|
| |||||||||||||||
| GO Revenue: 0.56% | ||||||||||||||||
Prince George’s County MD Consolidated Public Improvement Bonds Series C | 4.00 | 8-1-2028 | 12,960,000 | 14,420,851 | ||||||||||||
|
| |||||||||||||||
| Housing Revenue: 2.03% | ||||||||||||||||
Maryland CDA Department of Housing & Community Multifamily Development Headen House Series B | 2.45 | 3-1-2021 | 19,500,000 | 19,657,950 | ||||||||||||
Maryland CDA Department of Housing & Community Multifamily Development Huntington Apartments Series C 144A | 2.34 | 4-1-2021 | 5,000,000 | 5,041,850 | ||||||||||||
Maryland Community Development Department Housing Rosemont Tower LLC Series F (FHA/GNMA Insured) | 2.01 | 11-1-2021 | 18,500,000 | 18,678,895 | ||||||||||||
Maryland State Administration Department of Housing & Community Development Park View at Taylor Series D | 2.45 | 4-1-2021 | 8,820,000 | 8,898,410 | ||||||||||||
| 52,277,105 | ||||||||||||||||
|
| |||||||||||||||
| Tax Revenue: 0.40% | ||||||||||||||||
Maryland State Department of Transportation | 4.00 | 12-15-2027 | 9,260,000 | 10,293,323 | ||||||||||||
|
| |||||||||||||||
| Water & Sewer Revenue: 0.04% | ||||||||||||||||
Baltimore MD Series A (National Insured) | 5.65 | 7-1-2020 | 1,100,000 | 1,100,000 | ||||||||||||
|
| |||||||||||||||
| 80,785,597 | ||||||||||||||||
|
| |||||||||||||||
Massachusetts: 3.76% |
| |||||||||||||||
| Education Revenue: 1.31% | ||||||||||||||||
Lowell MA Collegiate Charter School Revenue | 4.00 | 6-15-2024 | 320,000 | 321,962 | ||||||||||||
Lowell MA Collegiate Charter School Revenue | 5.00 | 6-15-2029 | 490,000 | 510,972 | ||||||||||||
Massachusetts Development Finance Agency Harvard University Series A | 5.00 | 7-15-2033 | 22,560,000 | 27,584,112 | ||||||||||||
Massachusetts Development Finance Agency Sabis International Charter School Series 2015 | 5.00 | 4-15-2025 | 1,000,000 | 1,084,490 | ||||||||||||
Massachusetts Educational Financing Authority AMT Issue I Series B | 5.70 | 1-1-2031 | 1,625,000 | 1,627,080 | ||||||||||||
The accompanying notes are an integral part of these financial statements.
24 | Wells Fargo Strategic Municipal Bond Fund
Portfolio of investments—June 30, 2020
| Interest rate | Maturity date | Principal | Value | |||||||||||||
| Education Revenue (continued) | ||||||||||||||||
Massachusetts Educational Financing Authority Series B | 5.00 | % | 7-1-2023 | $ | 2,460,000 | $ | 2,689,912 | |||||||||
| 33,818,528 | ||||||||||||||||
|
| |||||||||||||||
| Health Revenue: 0.62% | ||||||||||||||||
Massachusetts Development Finance Agency Linden Ponds Incorporated Facility 144A | 4.00 | 11-15-2023 | 1,095,000 | 1,067,001 | ||||||||||||
Massachusetts Development Finance Agency Partners Healthcare System Series S-3 (SIFMA Municipal Swap +0.50%) ± | 0.63 | 7-1-2038 | 14,870,000 | 14,817,063 | ||||||||||||
| 15,884,064 | ||||||||||||||||
|
| |||||||||||||||
| Miscellaneous Revenue: 1.47% | ||||||||||||||||
Massachusetts Series A (3 Month LIBOR +0.55%) ± | 1.01 | 11-1-2025 | 15,800,000 | 15,702,040 | ||||||||||||
Massachusetts Water Pollution Abatement Trust Series 17 | 5.00 | 2-1-2031 | 10,000,000 | 11,125,900 | ||||||||||||
Massachusetts Water Pollution Abatement Trust Series 17 | 5.00 | 2-1-2032 | 10,000,000 | 11,104,100 | ||||||||||||
| 37,932,040 | ||||||||||||||||
|
| |||||||||||||||
| Tax Revenue: 0.36% | ||||||||||||||||
Massachusetts Bay Transportation Authority Assessment Bonds Series A | 4.00 | 7-1-2037 | 9,000,000 | 9,398,970 | ||||||||||||
|
| |||||||||||||||
| 97,033,602 | ||||||||||||||||
|
| |||||||||||||||
Michigan: 2.69% |
| |||||||||||||||
| Airport Revenue: 0.04% | ||||||||||||||||
Wayne County MI Airport Authority AMT Detroit Metropolitan Airport Series C | 5.00 | 12-1-2022 | 1,000,000 | 1,017,860 | ||||||||||||
|
| |||||||||||||||
| Education Revenue: 0.13% | ||||||||||||||||
Michigan Finance Authority Limited Obligation Refunding Bond Higher Education College Creative | 5.00 | 12-1-2026 | 840,000 | 873,718 | ||||||||||||
Michigan Finance Authority Limited Obligation Refunding Bond Higher Education College Creative | 5.00 | 12-1-2027 | 585,000 | 607,663 | ||||||||||||
Michigan Finance Authority Limited Obligation Refunding Bond Higher Education College Creative | 5.00 | 12-1-2028 | 535,000 | 555,170 | ||||||||||||
Michigan Finance Authority Limited Obligation Refunding Bond Higher Education College Creative | 5.00 | 12-1-2029 | 590,000 | 611,057 | ||||||||||||
Michigan Finance Authority Limited Obligation Refunding Bond Higher Education College Creative | 5.00 | 12-1-2030 | 400,000 | 413,444 | ||||||||||||
Michigan Finance Authority Limited Obligation Refunding Bonds Public School Academy Cesar Chavez Academy Project | 3.25 | 2-1-2024 | 400,000 | 398,388 | ||||||||||||
| 3,459,440 | ||||||||||||||||
|
| |||||||||||||||
| GO Revenue: 0.33% | ||||||||||||||||
Constantine MI Public Schools (Qualified School Board Loan Fund Insured) | 5.00 | 5-1-2021 | 1,200,000 | 1,245,816 | ||||||||||||
Forest Hills MI Public Schools | 5.00 | 5-1-2021 | 1,600,000 | 1,662,880 | ||||||||||||
Fraser MI Public Schools District (Qualified School Board Loan Fund Insured) | 5.00 | 5-1-2021 | 1,000,000 | 1,037,760 | ||||||||||||
Fraser MI Public Schools District (Qualified School Board Loan Fund Insured) | 5.00 | 5-1-2022 | 610,000 | 660,185 | ||||||||||||
Hudsonville MI Public Schools (Qualified School Board Loan Fund Insured) | 5.00 | 5-1-2021 | 1,465,000 | 1,520,934 | ||||||||||||
Ingham County MI Williamston Community Schools Series A (Qualified School Board Loan Fund Insured) | 4.00 | 5-1-2024 | 1,025,000 | 1,140,128 | ||||||||||||
Ingham County MI Williamston Community Schools Series A (Qualified School Board Loan Fund Insured) | 4.00 | 5-1-2025 | 1,000,000 | 1,133,180 | ||||||||||||
| 8,400,883 | ||||||||||||||||
|
| |||||||||||||||
The accompanying notes are an integral part of these financial statements.
Wells Fargo Strategic Municipal Bond Fund | 25
Portfolio of investments—June 30, 2020
| Interest rate | Maturity date | Principal | Value | |||||||||||||
| Health Revenue: 0.21% | ||||||||||||||||
Michigan Finance Authority Bronson Healthcare Group Series B & C | 3.75 | % | 11-15-2049 | $ | 4,800,000 | $ | 5,476,128 | |||||||||
|
| |||||||||||||||
| Housing Revenue: 0.35% | ||||||||||||||||
Michigan Housing Development Authority Series E (3 Month LIBOR +1.00%) ± | 2.00 | 4-1-2042 | 9,065,000 | 9,061,283 | ||||||||||||
|
| |||||||||||||||
| Miscellaneous Revenue: 0.70% | ||||||||||||||||
Michigan Finance Authority Detroit Recovery Project Series 2014F | 3.40 | 10-1-2020 | 500,000 | 502,725 | ||||||||||||
Michigan Finance Authority Detroit Recovery Project Series 2014F | 3.60 | 10-1-2021 | 500,000 | 506,245 | ||||||||||||
Michigan Finance Authority Detroit Recovery Project Series 2014F | 3.80 | 10-1-2022 | 500,000 | 513,075 | ||||||||||||
Michigan Finance Authority Detroit Recovery Project Series 2014F | 3.88 | 10-1-2023 | 2,500,000 | 2,585,575 | ||||||||||||
Michigan Finance Authority Local Government Loan Program City of Detroit Financial Recovery Refunding Bond Series F | 4.50 | 10-1-2029 | 5,685,000 | 5,961,405 | ||||||||||||
Michigan Finance Authority Senior Lien Distributable State Aid | 5.00 | 11-1-2028 | 865,000 | 1,134,465 | ||||||||||||
Michigan Finance Authority Senior Lien Distributable State Aid | 5.00 | 11-1-2029 | 1,500,000 | 1,968,555 | ||||||||||||
Michigan Finance Authority Series H-1 | 5.00 | 10-1-2021 | 1,565,000 | 1,581,965 | ||||||||||||
Michigan Municipal Bond Authority Local Government Loan Program Series C (Ambac Insured) | 5.00 | 5-1-2023 | 1,900,000 | 1,901,349 | ||||||||||||
Michigan Public Educational Facilities Authority Chandler Park Academy | 6.35 | 11-1-2028 | 1,385,000 | 1,388,019 | ||||||||||||
| 18,043,378 | ||||||||||||||||
|
| |||||||||||||||
| Tax Revenue: 0.12% | ||||||||||||||||
Michigan Finance Authority Series 2014B | 5.00 | 7-1-2032 | 3,000,000 | 3,233,280 | ||||||||||||
|
| |||||||||||||||
| Water & Sewer Revenue: 0.81% | ||||||||||||||||
Detroit MI Water & Sewage Department Series A | 5.00 | 7-1-2022 | 1,000,000 | 1,090,510 | ||||||||||||
Michigan Financial Authority Great Lakes Water Authority Series C-3 (AGM Insured) | 5.00 | 7-1-2031 | 3,000,000 | 3,423,780 | ||||||||||||
Michigan Financial Authority Local Government Loan Program Series C7 (National Insured) | 5.00 | 7-1-2022 | 2,000,000 | 2,179,340 | ||||||||||||
Michigan Financial Authority Local Government Loan Program Series D1 (AGM Insured) | 5.00 | 7-1-2022 | 2,700,000 | 2,947,779 | ||||||||||||
Michigan Financial Authority Local Government Loan Program Series D1 (AGM Insured) | 5.00 | 7-1-2023 | 2,000,000 | 2,272,300 | ||||||||||||
Michigan Financial Authority Local Government Loan Program Series D6 (National Insured) | 5.00 | 7-1-2022 | 2,080,000 | 2,266,514 | ||||||||||||
Michigan Financial Authority Local Government Loan Program Series D6 (National Insured) | 5.00 | 7-1-2023 | 3,670,000 | 4,157,890 | ||||||||||||
Michigan Financial Authority Local Government Loan Program Series D6 (National Insured) | 5.00 | 7-1-2024 | 2,130,000 | 2,489,736 | ||||||||||||
| 20,827,849 | ||||||||||||||||
|
| |||||||||||||||
| 69,520,101 | ||||||||||||||||
|
| |||||||||||||||
Minnesota: 0.73% |
| |||||||||||||||
| Education Revenue: 0.20% | ||||||||||||||||
Cologne MN Charter School Lease Academy Project Series 2014A | 4.00 | 7-1-2023 | 260,000 | 271,424 | ||||||||||||
Minneapolis MN Charter School Lease Revenue Northeast College Preparatory Project | 5.00 | 7-1-2040 | 875,000 | 875,000 | ||||||||||||
Minnesota State HEFAR Refunding Saint Catherine University Series A | 5.00 | 10-1-2024 | 545,000 | 593,560 | ||||||||||||
Minnesota State HEFAR Refunding Saint Catherine University Series A | 5.00 | 10-1-2027 | 1,035,000 | 1,163,019 | ||||||||||||
Minnesota State HEFAR Refunding Saint Catherine University Series A | 5.00 | 10-1-2029 | 660,000 | 746,315 | ||||||||||||
St. Paul MN Housing & RDA Charter School Hmong College Preparatory Academy Project Series A | 4.75 | 9-1-2022 | 490,000 | 496,444 | ||||||||||||
St. Paul MN Housing & RDA Charter School Hmong College Preparatory Academy Project Series A | 5.00 | 9-1-2026 | 1,000,000 | 1,079,470 | ||||||||||||
| 5,225,232 | ||||||||||||||||
|
| |||||||||||||||
The accompanying notes are an integral part of these financial statements.
26 | Wells Fargo Strategic Municipal Bond Fund
Portfolio of investments—June 30, 2020
| Interest rate | Maturity date | Principal | Value | |||||||||||||
| Health Revenue: 0.27% | ||||||||||||||||
Shakopee MN Senior Housing Revenue Benedictine Living Community LLC Project 144A | 5.85 | % | 11-1-2058 | $ | 5,500,000 | $ | 5,386,425 | |||||||||
St. Paul MN Housing & RDA HealthEast Care System Project Series 2015A | 5.25 | 11-15-2028 | 1,505,000 | 1,531,623 | ||||||||||||
| 6,918,048 | ||||||||||||||||
|
| |||||||||||||||
| Miscellaneous Revenue: 0.26% | ||||||||||||||||
Minneapolis & St. Paul MN Housing & RDA Children’s Hospital Clinics Series A (AGM Insured, U.S. Bank NA LIQ, U.S. Bank NA SPA) øø | 0.12 | 8-15-2037 | 6,825,000 | 6,825,000 | ||||||||||||
|
| |||||||||||||||
| 18,968,280 | ||||||||||||||||
|
| |||||||||||||||
Mississippi: 0.31% |
| |||||||||||||||
| Health Revenue: 0.31% | ||||||||||||||||
Mississippi Hospital Equipment and Facilities Authority Revenue North Mississippi Health Services Series li | 5.00 | 10-1-2040 | 3,930,000 | 4,730,030 | ||||||||||||
Mississippi Hospital Equipment and Facilities Authority Revenue Refunding Bond Baptist Memorial Health Care | 5.00 | 9-1-2044 | 3,000,000 | 3,379,050 | ||||||||||||
| 8,109,080 | ||||||||||||||||
|
| |||||||||||||||
Missouri: 1.73% |
| |||||||||||||||
| Airport Revenue: 0.26% | ||||||||||||||||
Kansas City MO Airport Revenue Refunding Bond AMT General Improvement Series A | 5.25 | 9-1-2025 | 6,390,000 | 6,684,132 | ||||||||||||
|
| |||||||||||||||
| Education Revenue: 0.34% | ||||||||||||||||
Missouri State HEFAR University Health Science | 5.00 | 10-1-2026 | 925,000 | 1,081,899 | ||||||||||||
Missouri State HEFAR University Health Science | 5.00 | 10-1-2027 | 975,000 | 1,159,675 | ||||||||||||
Missouri State HEFAR University Health Science | 5.00 | 10-1-2028 | 1,025,000 | 1,239,143 | ||||||||||||
Missouri State HEFAR Webster University Project | 5.00 | 4-1-2022 | 775,000 | 802,094 | ||||||||||||
Missouri State HEFAR Webster University Project | 5.00 | 4-1-2023 | 450,000 | 473,301 | ||||||||||||
Missouri State HEFAR Webster University Project | 5.00 | 4-1-2024 | 2,820,000 | 3,007,022 | ||||||||||||
Missouri State HEFAR Webster University Project | 5.00 | 4-1-2025 | 350,000 | 377,206 | ||||||||||||
Missouri State HEFAR Webster University Project | 5.00 | 4-1-2026 | 500,000 | 540,605 | ||||||||||||
| 8,680,945 | ||||||||||||||||
|
| |||||||||||||||
| Health Revenue: 0.38% | ||||||||||||||||
Lees Summit MO IDA Senior Living Facilities Revenue Series A | 5.00 | 8-15-2020 | 1,075,000 | 1,076,570 | ||||||||||||
RBC Municipal Products Incorporated (Royal Bank of Canada LOC, Royal Bank of Canada LIQ) 144Aø | 0.20 | 9-1-2039 | 8,700,000 | 8,700,000 | ||||||||||||
| 9,776,570 | ||||||||||||||||
|
| |||||||||||||||
| Miscellaneous Revenue: 0.53% | ||||||||||||||||
Branson MO IDA Branson Shoppes Series A | 3.00 | 11-1-2021 | 1,055,000 | 1,051,424 | ||||||||||||
Branson MO IDA Branson Shoppes Series A | 4.00 | 11-1-2022 | 350,000 | 354,263 | ||||||||||||
Branson MO IDA Branson Shoppes Series A | 4.00 | 11-1-2023 | 750,000 | 759,075 | ||||||||||||
Kansas City MO IDA International Airport Terminal Modernization Project Series B | 5.00 | 3-1-2028 | 3,000,000 | 3,734,910 | ||||||||||||
Kansas City MO IDA International Airport Terminal Modernization Project Series B | 5.00 | 3-1-2030 | 2,000,000 | 2,506,240 | ||||||||||||
Platte County MO Riverside-Quindaro Bend Levee District Project L-385 | 4.00 | 3-1-2021 | 930,000 | 948,089 | ||||||||||||
Platte County MO Riverside-Quindaro Bend Levee District Project L-385 | 4.00 | 3-1-2022 | 970,000 | 1,015,095 | ||||||||||||
Platte County MO Riverside-Quindaro Bend Levee District Project L-385 | 4.00 | 3-1-2023 | 1,010,000 | 1,074,044 | ||||||||||||
Platte County MO Riverside-Quindaro Bend Levee District Project L-385 | 5.00 | 3-1-2024 | 1,000,000 | 1,115,980 | ||||||||||||
Platte County MO Riverside-Quindaro Bend Levee District Project L-385 | 5.00 | 3-1-2025 | 1,105,000 | 1,253,413 | ||||||||||||
| 13,812,533 | ||||||||||||||||
|
| |||||||||||||||
The accompanying notes are an integral part of these financial statements.
Wells Fargo Strategic Municipal Bond Fund | 27
Portfolio of investments—June 30, 2020
| Interest rate | Maturity date | Principal | Value | |||||||||||||
| Tax Revenue: 0.08% | ||||||||||||||||
Arnold MO Real Property Arnold Triangle Redevelopment Project Series A | 3.75 | % | 5-1-2023 | $ | 655,000 | $ | 647,009 | |||||||||
Lees Summit MO Summit Fair Project Series 2017 144A | 3.50 | 11-1-2023 | 265,000 | 260,127 | ||||||||||||
Richmond Heights MO Francis Place Redevelopment Project | 5.63 | 11-1-2025 | 1,195,000 | 1,192,455 | ||||||||||||
| 2,099,591 | ||||||||||||||||
|
| |||||||||||||||
| Water & Sewer Revenue: 0.14% | ||||||||||||||||
Kansas City MO Sanitation Sewer System Revenue Series B | 5.00 | 1-1-2021 | 575,000 | 588,507 | ||||||||||||
Kansas City MO Sanitation Sewer System Revenue Series B | 5.00 | 1-1-2023 | 805,000 | 896,424 | ||||||||||||
Kansas City MO Sanitation Sewer System Revenue Series B | 5.00 | 1-1-2025 | 810,000 | 968,096 | ||||||||||||
Kansas City MO Sanitation Sewer System Revenue Series B | 5.00 | 1-1-2027 | 700,000 | 882,770 | ||||||||||||
Kansas City MO Sanitation Sewer System Revenue Series B | 5.00 | 1-1-2028 | 275,000 | 356,015 | ||||||||||||
| 3,691,812 | ||||||||||||||||
|
| |||||||||||||||
| 44,745,583 | ||||||||||||||||
|
| |||||||||||||||
Nebraska: 0.65% |
| |||||||||||||||
| Utilities Revenue: 0.65% | ||||||||||||||||
Central Plains Energy Nebraska Gas Project #3 Series A | 5.00 | 9-1-2025 | 3,290,000 | 3,816,696 | ||||||||||||
Central Plains Energy Nebraska Gas Project #3 Series A | 5.00 | 9-1-2026 | 3,750,000 | 4,432,078 | ||||||||||||
Central Plains Energy Nebraska Gas Project #3 Series A | 5.00 | 9-1-2027 | 1,000,000 | 1,203,870 | ||||||||||||
Central Plains Energy Nebraska Gas Supply Revenue Refunding Bond (Royal Bank of Canada LIQ) | 4.00 | 12-1-2049 | 6,340,000 | 7,196,397 | ||||||||||||
| 16,649,041 | ||||||||||||||||
|
| |||||||||||||||
Nevada: 0.05% |
| |||||||||||||||
| Tax Revenue: 0.05% | ||||||||||||||||
Sparks NV Tourism Improvement District #1 Senior Revenue Refunding Bond Sales Tax Anticipation Notes 144A | 2.50 | 6-15-2024 | 1,315,000 | 1,290,659 | ||||||||||||
|
| |||||||||||||||
New Hampshire: 0.35% |
| |||||||||||||||
| Health Revenue: 0.25% | ||||||||||||||||
New Hampshire Covenant Health Systems Series B | 5.00 | 7-1-2028 | 6,400,000 | 6,416,960 | ||||||||||||
|
| |||||||||||||||
| Housing Revenue: 0.10% | ||||||||||||||||
New Hampshire National Finance Authority Municipal Certificates Series A | 4.13 | 1-20-2034 | 2,486,397 | 2,665,020 | ||||||||||||
|
| |||||||||||||||
| 9,081,980 | ||||||||||||||||
|
| |||||||||||||||
New Jersey: 4.50% |
| |||||||||||||||
| Airport Revenue: 0.49% | ||||||||||||||||
New Jersey EDA Refunding Bonds Port Newark Container | 5.00 | 10-1-2025 | 2,750,000 | 3,074,528 | ||||||||||||
New Jersey EDA Refunding Bonds Port Newark Container | 5.00 | 10-1-2026 | 2,130,000 | 2,412,438 | ||||||||||||
New Jersey EDA Refunding Bonds Port Newark Container | 5.00 | 10-1-2027 | 1,675,000 | 1,919,852 | ||||||||||||
South Jersey NJ Port Corporation Marine Terminal Series R | 4.00 | 1-1-2022 | 1,600,000 | 1,605,536 | ||||||||||||
South Jersey NJ Port Corporation Marine Terminal Series S-2 | 5.00 | 1-1-2023 | 1,665,000 | 1,751,880 | ||||||||||||
South Jersey NJ Port Corporation Marine Terminal Series S-2 | 5.00 | 1-1-2024 | 1,750,000 | 1,872,413 | ||||||||||||
| 12,636,647 | ||||||||||||||||
|
| |||||||||||||||
| Education Revenue: 0.30% | ||||||||||||||||
New Jersey Higher Education Student Assistance Authority Series 2014-1A-1 | 5.00 | 12-1-2021 | 2,250,000 | 2,361,173 | ||||||||||||
New Jersey Higher Education Student Assistance Authority Series 2017-1B | 5.00 | 12-1-2020 | 2,250,000 | 2,283,750 | ||||||||||||
New Jersey Higher Education Student Assistance Authority Series 2017-1B | 5.00 | 12-1-2021 | 2,815,000 | 2,954,089 | ||||||||||||
| 7,599,012 | ||||||||||||||||
|
| |||||||||||||||
The accompanying notes are an integral part of these financial statements.
28 | Wells Fargo Strategic Municipal Bond Fund
Portfolio of investments—June 30, 2020
| Interest rate | Maturity date | Principal | Value | |||||||||||||
| Housing Revenue: 0.39% | ||||||||||||||||
New Jersey Housing & Mortgage Finance Agency MFHR Series C | 2.41 | % | 10-1-2021 | $ | 10,000,000 | $ | 10,042,500 | |||||||||
|
| |||||||||||||||
| Industrial Development Revenue: 0.15% | ||||||||||||||||
New Jersey EDA Elite Pharmaceuticals Project Series A | 6.50 | 9-1-2030 | 355,000 | 306,393 | ||||||||||||
New Jersey EDA The Goethals Bridge Replacement Project | 5.00 | 7-1-2020 | 500,000 | 500,000 | ||||||||||||
New Jersey EDA The Goethals Bridge Replacement Project | 5.00 | 1-1-2021 | 585,000 | 595,325 | ||||||||||||
New Jersey EDA The Goethals Bridge Replacement Project | 5.00 | 7-1-2021 | 900,000 | 931,545 | ||||||||||||
New Jersey EDA The Goethals Bridge Replacement Project | 5.00 | 1-1-2023 | 1,520,000 | 1,645,628 | ||||||||||||
| 3,978,891 | ||||||||||||||||
|
| |||||||||||||||
| Miscellaneous Revenue: 1.26% | ||||||||||||||||
New Jersey EDA Motor Vehicle Surcharge Revenue Refunding Bond Series A | 3.13 | 7-1-2029 | 9,175,000 | 9,133,896 | ||||||||||||
New Jersey EDA Motor Vehicle Surcharge Revenue Refunding Bond Series A | 3.38 | 7-1-2030 | 9,705,000 | 9,720,237 | ||||||||||||
New Jersey EDA School Facilities Construction Project Prerefunded Bond Series EE | 5.50 | 9-1-2021 | 2,025,000 | 2,095,895 | ||||||||||||
New Jersey EDA School Facilities Construction Project Series EE | 5.25 | 9-1-2025 | 2,350,000 | 2,402,899 | ||||||||||||
New Jersey EDA School Facilities Construction Project Series K (Ambac Insured) | 5.25 | 12-15-2020 | 3,000,000 | 3,042,180 | ||||||||||||
New Jersey EDA School Facilities Construction Project Series NN (AGM Insured) | 5.00 | 3-1-2024 | 1,645,000 | 1,790,303 | ||||||||||||
New Jersey EDA School Facilities Construction Refunding Bond Project Series I (SIFMA Municipal Swap +1.25%) ± | 1.38 | 9-1-2025 | 4,500,000 | 4,339,980 | ||||||||||||
| 32,525,390 | ||||||||||||||||
|
| |||||||||||||||
| Tax Revenue: 0.34% | ||||||||||||||||
New Jersey EDA School Facilities Construction Project Unrefunded Bond Series EE | 5.50 | 9-1-2021 | 750,000 | 765,945 | ||||||||||||
New Jersey Garden State Preservation Trust Open & Farmland Series A (AGM Insured) | 5.75 | 11-1-2028 | 5,000,000 | 6,214,450 | ||||||||||||
New Jersey State TTFA Transportation Program Series BB | 5.00 | 6-15-2030 | 1,500,000 | 1,729,725 | ||||||||||||
| 8,710,120 | ||||||||||||||||
|
| |||||||||||||||
| Transportation Revenue: 1.35% | ||||||||||||||||
New Jersey TTFA CAB Series A ¤ | 0.00 | 12-15-2026 | 12,000,000 | 9,792,120 | ||||||||||||
New Jersey TTFA Series A | 5.00 | 6-15-2022 | 4,815,000 | 5,030,134 | ||||||||||||
New Jersey TTFA Series A | 5.00 | 12-15-2025 | 1,000,000 | 1,122,520 | ||||||||||||
New Jersey TTFA Series A | 5.25 | 12-15-2020 | 1,950,000 | 1,977,417 | ||||||||||||
New Jersey TTFA Series A | 5.25 | 6-15-2022 | 2,785,000 | 2,917,427 | ||||||||||||
New Jersey TTFA Series AA | 5.00 | 6-15-2023 | 4,665,000 | 5,021,126 | ||||||||||||
New Jersey TTFA Series AA | 5.00 | 6-15-2023 | 1,350,000 | 1,418,931 | ||||||||||||
New Jersey TTFA Series D | 5.00 | 12-15-2023 | 6,960,000 | 7,569,905 | ||||||||||||
| 34,849,580 | ||||||||||||||||
|
| |||||||||||||||
| Water & Sewer Revenue: 0.22% | ||||||||||||||||
New Jersey EDA | 2.20 | 10-1-2039 | 5,500,000 | 5,691,510 | ||||||||||||
|
| |||||||||||||||
| 116,033,650 | ||||||||||||||||
|
| |||||||||||||||
New Mexico: 0.30% |
| |||||||||||||||
| Utilities Revenue: 0.30% | ||||||||||||||||
New Mexico Municipal Energy Acquisition Authority Gas Supply Revenue Refunding Bond Subordinated Series A (Royal Bank of Canada LIQ) | 5.00 | 11-1-2039 | 6,660,000 | 7,831,161 | ||||||||||||
|
| |||||||||||||||
The accompanying notes are an integral part of these financial statements.
Wells Fargo Strategic Municipal Bond Fund | 29
Portfolio of investments—June 30, 2020
| Interest rate | Maturity date | Principal | Value | |||||||||||||
| New York: 7.46% | ||||||||||||||||
| Airport Revenue: 1.60% | ||||||||||||||||
New York Transportation Development Corporation Special Refunding Bond Terminal One Group Association | 5.00 | % | 1-1-2022 | $ | 3,000,000 | $ | 3,069,060 | |||||||||
Port Authority of New York & New Jersey Consolidated Bonds 205 Series | 5.00 | 11-15-2025 | 475,000 | 573,520 | ||||||||||||
Port Authority of New York & New Jersey Consolidated Bonds 172 Series | 5.00 | 10-1-2027 | 5,000,000 | 5,313,100 | ||||||||||||
Port Authority of New York & New Jersey Consolidated Bonds 185 Series | 5.00 | 9-1-2028 | 5,000,000 | 5,707,400 | ||||||||||||
Port Authority of New York & New Jersey Consolidated Bonds 207 Series | 5.00 | 9-15-2027 | 21,380,000 | 26,652,308 | ||||||||||||
| 41,315,388 | ||||||||||||||||
|
| |||||||||||||||
| Education Revenue: 0.30% | ||||||||||||||||
Build New York City Resource Corporation Bronx Charter School for International Cultures & Arts Series A | 3.88 | 4-15-2023 | 610,000 | 614,386 | ||||||||||||
Hempstead Town NY Local Development Corporation Academy Charter School Project Series A | 5.45 | 2-1-2027 | 2,880,000 | 2,995,978 | ||||||||||||
Hempstead Town NY Local Development Corporation Academy Charter School Project Series A | 6.47 | 2-1-2033 | 1,435,000 | 1,561,007 | ||||||||||||
Hempstead Town NY Local Development Corporation Education Revenue Academy Charter School Project Series A %% | 4.76 | 2-1-2027 | 970,000 | 971,591 | ||||||||||||
Hempstead Town NY Local Development Corporation Education Revenue Refunding Academy Charter School Project %% | 4.76 | 2-1-2027 | 215,000 | 215,353 | ||||||||||||
New York NY IDA Civic Facility Stars Churchill School Center Project (AGC Insured) | 2.25 | 10-1-2029 | 1,425,000 | 1,459,186 | ||||||||||||
| 7,817,501 | ||||||||||||||||
|
| |||||||||||||||
| GO Revenue: 0.50% | ||||||||||||||||
Poughkeepsie City NY Refunding Bond Public Improvement | 5.00 | 6-1-2024 | 340,000 | 358,108 | ||||||||||||
Poughkeepsie City NY Refunding Bond Public Improvement | 5.00 | 6-1-2025 | 235,000 | 249,744 | ||||||||||||
Poughkeepsie City NY Refunding Bond Public Improvement | 5.00 | 6-1-2031 | 600,000 | 628,746 | ||||||||||||
Suffolk County NY Series A | 5.00 | 3-19-2021 | 11,500,000 | 11,767,260 | ||||||||||||
| 13,003,858 | ||||||||||||||||
|
| |||||||||||||||
| Health Revenue: 0.68% | ||||||||||||||||
Monroe County NY Industrial Development Corporation Unity Hospital Rochester Project (FHA Insured) | 4.20 | 8-15-2025 | 7,195,000 | 7,215,290 | ||||||||||||
New York Dormitory Authority Non-State Supported Debt Northwell Health Obligated Group | 5.00 | 5-1-2048 | 6,000,000 | 7,083,660 | ||||||||||||
New York Dormitory Authority Revenues Non-State Supported Debt Montefiore Obligation Group Series A | 5.00 | 9-1-2028 | 1,400,000 | 1,677,704 | ||||||||||||
New York Dormitory Authority Revenues Non-State Supported Debit Montefiore Obligation Group Series A | 5.00 | 9-1-2029 | 1,350,000 | 1,638,765 | ||||||||||||
| 17,615,419 | ||||||||||||||||
|
| |||||||||||||||
| Housing Revenue: 0.09% | ||||||||||||||||
New York HFA Affordable Housing Project Series M (GNMA/FNMA/FHLMC Insured) | 2.00 | 5-1-2021 | 2,250,000 | 2,251,643 | ||||||||||||
|
| |||||||||||||||
| Industrial Development Revenue: 0.53% | ||||||||||||||||
New York Liberty Development Corporation Refunding Bond | 2.80 | 9-15-2069 | 2,000,000 | 1,959,760 | ||||||||||||
New York Transportation Development Corporation Special Facilities Revenue Delta Air Lines Incorporated LaGuardia Airport Terminals C&D Redevelopment | 5.00 | 1-1-2026 | 11,030,000 | 11,728,861 | ||||||||||||
| 13,688,621 | ||||||||||||||||
|
| |||||||||||||||
The accompanying notes are an integral part of these financial statements.
30 | Wells Fargo Strategic Municipal Bond Fund
Portfolio of investments—June 30, 2020
| Interest rate | Maturity date | Principal | Value | |||||||||||||
| Tax Revenue: 0.61% | ||||||||||||||||
New York City Transitional Future Tax Secured Subordinated Series E 1 | 5.00 | % | 2-1-2031 | $ | 10,000,000 | $ | 10,637,400 | |||||||||
Tender Option Bond Trust Receipts/Certificates (JPMorgan Chase & Company LIQ) 144Aø | 0.17 | 2-15-2028 | 5,000,000 | 5,000,000 | ||||||||||||
| 15,637,400 | ||||||||||||||||
|
| |||||||||||||||
| Transportation Revenue: 3.15% | ||||||||||||||||
Metropolitan Transportacion Authority Revenue Various Refunding Bonds Subordinated Series G3 (SIFMA Municipal Swap +0.43%) ± | 0.56 | 11-1-2031 | 20,000,000 | 18,235,200 | ||||||||||||
Metropolitan Transportation Authority Subordinate Bond Series D (1 Month LIBOR +0.65%) ± | 0.77 | 11-1-2035 | 17,235,000 | 16,806,366 | ||||||||||||
New York Triborough Bridge & Tunnel Authority Series B (U.S. SOFR +0.50%) ± | 0.56 | 11-15-2038 | 14,500,000 | 14,483,325 | ||||||||||||
Tender Option Bond Trust Receipts/Certificates (Barclays Bank plc LOC, Barclays Bank plc LIQ) 144Aø | 0.17 | 11-15-2038 | 5,625,000 | 5,625,000 | ||||||||||||
Tender Option Bond Trust Receipts/Certificates (JPMorgan Chase & Company LIQ) 144Aø | 0.28 | 1-1-2044 | 21,110,000 | 21,110,000 | ||||||||||||
Tender Option Bond Trust Receipts/Certificates (Morgan Stanley Bank LIQ) 144Aø | 0.38 | 1-1-2053 | 5,000,000 | 5,000,000 | ||||||||||||
| 81,259,891 | ||||||||||||||||
|
| |||||||||||||||
| 192,589,721 | ||||||||||||||||
|
| |||||||||||||||
North Carolina: 0.03% |
| |||||||||||||||
| Industrial Development Revenue: 0.03% | ||||||||||||||||
Columbus County NC Industrial Facilities and PCFA Refunding Bonds Recovery Zone Facility International Paper Company Project | 2.00 | 11-1-2033 | 850,000 | 878,067 | ||||||||||||
|
| |||||||||||||||
North Dakota: 0.48% |
| |||||||||||||||
| GO Revenue: 0.48% | ||||||||||||||||
McKenzie County ND Public School District #1 School Building Series A | 5.00 | 8-1-2025 | 960,000 | 1,137,523 | ||||||||||||
McKenzie County ND Public School District #1 School Building Series A | 5.00 | 8-1-2026 | 1,115,000 | 1,351,391 | ||||||||||||
McKenzie County ND Public School District #1 School Building Series A | 5.00 | 8-1-2027 | 1,170,000 | 1,449,958 | ||||||||||||
McKenzie County ND Public School District #1 School Building Series A | 5.00 | 8-1-2028 | 1,225,000 | 1,551,916 | ||||||||||||
McKenzie County ND Public School District #1 School Building Series A | 5.00 | 8-1-2029 | 1,290,000 | 1,626,755 | ||||||||||||
McKenzie County ND Public School District #1 School Building Series A | 5.00 | 8-1-2030 | 1,355,000 | 1,699,238 | ||||||||||||
McKenzie County ND Public School District #1 School Building Series A | 5.00 | 8-1-2031 | 1,420,000 | 1,770,626 | ||||||||||||
McKenzie County ND Public School District #1 School Building Series A | 5.00 | 8-1-2032 | 1,490,000 | 1,845,603 | ||||||||||||
| 12,433,010 | ||||||||||||||||
|
| |||||||||||||||
Ohio: 1.97% |
| |||||||||||||||
| Education Revenue: 0.08% | ||||||||||||||||
Portage County OH Port Authority Northeast Ohio Medical University Project | 5.00 | 12-1-2026 | 1,980,000 | 2,039,301 | ||||||||||||
|
| |||||||||||||||
| Health Revenue: 0.70% | ||||||||||||||||
Akron OH Bath and Copley Joint Township Hospital District | 5.00 | 1-1-2031 | 2,000,000 | 2,138,440 | ||||||||||||
Allen County OH Hospital Facilities Revenue Bonds Series B | 5.00 | 8-1-2047 | 2,500,000 | 2,681,525 | ||||||||||||
Hamilton County OH Healthcare Series 2017 | 3.00 | 1-1-2022 | 465,000 | 462,108 | ||||||||||||
Hamilton County OH Hospital Facilities Revenue UC Health | 5.00 | 9-15-2027 | 615,000 | 756,714 | ||||||||||||
Hamilton County OH Hospital Facilities Revenue UC Health | 5.00 | 9-15-2028 | 650,000 | 816,322 | ||||||||||||
Montgomery County OH Hospital Refunding Bonds Facilities Premier Health Partners | 5.00 | 11-15-2033 | 4,000,000 | 4,680,960 | ||||||||||||
Montgomery County OH Hospital Refunding Bonds Facilities Premier Health Partners | 5.00 | 11-15-2034 | 5,460,000 | 6,367,507 | ||||||||||||
| 17,903,576 | ||||||||||||||||
|
| |||||||||||||||
The accompanying notes are an integral part of these financial statements.
Wells Fargo Strategic Municipal Bond Fund | 31
Portfolio of investments—June 30, 2020
| Interest rate | Maturity date | Principal | Value | |||||||||||||
| Housing Revenue: 0.57% | ||||||||||||||||
Ohio HFA MFHR Chadwick Place & Union Square Apartments | 1.60 | % | 1-1-2022 | $ | 3,130,000 | $ | 3,142,457 | |||||||||
Ohio HFA MFHR Terrace Towers Apartments Project | 1.45 | 6-1-2022 | 11,525,000 | 11,642,209 | ||||||||||||
| 14,784,666 | ||||||||||||||||
|
| |||||||||||||||
| Resource Recovery Revenue: 0.19% | ||||||||||||||||
Ohio Air Quality Development Authority Revenue Refunding Bonds AMT American Electric Power Company | 2.10 | 12-1-2027 | 4,930,000 | 4,976,046 | ||||||||||||
|
| |||||||||||||||
| Utilities Revenue: 0.16% | ||||||||||||||||
Ohio Air Quality Development Authority Ohio Valley Electric Corporation Project Series A | 3.25 | 9-1-2029 | 4,000,000 | 4,109,600 | ||||||||||||
|
| |||||||||||||||
| Water & Sewer Revenue: 0.27% | ||||||||||||||||
Columbus OH Sewerage System | 5.00 | 6-1-2031 | 5,825,000 | 6,904,198 | ||||||||||||
|
| |||||||||||||||
| 50,717,387 | ||||||||||||||||
|
| |||||||||||||||
Oklahoma: 0.71% |
| |||||||||||||||
| Education Revenue: 0.21% | ||||||||||||||||
Oklahoma Development Finance Authority Revenue Refunding Bonds Oklahoma City University Project | 5.00 | 8-1-2025 | 925,000 | 1,040,616 | ||||||||||||
Oklahoma Development Finance Authority Revenue Refunding Bonds Oklahoma City University Project | 5.00 | 8-1-2026 | 975,000 | 1,109,589 | ||||||||||||
Oklahoma Development Finance Authority Revenue Refunding Bonds Oklahoma City University Project | 5.00 | 8-1-2027 | 1,370,000 | 1,574,294 | ||||||||||||
Oklahoma Development Finance Authority Revenue Refunding Bonds Oklahoma City University Project | 5.00 | 8-1-2028 | 715,000 | 830,666 | ||||||||||||
Oklahoma Development Finance Authority Revenue Refunding Bonds Oklahoma City University Project | 5.00 | 8-1-2029 | 755,000 | 885,358 | ||||||||||||
| 5,440,523 | ||||||||||||||||
|
| |||||||||||||||
| Miscellaneous Revenue: 0.31% | ||||||||||||||||
Carter County OK Public Facilities Authority Dickson Public Schools Project | 4.00 | 9-1-2025 | 350,000 | 383,740 | ||||||||||||
Carter County OK Public Facilities Authority Dickson Public Schools Project | 5.00 | 9-1-2025 | 365,000 | 419,929 | ||||||||||||
Muskogee OK Industrial Trust Educational Facilities Lease Muskogee Public Schools Project | 4.00 | 9-1-2028 | 2,500,000 | 2,968,250 | ||||||||||||
Muskogee OK Industrial Trust Educational Facilities Lease Muskogee Public Schools Project | 5.00 | 9-1-2024 | 890,000 | 1,034,305 | ||||||||||||
Muskogee OK Industrial Trust Educational Facilities Lease Muskogee Public Schools Project | 5.00 | 9-1-2025 | 855,000 | 1,018,895 | ||||||||||||
Muskogee OK Industrial Trust Educational Facilities Lease Muskogee Public Schools Project | 5.00 | 9-1-2026 | 1,810,000 | 2,197,955 | ||||||||||||
| 8,023,074 | ||||||||||||||||
|
| |||||||||||||||
| Tax Revenue: 0.19% | ||||||||||||||||
Tulsa OK Public Facilities Authority Capital Improvements | 4.00 | 10-1-2027 | 4,050,000 | 4,745,993 | ||||||||||||
|
| |||||||||||||||
| 18,209,590 | ||||||||||||||||
|
| |||||||||||||||
Oregon: 0.47% |
| |||||||||||||||
| Health Revenue: 0.47% | ||||||||||||||||
Clackamas County OR Hospital Facility Authority Revenue Senior Living Rose Villa Project | 2.75 | 11-15-2025 | 500,000 | 500,795 | ||||||||||||
Multnomah County OR Hospital Facilities Authority Revenue Refunding Bonds Adventist Health System/West | 5.00 | 3-1-2040 | 9,500,000 | 10,733,100 | ||||||||||||
The accompanying notes are an integral part of these financial statements.
32 | Wells Fargo Strategic Municipal Bond Fund
Portfolio of investments—June 30, 2020
| Interest rate | Maturity date | Principal | Value | |||||||||||||
| Health Revenue (continued) | ||||||||||||||||
Oregon State Facilities Authority Revenue Refunding Samaritan Health Services Project %% | 5.00 | % | 10-1-2025 | $ | 400,000 | $ | 467,904 | |||||||||
Oregon State Facilities Authority Revenue Refunding Samaritan Health Services Project %% | 5.00 | 10-1-2026 | 125,000 | 149,140 | ||||||||||||
Oregon State Facilities Authority Revenue Refunding Samaritan Health Services Project %% | 5.00 | 10-1-2027 | 300,000 | 363,879 | ||||||||||||
| 12,214,818 | ||||||||||||||||
|
| |||||||||||||||
Other: 0.13% |
| |||||||||||||||
| Miscellaneous Revenue: 0.13% | ||||||||||||||||
FHLMC Multiclass Mortgage Certificate of Participation Series M012 Class A1A øø | 1.60 | 8-15-2051 | 2,839,872 | 2,895,419 | ||||||||||||
Public Housing Capital Fund Trust II (HUD Insured) 144A | 4.50 | 7-1-2022 | 341,557 | 348,412 | ||||||||||||
| 3,243,831 | ||||||||||||||||
|
| |||||||||||||||
Pennsylvania: 5.68% |
| |||||||||||||||
| Education Revenue: 0.62% | ||||||||||||||||
Chester County PA IDA Avon Grove Charter School Project Series 2017A | 4.00 | 12-15-2027 | 1,910,000 | 1,985,388 | ||||||||||||
Chester County PA IDA Collegium Charter School Project Series A | 3.70 | 10-15-2022 | 1,150,000 | 1,156,107 | ||||||||||||
Lycoming County PA Authority Association of Independent Colleges & Universities of Pennsylvania Financing Program øø | 2.00 | 11-1-2035 | 3,000,000 | 3,000,000 | ||||||||||||
Montgomery County PA HEFAR Arcadia University | 5.00 | 4-1-2022 | 1,575,000 | 1,634,441 | ||||||||||||
Montgomery County PA HEFAR Arcadia University | 5.00 | 4-1-2023 | 1,555,000 | 1,637,617 | ||||||||||||
Philadelphia PA IDA Charter School Project Series 2016B | 4.88 | 8-1-2026 | 1,720,000 | 1,819,502 | ||||||||||||
Philadelphia PA IDA Charter School Project Series A | 4.50 | 8-1-2026 | 2,630,000 | 2,751,006 | ||||||||||||
Philadelphia PA IDA for Independence Charter School | 4.00 | 6-15-2029 | 350,000 | 350,984 | ||||||||||||
Philadelphia PA IDA Tacony Academy Christian School Project Series A-1 | 6.25 | 6-15-2023 | 400,000 | 424,940 | ||||||||||||
Philadelphia PA IDA University of the Arts Series 2017 144A | 5.00 | 3-15-2021 | 1,205,000 | 1,216,628 | ||||||||||||
| 15,976,613 | ||||||||||||||||
|
| |||||||||||||||
| GO Revenue: 1.53% | ||||||||||||||||
Allegheny County PA Penn Hills Schools District Series 2015 (BAM Insured) | 5.00 | 11-15-2022 | 340,000 | 375,326 | ||||||||||||
Allegheny County PA Penn Hills Schools District Series 2015 (BAM Insured) | 5.00 | 11-15-2023 | 1,025,000 | 1,172,795 | ||||||||||||
Armstrong PA School District Refunding Bonds Series A (BAM Insured) | 5.00 | 3-15-2027 | 745,000 | 931,347 | ||||||||||||
Armstrong PA School District Refunding Bonds Series A (BAM Insured) | 5.00 | 3-15-2029 | 920,000 | 1,202,385 | ||||||||||||
Armstrong PA School District Refunding Bonds Series A (BAM Insured) | 5.00 | 3-15-2030 | 1,800,000 | 2,339,298 | ||||||||||||
Bristol Township PA School District | 5.25 | 6-1-2031 | 6,990,000 | 7,879,687 | ||||||||||||
Philadelphia PA School District Series B | 3.13 | 9-1-2020 | 200,000 | 200,746 | ||||||||||||
Philadelphia PA School District Series D | 5.00 | 9-1-2021 | 2,000,000 | 2,095,420 | ||||||||||||
Philadelphia PA School District Series D | 5.00 | 9-1-2022 | 3,565,000 | 3,880,716 | ||||||||||||
Philadelphia PA School District Series E | 5.25 | 9-1-2022 | 2,995,000 | 3,017,253 | ||||||||||||
Philadelphia PA School District Series E | 5.25 | 9-1-2023 | 5,770,000 | 5,812,871 | ||||||||||||
Philadelphia PA School District Series F | 5.00 | 9-1-2022 | 5,000,000 | 5,442,800 | ||||||||||||
Scranton PA School District Series A | 5.00 | 6-1-2024 | 750,000 | 863,295 | ||||||||||||
Scranton PA School District Series A | 5.00 | 6-1-2025 | 1,000,000 | 1,183,680 | ||||||||||||
Scranton PA School District Series B (National Insured) | 5.00 | 6-1-2024 | 665,000 | 765,455 | ||||||||||||
Scranton PA School District Series B (National Insured) | 5.00 | 6-1-2025 | 710,000 | 840,413 | ||||||||||||
Scranton PA Series 2017 144A | 5.00 | 9-1-2023 | 1,355,000 | 1,473,874 | ||||||||||||
| 39,477,361 | ||||||||||||||||
|
| |||||||||||||||
| Health Revenue: 0.98% | ||||||||||||||||
Berks County PA Municipal Authority Tower Health Project Series B2 | 5.00 | 2-1-2040 | 6,000,000 | 6,874,440 | ||||||||||||
Bucks County PA IDA Hospital St. Lukes University Health Network | 4.00 | 8-15-2031 | 750,000 | 857,753 | ||||||||||||
The accompanying notes are an integral part of these financial statements.
Wells Fargo Strategic Municipal Bond Fund | 33
Portfolio of investments—June 30, 2020
| Interest rate | Maturity date | Principal | Value | |||||||||||||
| Health Revenue (continued) | ||||||||||||||||
Bucks County PA IDA Hospital St. Lukes University Health Network | 4.00 | % | 8-15-2032 | $ | 1,390,000 | $ | 1,573,452 | |||||||||
Fulton County PA IDA Medical Center Project | 2.40 | 7-1-2020 | 810,000 | 810,000 | ||||||||||||
Montgomery County PA Higher Education & Health Authority Thomas Jefferson University Series C (SIFMA Municipal Swap +0.72%) ± | 0.85 | 9-1-2051 | 3,500,000 | 3,499,650 | ||||||||||||
Quakertown PA Health Facilities Authority Series A | 3.13 | 7-1-2021 | 1,500,000 | 1,471,980 | ||||||||||||
Residual Interest Bond Floater Trust Series 2019-003 (Barclays Bank plc LOC, Barclays Bank plc LIQ) 144Aø | 0.28 | 8-15-2038 | 10,000,000 | 10,000,000 | ||||||||||||
| 25,087,275 | ||||||||||||||||
|
| |||||||||||||||
| Housing Revenue: 0.59% | ||||||||||||||||
East Hempfield Township Pennsylvania Industrial Development Student Services Incorporate Student Housing | 5.00 | 7-1-2025 | 1,330,000 | 1,336,876 | ||||||||||||
Pennsylvania HFA Single Family Series 128A | 4.75 | 4-1-2033 | 1,645,000 | 1,805,026 | ||||||||||||
Pennsylvania HFA Special Limited Obligation MFHR Development Episcopal House | 1.38 | 12-1-2022 | 12,000,000 | 12,115,320 | ||||||||||||
| 15,257,222 | ||||||||||||||||
|
| |||||||||||||||
| Industrial Development Revenue: 0.37% | ||||||||||||||||
Montgomery County PA IDA Peco Energy Company Project Series A | 2.60 | 3-1-2034 | 8,500,000 | 8,526,095 | ||||||||||||
Pennsylvania State Economic Development Financial Authority Solid Waste Disposal CarbonLite P LLC Project 144A | 5.25 | 6-1-2026 | 1,000,000 | 972,250 | ||||||||||||
| 9,498,345 | ||||||||||||||||
|
| |||||||||||||||
| Miscellaneous Revenue: 0.69% | ||||||||||||||||
Delaware Valley PA Regional Finance Authority Local Government Series A (Ambac Insured) | 5.50 | 8-1-2028 | 11,885,000 | 15,371,465 | ||||||||||||
Delaware Valley PA Regional Finance Authority Local Government Series B (Ambac Insured) | 5.70 | 7-1-2027 | 1,780,000 | 2,273,487 | ||||||||||||
Delaware Valley PA Regional Finance Authority Local Government Series C (Ambac Insured) | 7.75 | 7-1-2027 | 125,000 | 168,608 | ||||||||||||
| 17,813,560 | ||||||||||||||||
|
| |||||||||||||||
| Resource Recovery Revenue: 0.25% | ||||||||||||||||
Pennsylvania EDFA Solid Waste Disposal Republic Services Incoporated Project Series A øø | 1.95 | 4-1-2034 | 6,500,000 | 6,501,105 | ||||||||||||
|
| |||||||||||||||
| Transportation Revenue: 0.13% | ||||||||||||||||
Lancaster PA Guaranteed Parking Authority Series A (BAM Insured) | 4.00 | 9-1-2027 | 570,000 | 678,465 | ||||||||||||
Lancaster PA Guaranteed Parking Authority Series A (BAM Insured) | 4.00 | 9-1-2028 | 590,000 | 696,914 | ||||||||||||
Lancaster PA Guaranteed Parking Authority Series A (BAM Insured) | 4.00 | 9-1-2029 | 410,000 | 481,898 | ||||||||||||
Lancaster PA Guaranteed Parking Authority Series A (BAM Insured) | 4.00 | 9-1-2030 | 425,000 | 496,336 | ||||||||||||
Lancaster PA Guaranteed Parking Authority Series A (BAM Insured) | 4.00 | 9-1-2031 | 440,000 | 510,145 | ||||||||||||
Lancaster PA Guaranteed Parking Authority Series A (BAM Insured) | 4.00 | 9-1-2032 | 460,000 | 529,787 | ||||||||||||
| 3,393,545 | ||||||||||||||||
|
| |||||||||||||||
| Water & Sewer Revenue: 0.52% | ||||||||||||||||
Luzerne County PA IDA Revenue Refunding Bond AMT Pennsylvania American Water Company Project | 2.45 | 12-1-2039 | 3,250,000 | 3,516,663 | ||||||||||||
Pittsburgh PA Water & Sewer Authority Series C (1 Month LIBOR +0.64%) (AGM Insured) ± | 0.77 | 9-1-2040 | 10,000,000 | 9,957,900 | ||||||||||||
| 13,474,563 | ||||||||||||||||
|
| |||||||||||||||
| 146,479,589 | ||||||||||||||||
|
| |||||||||||||||
The accompanying notes are an integral part of these financial statements.
34 | Wells Fargo Strategic Municipal Bond Fund
Portfolio of investments—June 30, 2020
| Interest rate | Maturity date | Principal | Value | |||||||||||||
| Rhode Island: 0.08% |
| |||||||||||||||
| Housing Revenue: 0.00% | ||||||||||||||||
Rhode Island Housing & Mortgage Finance | 6.50 | % | 4-1-2027 | $ | 15,000 | $ | 15,058 | |||||||||
|
| |||||||||||||||
| Miscellaneous Revenue: 0.08% | ||||||||||||||||
Providence RI RDA Series A | 5.00 | 4-1-2022 | 1,940,000 | 2,024,720 | ||||||||||||
|
| |||||||||||||||
| 2,039,778 | ||||||||||||||||
|
| |||||||||||||||
South Carolina: 0.46% |
| |||||||||||||||
| Education Revenue: 0.02% | ||||||||||||||||
South Carolina Jobs EDA York Preparatory Academy Project Series A | 5.75 | 11-1-2023 | 575,000 | 593,153 | ||||||||||||
|
| |||||||||||||||
| Health Revenue: 0.11% | ||||||||||||||||
Greenville Hospital System South Carolina Hospital Refunding Bond | 5.00 | 5-1-2029 | 2,725,000 | 2,879,617 | ||||||||||||
|
| |||||||||||||||
| Miscellaneous Revenue: 0.20% | ||||||||||||||||
Berkeley County SC Assessment Revenue Bonds Nexton Improvement District | 4.00 | 11-1-2030 | 425,000 | 421,430 | ||||||||||||
Lee County SC School Facilities Incorporated (AGM Insured) | 4.00 | 12-1-2020 | 375,000 | 380,306 | ||||||||||||
South Carolina Transportation Infrastructure Refunding Bonds Series A | 5.00 | 10-1-2032 | 4,025,000 | 4,257,162 | ||||||||||||
| 5,058,898 | ||||||||||||||||
|
| |||||||||||||||
| Resource Recovery Revenue: 0.13% | ||||||||||||||||
South Carolina Jobs EDA | 8.00 | 12-6-2029 | 260,000 | 246,514 | ||||||||||||
South Carolina Jobs EDA Solid Waste Disposal RePower South Berkeley LLC 144A | 5.25 | 2-1-2027 | 3,310,000 | 2,984,263 | ||||||||||||
| 3,230,777 | ||||||||||||||||
|
| |||||||||||||||
| 11,762,445 | ||||||||||||||||
|
| |||||||||||||||
South Dakota: 0.33% |
| |||||||||||||||
| Health Revenue: 0.33% | ||||||||||||||||
South Dakota HEFA Avera Health Series A | 5.00 | 7-1-2033 | 7,675,000 | 8,564,840 | ||||||||||||
|
| |||||||||||||||
Tennessee: 0.66% |
| |||||||||||||||
| Utilities Revenue: 0.66% | ||||||||||||||||
Tennessee Energy Acquisition Corporation Gas Project | 4.00 | 11-1-2049 | 2,210,000 | 2,502,273 | ||||||||||||
Tennessee Energy Acquisition Corporation Series A | 4.00 | 5-1-2048 | 12,390,000 | 13,335,853 | ||||||||||||
Tennessee Energy Acquisition Corporation Series B | 5.63 | 9-1-2026 | 925,000 | 1,111,832 | ||||||||||||
| 16,949,958 | ||||||||||||||||
|
| |||||||||||||||
Texas: 9.45% |
| |||||||||||||||
| Airport Revenue: 1.61% | ||||||||||||||||
Dallas Fort Worth TX International Airport Improvement Bonds AMT Series H | 5.00 | 11-1-2032 | 9,175,000 | 9,575,856 | ||||||||||||
Dallas Fort Worth TX International Airport Improvement Bonds AMT Series H | 5.00 | 11-1-2037 | 22,000,000 | 22,901,780 | ||||||||||||
Dallas Fort Worth TX International Airport Refunding Bonds AMT Series A | 5.00 | 11-1-2032 | 3,125,000 | 3,447,688 | ||||||||||||
Dallas Fort Worth TX International Airport Refunding Bonds AMT Series E | 5.00 | 11-1-2032 | 1,970,000 | 1,999,885 | ||||||||||||
Galveston TX Wharves and Terminal Refunding Bond | 4.63 | 2-1-2024 | 755,000 | 758,986 | ||||||||||||
Houston TX Airport System Subordinate Refunding Bonds AMT Series A | 5.00 | 7-1-2031 | 2,750,000 | 2,934,030 | ||||||||||||
| 41,618,225 | ||||||||||||||||
|
| |||||||||||||||
The accompanying notes are an integral part of these financial statements.
Wells Fargo Strategic Municipal Bond Fund | 35
Portfolio of investments—June 30, 2020
| Interest rate | Maturity date | Principal | Value | |||||||||||||
| Education Revenue: 1.22% | ||||||||||||||||
Alamo TX Community College District Various Financing System | 1.70 | % | 11-1-2042 | $ | 1,370,000 | $ | 1,373,329 | |||||||||
Arlington TX Higher Education Finance Corporate Education Series A | 4.00 | 6-15-2026 | 530,000 | 531,071 | ||||||||||||
Austin TX Community College District Series A | 4.00 | 2-1-2023 | 320,000 | 349,229 | ||||||||||||
Clifton TX Higher Education Finance Corporation Education Revenue International Leadership Texas Series A | 6.00 | 3-1-2029 | 2,150,000 | 2,350,230 | ||||||||||||
Clifton TX Higher Education Finance Corporation International Leadership Series 2015A | 4.63 | 8-15-2025 | 8,905,000 | 9,414,900 | ||||||||||||
Clifton TX Higher Education Finance Corporation Uplift Education Series 2018D | 5.00 | 8-15-2025 | 6,565,000 | 7,285,574 | ||||||||||||
Clifton TX Higher Education Finance Corporation Uplift Education Series A | 4.00 | 12-1-2025 | 2,835,000 | 2,936,039 | ||||||||||||
New Hope Cultural Education Facilities Finance Corporation Texas Education Revenue Cumberland Academy Series A 144A | 4.00 | 8-15-2030 | 1,735,000 | 1,742,114 | ||||||||||||
New Hope TX Cultural Education Facilities Finance Corporation Jubilee Academic Center 144A | 3.38 | 8-15-2021 | 1,070,000 | 1,068,395 | ||||||||||||
Newark TX Higher Educational Finance Corporation Charter Schools Incorporated Series 2015 A 144A | 4.63 | 8-15-2025 | 1,360,000 | 1,445,462 | ||||||||||||
Texas PFA Southern University Financing System (BAM Insured) | 5.00 | 11-1-2020 | 1,715,000 | 1,735,134 | ||||||||||||
Texas PFA Southern University Financing System (BAM Insured) | 5.00 | 11-1-2021 | 1,275,000 | 1,334,237 | ||||||||||||
| 31,565,714 | ||||||||||||||||
|
| |||||||||||||||
| GO Revenue: 3.50% | ||||||||||||||||
Brazosporight TX Independent School District School Building Series A | 4.00 | 2-15-2029 | 2,355,000 | 2,813,259 | ||||||||||||
Denton TX Independent School District Refunding Bonds Series B | 5.00 | 8-15-2032 | 5,000,000 | 5,465,050 | ||||||||||||
Grapevine Colleyville TX Independent School Building | 5.00 | 8-15-2034 | 2,890,000 | 3,470,485 | ||||||||||||
Grapevine Colleyville TX Independent School Building | 5.00 | 8-15-2035 | 1,600,000 | 1,917,840 | ||||||||||||
Houston TX Public Improvement Refunding Bonds Series A | 4.00 | 3-1-2031 | 10,110,000 | 11,187,018 | ||||||||||||
Leander TX Independent School District CAB Bonds Series 2014C ¤ | 0.00 | 8-15-2035 | 2,975,000 | 1,677,870 | ||||||||||||
Northside TX Independent School District Building Bond Series 2018 | 2.75 | 8-1-2048 | 11,275,000 | 11,907,077 | ||||||||||||
Northwest TX Independent School District Refunding Bonds | 5.00 | 2-15-2032 | 1,750,000 | 2,076,760 | ||||||||||||
Texas State College Student Loan | 4.00 | 8-1-2032 | 1,500,000 | 1,812,735 | ||||||||||||
Texas Transportation Commission Mobility Fund Refunding Bonds Series A | 5.00 | 10-1-2030 | 40,760,000 | 48,004,275 | ||||||||||||
| 90,332,369 | ||||||||||||||||
|
| |||||||||||||||
| Health Revenue: 0.25% | ||||||||||||||||
Mesquite TX Health Facilities Development Corporation Christian Care Centers Incorporated Project Series 2016 | 5.00 | 2-15-2021 | 560,000 | 556,741 | ||||||||||||
New Hope TX Cultural Education Facilities Finance Corporation Hospital Series 2017A | 5.00 | 8-15-2024 | 1,000,000 | 1,170,340 | ||||||||||||
New Hope TX Cultural Education Facilities Finance Corporation Hospital Series 2017A | 5.00 | 8-15-2026 | 2,000,000 | 2,465,840 | ||||||||||||
New Hope TX Cultural Education Facilities Finance Corporation Presbyterian Village North Project | 5.00 | 10-1-2020 | 680,000 | 680,483 | ||||||||||||
New Hope TX Cultural Education Facilities Finance Corporation Presbyterian Village North Project | 5.00 | 10-1-2023 | 1,570,000 | 1,578,761 | ||||||||||||
| 6,452,165 | ||||||||||||||||
|
| |||||||||||||||
| Housing Revenue: 0.14% | ||||||||||||||||
New Hope TX Cultural Education Facilities Finance Corporation Student Housing Tarleton State University Project | 5.38 | 4-1-2028 | 1,845,000 | 1,926,383 | ||||||||||||
New Hope TX ECFA Collegiate Housing Tarleton State University Series A | 4.00 | 4-1-2021 | 310,000 | 312,170 | ||||||||||||
New Hope TX ECFA Collegiate Housing Tarleton State University Series A | 4.00 | 4-1-2022 | 870,000 | 883,633 | ||||||||||||
New Hope TX ECFA Collegiate Housing Tarleton State University Series A | 5.00 | 4-1-2025 | 480,000 | 510,134 | ||||||||||||
| 3,632,320 | ||||||||||||||||
|
| |||||||||||||||
The accompanying notes are an integral part of these financial statements.
36 | Wells Fargo Strategic Municipal Bond Fund
Portfolio of investments—June 30, 2020
| Interest rate | Maturity date | Principal | Value | |||||||||||||
| Industrial Development Revenue: 0.44% | ||||||||||||||||
Austin Convention Enterprises Incorporated Series 2017B | 5.00 | % | 1-1-2021 | $ | 500,000 | $ | 490,430 | |||||||||
Houston TX Airport System Refunding Bond United Airlines Incorporated Terminal E Project | 4.50 | 7-1-2020 | 8,150,000 | 8,150,000 | ||||||||||||
Houston TX Airport System Revenue AMT Series B2 | 5.00 | 7-15-2020 | 2,750,000 | 2,754,510 | ||||||||||||
| 11,394,940 | ||||||||||||||||
|
| |||||||||||||||
| Miscellaneous Revenue: 0.53% | ||||||||||||||||
Houston TX Airport System Revenue Refunding AMT Special Facilities United | 5.00 | 7-1-2027 | 1,750,000 | 1,820,123 | ||||||||||||
Lewisville TX Combination Contract Revenue Special Assessment Bonds Utility System 144A | 8.00 | 9-1-2039 | 1,895,000 | 1,953,404 | ||||||||||||
Lewisville TX Combination Contract Revenue Special Assessment Bonds Utility System 144A | 8.00 | 9-1-2039 | 1,775,000 | 1,829,706 | ||||||||||||
Lower Colorado River Authority Texas Transmission Contract LCRA Transmission Services Corporation | 5.00 | 5-15-2028 | 1,845,000 | 2,146,049 | ||||||||||||
Texas Transportation Commission Highway Improvement | 5.00 | 4-1-2027 | 3,010,000 | 3,530,580 | ||||||||||||
Wood Glen TX Housing Finance Corporation Mortgage Copperwood Project Series A (National/FHA Insured) | 7.65 | 7-1-2022 | 2,125,000 | 2,311,724 | ||||||||||||
| 13,591,586 | ||||||||||||||||
|
| |||||||||||||||
| Resource Recovery Revenue: 0.21% | ||||||||||||||||
Port Arthur TX Navigation District Jefferson County Environmental Facilities Motiva Enterprises LLC Project Series C ø | 0.92 | 4-1-2040 | 5,365,000 | 5,365,000 | ||||||||||||
|
| |||||||||||||||
| Transportation Revenue: 0.35% | ||||||||||||||||
Central Texas Regional Mobility Authority Senior Lien Series A | 5.00 | 1-1-2021 | 1,000,000 | 1,013,320 | ||||||||||||
Central Texas Regional Mobility Authority Senior Lien Series A | 5.00 | 1-1-2023 | 500,000 | 533,420 | ||||||||||||
Texas Private Activity Bond Surface Transportation Corporation Senior Lien LBJ Infrastructure Group LLC | 7.00 | 6-30-2040 | 1,250,000 | 1,256,875 | ||||||||||||
Texas Private Activity Bond Surface Transportation Corporation Senior Lien Revenue Refunding Notes Mobility | 5.00 | 12-31-2030 | 1,000,000 | 1,242,150 | ||||||||||||
Texas Private Activity Bond Surface Transportation Corporation Senior Lien Revenue Refunding Notes Mobility | 5.00 | 12-31-2032 | 1,000,000 | 1,223,850 | ||||||||||||
Texas Private Activity Bond Surface Transportation Corporation Senior Lien Revenue Refunding Notes Mobility | 5.00 | 12-31-2033 | 3,000,000 | 3,657,450 | ||||||||||||
| 8,927,065 | ||||||||||||||||
|
| |||||||||||||||
| Utilities Revenue: 0.41% | ||||||||||||||||
San Antonio TX Electric & Gas Revenue Various Refunding Junior Lien Series 2020 | 1.75 | 2-1-2049 | 4,250,000 | 4,328,285 | ||||||||||||
San Antonio TX Electric & Gas Systems Junior Lien Refunding Bond | 2.75 | 2-1-2048 | 6,000,000 | 6,308,700 | ||||||||||||
| 10,636,985 | ||||||||||||||||
|
| |||||||||||||||
| Water & Sewer Revenue: 0.79% | ||||||||||||||||
Dallas TX Waterworks Refunding Bonds Series A | 5.00 | 10-1-2029 | 16,225,000 | 20,275,247 | ||||||||||||
|
| |||||||||||||||
| 243,791,616 | ||||||||||||||||
|
| |||||||||||||||
Utah: 0.22% |
| |||||||||||||||
| Airport Revenue: 0.18% | ||||||||||||||||
Salt Lake City UT Airport Revenue Bonds AMT Series 2018A | 5.00 | 7-1-2029 | 1,000,000 | 1,254,830 | ||||||||||||
Salt Lake City UT Airport Revenue Bonds AMT Series 2018A | 5.00 | 7-1-2031 | 2,705,000 | 3,345,625 | ||||||||||||
| 4,600,455 | ||||||||||||||||
|
| |||||||||||||||
The accompanying notes are an integral part of these financial statements.
Wells Fargo Strategic Municipal Bond Fund | 37
Portfolio of investments—June 30, 2020
| Interest rate | Maturity date | Principal | Value | |||||||||||||
| Education Revenue: 0.04% | ||||||||||||||||
Utah Charter School Finance Authority Ronald Wilson Reagan Academy Project Series A 144A | 3.50 | % | 2-15-2026 | $ | 1,215,000 | $ | 1,197,285 | |||||||||
|
| |||||||||||||||
| 5,797,740 | ||||||||||||||||
|
| |||||||||||||||
Vermont: 0.45% |
| |||||||||||||||
| Education Revenue: 0.37% | ||||||||||||||||
Vermont Student Assistance Corporation Series A | 5.00 | 6-15-2021 | 1,800,000 | 1,855,188 | ||||||||||||
Vermont Student Assistance Corporation Series A | 5.00 | 6-15-2022 | 550,000 | 583,594 | ||||||||||||
Vermont Student Assistance Corporation Series A | 5.00 | 6-15-2023 | 1,200,000 | 1,306,608 | ||||||||||||
Vermont Student Assistance Corporation Series B (1 Month LIBOR +1.00%) ± | 1.17 | 6-2-2042 | 5,985,747 | 5,784,147 | ||||||||||||
| 9,529,537 | ||||||||||||||||
|
| |||||||||||||||
| Housing Revenue: 0.08% | ||||||||||||||||
Vermont Housing Finance Agency Multiple Purpose Series A (GNMA/FNMA/FHLMC Insured) | 3.75 | 11-1-2050 | 1,815,000 | 2,007,299 | ||||||||||||
|
| |||||||||||||||
| 11,536,836 | ||||||||||||||||
|
| |||||||||||||||
Virginia: 2.30% |
| |||||||||||||||
| Health Revenue: 0.03% | ||||||||||||||||
Roanoke VA EDA Residential Care Facility Revenue Richfield Living | 4.30 | 9-1-2030 | 770,000 | 725,656 | ||||||||||||
|
| |||||||||||||||
| Miscellaneous Revenue: 0.28% | ||||||||||||||||
Westmoreland County VA IDA Lease BAN High School Project | 2.00 | 6-1-2022 | 7,000,000 | 7,159,740 | ||||||||||||
|
| |||||||||||||||
| Transportation Revenue: 1.08% | ||||||||||||||||
Chesapeake VA Bay Bridge & Tunnel District First Tier Generation Resolution | 5.00 | 11-1-2023 | 20,000,000 | 21,573,190 | ||||||||||||
Toll Road Investors Partnership II LP Series 1999B (National Public Finance Guaranty Insured) 144A¤ | 0.00 | 2-15-2029 | 10,000,000 | 6,480,178 | ||||||||||||
| 28,053,368 | ||||||||||||||||
|
| |||||||||||||||
| Utilities Revenue: 0.91% | ||||||||||||||||
Chesapeake VA EDA Poll Control Electric & Power Company Series 2008A | 1.90 | 2-1-2032 | 4,250,000 | 4,395,138 | ||||||||||||
Louisa VA Electric and Power IDA Series 2008B | 2.15 | 11-1-2035 | 19,050,000 | 19,056,096 | ||||||||||||
| 23,451,234 | ||||||||||||||||
|
| |||||||||||||||
| 59,389,998 | ||||||||||||||||
|
| |||||||||||||||
Washington: 1.32% |
| |||||||||||||||
| Airport Revenue: 0.08% | ||||||||||||||||
Port of Seattle WA Intermediate Lien Revenue Bonds AMT Series 2018A | 5.00 | 5-1-2036 | 1,710,000 | 2,002,667 | ||||||||||||
|
| |||||||||||||||
| GO Revenue: 0.24% | ||||||||||||||||
Washington State Refunding Bonds Motor Vehicle Fuel Tax %% | 5.00 | 6-1-2027 | 1,120,000 | 1,396,416 | ||||||||||||
Washington State Refunding Bonds Motor Vehicle Fuel Tax %% | 5.00 | 6-1-2028 | 1,500,000 | 1,921,440 | ||||||||||||
Washington State Refunding Bonds Motor Vehicle Fuel Tax %% | 5.00 | 6-1-2029 | 1,000,000 | 1,312,270 | ||||||||||||
Washington State Refunding Bonds Motor Vehicle Fuel Tax %% | 5.00 | 6-1-2030 | 1,150,000 | 1,541,058 | ||||||||||||
| 6,171,184 | ||||||||||||||||
|
| |||||||||||||||
| Health Revenue: 0.79% | ||||||||||||||||
Washington HCFR Catholic Health Initiatives Series B (SIFMA Municipal Swap +1.40%) ± | 1.53 | 1-1-2035 | 11,000,000 | 10,768,340 | ||||||||||||
Washington Health Care Facilities Authority Commonspirit Health Series B3 | 5.00 | 8-1-2049 | 3,000,000 | 3,528,990 | ||||||||||||
The accompanying notes are an integral part of these financial statements.
38 | Wells Fargo Strategic Municipal Bond Fund
Portfolio of investments—June 30, 2020
| Interest rate | Maturity date | Principal | Value | |||||||||||||
| Health Revenue (continued) | ||||||||||||||||
Washington Health Care Facilities Authority Fred Hutchinson Cancer Research (1 Month LIBOR +1.10%) ± | 1.22 | % | 1-1-2042 | $ | 6,050,000 | $ | 6,046,249 | |||||||||
| 20,343,579 | ||||||||||||||||
|
| |||||||||||||||
| Housing Revenue: 0.21% | ||||||||||||||||
Snohomish County WA Housing Authority | 5.00 | 4-1-2027 | 1,130,000 | 1,392,680 | ||||||||||||
Snohomish County WA Housing Authority | 5.00 | 4-1-2028 | 1,610,000 | 2,025,251 | ||||||||||||
Snohomish County WA Housing Authority | 5.00 | 4-1-2029 | 1,690,000 | 2,160,902 | ||||||||||||
| 5,578,833 | ||||||||||||||||
|
| |||||||||||||||
| 34,096,263 | ||||||||||||||||
|
| |||||||||||||||
West Virginia: 0.48% |
| |||||||||||||||
| Education Revenue: 0.05% | ||||||||||||||||
West Virginia University Revenues Refunding West Virginia University Projects Series B | 5.00 | 10-1-2041 | 1,000,000 | 1,271,390 | ||||||||||||
|
| |||||||||||||||
| Miscellaneous Revenue: 0.09% | ||||||||||||||||
Roane County WV Building Commission Lease BAN Roane General Hospital | 2.55 | 11-1-2021 | 2,250,000 | 2,261,430 | ||||||||||||
|
| |||||||||||||||
| Tax Revenue: 0.12% | ||||||||||||||||
Monongalia County WV Commission Special District University Town Center Series A 144A | 4.50 | 6-1-2027 | 3,105,000 | 3,194,145 | ||||||||||||
|
| |||||||||||||||
| Utilities Revenue: 0.22% | ||||||||||||||||
West Virginia EDA Solid Waste Disposal Facilities Wheeling Power Company Mitchell Project Series A | 3.00 | 6-1-2037 | 5,450,000 | 5,589,466 | ||||||||||||
|
| |||||||||||||||
| 12,316,431 | ||||||||||||||||
|
| |||||||||||||||
Wisconsin: 2.72% |
| |||||||||||||||
| Airport Revenue: 0.04% | ||||||||||||||||
Wisconsin PFA Airport Series C | 5.00 | 7-1-2022 | 905,000 | 927,887 | ||||||||||||
|
| |||||||||||||||
| Education Revenue: 0.22% | ||||||||||||||||
Corvian County WI Community School Revenue 144A | 4.25 | 6-15-2029 | 1,015,000 | 1,019,385 | ||||||||||||
Milwaukee WI RDA Science Education Consortium Incorporated Project Series A | 4.75 | 8-1-2023 | 640,000 | 669,005 | ||||||||||||
PFA Wisconsin Charter School Revenue American Preparatory Academy 144A | 4.00 | 7-15-2029 | 650,000 | 641,264 | ||||||||||||
PFA Wisconsin Education Revenue Corvian Community School Series A 144A | 4.00 | 6-15-2029 | 965,000 | 955,678 | ||||||||||||
Pine Lake WI PFA Preparatory Series 2015 144A | 4.35 | 3-1-2025 | 1,805,000 | 1,837,689 | ||||||||||||
Wisconsin PFA Roseman University of Health Sciences Project Series 2012 | 5.00 | 4-1-2022 | 630,000 | 644,125 | ||||||||||||
| 5,767,146 | ||||||||||||||||
|
| |||||||||||||||
| GO Revenue: 0.99% | ||||||||||||||||
Eau Claire WI Area School District Refunding Bonds | 5.00 | 4-1-2022 | 1,245,000 | 1,346,891 | ||||||||||||
Eau Claire WI Area School District Refunding Bonds | 5.00 | 4-1-2023 | 1,860,000 | 2,091,142 | ||||||||||||
Eau Claire WI Area School District Refunding Bonds | 5.00 | 4-1-2024 | 1,000,000 | 1,166,180 | ||||||||||||
Wisconsin State Series B | 5.00 | 5-1-2031 | 12,230,000 | 15,003,153 | ||||||||||||
Wisconsin State Series B | 5.00 | 5-1-2034 | 5,000,000 | 5,910,450 | ||||||||||||
| 25,517,816 | ||||||||||||||||
|
| |||||||||||||||
| Health Revenue: 0.59% | ||||||||||||||||
Wisconsin HEFA Bellin Memorial Hospital Series 2015 | 3.00 | 12-1-2020 | 745,000 | 751,385 | ||||||||||||
Wisconsin HEFA Bellin Memorial Hospital Series 2015 | 5.00 | 12-1-2022 | 755,000 | 826,461 | ||||||||||||
The accompanying notes are an integral part of these financial statements.
Wells Fargo Strategic Municipal Bond Fund | 39
Portfolio of investments—June 30, 2020
| Interest rate | Maturity date | Principal | Value | |||||||||||||
| Health Revenue (continued) | ||||||||||||||||
Wisconsin HEFA Beloit Health System Incorporated | 5.00 | % | 7-1-2027 | $ | 1,145,000 | $ | 1,394,129 | |||||||||
Wisconsin HEFA Beloit Health System Incorporated | 5.00 | 7-1-2028 | 600,000 | 745,056 | ||||||||||||
Wisconsin HEFA Marshfield Clinic Health System | 5.00 | 2-15-2052 | 3,000,000 | 3,425,730 | ||||||||||||
Wisconsin HEFA St. Camillus Health System Incorporated | 5.00 | 11-1-2027 | 375,000 | 391,575 | ||||||||||||
Wisconsin HEFA St. Camillus Health System Incorporated | 5.00 | 11-1-2028 | 470,000 | 489,796 | ||||||||||||
Wisconsin HEFA Temps 50 St. Camillus Health System Incorporated | 2.25 | 11-1-2026 | 4,000,000 | 3,737,720 | ||||||||||||
Wisconsin PFA Bancroft Neurohealth Project Series A 144A | 4.00 | 6-1-2021 | 1,370,000 | 1,382,234 | ||||||||||||
Wisconsin State HEFA Ascension Health Credit Group Series A | 4.00 | 11-15-2034 | 2,000,000 | 2,211,600 | ||||||||||||
| 15,355,686 | ||||||||||||||||
|
| |||||||||||||||
| Miscellaneous Revenue: 0.22% | ||||||||||||||||
Monona WI Anticipation Notes Series D | 3.63 | 9-1-2022 | 1,925,000 | 1,933,586 | ||||||||||||
Wisconsin State Series 2 | 5.00 | 11-1-2029 | 3,000,000 | 3,705,180 | ||||||||||||
| 5,638,766 | ||||||||||||||||
|
| |||||||||||||||
| Tax Revenue: 0.58% | ||||||||||||||||
Wisconsin State General Fund Annual Appropriations Series A | 5.00 | 5-1-2028 | 11,775,000 | 14,948,598 | ||||||||||||
|
| |||||||||||||||
| Water & Sewer Revenue: 0.08% | ||||||||||||||||
Wisconsin Clean Water Refunding Bonds Series 2012 | 5.00 | 6-1-2023 | 310,000 | 347,234 | ||||||||||||
Wisconsin Clean Water Refunding Bonds Series 2015 | 5.00 | 6-1-2026 | 1,525,000 | 1,797,152 | ||||||||||||
| 2,144,386 | ||||||||||||||||
|
| |||||||||||||||
| 70,300,285 | ||||||||||||||||
|
| |||||||||||||||
Total Municipal Obligations (Cost $2,464,995,862) |
| 2,533,275,908 | ||||||||||||||
|
| |||||||||||||||
Closed End Municipal Bond Fund Obligations: 0.39% |
| |||||||||||||||
| Other: 0.39% | ||||||||||||||||
Nuveen AMT-Free Municipal Credit Income Fund MuniFund Preferred Shares Series B (10,000 shares) 0.92% 144Aø | 10,000,000 | 10,000,000 | ||||||||||||||
|
| |||||||||||||||
Total Closed End Municipal Bond Fund Obligations (Cost $10,000,000) |
| 10,000,000 | ||||||||||||||
|
| |||||||||||||||
| Yield | Shares | |||||||||||||||
| Short-Term Investments: 0.88% |
| |||||||||||||||
| Investment Companies: 0.88% | ||||||||||||||||
Wells Fargo Municipal Cash Management Money Market Fund Institutional Class (l)(u)## | 0.10 | 22,720,411 | 22,727,227 | |||||||||||||
|
| |||||||||||||||
Total Short-Term Investments (Cost $22,724,557) |
| 22,727,227 | ||||||||||||||
|
| |||||||||||||||
| Total investments in securities (Cost $2,497,720,419) | 99.42 | % | 2,566,003,135 | |||||
Other assets and liabilities, net | 0.58 | 14,853,966 | ||||||
|
|
|
| |||||
| Total net assets | 100.00 | % | $ | 2,580,857,101 | ||||
|
|
|
| |||||
The accompanying notes are an integral part of these financial statements.
40 | Wells Fargo Strategic Municipal Bond Fund
Portfolio of investments—June 30, 2020
| 144A | The security may be resold in transactions exempt from registration, normally to qualified institutional buyers, pursuant to Rule 144A under the Securities Act of 1933. |
| ø | Variable rate demand notes are subject to a demand feature which reduces the effective maturity. The maturity date shown represents the final maturity date of the security. The interest rate is determined and reset by the issuer daily, weekly, or monthly depending upon the terms of the security. The rate shown is the rate in effect at period end. |
| ± | Variable rate investment. The rate shown is the rate in effect at period end. |
| (m) | The security is an auction-rate security which has an interest rate that resets at predetermined short-term intervals through a Dutch auction. The rate shown is the rate in effect at period end. |
| %% | The security is purchased on a when-issued basis. |
| ¤ | The security is issued in zero coupon form with no periodic interest payments. |
| øø | The interest rate is determined and reset by the issuer periodically depending upon the terms of the security. The rate shown is the rate in effect at period end. |
| ## | All or a portion of this security is segregated for when-issued securities. |
| (l) | The issuer of the security is an affiliated person of the Fund as defined in the Investment Company Act of 1940. |
| (u) | The rate represents the 7-day annualized yield at period end. |
Abbreviations:
| AGC | Assured Guaranty Corporation |
| AGM | Assured Guaranty Municipal |
| Ambac | Ambac Financial Group Incorporated |
| AMT | Alternative minimum tax |
| BAM | Build America Mutual Assurance Company |
| BAN | Bond anticipation notes |
| CAB | Capital appreciation bond |
| CDA | Community Development Authority |
| ECFA | Educational & Cultural Facilities Authority |
| EDA | Economic Development Authority |
| EDFA | Economic Development Finance Authority |
| FHA | Federal Housing Administration |
| FHLMC | Federal Home Loan Mortgage Corporation |
| FNMA | Federal National Mortgage Association |
| GNMA | Government National Mortgage Association |
| GO | General obligation |
| HCFR | Healthcare facilities revenue |
| HEFA | Health & Educational Facilities Authority |
| HEFAR | Higher Education Facilities Authority Revenue |
| HFA | Housing Finance Authority |
| HFFA | Health Facilities Financing Authority |
| IDA | Industrial Development Authority |
| LIBOR | London Interbank Offered Rate |
| LIQ | Liquidity agreement |
| LOC | Letter of credit |
| MFHR | Multifamily housing revenue |
| National | National Public Finance Guarantee Corporation |
| PCFA | Pollution Control Financing Authority |
| PCR | Pollution control revenue |
| PFA | Public Finance Authority |
| RDA | Redevelopment Authority |
| SIFMA | Securities Industry and Financial Markets Association |
| SOFR | Secured Overnight Financing Rate |
| SPA | Standby purchase agreement |
| TTFA | Transportation Trust Fund Authority |
The accompanying notes are an integral part of these financial statements.
Wells Fargo Strategic Municipal Bond Fund | 41
Portfolio of investments—June 30, 2020
Futures Contracts
| Description | Number of contracts | Expiration date | Notional cost | Notional value | Unrealized gains | Unrealized losses | ||||||||||||||||||
Short | ||||||||||||||||||||||||
10-Year U.S. Treasury Notes | (30) | 9-21-2020 | $ | (4,159,417 | ) | $ | (4,175,157 | ) | $ | 0 | $ | (15,740 | ) | |||||||||||
Investments in Affiliates
An affiliated investment is an investment in which the Fund owns at least 5% of the outstanding voting shares of the issuer or as a result of other relationships, such as the Fund and the issuer having the same investment manager. Transactions with issuers that were either affiliated persons of the Fund at the beginning of the period or the end of the period were as follows:
| Value, beginning of period | Purchases | Sales proceeds | Net realized gains (losses) | Net change in unrealized gains (losses) | Income from affiliated securities | Value, end of period | % of net assets | |||||||||||||||||||||||||
| Short-Term Investments | ||||||||||||||||||||||||||||||||
Investment Companies | ||||||||||||||||||||||||||||||||
Wells Fargo Municipal Cash Management Money Market Fund Institutional Class | $ | 837,029 | $ | 851,495,678 | $ | (829,620,414 | ) | $ | 12,431 | $ | 2,503 | $ | 186,833 | $ | 22,727,227 | 0.88 | % | |||||||||||||||
The accompanying notes are an integral part of these financial statements.
42 | Wells Fargo Strategic Municipal Bond Fund
Statement of assets and liabilities—June 30, 2020
Assets | ||||
Investments in unaffiliated securities, at value (cost $2,474,995,862) | $ | 2,543,275,908 | ||
Investment in affiliated securities, at value (cost $22,724,557) | 22,727,227 | |||
Segregated cash for futures contracts | 60,008 | |||
Receivable for investments sold | 5,845,600 | |||
Receivable for Fund shares sold | 4,562,324 | |||
Receivable for interest | 24,567,447 | |||
Receivable for daily variation margin on open futures contracts | 4,688 | |||
Prepaid expenses and other assets | 33,857 | |||
|
| |||
Total assets | 2,601,077,059 | |||
|
| |||
Liabilities | ||||
Payable for investments purchased | 13,589,809 | |||
Payable for Fund shares redeemed | 4,857,556 | |||
Management fee payable | 760,433 | |||
Dividends payable | 562,799 | |||
Administration fees payable | 209,192 | |||
Distribution fee payable | 42,953 | |||
Trustees’ fees and expenses payable | 3,492 | |||
Accrued expenses and other liabilities | 193,724 | |||
|
| |||
Total liabilities | 20,219,958 | |||
|
| |||
Total net assets | $ | 2,580,857,101 | ||
|
| |||
Net assets consist of | ||||
Paid-in capital | $ | 2,523,232,408 | ||
Total distributable earnings | 57,624,693 | |||
|
| |||
Total net assets | $ | 2,580,857,101 | ||
|
| |||
Computation of net asset value and offering price per share | ||||
Net assets – Class A | $ | 545,669,788 | ||
Shares outstanding – Class A1 | 59,502,580 | |||
Net asset value per share – Class A | $9.17 | |||
Maximum offering price per share – Class A2 | $9.55 | |||
Net assets – Class C | $ | 69,472,125 | ||
Shares outstanding – Class C1 | 7,549,513 | |||
Net asset value per share – Class C | $9.20 | |||
Net assets – Class R6 | $ | 20,458,611 | ||
Shares outstanding – Class R61 | 2,230,682 | |||
Net asset value per share – Class R6 | $9.17 | |||
Net assets – Administrator Class | $ | 115,888,565 | ||
Shares outstanding – Administrator Class1 | 12,644,177 | |||
Net asset value per share – Administrator Class | $9.17 | |||
Net assets – Institutional Class | $ | 1,829,368,012 | ||
Shares outstanding – Institutional Class1 | 199,532,877 | |||
Net asset value per share – Institutional Class | $9.17 | |||
| 1 | The Fund has an unlimited number of authorized shares. |
| 2 | Maximum offering price is computed as 100/96 of net asset value. On investments of $50,000 or more, the offering price is reduced. |
The accompanying notes are an integral part of these financial statements.
Wells Fargo Strategic Municipal Bond Fund | 43
Statement of operations—year ended June 30, 2020
Investment income | ||||
Interest | $ | 66,440,869 | ||
Interest from affiliated securities | 186,833 | |||
|
| |||
Total investment income | 66,627,702 | |||
|
| |||
Expenses | ||||
Management fee | 9,347,989 | |||
Administration fees |
| |||
Class A | 882,722 | |||
Class C | 121,187 | |||
Class R6 | 4,870 | |||
Administrator Class | 137,871 | |||
Institutional Class | 1,425,731 | |||
Shareholder servicing fees |
| |||
Class A | 1,379,254 | |||
Class C | 189,341 | |||
Administrator Class | 344,529 | |||
Distribution fee |
| |||
Class C | 568,022 | |||
Custody and accounting fees | 83,722 | |||
Professional fees | 52,986 | |||
Registration fees | 133,772 | |||
Shareholder report expenses | 28,262 | |||
Trustees’ fees and expenses | 21,541 | |||
Interest expense | 2,803 | |||
Other fees and expenses | 30,504 | |||
|
| |||
Total expenses | 14,755,106 | |||
Less: Fee waivers and/or expense reimbursements |
| |||
Class A | (1,687 | ) | ||
Class C | (10 | ) | ||
Administrator Class | (66,594 | ) | ||
|
| |||
Net expenses | 14,686,815 | |||
|
| |||
Net investment income | 51,940,887 | |||
|
| |||
Realized and unrealized gains (losses) on investments | ||||
Net realized gains (losses) on |
| |||
Unaffiliated securities | (10,428,039 | ) | ||
Affiliated securities | 12,431 | |||
Futures contracts | (160,630 | ) | ||
|
| |||
Net realized losses on investments | (10,576,238 | ) | ||
|
| |||
Net change in unrealized gains (losses) on |
| |||
Unaffiliated securities | 12,258,036 | |||
Affiliated securities | 2,503 | |||
Futures contracts | (15,740 | ) | ||
|
| |||
Net change in unrealized gains (losses) on investments | 12,244,799 | |||
|
| |||
Net realized and unrealized gains (losses) on investments | 1,668,561 | |||
|
| |||
Net increase in net assets resulting from operations | $ | 53,609,448 | ||
|
| |||
The accompanying notes are an integral part of these financial statements.
44 | Wells Fargo Strategic Municipal Bond Fund
Statement of changes in net assets
| Year ended June 30, 2020 | Year ended June 30, 2019 | |||||||||||||||
Operations | ||||||||||||||||
Net investment income | $ | 51,940,887 | $ | 46,487,672 | ||||||||||||
Net realized gains (losses) on investments | (10,576,238 | ) | 5,975,953 | |||||||||||||
Net change in unrealized gains (losses) on investments | 12,244,799 | 45,705,609 | ||||||||||||||
|
| |||||||||||||||
Net increase in net assets resulting from operations | 53,609,448 | 98,169,234 | ||||||||||||||
|
| |||||||||||||||
Distributions to shareholders from net investment income and net realized gains | ||||||||||||||||
Class A | (10,397,610 | ) | (9,763,010 | ) | ||||||||||||
Class C | (857,859 | ) | (1,245,785 | ) | ||||||||||||
Class R6 | (365,000 | ) | (193,619 | )1 | ||||||||||||
Administrator Class | (2,747,561 | ) | (3,446,885 | ) | ||||||||||||
Institutional Class | (39,466,814 | ) | (31,841,170 | ) | ||||||||||||
|
| |||||||||||||||
Total distributions to shareholders | (53,834,844 | ) | (46,490,469 | ) | ||||||||||||
|
| |||||||||||||||
Capital share transactions | Shares | Shares | ||||||||||||||
Proceeds from shares sold |
| |||||||||||||||
Class A | 18,849,916 | 172,905,977 | 19,706,942 | 177,435,241 | ||||||||||||
Class C | 1,396,675 | 12,877,889 | 1,344,541 | 12,107,980 | ||||||||||||
Class R6 | 2,389,745 | 21,930,358 | 2,320,780 | 1 | 20,830,779 | 1 | ||||||||||
Administrator Class | 2,699,164 | 24,742,963 | 5,609,233 | 50,252,974 | ||||||||||||
Institutional Class | 93,352,999 | 853,335,830 | 100,346,510 | 902,217,837 | ||||||||||||
|
| |||||||||||||||
| 1,085,793,017 | 1,162,844,811 | |||||||||||||||
|
| |||||||||||||||
Reinvestment of distributions |
| |||||||||||||||
Class A | 1,035,246 | 9,479,576 | 995,585 | 8,956,377 | ||||||||||||
Class C | 79,915 | 734,143 | 120,097 | 1,082,404 | ||||||||||||
Class R6 | 11,437 | 104,320 | 0 | 1 | 0 | 1 | ||||||||||
Administrator Class | 292,011 | 2,673,202 | 373,089 | 3,350,926 | ||||||||||||
Institutional Class | 3,591,282 | 32,877,993 | 2,885,056 | 25,969,024 | ||||||||||||
|
| |||||||||||||||
| 45,869,234 | 39,358,731 | |||||||||||||||
|
| |||||||||||||||
Payment for shares redeemed |
| |||||||||||||||
Class A | (18,134,239 | ) | (164,712,253 | ) | (17,937,947 | ) | (161,039,725 | ) | ||||||||
Class C | (2,900,830 | ) | (26,634,023 | ) | (5,379,557 | ) | (48,528,767 | ) | ||||||||
Class R6 | (1,623,820 | ) | (14,770,396 | ) | (867,460 | )1 | (7,804,378 | )1 | ||||||||
Administrator Class | (6,663,826 | ) | (60,284,872 | ) | (11,142,539 | ) | (99,719,756 | ) | ||||||||
Institutional Class | (77,609,421 | ) | (703,994,181 | ) | (60,128,198 | ) | (539,512,255 | ) | ||||||||
|
| |||||||||||||||
| (970,395,725 | ) | (856,604,881 | ) | |||||||||||||
|
| |||||||||||||||
Net increase in net assets resulting from capital share transactions | 161,266,526 | 345,598,661 | ||||||||||||||
|
| |||||||||||||||
Total increase in net assets | 161,041,130 | 397,277,426 | ||||||||||||||
|
| |||||||||||||||
Net assets | ||||||||||||||||
Beginning of period | 2,419,815,971 | 2,022,538,545 | ||||||||||||||
|
| |||||||||||||||
End of period | $ | 2,580,857,101 | $ | 2,419,815,971 | ||||||||||||
|
| |||||||||||||||
| 1 | For the period from July 31, 2018 (commencement of class operations) to June 30, 2019 |
The accompanying notes are an integral part of these financial statements.
Wells Fargo Strategic Municipal Bond Fund | 45
(For a share outstanding throughout each period)
| Year ended June 30 | ||||||||||||||||||||
| CLASS A | 2020 | 2019 | 2018 | 2017 | 2016 | |||||||||||||||
Net asset value, beginning of period | $9.14 | $8.93 | $8.94 | $9.06 | $8.90 | |||||||||||||||
Net investment income | 0.17 | 0.18 | 0.15 | 0.13 | 0.14 | |||||||||||||||
Net realized and unrealized gains (losses) on investments | 0.03 | 0.21 | 0.01 | (0.07 | ) | 0.18 | ||||||||||||||
|
|
|
|
|
|
|
|
|
| |||||||||||
Total from investment operations | 0.20 | 0.39 | 0.16 | 0.06 | 0.32 | |||||||||||||||
Distributions to shareholders from | ||||||||||||||||||||
Net investment income | (0.16 | ) | (0.18 | ) | (0.15 | ) | (0.13 | ) | (0.14 | ) | ||||||||||
Net realized gains | (0.01 | ) | 0.00 | (0.02 | ) | (0.05 | ) | (0.02 | ) | |||||||||||
|
|
|
|
|
|
|
|
|
| |||||||||||
Total distributions to shareholders | (0.17 | ) | (0.18 | ) | (0.17 | ) | (0.18 | ) | (0.16 | ) | ||||||||||
Net asset value, end of period | $9.17 | $9.14 | $8.93 | $8.94 | $9.06 | |||||||||||||||
Total return1 | 2.23 | % | 4.41 | % | 1.82 | % | 0.65 | % | 3.67 | % | ||||||||||
Ratios to average net assets (annualized) | ||||||||||||||||||||
Gross expenses | 0.79 | % | 0.80 | % | 0.82 | % | 0.81 | % | 0.81 | % | ||||||||||
Net expenses | 0.79 | % | 0.80 | % | 0.82 | % | 0.81 | % | 0.81 | % | ||||||||||
Net investment income | 1.81 | % | 1.99 | % | 1.69 | % | 1.45 | % | 1.53 | % | ||||||||||
Supplemental data | ||||||||||||||||||||
Portfolio turnover rate | 26 | % | 29 | % | 33 | % | 31 | % | 53 | % | ||||||||||
Net assets, end of period (000s omitted) | $545,670 | $528,004 | $491,128 | $550,965 | $726,135 | |||||||||||||||
| 1 | Total return calculations do not include any sales charges. |
The accompanying notes are an integral part of these financial statements.
46 | Wells Fargo Strategic Municipal Bond Fund
Financial highlights
(For a share outstanding throughout each period)
| Year ended June 30 | ||||||||||||||||||||
| CLASS C | 2020 | 2019 | 2018 | 2017 | 2016 | |||||||||||||||
Net asset value, beginning of period | $9.17 | $8.96 | $8.97 | $9.09 | $8.94 | |||||||||||||||
Net investment income | 0.10 | 0.11 | 1 | 0.08 | 1 | 0.07 | 0.07 | |||||||||||||
Net realized and unrealized gains (losses) on investments | 0.04 | 0.21 | 0.01 | (0.07 | ) | 0.17 | ||||||||||||||
|
|
|
|
|
|
|
|
|
| |||||||||||
Total from investment operations | 0.14 | 0.32 | 0.09 | (0.00 | ) | 0.24 | ||||||||||||||
Distributions to shareholders from | ||||||||||||||||||||
Net investment income | (0.10 | ) | (0.11 | ) | (0.08 | ) | (0.07 | ) | (0.07 | ) | ||||||||||
Net realized gains | (0.01 | ) | 0.00 | (0.02 | ) | (0.05 | ) | (0.02 | ) | |||||||||||
|
|
|
|
|
|
|
|
|
| |||||||||||
Total distributions to shareholders | (0.11 | ) | (0.11 | ) | (0.10 | ) | (0.12 | ) | (0.09 | ) | ||||||||||
Net asset value, end of period | $9.20 | $9.17 | $8.96 | $8.97 | $9.09 | |||||||||||||||
Total return2 | 1.47 | % | 3.62 | % | 1.06 | % | (0.10 | )% | 2.78 | % | ||||||||||
Ratios to average net assets (annualized) | ||||||||||||||||||||
Gross expenses | 1.54 | % | 1.55 | % | 1.57 | % | 1.56 | % | 1.56 | % | ||||||||||
Net expenses | 1.54 | % | 1.55 | % | 1.57 | % | 1.56 | % | 1.56 | % | ||||||||||
Net investment income | 1.06 | % | 1.24 | % | 0.94 | % | 0.72 | % | 0.78 | % | ||||||||||
Supplemental data | ||||||||||||||||||||
Portfolio turnover rate | 26 | % | 29 | % | 33 | % | 31 | % | 53 | % | ||||||||||
Net assets, end of period (000s omitted) | $69,472 | $82,331 | $115,518 | $137,955 | $156,560 | |||||||||||||||
| 1 | Calculated based upon average shares outstanding |
| 2 | Total return calculations do not include any sales charges. |
The accompanying notes are an integral part of these financial statements.
Wells Fargo Strategic Municipal Bond Fund | 47
Financial highlights
(For a share outstanding throughout each period)
| Year ended June 30 | ||||||||
| CLASS R6 | 2020 | 20191 | ||||||
Net asset value, beginning of period | $9.15 | $8.94 | ||||||
Net investment income | 0.20 | 0.20 | ||||||
Net realized and unrealized gains (losses) on investments | 0.03 | 0.21 | ||||||
|
|
|
| |||||
Total from investment operations | 0.23 | 0.41 | ||||||
Distributions to shareholders from | ||||||||
Net investment income | (0.20 | ) | (0.20 | ) | ||||
Net realized gains | (0.01 | ) | 0.00 | |||||
|
|
|
| |||||
Total distributions to shareholders | (0.21 | ) | (0.20 | ) | ||||
Net asset value, end of period | $9.17 | $9.15 | ||||||
Total return2 | 2.51 | % | 4.61 | % | ||||
Ratios to average net assets (annualized) | ||||||||
Gross expenses | 0.41 | % | 0.41 | % | ||||
Net expenses | 0.41 | % | 0.41 | % | ||||
Net investment income | 2.19 | % | 2.39 | % | ||||
Supplemental data | ||||||||
Portfolio turnover rate | 26 | % | 29 | % | ||||
Net assets, end of period (000s omitted) | $20,459 | $13,291 | ||||||
| 1 | For the period from July 31, 2018 (commencement of class operations) to June 30, 2019 |
| 2 | Returns for periods of less than one year are not annualized. |
The accompanying notes are an integral part of these financial statements.
48 | Wells Fargo Strategic Municipal Bond Fund
Financial highlights
(For a share outstanding throughout each period)
| Year ended June 30 | ||||||||||||||||||||
| ADMINISTRATOR CLASS | 2020 | 2019 | 2018 | 2017 | 2016 | |||||||||||||||
Net asset value, beginning of period | $9.14 | $8.93 | $8.93 | $9.06 | $8.90 | |||||||||||||||
Net investment income | 0.17 | 0.19 | 0.16 | 0.14 | 0.15 | |||||||||||||||
Net realized and unrealized gains (losses) on investments | 0.04 | 0.21 | 0.02 | (0.08 | ) | 0.18 | ||||||||||||||
|
|
|
|
|
|
|
|
|
| |||||||||||
Total from investment operations | 0.21 | 0.40 | 0.18 | 0.06 | 0.33 | |||||||||||||||
Distributions to shareholders from | ||||||||||||||||||||
Net investment income | (0.17 | ) | (0.19 | ) | (0.16 | ) | (0.14 | ) | (0.15 | ) | ||||||||||
Net realized gains | (0.01 | ) | 0.00 | (0.02 | ) | (0.05 | ) | (0.02 | ) | |||||||||||
|
|
|
|
|
|
|
|
|
| |||||||||||
Total distributions to shareholders | (0.18 | ) | (0.19 | ) | (0.18 | ) | (0.19 | ) | (0.17 | ) | ||||||||||
Net asset value, end of period | $9.17 | $9.14 | $8.93 | $8.93 | $9.06 | |||||||||||||||
Total return | 2.34 | % | 4.53 | % | 2.07 | % | 0.67 | % | 3.80 | % | ||||||||||
Ratios to average net assets (annualized) | ||||||||||||||||||||
Gross expenses | 0.73 | % | 0.73 | % | 0.76 | % | 0.75 | % | 0.74 | % | ||||||||||
Net expenses | 0.68 | % | 0.68 | % | 0.68 | % | 0.68 | % | 0.68 | % | ||||||||||
Net investment income | 1.92 | % | 2.10 | % | 1.80 | % | 1.51 | % | 1.66 | % | ||||||||||
Supplemental data | ||||||||||||||||||||
Portfolio turnover rate | 26 | % | 29 | % | 33 | % | 31 | % | 53 | % | ||||||||||
Net assets, end of period (000s omitted) | $115,889 | $149,097 | $191,723 | $195,138 | $408,846 | |||||||||||||||
The accompanying notes are an integral part of these financial statements.
Wells Fargo Strategic Municipal Bond Fund | 49
Financial highlights
(For a share outstanding throughout each period)
| Year ended June 30 | ||||||||||||||||||||
| INSTITUTIONAL CLASS | 2020 | 2019 | 2018 | 2017 | 2016 | |||||||||||||||
Net asset value, beginning of period | $9.14 | $8.93 | $8.94 | $9.06 | $8.90 | |||||||||||||||
Net investment income | 0.20 | 0.21 | 0.18 | 0.16 | 0.17 | |||||||||||||||
Net realized and unrealized gains (losses) on investments | 0.04 | 0.21 | 0.01 | (0.07 | ) | 0.18 | ||||||||||||||
|
|
|
|
|
|
|
|
|
| |||||||||||
Total from investment operations | 0.24 | 0.42 | 0.19 | 0.09 | 0.35 | |||||||||||||||
Distributions to shareholders from | ||||||||||||||||||||
Net investment income | (0.20 | ) | (0.21 | ) | (0.18 | ) | (0.16 | ) | (0.17 | ) | ||||||||||
Net realized gains | (0.01 | ) | 0.00 | (0.02 | ) | (0.05 | ) | (0.02 | ) | |||||||||||
|
|
|
|
|
|
|
|
|
| |||||||||||
Total distributions to shareholders | (0.21 | ) | (0.21 | ) | (0.20 | ) | (0.21 | ) | (0.19 | ) | ||||||||||
Net asset value, end of period | $9.17 | $9.14 | $8.93 | $8.94 | $9.06 | |||||||||||||||
Total return | 2.57 | % | 4.75 | % | 2.16 | % | 0.99 | % | 4.02 | % | ||||||||||
Ratios to average net assets (annualized) | ||||||||||||||||||||
Gross expenses | 0.46 | % | 0.47 | % | 0.49 | % | 0.48 | % | 0.48 | % | ||||||||||
Net expenses | 0.46 | % | 0.47 | % | 0.48 | % | 0.48 | % | 0.48 | % | ||||||||||
Net investment income | 2.14 | % | 2.32 | % | 2.05 | % | 1.85 | % | 1.85 | % | ||||||||||
Supplemental data | ||||||||||||||||||||
Portfolio turnover rate | 26 | % | 29 | % | 33 | % | 31 | % | 53 | % | ||||||||||
Net assets, end of period (000s omitted) | $1,829,368 | $1,647,093 | $1,224,170 | $1,033,007 | $608,995 | |||||||||||||||
The accompanying notes are an integral part of these financial statements.
50 | Wells Fargo Strategic Municipal Bond Fund
1. ORGANIZATION
Wells Fargo Funds Trust (the “Trust”), a Delaware statutory trust organized on March 10, 1999, is an open-end management investment company registered under the Investment Company Act of 1940, as amended (the “1940 Act”). As an investment company, the Trust follows the accounting and reporting guidance in Financial Accounting Standards Board (“FASB”) Accounting Standards Codification Topic 946, Financial Services – Investment Companies. These financial statements report on the Wells Fargo Strategic Municipal Bond Fund (the “Fund”) which is a diversified series of the Trust.
2. SIGNIFICANT ACCOUNTING POLICIES
The following significant accounting policies, which are consistently followed in the preparation of the financial statements of the Fund, are in conformity with U.S. generally accepted accounting principles which require management to make estimates and assumptions that affect the reported amounts of assets and liabilities, disclosure of contingent assets and liabilities at the date of the financial statements, and the reported amounts of revenues and expenses during the reporting period. Actual results could differ from those estimates.
Securities valuation
All investments are valued each business day as of the close of regular trading on the New York Stock Exchange (generally 4 p.m. Eastern Time), although the Fund may deviate from this calculation time under unusual or unexpected circumstances.
Debt securities are valued at the evaluated bid price provided by an independent pricing service (e.g. taking into account various factors, including yields, maturities, or credit ratings) or, if a reliable price is not available, the quoted bid price from an independent broker-dealer.
Futures contracts that are listed on a foreign or domestic exchange or market are valued at the official closing price or, if none, the last sales price.
Investments in registered open-end investment companies are valued at net asset value.
Investments which are not valued using any of the methods discussed above are valued at their fair value, as determined in good faith by the Board of Trustees of the Fund. The Board of Trustees has established a Valuation Committee comprised of the Trustees and has delegated to it the authority to take any actions regarding the valuation of portfolio securities that the Valuation Committee deems necessary or appropriate, including determining the fair value of portfolio securities, unless the determination has been delegated to the Wells Fargo Asset Management Pricing Committee at Wells Fargo Funds Management, LLC (“Funds Management”). The Board of Trustees retains the authority to make or ratify any valuation decisions or approve any changes to the Valuation Procedures as it deems appropriate. On a quarterly basis, the Board of Trustees receives reports on any valuation actions taken by the Valuation Committee or the Wells Fargo Asset Management Pricing Committee which may include items for ratification.
When-issued transactions
The Fund may purchase securities on a forward commitment or when-issued basis. The Fund records a when-issued transaction on the trade date and will segregate assets in an amount at least equal in value to the Fund’s commitment to purchase when-issued securities. Securities purchased on a when-issued basis are marked-to-market daily and the Fund begins earning interest on the settlement date. Losses may arise due to changes in the market value of the underlying securities or if the counterparty does not perform under the contract.
Futures contracts
Futures contracts are agreements between the Fund and a counterparty to buy or sell a specific amount of a commodity, financial instrument or currency at a specified price and on a specified date. The Fund may buy and sell futures contracts in order to gain exposure to, or protect against, changes in interest rates and is subject to interest rate risk. The primary risks associated with the use of futures contracts are the imperfect correlation between changes in market values of securities held by the Fund and the prices of futures contracts, and the possibility of an illiquid market. Futures contracts are generally entered into on a regulated futures exchange and cleared through a clearinghouse associated with the exchange. With futures contracts, there is minimal counterparty risk to the Fund since futures contracts are exchange traded and the exchange’s clearinghouse, as the counterparty to all exchange traded futures, guarantees the futures contracts against default.
Upon entering into a futures contracts, the Fund is required to deposit either cash or securities (initial margin) with the broker in an amount equal to a certain percentage of the contract value. Subsequent payments (variation margin) are paid to or from the broker each day equal to the daily changes in the contract value. Such payments are recorded as unrealized gains or losses and, if any, shown as variation margin receivable (payable) in the Statement of Assets and Liabilities. Should the Fund fail to make requested variation margin payments, the broker can gain access to the initial margin to satisfy the Fund’s payment obligations. When the contracts are closed, a realized gain or loss is recorded in the Statement of Operations.
Wells Fargo Strategic Municipal Bond Fund | 51
Notes to financial statements
Security transactions and income recognition
Securities transactions are recorded on a trade date basis. Realized gains or losses are recorded on the basis of identified cost.
Interest income is accrued daily and bond discounts are accreted and premiums are amortized daily. To the extent debt obligations are placed on non-accrual status, any related interest income may be reduced by writing off interest receivables when the collection of all or a portion of interest has been determined to be doubtful based on consistently applied procedures and the fair value has decreased. If the issuer subsequently resumes interest payments or when the collectability of interest is reasonably assured, the debt obligation is removed from non-accrual status.
Distributions to shareholders
Distributions to shareholders from net investment income are declared daily and paid monthly. Distributions from net realized gains, if any, are recorded on the ex-dividend date and paid at least annually. Such distributions are determined in accordance with income tax regulations and may differ from U.S. generally accepted accounting principles. Dividend sources are estimated at the time of declaration. The tax character of distributions is determined as of the Fund’s fiscal year end. Therefore, a portion of the Fund’s distributions made prior to the Fund’s fiscal year end may be categorized as a tax return of capital at year end.
Federal and other taxes
The Fund intends to continue to qualify as a regulated investment company by distributing substantially all of its investment company taxable and tax-exempt income and any net realized capital gains (after reduction for capital loss carryforwards) sufficient to relieve it from all, or substantially all, federal income taxes. Accordingly, no provision for federal income taxes was required.
The Fund’s income and federal excise tax returns and all financial records supporting those returns for the prior three fiscal years are subject to examination by the federal and Delaware revenue authorities. Management has analyzed the Fund’s tax positions taken on federal, state, and foreign tax returns for all open tax years and does not believe that there are any uncertain tax positions that require recognition of a tax liability.
As of June 30, 2020, the aggregate cost of all investments for federal income tax purposes was $2,497,704,676 and the unrealized gains (losses) consisted of:
Gross unrealized gains | $ | 78,615,197 | ||
Gross unrealized losses | (10,332,478 | ) | ||
Net unrealized gains | $ | 68,282,719 | ||
As of June 30, 2020, the Fund had capital loss carryforwards which consist of $8,424,845 in short-term capital losses and $2,167,133 in long-term capital losses.
Class allocations
The separate classes of shares offered by the Fund differ principally in applicable sales charges, distribution, shareholder servicing, and administration fees. Class specific expenses are charged directly to that share class. Investment income, common fund-level expenses, and realized and unrealized gains (losses) on investments are allocated daily to each class of shares based on the relative proportion of net assets of each class.
3. FAIR VALUATION MEASUREMENTS
Fair value measurements of investments are determined within a framework that has established a fair value hierarchy based upon the various data inputs utilized in determining the value of the Fund’s investments. The three-level hierarchy gives the highest priority to unadjusted quoted prices in active markets for identical assets or liabilities (Level 1) and the lowest priority to unobservable inputs (Level 3). The Fund’s investments are classified within the fair value hierarchy based on the lowest level of input that is significant to the fair value measurement. The inputs are summarized into three broad levels as follows:
| ∎ | Level 1 – quoted prices in active markets for identical securities |
| ∎ | Level 2 – other significant observable inputs (including quoted prices for similar securities, interest rates, prepayment speeds, credit risk, etc.) |
| ∎ | Level 3 – significant unobservable inputs (including the Fund’s own assumptions in determining the fair value of investments) |
The inputs or methodologies used for valuing investments in securities are not necessarily an indication of the risk associated with investing in those securities.
52 | Wells Fargo Strategic Municipal Bond Fund
Notes to financial statements
The following is a summary of the inputs used in valuing the Fund’s assets and liabilities as of June 30, 2020:
| Quoted prices (Level 1) | Other significant observable inputs (Level 2) | Significant (Level 3) | Total | |||||||||||||
Assets | ||||||||||||||||
Investments in: | ||||||||||||||||
Municipal obligations | $ | 0 | $ | 2,533,275,908 | $ | 0 | $ | 2,533,275,908 | ||||||||
Closed end municipal bond fund obligations | 0 | 10,000,000 | 0 | 10,000,000 | ||||||||||||
Short-term investments | ||||||||||||||||
Investment companies | 22,727,227 | 0 | 0 | 22,727,227 | ||||||||||||
Total assets | $ | 22,727,227 | $ | 2,543,275,908 | $ | 0 | $ | 2,566,003,135 | ||||||||
Liabilities | ||||||||||||||||
Futures contracts | $ | 15,740 | $ | 0 | $ | 0 | $ | 15,740 | ||||||||
Total liabilities | $ | 15,740 | $ | 0 | $ | 0 | $ | 15,740 | ||||||||
Futures contracts are reported at their cumulative unrealized gains (losses) at measurement date as reported in the table following the Portfolio of investments. For futures contracts , the current day’s variation margin is reported on the Statement of Assets and Liabilities. All other assets and liabilities are reported at their market value at measurement date.
Additional sector, industry or geographic detail is included in the Portfolio of Investments.
For the year ended June 30, 2020, the Fund did not have any transfers into/out of Level 3.
4. TRANSACTIONS WITH AFFILIATES
Management fee
Funds Management, an indirect wholly owned subsidiary of Wells Fargo & Company (“Wells Fargo”), is the manager of the Fund and provides advisory and fund-level administrative services under an investment management agreement. Under the investment management agreement, Funds Management is responsible for, among other services, implementing the investment objectives and strategies of the Fund, supervising the subadviser and providing fund-level administrative services in connection with the Fund’s operations. As compensation for its services under the investment management agreement, Funds Management is entitled to receive a management fee at the following annual rate based on the Fund’s average daily net assets:
| Average daily net assets | Management fee | |||
First $500 million | 0.400 | % | ||
Next $500 million | 0.375 | |||
Next $2 billion | 0.350 | |||
Next $2 billion | 0.325 | |||
Next $5 billion | 0.290 | |||
Over $10 billion | 0.280 | |||
For the year ended June 30, 2020, the management fee was equivalent to an annual rate of 0.36% of the Fund’s average daily net assets.
Funds Management has retained the services of a subadviser to provide daily portfolio management to the Fund. The fee for subadvisory services is borne by Funds Management. Wells Capital Management Incorporated, an affiliate of Funds Management and an indirect wholly owned subsidiary of Wells Fargo, is the subadviser to the Fund and is entitled to receive a fee from Funds Management at an annual rate starting at 0.20% and declining to 0.10% as the average daily net assets of the Fund increase.
Wells Fargo Strategic Municipal Bond Fund | 53
Notes to financial statements
Administration fees
Under a class-level administration agreement, Funds Management provides class-level administrative services to the Fund, which includes paying fees and expenses for services provided by the transfer agent, sub-transfer agents, omnibus account servicers and record-keepers. As compensation for its services under the class-level administration agreement, Funds Management receives an annual fee which is calculated based on the average daily net assets of each class as follows:
| Class-level administration fee | ||||
Class A, Class C | 0.16 | % | ||
Class R6 | 0.03 | |||
Administrator Class | 0.10 | |||
Institutional Class | 0.08 | |||
Waivers and/or expense reimbursements
Funds Management has contractually waived and/or reimbursed management and administration fees to the extent necessary to maintain certain net operating expense ratios for the Fund. When each class of the Fund has exceeded its expense cap, Funds Management has waived fees and/or reimbursed expenses from fund-level expenses on a proportionate basis and then from class specific expenses. When only certain classes exceed their expense caps, waivers and/or reimbursements are applied against class specific expenses before fund-level expenses. Funds Management has committed through October 31, 2020 to waive fees and/or reimburse expenses to the extent necessary to cap the Fund’s expenses at 0.81% for Class A shares, 1.56% for Class C shares, 0.43% for Class R6 shares, 0.68% for Administrator Class shares and 0.48% for Institutional Class shares. Prior to or after the commitment expiration date, the cap may be increased or the commitment to maintain the cap may be terminated only with the approval of the Board of Trustees. Prior to November 1, 2019, the Fund’s expenses were capped at 0.82% for Class A shares and 1.57% for Class C shares.
Distribution fee
The Trust has adopted a distribution plan for Class C shares of the Fund pursuant to Rule 12b-1 under the 1940 Act. A distribution fee is charged to Class C shares and paid to Wells Fargo Funds Distributor, LLC (“Funds Distributor”), the principal underwriter, at an annual rate of 0.75% of the average daily net assets of Class C shares.
In addition, Funds Distributor is entitled to receive the front-end sales charge from the purchase of Class A shares and a contingent deferred sales charge on the redemption of certain Class A shares. Funds Distributor is also entitled to receive the contingent deferred sales charges from redemptions of Class C shares. For the year ended June 30, 2020, Funds Distributor received $12,709 from the sale of Class A shares and $809 in contingent deferred sales charges from redemptions of Class C shares. No contingent deferred sales charges were incurred by Class A shares for the year ended June 30, 2020.
Shareholder servicing fees
The Trust has entered into contracts with one or more shareholder servicing agents, whereby Class A, Class C, and Administrator Class of the Fund is charged a fee at an annual rate of 0.25% of the average daily net assets of each respective class. A portion of these total shareholder servicing fees were paid to affiliates of Wells Fargo.
Interfund transactions
The Fund may purchase or sell portfolio investment securities to certain other Wells Fargo affiliates pursuant to Rule 17a-7 under the 1940 Act and under procedures adopted by the Board of Trustees. The procedures have been designed to ensure that these interfund transactions, which do not incur broker commissions, are effected at current market prices. Pursuant to these procedures, the Fund had $118,220,000 and $154,420,000 in interfund purchases and sales, respectively, during the year ended June 30, 2020.
5. INVESTMENT PORTFOLIO TRANSACTIONS
Purchases and sales of investments, excluding U.S. government obligations (if any) and short-term securities, for the year ended June 30, 2020 were $1,108,964,421 and $591,182,418, respectively.
6. DERIVATIVE TRANSACTIONS
During the year ended June 30, 2020, the Fund entered into futures contracts to take advantage of the differences between municipal and treasury yields and to help manage the duration of the portfolio. The Fund had an average notional amount of $1,256,151 in long futures contracts and $1,653,800 in short futures contracts during the year ended June 30, 2020.
54 | Wells Fargo Strategic Municipal Bond Fund
Notes to financial statements
The fair value, realized gains or losses and change in unrealized gains or losses, if any, on derivative instruments are reflected in the corresponding financial statement captions.
7. BANK BORROWINGS
The Trust (excluding the money market funds), Wells Fargo Master Trust and Wells Fargo Variable Trust are parties to a $350,000,000 revolving credit agreement whereby the Fund is permitted to use bank borrowings for temporary or emergency purposes, such as to fund shareholder redemption requests. Interest under the credit agreement is charged to the Fund based on a borrowing rate equal to the higher of the Federal Funds rate in effect on that day plus 1.25% or the overnight LIBOR rate in effect on that day plus 1.25%. In addition, an annual commitment fee equal to 0.25% of the unused balance is allocated to each participating fund.
During the year ended June 30, 2020, the Fund had average borrowings outstanding of $158,362 at an average rate of 1.77% and paid interest in the amount of $2,803.
8. DISTRIBUTIONS TO SHAREHOLDERS
The tax character of distributions paid during the years ended June 30, 2020 and June 30, 2019 were as follows:
| Year ended June 30 | ||||||||
| 2020 | 2019 | |||||||
Ordinary income | $ | 2,091,065 | $ | 0 | ||||
Tax-exempt income | 51,743,779 | 46,490,469 | ||||||
As of June 30, 2020, the components of distributable earnings on a tax basis were as follows:
Undistributed tax-exempt income | Unrealized gains | Capital loss carryforward | ||
| $507,063 | $68,282,719 | $(10,591,978) | ||
9. INDEMNIFICATION
Under the Fund’s organizational documents, the officers and Trustees have been granted certain indemnification rights against certain liabilities that may arise out of performance of their duties to the Fund. The Fund has entered into a separate agreement with each Trustee that converts indemnification rights currently existing under the Fund’s organizational documents into contractual rights that cannot be changed in the future without the consent of the Trustee. Additionally, in the normal course of business, the Fund may enter into contracts with service providers that contain a variety of indemnification clauses. The Fund’s maximum exposure under these arrangements is dependent on future claims that may be made against the Fund and, therefore, cannot be estimated.
10. NEW ACCOUNTING PRONOUNCEMENT
In August 2018, FASB issued Accounting Standards Update (“ASU”) No. 2018-13, Fair Value Measurement (Topic 820) Disclosure Framework—Changes to the Disclosure Requirements for Fair Value Measurement. ASU 2018-13 updates the disclosure requirements on fair value measurements in Topic 820, Fair Value Measurements. The amendments are effective for fiscal years, and interim periods within those fiscal years, beginning after December 15, 2019. Management has adopted this guidance which did not have a material impact on the financial statements.
11. CORONAVIRUS (COVID-19) PANDEMIC
On March 11, 2020, the World Health Organization announced that it had made the assessment that coronavirus disease 2019 (“COVID-19”) is a pandemic. The impacts of COVID-19 are adversely affecting the entire global economy, individual companies and investment products, and the market in general. There is significant uncertainty around the extent and duration of business disruptions related to COVID-19 and the impacts may be short term or may last for an extended period of time. The risk of further spreading of COVID-19 has led to significant uncertainty and volatility in the financial markets.
Wells Fargo Strategic Municipal Bond Fund | 55
Report of independent registered public accounting firm
To the Shareholders of the Fund and Board of Trustees
Wells Fargo Funds Trust:
Opinion on the Financial Statements
We have audited the accompanying statement of assets and liabilities of Wells Fargo Strategic Municipal Bond Fund (the Fund), one of the funds constituting Wells Fargo Funds Trust, including the portfolio of investments, as of June 30, 2020, the related statement of operations for the year then ended, the statements of changes in net assets for each of the years in the two-year period then ended, and the related notes (collectively, the financial statements) and the financial highlights for each of the years or periods in the five-year period then ended. In our opinion, the financial statements and financial highlights present fairly, in all material respects, the financial position of the Fund as of June 30, 2020, the results of its operations for the year then ended, the changes in its net assets for each of the years in the two-year period then ended, and the financial highlights for each of the years or periods in the five-year period then ended, in conformity with U.S. generally accepted accounting principles.
Basis for Opinion
These financial statements and financial highlights are the responsibility of the Fund’s management. Our responsibility is to express an opinion on these financial statements and financial highlights based on our audits. We are a public accounting firm registered with the Public Company Accounting Oversight Board (United States) (PCAOB) and are required to be independent with respect to the Fund in accordance with the U.S. federal securities laws and the applicable rules and regulations of the Securities and Exchange Commission and the PCAOB.
We conducted our audits in accordance with the standards of the PCAOB. Those standards require that we plan and perform the audit to obtain reasonable assurance about whether the financial statements and financial highlights are free of material misstatement, whether due to error or fraud. Our audits included performing procedures to assess the risks of material misstatement of the financial statements and financial highlights, whether due to error or fraud, and performing procedures that respond to those risks. Such procedures included examining, on a test basis, evidence regarding the amounts and disclosures in the financial statements and financial highlights. Such procedures also included confirmation of securities owned as of June 30, 2020, by correspondence with the custodian, transfer agent and brokers, or by other appropriate auditing procedures. Our audits also included evaluating the accounting principles used and significant estimates made by management, as well as evaluating the overall presentation of the financial statements and financial highlights. We believe that our audits provide a reasonable basis for our opinion.

We have not been able to determine the specific year that we began serving as the auditor of one or more Wells Fargo Funds investment companies; however we are aware that we have served as the auditor of one or more Wells Fargo Funds investment companies since at least 1955.
Boston, Massachusetts
August 29, 2020
56 | Wells Fargo Strategic Municipal Bond Fund
TAX INFORMATION
Pursuant to Section 852 of the Internal Revenue Code, 100% of distributions paid from net investment income is designated as exempt-interest dividends for the fiscal year ended June 30, 2020.
For the fiscal year ended June 30, 2020, $2,091,065 has been designated as short-term capital gain dividends for nonresident alien shareholders pursuant to Section 871 of the Internal Revenue Code.
PROXY VOTING INFORMATION
A description of the policies and procedures used to determine how to vote proxies relating to portfolio securities is available, upon request, by calling 1-800-222-8222, visiting our website at wfam.com, or visiting the SEC website at sec.gov. Information regarding how the proxies related to portfolio securities were voted during the most recent 12-month period ended June 30 is available on the website at wfam.com or by visiting the SEC website at sec.gov.
QUARTERLY PORTFOLIO HOLDINGS INFORMATION
The Fund files its complete schedule of portfolio holdings with the SEC for the first and third quarters of each fiscal year as an exhibit to its reports on Form N-PORT. Shareholders may view the filed Form N-PORT by visiting the SEC website at sec.gov.
Wells Fargo Strategic Municipal Bond Fund | 57
Other information (unaudited)
BOARD OF TRUSTEES AND OFFICERS
Each of the Trustees and Officers1 listed in the table below acts in identical capacities for each fund in the Wells Fargo family of funds, which consists of 147 mutual funds comprising the Wells Fargo Funds Trust, Wells Fargo Variable Trust, Wells Fargo Master Trust and four closed-end funds (collectively the “Fund Complex”). This table should be read in conjunction with the Prospectus and the Statement of Additional Information2. The mailing address of each Trustee and Officer is 525 Market Street, 12th Floor, San Francisco, CA 94105. Each Trustee and Officer serves an indefinite term, however, each Trustee serves such term until reaching the mandatory retirement age established by the Trustees.
Independent Trustees
Name and year of birth | Position held and length of service* | Principal occupations during past five years or longer | Current other public company or investment company directorships | |||
William R. Ebsworth (Born 1957) | Trustee, since 2015 | Retired. From 1984 to 2013, equities analyst, portfolio manager, research director and chief investment officer at Fidelity Management and Research Company in Boston, Tokyo, and Hong Kong, and retired in 2013 as Chief Investment Officer of Fidelity Strategic Advisers, Inc. where he led a team of investment professionals managing client assets. Prior thereto, Board member of Hong Kong Securities Clearing Co., Hong Kong Options Clearing Corp., the Thailand International Fund, Ltd., Fidelity Investments Life Insurance Company, and Empire Fidelity Investments Life Insurance Company. Audit Committee Chair and Investment Committee Chair of the Vincent Memorial Hospital Endowment (non-profit organization). Mr. Ebsworth is a CFA® charterholder. | N/A | |||
Jane A. Freeman (Born 1953) | Trustee, since 2015; Chair Liaison, since 2018 | Retired. From 2012 to 2014 and 1999 to 2008, Chief Financial Officer of Scientific Learning Corporation. From 2008 to 2012, Ms. Freeman provided consulting services related to strategic business projects. Prior to 1999, Portfolio Manager at Rockefeller & Co. and Scudder, Stevens & Clark. Board member of the Harding Loevner Funds from 1996 to 2014, serving as both Lead Independent Director and chair of the Audit Committee. Board member of the Russell Exchange Traded Funds Trust from 2011 to 2012 and the chair of the Audit Committee. Ms. Freeman is also an inactive Chartered Financial Analyst. | N/A | |||
Isaiah Harris, Jr. (Born 1952) | Trustee, since 2009; Audit Committee Chairman, since 2019 | Retired. Chairman of the Board of CIGNA Corporation since 2009, and Director since 2005. From 2003 to 2011, Director of Deluxe Corporation. Prior thereto, President and CEO of BellSouth Advertising and Publishing Corp. from 2005 to 2007, President and CEO of BellSouth Enterprises from 2004 to 2005 and President of BellSouth Consumer Services from 2000 to 2003. Emeritus member of the Iowa State University Foundation Board of Governors. Emeritus Member of the Advisory Board of Iowa State University School of Business. Advisory Board Member, Palm Harbor Academy (private school). Advisory Board Member, Child Evangelism Fellowship (non-profit). Mr. Harris is a certified public accountant (inactive status). | CIGNA Corporation | |||
Judith M. Johnson (Born 1949) | Trustee, since 2008; Audit Committee Chairman, from 2009 to 2018 | Retired. Prior thereto, Chief Executive Officer and Chief Investment Officer of Minneapolis Employees Retirement Fund from 1996 to 2008. Ms. Johnson is an attorney, certified public accountant and a certified managerial accountant. | N/A | |||
58 | Wells Fargo Strategic Municipal Bond Fund
Other information (unaudited)
Name and year of birth | Position held and length of service* | Principal occupations during past five years or longer | Current other public company or investment company directorships | |||
David F. Larcker (Born 1950) | Trustee, since 2009 | James Irvin Miller Professor of Accounting at the Graduate School of Business, Stanford University, Director of the Corporate Governance Research Initiative and Senior Faculty of The Rock Center for Corporate Governance since 2006. From 2005 to 2008, Professor of Accounting at the Graduate School of Business, Stanford University. Prior thereto, Ernst & Young Professor of Accounting at The Wharton School, University of Pennsylvania from 1985 to 2005. | N/A | |||
Olivia S. Mitchell (Born 1953) | Trustee, since 2006; Nominating and Governance Committee Chair, since 2018 | International Foundation of Employee Benefit Plans Professor, Wharton School of the University of Pennsylvania since 1993. Director of Wharton’s Pension Research Council and Boettner Center on Pensions & Retirement Research, and Research Associate at the National Bureau of Economic Research. Previously, Cornell University Professor from 1978 to 1993. | N/A | |||
Timothy J. Penny (Born 1951) | Trustee, since 1996; Chairman, since 2018 | President and Chief Executive Officer of Southern Minnesota Initiative Foundation, a non-profit organization, since 2007. Member of the Board of Trustees of NorthStar Education Finance, Inc., a non-profit organization, since 2007. | N/A | |||
James G. Polisson (Born 1959) | Trustee, since 2018 | Retired. Chief Marketing Officer, Source (ETF) UK Services, Ltd, from 2015 to 2017. From 2012 to 2015, Principal of The Polisson Group, LLC, a management consulting, corporate advisory and principal investing company. Chief Executive Officer and Managing Director at Russell Investments, Global Exchange Traded Funds from 2010 to 2012. Managing Director of Barclays Global Investors from 1998 to 2010 and Global Chief Marketing Officer for iShares and Barclays Global Investors from 2000 to 2010. Trustee of the San Francisco Mechanics’ Institute, a non-profit organization, from 2013 to 2015. Board member of the Russell Exchange Traded Fund Trust from 2011 to 2012. Director of Barclays Global Investors Holdings Deutschland GmbH from 2006 to 2009. Mr. Polisson is an attorney and has a retired status with the Massachusetts and District of Columbia Bar Associations. | N/A | |||
Pamela Wheelock (Born 1959) | Trustee, since January 2020; previously Trustee from January 2018 to July 2019 | Board member of the Destination Medical Center Economic Development Agency, Rochester, Minnesota since 2019 and Interim President of the McKnight Foundation since 2020. Acting Commissioner, Minnesota Department of Human Services, July 2019 through September 2019. Human Services Manager (part-time), Minnesota Department of Human Services, October 2019 through December 2019. Chief Operating Officer, Twin Cities Habitat for Humanity from 2017 to 2019. Vice President of University Services, University of Minnesota from 2012 to 2016. Prior thereto, on the Board of Directors, Governance Committee and Finance Committee for the Minnesota Philanthropy Partners (Saint Paul Foundation) from 2012 to 2018, Interim Chief Executive Officer of Blue Cross Blue Shield of Minnesota from 2011 to 2012, Chairman of the Board from 2009 to 2012 and Board Director from 2003 to 2015. Vice President, Leadership and Community Engagement, Bush Foundation, Saint Paul, Minnesota (a private foundation) from 2009 to 2011. Executive Vice President and Chief Financial Officer, Minnesota Sports and Entertainment from 2004 to 2009 and Senior Vice President from 2002 to 2004. Executive Vice President of the Minnesota Wild Foundation from 2004 to 2008. Commissioner of Finance, State of Minnesota, from 1999 to 2002. Currently Board Chair of the Minnesota Wild Foundation since 2010. | N/A | |||
| * | Length of service dates reflect the Trustee’s commencement of service with the Trust’s predecessor entities, where applicable. |
Wells Fargo Strategic Municipal Bond Fund | 59
Other information (unaudited)
Officers
Name and year of birth | Position held and length of service | Principal occupations during past five years or longer | ||
Andrew Owen (Born 1960) | President, since 2017 | Executive Vice President of Wells Fargo & Company and Head of Affiliated Managers, Wells Fargo Asset Management, since 2014. In addition, Mr. Owen is currently President, Chief Executive Officer and Director of Wells Fargo Funds Management, LLC since 2017. Prior thereto, Executive Vice President responsible for marketing, investments and product development for Wells Fargo Funds Management, LLC, from 2009 to 2014. | ||
Nancy Wiser1 (Born 1967) | Treasurer, since 2012 | Executive Vice President of Wells Fargo Funds Management, LLC since 2011. Chief Operating Officer and Chief Compliance Officer at LightBox Capital Management LLC, from 2008 to 2011. | ||
Michelle Rhee (Born 1966) | Chief Legal Officer, since 2019 | Secretary of Wells Fargo Funds Management, LLC, Chief Legal Counsel of Wells Fargo Asset Management and Assistant General Counsel of Wells Fargo Bank, N.A. since 2018. Associate General Counsel and Managing Director of Bank of America Corporation from 2004 to 2018. | ||
Catherine Kennedy (Born 1969) | Secretary, since 2019 | Vice President of Wells Fargo Funds Management, LLC and Senior Counsel of the Wells Fargo Legal Department since 2010. Vice President and Senior Counsel of Evergreen Investment Management Company, LLC from 1998 to 2010. | ||
Michael H. Whitaker (Born 1967) | Chief Compliance Officer, since 2016 | Chief Compliance Officer of Wells Fargo Asset Management since 2016. Senior Vice President and Chief Compliance Officer for Fidelity Investments from 2007 to 2016. | ||
David Berardi (Born 1975) | Assistant Treasurer, since 2009 | Vice President of Wells Fargo Funds Management, LLC since 2009. Vice President of Evergreen Investment Management Company, LLC from 2008 to 2010. Manager of Fund Reporting and Control for Evergreen Investment Management Company, LLC from 2004 to 2010. | ||
Jeremy DePalma1 (Born 1974) | Assistant Treasurer, since 2009 | Senior Vice President of Wells Fargo Funds Management, LLC since 2009. Senior Vice President of Evergreen Investment Management Company, LLC from 2008 to 2010 and head of the Fund Reporting and Control Team within Fund Administration from 2005 to 2010. | ||
| 1 | Nancy Wiser acts as Treasurer of 65 funds in the Fund Complex. Jeremy DePalma acts as the Treasurer of 82 funds and Assistant Treasurer of 65 funds in the Fund Complex. |
| 2 | The Statement of Additional Information includes additional information about the Trustees and is available, without charge, upon request, by calling 1-800-222-8222 or by visiting the website at wfam.com. |
60 | Wells Fargo Strategic Municipal Bond Fund
Other information (unaudited)
BOARD CONSIDERATION OF INVESTMENT MANAGEMENT AND SUB-ADVISORY AGREEMENTS:
Wells Fargo Strategic Municipal Bond Fund
Under the Investment Company Act of 1940 (the “1940 Act”), the Board of Trustees (the “Board”) of Wells Fargo Funds Trust (the “Trust”) must determine annually whether to approve the continuation of the Trust’s investment management and sub-advisory agreements. In this regard, at a Board meeting held on May 26, 2020 and May 28, 2020 (together, the “Meeting”), the Board, all the members of which have no direct or indirect interest in the investment management and sub-advisory agreements and are not “interested persons” of the Trust, as defined in the 1940 Act (the “Independent Trustees”), reviewed and approved for Wells Fargo Strategic Municipal Bond Fund (the “Fund”): (i) an investment management agreement (the “Management Agreement”) with Wells Fargo Funds Management, LLC (“Funds Management”); and (ii) an investment sub-advisory agreement (the “Sub-Advisory Agreement”) with Wells Capital Management Incorporated (the “Sub-Adviser”), an affiliate of Funds Management. The Management Agreement and the Sub-Advisory Agreement are collectively referred to as the “Advisory Agreements.”
At the Meeting, the Board considered the factors and reached the conclusions described below relating to the selection of Funds Management and the Sub-Adviser and the approval of the Advisory Agreements. Prior to the Meeting, including at a Board meeting held in April 2020, the Trustees conferred extensively among themselves and with representatives of Funds Management about these matters. Also, the Board has adopted a team-based approach, with each team consisting of a sub-set of Trustees, to assist the full Board in the discharge of its duties in reviewing investment performance and other matters throughout the year. The Independent Trustees were assisted in their evaluation of the Advisory Agreements by independent legal counsel, from whom they received separate legal advice and with whom they met separately.
In providing information to the Board, Funds Management and the Sub-Adviser were guided by a detailed set of requests for information submitted to them by independent legal counsel on behalf of the Independent Trustees at the start of the Board’s annual contract renewal process earlier in 2020. In considering and approving the Advisory Agreements, the Trustees considered the information they believed relevant, including but not limited to the information discussed below. The Board considered not only the specific information presented in connection with the Meeting, but also the knowledge gained over time through interaction with Funds Management and the Sub-Adviser about various topics. In this regard, the Board reviewed reports of Funds Management at each of its quarterly meetings, which included, among other things, portfolio reviews and investment performance reports. In addition, the Board and the teams mentioned above confer with portfolio managers at various times throughout the year. The Board did not identify any particular information or consideration that was all-important or controlling, and each individual Trustee may have attributed different weights to various factors.
After its deliberations, the Board unanimously approved the continuation of the Advisory Agreements for a one-year term and determined that the compensation payable to Funds Management and the Sub-Adviser under each of the Advisory Agreements was reasonable. The Board considered the approval of the Advisory Agreements for the Fund as part of its consideration of agreements for funds across the complex, but its approvals were made on a fund-by-fund basis. The following summarizes a number of important, but not necessarily all, factors considered by the Board in support of its approvals.
Nature, extent and quality of services
The Board received and considered various information regarding the nature, extent and quality of services provided to the Fund by Funds Management and the Sub-Adviser under the Advisory Agreements. This information included a description of the investment advisory services and Fund-level administrative services covered by the Management Agreement, as well as, among other things, a summary of the background and experience of senior management of Wells Fargo Asset Management (“WFAM”), of which Funds Management and the Sub-Adviser are a part, and a summary of investments made in the business of WFAM. The Board also received a description of Funds Management’s and the Sub-Adviser’s business continuity plans and of their approaches to data privacy and cybersecurity, and related testing. The Board also received and reviewed information about Funds Management’s role as administrator of the Fund’s liquidity risk management program, Funds Management’s approach to risk management, and Funds Management’s intermediary and vendor oversight program.
The Board also considered the qualifications, background, tenure and responsibilities of each of the portfolio managers primarily responsible for the day-to-day portfolio management of the Fund. The Board evaluated the ability of Funds Management and the Sub-Adviser to attract and retain qualified investment professionals, including research, advisory and supervisory personnel. The Board further considered the compliance programs and compliance records of Funds Management and the Sub-Adviser. In addition, the Board took into account the full range of services provided to the Fund by Funds Management and its affiliates.
Wells Fargo Strategic Municipal Bond Fund | 61
Other information (unaudited)
Fund investment performance and expenses
The Board considered the investment performance results for the Fund over various time periods ended December 31, 2019. The Board also considered more current results for various time periods ended March 31, 2020. The Board considered these results in comparison to the investment performance of funds in a universe that was determined by Broadridge Inc. (“Broadridge”) to be similar to the Fund (the “Universe”), and in comparison to the Fund’s benchmark index and to other comparative data. Broadridge is an independent provider of investment company data. The Board received a description of the methodology used by Broadridge to select the mutual funds in the performance Universe. The Board noted that the investment performance of the Fund (Administrator Class) was higher than the average investment performance of the Universe for the one-, three-, five- and ten-year periods ended December 31, 2019. The Board also noted that the investment performance of the Fund (Administrator Class) was higher than the average investment performance of the Universe for the three-, five- and ten-year periods ended March 31, 2020, and lower than the average investment performance of the Universe for the one-year period ended March 31, 2020. The Board also noted that the investment performance of the Fund was higher than its benchmark index, the Bloomberg Barclays Short-Intermediate Municipal Bond Index, for the three-, five- and ten-year periods ended December 31, 2019, and lower than its benchmark index for the one-year period ended December 31, 2019. The Board also noted that the investment performance of the Fund was higher than or in range of its benchmark index, the Bloomberg Barclays Short-Intermediate Municipal Bond Index, for the three-, five- and ten-year periods ended March 31, 2020, and lower than its benchmark index for the one-year period ended March 31, 2020.
The Board also received and considered information regarding the Fund’s net operating expense ratios and their various components, including actual management fees, custodian and other non-management fees, and Rule 12b-1 and non-Rule 12b-1 shareholder service fees. The Board considered these ratios in comparison to the median ratios of funds in class-specific expense groups that were determined by Broadridge to be similar to the Fund (the “Groups”). The Board received a description of the methodology used by Broadridge to select the mutual funds in the expense Groups and an explanation of how funds comprising expense groups and their expense ratios may vary from year-to-year. Based on the Broadridge reports, the Board noted that the net operating expense ratios of the Fund were in range of or equal to the median net operating expense ratios of the expense Groups for each share class.
The Board took into account the Fund’s investment performance and expense information provided to it among the factors considered in deciding to re-approve the Advisory Agreements.
Investment management and sub-advisory fee rates
The Board reviewed and considered the contractual fee rates payable by the Fund to Funds Management under the Management Agreement, as well as the contractual fee rates payable by the Fund to Funds Management for class-level administrative services under a Class-Level Administration Agreement, which include, among other things, class-level transfer agency and sub-transfer agency costs (collectively, the “Management Rates”). The Board also reviewed and considered the contractual investment sub-advisory fee rates that are payable by Funds Management to the Sub-Adviser for investment sub-advisory services.
Among other information reviewed by the Board was a comparison of the Fund’s Management Rates with the average contractual investment management fee rates of funds in the expense Groups at a common asset level as well as transfer agency costs of the funds in the expense Groups. The Board noted that the Management Rates of the Fund were lower than, in range of or equal to the sum of these average rates for the Fund’s expense Groups for all share classes.
The Board also received and considered information about the portion of the total management fee that was retained by Funds Management after payment of the fee to the Sub-Adviser for sub-advisory services. In assessing the reasonableness of this amount, the Board received and evaluated information about the nature and extent of responsibilities retained and risks assumed by Funds Management and not delegated to or assumed by the Sub-Adviser, and about Funds Management’s on-going oversight services. Given the affiliation between Funds Management and the Sub-Adviser, the Board ascribed limited relevance to the allocation of fees between them.
The Board also received and considered information about the nature and extent of services offered and fee rates charged by Funds Management and the Sub-Adviser to other types of clients with investment strategies similar to those of the Fund. In this regard, the Board received information about the significantly greater scope of services, and compliance, reporting and other legal burdens and risks of managing proprietary mutual funds compared with those associated with managing assets of other types of clients, including third-party sub-advised fund clients and non-mutual fund clients such as institutional separate accounts.
62 | Wells Fargo Strategic Municipal Bond Fund
Other information (unaudited)
Based on its consideration of the factors and information it deemed relevant, including those described here, the Board determined that the compensation payable to Funds Management under the Management Agreement and to the Sub-Adviser under the Sub-Advisory Agreement was reasonable.
Profitability
The Board received and considered information concerning the profitability of Funds Management, as well as the profitability of both WFAM and Wells Fargo & Co. (“Wells Fargo”) from providing services to the fund family as a whole. The Board noted that the Sub-Adviser’s profitability information with respect to providing services to the Fund and other funds in the family was subsumed in the WFAM and Wells Fargo profitability analysis.
Funds Management reported on the methodologies and estimates used in calculating profitability, including a description of the methodology used to allocate certain expenses. Among other things, the Board noted that the levels of profitability reported on a fund-by-fund basis varied widely, depending on factors such as the size, type and age of fund.
Based on its review, the Board did not deem the profits reported by Funds Management, WFAM or Wells Fargo from services provided to the Fund to be at a level that would prevent it from approving the continuation of the Advisory Agreements.
Economies of scale
The Board received and considered information about the potential for Funds Management to experience economies of scale in the provision of management services to the Fund, the difficulties of calculating economies of scale at an individual fund level, and the extent to which potential scale benefits are shared with shareholders. The Board noted the existence of breakpoints in the Fund’s management fee structure, which operate generally to reduce the Fund’s expense ratios as the Fund grows in size, and the size of the Fund in relation to such breakpoints. The Board considered that in addition to management fee breakpoints, Funds Management shares potential economies of scale from its management business in a variety of ways, including through fee waiver and expense reimbursement arrangements, services that benefit shareholders, competitive management fee rates set at the outset without regard to breakpoints, and investments in the business intended to enhance services available to shareholders.
The Board concluded that Funds Management’s arrangements with respect to the Fund, including contractual breakpoints, constituted a reasonable approach to sharing potential economies of scale with the Fund and its shareholders.
Other benefits to funds management and the sub-adviser
The Board received and considered information regarding potential “fall-out” or ancillary benefits received by Funds Management and its affiliates, including the Sub-Adviser, as a result of their relationships with the Fund. Ancillary benefits could include, among others, benefits directly attributable to other relationships with the Fund and benefits potentially derived from an increase in Funds Management’s and the Sub-Adviser’s business as a result of their relationships with the Fund. The Board noted that various affiliates of Funds Management may receive distribution-related fees, shareholder servicing payments and sub-transfer agency fees in respect of shares sold or held through them and services provided.
The Board also reviewed information about soft dollar credits earned and utilized by the Sub-Adviser, fees earned by Funds Management and the Sub-Adviser from managing a private investment vehicle for the fund family’s securities lending collateral, and commissions earned by an affiliated broker from portfolio transactions.
Based on its consideration of the factors and information it deemed relevant, including those described here, the Board did not find that any ancillary benefits received by Funds Management and its affiliates, including the Sub-Adviser, were unreasonable.
Conclusion
At the Meeting, after considering the above-described factors and based on its deliberations and its evaluation of the information described above, the Board unanimously approved the continuation of the Advisory Agreements for a one-year term and determined that the compensation payable to Funds Management and the Sub-Adviser under each of the Advisory Agreements was reasonable.
Wells Fargo Strategic Municipal Bond Fund | 63
Other information (unaudited)
LIQUIDITY RISK MANAGEMENT PROGRAM
In accordance with Rule 22e-4 under the Investment Company Act of 1940, as amended (the “Liquidity Rule”), Wells Fargo Funds Trust (the “Trust”) has adopted and implemented a liquidity risk management program (the “Program”) on behalf of each of its series, including the Fund, which is reasonably designed to assess and manage the Fund’s liquidity risk. “Liquidity risk” is defined as the risk that the Fund is unable to meet redemption requests without significantly diluting remaining investors’ interests in the Fund. The Trust’s Board of Trustees (the “Board”) previously approved the designation of Wells Fargo Funds Management, LLC (“Funds Management”), the Fund’s investment manager, as the administrator of the Program, and Funds Management has established a Liquidity Risk Management Council composed of personnel from multiple departments within Funds Management and its affiliates to assist Funds Management in the implementation and on-going administration of the Program.
The Program is comprised of various components designed to support the assessment and/or management of liquidity risk, including: (1) the periodic assessment (no less frequently than annually) of certain factors that influence the Fund’s liquidity risk; (2) the periodic classification (no less frequently than monthly) of the Fund’s investments into one of four liquidity categories that reflect an estimate of their liquidity under current market conditions; (3) a 15% limit on the acquisition of “illiquid investments” (as defined under the Liquidity Rule); (4) to the extent the Fund does not invest primarily in “highly liquid investments” (as defined under the Liquidity Rule), the determination of a minimum percentage of the Fund’s assets that generally will be invested in highly liquid investments (an “HLIM”); (5) if the Fund has established an HLIM, the periodic review (no less frequently than annually) of the HLIM and the adoption of policies and procedures for responding to a shortfall of the Fund’s “highly liquid investments” below its HLIM; and (6) periodic reporting to the Board.
At a meeting of the Board held on May 26 and 28, 2020, the Board received a written report (the “Report”) from Funds Management that addressed the operation of the Program and assessed its adequacy and effectiveness of implementation. The Report covered the initial period from December 1, 2018 through December 31, 2019 (the “Reporting Period”). No significant liquidity events impacting the Fund were noted in the Report. There were no material changes to the Program during the Reporting Period. The Report concluded that the Program is operating effectively to assess and manage the Fund’s liquidity risk, and that the Program has been and continues to be adequately and effectively implemented to monitor and, as applicable, respond to the Fund’s liquidity developments.
There can be no assurance that the Program will achieve its objectives under all circumstances in the future. Please refer to the Fund’s prospectus for more information regarding the Fund’s exposure to liquidity risk and other risks to which an investment in the Fund may be subject.
64 | Wells Fargo Strategic Municipal Bond Fund
Effective on or after May 1, 2020, clients of Edward Jones (also referred to as “shareholders”) purchasing Fund shares on the Edward Jones commission and fee-based platforms are eligible only for the following sales charge discounts (also referred to as “breakpoints”) and waivers, which can differ from breakpoints and waivers described elsewhere in the Fund’s Prospectus or SAI or through another broker-dealer. In all instances, it is the shareholder’s responsibility to inform Edward Jones at the time of purchase of any relationship, holdings of Wells Fargo Funds or other facts qualifying the purchaser for breakpoints or waivers. Edward Jones can ask for documentation of such circumstance.
| Breakpoints available at Edward Jones |
| Rights of Accumulation (ROA) |
The applicable sales charge on a purchase of Class A shares is determined by taking into account all share classes (except any money market funds and retirement plan share classes) of Wells Fargo Funds held by the shareholder or in an account grouped by Edward Jones with other accounts for the purpose of providing certain pricing considerations (“pricing groups”). This includes all share classes held on the Edward Jones platform and/or held on another platform. The inclusion of eligible fund family assets in the rights of accumulation calculation is dependent on the shareholder notifying his or her financial advisor of such assets at the time of calculation. |
ROA is determined by calculating the higher of cost or market value (current shares x NAV). |
| Letter of Intent (LOI) |
Through a LOI, shareholders can receive the sales charge and breakpoint discounts for purchases shareholders intend to makeover a 13-month period from the date Edward Jones receives the LOI. The LOI is determined by calculating the higher of cost or market value of qualifying holdings at LOI initiation in combination with the value that the shareholder intends to buy over a 13-month period to calculate the front-end sales charge and any breakpoint discounts. Each purchase the shareholder makes during that 13-month period will receive the sales charge and breakpoint discount that applies to the total amount. The inclusion of eligible fund family assets in the LOI calculation is dependent on the shareholder notifying his or her financial advisor of such assets at the time of calculation. Purchases made before the LOI is received by Edward Jones are not covered under the LOI and will not reduce the sales charge previously paid. Sales charges will be adjusted if LOI is not met. |
| Sales charges are waived for the following shareholders and in the following situations at Edward Jones: |
● Associates of Edward Jones and its affiliates and their family members who are in the same pricing group (as determined by Edward Jones under its policies and procedures) as the associate. This waiver will continue for the remainder of the associate’s life if the associate retires from Edward Jones in good-standing. |
● Shares purchased in an Edward Jones fee-based program. |
● Shares purchased through reinvestment of capital gains distributions and dividend reinvestment. |
● Shares purchased from the proceeds of redeemed shares of the same fund family so long as the following conditions are met: 1) the proceeds are from the sale of shares within 60 days of the purchase, and 2) the sale and purchase are made in the same share class and the same account or the purchase is made in an individual retirement account with proceeds from liquidations in anon-retirement account. |
● Shares exchanged into Class A shares from another share class so long as the exchange is into the same fund and was initiated at the discretion of Edward Jones. Edward Jones is responsible for any remaining CDSC due to the fund company, if applicable. Any future purchases are subject to the applicable sales charge as disclosed in the prospectus. |
● Exchanges from Class C shares to Class A shares of the same fund, generally, in the 84th month following the anniversary of the purchase date or earlier at the discretion of Edward Jones. |
| If the shareholder purchases shares that are subject to a CDSC and those shares are redeemed before the CDSC is expired, the shareholder is responsible to pay the CDSC except in the following conditions available at Edward Jones: |
● The death or disability of the shareholder. |
● Systematic withdrawals with up to 10% per year of the account value. |
● Return of excess contributions from an Individual Retirement Account (IRA). |
● Shares sold as part of a required minimum distribution for IRA and retirement accounts if the redemption is taken in or after the year the shareholder reaches qualified age based on applicable IRS regulation. |
● Shares sold to pay Edward Jones fees or costs in such cases where the transaction is initiated by Edward Jones. |
● Shares exchanged in an Edward Jones fee-based program. |
● Shares acquired through NAV reinstatement. |
Wells Fargo Strategic Municipal Bond Fund | 65
Appendix I (unaudited)
| Other Important Information for accounts at Edward Jones: |
| Minimum Purchase Amounts |
● $250 initial purchase minimum |
● $50 subsequent purchase minimum |
| Minimum Balances |
| Edward Jones has the right to redeem at its discretion fund holdings with a balance of $250 or less. The following are examples of accounts that are not included in this policy: |
● A fee-based account held on an Edward Jones platform |
● A 529 account held on an Edward Jones platform |
● An account with an active systematic investment plan or letter of intent (LOI) |
| Changing Share Classes |
| At any time it deems necessary, Edward Jones has the authority to exchange at NAV a shareholder’s holdings in a fund to Class A shares. |
66 | Wells Fargo Strategic Municipal Bond Fund
Effective June 1, 2020, shareholders purchasing Fund shares through an Oppenheimer & Co. Inc. (“Oppenheimer”) platform or account are eligible only for the following load waivers (front-end sales charge waivers and contingent deferred or back-end, sales charge waivers) and discounts, which may differ from those disclosed in the Fund’s Prospectus or SAI.
| Front-end Sales Load Waivers on Class A Shares available at Oppenheimer |
| Employer-sponsored retirement, deferred compensation and employee benefit plans (including health savings accounts) and trusts used to fund those plans, provided that the shares are not held in a commission-based brokerage account and shares are held for the benefit of the plan. |
| Shares purchased by or through a 529 Plan. |
| Shares purchased through an Oppenheimer affiliated investment advisory program. |
| Shares purchased through reinvestment of capital gains distributions and dividend reinvestment when purchasing shares of the same fund (but not any other fund within the fund family). |
| Shares purchased from the proceeds of redemptions within the same fund family, provided (1) the repurchase occurs within 90 days following the redemption, (2) the redemption and purchase occur in the same account, and (3) redeemed shares were subject to a front-end or deferred sales load (known as Rights of Restatement). |
| A shareholder in the Fund’s Class C shares will have their shares exchanged at net asset value to Class A shares (or the appropriate share class) of the Fund if the shares are no longer subject to a CDSC and the exchange is in line with the policies and procedures of Oppenheimer. |
| Employees and registered representatives of Oppenheimer or its affiliates and their family members. |
| Directors or Trustees of the Fund, and employees of the Fund’s investment adviser or any of its affiliates, as described in the Prospectus. |
| CDSC Waivers on A and C Shares available at Oppenheimer |
| Death or disability of the shareholder. |
| Shares sold as part of a systematic withdrawal plan as described in the Prospectus. |
| Return of excess contributions from an IRA Account. |
| Shares sold as part of a required minimum distribution for IRA and retirement accounts due to the shareholder reaching the qualified age based on applicable IRS regulations as described in the Prospectus. |
| Shares sold to pay Oppenheimer fees but only if the transaction is initiated by Oppenheimer. |
| Shares acquired through a right of reinstatement. |
| Front-end load Discounts Available at Oppenheimer: Breakpoints, Rights of Accumulation & Letters of Intent |
| Breakpoints as described in the Prospectus. |
| Rights of Accumulation (ROA), which entitle shareholders to breakpoint discounts, will be automatically calculated based on the aggregated holding of fund family assets held by accounts within the purchaser’s household at Oppenheimer. Eligible fund family assets not held at Oppenheimer may be included in the ROA calculation only if the shareholder notifies his or her financial advisor about such assets. |
Wells Fargo Strategic Municipal Bond Fund | 67
Effective June 15, 2020, shareholders purchasing fund shares through a Robert W. Baird & Co. (“Baird”) platform or account will only be eligible for the following sales charge waivers (front-end sales charge waivers and CDSC waivers) and discounts, which may differ from those disclosed elsewhere in the Fund’s Prospectus or the SAI.
| Front-end Sales Load Waivers on Class A Shares available at Baird |
| Shares purchased through reinvestment of capital gains distributions and dividend reinvestment when purchasing share of the same fund. |
| Share purchase by employees and registers representatives of Baird or its affiliate and their family members as designated by Baird. |
| Shares purchase from the proceeds of redemptions within the same fund family, provided (1) the repurchase occurs within 90 days following the redemption, (2) the redemption and purchase occur in the same accounts, and (3) redeemed shares were subject to a front-end or deferred sales charge (known as rights of reinstatement). |
| A shareholder in the Funds Investor C Shares will have their share exchanged at net asset value to Investor A shares of the fund if the shares are no longer subject to CDSC and the exchange is in line with the policies and procedures of Baird. |
| Employer-sponsored retirement plans or charitable accounts in a transactional brokerage account at Baird, including 401(k) plans, 457 plans, employer-sponsored 403(b) plans, profit sharing and money purchase pension plans and defined benefit plans. For purposes of this provision, employer-sponsored retirement plans do not include SEP IRAs, Simple IRAs or SAR-SEPs. |
| CDSC Waivers on A and C Shares available at Baird |
| Shares sold due to death or disability of the shareholder. |
| Shares sold as part of a systematic withdrawal plan as described in the Fund’s Prospectus. |
| Shares bought due to returns of excess contributions from an IRA Account. |
| Shares sold as part of a required minimum distribution for IRA and retirement accounts due to the shareholder reaching age 72 as described in the Fund’s Prospectus. |
| Shares sold to pay Baird fees but only if the transaction is initiated by Baird. |
| Shares acquired through a right of reinstatement. |
| Front-end load Discounts Available at Baird: Breakpoint and/or Rights of Accumulation |
| Breakpoints as described in the Prospectus. |
| Rights of accumulations which entitles shareholders to breakpoint discounts will be automatically calculated based on the aggregated holding of fund family assets held by accounts within the purchaser’s household at Baird. Eligible fund family assets not held at Baird may be included in the rights of accumulations calculation only if the shareholder notifies his or her financial advisor about such assets. |
| Letters of Intent (LOI) allow for breakpoint discounts based on anticipated purchases within a fund family through Baird, over a 13-month period of time. |
68 | Wells Fargo Strategic Municipal Bond Fund
For more information
More information about Wells Fargo Funds is available free upon request. To obtain literature, please write, visit the Fund’s website, or call:
Wells Fargo Funds
P.O. Box 219967
Kansas City, MO 64121-9967
Website: wfam.com
Individual investors: 1-800-222-8222
Retail investment professionals: 1-888-877-9275
Institutional investment professionals: 1-866-765-0778

This report and the financial statements contained herein are submitted for the general information of the shareholders of the Fund. If this report is used for promotional purposes, distribution of the report must be accompanied or preceded by a current prospectus. Before investing, please consider the investment objectives, risks, charges, and expenses of the investment. For a current prospectus and, if available, a summary prospectus, containing this information, call 1-800-222-8222 or visit the Fund’s website at wfam.com. Read the prospectus carefully before you invest or send money.
Wells Fargo Asset Management (WFAM) is the trade name for certain investment advisory/management firms owned by Wells Fargo & Company. These firms include but are not limited to Wells Capital Management Incorporated and Wells Fargo Funds Management, LLC. Certain products managed by WFAM entities are distributed by Wells Fargo Funds Distributor, LLC (a broker-dealer and Member FINRA).
This material is for general informational and educational purposes only and is NOT intended to provide investment advice or a recommendation of any kind—including a recommendation for any specific investment, strategy, or plan.
INVESTMENT PRODUCTS: NOT FDIC INSURED ◾ NO BANK GUARANTEE ◾ MAY LOSE VALUE
© 2020 Wells Fargo & Company. All rights reserved.
PAR-0720-00249 08-20
A257/AR257 06-20

Annual Report
June 30, 2020
Wells Fargo
High Yield Municipal Bond Fund
Beginning on January 1, 2021, as permitted by new regulations adopted by the Securities and Exchange Commission, paper copies of the Wells Fargo Funds’ annual and semi-annual shareholder reports issued after this date will no longer be sent by mail, unless you specifically request paper copies of the reports. Instead, the reports will be made available on the Funds’ website, and you will be notified by mail each time a report is posted and provided with a website address to access the report.
If you already elected to receive shareholder reports electronically, you will not be affected by this change and you need not take any action. You may elect to receive shareholder reports and other communications from the Fund electronically at any time by contacting your financial intermediary (such as a broker-dealer or bank) or, if you are a direct investor, by calling 1-800-222-8222 or by enrolling at wellsfargo.com/advantagedelivery.
You may elect to receive all future reports in paper free of charge. If you invest through a financial intermediary, you can contact your financial intermediary to request that you continue to receive paper copies of your shareholder reports; if you invest directly with the Fund, you can call 1-800-222-8222. Your election to receive reports in paper will apply to all Wells Fargo Funds held in your account with your financial intermediary or, if you are a direct investor, to all Wells Fargo Funds that you hold.
|
Reduce clutter. Save trees. |
Sign up for electronic delivery of prospectuses and |
The views expressed and any forward-looking statements are as of June 30, 2020, unless otherwise noted, and are those of the Fund managers and/or Wells Fargo Asset Management. Discussions of individual securities, or the markets generally, or any Wells Fargo Fund are not intended as individual recommendations. Future events or results may vary significantly from those expressed in any forward-looking statements. The views expressed are subject to change at any time in response to changing circumstances in the market. Wells Fargo Asset Management and the Fund disclaim any obligation to publicly update or revise any views expressed or forward-looking statements.
INVESTMENT PRODUCTS: NOT FDIC INSURED ◾ NO BANK GUARANTEE ◾ MAY LOSE VALUE
Wells Fargo High Yield Municipal Bond Fund | 1
Letter to shareholders (unaudited)

Andrew Owen
President
Wells Fargo Funds
Dear Shareholder:
We are pleased to offer you this annual report for the Wells Fargo High Yield Municipal Bond Fund for the 12-month period that ended June 30, 2020. Global stock markets saw earlier gains erased in February and March as governments around the world took unprecedented measures to stop the spread of the coronavirus at the expense of short-term economic output. However, markets rebounded from April through June to offset much of the losses as central banks attempted to bolster capital markets and confidence. Fixed-income markets generally performed better, with most achieving gains. Overall U.S. markets surpassed their international peers, while U.S. large-cap equity, as measured by the Russell 1000® Index1, easily outperformed small caps, as measured by the Russell 2000® Index2, for the 12-month period.
For the 12-month period, fixed-income securities generally had positive total returns while non-U.S. equities had broad losses and U.S. stocks performed strongly despite sharp volatility since late February. For the period, U.S. stocks, based on the S&P 500 Index,3 gained 7.51%. International stocks, as measured by the MSCI ACWI ex USA Index (Net),4 returned -4.80%, while the MSCI EM Index (Net)5 performed slightly better, with a -3.39% return. For bond investors, the Bloomberg Barclays U.S. Aggregate Bond Index6 returned a robust 8.74%, the Bloomberg Barclays Global Aggregate ex-USD Index7 gained a modest 0.71%, and the Bloomberg Barclays Municipal Bond Index8 returned 4.45% while the ICE BofA U.S. High Yield Index9 lost 1.10%.
The fiscal year began on a positive note.
The 12-month period began with the U.S. equity market advancing to new highs in July 2019. U.S. President Donald Trump initially backed off of earlier tariff threats against Mexico and China. However, later in July, the U.S. reversed course and threatened to impose higher tariffs on China’s exports after talks failed. China responded with tariff threats of its own and devalued the renminbi, roiling global markets. Major U.S. stock market indices closed July with the worst weekly results of the year. Bond prices gained as Treasury yields fell to multiyear lows, and the yield curve inverted at multiple points along the 30-year arc, with shorter term yields higher than longer-term. At the end of July, the U.S. Federal Reserve (Fed) cut its federal funds rate by 0.25%.
In August, U.S.-China trade tensions continued with no signs of compromise. Evidence of a continued global economic slowdown mounted, and central banks in China, New Zealand,
| 1 | The Russell 1000® Index measures the performance of the 1,000 largest companies in the Russell 3000® Index, which represents approximately 92% of the total market capitalization of the Russell 3000® Index. You cannot invest directly in an index. |
| 2 | The Russell 2000® Index measures the performance of the 2,000 smallest companies in the Russell 3000® Index, which represents approximately 8% of the total market capitalization of the Russell 3000® Index. You cannot invest directly in an index. |
| 3 | The S&P 500 Index consists of 500 stocks chosen for market size, liquidity, and industry group representation. It is a market-value-weighted index with each stock’s weight in the index proportionate to its market value. You cannot invest directly in an index. |
| 4 | The Morgan Stanley Capital International (MSCI) All Country World Index (ACWI) ex USA Index (Net) is a free-float-adjusted market-capitalization-weighted index that is designed to measure the equity market performance of developed and emerging markets, excluding the United States. Source: MSCI. MSCI makes no express or implied warranties or representations and shall have no liability whatsoever with respect to any MSCI data contained herein. The MSCI data may not be further redistributed or used as a basis for other indices or any securities or financial products. This report is not approved, reviewed, or produced by MSCI. You cannot invest directly in an index. |
| 5 | The MSCI Emerging Markets (EM) Index (Net) is a free-float-adjusted market-capitalization-weighted index that is designed to measure equity market performance of emerging markets. You cannot invest directly in an index. |
| 6 | The Bloomberg Barclays U.S. Aggregate Bond Index is a broad-based benchmark that measures the investment-grade, U.S. dollar-denominated, fixed-rate taxable bond market, including Treasuries, government-related and corporate securities, mortgage-backed securities (agency fixed-rate and hybrid adjustable-rate mortgage pass-throughs), asset-backed securities, and commercial mortgage-backed securities. You cannot invest directly in an index. |
| 7 | The Bloomberg Barclays Global Aggregate ex-USD Index is an unmanaged index that provides a broad-based measure of the global investment-grade fixed-income markets excluding the U.S.-dollar-denominated debt market. You cannot invest directly in an index. |
| 8 | The Bloomberg Barclays Municipal Bond Index is an unmanaged index composed of long-term tax-exempt bonds with a minimum credit rating of Baa. You cannot invest directly in an index. |
| 9 | The ICE BofA U.S. High Yield Index is a market-capitalization-weighted index of domestic and Yankee high-yield bonds. The index tracks the performance of high-yield securities traded in the U.S. bond market. You cannot invest directly in an index. Copyright 2020. ICE Data Indices, LLC. All rights reserved. |
2 | Wells Fargo High Yield Municipal Bond Fund
Letter to shareholders (unaudited)
and Thailand cut interest rates. Industrial and manufacturing data declined in China, Canada, Japan, and Germany. Adding to global uncertainty, Italy’s prime minister resigned, many feared a crackdown in Hong Kong as protestors sustained their calls for reform, and U.K. Prime Minister Boris Johnson planned to suspend Parliament as Brexit’s deadline neared.
In the U.S., the Fed cut interest rates a second time in September. U.S. manufacturing data disappointed investors. The U.S. Congress announced it would pursue an impeachment investigation of President Trump. Meanwhile, the Brexit impasse showed no signs of resolution. Officials in China said that hitting the country’s economic growth goals for the year would be difficult considering the weight of tariffs and trade restrictions. Although the S&P 500 Index finished the third quarter with the best year-to-date returns in more than 20 years, concerns about future returns remained.
The fourth quarter started on a strong note, with U.S.-China trade tensions relaxing in October along with renewed optimism for a U.K. Brexit deal and positive macroeconomic data. The initial estimate of U.S. third-quarter gross domestic product (GDP) growth was a resilient 1.9% annualized rate, while the U.S. unemployment rate fell to a 50-year low of 3.5% in September. However, despite resilience among U.S. consumers, business confidence declined while manufacturing activity contracted. Concerned with a potential economic slowdown, the Fed lowered interest rates another quarter point in late October—its third rate cut in four months. This helped push the S&P 500 Index to a new all-time high while emerging market equities rallied and global bonds declined overall, reflecting a broad pickup in risk appetite.
Equity markets continued to rally in November despite ongoing geopolitical risks. Hopes for a U.S.-China trade deal buoyed investor confidence. U.S. business sentiment improved slightly, and manufacturing and services activity picked up. While consumer confidence and purchasing manager activity rose in the eurozone, China reported weakening manufacturing and consumer data. Bond yields rose marginally, leading to slightly negative returns for global government and investment-grade corporate bonds.
Financial markets ended 2019 with a boost from the U.S. and China accord on a Phase One trade deal. That, along with the landslide win by the pro-Brexit U.K. Conservative Party in a national election and ongoing central bank support, gave investors greater confidence. U.S. economic indicators were generally positive, with the exception of manufacturing activity and business confidence. Consumer confidence was resilient, fed by a robust labor market, tame inflation, and lower interest rates, which boosted housing affordability and stimulated homebuyer activity. The impeachment of President Trump had little impact on markets. Meanwhile, slowing Chinese economic activity, partly attributable to the trade war, led to further government stimulus at year-end through lower reserve ratios, allowing banks to lend more money.
The year-end rally continued in early January 2020. However, capital market volatility picked up sharply in late January on concerns over the potential impact of the coronavirus on the global economy and stock markets. With sentiment somewhat souring, perceived safe havens did well in January. The U.S. dollar and Japanese yen both rose, and government bonds outperformed equities. While the S&P 500 Index held its ground, emerging market equities tumbled, including those in Asia.
In February, the coronavirus became the major market focus. Fears of the virus’s impact on global growth led to expectations of increased global central bank monetary policy support. That led the 10-year U.S. Treasury yield to fall to an all-time low of 1.1% by the end of the month. Although equity markets initially shrugged off concerns about the outbreak, focusing instead on strong fourth-quarter earnings and improving business confidence in January, market sentiment turned sharply lower toward month-end and the S&P 500 Index lost 8.2% for the month. Oil prices tumbled as Russia and the Organization of the Petroleum Exporting countries compounded a major decline in oil demand with a brutal price war, partly aimed at dissuading further U.S. shale production. As a result, the price of West Texas Intermediate crude oil fell 13% in February.
Wells Fargo High Yield Municipal Bond Fund | 3
Letter to shareholders (unaudited)
“The global spread of the coronavirus led country after country to clamp down on social and business-related activity in order to contain the virus from causing even greater devastation and overwhelming health care systems.”
“Despite ongoing economic weakness and high levels of uncertainty on the containment of the coronavirus and the timing of an effective vaccine, financial markets continued to post widely positive returns in June.”
The global spread of the coronavirus led country after country to clamp down on social and business-related activity in order to contain the virus from causing even greater devastation and overwhelming health care systems. This abrupt stoppage of economic activity led to the sharp deceleration of global output, sending economies into a deep contraction. Central bank responses were swift, as they slashed interest rates and expanded quantitative easing programs to restore liquidity and confidence to the markets. In the U.S., the Fed introduced several new lending programs, funding investment-grade bonds, money market mutual funds, and commercial paper while purchasing Treasuries, mortgage-backed securities, and overnight repurchase agreements. Meanwhile, stock markets tumbled quickly into a bear market, ending the longest bull stock market in U.S. history.
Markets rebounded strongly in April, with the S&P 500 Index gaining 12.8% for the month and the MSCI ACWI ex USA Index (Net) returning 7.6%. The rebound was fueled by unprecedented government and central bank stimulus measures taken to buffer the economic damage created by mass shutdowns enacted in order to contain the virus’s spread. The U.S. economy contracted by an annualized 5.0% pace in the first quarter, with 30 million new unemployment insurance claims in six weeks. In the eurozone, first-quarter real GDP shrank 3.8%, with the composite April Flash Purchasing Managers’ Index, a monthly survey of purchasing managers, falling to an all-time low of 13.5. The European Central Bank expanded its quantitative easing to include the purchase of additional government bonds of countries with the greatest virus-related need, including Italy and Spain. China’s first-quarter GDP fell by 6.8% year over year. However, retail sales, production, and investment showed signs of recovery. Extreme oil-price volatility continued as global supply far exceeded demand.
In May, the equity market rebound continued, with the S&P 500 Index climbing a further 4.8%. European and Japanese stock markets also had monthly gains. Investors regained confidence on reports of early signs of success in human trials of a coronavirus vaccine. Growth stocks continued to outperform value stocks while returns on global government bonds were generally flat. In the U.S., a gap grew between the stock market rebound and devastating economic data points, including an April unemployment rate of 14.7%, the highest level since World War II. Purchasing managers’ indices continued to reflect weakening activity in May in both the manufacturing and services sectors. U.S. corporate earnings reports indicated a 14% year-over-year contraction in earnings from the first quarter of 2019. However, high demand for technology, driven by remote activity, helped maintain robust information technology sector earnings, which helped drive powerful well-known technology stocks higher.
Despite ongoing economic weakness and high levels of uncertainty on the containment of the coronavirus and the timing of an effective vaccine, financial markets continued to post widely positive returns in June. As economies reopened, there were hopeful signs. U.S. retail sales rose 17% in May while retail sales in the U.K. rebounded by 12%. However, year over year, sales remained depressed. Vitally important to market sentiment was the ongoing commitment by central banks globally to do all they can to provide economic support through liquidity and low borrowing costs. U.S. economic activity was aided by one-time $1,200 stimulus checks and $600 bonus weekly unemployment benefits due to expire at the end of July. However, unemployment remained in the double digits, easing somewhat from 14.7% in April to 11.1% in June. At period-end, numerous states reported alarming increases of coronavirus cases. China’s economic recovery picked up momentum in June, though it remained far from a full recovery.
4 | Wells Fargo High Yield Municipal Bond Fund
Letter to shareholders (unaudited)
Don’t let short-term uncertainty derail long-term investment goals.
Periods of investment uncertainty can present challenges, but experience has taught us that maintaining long-term investment goals can be an effective way to plan for the future. To help you create a sound strategy based on your personal goals and risk tolerance, Wells Fargo Funds offers more than 100 mutual funds spanning a wide range of asset classes and investment styles. Although diversification cannot guarantee an investment profit or prevent losses, we believe it can be an effective way to manage investment risk and potentially smooth out overall portfolio performance. We encourage investors to know their investments and to understand that appropriate levels of risk-taking may unlock opportunities.
Thank you for choosing to invest with Wells Fargo Funds. We appreciate your confidence in us and remain committed to helping you meet your financial needs.
Sincerely,

Andrew Owen
President
Wells Fargo Funds
|
For further information about your Fund, contact your investment professional, visit our website at wfam.com, or call us directly at 1-800-222-8222. |
Notice to Shareholders
At a meeting held on August 10-12, 2020, the Board of Trustees of the Fund approved a change to the Fund’s automatic conversion feature for Class C shares in order to shorten the required holding period from 10 to 8 years. As a result, on a monthly basis beginning November 5, 2020, Class C shares will convert automatically into Class A shares 8 years after the initial date of purchase or, if you acquired your Class C shares through an exchange or conversion from another share class, 8 years after the date you acquired your Class C shares. When Class C shares that you acquired through a purchase or exchange convert, any other Class C shares that you purchased with reinvested dividends and distributions also will convert into Class A shares on a pro rata basis.
Please note that a shorter holding period may apply depending on your intermediary. Please see “Appendix A—Sales Charge Reductions and Waivers for Certain Intermediaries” in the Fund’s prospectus for further information.
Wells Fargo High Yield Municipal Bond Fund | 5
Performance highlights (unaudited)
Investment objective
The Fund seeks high current income exempt from federal income tax, and capital appreciation.
Manager
Wells Fargo Funds Management, LLC
Subadviser
Wells Capital Management Incorporated
Portfolio managers
Dennis Derby
Terry J. Goode
Average annual total returns (%) as of June 30, 2020
| Including sales charge | Excluding sales charge | Expense ratios1 (%) | ||||||||||||||||||||||||||||||||
| Inception date | 1 year | 5 year | Since inception | 1 year | 5 year | Since inception | Gross | Net2 | ||||||||||||||||||||||||||
| Class A (WHYMX) | 1-31-2013 | -5.37 | 3.22 | 3.97 | -0.88 | * | 4.18 | 4.61 | 1.09 | 0.80 | ||||||||||||||||||||||||
| Class C (WHYCX) | 1-31-2013 | -2.63 | 3.40 | 3.84 | -1.63 | 3.40 | 3.84 | 1.84 | 1.55 | |||||||||||||||||||||||||
| Class R6 (EKHRX)3 | 7-31-2018 | – | – | – | -0.68 | 4.46 | 4.89 | 0.71 | 0.50 | |||||||||||||||||||||||||
| Administrator Class (WHYDX) | 1-31-2013 | – | – | – | -0.87 | 4.28 | 4.72 | 1.03 | 0.70 | |||||||||||||||||||||||||
| Institutional Class (WHYIX) | 1-31-2013 | – | – | – | -0.64 | * | 4.44 | 4.87 | 0.76 | 0.55 | ||||||||||||||||||||||||
| High Yield Municipal Bond Blended Index4 | – | – | – | – | 2.48 | 5.06 | 4.07 | ** | – | – | ||||||||||||||||||||||||
| Bloomberg Barclays Municipal Bond Index5 | – | – | – | – | 4.45 | 3.93 | 3.44 | ** | – | – | ||||||||||||||||||||||||
| Bloomberg Barclays High Yield Municipal Bond Index6 | – | – | – | – | 1.02 | 5.77 | 4.45 | ** | – | – | ||||||||||||||||||||||||
| * | Total return differs from the return in the Financial Highlights in this report. The total return presented is calculated based on the NAV at which the shareholder transactions were processed. The NAV and total return presented in the Financial Highlights reflects certain adjustments made to the net assets of the Fund that are necessary under U.S. generally accepted accounting principles. |
| ** | Based on the inception date of the oldest Fund class. |
Figures quoted represent past performance, which is no guarantee of future results, and do not reflect taxes that a shareholder may pay on an investment in a fund. Investment return and principal value of an investment will fluctuate so that an investor’s shares, when redeemed, may be worth more or less than their original cost. Performance shown without sales charges would be lower if sales charges were reflected. Current performance may be lower or higher than the performance data quoted, which assumes the reinvestment of dividends and capital gains. Current month-end performance is available on the Fund’s website, wfam.com.
Index returns do not include transaction costs associated with buying and selling securities, any mutual fund fees or expenses, or any taxes. It is not possible to invest directly in an index.
For Class A shares, the maximum front-end sales charge is 4.50%. For Class C shares, the maximum contingent deferred sales charge is 1.00%. Performance including a contingent deferred sales charge assumes the sales charge for the corresponding time period. Class R6, Administrator Class, and Institutional Class shares are sold without a front-end sales charge or contingent deferred sales charge.
Bond values fluctuate in response to the financial condition of individual issuers, general market and economic conditions, and changes in interest rates. Changes in market conditions and government policies may lead to periods of heightened volatility in the bond market and reduced liquidity for certain bonds held by the Fund. In general, when interest rates rise, bond values fall and investors may lose principal value. Interest rate changes and their impact on the Fund and its share price can be sudden and unpredictable. High-yield securities have a greater risk of default and tend to be more volatile than higher-rated debt securities. The use of derivatives may reduce returns and/or increase volatility. Certain investment strategies tend to increase the total risk of an investment (relative to the broader market). The Fund is exposed to municipal securities risk. Consult the Fund’s prospectus for additional information on these and other risks. A portion of the Fund’s income may be subject to federal, state, and/or local income taxes or the Alternative Minimum Tax (AMT). Any capital gains distributions may be taxable.
Please see footnotes on page 7.
6 | Wells Fargo High Yield Municipal Bond Fund
Performance highlights (unaudited)
| Growth of $10,000 investment as of June 30, 20207 |
|
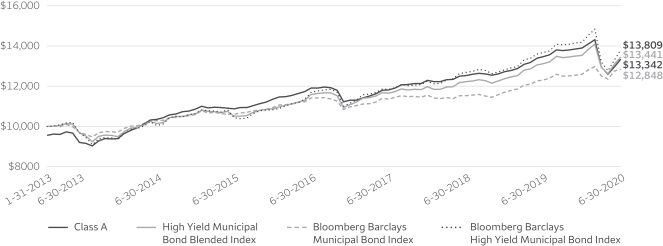
| 1 | Reflects the expense ratios as stated in the most recent prospectuses. The expense ratios shown are subject to change and may differ from the annualized expense ratios shown in the financial highlights of this report. |
| 2 | The manager has contractually committed through October 31, 2020, to waive fees and/or reimburse expenses to the extent necessary to cap total annual fund operating expenses after fee waivers at 0.80% for Class A, 1.55% for Class C, 0.50% for Class R6, 0.70% for Administrator Class, and 0.55% for Institutional Class. Brokerage commissions, stamp duty fees, interest, taxes, acquired fund fees and expenses (if any), and extraordinary expenses are excluded from the expense caps. Prior to or after the commitment expiration date, the caps may be increased or the commitment to maintain the caps may be terminated only with the approval of the Board of Trustees. Without these caps, the Fund’s returns would have been lower. The expense ratio paid by an investor is the net expense ratio (the total annual fund operating expenses after fee waivers) as stated in the prospectuses. |
| 3 | Historical performance shown for the Class R6 shares prior to their inception reflects the performance of the Institutional Class shares, and includes the higher expenses applicable to the Institutional Class shares. If these expenses had not been included, returns for the Class R6 shares would be higher. |
| 4 | Source: Wells Fargo Funds Management LLC. The High Yield Municipal Bond Blended Index is weighted 60% in the Bloomberg Barclays High Yield Municipal Bond Index and 40% in the Bloomberg Barclays Municipal Bond Index. Effective November 1, 2019, the Fund’s benchmark changed from Bloomberg Barclays Municipal Bond Index to the High Yield Municipal Bond Blended Index to better match the Fund’s investment strategy. You cannot invest directly in an index. |
| 5 | The Bloomberg Barclays Municipal Bond Index is an unmanaged index composed of long-term tax-exempt bonds with a minimum credit rating of Baa. You cannot invest directly in an index. |
| 6 | The Bloomberg Barclays High Yield Municipal Bond Index measures the non-investment-grade and nonrated U.S. dollar–denominated, fixed-rate, tax-exempt bond market within the 50 United States and four other qualifying regions (Washington, D.C.; Puerto Rico; Guam; and the Virgin Islands). The index allows state and local general obligation, revenue, insured, and prefunded bonds; however, historically the index has been composed of mostly revenue bonds. You cannot invest directly in an index. |
| 7 | The chart compares the performance of Class A shares since inception with the High Yield Municipal Bond Blended Index, Bloomberg Barclays Municipal Bond Index, and the Bloomberg Barclays High Yield Municipal Bond Index. The chart assumes a hypothetical $10,000 investment in Class A shares and reflects all operating expenses and assumes the maximum initial sales charge of 4.50%. |
| 8 | Amounts are calculated based on the long-term total investments of the Fund. These amounts are subject to change and may have changed since the date specified. |
| 9 | The credit quality distribution of portfolio holdings reflected in the chart is based on ratings from Standard & Poor’s, Moody’s Investors Service, and/or Fitch Ratings Ltd. Credit quality ratings apply to the underlying holdings of the Fund and not to the Fund itself. The percentages of the Fund’s portfolio with the ratings depicted in the chart are calculated based on the total market value of fixed income securities held by the Fund. If a security was rated by all three rating agencies, the middle rating was utilized. If rated by two of three rating agencies, the lower rating was utilized, and if rated by one of the rating agencies, that rating was utilized. Standard & Poor’s rates the creditworthiness of bonds, ranging from AAA (highest) to D (lowest). Ratings from A to CCC may be modified by the addition of a plus (+) or minus (-) sign to show relative standing within the rating categories. Standard & Poor’s rates the creditworthiness of short-term notes from SP-1 (highest) to SP-3 (lowest). Moody’s rates the creditworthiness of bonds, ranging from Aaa (highest) to C (lowest). Ratings Aa to B may be modified by the addition of a number 1 (highest) to 3 (lowest) to show relative standing within the ratings categories. Moody’s rates the creditworthiness of short-term U.S. tax-exempt municipal securities from MIG 1/VMIG 1 (highest) to SG (lowest). Fitch rates the creditworthiness of bonds, ranging from AAA (highest) to D (lowest). Credit quality distribution is subject to change and may have changed since the date specified. |
Wells Fargo High Yield Municipal Bond Fund | 7
Performance highlights (unaudited)
MANAGER’S DISCUSSION
Fund highlights
| ∎ | The Fund underperformed its benchmarks, the High Yield Municipal Bond Blended Index, the Bloomberg Barclays Municipal Bond Index, and the Bloomberg Barclays High Yield Municipal Bond Index, for the year that ended June 30, 2020. |
| ∎ | Our yield-curve positioning relative to the benchmark was a positive contributor. However, our more conservative duration positioning was a detractor as interest rates declined over the 12-month period ending June 30, 2020. We started the fiscal year shorter than the benchmark and underweight the 20-year and long bond maturity segments. We were overweight the best-performing 7-year maturity segment. |
| ∎ | An overweight to nonrated bonds detracted from relative performance as credit spreads widened and were extremely volatile over the 12-month period. As the period ended, credit spreads were beginning to contract as demand for yield paper increased with interest rates at or near record lows. However, investment-grade bonds were among the best performers in the index. |
| ∎ | Security selection, especially in the education sector, was the biggest driver of performance, and our overweight to selected high-yield bonds added to returns. |
| Effective maturity distribution as of June 30, 20208 |
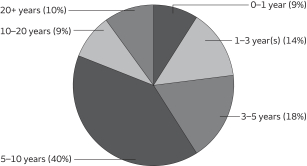 |
The coronavirus pandemic and the associated containment efforts became the dominant market influence over the 12-month period.
In 2019, market expectations moved the U.S. Federal Reserve (Fed) from a rate-hiking posture to multiple cuts in what was considered a “mid-cycle adjustment” at the time. Generally positive U.S. economic data was enough for most investors to expect continued slow growth and an extension of the economic expansion. Global trade tensions prompted a rise in market volatility, which subsided with the passage of a Phase One U.S.-China trade deal late in the calendar year. President Trump was formally impeached and ultimately acquitted by the U.S. Senate. By March, the coronavirus pandemic brought an end to the longest bull market on record.
The municipal bond market was heavily influenced by technical factors throughout the reporting period. Municipal mutual funds saw 61 straight weeks of net inflows, which pushed yields across ratings categories to all-time lows by late February. Low yields and ample demand drove municipal issuance higher but also altered the mix. Taxable municipal bonds as a proportion of new-issue municipal debt was at its highest level since 2010 by period-end. Pandemic-related volatility and liquidity pressures prompted record-setting outflows from municipal bonds in March. Strong support by the Fed, including a Municipal Liquidity Facility and more than $2.5 trillion in fiscal stimulus, buoyed markets and bolstered investor confidence. Several weeks of consecutive positive net flows for municipal funds and strong demand for new bonds drove yields back near the lows for highly rated issues. The 12-month period ended with the Fed pledging to keep short rates low for the foreseeable future, and the fundamental outlook for municipal issuers came into question as the path of recovery from the virus remains extraordinarily uncertain.
Security selection and yield-curve positioning were positive, but were more than offset by an overweight to nonrated bonds and conservative duration positioning.
Yield-curve positioning, particularly among the 5- to 7-year and 15-year maturity segments, contributed to performance. Sector allocation among charter schools also aided performance, while conservative duration positioning was somewhat offset by security selection. We started the period defensively positioned and extended duration tactically, ending the period closer to neutral. The largest individual contributors to performance included industrial development revenue/pollution control revenue (IDR/PCR) bonds, senior living, and charter schools. Detractors from performance included a distressed IDR/PCR bond we sold as well as bond sells during the most volatile month of March.
Demand for income characterized the beginning and the end of the 12-month period, with extreme bouts of volatility in between. Once volatility subsided, continued focus on finding attractive yielding bonds returned as overall interest rates
Please see footnotes on page 7.
8 | Wells Fargo High Yield Municipal Bond Fund
Performance highlights (unaudited)
remained low by historical standards. The return to positive flows toward period-end after significant outflows enabled bond prices in the high yield sector to begin to recover. However, it was not enough to outweigh the volatility and poor performance experienced as credit concerns due to the coronavirus affected several sectors and the non-investment grade rating category. We actively traded some new issues, particularly in the IDR/PCR sector, and were able to exit before steep price declines.
| Credit quality as of June 30, 20209 |
 |
We remain underweight state general obligation (GO) bonds but are overweight local GO bonds, especially those in Illinois and Colorado. Our largest revenue sector overweight is to education, which represents mainly charter schools, the Fund’s best performing sector. Our underweight to the IDR/PCR sector, especially tobacco settlement bonds, led to underperformance relative to the index. Lack of exposure to Puerto Rico for most of the period also hurt performance.
Rates are likely to remain low over the foreseeable future. Rating downgrades are expected, but defaults in the investment-grade space are expected to remain rare.
The longest economic expansion in history is over. The economic impact of the pandemic worldwide and nationally has yet to be fully realized. As we reopen the economy, we expect to see a boost versus the lows of April, but economic activity is likely to remain muted and pressure more troubled credits. Most states and municipalities came into this in the best financial shape they’ve been in for decades, notwithstanding pension challenges of certain issuers. Municipal issuers have a long history of managing through deep recessions, and many have already cut expenses, furloughed employees, and prepared to raise taxes. We expect to see a deterioration of credit quality and resultant downgrades, but we don’t believe that will result in a material increase in defaults in the investment-grade space. Individual security selection will be an important driver of performance in the next year, especially within the high-yield municipal market. We expect to manage duration tactically relative to the benchmark, depending on technical factors and market opportunities. Credit exposure will also vary depending on where we find relative value in the market as well as the trajectory of the economic recovery.
Please see footnotes on page 7.
Wells Fargo High Yield Municipal Bond Fund | 9
As a shareholder of the Fund, you incur two types of costs: (1) transaction costs, including sales charges (loads) on purchase payments and contingent deferred sales charges (if any) on redemptions and (2) ongoing costs, including management fees, distribution (12b-1) and/or shareholder servicing fees, and other Fund expenses. This example is intended to help you understand your ongoing costs (in dollars) of investing in the Fund and to compare these costs with the ongoing costs of investing in other mutual funds.
The example is based on an investment of $1,000 invested at the beginning of the six-month period and held for the entire period from January 1, 2020 to June 30, 2020.
Actual expenses
The “Actual” line of the table below provides information about actual account values and actual expenses. You may use the information in this line, together with the amount you invested, to estimate the expenses that you paid over the period. Simply divide your account value by $1,000 (for example, an $8,600 account value divided by $1,000 = 8.6), then multiply the result by the number in the “Actual” line under the heading entitled “Expenses paid during period” for your applicable class of shares to estimate the expenses you paid on your account during this period.
Hypothetical example for comparison purposes
The “Hypothetical” line of the table below provides information about hypothetical account values and hypothetical expenses based on the Fund’s actual expense ratio and an assumed rate of return of 5% per year before expenses, which is not the Fund’s actual return. The hypothetical account values and expenses may not be used to estimate the actual ending account balance or expenses you paid for the period. You may use this information to compare the ongoing costs of investing in the Fund and other funds. To do so, compare this 5% hypothetical example with the 5% hypothetical examples that appear in the shareholder reports of the other funds.
Please note that the expenses shown in the table are meant to highlight your ongoing costs only and do not reflect any transactional costs, such as sales charges (loads) and contingent deferred sales charges. Therefore, the “Hypothetical” line of the table is useful in comparing ongoing costs only and will not help you determine the relative total costs of owning different funds. In addition, if these transactional costs were included, your costs would have been higher.
| Beginning account value 1-1-2020 | Ending account value 6-30-2020 | Expenses paid during the period1 | Annualized net expense ratio | |||||||||||||
Class A | ||||||||||||||||
Actual | $ | 1,000.00 | $ | 960.58 | $ | 3.85 | 0.79 | % | ||||||||
Hypothetical (5% return before expenses) | $ | 1,000.00 | $ | 1,020.93 | $ | 3.97 | 0.79 | % | ||||||||
Class C | ||||||||||||||||
Actual | $ | 1,000.00 | $ | 956.97 | $ | 7.54 | 1.55 | % | ||||||||
Hypothetical (5% return before expenses) | $ | 1,000.00 | $ | 1,017.16 | $ | 7.77 | 1.55 | % | ||||||||
Class R6 | ||||||||||||||||
Actual | $ | 1,000.00 | $ | 961.99 | $ | 2.44 | 0.50 | % | ||||||||
Hypothetical (5% return before expenses) | $ | 1,000.00 | $ | 1,022.38 | $ | 2.51 | 0.50 | % | ||||||||
Administrator Class | ||||||||||||||||
Actual | $ | 1,000.00 | $ | 961.07 | $ | 3.36 | 0.69 | % | ||||||||
Hypothetical (5% return before expenses) | $ | 1,000.00 | $ | 1,021.43 | $ | 3.47 | 0.69 | % | ||||||||
Institutional Class | ||||||||||||||||
Actual | $ | 1,000.00 | $ | 961.72 | $ | 2.68 | 0.55 | % | ||||||||
Hypothetical (5% return before expenses) | $ | 1,000.00 | $ | 1,022.13 | $ | 2.77 | 0.55 | % | ||||||||
| 1 | Expenses paid is equal to the annualized net expense ratio of each class multiplied by the average account value over the period, multiplied by the number of days in the most recent fiscal half-year divided by the number of days in the fiscal year (to reflect the one-half-year period). |
10 | Wells Fargo High Yield Municipal Bond Fund
Portfolio of investments—June 30, 2020
| Interest rate | Maturity date | Principal | Value | |||||||||||||
| Municipal Obligations: 98.97% |
| |||||||||||||||
Alabama: 0.89% |
| |||||||||||||||
| Water & Sewer Revenue: 0.89% | ||||||||||||||||
Jefferson County AL Warrants CAB Senior Lien Series B (AGM Insured) ¤ | 0.00 | % | 10-1-2027 | $ | 920,000 | $ | 727,748 | |||||||||
|
| |||||||||||||||
Arizona: 4.73% |
| |||||||||||||||
| Education Revenue: 1.90% | ||||||||||||||||
Florence AZ IDA Legacy Traditional School Project Queen Creek & Casa Grande Campuses | 5.00 | 7-1-2023 | 160,000 | 165,824 | ||||||||||||
Phoenix AZ IDA Legacy Traditional Schools Project Series A 144A | 6.50 | 7-1-2034 | 500,000 | 560,455 | ||||||||||||
Pima County AZ IDA Desert Heights Charter School Facility Refunding Bond | 6.00 | 5-1-2024 | 325,000 | 343,996 | ||||||||||||
Pima County AZ IDA New Plan Learning Project Series A | 8.13 | 7-1-2041 | 495,000 | 491,307 | ||||||||||||
| 1,561,582 | ||||||||||||||||
|
| |||||||||||||||
| Health Revenue: 2.83% | ||||||||||||||||
Maricopa County AZ IDA Senior Living Facility Series 2016 144A | 6.00 | 1-1-2048 | 1,000,000 | 921,970 | ||||||||||||
Tempe AZ IDA Mirabella at ASU Incorporated Project Series A 144A | 6.13 | 10-1-2052 | 1,400,000 | 1,405,110 | ||||||||||||
| 2,327,080 | ||||||||||||||||
|
| |||||||||||||||
| 3,888,662 | ||||||||||||||||
|
| |||||||||||||||
California: 2.53% |
| |||||||||||||||
| Education Revenue: 0.33% | ||||||||||||||||
California Municipal Finance Authority Charter School Albert Einstein Academies Project Series A | 7.13 | 8-1-2043 | 250,000 | 274,475 | ||||||||||||
|
| |||||||||||||||
| Miscellaneous Revenue: 1.14% | ||||||||||||||||
Compton CA PFA Refunding Bond 144A | 4.00 | 9-1-2027 | 1,000,000 | 939,780 | ||||||||||||
|
| |||||||||||||||
| Tax Revenue: 1.06% | ||||||||||||||||
Compton CA Community College RDA Project 2nd Lien Series A | 5.00 | 8-1-2020 | 100,000 | 100,293 | ||||||||||||
San Francisco City & County CA RDA CAB Mission Bay South Redevelopment Project Subordinate Bond Series D 144A¤ | 0.00 | 8-1-2026 | 1,000,000 | 766,360 | ||||||||||||
| 866,653 | ||||||||||||||||
|
| |||||||||||||||
| 2,080,908 | ||||||||||||||||
|
| |||||||||||||||
Colorado: 10.26% |
| |||||||||||||||
| GO Revenue: 8.42% | ||||||||||||||||
Arapahoe County CO Copperleaf Metropolitan District #2 | 5.75 | 12-1-2045 | 500,000 | 509,415 | ||||||||||||
Aurora CO Cornerstar Metropolitan District Refunding Bond Series A | 5.25 | 12-1-2047 | 1,000,000 | 1,003,170 | ||||||||||||
Colorado Big Dry Creek Metropolitan District Improvement & Refunding Bonds Limited Tax Series A | 5.75 | 12-1-2047 | 1,000,000 | 1,024,670 | ||||||||||||
Colorado Cottonwood Highlands Metropolitan District #1 Limited Tax Series A | 5.00 | 12-1-2049 | 900,000 | 891,738 | ||||||||||||
Colorado Whispering Pines Metropolitan District #1 Series A | 5.00 | 12-1-2047 | 1,000,000 | 1,002,310 | ||||||||||||
Denver CO International Business Center Metropolitan District #1 Series B | 6.00 | 12-1-2048 | 1,145,000 | 1,158,786 | ||||||||||||
Eaton CO Area Park & Recreation District | 5.00 | 12-1-2023 | 810,000 | 840,723 | ||||||||||||
Eaton CO Area Park & Recreation District | 5.50 | 12-1-2030 | 475,000 | 491,777 | ||||||||||||
| 6,922,589 | ||||||||||||||||
|
| |||||||||||||||
| Tax Revenue: 1.20% | ||||||||||||||||
Pueblo CO Urban Renewal Authority Regional Tourism Act Project | 5.00 | 6-1-2036 | 1,000,000 | 985,930 | ||||||||||||
|
| |||||||||||||||
The accompanying notes are an integral part of these financial statements.
Wells Fargo High Yield Municipal Bond Fund | 11
Portfolio of investments—June 30, 2020
| Interest rate | Maturity date | Principal | Value | |||||||||||||
| Transportation Revenue: 0.64% | ||||||||||||||||
Colorado High Performance Transportation Enterprise U.S. 36 & I-25 Managed Lanes | 5.75 | % | 1-1-2044 | $ | 500,000 | $ | 530,870 | |||||||||
|
| |||||||||||||||
| 8,439,389 | ||||||||||||||||
|
| |||||||||||||||
Connecticut: 0.77% |
| |||||||||||||||
| GO Revenue: 0.77% | ||||||||||||||||
Hartford CT Series A | 4.00 | 4-1-2032 | 325,000 | 338,910 | ||||||||||||
Hartford CT Series A | 5.00 | 4-1-2024 | 105,000 | 115,340 | ||||||||||||
Hartford CT Series B | 5.00 | 4-1-2033 | 50,000 | 53,619 | ||||||||||||
Hartford CT Unrefunded Bond Series A | 5.00 | 4-1-2029 | 45,000 | 47,443 | ||||||||||||
Hartford CT Unrefunded Bond Series A | 5.00 | 4-1-2030 | 70,000 | 73,704 | ||||||||||||
| 629,016 | ||||||||||||||||
|
| |||||||||||||||
Delaware: 1.29% |
| |||||||||||||||
| Education Revenue: 1.29% | ||||||||||||||||
Delaware EDA Odyssey Charter School Incorporated Project Series A 144A | 7.00 | 9-1-2045 | 1,000,000 | 1,062,980 | ||||||||||||
|
| |||||||||||||||
District of Columbia: 0.55% |
| |||||||||||||||
| Tobacco Revenue: 0.55% | ||||||||||||||||
District of Columbia Tobacco Settlement Financing Corporation | 6.75 | 5-15-2040 | 435,000 | 448,159 | ||||||||||||
|
| |||||||||||||||
Florida: 4.27% |
| |||||||||||||||
| Education Revenue: 4.07% | ||||||||||||||||
Florida Capital Trust Agency Educational Facilities Pineapple Cove Classical Academy Incorporated Project Series A 144A | 5.13 | 7-1-2039 | 2,000,000 | 2,047,720 | ||||||||||||
Florida Development Finance Corporation Educational Facilities Renaissance Charter School Project Series A | 8.50 | 6-15-2044 | 250,000 | 281,143 | ||||||||||||
Miami-Dade County FL IDA Youth Co-Op Charter Schools Project Series A 144A | 6.00 | 9-15-2045 | 1,000,000 | 1,023,170 | ||||||||||||
| 3,352,033 | ||||||||||||||||
|
| |||||||||||||||
| Health Revenue: 0.20% | ||||||||||||||||
Holmes County FL Hospital Corporation Doctors Memorial Hospital Project | 6.00 | 11-1-2038 | 250,000 | 162,500 | ||||||||||||
|
| |||||||||||||||
| 3,514,533 | ||||||||||||||||
|
| |||||||||||||||
Georgia: 1.97% |
| |||||||||||||||
| Housing Revenue: 1.04% | ||||||||||||||||
Cobb County GA Development Authority Student Housing Kennesaw State University Foundation Project Refunding Bond Series C | 5.00 | 7-15-2028 | 800,000 | 858,496 | ||||||||||||
|
| |||||||||||||||
| Transportation Revenue: 0.93% | ||||||||||||||||
Georgia Road & Tollway Authority CCAB I-75 South Expressway Lanes Project Series B 144A¤ | 0.00 | 6-1-2049 | 1,000,000 | 762,150 | ||||||||||||
|
| |||||||||||||||
| 1,620,646 | ||||||||||||||||
|
| |||||||||||||||
Idaho: 0.31% |
| |||||||||||||||
| Education Revenue: 0.31% | ||||||||||||||||
Idaho Housing & Finance Association Legacy Public Charter School Incorporated Project Series A | 6.25 | 5-1-2043 | 250,000 | 257,533 | ||||||||||||
|
| |||||||||||||||
The accompanying notes are an integral part of these financial statements.
12 | Wells Fargo High Yield Municipal Bond Fund
Portfolio of investments—June 30, 2020
| Interest rate | Maturity date | Principal | Value | |||||||||||||
| Illinois: 16.47% | ||||||||||||||||
| Education Revenue: 1.80% | ||||||||||||||||
Illinois Finance Authority Charter School Aid Intrinsic Schools Belmont School Project Series A 144A | 5.25 | % | 12-1-2025 | $ | 800,000 | $ | 843,504 | |||||||||
Illinois Finance Authority Charter Schools Improvement & Refunding Bonds Series A | 6.88 | 10-1-2031 | 610,000 | 635,858 | ||||||||||||
| 1,479,362 | ||||||||||||||||
|
| |||||||||||||||
| GO Revenue: 8.77% | ||||||||||||||||
Chicago IL Board of Education CAB School Reform Series A (National Insured) ¤ | 0.00 | 12-1-2025 | 500,000 | 427,025 | ||||||||||||
Chicago IL Neighborhoods Alive 21 Program Series B | 5.50 | 1-1-2032 | 700,000 | 755,069 | ||||||||||||
Chicago IL Series A | 5.00 | 1-1-2033 | 310,000 | 314,848 | ||||||||||||
Chicago IL Series A | 6.00 | 1-1-2038 | 1,500,000 | 1,692,135 | ||||||||||||
Cook County IL School District #144 Prairie Hills CAB Refunding Bond Series C (AGM Insured) ¤ | 0.00 | 12-1-2025 | 730,000 | 676,330 | ||||||||||||
Illinois | 5.00 | 3-1-2033 | 1,000,000 | 1,016,860 | ||||||||||||
Lake County IL Community Unit School District #187 North Chicago CAB Series A (AGM Insured) ¤ | 0.00 | 1-1-2023 | 590,000 | 567,497 | ||||||||||||
Will County IL Lincoln-Way Community High School District #210 Tennessee Consolidated Retirement System CAB Refunding Bond Series A (BAM Insured) | 3.25 | 1-1-2030 | 450,000 | 458,955 | ||||||||||||
Will County IL Lincoln-Way Community High School District #210 Tennessee Consolidated Retirement System CAB Refunding Bond Series B (BAM Insured) ¤ | 0.00 | 1-1-2027 | 685,000 | 598,080 | ||||||||||||
Will County IL Lincoln-Way Community High School District #210 Tennessee Consolidated Retirement System CAB Refunding Bond Series B (BAM Insured) ¤ | 0.00 | 1-1-2033 | 1,000,000 | 705,090 | ||||||||||||
| 7,211,889 | ||||||||||||||||
|
| |||||||||||||||
| Miscellaneous Revenue: 3.10% | ||||||||||||||||
Chicago IL Certificate of Participation River Point Plaza Redevelopment Project Series A 144A | 4.84 | 4-15-2028 | 1,825,000 | 1,834,454 | ||||||||||||
Illinois Finance Authority Educational Facility Senior Rogers Park Montessori School | 6.00 | 2-1-2034 | 680,000 | 718,189 | ||||||||||||
| 2,552,643 | ||||||||||||||||
|
| |||||||||||||||
| Tax Revenue: 2.80% | ||||||||||||||||
Hillside IL Tax Increment Refunding Bond | 5.00 | 1-1-2030 | 1,345,000 | 1,353,890 | ||||||||||||
Illinois Sports Facilities Authority State Tax Supported CAB (Ambac Insured) ¤ | 0.00 | 6-15-2025 | 1,140,000 | 947,522 | ||||||||||||
| 2,301,412 | ||||||||||||||||
|
| |||||||||||||||
| 13,545,306 | ||||||||||||||||
|
| |||||||||||||||
Kansas: 3.34% |
| |||||||||||||||
| Health Revenue: 1.20% | ||||||||||||||||
Kansas State Development Finance Authority Revenue Bond Series A | 5.25 | 11-15-2033 | 1,000,000 | 985,780 | ||||||||||||
|
| |||||||||||||||
| Tax Revenue: 2.14% | ||||||||||||||||
Wyandotte County & Kansas City KS Special Obligation Improvement & Refunding Bonds Plaza Redevelopment Project | 4.00 | 12-1-2028 | 605,000 | 575,016 | ||||||||||||
Wyandotte County & Kansas City KS Special Obligation Vacation Village Project Area 4 Major Multi-Sport Athletic Complex Project CAB Series 2015 144A¤ | 0.00 | 9-1-2034 | 2,895,000 | 1,183,389 | ||||||||||||
| 1,758,405 | ||||||||||||||||
|
| |||||||||||||||
| 2,744,185 | ||||||||||||||||
|
| |||||||||||||||
The accompanying notes are an integral part of these financial statements.
Wells Fargo High Yield Municipal Bond Fund | 13
Portfolio of investments—June 30, 2020
| Interest rate | Maturity date | Principal | Value | |||||||||||||
| Kentucky: 1.09% | ||||||||||||||||
| Health Revenue: 1.09% | ||||||||||||||||
Kentucky EDFA Rosedale Green Project Refunding Bond | 5.50 | % | 11-15-2035 | $ | 1,000,000 | $ | 897,350 | |||||||||
|
| |||||||||||||||
Maryland: 1.34% |
| |||||||||||||||
| Education Revenue: 1.34% | ||||||||||||||||
Prince George’s County MD Chesapeake Lighthouse Charter School Project Series 2016-A 144A | 6.90 | 8-1-2041 | 1,000,000 | 1,104,070 | ||||||||||||
|
| |||||||||||||||
Michigan: 6.98% |
| |||||||||||||||
| Education Revenue: 0.53% | ||||||||||||||||
Michigan Public Educational Facilities Authority Limited Obligation Bradford Academy Project 144A | 6.50 | 9-1-2037 | 185,000 | 144,300 | ||||||||||||
Michigan Public Educational Facilities Authority Limited Obligation Crescent Academy Project | 7.00 | 10-1-2036 | 292,500 | 292,766 | ||||||||||||
| 437,066 | ||||||||||||||||
|
| |||||||||||||||
| GO Revenue: 1.05% | ||||||||||||||||
Wayne County MI Building Improvement Series A | 6.75 | 11-1-2039 | 860,000 | 861,548 | ||||||||||||
|
| |||||||||||||||
| Miscellaneous Revenue: 3.02% | ||||||||||||||||
Charyl Stockwell Academy Michigan Public School Refunding Bond | 4.88 | 10-1-2023 | 270,000 | 272,684 | ||||||||||||
Michigan Finance Authority Local Government Loan Program City of Detroit Financial Recovery Refunding Bond Series F | 4.50 | 10-1-2029 | 1,000,000 | 1,048,620 | ||||||||||||
Michigan Municipal Bond Authority Local Government Loan Program Series C (Ambac Insured) | 4.75 | 5-1-2027 | 950,000 | 950,342 | ||||||||||||
Michigan Public Educational Facilities Authority Chandler Park Academy Project | 6.35 | 11-1-2028 | 210,000 | 210,458 | ||||||||||||
| 2,482,104 | ||||||||||||||||
|
| |||||||||||||||
| Tax Revenue: 2.38% | ||||||||||||||||
Detroit MI Downtown Development Authority CAB ¤## | 0.00 | 7-1-2020 | 285,000 | 285,000 | ||||||||||||
Detroit MI Downtown Development Authority CAB ¤ | 0.00 | 7-1-2021 | 170,000 | 162,178 | ||||||||||||
Detroit MI Downtown Development Authority CAB ¤ | 0.00 | 7-1-2024 | 20,000 | 16,214 | ||||||||||||
Detroit MI Downtown Development Authority CAB ¤ | 0.00 | 7-1-2025 | 580,000 | 443,764 | ||||||||||||
Michigan Finance Authority Local Government Loan Program Public Lighting Authority Refunding Bonds Series B | 5.00 | 7-1-2044 | 1,000,000 | 1,053,050 | ||||||||||||
| 1,960,206 | ||||||||||||||||
|
| |||||||||||||||
| 5,740,924 | ||||||||||||||||
|
| |||||||||||||||
Minnesota: 1.91% |
| |||||||||||||||
| Education Revenue: 0.39% | ||||||||||||||||
Deephaven MN Charter School Eagle Ridge Academy Project Series 2015-A | 4.40 | 7-1-2025 | 105,000 | 108,931 | ||||||||||||
Deephaven MN Charter School Eagle Ridge Academy Project Series 2015-A | 5.00 | 7-1-2030 | 195,000 | 210,811 | ||||||||||||
| 319,742 | ||||||||||||||||
|
| |||||||||||||||
| Health Revenue: 0.60% | ||||||||||||||||
Shakopee MN Senior Housing Revenue Benedictine Living Community LLC Project 144A | 5.85 | 11-1-2058 | 500,000 | 489,675 | ||||||||||||
|
| |||||||||||||||
| Housing Revenue: 0.92% | ||||||||||||||||
Minneapolis MN Student Housing Riverton Community Housing Project Refunding Bond | 4.70 | 8-1-2026 | 335,000 | 345,777 | ||||||||||||
The accompanying notes are an integral part of these financial statements.
14 | Wells Fargo High Yield Municipal Bond Fund
Portfolio of investments—June 30, 2020
| Interest rate | Maturity date | Principal | Value | |||||||||||||
| Housing Revenue (continued) | ||||||||||||||||
Minneapolis MN Student Housing Riverton Community Housing Project Refunding Bond | 4.80 | % | 8-1-2027 | $ | 400,000 | $ | 412,532 | |||||||||
| 758,309 | ||||||||||||||||
|
| |||||||||||||||
| 1,567,726 | ||||||||||||||||
|
| |||||||||||||||
Mississippi: 1.86% |
| |||||||||||||||
| Resource Recovery Revenue: 1.86% | ||||||||||||||||
Mississippi Business Finance Corporation AMT Waste Pro USA Incorporated Project 144A | 5.00 | 2-1-2036 | 1,500,000 | 1,532,010 | ||||||||||||
|
| |||||||||||||||
Missouri: 1.44% |
| |||||||||||||||
| Tax Revenue: 1.44% | ||||||||||||||||
Blue Springs MO Special Obligation Tax Improvement & Refunding Bonds Adams Farm Project Series A | 4.00 | 6-1-2026 | 395,000 | 384,031 | ||||||||||||
Richmond Heights MO Francis Place Redevelopment Project | 5.63 | 11-1-2025 | 800,000 | 798,296 | ||||||||||||
| 1,182,327 | ||||||||||||||||
|
| |||||||||||||||
New Jersey: 3.75% |
| |||||||||||||||
| GO Revenue: 1.32% | ||||||||||||||||
Newark NJ Qualified General Improvement Series A | 5.00 | 7-15-2027 | 1,000,000 | 1,089,810 | ||||||||||||
|
| |||||||||||||||
| Industrial Development Revenue: 0.31% | ||||||||||||||||
New Jersey EDA Continental Airlines Incorporated Project | 5.25 | 9-15-2029 | 250,000 | 254,720 | ||||||||||||
|
| |||||||||||||||
| Transportation Revenue: 2.12% | ||||||||||||||||
New Jersey TTFA CAB Series A ¤ | 0.00 | 12-15-2031 | 1,000,000 | 655,560 | ||||||||||||
New Jersey TTFA Series C | 5.25 | 6-15-2032 | 1,000,000 | 1,087,030 | ||||||||||||
| 1,742,590 | ||||||||||||||||
|
| |||||||||||||||
| 3,087,120 | ||||||||||||||||
|
| |||||||||||||||
New York: 4.21% |
| |||||||||||||||
| Education Revenue: 2.46% | ||||||||||||||||
Hempstead Town NY Local Development Corporation The Academy Charter School Project Series A %% | 5.73 | 2-1-2050 | 1,000,000 | 1,002,140 | ||||||||||||
Hempstead Town NY Local Development Corporation The Academy Charter School Project Series A | 7.65 | 2-1-2044 | 980,000 | 1,020,856 | ||||||||||||
| 2,022,996 | ||||||||||||||||
|
| |||||||||||||||
| Tax Revenue: 1.51% | ||||||||||||||||
New York Dormitory Authority Series A Group 4 | 5.00 | 3-15-2045 | 1,000,000 | 1,238,360 | ||||||||||||
|
| |||||||||||||||
| Utilities Revenue: 0.24% | ||||||||||||||||
Green Island NY Power Authority Power System ## | 6.00 | 12-15-2020 | 200,000 | 200,810 | ||||||||||||
|
| |||||||||||||||
| 3,462,166 | ||||||||||||||||
|
| |||||||||||||||
Ohio: 1.35% |
| |||||||||||||||
| Tobacco Revenue: 1.35% | ||||||||||||||||
Buckeye OH Tobacco Settlement Financing Authority CAB ¤ | 0.00 | 6-1-2057 | 8,000,000 | 1,110,560 | ||||||||||||
|
| |||||||||||||||
The accompanying notes are an integral part of these financial statements.
Wells Fargo High Yield Municipal Bond Fund | 15
Portfolio of investments—June 30, 2020
| Interest rate | Maturity date | Principal | Value | |||||||||||||
| Oregon: 0.66% | ||||||||||||||||
| Health Revenue: 0.66% | ||||||||||||||||
Polk County OR Hospital Facility Authority Revenue Bond Dallas Retirement Village Project Series 2015-A | 5.00 | % | 7-1-2025 | $ | 550,000 | $ | 543,312 | |||||||||
|
| |||||||||||||||
Pennsylvania: 7.41% |
| |||||||||||||||
| Education Revenue: 3.71% | ||||||||||||||||
Allegheny County PA IDA Propel Charter School Sunrise Project | 5.25 | 7-15-2023 | 75,000 | 77,042 | ||||||||||||
East Hempfield Township PA IDA Student Services Incorporated Student Housing Project of Millersville University | 5.00 | 7-1-2029 | 500,000 | 506,680 | ||||||||||||
Montgomery County PA Higher Education & Health Authority Arcadia University | 5.00 | 4-1-2026 | 1,655,000 | 1,805,638 | ||||||||||||
Philadelphia PA IDA Independence Charter School Project | 5.00 | 6-15-2039 | 250,000 | 253,988 | ||||||||||||
Philadelphia PA IDA Tacony Academy Charter School Project | 6.88 | 6-15-2033 | 375,000 | 405,930 | ||||||||||||
| 3,049,278 | ||||||||||||||||
|
| |||||||||||||||
| Health Revenue: 1.04% | ||||||||||||||||
Quakertown PA General Authority Health LifeQuest Obligated Group Refunding Bond Series C | 5.30 | 7-1-2042 | 1,000,000 | 855,390 | ||||||||||||
|
| |||||||||||||||
| Industrial Development Revenue: 1.43% | ||||||||||||||||
Pennsylvania EDFA Carbonlite P LLC Project 144A | 5.75 | 6-1-2036 | 1,250,000 | 1,175,488 | ||||||||||||
|
| |||||||||||||||
| Miscellaneous Revenue: 1.23% | ||||||||||||||||
Chester County PA IDA Woodlands at Graystone Project Series 2018 144A | 5.13 | 3-1-2048 | 1,049,000 | 1,015,044 | ||||||||||||
|
| |||||||||||||||
| 6,095,200 | ||||||||||||||||
|
| |||||||||||||||
South Carolina: 3.05% |
| |||||||||||||||
| Education Revenue: 0.79% | ||||||||||||||||
South Carolina Jobs EDA York Preparatory Academy Project Series A | 5.75 | 11-1-2023 | 105,000 | 108,315 | ||||||||||||
South Carolina Jobs EDA York Preparatory Academy Project Series A | 7.25 | 11-1-2045 | 500,000 | 542,260 | ||||||||||||
| 650,575 | ||||||||||||||||
|
| |||||||||||||||
| Health Revenue: 1.17% | ||||||||||||||||
South Carolina Jobs EDA Residential Facilities Revenue Episcopal Home Still Hopes Refunding Bond Series A | 5.00 | 4-1-2048 | 1,000,000 | 960,780 | ||||||||||||
|
| |||||||||||||||
| Resource Recovery Revenue: 1.09% | ||||||||||||||||
South Carolina Jobs EDA | 8.00 | 12-6-2029 | 100,000 | 94,813 | ||||||||||||
South Carolina Jobs EDA Solid Waste Disposal AMT RePower South Berkeley LLC Project Green Bond 144A | 6.25 | 2-1-2045 | 1,000,000 | 799,550 | ||||||||||||
| 894,363 | ||||||||||||||||
|
| |||||||||||||||
| 2,505,718 | ||||||||||||||||
|
| |||||||||||||||
Tennessee: 1.26% |
| |||||||||||||||
| Tax Revenue: 1.26% | ||||||||||||||||
Bristol TN Industrial Development Board Sales Tax CAB Series B 144A¤ | 0.00 | 12-1-2031 | 1,000,000 | 517,340 | ||||||||||||
Nashville TN Metropolitan Development & Housing Agency Tax Increment Fifth & Broadway Development Project 144A | 5.13 | 6-1-2036 | 500,000 | 514,940 | ||||||||||||
| 1,032,280 | ||||||||||||||||
|
| |||||||||||||||
The accompanying notes are an integral part of these financial statements.
16 | Wells Fargo High Yield Municipal Bond Fund
Portfolio of investments—June 30, 2020
| Interest rate | Maturity date | Principal | Value | |||||||||||||
| Texas: 5.38% | ||||||||||||||||
| Education Revenue: 1.67% | ||||||||||||||||
Arlington TX Higher Education Finance Corporation Universal Academy Series A | 7.00 | % | 3-1-2034 | $ | 320,000 | $ | 346,381 | |||||||||
Pottsboro TX Higher Education Finance Corporation Imagine International Academy of North Texas Series A | 3.88 | 8-15-2026 | 1,015,000 | 1,030,174 | ||||||||||||
| 1,376,555 | ||||||||||||||||
|
| |||||||||||||||
| GO Revenue: 1.34% | ||||||||||||||||
Port Isabel TX 144A | 5.10 | 2-15-2049 | 995,000 | 1,103,266 | ||||||||||||
|
| |||||||||||||||
| Miscellaneous Revenue: 0.59% | ||||||||||||||||
Lewisville TX Combination Contract Castle Hills Public Improvement Bonds District #6 144A | 5.50 | 9-1-2039 | 500,000 | 486,810 | ||||||||||||
|
| |||||||||||||||
| Resource Recovery Revenue: 1.22% | ||||||||||||||||
Port Arthur TX Navigation District Jefferson County Environmental Facilities Motiva Enterprises LLC Project Series B ø | 0.90 | 4-1-2040 | 1,000,000 | 1,000,000 | ||||||||||||
|
| |||||||||||||||
| Transportation Revenue: 0.28% | ||||||||||||||||
Texas Private Activity Bond Surface Transportation Corporation Project NTE Mobility Partners Segments LLC | 7.00 | 12-31-2038 | 200,000 | 229,178 | ||||||||||||
|
| |||||||||||||||
| Utilities Revenue: 0.28% | ||||||||||||||||
Texas Gas Supply SA Energy Acquisition Public Facilities Corporation | 5.50 | 8-1-2027 | 190,000 | 231,958 | ||||||||||||
|
| |||||||||||||||
| 4,427,767 | ||||||||||||||||
|
| |||||||||||||||
Utah: 1.22% |
| |||||||||||||||
| Education Revenue: 1.22% | ||||||||||||||||
Utah Finance Authority Charter School Revenue Spectrum Academy Project 144A | 5.00 | 4-15-2030 | 1,000,000 | 1,000,310 | ||||||||||||
|
| |||||||||||||||
Virginia: 1.38% |
| |||||||||||||||
| Health Revenue: 1.38% | ||||||||||||||||
Roanoke VA EDA Residential Care Richfield Living | 5.13 | 9-1-2055 | 1,210,000 | 1,130,769 | ||||||||||||
|
| |||||||||||||||
Washington: 0.31% |
| |||||||||||||||
| Health Revenue: 0.31% | ||||||||||||||||
Skagit County WA Public Hospital District #1 Skagit Valley Hospital Project | 5.25 | 12-1-2025 | 250,000 | 255,115 | ||||||||||||
|
| |||||||||||||||
West Virginia: 1.88% |
| |||||||||||||||
| Tax Revenue: 1.88% | ||||||||||||||||
Monongalia County WV Commission Improvement & Refunding Bonds University Town Center Series A 144A | 5.75 | 6-1-2043 | 1,500,000 | 1,548,195 | ||||||||||||
|
| |||||||||||||||
Wisconsin: 5.11% |
| |||||||||||||||
| Education Revenue: 3.43% | ||||||||||||||||
Wisconsin PFA Charter School Voyager Funding Incorporated Project Series A | 4.13 | 10-1-2024 | 175,000 | 184,090 | ||||||||||||
Wisconsin PFA Coral Academy Science Las Vegas Series A | 5.00 | 7-1-2024 | 305,000 | 323,431 | ||||||||||||
Wisconsin PFA Research Triangle High School Project Series 2015-A 144A | 5.63 | 7-1-2045 | 1,000,000 | 1,017,610 | ||||||||||||
Wisconsin PFA Wilson Preparatory Academy Series A 144A | 5.00 | 6-15-2039 | 1,285,000 | 1,293,507 | ||||||||||||
| 2,818,638 | ||||||||||||||||
|
| |||||||||||||||
The accompanying notes are an integral part of these financial statements.
Wells Fargo High Yield Municipal Bond Fund | 17
Portfolio of investments—June 30, 2020
| Interest rate | Maturity date | Principal | Value | |||||||||||||
| Health Revenue: 1.68% | ||||||||||||||||
Wisconsin HEFA Wisconsin Illinois Senior Housing Incorporated Series 2018-A | 5.25 | % | 8-1-2048 | $ | 1,500,000 | $ | 1,380,420 | |||||||||
|
| |||||||||||||||
| 4,199,058 | ||||||||||||||||
|
| |||||||||||||||
Total Municipal Obligations (Cost $79,283,125) |
| 81,381,042 | ||||||||||||||
|
| |||||||||||||||
| Yield | Shares | |||||||||||||||
| Short-Term Investments: 0.85% | ||||||||||||||||
| Investment Companies: 0.85% | ||||||||||||||||
Wells Fargo Municipal Cash Management Money Market Fund Institutional Class (l)(u)## | 0.10 | 699,264 | 699,474 | |||||||||||||
|
| |||||||||||||||
Total Short-Term Investments (Cost $699,436) |
| 699,474 | ||||||||||||||
|
| |||||||||||||||
| Total investments in securities (Cost $79,982,561) | 99.82 | % | 82,080,516 | |||||
Other assets and liabilities, net | 0.18 | 148,653 | ||||||
|
|
|
| |||||
| Total net assets | 100.00 | % | $ | 82,229,169 | ||||
|
|
|
| |||||
| ¤ | The security is issued in zero coupon form with no periodic interest payments. |
| 144A | The security may be resold in transactions exempt from registration, normally to qualified institutional buyers, pursuant to Rule 144A under the Securities Act of 1933. |
| ## | All or a portion of this security is segregated for when-issued securities. |
| %% | The security is purchased on a when-issued basis. |
| ø | Variable rate demand notes are subject to a demand feature which reduces the effective maturity. The maturity date shown represents the final maturity date of the security. The interest rate is determined and reset by the issuer daily, weekly, or monthly depending upon the terms of the security. The rate shown is the rate in effect at period end. |
| (l) | The issuer of the security is an affiliated person of the Fund as defined in the Investment Company Act of 1940. |
| (u) | The rate represents the 7-day annualized yield at period end. |
Abbreviations:
| AGM | Assured Guaranty Municipal |
| Ambac | Ambac Financial Group Incorporated |
| AMT | Alternative minimum tax |
| BAM | Build America Mutual Assurance Company |
| CAB | Capital appreciation bond |
| CCAB | Convertible capital appreciation bond |
| EDA | Economic Development Authority |
| EDFA | Economic Development Finance Authority |
| GO | General obligation |
| HEFA | Health & Educational Facilities Authority |
| IDA | Industrial Development Authority |
| National | National Public Finance Guarantee Corporation |
| PFA | Public Finance Authority |
| RDA | Redevelopment Authority |
| TTFA | Transportation Trust Fund Authority |
The accompanying notes are an integral part of these financial statements.
18 | Wells Fargo High Yield Municipal Bond Fund
Portfolio of investments—June 30, 2020
Investments in Affiliates
An affiliated investment is an investment in which the Fund owns at least 5% of the outstanding voting shares of the issuer or as a result of other relationships, such as the Fund and the issuer having the same investment manager. Transactions with issuers that were either affiliated persons of the Fund at the beginning of the period or the end of the period were as follows:
| Value, beginning of period | Purchases | Sales proceeds | Net realized gains (losses) | Net change in unrealized gains (losses) | Income from affiliated securities | Value, end of period | % of net assets | |||||||||||||||||||||||||
| Short-Term Investments | ||||||||||||||||||||||||||||||||
Investment Companies | ||||||||||||||||||||||||||||||||
Wells Fargo Municipal Cash Management Money Market Fund Institutional Class | $ | 1,934,050 | $ | 47,574,394 | $ | (48,808,800 | ) | $ | (199 | ) | $ | 29 | $ | 10,182 | $ | 699,474 | 0.85 | % | ||||||||||||||
The accompanying notes are an integral part of these financial statements.
Wells Fargo High Yield Municipal Bond Fund | 19
Statement of assets and liabilities—June 30, 2020
Assets | ||||
Investments in unaffiliated securities, at value (cost $79,283,125) | $ | 81,381,042 | ||
Investments in affiliated securities, at value (cost $699,436) | 699,474 | |||
Receivable for investments sold | 150,000 | |||
Receivable for Fund shares sold | 82,784 | |||
Receivable for interest | 1,082,481 | |||
Prepaid expenses and other assets | 38,630 | |||
|
| |||
Total assets | 83,434,411 | |||
|
| |||
Liabilities | ||||
Payable for investments purchased | 1,000,000 | |||
Payable for Fund shares redeemed | 96,389 | |||
Overdraft due to custodian bank | 33,693 | |||
Management fee payable | 10,103 | |||
Dividends payable | 20,714 | |||
Administration fees payable | 7,736 | |||
Distribution fee payable | 5,664 | |||
Trustees’ fees and expenses payable | 3,860 | |||
Accrued expenses and other liabilities | 27,083 | |||
|
| |||
Total liabilities | 1,205,242 | |||
|
| |||
Total net assets | $ | 82,229,169 | ||
|
| |||
Net assets consist of | ||||
Paid-in capital | $ | 80,697,365 | ||
Total distributable earnings | 1,531,804 | |||
|
| |||
Total net assets | $ | 82,229,169 | ||
|
| |||
Computation of net asset value and offering price per share | ||||
Net assets – Class A | $ | 24,790,816 | ||
Shares outstanding – Class A1 | 2,375,946 | |||
Net asset value per share – Class A | $10.43 | |||
Maximum offering price per share – Class A2 | $10.92 | |||
Net assets – Class C | $ | 9,249,832 | ||
Shares outstanding – Class C1 | 886,382 | |||
Net asset value per share – Class C | $10.44 | |||
Net assets – Class R6 | $ | 24,597 | ||
Shares outstanding – Class R61 | 2,356 | |||
Net asset value per share – Class R6 | $10.44 | |||
Net assets – Administrator Class | $ | 11,114,937 | ||
Shares outstanding – Administrator Class1 | 1,064,916 | |||
Net asset value per share – Administrator Class | $10.44 | |||
Net assets – Institutional Class | $ | 37,048,987 | ||
Shares outstanding – Institutional Class1 | 3,551,070 | |||
Net asset value per share – Institutional Class | $10.43 | |||
| 1 | The Fund has an unlimited number of authorized shares. |
| 2 | Maximum offering price is computed as 100/95.50 of net asset value. On investments of $50,000 or more, the offering price is reduced. |
The accompanying notes are an integral part of these financial statements.
20 | Wells Fargo High Yield Municipal Bond Fund
Statement of operations—year ended June 30, 2020
Investment income | ||||
Interest | $ | 5,525,356 | ||
Income from affiliated securities | 10,182 | |||
|
| |||
Total investment income | 5,535,538 | |||
|
| |||
Expenses | ||||
Management fee | 575,729 | |||
Administration fees |
| |||
Class A | 39,993 | |||
Class C | 15,702 | |||
Class R6 | 7 | |||
Administrator Class | 13,483 | |||
Institutional Class | 53,463 | |||
Shareholder servicing fees |
| |||
Class A | 62,489 | |||
Class C | 24,528 | |||
Administrator Class | 33,660 | |||
Distribution fee |
| |||
Class C | 73,589 | |||
Custody and accounting fees | 17,177 | |||
Professional fees | 52,888 | |||
Registration fees | 89,360 | |||
Shareholder report expenses | 38,391 | |||
Trustees’ fees and expenses | 21,541 | |||
Other fees and expenses | 10,666 | |||
|
| |||
Total expenses | 1,122,666 | |||
Less: Fee waivers and/or expense reimbursements |
| |||
Fund-level | (260,135 | ) | ||
Class A | (23,980 | ) | ||
Class C | (8,868 | ) | ||
Class R6 | (1 | ) | ||
Administrator Class | (17,577 | ) | ||
|
| |||
Net expenses | 812,105 | |||
|
| |||
Net investment income | 4,723,433 | |||
|
| |||
Realized and unrealized gains (losses) on investments | ||||
Net realized losses on |
| |||
Unaffiliated securities | (115,408 | ) | ||
Affiliated securities | (199 | ) | ||
|
| |||
Net realized losses on investments | (115,607 | ) | ||
|
| |||
Net change in unrealized gains (losses) on |
| |||
Unaffiliated securities | (5,492,818 | ) | ||
Affiiliated securities | 29 | |||
|
| |||
Net change in unrealized gains (losses) on investments | (5,492,789 | ) | ||
|
| |||
Net realized and unrealized gains (losses) on investments | (5,608,396 | ) | ||
|
| |||
Net decrease in net assets resulting from operations | $ | (884,963 | ) | |
|
| |||
The accompanying notes are an integral part of these financial statements.
Wells Fargo High Yield Municipal Bond Fund | 21
Statement of changes in net assets
| Year ended June 30, 2020 | Year ended June 30, 2019 | |||||||||||||||
Operations | ||||||||||||||||
Net investment income | $ | 4,723,433 | $ | 4,885,724 | ||||||||||||
Net realized gains (losses) on investments | (115,607 | ) | 724,011 | |||||||||||||
Net change in unrealized gains (losses) on investments | (5,492,789 | ) | 3,956,531 | |||||||||||||
|
| |||||||||||||||
Net increase (decrease) in net assets resulting from operations | (884,963 | ) | 9,566,266 | |||||||||||||
|
| |||||||||||||||
Distributions to shareholders from net investment income and net realized gains | ||||||||||||||||
Class A | (1,016,115 | ) | (748,569 | ) | ||||||||||||
Class C | (324,379 | ) | (267,644 | ) | ||||||||||||
Class R6 | (1,113 | ) | (908 | )1 | ||||||||||||
Administrator Class | (557,564 | ) | (717,353 | ) | ||||||||||||
Institutional Class | (2,837,133 | ) | (3,150,417 | ) | ||||||||||||
|
| |||||||||||||||
Total distributions to shareholders | (4,736,304 | ) | (4,884,891 | ) | ||||||||||||
|
| |||||||||||||||
Capital share transactions | Shares | Shares | ||||||||||||||
Proceeds from shares sold |
| |||||||||||||||
Class A | 1,136,030 | 12,292,528 | 891,097 | 9,469,553 | ||||||||||||
Class C | 151,588 | 1,643,335 | 326,023 | 3,467,080 | ||||||||||||
Class R6 | 0 | 0 | 2,356 | 1 | 25,000 | 1 | ||||||||||
Administrator Class | 339,763 | 3,572,890 | 509,916 | 5,419,801 | ||||||||||||
Institutional Class | 2,083,511 | 22,719,379 | 3,781,572 | 40,041,514 | ||||||||||||
|
| |||||||||||||||
| 40,228,132 | 58,422,948 | |||||||||||||||
|
| |||||||||||||||
Reinvestment of distributions |
| |||||||||||||||
Class A | 89,770 | 969,449 | 66,476 | 710,565 | ||||||||||||
Class C | 29,127 | 314,674 | 24,085 | 257,291 | ||||||||||||
Administrator Class | 35,739 | 388,413 | 53,338 | 568,370 | ||||||||||||
Institutional Class | 255,191 | 2,782,732 | 280,408 | 2,994,965 | ||||||||||||
|
| |||||||||||||||
| 4,455,268 | 4,531,191 | |||||||||||||||
|
| |||||||||||||||
Payment for shares redeemed |
| |||||||||||||||
Class A | (1,007,385 | ) | (10,751,077 | ) | (413,546 | ) | (4,406,588 | ) | ||||||||
Class C | (201,418 | ) | (2,168,643 | ) | (282,977 | ) | (3,004,602 | ) | ||||||||
Administrator Class | (741,308 | ) | (8,002,341 | ) | (1,457,134 | ) | (15,416,580 | ) | ||||||||
Institutional Class | (6,551,028 | ) | (70,457,229 | ) | (3,433,887 | ) | (36,431,467 | ) | ||||||||
|
| |||||||||||||||
| (91,379,290 | ) | (59,259,237 | ) | |||||||||||||
|
| |||||||||||||||
Net increase (decrease) in net assets resulting from capital share transactions | (46,695,890 | ) | 3,694,902 | |||||||||||||
|
| |||||||||||||||
Total increase (decrease) in net assets | (52,317,157 | ) | 8,376,277 | |||||||||||||
|
| |||||||||||||||
Net assets | ||||||||||||||||
Beginning of period | 134,546,326 | 126,170,049 | ||||||||||||||
|
| |||||||||||||||
End of period | $ | 82,229,169 | $ | 134,546,326 | ||||||||||||
|
| |||||||||||||||
| 1 | For the period from July 31, 2018 (commencement of class operations) to June 30, 2019 |
The accompanying notes are an integral part of these financial statements.
22 | Wells Fargo High Yield Municipal Bond Fund
(For a share outstanding throughout each period)
| Year ended June 30 | ||||||||||||||||||||
| CLASS A | 2020 | 2019 | 2018 | 2017 | 2016 | |||||||||||||||
Net asset value, beginning of period | $10.97 | $10.59 | $10.37 | $10.91 | $10.34 | |||||||||||||||
Net investment income | 0.44 | 0.39 | 0.40 | 0.37 | 0.35 | |||||||||||||||
Net realized and unrealized gains (losses) on investments | (0.54 | ) | 0.38 | 0.22 | (0.46 | ) | 0.60 | |||||||||||||
|
|
|
|
|
|
|
|
|
| |||||||||||
Total from investment operations | (0.10 | ) | 0.77 | 0.62 | (0.09 | ) | 0.95 | |||||||||||||
Distributions to shareholders from | ||||||||||||||||||||
Net investment income | (0.44 | ) | (0.39 | ) | (0.40 | ) | (0.37 | ) | (0.35 | ) | ||||||||||
Net realized gains | 0.00 | 0.00 | 0.00 | (0.08 | ) | (0.03 | ) | |||||||||||||
|
|
|
|
|
|
|
|
|
| |||||||||||
Total distributions to shareholders | (0.44 | ) | (0.39 | ) | (0.40 | ) | (0.45 | ) | (0.38 | ) | ||||||||||
Net asset value, end of period | $10.43 | $10.97 | $10.59 | $10.37 | $10.91 | |||||||||||||||
Total return1 | (0.98 | )% | 7.43 | % | 6.11 | % | (0.76 | )% | 9.44 | % | ||||||||||
Ratios to average net assets (annualized) | ||||||||||||||||||||
Gross expenses | 1.12 | % | 1.09 | % | 1.07 | % | 1.06 | % | 1.07 | % | ||||||||||
Net expenses | 0.80 | % | 0.80 | % | 0.85 | % | 0.85 | % | 0.85 | % | ||||||||||
Net investment income | 4.05 | % | 3.68 | % | 3.82 | % | 3.51 | % | 3.28 | % | ||||||||||
Supplemental data | ||||||||||||||||||||
Portfolio turnover rate | 14 | % | 20 | % | 50 | % | 82 | % | 61 | % | ||||||||||
Net assets, end of period (000s omitted) | $24,791 | $23,674 | $17,086 | $20,305 | $38,018 | |||||||||||||||
| 1 | Total return calculations do not include any sales charges. |
The accompanying notes are an integral part of these financial statements.
Wells Fargo High Yield Municipal Bond Fund | 23
Financial highlights
(For a share outstanding throughout each period)
| Year ended June 30 | ||||||||||||||||||||
| CLASS C | 2020 | 2019 | 2018 | 2017 | 2016 | |||||||||||||||
Net asset value, beginning of period | $10.97 | $10.59 | $10.37 | $10.91 | $10.34 | |||||||||||||||
Net investment income | 0.36 | 0.31 | 0.32 | 0.29 | 0.27 | |||||||||||||||
Net realized and unrealized gains (losses) on investments | (0.53 | ) | 0.38 | 0.22 | (0.46 | ) | 0.60 | |||||||||||||
|
|
|
|
|
|
|
|
|
| |||||||||||
Total from investment operations | (0.17 | ) | 0.69 | 0.54 | (0.17 | ) | 0.87 | |||||||||||||
Distributions to shareholders from | ||||||||||||||||||||
Net investment income | (0.36 | ) | (0.31 | ) | (0.32 | ) | (0.29 | ) | (0.27 | ) | ||||||||||
Net realized gains | 0.00 | 0.00 | 0.00 | (0.08 | ) | (0.03 | ) | |||||||||||||
|
|
|
|
|
|
|
|
|
| |||||||||||
Total distributions to shareholders | (0.36 | ) | (0.31 | ) | (0.32 | ) | (0.37 | ) | (0.30 | ) | ||||||||||
Net asset value, end of period | $10.44 | $10.97 | $10.59 | $10.37 | $10.91 | |||||||||||||||
Total return1 | (1.63 | )% | 6.63 | % | 5.32 | % | (1.50 | )% | 8.62 | % | ||||||||||
Ratios to average net assets (annualized) | ||||||||||||||||||||
Gross expenses | 1.87 | % | 1.84 | % | 1.82 | % | 1.81 | % | 1.82 | % | ||||||||||
Net expenses | 1.55 | % | 1.55 | % | 1.60 | % | 1.60 | % | 1.60 | % | ||||||||||
Net investment income | 3.29 | % | 2.91 | % | 3.09 | % | 2.79 | % | 2.49 | % | ||||||||||
Supplemental data | ||||||||||||||||||||
Portfolio turnover rate | 14 | % | 20 | % | 50 | % | 82 | % | 61 | % | ||||||||||
Net assets, end of period (000s omitted) | $9,250 | $9,955 | $8,896 | $8,709 | $10,573 | |||||||||||||||
| 1 | Total return calculations do not include any sales charges. |
The accompanying notes are an integral part of these financial statements.
24 | Wells Fargo High Yield Municipal Bond Fund
Financial highlights
(For a share outstanding throughout each period)
Year ended June 30 | ||||||||
| CLASS R6 | 2020 | 20191 | ||||||
Net asset value, beginning of period | $10.98 | $10.61 | ||||||
Net investment income | 0.47 | 0.39 | ||||||
Net realized and unrealized gains (losses) on investments | (0.54 | ) | 0.37 | |||||
|
|
|
| |||||
Total from investment operations | (0.07 | ) | 0.76 | |||||
Distributions to shareholders from | ||||||||
Net investment income | (0.47 | ) | (0.39 | ) | ||||
Net asset value, end of period | $10.44 | $10.98 | ||||||
Total return2 | (0.68 | )% | 7.29 | % | ||||
Ratios to average net assets (annualized) | ||||||||
Gross expenses | 0.73 | % | 0.71 | % | ||||
Net expenses | 0.50 | % | 0.50 | % | ||||
Net investment income | 4.34 | % | 3.96 | % | ||||
Supplemental data | ||||||||
Portfolio turnover rate | 14 | % | 20 | % | ||||
Net assets, end of period (000s omitted) | $25 | $26 | ||||||
| 1 | For the period from July 31, 2018 (commencement of class operations) to June 30, 2019 |
| 2 | Returns for periods of less than one year are not annualized. |
The accompanying notes are an integral part of these financial statements.
Wells Fargo High Yield Municipal Bond Fund | 25
Financial highlights
(For a share outstanding throughout each period)
| Year ended June 30 | ||||||||||||||||||||
| ADMINISTRATOR CLASS | 2020 | 2019 | 2018 | 2017 | 2016 | |||||||||||||||
Net asset value, beginning of period | $10.98 | $10.59 | $10.37 | $10.92 | $10.34 | |||||||||||||||
Net investment income | 0.45 | 0.40 | 0.41 | 0.38 | 0.36 | |||||||||||||||
Net realized and unrealized gains (losses) on investments | (0.54 | ) | 0.39 | 0.22 | (0.47 | ) | 0.61 | |||||||||||||
|
|
|
|
|
|
|
|
|
| |||||||||||
Total from investment operations | (0.09 | ) | 0.79 | 0.63 | (0.09 | ) | 0.97 | |||||||||||||
Distributions to shareholders from | ||||||||||||||||||||
Net investment income | (0.45 | ) | (0.40 | ) | (0.41 | ) | (0.38 | ) | (0.36 | ) | ||||||||||
Net realized gains | 0.00 | 0.00 | 0.00 | (0.08 | ) | (0.03 | ) | |||||||||||||
|
|
|
|
|
|
|
|
|
| |||||||||||
Total distributions to shareholders | (0.45 | ) | (0.40 | ) | (0.41 | ) | (0.46 | ) | (0.39 | ) | ||||||||||
Net asset value, end of period | $10.44 | $10.98 | $10.59 | $10.37 | $10.92 | |||||||||||||||
Total return | (0.87 | )% | 7.64 | % | 6.21 | % | (0.75 | )% | 9.65 | % | ||||||||||
Ratios to average net assets (annualized) | ||||||||||||||||||||
Gross expenses | 1.05 | % | 1.03 | % | 1.01 | % | 1.00 | % | 1.00 | % | ||||||||||
Net expenses | 0.70 | % | 0.71 | % | 0.75 | % | 0.75 | % | 0.75 | % | ||||||||||
Net investment income | 4.12 | % | 3.69 | % | 3.93 | % | 3.60 | % | 3.39 | % | ||||||||||
Supplemental data | ||||||||||||||||||||
Portfolio turnover rate | 14 | % | 20 | % | 50 | % | 82 | % | 61 | % | ||||||||||
Net assets, end of period (000s omitted) | $11,115 | $15,704 | $24,627 | $22,839 | $25,179 | |||||||||||||||
The accompanying notes are an integral part of these financial statements.
26 | Wells Fargo High Yield Municipal Bond Fund
Financial highlights
(For a share outstanding throughout each period)
| Year ended June 30 | ||||||||||||||||||||
| INSTITUTIONAL CLASS | 2020 | 2019 | 2018 | 2017 | 2016 | |||||||||||||||
Net asset value, beginning of period | $10.97 | $10.59 | $10.37 | $10.91 | $10.34 | |||||||||||||||
Net investment income | 0.46 | 0.42 | 0.43 | 0.40 | 0.38 | |||||||||||||||
Net realized and unrealized gains (losses) on investments | (0.53 | ) | 0.38 | 0.22 | (0.46 | ) | 0.60 | |||||||||||||
|
|
|
|
|
|
|
|
|
| |||||||||||
Total from investment operations | (0.07 | ) | 0.80 | 0.65 | (0.06 | ) | 0.98 | |||||||||||||
Distributions to shareholders from | ||||||||||||||||||||
Net investment income | (0.47 | ) | (0.42 | ) | (0.43 | ) | (0.40 | ) | (0.38 | ) | ||||||||||
Net realized gains | 0.00 | 0.00 | 0.00 | (0.08 | ) | (0.03 | ) | |||||||||||||
|
|
|
|
|
|
|
|
|
| |||||||||||
Total distributions to shareholders | (0.47 | ) | (0.42 | ) | (0.43 | ) | (0.48 | ) | (0.41 | ) | ||||||||||
Net asset value, end of period | $10.43 | $10.97 | $10.59 | $10.37 | $10.91 | |||||||||||||||
Total return | (0.74 | )% | 7.70 | % | 6.37 | % | (0.51 | )% | 9.71 | % | ||||||||||
Ratios to average net assets (annualized) | ||||||||||||||||||||
Gross expenses | 0.78 | % | 0.76 | % | 0.74 | % | 0.73 | % | 0.74 | % | ||||||||||
Net expenses | 0.55 | % | 0.55 | % | 0.60 | % | 0.60 | % | 0.60 | % | ||||||||||
Net investment income | 4.24 | % | 3.92 | % | 4.09 | % | 3.82 | % | 3.58 | % | ||||||||||
Supplemental data | ||||||||||||||||||||
Portfolio turnover rate | 14 | % | 20 | % | 50 | % | 82 | % | 61 | % | ||||||||||
Net assets, end of period (000s omitted) | $37,049 | $85,187 | $75,560 | $73,989 | $67,867 | |||||||||||||||
The accompanying notes are an integral part of these financial statements.
Wells Fargo High Yield Municipal Bond Fund | 27
1. ORGANIZATION
Wells Fargo Funds Trust (the “Trust”), a Delaware statutory trust organized on March 10, 1999, is an open-end management investment company registered under the Investment Company Act of 1940, as amended (the “1940 Act”). As an investment company, the Trust follows the accounting and reporting guidance in Financial Accounting Standards Board (“FASB”) Accounting Standards Codification Topic 946, Financial Services – Investment Companies. These financial statements report on the Wells Fargo High Yield Municipal Bond Fund (the “Fund”) which is a diversified series of the Trust.
2. SIGNIFICANT ACCOUNTING POLICIES
The following significant accounting policies, which are consistently followed in the preparation of the financial statements of the Fund, are in conformity with U.S. generally accepted accounting principles which require management to make estimates and assumptions that affect the reported amounts of assets and liabilities, disclosure of contingent assets and liabilities at the date of the financial statements, and the reported amounts of revenues and expenses during the reporting period. Actual results could differ from those estimates.
Securities valuation
All investments are valued each business day as of the close of regular trading on the New York Stock Exchange (generally 4 p.m. Eastern Time), although the Fund may deviate from this calculation time under unusual or unexpected circumstances.
Debt securities are valued at the evaluated bid price provided by an independent pricing service (e.g. taking into account various factors, including yields, maturities, or credit ratings) or, if a reliable price is not available, the quoted bid price from an independent broker-dealer.
Investments in registered open-end investment companies are valued at net asset value.
Investments which are not valued using any of the methods discussed above are valued at their fair value, as determined in good faith by the Board of Trustees of the Fund. The Board of Trustees has established a Valuation Committee comprised of the Trustees and has delegated to it the authority to take any actions regarding the valuation of portfolio securities that the Valuation Committee deems necessary or appropriate, including determining the fair value of portfolio securities, unless the determination has been delegated to the Wells Fargo Asset Management Pricing Committee at Wells Fargo Funds Management, LLC (“Funds Management”). The Board of Trustees retains the authority to make or ratify any valuation decisions or approve any changes to the Valuation Procedures as it deems appropriate. On a quarterly basis, the Board of Trustees receives reports on any valuation actions taken by the Valuation Committee or the Wells Fargo Asset Management Pricing Committee which may include items for ratification.
When-issued transactions
The Fund may purchase securities on a forward commitment or when-issued basis. The Fund records a when-issued transaction on the trade date and will segregate assets in an amount at least equal in value to the Fund’s commitment to purchase when-issued securities. Securities purchased on a when-issued basis are marked-to-market daily and the Fund begins earning interest on the settlement date. Losses may arise due to changes in the market value of the underlying securities or if the counterparty does not perform under the contract.
Security transactions and income recognition
Securities transactions are recorded on a trade date basis. Realized gains or losses are recorded on the basis of identified cost.
Interest income is accrued daily and bond discounts are accreted and premiums are amortized daily. To the extent debt obligations are placed on non-accrual status, any related interest income may be reduced by writing off interest receivables when the collection of all or a portion of interest has been determined to be doubtful based on consistently applied procedures and the fair value has decreased. If the issuer subsequently resumes interest payments or when the collectability of interest is reasonably assured, the debt obligation is removed from non-accrual status.
Distributions to shareholders
Distributions to shareholders from net investment income are declared daily and paid monthly. Distributions from net realized gains, if any, are recorded on the ex-dividend date and paid at least annually. Such distributions are determined in accordance with income tax regulations and may differ from U.S. generally accepted accounting principles. Dividend sources are estimated at the time of declaration. The tax character of distributions is determined as of the Fund’s fiscal year end. Therefore, a portion of the Fund’s distributions made prior to the Fund’s fiscal year end may be categorized as a tax return of capital at year end.
28 | Wells Fargo High Yield Municipal Bond Fund
Notes to financial statements
Federal and other taxes
The Fund intends to continue to qualify as a regulated investment company by distributing substantially all of its investment company taxable and tax-exempt income and any net realized capital gains (after reduction for capital loss carryforwards) sufficient to relieve it from all, or substantially all, federal income taxes. Accordingly, no provision for federal income taxes was required.
The Fund’s income and federal excise tax returns and all financial records supporting those returns for the prior three fiscal years are subject to examination by the federal and Delaware revenue authorities. Management has analyzed the Fund’s tax positions taken on federal, state, and foreign tax returns for all open tax years and does not believe that there are any uncertain tax positions that require recognition of a tax liability.
As of June 30, 2020, the aggregate cost of all investments for federal income tax purposes was $79,982,561 and the unrealized gains (losses) consisted of:
Gross unrealized gains | $ | 3,131,303 | ||
Gross unrealized losses | (1,033,348 | ) | ||
Net unrealized gains | $ | 2,097,955 | ||
As of June 30, 2020, the Fund had capital loss carryforwards which consist of $46,096 in short-term capital losses and $502,345 in long-term capital losses.
Class allocations
The separate classes of shares offered by the Fund differ principally in applicable sales charges, distribution, shareholder servicing, and administration fees. Class specific expenses are charged directly to that share class. Investment income, common fund-level expenses, and realized and unrealized gains (losses) on investments are allocated daily to each class of shares based on the relative proportion of net assets of each class.
3. FAIR VALUATION MEASUREMENTS
Fair value measurements of investments are determined within a framework that has established a fair value hierarchy based upon the various data inputs utilized in determining the value of the Fund’s investments. The three-level hierarchy gives the highest priority to unadjusted quoted prices in active markets for identical assets or liabilities (Level 1) and the lowest priority to unobservable inputs (Level 3). The Fund’s investments are classified within the fair value hierarchy based on the lowest level of input that is significant to the fair value measurement. The inputs are summarized into three broad levels as follows:
| ∎ | Level 1 – quoted prices in active markets for identical securities |
| ∎ | Level 2 – other significant observable inputs (including quoted prices for similar securities, interest rates, prepayment speeds, credit risk, etc.) |
| ∎ | Level 3 – significant unobservable inputs (including the Fund’s own assumptions in determining the fair value of investments) |
The inputs or methodologies used for valuing investments in securities are not necessarily an indication of the risk associated with investing in those securities.
The following is a summary of the inputs used in valuing the Fund’s assets and liabilities as of June 30, 2020:
| Quoted prices (Level 1) | Other significant observable inputs (Level 2) | Significant (Level 3) | Total | |||||||||||||
Assets | ||||||||||||||||
Investments in: | ||||||||||||||||
Municipal obligations | $ | 0 | $ | 81,381,042 | $ | 0 | $ | 81,381,042 | ||||||||
Short-term investments | ||||||||||||||||
Investment companies | 699,474 | 0 | 0 | 699,474 | ||||||||||||
Total assets | $ | 699,474 | $ | 81,381,042 | $ | 0 | $ | 82,080,516 | ||||||||
Additional sector, industry or geographic detail is included in the Portfolio of Investments.
For the year ended June 30, 2020, the Fund did not have any transfers into/out of Level 3.
Wells Fargo High Yield Municipal Bond Fund | 29
Notes to financial statements
4. TRANSACTIONS WITH AFFILIATES
Funds Management, an indirect wholly owned subsidiary of Wells Fargo & Company (“Wells Fargo”), is the manager of the Fund and provides advisory and fund-level administrative services under an investment management agreement. Under the investment management agreement, Funds Management is responsible for, among other services, implementing the investment objectives and strategies of the Fund, supervising the subadviser and providing fund-level administrative services in connection with the Fund’s operations. As compensation for its services under the investment management agreement, Funds Management is entitled to receive a management fee at the following annual rate based on the Fund’s average daily net assets:
| Average daily net assets | Management fee | |||
First $500 million | 0.500 | % | ||
Next $500 million | 0.475 | |||
Next $2 billion | 0.450 | |||
Next $2 billion | 0.425 | |||
Next $5 billion | 0.390 | |||
Over $10 billion | 0.380 | |||
For the year ended June 30, 2020, the management fee was equivalent to an annual rate of 0.50% of the Fund’s average daily net assets.
Funds Management has retained the services of a subadviser to provide daily portfolio management to the Fund. The fee for subadvisory services is borne by Funds Management. Wells Capital Management Incorporated, an affiliate of Funds Management and an indirect wholly owned subsidiary of Wells Fargo, is the subadviser to the Fund and is entitled to receive a fee from Funds Management at an annual rate starting at 0.35% and declining to 0.20% as the average daily net assets of the Fund increase.
Administration fees
Under a class-level administration agreement, Funds Management provides class-level administrative services to the Fund, which includes paying fees and expenses for services provided by the transfer agent, sub-transfer agents, omnibus account servicers and record-keepers. As compensation for its services under the class-level administration agreement, Funds Management receives an annual fee which is calculated based on the average daily net assets of each class as follows:
| Class-level administration fee | ||||
Class A, Class C | 0.16 | % | ||
Class R6 | 0.03 | |||
Administrator Class | 0.10 | |||
Institutional Class | 0.08 | |||
Waivers and/or expense reimbursements
Funds Management has contractually waived and/or reimbursed management and administration fees to the extent necessary to maintain certain net operating expense ratios for the Fund. When each class of the Fund has exceeded its expense cap, Funds Management has waived fees and/or reimbursed expenses from fund-level expenses on a proportionate basis and then from class specific expenses. When only certain classes exceed their expense caps, waivers and/or reimbursements are applied against class specific expenses before fund-level expenses. Funds Management has committed through October 31, 2020 to waive fees and/or reimburse expenses to the extent necessary to cap the Fund’s expenses at 0.80% for Class A shares, 1.55% for Class C shares, 0.50% for Class R6 shares, 0.70% for Administrator Class shares, and 0.55% for Institutional Class shares. Prior to or after the commitment expiration date, the cap may be increased or the commitment to maintain the cap may be terminated only with the approval of the Board of Trustees.
Distribution fee
The Trust has adopted a distribution plan for Class C shares of the Fund pursuant to Rule 12b-1 under the 1940 Act. A distribution fee is charged to Class C shares and paid to Wells Fargo Funds Distributor, LLC (“Funds Distributor”), the principal underwriter, at an annual rate of 0.75% of the average daily net assets of Class C shares.
30 | Wells Fargo High Yield Municipal Bond Fund
Notes to financial statements
In addition, Funds Distributor is entitled to receive the front-end sales charge from the purchase of Class A shares and a contingent deferred sales charge on the redemption of certain Class A shares. Funds Distributor is also entitled to receive the contingent deferred sales charges from redemptions of Class C shares. For the year ended June 30, 2020, Funds Distributor received $5,967 from the sale of Class A shares and $143 in contingent deferred sales charges from redemptions of Class C. No contingent deferred sales charges were incurred by Class A shares for the year ended June 30, 2020.
Shareholder servicing fees
The Trust has entered into contracts with one or more shareholder servicing agents, whereby Class A, Class C, and Administrator Class of the Fund are charged a fee at an annual rate of 0.25% of the average daily net assets of each respective class. A portion of these total shareholder servicing fees were paid to affiliates of Wells Fargo.
Interfund transactions
The Fund may purchase or sell portfolio investment securities to certain other Wells Fargo affiliates pursuant to Rule 17a-7 under the 1940 Act and under procedures adopted by the Board of Trustees. The procedures have been designed to ensure that these interfund transactions, which do not incur broker commissions, are effected at current market prices. Pursuant to these procedures, the Fund had $21,105,000 and $23,405,000 in interfund purchases and sales, respectively, during the year ended June 30, 2020.
5. INVESTMENT PORTFOLIO TRANSACTIONS
Purchases and sales of investments, excluding U.S. government obligations (if any) and short-term securities, for the year ended June 30, 2020 were $15,231,723 and $59,462,634, respectively.
6. BANK BORROWINGS
The Trust (excluding the money market funds), Wells Fargo Master Trust and Wells Fargo Variable Trust are parties to a $350,000,000 revolving credit agreement whereby the Fund is permitted to use bank borrowings for temporary or emergency purposes, such as to fund shareholder redemption requests. Interest under the credit agreement is charged to the Fund based on a borrowing rate equal to the higher of the Federal Funds rate in effect on that day plus 1.25% or the overnight LIBOR rate in effect on that day plus 1.25%. In addition, an annual commitment fee equal to 0.25% of the unused balance is allocated to each participating fund.
For the year ended June 30, 2020, there were no borrowings by the Fund under the agreement.
7. DISTRIBUTIONS TO SHAREHOLDERS
The tax character of distributions paid was $4,736,304 and $4,884,891 of tax-exempt income for the years ended June 30, 2020 and June 30, 2019, respectively.
As of June 30, 2020, the components of distributable earnings on a tax basis were as follows:
Undistributed tax-exempt income | Unrealized gains | Capital loss carryforward | ||
| $3,004 | $2,097,955 | $(548,441) | ||
8. INDEMNIFICATION
Under the Fund’s organizational documents, the officers and Trustees have been granted certain indemnification rights against certain liabilities that may arise out of performance of their duties to the Fund. The Fund has entered into a separate agreement with each Trustee that converts indemnification rights currently existing under the Fund’s organizational documents into contractual rights that cannot be changed in the future without the consent of the Trustee. Additionally, in the normal course of business, the Fund may enter into contracts with service providers that contain a variety of indemnification clauses. The Fund’s maximum exposure under these arrangements is dependent on future claims that may be made against the Fund and, therefore, cannot be estimated.
9. NEW ACCOUNTING PRONOUNCEMENT
In August 2018, FASB issued Accounting Standards Update (“ASU”) No. 2018-13, Fair Value Measurement (Topic 820) Disclosure Framework—Changes to the Disclosure Requirements for Fair Value Measurement. ASU 2018-13 updates the disclosure requirements on fair value measurements in Topic 820, Fair Value Measurements. The amendments are effective for fiscal years, and interim periods within those fiscal years, beginning after December 15, 2019. Management has adopted this guidance which did not have a material impact on the financial statements.
Wells Fargo High Yield Municipal Bond Fund | 31
Notes to financial statements
10. CORONAVIRUS (COVID-19) PANDEMIC
On March 11, 2020, the World Health Organization announced that it had made the assessment that coronavirus disease 2019 (“COVID-19”) is a pandemic. The impacts of COVID-19 are adversely affecting the entire global economy, individual companies and investment products, and the market in general. There is significant uncertainty around the extent and duration of business disruptions related to COVID-19 and the impacts may be short term or may last for an extended period of time. The risk of further spreading of COVID-19 has led to significant uncertainty and volatility in the financial markets.
32 | Wells Fargo High Yield Municipal Bond Fund
Report of independent registered public accounting firm
To the Shareholders of the Fund and Board of Trustees
Wells Fargo Funds Trust:
Opinion on the Financial Statements
We have audited the accompanying statement of assets and liabilities of Wells Fargo High Yield Municipal Bond Fund (the Fund), one of the funds constituting Wells Fargo Funds Trust, including the portfolio of investments, as of June 30, 2020, the related statement of operations for the year then ended, the statements of changes in net assets for each of the years in the two-year period then ended, and the related notes (collectively, the financial statements) and the financial highlights for each of the years or periods in the five-year period then ended. In our opinion, the financial statements and financial highlights present fairly, in all material respects, the financial position of the Fund as of June 30, 2020, the results of its operations for the year then ended, the changes in its net assets for each of the years in the two-year period then ended, and the financial highlights for each of the years or periods in the five-year period then ended, in conformity with U.S. generally accepted accounting principles.
Basis for Opinion
These financial statements and financial highlights are the responsibility of the Fund’s management. Our responsibility is to express an opinion on these financial statements and financial highlights based on our audits. We are a public accounting firm registered with the Public Company Accounting Oversight Board (United States) (PCAOB) and are required to be independent with respect to the Fund in accordance with the U.S. federal securities laws and the applicable rules and regulations of the Securities and Exchange Commission and the PCAOB.
We conducted our audits in accordance with the standards of the PCAOB. Those standards require that we plan and perform the audit to obtain reasonable assurance about whether the financial statements and financial highlights are free of material misstatement, whether due to error or fraud. Our audits included performing procedures to assess the risks of material misstatement of the financial statements and financial highlights, whether due to error or fraud, and performing procedures that respond to those risks. Such procedures included examining, on a test basis, evidence regarding the amounts and disclosures in the financial statements and financial highlights. Such procedures also included confirmation of securities owned as of June 30, 2020, by correspondence with the custodian, transfer agent and brokers, or by other appropriate auditing procedures. Our audits also included evaluating the accounting principles used and significant estimates made by management, as well as evaluating the overall presentation of the financial statements and financial highlights. We believe that our audits provide a reasonable basis for our opinion.

We have not been able to determine the specific year that we began serving as the auditor of one or more Wells Fargo Funds investment companies; however we are aware that we have served as the auditor of one or more Wells Fargo Funds investment companies since at least 1955.
Boston, Massachusetts
August 29, 2020
Wells Fargo High Yield Municipal Bond Fund | 33
TAX INFORMATION
Pursuant to Section 852 of the Internal Revenue Code, 100% of distributions paid from net investment income is designated as exempt-interest dividends for the fiscal year ended June 30, 2020.
PROXY VOTING INFORMATION
A description of the policies and procedures used to determine how to vote proxies relating to portfolio securities is available, upon request, by calling 1-800-222-8222, visiting our website at wfam.com, or visiting the SEC website at sec.gov. Information regarding how the proxies related to portfolio securities were voted during the most recent 12-month period ended June 30 is available on the website at wfam.com or by visiting the SEC website at sec.gov.
QUARTERLY PORTFOLIO HOLDINGS INFORMATION
The Fund files its complete schedule of portfolio holdings with the SEC for the first and third quarters of each fiscal year as an exhibit to its reports on Form N-PORT. Shareholders may view the filed Form N-PORT by visiting the SEC website at sec.gov.
34 | Wells Fargo High Yield Municipal Bond Fund
Other information (unaudited)
BOARD OF TRUSTEES AND OFFICERS
Each of the Trustees and Officers1 listed in the table below acts in identical capacities for each fund in the Wells Fargo family of funds, which consists of 147 mutual funds comprising the Wells Fargo Funds Trust, Wells Fargo Variable Trust, Wells Fargo Master Trust and four closed-end funds (collectively the “Fund Complex”). This table should be read in conjunction with the Prospectus and the Statement of Additional Information2. The mailing address of each Trustee and Officer is 525 Market Street, 12th Floor, San Francisco, CA 94105. Each Trustee and Officer serves an indefinite term, however, each Trustee serves such term until reaching the mandatory retirement age established by the Trustees.
Independent Trustees
Name and year of birth | Position held and length of service* | Principal occupations during past five years or longer | Current other public company or investment company directorships | |||
William R. Ebsworth (Born 1957) | Trustee, since 2015 | Retired. From 1984 to 2013, equities analyst, portfolio manager, research director and chief investment officer at Fidelity Management and Research Company in Boston, Tokyo, and Hong Kong, and retired in 2013 as Chief Investment Officer of Fidelity Strategic Advisers, Inc. where he led a team of investment professionals managing client assets. Prior thereto, Board member of Hong Kong Securities Clearing Co., Hong Kong Options Clearing Corp., the Thailand International Fund, Ltd., Fidelity Investments Life Insurance Company, and Empire Fidelity Investments Life Insurance Company. Audit Committee Chair and Investment Committee Chair of the Vincent Memorial Hospital Endowment (non-profit organization). Mr. Ebsworth is a CFA® charterholder. | N/A | |||
Jane A. Freeman (Born 1953) | Trustee, since 2015; Chair Liaison, since 2018 | Retired. From 2012 to 2014 and 1999 to 2008, Chief Financial Officer of Scientific Learning Corporation. From 2008 to 2012, Ms. Freeman provided consulting services related to strategic business projects. Prior to 1999, Portfolio Manager at Rockefeller & Co. and Scudder, Stevens & Clark. Board member of the Harding Loevner Funds from 1996 to 2014, serving as both Lead Independent Director and chair of the Audit Committee. Board member of the Russell Exchange Traded Funds Trust from 2011 to 2012 and the chair of the Audit Committee. Ms. Freeman is also an inactive Chartered Financial Analyst. | N/A | |||
Isaiah Harris, Jr. (Born 1952) | Trustee, since 2009; Audit Committee Chairman, since 2019 | Retired. Chairman of the Board of CIGNA Corporation since 2009, and Director since 2005. From 2003 to 2011, Director of Deluxe Corporation. Prior thereto, President and CEO of BellSouth Advertising and Publishing Corp. from 2005 to 2007, President and CEO of BellSouth Enterprises from 2004 to 2005 and President of BellSouth Consumer Services from 2000 to 2003. Emeritus member of the Iowa State University Foundation Board of Governors. Emeritus Member of the Advisory Board of Iowa State University School of Business. Advisory Board Member, Palm Harbor Academy (private school). Advisory Board Member, Child Evangelism Fellowship (non-profit). Mr. Harris is a certified public accountant (inactive status). | CIGNA Corporation | |||
Judith M. Johnson (Born 1949) | Trustee, since 2008; Audit Committee Chairman, from 2009 to 2018 | Retired. Prior thereto, Chief Executive Officer and Chief Investment Officer of Minneapolis Employees Retirement Fund from 1996 to 2008. Ms. Johnson is an attorney, certified public accountant and a certified managerial accountant. | N/A | |||
Wells Fargo High Yield Municipal Bond Fund | 35
Other information (unaudited)
Name and year of birth | Position held and length of service* | Principal occupations during past five years or longer | Current other public company or investment company directorships | |||
David F. Larcker (Born 1950) | Trustee, since 2009 | James Irvin Miller Professor of Accounting at the Graduate School of Business, Stanford University, Director of the Corporate Governance Research Initiative and Senior Faculty of The Rock Center for Corporate Governance since 2006. From 2005 to 2008, Professor of Accounting at the Graduate School of Business, Stanford University. Prior thereto, Ernst & Young Professor of Accounting at The Wharton School, University of Pennsylvania from 1985 to 2005. | N/A | |||
Olivia S. Mitchell (Born 1953) | Trustee, since 2006; Nominating and Governance Committee Chair, since 2018 | International Foundation of Employee Benefit Plans Professor, Wharton School of the University of Pennsylvania since 1993. Director of Wharton’s Pension Research Council and Boettner Center on Pensions & Retirement Research, and Research Associate at the National Bureau of Economic Research. Previously, Cornell University Professor from 1978 to 1993. | N/A | |||
Timothy J. Penny (Born 1951) | Trustee, since 1996; Chairman, since 2018 | President and Chief Executive Officer of Southern Minnesota Initiative Foundation, a non-profit organization, since 2007. Member of the Board of Trustees of NorthStar Education Finance, Inc., a non-profit organization, since 2007. | N/A | |||
James G. Polisson (Born 1959) | Trustee, since 2018 | Retired. Chief Marketing Officer, Source (ETF) UK Services, Ltd, from 2015 to 2017. From 2012 to 2015, Principal of The Polisson Group, LLC, a management consulting, corporate advisory and principal investing company. Chief Executive Officer and Managing Director at Russell Investments, Global Exchange Traded Funds from 2010 to 2012. Managing Director of Barclays Global Investors from 1998 to 2010 and Global Chief Marketing Officer for iShares and Barclays Global Investors from 2000 to 2010. Trustee of the San Francisco Mechanics’ Institute, a non-profit organization, from 2013 to 2015. Board member of the Russell Exchange Traded Fund Trust from 2011 to 2012. Director of Barclays Global Investors Holdings Deutschland GmbH from 2006 to 2009. Mr. Polisson is an attorney and has a retired status with the Massachusetts and District of Columbia Bar Associations. | N/A | |||
Pamela Wheelock (Born 1959) | Trustee, since January 2020; previously Trustee from January 2018 to July 2019 | Board member of the Destination Medical Center Economic Development Agency, Rochester, Minnesota since 2019 and Interim President of the McKnight Foundation since 2020. Acting Commissioner, Minnesota Department of Human Services, July 2019 through September 2019. Human Services Manager (part-time), Minnesota Department of Human Services, October 2019 through December 2019. Chief Operating Officer, Twin Cities Habitat for Humanity from 2017 to 2019. Vice President of University Services, University of Minnesota from 2012 to 2016. Prior thereto, on the Board of Directors, Governance Committee and Finance Committee for the Minnesota Philanthropy Partners (Saint Paul Foundation) from 2012 to 2018, Interim Chief Executive Officer of Blue Cross Blue Shield of Minnesota from 2011 to 2012, Chairman of the Board from 2009 to 2012 and Board Director from 2003 to 2015. Vice President, Leadership and Community Engagement, Bush Foundation, Saint Paul, Minnesota (a private foundation) from 2009 to 2011. Executive Vice President and Chief Financial Officer, Minnesota Sports and Entertainment from 2004 to 2009 and Senior Vice President from 2002 to 2004. Executive Vice President of the Minnesota Wild Foundation from 2004 to 2008. Commissioner of Finance, State of Minnesota, from 1999 to 2002. Currently Board Chair of the Minnesota Wild Foundation since 2010. | N/A | |||
| * | Length of service dates reflect the Trustee’s commencement of service with the Trust’s predecessor entities, where applicable. |
36 | Wells Fargo High Yield Municipal Bond Fund
Other information (unaudited)
Officers
Name and year of birth | Position held and length of service | Principal occupations during past five years or longer | ||
Andrew Owen (Born 1960) | President, since 2017 | Executive Vice President of Wells Fargo & Company and Head of Affiliated Managers, Wells Fargo Asset Management, since 2014. In addition, Mr. Owen is currently President, Chief Executive Officer and Director of Wells Fargo Funds Management, LLC since 2017. Prior thereto, Executive Vice President responsible for marketing, investments and product development for Wells Fargo Funds Management, LLC, from 2009 to 2014. | ||
Nancy Wiser1 (Born 1967) | Treasurer, since 2012 | Executive Vice President of Wells Fargo Funds Management, LLC since 2011. Chief Operating Officer and Chief Compliance Officer at LightBox Capital Management LLC, from 2008 to 2011. | ||
Michelle Rhee (Born 1966) | Chief Legal Officer, since 2019 | Secretary of Wells Fargo Funds Management, LLC, Chief Legal Counsel of Wells Fargo Asset Management and Assistant General Counsel of Wells Fargo Bank, N.A. since 2018. Associate General Counsel and Managing Director of Bank of America Corporation from 2004 to 2018. | ||
Catherine Kennedy (Born 1969) | Secretary, since 2019 | Vice President of Wells Fargo Funds Management, LLC and Senior Counsel of the Wells Fargo Legal Department since 2010. Vice President and Senior Counsel of Evergreen Investment Management Company, LLC from 1998 to 2010. | ||
Michael H. Whitaker (Born 1967) | Chief Compliance Officer, since 2016 | Chief Compliance Officer of Wells Fargo Asset Management since 2016. Senior Vice President and Chief Compliance Officer for Fidelity Investments from 2007 to 2016. | ||
David Berardi (Born 1975) | Assistant Treasurer, since 2009 | Vice President of Wells Fargo Funds Management, LLC since 2009. Vice President of Evergreen Investment Management Company, LLC from 2008 to 2010. Manager of Fund Reporting and Control for Evergreen Investment Management Company, LLC from 2004 to 2010. | ||
Jeremy DePalma1 (Born 1974) | Assistant Treasurer, since 2009 | Senior Vice President of Wells Fargo Funds Management, LLC since 2009. Senior Vice President of Evergreen Investment Management Company, LLC from 2008 to 2010 and head of the Fund Reporting and Control Team within Fund Administration from 2005 to 2010. | ||
| 1 | Nancy Wiser acts as Treasurer of 65 funds in the Fund Complex. Jeremy DePalma acts as the Treasurer of 82 funds and Assistant Treasurer of 65 funds in the Fund Complex. |
| 2 | The Statement of Additional Information includes additional information about the Trustees and is available, without charge, upon request, by calling 1-800-222-8222 or by visiting the website at wfam.com. |
Wells Fargo High Yield Municipal Bond Fund | 37
Other information (unaudited)
BOARD CONSIDERATION OF INVESTMENT MANAGEMENT AND SUB-ADVISORY AGREEMENTS:
Wells Fargo High Yield Municipal Bond Fund
Under the Investment Company Act of 1940 (the “1940 Act”), the Board of Trustees (the “Board”) of Wells Fargo Funds Trust (the “Trust”) must determine annually whether to approve the continuation of the Trust’s investment management and sub-advisory agreements. In this regard, at a Board meeting held on May 26, 2020 and May 28, 2020 (together, the “Meeting”), the Board, all the members of which have no direct or indirect interest in the investment management and sub-advisory agreements and are not “interested persons” of the Trust, as defined in the 1940 Act (the “Independent Trustees”), reviewed and approved for Wells Fargo High Yield Municipal Bond Fund (the “Fund”): (i) an investment management agreement (the “Management Agreement”) with Wells Fargo Funds Management, LLC (“Funds Management”); and (ii) an investment sub-advisory agreement (the “Sub-Advisory Agreement”) with Wells Capital Management Incorporated (the “Sub-Adviser”), an affiliate of Funds Management. The Management Agreement and the Sub-Advisory Agreement are collectively referred to as the “Advisory Agreements.”
At the Meeting, the Board considered the factors and reached the conclusions described below relating to the selection of Funds Management and the Sub-Adviser and the approval of the Advisory Agreements. Prior to the Meeting, including at a Board meeting held in April 2020, the Trustees conferred extensively among themselves and with representatives of Funds Management about these matters. Also, the Board has adopted a team-based approach, with each team consisting of a sub-set of Trustees, to assist the full Board in the discharge of its duties in reviewing investment performance and other matters throughout the year. The Independent Trustees were assisted in their evaluation of the Advisory Agreements by independent legal counsel, from whom they received separate legal advice and with whom they met separately.
In providing information to the Board, Funds Management and the Sub-Adviser were guided by a detailed set of requests for information submitted to them by independent legal counsel on behalf of the Independent Trustees at the start of the Board’s annual contract renewal process earlier in 2020. In considering and approving the Advisory Agreements, the Trustees considered the information they believed relevant, including but not limited to the information discussed below. The Board considered not only the specific information presented in connection with the Meeting, but also the knowledge gained over time through interaction with Funds Management and the Sub-Adviser about various topics. In this regard, the Board reviewed reports of Funds Management at each of its quarterly meetings, which included, among other things, portfolio reviews and investment performance reports. In addition, the Board and the teams mentioned above confer with portfolio managers at various times throughout the year. The Board did not identify any particular information or consideration that was all-important or controlling, and each individual Trustee may have attributed different weights to various factors.
After its deliberations, the Board unanimously approved the continuation of the Advisory Agreements for a one-year term and determined that the compensation payable to Funds Management and the Sub-Adviser under each of the Advisory Agreements was reasonable. The Board considered the approval of the Advisory Agreements for the Fund as part of its consideration of agreements for funds across the complex, but its approvals were made on a fund-by-fund basis. The following summarizes a number of important, but not necessarily all, factors considered by the Board in support of its approvals.
Nature, extent and quality of services
The Board received and considered various information regarding the nature, extent and quality of services provided to the Fund by Funds Management and the Sub-Adviser under the Advisory Agreements. This information included a description of the investment advisory services and Fund-level administrative services covered by the Management Agreement, as well as, among other things, a summary of the background and experience of senior management of Wells Fargo Asset Management (“WFAM”), of which Funds Management and the Sub-Adviser are a part, and a summary of investments made in the business of WFAM. The Board also received a description of Funds Management’s and the Sub-Adviser’s business continuity plans and of their approaches to data privacy and cybersecurity, and related testing. The Board also received and reviewed information about Funds Management’s role as administrator of the Fund’s liquidity risk management program, Funds Management’s approach to risk management, and Funds Management’s intermediary and vendor oversight program.
The Board also considered the qualifications, background, tenure and responsibilities of each of the portfolio managers primarily responsible for the day-to-day portfolio management of the Fund. The Board evaluated the ability of Funds Management and the Sub-Adviser to attract and retain qualified investment professionals, including research, advisory and supervisory personnel. The Board further considered the compliance programs and compliance records of Funds Management and the Sub-Adviser. In addition, the Board took into account the full range of services provided to the Fund by Funds Management and its affiliates.
38 | Wells Fargo High Yield Municipal Bond Fund
Other information (unaudited)
Fund investment performance and expenses
The Board considered the investment performance results for the Fund over various time periods ended December 31, 2019. The Board also considered more current results for various time periods ended March 31, 2020. The Board considered these results in comparison to the investment performance of funds in a universe that was determined by Broadridge Inc. (“Broadridge”) to be similar to the Fund (the “Universe”), and in comparison to the Fund’s benchmark index and to other comparative data. Broadridge is an independent provider of investment company data. The Board received a description of the methodology used by Broadridge to select the mutual funds in the performance Universe. The Board noted that the investment performance of the Fund (Administrator Class) was higher than the average investment performance of the Universe for the one-, three- and five-year periods ended December 31, 2019. The Board also noted that the investment performance of the Fund (Administrator Class) was higher than the average investment performance of the Universe for the three- and five-year periods ended March 31, 2020, and lower than the average investment performance of the Universe for the one-year period ended March 31, 2020. The Board also noted that the investment performance of the Fund was higher than or in range of its benchmark index, the High Yield Municipal Bond Blended Index, for all periods ended December 31, 2019. The Board also noted that the investment performance of the Fund was in range of its benchmark index, the High Yield Municipal Bond Blended Index, for the three-year period ended March 31, 2020, and lower than its benchmark index for the one- and five-year periods ended March 31, 2020.
The Board also received and considered information regarding the Fund’s net operating expense ratios and their various components, including actual management fees, custodian and other non-management fees, and Rule 12b-1 and non-Rule 12b-1 shareholder service fees. The Board considered these ratios in comparison to the median ratios of funds in class-specific expense groups that were determined by Broadridge to be similar to the Fund (the “Groups”). The Board received a description of the methodology used by Broadridge to select the mutual funds in the expense Groups and an explanation of how funds comprising expense groups and their expense ratios may vary from year-to-year. Based on the Broadridge reports, the Board noted that the net operating expense ratios of the Fund were lower than or equal to the median net operating expense ratios of the expense Groups for each share class.
The Board took into account the Fund’s investment performance and expense information provided to it among the factors considered in deciding to re-approve the Advisory Agreements.
Investment management and sub-advisory fee rates
The Board reviewed and considered the contractual fee rates payable by the Fund to Funds Management under the Management Agreement, as well as the contractual fee rates payable by the Fund to Funds Management for class-level administrative services under a Class-Level Administration Agreement, which include, among other things, class-level transfer agency and sub-transfer agency costs (collectively, the “Management Rates”). The Board also reviewed and considered the contractual investment sub-advisory fee rates that are payable by Funds Management to the Sub-Adviser for investment sub-advisory services.
Among other information reviewed by the Board was a comparison of the Fund’s Management Rates with the average contractual investment management fee rates of funds in the expense Groups at a common asset level as well as transfer agency costs of the funds in the expense Groups. The Board noted that the Management Rates of the Fund were lower than or in range of the sum of these average rates for the Fund’s expense Groups for all share classes.
The Board also received and considered information about the portion of the total management fee that was retained by Funds Management after payment of the fee to the Sub-Adviser for sub-advisory services. In assessing the reasonableness of this amount, the Board received and evaluated information about the nature and extent of responsibilities retained and risks assumed by Funds Management and not delegated to or assumed by the Sub-Adviser, and about Funds Management’s on-going oversight services. Given the affiliation between Funds Management and the Sub-Adviser, the Board ascribed limited relevance to the allocation of fees between them.
The Board also received and considered information about the nature and extent of services offered and fee rates charged by Funds Management and the Sub-Adviser to other types of clients with investment strategies similar to those of the Fund. In this regard, the Board received information about the significantly greater scope of services, and compliance, reporting and other legal burdens and risks of managing proprietary mutual funds compared with those associated with managing assets of other types of clients, including third-party sub-advised fund clients and non-mutual fund clients such as institutional separate accounts.
Based on its consideration of the factors and information it deemed relevant, including those described here, the Board determined that the compensation payable to Funds Management under the Management Agreement and to the Sub-Adviser under the Sub-Advisory Agreement was reasonable.
Wells Fargo High Yield Municipal Bond Fund | 39
Other information (unaudited)
Profitability
The Board received and considered information concerning the profitability of Funds Management, as well as the profitability of both WFAM and Wells Fargo & Co. (“Wells Fargo”) from providing services to the fund family as a whole. The Board noted that the Sub-Adviser’s profitability information with respect to providing services to the Fund and other funds in the family was subsumed in the WFAM and Wells Fargo profitability analysis.
Funds Management reported on the methodologies and estimates used in calculating profitability, including a description of the methodology used to allocate certain expenses. Among other things, the Board noted that the levels of profitability reported on a fund-by-fund basis varied widely, depending on factors such as the size, type and age of fund.
Based on its review, the Board did not deem the profits reported by Funds Management, WFAM or Wells Fargo from services provided to the Fund to be at a level that would prevent it from approving the continuation of the Advisory Agreements.
Economies of scale
The Board received and considered information about the potential for Funds Management to experience economies of scale in the provision of management services to the Fund, the difficulties of calculating economies of scale at an individual fund level, and the extent to which potential scale benefits are shared with shareholders. The Board noted the existence of breakpoints in the Fund’s management fee structure, which operate generally to reduce the Fund’s expense ratios as the Fund grows in size, and the size of the Fund in relation to such breakpoints. The Board considered that in addition to management fee breakpoints, Funds Management shares potential economies of scale from its management business in a variety of ways, including through fee waiver and expense reimbursement arrangements, services that benefit shareholders, competitive management fee rates set at the outset without regard to breakpoints, and investments in the business intended to enhance services available to shareholders.
The Board concluded that Funds Management’s arrangements with respect to the Fund, including contractual breakpoints, constituted a reasonable approach to sharing potential economies of scale with the Fund and its shareholders.
Other benefits to Funds Management and the Sub-Adviser
The Board received and considered information regarding potential “fall-out” or ancillary benefits received by Funds Management and its affiliates, including the Sub-Adviser, as a result of their relationships with the Fund. Ancillary benefits could include, among others, benefits directly attributable to other relationships with the Fund and benefits potentially derived from an increase in Funds Management’s and the Sub-Adviser’s business as a result of their relationships with the Fund. The Board noted that various affiliates of Funds Management may receive distribution-related fees, shareholder servicing payments and sub-transfer agency fees in respect of shares sold or held through them and services provided.
The Board also reviewed information about soft dollar credits earned and utilized by the Sub-Adviser, fees earned by Funds Management and the Sub-Adviser from managing a private investment vehicle for the fund family’s securities lending collateral, and commissions earned by an affiliated broker from portfolio transactions.
Based on its consideration of the factors and information it deemed relevant, including those described here, the Board did not find that any ancillary benefits received by Funds Management and its affiliates, including the Sub-Adviser, were unreasonable.
Conclusion
At the Meeting, after considering the above-described factors and based on its deliberations and its evaluation of the information described above, the Board unanimously approved the continuation of the Advisory Agreements for a one-year term and determined that the compensation payable to Funds Management and the Sub-Adviser under each of the Advisory Agreements was reasonable.
40 | Wells Fargo High Yield Municipal Bond Fund
Other information (unaudited)
LIQUIDITY RISK MANAGEMENT PROGRAM
In accordance with Rule 22e-4 under the Investment Company Act of 1940, as amended (the “Liquidity Rule”), Wells Fargo Funds Trust (the “Trust”) has adopted and implemented a liquidity risk management program (the “Program”) on behalf of each of its series, including the Fund, which is reasonably designed to assess and manage the Fund’s liquidity risk. “Liquidity risk” is defined as the risk that the Fund is unable to meet redemption requests without significantly diluting remaining investors’ interests in the Fund. The Trust’s Board of Trustees (the “Board”) previously approved the designation of Wells Fargo Funds Management, LLC (“Funds Management”), the Fund’s investment manager, as the administrator of the Program, and Funds Management has established a Liquidity Risk Management Council composed of personnel from multiple departments within Funds Management and its affiliates to assist Funds Management in the implementation and on-going administration of the Program.
The Program is comprised of various components designed to support the assessment and/or management of liquidity risk, including: (1) the periodic assessment (no less frequently than annually) of certain factors that influence the Fund’s liquidity risk; (2) the periodic classification (no less frequently than monthly) of the Fund’s investments into one of four liquidity categories that reflect an estimate of their liquidity under current market conditions; (3) a 15% limit on the acquisition of “illiquid investments” (as defined under the Liquidity Rule); (4) to the extent the Fund does not invest primarily in “highly liquid investments” (as defined under the Liquidity Rule), the determination of a minimum percentage of the Fund’s assets that generally will be invested in highly liquid investments (an “HLIM”); (5) if the Fund has established an HLIM, the periodic review (no less frequently than annually) of the HLIM and the adoption of policies and procedures for responding to a shortfall of the Fund’s “highly liquid investments” below its HLIM; and (6) periodic reporting to the Board.
At a meeting of the Board held on May 26 and 28, 2020, the Board received a written report (the “Report”) from Funds Management that addressed the operation of the Program and assessed its adequacy and effectiveness of implementation. The Report covered the initial period from December 1, 2018 through December 31, 2019 (the “Reporting Period”). No significant liquidity events impacting the Fund were noted in the Report. There were no material changes to the Program during the Reporting Period. The Report concluded that the Program is operating effectively to assess and manage the Fund’s liquidity risk, and that the Program has been and continues to be adequately and effectively implemented to monitor and, as applicable, respond to the Fund’s liquidity developments.
There can be no assurance that the Program will achieve its objectives under all circumstances in the future. Please refer to the Fund’s prospectus for more information regarding the Fund’s exposure to liquidity risk and other risks to which an investment in the Fund may be subject.
Wells Fargo High Yield Municipal Bond Fund | 41
Effective on or after May 1, 2020, clients of Edward Jones (also referred to as “shareholders”) purchasing Fund shares on the Edward Jones commission and fee-based platforms are eligible only for the following sales charge discounts (also referred to as “breakpoints”) and waivers, which can differ from breakpoints and waivers described elsewhere in the Fund’s Prospectus or SAI or through another broker-dealer. In all instances, it is the shareholder’s responsibility to inform Edward Jones at the time of purchase of any relationship, holdings of Wells Fargo Funds or other facts qualifying the purchaser for breakpoints or waivers. Edward Jones can ask for documentation of such circumstance.
| Breakpoints available at Edward Jones |
| Rights of Accumulation (ROA) |
The applicable sales charge on a purchase of Class A shares is determined by taking into account all share classes (except any money market funds and retirement plan share classes) of Wells Fargo Funds held by the shareholder or in an account grouped by Edward Jones with other accounts for the purpose of providing certain pricing considerations (“pricing groups”). This includes all share classes held on the Edward Jones platform and/or held on another platform. The inclusion of eligible fund family assets in the rights of accumulation calculation is dependent on the shareholder notifying his or her financial advisor of such assets at the time of calculation. |
ROA is determined by calculating the higher of cost or market value (current shares x NAV). |
| Letter of Intent (LOI) |
Through a LOI, shareholders can receive the sales charge and breakpoint discounts for purchases shareholders intend to makeover a 13-month period from the date Edward Jones receives the LOI. The LOI is determined by calculating the higher of cost or market value of qualifying holdings at LOI initiation in combination with the value that the shareholder intends to buy over a 13-month period to calculate the front-end sales charge and any breakpoint discounts. Each purchase the shareholder makes during that 13-month period will receive the sales charge and breakpoint discount that applies to the total amount. The inclusion of eligible fund family assets in the LOI calculation is dependent on the shareholder notifying his or her financial advisor of such assets at the time of calculation. Purchases made before the LOI is received by Edward Jones are not covered under the LOI and will not reduce the sales charge previously paid. Sales charges will be adjusted if LOI is not met. |
| Sales charges are waived for the following shareholders and in the following situations at Edward Jones: |
● Associates of Edward Jones and its affiliates and their family members who are in the same pricing group (as determined by Edward Jones under its policies and procedures) as the associate. This waiver will continue for the remainder of the associate’s life if the associate retires from Edward Jones in good-standing. |
● Shares purchased in an Edward Jones fee-based program. |
● Shares purchased through reinvestment of capital gains distributions and dividend reinvestment. |
● Shares purchased from the proceeds of redeemed shares of the same fund family so long as the following conditions are met: 1) the proceeds are from the sale of shares within 60 days of the purchase, and 2) the sale and purchase are made in the same share class and the same account or the purchase is made in an individual retirement account with proceeds from liquidations in anon-retirement account. |
● Shares exchanged into Class A shares from another share class so long as the exchange is into the same fund and was initiated at the discretion of Edward Jones. Edward Jones is responsible for any remaining CDSC due to the fund company, if applicable. Any future purchases are subject to the applicable sales charge as disclosed in the prospectus. |
● Exchanges from Class C shares to Class A shares of the same fund, generally, in the 84th month following the anniversary of the purchase date or earlier at the discretion of Edward Jones. |
| If the shareholder purchases shares that are subject to a CDSC and those shares are redeemed before the CDSC is expired, the shareholder is responsible to pay the CDSC except in the following conditions available at Edward Jones: |
● The death or disability of the shareholder. |
● Systematic withdrawals with up to 10% per year of the account value. |
● Return of excess contributions from an Individual Retirement Account (IRA). |
● Shares sold as part of a required minimum distribution for IRA and retirement accounts if the redemption is taken in or after the year the shareholder reaches qualified age based on applicable IRS regulation. |
● Shares sold to pay Edward Jones fees or costs in such cases where the transaction is initiated by Edward Jones. |
● Shares exchanged in an Edward Jones fee-based program. |
● Shares acquired through NAV reinstatement. |
42 | Wells Fargo High Yield Municipal Bond Fund
Appendix I (unaudited)
| Other Important Information for accounts at Edward Jones: |
| Minimum Purchase Amounts |
● $250 initial purchase minimum |
● $50 subsequent purchase minimum |
| Minimum Balances |
| Edward Jones has the right to redeem at its discretion fund holdings with a balance of $250 or less. The following are examples of accounts that are not included in this policy: |
● A fee-based account held on an Edward Jones platform |
● A 529 account held on an Edward Jones platform |
● An account with an active systematic investment plan or letter of intent (LOI) |
| Changing Share Classes |
| At any time it deems necessary, Edward Jones has the authority to exchange at NAV a shareholder’s holdings in a fund to Class A shares. |
Wells Fargo High Yield Municipal Bond Fund | 43
Effective June 1, 2020, shareholders purchasing Fund shares through an Oppenheimer & Co. Inc. (“Oppenheimer”) platform or account are eligible only for the following load waivers (front-end sales charge waivers and contingent deferred or back-end, sales charge waivers) and discounts, which may differ from those disclosed in the Fund’s Prospectus or SAI.
| Front-end Sales Load Waivers on Class A Shares available at Oppenheimer |
| Employer-sponsored retirement, deferred compensation and employee benefit plans (including health savings accounts) and trusts used to fund those plans, provided that the shares are not held in a commission-based brokerage account and shares are held for the benefit of the plan. |
| Shares purchased by or through a 529 Plan. |
| Shares purchased through an Oppenheimer affiliated investment advisory program. |
| Shares purchased through reinvestment of capital gains distributions and dividend reinvestment when purchasing shares of the same fund (but not any other fund within the fund family). |
| Shares purchased from the proceeds of redemptions within the same fund family, provided (1) the repurchase occurs within 90 days following the redemption, (2) the redemption and purchase occur in the same account, and (3) redeemed shares were subject to a front-end or deferred sales load (known as Rights of Restatement). |
| A shareholder in the Fund’s Class C shares will have their shares exchanged at net asset value to Class A shares (or the appropriate share class) of the Fund if the shares are no longer subject to a CDSC and the exchange is in line with the policies and procedures of Oppenheimer. |
| Employees and registered representatives of Oppenheimer or its affiliates and their family members. |
| Directors or Trustees of the Fund, and employees of the Fund’s investment adviser or any of its affiliates, as described in the Prospectus. |
| CDSC Waivers on A and C Shares available at Oppenheimer |
| Death or disability of the shareholder. |
| Shares sold as part of a systematic withdrawal plan as described in the Prospectus. |
| Return of excess contributions from an IRA Account. |
| Shares sold as part of a required minimum distribution for IRA and retirement accounts due to the shareholder reaching the qualified age based on applicable IRS regulations as described in the Prospectus. |
| Shares sold to pay Oppenheimer fees but only if the transaction is initiated by Oppenheimer. |
| Shares acquired through a right of reinstatement. |
| Front-end load Discounts Available at Oppenheimer: Breakpoints, Rights of Accumulation & Letters of Intent |
| Breakpoints as described in the Prospectus. |
| Rights of Accumulation (ROA), which entitle shareholders to breakpoint discounts, will be automatically calculated based on the aggregated holding of fund family assets held by accounts within the purchaser’s household at Oppenheimer. Eligible fund family assets not held at Oppenheimer may be included in the ROA calculation only if the shareholder notifies his or her financial advisor about such assets. |
44 | Wells Fargo High Yield Municipal Bond Fund
Effective June 15, 2020, shareholders purchasing fund shares through a Robert W. Baird & Co. (“Baird”) platform or account will only be eligible for the following sales charge waivers (front-end sales charge waivers and CDSC waivers) and discounts, which may differ from those disclosed elsewhere in the Fund’s Prospectus or the SAI.
| Front-end Sales Load Waivers on Class A Shares available at Baird |
| Shares purchased through reinvestment of capital gains distributions and dividend reinvestment when purchasing share of the same fund. |
| Share purchase by employees and registers representatives of Baird or its affiliate and their family members as designated by Baird. |
| Shares purchase from the proceeds of redemptions within the same fund family, provided (1) the repurchase occurs within 90 days following the redemption, (2) the redemption and purchase occur in the same accounts, and (3) redeemed shares were subject to a front-end or deferred sales charge (known as rights of reinstatement). |
| A shareholder in the Funds Investor C Shares will have their share exchanged at net asset value to Investor A shares of the fund if the shares are no longer subject to CDSC and the exchange is in line with the policies and procedures of Baird. |
| Employer-sponsored retirement plans or charitable accounts in a transactional brokerage account at Baird, including 401(k) plans, 457 plans, employer-sponsored 403(b) plans, profit sharing and money purchase pension plans and defined benefit plans. For purposes of this provision, employer-sponsored retirement plans do not include SEP IRAs, Simple IRAs or SAR-SEPs. |
| CDSC Waivers on A and C Shares available at Baird |
| Shares sold due to death or disability of the shareholder. |
| Shares sold as part of a systematic withdrawal plan as described in the Fund’s Prospectus. |
| Shares bought due to returns of excess contributions from an IRA Account. |
| Shares sold as part of a required minimum distribution for IRA and retirement accounts due to the shareholder reaching age 72 as described in the Fund’s Prospectus. |
| Shares sold to pay Baird fees but only if the transaction is initiated by Baird. |
| Shares acquired through a right of reinstatement. |
| Front-end load Discounts Available at Baird: Breakpoint and/or Rights of Accumulation |
| Breakpoints as described in the Prospectus. |
| Rights of accumulations which entitles shareholders to breakpoint discounts will be automatically calculated based on the aggregated holding of fund family assets held by accounts within the purchaser’s household at Baird. Eligible fund family assets not held at Baird may be included in the rights of accumulations calculation only if the shareholder notifies his or her financial advisor about such assets. |
| Letters of Intent (LOI) allow for breakpoint discounts based on anticipated purchases within a fund family through Baird, over a 13-month period of time. |
Wells Fargo High Yield Municipal Bond Fund | 45
This page is intentionally left blank.
This page is intentionally left blank.
This page is intentionally left blank.
For more information
More information about Wells Fargo Funds is available free upon request. To obtain literature, please write, visit the Fund’s website, or call:
Wells Fargo Funds
P.O. Box 219967
Kansas City, MO 64121-9967
Website: wfam.com
Individual investors: 1-800-222-8222
Retail investment professionals: 1-888-877-9275
Institutional investment professionals: 1-866-765-0778

This report and the financial statements contained herein are submitted for the general information of the shareholders of the Fund. If this report is used for promotional purposes, distribution of the report must be accompanied or preceded by a current prospectus. Before investing, please consider the investment objectives, risks, charges, and expenses of the investment. For a current prospectus and, if available, a summary prospectus, containing this information, call 1-800-222-8222 or visit the Fund’s website at wfam.com. Read the prospectus carefully before you invest or send money.
Wells Fargo Asset Management (WFAM) is the trade name for certain investment advisory/management firms owned by Wells Fargo & Company. These firms include but are not limited to Wells Capital Management Incorporated and Wells Fargo Funds Management, LLC. Certain products managed by WFAM entities are distributed by Wells Fargo Funds Distributor, LLC (a broker-dealer and Member FINRA).
This material is for general informational and educational purposes only and is NOT intended to provide investment advice or a recommendation of any kind—including a recommendation for any specific investment, strategy, or plan.
INVESTMENT PRODUCTS: NOT FDIC INSURED ◾ NO BANK GUARANTEE ◾ MAY LOSE VALUE
© 2020 Wells Fargo & Company. All rights reserved.
PAR-0720-00242 08-20
A264/AR264 06-20

Annual Report
June 30, 2020
Wells Fargo
Alternative Risk Premia Fund
Beginning on January 1, 2021, as permitted by new regulations adopted by the Securities and Exchange Commission, paper copies of the Wells Fargo Funds’ annual and semi-annual shareholder reports issued after this date will no longer be sent by mail, unless you specifically request paper copies of the reports. Instead, the reports will be made available on the Funds’ website, and you will be notified by mail each time a report is posted and provided with a website address to access the report.
If you already elected to receive shareholder reports electronically, you will not be affected by this change and you need not take any action. You may elect to receive shareholder reports and other communications from the Fund electronically at any time by contacting your financial intermediary (such as a broker-dealer or bank) or, if you are a direct investor, by calling 1-800-222-8222 or by enrolling at wellsfargo.com/advantagedelivery.
You may elect to receive all future reports in paper free of charge. If you invest through a financial intermediary, you can contact your financial intermediary to request that you continue to receive paper copies of your shareholder reports; if you invest directly with the Fund, you can call 1-800-222-8222. Your election to receive reports in paper will apply to all Wells Fargo Funds held in your account with your financial intermediary or, if you are a direct investor, to all Wells Fargo Funds that you hold.
|
Reduce clutter. Save trees. |
Sign up for of prospectuses |
The views expressed and any forward-looking statements are as of June 30, 2020, unless otherwise noted, and are those of the Fund managers and/or Wells Fargo Asset Management. Discussions of individual securities, or the markets generally, or any Wells Fargo Fund are not intended as individual recommendations. Future events or results may vary significantly from those expressed in any forward-looking statements. The views expressed are subject to change at any time in response to changing circumstances in the market. Wells Fargo Asset Management and the Fund disclaim any obligation to publicly update or revise any views expressed or forward-looking statements.
INVESTMENT PRODUCTS: NOT FDIC INSURED ◾ NO BANK GUARANTEE ◾ MAY LOSE VALUE
Wells Fargo Alternative Risk Premia Fund | 1
Letter to shareholders (unaudited)

Andrew Owen
President
Wells Fargo Funds
Dear Shareholder:
We are pleased to offer you this annual report for the Wells Fargo Alternative Risk Premia Fund for the 12-month period that ended June 30, 2020. Global stock markets saw earlier gains erased in February and March as governments around the world took unprecedented measures to stop the spread of the coronavirus at the expense of short-term economic output. However, markets rebounded from April through June to offset much of the losses as central banks attempted to bolster capital markets and confidence. Fixed-income markets generally performed better, with most achieving gains. Overall U.S. markets surpassed their international peers, while U.S. large-cap equity, as measured by the Russell 1000® Index1, easily outperformed small caps, as measured by the Russell 2000® Index2, for the 12-month period.
For the 12-month period, fixed-income securities generally had positive total returns while non-U.S. equities had broad losses and U.S. stocks performed strongly despite sharp volatility since late February. For the period, U.S. stocks, based on the S&P 500 Index,3 gained 7.51%. International stocks, as measured by the MSCI ACWI ex USA Index (Net),4 returned -4.80%, while the MSCI EM Index (Net)5 performed slightly better, with a -3.39% return. For bond investors, the Bloomberg Barclays U.S. Aggregate Bond Index6 returned a robust 8.74%, the Bloomberg Barclays Global Aggregate ex-USD Index7 gained a modest 0.71%, and the Bloomberg Barclays Municipal Bond Index8 returned 4.45% while the ICE BofA U.S. High Yield Index9 lost 1.10%.
The fiscal year began on a positive note.
The 12-month period began with the U.S. equity market advancing to new highs in July 2019. U.S. President Donald Trump initially backed off of earlier tariff threats against Mexico and China. However, later in July, the U.S. reversed course and threatened to impose higher tariffs on China’s exports after talks failed. China responded with tariff threats of its own and devalued the renminbi, roiling global markets. Major U.S. stock market indices closed July with the worst weekly results of the year. Bond prices gained as Treasury yields fell to multiyear lows, and the yield curve inverted at multiple points along the 30-year arc, with shorter term yields higher than longer-term. At the end of July, the U.S. Federal Reserve (Fed) cut its federal funds rate by 0.25%.
In August, U.S.-China trade tensions continued with no signs of compromise. Evidence of a continued global economic slowdown mounted, and central banks in China, New Zealand, and Thailand cut interest rates. Industrial and manufacturing data declined in China,
| 1 | The Russell 1000® Index measures the performance of the 1,000 largest companies in the Russell 3000® Index, which represents approximately 92% of the total market capitalization of the Russell 3000® Index. You cannot invest directly in an index. |
| 2 | The Russell 2000® Index measures the performance of the 2,000 smallest companies in the Russell 3000® Index, which represents approximately 8% of the total market capitalization of the Russell 3000® Index. You cannot invest directly in an index. |
| 3 | The S&P 500 Index consists of 500 stocks chosen for market size, liquidity, and industry group representation. It is a market-value-weighted index with each stock’s weight in the index proportionate to its market value. You cannot invest directly in an index. |
| 4 | The Morgan Stanley Capital International (MSCI) All Country World Index (ACWI) ex USA Index (Net) is a free-float-adjusted market-capitalization-weighted index that is designed to measure the equity market performance of developed and emerging markets, excluding the United States. Source: MSCI. MSCI makes no express or implied warranties or representations and shall have no liability whatsoever with respect to any MSCI data contained herein. The MSCI data may not be further redistributed or used as a basis for other indices or any securities or financial products. This report is not approved, reviewed, or produced by MSCI. You cannot invest directly in an index. |
| 5 | The MSCI Emerging Markets (EM) Index (Net) is a free-float-adjusted market-capitalization-weighted index that is designed to measure equity market performance of emerging markets. You cannot invest directly in an index. |
| 6 | The Bloomberg Barclays U.S. Aggregate Bond Index is a broad-based benchmark that measures the investment-grade, U.S. dollar-denominated, fixed-rate taxable bond market, including Treasuries, government-related and corporate securities, mortgage-backed securities (agency fixed-rate and hybrid adjustable-rate mortgage pass-throughs), asset-backed securities, and commercial mortgage-backed securities. You cannot invest directly in an index. |
| 7 | The Bloomberg Barclays Global Aggregate ex-USD Index is an unmanaged index that provides a broad-based measure of the global investment-grade fixed-income markets excluding the U.S.-dollar-denominated debt market. You cannot invest directly in an index. |
| 8 | The Bloomberg Barclays Municipal Bond Index is an unmanaged index composed of long-term tax-exempt bonds with a minimum credit rating of Baa. You cannot invest directly in an index. |
| 9 | The ICE BofA U.S. High Yield Index is a market-capitalization-weighted index of domestic and Yankee high-yield bonds. The index tracks the performance of high-yield securities traded in the U.S. bond market. You cannot invest directly in an index. Copyright 2020. ICE Data Indices, LLC. All rights reserved. |
2 | Wells Fargo Alternative Risk Premia Fund
Letter to shareholders (unaudited)
Canada, Japan, and Germany. Adding to global uncertainty, Italy’s prime minister resigned, many feared a crackdown in Hong Kong as protestors sustained their calls for reform, and U.K. Prime Minister Boris Johnson planned to suspend Parliament as Brexit’s deadline neared.
In the U.S., the Fed cut interest rates a second time in September. U.S. manufacturing data disappointed investors. The U.S. Congress announced it would pursue an impeachment investigation of President Trump. Meanwhile, the Brexit impasse showed no signs of resolution. Officials in China said that hitting the country’s economic growth goals for the year would be difficult considering the weight of tariffs and trade restrictions. Although the S&P 500 Index finished the third quarter with the best year-to-date returns in more than 20 years, concerns about future returns remained.
The fourth quarter started on a strong note, with U.S.-China trade tensions relaxing in October along with renewed optimism for a U.K. Brexit deal and positive macroeconomic data. The initial estimate of U.S. third-quarter gross domestic product (GDP) growth was a resilient 1.9% annualized rate, while the U.S. unemployment rate fell to a 50-year low of 3.5% in September. However, despite resilience among U.S. consumers, business confidence declined while manufacturing activity contracted. Concerned with a potential economic slowdown, the Fed lowered interest rates another quarter point in late October—its third rate cut in four months. This helped push the S&P 500 Index to a new all-time high while emerging market equities rallied and global bonds declined overall, reflecting a broad pickup in risk appetite.
Equity markets continued to rally in November despite ongoing geopolitical risks. Hopes for a U.S.-China trade deal buoyed investor confidence. U.S. business sentiment improved slightly, and manufacturing and services activity picked up. While consumer confidence and purchasing manager activity rose in the eurozone, China reported weakening manufacturing and consumer data. Bond yields rose marginally, leading to slightly negative returns for global government and investment-grade corporate bonds.
Financial markets ended 2019 with a boost from the U.S. and China accord on a Phase One trade deal. That, along with the landslide win by the pro-Brexit U.K. Conservative Party in a national election and ongoing central bank support, gave investors greater confidence. U.S. economic indicators were generally positive, with the exception of manufacturing activity and business confidence. Consumer confidence was resilient, fed by a robust labor market, tame inflation, and lower interest rates, which boosted housing affordability and stimulated homebuyer activity. The impeachment of President Trump had little impact on markets. Meanwhile, slowing Chinese economic activity, partly attributable to the trade war, led to further government stimulus at year-end through lower reserve ratios, allowing banks to lend more money.
The year-end rally continued in early January 2020. However, capital market volatility picked up sharply in late January on concerns over the potential impact of the coronavirus on the global economy and stock markets. With sentiment somewhat souring, perceived safe havens did well in January. The U.S. dollar and Japanese yen both rose, and government bonds outperformed equities. While the S&P 500 Index held its ground, emerging market equities tumbled, including those in Asia.
In February, the coronavirus became the major market focus. Fears of the virus’s impact on global growth led to expectations of increased global central bank monetary policy support. That led the 10-year U.S. Treasury yield to fall to an all-time low of 1.1% by the end of the month. Although equity markets initially shrugged off concerns about the outbreak, focusing instead on strong fourth-quarter earnings and improving business confidence in January, market sentiment turned sharply lower toward month-end and the S&P 500 Index lost 8.2% for the month. Oil prices tumbled as Russia and the Organization of the Petroleum Exporting countries compounded a major decline in oil demand with a brutal price war, partly aimed at dissuading further U.S. shale production. As a result, the price of West Texas Intermediate crude oil fell 13% in February.
Wells Fargo Alternative Risk Premia Fund | 3
Letter to shareholders (unaudited)
“The global spread of the coronavirus led country after country to clamp down on social and business-related activity in order to contain the virus from causing even greater devastation and overwhelming health care systems.”
“Despite ongoing economic weakness and high levels of uncertainty on the containment of the coronavirus and the timing of an effective vaccine, financial markets continued to post widely positive returns in June.”
The global spread of the coronavirus led country after country to clamp down on social and business-related activity in order to contain the virus from causing even greater devastation and overwhelming health care systems. This abrupt stoppage of economic activity led to the sharp deceleration of global output, sending economies into a deep contraction. Central bank responses were swift, as they slashed interest rates and expanded quantitative easing programs to restore liquidity and confidence to the markets. In the U.S., the Fed introduced several new lending programs, funding investment-grade bonds, money market mutual funds, and commercial paper while purchasing Treasuries, mortgage-backed securities, and overnight repurchase agreements. Meanwhile, stock markets tumbled quickly into a bear market, ending the longest bull stock market in U.S. history.
Markets rebounded strongly in April, with the S&P 500 Index gaining 12.8% for the month and the MSCI ACWI ex USA Index (Net) returning 7.6%. The rebound was fueled by unprecedented government and central bank stimulus measures taken to buffer the economic damage created by mass shutdowns enacted in order to contain the virus’s spread. The U.S. economy contracted by an annualized 5.0% pace in the first quarter, with 30 million new unemployment insurance claims in six weeks. In the eurozone, first-quarter real GDP shrank 3.8%, with the composite April Flash Purchasing Managers’ Index, a monthly survey of purchasing managers, falling to an all-time low of 13.5. The European Central Bank expanded its quantitative easing to include the purchase of additional government bonds of countries with the greatest virus-related need, including Italy and Spain. China’s first-quarter GDP fell by 6.8% year over year. However, retail sales, production, and investment showed signs of recovery. Extreme oil-price volatility continued as global supply far exceeded demand.
In May, the equity market rebound continued, with the S&P 500 Index climbing a further 4.8%. European and Japanese stock markets also had monthly gains. Investors regained confidence on reports of early signs of success in human trials of a coronavirus vaccine. Growth stocks continued to outperform value stocks while returns on global government bonds were generally flat. In the U.S., a gap grew between the stock market rebound and devastating economic data points, including an April unemployment rate of 14.7%, the highest level since World War II. Purchasing managers’ indices continued to reflect weakening activity in May in both the manufacturing and services sectors. U.S. corporate earnings reports indicated a 14% year-over-year contraction in earnings from the first quarter of 2019. However, high demand for technology, driven by remote activity, helped maintain robust information technology sector earnings, which helped drive powerful well-known technology stocks higher.
Despite ongoing economic weakness and high levels of uncertainty on the containment of the coronavirus and the timing of an effective vaccine, financial markets continued to post widely positive returns in June. As economies reopened, there were hopeful signs. U.S. retail sales rose 17% in May while retail sales in the U.K. rebounded by 12%. However, year over year, sales remained depressed. Vitally important to market sentiment was the ongoing commitment by central banks globally to do all they can to provide economic support through liquidity and low borrowing costs. U.S. economic activity was aided by one-time $1,200 stimulus checks and $600 bonus weekly unemployment benefits due to expire at the end of July. However, unemployment remained in the double digits, easing somewhat from 14.7% in April to 11.1% in June. At period-end, numerous states reported alarming increases of coronavirus cases. China’s economic recovery picked up momentum in June, though it remained far from a full recovery.
4 | Wells Fargo Alternative Risk Premia Fund
Letter to shareholders (unaudited)
Don’t let short-term uncertainty derail long-term investment goals.
Periods of investment uncertainty can present challenges, but experience has taught us that maintaining long-term investment goals can be an effective way to plan for the future. To help you create a sound strategy based on your personal goals and risk tolerance, Wells Fargo Funds offers more than 100 mutual funds spanning a wide range of asset classes and investment styles. Although diversification cannot guarantee an investment profit or prevent losses, we believe it can be an effective way to manage investment risk and potentially smooth out overall portfolio performance. We encourage investors to know their investments and to understand that appropriate levels of risk-taking may unlock opportunities.
Thank you for choosing to invest with Wells Fargo Funds. We appreciate your confidence in us and remain committed to helping you meet your financial needs.
Sincerely,

Andrew Owen
President
Wells Fargo Funds
|
For further information about your Fund, contact your investment professional, visit our website at wfam.com, or call us directly at 1-800-222-8222. |
Wells Fargo Alternative Risk Premia Fund | 5
Performance highlights (unaudited)
Investment objective
The Fund seeks long-term capital appreciation.
Manager
Wells Fargo Funds Management, LLC
Subadvisers
Wells Capital Management Incorporated
Wells Fargo Asset Management (International) Limited
Portfolio managers
Petros N. Bocray, CFA®‡ , FRM
Eddie Cheng, CFA®‡
Monisha Jayakumar
Average annual total returns (%) as of June 30, 2020
| Expense ratios1 (%) | ||||||||||||||||||
| Inception date | 1 year | Since inception | Gross | Net2 | ||||||||||||||
| Class R6 (WRPRX) | 1-29-2019 | -16.78 | -13.78 | 1.56 | 0.62 | |||||||||||||
| Institutional Class (WRPIX) | 1-29-2019 | -16.87 | -13.85 | 1.66 | 0.72 | |||||||||||||
| ICE BofA 3-Month U.S. Treasury Bill Index3 | – | 1.63 | 1.90 | * | – | – | ||||||||||||
| * | Based on inception date of the oldest Fund class. |
Figures quoted represent past performance, which is no guarantee of future results, and do not reflect taxes that a shareholder may pay on an investment in a fund. Investment return and principal value of an investment will fluctuate so that an investor’s shares, when redeemed, may be worth more or less than their original cost. Current performance may be lower or higher than the performance data quoted, which assumes the reinvestment of dividends and capital gains. Current month-end performance is available on the Fund’s website, wfam.com.
Index returns do not include transaction costs associated with buying and selling securities, any mutual fund fees or expenses, or any taxes. It is not possible to invest directly in an index.
Class R6 and Institutional Class shares are sold without a front-end sales charge or contingent deferred sales charge.
The investment techniques employed by the Fund create leverage. As a result, the sum of the Fund’s investment exposures will typically exceed the amount of the Fund’s net assets. These exposures may vary over time. We expect gross notional exposure of the Fund to be in a range of 400% to 1200% of the net asset value of the Fund under normal market conditions. Leverage may be significantly different (higher or lower) as deemed necessary by the investment manager. We expect net notional exposure of the Fund to be in a range of -200% to 200% of the net asset value of the Fund under normal market conditions.
Alternative risk premia investment risk is the Fund’s ability to achieve its investment objective depending largely upon the portfolio managers’ successful evaluation of the risks, potential returns, and correlation properties with respect to the various risk premia in which the Fund invests. Stock values fluctuate in response to the activities of individual companies and general market and economic conditions. Bond values fluctuate in response to the financial condition of individual issuers, general market and economic conditions, and changes in interest rates. Changes in market conditions and government policies may lead to periods of heightened volatility in the bond market and reduced liquidity for certain bonds held by the Fund. In general, when interest rates rise, bond values fall and investors may lose principal value. Interest rate changes and their impact on the Fund and its share price can be sudden and unpredictable. The use of leverage results in certain risks, including, among others, the likelihood of greater volatility of net asset value. Short selling is generally considered speculative, has the potential for unlimited loss, and may involve leverage. Foreign investments are especially volatile and can rise or fall dramatically due to differences in the political and economic conditions of the host country. The use of derivatives may reduce returns and/or increase volatility. Certain investment strategies tend to increase the total risk of an investment (relative to the broader market). The Fund is exposed to subsidiary risk and smaller-company securities risk. Consult the Fund’s prospectus for additional information on these and other risks.
Please see footnotes on page 7.
6 | Wells Fargo Alternative Risk Premia Fund
Performance highlights (unaudited)
| Growth of $1,000,000 investment as of June 30, 20204 |
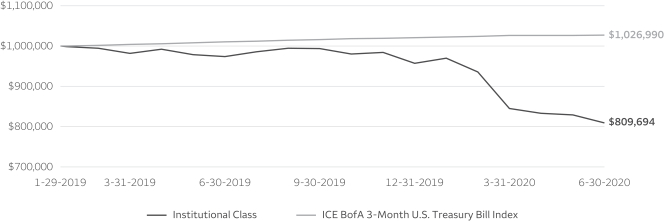
| ‡ | CFA® and Chartered Financial Analyst® are trademarks owned by CFA Institute. |
| 1 | Reflects the expense ratios as stated in the most recent prospectuses. The expense ratios shown are subject to change and may differ from the annualized expense ratios shown in the financial highlights of this report. |
| 2 | The manager has contractually committed through October 31, 2020, to waive fees and/or reimburse expenses to the extent necessary to cap total annual fund operating expenses after fee waivers at 0.62% for Class R6 and 0.72% Institutional Class. Brokerage commissions, stamp duty fees, interest, taxes, acquired fund fees and expenses (if any), and extraordinary expenses are excluded from the expense caps. Prior to or after the commitment expiration date, the caps may be increased or the commitment to maintain the caps may be terminated only with the approval of the Board of Trustees. Without these caps, the Fund’s returns would have been lower. The expense ratio paid by an investor is the net expense ratio (the total annual fund operating expenses after fee waivers) as stated in the prospectuses. |
| 3 | The ICE BofA 3-Month U.S. Treasury Bill Index is an unmanaged index that is comprised of a single U.S. Treasury issue with approximately three months to final maturity, purchased at the beginning of each month and held for one full month. Copyright 2020. ICE Data Indices, LLC. All rights reserved. You cannot invest directly in an index. |
| 4 | The chart compares the performance of the Institutional Class shares since inception with the ICE BofA 3-Month U.S. Treasury Bill Index. The chart assumes a hypothetical $1,000,000 investment in Institutional Class shares and reflects all operating expenses. |
| 5 | Amounts are subject to change and may have changed since the date specified. |
Wells Fargo Alternative Risk Premia Fund | 7
Performance highlights (unaudited)
MANAGERS’ DISCUSSION
Fund highlights
| ∎ | The Fund underperformed its benchmark, ICE BofA 3-Month U.S. Treasury Bill Index, for the 12-month period that ended June 30, 2020. |
| ∎ | The largest detractors included our equity multifactor strategy (-13.0%), commodity carry strategy (-3.8%), and rates value strategy (-4.5%). |
| ∎ | Top contributors included our foreign exchange (FX) value strategy (+2.3%) and our risk hedges, which contributed 5.0% to the Fund’s returns. |
A volatile market creates challenges.
The past 12 months have been extremely eventful, with markets benefiting from central bank liquidity support in a low but stable growth environment in the second half of 2019 and then experiencing one of their sharpest drawdowns in the first quarter of 2020 before recovering sharply in the second quarter. We believe two factors were particularly unconducive for our strategy. First, markets were significantly driven by idiosyncratic factors (particularly the coronavirus), which are not captured by our quantitative models. Second, we’ve experienced some of the sharpest and fastest moves in an overall range-bound market, which made it difficult for some of our strategies to perform. In this difficult environment, the Fund lost 17%.
The multifactor equity strategy detracted.
The largest detractor was our multifactor equity strategy, which took 13% from the Fund’s returns, with most losses attributable to the value factor. Commodities also had a difficult time, with commodity carry being particularly affected by its long positions in energy during the first-quarter correction. Rates value was the second-largest detractor from performance and continued to suffer in an environment where investors didn’t pay much attention to valuation. In an environment where investors want to access growth at all costs (despite high valuation and lower quality), value is expected to struggle. Carry strategies (strategies involving holding securities for a period in an effort to capture price discrepancies) performed well until the drawdown, and while they have recovered since then, it has not been enough to compensate for first-quarter losses. Trend and momentum have been whipsawed by the V-shaped recovery but have also started to recover.
De-risking strategies aided results.
After conducting an in-depth review of our investment process, strategies, and performance, we remain confident in our current process and did not make significant changes. It is, however, worth highlighting that we have made full use of our downside risk management budget and took many active decisions to reduce risks not captured by our models, such as de-risking the overall portfolio in the beginning of the year and hedging a significant portion of our energy exposure. Those decisions had a significantly positive impact on the results and contributed 5.0% to returns over that period, which makes us confident about the value added from our multidimensional risk management process.
Looking at the contribution by asset class, FX strategies were the top performers, driven by strong gains in FX value. While FX carry also performed well until the beginning of 2020, it corrected sharply in the first quarter drawdown. Rates momentum also contributed and benefited from its defensive positioning over the period. Lastly, and as mentioned above, our downside risk hedges contributed 5.0% to the Fund’s returns, with most of the performance coming from our energy hedges.
We hold a conservative stance with a focus on downside risk management.
We believe that the main headwinds to performance over the past 12 months—namely, markets driven by idiosyncratic factors and sharp mean-reverting market moves—should start to fade as the economy gradually recovers from the hit induced by lockdowns. However, the largest risk remains that a second wave of the virus could once again drive market moves and lead to sharp, unpredictable corrections. As a result, we are currently running the Fund’s risks very conservatively, and we believe that our focus on downside risk management should continue to add value.
| Net asset exposure as of June 30, 20205 | ||||||||
| % of net assets | ||||||||
| Long positions | Short positions | |||||||
Stocks | 41 | 30 | ||||||
Bond futures | 120 | 77 | ||||||
Currency forwards | 61 | 68 | ||||||
Equity index futures | 7 | 9 | ||||||
Commodity futures | 17 | 15 | ||||||
8 | Wells Fargo Alternative Risk Premia Fund
As a shareholder of the Fund, you incur ongoing costs, including management fees, and other Fund expenses. This example is intended to help you understand your ongoing costs (in dollars) of investing in the Fund and to compare these costs with the ongoing costs of investing in other mutual funds.
The example is based on an investment of $1,000 invested at the beginning of the six-month period and held for the entire period from January 1, 2020 to June 30, 2020.
Actual expenses
The “Actual” line of the table below provides information about actual account values and actual expenses. You may use the information in this line, together with the amount you invested, to estimate the expenses that you paid over the period. Simply divide your account value by $1,000 (for example, an $8,600 account value divided by $1,000 = 8.6), then multiply the result by the number in the “Actual” line under the heading entitled “Expenses paid during period” for your applicable class of shares to estimate the expenses you paid on your account during this period.
Hypothetical example for comparison purposes
The “Hypothetical” line of the table below provides information about hypothetical account values and hypothetical expenses based on the Fund’s actual expense ratio and an assumed rate of return of 5% per year before expenses, which is not the Fund’s actual return. The hypothetical account values and expenses may not be used to estimate the actual ending account balance or expenses you paid for the period. You may use this information to compare the ongoing costs of investing in the Fund and other funds. To do so, compare this 5% hypothetical example with the 5% hypothetical examples that appear in the shareholder reports of the other funds.
Please note that the expenses shown in the table are meant to highlight your ongoing costs. Therefore, the “Hypothetical” line of the table is useful in comparing ongoing costs only and will not help you determine the relative total costs of owning different funds.
| Beginning account value 1-1-2020 | Ending account value 6-30-2020 | Expenses paid during the period1 | Annualized net expense ratio | |||||||||||||
Class R6 | ||||||||||||||||
Actual | $ | 1,000.00 | $ | 845.99 | $ | 2.85 | 0.62 | % | ||||||||
Hypothetical (5% return before expenses) | $ | 1,000.00 | $ | 1,021.78 | $ | 3.12 | 0.62 | % | ||||||||
Institutional Class | ||||||||||||||||
Actual | $ | 1,000.00 | $ | 845.99 | $ | 3.30 | 0.72 | % | ||||||||
Hypothetical (5% return before expenses) | $ | 1,000.00 | $ | 1,021.28 | $ | 3.62 | 0.72 | % | ||||||||
| 1 | Expenses paid is equal to the annualized net expense ratio of each class multiplied by the average account value over the period, multiplied by the number of days in the most recent fiscal half-year divided by the number of days in the fiscal year (to reflect the one-half-year period). |
Wells Fargo Alternative Risk Premia Fund | 9
Consolidated portfolio of investments—June 30, 2020
| Yield | Shares | Value | ||||||||||||||
| Short-Term Investments: 87.51% | ||||||||||||||||
| Investment Companies: 11.94% | ||||||||||||||||
Wells Fargo Government Money Market Fund Select Class (l)(u)* | 0.11 | % | 7,855,265 | $ | 7,855,265 | |||||||||||
|
| |||||||||||||||
| Maturity date | Principal | |||||||||||||||
| U.S. Treasury Securities: 75.57% | ||||||||||||||||
U.S. Treasury Bill (z)# | 0.15 | 9-10-2020 | $ | 8,800,000 | 8,797,700 | |||||||||||
U.S. Treasury Bill (z) | 1.42 | 7-16-2020 | 30,000,000 | 29,998,578 | ||||||||||||
U.S. Treasury Bill (z) | 1.47 | 7-30-2020 | 10,919,000 | 10,917,879 | ||||||||||||
| 49,714,157 | ||||||||||||||||
|
| |||||||||||||||
Total Short-Term Investments (Cost $57,539,307) | 57,569,422 | |||||||||||||||
|
| |||||||||||||||
| Total investments in securities (Cost $57,539,307) | 87.51 | % | 57,569,422 | |||||
Other assets and liabilities, net | 12.49 | 8,215,676 | ||||||
|
|
|
| |||||
| Total net assets | 100.00 | % | $ | 65,785,098 | ||||
|
|
|
| |||||
| (l) | The issuer of the security is an affiliated person of the Fund as defined in the Investment Company Act of 1940. |
| (u) | The rate represents the 7-day annualized yield at period end. |
| * | A portion of the holding represents an investment held in Alt Risk Premia Special Investments (Cayman) Ltd., the consolidated entity. |
| (z) | Zero coupon security. The rate represents the current yield to maturity. |
| # | All or a portion of this security is segregated as collateral for investments in derivative instruments. |
Investments in Affiliates
An affiliated investment is an investment in which the Fund owns at least 5% of the outstanding voting shares of the issuer or as a result of other relationships, such as the Fund and the issuer having the same investment manager. Transactions with issuers that were either affiliated persons of the Fund at the beginning of the period or the end of the period were as follows:
| Value, beginning of period | Purchases | Sales proceeds | Net realized gains (losses) | Net change in unrealized gains (losses) | Income from affiliated securities | Value, end of period | % of net assets | |||||||||||||||||||||||||
| Short-Term Investments | ||||||||||||||||||||||||||||||||
Investment Companies | ||||||||||||||||||||||||||||||||
Wells Fargo Government | $ | 2,383,220 | $ | 217,574,172 | $ | (212,102,127 | ) | $ | 0 | $ | 0 | $ | 105,101 | $ | 7,855,265 | 11.94 | % | |||||||||||||||
Futures Contracts
| Description | Number of contracts | Expiration date | Notional cost | Notional value | Unrealized gains | Unrealized losses | ||||||||||||||||||
Long | ||||||||||||||||||||||||
London Metal Exchange Aluminium Futures * | 37 | 7-13-2020 | $ | 1,408,940 | $ | 1,474,219 | $ | 65,279 | $ | 0 | ||||||||||||||
London Metal Exchange Copper Futures * | 8 | 7-13-2020 | 1,027,286 | 1,201,650 | 174,364 | 0 | ||||||||||||||||||
London Metal Exchange Lead Futures * | 19 | 7-13-2020 | 837,347 | 839,206 | 1,859 | 0 | ||||||||||||||||||
London Metal Exchange Nickel Futures * | 8 | 7-13-2020 | 594,423 | 612,576 | 18,153 | 0 | ||||||||||||||||||
London Metal Exchange Zinc Futures * | 5 | 7-13-2020 | 254,866 | 254,781 | 0 | (85 | ) | |||||||||||||||||
Soybean Oil Futures * | 19 | 8-14-2020 | 327,365 | 320,796 | 0 | (6,569 | ) | |||||||||||||||||
London Metal Exchange Aluminium Futures * | 4 | 8-17-2020 | 155,868 | 160,825 | 4,957 | 0 | ||||||||||||||||||
The accompanying notes are an integral part of these financial statements.
10 | Wells Fargo Alternative Risk Premia Fund
Consolidated portfolio of investments—June 30, 2020
Futures Contracts (continued)
| Description | Number of contracts | Expiration date | Notional cost | Notional value | Unrealized gains | Unrealized losses | ||||||||||||||||||
Long (continued) | ||||||||||||||||||||||||
London Metal Exchange Copper Futures * | 6 | 8-17-2020 | $ | 883,872 | $ | 902,063 | $ | 18,191 | $ | 0 | ||||||||||||||
London Metal Exchange Nickel Futures * | 6 | 8-17-2020 | 447,323 | 460,134 | 12,811 | 0 | ||||||||||||||||||
London Metal Exchange Zinc Futures * | 3 | 8-17-2020 | 152,863 | 153,150 | 287 | 0 | ||||||||||||||||||
Gold 100 Ounces Futures * | 5 | 8-27-2020 | 870,617 | 900,250 | 29,633 | 0 | ||||||||||||||||||
TOPIX Index | 6 | 9-10-2020 | 906,257 | 866,034 | 0 | (40,223 | ) | |||||||||||||||||
10-Year Japanese Treasury Bonds | 29 | 9-14-2020 | 40,711,809 | 40,810,836 | 99,027 | 0 | ||||||||||||||||||
KC Hard Red Winter Wheat Futures * | 48 | 9-14-2020 | 1,072,930 | 1,055,400 | 0 | (17,530 | ) | |||||||||||||||||
Wheat Futures * | 72 | 9-14-2020 | 1,805,657 | 1,770,300 | 0 | (35,357 | ) | |||||||||||||||||
Cocoa Futures * | 106 | 9-15-2020 | 2,526,042 | 2,317,160 | 0 | (208,882 | ) | |||||||||||||||||
Coffee C Futures * | 3 | 9-18-2020 | 107,112 | 113,625 | 6,513 | 0 | ||||||||||||||||||
NASDAQ 100 E-Mini Index | 3 | 9-18-2020 | 587,360 | 608,835 | 21,475 | 0 | ||||||||||||||||||
E-Mini Russell 2000 Index | 36 | 9-18-2020 | 2,552,767 | 2,587,680 | 34,913 | 0 | ||||||||||||||||||
S&P 500 E-Mini Index | 5 | 9-18-2020 | 765,551 | 772,550 | 6,999 | 0 | ||||||||||||||||||
10-Year Canadian Treasury Bonds | 37 | 9-21-2020 | 4,177,854 | 4,192,207 | 14,353 | 0 | ||||||||||||||||||
10-Year U.S. Treasury Notes | 33 | 9-21-2020 | 4,583,478 | 4,592,672 | 9,194 | 0 | ||||||||||||||||||
Long Gilt Bonds | 171 | 9-28-2020 | 29,106,533 | 29,164,016 | 57,483 | 0 | ||||||||||||||||||
Silver Futures * | 7 | 9-28-2020 | 628,833 | 652,295 | 23,462 | 0 | ||||||||||||||||||
Sugar #11 Futures * | 68 | 9-30-2020 | 925,127 | 910,874 | 0 | (14,253 | ) | |||||||||||||||||
Cotton #2 Futures * | 54 | 12-8-2020 | 1,619,615 | 1,643,760 | 24,145 | 0 | ||||||||||||||||||
Short | ||||||||||||||||||||||||
London Metal Exchange Aluminium Futures * | (37) | 7-13-2020 | (1,372,825 | ) | (1,474,219 | ) | 0 | (101,394 | ) | |||||||||||||||
London Metal Exchange Copper Futures * | (8) | 7-13-2020 | (1,166,239 | ) | (1,201,650 | ) | 0 | (35,411 | ) | |||||||||||||||
London Metal Exchange Lead Futures * | (19) | 7-13-2020 | (795,318 | ) | (839,206 | ) | 0 | (43,888 | ) | |||||||||||||||
London Metal Exchange Nickel Futures * | (8) | 7-13-2020 | (597,204 | ) | (612,576 | ) | 0 | (15,372 | ) | |||||||||||||||
London Metal Exchange Zinc Futures * | (5) | 7-13-2020 | (251,218 | ) | (254,781 | ) | 0 | (3,563 | ) | |||||||||||||||
CAC 40 Index | (14) | 7-17-2020 | (781,466 | ) | (772,844 | ) | 8,622 | 0 | ||||||||||||||||
Natural Gas Futures * | (69) | 7-29-2020 | (1,187,263 | ) | (1,208,190 | ) | 0 | (20,927 | ) | |||||||||||||||
Hang Seng Index | (5) | 7-30-2020 | (800,472 | ) | (782,111 | ) | 18,361 | 0 | ||||||||||||||||
Brent Crude Futures * | (20) | 7-31-2020 | (811,411 | ) | (825,400 | ) | 0 | (13,989 | ) | |||||||||||||||
Gasoline RBOB Futures * | (6) | 7-31-2020 | (302,313 | ) | (302,778 | ) | 0 | (465 | ) | |||||||||||||||
NY Harbor Ultra-Low Sulfur Diesel Futures * | (21) | 7-31-2020 | (1,043,358 | ) | (1,046,493 | ) | 0 | (3,135 | ) | |||||||||||||||
Low Sugar Gas Oil Futures * | (36) | 8-12-2020 | (1,316,607 | ) | (1,278,900 | ) | 37,707 | 0 | ||||||||||||||||
Lean Hogs Futures * | (15) | 8-14-2020 | (307,613 | ) | (294,150 | ) | 13,463 | 0 | ||||||||||||||||
Soybean Futures * | (12) | 8-14-2020 | (525,105 | ) | (527,250 | ) | 0 | (2,145 | ) | |||||||||||||||
Soybean Meal Futures * | (67) | 8-14-2020 | (1,937,392 | ) | (1,936,970 | ) | 422 | 0 | ||||||||||||||||
London Metal Exchange Lead Futures * | (14) | 8-17-2020 | (623,375 | ) | (619,238 | ) | 4,137 | 0 | ||||||||||||||||
WTI Crude Futures * | (13) | 8-20-2020 | (494,477 | ) | (511,420 | ) | 0 | (16,943 | ) | |||||||||||||||
Euro-Bund Futures | (205) | 9-8-2020 | (40,417,997 | ) | (40,655,629 | ) | 0 | (237,632 | ) | |||||||||||||||
Corn Futures * | (58) | 9-14-2020 | (969,833 | ) | (990,350 | ) | 0 | (20,517 | ) | |||||||||||||||
10-Year Australian Treasury Bonds | (98) | 9-15-2020 | (9,856,837 | ) | (10,062,530 | ) | 0 | (205,693 | ) | |||||||||||||||
S&P/TSX 60 Index | (5) | 9-17-2020 | (691,008 | ) | (683,928 | ) | 7,080 | 0 | ||||||||||||||||
SPI 200 Index | (8) | 9-17-2020 | (811,954 | ) | (813,214 | ) | 0 | (1,260 | ) | |||||||||||||||
The accompanying notes are an integral part of these financial statements.
Wells Fargo Alternative Risk Premia Fund | 11
Consolidated portfolio of investments—June 30, 2020
Futures Contracts (continued)
| Description | Number of contracts | Expiration date | Notional cost | Notional value | Unrealized gains | Unrealized losses | ||||||||||||||||||
Short (continued) | ||||||||||||||||||||||||
DAX Index | (2) | 9-18-2020 | $ | (697,069 | ) | $ | (692,385 | ) | $ | 4,684 | $ | 0 | ||||||||||||
Euro STOXX 50 Index | (22) | 9-18-2020 | (797,447 | ) | (796,629 | ) | 818 | 0 | ||||||||||||||||
FTSE 100 Index | (11) | 9-18-2020 | (853,086 | ) | (837,911 | ) | 15,175 | 0 | ||||||||||||||||
MSCI Emerging Markets Index | (13) | 9-18-2020 | (643,335 | ) | (640,705 | ) | 2,630 | 0 | ||||||||||||||||
|
|
|
| |||||||||||||||||||||
| $ | 736,197 | $ | (1,045,233 | ) | ||||||||||||||||||||
|
|
|
| |||||||||||||||||||||
| * | Represents an investment held in Alt Risk Premia Special Investments (Cayman) Ltd., the consolidated entity. |
Forward Foreign Currency Contracts
| Currency to be received | Currency to be delivered | Counterparty | Settlement date | Unrealized gains | Unrealized losses | |||||||||
| 19,664,000 NOK | 2,033,769 USD | Goldman Sachs International | 7-14-2020 | $ | 9,283 | $ | 0 | |||||||
| 5,349,000 AUD | 3,656,255 USD | Goldman Sachs International | 7-14-2020 | 35,354 | 0 | |||||||||
| 1,820,000 BRL | 351,698 USD | Goldman Sachs International | 7-14-2020 | 0 | (17,208 | ) | ||||||||
| 3,431,000 CZK | 144,602 USD | Goldman Sachs International | 7-14-2020 | 32 | 0 | |||||||||
| 9,593,000 EUR | 10,848,733 USD | Goldman Sachs International | 7-14-2020 | 0 | (68,278 | ) | ||||||||
| 4,383,000 PLN | 1,116,856 USD | Goldman Sachs International | 7-14-2020 | 0 | (8,960 | ) | ||||||||
| 65,187,670,000 IDR | 4,638,041 USD | Goldman Sachs International | 7-14-2020 | 0 | (80,897 | ) | ||||||||
| 10,577,000 TRY | 1,569,518 USD | Goldman Sachs International | 7-14-2020 | 0 | (30,314 | ) | ||||||||
| 29,620,000 SEK | 3,229,374 USD | Goldman Sachs International | 7-14-2020 | 0 | (50,214 | ) | ||||||||
| 7,486,000 GBP | 9,506,733 USD | Goldman Sachs International | 7-14-2020 | 0 | (230,138 | ) | ||||||||
| 12,584,000 CAD | 9,382,663 USD | Goldman Sachs International | 7-14-2020 | 0 | (113,042 | ) | ||||||||
| 9,123,000 NZD | 5,941,062 USD | Goldman Sachs International | 7-14-2020 | 0 | (53,680 | ) | ||||||||
| 188,971,000 RUB | 2,748,737 USD | Goldman Sachs International | 7-14-2020 | 0 | (96,891 | ) | ||||||||
| 16,673,000 ZAR | 987,289 USD | Goldman Sachs International | 7-14-2020 | 0 | (27,729 | ) | ||||||||
| 3,830,000 HUF | 12,597 USD | Goldman Sachs International | 7-14-2020 | 0 | (447 | ) | ||||||||
| 34,039,000 MXN | 1,574,414 USD | Goldman Sachs International | 7-14-2020 | 0 | (95,777 | ) | ||||||||
| 2,159,000 CHF | 2,274,595 USD | Goldman Sachs International | 7-14-2020 | 4,928 | 0 | |||||||||
| 492,838,000 KRW | 406,612 USD | Goldman Sachs International | 7-14-2020 | 3,126 | 0 | |||||||||
| 351,677,000 JPY | 3,276,672 USD | Goldman Sachs International | 7-14-2020 | 0 | (19,202 | ) | ||||||||
| 10,021,000 INR | 131,442 USD | Goldman Sachs International | 7-14-2020 | 1,130 | 0 | |||||||||
| 306,349 USD | 2,124,000 TRY | Goldman Sachs International | 7-14-2020 | 0 | (2,743 | ) | ||||||||
| 2,009,922 USD | 1,603,000 GBP | Goldman Sachs International | 7-14-2020 | 23,496 | 0 | |||||||||
| 1,349,012 USD | 2,095,000 NZD | Goldman Sachs International | 7-14-2020 | 0 | (2,962 | ) | ||||||||
| 213,001 USD | 3,683,000 ZAR | Goldman Sachs International | 7-14-2020 | 1,038 | 0 | |||||||||
| 538,258 USD | 37,959,000 RUB | Goldman Sachs International | 7-14-2020 | 5,576 | 0 | |||||||||
| 672,351 USD | 6,301,000 SEK | Goldman Sachs International | 7-14-2020 | 0 | (3,946 | ) | ||||||||
| 1,025,954 USD | 14,775,794,000 IDR | Goldman Sachs International | 7-14-2020 | 0 | (6,993 | ) | ||||||||
| 1,938,425 USD | 2,645,000 CAD | Goldman Sachs International | 7-14-2020 | 0 | (9,934 | ) | ||||||||
| 303,348 USD | 6,894,000 MXN | Goldman Sachs International | 7-14-2020 | 3,876 | 0 | |||||||||
| 1,415,354 USD | 7,006,000 BRL | Goldman Sachs International | 7-14-2020 | 127,753 | 0 | |||||||||
| 624,232 USD | 47,323,000 INR | Goldman Sachs International | 7-14-2020 | 0 | (1,823 | ) | ||||||||
| 10,269,176 USD | 9,876,000 CHF | Goldman Sachs International | 7-14-2020 | 0 | (158,137 | ) | ||||||||
| 17,022,604 USD | 24,380,000 AUD | Goldman Sachs International | 7-14-2020 | 196,761 | 0 | |||||||||
The accompanying notes are an integral part of these financial statements.
12 | Wells Fargo Alternative Risk Premia Fund
Consolidated portfolio of investments—June 30, 2020
Forward Foreign Currency Contracts (continued)
| Currency to be received | Currency to be delivered | Counterparty | Settlement date | Unrealized gains | Unrealized losses | |||||||||
| 649,600 USD | 15,257,000 CZK | Goldman Sachs International | 7-14-2020 | $ | 6,440 | $ | 0 | |||||||
| 167,712 USD | 128,241,000 CLP | Goldman Sachs International | 7-14-2020 | 11,540 | 0 | |||||||||
| 1,813,189 USD | 2,182,681,000 KRW | Goldman Sachs International | 7-14-2020 | 0 | (1,456 | ) | ||||||||
| 10,111,680 USD | 93,898,000 NOK | Goldman Sachs International | 7-14-2020 | 355,859 | 0 | |||||||||
| 15,052,109 USD | 1,650,262,000 JPY | Goldman Sachs International | 7-14-2020 | 0 | (233,731 | ) | ||||||||
| 2,370,745 USD | 2,106,000 EUR | Goldman Sachs International | 7-14-2020 | 4,057 | 0 | |||||||||
| 232,946 USD | 919,000 PLN | Goldman Sachs International | 7-14-2020 | 649 | 0 | |||||||||
|
|
|
| |||||||||||
| $ | 790,898 | $ | (1,314,502 | ) | ||||||||||
|
|
|
| |||||||||||
Swaps
| Reference asset/index | Counterparty | Payment frequency | Maturity date | Notional amount | Value | Unrealized gains | Unrealized losses | |||||||||||||||||
| Synthetic total return swap† | Goldman Sachs International | Monthly | 2-1-2024 | $ | 7,296,476 | $ | 7,455,721 | $ | 159,245 | $ | 0 | |||||||||||||
| † | The Fund receives or pays the difference between the total return on a portfolio of long and short positions underlying the total return swap and the return on a specified benchmark (either the Federal Funds Effective Rate or the One Month LIBOR), plus or minus a spread in a typical range of 20-75 basis points (bps; 100 bps equal 1.00%). The spread is determined based upon the country and/or currency of the individual underlying positions. Certain short positions may be subject to higher market rates. |
The accompanying notes are an integral part of these financial statements.
Wells Fargo Alternative Risk Premia Fund | 13
Consolidated portfolio of investments—June 30, 2020
The following table represents the component disclosures associated with the synthetic total return swap basket as of the end of the period.
| Reference asset | Shares | Value | % of swap basket value | |||||||||||||
Long positions | ||||||||||||||||
Common Stocks | ||||||||||||||||
Communication Services | ||||||||||||||||
Diversified Telecommunication Services | ||||||||||||||||
PCCW Limited | 812,000 | $ | 464,269 | 6.23 | % | |||||||||||
Spark New Zealand Limited | 68,468 | 202,571 | 2.72 | |||||||||||||
Swisscom AG | 349 | 183,014 | 2.45 | |||||||||||||
Entertainment | ||||||||||||||||
Electronic Arts Incorporated | 1,425 | 188,166 | 2.52 | |||||||||||||
Interactive Media & Services | ||||||||||||||||
Match Group Incorporated | 2,864 | 306,586 | 4.11 | |||||||||||||
Media | ||||||||||||||||
Discovery Communications Incorporated Class A | 5,625 | 118,686 | 1.59 | |||||||||||||
Discovery Communications Incorporated Class C | 7,685 | 148,011 | 1.99 | |||||||||||||
Fox Corporation Class B | 3,175 | 85,215 | 1.14 | |||||||||||||
ITV plc | 232,382 | 214,772 | 2.88 | |||||||||||||
Quebecor Incorporated Class B | 4,900 | 105,282 | 1.41 | |||||||||||||
| 2,016,572 | ||||||||||||||||
|
| |||||||||||||||
Consumer Discretionary | ||||||||||||||||
Auto Components | ||||||||||||||||
Toyoda Gosei Company Limited | 7,800 | 162,969 | 2.19 | |||||||||||||
Leisure Products | ||||||||||||||||
Polaris Industries Incorporated | 812 | 75,149 | 1.01 | |||||||||||||
Specialty Retail | ||||||||||||||||
Best Buy Company Incorporated | 1,211 | 105,683 | 1.42 | |||||||||||||
Textiles, Apparel & Luxury Goods | ||||||||||||||||
HanesBrands Incorporated | 10,592 | 119,582 | 1.60 | |||||||||||||
Yue Yuen Industrial Holdings Limited | 130,000 | 198,153 | 2.66 | |||||||||||||
| 661,536 | ||||||||||||||||
|
| |||||||||||||||
Consumer Staples | ||||||||||||||||
Beverages | ||||||||||||||||
Brown-Forman Corporation Class B | 1,271 | 80,908 | 1.09 | |||||||||||||
Coca-Cola Amatil Limited | 33,404 | 201,204 | 2.70 | |||||||||||||
Food & Staples Retailing | ||||||||||||||||
Coles Group Limited | 12,947 | 153,905 | 2.06 | |||||||||||||
Empire Company Limited Class A | 12,100 | 289,753 | 3.89 | |||||||||||||
The Kroger Company | 8,262 | 279,668 | 3.75 | |||||||||||||
Food Products | ||||||||||||||||
Campbell Soup Company | 2,873 | 142,586 | 1.91 | |||||||||||||
Chocoladefabriken Lindt & Spruengli AG | 20 | 165,186 | 2.22 | |||||||||||||
Ingredion Incorporated | 2,669 | 221,526 | 2.97 | |||||||||||||
Yamazaki Baking Company Limited | 10,400 | 178,642 | 2.40 | |||||||||||||
Household Products | ||||||||||||||||
The Clorox Company | 920 | 201,817 | 2.71 | |||||||||||||
| 1,915,195 | ||||||||||||||||
|
| |||||||||||||||
The accompanying notes are an integral part of these financial statements.
14 | Wells Fargo Alternative Risk Premia Fund
Consolidated portfolio of investments—June 30, 2020
| Reference asset | Shares | Value | % of swap basket value | |||||||||||||
Long positions (continued) | ||||||||||||||||
Energy | ||||||||||||||||
Oil, Gas & Consumable Fuels | ||||||||||||||||
Altagas Limited | 14,300 | $ | 164,844 | 2.21 | % | |||||||||||
Ampol Limited | 20,142 | 410,417 | 5.50 | |||||||||||||
Koninklijke Vopak NV | 3,400 | 179,838 | 2.41 | |||||||||||||
| 755,099 | ||||||||||||||||
|
| |||||||||||||||
Financials | ||||||||||||||||
Banks | ||||||||||||||||
Fukuoka Financial Group Incorporated | 16,100 | 254,555 | 3.41 | |||||||||||||
Israel Discount Bank Limited Class A | 61,111 | 186,386 | 2.50 | |||||||||||||
Seven Bank Limited | 81,600 | 223,651 | 3.00 | |||||||||||||
Capital Markets | ||||||||||||||||
CI Financial Corporation | 7,900 | 100,495 | 1.35 | |||||||||||||
Eaton Vance Corporation | 3,115 | 120,237 | 1.61 | |||||||||||||
Stonex Group Incorporated | 1,655 | 91,022 | 1.22 | |||||||||||||
Diversified Financial Services | ||||||||||||||||
Kinnevik AB Class B | 3,243 | 85,604 | 1.15 | |||||||||||||
Mitsubishi UFJ Lease & Finance Company Limited | 33,900 | 161,764 | 2.17 | |||||||||||||
Onex Corporation | 3,900 | 176,182 | 2.36 | |||||||||||||
Insurance | ||||||||||||||||
Direct Line Insurance Group plc | 22,777 | 76,372 | 1.02 | |||||||||||||
iA Financial Corporation | 6,900 | 231,049 | 3.10 | |||||||||||||
The Allstate Corporation | 1,465 | 142,089 | 1.91 | |||||||||||||
Mortgage REITs | ||||||||||||||||
AGNC Investment Corporation | 7,812 | 100,770 | 1.35 | |||||||||||||
| 1,950,176 | ||||||||||||||||
|
| |||||||||||||||
Health Care | ||||||||||||||||
Biotechnology | ||||||||||||||||
Biogen Incorporated | 762 | 203,872 | 2.73 | |||||||||||||
Health Care Equipment & Supplies | ||||||||||||||||
Coloplast AS Class B | 1,619 | 252,348 | 3.38 | |||||||||||||
West Pharmaceutical Services Incorporated | 710 | 161,289 | 2.16 | |||||||||||||
Health Care Providers & Services | ||||||||||||||||
DaVita HealthCare Partners Incorporated | 1,330 | 105,254 | 1.41 | |||||||||||||
Life Sciences Tools & Services | ||||||||||||||||
Bio-Rad Laboratories Incorporated Class A | 489 | 220,775 | 2.96 | |||||||||||||
Pharmaceuticals | ||||||||||||||||
Orion Oyj Class B | 5,954 | 288,734 | 3.87 | |||||||||||||
| 1,232,272 | ||||||||||||||||
|
| |||||||||||||||
Industrials | ||||||||||||||||
Aerospace & Defense | ||||||||||||||||
BAE Systems plc | 26,522 | 158,586 | 2.13 | |||||||||||||
Huntington Ingalls Industries Incorporated | 1,302 | 227,184 | 3.05 | |||||||||||||
Building Products | ||||||||||||||||
A.O. Smith Corporation | 2,370 | 111,672 | 1.50 | |||||||||||||
Commercial Services & Supplies | ||||||||||||||||
Toppan Printing Company Limited | 13,600 | 227,376 | 3.05 | |||||||||||||
Electrical Equipment | ||||||||||||||||
Prysmian SpA | 3,456 | 80,170 | 1.08 | |||||||||||||
The accompanying notes are an integral part of these financial statements.
Wells Fargo Alternative Risk Premia Fund | 15
Consolidated portfolio of investments—June 30, 2020
| Reference asset | Shares | Value | % of swap basket value | |||||||||||||
Long positions (continued) | ||||||||||||||||
Machinery | ||||||||||||||||
Epiroc AB Class B | 17,219 | $ | 211,468 | 2.84 | % | |||||||||||
Kurita Water Industries Limited | 5,600 | 155,780 | 2.09 | |||||||||||||
Schindler Holding AG | 579 | 137,024 | 1.84 | |||||||||||||
Professional Services | ||||||||||||||||
Adecco SA | 2,390 | 112,653 | 1.51 | |||||||||||||
Randstad Holdings NV | 4,630 | 207,030 | 2.78 | |||||||||||||
Robert Half International Incorporated | 3,003 | 158,647 | 2.13 | |||||||||||||
Road & Rail | ||||||||||||||||
J.B. Hunt Transport Services Incorporated | 1,556 | 187,248 | 2.51 | |||||||||||||
Knight-Swift Transportation Holdings Incorporated | 3,575 | 149,112 | 2.00 | |||||||||||||
Nippon Express Company Limited | 5,400 | 280,008 | 3.76 | |||||||||||||
Old Dominion Freight Line Incorporated | 1,154 | 195,706 | 2.62 | |||||||||||||
Transportation Infrastructure | ||||||||||||||||
Japan Airport Terminal Company Limited | 1,900 | 81,074 | 1.09 | |||||||||||||
| 2,680,738 | ||||||||||||||||
|
| |||||||||||||||
Information Technology | ||||||||||||||||
Communications Equipment | ||||||||||||||||
F5 Networks Incorporated | 974 | 135,850 | 1.82 | |||||||||||||
Electronic Equipment, Instruments & Components | ||||||||||||||||
Hitachi High-Technologies Corporation | 4,200 | 310,793 | 4.17 | |||||||||||||
Venture Corporation Limited | 7,400 | 86,481 | 1.16 | |||||||||||||
IT Services | ||||||||||||||||
Booz Allen Hamilton Holding Corporation | 3,962 | 308,203 | 4.13 | |||||||||||||
Fujitsu Limited | 1,000 | 117,082 | 1.57 | |||||||||||||
Itochu Techno-Solutions Corporation | 6,900 | 259,486 | 3.48 | |||||||||||||
Jack Henry & Associates Incorporated | 652 | 119,987 | 1.61 | |||||||||||||
Leidos Holdings Incorporated | 2,347 | 219,842 | 2.95 | |||||||||||||
Otsuka Corporation | 3,800 | 200,699 | 2.69 | |||||||||||||
The Western Union Company | 7,429 | 160,614 | 2.15 | |||||||||||||
Software | ||||||||||||||||
Citrix Systems Incorporated | 1,912 | 282,803 | 3.79 | |||||||||||||
NortonLifeLock Incorporated | 7,273 | 144,223 | 1.93 | |||||||||||||
Tyler Technologies Incorporated | 806 | 279,584 | 3.75 | |||||||||||||
Technology Hardware, Storage & Peripherals | ||||||||||||||||
Seagate Technology plc | 4,518 | 218,711 | 2.93 | |||||||||||||
| 2,844,358 | ||||||||||||||||
|
| |||||||||||||||
Materials | ||||||||||||||||
Chemicals | ||||||||||||||||
Air Water Incorporated | 9,800 | 138,462 | 1.86 | |||||||||||||
Teijin Limited | 19,800 | 315,245 | 4.23 | |||||||||||||
Tosoh Corporation | 17,300 | 237,646 | 3.19 | |||||||||||||
Umicore SA | 1,901 | 89,733 | 1.20 | |||||||||||||
Containers & Packaging | ||||||||||||||||
Crown Holdings Incorporated | 3,105 | 202,225 | 2.71 | |||||||||||||
Packaging Corporation of America | 2,266 | 226,143 | 3.03 | |||||||||||||
Metals & Mining | ||||||||||||||||
BlueScope Steel Limited | 24,812 | 204,396 | 2.74 | |||||||||||||
Steel Dynamics Incorporated | 7,289 | 190,169 | 2.55 | |||||||||||||
| 1,604,019 | ||||||||||||||||
|
| |||||||||||||||
The accompanying notes are an integral part of these financial statements.
16 | Wells Fargo Alternative Risk Premia Fund
Consolidated portfolio of investments—June 30, 2020
| Reference asset | Shares | Value | % of swap basket value | |||||||||||||
Long positions (continued) | ||||||||||||||||
Real Estate | ||||||||||||||||
Equity REITs | ||||||||||||||||
Canadian Apartment Properties | 8,400 | $ | 300,643 | 4.03 | % | |||||||||||
First Capital Real Estate Investments LLC | 7,400 | 75,633 | 1.01 | |||||||||||||
Gecina SA | 2,052 | 253,435 | 3.40 | |||||||||||||
ICADE | 1,811 | 126,457 | 1.70 | |||||||||||||
Mapletree Commercial Trust | 176,500 | 246,958 | 3.31 | |||||||||||||
Segro plc | 29,609 | 327,473 | 4.39 | |||||||||||||
Vornado Realty Trust | 4,576 | 174,847 | 2.35 | |||||||||||||
Real Estate Management & Development | ||||||||||||||||
Jones Lang LaSalle Incorporated | 2,206 | 228,228 | 3.06 | |||||||||||||
| 1,733,674 | ||||||||||||||||
|
| |||||||||||||||
Utilities | ||||||||||||||||
Electric Utilities | ||||||||||||||||
Chubu Electric Power Company Incorporated | 10,700 | 134,197 | 1.80 | |||||||||||||
NRG Energy Incorporated | 5,017 | 163,352 | 2.19 | |||||||||||||
The Chugoku Electric Power Company Incorporated | 32,900 | 438,622 | 5.88 | |||||||||||||
Tohoku Electric Power Company Incorporated | 22,700 | 215,638 | 2.89 | |||||||||||||
Gas Utilities | ||||||||||||||||
Toho Gas Company Limited | 3,900 | 194,927 | 2.61 | |||||||||||||
Independent Power & Renewable Electricity Producers | ||||||||||||||||
Uniper SE | 8,804 | 284,093 | 3.81 | |||||||||||||
Multi-Utilities | ||||||||||||||||
ATCO Limited Class I | 4,600 | 136,444 | 1.83 | |||||||||||||
Water Utilities | ||||||||||||||||
Severn Trent plc | 5,338 | 163,363 | 2.19 | |||||||||||||
| 1,730,636 | ||||||||||||||||
|
| |||||||||||||||
| Dividend yield | ||||||||||||||||
Preferred Stock | ||||||||||||||||
Materials | ||||||||||||||||
Chemicals | ||||||||||||||||
Fuchs Petrolub SE | 2.77 | % | 7,671 | 308,327 | 4.14 | |||||||||||
|
| |||||||||||||||
Short positions | ||||||||||||||||
Common Stocks | ||||||||||||||||
Communication Services | ||||||||||||||||
Diversified Telecommunication Services | ||||||||||||||||
Singapore Telecommunications | (71,800 | ) | (127,725 | ) | (1.71 | ) | ||||||||||
Telenor ASA | (11,271 | ) | (164,566 | ) | (2.21 | ) | ||||||||||
Wireless Telecommunication Services | ||||||||||||||||
Vodafone Group plc | (87,947 | ) | (139,814 | ) | (1.88 | ) | ||||||||||
| (432,105 | ) | |||||||||||||||
|
| |||||||||||||||
Consumer Discretionary | ||||||||||||||||
Auto Components | ||||||||||||||||
Continental AG | (1,683 | ) | (165,458 | ) | (2.22 | ) | ||||||||||
Automobiles | ||||||||||||||||
Daimler AG | (6,168 | ) | (250,938 | ) | (3.37 | ) | ||||||||||
Ford Motor Company | (16,562 | ) | (100,697 | ) | (1.35 | ) | ||||||||||
Nissan Motor Company Limited | (82,600 | ) | (306,318 | ) | (4.11 | ) | ||||||||||
The accompanying notes are an integral part of these financial statements.
Wells Fargo Alternative Risk Premia Fund | 17
Consolidated portfolio of investments—June 30, 2020
| Reference asset | Shares | Value | % of swap basket value | |||||||||||||
Short positions (continued) | ||||||||||||||||
Hotels, Restaurants & Leisure | ||||||||||||||||
Oriental Land Company Limited | (1,500 | ) | $ | (198,219 | ) | (2.66 | )% | |||||||||
Restaurant Brands International | (1,900 | ) | (103,411 | ) | (1.39 | ) | ||||||||||
Internet & Direct Marketing Retail | ||||||||||||||||
Prosus NV | (2,411 | ) | (224,123 | ) | (3.01 | ) | ||||||||||
Specialty Retail | ||||||||||||||||
Fast Retailing Company Limited | (600 | ) | (344,863 | ) | (4.63 | ) | ||||||||||
Sanrio Company Limited | (6,100 | ) | (94,594 | ) | (1.27 | ) | ||||||||||
Textiles, Apparel & Luxury Goods | ||||||||||||||||
Adidas AG | (474 | ) | (124,971 | ) | (1.68 | ) | ||||||||||
Compagnie Financière Richemont SA | (2,259 | ) | (145,706 | ) | (1.95 | ) | ||||||||||
LVMH Moet Hennessy Louis Vuitton SE | (547 | ) | (241,498 | ) | (3.24 | ) | ||||||||||
| (2,300,796 | ) | |||||||||||||||
|
| |||||||||||||||
Consumer Staples | ||||||||||||||||
Beverages | ||||||||||||||||
Anheuser Busch InBev SA | (3,919 | ) | (193,193 | ) | (2.59 | ) | ||||||||||
Food & Staples Retailing | ||||||||||||||||
Dairy Farm International Holdings Limited | (22,700 | ) | (106,070 | ) | (1.42 | ) | ||||||||||
Familymart Company | (10,900 | ) | (187,130 | ) | (2.51 | ) | ||||||||||
Tobacco | ||||||||||||||||
Altria Group Incorporated | (4,643 | ) | (182,238 | ) | (2.44 | ) | ||||||||||
| (668,631 | ) | |||||||||||||||
|
| |||||||||||||||
Energy | ||||||||||||||||
Energy Equipment & Services | ||||||||||||||||
Schlumberger Limited | (7,835 | ) | (144,086 | ) | (1.93 | ) | ||||||||||
Oil, Gas & Consumable Fuels | ||||||||||||||||
Bp plc | (35,339 | ) | (135,385 | ) | (1.82 | ) | ||||||||||
Enbridge Incorporated | (5,400 | ) | (164,196 | ) | (2.20 | ) | ||||||||||
| (443,667 | ) | |||||||||||||||
|
| |||||||||||||||
Financials | ||||||||||||||||
Banks | ||||||||||||||||
Hang Seng Bank Limited | (10,400 | ) | (175,160 | ) | (2.35 | ) | ||||||||||
HSBC Holdings plc | (18,919 | ) | (87,928 | ) | (1.18 | ) | ||||||||||
Mizuho Financial Group Incorporated | (282,200 | ) | (347,119 | ) | (4.66 | ) | ||||||||||
Royal Bank Of Canada | (1,200 | ) | (81,417 | ) | (1.09 | ) | ||||||||||
Toronto Dominion Bank | (4,800 | ) | (214,225 | ) | (2.87 | ) | ||||||||||
Westpac Banking Corporation | (15,768 | ) | (197,626 | ) | (2.65 | ) | ||||||||||
Capital Markets | ||||||||||||||||
CME Group Incorporated | (954 | ) | (155,063 | ) | (2.08 | ) | ||||||||||
Matsui Securities Company Limited | (14,100 | ) | (109,064 | ) | (1.46 | ) | ||||||||||
Consumer Finance | ||||||||||||||||
American Express Company | (1,644 | ) | (156,509 | ) | (2.10 | ) | ||||||||||
Diversified Financial Services | ||||||||||||||||
AMP Limited | (212,703 | ) | (275,222 | ) | (3.69 | ) | ||||||||||
Equitable Holdings Incorporated | (6,954 | ) | (134,143 | ) | (1.80 | ) | ||||||||||
Insurance | ||||||||||||||||
Insurance Australia Group | (75,225 | ) | (301,905 | ) | (4.05 | ) | ||||||||||
Japan Post Holdings Company Limited | (43,100 | ) | (307,591 | ) | (4.13 | ) | ||||||||||
The accompanying notes are an integral part of these financial statements.
18 | Wells Fargo Alternative Risk Premia Fund
Consolidated portfolio of investments—June 30, 2020
| Reference asset | Shares | Value | % of swap basket value | |||||||||||||
Short positions (continued) | ||||||||||||||||
Insurance (continued) | ||||||||||||||||
QBE Insurance Group Limited | (48,502 | ) | $ | (299,311 | ) | (4.01 | )% | |||||||||
Swiss Re AG | (3,941 | ) | (305,564 | ) | (4.10 | ) | ||||||||||
| (3,147,847 | ) | |||||||||||||||
|
| |||||||||||||||
Health Care | ||||||||||||||||
Biotechnology | ||||||||||||||||
Beigene Limited ADR | (408 | ) | (76,867 | ) | (1.03 | ) | ||||||||||
Exact Sciences Corporation | (1,479 | ) | (128,584 | ) | (1.72 | ) | ||||||||||
Health Care Equipment & Supplies | ||||||||||||||||
Alcon Incorporated | (4,737 | ) | (272,184 | ) | (3.65 | ) | ||||||||||
Pharmaceuticals | ||||||||||||||||
Bayer AG | (1,349 | ) | (99,993 | ) | (1.34 | ) | ||||||||||
Canopy Growth Corporation | (7,600 | ) | (123,103 | ) | (1.65 | ) | ||||||||||
| (700,731 | ) | |||||||||||||||
|
| |||||||||||||||
Industrials | ||||||||||||||||
Aerospace & Defense | ||||||||||||||||
Rolls Royce Holdings plc | (65,993 | ) | (232,996 | ) | (3.13 | ) | ||||||||||
The Boeing Company | (1,065 | ) | (195,215 | ) | (2.62 | ) | ||||||||||
Air Freight & Logistics | ||||||||||||||||
FedEx Corporation | (1,923 | ) | (269,643 | ) | (3.62 | ) | ||||||||||
Construction & Engineering | ||||||||||||||||
Vinci SA | (1,858 | ) | (172,280 | ) | (2.31 | ) | ||||||||||
Electrical Equipment | ||||||||||||||||
Nidec Corporation | (3,800 | ) | (256,001 | ) | (3.43 | ) | ||||||||||
Machinery | ||||||||||||||||
FANUC Corporation | (1,700 | ) | (304,759 | ) | (4.09 | ) | ||||||||||
Professional Services | ||||||||||||||||
Nielsen Holdings plc | (6,884 | ) | (102,296 | ) | (1.37 | ) | ||||||||||
Thomson Reuters Corporation | (3,200 | ) | (217,419 | ) | (2.92 | ) | ||||||||||
Road & Rail | ||||||||||||||||
Central Japan Railway Company | (1,500 | ) | (231,987 | ) | (3.11 | ) | ||||||||||
East Japan Railway Company | (3,800 | ) | (263,322 | ) | (3.53 | ) | ||||||||||
Nankai Electric Railway Company | (3,500 | ) | (80,153 | ) | (1.08 | ) | ||||||||||
Uber Technologies Incorporated | (2,886 | ) | (89,697 | ) | (1.20 | ) | ||||||||||
| (2,415,768 | ) | |||||||||||||||
|
| |||||||||||||||
Information Technology | ||||||||||||||||
Communications Equipment | ||||||||||||||||
Nokia Oyj | (30,941 | ) | (135,208 | ) | (1.81 | ) | ||||||||||
Electronic Equipment, Instruments & Components | ||||||||||||||||
Keyence Corporation | (800 | ) | (335,249 | ) | (4.50 | ) | ||||||||||
Kyocera Corporation | (2,100 | ) | (114,628 | ) | (1.54 | ) | ||||||||||
IT Services | ||||||||||||||||
Fidelity National Information Service | (1,314 | ) | (176,194 | ) | (2.36 | ) | ||||||||||
Global Payments Incorporated | (1,172 | ) | (198,795 | ) | (2.67 | ) | ||||||||||
PayPal Holdings Incorporated | (1,171 | ) | (204,023 | ) | (2.74 | ) | ||||||||||
Visa Incorporated Class A | (955 | ) | (184,477 | ) | (2.47 | ) | ||||||||||
WEX Incorporated | (461 | ) | (76,070 | ) | (1.02 | ) | ||||||||||
Wix.com Limited | (441 | ) | (112,993 | ) | (1.52 | ) | ||||||||||
Semiconductors & Semiconductor Equipment | ||||||||||||||||
Broadcom Incorporated | (557 | ) | (175,795 | ) | (2.36 | ) | ||||||||||
Nxp Semiconductors NV | (2,005 | ) | (228,650 | ) | (3.07 | ) | ||||||||||
The accompanying notes are an integral part of these financial statements.
Wells Fargo Alternative Risk Premia Fund | 19
Consolidated portfolio of investments—June 30, 2020
| Reference asset | Shares | Value | % of swap basket value | |||||||||||||
Short positions (continued) | ||||||||||||||||
Software | ||||||||||||||||
salesforce.com Incorporated | (836 | ) | $ | (156,608 | ) | (2.10 | )% | |||||||||
Technology Hardware, Storage & Peripherals | ||||||||||||||||
Canon Incorporated | (17,000 | ) | (339,116 | ) | (4.55 | ) | ||||||||||
Western Digital Corporation | (2,172 | ) | (95,894 | ) | (1.29 | ) | ||||||||||
| (2,533,700 | ) | |||||||||||||||
|
| |||||||||||||||
Materials | ||||||||||||||||
Chemicals | ||||||||||||||||
Corteva Incorporated | (4,832 | ) | (129,449 | ) | (1.74 | ) | ||||||||||
Dow Incorporated | (3,968 | ) | (161,736 | ) | (2.17 | ) | ||||||||||
Dupont De Nemours Incorporated | (3,551 | ) | (188,665 | ) | (2.53 | ) | ||||||||||
Nutrien Limited | (2,800 | ) | (89,965 | ) | (1.21 | ) | ||||||||||
The Mosaic Company | (9,519 | ) | (119,083 | ) | (1.60 | ) | ||||||||||
Metals & Mining | ||||||||||||||||
Agnico Eagle Mines Limited | (1,700 | ) | (108,855 | ) | (1.46 | ) | ||||||||||
Freeport-McMoRan Incorporated | (10,569 | ) | (122,283 | ) | (1.64 | ) | ||||||||||
Wheaton Precious Metals Corporation | (1,700 | ) | (74,769 | ) | (1.00 | ) | ||||||||||
| (994,805 | ) | |||||||||||||||
|
| |||||||||||||||
Real Estate | ||||||||||||||||
Equity REITs | ||||||||||||||||
British Land Company plc | (33,987 | ) | (162,576 | ) | (2.18 | ) | ||||||||||
Land Securities Group plc | (21,743 | ) | (148,562 | ) | (1.99 | ) | ||||||||||
Vereit Incorporated | (24,050 | ) | (154,642 | ) | (2.07 | ) | ||||||||||
Real Estate Management & Development | ||||||||||||||||
Mitsubishi Estate Company Limited | (14,000 | ) | (208,625 | ) | (2.80 | ) | ||||||||||
Swire Properties Limited | (69,200 | ) | (176,679 | ) | (2.37 | ) | ||||||||||
| (851,084 | ) | |||||||||||||||
|
| |||||||||||||||
Utilities | ||||||||||||||||
Gas Utilities | ||||||||||||||||
The Hong Kong and China Gas Company Limited | (111,000 | ) | (172,513 | ) | (2.31 | ) | ||||||||||
|
| |||||||||||||||
Abbreviations:
| ADR | American depositary receipt |
| REIT | Real estate investment trust |
The accompanying notes are an integral part of these financial statements.
20 | Wells Fargo Alternative Risk Premia Fund
Consolidated statement of assets and liabilities—June 30, 2020
Assets |
| |||
Investments in unaffiliated securities, at value (cost $49,684,042) | $ | 49,714,157 | ||
Investments in affiliated securities, at value (cost $7,855,265) | 7,855,265 | |||
Cash at broker segregated for forward foreign currency contracts | 570,000 | |||
Segregated cash for futures contracts | 7,885,296 | |||
Due from broker | 101,159 | |||
Receivable for investments sold | 147,825 | |||
Receivable for dividends | 899 | |||
Unrealized gains on forward foreign currency contracts | 790,898 | |||
Unrealized gains on swap contracts | 159,245 | |||
Prepaid expenses and other assets | 22,934 | |||
|
| |||
Total assets | 67,247,678 | |||
|
| |||
Liabilities |
| |||
Payable for daily variation margin on open futures contracts | 103,360 | |||
Unrealized losses on forward foreign currency contracts | 1,314,502 | |||
Management fee payable | 9,061 | |||
Administration fees payable | 1,824 | |||
Trustees’ fees and expenses payable | 4,484 | |||
Accrued expenses and other liabilities | 29,349 | |||
|
| |||
Total liabilities | 1,462,580 | |||
|
| |||
Total net assets | $ | 65,785,098 | ||
|
| |||
Net assets consist of |
| |||
Paid-in capital | $ | 79,759,613 | ||
Total distributable loss | (13,974,515 | ) | ||
|
| |||
Total net assets | $ | 65,785,098 | ||
|
| |||
Computation of net asset value per share |
| |||
Net assets – Class R6 | $ | 65,765,060 | ||
Shares outstanding – Class R6¹ | 8,199,073 | |||
Net asset value per share – Class R6 | $8.02 | |||
Net assets – Institutional Class | $ | 20,038 | ||
Shares outstanding – Institutional Class¹ | 2,500 | |||
Net asset value per share – Institutional Class | $8.02 | |||
| 1 | The Fund has an unlimited number of authorized shares. |
The accompanying notes are an integral part of these financial statements.
Wells Fargo Alternative Risk Premia Fund | 21
Consolidated statement of operations—year ended June 30, 2020
Investment income |
| |||
Interest | $ | 1,348,755 | ||
Income from affiliated securities | 105,101 | |||
|
| |||
Total investment income | 1,453,856 | |||
|
| |||
Expenses |
| |||
Management fee | 528,839 | |||
Administration fees | ||||
Class R6 | 26,435 | |||
Institutional Class | 31 | |||
Custody and accounting fees | 65,723 | |||
Professional fees | 100,000 | |||
Registration fees | 59,014 | |||
Shareholder report expenses | 70,937 | |||
Trustees’ fees and expenses | 20,725 | |||
Other fees and expenses | 48,031 | |||
|
| |||
Total expenses | 919,735 | |||
Less: Fee waivers and/or expense reimbursements | ||||
Fund-level | (373,589 | ) | ||
Institutional Class | (2 | ) | ||
|
| |||
Net expenses | 546,144 | |||
|
| |||
Net investment income | 907,712 | |||
|
| |||
Realized and unrealized gains (losses) on investments |
| |||
Net realized gains (losses) on |
| |||
Unaffiliated securities and foreign currency | 64,780 | |||
Futures contracts | (5,156,962 | ) | ||
Forward foreign currency contracts | 561,199 | |||
Swap contracts | (12,202,380 | ) | ||
|
| |||
Net realized losses on investments | (16,733,363 | ) | ||
|
| |||
Net change in unrealized gains (losses) on |
| |||
Unaffiliated securities | 12,720 | |||
Futures contracts | (637,376 | ) | ||
Forward foreign currency contracts | (483,412 | ) | ||
Swap contracts | 141,501 | |||
|
| |||
Net change in unrealized gains (losses) on investments | (966,567 | ) | ||
|
| |||
Net realized and unrealized gains (losses) on investments | (17,699,930 | ) | ||
|
| |||
Net decrease in net assets resulting from operations | $ | (16,792,218 | ) | |
|
| |||
The accompanying notes are an integral part of these financial statements.
22 | Wells Fargo Alternative Risk Premia Fund
Consolidated statement of changes in net assets
| Year ended June 30, 2020 | Year ended June 30, 20191 | |||||||||||||||
Operations | ||||||||||||||||
Net investment income | $ | 907,712 | $ | 293,577 | ||||||||||||
Net realized losses on investments | (16,733,363 | ) | (1,635,932 | ) | ||||||||||||
Net change in unrealized gains (losses) on investments | (966,567 | ) | 323,292 | |||||||||||||
|
| |||||||||||||||
Net decrease in net assets resulting from operations | (16,792,218 | ) | (1,019,063 | ) | ||||||||||||
|
| |||||||||||||||
Distributions to shareholders from net investment income and net | ||||||||||||||||
Class R6 | (1,035,896 | ) | 0 | |||||||||||||
Institutional Class | (233 | ) | 0 | |||||||||||||
|
| |||||||||||||||
Total distributions to shareholders | (1,036,129 | ) | 0 | |||||||||||||
|
| |||||||||||||||
Capital share transactions | Shares | Shares | ||||||||||||||
Proceeds from shares sold | ||||||||||||||||
Class R6 | 8,031,702 | 77,333,419 | 3,997,500 | 39,975,000 | ||||||||||||
Institutional Class | 0 | 0 | 2,500 | 25,000 | ||||||||||||
|
| |||||||||||||||
| 77,333,419 | 40,000,000 | |||||||||||||||
|
| |||||||||||||||
Reinvestment of distributions | ||||||||||||||||
Class R6 | 64,136 | 622,954 | 0 | 0 | ||||||||||||
|
| |||||||||||||||
Payment for shares redeemed | ||||||||||||||||
Class R6 | (3,894,265 | ) | (33,323,865 | ) | 0 | 0 | ||||||||||
|
| |||||||||||||||
Net increase in net assets resulting from capital share transactions | 44,632,508 | 40,000,000 | ||||||||||||||
|
| |||||||||||||||
Total increase in net assets | 26,804,161 | 38,980,937 | ||||||||||||||
|
| |||||||||||||||
Net assets | ||||||||||||||||
Beginning of period | 38,980,937 | 0 | ||||||||||||||
|
| |||||||||||||||
End of period | $ | 65,785,098 | $ | 38,980,937 | ||||||||||||
|
| |||||||||||||||
| 1 | For the period from January 29, 2019 (commencement of operations) to June 30, 2019 |
The accompanying notes are an integral part of these financial statements.
Wells Fargo Alternative Risk Premia Fund | 23
Consolidated financial highlights
(For a share outstanding throughout each period)
| Year ended June 30 | ||||||||
| CLASS R6 | 2020 | 20191 | ||||||
Net asset value, beginning of period | $9.75 | $10.00 | ||||||
Net investment income | 0.10 | 0.07 | ||||||
Net realized and unrealized gains (losses) on investments | (1.73 | ) | (0.32 | ) | ||||
|
|
|
| |||||
Total from investment operations | (1.63 | ) | (0.25 | ) | ||||
Distributions to shareholders from | ||||||||
Net investment income | (0.03 | ) | 0.00 | |||||
Net realized gains | (0.07 | ) | 0.00 | |||||
|
|
|
| |||||
Total distributions to shareholders | (0.10 | ) | 0.00 | |||||
Net asset value, end of period | $8.02 | $9.75 | ||||||
Total return2 | (16.78 | )% | (2.50 | )% | ||||
Ratios to average net assets (annualized) | ||||||||
Gross expenses | 1.04 | % | 1.56 | % | ||||
Net expenses | 0.62 | % | 0.62 | % | ||||
Net investment income | 1.03 | % | 1.78 | % | ||||
Supplemental data | ||||||||
Portfolio turnover rate | 0 | % | 0 | % | ||||
Net assets, end of period (000s omitted) | $65,765 | $38,957 | ||||||
| 1 | For the period from January 29, 2019 (commencement of class operations) to June 30, 2019 |
| 2 | Returns for periods of less than one year are not annualized. |
The accompanying notes are an integral part of these financial statements.
24 | Wells Fargo Alternative Risk Premia Fund
Consolidated financial highlights
(For a share outstanding throughout each period)
| Year ended June 30 | ||||||||
| INSTITUTIONAL CLASS | 2020 | 20191 | ||||||
Net asset value, beginning of period | $9.74 | $10.00 | ||||||
Net investment income | 0.09 | 0.07 | ||||||
Net realized and unrealized gains (losses) on investments | (1.72 | ) | (0.33 | ) | ||||
|
|
|
| |||||
Total from investment operations | (1.63 | ) | (0.26 | ) | ||||
Distributions to shareholders from | ||||||||
Net investment income | (0.02 | ) | 0.00 | |||||
Net realized gains | (0.07 | ) | 0.00 | |||||
|
|
|
| |||||
Total distributions to shareholders | (0.09 | ) | 0.00 | |||||
Net asset value, end of period | $8.02 | $9.74 | ||||||
Total return2 | (16.87 | )% | (2.60 | )% | ||||
Ratios to average net assets (annualized) | ||||||||
Gross expenses | 1.15 | % | 1.68 | % | ||||
Net expenses | 0.72 | % | 0.72 | % | ||||
Net investment income | 0.95 | % | 1.69 | % | ||||
Supplemental data | ||||||||
Portfolio turnover rate | 0 | % | 0 | % | ||||
Net assets, end of period (000s omitted) | $20 | $24 | ||||||
| 1 | For the period from January 29, 2019 (commencement of class operations) to June 30, 2019 |
| 2 | Returns for periods of less than one year are not annualized. |
The accompanying notes are an integral part of these financial statements.
Wells Fargo Alternative Risk Premia Fund | 25
Consolidated notes to financial statements
1. ORGANIZATION
Wells Fargo Funds Trust (the “Trust”), a Delaware statutory trust organized on March 10, 1999, is an open-end management investment company registered under the Investment Company Act of 1940, as amended (the “1940 Act”). As an investment company, the Trust follows the accounting and reporting guidance in Financial Accounting Standards Board (“FASB”) Accounting Standards Codification Topic 946, Financial Services – Investment Companies. These financial statements report on the Wells Fargo Alternative Risk Premia Fund (the “Fund”) which is a diversified series of the Trust.
2. INVESTMENT IN SUBSIDIARY
The Fund invests in direct or indirect investments in various derivatives, including commodity-linked derivatives, through Alt Risk Premia Special Investments (Cayman) Ltd. (the “Subsidiary”), a wholly owned subsidiary incorporated on October 2, 2018 under the laws of the Cayman Islands as an exempted segregated portfolio company with limited liability. As of June 30, 2020, the Subsidiary primarily had $67,364 in variation margin payable related to open futures contracts representing (1.53)% of its net assets. The Fund is the sole shareholder of the Subsidiary. As of June 30, 2020, the Fund held $4,409,262 in the Subsidiary, representing 6.70% of the Fund’s net assets prior to consolidation.
The consolidated financial statements of the Fund include the financial results of the Subsidiary. The Consolidated Portfolio of Investments includes positions of the Fund and the Subsidiary and the consolidated financial statements include the accounts of the Fund and the Subsidiary. Accordingly, all interfund balances and transactions between the Fund and the Subsidiary have been eliminated in consolidation.
3. SIGNIFICANT ACCOUNTING POLICIES
The following significant accounting policies, which are consistently followed in the preparation of the financial statements of the Fund, are in conformity with U.S. generally accepted accounting principles which require management to make estimates and assumptions that affect the reported amounts of assets and liabilities, disclosure of contingent assets and liabilities at the date of the financial statements, and the reported amounts of revenues and expenses during the reporting period. Actual results could differ from those estimates.
Securities valuation
All investments are valued each business day as of the close of regular trading on the New York Stock Exchange (generally 4 p.m. Eastern Time), although the Fund may deviate from this calculation time under unusual or unexpected circumstances.
Futures contracts that are listed on a foreign or domestic exchange or market are valued at the official closing price or, if none, the last sales price. If no sale occurs on the principal exchange or market that day, a fair value price will be determined in accordance with the Fund’s Valuation Procedures.
Forward foreign currency contracts are recorded at the forward rate provided by an independent foreign currency pricing source at a time each business day specified by the Wells Fargo Asset Management Pricing Committee at Wells Fargo Funds Management, LLC (“Funds Management”).
Swap contracts are valued at the evaluated price provided by an independent pricing service or, if a reliable price is not available, the quoted bid price from an independent broker-dealer.
Debt securities are valued at the evaluated bid price provided by an independent pricing service (e.g. taking into account various factors, including yields, maturities, or credit ratings) or, if a reliable price is not available, the quoted bid price from an independent broker-dealer.
Investments in registered open-end investment companies are valued at net asset value.
Investments which are not valued using any of the methods discussed above are valued at their fair value, as determined in good faith by the Board of Trustees of the Fund. The Board of Trustees has established a Valuation Committee comprised of the Trustees and has delegated to it the authority to take any actions regarding the valuation of portfolio securities that the Valuation Committee deems necessary or appropriate, including determining the fair value of portfolio securities, unless the determination has been delegated to the Wells Fargo Asset Management Pricing. The Board of Trustees retains the authority to make or ratify any valuation decisions or approve any changes to the Valuation Procedures as it deems appropriate. On a quarterly basis, the Board of Trustees receives reports on any valuation actions taken by the Valuation Committee or the Wells Fargo Asset Management Pricing Committee which may include items for ratification.
Foreign currency translation
The accounting records of the Fund are maintained in U.S. dollars. The values of other assets and liabilities denominated in foreign currencies are translated into U.S. dollars at rates provided by an independent foreign currency pricing source at a time
26 | Wells Fargo Alternative Risk Premia Fund
Consolidated notes to financial statements
each business day specified by the Wells Fargo Asset Management Pricing Committee. Purchases and sales of securities, and income and expenses are converted at the rate of exchange on the respective dates of such transactions. Net realized foreign exchange gains or losses arise from sales of foreign currencies, currency gains or losses realized between the trade and settlement dates on securities transactions, and the difference between the amounts of dividends, interest and foreign withholding taxes recorded and the U.S. dollar equivalent of the amounts actually paid or received. Net unrealized foreign exchange gains and losses arise from changes in the fair value of assets and liabilities other than investments in securities resulting from changes in exchange rates. The changes in net assets arising from changes in exchange rates of securities and the changes in net assets resulting from changes in market prices of securities are not separately presented. Such changes are included in net realized and unrealized gains or losses from investments.
Forward foreign currency contracts
A forward foreign currency contract is an agreement between two parties to purchase or sell a specific currency for an agreed-upon price at a future date. The Fund enters into forward foreign currency contracts to facilitate transactions in foreign-denominated securities and to attempt to minimize the risk to the Fund from adverse changes in the relationship between currencies. Forward foreign currency contracts are recorded at the forward rate and marked-to-market daily. When the contracts are closed, realized gains and losses arising from such transactions are recorded as realized gains or losses on forward foreign currency contracts. The Fund is subject to foreign currency risk and may be exposed to risks if the counterparties to the contracts are unable to meet the terms of their contracts or if the value of the foreign currency changes unfavorably. The Fund’s maximum risk of loss from counterparty credit risk is the unrealized gains on the contracts. This risk may be mitigated if there is a master netting arrangement between the Fund and the counterparty.
Futures contracts
Futures contracts are agreements between the Fund and a counterparty to buy or sell a specific amount of a commodity, financial instrument or currency at a specified price and on a specified date. The Fund may buy and sell futures contracts in order to gain exposure to, or protect against, changes in interest rates, security values, commodities, and foreign exchange rates and is subject to interest rate risk, equity price risk, commodity risk, and foreign currency risk. The primary risks associated with the use of futures contracts are the imperfect correlation between changes in market values of securities held by the Fund and the prices of futures contracts, and the possibility of an illiquid market. Futures contracts are generally entered into on a regulated futures exchange and cleared through a clearinghouse associated with the exchange. With futures contracts, there is minimal counterparty risk to the Fund since futures contracts are exchange traded and the exchange’s clearinghouse, as the counterparty to all exchange traded futures, guarantees the futures contracts against default.
Upon entering into a futures contracts, the Fund is required to deposit either cash or securities (initial margin) with the broker in an amount equal to a certain percentage of the contract value. Subsequent payments (variation margin) are paid to or from the broker each day equal to the daily changes in the contract value. Such payments are recorded as unrealized gains or losses and, if any, shown as variation margin receivable (payable) in the Consolidated Statement of Assets and Liabilities. Should the Fund fail to make requested variation margin payments, the broker can gain access to the initial margin to satisfy the Fund’s payment obligations. When the contracts are closed, a realized gain or loss is recorded in the Consolidated Statement of Operations.
Swap contracts
Swap contracts are agreements between the Fund and a counterparty to exchange a series of cash flows over a specified period. Swap agreements are privately negotiated contracts between the Fund that are entered into as bilateral contracts in the OTC market (“OTC swaps”) or centrally cleared (“centrally cleared swaps”) with a central clearinghouse.
The Fund entered into OTC swaps. For OTC swaps, any upfront premiums paid and any upfront fees received are shown as swap premiums paid and swap premiums received, respectively, in the Consolidated Statement of Assets and Liabilities and amortized over the term of the contract. The daily fluctuations in market value are recorded as unrealized gains or losses on OTC swaps in the Consolidated Statement of Assets and Liabilities. Payments received or paid are recorded in the Consolidated Statement of Operations as realized gains or losses, respectively. When an OTC swap is terminated, a realized gain or loss is recorded in the Consolidated Statement of Operations equal to the difference between the proceeds from (or cost of) the closing transaction and the Fund’s basis in the contract, if any. Generally, the basis of the contract is the premium received or paid.
Total return basket swaps
The Fund may enter into total return basket swap contracts to obtain exposure to a custom basket of long and short securities without owning such securities. The Fund has the ability to trade in and out of the long and short positions within the swap and receives the economic benefits and risks equivalent to direct investments in these positions. Under the terms of the contract, the Fund and the counterparty exchange periodic payments based on the total return of reference assets
Wells Fargo Alternative Risk Premia Fund | 27
Consolidated notes to financial statements
within a basket for a specified interest rate. Benefits and risks include capital appreciation (depreciation), corporate actions and dividends received and paid, all of which are reflected in the swap’s market value. The market value also includes interest charges and credits (“financing fees”) related to the notional values of the long and short positions and cash balances within the swap. To the extent the total return of the reference assets exceeds or falls short of the offsetting interest rate obligation, the Fund will receive a payment from, or make a payment to, the counterparty. Positions within the swap are reset periodically. During a reset, any unrealized appreciation (depreciation) on positions and accrued financing fees become available for cash settlement between the Fund and the counterparty. The amounts that are available for cash settlement are recorded as realized gains or losses on swap contracts in the Consolidated Statement of Operations. Cash settlement in and out of the swap may occur at a reset date or any other date, at the discretion of the Fund and the counterparty, over the life of the agreement. Certain swaps have no stated expiration and can be terminated by either party at any time.
The Fund is exposed to risks if the counterparty defaults on its obligation to perform, or if there are unfavorable changes in the fluctuation of interest rates or in the price of the reference securities in the basket. In addition to counterparty credit risk, the Fund is subject to liquidity risk if there is no market for the contracts and is exposed to the market risk associated with the reference securities in the basket.
Security transactions and income recognition
Securities transactions are recorded on a trade date basis. Realized gains or losses are recorded on the basis of identified cost.
Interest income is accrued daily and bond discounts are accreted and premiums are amortized daily. To the extent debt obligations are placed on non-accrual status, any related interest income may be reduced by writing off interest receivables when the collection of all or a portion of interest has been determined to be doubtful based on consistently applied procedures and the fair value has decreased. If the issuer subsequently resumes interest payments or when the collectability of interest is reasonably assured, the debt obligation is removed from non-accrual status.
Distributions to shareholders
Distributions to shareholders from net investment income and any net realized gains are recorded on the ex-dividend date and paid at least annually. Such distributions are determined in accordance with income tax regulations and may differ from U.S. generally accepted accounting principles. Dividend sources are estimated at the time of declaration. The tax character of distributions is determined as of the Fund’s fiscal year end. Therefore, a portion of the Fund’s distributions made prior to the Fund’s fiscal year end may be categorized as a tax return of capital at year end.
Federal and other taxes
The Fund intends to continue to qualify as a regulated investment company by distributing substantially all of its investment company taxable income and any net realized capital gains (after reduction for capital loss carryforwards) sufficient to relieve it from all, or substantially all, federal income taxes. Accordingly, no provision for federal income taxes was required.
The Subsidiary is classified as a controlled foreign corporation under Subchapter N of the Internal Revenue Code. Therefore, the Fund is required to increase its taxable income by its share of the Subsidiary’s income. Net investment losses of the Subsidiary cannot be deducted by the Fund in the current period nor carried forward to offset taxable income in future periods.
The Fund’s income and federal excise tax returns and all financial records supporting those returns for the fiscal years since commencement of operations are subject to examination by the federal and Delaware revenue authorities. Management has analyzed the Fund’s tax positions taken on federal, state, and foreign tax returns for all open tax years and does not believe that there are any uncertain tax positions that require recognition of a tax liability.
As of June 30, 2020, the aggregate cost of all investments for federal income tax purposes was $56,953,210 and the unrealized gains (losses) consisted of:
Gross unrealized gains | $ | 352,218 | ||
Gross unrealized losses | (409,401 | ) | ||
Net unrealized losses | $ | (57,183 | ) | |
Reclassifications are made to the Fund’s capital accounts for permanent tax differences to reflect income and gains available for distribution (or available capital loss carryforwards) under federal income tax regulations. U.S. generally accepted accounting principles require that certain components of net assets be adjusted to reflect permanent differences between financial and tax reporting. These reclassifications have no effect on net assets or net asset values per share. The primary permanent difference
28 | Wells Fargo Alternative Risk Premia Fund
Consolidated notes to financial statements
causing such reclassification is due to losses from a controlled foreign corporation. At June 30, 2020, as a result of permanent book-to-tax differences, the following reclassification adjustments were made on the Consolidated Statement of Assets and Liabilities:
| Paid-in capital | Total distributable loss | |
| $(3,153,777) | $3,153,777 | |
As of June 30, 2020, the Fund had capital loss carryforwards which consist of $2,479,978 in short-term capital losses and $112,066 in long-term capital losses.
As of June 30, 2020, the Fund had a qualified late-year ordinary loss of $11,325,293 which will be recognized on the first day of the following fiscal year.
Class allocations
The separate classes of shares offered by the Fund differ principally in administration fees. Class specific expenses are charged directly to that share class. Investment income, common fund-level expenses, and realized and unrealized gains (losses) on investments are allocated daily to each class of shares based on the relative proportion of net assets of each class.
4. FAIR VALUATION MEASUREMENTS
Fair value measurements of investments are determined within a framework that has established a fair value hierarchy based upon the various data inputs utilized in determining the value of the Fund’s investments. The three-level hierarchy gives the highest priority to unadjusted quoted prices in active markets for identical assets or liabilities (Level 1) and the lowest priority to unobservable inputs (Level 3). The Fund’s investments are classified within the fair value hierarchy based on the lowest level of input that is significant to the fair value measurement. The inputs are summarized into three broad levels as follows:
| ∎ | Level 1 – quoted prices in active markets for identical securities |
| ∎ | Level 2 – other significant observable inputs (including quoted prices for similar securities, interest rates, prepayment speeds, credit risk, etc.) |
| ∎ | Level 3 – significant unobservable inputs (including the Fund’s own assumptions in determining the fair value of investments) |
The inputs or methodologies used for valuing investments in securities are not necessarily an indication of the risk associated with investing in those securities.
The following is a summary of the inputs used in valuing the Fund’s assets and liabilities as of June 30, 2020:
| Quoted prices (Level 1) | Other significant observable inputs (Level 2) | Significant (Level 3) | Total | |||||||||||||
Assets | ||||||||||||||||
Investments in: | ||||||||||||||||
Short-term investments | ||||||||||||||||
Investment companies | $ | 7,855,265 | $ | 0 | $ | 0 | $ | 7,855,265 | ||||||||
U.S. Treasury securities | 49,714,157 | 0 | 0 | 49,714,157 | ||||||||||||
| 57,569,422 | 0 | 0 | 57,569,422 | |||||||||||||
Futures contracts | 736,197 | 0 | 0 | 736,197 | ||||||||||||
Forward foreign currency contracts | 0 | 790,898 | 0 | 790,898 | ||||||||||||
Swap contracts | 0 | 159,245 | 0 | 159,245 | ||||||||||||
Total assets | $ | 58,305,619 | $ | 950,143 | $ | 0 | $ | 59,255,762 | ||||||||
Liabilities | ||||||||||||||||
Futures contracts | $ | 1,045,233 | $ | 0 | $ | 0 | $ | 1,045,233 | ||||||||
Forward foreign currency contracts | 0 | 1,314,502 | 0 | 1,314,502 | ||||||||||||
Total liabilities | $ | 1,045,233 | $ | 1,314,502 | $ | 0 | $ | 2,359,735 | ||||||||
Futures contracts, forward foreign currency contracts and swap contracts are reported at their cumulative unrealized gains (losses) at measurement date as reported in the tables following the Consolidated Portfolio of Investments. For futures contracts, the current day’s variation margin is reported on the Consolidated Statement of Assets and Liabilities. All other assets and liabilities are reported at their market value at measurement date.
Wells Fargo Alternative Risk Premia Fund | 29
Consolidated notes to financial statements
For the year ended June 30, 2020, the Fund did not have any transfers into/out of Level 3.
5. TRANSACTIONS WITH AFFILIATES
Management fee
Funds Management, an indirect wholly owned subsidiary of Wells Fargo & Company (“Wells Fargo”), is the manager of the Fund and provides advisory and fund-level administrative services under an investment management agreement. Under the investment management agreement, Funds Management is responsible for, among other services, implementing the investment objectives and strategies of the Fund, supervising the subadvisers and providing fund-level administrative services in connection with the Fund’s operations. As compensation for its services under the investment management agreement, Funds Management is entitled to receive a management fee at the following annual rate based on the Fund’s average daily net assets:
| Average daily net assets | Management fee | |
First $500 million | 0.600% | |
Next $500 million | 0.575 | |
Next $2 billion | 0.550 | |
Next $2 billion | 0.525 | |
Next $5 billion | 0.490 | |
Over $10 billion | 0.480 | |
For the year ended June 30, 2020, the management fee was equivalent to an annual rate of 0.60% of the Fund’s average daily net assets.
The Subsidiary has entered into a separate advisory contract with Funds Management to manage the investment and reinvestment of its assets in conformity with its investment objectives and restrictions. Under this agreement, the Subsidiary does not pay Funds Management a fee for its services.
Funds Management has retained the services of certain subavisers to provide daily portfolio management to the Fund. The fee for subadvisory services is borne by Funds Management. Wells Capital Management Incorporated (“WellsCap”) and Wells Fargo
Asset Management (International) Limited (“WFAM(I) Ltd”), each an affiliate of Funds Management and an indirect wholly owned subsidiary of Wells Fargo, serve as subadvisers to the Fund. WellsCap receives a subadvisory fee at an annual rate starting at 0.20% and declining to 0.10% as the average daily net assets of the Fund increase. WFAM(I) Ltd receives a subadvisory fee for its asset allocation services at an annual rate of 0.10% of the Fund’s average daily net assets and a fee for portfolio management services on the assets it co-manages with WellsCap at an annual rate starting at 0.15% and declining to 0.075%. Effective August 1, 2019, Wells Fargo Asset Management (International), LLC, the subadviser at the time to the Fund, had merged with WFAM(I) Ltd and WFAM(I) Ltd became the subadviser to the Fund. This transaction did not result in any changes to the services provided to the Fund or to the strategies or fees and expenses.
Administration fees
Under a class-level administration agreement, Funds Management provides class-level administrative services to the Fund, which includes paying fees and expenses for services provided by the transfer agent, sub-transfer agents, omnibus account servicers and record-keepers. As compensation for its services under the class-level administration agreement, Funds Management receives an annual fee which is calculated based on the average daily net assets of each class as follows:
| Class-level administration fee | ||
Class R6 | 0.03% | |
Institutional Class | 0.13 | |
Waivers and/or expense reimbursements
Funds Management has contractually waived and/or reimbursed management and administration fees to the extent necessary to maintain certain net operating expense ratios for the Fund. When each class of the Fund has exceeded its expense cap, Funds Management has waived fees and/or reimbursed expenses from fund-level expenses on a proportionate basis and then from class specific expenses. When only certain classes exceed their expense caps, waivers and/or reimbursements are applied
30 | Wells Fargo Alternative Risk Premia Fund
Consolidated notes to financial statements
against class specific expenses before fund-level expenses. Funds Management has committed through October 31, 2020 to waive fees and/or reimburse expenses to the extent necessary to cap the Fund’s expenses at 0.62% for Class R6 shares and 0.72% for Institutional Class shares. Prior to or after the commitment expiration date, the cap may be increased or the commitment to maintain the cap may be terminated only with the approval of the Board of Trustees.
Interfund transactions
The Fund may purchase or sell portfolio investment securities to certain other Wells Fargo affiliates pursuant to Rule 17a-7 under the 1940 Act and under procedures adopted by the Board of Trustees. The procedures have been designed to ensure that these interfund transactions, which do not incur broker commissions, are effected at current market prices.
6. INVESTMENT PORTFOLIO TRANSACTIONS
For the year ended June 30, 2020, the Fund did not have any purchases and sales of securities, excluding any short-term securities.
7. DERIVATIVE TRANSACTIONS
During the year ended June 30, 2020, the Fund entered into futures contracts, forward foreign currency contracts, and swap contracts to gain market exposure as a substitute for taking a position in the underlying security or basket of securities aiming to achieve Fund’s risk return objective.
The volume of the Fund’s derivative activity during the year ended June 30, 2020 was as follows:
Futures contracts | ||||
Average notional balance on long futures | $ | 140,371,359 | ||
Average notional balance on short futures | 51,299,998 | |||
Forward foreign currency contracts | ||||
Average contract amounts to buy | $ | 85,411,489 | ||
Average contract amounts to sell | 100,836,180 | |||
Swap contracts | ||||
Average notional balance | $ | 14,496,339 | ||
The Fund’s swap transactions may contain provisions for early termination in the event the net assets of the Fund declines below specific levels identified by the counterparty. If these levels are triggered, the counterparty may terminate the transaction and seek payment or request full collateralization of the derivative transactions in net liability positions.
A summary of the location of derivative instruments on the financial statements by primary risk exposure is outlined in the following tables.
The fair value of derivative instruments as of June 30, 2020 by risk type was as follows for the Fund:
Asset derivatives | Liability derivatives | |||||||||||
| Consolidated Statement of Assets and Liabilities location | Fair value | Consolidated Statement of Assets and Liabilities location | Fair value | |||||||||
Interest rate risk | Unrealized gains on futures contracts | $ | 180,057 | * | Unrealized losses on futures contracts | $ | 443,325 | * | ||||
Commodity risk | Unrealized gains on futures contracts | 435,383 | * | Unrealized losses on futures contracts | 560,425 | * | ||||||
Equity risk | Unrealized gains on futures contracts | 120,757 | * | Unrealized losses on futures contracts | 41,483 | * | ||||||
| Unrealized gains on swap contracts | 159,245 | * | Unrealized losses on swap contracts | 0 | * | |||||||
Foreign currency risk | Unrealized gains on forward foreign currency contracts | 790,898 | * | Unrealized losses on forward foreign currency contracts | 1,314,502 | * | ||||||
| $ | 1,686,340 | $ | 2,359,735 | |||||||||
| * | Amount represents cumulative unrealized gains (losses) as reported in the table following the Consolidated Portfolio of Investments. For futures contracts, the current day’s variation margin as of June 30, 2020 is reported separately on the Consolidated Statement of Assets and Liabilities. |
Wells Fargo Alternative Risk Premia Fund | 31
Consolidated notes to financial statements
The effect of derivative instruments on the Consolidated Statement of Operations for the year ended June 30, 2020 was as follows for the Fund:
| Amount of realized gains (losses) on derivatives | ||||||||||||||||
| Futures contracts | Forward foreign currency contracts | Swap contracts | Total | |||||||||||||
Interest rate risk | $ | (562,038 | ) | $ | 0 | $ | 0 | $ | (562,038 | ) | ||||||
Commodity risk | (2,814,620 | ) | 0 | 0 | (2,814,620 | ) | ||||||||||
Equity risk | (1,780,304 | ) | 0 | (12,202,380 | ) | (13,982,684 | ) | |||||||||
Foreign currency risk | 0 | 561,199 | 0 | 561,199 | ||||||||||||
| $ | (5,156,962 | ) | $ | 561,199 | $ | (12,202,380 | ) | $ | (16,798,143 | ) | ||||||
| Change in unrealized gains (losses) on derivatives | ||||||||||||||||
| Futures contracts | Forward foreign currency contracts | Swap contracts | Total | |||||||||||||
Interest rate risk | $ | (408,313 | ) | $ | 0 | $ | 0 | $ | (408,313 | ) | ||||||
Commodity risk | (202,806 | ) | 0 | 0 | (202,806 | ) | ||||||||||
Equity risk | (26,257 | ) | 0 | 141,501 | 115,244 | |||||||||||
Foreign currency risk | 0 | (483,412 | ) | 0 | (483,412 | ) | ||||||||||
| $ | (637,376 | ) | $ | (483,412 | ) | $ | 141,501 | $ | (979,287 | ) | ||||||
For certain types of derivative transactions, the Fund has entered into International Swaps and Derivatives Association, Inc. master agreements (“ISDA Master Agreements”) or similar agreements with approved counterparties. The ISDA Master Agreements or similar agreements may have requirements to deliver/deposit securities or cash to/with an exchange or broker-dealer as collateral and allows the Fund to offset, with each counterparty, certain derivative financial instrument’s assets and/or liabilities with collateral held or pledged. Collateral requirements differ by type of derivative. Collateral or margin requirements are set by the broker or exchange clearinghouse for exchange traded derivatives while collateral terms are contract specific for over-the-counter traded derivatives. Cash collateral that has been pledged to cover obligations of the Fund under ISDA Master Agreements or similar agreements, if any, are reported separately in the Consolidated Statement of Assets and Liabilities. Securities pledged as collateral, if any, are noted in the Consolidated Portfolio of Investments. With respect to balance sheet offsetting, absent an event of default by the counterparty or a termination of the agreement, the reported amounts of financial assets and financial liabilities in the Consolidated Statement of Assets and Liabilities are not offset across transactions between the Fund and the applicable counterparty. A reconciliation of the gross amounts on the Consolidated Statement of Assets and Liabilities to the net amounts by counterparty, including any collateral exposure, for OTC derivatives is as follows:
| Counterparty | Gross amounts of assets in the Consolidated Statement of Assets and Liabilities | Amounts subject to netting agreements | Collateral received | Net amount of assets | ||||||||
Goldman Sachs International | $950,143 | $(950,143) | $ | 0 | $ | 0 | ||||||
| Counterparty | Gross amounts of liabilities in the Consolidated Statement of Assets and Liabilities | Amounts subject to netting agreements | Collateral pledged1 | Net amount of liabilities | ||||||||
Goldman Sachs International | $1,314,502 | $(950,143) | $ | (364,359 | ) | $ | 0 | |||||
| 1 | Collateral pledged within this table is limited to the collateral for the net transaction with the counterparty. |
32 | Wells Fargo Alternative Risk Premia Fund
Consolidated notes to financial statements
8. BANK BORROWINGS
The Trust (excluding the money market funds), Wells Fargo Master Trust and Wells Fargo Variable Trust are parties to a $350,000,000 revolving credit agreement whereby the Fund is permitted to use bank borrowings for temporary or emergency purposes, such as to fund shareholder redemption requests. Interest under the credit agreement is charged to the Fund based on a borrowing rate equal to the higher of the Federal Funds rate in effect on that day plus 1.25% or the overnight LIBOR rate in effect on that day plus 1.25%. In addition, an annual commitment fee equal to 0.25% of the unused balance is allocated to each participating fund.
For the year ended June 30, 2020, there were no borrowings by the Fund under the agreement.
9. DISTRIBUTIONS TO SHAREHOLDERS
The tax character of distributions paid for the year ended June 30, 2020 was $323,741 of ordinary income and $712,388 of long-term capital gain. For the period from January 29, 2019 (commencement of operations) to June 30, 2019, the Fund did not pay any distributions to shareholders.
As of June 30, 2020, the components of distributable earnings on a tax basis were as follows:
Unrealized losses | Late-year ordinary losses deferred | Capital loss carryforward | ||
| $(57,178) | $(11,325,293) | $(2,592,044) | ||
10. INDEMNIFICATION
Under the Fund’s organizational documents, the officers and Trustees have been granted certain indemnification rights against certain liabilities that may arise out of performance of their duties to the Fund. The Fund has entered into a separate agreement with each Trustee that converts indemnification rights currently existing under the Fund’s organizational documents into contractual rights that cannot be changed in the future without the consent of the Trustee. Additionally, in the normal course of business, the Fund may enter into contracts with service providers that contain a variety of indemnification clauses. The Fund’s maximum exposure under these arrangements is dependent on future claims that may be made against the Fund and, therefore, cannot be estimated.
11. NEW ACCOUNTING PRONOUNCEMENT
In August 2018, FASB issued Accounting Standards Update (“ASU”) No. 2018-13, Fair Value Measurement (Topic 820) Disclosure Framework—Changes to the Disclosure Requirements for Fair Value Measurement. ASU 2018-13 updates the disclosure requirements on fair value measurements in Topic 820, Fair Value Measurements. The amendments are effective for fiscal years, and interim periods within those fiscal years, beginning after December 15, 2019. Management has adopted this guidance which did not have a material impact on the financial statements.
12. CORONAVIRUS (COVID-19) PANDEMIC
On March 11, 2020, the World Health Organization announced that it had made the assessment that coronavirus disease 2019 (“COVID-19”) is a pandemic. The impacts of COVID-19 are adversely affecting the entire global economy, individual companies and investment products, and the market in general. There is significant uncertainty around the extent and duration of business disruptions related to COVID-19 and the impacts may be short term or may last for an extended period of time. The risk of further spreading of COVID-19 has led to significant uncertainty and volatility in the financial markets.
Wells Fargo Alternative Risk Premia Fund | 33
Report of independent registered public accounting firm
To the Shareholders of the Fund and Board of Trustees
Wells Fargo Funds Trust:
Opinion on the Consolidated Financial Statements
We have audited the accompanying consolidated statement of assets and liabilities of Wells Fargo Alternative Risk Premia Fund (the Fund), one of the funds constituting Wells Fargo Funds Trust, including the consolidated portfolio of investments, as of June 30, 2020, the related consolidated statement of operations for the year then ended, the consolidated statements of changes in net assets for the year then ended and for the period from January 29, 2019 (commencement of operations) to June 30, 2019, and the related consolidated notes (collectively, the consolidated financial statements) and the consolidated financial highlights for the year then ended and for the period from the commencement of operations to June 30, 2019. In our opinion, the consolidated financial statements and consolidated financial highlights present fairly, in all material respects, the financial position of the Fund as of June 30, 2020, the results of its operations for the year then ended, and the changes in its net assets and the financial highlights for the year then ended and for the period from the commencement of operations to June 30, 2019, in conformity with U.S. generally accepted accounting principles.
Basis for Opinion
These consolidated financial statements and consolidated financial highlights are the responsibility of the Fund’s management. Our responsibility is to express an opinion on these consolidated financial statements and consolidated financial highlights based on our audits. We are a public accounting firm registered with the Public Company Accounting Oversight Board (United States) (PCAOB) and are required to be independent with respect to the Fund in accordance with the U.S. federal securities laws and the applicable rules and regulations of the Securities and Exchange Commission and the PCAOB.
We conducted our audits in accordance with the standards of the PCAOB. Those standards require that we plan and perform the audit to obtain reasonable assurance about whether the consolidated financial statements and consolidated financial highlights are free of material misstatement, whether due to error or fraud. Our audits included performing procedures to assess the risks of material misstatement of the consolidated financial statements and consolidated financial highlights, whether due to error or fraud, and performing procedures that respond to those risks. Such procedures included examining, on a test basis, evidence regarding the amounts and disclosures in the consolidated financial statements and consolidated financial highlights. Such procedures also included confirmation of securities owned as of June 30, 2020, by correspondence with the custodian, transfer agent and brokers. Our audits also included evaluating the accounting principles used and significant estimates made by management, as well as evaluating the overall presentation of the consolidated financial statements and consolidated financial highlights. We believe that our audits provide a reasonable basis for our opinion.

We have not been able to determine the specific year that we began serving as the auditor of one or more Wells Fargo Funds investment companies; however we are aware that we have served as the auditor of one or more Wells Fargo Funds investment companies since at least 1955.
Boston, Massachusetts
August 29, 2020
34 | Wells Fargo Alternative Risk Premia Fund
TAX INFORMATION
Pursuant to Section 852 of the Internal Revenue Code, $712,388 was designated as a 20% rate gain distribution for the fiscal year ended June 30, 2020.
For the fiscal year ended June 30, 2020, $323,741 has been designated as interest-related dividends for nonresident alien shareholders pursuant to Section 871 of the Internal Revenue Code.
PROXY VOTING INFORMATION
A description of the policies and procedures used to determine how to vote proxies relating to portfolio securities is available, upon request, by calling 1-800-222-8222, visiting our website at wfam.com, or visiting the SEC website at sec.gov. Information regarding how the proxies related to portfolio securities were voted during the most recent 12-month period ended June 30 is available on the website at wfam.com or by visiting the SEC website at sec.gov.
QUARTERLY PORTFOLIO HOLDINGS INFORMATION
The Fund files its complete schedule of portfolio holdings with the SEC for the first and third quarters of each fiscal year as an exhibit to its reports on Form N-PORT. Shareholders may view the filed Form N-PORT by visiting the SEC website at sec.gov.
Wells Fargo Alternative Risk Premia Fund | 35
Other information (unaudited)
BOARD OF TRUSTEES AND OFFICERS
Each of the Trustees and Officers1 listed in the table below acts in identical capacities for each fund in the Wells Fargo family of funds, which consists of 147 mutual funds comprising the Wells Fargo Funds Trust, Wells Fargo Variable Trust, Wells Fargo Master Trust and four closed-end funds (collectively the “Fund Complex”). This table should be read in conjunction with the Prospectus and the Statement of Additional Information2. The mailing address of each Trustee and Officer is 525 Market Street, 12th Floor, San Francisco, CA 94105. Each Trustee and Officer serves an indefinite term, however, each Trustee serves such term until reaching the mandatory retirement age established by the Trustees.
Independent Trustees
| Name and year of birth | Position held and length of service* | Principal occupations during past five years or longer | Current other public company or investment company directorships | |||
William R. Ebsworth (Born 1957) | Trustee, since 2015 | Retired. From 1984 to 2013, equities analyst, portfolio manager, research director and chief investment officer at Fidelity Management and Research Company in Boston, Tokyo, and Hong Kong, and retired in 2013 as Chief Investment Officer of Fidelity Strategic Advisers, Inc. where he led a team of investment professionals managing client assets. Prior thereto, Board member of Hong Kong Securities Clearing Co., Hong Kong Options Clearing Corp., the Thailand International Fund, Ltd., Fidelity Investments Life Insurance Company, and Empire Fidelity Investments Life Insurance Company. Audit Committee Chair and Investment Committee Chair of the Vincent Memorial Hospital Endowment (non-profit organization). Mr. Ebsworth is a CFA® charterholder. | N/A | |||
Jane A. Freeman (Born 1953) | Trustee, since 2015; Chair Liaison, since 2018 | Retired. From 2012 to 2014 and 1999 to 2008, Chief Financial Officer of Scientific Learning Corporation. From 2008 to 2012, Ms. Freeman provided consulting services related to strategic business projects. Prior to 1999, Portfolio Manager at Rockefeller & Co. and Scudder, Stevens & Clark. Board member of the Harding Loevner Funds from 1996 to 2014, serving as both Lead Independent Director and chair of the Audit Committee. Board member of the Russell Exchange Traded Funds Trust from 2011 to 2012 and the chair of the Audit Committee. Ms. Freeman is also an inactive Chartered Financial Analyst. | N/A | |||
Isaiah Harris, Jr. (Born 1952) | Trustee, since 2009; Audit Committee Chairman, since 2019 | Retired. Chairman of the Board of CIGNA Corporation since 2009, and Director since 2005. From 2003 to 2011, Director of Deluxe Corporation. Prior thereto, President and CEO of BellSouth Advertising and Publishing Corp. from 2005 to 2007, President and CEO of BellSouth Enterprises from 2004 to 2005 and President of BellSouth Consumer Services from 2000 to 2003. Emeritus member of the Iowa State University Foundation Board of Governors. Emeritus Member of the Advisory Board of Iowa State University School of Business. Advisory Board Member, Palm Harbor Academy (private school). Advisory Board Member, Child Evangelism Fellowship (non-profit). Mr. Harris is a certified public accountant (inactive status). | CIGNA Corporation | |||
Judith M. Johnson (Born 1949) | Trustee, since 2008; Audit Committee Chairman, from 2009 to 2018 | Retired. Prior thereto, Chief Executive Officer and Chief Investment Officer of Minneapolis Employees Retirement Fund from 1996 to 2008. Ms. Johnson is an attorney, certified public accountant and a certified managerial accountant. | N/A | |||
36 | Wells Fargo Alternative Risk Premia Fund
Other information (unaudited)
| Name and year of birth | Position held and length of service* | Principal occupations during past five years or longer | Current other public company or investment company directorships | |||
David F. Larcker (Born 1950) | Trustee, since 2009 | James Irvin Miller Professor of Accounting at the Graduate School of Business, Stanford University, Director of the Corporate Governance Research Initiative and Senior Faculty of The Rock Center for Corporate Governance since 2006. From 2005 to 2008, Professor of Accounting at the Graduate School of Business, Stanford University. Prior thereto, Ernst & Young Professor of Accounting at The Wharton School, University of Pennsylvania from 1985 to 2005. | N/A | |||
Olivia S. Mitchell (Born 1953) | Trustee, since 2006; Nominating and Governance Committee Chair, since 2018 | International Foundation of Employee Benefit Plans Professor, Wharton School of the University of Pennsylvania since 1993. Director of Wharton’s Pension Research Council and Boettner Center on Pensions & Retirement Research, and Research Associate at the National Bureau of Economic Research. Previously, Cornell University Professor from 1978 to 1993. | N/A | |||
Timothy J. Penny (Born 1951) | Trustee, since 1996; Chairman, | President and Chief Executive Officer of Southern Minnesota Initiative Foundation, a non-profit organization, since 2007. Member of the Board of Trustees of NorthStar Education Finance, Inc., a non-profit organization, since 2007. | N/A | |||
James G. Polisson (Born 1959) | Trustee, since 2018 | Retired. Chief Marketing Officer, Source (ETF) UK Services, Ltd, from 2015 to 2017. From 2012 to 2015, Principal of The Polisson Group, LLC, a management consulting, corporate advisory and principal investing company. Chief Executive Officer and Managing Director at Russell Investments, Global Exchange Traded Funds from 2010 to 2012. Managing Director of Barclays Global Investors from 1998 to 2010 and Global Chief Marketing Officer for iShares and Barclays Global Investors from 2000 to 2010. Trustee of the San Francisco Mechanics’ Institute, a non-profit organization, from 2013 to 2015. Board member of the Russell Exchange Traded Fund Trust from 2011 to 2012. Director of Barclays Global Investors Holdings Deutschland GmbH from 2006 to 2009. Mr. Polisson is an attorney and has a retired status with the Massachusetts and District of Columbia Bar Associations. | N/A | |||
| Pamela Wheelock (Born 1959) | Trustee, since January 2020; previously Trustee from January 2018 to July 2019 | Board member of the Destination Medical Center Economic Development Agency, Rochester, Minnesota since 2019 and Interim President of the McKnight Foundation since 2020. Acting Commissioner, Minnesota Department of Human Services, July 2019 through September 2019. Human Services Manager (part-time), Minnesota Department of Human Services, October 2019 through December 2019. Chief Operating Officer, Twin Cities Habitat for Humanity from 2017 to 2019. Vice President of University Services, University of Minnesota from 2012 to 2016. Prior thereto, on the Board of Directors, Governance Committee and Finance Committee for the Minnesota Philanthropy Partners (Saint Paul Foundation) from 2012 to 2018, Interim Chief Executive Officer of Blue Cross Blue Shield of Minnesota from 2011 to 2012, Chairman of the Board from 2009 to 2012 and Board Director from 2003 to 2015. Vice President, Leadership and Community Engagement, Bush Foundation, Saint Paul, Minnesota (a private foundation) from 2009 to 2011. Executive Vice President and Chief Financial Officer, Minnesota Sports and Entertainment from 2004 to 2009 and Senior Vice President from 2002 to 2004. Executive Vice President of the Minnesota Wild Foundation from 2004 to 2008. Commissioner of Finance, State of Minnesota, from 1999 to 2002. Currently Board Chair of the Minnesota Wild Foundation since 2010. | N/A | |||
| * | Length of service dates reflect the Trustee’s commencement of service with the Trust’s predecessor entities, where applicable. |
Wells Fargo Alternative Risk Premia Fund | 37
Other information (unaudited)
Officers
| Name and year of birth | Position held and length of service | Principal occupations during past five years or longer | ||
Andrew Owen (Born 1960) | President, since 2017 | Executive Vice President of Wells Fargo & Company and Head of Affiliated Managers, Wells Fargo Asset Management, since 2014. In addition, Mr. Owen is currently President, Chief Executive Officer and Director of Wells Fargo Funds Management, LLC since 2017. Prior thereto, Executive Vice President responsible for marketing, investments and product development for Wells Fargo Funds Management, LLC, from 2009 to 2014. | ||
| Jeremy DePalma1 (Born 1974) | Treasurer, since 2012 | Senior Vice President of Wells Fargo Funds Management, LLC since 2009. Senior Vice President of Evergreen Investment Management Company, LLC from 2008 to 2010 and head of the Fund Reporting and Control Team within Fund Administration from 2005 to 2010. | ||
Michelle Rhee (Born 1966) | Chief Legal Officer, since 2019 | Secretary of Wells Fargo Funds Management, LLC, Chief Legal Counsel of Wells Fargo Asset Management and Assistant General Counsel of Wells Fargo Bank, N.A. since 2018. Associate General Counsel and Managing Director of Bank of America Corporation from 2004 to 2018. | ||
| Catherine Kennedy (Born 1969) | Secretary, since 2019 | Vice President of Wells Fargo Funds Management, LLC and Senior Counsel of the Wells Fargo Legal Department since 2010. Vice President and Senior Counsel of Evergreen Investment Management Company, LLC from 1998 to 2010. | ||
| Michael H. Whitaker (Born 1967) | Chief Compliance Officer, since 2016 | Chief Compliance Officer of Wells Fargo Asset Management since 2016. Senior Vice President and Chief Compliance Officer for Fidelity Investments from 2007 to 2016. | ||
David Berardi (Born 1975) | Assistant Treasurer, since 2009 | Vice President of Wells Fargo Funds Management, LLC since 2009. Vice President of Evergreen Investment Management Company, LLC from 2008 to 2010. Manager of Fund Reporting and Control for Evergreen Investment Management Company, LLC from 2004 to 2010. | ||
| 1 | Jeremy DePalma acts as Treasurer of 82 funds and Assistant Treasurer of 65 funds in the Fund Complex. |
| 2 | The Statement of Additional Information includes additional information about the Trustees and is available, without charge, upon request, by calling 1-800-222-8222 or by visiting the website at wfam.com. |
38 | Wells Fargo Alternative Risk Premia Fund
Other information (unaudited)
BOARD CONSIDERATION OF INVESTMENT MANAGEMENT AND SUB-ADVISORY AGREEMENTS:
Wells Fargo Alternative Risk Premia Fund
Under the Investment Company Act of 1940 (the “1940 Act”), the Board of Trustees (the “Board”) of Wells Fargo Funds Trust (the “Trust”) must determine annually whether to approve the continuation of the Trust’s investment management and sub-advisory agreements. In this regard, at a Board meeting held on May 26, 2020 and May 28, 2020 (together, the “Meeting”), the Board, all the members of which have no direct or indirect interest in the investment management and sub-advisory agreements and are not “interested persons” of the Trust, as defined in the 1940 Act (the “Independent Trustees”), reviewed and approved for Wells Fargo Alternative Risk Premia Fund (the “Fund”): (i) an investment management agreement (the “Management Agreement”) with Wells Fargo Funds Management, LLC (“Funds Management”); (ii) an investment sub-advisory agreement with Wells Capital Management Incorporated (“WellsCap”), an affiliate of Funds Management; and (iii) an investment sub-advisory agreement with Wells Fargo Asset Management (International) Limited (“WFAM International”), an affiliate of Funds Management. The sub-advisory agreements with WellsCap and WFAM International (the “Sub-Advisers”) are collectively referred to as the Sub-Advisory Agreements, and the Management Agreement and the Sub-Advisory Agreements are collectively referred to as the “Advisory Agreements.”
At the Meeting, the Board considered the factors and reached the conclusions described below relating to the selection of Funds Management and the Sub-Advisers and the approval of the Advisory Agreements. Prior to the Meeting, including at a Board meeting held in April 2020, the Trustees conferred extensively among themselves and with representatives of Funds Management about these matters. Also, the Board has adopted a team-based approach, with each team consisting of a sub-set of Trustees, to assist the full Board in the discharge of its duties in reviewing investment performance and other matters throughout the year. The Independent Trustees were assisted in their evaluation of the Advisory Agreements by independent legal counsel, from whom they received separate legal advice and with whom they met separately.
In providing information to the Board, Funds Management and the Sub-Advisers were guided by a detailed set of requests for information submitted to them by independent legal counsel on behalf of the Independent Trustees at the start of the Board’s annual contract renewal process earlier in 2020. In considering and approving the Advisory Agreements, the Trustees considered the information they believed relevant, including but not limited to the information discussed below. The Board considered not only the specific information presented in connection with the Meeting, but also the knowledge gained over time through interaction with Funds Management and the Sub-Advisers about various topics. In this regard, the Board reviewed reports of Funds Management at each of its quarterly meetings, which included, among other things, portfolio reviews and investment performance reports. In addition, the Board and the teams mentioned above confer with portfolio managers at various times throughout the year. The Board did not identify any particular information or consideration that was all-important or controlling, and each individual Trustee may have attributed different weights to various factors.
After its deliberations, the Board unanimously approved the continuation of the Advisory Agreements for a one-year term and determined that the compensation payable to Funds Management and the Sub-Advisers under each of the Advisory Agreements was reasonable. The Board considered the approval of the Advisory Agreements for the Fund as part of its consideration of agreements for funds across the complex, but its approvals were made on a fund-by-fund basis. The following summarizes a number of important, but not necessarily all, factors considered by the Board in support of its approvals.
Nature, extent and quality of services
The Board received and considered various information regarding the nature, extent and quality of services provided to the Fund by Funds Management and the Sub-Advisers under the Advisory Agreements. This information included a description of the investment advisory services and Fund-level administrative services covered by the Management Agreement, as well as, among other things, a summary of the background and experience of senior management of Wells Fargo Asset Management (“WFAM”), of which Funds Management and the Sub-Advisers are a part, and a summary of investments made in the business of WFAM. The Board also received a description of Funds Management’s and the Sub-Advisers’ business continuity plans and of their approaches to data privacy and cybersecurity, and related testing. The Board also received and reviewed information about Funds Management’s role as administrator of the Fund’s liquidity risk management program, Funds Management’s approach to risk management, and Funds Management’s intermediary and vendor oversight program.
The Board also considered the qualifications, background, tenure and responsibilities of each of the portfolio managers primarily responsible for the day-to-day portfolio management of the Fund. The Board evaluated the ability of Funds Management and the Sub-Advisers to attract and retain qualified investment professionals, including research, advisory and supervisory personnel. The Board further considered the compliance programs and compliance records of Funds Management and the Sub-Advisers. In addition, the Board took into account the full range of services provided to the Fund by Funds Management and its affiliates.
Wells Fargo Alternative Risk Premia Fund | 39
Other information (unaudited)
Fund investment performance and expenses
The Board considered the investment performance results for the Fund for the one-year period ended March 31, 2020. The Board considered these results in comparison to the investment performance of funds in a universe that was determined by Broadridge Inc. (“Broadridge”) to be similar to the Fund (the “Universe”), and in comparison to the Fund’s benchmark index and to other comparative data. Broadridge is an independent provider of investment company data. The Board received a description of the methodology used by Broadridge to select the mutual funds in the performance Universe. The Board noted that the Fund had recently commenced operations and had no performance history for the period ended December 31, 2019 to review. The Board also noted that the investment performance of the Fund (Institutional Class) was lower than the average investment performance of the Universe for the one-year period ended March 31, 2020. The Board also noted that the investment performance of the Fund was lower than its benchmark index, the ICE BofA 3-Month U.S. Treasury Bill Index, for the one-year period ended March 31, 2020. The Board noted that it would have the opportunity to review the Fund’s performance history in connection with the Board’s future review and approval of the Fund’s Advisory Agreements.
The Board also received and considered information regarding the Fund’s net operating expense ratios and their various components, including actual management fees, custodian and other non-management fees, and Rule 12b-1 and non-Rule 12b-1 shareholder service fees. The Board considered these ratios in comparison to the median ratios of funds in class-specific expense groups that were determined by Broadridge to be similar to the Fund (the “Groups”). The Board received a description of the methodology used by Broadridge to select the mutual funds in the expense Groups and an explanation of how funds comprising expense groups and their expense ratios may vary from year-to-year. Based on the Broadridge reports, the Board noted that the net operating expense ratios of the Fund were lower than the median net operating expense ratios of the expense Groups for each share class.
The Board took into account the Fund’s expense information provided to it among the factors considered in deciding to re-approve the Advisory Agreements.
Investment management and sub-advisory fee rates
The Board reviewed and considered the contractual fee rates payable by the Fund to Funds Management under the Management Agreement, as well as the contractual fee rates payable by the Fund to Funds Management for class-level administrative services under a Class-Level Administration Agreement, which include, among other things, class-level transfer agency and sub-transfer agency costs (collectively, the “Management Rates”). The Board also reviewed and considered the contractual investment sub-advisory fee rates that are payable by Funds Management to the Sub-Advisers for investment sub-advisory services.
Among other information reviewed by the Board was a comparison of the Fund’s Management Rates with the average contractual investment management fee rates of funds in the expense Groups at a common asset level as well as transfer agency costs of the funds in the expense Groups. The Board noted that the Management Rates of the Fund were lower than the sum of these average rates for the Fund’s expense Groups for all share classes.
The Board also received and considered information about the portion of the total management fee that was retained by Funds Management after payment of the fee to the Sub-Advisers for sub-advisory services. In assessing the reasonableness of this amount, the Board received and evaluated information about the nature and extent of responsibilities retained and risks assumed by Funds Management and not delegated to or assumed by the Sub-Advisers, and about Funds Management’s on-going oversight services. Given the affiliation between Funds Management and the Sub-Advisers, the Board ascribed limited relevance to the allocation of fees between them.
The Board also received and considered information about the nature and extent of services offered and fee rates charged by Funds Management and the Sub-Advisers to other types of clients with investment strategies similar to those of the Fund. In this regard, the Board received information about the significantly greater scope of services, and compliance, reporting and other legal burdens and risks of managing proprietary mutual funds compared with those associated with managing assets of other types of clients, including third-party sub-advised fund clients and non-mutual fund clients such as institutional separate accounts.
The Board also received and considered information about the nature and extent of services offered and fee rates charged by Funds Management and the Sub-Adviser to other types of clients with investment strategies similar to those of the Fund. In this regard, the Board received information about the significantly greater scope of services, and compliance, reporting and other legal burdens and risks of managing proprietary mutual funds compared with those associated with managing assets of other types of clients, including third-party sub-advised fund clients and non-mutual fund clients such as institutional separate accounts.
40 | Wells Fargo Alternative Risk Premia Fund
Other information (unaudited)
Based on its consideration of the factors and information it deemed relevant, including those described here, the Board determined that the compensation payable to Funds Management under the Management Agreement and to the Sub-Advisers under the Sub-Advisory Agreements was reasonable.
Profitability
The Board received and considered information concerning the profitability of Funds Management, as well as the profitability of both WFAM and Wells Fargo & Co. (“Wells Fargo”) from providing services to the fund family as a whole. The Board noted that the Sub-Advisers’ profitability information with respect to providing services to the Fund and other funds in the family was subsumed in the WFAM and Wells Fargo profitability analysis.
Funds Management reported on the methodologies and estimates used in calculating profitability, including a description of the methodology used to allocate certain expenses. Among other things, the Board noted that the levels of profitability reported on a fund-by-fund basis varied widely, depending on factors such as the size, type and age of fund.
Based on its review, the Board did not deem the profits reported by Funds Management, WFAM or Wells Fargo from services provided to the Fund to be at a level that would prevent it from approving the continuation of the Advisory Agreements.
Economies of scale
The Board received and considered information about the potential for Funds Management to experience economies of scale in the provision of management services to the Fund, the difficulties of calculating economies of scale at an individual fund level, and the extent to which potential scale benefits are shared with shareholders. The Board noted the existence of breakpoints in the Fund’s management fee structure, which operate generally to reduce the Fund’s expense ratios as the Fund grows in size, and the size of the Fund in relation to such breakpoints. The Board considered that in addition to management fee breakpoints, Funds Management shares potential economies of scale from its management business in a variety of ways, including through fee waiver and expense reimbursement arrangements, services that benefit shareholders, competitive management fee rates set at the outset without regard to breakpoints, and investments in the business intended to enhance services available to shareholders.
The Board concluded that Funds Management’s arrangements with respect to the Fund, including contractual breakpoints, constituted a reasonable approach to sharing potential economies of scale with the Fund and its shareholders.
Other benefits to Funds Management and the Sub-Advisers
The Board received and considered information regarding potential “fall-out” or ancillary benefits received by Funds Management and its affiliates, including the Sub-Advisers, as a result of their relationships with the Fund. Ancillary benefits could include, among others, benefits directly attributable to other relationships with the Fund and benefits potentially derived from an increase in Funds Management’s and the Sub-Advisers’ business as a result of their relationships with the Fund. The Board noted that various affiliates of Funds Management may receive distribution-related fees, shareholder servicing payments and sub-transfer agency fees in respect of shares sold or held through them and services provided.
The Board also reviewed information about soft dollar credits earned and utilized by the Sub-Advisers, fees earned by Funds Management and WellsCap from managing a private investment vehicle for the fund family’s securities lending collateral, and commissions earned by an affiliated broker from portfolio transactions.
Based on its consideration of the factors and information it deemed relevant, including those described here, the Board did not find that any ancillary benefits received by Funds Management and its affiliates, including the Sub-Advisers, were unreasonable.
Conclusion
At the Meeting, after considering the above-described factors and based on its deliberations and its evaluation of the information described above, the Board unanimously approved the continuation of the Advisory Agreements for a one-year term and determined that the compensation payable to Funds Management and the Sub-Advisers under each of the Advisory Agreements was reasonable.
Wells Fargo Alternative Risk Premia Fund | 41
Other information (unaudited)
LIQUIDITY RISK MANAGEMENT PROGRAM
In accordance with Rule 22e-4 under the Investment Company Act of 1940, as amended (the “Liquidity Rule”), Wells Fargo Funds Trust (the “Trust”) has adopted and implemented a liquidity risk management program (the “Program”) on behalf of each of its series, including the Fund, which is reasonably designed to assess and manage the Fund’s liquidity risk. “Liquidity risk” is defined as the risk that the Fund is unable to meet redemption requests without significantly diluting remaining investors’ interests in the Fund. The Trust’s Board of Trustees (the “Board”) previously approved the designation of Wells Fargo Funds Management, LLC (“Funds Management”), the Fund’s investment manager, as the administrator of the Program, and Funds Management has established a Liquidity Risk Management Council composed of personnel from multiple departments within Funds Management and its affiliates to assist Funds Management in the implementation and on-going administration of the Program.
The Program is comprised of various components designed to support the assessment and/or management of liquidity risk, including: (1) the periodic assessment (no less frequently than annually) of certain factors that influence the Fund’s liquidity risk; (2) the periodic classification (no less frequently than monthly) of the Fund’s investments into one of four liquidity categories that reflect an estimate of their liquidity under current market conditions; (3) a 15% limit on the acquisition of “illiquid investments” (as defined under the Liquidity Rule); (4) to the extent the Fund does not invest primarily in “highly liquid investments” (as defined under the Liquidity Rule), the determination of a minimum percentage of the Fund’s assets that generally will be invested in highly liquid investments (an “HLIM”); (5) if the Fund has established an HLIM, the periodic review (no less frequently than annually) of the HLIM and the adoption of policies and procedures for responding to a shortfall of the Fund’s “highly liquid investments” below its HLIM; and (6) periodic reporting to the Board.
At a meeting of the Board held on May 26 and 28, 2020, the Board received a written report (the “Report”) from Funds Management that addressed the operation of the Program and assessed its adequacy and effectiveness of implementation. The Report covered the initial period from December 1, 2018 through December 31, 2019 (the “Reporting Period”). No significant liquidity events impacting the Fund were noted in the Report. There were no material changes to the Program during the Reporting Period. The Report concluded that the Program is operating effectively to assess and manage the Fund’s liquidity risk, and that the Program has been and continues to be adequately and effectively implemented to monitor and, as applicable, respond to the Fund’s liquidity developments.
There can be no assurance that the Program will achieve its objectives under all circumstances in the future. Please refer to the Fund’s prospectus for more information regarding the Fund’s exposure to liquidity risk and other risks to which an investment in the Fund may be subject.
42 | Wells Fargo Alternative Risk Premia Fund
This page is intentionally left blank.
This page is intentionally left blank.
For more information
More information about Wells Fargo Funds is available free upon request. To obtain literature, please write, visit the Fund’s website, or call:
Wells Fargo Funds
P.O. Box 219967
Kansas City, MO 64121-9967
Website: wfam.com
Individual investors: 1-800-222-8222
Retail investment professionals: 1-888-877-9275
Institutional investment professionals: 1-866-765-0778

This report and the financial statements contained herein are submitted for the general information of the shareholders of the Fund. If this report is used for promotional purposes, distribution of the report must be accompanied or preceded by a current prospectus. Before investing, please consider the investment objectives, risks, charges, and expenses of the investment. For a current prospectus and, if available, a summary prospectus, containing this information, call 1-800-222-8222 or visit the Fund’s website at wfam.com. Read the prospectus carefully before you invest or send money.
Wells Fargo Asset Management (WFAM) is the trade name for certain investment advisory/management firms owned by Wells Fargo & Company. These firms include but are not limited to Wells Capital Management Incorporated and Wells Fargo Funds Management, LLC. Certain products managed by WFAM entities are distributed by Wells Fargo Funds Distributor, LLC (a broker-dealer and Member FINRA).
This material is for general informational and educational purposes only and is NOT intended to provide investment advice or a recommendation of any kind—including a recommendation for any specific investment, strategy, or plan.
INVESTMENT PRODUCTS: NOT FDIC INSURED ◾ NO BANK GUARANTEE ◾ MAY LOSE VALUE
© 2020 Wells Fargo & Company. All rights reserved.
PAR-0720-00238 08-20
A295/AR295 06-20

Annual Report
June 30, 2020
Wells Fargo
Municipal Sustainability Fund
Beginning on January 1, 2021, as permitted by new regulations adopted by the Securities and Exchange Commission, paper copies of the Wells Fargo Funds’ annual and semi-annual shareholder reports issued after this date will no longer be sent by mail, unless you specifically request paper copies of the reports. Instead, the reports will be made available on the Funds’ website, and you will be notified by mail each time a report is posted and provided with a website address to access the report.
If you already elected to receive shareholder reports electronically, you will not be affected by this change and you need not take any action. You may elect to receive shareholder reports and other communications from the Fund electronically at any time by contacting your financial intermediary (such as a broker-dealer or bank) or, if you are a direct investor, by calling 1-800-222-8222 or by enrolling at wellsfargo.com/advantagedelivery.
You may elect to receive all future reports in paper free of charge. If you invest through a financial intermediary, you can contact your financial intermediary to request that you continue to receive paper copies of your shareholder reports; if you invest directly with the Fund, you can call 1-800-222-8222. Your election to receive reports in paper will apply to all Wells Fargo Funds held in your account with your financial intermediary or, if you are a direct investor, to all Wells Fargo Funds that you hold.
|
Reduce clutter. Save trees. |
Sign up for electronic delivery of prospectuses and |
The views expressed and any forward-looking statements are as of June 30, 2020, unless otherwise noted, and are those of the Fund managers and/or Wells Fargo Asset Management. Discussions of individual securities, or the markets generally, or any Wells Fargo Fund are not intended as individual recommendations. Future events or results may vary significantly from those expressed in any forward-looking statements. The views expressed are subject to change at any time in response to changing circumstances in the market. Wells Fargo Asset Management and the Fund disclaim any obligation to publicly update or revise any views expressed or forward-looking statements.
INVESTMENT PRODUCTS: NOT FDIC INSURED ◾ NO BANK GUARANTEE ◾ MAY LOSE VALUE
Wells Fargo Municipal Sustainability Fund | 1
Letter to shareholders (unaudited)

Andrew Owen
President
Wells Fargo Funds
Dear Shareholder:
We are pleased to offer you this first shareholder report for the Wells Fargo Municipal Sustainability Fund from the Fund’s inception on February 28 through June 30, 2020.
Global stock markets tumbled in February and March as governments took unprecedented measures to stop the spread of the coronavirus at the expense of short-term economic output. However, markets rebounded from April through June to offset the losses as central banks attempted to bolster capital markets and confidence. Fixed-income markets generally performed better, with the exception of municipal and high-yield bonds, as U.S. bonds overall achieved modest gains. Equity performance was mixed, with international equities trailing U.S. stocks for the four-month period through June.
For the period, U.S. stocks, based on the S&P 500 Index,1 returned 5.65% and international stocks, as measured by the MSCI ACWI ex USA Index (Net),2 fell 0.69%. The MSCI EM Index (Net)3 lost 0.11%. For bond investors, the Bloomberg Barclays U.S. Aggregate Bond Index4 added 2.29%, the Bloomberg Barclays Global Aggregate ex-USD Index5 returned 0.06%, the Bloomberg Barclays Municipal Bond Index6 lost 1.00%, and the ICE BofA U.S. High Yield Index7 lost 3.28%.
The coronavirus dominated market concerns entering the period.
Just before the period began, the coronavirus became the major market focus. Although equity markets initially shrugged off concerns about the outbreak, market sentiment plunged in late February and into March. Oil prices tumbled as Russia and the Organization of the Petroleum Exporting Countries compounded a major decline in oil demand with a brutal price war, causing the price of West Texas Intermediate crude oil to tumble.
| 1 | The S&P 500 Index consists of 500 stocks chosen for market size, liquidity, and industry group representation. It is a market-value-weighted index with each stock’s weight in the index proportionate to its market value. You cannot invest directly in an index. |
| 2 | The Morgan Stanley Capital International (MSCI) All Country World Index (ACWI) ex USA Index (Net) is a free-float-adjusted market-capitalization-weighted index that is designed to measure the equity market performance of developed and emerging markets, excluding the United States. Source: MSCI. MSCI makes no express or implied warranties or representations and shall have no liability whatsoever with respect to any MSCI data contained herein. The MSCI data may not be further redistributed or used as a basis for other indices or any securities or financial products. This report is not approved, reviewed, or produced by MSCI. You cannot invest directly in an index. |
| 3 | The MSCI Emerging Markets (EM) Index (Net) is a free-float-adjusted market-capitalization-weighted index that is designed to measure equity market performance of emerging markets. You cannot invest directly in an index. |
| 4 | The Bloomberg Barclays U.S. Aggregate Bond Index is a broad-based benchmark that measures the investment-grade, U.S. dollar-denominated, fixed-rate taxable bond market, including Treasuries, government-related and corporate securities, mortgage-backed securities (agency fixed-rate and hybrid adjustable-rate mortgage pass-throughs), asset-backed securities, and commercial mortgage-backed securities. You cannot invest directly in an index. |
| 5 | The Bloomberg Barclays Global Aggregate ex-USD Index is an unmanaged index that provides a broad-based measure of the global investment-grade fixed-income markets excluding the U.S.-dollar-denominated debt market. You cannot invest directly in an index. |
| 6 | The Bloomberg Barclays Municipal Bond Index is an unmanaged index composed of long-term tax-exempt bonds with a minimum credit rating of Baa. You cannot invest directly in an index. |
| 7 | The ICE BofA U.S. High Yield Index is a market-capitalization-weighted index of domestic and Yankee high-yield bonds. The index tracks the performance of high-yield securities traded in the U.S. bond market. You cannot invest directly in an index. Copyright 2020. ICE Data Indices, LLC. All rights reserved. |
2 | Wells Fargo Municipal Sustainability Fund
Letter to shareholders (unaudited)
The global spread of the coronavirus led many countries to clamp down on social and business-related activity in order to contain the virus from causing even greater devastation and overwhelming the health care system. This abrupt stoppage of economic activity led to the sharp deceleration of global output, sending economies into a deep contraction. Central bank responses were swift, as they slashed interest rates and expanded quantitative easing programs to restore liquidity and confidence to the markets. In the U.S., the Federal Reserve launched several lending programs, funding investment-grade bonds, money market mutual funds, and commercial paper while purchasing Treasuries, mortgage-backed securities, and overnight repurchase agreements. Meanwhile, stock markets tumbled quickly into a bear market, ending the longest bull stock market in U.S. history.
Markets rebounded strongly in April after the extreme volatility of the previous two months, with the S&P 500 Index gaining 12.8% for the month and the MSCI ACWI ex USA Index (Net) returning 7.6%. The rebound was fueled by unprecedented stimulus measures taken by governments and central banks to buffer the economic damage created by mass shutdowns to try to contain the virus’s spread. The U.S. economy contracted by an annualized 5.0% pace in the first quarter, with 30 million new unemployment insurance claims in six weeks. In the eurozone, first-quarter real gross domestic product (GDP) shrank 3.8%, with the composite April Flash Purchasing Managers’ Index, a monthly survey of purchasing managers, falling to an all-time low of 13.5. The European Central Bank expanded its quantitative easing to include the purchase of additional government bonds of countries with the greatest virus-related need, including Italy and Spain. China’s first-quarter GDP fell by 6.8% year over year. However, retail sales, production, and investment showed signs of recovery. Extreme oil-price volatility continued as global supply far exceeded demand.
In May, the equity market rebound continued, with the S&P 500 Index climbing a further 4.8%. European and Japanese stock markets also had monthly gains. Investors regained confidence on reports of early signs of success in human trials of a coronavirus vaccine. Global stocks continued to outperform value stocks while returns on global government bonds were generally flat. In the U.S., a gap grew between the stock market rebound and devastating economic data points, including an April unemployment rate of 14.7%, the highest level since World War II. Purchasing managers’ indices continued to reflect weakening activity in May in both the manufacturing and services sectors. U.S. corporate earnings reports indicated a 14% year-over-year contraction in earnings from the first quarter of 2019. However, high demand for technology, driven by remote activity, helped maintain robust information technology sector earnings, which helped drive powerful well-known technology stocks higher.
Despite ongoing economic weakness and high levels of uncertainty on the containment of the coronavirus and the timing of an effective vaccine, financial markets continued to post widely positive returns in June. As economies reopened, there were hopeful signs. U.S. retail sales rose 17% in May while retail sales in the U.K. rebounded by 12%. However, year over year, sales remained depressed. Vitally important to market sentiment was the ongoing commitment by central banks globally to do all they can to provide economic support through liquidity and low borrowing costs. U.S. economic activity was aided by one-time $1,200 stimulus checks and $600 bonus weekly unemployment benefits due to expire at the end of July. However, unemployment remained in the double digits, easing somewhat from 14.7% in April to 11.1% in June. At period-end, numerous states reported alarming increases of coronavirus cases. China’s economic recovery picked up momentum in June, though it remained far from a full recovery.
“The global spread of the coronavirus led many countries to clamp down on social and business-related activity in order to contain the virus from causing even greater devastation and overwhelming the health care system.”
“Despite ongoing economic weakness and high levels of uncertainty on the containment of the coronavirus and the timing of an effective vaccine, financial markets continued to post widely positive returns in June.”
Wells Fargo Municipal Sustainability Fund | 3
Letter to shareholders (unaudited)
|
For further information about your Fund, contact your investment professional, visit our website at wfam.com, or call us directly at 1-800-222-8222. |
Don’t let short-term uncertainty derail long-term investment goals.
Periods of investment uncertainty can present challenges, but experience has taught us that maintaining long-term investment goals can be an effective way to plan for the future. To help you create a sound strategy based on your personal goals and risk tolerance, Wells Fargo Funds offers more than 100 mutual funds spanning a wide range of asset classes and investment styles. Although diversification cannot guarantee an investment profit or prevent losses, we believe it can be an effective way to manage investment risk and potentially smooth out overall portfolio performance. We encourage investors to know their investments and to understand that appropriate levels of risk-taking may unlock opportunities.
Thank you for choosing to invest with Wells Fargo Funds. We appreciate your confidence in us and remain committed to helping you meet your financial needs.
Sincerely,

Andrew Owen
President
Wells Fargo Funds
Notice to Shareholders
At a meeting held on August 10-12, 2020, the Board of Trustees of the Fund approved a change to the Fund’s automatic conversion feature for Class C shares in order to shorten the required holding period from 10 to 8 years. As a result, on a monthly basis beginning November 5, 2020, Class C shares will convert automatically into Class A shares 8 years after the initial date of purchase or, if you acquired your Class C shares through an exchange or conversion from another share class, 8 years after the date you acquired your Class C shares. When Class C shares that you acquired through a purchase or exchange convert, any other Class C shares that you purchased with reinvested dividends and distributions also will convert into Class A shares on a pro rata basis.
Please note that a shorter holding period may apply depending on your intermediary. Please see “Appendix A—Sales Charge Reductions and Waivers for Certain Intermediaries” in the Fund’s prospectus for further information.
4 | Wells Fargo Municipal Sustainability Fund
This page is intentionally left blank.
Performance highlights (unaudited)
Investment objective
The Fund seeks current income exempt from federal income tax.
Manager
Wells Fargo Funds Management, LLC
Subadviser
Wells Capital Management Incorporated
Portfolio managers
Terry J. Goode
Robert J. Miller
Average annual total returns (%) as of June 30, 2020
| Including sales charge | Excluding sales charge | Expense ratios1 (%) | ||||||||||||||||
| Inception date | Since inception | Since inception | Gross | Net2 | ||||||||||||||
| Class A (WMSAX) | 2-28-2020 | -2.32 | 2.27 | 1.03 | 0.75 | |||||||||||||
| Class C (WMSCX) | 2-28-2020 | 1.04 | 2.04 | 1.78 | 1.50 | |||||||||||||
| Class R6 (WMSRX) | 2-28-2020 | – | 2.39 | 0.65 | 0.40 | |||||||||||||
| Administrator Class (WMSDX) | 2-28-2020 | – | 2.32 | 0.97 | 0.60 | |||||||||||||
| Institutional Class (WMSIX) | 2-28-2020 | – | 2.37 | 0.70 | 0.45 | |||||||||||||
| Bloomberg Barclays Municipal Bond Index3 | – | – | -1.00 | * | – | – | ||||||||||||
| * | Based on inception date of the oldest Fund class. |
Figures quoted represent past performance, which is no guarantee of future results, and do not reflect taxes that a shareholder may pay on an investment in a fund. Investment return and principal value of an investment will fluctuate so that an investor’s shares, when redeemed, may be worth more or less than their original cost. Current performance may be lower or higher than the performance data quoted, which assumes the reinvestment of dividends and capital gains. Current month-end performance is available on the Fund’s website, wfam.com.
Index returns do not include transaction costs associated with buying and selling securities, any mutual fund fees or expenses, or any taxes. It is not possible to invest directly in an index.
For Class A shares, the maximum front-end sales charge is 4.50%. For Class C shares, the maximum contingent deferred sales charge is 1.00%. Performance including a contingent deferred sales charge assumes the sales charge for the corresponding time period. Class R6, Administrator Class, and Institutional Class shares are sold without a front-end sales charge or contingent deferred sales charge.
Bond values fluctuate in response to the financial condition of individual issuers, general market and economic conditions, and changes in interest rates. Changes in market conditions and government policies may lead to periods of heightened volatility in the bond market and reduced liquidity for certain bonds held by the Fund. In general, when interest rates rise, bond values fall and investors may lose principal value. Interest rate changes and their impact on the Fund and its share price can be sudden and unpredictable. High-yield securities have a greater risk of default and tend to be more volatile than higher-rated debt securities. The use of derivatives may reduce returns and/or increase volatility. Investing in environmental, social, and governance (ESG) carries the risk that, under certain market conditions, the investments may underperform products that invest in a broader array of investments. In addition, some ESG investments may be dependent on government tax incentives and subsidies and on political support for certain environmental technologies and companies. The ESG sector also may have challenges such as a limited number of issuers and liquidity in the market, including a robust secondary market. Investing primarily in responsible investments carries the risk that, under certain market conditions, an investment may underperform funds that do not use a responsible investment strategy. The Fund is exposed to municipal securities risk. Consult the Fund’s prospectus for additional information on these and other risks.
Please see footnotes on page 7.
6 | Wells Fargo Municipal Sustainability Fund
Performance highlights (unaudited)
| Growth of $10,000 investment as of June 30, 20204 |
|
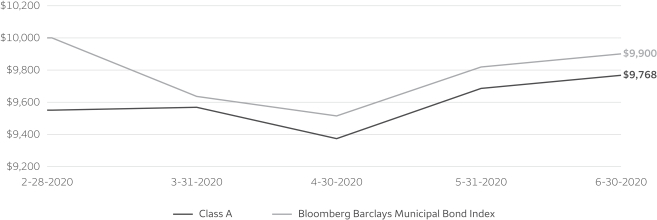
| 1 | Reflects the expense ratios as stated in the most recent prospectuses. The expense ratios shown are subject to change and may differ from the annualized expense ratios shown in the financial highlights of this report. |
| 2 | The manager has contractually committed through October 31, 2021, to waive fees and/or reimburse expenses to the extent necessary to cap total annual fund operating expenses after fee waivers at 0.75% for Class A, 1.50% for Class C, 0.40% for Class R6, 0.60% for Administrator Class, and 0.45% for Institutional Class. Brokerage commissions, stamp duty fees, interest, taxes, acquired fund fees and expenses (if any), and extraordinary expenses are excluded from the expense caps. Prior to or after the commitment expiration date, the caps may be increased or the commitment to maintain the caps may be terminated only with the approval of the Board of Trustees. Without these caps, the Fund’s returns would have been lower. The expense ratio paid by an investor is the net expense ratio (the total annual fund operating expenses after fee waivers) as stated in the prospectuses. |
| 3 | The Bloomberg Barclays Municipal Bond Index is an unmanaged index composed of long-term tax-exempt bonds with a minimum credit rating of Baa. You cannot invest directly in an index. |
| 4 | The chart compares the performance of Class A shares since inception with the Bloomberg Barclays Municipal Bond Index. The chart assumes a hypothetical $10,000 investment in Class A shares and reflects all operating expenses and assumes the maximum initial sales charge of 4.50%. |
| 5 | Amounts are calculated based on the long-term total investments of the Fund. These amounts are subject to change and may have changed since the date specified. |
| 6 | The credit quality distribution of portfolio holdings reflected in the chart is based on ratings from Standard & Poor’s, Moody’s Investors Service, and/or Fitch Ratings Ltd. Credit quality ratings apply to the underlying holdings of the Fund and not to the Fund itself. The percentages of the Fund’s portfolio with the ratings depicted in the chart are calculated based on the total market value of fixed income securities held by the Fund. If a security was rated by all three rating agencies, the middle rating was utilized. If rated by two of three rating agencies, the lower rating was utilized, and if rated by one of the rating agencies, that rating was utilized. Standard & Poor’s rates the creditworthiness of bonds, ranging from AAA (highest) to D (lowest). Ratings from A to CCC may be modified by the addition of a plus (+) or minus (-) sign to show relative standing within the rating categories. Standard & Poor’s rates the creditworthiness of short-term notes from SP-1 (highest) to SP-3 (lowest). Moody’s rates the creditworthiness of bonds, ranging from Aaa (highest) to C (lowest). Ratings Aa to B may be modified by the addition of a number 1 (highest) to 3 (lowest) to show relative standing within the ratings categories. Moody’s rates the creditworthiness of short-term U.S. tax-exempt municipal securities from MIG 1/VMIG 1 (highest) to SG (lowest). Fitch rates the creditworthiness of bonds, ranging from AAA (highest) to D (lowest). Credit quality distribution is subject to change and may have changed since the date specified. |
Wells Fargo Municipal Sustainability Fund | 7
Performance highlights (unaudited)
MANAGER’S DISCUSSION
Fund highlights
| ∎ | The Fund outperformed its benchmark, the Bloomberg Barclays Municipal Bond Index, for the four-month period from the Fund’s inception to June 30, 2020. |
| ∎ | Quality allocation contributed to performance. |
| ∎ | Security selection was the largest detractor from relative performance followed by duration and yield-curve positioning. |
The coronavirus pandemic and resulting liquidity crisis dominated the market during the period.
The four-month period began with the U.S. and global economies reeling from the pandemic-prompted liquidity crisis experienced in March. New liquidity facilities announced by the U.S. Federal Reserve (Fed) provided support to the corporate and municipal bond markets, while individual stimulus payments and loan forbearance helped many reduce or delay the worst impacts of the economic contraction. Stay-at-home orders across the U.S. were eventually lifted, and investors were buoyed by optimism over efforts to reopen the economy.
| Effective maturity distribution as of June 30, 20205 |
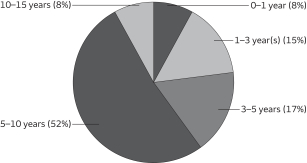 |
The unemployment rate rose to a record high of 14.7%, and data for manufacturing, nonmanufacturing, and consumer and business confidence all fell to record-low levels. Dozens of cities saw large-scale demonstrations and unrest following the death of an unarmed black man by police in Minneapolis. The quarter ended with coronavirus infection rates rising in most states, calling the plans to reopen the economy into question.
The record outflows from municipal mutual funds seen in March gave way to several weeks of consecutive inflows by the end of the second quarter. Yields on the highest-rated municipal bonds fell back near their all-time lows, while yields on bonds rated A, BBB, and below investment grade remained elevated.
The volatility of U.S. Treasury rates decreased in the second quarter. AAA municipals that dictate the performance of duration in the municipal market offer less value than they did three months ago, though municipals remain relatively cheap compared with Treasuries, serving as a modest hedge should rates rise. Given the difficulty of forecasting global health pandemics, we believe that investors are better served looking for relative-value mispricings than making outsized duration bets.
The municipal yield curve steepened during the quarter, with the front end of the curve dropping considerably from the levels seen at the end of March. Short maturity yields, driven by the Fed, should stay reasonably anchored. The growth and inflationary impacts of massive stimulus are less known but have a greater influence on the long end of the curve. Longer yields may see more volatility as recovery from the pandemic continues and the economy recovers fitfully.
We use a sustainable framework for municipal bond investing.
The Fund looks to take advantage of the natural alignment of the municipal sector with sustainable outcomes. Our robust framework and scoring methodology align with green bond principles and social bond principles as we seek to identify bonds that we believe have positive impact. We also evaluate environmental, social, and governance (ESG) risk as part of our fundamental credit research.
A variety of factors affected the Fund’s relative performance.
We were overweight AAA-rated debt, underweight AA-rated debt, overweight A-rated and BBB-rated debt, and had out-of-benchmark allocations to non-investment-grade and nonrated credits. Spreads tightened throughout the quarter for lower-rated investment-grade bonds. Controlling for duration and curve effects, our overweight to medium- and lower-quality credits was a contributor.
Please see footnotes on page 7.
8 | Wells Fargo Municipal Sustainability Fund
Performance highlights (unaudited)
| Credit quality as of June 30, 20206 |
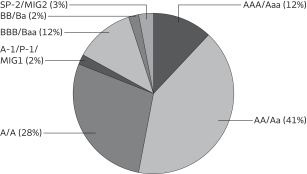 |
High-yield municipals outperformed for the quarter, though they lagged for the year to date, while higher-rated municipals rallied, bringing AAA yields back near all-time lows. A return to positive fund flows could prompt investors to seek out the higher income offered by A-rated and BBB-rated municipals, which have lagged year to date. We anticipate investment-grade municipal defaults will remain rare, but we believe that investors should expect additional ratings downgrades. High-yield municipals may offer opportunity, but issue-specific risks remain elevated and that market segment could be more susceptible to downturns in sentiment or a return to net outflows.
We were underweight general obligation (GO) bonds and overweight revenue bonds. Controlling for duration, curve, and quality-allocation effects, contributors included overweights to the water and sewer and local GO sectors and the state of Colorado. Detractors included overweights to the education and housing sectors and an underweight to the industrial development revenue/pollution control revenue sector.
Strong GO and essential-service bonds performed very well in the quarter, reducing their relative value. Yield-oriented sectors offering higher levels of income, such as transportation and hospitals, may receive increased investor attention. This could be supportive in the months ahead despite fundamental risks. Many municipal sectors are likely to receive additional federal stimulus support, and this aid is increasingly being priced in. Its delay could dampen sentiment. Risks remain elevated in senior care, student housing, and project finance.
Being underweight debt subject to the alternative minimum tax detracted from performance, while our underweight to zero-coupon bonds contributed. Controlling for duration, curve, and quality- and sector-allocation effects, contributors included selection within the housing and electric power sectors and the state of Washington. Detractors included selection within the hospital and special tax sectors.
The outlook remains favorable for active bond management, in our view.
The outlook for bond selection remains favorable. Increased dispersion within rating tiers and sectors offers the opportunity for differentiation among credits. Secondary market trading lacked depth at quarter-end but still offers an outlet for informed investors to identify mispricings.
Please see footnotes on page 7.
Wells Fargo Municipal Sustainability Fund | 9
As a shareholder of the Fund, you incur two types of costs: (1) transaction costs, including sales charges (loads) on purchase payments and contingent deferred sales charges (if any) on redemptions and (2) ongoing costs, including management fees, distribution (12b-1) and/or shareholder servicing fees, and other Fund expenses. This example is intended to help you understand your ongoing costs (in dollars) of investing in the Fund and to compare these costs with the ongoing costs of investing in other mutual funds.
The example is based on an investment of $1,000 invested at the beginning of the six-month period and held for the entire period from January 1, 2020 to June 30, 2020.
Actual expenses
The “Actual” line of the table below provides information about actual account values and actual expenses. You may use the information in this line, together with the amount you invested, to estimate the expenses that you paid over the period. Simply divide your account value by $1,000 (for example, an $8,600 account value divided by $1,000 = 8.6), then multiply the result by the number in the “Actual” line under the heading entitled “Expenses paid during period” for your applicable class of shares to estimate the expenses you paid on your account during this period.
Hypothetical example for comparison purposes
The “Hypothetical” line of the table below provides information about hypothetical account values and hypothetical expenses based on the Fund’s actual expense ratio and an assumed rate of return of 5% per year before expenses, which is not the Fund’s actual return. The hypothetical account values and expenses may not be used to estimate the actual ending account balance or expenses you paid for the period. You may use this information to compare the ongoing costs of investing in the Fund and other funds. To do so, compare this 5% hypothetical example with the 5% hypothetical examples that appear in the shareholder reports of the other funds.
Please note that the expenses shown in the table are meant to highlight your ongoing costs only and do not reflect any transactional costs, such as sales charges (loads) and contingent deferred sales charges. Therefore, the “Hypothetical” line of the table is useful in comparing ongoing costs only and will not help you determine the relative total costs of owning different funds. In addition, if these transactional costs were included, your costs would have been higher.
| Beginning account value 1-1-2020 | Ending account value 6-30-2020 | Expenses paid during the period1 | Annualized net expense ratio | |||||||||||||
Class A | ||||||||||||||||
Actual | $ | 1,000.00 | $ | 1,022.70 | $ | 2.55 | 0.75 | % | ||||||||
Hypothetical (5% return before expenses) | $ | 1,000.00 | $ | 1,014.28 | $ | 2.54 | 0.75 | % | ||||||||
Class C | ||||||||||||||||
Actual | $ | 1,000.00 | $ | 1,020.40 | $ | 5.09 | 1.50 | % | ||||||||
Hypothetical (5% return before expenses) | $ | 1,000.00 | $ | 1,011.76 | $ | 5.07 | 1.50 | % | ||||||||
Class R6 | ||||||||||||||||
Actual | $ | 1,000.00 | $ | 1,023.90 | $ | 1.36 | 0.40 | % | ||||||||
Hypothetical (5% return before expenses) | $ | 1,000.00 | $ | 1,015.46 | $ | 1.35 | 0.40 | % | ||||||||
Administrator Class | ||||||||||||||||
Actual | $ | 1,000.00 | $ | 1,023.20 | $ | 2.04 | 0.60 | % | ||||||||
Hypothetical (5% return before expenses) | $ | 1,000.00 | $ | 1,014.79 | $ | 2.03 | 0.60 | % | ||||||||
Institutional Class | ||||||||||||||||
Actual | $ | 1,000.00 | $ | 1,023.70 | $ | 1.53 | 0.45 | % | ||||||||
Hypothetical (5% return before expenses) | $ | 1,000.00 | $ | 1,015.29 | $ | 1.52 | 0.45 | % | ||||||||
| 1 | Expenses paid is equal to the annualized net expense ratio of each class multiplied by the average account value over the period, multiplied by the number of days in the most recent fiscal half-year divided by the number of days in the fiscal year (to reflect the one-half-year period). |
10 | Wells Fargo Municipal Sustainability Fund
Portfolio of investments—June 30, 2020
| Interest rate | Maturity date | Principal | Value | |||||||||||||
| Municipal Obligations: 100.63% |
| |||||||||||||||
Alabama: 1.12% |
| |||||||||||||||
| Education Revenue: 1.12% | ||||||||||||||||
University of North Alabama Revenue General Fee Series A | 5.00 | % | 11-1-2022 | $ | 265,000 | $ | 285,988 | |||||||||
|
| |||||||||||||||
Arizona: 9.11% |
| |||||||||||||||
| GO Revenue: 4.00% | ||||||||||||||||
Maricopa County AZ Elementary School District #25 Liberty School Improvement Project 2019 Series A (AGM Insured) | 5.00 | 7-1-2023 | 300,000 | 339,210 | ||||||||||||
Pima County AZ Union School District #20 Vail Refunding Bonds School Improvement (AGM Insured) | 5.00 | 7-1-2022 | 625,000 | 678,338 | ||||||||||||
| 1,017,548 | ||||||||||||||||
|
| |||||||||||||||
| Miscellaneous Revenue: 5.11% | ||||||||||||||||
Phoenix AZ Civic Improvement Corporation Water System Sustainability Bonds Series B ## | 5.00 | 7-1-2044 | 1,000,000 | 1,299,625 | ||||||||||||
|
| |||||||||||||||
| 2,317,173 | ||||||||||||||||
|
| |||||||||||||||
| California: 11.04% | ||||||||||||||||
| Health Revenue: 1.05% | ||||||||||||||||
San Buenaventura CA Community Mental Health System | 6.50 | 12-1-2021 | 250,000 | 265,798 | ||||||||||||
|
| |||||||||||||||
| Housing Revenue: 5.75% | ||||||||||||||||
California HFA MFHR | 1.45 | 4-1-2024 | 1,000,000 | 1,008,760 | ||||||||||||
California Municipal Finance Authority Student Housing Revenue CHF Riverside I LLC Projects | 5.00 | 5-15-2029 | 375,000 | 454,594 | ||||||||||||
| 1,463,354 | ||||||||||||||||
|
| |||||||||||||||
| Miscellaneous Revenue: 3.68% | ||||||||||||||||
California Infrastructure & Economic Development Bank Lease Revenue Teachers Retirement | 5.00 | 8-1-2030 | 310,000 | 406,658 | ||||||||||||
San Francisco City & County CA 49 South Van Ness Project Green Bond Series A | 4.00 | 4-1-2034 | 370,000 | 424,930 | ||||||||||||
San Joaquin CA Area Flood Control Agency Smith Canal Area Assessment District Revenue (AGM Insured) | 4.00 | 10-1-2021 | 100,000 | 103,670 | ||||||||||||
| 935,258 | ||||||||||||||||
|
| |||||||||||||||
| Water & Sewer Revenue: 0.56% | ||||||||||||||||
Santa Paula CA Utility Authority Series A | 4.00 | 2-1-2021 | 140,000 | 142,944 | ||||||||||||
|
| |||||||||||||||
| 2,807,354 | ||||||||||||||||
|
| |||||||||||||||
Colorado: 4.76% |
| |||||||||||||||
| Education Revenue: 2.55% | ||||||||||||||||
Colorado ECFA Revenue Refunding & Improvement Bonds Charter School | 5.00 | 3-15-2027 | 535,000 | 649,169 | ||||||||||||
|
| |||||||||||||||
| Health Revenue: 2.21% | ||||||||||||||||
Colorado Health Facilities Authority Revenue Hospital Advent Health Obligated Group Series A | 4.00 | 11-15-2043 | 500,000 | 560,870 | ||||||||||||
|
| |||||||||||||||
| 1,210,039 | ||||||||||||||||
|
| |||||||||||||||
The accompanying notes are an integral part of these financial statements.
Wells Fargo Municipal Sustainability Fund | 11
Portfolio of investments—June 30, 2020
| Interest rate | Maturity date | Principal | Value | |||||||||||||
District of Columbia: 1.28% |
| |||||||||||||||
| Water & Sewer Revenue: 1.28% | ||||||||||||||||
District of Columbia Water & Sewer Authority Public Utility Green Bond Series A | 5.00 | % | 10-1-2038 | $ | 250,000 | $ | 326,268 | |||||||||
|
| |||||||||||||||
Guam: 1.17% |
| |||||||||||||||
| Water & Sewer Revenue: 1.17% | ||||||||||||||||
Guam Government Waterworks Authority Series A | 5.00 | 1-1-2050 | 250,000 | 298,303 | ||||||||||||
|
| |||||||||||||||
Idaho: 1.54% |
| |||||||||||||||
| Health Revenue: 1.54% | ||||||||||||||||
Idaho Health Facilities Authority Hospital Trinity Health Credit Group Series A | 5.00 | 12-1-2047 | 330,000 | 392,208 | ||||||||||||
|
| |||||||||||||||
Illinois: 13.96% |
| |||||||||||||||
| GO Revenue: 5.93% | ||||||||||||||||
Chicago IL Series A | 5.50 | 1-1-2039 | 360,000 | 382,284 | ||||||||||||
Chicago IL Series A | 6.00 | 1-1-2038 | 150,000 | 169,214 | ||||||||||||
Decatur IL (BAM Insured) | 5.00 | 3-1-2024 | 375,000 | 428,543 | ||||||||||||
Kendall, Kane & Will Counties IL CAB School District #308 (AGM Insured) ¤ | 0.00 | 2-1-2027 | 155,000 | 141,717 | ||||||||||||
Will County IL Lincoln-Way Community High School District # 210 Refunded Bond (AGM Insured) | 4.00 | 1-1-2022 | 375,000 | 386,873 | ||||||||||||
| 1,508,631 | ||||||||||||||||
|
| |||||||||||||||
| Miscellaneous Revenue: 2.71% | ||||||||||||||||
Illinois Finance Authority Clean Water Initiative Revolving Fund | 5.00 | 7-1-2024 | 585,000 | 688,615 | ||||||||||||
|
| |||||||||||||||
| Tax Revenue: 2.25% | ||||||||||||||||
Chicago IL Transit Authority Sales Tax Receipts (AGM Insured) | 5.00 | 12-1-2046 | 500,000 | 571,645 | ||||||||||||
|
| |||||||||||||||
| Water & Sewer Revenue: 3.07% | ||||||||||||||||
Chicago IL Wastewater Transmission Series C | 5.00 | 1-1-2024 | 700,000 | 781,004 | ||||||||||||
|
| |||||||||||||||
| 3,549,895 | ||||||||||||||||
|
| |||||||||||||||
Indiana: 4.89% |
| |||||||||||||||
| Miscellaneous Revenue: 2.47% | ||||||||||||||||
Indiana Finance Authority State Revolving Fund Program Green Bond Series E | 5.00 | 2-1-2047 | 500,000 | 628,180 | ||||||||||||
|
| |||||||||||||||
| Water & Sewer Revenue: 2.42% | ||||||||||||||||
Indiana Finance Authority Green Bond Series B | 5.00 | 2-1-2028 | 500,000 | 616,300 | ||||||||||||
|
| |||||||||||||||
| 1,244,480 | ||||||||||||||||
|
| |||||||||||||||
Louisiana: 0.67% |
| |||||||||||||||
| Water & Sewer Revenue: 0.67% | ||||||||||||||||
New Orleans LA Water (BAM Insured) | 5.00 | 12-1-2034 | 150,000 | 170,222 | ||||||||||||
|
| |||||||||||||||
Massachusetts: 2.39% |
| |||||||||||||||
| Education Revenue: 2.39% | ||||||||||||||||
Massachusetts Development Finance Agency Boston College Issue Series U | 5.00 | 7-1-2025 | 500,000 | 607,515 | ||||||||||||
|
| |||||||||||||||
Michigan: 4.73% |
| |||||||||||||||
| Miscellaneous Revenue: 2.41% | ||||||||||||||||
Michigan Building Authority Series I | 5.00 | 10-15-2031 | 500,000 | 613,600 | ||||||||||||
|
| |||||||||||||||
The accompanying notes are an integral part of these financial statements.
12 | Wells Fargo Municipal Sustainability Fund
Portfolio of investments—June 30, 2020
| Interest rate | Maturity date | Principal | Value | |||||||||||||
| Tax Revenue: 0.41% | ||||||||||||||||
Michigan Finance Authority Local Government Loan Program Public Lighting Authority Refunding Bonds Series B | 5.00 | % | 7-1-2044 | $ | 100,000 | $ | 105,305 | |||||||||
|
| |||||||||||||||
| Water & Sewer Revenue: 1.91% | ||||||||||||||||
Great Lakes MI Water Authority Water Supply System Series D | 5.00 | 7-1-2031 | 400,000 | 485,408 | ||||||||||||
|
| |||||||||||||||
| 1,204,313 | ||||||||||||||||
|
| |||||||||||||||
Nevada: 5.35% |
| |||||||||||||||
| GO Revenue: 5.35% | ||||||||||||||||
Clark County NV Flood Control District | 5.00 | 11-1-2029 | 500,000 | 655,295 | ||||||||||||
Clark County NV School District Building Series A | 4.00 | 6-15-2035 | 625,000 | 705,213 | ||||||||||||
| 1,360,508 | ||||||||||||||||
|
| |||||||||||||||
New Jersey: 1.61% |
| |||||||||||||||
| Miscellaneous Revenue: 1.12% | ||||||||||||||||
New Jersey EDA Series XX | 4.00 | 6-15-2024 | 270,000 | 285,825 | ||||||||||||
|
| |||||||||||||||
| Tax Revenue: 0.49% | ||||||||||||||||
New Jersey Garden State Preservation Trust Open & Farmland Series A (AGM Insured) | 5.75 | 11-1-2028 | 100,000 | 124,289 | ||||||||||||
|
| |||||||||||||||
| 410,114 | ||||||||||||||||
|
| |||||||||||||||
New York: 7.02% |
| |||||||||||||||
| Education Revenue: 1.32% | ||||||||||||||||
New York Dormitory Authority Non-State Supported Debt Series A | 5.00 | 7-1-2038 | 270,000 | 334,727 | ||||||||||||
|
| |||||||||||||||
| GO Revenue: 0.52% | ||||||||||||||||
Poughkeepsie City NY Refunding Bonds Public Improvement | 5.00 | 6-1-2024 | 125,000 | 131,658 | ||||||||||||
|
| |||||||||||||||
| Transportation Revenue: 2.56% | ||||||||||||||||
Metropolitan Transportation Authority New York Revenue BAN Subordinated Series B-1 | 5.00 | 5-15-2022 | 625,000 | 652,631 | ||||||||||||
|
| |||||||||||||||
| Water & Sewer Revenue: 2.62% | ||||||||||||||||
New York Environmental Facilities Corporation Clean Water & Drinking Water New York City Municipal Water Finance Authority Project Series A | 5.00 | 6-15-2032 | 500,000 | 666,800 | ||||||||||||
|
| |||||||||||||||
| 1,785,816 | ||||||||||||||||
|
| |||||||||||||||
North Carolina: 0.79% |
| |||||||||||||||
| Housing Revenue: 0.79% | ||||||||||||||||
North Carolina Capital Facilities Finance Refunding Bonds Arc North Carolina Projects (Department of Housing and Urban Development Insured) | 5.00 | 10-1-2024 | 180,000 | 200,000 | ||||||||||||
|
| |||||||||||||||
Ohio: 5.98% |
| |||||||||||||||
| Education Revenue: 1.96% | ||||||||||||||||
The Ohio State University Series B-1 ø | 0.12 | 12-1-2039 | 500,000 | 500,000 | ||||||||||||
|
| |||||||||||||||
| Health Revenue: 4.02% | ||||||||||||||||
Ohio Hospital Facility Revenue Refunding Bonds Cleveland Clinic Health | 5.00 | 1-1-2021 | 1,000,000 | 1,022,020 | ||||||||||||
|
| |||||||||||||||
| 1,522,020 | ||||||||||||||||
|
| |||||||||||||||
The accompanying notes are an integral part of these financial statements.
Wells Fargo Municipal Sustainability Fund | 13
Portfolio of investments—June 30, 2020
| Interest rate | Maturity date | Principal | Value | |||||||||||||
Oregon: 2.50% |
| |||||||||||||||
| GO Revenue: 2.50% | ||||||||||||||||
Bend OR | 5.00 | % | 6-1-2050 | $ | 500,000 | $ | 636,945 | |||||||||
|
| |||||||||||||||
Pennsylvania: 5.61% |
| |||||||||||||||
| Education Revenue: 3.18% | ||||||||||||||||
Allegheny County PA Higher Education Robert Morris University | 5.00 | 10-15-2037 | 250,000 | 260,198 | ||||||||||||
Philadelphia PA IDA Saint Joseph’s University Series C %% | 4.00 | 11-1-2037 | 500,000 | 547,900 | ||||||||||||
| 808,098 | ||||||||||||||||
|
| |||||||||||||||
| Transportation Revenue: 2.43% | ||||||||||||||||
Pennsylvania Turnpike Commisson Turnpike Series B-1 | 5.25 | 6-1-2047 | 535,000 | 617,979 | ||||||||||||
|
| |||||||||||||||
| 1,426,077 | ||||||||||||||||
|
| |||||||||||||||
South Carolina: 1.26% |
| |||||||||||||||
| Education Revenue: 1.26% | ||||||||||||||||
South Carolina Jobs EDA Revenue Wofford College Project | 5.00 | 4-1-2033 | 270,000 | 320,717 | ||||||||||||
|
| |||||||||||||||
Texas: 6.34% |
| |||||||||||||||
| Airport Revenue: 1.48% | ||||||||||||||||
Galveston TX Wharves & Terminal Refunding Bonds | 4.63 | 2-1-2024 | 375,000 | 376,980 | ||||||||||||
|
| |||||||||||||||
| GO Revenue: 2.78% | ||||||||||||||||
Dallas County TX Hospital District Limited Tax | 5.00 | 8-15-2030 | 625,000 | 707,281 | ||||||||||||
|
| |||||||||||||||
| Water & Sewer Revenue: 2.08% | ||||||||||||||||
Texas Water Development Board State Water Implementation Fund Series A | 4.00 | 10-15-2054 | 450,000 | 527,787 | ||||||||||||
|
| |||||||||||||||
| 1,612,048 | ||||||||||||||||
|
| |||||||||||||||
Virginia: 1.52% |
| |||||||||||||||
| Transportation Revenue: 1.52% | ||||||||||||||||
Virginia Small Business Financing Authority AMT 95 Express Lanes LLC Project | 5.00 | 7-1-2049 | 375,000 | 385,346 | ||||||||||||
|
| |||||||||||||||
Washington: 5.99% |
| |||||||||||||||
| Education Revenue: 0.69% | ||||||||||||||||
Washington HEFAR Seattle University Project %% | 5.00 | 5-1-2027 | 145,000 | 174,523 | ||||||||||||
|
| |||||||||||||||
| GO Revenue: 2.92% | ||||||||||||||||
King County WA Public Hospital District #1 Valley Medical Center Refunding Bonds | 5.00 | 12-1-2026 | 625,000 | 744,263 | ||||||||||||
|
| |||||||||||||||
| Utilities Revenue: 2.38% | ||||||||||||||||
Chelan County WA Public Utility District #001 Consolidated Revenue Refunding Bonds Governmental Series A | 4.00 | 7-1-2036 | 500,000 | 605,890 | ||||||||||||
|
| |||||||||||||||
| 1,524,676 | ||||||||||||||||
|
| |||||||||||||||
Total Municipal Obligations (Cost $24,779,860) |
| 25,598,025 | ||||||||||||||
|
| |||||||||||||||
The accompanying notes are an integral part of these financial statements.
14 | Wells Fargo Municipal Sustainability Fund
Portfolio of investments—June 30, 2020
| Yield | Shares | Value | ||||||||||||||
| Short-Term Investments: 1.24% | ||||||||||||||||
Investment Companies: 1.24% |
| |||||||||||||||
Wells Fargo Municipal Cash Management Money Market Fund Institutional Class (l)(u) | 0.10 | % | 315,686 | $ | 315,780 | |||||||||||
|
| |||||||||||||||
Total Short-Term Investments (Cost $315,775) | 315,780 | |||||||||||||||
|
| |||||||||||||||
| Total investments in securities (Cost $25,095,635) | 101.87 | % | 25,913,805 | |||||
Other assets and liabilities, net | (1.87 | ) | (475,105 | ) | ||||
|
|
|
| |||||
| Total net assets | 100.00 | % | $ | 25,438,700 | ||||
|
|
|
| |||||
| ## | All or a portion of this security is segregated for when-issued securities. |
| ¤ | The security is issued in zero coupon form with no periodic interest payments. |
| ø | Variable rate demand notes are subject to a demand feature which reduces the effective maturity. The maturity date shown represents the final maturity date of the security. The interest rate is determined and reset by the issuer daily, weekly, or monthly depending upon the terms of the security. The rate shown is the rate in effect at period end. |
| %% | The security is purchased on a when-issued basis. |
| (l) | The issuer of the security is an affiliated person of the Fund as defined in the Investment Company Act of 1940. |
| (u) | The rate represents the 7-day annualized yield at period end. |
Abbreviations:
| AGM | Assured Guaranty Municipal |
| AMT | Alternative minimum tax |
| BAM | Build America Mutual Assurance Company |
| BAN | Bond anticipation notes |
| CAB | Capital appreciation bond |
| ECFA | Educational & Cultural Facilities Authority |
| EDA | Economic Development Authority |
| GO | General obligation |
| HEFAR | Higher Education Facilities Authority Revenue |
| HFA | Housing Finance Authority |
| IDA | Industrial Development Authority |
| MFHR | Multifamily housing revenue |
Investments in Affiliates
An affiliated investment is an investment in which the Fund owns at least 5% of the outstanding voting shares of the issuer or as a result of other relationships, such as the Fund and the issuer having the same investment manager. Transactions with issuers that were either affiliated persons of the Fund at the beginning of the period or the end of the period were as follows:
| Value, beginning of period | Purchases | Sales proceeds | Net realized gains (losses) | Net change in unrealized gains (losses) | Income from affiliated securities | Value, end of period | % of net assets | |||||||||||||||||||||||||
| Short-Term Investments | ||||||||||||||||||||||||||||||||
Investment Companies | ||||||||||||||||||||||||||||||||
Wells Fargo Municipal Cash Management Money Market Fund Institutional Class | $ | 0 | $ | 33,668,483 | $ | (33,352,497 | ) | $ | (211 | ) | $ | 5 | $ | 2,778 | $ | 315,780 | 1.24 | % | ||||||||||||||
The accompanying notes are an integral part of these financial statements.
Wells Fargo Municipal Sustainability Fund | 15
Statement of assets and liabilities—June 30, 2020
Assets | ||||
Investments in unaffiliated securities, at value (cost $24,779,860) | $ | 25,598,025 | ||
Investments in affiliated securities, at value (cost $315,775) | 315,780 | |||
Receivable for interest | 264,133 | |||
Receivable from manager | 22,039 | |||
Prepaid expenses and other assets | 68,113 | |||
|
| |||
Total assets | 26,268,090 | |||
|
| |||
Liabilities | ||||
Payable for investments purchased | 741,093 | |||
Dividends payable | 41,707 | |||
Administration fees payable | 940 | |||
Distribution fee payable | 624 | |||
Trustees’ fees and expenses payable | 852 | |||
Accrued expenses and other liabilities | 44,174 | |||
|
| |||
Total liabilities | 829,390 | |||
|
| |||
Total net assets | $ | 25,438,700 | ||
|
| |||
Net assets consist of | ||||
Paid-in capital | $ | 25,002,010 | ||
Total distributable earnings | 436,690 | |||
|
| |||
Total net assets | $ | 25,438,700 | ||
|
| |||
Computation of net asset value and offering price per share | ||||
Net assets – Class A | $ | 1,019,508 | ||
Shares outstanding – Class A1 | 50,101 | |||
Net asset value per share – Class A | $20.35 | |||
Maximum offering price per share – Class A2 | $21.31 | |||
Net assets – Class C | $ | 1,017,346 | ||
Shares outstanding – Class C1 | 50,000 | |||
Net asset value per share – Class C | $20.35 | |||
Net assets – Class R6 | $ | 21,366,906 | ||
Shares outstanding – Class R61 | 1,050,000 | |||
Net asset value per share – Class R6 | $20.35 | |||
Net assets – Administrator Class | $ | 1,017,468 | ||
Shares outstanding – Administrator Class1 | 50,000 | |||
Net asset value per share – Administrator Class | $20.35 | |||
Net assets – Institutional Class | $ | 1,017,472 | ||
Shares outstanding – Institutional Class1 | 50,000 | |||
Net asset value per share �� Institutional Class | $20.35 | |||
| 1 | The Fund has an unlimited number of authorized shares. |
| 2 | Maximum offering price is computed as 100/95.50 of net asset value. On investments of $50,000 or more, the offering price is reduced. |
The accompanying notes are an integral part of these financial statements.
16 | Wells Fargo Municipal Sustainability Fund
Statement of operations—year ended June 30, 20201
Investment income | ||||
Interest | $ | 184,281 | ||
Income from affiliated securities | 2,778 | |||
|
| |||
Total investment income | 187,059 | |||
|
| |||
Expenses | ||||
Management fee | 32,992 | |||
Administration fees |
| |||
Class A | 529 | |||
Class C | 528 | |||
Class R6 | 2,078 | |||
Administrator Class | 330 | |||
Institutional Class | 264 | |||
Shareholder servicing fees |
| |||
Class A | 826 | |||
Class C | 825 | |||
Administrator Class | 825 | |||
Distribution fee |
| |||
Class C | 2,474 | |||
Custody and accounting fees | 4,310 | |||
Professional fees | 45,306 | |||
Registration fees | 26,852 | |||
Shareholder report expenses | 30,250 | |||
Trustees’ fees and expenses | 6,464 | |||
Other fees and expenses | 6,133 | |||
|
| |||
Total expenses | 160,986 | |||
Less: Fee waivers and/or expense reimbursements |
| |||
Fund-level | (121,824 | ) | ||
Class A | (98 | ) | ||
Class C | (110 | ) | ||
Administrator Class | (395 | ) | ||
|
| |||
Net expenses | 38,559 | |||
|
| |||
Net investment income | 148,500 | |||
|
| |||
Realized and unrealized gains (losses) on investments | ||||
Net realized losses on |
| |||
Unaffiliated securities | (378,357 | ) | ||
Affiliated securities | (211 | ) | ||
|
| |||
Net realized losses on investments | (378,568 | ) | ||
|
| |||
Net change in unrealized gains (losses) on |
| |||
Unaffiliated securities | 818,165 | |||
Affiliated securities | 5 | |||
|
| |||
Net change in unrealized gains (losses) on investments | 818,170 | |||
|
| |||
Net realized and unrealized gains (losses) on investments | 439,602 | |||
|
| |||
Net increase in net assets resulting from operations | $ | 588,102 | ||
|
| |||
| 1 | For the period from February 28, 2020 (commencement of operations) to June 30, 2020 |
The accompanying notes are an integral part of these financial statements.
Wells Fargo Municipal Sustainability Fund | 17
Statement of changes in net assets
| Year ended June 30, 20201 | ||||||||
Operations |
| |||||||
Net investment income | $ | 148,500 | ||||||
Net realized losses on investments | (378,568 | ) | ||||||
Net change in unrealized gains (losses) on investments | 818,170 | |||||||
|
| |||||||
Net increase in net assets resulting from operations | 588,102 | |||||||
|
| |||||||
Distributions to shareholders from net investment income and net realized gains |
| |||||||
Class A | (5,137 | ) | ||||||
Class C | (2,811 | ) | ||||||
Class R6 | (131,738 | ) | ||||||
Administrator Class | (5,618 | ) | ||||||
Institutional Class | (6,108 | ) | ||||||
|
| |||||||
Total distributions to shareholders | �� | (151,412 | ) | |||||
|
| |||||||
Capital share transactions | Shares | |||||||
Proceeds from shares sold |
| |||||||
Class A | 50,101 | 1,002,010 | ||||||
Class C | 50,000 | 1,000,000 | ||||||
Class R6 | 1,050,000 | 21,000,000 | ||||||
Administrator Class | 50,000 | 1,000,000 | ||||||
Institutional Class | 50,000 | 1,000,000 | ||||||
|
| |||||||
| 25,002,010 | ||||||||
|
| |||||||
Net increase in net assets resulting from capital share transactions | 25,002,010 | |||||||
|
| |||||||
Total increase in net assets | 25,438,700 | |||||||
|
| |||||||
Net assets | ||||||||
Beginning of period | 0 | |||||||
|
| |||||||
End of period | $ | 25,438,700 | ||||||
|
| |||||||
| 1 | For the period from February 28, 2020 (commencement of operations) to June 30, 2020 |
The accompanying notes are an integral part of these financial statements.
18 | Wells Fargo Municipal Sustainability Fund
(For a share outstanding throughout the period)
| CLASS A | Year ended June 30, 20201 | |||
Net asset value, beginning of period | $20.00 | |||
Net investment income | 0.10 | |||
Net realized and unrealized gains (losses) on investments | 0.35 | |||
|
| |||
Total from investment operations | 0.45 | |||
Distributions to shareholders from | ||||
Net investment income | (0.10 | ) | ||
Net asset value, end of period | $20.35 | |||
Total return2 | 2.27 | % | ||
Ratios to average net assets (annualized) | ||||
Gross expenses | 2.26 | % | ||
Net expenses | 0.75 | % | ||
Net investment income | 1.52 | % | ||
Supplemental data | ||||
Portfolio turnover rate | 32 | % | ||
Net assets, end of period (000s omitted) | $1,020 | |||
| 1 | For the period from February 28, 2020 (commencement of class operations) to June 30, 2020 |
| 2 | Total return calculations do not include any sales charges. Returns for periods of less than one year are not annualized. |
The accompanying notes are an integral part of these financial statements.
Wells Fargo Municipal Sustainability Fund | 19
Financial highlights
(For a share outstanding throughout the period)
| CLASS C | Year ended June 30, 20201 | |||
Net asset value, beginning of period | $20.00 | |||
Net investment income | 0.05 | |||
Net realized and unrealized gains (losses) on investments | 0.36 | |||
|
| |||
Total from investment operations | 0.41 | |||
Distributions to shareholders from | ||||
Net investment income | (0.06 | ) | ||
Net asset value, end of period | $20.35 | |||
Total return2 | 2.04 | % | ||
Ratios to average net assets (annualized) | ||||
Gross expenses | 3.01 | % | ||
Net expenses | 1.50 | % | ||
Net investment income | 0.78 | % | ||
Supplemental data | ||||
Portfolio turnover rate | 32 | % | ||
Net assets, end of period (000s omitted) | $1,017 | |||
| 1 | For the period from February 28, 2020 (commencement of class operations) to June 30, 2020 |
| 2 | Total return calculations do not include any sales charges. Returns for periods of less than one year are not annualized. |
The accompanying notes are an integral part of these financial statements.
20 | Wells Fargo Municipal Sustainability Fund
Financial highlights
(For a share outstanding throughout the period)
| CLASS R6 | Year ended June 30, 20201 | |||
Net asset value, beginning of period | $20.00 | |||
Net investment income | 0.13 | 2 | ||
Net realized and unrealized gains (losses) on investments | 0.35 | |||
|
| |||
Total from investment operations | 0.48 | |||
Distributions to shareholders from | ||||
Net investment income | (0.13 | ) | ||
Net asset value, end of period | $20.35 | |||
Total return3 | 2.39 | % | ||
Ratios to average net assets (annualized) | ||||
Gross expenses | 1.88 | % | ||
Net expenses | 0.40 | % | ||
Net investment income | 1.87 | % | ||
Supplemental data | ||||
Portfolio turnover rate | 32 | % | ||
Net assets, end of period (000s omitted) | $21,367 | |||
| 1 | For the period from February 28, 2020 (commencement of class operations) to June 30, 2020 |
| 2 | Calculated based upon average shares outstanding |
| 3 | Returns for periods of less than one year are not annualized. |
The accompanying notes are an integral part of these financial statements.
Wells Fargo Municipal Sustainability Fund | 21
Financial highlights
(For a share outstanding throughout the period)
| ADMINISTRATOR CLASS | Year ended June 30, 20201 | |||
Net asset value, beginning of period | $20.00 | |||
Net investment income | 0.11 | |||
Net realized and unrealized gains (losses) on investments | 0.35 | |||
|
| |||
Total from investment operations | 0.46 | |||
Distributions to shareholders from | ||||
Net investment income | (0.11 | ) | ||
Net asset value, end of period | $20.35 | |||
Total return2 | 2.32 | % | ||
Ratios to average net assets (annualized) | ||||
Gross expenses | 2.20 | % | ||
Net expenses | 0.60 | % | ||
Net investment income | 1.67 | % | ||
Supplemental data | ||||
Portfolio turnover rate | 32 | % | ||
Net assets, end of period (000s omitted) | $1,017 | |||
| 1 | For the period from February 28, 2020 (commencement of class operations) to June 30, 2020 |
| 2 | Returns for periods of less than one year are not annualized. |
The accompanying notes are an integral part of these financial statements.
22 | Wells Fargo Municipal Sustainability Fund
Financial highlights
(For a share outstanding throughout the period)
| INSTITUTIONAL CLASS | Year ended June 30, 20201 | |||
Net asset value, beginning of period | $20.00 | |||
Net investment income | 0.12 | |||
Net realized and unrealized gains (losses) on investments | 0.35 | |||
|
| |||
Total from investment operations | 0.47 | |||
Distributions to shareholders from | ||||
Net investment income | (0.12 | ) | ||
Net asset value, end of period | $20.35 | |||
Total return2 | 2.37 | % | ||
Ratios to average net assets (annualized) | ||||
Gross expenses | 1.93 | % | ||
Net expenses | 0.45 | % | ||
Net investment income | 1.82 | % | ||
Supplemental data | ||||
Portfolio turnover rate | 32 | % | ||
Net assets, end of period (000s omitted) | $1,017 | |||
| 1 | For the period from February 28, 2020 (commencement of class operations) to June 30, 2020 |
| 2 | Returns for periods of less than one year are not annualized. |
The accompanying notes are an integral part of these financial statements.
Wells Fargo Municipal Sustainability Fund | 23
1. ORGANIZATION
Wells Fargo Funds Trust (the “Trust”), a Delaware statutory trust organized on March 10, 1999, is an open-end management investment company registered under the Investment Company Act of 1940, as amended (the “1940 Act”). As an investment company, the Trust follows the accounting and reporting guidance in Financial Accounting Standards Board (“FASB”) Accounting Standards Codification Topic 946, Financial Services – Investment Companies. These financial statements report on the Wells Fargo Municipal Sustainability Fund (the “Fund”) which is a diversified series of the Trust.
2. SIGNIFICANT ACCOUNTING POLICIES
The following significant accounting policies, which are consistently followed in the preparation of the financial statements of the Fund, are in conformity with U.S. generally accepted accounting principles which require management to make estimates and assumptions that affect the reported amounts of assets and liabilities, disclosure of contingent assets and liabilities at the date of the financial statements, and the reported amounts of revenues and expenses during the reporting period. Actual results could differ from those estimates.
Securities valuation
All investments are valued each business day as of the close of regular trading on the New York Stock Exchange (generally 4 p.m. Eastern Time), although the Fund may deviate from this calculation time under unusual or unexpected circumstances.
Debt securities are valued at the evaluated bid price provided by an independent pricing service (e.g. taking into account various factors, including yields, maturities, or credit ratings) or, if a reliable price is not available, the quoted bid price from an independent broker-dealer.
Investments in registered open-end investment companies are valued at net asset value.
Investments which are not valued using any of the methods discussed above are valued at their fair value, as determined in good faith by the Board of Trustees of the Fund. The Board of Trustees has established a Valuation Committee comprised of the Trustees and has delegated to it the authority to take any actions regarding the valuation of portfolio securities that the Valuation Committee deems necessary or appropriate, including determining the fair value of portfolio securities, unless the determination has been delegated to the Wells Fargo Asset Management Pricing Committee at Wells Fargo Funds Management, LLC (“Funds Management”). The Board of Trustees retains the authority to make or ratify any valuation decisions or approve any changes to the Valuation Procedures as it deems appropriate. On a quarterly basis, the Board of Trustees receives reports on any valuation actions taken by the Valuation Committee or the Wells Fargo Asset Management Pricing Committee which may include items for ratification.
When-issued transactions
The Fund may purchase securities on a forward commitment or when-issued basis. The Fund records a when-issued transaction on the trade date and will segregate assets in an amount at least equal in value to the Fund’s commitment to purchase when-issued securities. Securities purchased on a when-issued basis are marked-to-market daily and the Fund begins earning interest on the settlement date. Losses may arise due to changes in the market value of the underlying securities or if the counterparty does not perform under the contract.
Security transactions and income recognition
Securities transactions are recorded on a trade date basis. Realized gains or losses are recorded on the basis of identified cost.
Interest income is accrued daily and bond discounts are accreted and premiums are amortized daily. To the extent debt obligations are placed on non-accrual status, any related interest income may be reduced by writing off interest receivables when the collection of all or a portion of interest has been determined to be doubtful based on consistently applied procedures and the fair value has decreased. If the issuer subsequently resumes interest payments or when the collectability of interest is reasonably assured, the debt obligation is removed from non-accrual status.
Distributions to shareholders
Distributions to shareholders from net investment income are declared daily and paid monthly. Distributions from net realized gains, if any, are recorded on the ex-dividend date and paid at least annually. Such distributions are determined in accordance with income tax regulations and may differ from U.S. generally accepted accounting principles. Dividend sources are estimated at the time of declaration. The tax character of distributions is determined as of the Fund’s fiscal year end. Therefore, a portion of the Fund’s distributions made prior to the Fund’s fiscal year end may be categorized as a tax return of capital at year end.
24 | Wells Fargo Municipal Sustainability Fund
Notes to financial statements
Federal and other taxes
The Fund intends to qualify as a regulated investment company by distributing substantially all of its investment company taxable and tax-exempt income and any net realized capital gains (after reduction for capital loss carryforwards) sufficient to relieve it from all, or substantially all, federal income taxes. Accordingly, no provision for federal income taxes was required.
The Fund’s income and federal excise tax returns and all financial records supporting those returns for the fiscal year since commencement of operations will be subject to examination by the federal and Delaware revenue authorities. Management has analyzed the Fund’s tax positions taken on federal, state, and foreign tax returns for all open tax years and does not believe that there are any uncertain tax positions that require recognition of a tax liability.
As of June 30, 2020, the aggregate cost of all investments for federal income tax purposes was $25,095,635 and the unrealized gains (losses) consisted of:
Gross unrealized gains | $ | 874,738 | ||
Gross unrealized losses | (56,568 | ) | ||
Net unrealized gains | $ | 818,170 | ||
As of June 30, 2020, the Fund had capital loss carryforwards which consist of $378,568 in short-term capital losses.
Class allocations
The separate classes of shares offered by the Fund differ principally in applicable sales charges, distribution, shareholder servicing, and administration fees. Class specific expenses are charged directly to that share class. Investment income, common fund-level expenses, and realized and unrealized gains (losses) on investments are allocated daily to each class of shares based on the relative proportion of net assets of each class.
3. FAIR VALUATION MEASUREMENTS
Fair value measurements of investments are determined within a framework that has established a fair value hierarchy based upon the various data inputs utilized in determining the value of the Fund’s investments. The three-level hierarchy gives the highest priority to unadjusted quoted prices in active markets for identical assets or liabilities (Level 1) and the lowest priority to unobservable inputs (Level 3). The Fund’s investments are classified within the fair value hierarchy based on the lowest level of input that is significant to the fair value measurement. The inputs are summarized into three broad levels as follows:
| ∎ | Level 1 – quoted prices in active markets for identical securities |
| ∎ | Level 2 – other significant observable inputs (including quoted prices for similar securities, interest rates, prepayment speeds, credit risk, etc.) |
| ∎ | Level 3 – significant unobservable inputs (including the Fund’s own assumptions in determining the fair value of investments) |
The inputs or methodologies used for valuing investments in securities are not necessarily an indication of the risk associated with investing in those securities.
The following is a summary of the inputs used in valuing the Fund’s assets and liabilities as of June 30, 2020:
| Quoted prices (Level 1) | Other significant observable inputs (Level 2) | Significant (Level 3) | Total | |||||||||||||
Assets | ||||||||||||||||
Investments in: | ||||||||||||||||
Municipal obligations | $ | 0 | $ | 25,598,025 | $ | 0 | $ | 25,598,025 | ||||||||
Short-term investments | ||||||||||||||||
Investment companies | 315,780 | 0 | 0 | 315,780 | ||||||||||||
Total assets | $ | 315,780 | $ | 25,598,025 | $ | 0 | $ | 25,913,805 | ||||||||
Additional sector, industry or geographic detail is included in the Portfolio of Investments.
For the period from February 28, 2020 (commencement of operations) to June 30, 2020, the Fund did not have any transfers into/out of Level 3.
Wells Fargo Municipal Sustainability Fund | 25
Notes to financial statements
4. TRANSACTIONS WITH AFFILIATES
Management fee
Funds Management, an indirect wholly owned subsidiary of Wells Fargo & Company (“Wells Fargo”), is the manager of the Fund and provides advisory and fund-level administrative services under an investment management agreement. Under the investment management agreement, Funds Management is responsible for, among other services, implementing the investment objectives and strategies of the Fund, supervising the subadviser and providing fund-level administrative services in connection with the Fund’s operations. As compensation for its services under the investment management agreement, Funds Management is entitled to receive a management fee at the following annual rate based on the Fund’s average daily net assets:
| Average daily net assets | Management fee | |||
First $500 million | 0.400 | % | ||
Next $500 million | 0.375 | |||
Next $2 billion | 0.350 | |||
Next $2 billion | 0.325 | |||
Next $5 billion | 0.290 | |||
Over $10 billion | 0.280 | |||
For the period from February 28, 2020 (commencement of operations) to June 30, 2020, the management fee was equivalent to an annual rate of 0.40% of the Fund’s average daily net assets.
Funds Management has retained the services of a subadviser to provide daily portfolio management to the Fund. The fee for subadvisory services is borne by Funds Management. Wells Capital Management Incorporated, an affiliate of Funds Management and an indirect wholly owned subsidiary of Wells Fargo, is the subadviser to the Fund and is entitled to receive a fee from Funds Management at an annual rate starting at 0.20% and declining to 0.10% as the average daily net assets of the Fund increase.
Administration fees
Under a class-level administration agreement, Funds Management provides class-level administrative services to the Fund, which includes paying fees and expenses for services provided by the transfer agent, sub-transfer agents, omnibus account servicers and record-keepers. As compensation for its services under the class-level administration agreement, Funds Management receives an annual fee which is calculated based on the average daily net assets of each class as follows:
| Class-level administration fee | ||||
Class A, Class C | 0.16 | % | ||
Class R6 | 0.03 | |||
Administrator Class | 0.10 | |||
Institutional Class | 0.08 | |||
Waivers and/or expense reimbursements
Funds Management has contractually waived and/or reimbursed management and administration fees to the extent necessary to maintain certain net operating expense ratios for the Fund. When each class of the Fund has exceeded its expense cap, Funds Management has waived fees and/or reimbursed expenses from fund-level expenses on a proportionate basis and then from class specific expenses. When only certain classes exceed their expense caps, waivers and/or reimbursements are applied against class specific expenses before fund-level expenses. Funds Management has committed through October 31, 2021 to waive fees and/or reimburse expenses to the extent necessary to cap the Fund’s expenses at 0.75% for Class A shares, 1.50% for Class C shares, 0.40% for Class R6 shares, 0.60% for Administrator Class shares and 0.45% for Institutional Class shares. Prior to or after the commitment expiration date, the cap may be increased or the commitment to maintain the cap may be terminated only with the approval of the Board of Trustees.
Distribution fee
The Trust has adopted a distribution plan for Class C shares of the Fund pursuant to Rule 12b-1 under the 1940 Act. A distribution fee is charged to Class C shares and paid to Wells Fargo Funds Distributor, LLC (“Funds Distributor”), the principal underwriter, at an annual rate of 0.75% of the average daily net assets of Class C shares.
26 | Wells Fargo Municipal Sustainability Fund
Notes to financial statements
In addition, Funds Distributor is entitled to receive the front-end sales charge from the purchase of Class A shares and a contingent deferred sales charge on the redemption of certain Class A shares. Funds Distributor is also entitled to receive the contingent deferred sales charges from redemptions of Class C shares. Funds Distributor did not receive any front-end or contingent deferred sales charges from Class A or Class C shares for the period from February 28, 2020 (commencement of operations) to June 30, 2020.
Shareholder servicing fees
The Trust has entered into contracts with one or more shareholder servicing agents, whereby Class A, Class C, and Administrator Class of the Fund are charged a fee at an annual rate of 0.25% of the average daily net assets of each respective class. A portion of these total shareholder servicing fees were paid to affiliates of Wells Fargo.
Interfund transactions
The Fund may purchase or sell portfolio investment securities to certain other Wells Fargo affiliates pursuant to Rule 17a-7 under the 1940 Act and under procedures adopted by the Board of Trustees. The procedures have been designed to ensure that these interfund transactions, which do not incur broker commissions, are effected at current market prices. Pursuant to these procedures, the Fund had $16,000,000 and $11,000,000 in interfund purchases and sales, respectively, for the period from February 28, 2020 (commencement of operations) to June 30, 2020.
5. INVESTMENT PORTFOLIO TRANSACTIONS
Purchases and sales of investments, excluding U.S. government obligations (if any) and short-term securities, for the period from February 28, 2020 (commencement of operations) to June 30, 2020 were $30,484,484 and $5,727,805, respectively.
6. DISTRIBUTIONS TO SHAREHOLDERS
The tax character of distributions paid for the period from February 28, 2020 (commencement of operations) to June 30, 2020 was $151,412 of tax-exempt income.
As of June 30, 2020, the components of distributable earnings on a tax basis were as follows:
| Undistributed tax-exempt income | Unrealized gains | Capital loss carryforward | ||
| $38,795 | $818,170 | $(378,568) | ||
7. INDEMNIFICATION
Under the Fund’s organizational documents, the officers and Trustees have been granted certain indemnification rights against certain liabilities that may arise out of performance of their duties to the Fund. The Fund has entered into a separate agreement with each Trustee that converts indemnification rights currently existing under the Fund’s organizational documents into contractual rights that cannot be changed in the future without the consent of the Trustee. Additionally, in the normal course of business, the Fund may enter into contracts with service providers that contain a variety of indemnification clauses. The Fund’s maximum exposure under these arrangements is dependent on future claims that may be made against the Fund and, therefore, cannot be estimated.
8. CORONAVIRUS (COVID-19) PANDEMIC
On March 11, 2020, the World Health Organization announced that it had made the assessment that coronavirus disease 2019 (“COVID-19”) is a pandemic. The impacts of COVID-19 are adversely affecting the entire global economy, individual companies and investment products, and the market in general. There is significant uncertainty around the extent and duration of business disruptions related to COVID-19 and the impacts may be short term or may last for an extended period of time. The risk of further spreading of COVID-19 has led to significant uncertainty and volatility in the financial markets.
Wells Fargo Municipal Sustainability Fund | 27
Report of independent registered public accounting firm
To the Shareholders of the Fund and Board of Trustees
Wells Fargo Funds Trust:
Opinion on the Financial Statements
We have audited the accompanying statement of assets and liabilities of Wells Fargo Municipal Sustainability Fund (the Fund), one of the funds constituting Wells Fargo Funds Trust, including the portfolio of investments, as of June 30, 2020, the related statements of operations and changes in net assets for the period from February 28, 2020 (commencement of operations) to June 30, 2020, and the related notes (collectively, the financial statements) and the financial highlights for the period from February 28, 2020 to June 30, 2020. In our opinion, the financial statements and financial highlights present fairly, in all material respects, the financial position of the Fund as of June 30, 2020, the results of its operations, the changes in its net assets, and the financial highlights for the period from February 28, 2020 to June 30, 2020, in conformity with U.S. generally accepted accounting principles.
Basis for Opinion
These financial statements and financial highlights are the responsibility of the Fund’s management. Our responsibility is to express an opinion on these financial statements and financial highlights based on our audit. We are a public accounting firm registered with the Public Company Accounting Oversight Board (United States) (PCAOB) and are required to be independent with respect to the Fund in accordance with the U.S. federal securities laws and the applicable rules and regulations of the Securities and Exchange Commission and the PCAOB.
We conducted our audit in accordance with the standards of the PCAOB. Those standards require that we plan and perform the audit to obtain reasonable assurance about whether the financial statements and financial highlights are free of material misstatement, whether due to error or fraud. Our audit included performing procedures to assess the risks of material misstatement of the financial statements and financial highlights, whether due to error or fraud, and performing procedures that respond to those risks. Such procedures included examining, on a test basis, evidence regarding the amounts and disclosures in the financial statements and financial highlights. Such procedures also included confirmation of securities owned as of June 30, 2020, by correspondence with the custodian, transfer agent and brokers, or by other appropriate auditing procedures. Our audit also included evaluating the accounting principles used and significant estimates made by management, as well as evaluating the overall presentation of the financial statements and financial highlights. We believe that our audit provides a reasonable basis for our opinion.

We have not been able to determine the specific year that we began serving as the auditor of one or more Wells Fargo Funds investment companies; however we are aware that we have served as the auditor of one or more Wells Fargo Funds investment companies since at least 1955.
Boston, Massachusetts
August 29, 2020
28 | Wells Fargo Municipal Sustainability Fund
TAX INFORMATION
Pursuant to Section 852 of the Internal Revenue Code, 100% of distributions paid from net investment income is designated as exempt-interest dividends for the period from February 28, 2020 (commencement of operations) to June 30, 2020.
PROXY VOTING INFORMATION
A description of the policies and procedures used to determine how to vote proxies relating to portfolio securities is available, upon request, by calling 1-800-222-8222, visiting our website at wfam.com, or visiting the SEC website at sec.gov. Information regarding how the proxies related to portfolio securities were voted during the most recent 12-month period ended June 30 is available on the website at wfam.com or by visiting the SEC website at sec.gov.
QUARTERLY PORTFOLIO HOLDINGS INFORMATION
The Fund files its complete schedule of portfolio holdings with the SEC for the first and third quarters of each fiscal year as an exhibit to its reports on Form N-PORT. Shareholders may view the filed Form N-PORT by visiting the SEC website at sec.gov.
Wells Fargo Municipal Sustainability Fund | 29
Other information (unaudited)
BOARD OF TRUSTEES AND OFFICERS
Each of the Trustees and Officers1 listed in the table below acts in identical capacities for each fund in the Wells Fargo family of funds, which consists of 147 mutual funds comprising the Wells Fargo Funds Trust, Wells Fargo Variable Trust, Wells Fargo Master Trust and four closed-end funds (collectively the “Fund Complex”). This table should be read in conjunction with the Prospectus and the Statement of Additional Information2. The mailing address of each Trustee and Officer is 525 Market Street, 12th Floor, San Francisco, CA 94105. Each Trustee and Officer serves an indefinite term, however, each Trustee serves such term until reaching the mandatory retirement age established by the Trustees.
Independent Trustees
| Name and year of birth | Position held and length of service* | Principal occupations during past five years or longer | Current other public company or investment company directorships | |||
| William R. Ebsworth (Born 1957) | Trustee, since 2015 | Retired. From 1984 to 2013, equities analyst, portfolio manager, research director and chief investment officer at Fidelity Management and Research Company in Boston, Tokyo, and Hong Kong, and retired in 2013 as Chief Investment Officer of Fidelity Strategic Advisers, Inc. where he led a team of investment professionals managing client assets. Prior thereto, Board member of Hong Kong Securities Clearing Co., Hong Kong Options Clearing Corp., the Thailand International Fund, Ltd., Fidelity Investments Life Insurance Company, and Empire Fidelity Investments Life Insurance Company. Audit Committee Chair and Investment Committee Chair of the Vincent Memorial Hospital Endowment (non-profit organization). Mr. Ebsworth is a CFA® charterholder. | N/A | |||
| Jane A. Freeman (Born 1953) | Trustee, since 2015; Chair Liaison, since 2018 | Retired. From 2012 to 2014 and 1999 to 2008, Chief Financial Officer of Scientific Learning Corporation. From 2008 to 2012, Ms. Freeman provided consulting services related to strategic business projects. Prior to 1999, Portfolio Manager at Rockefeller & Co. and Scudder, Stevens & Clark. Board member of the Harding Loevner Funds from 1996 to 2014, serving as both Lead Independent Director and chair of the Audit Committee. Board member of the Russell Exchange Traded Funds Trust from 2011 to 2012 and the chair of the Audit Committee. Ms. Freeman is also an inactive Chartered Financial Analyst. | N/A | |||
| Isaiah Harris, Jr. (Born 1952) | Trustee, since 2009; Audit Committee Chairman, since 2019 | Retired. Chairman of the Board of CIGNA Corporation since 2009, and Director since 2005. From 2003 to 2011, Director of Deluxe Corporation. Prior thereto, President and CEO of BellSouth Advertising and Publishing Corp. from 2005 to 2007, President and CEO of BellSouth Enterprises from 2004 to 2005 and President of BellSouth Consumer Services from 2000 to 2003. Emeritus member of the Iowa State University Foundation Board of Governors. Emeritus Member of the Advisory Board of Iowa State University School of Business. Advisory Board Member, Palm Harbor Academy (private school). Advisory Board Member, Child Evangelism Fellowship (non-profit). Mr. Harris is a certified public accountant (inactive status). | CIGNA Corporation | |||
| Judith M. Johnson (Born 1949) | Trustee, since 2008; Audit Committee Chairman, from 2009 to 2018 | Retired. Prior thereto, Chief Executive Officer and Chief Investment Officer of Minneapolis Employees Retirement Fund from 1996 to 2008. Ms. Johnson is an attorney, certified public accountant and a certified managerial accountant. | N/A | |||
30 | Wells Fargo Municipal Sustainability Fund
Other information (unaudited)
| Name and year of birth | Position held and length of service* | Principal occupations during past five years or longer | Current other public company or investment company directorships | |||
| David F. Larcker (Born 1950) | Trustee, since 2009 | James Irvin Miller Professor of Accounting at the Graduate School of Business, Stanford University, Director of the Corporate Governance Research Initiative and Senior Faculty of The Rock Center for Corporate Governance since 2006. From 2005 to 2008, Professor of Accounting at the Graduate School of Business, Stanford University. Prior thereto, Ernst & Young Professor of Accounting at The Wharton School, University of Pennsylvania from 1985 to 2005. | N/A | |||
| Olivia S. Mitchell (Born 1953) | Trustee, since 2006; Nominating and Governance Committee Chair, since 2018 | International Foundation of Employee Benefit Plans Professor, Wharton School of the University of Pennsylvania since 1993. Director of Wharton’s Pension Research Council and Boettner Center on Pensions & Retirement Research, and Research Associate at the National Bureau of Economic Research. Previously, Cornell University Professor from 1978 to 1993. | N/A | |||
| Timothy J. Penny (Born 1951) | Trustee, since 1996; Chairman, since 2018 | President and Chief Executive Officer of Southern Minnesota Initiative Foundation, a non-profit organization, since 2007. Member of the Board of Trustees of NorthStar Education Finance, Inc., a non-profit organization, since 2007. | N/A | |||
| James G. Polisson (Born 1959) | Trustee, since 2018 | Retired. Chief Marketing Officer, Source (ETF) UK Services, Ltd, from 2015 to 2017. From 2012 to 2015, Principal of The Polisson Group, LLC, a management consulting, corporate advisory and principal investing company. Chief Executive Officer and Managing Director at Russell Investments, Global Exchange Traded Funds from 2010 to 2012. Managing Director of Barclays Global Investors from 1998 to 2010 and Global Chief Marketing Officer for iShares and Barclays Global Investors from 2000 to 2010. Trustee of the San Francisco Mechanics’ Institute, a non-profit organization, from 2013 to 2015. Board member of the Russell Exchange Traded Fund Trust from 2011 to 2012. Director of Barclays Global Investors Holdings Deutschland GmbH from 2006 to 2009. Mr. Polisson is an attorney and has a retired status with the Massachusetts and District of Columbia Bar Associations. | N/A | |||
| Pamela Wheelock (Born 1959) | Trustee, since January 2020; previously Trustee from January 2018 to July 2019 | Board member of the Destination Medical Center Economic Development Agency, Rochester, Minnesota since 2019 and Interim President of the McKnight Foundation since 2020. Acting Commissioner, Minnesota Department of Human Services, July 2019 through September 2019. Human Services Manager (part-time), Minnesota Department of Human Services, October 2019 through December 2019. Chief Operating Officer, Twin Cities Habitat for Humanity from 2017 to 2019. Vice President of University Services, University of Minnesota from 2012 to 2016. Prior thereto, on the Board of Directors, Governance Committee and Finance Committee for the Minnesota Philanthropy Partners (Saint Paul Foundation) from 2012 to 2018, Interim Chief Executive Officer of Blue Cross Blue Shield of Minnesota from 2011 to 2012, Chairman of the Board from 2009 to 2012 and Board Director from 2003 to 2015. Vice President, Leadership and Community Engagement, Bush Foundation, Saint Paul, Minnesota (a private foundation) from 2009 to 2011. Executive Vice President and Chief Financial Officer, Minnesota Sports and Entertainment from 2004 to 2009 and Senior Vice President from 2002 to 2004. Executive Vice President of the Minnesota Wild Foundation from 2004 to 2008. Commissioner of Finance, State of Minnesota, from 1999 to 2002. Currently Board Chair of the Minnesota Wild Foundation since 2010. | N/A | |||
| * | Length of service dates reflect the Trustee’s commencement of service with the Trust’s predecessor entities, where applicable. |
Wells Fargo Municipal Sustainability Fund | 31
Other information (unaudited)
Officers
| Name and year of birth | Position held and length of service | Principal occupations during past five years or longer | ||
| Andrew Owen (Born 1960) | President, since 2017 | Executive Vice President of Wells Fargo & Company and Head of Affiliated Managers, Wells Fargo Asset Management, since 2014. In addition, Mr. Owen is currently President, Chief Executive Officer and Director of Wells Fargo Funds Management, LLC since 2017. Prior thereto, Executive Vice President responsible for marketing, investments and product development for Wells Fargo Funds Management, LLC, from 2009 to 2014. | ||
| Nancy Wiser1 (Born 1967) | Treasurer, since 2012 | Executive Vice President of Wells Fargo Funds Management, LLC since 2011. Chief Operating Officer and Chief Compliance Officer at LightBox Capital Management LLC, from 2008 to 2011. | ||
| Michelle Rhee (Born 1966) | Chief Legal Officer, since 2019 | Secretary of Wells Fargo Funds Management, LLC, Chief Legal Counsel of Wells Fargo Asset Management and Assistant General Counsel of Wells Fargo Bank, N.A. since 2018. Associate General Counsel and Managing Director of Bank of America Corporation from 2004 to 2018. | ||
| Catherine Kennedy (Born 1969) | Secretary, since 2019 | Vice President of Wells Fargo Funds Management, LLC and Senior Counsel of the Wells Fargo Legal Department since 2010. Vice President and Senior Counsel of Evergreen Investment Management Company, LLC from 1998 to 2010. | ||
| Michael H. Whitaker (Born 1967) | Chief Compliance Officer, since 2016 | Chief Compliance Officer of Wells Fargo Asset Management since 2016. Senior Vice President and Chief Compliance Officer for Fidelity Investments from 2007 to 2016. | ||
| David Berardi (Born 1975) | Assistant Treasurer, since 2009 | Vice President of Wells Fargo Funds Management, LLC since 2009. Vice President of Evergreen Investment Management Company, LLC from 2008 to 2010. Manager of Fund Reporting and Control for Evergreen Investment Management Company, LLC from 2004 to 2010. | ||
| Jeremy DePalma1 (Born 1974) | Assistant Treasurer, since 2009 | Senior Vice President of Wells Fargo Funds Management, LLC since 2009. Senior Vice President of Evergreen Investment Management Company, LLC from 2008 to 2010 and head of the Fund Reporting and Control Team within Fund Administration from 2005 to 2010. | ||
| 1 | Nancy Wiser acts as Treasurer of 65 funds in the Fund Complex. Jeremy DePalma acts as the Treasurer of 82 funds and Assistant Treasurer of 65 funds in the Fund Complex. |
| 2 | The Statement of Additional Information includes additional information about the Trustees and is available, without charge, upon request, by calling 1-800-222-8222 or by visiting the website at wfam.com. |
32 | Wells Fargo Municipal Sustainability Fund
Other information (unaudited)
Board Consideration of Investment Management and Sub-Advisory Agreements:
Wells Fargo Municipal Sustainability Fund
Under the Investment Company Act of 1940 (the “1940 Act”), the Board of Trustees (the “Board”) of Wells Fargo Funds Trust (the “Trust”) must determine annually whether to approve the continuation of the Trust’s investment management and sub-advisory agreements. In this regard, at a Board meeting held on May 26, 2020 and May 28, 2020 (together, the “Meeting”), the Board, all the members of which have no direct or indirect interest in the investment management and sub-advisory agreements and are not “interested persons” of the Trust, as defined in the 1940 Act (the “Independent Trustees”), reviewed and approved for Wells Fargo Municipal Sustainability Fund (the “Fund”): (i) an investment management agreement (the “Management Agreement”) with Wells Fargo Funds Management, LLC (“Funds Management”); and (ii) an investment sub-advisory agreement (the “Sub-Advisory Agreement”) with Wells Capital Management Incorporated (the “Sub-Adviser”), an affiliate of Funds Management. The Management Agreement and the Sub-Advisory Agreement are collectively referred to as the ��Advisory Agreements.”
At the Meeting, the Board considered the factors and reached the conclusions described below relating to the selection of Funds Management and the Sub-Adviser and the approval of the Advisory Agreements. Prior to the Meeting, including at a Board meeting held in April 2020, the Trustees conferred extensively among themselves and with representatives of Funds Management about these matters. Also, the Board has adopted a team-based approach, with each team consisting of a sub-set of Trustees, to assist the full Board in the discharge of its duties in reviewing investment performance and other matters throughout the year. The Independent Trustees were assisted in their evaluation of the Advisory Agreements by independent legal counsel, from whom they received separate legal advice and with whom they met separately.
In providing information to the Board, Funds Management and the Sub-Adviser were guided by a detailed set of requests for information submitted to them by independent legal counsel on behalf of the Independent Trustees at the start of the Board’s annual contract renewal process earlier in 2020. In considering and approving the Advisory Agreements, the Trustees considered the information they believed relevant, including but not limited to the information discussed below. The Board considered not only the specific information presented in connection with the Meeting, but also the knowledge gained over time through interaction with Funds Management and the Sub-Adviser about various topics. In this regard, the Board reviewed reports of Funds Management at each of its quarterly meetings, which included, among other things, portfolio reviews and investment performance reports. In addition, the Board and the teams mentioned above confer with portfolio managers at various times throughout the year. The Board did not identify any particular information or consideration that was all-important or controlling, and each individual Trustee may have attributed different weights to various factors.
After its deliberations, the Board unanimously approved the continuation of the Advisory Agreements for a one-year term and determined that the compensation payable to Funds Management and the Sub-Adviser under each of the Advisory Agreements was reasonable. The Board considered the approval of the Advisory Agreements for the Fund as part of its consideration of agreements for funds across the complex, but its approvals were made on a fund-by-fund basis. The following summarizes a number of important, but not necessarily all, factors considered by the Board in support of its approvals.
Nature, extent and quality of services
The Board received and considered various information regarding the nature, extent and quality of services provided to the Fund by Funds Management and the Sub-Adviser under the Advisory Agreements. This information included a description of the investment advisory services and Fund-level administrative services covered by the Management Agreement, as well as, among other things, a summary of the background and experience of senior management of Wells Fargo Asset Management (“WFAM”), of which Funds Management and the Sub-Adviser are a part, and a summary of investments made in the business of WFAM. The Board also received a description of Funds Management’s and the Sub-Adviser’s business continuity plans and of their approaches to data privacy and cybersecurity, and related testing. The Board also received and reviewed information about Funds Management’s role as administrator of the Fund’s liquidity risk management program, Funds Management’s approach to risk management, and Funds Management’s intermediary and vendor oversight program.
The Board also considered the qualifications, background, tenure and responsibilities of each of the portfolio managers primarily responsible for the day-to-day portfolio management of the Fund. The Board evaluated the ability of Funds Management and the Sub-Adviser to attract and retain qualified investment professionals, including research, advisory and supervisory personnel. The Board further considered the compliance programs and compliance records of Funds Management and the Sub-Adviser. In addition, the Board took into account the full range of services provided to the Fund by Funds Management and its affiliates.
Wells Fargo Municipal Sustainability Fund | 33
Other information (unaudited)
Fund investment performance and expenses
The Board noted that the Fund had recently commenced operations and had no performance history to review. The Board noted that it would have the opportunity to review the Fund’s performance history in connection with the Board’s future review and approval of the Fund’s Advisory Agreements.
The Board noted that the Fund had recently commenced operations and had no expense analysis data to review. The Board noted that it would have the opportunity to review the Fund’s expense comparisons in connection with the Board’s future review and approval of the Fund’s Advisory Agreements.
Investment management and sub-advisory fee rates
The Board reviewed and considered the contractual fee rates payable by the Fund to Funds Management under the Management Agreement, as well as the contractual fee rates payable by the Fund to Funds Management for class-level administrative services under a Class-Level Administration Agreement, which include, among other things, class-level transfer agency and sub-transfer agency costs (collectively, the “Management Rates”). The Board also reviewed and considered the contractual investment sub-advisory fee rates that are payable by Funds Management to the Sub-Adviser for investment sub-advisory services.
Among other information reviewed by the Board was a comparison of the Fund’s Management Rates with the average contractual investment management fee rates of funds in the expense Groups at a common asset level as well as transfer agency costs of the funds in the expense Groups. The Board noted that the Management Rates of the Fund were lower than or in range of the sum of these average rates for the Fund’s expense Groups for all share classes.
The Board also received and considered information about the portion of the total management fee that was retained by Funds Management after payment of the fee to the Sub-Adviser for sub-advisory services. In assessing the reasonableness of this amount, the Board received and evaluated information about the nature and extent of responsibilities retained and risks assumed by Funds Management and not delegated to or assumed by the Sub-Adviser, and about Funds Management’s on-going oversight services. Given the affiliation between Funds Management and the Sub-Adviser, the Board ascribed limited relevance to the allocation of fees between them.
The Board also received and considered information about the nature and extent of services offered and fee rates charged by Funds Management and the Sub-Adviser to other types of clients with investment strategies similar to those of the Fund. In this regard, the Board received information about the significantly greater scope of services, and compliance, reporting and other legal burdens and risks of managing proprietary mutual funds compared with those associated with managing assets of other types of clients, including third-party sub-advised fund clients and non-mutual fund clients such as institutional separate accounts.
Based on its consideration of the factors and information it deemed relevant, including those described here, the Board determined that the compensation payable to Funds Management under the Management Agreement and to the Sub-Adviser under the Sub-Advisory Agreement was reasonable.
Profitability
The Board received and considered information concerning the profitability of Funds Management, as well as the profitability of both WFAM and Wells Fargo & Co. (“Wells Fargo”) from providing services to the fund family as a whole. The Board noted that the Sub-Adviser’s profitability information with respect to providing services to the Fund and other funds in the family was subsumed in the WFAM and Wells Fargo profitability analysis.
Funds Management reported on the methodologies and estimates used in calculating profitability, including a description of the methodology used to allocate certain expenses. Among other things, the Board noted that the levels of profitability reported on a fund-by-fund basis varied widely, depending on factors such as the size, type and age of fund.
Based on its review, the Board did not deem the profits reported by Funds Management, WFAM or Wells Fargo from services provided to the Fund to be at a level that would prevent it from approving the continuation of the Advisory Agreements.
Economies of scale
The Board received and considered information about the potential for Funds Management to experience economies of scale in the provision of management services to the Fund, the difficulties of calculating economies of scale at an individual fund level, and the extent to which potential scale benefits are shared with shareholders. The Board noted the existence of breakpoints in the Fund’s management fee structure, which operate generally to reduce the Fund’s expense ratios as the Fund grows in size, and the size of the Fund in relation to such breakpoints. The Board considered that in addition to management fee breakpoints,
34 | Wells Fargo Municipal Sustainability Fund
Other information (unaudited)
Funds Management shares potential economies of scale from its management business in a variety of ways, including through fee waiver and expense reimbursement arrangements, services that benefit shareholders, competitive management fee rates set at the outset without regard to breakpoints, and investments in the business intended to enhance services available to shareholders.
The Board concluded that Funds Management’s arrangements with respect to the Fund, including contractual breakpoints, constituted a reasonable approach to sharing potential economies of scale with the Fund and its shareholders.
Other benefits to Funds Management and the Sub-Adviser
The Board received and considered information regarding potential “fall-out” or ancillary benefits received by Funds Management and its affiliates, including the Sub-Adviser, as a result of their relationships with the Fund. Ancillary benefits could include, among others, benefits directly attributable to other relationships with the Fund and benefits potentially derived from an increase in Funds Management’s and the Sub-Adviser’s business as a result of their relationships with the Fund. The Board noted that various affiliates of Funds Management may receive distribution-related fees, shareholder servicing payments and sub-transfer agency fees in respect of shares sold or held through them and services provided.
The Board also reviewed information about soft dollar credits earned and utilized by the Sub-Adviser, fees earned by Funds Management and the Sub-Adviser from managing a private investment vehicle for the fund family’s securities lending collateral, and commissions earned by an affiliated broker from portfolio transactions.
Based on its consideration of the factors and information it deemed relevant, including those described here, the Board did not find that any ancillary benefits received by Funds Management and its affiliates, including the Sub-Adviser, were unreasonable.
Conclusion
At the Meeting, after considering the above-described factors and based on its deliberations and its evaluation of the information described above, the Board unanimously approved the continuation of the Advisory Agreements for a one-year term and determined that the compensation payable to Funds Management and the Sub-Adviser under each of the Advisory Agreements was reasonable.
Wells Fargo Municipal Sustainability Fund | 35
Other information (unaudited)
LIQUIDITY RISK MANAGEMENT PROGRAM
In accordance with Rule 22e-4 under the Investment Company Act of 1940, as amended (the “Liquidity Rule”), Wells Fargo Funds Trust (the “Trust”) has adopted and implemented a liquidity risk management program (the “Program”) on behalf of each of its series, including the Fund, which is reasonably designed to assess and manage the Fund’s liquidity risk. “Liquidity risk” is defined as the risk that the Fund is unable to meet redemption requests without significantly diluting remaining investors’ interests in the Fund. The Trust’s Board of Trustees (the “Board”) previously approved the designation of Wells Fargo Funds Management, LLC (“Funds Management”), the Fund’s investment manager, as the administrator of the Program, and Funds Management has established a Liquidity Risk Management Council composed of personnel from multiple departments within Funds Management and its affiliates to assist Funds Management in the implementation and on-going administration of the Program.
The Program is comprised of various components designed to support the assessment and/or management of liquidity risk, including: (1) the periodic assessment (no less frequently than annually) of certain factors that influence the Fund’s liquidity risk; (2) the periodic classification (no less frequently than monthly) of the Fund’s investments into one of four liquidity categories that reflect an estimate of their liquidity under current market conditions; (3) a 15% limit on the acquisition of “illiquid investments” (as defined under the Liquidity Rule); (4) to the extent the Fund does not invest primarily in “highly liquid investments” (as defined under the Liquidity Rule), the determination of a minimum percentage of the Fund’s assets that generally will be invested in highly liquid investments (an “HLIM”); (5) if the Fund has established an HLIM, the periodic review (no less frequently than annually) of the HLIM and the adoption of policies and procedures for responding to a shortfall of the Fund’s “highly liquid investments” below its HLIM; and (6) periodic reporting to the Board.
At a meeting of the Board held on May 26 and 28, 2020, the Board received a written report (the “Report”) from Funds Management that addressed the operation of the Program and assessed its adequacy and effectiveness of implementation. The Report covered the initial period from December 1, 2018 through December 31, 2019 (the “Reporting Period”). No significant liquidity events impacting the Fund were noted in the Report. There were no material changes to the Program during the Reporting Period. The Report concluded that the Program is operating effectively to assess and manage the Fund’s liquidity risk, and that the Program has been and continues to be adequately and effectively implemented to monitor and, as applicable, respond to the Fund’s liquidity developments.
There can be no assurance that the Program will achieve its objectives under all circumstances in the future. Please refer to the Fund’s prospectus for more information regarding the Fund’s exposure to liquidity risk and other risks to which an investment in the Fund may be subject.
36 | Wells Fargo Municipal Sustainability Fund
Effective on or after May 1, 2020, clients of Edward Jones (also referred to as “shareholders”) purchasing Fund shares on the Edward Jones commission and fee-based platforms are eligible only for the following sales charge discounts (also referred to as “breakpoints”) and waivers, which can differ from breakpoints and waivers described elsewhere in the Fund’s Prospectus or SAI or through another broker-dealer. In all instances, it is the shareholder’s responsibility to inform Edward Jones at the time of purchase of any relationship, holdings of Wells Fargo Funds or other facts qualifying the purchaser for breakpoints or waivers. Edward Jones can ask for documentation of such circumstance.
| Breakpoints available at Edward Jones |
| Rights of Accumulation (ROA) |
The applicable sales charge on a purchase of Class A shares is determined by taking into account all share classes (except any money market funds and retirement plan share classes) of Wells Fargo Funds held by the shareholder or in an account grouped by Edward Jones with other accounts for the purpose of providing certain pricing considerations (“pricing groups”). This includes all share classes held on the Edward Jones platform and/or held on another platform. The inclusion of eligible fund family assets in the rights of accumulation calculation is dependent on the shareholder notifying his or her financial advisor of such assets at the time of calculation. |
ROA is determined by calculating the higher of cost or market value (current shares x NAV). |
| Letter of Intent (LOI) |
Through a LOI, shareholders can receive the sales charge and breakpoint discounts for purchases shareholders intend to makeover a 13-month period from the date Edward Jones receives the LOI. The LOI is determined by calculating the higher of cost or market value of qualifying holdings at LOI initiation in combination with the value that the shareholder intends to buy over a 13-month period to calculate the front-end sales charge and any breakpoint discounts. Each purchase the shareholder makes during that 13-month period will receive the sales charge and breakpoint discount that applies to the total amount. The inclusion of eligible fund family assets in the LOI calculation is dependent on the shareholder notifying his or her financial advisor of such assets at the time of calculation. Purchases made before the LOI is received by Edward Jones are not covered under the LOI and will not reduce the sales charge previously paid. Sales charges will be adjusted if LOI is not met. |
| Sales charges are waived for the following shareholders and in the following situations at Edward Jones: |
● Associates of Edward Jones and its affiliates and their family members who are in the same pricing group (as determined by Edward Jones under its policies and procedures) as the associate. This waiver will continue for the remainder of the associate’s life if the associate retires from Edward Jones in good-standing. |
● Shares purchased in an Edward Jones fee-based program. |
● Shares purchased through reinvestment of capital gains distributions and dividend reinvestment. |
● Shares purchased from the proceeds of redeemed shares of the same fund family so long as the following conditions are met: 1) the proceeds are from the sale of shares within 60 days of the purchase, and 2) the sale and purchase are made in the same share class and the same account or the purchase is made in an individual retirement account with proceeds from liquidations in anon-retirement account. |
● Shares exchanged into Class A shares from another share class so long as the exchange is into the same fund and was initiated at the discretion of Edward Jones. Edward Jones is responsible for any remaining CDSC due to the fund company, if applicable. Any future purchases are subject to the applicable sales charge as disclosed in the prospectus. |
● Exchanges from Class C shares to Class A shares of the same fund, generally, in the 84th month following the anniversary of the purchase date or earlier at the discretion of Edward Jones. |
| If the shareholder purchases shares that are subject to a CDSC and those shares are redeemed before the CDSC is expired, the shareholder is responsible to pay the CDSC except in the following conditions available at Edward Jones: |
● The death or disability of the shareholder. |
● Systematic withdrawals with up to 10% per year of the account value. |
● Return of excess contributions from an Individual Retirement Account (IRA). |
● Shares sold as part of a required minimum distribution for IRA and retirement accounts if the redemption is taken in or after the year the shareholder reaches qualified age based on applicable IRS regulation. |
● Shares sold to pay Edward Jones fees or costs in such cases where the transaction is initiated by Edward Jones. |
● Shares exchanged in an Edward Jones fee-based program. |
● Shares acquired through NAV reinstatement. |
Wells Fargo Municipal Sustainability Fund | 37
Appendix I (unaudited)
| Other Important Information for accounts at Edward Jones: |
| Minimum Purchase Amounts |
● $250 initial purchase minimum |
● $50 subsequent purchase minimum |
| Minimum Balances |
| Edward Jones has the right to redeem at its discretion fund holdings with a balance of $250 or less. The following are examples of accounts that are not included in this policy: |
● A fee-based account held on an Edward Jones platform |
● A 529 account held on an Edward Jones platform |
● An account with an active systematic investment plan or letter of intent (LOI) |
| Changing Share Classes |
| At any time it deems necessary, Edward Jones has the authority to exchange at NAV a shareholder’s holdings in a fund to Class A shares. |
38 | Wells Fargo Municipal Sustainability Fund
Effective June 1, 2020, shareholders purchasing Fund shares through an Oppenheimer & Co. Inc. (“Oppenheimer”) platform or account are eligible only for the following load waivers (front-end sales charge waivers and contingent deferred or back-end, sales charge waivers) and discounts, which may differ from those disclosed in the Fund’s Prospectus or SAI.
| Front-end Sales Load Waivers on Class A Shares available at Oppenheimer |
| Employer-sponsored retirement, deferred compensation and employee benefit plans (including health savings accounts) and trusts used to fund those plans, provided that the shares are not held in a commission-based brokerage account and shares are held for the benefit of the plan. |
| Shares purchased by or through a 529 Plan. |
| Shares purchased through an Oppenheimer affiliated investment advisory program. |
| Shares purchased through reinvestment of capital gains distributions and dividend reinvestment when purchasing shares of the same fund (but not any other fund within the fund family). |
| Shares purchased from the proceeds of redemptions within the same fund family, provided (1) the repurchase occurs within 90 days following the redemption, (2) the redemption and purchase occur in the same account, and (3) redeemed shares were subject to a front-end or deferred sales load (known as Rights of Restatement). |
| A shareholder in the Fund’s Class C shares will have their shares exchanged at net asset value to Class A shares (or the appropriate share class) of the Fund if the shares are no longer subject to a CDSC and the exchange is in line with the policies and procedures of Oppenheimer. |
| Employees and registered representatives of Oppenheimer or its affiliates and their family members. |
| Directors or Trustees of the Fund, and employees of the Fund’s investment adviser or any of its affiliates, as described in the Prospectus. |
| CDSC Waivers on A and C Shares available at Oppenheimer |
| Death or disability of the shareholder. |
| Shares sold as part of a systematic withdrawal plan as described in the Prospectus. |
| Return of excess contributions from an IRA Account. |
| Shares sold as part of a required minimum distribution for IRA and retirement accounts due to the shareholder reaching the qualified age based on applicable IRS regulations as described in the Prospectus. |
| Shares sold to pay Oppenheimer fees but only if the transaction is initiated by Oppenheimer. |
| Shares acquired through a right of reinstatement. |
| Front-end load Discounts Available at Oppenheimer: Breakpoints, Rights of Accumulation & Letters of Intent |
| Breakpoints as described in the Prospectus. |
| Rights of Accumulation (ROA), which entitle shareholders to breakpoint discounts, will be automatically calculated based on the aggregated holding of fund family assets held by accounts within the purchaser’s household at Oppenheimer. Eligible fund family assets not held at Oppenheimer may be included in the ROA calculation only if the shareholder notifies his or her financial advisor about such assets. |
Wells Fargo Municipal Sustainability Fund | 39
Effective June 15, 2020, shareholders purchasing fund shares through a Robert W. Baird & Co. (“Baird”) platform or account will only be eligible for the following sales charge waivers (front-end sales charge waivers and CDSC waivers) and discounts, which may differ from those disclosed elsewhere in the Fund’s Prospectus or the SAI.
| Front-end Sales Load Waivers on Class A Shares available at Baird |
| Shares purchased through reinvestment of capital gains distributions and dividend reinvestment when purchasing share of the same fund. |
| Share purchase by employees and registers representatives of Baird or its affiliate and their family members as designated by Baird. |
| Shares purchase from the proceeds of redemptions within the same fund family, provided (1) the repurchase occurs within 90 days following the redemption, (2) the redemption and purchase occur in the same accounts, and (3) redeemed shares were subject to a front-end or deferred sales charge (known as rights of reinstatement). |
| A shareholder in the Funds Investor C Shares will have their share exchanged at net asset value to Investor A shares of the fund if the shares are no longer subject to CDSC and the exchange is in line with the policies and procedures of Baird. |
| Employer-sponsored retirement plans or charitable accounts in a transactional brokerage account at Baird, including 401(k) plans, 457 plans, employer-sponsored 403(b) plans, profit sharing and money purchase pension plans and defined benefit plans. For purposes of this provision, employer-sponsored retirement plans do not include SEP IRAs, Simple IRAs or SAR-SEPs. |
| CDSC Waivers on A and C Shares available at Baird |
| Shares sold due to death or disability of the shareholder. |
| Shares sold as part of a systematic withdrawal plan as described in the Fund’s Prospectus. |
| Shares bought due to returns of excess contributions from an IRA Account. |
| Shares sold as part of a required minimum distribution for IRA and retirement accounts due to the shareholder reaching age 72 as described in the Fund’s Prospectus. |
| Shares sold to pay Baird fees but only if the transaction is initiated by Baird. |
| Shares acquired through a right of reinstatement. |
| Front-end load Discounts Available at Baird: Breakpoint and/or Rights of Accumulation |
| Breakpoints as described in the Prospectus. |
| Rights of accumulations which entitles shareholders to breakpoint discounts will be automatically calculated based on the aggregated holding of fund family assets held by accounts within the purchaser’s household at Baird. Eligible fund family assets not held at Baird may be included in the rights of accumulations calculation only if the shareholder notifies his or her financial advisor about such assets. |
| Letters of Intent (LOI) allow for breakpoint discounts based on anticipated purchases within a fund family through Baird, over a 13-month period of time. |
40 | Wells Fargo Municipal Sustainability Fund
For more information
More information about Wells Fargo Funds is available free upon request. To obtain literature, please write, visit the Fund’s website, or call:
Wells Fargo Funds
P.O. Box 219967
Kansas City, MO 64121-9967
Website: wfam.com
Individual investors: 1-800-222-8222
Retail investment professionals: 1-888-877-9275
Institutional investment professionals: 1-866-765-0778

This report and the financial statements contained herein are submitted for the general information of the shareholders of the Fund. If this report is used for promotional purposes, distribution of the report must be accompanied or preceded by a current prospectus. Before investing, please consider the investment objectives, risks, charges, and expenses of the investment. For a current prospectus and, if available, a summary prospectus, containing this information, call 1-800-222-8222 or visit the Fund’s website at wfam.com. Read the prospectus carefully before you invest or send money.
Wells Fargo Asset Management (WFAM) is the trade name for certain investment advisory/management firms owned by Wells Fargo & Company. These firms include but are not limited to Wells Capital Management Incorporated and Wells Fargo Funds Management, LLC. Certain products managed by WFAM entities are distributed by Wells Fargo Funds Distributor, LLC (a broker-dealer and Member FINRA).
This material is for general informational and educational purposes only and is NOT intended to provide investment advice or a recommendation of any kind—including a recommendation for any specific investment, strategy, or plan.
INVESTMENT PRODUCTS: NOT FDIC INSURED ◾ NO BANK GUARANTEE ◾ MAY LOSE VALUE
© 2020 Wells Fargo & Company. All rights reserved.
PAR-0720-00246 08-20
A297/AR297 06-20
| ITEM 2. | CODE OF ETHICS |
(a) As of the end of the period covered by the report, Wells Fargo Funds Trust has adopted a code of ethics that applies to its President and Treasurer. A copy of the code of ethics is filed as an exhibit to this Form N-CSR.
(c) During the period covered by this report, there were no amendments to the provisions of the code of ethics adopted in Item 2(a) above.
(d) During the period covered by this report, there were no implicit or explicit waivers to the provisions of the code of ethics adopted in Item 2(a) above.
| ITEM 3. | AUDIT COMMITTEE FINANCIAL EXPERT |
The Board of Trustees of Wells Fargo Funds Trust has determined that Judith Johnson is an audit committee financial expert, as defined in Item 3 of Form N-CSR. Mrs. Johnson is independent for purposes of Item 3 of Form N-CSR.
| ITEM 4. | PRINCIPAL ACCOUNTANT FEES AND SERVICES |
(a), (b), (c), (d) The following table presents aggregate fees billed in each of the last two fiscal years for services rendered
to the Registrant by the Registrant’s principal accountant. These fees were billed to the registrant and were approved by
the Registrant’s audit committee.
| Fiscal year ended June 30, 2020 | Fiscal year ended June 30, 2019 | |||||||
Audit fees | $ | 603,390 | $ | 556,800 | ||||
Audit-related fees(1) | — | 16,110 | ||||||
Tax fees (2) | 28,540 | 25,370 | ||||||
All other fees | — | — | ||||||
|
|
|
| |||||
| $ | 631,930 | $ | 598,280 | |||||
|
|
|
| |||||
| (1) | Amount represents fees related to the merger of Wells Fargo Colorado Tax-Free Fund and Wells Fargo North Carolina Tax-Free Fund into the Wells Fargo Municipal Bond Fund on March 15, 2019. |
| (2) | Tax fees consist of fees for tax compliance, tax advice, tax planning and excise tax. |
(e) The Chairman of the Audit Committees is authorized to pre-approve: (1) audit services for the mutual funds of Wells Fargo Funds Trust; (2) non-audit tax or compliance consulting or training services provided to the Funds by the independent auditors (“Auditors”) if the fees for any particular engagement are not anticipated to exceed $50,000; and (3) non-audit tax or compliance consulting or training services provided by the Auditors to a Fund’s investment adviser and its controlling entities (where pre-approval is required because the engagement relates directly to the operations and financial reporting of the Fund) if the fee to the Auditors for any particular engagement is not anticipated to exceed $50,000. For any such pre-approval sought from the Chairman, Management shall prepare a brief description of the proposed services.
If the Chairman approves of such service, he or she shall sign the statement prepared by Management.
Such written statement shall be presented to the full Committees at their next regularly scheduled meetings.
(f) Not applicable
(g) Not applicable
(h) Not applicable
| ITEM 5. | AUDIT COMMITTEE OF LISTED REGISTRANTS |
Not applicable.
| ITEM 6. | INVESTMENTS |
A Portfolio of Investments for each series of Wells Fargo Funds Trust is included as part of the report to shareholders filed under Item 1 of this Form.
| ITEM 7. | DISCLOSURE OF PROXY VOTING POLICIES AND PROCEDURES FOR CLOSED-END MANAGEMENT INVESTMENT COMPANIES |
Not applicable.
| ITEM 8. | PORTFOLIO MANAGERS OF CLOSED-END MANAGEMENT INVESTMENT COMPANIES |
Not applicable.
| ITEM 9. | PURCHASES OF EQUITY SECURITIES BY CLOSED-END MANAGEMENT INVESTMENT COMPANY AND AFFILIATED PURCHASERS |
Not applicable.
| ITEM 10. | SUBMISSION OF MATTERS TO A VOTE OF SECURITY HOLDERS |
There have been no material changes to the procedures by which shareholders may recommend nominees to the registrant’s Board of Trustees that have been implemented since the registrant’s last provided disclosure in response to the requirements of this Item.
| ITEM 11. | CONTROLS AND PROCEDURES |
(a) The President and Treasurer have concluded that the Wells Fargo Funds Trust disclosure controls and procedures (as defined in Rule 30a-3(c) under the Investment Company Act of 1940) provide reasonable assurances that material information relating to the registrant is made known to them by the appropriate persons based on their evaluation of these controls and procedures as of a date within 90 days of the filing of this report.
(b) There were no significant changes in the registrant’s internal controls over financial reporting (as defined in Rule 30a-3(d) under the Investment Company Act of 1940) that occurred during the most recent fiscal half-year of the period covered by this report that materially affected, or is reasonably likely to materially affect, the registrant’s internal control over financial reporting.
| ITEM 12. | DISCLOSURES OF SECURITIES LENDING ACTIVITES FOR CLOSED-END MANAGEMENT INVESTMENT COMPANIES |
Not applicable.
| ITEM 13. | EXHIBITS |
(a)(2) Certifications pursuant to Section 302 of the Sarbanes-Oxley Act of 2002.
(b) Certifications pursuant to Section 906 of the Sarbanes-Oxley Act of 2002.
SIGNATURES
Pursuant to the requirements of the Securities Exchange Act of 1934 and the Investment Company Act of 1940, the registrant has duly caused this report to be signed on its behalf by the undersigned, thereunto duly authorized.
| Wells Fargo Funds Trust | ||
| By: | ||
| /s/ Andrew Owen | ||
| Andrew Owen | ||
| President | ||
| Date: | August 29, 2020 | |
Pursuant to the requirements of the Securities Exchange Act of 1934 and the Investment Company Act of 1940, this report has been signed below by the following persons on behalf of the registrant and in the capacities and on the date indicated.
| Wells Fargo Funds Trust | ||
| By: | ||
| /s/ Andrew Owen | ||
| Andrew Owen | ||
| President | ||
| Date: | August 29, 2020 | |
| By: | ||
| /s/ Nancy Wiser | ||
| Nancy Wiser | ||
| Treasurer | ||
| Date: | August 29, 2020 | |
| By: | ||
| /s/ Jeremy DePalma | ||
| Jeremy DePalma | ||
| Treasurer | ||
| Date: | August 29, 2020 | |