Table of Contents

UNITED STATES
SECURITIES AND EXCHANGE COMMISSION
Washington, D.C. 20549
FORM N-CSR
CERTIFIED SHAREHOLDER REPORT OF REGISTERED
MANAGEMENT INVESTMENT COMPANIES
Investment Company Act file number: 811-09253
Wells Fargo Funds Trust
(Exact name of registrant as specified in charter)
525 Market St., San Francisco, CA 94105
(Address of principal executive offices) (Zip code)
Catherine Kennedy
Wells Fargo Funds Management, LLC
525 Market St., San Francisco, CA 94105
(Name and address of agent for service)
Registrant’s telephone number, including area code: 800-222-8222
Date of fiscal year end: July 31
Registrant is making a filing for 10 of its series:
Wells Fargo Disciplined U.S. Core Fund, Wells Fargo Endeavor Select Fund, Wells Fargo Growth Fund, Wells Fargo Classic Value Fund, Wells Fargo Large Cap Core Fund, Wells Fargo Large Cap Growth Fund, Wells Fargo Large Company Value Fund, Wells Fargo Low Volatility U.S. Equity Fund, Wells Fargo Omega Growth Fund, and Wells Fargo Premier Large Company Growth Fund.
Date of reporting period: July 31, 2020
Table of Contents
ITEM 1. REPORT TO STOCKHOLDERS
Table of Contents

Annual Report
July 31, 2020
Wells Fargo Classic Value Fund
Beginning on January 1, 2021, as permitted by new regulations adopted by the Securities and Exchange Commission, paper copies of the Wells Fargo Funds’ annual and semi-annual shareholder reports issued after this date will no longer be sent by mail, unless you specifically request paper copies of the reports. Instead, the reports will be made available on the Funds’ website, and you will be notified by mail each time a report is posted and provided with a website address to access the report.
If you already elected to receive shareholder reports electronically, you will not be affected by this change and you need not take any action. You may elect to receive shareholder reports and other communications from the Fund electronically at any time by contacting your financial intermediary (such as a broker-dealer or bank) or, if you are a direct investor, by calling 1-800-222-8222 or by enrolling at wellsfargo.com/advantagedelivery.
You may elect to receive all future reports in paper free of charge. If you invest through a financial intermediary, you can contact your financial intermediary to request that you continue to receive paper copies of your shareholder reports; if you invest directly with the Fund, you can call 1-800-222-8222. Your election to receive reports in paper will apply to all Wells Fargo Funds held in your account with your financial intermediary or, if you are a direct investor, to all Wells Fargo Funds that you hold.
Table of Contents
|
Reduce clutter. Save trees. |
Sign up for electronic delivery of prospectuses and shareholder reports at wellsfargo.com/ |
The views expressed and any forward-looking statements are as of July 31, 2020, unless otherwise noted, and are those of the Fund managers and/or Wells Fargo Asset Management. Discussions of individual securities, or the markets generally, or any Wells Fargo Fund are not intended as individual recommendations. Future events or results may vary significantly from those expressed in any forward-looking statements. The views expressed are subject to change at any time in response to changing circumstances in the market. Wells Fargo Asset Management and the Fund disclaim any obligation to publicly update or revise any views expressed or forward-looking statements.
INVESTMENT PRODUCTS: NOT FDIC INSURED ◾ NO BANK GUARANTEE ◾ MAY LOSE VALUE
Wells Fargo Classic Value Fund | 1
Table of Contents
Letter to shareholders (unaudited)

Andrew Owen
President
Wells Fargo Funds
Dear Shareholder:
We are pleased to offer you this annual report for the Wells Fargo Classic Value Fund for the 12-month period that ended July 31, 2020. Global stock markets saw earlier gains erased in February and March as governments around the world took unprecedented measures, attempting to stop the spread of the coronavirus at the expense of short-term economic output. However, markets rebounded from April on to offset much of the losses as central banks attempted to bolster capital markets and confidence. Fixed-income markets generally performed well overall, achieving widespread gains. Overall, U.S. stocks surpassed their international peers, while U.S. large-cap equity, as measured by the Russell 1000® Index1, easily outperformed small caps, as measured by the Russell 2000® Index2, for the 12-month period that began last August.
For the 12-month period, fixed-income securities generally had positive total returns while non-U.S. developed market equities had the weakest performance and U.S. stocks performed strongly despite sharp volatility in the late winter and early spring. For the period, U.S. stocks, based on the S&P 500 Index,3 gained 11.96%. International stocks, as measured by the MSCI ACWI ex USA Index (Net),4 returned 0.66%, while the MSCI EM Index (Net)5 had somewhat stronger performance, with a 6.55% gain. For bond investors, the Bloomberg Barclays U.S. Aggregate Bond Index6 returned a robust 10.12%, the Bloomberg Barclays Global Aggregate ex-USD Index7 gained a more modest 5.94%, and the Bloomberg Barclays Municipal Bond Index8 gained 5.36% while the ICE BofA U.S. High Yield Index9 returned 3.10%.
The fiscal year began with supportive central bank actions.
The period began with unresolved U.S.-China trade tensions showing no signs of compromise in August 2019. Evidence of a continued global economic slowdown mounted, and central banks in China, New Zealand, and Thailand cut interest rates after the U.S. Federal Reserve (Fed) had done so in late July. Industrial and manufacturing data declined in China, Canada, Japan, and Germany. Adding to global uncertainty, Italy’s prime minister resigned, many feared a crackdown in Hong Kong as protestors sustained their calls for reform, and U.K. Prime Minister Boris Johnson planned to suspend Parliament as Brexit’s deadline neared.
| 1 | The Russell 1000® Index measures the performance of the 1,000 largest companies in the Russell 3000® Index, which represents approximately 92% of the total market capitalization of the Russell 3000® Index. You cannot invest directly in an index. |
| 2 | The Russell 2000® Index measures the performance of the 2,000 smallest companies in the Russell 3000® Index, which represents approximately 8% of the total market capitalization of the Russell 3000® Index. You cannot invest directly in an index. |
| 3 | The S&P 500 Index consists of 500 stocks chosen for market size, liquidity, and industry group representation. It is a market-value-weighted index with each stock’s weight in the index proportionate to its market value. You cannot invest directly in an index. |
| 4 | The Morgan Stanley Capital International (MSCI) All Country World Index (ACWI) ex USA Index (Net) is a free-float-adjusted market-capitalization-weighted index that is designed to measure the equity market performance of developed and emerging markets, excluding the United States. Source: MSCI. MSCI makes no express or implied warranties or representations and shall have no liability whatsoever with respect to any MSCI data contained herein. The MSCI data may not be further redistributed or used as a basis for other indices or any securities or financial products. This report is not approved, reviewed, or produced by MSCI. You cannot invest directly in an index. |
| 5 | The MSCI Emerging Markets (EM) Index (Net) is a free-float-adjusted market-capitalization-weighted index that is designed to measure equity market performance of emerging markets. You cannot invest directly in an index. |
| 6 | The Bloomberg Barclays U.S. Aggregate Bond Index is a broad-based benchmark that measures the investment-grade, U.S. dollar-denominated, fixed-rate taxable bond market, including Treasuries, government-related and corporate securities, mortgage-backed securities (agency fixed-rate and hybrid adjustable-rate mortgage pass-throughs), asset-backed securities, and commercial mortgage-backed securities. You cannot invest directly in an index. |
| 7 | The Bloomberg Barclays Global Aggregate ex-USD Index is an unmanaged index that provides a broad-based measure of the global investment-grade fixed-income markets excluding the U.S.-dollar-denominated debt market. You cannot invest directly in an index. |
| 8 | The Bloomberg Barclays Municipal Bond Index is an unmanaged index composed of long-term tax-exempt bonds with a minimum credit rating of Baa. You cannot invest directly in an index. |
| 9 | The ICE BofA U.S. High Yield Index is a market-capitalization-weighted index of domestic and Yankee high-yield bonds. The index tracks the performance of high-yield securities traded in the U.S. bond market. You cannot invest directly in an index. Copyright 2020. ICE Data Indices, LLC. All rights reserved. |
2 | Wells Fargo Classic Value Fund
Table of Contents
Letter to shareholders (unaudited)
In the U.S., the Fed cut interest rates again in September. U.S. manufacturing data disappointed investors. The U.S. Congress announced it would pursue an impeachment investigation of President Trump. Meanwhile, the Brexit impasse showed no signs of resolution. Officials in China said that hitting the country’s economic growth goals for the year would be difficult considering the weight of tariffs and trade restrictions. Although the S&P 500 Index finished the third quarter with the best year-to-date returns in more than 20 years, concerns about future returns remained.
The fourth quarter started on a strong note, with U.S.-China trade tensions relaxing in October along with renewed optimism for a U.K. Brexit deal and positive macroeconomic data. The initial estimate of U.S. third-quarter gross domestic product (GDP) growth was a resilient 1.9% annualized rate, while the U.S. unemployment rate fell to a 50-year low of 3.5% in September. However, despite strength among U.S. consumers, business confidence declined while manufacturing activity contracted. Concerned with a potential economic slowdown, the Fed lowered interest rates another quarter point in late October—its third rate cut in four months. This helped push the S&P 500 Index to an all-time high while emerging market equities rallied and global bonds declined overall, reflecting a broad pickup in risk appetite.
Equity markets continued to rally in November despite ongoing geopolitical risks. Hopes for a U.S.-China trade deal buoyed investor confidence. U.S. business sentiment improved slightly, and manufacturing and services activity picked up. While consumer confidence and purchasing managers’ activity rose in the eurozone, China reported weakening manufacturing and consumer data. Bond yields rose marginally, leading to slightly negative returns for global government and investment-grade corporate bonds.
Financial markets ended 2019 with a boost from the U.S. and China accord on a Phase One trade deal. That, along with the landslide win by the pro-Brexit U.K. Conservative Party in a national election and ongoing central bank support, gave investors greater confidence. U.S. economic indicators were generally positive, with the exception of manufacturing activity and business confidence. Consumer confidence was resilient, fed by a robust labor market, tame inflation, and lower interest rates, which boosted housing affordability and stimulated homebuyer activity. The impeachment of President Trump had little impact on markets. Meanwhile, slowing Chinese economic activity, partly attributable to the trade war, led to further government stimulus at year-end through lower reserve ratios, allowing banks to lend more money.
The year-end rally continued in early January 2020. However, capital market volatility picked up sharply in late January on concerns over the potential impact of the coronavirus on the global economy and stock markets. With sentiment somewhat souring, perceived safe havens did well in January. The U.S. dollar and Japanese yen both rose, and government bonds outperformed equities. While the S&P 500 Index held its ground, emerging market equities tumbled, including those in Asia.
In February, the coronavirus became the major market focus. Fears of the virus’s impact on global growth led to expectations of increased global central bank monetary policy support. That led the 10-year U.S. Treasury yield to fall to an all-time low of 1.1%. Although equity markets initially shrugged off concerns about the outbreak, focusing instead on strong fourth-quarter earnings and improving business confidence in January, market sentiment turned sharply lower and the S&P 500 Index lost 8.2% for the month. Oil prices tumbled as Russia and the Organization of the Petroleum Exporting Countries compounded a major decline in oil demand with a brutal price war, partly aimed at dissuading further U.S. shale production, causing the price of West Texas Intermediate crude oil to plummet.
Wells Fargo Classic Value Fund | 3
Table of Contents
Letter to shareholders (unaudited)
“The global spread of the coronavirus led country after country to clamp down on social and business-related activity in order to contain the virus from causing even greater devastation and overwhelming health care systems.”
“Financial markets posted widely positive returns in June despite ongoing economic weakness and high levels of uncertainty on the containment of the coronavirus and the timing of an effective vaccine.”
The global spread of the coronavirus led country after country to clamp down on social and business-related activity in order to contain the virus from causing even greater devastation and overwhelming health care systems. This abrupt stoppage of economic activity led to the sharp deceleration of global output, sending economies into a deep contraction. Central banks responded swiftly, slashing interest rates and expanding quantitative easing programs to restore liquidity and confidence to the markets. In the U.S., the Fed introduced several new lending programs, funding investment-grade bonds, money market mutual funds, and commercial paper while purchasing Treasuries, mortgage-backed securities, and overnight repurchase agreements. Meanwhile, stock markets tumbled quickly into a bear market, ending the longest bull stock market in U.S. history.
Markets rebounded strongly in April, fueled by unprecedented government and central bank stimulus measures. The U.S. economy contracted by an annualized 5.0% pace in the first quarter, with 30 million new unemployment insurance claims in six weeks. In the eurozone, first-quarter real GDP shrank 3.8%, with the composite April Flash Purchasing Managers’ Index, a monthly survey of purchasing managers, falling to an all-time low of 13.5. The European Central Bank expanded its quantitative easing to include the purchase of additional government bonds of countries with the greatest virus-related need, including Italy and Spain. China’s first-quarter GDP fell by 6.8% year over year. However, retail sales, production, and investment showed signs of recovery. Extreme oil-price volatility continued as global supply far exceeded demand.
In May, the global equity market rebound continued, with widespread strong monthly gains. Investors regained confidence on reports of early signs of success in human trials of a coronavirus vaccine. Growth stocks continued to outperform value stocks while returns on global government bonds were generally flat. In the U.S., a gap grew between the stock market rebound and devastating economic data points, including an April unemployment rate of 14.7%, the highest level since World War II. Purchasing managers’ indices reflected weakening activity in May in both the manufacturing and services sectors. U.S. corporate earnings reports indicated a 14% year-over-year contraction in earnings from the first quarter of 2019. However, high demand for technology, driven by remote activity, supported robust information technology sector earnings, which helped drive major technology stocks higher.
Financial markets posted widely positive returns in June despite ongoing economic weakness and high levels of uncertainty on the containment of the coronavirus and the timing of an effective vaccine. There were hopeful signs as economies reopened, with both U.S. and U.K. retail sales rebounding substantially in May. However, year over year, sales remained depressed. Vitally important to market sentiment was the ongoing commitment by central banks globally to do all they could to provide economic support through liquidity and low borrowing costs. U.S. economic activity was aided by one-time $1,200 stimulus checks and $600 bonus weekly unemployment benefits due to expire at the end of July. However, unemployment remained in the double digits, easing somewhat from 14.7% in April to 11.1% in June. During June, numerous states reported alarming increases of coronavirus cases. China’s economic recovery picked up momentum in June, though it remained far from a full recovery.
July was a broadly positive month for both global equities and fixed income. However, economic data and a resurgence of coronavirus cases pointed to the vulnerability of the global economy and the ongoing imperative to regain control of the pandemic. Second-quarter GDP shrank by 9.5% and 12.1% in the U.S. and eurozone, respectively, from the previous quarter. In contrast, China reported a 3.2% year-over-year expansion in its second-quarter GDP. U.S. unemployment remained historically high despite adding 1.8 million jobs in July, with a double-digit jobless rate persisting. However, manufacturing activity grew in both the U.S. and eurozone. In Asia, while China’s manufacturing sector continued to expand, activity in Japan and South Korea contracted. In July, a rising concern
4 | Wells Fargo Classic Value Fund
Table of Contents
Letter to shareholders (unaudited)
was the rapid and broad reemergence of coronavirus infections. Despite the ongoing promise of positive early-stage vaccine trial results, economic activity could be held back by the continued spread of the virus and the end of a widely received $600-a-week bonus unemployment benefit in late July.
Don’t let short-term uncertainty derail long-term investment goals.
Periods of investment uncertainty can present challenges, but experience has taught us that maintaining long-term investment goals can be an effective way to plan for the future. To help you create a sound strategy based on your personal goals and risk tolerance, Wells Fargo Funds offers more than 100 mutual funds spanning a wide range of asset classes and investment styles. Although diversification cannot guarantee an investment profit or prevent losses, we believe it can be an effective way to manage investment risk and potentially smooth out overall portfolio performance. We encourage investors to know their investments and to understand that appropriate levels of risk-taking may unlock opportunities.
Thank you for choosing to invest with Wells Fargo Funds. We appreciate your confidence in us and remain committed to helping you meet your financial needs.
Sincerely,

Andrew Owen
President
Wells Fargo Funds
|
For further information about your Fund, contact your investment professional, visit our website at wfam.com, or call us directly at 1-800-222-8222. |
Notice to Shareholders
At a meeting held on August 10-12, 2020, the Board of Trustees of the Fund approved a change to the Fund’s automatic conversion feature for Class C shares in order to shorten the required holding period from 10 to 8 years. As a result, on a monthly basis beginning November 5, 2020, Class C shares will convert automatically into Class A shares 8 years after the initial date of purchase or, if you acquired your Class C shares through an exchange or conversion from another share class, 8 years after the date you acquired your Class C shares. When Class C shares that you acquired through a purchase or exchange convert, any other Class C shares that you purchased with reinvested dividends and distributions also will convert into Class A shares on a pro rata basis.
Please note that a shorter holding period may apply depending on your intermediary. Please see “Appendix A—Sales Charge Reductions and Waivers for Certain Intermediaries” in the Fund’s prospectus for further information.
Wells Fargo Classic Value Fund | 5
Table of Contents
Performance highlights (unaudited)
Investment objective
The Fund seeks long-term capital appreciation.
Manager
Wells Fargo Funds Management, LLC
Subadviser
Wells Capital Management Incorporated
Portfolio managers
Miguel E. Giaconi, CFA®‡
Jean-Baptiste Nadal, CFA®‡
Average annual total returns (%) as of July 31, 2020
| Including sales charge | Excluding sales charge | Expense ratios1 (%) | ||||||||||||||||||||||||||||||||
| Inception date | 1 year | 5 year | 10 year | 1 year | 5 year | 10 year | Gross | Net2 | ||||||||||||||||||||||||||
| Class A (EIVAX) | 8-1-2006 | -9.75 | 4.29 | 9.19 | -4.25 | 5.53 | 9.84 | 1.19 | 1.11 | |||||||||||||||||||||||||
| Class C (EIVCX) | 8-1-2006 | -5.99 | 4.73 | 9.01 | -4.99 | 4.73 | 9.01 | 1.94 | 1.86 | |||||||||||||||||||||||||
| Class R (EIVTX)3 | 3-1-2013 | – | – | – | -4.56 | 5.25 | 9.58 | 1.44 | 1.36 | |||||||||||||||||||||||||
| Class R6 (EIVFX)4 | 11-30-2012 | – | – | – | -3.87 | 6.17 | 10.36 | 0.76 | 0.65 | |||||||||||||||||||||||||
| Administrator Class (EIVDX) | 7-30-2010 | – | – | – | -4.15 | 5.69 | 10.04 | 1.11 | 0.95 | |||||||||||||||||||||||||
| Institutional Class (EIVIX) | 8-1-2006 | – | – | – | -3.86 | 5.97 | 10.29 | 0.86 | 0.70 | |||||||||||||||||||||||||
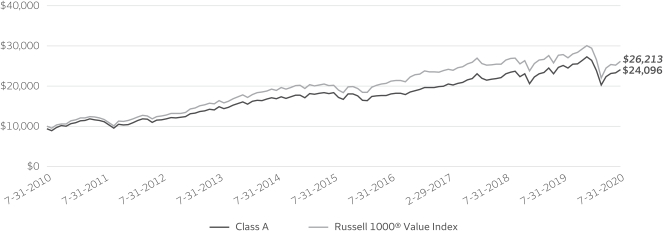
| Russell 1000® Value Index5 | – | – | – | – | -6.01 | 5.36 | 10.12 | – | – | |||||||||||||||||||||||||
Figures quoted represent past performance, which is no guarantee of future results, and do not reflect taxes that a shareholder may pay on an investment in a fund. Investment return and principal value of an investment will fluctuate so that an investor’s shares, when redeemed, may be worth more or less than their original cost. Performance shown without sales charges would be lower if sales charges were reflected. Current performance may be lower or higher than the performance data quoted, which assumes the reinvestment of dividends and capital gains. Current month-end performance is available on the Fund’s website, wfam.com.
Index returns do not include transaction costs associated with buying and selling securities, any mutual fund fees or expenses, or any taxes. It is not possible to invest directly in an index.
For Class A shares, the maximum front-end sales charge is 5.75%. For Class C shares, the maximum contingent deferred sales charge is 1.00%. Performance including a contingent deferred sales charge assumes the sales charge for the corresponding time period. Class R, Class R6, Administrator Class, and Institutional Class shares are sold without a front-end sales charge or contingent deferred sales charge.
Stock values fluctuate in response to the activities of individual companies and general market and economic conditions. Certain investment strategies tend to increase the total risk of an investment (relative to the broader market). The Fund is exposed to foreign investment risk and focused portfolio risk. Consult the Fund’s prospectus for additional information on these and other risks.
Please see footnotes on page 7.
6 | Wells Fargo Classic Value Fund
Table of Contents
Performance highlights (unaudited)
| Growth of $10,000 investment as of July 31, 20206 |
|
| ‡ | CFA® and Chartered Financial Analyst® are trademarks owned by CFA Institute. |
| 1 | Reflects the expense ratios as stated in the most recent prospectuses. The expense ratios shown are subject to change and may differ from the annualized expense ratios shown in the financial highlights of this report. |
| 2 | The manager has contractually committed through November 30, 2020, to waive fees and/or reimburse expenses to the extent necessary to cap total annual fund operating expenses after fee waivers at 1.11% for Class A, 1.86% for Class C, 1.36% for Class R, 0.65% for Class R6, 0.95% for Administrator Class, and 0.70% for Institutional Class. Brokerage commissions, stamp duty fees, interest, taxes, acquired fund fees and expenses (if any), and extraordinary expenses are excluded from the expense caps. Prior to or after the commitment expiration date, the caps may be increased or the commitment to maintain the caps may be terminated only with the approval of the Board of Trustees. Without these caps, the Fund’s returns would have been lower. The expense ratio paid by an investor is the net expense ratio (the total annual fund operating expenses after fee waivers) as stated in the prospectuses. |
| 3 | Historical performance shown for the Class R shares prior to their inception reflects the performance of the Institutional Class shares, adjusted to reflect the higher expenses applicable to the Class R shares. |
| 4 | Historical performance shown for the Class R6 shares prior to their inception reflects the performance of the Institutional Class shares, and includes the higher expenses applicable to the Institutional Class shares. If these expenses had not been included, returns for the Class R6 shares would be higher. |
| 5 | The Russell 1000® Value Index measures the performance of those Russell 1000 companies with lower price/book ratios and lower forecasted growth values. You cannot invest directly in an index. |
| 6 | The chart compares the performance of Class A shares for the most recent ten years with the Russell 1000® Value Index. The chart assumes a hypothetical investment of $10,000 in Class A shares and reflects all operating expenses and assumes the maximum initial sales charge of 5.75%. |
| 7 | The ten largest holdings, excluding cash, cash equivalents and any money market funds, are calculated based on the value of the investments divided by total net assets of the Fund. Holdings are subject to change and may have changed since the date specified. |
| 8 | Amounts are calculated based on the total long-term investments of the Fund. These amounts are subject to change and may have changed since the date specified. |
| * | This security was no longer held at the end of the reporting period. |
Wells Fargo Classic Value Fund | 7
Table of Contents
Performance highlights (unaudited)
MANAGER’S DISCUSSION
| ∎ | The Fund outperformed its benchmark, the Russell 1000® Value Index, for the 12-month period that ended July 31, 2020. |
| ∎ | Stock selection in the information technology (IT), consumer staples, and utilities sectors contributed to relative performance. |
| ∎ | Stock selection in the financials and energy sectors detracted from the Fund’s relative performance. |
Until about mid-February 2020, equity markets demonstrated the continued euphoria and strength of 2019, optimistic about accelerating global growth. The outbreak and propagation of the new coronavirus created significant fear and tremendous uncertainty across the globe during the remainder of the first quarter of 2020. The global economy was rapidly shuttered for the first time ever. However, during the second quarter, economies around the globe reopened slowly. We continued to adhere to our disciplined investment process that relies predominantly on discounted free cash flow. We also maintained our focus on individual companies rather than on broad, top-down economic or sector forecasts. To manage risk, we maintained the Fund’s broad diversification by sector, industry, and position.
| Ten largest holdings (%) as of July 31, 20207 | ||||
Mondelez International Incorporated Class A | 3.95 | |||
Comcast Corporation Class A | 3.87 | |||
Kellogg Company | 3.67 | |||
NextEra Energy Incorporated | 3.57 | |||
Merck & Company Incorporated | 3.41 | |||
Advance Auto Parts Incorporated | 3.37 | |||
Cisco Systems Incorporated | 3.06 | |||
Bank of America Corporation | 3.01 | |||
JPMorgan Chase & Company | 2.89 | |||
Honeywell International Incorporated | 2.86 | |||
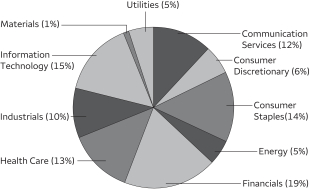
| Sector allocation as of July 31, 20208 |
 |
Stock selection across several sectors contributed to Fund performance.
Within the IT sector, the largest contributors to the Fund’s performance were computer software giant Microsoft Corp. and Apple Inc., leading global manufacturer of consumer electronics, personal computers and related software, peripherals, and networking solutions. Supermarket operator The Kroger Co. and U.S. package food company The Kellogg Co. were the Fund’s top contributors within the consumer staples sector. The Fund’s holding in the utilities sector, NextEra Energy, Inc., a Florida-based utility company with a balanced mix of regulated and nonregulated businesses, enhanced relative value.
Security selection in financials and energy detracted from relative performance.
Within the financials sector, the primary detractor was the middle-market commercial bank, CIT Group Inc*. Stock selection in the energy sector also detracted from relative return, especially TechnipFMC plc*, an equipment manufacturer for the energy industry, and Schlumberger Ltd.*, a global leader in oilfield services.
During the period, we made changes to the Fund’s portfolio based on our fundamental research.
As a result of trades, stock price movements, and the annual reconstitution of the FTSE Russell family of indices, the Fund’s positioning relative to its benchmark shifted noticeably during the period. The most notable sector weighting change within the Fund was an increase in the consumer staples sector’s weighting. We added positions in three consumer staples companies: Kroger, brewing giant Anheuser-Busch InBev SA/NV, and household and personal care company The Procter & Gamble Co. In all cases, trades within the Fund were made based on fundamental bottom-up research and were not top-down sector allocation decisions.
We continued to focus on our investment strategy and process.
The rebound in global equity markets reflects investors’ positive anticipation about the pace and strength of the economic recovery. As long-term investors, we have positioned our portfolios for the next two to three years and have tried to maintain
Please see footnotes on page 7.
8 | Wells Fargo Classic Value Fund
Table of Contents
Performance highlights (unaudited)
our risk profile to participate in the recovery. There are signs of recovery across the globe. However, this recovery has not been smooth, nor as rapid as the decline. We still consider a U-shaped recovery the most likely scenario, with economic activity improving in the third and fourth quarters.
We identify several risks that may affect short-term returns, including coronavirus propagation prolonging quarantines or slowing reopenings; human behavior shifts away from city centers, travel, and mass public events and gatherings; U.S. political conflict and 2020 elections; deteriorating trade relations with China; and other geopolitical events.
We continue to believe that our long-term focus on company fundamentals, our determination to seek out mispricing opportunities in the marketplace, and our ability to identify catalysts that create or unlock value over our investment time horizon should return value for shareholders over a complete market cycle.
Wells Fargo Classic Value Fund | 9
Table of Contents
As a shareholder of the Fund, you incur two types of costs: (1) transaction costs, including sales charges (loads) on purchase payments and contingent deferred sales charges (if any) on redemptions and (2) ongoing costs, including management fees, distribution (12b-1) and/or shareholder servicing fees, and other Fund expenses. This example is intended to help you understand your ongoing costs (in dollars) of investing in the Fund and to compare these costs with the ongoing costs of investing in other mutual funds.
The example is based on an investment of $1,000 invested at the beginning of the six-month period and held for the entire period from February 1, 2020 to July 31, 2020.
Actual expenses
The “Actual” line of the table below provides information about actual account values and actual expenses. You may use the information in this line, together with the amount you invested, to estimate the expenses that you paid over the period. Simply divide your account value by $1,000 (for example, an $8,600 account value divided by $1,000 = 8.6), then multiply the result by the number in the “Actual” line under the heading entitled “Expenses paid during period” for your applicable class of shares to estimate the expenses you paid on your account during this period.
Hypothetical example for comparison purposes
The “Hypothetical” line of the table below provides information about hypothetical account values and hypothetical expenses based on the Fund’s actual expense ratio and an assumed rate of return of 5% per year before expenses, which is not the Fund’s actual return. The hypothetical account values and expenses may not be used to estimate the actual ending account balance or expenses you paid for the period. You may use this information to compare the ongoing costs of investing in the Fund and other funds. To do so, compare this 5% hypothetical example with the 5% hypothetical examples that appear in the shareholder reports of the other funds.
Please note that the expenses shown in the table are meant to highlight your ongoing costs only and do not reflect any transactional costs, such as sales charges (loads) and contingent deferred sales charges. Therefore, the “Hypothetical” line of the table is useful in comparing ongoing costs only and will not help you determine the relative total costs of owning different funds. In addition, if these transactional costs were included, your costs would have been higher.
| Beginning account value 2-1-2020 | Ending account value 7-31-2020 | Expenses paid during the period1 | Annualized net expense ratio | |||||||||||||
Class A | ||||||||||||||||
Actual | $ | 1,000.00 | $ | 911.65 | $ | 5.23 | 1.10 | % | ||||||||
Hypothetical (5% return before expenses) | $ | 1,000.00 | $ | 1,019.39 | $ | 5.52 | 1.10 | % | ||||||||
Class C | ||||||||||||||||
Actual | $ | 1,000.00 | $ | 908.26 | $ | 8.82 | 1.86 | % | ||||||||
Hypothetical (5% return before expenses) | $ | 1,000.00 | $ | 1,015.61 | $ | 9.32 | 1.86 | % | ||||||||
Class R | ||||||||||||||||
Actual | $ | 1,000.00 | $ | 909.96 | $ | 6.46 | 1.36 | % | ||||||||
Hypothetical (5% return before expenses) | $ | 1,000.00 | $ | 1,018.10 | $ | 6.82 | 1.36 | % | ||||||||
Class R6 | ||||||||||||||||
Actual | $ | 1,000.00 | $ | 914.00 | $ | 3.09 | 0.65 | % | ||||||||
Hypothetical (5% return before expenses) | $ | 1,000.00 | $ | 1,021.63 | $ | 3.27 | 0.65 | % | ||||||||
Administrator Class | ||||||||||||||||
Actual | $ | 1,000.00 | $ | 911.79 | $ | 4.52 | 0.95 | % | ||||||||
Hypothetical (5% return before expenses) | $ | 1,000.00 | $ | 1,020.14 | $ | 4.77 | 0.95 | % | ||||||||
Institutional Class | ||||||||||||||||
Actual | $ | 1,000.00 | $ | 913.74 | $ | 3.33 | 0.70 | % | ||||||||
Hypothetical (5% return before expenses) | $ | 1,000.00 | $ | 1,021.38 | $ | 3.52 | 0.70 | % | ||||||||
| 1 | Expenses paid is equal to the annualized net expense ratio of each class multiplied by the average account value over the period, multiplied by the number of days in the most recent fiscal half-year divided by the number of days in the fiscal year (to reflect the one-half-year period). |
10 | Wells Fargo Classic Value Fund
Table of Contents
Portfolio of investments—July 31, 2020
| Shares | Value | |||||||||||||||
| Common Stocks: 97.24% | ||||||||||||||||
Communication Services: 11.66% | ||||||||||||||||
| Diversified Telecommunication Services: 2.78% | ||||||||||||||||
Verizon Communications Incorporated | 362,400 | $ | 20,830,752 | |||||||||||||
|
| |||||||||||||||
| Entertainment: 2.28% | ||||||||||||||||
The Walt Disney Company | 145,800 | 17,049,852 | ||||||||||||||
|
| |||||||||||||||
| Interactive Media & Services: 2.73% | ||||||||||||||||
Alphabet Incorporated Class C † | 13,800 | 20,464,848 | ||||||||||||||
|
| |||||||||||||||
| Media: 3.87% | ||||||||||||||||
Comcast Corporation Class A | 676,800 | 28,967,040 | ||||||||||||||
|
| |||||||||||||||
Consumer Discretionary: 5.71% | ||||||||||||||||
| Multiline Retail: 2.35% | ||||||||||||||||
Dollar Tree Incorporated † | 188,300 | 17,577,805 | ||||||||||||||
|
| |||||||||||||||
| Specialty Retail: 3.36% | ||||||||||||||||
Advance Auto Parts Incorporated | 167,900 | 25,208,506 | ||||||||||||||
|
| |||||||||||||||
Consumer Staples: 13.70% | ||||||||||||||||
| Beverages: 1.04% | ||||||||||||||||
Anheuser-Busch InBev NV ADR | 143,400 | 7,805,262 | ||||||||||||||
|
| |||||||||||||||
| Food & Staples Retailing: 2.65% | ||||||||||||||||
The Kroger Company | 570,000 | 19,830,300 | ||||||||||||||
|
| |||||||||||||||
Food Products: 7.61% | ||||||||||||||||
Kellogg Company | 398,600 | 27,499,414 | ||||||||||||||
Mondelez International Incorporated Class A | 532,700 | 29,559,523 | ||||||||||||||
| 57,058,937 | ||||||||||||||||
|
| |||||||||||||||
| Household Products: 2.40% | ||||||||||||||||
The Procter & Gamble Company | 137,000 | 17,963,440 | ||||||||||||||
|
| |||||||||||||||
Energy: 4.53% | ||||||||||||||||
| Oil, Gas & Consumable Fuels: 4.53% | ||||||||||||||||
Chevron Corporation | 170,800 | 14,336,952 | ||||||||||||||
ConocoPhillips | 289,703 | 10,831,995 | ||||||||||||||
EOG Resources Incorporated | 186,200 | 8,723,470 | ||||||||||||||
| 33,892,417 | ||||||||||||||||
|
| |||||||||||||||
Financials: 18.42% | ||||||||||||||||
| Banks: 9.08% | ||||||||||||||||
Bank of America Corporation | 905,600 | 22,531,328 | ||||||||||||||
JPMorgan Chase & Company | 223,900 | 21,637,696 | ||||||||||||||
Truist Financial Corporation | 435,800 | 16,325,068 | ||||||||||||||
US Bancorp | 204,553 | 7,535,733 | ||||||||||||||
| 68,029,825 | ||||||||||||||||
|
| |||||||||||||||
| Capital Markets: 5.22% | ||||||||||||||||
Intercontinental Exchange Incorporated | 204,800 | 19,820,544 | ||||||||||||||
The Goldman Sachs Group Incorporated | 97,500 | 19,301,100 | ||||||||||||||
| 39,121,644 | ||||||||||||||||
|
| |||||||||||||||
The accompanying notes are an integral part of these financial statements.
Wells Fargo Classic Value Fund | 11
Table of Contents
Portfolio of investments—July 31, 2020
| Shares | Value | |||||||||||||||
| Insurance: 4.12% | ||||||||||||||||
American International Group Incorporated | 383,300 | $ | 12,319,262 | |||||||||||||
The Allstate Corporation | 196,300 | 18,528,757 | ||||||||||||||
| 30,848,019 | ||||||||||||||||
|
| |||||||||||||||
Health Care: 12.70% | ||||||||||||||||
| Biotechnology: 1.35% | ||||||||||||||||
Gilead Sciences Incorporated | 145,000 | 10,081,850 | ||||||||||||||
|
| |||||||||||||||
| Health Care Equipment & Supplies: 3.51% | ||||||||||||||||
Medtronic plc | 152,000 | 14,664,960 | ||||||||||||||
Stryker Corporation | 60,200 | 11,636,660 | ||||||||||||||
| 26,301,620 | ||||||||||||||||
|
| |||||||||||||||
| Health Care Providers & Services: 2.13% | ||||||||||||||||
Cigna Corporation | 92,500 | 15,973,825 | ||||||||||||||
|
| |||||||||||||||
| Pharmaceuticals: 5.71% | ||||||||||||||||
Eli Lilly & Company | 114,900 | 17,268,321 | ||||||||||||||
Merck & Company Incorporated | 318,000 | 25,516,320 | ||||||||||||||
| 42,784,641 | ||||||||||||||||
|
| |||||||||||||||
Industrials: 9.89% | ||||||||||||||||
| Aerospace & Defense: 5.00% | ||||||||||||||||
General Dynamics Corporation | 120,300 | 17,652,822 | ||||||||||||||
Northrop Grumman Corporation | 61,025 | 19,833,735 | ||||||||||||||
| 37,486,557 | ||||||||||||||||
|
| |||||||||||||||
| Commercial Services & Supplies: 2.03% | ||||||||||||||||
Waste Management Incorporated | 138,700 | 15,201,520 | ||||||||||||||
|
| |||||||||||||||
| Industrial Conglomerates: 2.86% | ||||||||||||||||
Honeywell International Incorporated | 143,200 | 21,389,784 | ||||||||||||||
|
| |||||||||||||||
Information Technology: 15.13% | ||||||||||||||||
| Communications Equipment: 5.47% | ||||||||||||||||
Cisco Systems Incorporated | 486,100 | 22,895,310 | ||||||||||||||
Motorola Solutions Incorporated | 129,500 | 18,104,100 | ||||||||||||||
| 40,999,410 | ||||||||||||||||
|
| |||||||||||||||
| Semiconductors & Semiconductor Equipment: 5.36% | ||||||||||||||||
NXP Semiconductors NV | 178,300 | 20,955,599 | ||||||||||||||
ON Semiconductor Corporation † | 932,000 | 19,199,200 | ||||||||||||||
| 40,154,799 | ||||||||||||||||
|
| |||||||||||||||
| Software: 2.36% | ||||||||||||||||
Microsoft Corporation | 86,100 | 17,651,361 | ||||||||||||||
|
| |||||||||||||||
| Technology Hardware, Storage & Peripherals: 1.94% | ||||||||||||||||
Apple Incorporated | 34,266 | 14,564,421 | ||||||||||||||
|
| |||||||||||||||
Materials: 0.91% | ||||||||||||||||
| Construction Materials: 0.91% | ||||||||||||||||
Vulcan Materials Company | 58,000 | 6,810,360 | ||||||||||||||
|
| |||||||||||||||
The accompanying notes are an integral part of these financial statements.
12 | Wells Fargo Classic Value Fund
Table of Contents
Portfolio of investments—July 31, 2020
| Shares | Value | |||||||||||||||
Utilities: 4.59% | ||||||||||||||||
| Electric Utilities: 3.57% | ||||||||||||||||
NextEra Energy Incorporated | 95,200 | $ | 26,722,640 | |||||||||||||
|
| |||||||||||||||
| Multi-Utilities: 1.02% | ||||||||||||||||
WEC Energy Group Incorporated | 80,301 | 7,649,473 | ||||||||||||||
|
| |||||||||||||||
Total Common Stocks (Cost $575,665,561) | 728,420,908 | |||||||||||||||
|
| |||||||||||||||
| Yield | ||||||||||||||||
| Short-Term Investments: 2.55% | ||||||||||||||||
| Investment Companies: 2.55% | ||||||||||||||||
Wells Fargo Government Money Market Select Class (l)(u) | 0.10 | % | 19,155,681 | 19,155,681 | ||||||||||||
|
| |||||||||||||||
Total Short-Term Investments (Cost $19,155,681) | 19,155,681 | |||||||||||||||
|
| |||||||||||||||
| Total investments in securities (Cost $594,821,242) | 99.79 | % | 747,576,589 | |||||
Other assets and liabilities, net | 0.21 | 1,540,390 | ||||||
|
|
|
| |||||
| Total net assets | 100.00 | % | $ | 749,116,979 | ||||
|
|
|
| |||||
| † | Non-income-earning security |
| (l) | The issuer of the security is an affiliated person of the Fund as defined in the Investment Company Act of 1940. |
| (u) | The rate represents the 7-day annualized yield at period end. |
Abbreviations:
| ADR | American depositary receipt |
Investments in Affiliates
An affiliated investment is an investment in which the Fund owns at least 5% of the outstanding voting shares of the issuer or as a result of other relationships, such as the Fund and the issuer having the same investment manager. Transactions with issuers that were either affiliated persons of the Fund at the beginning of the period or the end of the period were as follows:
| Value, beginning of period | Purchases | Sales proceeds | Net realized gains (losses) | Net change in unrealized gains (losses) | Income from affiliated securities | Value, end of period | % of net assets | |||||||||||||||||||||||||
| Short-Term Investments | ||||||||||||||||||||||||||||||||
Investment Companies | ||||||||||||||||||||||||||||||||
Securities Lending Cash Investments LLC * | $ | 0 | $ | 124,158,850 | $ | (124,158,380 | ) | $ | (470 | ) | $ | 0 | $ | 55,346 | # | $ | 0 | |||||||||||||||
Wells Fargo Government Money Market Fund Select Class | 21,251,512 | 188,726,307 | (190,822,138 | ) | 0 | 0 | 192,587 | 19,155,681 | ||||||||||||||||||||||||
|
|
|
|
|
|
|
|
|
| |||||||||||||||||||||||
| $ | (470 | ) | $ | 0 | $ | 247,933 | $ | 19,155,681 | 2.55 | % | ||||||||||||||||||||||
|
|
|
|
|
|
|
|
|
| |||||||||||||||||||||||
| * | No longer held at the end of the period. |
| # | Amount shown represents income before fees and rebates. |
The accompanying notes are an integral part of these financial statements.
Wells Fargo Classic Value Fund | 13
Table of Contents
Statement of assets and liabilities—July 31, 2020
Assets | ||||
Investments in unaffiliated securities, at value (cost $575,665,561) | $ | 728,420,908 | ||
Investments in affiliated securities, at value (cost $19,155,681) | 19,155,681 | |||
Receivable for investments sold | 9,322,142 | |||
Receivable for Fund shares sold | 189,251 | |||
Receivable for dividends | 747,360 | |||
Prepaid expenses and other assets | 8,719 | |||
|
| |||
Total assets | 757,844,061 | |||
|
| |||
Liabilities | ||||
Payable for investments purchased | 7,524,454 | |||
Payable for Fund shares redeemed | 392,148 | |||
Management fee payable | 370,471 | |||
Administration fees payable | 103,759 | |||
Distribution fees payable | 2,997 | |||
Trustees’ fees and expenses payable | 4,460 | |||
Accrued expenses and other liabilities | 328,793 | |||
|
| |||
Total liabilities | 8,727,082 | |||
|
| |||
Total net assets | $ | 749,116,979 | ||
|
| |||
Net assets consist of | ||||
Paid-in capital | $ | 601,069,522 | ||
Total distributable earnings | 148,047,457 | |||
|
| |||
Total net assets | $ | 749,116,979 | ||
|
| |||
Computation of net asset value and offering price per share | ||||
Net assets – Class A | $ | 245,977,056 | ||
Shares outstanding – Class A1 | 21,678,156 | |||
Net asset value per share – Class A | $11.35 | |||
Maximum offering price per share – Class A2 | $12.04 | |||
Net assets – Class C | $ | 4,400,789 | ||
Shares outstanding – Class C1 | 400,436 | |||
Net asset value per share – Class C | $10.99 | |||
Net assets – Class R | $ | 75,611 | ||
Shares outstanding – Class R1 | 6,619 | |||
Net asset value per share – Class R | $11.42 | |||
Net assets – Class R6 | $ | 11,552,132 | ||
Shares outstanding – Class R61 | 1,035,326 | |||
Net asset value per share – Class R6 | $11.16 | |||
Net assets – Administrator Class | $ | 402,567,427 | ||
Shares outstanding – Administrator Class1 | 33,567,309 | |||
Net asset value per share – Administrator Class | $11.99 | |||
Net assets – Institutional Class | $ | 84,543,964 | ||
Shares outstanding – Institutional Class1 | 7,393,168 | |||
Net asset value per share – Institutional Class | $11.44 | |||
| 1 | The Fund has an unlimited number of authorized shares. |
| 2 | Maximum offering price is computed as 100/94.25 of net asset value. On investments of $50,000 or more, the offering price is reduced. |
The accompanying notes are an integral part of these financial statements.
14 | Wells Fargo Classic Value Fund
Table of Contents
Statement of operations—year ended July 31, 2020
Investment income | ||||
Dividends (net of foreign withholding taxes of $55,145) | $ | 18,306,593 | ||
Income from affiliated securities | 210,380 | |||
|
| |||
Total investment income | 18,516,973 | |||
|
| |||
Expenses | ||||
Management fee | 5,564,149 | |||
Administration fees | ||||
Class A | 560,646 | |||
Class C | 12,230 | |||
Class R | 176 | |||
Class R6 | 1,952 | |||
Administrator Class | 562,463 | |||
Institutional Class | 121,740 | |||
Shareholder servicing fees | ||||
Class A | 643,532 | |||
Class C | 14,542 | |||
Class R | 210 | |||
Administrator Class | 1,078,671 | |||
Distribution fees | ||||
Class C | 43,616 | |||
Class R | 187 | |||
Custody and accounting fees | 37,465 | |||
Professional fees | 44,906 | |||
Registration fees | 100,850 | |||
Shareholder report expenses | 85,793 | |||
Trustees’ fees and expenses | 21,002 | |||
Other fees and expenses | 35,649 | |||
|
| |||
Total expenses | 8,929,779 | |||
Less: Fee waivers and/or expense reimbursements | ||||
Fund-level | (654,720 | ) | ||
Class A | (26,900 | ) | ||
Class C | (49 | ) | ||
Class R6 | (1,952 | ) | ||
Administrator Class | (430,306 | ) | ||
Institutional Class | (71,828 | ) | ||
|
| |||
Net expenses | 7,744,024 | |||
|
| |||
Net investment income | 10,772,949 | |||
|
| |||
Realized and unrealized gains (losses) on investments | ||||
Net realized losses on | ||||
Unaffiliated securities | (3,780,578 | ) | ||
Affiliated securities | (470 | ) | ||
|
| |||
Net realized losses on investments | (3,781,048 | ) | ||
Net change in unrealized gains (losses) on investments | (43,117,237 | ) | ||
|
| |||
Net realized and unrealized gains (losses) on investments | (46,898,285 | ) | ||
|
| |||
Net decrease in net assets resulting from operations | $ | (36,125,336 | ) | |
|
| |||
The accompanying notes are an integral part of these financial statements.
Wells Fargo Classic Value Fund | 15
Table of Contents
Statement of changes in net assets
| Year ended July 31, 2020 | Year ended July 31, 2019 | |||||||||||||||
Operations | ||||||||||||||||
Net investment income | $ | 10,772,949 | $ | 8,013,702 | ||||||||||||
Net realized gains (losses) on investments | (3,781,048 | ) | 76,996,742 | |||||||||||||
Net change in unrealized gains (losses) on investments | (43,117,237 | ) | (13,962,337 | ) | ||||||||||||
|
| |||||||||||||||
Net increase (decrease) in net assets resulting from operations | (36,125,336 | ) | 71,048,107 | |||||||||||||
|
| |||||||||||||||
Distributions to shareholders from net investment income and net realized gains | ||||||||||||||||
Class A | (28,687,356 | ) | (20,592,244 | ) | ||||||||||||
Class C | (597,397 | ) | (1,289,606 | ) | ||||||||||||
Class R | (9,076 | ) | (5,465 | ) | ||||||||||||
Class R6 | (458,181 | ) | (8,549 | ) | ||||||||||||
Administrator Class | (45,185,976 | ) | (32,970,858 | ) | ||||||||||||
Institutional Class | (10,686,553 | ) | (9,914,802 | ) | ||||||||||||
|
| |||||||||||||||
Total distributions to shareholders | (85,624,539 | ) | (64,781,524 | ) | ||||||||||||
|
| |||||||||||||||
Capital share transactions | Shares | Shares | ||||||||||||||
Proceeds from shares sold | ||||||||||||||||
Class A | 374,915 | 4,569,597 | 1,095,957 | 13,103,460 | ||||||||||||
Class C | 58,656 | 692,729 | 39,212 | 474,330 | ||||||||||||
Class R | 705 | 8,409 | 620 | 7,723 | ||||||||||||
Class R6 | 774,821 | 8,508,694 | 338,872 | 4,112,428 | ||||||||||||
Administrator Class | 365,622 | 4,856,780 | 156,229 | 2,025,198 | ||||||||||||
Institutional Class | 1,902,355 | 21,368,302 | 340,168 | 4,276,101 | ||||||||||||
|
| |||||||||||||||
| 40,004,511 | 23,999,240 | |||||||||||||||
|
| |||||||||||||||
Reinvestment of distributions | ||||||||||||||||
Class A | 2,187,382 | 27,522,364 | 1,707,185 | 19,644,349 | ||||||||||||
Class C | 46,079 | 559,402 | 110,427 | 1,234,002 | ||||||||||||
Class R | 588 | 7,444 | 372 | 4,309 | ||||||||||||
Class R6 | 36,211 | 448,674 | 65 | 713 | ||||||||||||
Administrator Class | 3,206,695 | 42,691,455 | 2,569,095 | 31,093,029 | ||||||||||||
Institutional Class | 812,821 | 10,324,119 | 740,566 | 8,584,300 | ||||||||||||
|
| |||||||||||||||
| 81,553,458 | 60,560,702 | |||||||||||||||
|
| |||||||||||||||
Payment for shares redeemed | ||||||||||||||||
Class A | (3,055,060 | ) | (36,802,224 | ) | (2,824,686 | ) | (34,934,918 | ) | ||||||||
Class C | (282,178 | ) | (3,247,977 | ) | (1,137,730 | ) | (13,185,582 | ) | ||||||||
Class R | (1,307 | ) | (13,014 | ) | (1 | ) | (14 | ) | ||||||||
Class R6 | (103,056 | ) | (1,219,499 | ) | (211,115 | ) | (2,800,996 | ) | ||||||||
Administrator Class | (3,608,759 | ) | (45,625,921 | ) | (3,428,830 | ) | (44,447,112 | ) | ||||||||
Institutional Class | (3,405,957 | ) | (37,492,113 | ) | (3,443,010 | ) | (40,683,763 | ) | ||||||||
|
| |||||||||||||||
| (124,400,748 | ) | (136,052,385 | ) | |||||||||||||
|
| |||||||||||||||
Net decrease in net assets resulting from capital share transactions | (2,842,779 | ) | (51,492,443 | ) | ||||||||||||
|
| |||||||||||||||
Total decrease in net assets | (124,592,654 | ) | (45,225,860 | ) | ||||||||||||
|
| |||||||||||||||
Net assets | ||||||||||||||||
Beginning of period | 873,709,633 | 918,935,493 | ||||||||||||||
|
| |||||||||||||||
End of period | $ | 749,116,979 | $ | 873,709,633 | ||||||||||||
|
| |||||||||||||||
The accompanying notes are an integral part of these financial statements.
16 | Wells Fargo Classic Value Fund
Table of Contents
(For a share outstanding throughout each period)
| Year ended July 31 | ||||||||||||||||||||
| CLASS A | 2020 | 2019 | 2018 | 2017 | 2016 | |||||||||||||||
Net asset value, beginning of period | $13.13 | $13.05 | $12.61 | $12.01 | $13.73 | |||||||||||||||
Net investment income | 0.14 | 0.10 | 0.11 | 0.12 | 1 | 0.13 | ||||||||||||||
Net realized and unrealized gains (losses) on investments | (0.58 | ) | 0.94 | 1.39 | 1.43 | (0.42 | ) | |||||||||||||
|
|
|
|
|
|
|
|
|
| |||||||||||
Total from investment operations | (0.44 | ) | 1.04 | 1.50 | 1.55 | (0.29 | ) | |||||||||||||
Distributions to shareholders from | ||||||||||||||||||||
Net investment income | (0.10 | ) | (0.12 | ) | (0.06 | ) | (0.14 | ) | (0.11 | ) | ||||||||||
Net realized gains | (1.24 | ) | (0.84 | ) | (1.00 | ) | (0.81 | ) | (1.32 | ) | ||||||||||
|
|
|
|
|
|
|
|
|
| |||||||||||
Total distributions to shareholders | (1.34 | ) | (0.96 | ) | (1.06 | ) | (0.95 | ) | (1.43 | ) | ||||||||||
Net asset value, end of period | $11.35 | $13.13 | $13.05 | $12.61 | $12.01 | |||||||||||||||
Total return2 | (4.25 | )% | 9.03 | % | 12.43 | % | 13.50 | % | (1.73 | )% | ||||||||||
Ratios to average net assets (annualized) | ||||||||||||||||||||
Gross expenses | 1.18 | % | 1.18 | % | 1.18 | % | 1.17 | % | 1.17 | % | ||||||||||
Net expenses | 1.10 | % | 1.10 | % | 1.10 | % | 1.10 | % | 1.10 | % | ||||||||||
Net investment income | 1.20 | % | 0.81 | % | 0.83 | % | 0.95 | % | 1.12 | % | ||||||||||
Supplemental data | ||||||||||||||||||||
Portfolio turnover rate | 34 | % | 27 | % | 21 | % | 27 | % | 34 | % | ||||||||||
Net assets, end of period (000s omitted) | $245,977 | $291,111 | $289,683 | $293,599 | $318,543 | |||||||||||||||
| 1 | Calculated based upon average shares outstanding |
| 2 | Total return calculations do not include any sales charges. |
The accompanying notes are an integral part of these financial statements.
Wells Fargo Classic Value Fund | 17
Table of Contents
Financial highlights
(For a share outstanding throughout each period)
| Year ended July 31 | ||||||||||||||||||||
| CLASS C | 2020 | 2019 | 2018 | 2017 | 2016 | |||||||||||||||
Net asset value, beginning of period | $12.75 | $12.69 | $12.31 | $11.74 | $13.45 | |||||||||||||||
Net investment income | 0.05 | 1 | 0.00 | 1,2 | 0.01 | 1 | 0.02 | 1 | 0.03 | |||||||||||
Net realized and unrealized gains (losses) on investments | (0.57 | ) | 0.92 | 1.37 | 1.40 | (0.41 | ) | |||||||||||||
|
|
|
|
|
|
|
|
|
| |||||||||||
Total from investment operations | (0.52 | ) | 0.92 | 1.38 | 1.42 | (0.38 | ) | |||||||||||||
Distributions to shareholders from | ||||||||||||||||||||
Net investment income | 0.00 | (0.02 | ) | 0.00 | (0.04 | ) | (0.01 | ) | ||||||||||||
Net realized gains | (1.24 | ) | (0.84 | ) | (1.00 | ) | (0.81 | ) | (1.32 | ) | ||||||||||
|
|
|
|
|
|
|
|
|
| |||||||||||
Total distributions to shareholders | (1.24 | ) | (0.86 | ) | (1.00 | ) | (0.85 | ) | (1.33 | ) | ||||||||||
Net asset value, end of period | $10.99 | $12.75 | $12.69 | $12.31 | $11.74 | |||||||||||||||
Total return3 | (4.99 | )% | 8.16 | % | 11.65 | % | 12.58 | % | (2.47 | )% | ||||||||||
Ratios to average net assets (annualized) | ||||||||||||||||||||
Gross expenses | 1.94 | % | 1.94 | % | 1.93 | % | 1.93 | % | 1.93 | % | ||||||||||
Net expenses | 1.86 | % | 1.86 | % | 1.86 | % | 1.86 | % | 1.86 | % | ||||||||||
Net investment income | 0.44 | % | 0.03 | % | 0.08 | % | 0.20 | % | 0.37 | % | ||||||||||
Supplemental data | ||||||||||||||||||||
Portfolio turnover rate | 34 | % | 27 | % | 21 | % | 27 | % | 34 | % | ||||||||||
Net assets, end of period (000s omitted) | $4,401 | $7,370 | $19,874 | $21,727 | $28,756 | |||||||||||||||
| 1 | Calculated based upon average shares outstanding |
| 2 | Amount is less than $0.005. |
| 3 | Total return calculations do not include any sales charges. |
The accompanying notes are an integral part of these financial statements.
18 | Wells Fargo Classic Value Fund
Table of Contents
Financial highlights
(For a share outstanding throughout each period)
| Year ended July 31 | ||||||||||||||||||||
| CLASS R | 2020 | 2019 | 2018 | 2017 | 2016 | |||||||||||||||
Net asset value, beginning of period | $13.22 | $13.15 | $12.70 | $12.09 | $13.81 | |||||||||||||||
Net investment income | 0.11 | 0.06 | 0.05 | 0.08 | 1 | 0.10 | ||||||||||||||
Net realized and unrealized gains (losses) on investments | (0.59 | ) | 0.95 | 1.44 | 1.45 | (0.43 | ) | |||||||||||||
|
|
|
|
|
|
|
|
|
| |||||||||||
Total from investment operations | (0.48 | ) | 1.01 | 1.49 | 1.53 | (0.33 | ) | |||||||||||||
Distributions to shareholders from | ||||||||||||||||||||
Net investment income | (0.08 | ) | (0.10 | ) | (0.04 | ) | (0.11 | ) | (0.07 | ) | ||||||||||
Net realized gains | (1.24 | ) | (0.84 | ) | (1.00 | ) | (0.81 | ) | (1.32 | ) | ||||||||||
|
|
|
|
|
|
|
|
|
| |||||||||||
Total distributions to shareholders | (1.32 | ) | (0.94 | ) | (1.04 | ) | (0.92 | ) | (1.39 | ) | ||||||||||
Net asset value, end of period | $11.42 | $13.22 | $13.15 | $12.70 | $12.09 | |||||||||||||||
Total return | (4.56 | )% | 8.70 | % | 12.21 | % | 13.22 | % | (1.99 | )% | ||||||||||
Ratios to average net assets (annualized) | ||||||||||||||||||||
Gross expenses | 1.41 | % | 1.43 | % | 1.44 | % | 1.44 | % | 1.44 | % | ||||||||||
Net expenses | 1.36 | % | 1.36 | % | 1.36 | % | 1.36 | % | 1.36 | % | ||||||||||
Net investment income | 0.95 | % | 0.55 | % | 0.56 | % | 0.69 | % | 0.86 | % | ||||||||||
Supplemental data | ||||||||||||||||||||
Portfolio turnover rate | 34 | % | 27 | % | 21 | % | 27 | % | 34 | % | ||||||||||
Net assets, end of period (000s omitted) | $76 | $88 | $74 | $48 | $43 | |||||||||||||||
| 1 | Calculated based upon average shares outstanding |
The accompanying notes are an integral part of these financial statements.
Wells Fargo Classic Value Fund | 19
Table of Contents
Financial highlights
(For a share outstanding throughout each period)
| Year ended July 31 | ||||||||||||||||||||
| CLASS R6 | 2020 | 2019 | 2018 | 2017 | 2016 | |||||||||||||||
Net asset value, beginning of period | $12.93 | $12.92 | $12.49 | $11.90 | $13.62 | |||||||||||||||
Net investment income | 0.19 | 1 | 0.16 | 1 | 0.16 | 0.17 | 1 | 0.17 | ||||||||||||
Net realized and unrealized gains (losses) on investments | (0.57 | ) | 1.00 | 1.39 | 1.42 | (0.40 | ) | |||||||||||||
|
|
|
|
|
|
|
|
|
| |||||||||||
Total from investment operations | (0.38 | ) | 1.16 | 1.55 | 1.59 | (0.23 | ) | |||||||||||||
Distributions to shareholders from | ||||||||||||||||||||
Net investment income | (0.15 | ) | (0.31 | ) | (0.12 | ) | (0.19 | ) | (0.17 | ) | ||||||||||
Net realized gains | (1.24 | ) | (0.84 | ) | (1.00 | ) | (0.81 | ) | (1.32 | ) | ||||||||||
|
|
|
|
|
|
|
|
|
| |||||||||||
Total distributions to shareholders | (1.39 | ) | (1.15 | ) | (1.12 | ) | (1.00 | ) | (1.49 | ) | ||||||||||
Net asset value, end of period | $11.16 | $12.93 | $12.92 | $12.49 | $11.90 | |||||||||||||||
Total return | (3.87 | )% | 10.38 | % | 12.96 | % | 14.03 | % | (1.30 | )% | ||||||||||
Ratios to average net assets (annualized) | ||||||||||||||||||||
Gross expenses | 0.76 | % | 0.76 | % | 0.75 | % | 0.75 | % | 0.75 | % | ||||||||||
Net expenses | 0.65 | % | 0.65 | % | 0.65 | % | 0.65 | % | 0.65 | % | ||||||||||
Net investment income | 1.67 | % | 1.27 | % | 1.29 | % | 1.40 | % | 1.47 | % | ||||||||||
Supplemental data | ||||||||||||||||||||
Portfolio turnover rate | 34 | % | 27 | % | 21 | % | 27 | % | 34 | % | ||||||||||
Net assets, end of period (000s omitted) | $11,552 | $4,231 | $2,578 | $2,397 | $2,842 | |||||||||||||||
| 1 | Calculated based upon average shares outstanding |
The accompanying notes are an integral part of these financial statements.
20 | Wells Fargo Classic Value Fund
Table of Contents
Financial highlights
(For a share outstanding throughout each period)
| Year ended July 31 | ||||||||||||||||||||
| ADMINISTRATOR CLASS | 2020 | 2019 | 2018 | 2017 | 2016 | |||||||||||||||
Net asset value, beginning of period | $13.81 | $13.68 | $13.17 | $12.51 | $14.25 | |||||||||||||||
Net investment income | 0.17 | 0.12 | 0.13 | 0.14 | 1 | 0.15 | ||||||||||||||
Net realized and unrealized gains (losses) on investments | (0.62 | ) | 1.00 | 1.47 | 1.49 | (0.43 | ) | |||||||||||||
|
|
|
|
|
|
|
|
|
| |||||||||||
Total from investment operations | (0.45 | ) | 1.12 | 1.60 | 1.63 | (0.28 | ) | |||||||||||||
Distributions to shareholders from | ||||||||||||||||||||
Net investment income | (0.13 | ) | (0.15 | ) | (0.09 | ) | (0.16 | ) | (0.14 | ) | ||||||||||
Net realized gains | (1.24 | ) | (0.84 | ) | (1.00 | ) | (0.81 | ) | (1.32 | ) | ||||||||||
|
|
|
|
|
|
|
|
|
| |||||||||||
Total distributions to shareholders | (1.37 | ) | (0.99 | ) | (1.09 | ) | (0.97 | ) | (1.46 | ) | ||||||||||
Net asset value, end of period | $11.99 | $13.81 | $13.68 | $13.17 | $12.51 | |||||||||||||||
Total return | (4.15 | )% | 9.21 | % | 12.63 | % | 13.66 | % | (1.58 | )% | ||||||||||
Ratios to average net assets (annualized) | ||||||||||||||||||||
Gross expenses | 1.11 | % | 1.11 | % | 1.10 | % | 1.10 | % | 1.10 | % | ||||||||||
Net expenses | 0.93 | % | 0.95 | % | 0.95 | % | 0.95 | % | 0.95 | % | ||||||||||
Net investment income | 1.37 | % | 0.96 | % | 0.98 | % | 1.10 | % | 1.27 | % | ||||||||||
Supplemental data | ||||||||||||||||||||
Portfolio turnover rate | 34 | % | 27 | % | 21 | % | 27 | % | 34 | % | ||||||||||
Net assets, end of period (000s omitted) | $402,567 | $464,041 | $469,464 | $459,650 | $470,152 | |||||||||||||||
| 1 | Calculated based upon average shares outstanding |
The accompanying notes are an integral part of these financial statements.
Wells Fargo Classic Value Fund | 21
Table of Contents
Financial highlights
(For a share outstanding throughout each period)
| Year ended July 31 | ||||||||||||||||||||
| INSTITUTIONAL CLASS | 2020 | 2019 | 2018 | 2017 | 2016 | |||||||||||||||
Net asset value, beginning of period | $13.22 | $13.14 | $12.68 | $12.08 | $13.80 | |||||||||||||||
Net investment income | 0.19 | 1 | 0.15 | 1 | 0.22 | 0.17 | 1 | 0.18 | ||||||||||||
Net realized and unrealized gains (losses) on investments | (0.58 | ) | 0.94 | 1.35 | 1.43 | (0.41 | ) | |||||||||||||
|
|
|
|
|
|
|
|
|
| |||||||||||
Total from investment operations | (0.39 | ) | 1.09 | 1.57 | 1.60 | (0.23 | ) | |||||||||||||
Distributions to shareholders from | ||||||||||||||||||||
Net investment income | (0.15 | ) | (0.17 | ) | (0.11 | ) | (0.19 | ) | (0.17 | ) | ||||||||||
Net realized gains | (1.24 | ) | (0.84 | ) | (1.00 | ) | (0.81 | ) | (1.32 | ) | ||||||||||
|
|
|
|
|
|
|
|
|
| |||||||||||
Total distributions to shareholders | (1.39 | ) | (1.01 | ) | (1.11 | ) | (1.00 | ) | (1.49 | ) | ||||||||||
Net asset value, end of period | $11.44 | $13.22 | $13.14 | $12.68 | $12.08 | |||||||||||||||
Total return | (3.86 | )% | 9.44 | % | 12.96 | % | 13.88 | % | (1.27 | )% | ||||||||||
Ratios to average net assets (annualized) | ||||||||||||||||||||
Gross expenses | 0.86 | % | 0.86 | % | 0.85 | % | 0.85 | % | 0.85 | % | ||||||||||
Net expenses | 0.70 | % | 0.70 | % | 0.70 | % | 0.70 | % | 0.70 | % | ||||||||||
Net investment income | 1.59 | % | 1.22 | % | 1.24 | % | 1.36 | % | 1.52 | % | ||||||||||
Supplemental data | ||||||||||||||||||||
Portfolio turnover rate | 34 | % | 27 | % | 21 | % | 27 | % | 34 | % | ||||||||||
Net assets, end of period (000s omitted) | $84,544 | $106,869 | $137,263 | $162,480 | $215,175 | |||||||||||||||
| 1 | Calculated based upon average shares outstanding |
The accompanying notes are an integral part of these financial statements.
22 | Wells Fargo Classic Value Fund
Table of Contents
1. ORGANIZATION
Wells Fargo Funds Trust (the “Trust”), a Delaware statutory trust organized on March 10, 1999, is an open-end management investment company registered under the Investment Company Act of 1940, as amended (the “1940 Act”). As an investment company, the Trust follows the accounting and reporting guidance in Financial Accounting Standards Board (“FASB”) Accounting Standards Codification Topic 946, Financial Services – Investment Companies. These financial statements report on the Wells Fargo Classic Value Fund (the “Fund”) which is a diversified series of the Trust.
2. SIGNIFICANT ACCOUNTING POLICIES
The following significant accounting policies, which are consistently followed in the preparation of the financial statements of the Fund, are in conformity with U.S. generally accepted accounting principles which require management to make estimates and assumptions that affect the reported amounts of assets and liabilities, disclosure of contingent assets and liabilities at the date of the financial statements, and the reported amounts of revenues and expenses during the reporting period. Actual results could differ from those estimates.
Securities valuation
All investments are valued each business day as of the close of regular trading on the New York Stock Exchange (generally 4 p.m. Eastern Time), although the Fund may deviate from this calculation time under unusual or unexpected circumstances.
Equity securities that are listed on a foreign or domestic exchange or market are valued at the official closing price or, if none, the last sales price. If no sale occurs on the principal exchange or market that day, a fair value price will be determined in accordance with the Fund’s Valuation Procedures.
Investments in registered open-end investment companies are valued at net asset value. Interests in non-registered investment companies that are redeemable at net asset value are fair valued normally at net asset value.
Investments which are not valued using any of the methods discussed above are valued at their fair value, as determined in good faith by the Board of Trustees of the Fund. The Board of Trustees has established a Valuation Committee comprised of the Trustees and has delegated to it the authority to take any actions regarding the valuation of portfolio securities that the Valuation Committee deems necessary or appropriate, including determining the fair value of portfolio securities, unless the determination has been delegated to the Wells Fargo Asset Management Pricing Committee at Wells Fargo Funds Management, LLC (“Funds Management”). The Board of Trustees retains the authority to make or ratify any valuation decisions or approve any changes to the Valuation Procedures as it deems appropriate. On a quarterly basis, the Board of Trustees receives reports on any valuation actions taken by the Valuation Committee or the Wells Fargo Asset Management Pricing Committee which may include items for ratification.
Securities lending
The Fund may lend its securities from time to time in order to earn additional income in the form of fees or interest on securities received as collateral or the investment of any cash received as collateral. When securities are on loan, the Fund receives interest or dividends on those securities. Cash collateral received in connection with its securities lending transactions is invested in Securities Lending Cash Investments, LLC (the “Securities Lending Fund”). Investments in Securities Lending Fund are valued at the evaluated bid price provided by an independent pricing service. Income earned from investment in the Securities Lending Fund (net of fees and rebates), if any, is included in income from affiliated securities on the Statement of Operations.
In a securities lending transaction, the net asset value of the Fund is affected by an increase or decrease in the value of the securities loaned and by an increase or decrease in the value of the instrument in which collateral is invested. The amount of securities lending activity undertaken by the Fund fluctuates from time to time. The Fund has the right under the lending agreement to recover the securities from the borrower on demand. In the event of default or bankruptcy by the borrower, the Fund may be prevented from recovering the loaned securities or gaining access to the collateral or may experience delays or costs in doing so. In such an event, the terms of the agreement allow the unaffiliated securities lending agent to use the collateral to purchase replacement securities on behalf of the Fund or pay the Fund the market value of the loaned securities. The Fund bears the risk of loss with respect to depreciation of its investment of the cash collateral.
Security transactions and income recognition
Securities transactions are recorded on a trade date basis. Realized gains or losses are recorded on the basis of identified cost.
Dividend income is recognized on the ex-dividend date. Dividend income is recorded net of foreign taxes withheld where recovery of such taxes is not assured.
Wells Fargo Classic Value Fund | 23
Table of Contents
Notes to financial statements
Distributions to shareholders
Distributions to shareholders from net investment income and any net realized gains are recorded on the ex-dividend date and paid at least annually. Such distributions are determined in accordance with income tax regulations and may differ from U.S. generally accepted accounting principles. Dividend sources are estimated at the time of declaration. The tax character of distributions is determined as of the Fund’s fiscal year end. Therefore, a portion of the Fund’s distributions made prior to the Fund’s fiscal year end may be categorized as a tax return of capital at year end.
Federal and other taxes
The Fund intends to continue to qualify as a regulated investment company by distributing substantially all of its investment company taxable income and any net realized capital gains (after reduction for capital loss carryforwards) sufficient to relieve it from all, or substantially all, federal income taxes. Accordingly, no provision for federal income taxes was required.
The Fund’s income and federal excise tax returns and all financial records supporting those returns for the prior three fiscal years are subject to examination by the federal and Delaware revenue authorities. Management has analyzed the Fund’s tax positions taken on federal, state, and foreign tax returns for all open tax years and does not believe that there are any uncertain tax positions that require recognition of a tax liability.
As of July 31, 2020, the aggregate cost of all investments for federal income tax purposes was $595,520,635 and the unrealized gains (losses) consisted of:
Gross unrealized gains | $ | 189,039,964 | ||
Gross unrealized losses | (36,984,010 | ) | ||
Net unrealized gains | $ | 152,055,954 | ||
As of July 31, 2020, the Fund had current year deferred post-October capital losses consisting of $7,846,262 in short-term losses and $4,440,387 in long-term losses which will be recognized on the first day of the following fiscal year.
Class allocations
The separate classes of shares offered by the Fund differ principally in applicable sales charges, distribution, shareholder servicing, and administration fees. Class specific expenses are charged directly to that share class. Investment income, common fund-level expenses, and realized and unrealized gains (losses) on investments are allocated daily to each class of shares based on the relative proportion of net assets of each class.
3. FAIR VALUATION MEASUREMENTS
Fair value measurements of investments are determined within a framework that has established a fair value hierarchy based upon the various data inputs utilized in determining the value of the Fund’s investments. The three-level hierarchy gives the highest priority to unadjusted quoted prices in active markets for identical assets or liabilities (Level 1) and the lowest priority to unobservable inputs (Level 3). The Fund’s investments are classified within the fair value hierarchy based on the lowest level of input that is significant to the fair value measurement. The inputs are summarized into three broad levels as follows:
| ∎ | Level 1 – quoted prices in active markets for identical securities |
| ∎ | Level 2 – other significant observable inputs (including quoted prices for similar securities, interest rates, prepayment speeds, credit risk, etc.) |
| ∎ | Level 3 – significant unobservable inputs (including the Fund’s own assumptions in determining the fair value of investments) |
The inputs or methodologies used for valuing investments in securities are not necessarily an indication of the risk associated with investing in those securities.
24 | Wells Fargo Classic Value Fund
Table of Contents
Notes to financial statements
The following is a summary of the inputs used in valuing the Fund’s assets and liabilities as of July 31, 2020:
| Quoted prices (Level 1) | Other significant observable inputs (Level 2) | Significant (Level 3) | Total | |||||||||||||
Assets | ||||||||||||||||
Investments in: | ||||||||||||||||
Common stocks | ||||||||||||||||
Communication services | $ | 87,312,492 | $ | 0 | $ | 0 | $ | 87,312,492 | ||||||||
Consumer discretionary | 42,786,311 | 0 | 0 | 42,786,311 | ||||||||||||
Consumer staples | 102,657,939 | 0 | 0 | 102,657,939 | ||||||||||||
Energy | 33,892,417 | 0 | 0 | 33,892,417 | ||||||||||||
Financials | 137,999,488 | 0 | 0 | 137,999,488 | ||||||||||||
Health care | 95,141,936 | 0 | 0 | 95,141,936 | ||||||||||||
Industrials | 74,077,861 | 0 | 0 | 74,077,861 | ||||||||||||
Information technology | 113,369,991 | 0 | 0 | 113,369,991 | ||||||||||||
Materials | 6,810,360 | 0 | 0 | 6,810,360 | ||||||||||||
Utilities | 34,372,113 | 0 | 0 | 34,372,113 | ||||||||||||
Short-term investments | ||||||||||||||||
Investment companies | 19,155,681 | 0 | �� | 0 | 19,155,681 | |||||||||||
Total assets | $ | 747,576,589 | $ | 0 | $ | 0 | $ | 747,576,589 | ||||||||
Additional sector, industry or geographic detail is included in the Portfolio of Investments.
For the year ended July 31, 2020, the Fund did not have any transfers into/out of Level 3.
4. TRANSACTIONS WITH AFFILIATES
Management fee
Funds Management, an indirect wholly owned subsidiary of Wells Fargo & Company (“Wells Fargo”), is the manager of the Fund and provides advisory and fund-level administrative services under an investment management agreement. Under the investment management agreement, Funds Management is responsible for, among other services, implementing the investment objectives and strategies of the Fund, supervising the subadviser and providing fund-level administrative services in connection with the Fund’s operations. As compensation for its services under the investment management agreement, Funds Management is entitled to receive a management fee at the following annual rate based on the Fund’s average daily net assets:
| Average daily net assets | Management fee | |||
First $500 million | 0.700 | % | ||
Next $500 million | 0.675 | |||
Next $1 billion | 0.650 | |||
Next $2 billion | 0.625 | |||
Next $1 billion | 0.600 | |||
Next $3 billion | 0.590 | |||
Next $2 billion | 0.565 | |||
Next $2 billion | 0.555 | |||
Next $4 billion | 0.530 | |||
Over $16 billion | 0.505 | |||
For the year ended July 31, 2020, the management fee was equivalent to an annual rate of 0.69% of the Fund’s average daily net assets.
Funds Management has retained the services of a subadviser to provide daily portfolio management to the Fund. The fee for subadvisory services is borne by Funds Management. Wells Capital Management Incorporated (“WellsCap), an affiliate of
Wells Fargo Classic Value Fund | 25
Table of Contents
Notes to financial statements
Funds Management and an indirect wholly owned subsidiary of Wells Fargo, is the subadviser to the Fund and is entitled to receive a fee from Funds Management at an annual rate starting at 0.35% and declining to 0.25% as the average daily net assets of the Fund increase.
Administration fees
Under a class-level administration agreement, Funds Management provides class-level administrative services to the Fund, which includes paying fees and expenses for services provided by the transfer agent, sub-transfer agents, omnibus account servicers and record-keepers. As compensation for its services under the class-level administration agreement, Funds Management receives an annual fee which is calculated based on the average daily net assets of each class as follows:
| Class-level administration fee | ||||
Class A, Class C, Class R | 0.21 | % | ||
Class R6 | 0.03 | |||
Administrator Class, Institutional Class | 0.13 | |||
Waivers and/or expense reimbursements
Funds Management has contractually waived and/or reimbursed management and administration fees to the extent necessary to maintain certain net operating expense ratios for the Fund. When each class of the Fund has exceeded its expense cap, Funds Management has waived fees and/or reimbursed expenses from fund-level expenses on a proportionate basis and then from class specific expenses. When only certain classes exceed their expense caps, waivers and/or reimbursements are applied against class specific expenses before fund-level expenses. Funds Management has committed through November 30, 2020 to waive fees and/or reimburse expenses to the extent necessary to cap the Fund’s expenses at 1.11% for Class A shares, 1.86% for Class C shares, 1.36% for Class R shares, 0.65% for Class R6 shares, 0.95% for Administrator Class shares, and 0.70% for Institutional Class shares. Prior to or after the commitment expiration date, the cap may be increased or the commitment to maintain the cap may be terminated only with the approval of the Board of Trustees.
Distribution fees
The Trust has adopted a distribution plan for Class C and Class R shares of the Fund pursuant to Rule 12b-1 under the 1940 Act. Distribution fees are charged to Class C and Class R shares and paid to Wells Fargo Funds Distributor, LLC (“Funds Distributor”), the principal underwriter, at an annual rate of 0.75% of the average daily net assets of Class C shares and 0.25% of the average daily net assets of Class R shares.
In addition, Funds Distributor is entitled to receive the front-end sales charge from the purchase of Class A shares and a contingent deferred sales charge on the redemption of certain Class A shares. Funds Distributor is also entitled to receive the contingent deferred sales charges from redemptions of Class C shares. For the year ended July 31, 2020, Funds Distributor received $5,320 from the sale of Class A shares. No contingent deferred sales charges were incurred by Class A and Class C shares for the year ended July 31, 2020.
Shareholder servicing fees
The Trust has entered into contracts with one or more shareholder servicing agents, whereby Class A, Class C, Class R, and Administrator Class of the Fund are charged a fee at an annual rate of 0.25% of the average daily net assets of each respective class. A portion of these total shareholder servicing fees were paid to affiliates of Wells Fargo.
Interfund transactions
The Fund may purchase or sell portfolio investment securities to certain other Wells Fargo affiliates pursuant to Rule 17a-7 under the 1940 Act and under procedures adopted by the Board of Trustees. The procedures have been designed to ensure that these interfund transactions, which do not incur broker commissions, are effected at current market prices.
5. INVESTMENT PORTFOLIO TRANSACTIONS
Purchases and sales of investments, excluding U.S. government obligations (if any) and short-term securities, for the year ended July 31, 2020 were $265,482,611 and $343,027,070, respectively.
6. SECURITIES LENDING TRANSACTIONS
The Fund lends its securities through an unaffiliated securities lending agent and receives collateral in the form of cash or securities with a value at least equal to the value of the securities on loan. The value of the loaned securities is determined at the close of each business day and any increases or decreases in the required collateral are exchanged between the Fund and the
counterparty on the next business day. Cash collateral received is invested in the Securities Lending Fund which seeks to
26 | Wells Fargo Classic Value Fund
Table of Contents
Notes to financial statements
provide a positive return compared to the daily Federal Funds Open Rate by investing in high-quality, U.S. dollar-denominated short-term money market instruments and is exempt from registration under Section 3(c)(7) of the 1940 Act. Securities Lending Fund is managed by Funds Management and is subadvised by WellsCap. Funds Management receives an advisory fee starting at 0.05% and declining to 0.01% as the average daily net assets of the Securities Lending Fund increase. All of the fees received by Funds Management are paid to WellsCap for its services as subadviser.
In the event of counterparty default or the failure of a borrower to return a loaned security, the Fund has the right to use the collateral to offset any losses incurred. As of July 31, 2020, the Fund did not have any securities on loan.
7. BORROWINGS
The Trust (excluding the money market funds), Wells Fargo Master Trust and Wells Fargo Variable Trust are parties to a $350,000,000 revolving credit agreement whereby the Fund is permitted to use bank borrowings for temporary or emergency purposes, such as to fund shareholder redemption requests. Interest under the credit agreement is charged to the Fund based on a borrowing rate equal to the higher of the Federal Funds rate in effect on that day plus 1.25% or the overnight LIBOR rate in effect on that day plus 1.25%. In addition, an annual commitment fee equal to 0.25% of the unused balance is allocated to each participating fund.
For the year ended July 31, 2020, there were no borrowings by the Fund under the agreement.
8. DISTRIBUTIONS TO SHAREHOLDERS
The tax character of distributions paid during the years ended July 31, 2020 and July 31, 2019 were as follows:
| Year ended July 31 | ||||||||
| 2020 | 2019 | |||||||
Ordinary income | $ | 9,299,522 | $ | 9,595,122 | ||||
Long-term capital gain | 76,325,017 | 55,186,402 | ||||||
As of July 31, 2020, the components of distributable earnings on a tax basis were as follows:
| Undistributed ordinary income | Post-October capital losses deferred | Unrealized gains | ||
| $8,371,285 | $(12,286,649) | $152,055,954 | ||
9. INDEMNIFICATION
Under the Fund’s organizational documents, the officers and Trustees have been granted certain indemnification rights against certain liabilities that may arise out of performance of their duties to the Fund. The Fund has entered into a separate agreement with each Trustee that converts indemnification rights currently existing under the Fund’s organizational documents into contractual rights that cannot be changed in the future without the consent of the Trustee. Additionally, in the normal course of business, the Fund may enter into contracts with service providers that contain a variety of indemnification clauses. The Fund’s maximum exposure under these arrangements is dependent on future claims that may be made against the Fund and, therefore, cannot be estimated.
10. NEW ACCOUNTING PRONOUNCEMENT
In August 2018, FASB issued Accounting Standards Update (“ASU”) No. 2018-13, Fair Value Measurement (Topic 820) Disclosure Framework—Changes to the Disclosure Requirements for Fair Value Measurement. ASU 2018-13 updates the disclosure requirements on fair value measurements in Topic 820, Fair Value Measurements. The amendments are effective for fiscal years, and interim periods within those fiscal years, beginning after December 15, 2019. Management has adopted this guidance which did not have a material impact on the financial statements.
11. CORONAVIRUS (COVID-19) PANDEMIC
On March 11, 2020, the World Health Organization announced that it had made the assessment that coronavirus disease 2019 (“COVID-19”) is a pandemic. The impacts of COVID-19 are adversely affecting the entire global economy, individual companies and investment products, and the market in general. There is significant uncertainty around the extent and duration of business
disruptions related to COVID-19 and the impacts may be short term or may last for an extended period of time. The risk of further spreading of COVID-19 has led to significant uncertainty and volatility in the financial markets.
Wells Fargo Classic Value Fund | 27
Table of Contents
Report of independent registered public accounting firm
To the Shareholders of the Fund and Board of Trustees
Wells Fargo Funds Trust:
Opinion on the Financial Statements
We have audited the accompanying statement of assets and liabilities of Wells Fargo Classic Value Fund (the Fund), one of the funds constituting Wells Fargo Funds Trust, including the portfolio of investments, as of July 31, 2020, the related statement of operations for the year then ended, the statements of changes in net assets for each of the years in the two-year period then ended, and the related notes (collectively, the financial statements) and the financial highlights for each of the years in the five-year period then ended. In our opinion, the financial statements and financial highlights present fairly, in all material respects, the financial position of the Fund as of July 31, 2020, the results of its operations for the year then ended, the changes in its net assets for each of the years in the two-year period then ended, and the financial highlights for each of the years in the five-year period then ended, in conformity with U.S. generally accepted accounting principles.
Basis for Opinion
These financial statements and financial highlights are the responsibility of the Fund’s management. Our responsibility is to express an opinion on these financial statements and financial highlights based on our audits. We are a public accounting firm registered with the Public Company Accounting Oversight Board (United States) (PCAOB) and are required to be independent with respect to the Fund in accordance with the U.S. federal securities laws and the applicable rules and regulations of the Securities and Exchange Commission and the PCAOB.
We conducted our audits in accordance with the standards of the PCAOB. Those standards require that we plan and perform the audit to obtain reasonable assurance about whether the financial statements and financial highlights are free of material misstatement, whether due to error or fraud. Our audits included performing procedures to assess the risks of material misstatement of the financial statements and financial highlights, whether due to error or fraud, and performing procedures that respond to those risks. Such procedures included examining, on a test basis, evidence regarding the amounts and disclosures in the financial statements and financial highlights. Such procedures also included confirmation of securities owned as of July 31, 2020, by correspondence with the custodian, transfer agent and brokers, or by other appropriate auditing procedures. Our audits also included evaluating the accounting principles used and significant estimates made by management, as well as evaluating the overall presentation of the financial statements and financial highlights. We believe that our audits provide a reasonable basis for our opinion.

We have not been able to determine the specific year that we began serving as the auditor of one or more Wells Fargo Funds investment companies; however we are aware that we have served as the auditor of one or more Wells Fargo Funds investment companies since at least 1955.
Boston, Massachusetts
September 25, 2020
28 | Wells Fargo Classic Value Fund
Table of Contents
TAX INFORMATION
For corporate shareholders, pursuant to Section 854 of the Internal Revenue Code, 100% of ordinary income dividends qualify for the corporate dividends-received deduction for the fiscal year ended July 31, 2020.
Pursuant to Section 852 of the Internal Revenue Code, $76,325,017 was designated as a 20% rate gain distribution for the fiscal year ended July 31, 2020.
Pursuant to Section 854 of the Internal Revenue Code, $9,299,522 of income dividends paid during the fiscal year ended July 31, 2020 has been designated as qualified dividend income (QDI).
For the fiscal year ended July 31, 2020, $111,585 has been designated as interest-related dividends for nonresident alien shareholders pursuant to Section 871 of the Internal Revenue Code.
For the fiscal year ended July 31, 2020, $679,908 has been designated as short-term capital gain dividends for nonresident alien shareholders pursuant to Section 871 of the Internal Revenue Code.
PROXY VOTING INFORMATION
A description of the policies and procedures used to determine how to vote proxies relating to portfolio securities is available, upon request, by calling 1-800-222-8222, visiting our website at wfam.com, or visiting the SEC website at sec.gov. Information regarding how the proxies related to portfolio securities were voted during the most recent 12-month period ended June 30 is available on the website at wfam.com or by visiting the SEC website at sec.gov.
QUARTERLY PORTFOLIO HOLDINGS INFORMATION
The Fund files its complete schedule of portfolio holdings with the SEC for the first and third quarters of each fiscal year as an exhibit to its reports on Form N-PORT. Shareholders may view the filed Form N-PORT by visiting the SEC website at sec.gov.
Wells Fargo Classic Value Fund | 29
Table of Contents
Other information (unaudited)
BOARD OF TRUSTEES AND OFFICERS
Each of the Trustees and Officers1 listed in the table below acts in identical capacities for each fund in the Wells Fargo family of funds, which consists of 147 mutual funds comprising the Wells Fargo Funds Trust, Wells Fargo Variable Trust, Wells Fargo Master Trust and four closed-end funds (collectively the “Fund Complex”). This table should be read in conjunction with the Prospectus and the Statement of Additional Information2. The mailing address of each Trustee and Officer is 525 Market Street, 12th Floor, San Francisco, CA 94105. Each Trustee and Officer serves an indefinite term, however, each Trustee serves such term until reaching the mandatory retirement age established by the Trustees.
Independent Trustees
| Name and year of birth | Position held and length of service* | Principal occupations during past five years or longer | Current other public company or investment company directorships | |||
| William R. Ebsworth (Born 1957) | Trustee, since 2015 | Retired. From 1984 to 2013, equities analyst, portfolio manager, research director and chief investment officer at Fidelity Management and Research Company in Boston, Tokyo, and Hong Kong, and retired in 2013 as Chief Investment Officer of Fidelity Strategic Advisers, Inc. where he led a team of investment professionals managing client assets. Prior thereto, Board member of Hong Kong Securities Clearing Co., Hong Kong Options Clearing Corp., the Thailand International Fund, Ltd., Fidelity Investments Life Insurance Company, and Empire Fidelity Investments Life Insurance Company. Audit Committee Chair and Investment Committee Chair of the Vincent Memorial Hospital Endowment (non-profit organization). Mr. Ebsworth is a CFA® charterholder. | N/A | |||
| Jane A. Freeman (Born 1953) | Trustee, since 2015; Chair Liaison, since 2018 | Retired. From 2012 to 2014 and 1999 to 2008, Chief Financial Officer of Scientific Learning Corporation. From 2008 to 2012, Ms. Freeman provided consulting services related to strategic business projects. Prior to 1999, Portfolio Manager at Rockefeller & Co. and Scudder, Stevens & Clark. Board member of the Harding Loevner Funds from 1996 to 2014, serving as both Lead Independent Director and chair of the Audit Committee. Board member of the Russell Exchange Traded Funds Trust from 2011 to 2012 and the chair of the Audit Committee. Ms. Freeman is also an inactive Chartered Financial Analyst. | N/A | |||
| Isaiah Harris, Jr. (Born 1952) | Trustee, since 2009; Audit Committee Chairman, since 2019 | Retired. Chairman of the Board of CIGNA Corporation since 2009, and Director since 2005. From 2003 to 2011, Director of Deluxe Corporation. Prior thereto, President and CEO of BellSouth Advertising and Publishing Corp. from 2005 to 2007, President and CEO of BellSouth Enterprises from 2004 to 2005 and President of BellSouth Consumer Services from 2000 to 2003. Emeritus member of the Iowa State University Foundation Board of Governors. Emeritus Member of the Advisory Board of Iowa State University School of Business. Advisory Board Member, Palm Harbor Academy (private school). Advisory Board Member, Child Evangelism Fellowship (non-profit). Mr. Harris is a certified public accountant (inactive status). | CIGNA Corporation | |||
| Judith M. Johnson (Born 1949) | Trustee, since 2008; Audit Committee Chairman, from 2009 to 2018 | Retired. Prior thereto, Chief Executive Officer and Chief Investment Officer of Minneapolis Employees Retirement Fund from 1996 to 2008. Ms. Johnson is an attorney, certified public accountant and a certified managerial accountant. | N/A | |||
30 | Wells Fargo Classic Value Fund
Table of Contents
Other information (unaudited)
| Name and year of birth | Position held and length of service* | Principal occupations during past five years or longer | Current other public company or investment company directorships | |||
| David F. Larcker (Born 1950) | Trustee, since 2009 | James Irvin Miller Professor of Accounting at the Graduate School of Business, Stanford University, Director of the Corporate Governance Research Initiative and Senior Faculty of The Rock Center for Corporate Governance since 2006. From 2005 to 2008, Professor of Accounting at the Graduate School of Business, Stanford University. Prior thereto, Ernst & Young Professor of Accounting at The Wharton School, University of Pennsylvania from 1985 to 2005. | N/A | |||
| Olivia S. Mitchell (Born 1953) | Trustee, since 2006; Nominating and Governance Committee Chair, since 2018 | International Foundation of Employee Benefit Plans Professor, Wharton School of the University of Pennsylvania since 1993. Director of Wharton’s Pension Research Council and Boettner Center on Pensions & Retirement Research, and Research Associate at the National Bureau of Economic Research. Previously, Cornell University Professor from 1978 to 1993. | N/A | |||
| Timothy J. Penny (Born 1951) | Trustee, since 1996; Chairman, since 2018 | President and Chief Executive Officer of Southern Minnesota Initiative Foundation, a non-profit organization, since 2007. Member of the Board of Trustees of NorthStar Education Finance, Inc., a non-profit organization, since 2007. | N/A | |||
| James G. Polisson (Born 1959) | Trustee, since 2018 | Retired. Chief Marketing Officer, Source (ETF) UK Services, Ltd, from 2015 to 2017. From 2012 to 2015, Principal of The Polisson Group, LLC, a management consulting, corporate advisory and principal investing company. Chief Executive Officer and Managing Director at Russell Investments, Global Exchange Traded Funds from 2010 to 2012. Managing Director of Barclays Global Investors from 1998 to 2010 and Global Chief Marketing Officer for iShares and Barclays Global Investors from 2000 to 2010. Trustee of the San Francisco Mechanics’ Institute, a non-profit organization, from 2013 to 2015. Board member of the Russell Exchange Traded Fund Trust from 2011 to 2012. Director of Barclays Global Investors Holdings Deutschland GmbH from 2006 to 2009. Mr. Polisson is an attorney and has a retired status with the Massachusetts and District of Columbia Bar Associations. | N/A | |||
| Pamela Wheelock (Born 1959) | Trustee, since January 2020; previously Trustee from January 2018 to July 2019 | Board member of the Destination Medical Center Economic Development Agency, Rochester, Minnesota since 2019 and Interim President of the McKnight Foundation since 2020. Acting Commissioner, Minnesota Department of Human Services, July 2019 through September 2019. Human Services Manager (part-time), Minnesota Department of Human Services, October 2019 through December 2019. Chief Operating Officer, Twin Cities Habitat for Humanity from 2017 to 2019. Vice President of University Services, University of Minnesota from 2012 to 2016. Prior thereto, on the Board of Directors, Governance Committee and Finance Committee for the Minnesota Philanthropy Partners (Saint Paul Foundation) from 2012 to 2018, Interim Chief Executive Officer of Blue Cross Blue Shield of Minnesota from 2011 to 2012, Chairman of the Board from 2009 to 2012 and Board Director from 2003 to 2015. Vice President, Leadership and Community Engagement, Bush Foundation, Saint Paul, Minnesota (a private foundation) from 2009 to 2011. Executive Vice President and Chief Financial Officer, Minnesota Sports and Entertainment from 2004 to 2009 and Senior Vice President from 2002 to 2004. Executive Vice President of the Minnesota Wild Foundation from 2004 to 2008. Commissioner of Finance, State of Minnesota, from 1999 to 2002. Currently Board Chair of the Minnesota Wild Foundation since 2010. | N/A | |||
| * | Length of service dates reflect the Trustee’s commencement of service with the Trust’s predecessor entities, where applicable. |
Wells Fargo Classic Value Fund | 31
Table of Contents
Other information (unaudited)
Officers
| Name and year of birth | Position held and length of service | Principal occupations during past five years or longer | ||
| Andrew Owen (Born 1960) | President, since 2017 | Executive Vice President of Wells Fargo & Company and Head of Affiliated Managers, Wells Fargo Asset Management, since 2014. In addition, Mr. Owen is currently President, Chief Executive Officer and Director of Wells Fargo Funds Management, LLC since 2017. Prior thereto, Executive Vice President responsible for marketing, investments and product development for Wells Fargo Funds Management, LLC, from 2009 to 2014. | ||
| Jeremy DePalma1 (Born 1974) | Treasurer, since 2012 | Senior Vice President of Wells Fargo Funds Management, LLC since 2009. Senior Vice President of Evergreen Investment Management Company, LLC from 2008 to 2010 and head of the Fund Reporting and Control Team within Fund Administration from 2005 to 2010. | ||
| Michelle Rhee (Born 1966) | Chief Legal Officer, since 2019 | Secretary of Wells Fargo Funds Management, LLC, Chief Legal Counsel of Wells Fargo Asset Management and Assistant General Counsel of Wells Fargo Bank, N.A. since 2018. Associate General Counsel and Managing Director of Bank of America Corporation from 2004 to 2018. | ||
| Catherine Kennedy (Born 1969) | Secretary, since 2019 | Vice President of Wells Fargo Funds Management, LLC and Senior Counsel of the Wells Fargo Legal Department since 2010. Vice President and Senior Counsel of Evergreen Investment Management Company, LLC from 1998 to 2010. | ||
| Michael H. Whitaker (Born 1967) | Chief Compliance Officer, since 2016 | Chief Compliance Officer of Wells Fargo Asset Management since 2016. Senior Vice President and Chief Compliance Officer for Fidelity Investments from 2007 to 2016. | ||
| David Berardi (Born 1975) | Assistant Treasurer, since 2009 | Vice President of Wells Fargo Funds Management, LLC since 2009. Vice President of Evergreen Investment Management Company, LLC from 2008 to 2010. Manager of Fund Reporting and Control for Evergreen Investment Management Company, LLC from 2004 to 2010. | ||
| 1 | Jeremy DePalma acts as Treasurer of 82 funds and Assistant Treasurer of 65 funds in the Fund Complex. |
| 2 | The Statement of Additional Information includes additional information about the Trustees and is available, without charge, upon request, by calling 1-800-222-8222 or by visiting the website at wfam.com. |
32 | Wells Fargo Classic Value Fund
Table of Contents
Other information (unaudited)
BOARD CONSIDERATION OF INVESTMENT MANAGEMENT AND SUB-ADVISORY AGREEMENTS:
Wells Fargo Classic Value Fund
Under the Investment Company Act of 1940 (the “1940 Act”), the Board of Trustees (the “Board”) of Wells Fargo Funds Trust (the “Trust”) must determine annually whether to approve the continuation of the Trust’s investment management and sub-advisory agreements. In this regard, at a Board meeting held on May 26, 2020 and May 28, 2020 (together, the “Meeting”), the Board, all the members of which have no direct or indirect interest in the investment management and sub-advisory agreements and are not “interested persons” of the Trust, as defined in the 1940 Act (the “Independent Trustees”), reviewed and approved for Wells Fargo Classic Value Fund (the “Fund”): (i) an investment management agreement (the “Management Agreement”) with Wells Fargo Funds Management, LLC (“Funds Management”); and (ii) an investment sub-advisory agreement (the “Sub-Advisory Agreement”) with Wells Capital Management Incorporated (the “Sub-Adviser”), an affiliate of Funds Management. The Management Agreement and the Sub-Advisory Agreement are collectively referred to as the “Advisory Agreements.”
At the Meeting, the Board considered the factors and reached the conclusions described below relating to the selection of Funds Management and the Sub-Adviser and the approval of the Advisory Agreements. Prior to the Meeting, including at a Board meeting held in April 2020, the Trustees conferred extensively among themselves and with representatives of Funds Management about these matters. Also, the Board has adopted a team-based approach, with each team consisting of a sub-set of Trustees, to assist the full Board in the discharge of its duties in reviewing investment performance and other matters throughout the year. The Independent Trustees were assisted in their evaluation of the Advisory Agreements by independent legal counsel, from whom they received separate legal advice and with whom they met separately.
In providing information to the Board, Funds Management and the Sub-Adviser were guided by a detailed set of requests for information submitted to them by independent legal counsel on behalf of the Independent Trustees at the start of the Board’s annual contract renewal process earlier in 2020. In considering and approving the Advisory Agreements, the Trustees considered the information they believed relevant, including but not limited to the information discussed below. The Board considered not only the specific information presented in connection with the Meeting, but also the knowledge gained over time through interaction with Funds Management and the Sub-Adviser about various topics. In this regard, the Board reviewed reports of Funds Management at each of its quarterly meetings, which included, among other things, portfolio reviews and investment performance reports. In addition, the Board and the teams mentioned above confer with portfolio managers at various times throughout the year. The Board did not identify any particular information or consideration that was all-important or controlling, and each individual Trustee may have attributed different weights to various factors.
After its deliberations, the Board unanimously approved the continuation of the Advisory Agreements for a one-year term and determined that the compensation payable to Funds Management and the Sub-Adviser under each of the Advisory Agreements was reasonable. The Board considered the approval of the Advisory Agreements for the Fund as part of its consideration of agreements for funds across the complex, but its approvals were made on a fund-by-fund basis. The following summarizes a number of important, but not necessarily all, factors considered by the Board in support of its approvals.
Nature, extent and quality of services
The Board received and considered various information regarding the nature, extent and quality of services provided to the Fund by Funds Management and the Sub-Adviser under the Advisory Agreements. This information included a description of the investment advisory services and Fund-level administrative services covered by the Management Agreement, as well as, among other things, a summary of the background and experience of senior management of Wells Fargo Asset Management (“WFAM”), of which Funds Management and the Sub-Adviser are a part, and a summary of investments made in the business of WFAM. The Board also received a description of Funds Management’s and the Sub-Adviser’s business continuity plans and of their approaches to data privacy and cybersecurity, and related testing. The Board also received and reviewed information about Funds Management’s role as administrator of the Fund’s liquidity risk management program, Funds Management’s approach to risk management, and Funds Management’s intermediary and vendor oversight program.
The Board also considered the qualifications, background, tenure and responsibilities of each of the portfolio managers primarily responsible for the day-to-day portfolio management of the Fund. The Board evaluated the ability of Funds Management and the Sub-Adviser to attract and retain qualified investment professionals, including research, advisory and supervisory personnel. The Board further considered the compliance programs and compliance records of Funds Management and the Sub-Adviser. In addition, the Board took into account the full range of services provided to the Fund by Funds Management and its affiliates.
Wells Fargo Classic Value Fund | 33
Table of Contents
Other information (unaudited)
Fund investment performance and expenses
The Board considered the investment performance results for the Fund over various time periods ended December 31, 2019. The Board also considered more current results for various time periods ended March 31, 2020. The Board considered these results in comparison to the investment performance of funds in a universe that was determined by Broadridge Inc. (“Broadridge”) to be similar to the Fund (the “Universe”), and in comparison to the Fund’s benchmark index and to other comparative data. Broadridge is an independent provider of investment company data. The Board received a description of the methodology used by Broadridge to select the mutual funds in the performance Universe. The Board noted that the investment performance of the Fund (Class A) was higher than the average investment performance of the Universe for the one-, three-, five- and ten-year periods ended December 31, 2019. The Board also noted that the investment performance of the Fund (Administrator Class) was higher than the average investment performance of the Universe for all periods ended March 31, 2020. The Board also noted that the investment performance of the Fund was higher than or in range of its benchmark index, the Russell 1000® Value Index, for all periods ended December 31, 2019. The Board also noted that the investment performance of the Fund was higher than its benchmark index, the Russell 1000® Value Index, for all periods ended March 31, 2020.
The Board also received and considered information regarding the Fund’s net operating expense ratios and their various components, including actual management fees, custodian and other non-management fees, and Rule 12b-1 and non-Rule 12b-1 shareholder service fees. The Board considered these ratios in comparison to the median ratios of funds in class-specific expense groups that were determined by Broadridge to be similar to the Fund (the “Groups”). The Board received a description of the methodology used by Broadridge to select the mutual funds in the expense Groups and an explanation of how funds comprising expense groups and their expense ratios may vary from year-to-year. Based on the Broadridge reports, the Board noted that the net operating expense ratios of the Fund were lower than or equal to the median net operating expense ratios of the expense Groups for all share classes.
The Board took into account the Fund’s investment performance and expense information provided to it among the factors considered in deciding to re-approve the Advisory Agreements.
Investment management and sub-advisory fee rates
The Board reviewed and considered the contractual fee rates payable by the Fund to Funds Management under the Management Agreement, as well as the contractual fee rates payable by the Fund to Funds Management for class-level administrative services under a Class-Level Administration Agreement, which include, among other things, class-level transfer agency and sub-transfer agency costs (collectively, the “Management Rates”). The Board also reviewed and considered the contractual investment sub-advisory fee rates that are payable by Funds Management to the Sub-Adviser for investment sub-advisory services.
Among other information reviewed by the Board was a comparison of the Fund’s Management Rates with the average contractual investment management fee rates of funds in the expense Groups at a common asset level as well as transfer agency costs of the funds in the expense Groups. The Board noted that the Management Rates of the Fund were in range of the sum of these average rates for the Fund’s expense Groups for all share classes, except Class A. The Board also noted that the net operating expense ratios of the Fund were lower than or equal to the median net operating expense ratios of the expense Groups for all share classes.
The Board also received and considered information about the portion of the total management fee that was retained by Funds Management after payment of the fee to the Sub-Adviser for sub-advisory services. In assessing the reasonableness of this amount, the Board received and evaluated information about the nature and extent of responsibilities retained and risks assumed by Funds Management and not delegated to or assumed by the Sub-Adviser, and about Funds Management’s on-going oversight services. Given the affiliation between Funds Management and the Sub-Adviser, the Board ascribed limited relevance to the allocation of fees between them.
The Board also received and considered information about the nature and extent of services offered and fee rates charged by Funds Management and the Sub-Adviser to other types of clients with investment strategies similar to those of the Fund. In this regard, the Board received information about the significantly greater scope of services, and compliance, reporting and other legal burdens and risks of managing proprietary mutual funds compared with those associated with managing assets of other types of clients, including third-party sub-advised fund clients and non-mutual fund clients such as institutional separate accounts.
Based on its consideration of the factors and information it deemed relevant, including those described here, the Board determined that the compensation payable to Funds Management under the Management Agreement and to the Sub-Adviser under the Sub-Advisory Agreement was reasonable.
34 | Wells Fargo Classic Value Fund
Table of Contents
Other information (unaudited)
Profitability
The Board received and considered information concerning the profitability of Funds Management, as well as the profitability of both WFAM and Wells Fargo & Co. (“Wells Fargo”) from providing services to the fund family as a whole. The Board noted that the Sub-Adviser’s profitability information with respect to providing services to the Fund and other funds in the family was subsumed in the WFAM and Wells Fargo profitability analysis.
Funds Management reported on the methodologies and estimates used in calculating profitability, including a description of the methodology used to allocate certain expenses. Among other things, the Board noted that the levels of profitability reported on a fund-by-fund basis varied widely, depending on factors such as the size, type and age of fund.
Based on its review, the Board did not deem the profits reported by Funds Management, WFAM or Wells Fargo from services provided to the Fund to be at a level that would prevent it from approving the continuation of the Advisory Agreements.
Economies of scale
The Board received and considered information about the potential for Funds Management to experience economies of scale in the provision of management services to the Fund, the difficulties of calculating economies of scale at an individual fund level, and the extent to which potential scale benefits are shared with shareholders. The Board noted the existence of breakpoints in the Fund’s management fee structure, which operate generally to reduce the Fund’s expense ratios as the Fund grows in size, and the size of the Fund in relation to such breakpoints. The Board considered that in addition to management fee breakpoints, Funds Management shares potential economies of scale from its management business in a variety of ways, including through fee waiver and expense reimbursement arrangements, services that benefit shareholders, competitive management fee rates set at the outset without regard to breakpoints, and investments in the business intended to enhance services available to shareholders.
The Board concluded that Funds Management’s arrangements with respect to the Fund, including contractual breakpoints, constituted a reasonable approach to sharing potential economies of scale with the Fund and its shareholders.
Other benefits to Funds Management and the Sub-Adviser
The Board received and considered information regarding potential “fall-out” or ancillary benefits received by Funds Management and its affiliates, including the Sub-Adviser, as a result of their relationships with the Fund. Ancillary benefits could include, among others, benefits directly attributable to other relationships with the Fund and benefits potentially derived from an increase in Funds Management’s and the Sub-Adviser’s business as a result of their relationships with the Fund. The Board noted that various affiliates of Funds Management may receive distribution-related fees, shareholder servicing payments and sub-transfer agency fees in respect of shares sold or held through them and services provided.
The Board also reviewed information about soft dollar credits earned and utilized by the Sub-Adviser, fees earned by Funds Management and the Sub-Adviser from managing a private investment vehicle for the fund family’s securities lending collateral, and commissions earned by an affiliated broker from portfolio transactions.
Based on its consideration of the factors and information it deemed relevant, including those described here, the Board did not find that any ancillary benefits received by Funds Management and its affiliates, including the Sub-Adviser, were unreasonable.
Conclusion
At the Meeting, after considering the above-described factors and based on its deliberations and its evaluation of the information described above, the Board unanimously approved the continuation of the Advisory Agreements for a one-year term and determined that the compensation payable to Funds Management and the Sub-Adviser under each of the Advisory Agreements was reasonable.
Wells Fargo Classic Value Fund | 35
Table of Contents
Other information (unaudited)
LIQUIDITY RISK MANAGEMENT PROGRAM
In accordance with Rule 22e-4 under the Investment Company Act of 1940, as amended (the “Liquidity Rule”), Wells Fargo Funds Trust (the “Trust”) has adopted and implemented a liquidity risk management program (the “Program”) on behalf of each of its series, including the Fund, which is reasonably designed to assess and manage the Fund’s liquidity risk. “Liquidity risk” is defined as the risk that the Fund is unable to meet redemption requests without significantly diluting remaining investors’ interests in the Fund. The Trust’s Board of Trustees (the “Board”) previously approved the designation of Wells Fargo Funds Management, LLC (“Funds Management”), the Fund’s investment manager, as the administrator of the Program, and Funds Management has established a Liquidity Risk Management Council composed of personnel from multiple departments within Funds Management and its affiliates to assist Funds Management in the implementation and on-going administration of the Program.
The Program is comprised of various components designed to support the assessment and/or management of liquidity risk, including: (1) the periodic assessment (no less frequently than annually) of certain factors that influence the Fund’s liquidity risk; (2) the periodic classification (no less frequently than monthly) of the Fund’s investments into one of four liquidity categories that reflect an estimate of their liquidity under current market conditions; (3) a 15% limit on the acquisition of “illiquid investments” (as defined under the Liquidity Rule); (4) to the extent the Fund does not invest primarily in “highly liquid investments” (as defined under the Liquidity Rule), the determination of a minimum percentage of the Fund’s assets that generally will be invested in highly liquid investments (an “HLIM”); (5) if the Fund has established an HLIM, the periodic review (no less frequently than annually) of the HLIM and the adoption of policies and procedures for responding to a shortfall of the Fund’s “highly liquid investments” below its HLIM; and (6) periodic reporting to the Board.
At a meeting of the Board held on May 26 and 28, 2020, the Board received a written report (the “Report”) from Funds Management that addressed the operation of the Program and assessed its adequacy and effectiveness of implementation. The Report covered the initial period from December 1, 2018 through December 31, 2019 (the “Reporting Period”). No significant liquidity events impacting the Fund were noted in the Report. There were no material changes to the Program during the Reporting Period. The Report concluded that the Program is operating effectively to assess and manage the Fund’s liquidity risk, and that the Program has been and continues to be adequately and effectively implemented to monitor and, as applicable, respond to the Fund’s liquidity developments.
There can be no assurance that the Program will achieve its objectives under all circumstances in the future. Please refer to the Fund’s prospectus for more information regarding the Fund’s exposure to liquidity risk and other risks to which an investment in the Fund may be subject.
36 | Wells Fargo Classic Value Fund
Table of Contents
Effective on or after May 1, 2020, clients of Edward Jones (also referred to as “shareholders”) purchasing Fund shares on the Edward Jones commission and fee-based platforms are eligible only for the following sales charge discounts (also referred to as “breakpoints”) and waivers, which can differ from breakpoints and waivers described elsewhere in the Fund’s Prospectus or SAI or through another broker-dealer. In all instances, it is the shareholder’s responsibility to inform Edward Jones at the time of purchase of any relationship, holdings of Wells Fargo Funds or other facts qualifying the purchaser for breakpoints or waivers. Edward Jones can ask for documentation of such circumstance.
| Breakpoints available at Edward Jones |
| Rights of Accumulation (ROA) |
The applicable sales charge on a purchase of Class A shares is determined by taking into account all share classes (except any money market funds and retirement plan share classes) of Wells Fargo Funds held by the shareholder or in an account grouped by Edward Jones with other accounts for the purpose of providing certain pricing considerations (“pricing groups”). This includes all share classes held on the Edward Jones platform and/or held on another platform. The inclusion of eligible fund family assets in the rights of accumulation calculation is dependent on the shareholder notifying his or her financial advisor of such assets at the time of calculation. |
ROA is determined by calculating the higher of cost or market value (current shares x NAV). |
| Letter of Intent (LOI) |
Through a LOI, shareholders can receive the sales charge and breakpoint discounts for purchases shareholders intend to makeover a 13-month period from the date Edward Jones receives the LOI. The LOI is determined by calculating the higher of cost or market value of qualifying holdings at LOI initiation in combination with the value that the shareholder intends to buy over a 13-month period to calculate the front-end sales charge and any breakpoint discounts. Each purchase the shareholder makes during that 13-month period will receive the sales charge and breakpoint discount that applies to the total amount. The inclusion of eligible fund family assets in the LOI calculation is dependent on the shareholder notifying his or her financial advisor of such assets at the time of calculation. Purchases made before the LOI is received by Edward Jones are not covered under the LOI and will not reduce the sales charge previously paid. Sales charges will be adjusted if LOI is not met. |
| Sales charges are waived for the following shareholders and in the following situations at Edward Jones: |
● Associates of Edward Jones and its affiliates and their family members who are in the same pricing group (as determined by Edward Jones under its policies and procedures) as the associate. This waiver will continue for the remainder of the associate’s life if the associate retires from Edward Jones in good-standing. |
● Shares purchased in an Edward Jones fee-based program. |
● Shares purchased through reinvestment of capital gains distributions and dividend reinvestment. |
● Shares purchased from the proceeds of redeemed shares of the same fund family so long as the following conditions are met: 1) the proceeds are from the sale of shares within 60 days of the purchase, and 2) the sale and purchase are made in the same share class and the same account or the purchase is made in an individual retirement account with proceeds from liquidations in anon-retirement account. |
● Shares exchanged into Class A shares from another share class so long as the exchange is into the same fund and was initiated at the discretion of Edward Jones. Edward Jones is responsible for any remaining CDSC due to the fund company, if applicable. Any future purchases are subject to the applicable sales charge as disclosed in the prospectus. |
● Exchanges from Class C shares to Class A shares of the same fund, generally, in the 84th month following the anniversary of the purchase date or earlier at the discretion of Edward Jones. |
| If the shareholder purchases shares that are subject to a CDSC and those shares are redeemed before the CDSC is expired, the shareholder is responsible to pay the CDSC except in the following conditions available at Edward Jones: |
● The death or disability of the shareholder. |
● Systematic withdrawals with up to 10% per year of the account value. |
● Return of excess contributions from an Individual Retirement Account (IRA). |
● Shares sold as part of a required minimum distribution for IRA and retirement accounts if the redemption is taken in or after the year the shareholder reaches qualified age based on applicable IRS regulation. |
● Shares sold to pay Edward Jones fees or costs in such cases where the transaction is initiated by Edward Jones. |
● Shares exchanged in an Edward Jones fee-based program. |
● Shares acquired through NAV reinstatement. |
Wells Fargo Classic Value Fund | 37
Table of Contents
Appendix I (unaudited)
| Other Important Information for accounts at Edward Jones: |
| Minimum Purchase Amounts |
● $250 initial purchase minimum |
● $50 subsequent purchase minimum |
| Minimum Balances |
| Edward Jones has the right to redeem at its discretion fund holdings with a balance of $250 or less. The following are examples of accounts that are not included in this policy: |
● A fee-based account held on an Edward Jones platform |
● A 529 account held on an Edward Jones platform |
● An account with an active systematic investment plan or letter of intent (LOI) |
| Changing Share Classes |
| At any time it deems necessary, Edward Jones has the authority to exchange at NAV a shareholder’s holdings in a fund to Class A shares. |
38 | Wells Fargo Classic Value Fund
Table of Contents
Effective June 1, 2020, shareholders purchasing Fund shares through an Oppenheimer & Co. Inc. (“Oppenheimer”) platform or account are eligible only for the following load waivers (front-end sales charge waivers and contingent deferred or back-end, sales charge waivers) and discounts, which may differ from those disclosed in the Fund’s Prospectus or SAI.
| Front-end Sales Load Waivers on Class A Shares available at Oppenheimer |
| Employer-sponsored retirement, deferred compensation and employee benefit plans (including health savings accounts) and trusts used to fund those plans, provided that the shares are not held in a commission-based brokerage account and shares are held for the benefit of the plan. |
| Shares purchased by or through a 529 Plan. |
| Shares purchased through an Oppenheimer affiliated investment advisory program. |
| Shares purchased through reinvestment of capital gains distributions and dividend reinvestment when purchasing shares of the same fund (but not any other fund within the fund family). |
| Shares purchased from the proceeds of redemptions within the same fund family, provided (1) the repurchase occurs within 90 days following the redemption, (2) the redemption and purchase occur in the same account, and (3) redeemed shares were subject to a front-end or deferred sales load (known as Rights of Restatement). |
| A shareholder in the Fund’s Class C shares will have their shares exchanged at net asset value to Class A shares (or the appropriate share class) of the Fund if the shares are no longer subject to a CDSC and the exchange is in line with the policies and procedures of Oppenheimer. |
| Employees and registered representatives of Oppenheimer or its affiliates and their family members. |
| Directors or Trustees of the Fund, and employees of the Fund’s investment adviser or any of its affiliates, as described in the Prospectus. |
| CDSC Waivers on A and C Shares available at Oppenheimer |
| Death or disability of the shareholder. |
| Shares sold as part of a systematic withdrawal plan as described in the Prospectus. |
| Return of excess contributions from an IRA Account. |
| Shares sold as part of a required minimum distribution for IRA and retirement accounts due to the shareholder reaching the qualified age based on applicable IRS regulations as described in the Prospectus. |
| Shares sold to pay Oppenheimer fees but only if the transaction is initiated by Oppenheimer. |
| Shares acquired through a right of reinstatement. |
| Front-end load Discounts Available at Oppenheimer: Breakpoints, Rights of Accumulation & Letters of Intent |
| Breakpoints as described in the Prospectus. |
| Rights of Accumulation (ROA), which entitle shareholders to breakpoint discounts, will be automatically calculated based on the aggregated holding of fund family assets held by accounts within the purchaser’s household at Oppenheimer. Eligible fund family assets not held at Oppenheimer may be included in the ROA calculation only if the shareholder notifies his or her financial advisor about such assets. |
Wells Fargo Classic Value Fund | 39
Table of Contents
Effective June 15, 2020, shareholders purchasing fund shares through a Robert W. Baird & Co. (“Baird”) platform or account will only be eligible for the following sales charge waivers (front-end sales charge waivers and CDSC waivers) and discounts, which may differ from those disclosed elsewhere in the Fund’s Prospectus or the SAI.
| Front-end Sales Load Waivers on Class A Shares available at Baird |
| Shares purchased through reinvestment of capital gains distributions and dividend reinvestment when purchasing share of the same fund. |
| Share purchase by employees and registers representatives of Baird or its affiliate and their family members as designated by Baird. |
| Shares purchase from the proceeds of redemptions within the same fund family, provided (1) the repurchase occurs within 90 days following the redemption, (2) the redemption and purchase occur in the same accounts, and (3) redeemed shares were subject to a front-end or deferred sales charge (known as rights of reinstatement). |
| A shareholder in the Funds Investor C Shares will have their share exchanged at net asset value to Investor A shares of the fund if the shares are no longer subject to CDSC and the exchange is in line with the policies and procedures of Baird. |
| Employer-sponsored retirement plans or charitable accounts in a transactional brokerage account at Baird, including 401(k) plans, 457 plans, employer-sponsored 403(b) plans, profit sharing and money purchase pension plans and defined benefit plans. For purposes of this provision, employer-sponsored retirement plans do not include SEP IRAs, Simple IRAs or SAR-SEPs. |
| CDSC Waivers on A and C Shares available at Baird |
| Shares sold due to death or disability of the shareholder. |
| Shares sold as part of a systematic withdrawal plan as described in the Fund’s Prospectus. |
| Shares bought due to returns of excess contributions from an IRA Account. |
| Shares sold as part of a required minimum distribution for IRA and retirement accounts due to the shareholder reaching age 72 as described in the Fund’s Prospectus. |
| Shares sold to pay Baird fees but only if the transaction is initiated by Baird. |
| Shares acquired through a right of reinstatement. |
| Front-end load Discounts Available at Baird: Breakpoint and/or Rights of Accumulation |
| Breakpoints as described in the Prospectus. |
| Rights of accumulations which entitles shareholders to breakpoint discounts will be automatically calculated based on the aggregated holding of fund family assets held by accounts within the purchaser’s household at Baird. Eligible fund family assets not held at Baird may be included in the rights of accumulations calculation only if the shareholder notifies his or her financial advisor about such assets. |
| Letters of Intent (LOI) allow for breakpoint discounts based on anticipated purchases within a fund family through Baird, over a 13-month period of time. |
40 | Wells Fargo Classic Value Fund
Table of Contents
For more information
More information about Wells Fargo Funds is available free upon request. To obtain literature, please write, visit the Fund’s website, or call:
Wells Fargo Funds
P.O. Box 219967
Kansas City, MO 64121-9967
Website: wfam.com
Individual investors: 1-800-222-8222
Retail investment professionals: 1-888-877-9275
Institutional investment professionals: 1-866-765-0778

This report and the financial statements contained herein are submitted for the general information of the shareholders of the Fund. If this report is used for promotional purposes, distribution of the report must be accompanied or preceded by a current prospectus. Before investing, please consider the investment objectives, risks, charges, and expenses of the investment. For a current prospectus and, if available, a summary prospectus, containing this information, call 1-800-222-8222 or visit the Fund’s website at wfam.com. Read the prospectus carefully before you invest or send money.
Wells Fargo Asset Management (WFAM) is the trade name for certain investment advisory/management firms owned by Wells Fargo & Company. These firms include but are not limited to Wells Capital Management Incorporated and Wells Fargo Funds Management, LLC. Certain products managed by WFAM entities are distributed by Wells Fargo Funds Distributor, LLC (a broker-dealer and Member FINRA).
This material is for general informational and educational purposes only and is NOT intended to provide investment advice or a recommendation of any kind—including a recommendation for any specific investment, strategy, or plan.
INVESTMENT PRODUCTS: NOT FDIC INSURED ◾ NO BANK GUARANTEE ◾ MAY LOSE VALUE
© 2020 Wells Fargo & Company. All rights reserved
PAR-0820-01037 09-20
A207/AR207 07-20
Table of Contents

Annual Report
July 31, 2020
Wells Fargo
Disciplined U.S. Core Fund
Beginning on January 1, 2021, as permitted by new regulations adopted by the Securities and Exchange Commission, paper copies of the Wells Fargo Funds’ annual and semi-annual shareholder reports issued after this date will no longer be sent by mail, unless you specifically request paper copies of the reports. Instead, the reports will be made available on the Funds’ website, and you will be notified by mail each time a report is posted and provided with a website address to access the report.
If you already elected to receive shareholder reports electronically, you will not be affected by this change and you need not take any action. You may elect to receive shareholder reports and other communications from the Fund electronically at any time by contacting your financial intermediary (such as a broker-dealer or bank) or, if you are a direct investor, by calling 1-800-222-8222 or by enrolling at wellsfargo.com/advantagedelivery.
You may elect to receive all future reports in paper free of charge. If you invest through a financial intermediary, you can contact your financial intermediary to request that you continue to receive paper copies of your shareholder reports; if you invest directly with the Fund, you can call 1-800-222-8222. Your election to receive reports in paper will apply to all Wells Fargo Funds held in your account with your financial intermediary or, if you are a direct investor, to all Wells Fargo Funds that you hold.
Table of Contents
|
Reduce clutter. Save trees. |
Sign up for electronic delivery of prospectuses and shareholder reports at wellsfargo.com/advantagedelivery |
The views expressed and any forward-looking statements are as of July 31, 2020, unless otherwise noted, and are those of the Fund managers and/or Wells Fargo Asset Management. Discussions of individual securities, or the markets generally, or any Wells Fargo Fund are not intended as individual recommendations. Future events or results may vary significantly from those expressed in any forward-looking statements. The views expressed are subject to change at any time in response to changing circumstances in the market. Wells Fargo Asset Management and the Fund disclaim any obligation to publicly update or revise any views expressed or forward-looking statements.
INVESTMENT PRODUCTS: NOT FDIC INSURED ◾ NO BANK GUARANTEE ◾ MAY LOSE VALUE
Wells Fargo Disciplined U.S. Core Fund | 1
Table of Contents
Letter to shareholders (unaudited)

Andrew Owen
President
Wells Fargo Funds
Dear Shareholder:
We are pleased to offer you this annual report for the Wells Fargo Disciplined U.S. Core Fund for the 12-month period that ended July 31, 2020. Global stock markets saw earlier gains erased in February and March as governments around the world took unprecedented measures, attempting to stop the spread of the coronavirus at the expense of short-term economic output. However, markets rebounded from April on to offset much of the losses as central banks attempted to bolster capital markets and confidence. Fixed-income markets generally performed well overall, achieving widespread gains. Overall, U.S. stocks surpassed their international peers, while U.S. large-cap equity, as measured by the Russell 1000® Index1, easily outperformed small caps, as measured by the Russell 2000® Index2, for the 12-month period that began last August.
For the 12-month period, fixed-income securities generally had positive total returns while non-U.S. developed market equities had the weakest performance and U.S. stocks performed strongly despite sharp volatility in the late winter and early spring. For the period, U.S. stocks, based on the S&P 500 Index,3 gained 11.96%. International stocks, as measured by the MSCI ACWI ex USA Index (Net),4 returned 0.66%, while the MSCI EM Index (Net)5 had somewhat stronger performance, with a 6.55% gain. For bond investors, the Bloomberg Barclays U.S. Aggregate Bond Index6 returned a robust 10.12%, the Bloomberg Barclays Global Aggregate ex-USD Index7 gained a more modest 5.94%, and the Bloomberg Barclays Municipal Bond Index8 gained 5.36% while the ICE BofA U.S. High Yield Index9 returned 3.10%.
The fiscal year began with supportive central bank actions.
The period began with unresolved U.S.-China trade tensions showing no signs of compromise in August 2019. Evidence of a continued global economic slowdown mounted, and central banks in China, New Zealand, and Thailand cut interest rates after the U.S. Federal Reserve (Fed) had done so in late July. Industrial and manufacturing data declined in China, Canada, Japan, and Germany. Adding to global uncertainty, Italy’s prime minister resigned, many feared a crackdown in Hong Kong as protestors sustained their calls for reform, and U.K. Prime Minister Boris Johnson planned to suspend Parliament as Brexit’s deadline neared.
| 1 | The Russell 1000® Index measures the performance of the 1,000 largest companies in the Russell 3000® Index, which represents approximately 92% of the total market capitalization of the Russell 3000® Index. You cannot invest directly in an index. |
| 2 | The Russell 2000® Index measures the performance of the 2,000 smallest companies in the Russell 3000® Index, which represents approximately 8% of the total market capitalization of the Russell 3000® Index. You cannot invest directly in an index. |
| 3 | The S&P 500 Index consists of 500 stocks chosen for market size, liquidity, and industry group representation. It is a market-value-weighted index with each stock’s weight in the index proportionate to its market value. You cannot invest directly in an index. |
| 4 | The Morgan Stanley Capital International (MSCI) All Country World Index (ACWI) ex USA Index (Net) is a free-float-adjusted market-capitalization-weighted index that is designed to measure the equity market performance of developed and emerging markets, excluding the United States. Source: MSCI. MSCI makes no express or implied warranties or representations and shall have no liability whatsoever with respect to any MSCI data contained herein. The MSCI data may not be further redistributed or used as a basis for other indices or any securities or financial products. This report is not approved, reviewed, or produced by MSCI. You cannot invest directly in an index. |
| 5 | The MSCI Emerging Markets (EM) Index (Net) is a free-float-adjusted market-capitalization-weighted index that is designed to measure equity market performance of emerging markets. You cannot invest directly in an index. |
| 6 | The Bloomberg Barclays U.S. Aggregate Bond Index is a broad-based benchmark that measures the investment-grade, U.S. dollar-denominated, fixed-rate taxable bond market, including Treasuries, government-related and corporate securities, mortgage-backed securities (agency fixed-rate and hybrid adjustable-rate mortgage pass-throughs), asset-backed securities, and commercial mortgage-backed securities. You cannot invest directly in an index. |
| 7 | The Bloomberg Barclays Global Aggregate ex-USD Index is an unmanaged index that provides a broad-based measure of the global investment-grade fixed-income markets excluding the U.S.-dollar-denominated debt market. You cannot invest directly in an index. |
| 8 | The Bloomberg Barclays Municipal Bond Index is an unmanaged index composed of long-term tax-exempt bonds with a minimum credit rating of Baa. You cannot invest directly in an index. |
| 9 | The ICE BofA U.S. High Yield Index is a market-capitalization-weighted index of domestic and Yankee high-yield bonds. The index tracks the performance of high-yield securities traded in the U.S. bond market. You cannot invest directly in an index. Copyright 2020. ICE Data Indices, LLC. All rights reserved. |
2 | Wells Fargo Disciplined U.S. Core Fund
Table of Contents
Letter to shareholders (unaudited)
In the U.S., the Fed cut interest rates again in September. U.S. manufacturing data disappointed investors. The U.S. Congress announced it would pursue an impeachment investigation of President Trump. Meanwhile, the Brexit impasse showed no signs of resolution. Officials in China said that hitting the country’s economic growth goals for the year would be difficult considering the weight of tariffs and trade restrictions. Although the S&P 500 Index finished the third quarter with the best year-to-date returns in more than 20 years, concerns about future returns remained.
The fourth quarter started on a strong note, with U.S.-China trade tensions relaxing in October along with renewed optimism for a U.K. Brexit deal and positive macroeconomic data. The initial estimate of U.S. third-quarter gross domestic product (GDP) growth was a resilient 1.9% annualized rate, while the U.S. unemployment rate fell to a 50-year low of 3.5% in September. However, despite strength among U.S. consumers, business confidence declined while manufacturing activity contracted. Concerned with a potential economic slowdown, the Fed lowered interest rates another quarter point in late October—its third rate cut in four months. This helped push the S&P 500 Index to an all-time high while emerging market equities rallied and global bonds declined overall, reflecting a broad pickup in risk appetite.
Equity markets continued to rally in November despite ongoing geopolitical risks. Hopes for a U.S.-China trade deal buoyed investor confidence. U.S. business sentiment improved slightly, and manufacturing and services activity picked up. While consumer confidence and purchasing managers’ activity rose in the eurozone, China reported weakening manufacturing and consumer data. Bond yields rose marginally, leading to slightly negative returns for global government and investment-grade corporate bonds.
Financial markets ended 2019 with a boost from the U.S. and China accord on a Phase One trade deal. That, along with the landslide win by the pro-Brexit U.K. Conservative Party in a national election and ongoing central bank support, gave investors greater confidence. U.S. economic indicators were generally positive, with the exception of manufacturing activity and business confidence. Consumer confidence was resilient, fed by a robust labor market, tame inflation, and lower interest rates, which boosted housing affordability and stimulated homebuyer activity. The impeachment of President Trump had little impact on markets. Meanwhile, slowing Chinese economic activity, partly attributable to the trade war, led to further government stimulus at year-end through lower reserve ratios, allowing banks to lend more money.
The year-end rally continued in early January 2020. However, capital market volatility picked up sharply in late January on concerns over the potential impact of the coronavirus on the global economy and stock markets. With sentiment somewhat souring, perceived safe havens did well in January. The U.S. dollar and Japanese yen both rose, and government bonds outperformed equities. While the S&P 500 Index held its ground, emerging market equities tumbled, including those in Asia.
In February, the coronavirus became the major market focus. Fears of the virus’s impact on global growth led to expectations of increased global central bank monetary policy support. That led the 10-year U.S. Treasury yield to fall to an all-time low of 1.1%. Although equity markets initially shrugged off concerns about the outbreak, focusing instead on strong fourth-quarter earnings and improving business confidence in January, market sentiment turned sharply lower and the S&P 500 Index lost 8.2% for the month. Oil prices tumbled as Russia and the Organization of the Petroleum Exporting Countries compounded a major decline in oil demand with a brutal price war, partly aimed at dissuading further U.S. shale production, causing the price of West Texas Intermediate crude oil to plummet.
Wells Fargo Disciplined U.S. Core Fund | 3
Table of Contents
Letter to shareholders (unaudited)
“The global spread of the coronavirus led country after country to clamp down on social and business-related activity in order to contain the virus from causing even greater devastation and overwhelming health care systems.”
“Financial markets posted widely positive returns in June despite ongoing economic weakness and high levels of uncertainty on the containment of the coronavirus and the timing of an effective vaccine.”
The global spread of the coronavirus led country after country to clamp down on social and business-related activity in order to contain the virus from causing even greater devastation and overwhelming health care systems. This abrupt stoppage of economic activity led to the sharp deceleration of global output, sending economies into a deep contraction. Central banks responded swiftly, slashing interest rates and expanding quantitative easing programs to restore liquidity and confidence to the markets. In the U.S., the Fed introduced several new lending programs, funding investment-grade bonds, money market mutual funds, and commercial paper while purchasing Treasuries, mortgage-backed securities, and overnight repurchase agreements. Meanwhile, stock markets tumbled quickly into a bear market, ending the longest bull stock market in U.S. history.
Markets rebounded strongly in April, fueled by unprecedented government and central bank stimulus measures. The U.S. economy contracted by an annualized 5.0% pace in the first quarter, with 30 million new unemployment insurance claims in six weeks. In the eurozone, first-quarter real GDP shrank 3.8%, with the composite April Flash Purchasing Managers’ Index, a monthly survey of purchasing managers, falling to an all-time low of 13.5. The European Central Bank expanded its quantitative easing to include the purchase of additional government bonds of countries with the greatest virus-related need, including Italy and Spain. China’s first-quarter GDP fell by 6.8% year over year. However, retail sales, production, and investment showed signs of recovery. Extreme oil-price volatility continued as global supply far exceeded demand.
In May, the global equity market rebound continued, with widespread strong monthly gains. Investors regained confidence on reports of early signs of success in human trials of a coronavirus vaccine. Growth stocks continued to outperform value stocks while returns on global government bonds were generally flat. In the U.S., a gap grew between the stock market rebound and devastating economic data points, including an April unemployment rate of 14.7%, the highest level since World War II. Purchasing managers’ indices reflected weakening activity in May in both the manufacturing and services sectors. U.S. corporate earnings reports indicated a 14% year-over-year contraction in earnings from the first quarter of 2019. However, high demand for technology, driven by remote activity, supported robust information technology sector earnings, which helped drive major technology stocks higher.
Financial markets posted widely positive returns in June despite ongoing economic weakness and high levels of uncertainty on the containment of the coronavirus and the timing of an effective vaccine. There were hopeful signs as economies reopened, with both U.S. and U.K. retail sales rebounding substantially in May. However, year over year, sales remained depressed. Vitally important to market sentiment was the ongoing commitment by central banks globally to do all they could to provide economic support through liquidity and low borrowing costs. U.S. economic activity was aided by one-time $1,200 stimulus checks and $600 bonus weekly unemployment benefits due to expire at the end of July. However, unemployment remained in the double digits, easing somewhat from 14.7% in April to 11.1% in June. During June, numerous states reported alarming increases of coronavirus cases. China’s economic recovery picked up momentum in June, though it remained far from a full recovery.
July was a broadly positive month for both global equities and fixed income. However, economic data and a resurgence of coronavirus cases pointed to the vulnerability of the global economy and the ongoing imperative to regain control of the pandemic. Second-quarter GDP shrank by 9.5% and 12.1% in the U.S. and eurozone, respectively, from the previous quarter. In contrast, China reported a 3.2% year-over-year expansion in its second-quarter GDP. U.S. unemployment remained historically high despite adding 1.8 million jobs in July, with a double-digit jobless rate persisting. However, manufacturing activity grew in both the U.S. and eurozone. In Asia, while China’s manufacturing sector continued to expand, activity in Japan and South Korea contracted. In July, a rising concern
4 | Wells Fargo Disciplined U.S. Core Fund
Table of Contents
Letter to shareholders (unaudited)
was the rapid and broad reemergence of coronavirus infections. Despite the ongoing promise of positive early-stage vaccine trial results, economic activity could be held back by the continued spread of the virus and the end of a widely received $600-a-week bonus unemployment benefit in late July.
Don’t let short-term uncertainty derail long-term investment goals.
Periods of investment uncertainty can present challenges, but experience has taught us that maintaining long-term investment goals can be an effective way to plan for the future. To help you create a sound strategy based on your personal goals and risk tolerance, Wells Fargo Funds offers more than 100 mutual funds spanning a wide range of asset classes and investment styles. Although diversification cannot guarantee an investment profit or prevent losses, we believe it can be an effective way to manage investment risk and potentially smooth out overall portfolio performance. We encourage investors to know their investments and to understand that appropriate levels of risk-taking may unlock opportunities.
Thank you for choosing to invest with Wells Fargo Funds. We appreciate your confidence in us and remain committed to helping you meet your financial needs.
Sincerely,

Andrew Owen
President
Wells Fargo Funds
|
For further information about your Fund, contact your investment professional, visit our website at wfam.com, or call us directly at 1-800-222-8222. |
Notice to Shareholders
At a meeting held on August 10-12, 2020, the Board of Trustees of the Fund approved a change to the Fund’s automatic conversion feature for Class C shares in order to shorten the required holding period from 10 to 8 years. As a result, on a monthly basis beginning November 5, 2020, Class C shares will convert automatically into Class A shares 8 years after the initial date of purchase or, if you acquired your Class C shares through an exchange or conversion from another share class, 8 years after the date you acquired your Class C shares. When Class C shares that you acquired through a purchase or exchange convert, any other Class C shares that you purchased with reinvested dividends and distributions also will convert into Class A shares on a pro rata basis.
Please note that a shorter holding period may apply depending on your intermediary. Please see “Appendix A—Sales Charge Reductions and Waivers for Certain Intermediaries” in the Fund’s prospectus for further information.
Wells Fargo Disciplined U.S. Core Fund | 5
Table of Contents
Performance highlights (unaudited)
Investment objective
The Fund seeks long-term capital appreciation.
Manager
Wells Fargo Funds Management, LLC
Subadviser
Wells Capital Management Incorporated
Portfolio managers
Justin P. Carr, CFA®‡
Robert M. Wicentowski, CFA®‡
Average annual total returns (%) as of July 31, 2020
| Including sales charge | Excluding sales charge | Expense ratios1 (%) | ||||||||||||||||||||||||||||||||
| Inception date | 1 year | 5 year | 10 year | 1 year | 5 year | 10 year | Gross | Net2 | ||||||||||||||||||||||||||
| Class A (EVSAX) | 2-28-1990 | 3.67 | 8.21 | 12.31 | 9.97 | 9.50 | 12.98 | 0.84 | 0.84 | |||||||||||||||||||||||||
| Class C (EVSTX) | 6-30-1999 | 8.09 | 8.68 | 12.13 | 9.09 | 8.68 | 12.13 | 1.59 | 1.59 | |||||||||||||||||||||||||
| Class R (EVSHX)3 | 9-30-2015 | – | – | – | 9.68 | 9.23 | 12.68 | 1.09 | 1.09 | |||||||||||||||||||||||||
| Class R6 (EVSRX)4 | 9-30-2015 | – | – | – | 10.39 | 9.96 | 13.47 | 0.41 | 0.41 | |||||||||||||||||||||||||
| Administrator Class (EVSYX) | 2-21-1995 | – | – | – | 10.08 | 9.62 | 13.14 | 0.76 | 0.74 | |||||||||||||||||||||||||
| Institutional Class (EVSIX) | 7-30-2010 | – | – | – | 10.39 | 9.89 | 13.44 | 0.51 | 0.48 | |||||||||||||||||||||||||
| S&P 500 Index5 | – | – | – | – | 11.96 | 11.49 | 13.84 | – | – | |||||||||||||||||||||||||
Figures quoted represent past performance, which is no guarantee of future results, and do not reflect taxes that a shareholder may pay on an investment in a fund. Investment return and principal value of an investment will fluctuate so that an investor’s shares, when redeemed, may be worth more or less than their original cost. Performance shown without sales charges would be lower if sales charges were reflected. Current performance may be lower or higher than the performance data quoted, which assumes the reinvestment of dividends and capital gains. Current month-end performance is available on the Fund’s website, wfam.com.
Index returns do not include transaction costs associated with buying and selling securities, any mutual fund fees or expenses, or any taxes. It is not possible to invest directly in an index.
For Class A shares, the maximum front-end sales charge is 5.75%. For Class C shares, the maximum contingent deferred sales charge is 1.00%. Performance including a contingent deferred sales charge assumes the sales charge for the corresponding time period. Class R, Class R6, Administrator Class, and Institutional Class shares are sold without a front-end sales charge or contingent deferred sales charge.
Stock values fluctuate in response to the activities of individual companies and general market and economic conditions. The use of derivatives may reduce returns and/or increase volatility. Consult the Fund’s prospectus for additional information on these and other risks.
Please see footnotes on page 7.
6 | Wells Fargo Disciplined U.S. Core Fund
Table of Contents
Performance highlights (unaudited)
| Growth of $10,000 investment as of July 31, 20206 |
|
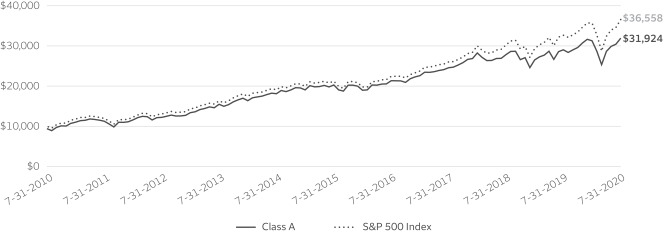
| ‡ | CFA® and Chartered Financial Analyst® are trademarks owned by CFA Institute. |
| 1 | Reflects the expense ratios as stated in the most recent prospectuses. The expense ratios shown are subject to change and may differ from the annualized expense ratios shown in the financial highlights of this report. |
| 2 | The manager has contractually committed through November 30, 2020, to waive fees and/or reimburse expenses to the extent necessary to cap total annual fund operating expenses after fee waivers at 0.87% for Class A, 1.62% for Class C, 1.12% for Class R, 0.43% for Class R6, 0.74% for Administrator Class, and 0.48% for Institutional Class. Brokerage commissions, stamp duty fees, interest, taxes, acquired fund fees and expenses (if any), and extraordinary expenses are excluded from the expense caps. Prior to or after the commitment expiration date, the caps may be increased or the commitment to maintain the caps may be terminated only with the approval of the Board of Trustees. Without these caps, the Fund’s returns would have been lower. The expense ratio paid by an investor is the net expense ratio (the total annual fund operating expenses after fee waivers) as stated in the prospectuses. |
| 3 | Historical performance shown for the Class R shares prior to their inception reflects the performance of the Administrator Class shares, adjusted to reflect higher expenses applicable to the Class R shares. |
| 4 | Historical performance shown for the Class R6 shares prior to their inception reflects the performance of the Institutional Class shares, and includes the higher expenses applicable to the Institutional Class shares. If these expenses had not been included, returns for the Class R6 shares would be higher. |
| 5 | The S&P 500 Index consists of 500 stocks chosen for market size, liquidity, and industry group representation. It is a market-value weighted index with each stock’s weight in the index proportionate to its market value. You cannot invest directly in an index. |
| 6 | The chart compares the performance of Class A shares for the most recent ten years with the S&P 500 Index. The chart assumes a hypothetical investment of $10,000 in Class A shares and reflects all operating expenses and assumes the maximum initial sales charge of 5.75%. |
| 7 | The ten largest holdings, excluding cash, cash equivalents and any money market funds, are calculated based on the value of the investments divided by total net assets of the Fund. Holdings are subject to change and may have changed since the date specified. |
| 8 | Amounts are calculated based on the total long-term investments of the Fund. These amounts are subject to change and may have changed since the date specified. |
Wells Fargo Disciplined U.S. Core Fund | 7
Table of Contents
Performance highlights (unaudited)
MANAGER’S DISCUSSION
Fund highlights
| ∎ | The Fund underperformed its benchmark, the S&P 500 Index, for the 12-month period that ended July 31, 2020. |
| ∎ | Stock selection was the main performance detractor for the Fund, adding value in only 4 of the 11 sectors. Favorable stock selection came from real estate, consumer discretionary, energy, and health care. Notable weakness in stock selection was found within financials, information technology (IT), communication services, and utilities. The Fund’s exposure to valuation characteristics, such as price/earnings (P/E), also detracted from performance relative to the benchmark index. |
| ∎ | Sector weighting decisions were modestly additive to performance. Contributions to total return came from being underweight the consumer discretionary and industrials sectors. Variation in sector weights were relatively small, as is typical for the strategy. |
Heightened uncertainty and volatility influenced investors.
During the second half of 2019, U.S. equity markets rose sharply, capping off the S&P 500 Index’s largest annual gain since 2013. Investors entered 2020 with high expectations, bolstered by steady U.S. economic growth, accommodative monetary policy, and a reduction in global trade tensions. However, once the coronavirus outbreak spiraled into a global pandemic, equity markets rapidly entered bear territory as volatility and fear escalated across the world. The U.S. Congress responded by passing the $2 trillion Coronavirus Aid, Relief, and Economic Security Act, the most significant U.S. fiscal stimulus since World War II. The Federal Reserve (Fed) implemented an “all means necessary” approach and used an arsenal of emergency monetary policy tools to ensure the liquidity and functioning of financial markets. The aggressiveness of the $18 trillion global monetary and fiscal response cushioned the pandemic’s initial economic blow and was a significant catalyst for the market rebound following March’s historic decline. U.S. equities rallied on better-than-expected economic data, a reduction in quarantine restrictions, optimism over potential vaccines and effective treatments, and signs that the global economic collapse had bottomed.
| Ten largest holdings (%) as of July 31, 20207 | ||||
Apple Incorporated | 6.62 | |||
Microsoft Corporation | 6.19 | |||
Amazon.com Incorporated | 4.87 | |||
Alphabet Incorporated Class C | 1.95 | |||
Facebook Incorporated Class A | 1.90 | |||
Johnson & Johnson | 1.81 | |||
Alphabet Incorporated Class A | 1.78 | |||
The Procter & Gamble Company | 1.59 | |||
Berkshire Hathaway Incorporated Class B | 1.59 | |||
The Home Depot Incorporated | 1.51 | |||
Stock selection detracted from performance while sector allocation decisions helped.
Stock selection was the main detractor from performance during the period. The most notable weakness came from the financials sector, specifically due to our holdings of diversified financials and insurance companies such as Synchrony Financial, Reinsurance Group of America, Hartford Financial Services Group, and Capital One Financial Corp. Within IT, performance headwinds came from the semiconductor industry, where the portfolio’s overweight to NVIDIA Corp. and Intel detracted from relative performance.
| Sector allocation as of July 31, 20208 |
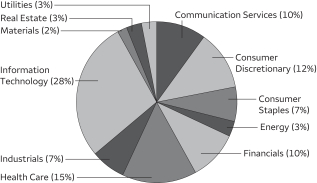 |
Stock selection within the real estate sector contributed to relative results, specifically due to data center and wireless tower real estate investment trusts such as Equinix, Prologis, SBA Communications, and American Tower Corp. The Fund also benefited from a modest overweight to and stock selection within the consumer discretionary sector. PulteGroup, a leading U.S. homebuilder, contributed to relative results, as did Best Buy Co., The Home Depot, Inc., and Target Corp. within the retail industry. The Fund’s underweight to the hard-hit energy sector also added to relative performance.
Please see footnotes on page 7.
8 | Wells Fargo Disciplined U.S. Core Fund
Table of Contents
Performance highlights (unaudited)
The Fund was misaligned with the large-cap growth theme that drove the market.
Characteristics that are typically favored in the portfolio include attractive valuation, earnings consistency, profitability, improving sentiment, and momentum. For the trailing 12 months, those characteristics, in aggregate, were misaligned with market trends, leading to weak relative performance. The lower P/E ratio and better profitability characteristics favored by our quantitative stock selection model have led to a higher exposure to cyclical value companies rather than secular growth or low-volatility companies. The market continued its extended trend of strongly preferring secular growth stocks over value. During the downturn, we reduced our exposure to travel and leisure, interest rate risk, supply-chain risk, and weak consumer spending. We continue to monitor the balance sheet strength and liquidity characteristics of our holdings to increase our confidence that they will be able to weather this crisis. We are looking for opportunities to increase exposure to secular growth companies should their ranks improve to meet our buy discipline while maintaining exposure to fundamentally strong companies at attractive valuations that will benefit from a broadening of the market when economic growth recovers.
Our market outlook is cautious.
The coronavirus pandemic inflicted a major external shock to the global economic system and will have lasting repercussions. The massive global monetary and fiscal response did not eliminate the pandemic, but it may have prevented a deep recession from spiraling into an economic depression. Equity markets recovered most of their losses and an economic recovery has begun, but the true depth and duration of the damage is highly uncertain.
With most U.S. states reducing quarantine restrictions in May and June, the rebound in third-quarter gross domestic product is expected to be strong. However, the increase in coronavirus cases within the Western and Southeastern U.S. has investors worried about a second wave of infection, which may restrain consumer spending and business confidence. If a second wave does appear and leads to another round of economic shutdowns, policymakers will likely pursue a more targeted quarantine approach in comparison to the initial outbreak.
Until a widely proven treatment or vaccine is available, the risk of a spike in infections and renewed quarantines will persist and delay a full economic recovery. The longer the crisis continues, the greater the risk of prolonged economic turmoil. However, there is growing optimism about vaccine clinical trials and the efficacy of inexpensive steroid treatments.
The devastating impact of the pandemic should dissipate as daily coronavirus infections peak, new therapies prove successful, and quarantines are no longer necessary. However, the depth and length of the coronavirus recession and the speed and strength of the recovery is still unclear. The path forward will be volatile as equity markets will be highly susceptible to positive and negative virus-related news. As we monitor the macroeconomic environment, we will continue to diligently focus on company fundamentals and disciplined portfolio risk management.
Please see footnotes on page 7.
Wells Fargo Disciplined U.S. Core Fund | 9
Table of Contents
As a shareholder of the Fund, you incur two types of costs: (1) transaction costs, including sales charges (loads) on purchase payments and contingent deferred sales charges (if any) on redemptions and (2) ongoing costs, including management fees, distribution (12b-1) and/or shareholder servicing fees, and other Fund expenses. This example is intended to help you understand your ongoing costs (in dollars) of investing in the Fund and to compare these costs with the ongoing costs of investing in other mutual funds.
The example is based on an investment of $1,000 invested at the beginning of the six-month period and held for the entire period from February 1, 2020 to July 31, 2020.
Actual expenses
The “Actual” line of the table below provides information about actual account values and actual expenses. You may use the information in this line, together with the amount you invested, to estimate the expenses that you paid over the period. Simply divide your account value by $1,000 (for example, an $8,600 account value divided by $1,000 = 8.6), then multiply the result by the number in the “Actual” line under the heading entitled “Expenses paid during period” for your applicable class of shares to estimate the expenses you paid on your account during this period.
Hypothetical example for comparison purposes
The “Hypothetical” line of the table below provides information about hypothetical account values and hypothetical expenses based on the Fund’s actual expense ratio and an assumed rate of return of 5% per year before expenses, which is not the Fund’s actual return. The hypothetical account values and expenses may not be used to estimate the actual ending account balance or expenses you paid for the period. You may use this information to compare the ongoing costs of investing in the Fund and other funds. To do so, compare this 5% hypothetical example with the 5% hypothetical examples that appear in the shareholder reports of the other funds.
Please note that the expenses shown in the table are meant to highlight your ongoing costs only and do not reflect any transactional costs, such as sales charges (loads) and contingent deferred sales charges. Therefore, the “Hypothetical” line of the table is useful in comparing ongoing costs only and will not help you determine the relative total costs of owning different funds. In addition, if these transactional costs were included, your costs would have been higher.
Beginning 2-1-2020 | Ending 7-31-2020 | Expenses the period1 | Annualized net expense ratio | |||||||||||||
Class A | ||||||||||||||||
Actual | $ | 1,000.00 | $ | 1,020.73 | $ | 4.32 | 0.86 | % | ||||||||
Hypothetical (5% return before expenses) | $ | 1,000.00 | $ | 1,020.59 | $ | 4.32 | 0.86 | % | ||||||||
Class C | ||||||||||||||||
Actual | $ | 1,000.00 | $ | 1,016.43 | $ | 8.07 | 1.61 | % | ||||||||
Hypothetical (5% return before expenses) | $ | 1,000.00 | $ | 1,016.86 | $ | 8.07 | 1.61 | % | ||||||||
Class R | ||||||||||||||||
Actual | $ | 1,000.00 | $ | 1,019.41 | $ | 5.57 | 1.11 | % | ||||||||
Hypothetical (5% return before expenses) | $ | 1,000.00 | $ | 1,019.34 | $ | 5.57 | 1.11 | % | ||||||||
Class R6 | ||||||||||||||||
Actual | $ | 1,000.00 | $ | 1,022.39 | $ | 2.16 | 0.43 | % | ||||||||
Hypothetical (5% return before expenses) | $ | 1,000.00 | $ | 1,022.73 | $ | 2.16 | 0.43 | % | ||||||||
Administrator Class | ||||||||||||||||
Actual | $ | 1,000.00 | $ | 1,021.21 | $ | 3.72 | 0.74 | % | ||||||||
Hypothetical (5% return before expenses) | $ | 1,000.00 | $ | 1,021.18 | $ | 3.72 | 0.74 | % | ||||||||
Institutional Class | ||||||||||||||||
Actual | $ | 1,000.00 | $ | 1,022.61 | $ | 2.41 | 0.48 | % | ||||||||
Hypothetical (5% return before expenses) | $ | 1,000.00 | $ | 1,022.48 | $ | 2.41 | 0.48 | % | ||||||||
| 1 | Expenses paid is equal to the annualized net expense ratio of each class multiplied by the average account value over the period, multiplied by the number of days in the most recent fiscal half-year divided by the number of days in the fiscal year (to reflect the one-half-year period). |
10 | Wells Fargo Disciplined U.S. Core Fund
Table of Contents
Portfolio of investments—July 31, 2020
| Shares | Value | |||||||||||||||
| Common Stocks: 98.05% |
| |||||||||||||||
Communication Services: 10.17% |
| |||||||||||||||
| Diversified Telecommunication Services: 2.39% | ||||||||||||||||
AT&T Incorporated | 350,577 | $ | 10,370,071 | |||||||||||||
Verizon Communications Incorporated | 196,202 | 11,277,691 | ||||||||||||||
| 21,647,762 | ||||||||||||||||
|
| |||||||||||||||
| Entertainment: 1.42% | ||||||||||||||||
Activision Blizzard Incorporated | 38,807 | 3,206,622 | ||||||||||||||
Netflix Incorporated † | 12,709 | 6,213,176 | ||||||||||||||
The Walt Disney Company | 29,205 | 3,415,233 | ||||||||||||||
| 12,835,031 | ||||||||||||||||
|
| |||||||||||||||
| Interactive Media & Services: 5.63% | ||||||||||||||||
Alphabet Incorporated Class A † | 10,791 | 16,056,468 | ||||||||||||||
Alphabet Incorporated Class C † | 11,866 | 17,596,803 | ||||||||||||||
Facebook Incorporated Class A † | 67,847 | 17,210,748 | ||||||||||||||
| 50,864,019 | ||||||||||||||||
|
| |||||||||||||||
| Media: 0.73% | ||||||||||||||||
Comcast Corporation Class A | 90,803 | 3,886,368 | ||||||||||||||
Discovery Communications Incorporated Class A † | 127,867 | 2,697,994 | ||||||||||||||
| 6,584,362 | ||||||||||||||||
|
| |||||||||||||||
Consumer Discretionary: 11.85% | ||||||||||||||||
| Automobiles: 0.33% | ||||||||||||||||
General Motors Company | 120,509 | 2,999,469 | ||||||||||||||
|
| |||||||||||||||
| Hotels, Restaurants & Leisure: 1.31% | ||||||||||||||||
Chipotle Mexican Grill Incorporated † | 1,832 | 2,116,253 | ||||||||||||||
Las Vegas Sands Corporation | 30,133 | 1,315,004 | ||||||||||||||
McDonald’s Corporation | 22,531 | 4,377,323 | ||||||||||||||
Starbucks Corporation | 53,365 | 4,084,023 | ||||||||||||||
| 11,892,603 | ||||||||||||||||
|
| |||||||||||||||
| Household Durables: 1.10% | ||||||||||||||||
D.R. Horton Incorporated | 80,466 | 5,323,631 | ||||||||||||||
PulteGroup Incorporated | 105,329 | 4,592,344 | ||||||||||||||
| 9,915,975 | ||||||||||||||||
|
| |||||||||||||||
| Internet & Direct Marketing Retail: 4.87% | ||||||||||||||||
Amazon.com Incorporated † | 13,922 | 44,058,675 | ||||||||||||||
|
| |||||||||||||||
| Multiline Retail: 0.74% | ||||||||||||||||
Target Corporation | 53,145 | 6,689,893 | ||||||||||||||
|
| |||||||||||||||
| Specialty Retail: 2.56% | ||||||||||||||||
AutoZone Incorporated † | 2,853 | 3,444,769 | ||||||||||||||
Best Buy Company Incorporated | 60,171 | 5,992,430 | ||||||||||||||
The Home Depot Incorporated | 51,582 | 13,694,505 | ||||||||||||||
| 23,131,704 | ||||||||||||||||
|
| |||||||||||||||
| Textiles, Apparel & Luxury Goods: 0.94% | ||||||||||||||||
Nike Incorporated Class B | 86,677 | 8,460,542 | ||||||||||||||
|
| |||||||||||||||
The accompanying notes are an integral part of these financial statements.
Wells Fargo Disciplined U.S. Core Fund | 11
Table of Contents
Portfolio of investments—July 31, 2020
| Shares | Value | |||||||||||||||
Consumer Staples: 6.86% | ||||||||||||||||
| Beverages: 0.75% | ||||||||||||||||
PepsiCo Incorporated | 13,118 | $ | 1,805,824 | |||||||||||||
The Coca-Cola Company | 105,679 | 4,992,276 | ||||||||||||||
| 6,798,100 | ||||||||||||||||
|
| |||||||||||||||
| Food & Staples Retailing: 1.82% | ||||||||||||||||
Costco Wholesale Corporation | 11,321 | 3,685,325 | ||||||||||||||
Sysco Corporation | 25,017 | 1,322,148 | ||||||||||||||
Walgreens Boots Alliance Incorporated | 51,948 | 2,114,803 | ||||||||||||||
Walmart Incorporated | 72,278 | 9,352,773 | ||||||||||||||
| 16,475,049 | ||||||||||||||||
|
| |||||||||||||||
| Food Products: 0.93% | ||||||||||||||||
General Mills Incorporated | 37,703 | 2,385,469 | ||||||||||||||
Pilgrim’s Pride Corporation † | 131,817 | 2,023,391 | ||||||||||||||
Tyson Foods Incorporated Class A | 64,745 | 3,978,580 | ||||||||||||||
| 8,387,440 | ||||||||||||||||
|
| |||||||||||||||
| Household Products: 2.07% | ||||||||||||||||
Kimberly-Clark Corporation | 28,762 | 4,372,974 | ||||||||||||||
The Procter & Gamble Company | 109,656 | 14,378,095 | ||||||||||||||
| 18,751,069 | ||||||||||||||||
|
| |||||||||||||||
| Personal Products: 0.58% | ||||||||||||||||
The Estee Lauder Companies Incorporated Class A | 26,755 | 5,285,183 | ||||||||||||||
|
| |||||||||||||||
| Tobacco: 0.71% | ||||||||||||||||
Altria Group Incorporated | 60,175 | 2,476,201 | ||||||||||||||
Philip Morris International Incorporated | 50,888 | 3,908,707 | ||||||||||||||
| 6,384,908 | ||||||||||||||||
|
| |||||||||||||||
Energy: 2.47% | ||||||||||||||||
| Oil, Gas & Consumable Fuels: 2.47% | ||||||||||||||||
Chevron Corporation | 78,677 | 6,604,147 | ||||||||||||||
ConocoPhillips | 38,074 | 1,423,587 | ||||||||||||||
Exxon Mobil Corporation | 206,738 | 8,699,535 | ||||||||||||||
Marathon Petroleum Corporation | 78,610 | 3,002,902 | ||||||||||||||
Valero Energy Corporation | 46,461 | 2,612,502 | ||||||||||||||
| 22,342,673 | ||||||||||||||||
|
| |||||||||||||||
Financials: 9.78% | ||||||||||||||||
| Banks: 3.29% | ||||||||||||||||
Bank of America Corporation | 337,527 | 8,397,672 | ||||||||||||||
Citigroup Incorporated | 67,954 | 3,398,380 | ||||||||||||||
Citizens Financial Group Incorporated | 44,934 | 1,114,813 | ||||||||||||||
JPMorgan Chase & Company | 102,737 | 9,928,504 | ||||||||||||||
Popular Incorporated | 33,330 | 1,236,876 | ||||||||||||||
Signature Bank | 17,427 | 1,786,790 | ||||||||||||||
US Bancorp | 105,812 | 3,898,114 | ||||||||||||||
| 29,761,149 | ||||||||||||||||
|
| |||||||||||||||
The accompanying notes are an integral part of these financial statements.
12 | Wells Fargo Disciplined U.S. Core Fund
Table of Contents
Portfolio of investments—July 31, 2020
| Shares | Value | |||||||||||||||
| Capital Markets: 2.07% | ||||||||||||||||
Ameriprise Financial Incorporated | 28,662 | $ | 4,403,343 | |||||||||||||
Bank of New York Mellon Corporation | 110,746 | 3,970,244 | ||||||||||||||
CME Group Incorporated | 11,118 | 1,847,589 | ||||||||||||||
Morgan Stanley | 76,595 | 3,743,964 | ||||||||||||||
Northern Trust Corporation | 60,848 | 4,767,441 | ||||||||||||||
| 18,732,581 | ||||||||||||||||
|
| |||||||||||||||
| Consumer Finance: 0.42% | ||||||||||||||||
Capital One Financial Corporation | 22,940 | 1,463,572 | ||||||||||||||
Synchrony Financial | 103,193 | 2,283,661 | ||||||||||||||
| 3,747,233 | ||||||||||||||||
|
| |||||||||||||||
| Diversified Financial Services: 2.03% | ||||||||||||||||
Berkshire Hathaway Incorporated Class B † | 73,216 | 14,334,228 | ||||||||||||||
Equitable Holdings Incorporated | 197,578 | 4,042,446 | ||||||||||||||
| 18,376,674 | ||||||||||||||||
|
| |||||||||||||||
| Insurance: 1.97% | ||||||||||||||||
MetLife Incorporated | 108,804 | 4,118,231 | ||||||||||||||
Reinsurance Group of America Incorporated | 31,258 | 2,664,745 | ||||||||||||||
The Allstate Corporation | 27,741 | 2,618,473 | ||||||||||||||
The Hartford Financial Services Group Incorporated | 89,416 | 3,784,085 | ||||||||||||||
The Progressive Corporation | 50,866 | 4,595,234 | ||||||||||||||
| 17,780,768 | ||||||||||||||||
|
| |||||||||||||||
Health Care: 14.93% | ||||||||||||||||
| Biotechnology: 2.88% | ||||||||||||||||
AbbVie Incorporated | 103,359 | 9,809,803 | ||||||||||||||
Amgen Incorporated | 37,830 | 9,255,866 | ||||||||||||||
Biogen Incorporated † | 7,914 | 2,173,897 | ||||||||||||||
Gilead Sciences Incorporated | 69,151 | 4,808,069 | ||||||||||||||
| 26,047,635 | ||||||||||||||||
|
| |||||||||||||||
| Health Care Equipment & Supplies: 2.81% | ||||||||||||||||
Abbott Laboratories | 52,741 | 5,307,854 | ||||||||||||||
Baxter International Incorporated | 31,259 | 2,700,152 | ||||||||||||||
Danaher Corporation | 5,269 | 1,073,822 | ||||||||||||||
Edwards Lifesciences Corporation † | 51,909 | 4,070,185 | ||||||||||||||
Medtronic plc | 79,399 | 7,660,416 | ||||||||||||||
Zimmer Biomet Holdings Incorporated | 34,059 | 4,593,197 | ||||||||||||||
| 25,405,626 | ||||||||||||||||
|
| |||||||||||||||
| Health Care Providers & Services: 3.83% | ||||||||||||||||
AmerisourceBergen Corporation | 51,269 | 5,136,641 | ||||||||||||||
Anthem Incorporated | 11,332 | 3,102,702 | ||||||||||||||
Cardinal Health Incorporated | 30,594 | 1,671,044 | ||||||||||||||
Cigna Corporation | 16,287 | 2,812,602 | ||||||||||||||
CVS Health Corporation | 20,857 | 1,312,740 | ||||||||||||||
Humana Incorporated | 10,551 | 4,140,740 | ||||||||||||||
McKesson Corporation | 30,543 | 4,586,337 | ||||||||||||||
UnitedHealth Group Incorporated | 39,340 | 11,911,365 | ||||||||||||||
| 34,674,171 | ||||||||||||||||
|
| |||||||||||||||
| Health Care Technology: 0.58% | ||||||||||||||||
Veeva Systems Incorporated Class A † | 19,871 | 5,257,270 | ||||||||||||||
|
| |||||||||||||||
The accompanying notes are an integral part of these financial statements.
Wells Fargo Disciplined U.S. Core Fund | 13
Table of Contents
Portfolio of investments—July 31, 2020
| Shares | Value | |||||||||||||||
| Life Sciences Tools & Services: 0.11% | ||||||||||||||||
Thermo Fisher Scientific Incorporated | 2,329 | $ | 964,090 | |||||||||||||
|
| |||||||||||||||
| Pharmaceuticals: 4.72% | ||||||||||||||||
Bristol-Myers Squibb Company | 131,294 | 7,701,706 | ||||||||||||||
Eli Lilly & Company | 5,157 | 775,046 | ||||||||||||||
Johnson & Johnson | 112,151 | 16,347,130 | ||||||||||||||
Merck & Company Incorporated | 135,346 | 10,860,163 | ||||||||||||||
Pfizer Incorporated | 181,304 | 6,976,578 | ||||||||||||||
| 42,660,623 | ||||||||||||||||
|
| |||||||||||||||
Industrials: 7.29% | ||||||||||||||||
| Aerospace & Defense: 1.64% | ||||||||||||||||
Howmet Aerospace Incorporated | 42,877 | 633,722 | ||||||||||||||
Lockheed Martin Corporation | 12,414 | 4,704,534 | ||||||||||||||
Northrop Grumman Corporation | 6,979 | 2,268,245 | ||||||||||||||
Raytheon Technologies Corporation | 114,583 | 6,494,564 | ||||||||||||||
The Boeing Company | 4,620 | 729,960 | ||||||||||||||
| 14,831,025 | ||||||||||||||||
|
| |||||||||||||||
| Air Freight & Logistics: 0.82% | ||||||||||||||||
Expeditors International of Washington Incorporated | 30,621 | 2,587,781 | ||||||||||||||
United Parcel Service Incorporated Class B | 33,708 | 4,812,154 | ||||||||||||||
| 7,399,935 | ||||||||||||||||
|
| |||||||||||||||
| Airlines: 0.36% | ||||||||||||||||
Delta Air Lines Incorporated | 100,529 | 2,510,209 | ||||||||||||||
United Airlines Holdings Incorporated † | 23,459 | 736,143 | ||||||||||||||
| 3,246,352 | ||||||||||||||||
|
| |||||||||||||||
| Building Products: 0.47% | ||||||||||||||||
Carrier Global Corporation | 44,260 | 1,205,642 | ||||||||||||||
Masco Corporation | 53,978 | 3,085,382 | ||||||||||||||
| 4,291,024 | ||||||||||||||||
|
| |||||||||||||||
| Commercial Services & Supplies: 0.52% | ||||||||||||||||
Waste Management Incorporated | 42,583 | 4,667,097 | ||||||||||||||
|
| |||||||||||||||
| Construction & Engineering: 0.54% | ||||||||||||||||
Quanta Services Incorporated | 123,087 | 4,919,787 | ||||||||||||||
|
| |||||||||||||||
| Electrical Equipment: 0.66% | ||||||||||||||||
AMETEK Incorporated | 34,214 | 3,190,456 | ||||||||||||||
Eaton Corporation plc | 29,540 | 2,751,060 | ||||||||||||||
| 5,941,516 | ||||||||||||||||
|
| |||||||||||||||
| Industrial Conglomerates: 0.51% | ||||||||||||||||
Honeywell International Incorporated | 31,117 | 4,647,946 | ||||||||||||||
|
| |||||||||||||||
| Machinery: 0.98% | ||||||||||||||||
Caterpillar Incorporated | 14,543 | 1,932,474 | ||||||||||||||
Cummins Incorporated | 23,626 | 4,565,961 | ||||||||||||||
Illinois Tool Works Incorporated | 12,547 | 2,321,070 | ||||||||||||||
| 8,819,505 | ||||||||||||||||
|
| |||||||||||||||
The accompanying notes are an integral part of these financial statements.
14 | Wells Fargo Disciplined U.S. Core Fund
Table of Contents
Portfolio of investments—July 31, 2020
| Shares | Value | |||||||||||||||
| Road & Rail: 0.20% | ||||||||||||||||
Union Pacific Corporation | 10,156 | $ | 1,760,543 | |||||||||||||
|
| |||||||||||||||
| Trading Companies & Distributors: 0.59% | ||||||||||||||||
W.W. Grainger Incorporated | 15,728 | 5,371,584 | ||||||||||||||
|
| |||||||||||||||
Information Technology: 27.88% | ||||||||||||||||
| Communications Equipment: 1.18% | ||||||||||||||||
Cisco Systems Incorporated | 226,969 | 10,690,240 | ||||||||||||||
|
| |||||||||||||||
| Electronic Equipment, Instruments & Components: 0.59% | ||||||||||||||||
Keysight Technologies Incorporated † | 39,612 | 3,956,843 | ||||||||||||||
Zebra Technologies Corporation Class A † | 4,779 | 1,341,704 | ||||||||||||||
| 5,298,547 | ||||||||||||||||
|
| |||||||||||||||
| IT Services: 4.56% | ||||||||||||||||
Accenture plc Class A | 27,381 | 6,154,701 | ||||||||||||||
Amdocs Limited | 48,703 | 3,024,456 | ||||||||||||||
Cognizant Technology Solutions Corporation Class A | 25,653 | 1,752,613 | ||||||||||||||
International Business Machines Corporation | 19,943 | 2,451,792 | ||||||||||||||
MasterCard Incorporated Class A | 21,887 | 6,752,796 | ||||||||||||||
PayPal Holdings Incorporated † | 37,995 | 7,449,680 | ||||||||||||||
Visa Incorporated Class A | 71,798 | 13,670,339 | ||||||||||||||
| 41,256,377 | ||||||||||||||||
|
| |||||||||||||||
| Semiconductors & Semiconductor Equipment: 5.10% | ||||||||||||||||
Applied Materials Incorporated | 74,774 | 4,810,211 | ||||||||||||||
Broadcom Incorporated | 20,033 | 6,345,453 | ||||||||||||||
Intel Corporation | 198,346 | 9,467,055 | ||||||||||||||
Lam Research Corporation | 7,727 | 2,914,315 | ||||||||||||||
Micron Technology Incorporated † | 98,318 | 4,921,307 | ||||||||||||||
NVIDIA Corporation | 20,086 | 8,528,315 | ||||||||||||||
QUALCOMM Incorporated | 86,199 | 9,103,476 | ||||||||||||||
| 46,090,132 | ||||||||||||||||
|
| |||||||||||||||
| Software: 9.44% | ||||||||||||||||
Adobe Incorporated † | 14,320 | 6,362,662 | ||||||||||||||
Cadence Design Systems Incorporated † | 40,113 | 4,382,345 | ||||||||||||||
Fortinet Incorporated † | 25,914 | 3,583,906 | ||||||||||||||
Intuit Incorporated | 18,140 | 5,557,552 | ||||||||||||||
Microsoft Corporation | 273,216 | 56,012,012 | ||||||||||||||
Oracle Corporation | 113,396 | 6,287,808 | ||||||||||||||
Salesforce.com Incorporated † | 16,196 | 3,155,791 | ||||||||||||||
| 85,342,076 | ||||||||||||||||
|
| |||||||||||||||
| Technology Hardware, Storage & Peripherals: 7.01% | ||||||||||||||||
Apple Incorporated | 140,928 | 59,900,037 | ||||||||||||||
HP Incorporated | 200,510 | 3,524,966 | ||||||||||||||
| 63,425,003 | ||||||||||||||||
|
| |||||||||||||||
Materials: 1.59% |
| |||||||||||||||
| Chemicals: 0.67% | ||||||||||||||||
Eastman Chemical Company | 24,445 | 1,824,330 | ||||||||||||||
LyondellBasell Industries NV Class A | 67,634 | 4,228,478 | ||||||||||||||
| 6,052,808 | ||||||||||||||||
|
| |||||||||||||||
The accompanying notes are an integral part of these financial statements.
Wells Fargo Disciplined U.S. Core Fund | 15
Table of Contents
Portfolio of investments—July 31, 2020
| Shares | Value | |||||||||||||||
| Metals & Mining: 0.92% | ||||||||||||||||
Arconic Corporation † | 10,720 | $ | 174,629 | |||||||||||||
Nucor Corporation | 82,436 | 3,458,190 | ||||||||||||||
Reliance Steel & Aluminum Company | 48,178 | 4,733,970 | ||||||||||||||
| 8,366,789 | ||||||||||||||||
|
| |||||||||||||||
Real Estate: 2.80% | ||||||||||||||||
| Equity REITs: 2.80% | ||||||||||||||||
American Tower Corporation | 24,876 | 6,502,338 | ||||||||||||||
AvalonBay Communities Incorporated | 15,348 | 2,350,086 | ||||||||||||||
Crown Castle International Corporation | 8,301 | 1,383,777 | ||||||||||||||
Equinix Incorporated | 3,416 | 2,683,200 | ||||||||||||||
Essex Property Trust Incorporated | 7,761 | 1,713,163 | ||||||||||||||
Prologis Incorporated | 72,682 | 7,662,136 | ||||||||||||||
SBA Communications Corporation | 9,666 | 3,011,346 | ||||||||||||||
| 25,306,046 | ||||||||||||||||
|
| |||||||||||||||
Utilities: 2.43% | ||||||||||||||||
| Electric Utilities: 1.14% | ||||||||||||||||
Eversource Energy | 20,235 | 1,822,566 | ||||||||||||||
NRG Energy Incorporated | 124,332 | 4,203,665 | ||||||||||||||
The Southern Company | 79,066 | 4,317,794 | ||||||||||||||
| 10,344,025 | ||||||||||||||||
|
| |||||||||||||||
| Independent Power & Renewable Electricity Producers: 0.77% | ||||||||||||||||
AES Corporation | 227,957 | 3,471,785 | ||||||||||||||
Vistra Energy Corporation | 188,304 | 3,513,753 | ||||||||||||||
| 6,985,538 | ||||||||||||||||
|
| |||||||||||||||
| Multi-Utilities: 0.52% | ||||||||||||||||
Dominion Energy Incorporated | 38,037 | 3,082,138 | ||||||||||||||
Sempra Energy | 12,670 | 1,576,908 | ||||||||||||||
| 4,659,046 | ||||||||||||||||
|
| |||||||||||||||
Total Common Stocks (Cost $563,024,892) |
| 886,625,218 | ||||||||||||||
|
| |||||||||||||||
| Yield | ||||||||||||||||
| Short-Term Investments: 1.84% | ||||||||||||||||
| Investment Companies: 1.76% | ||||||||||||||||
Wells Fargo Government Money Market Select Class (l)(u) | 0.10 | % | 15,915,451 | 15,915,451 | ||||||||||||
|
| |||||||||||||||
Maturity date | Principal | |||||||||||||||
| U.S. Treasury Securities: 0.08% | ||||||||||||||||
U.S. Treasury Bill #(z) | 0.10 | 10-1-2020 | $ | 700,000 | 699,895 | |||||||||||
|
| |||||||||||||||
Total Short-Term Investments (Cost $16,615,325) |
| 16,615,346 | ||||||||||||||
|
| |||||||||||||||
| Total investments in securities (Cost $579,640,217) | 99.89 | % | 903,240,564 | |||||
Other assets and liabilities, net | 0.11 | 996,470 | ||||||
|
|
|
| |||||
| Total net assets | 100.00 | % | $ | 904,237,034 | ||||
|
|
|
| |||||
The accompanying notes are an integral part of these financial statements.
16 | Wells Fargo Disciplined U.S. Core Fund
Table of Contents
Portfolio of investments—July 31, 2020
| † | Non-income-earning security |
| (l) | The issuer of the security is an affiliated person of the Fund as defined in the Investment Company Act of 1940. |
| (u) | The rate represents the 7-day annualized yield at period end. |
| # | All or a portion of this security is segregated as collateral for investments in derivative instruments. |
| (z) | Zero coupon security. The rate represents the current yield to maturity. |
Abbreviations:
| REIT | Real investment trust |
Futures Contracts
| Description | Number of contracts | Expiration date | Notional cost | Notional value | Unrealized gains | Unrealized losses | ||||||||||||||||||
Long | ||||||||||||||||||||||||
S&P 500 E-Mini Index | 88 | 9-18-2020 | $ | 13,906,476 | $ | 14,359,400 | $ | 452,924 | $ | 0 | ||||||||||||||
Investments in Affiliates
An affiliated investment is an investment in which the Fund owns at least 5% of the outstanding voting shares of the issuer or as a result of other relationships, such as the Fund and the issuer having the same investment manager. Transactions with issuers that were either affiliated persons of the Fund at the beginning of the period or the end of the period were as follows:
| Value, beginning of period | Purchases | Sales proceeds | Net realized gains (losses) | Net change in unrealized gains (losses) | Income from affiliated securities | Value, end of period | % of net assets | |||||||||||||||||||||||||
| Short-Term Investments | ||||||||||||||||||||||||||||||||
Investment Companies | ||||||||||||||||||||||||||||||||
Securities Lending Cash Investments LLC * | $ | 4,463,486 | $ | 73,540,239 | $ | (78,002,324 | ) | ($ | 1,401 | ) | $ | 0 | $ | 58,752 | # | $ | 0 | |||||||||||||||
Wells Fargo Government Money Market Fund Select Class | 7,316,959 | 248,042,221 | (239,443,729 | ) | 0 | 0 | 91,333 | 15,915,451 | ||||||||||||||||||||||||
|
|
|
|
|
|
|
|
|
| |||||||||||||||||||||||
| ($ | 1,401 | ) | $ | 0 | $ | 150,085 | $ | 15,915,451 | 1.76 | % | ||||||||||||||||||||||
|
|
|
|
|
|
|
|
|
| |||||||||||||||||||||||
| * | No longer held at the end of the period. |
| # | Amount shown represents income before fees and rebates. |
The accompanying notes are an integral part of these financial statements.
Wells Fargo Disciplined U.S. Core Fund | 17
Table of Contents
Statement of assets and liabilities—July 31, 2020
Assets | ||||
Investments in unaffiliated securities, at value (cost $563,724,766) | $ | 887,325,113 | ||
Investments in affiliated securities, at value (cost $15,915,451) | 15,915,451 | |||
Segregated cash for futures contracts | 1,217,000 | |||
Receivable for Fund shares sold | 353,784 | |||
Receivable for dividends | 1,017,000 | |||
Receivable for daily variation margin on open futures contracts | 63,339 | |||
Prepaid expenses and other assets | 225,601 | |||
|
| |||
Total assets | 906,117,288 | |||
|
| |||
Liabilities | ||||
Payable for Fund shares redeemed | 1,346,892 | |||
Management fee payable | 271,782 | |||
Administration fees payable | 114,165 | |||
Distribution fees payable | 19,347 | |||
Shareholder servicing fees payable | 111,120 | |||
Trustees’ fees and expenses payable | 3,771 | |||
Accrued expenses and other liabilities | 13,177 | |||
|
| |||
Total liabilities | 1,880,254 | |||
|
| |||
Total net assets | $ | 904,237,034 | ||
|
| |||
Net assets consist of | ||||
Paid-in capital | $ | 503,155,023 | ||
Total distributable earnings | 401,082,011 | |||
|
| |||
Total net assets | $ | 904,237,034 | ||
|
| |||
Computation of net asset value and offering price per share | ||||
Net assets – Class A | $ | 421,005,133 | ||
Shares outstanding – Class A1 | 23,107,333 | |||
Net asset value per share – Class A | $18.22 | |||
Maximum offering price per share – Class A2 | $19.33 | |||
Net assets – Class C | $ | 29,140,703 | ||
Shares outstanding – Class C1 | 1,744,586 | |||
Net asset value per share – Class C | $16.70 | |||
Net assets – Class R | $ | 3,507,129 | ||
Shares outstanding – Class R1 | 190,830 | |||
Net asset value per share – Class R | $18.38 | |||
Net assets – Class R6 | $ | 253,222,554 | ||
Shares outstanding – Class R61 | 13,523,457 | |||
Net asset value per share – Class R6 | $18.72 | |||
Net assets – Administrator Class | $ | 50,654,757 | ||
Shares outstanding – Administrator Class1 | 2,696,858 | |||
Net asset value per share – Administrator Class | $18.78 | |||
Net assets – Institutional Class | $ | 146,706,758 | ||
Shares outstanding – Institutional Class1 | 7,914,329 | |||
Net asset value per share – Institutional Class | $18.54 | |||
| 1 | The Fund has an unlimited number of authorized shares. |
| 2 | Maximum offering price is computed as 100/94.25 of net asset value. On investments of $50,000 or more, the offering price is reduced. |
The accompanying notes are an integral part of these financial statements.
18 | Wells Fargo Disciplined U.S. Core Fund
Table of Contents
Statement of operations—year ended July 31, 2020
Investment income | ||||
Dividends (net of foreign withholding taxes of $6,638) | $ | 20,886,059 | ||
Income from affiliated securities | 137,227 | |||
Interest | 9,447 | |||
|
| |||
Total investment income | 21,032,733 | |||
|
| |||
Expenses | ||||
Management fee | 3,469,025 | |||
Administration fees | ||||
Class A | 876,976 | |||
Class C | 71,498 | |||
Class R | 6,515 | |||
Class R6 | 88,995 | |||
Administrator Class | 71,002 | |||
Institutional Class | 244,610 | |||
Shareholder servicing fees | ||||
Class A | 1,042,803 | |||
Class C | 84,974 | |||
Class R | 7,749 | |||
Administrator Class | 136,015 | |||
Distribution fees | ||||
Class C | 255,000 | |||
Class R | 7,705 | |||
Custody and accounting fees | 62,321 | |||
Professional fees | 54,447 | |||
Registration fees | 119,725 | |||
Shareholder report expenses | 107,010 | |||
Trustees’ fees and expenses | 21,002 | |||
Interest expense | 2,640 | |||
Other fees and expenses | 93,155 | |||
|
| |||
Total expenses | 6,823,167 | |||
Less: Fee waivers and/or expense reimbursements | ||||
Class A | (12,968 | ) | ||
Class C | (11 | ) | ||
Class R6 | (4,972 | ) | ||
Administrator Class | (20,094 | ) | ||
Institutional Class | (82,021 | ) | ||
|
| |||
Net expenses | 6,703,101 | |||
|
| |||
Net investment income | 14,329,632 | |||
|
| |||
Realized and unrealized gains (losses) on investments | ||||
Net realized gains (losses) on | ||||
Unaffiliated securities | 70,604,142 | |||
Affiliated securities | (1,401 | ) | ||
Futures contracts | 930,657 | |||
|
| |||
Net realized gains on investments | 71,533,398 | |||
|
| |||
Net change in unrealized gains (losses) on | ||||
Unaffiliated securities | (1,821,726 | ) | ||
Futures contracts | 452,924 | |||
|
| |||
Net change in unrealized gains (losses) on investments | (1,368,802 | ) | ||
|
| |||
Net realized and unrealized gains (losses) on investments | 70,164,596 | |||
|
| |||
Net increase in net assets resulting from operations | $ | 84,494,228 | ||
|
| |||
The accompanying notes are an integral part of these financial statements.
Wells Fargo Disciplined U.S. Core Fund | 19
Table of Contents
Statement of changes in net assets
| Year ended July 31, 2020 | Year ended July 31, 2019 | |||||||||||||||
Operations | ||||||||||||||||
Net investment income | $ | 14,329,632 | $ | 20,796,365 | ||||||||||||
Net realized gains on investments | 71,533,398 | 27,061,264 | ||||||||||||||
Net change in unrealized gains (losses) on investments | (1,368,802 | ) | (3,387,087 | ) | ||||||||||||
|
| |||||||||||||||
Net increase in net assets resulting from operations | 84,494,228 | 44,470,542 | ||||||||||||||
|
| |||||||||||||||
Distributions to shareholders from net investment income and net realized gains | ||||||||||||||||
Class A | (18,684,889 | ) | (27,282,105 | ) | ||||||||||||
Class C | (1,266,022 | ) | (2,771,228 | ) | ||||||||||||
Class R | (125,676 | ) | (201,547 | ) | ||||||||||||
Class R6 | (13,828,583 | ) | (25,476,362 | ) | ||||||||||||
Administrator Class | (2,526,202 | ) | (3,946,556 | ) | ||||||||||||
Institutional Class | (9,162,742 | ) | (24,186,334 | ) | ||||||||||||
|
| |||||||||||||||
Total distributions to shareholders | (45,594,114 | ) | (83,864,132 | ) | ||||||||||||
|
| |||||||||||||||
Capital share transactions | Shares | Shares | ||||||||||||||
Proceeds from shares sold | ||||||||||||||||
Class A | 1,168,491 | 19,900,273 | 1,886,725 | 30,921,236 | ||||||||||||
Class C | 95,422 | 1,502,772 | 472,068 | 6,869,156 | ||||||||||||
Class R | 46,128 | 784,721 | 37,989 | 635,336 | ||||||||||||
Class R6 | 2,828,938 | 48,881,704 | 3,079,018 | 48,714,888 | ||||||||||||
Administrator Class | 204,842 | 3,475,476 | 426,111 | 7,266,082 | ||||||||||||
Institutional Class | 1,095,326 | 19,014,160 | 4,282,122 | 73,227,240 | ||||||||||||
|
| |||||||||||||||
| 93,559,106 | 167,633,938 | |||||||||||||||
|
| |||||||||||||||
Reinvestment of distributions | ||||||||||||||||
Class A | 983,735 | 17,558,389 | 1,648,190 | 25,532,516 | ||||||||||||
Class C | 71,599 | 1,167,986 | 177,775 | 2,524,825 | ||||||||||||
Class R | 6,899 | 124,243 | 12,745 | 199,335 | ||||||||||||
Class R6 | 704,180 | 12,911,375 | 1,506,629 | 23,955,923 | ||||||||||||
Administrator Class | 122,596 | 2,255,074 | 235,868 | 3,758,071 | ||||||||||||
Institutional Class | 466,052 | 8,456,868 | 1,264,383 | 19,892,703 | ||||||||||||
|
| |||||||||||||||
| 42,473,935 | 75,863,373 | |||||||||||||||
|
| |||||||||||||||
Payment for shares redeemed | ||||||||||||||||
Class A | (4,165,810 | ) | (70,522,271 | ) | (5,568,268 | ) | (92,539,888 | ) | ||||||||
Class C | (864,975 | ) | (13,589,760 | ) | (1,440,204 | ) | (21,524,938 | ) | ||||||||
Class R | (41,436 | ) | (711,640 | ) | (55,966 | ) | (904,117 | ) | ||||||||
Class R6 | (9,188,798 | ) | (160,807,048 | ) | (9,937,174 | ) | (168,483,143 | ) | ||||||||
Administrator Class | (934,084 | ) | (15,485,846 | ) | (2,534,639 | ) | (43,971,874 | ) | ||||||||
Institutional Class | (9,902,961 | ) | (170,810,159 | ) | (12,205,371 | ) | (203,720,141 | ) | ||||||||
|
| |||||||||||||||
| (431,926,724 | ) | (531,144,101 | ) | |||||||||||||
|
| |||||||||||||||
Net decrease in net assets resulting from capital share transactions | (295,893,683 | ) | (287,646,790 | ) | ||||||||||||
|
| |||||||||||||||
Total decrease in net assets | (256,993,569 | ) | (327,040,380 | ) | ||||||||||||
|
| |||||||||||||||
Net assets | ||||||||||||||||
Beginning of period | 1,161,230,603 | 1,488,270,983 | ||||||||||||||
|
| |||||||||||||||
End of period | $ | 904,237,034 | $ | 1,161,230,603 | ||||||||||||
|
| |||||||||||||||
The accompanying notes are an integral part of these financial statements.
20 | Wells Fargo Disciplined U.S. Core Fund
Table of Contents
(For a share outstanding throughout each period)
| Year ended July 31 | ||||||||||||||||||||
| CLASS A | 2020 | 2019 | 2018 | 2017 | 2016 | |||||||||||||||
Net asset value, beginning of period | $17.29 | $17.70 | $16.30 | $14.50 | $15.45 | |||||||||||||||
Net investment income | 0.23 | 0.25 | 0.24 | 0.22 | 0.21 | |||||||||||||||
Net realized and unrealized gains (losses) on investments | 1.47 | 0.38 | 1.90 | 1.94 | 0.47 | |||||||||||||||
|
|
|
|
|
|
|
|
|
| |||||||||||
Total from investment operations | 1.70 | 0.63 | 2.14 | 2.16 | 0.68 | |||||||||||||||
Distributions to shareholders from | ||||||||||||||||||||
Net investment income | (0.33 | ) | (0.19 | ) | (0.15 | ) | (0.15 | ) | (0.19 | ) | ||||||||||
Net realized gains | (0.44 | ) | (0.85 | ) | (0.59 | ) | (0.21 | ) | (1.44 | ) | ||||||||||
|
|
|
|
|
|
|
|
|
| |||||||||||
Total distributions to shareholders | (0.77 | ) | (1.04 | ) | (0.74 | ) | (0.36 | ) | (1.63 | ) | ||||||||||
Net asset value, end of period | $18.22 | $17.29 | $17.70 | $16.30 | $14.50 | |||||||||||||||
Total return1 | 9.97 | % | 4.31 | % | 13.28 | % | 15.12 | % | 5.22 | % | ||||||||||
Ratios to average net assets (annualized) | ||||||||||||||||||||
Gross expenses | 0.86 | % | 0.84 | % | 0.83 | % | 0.85 | % | 0.87 | % | ||||||||||
Net expenses | 0.85 | % | 0.84 | % | 0.83 | % | 0.85 | % | 0.87 | % | ||||||||||
Net investment income | 1.25 | % | 1.40 | % | 1.33 | % | 1.45 | % | 1.60 | % | ||||||||||
Supplemental data | ||||||||||||||||||||
Portfolio turnover rate | 50 | % | 63 | % | 73 | % | 60 | % | 52 | % | ||||||||||
Net assets, end of period (000s omitted) | $421,005 | $434,367 | $480,602 | $467,491 | $412,629 | |||||||||||||||
| 1 | Total return calculations do not include any sales charges. |
The accompanying notes are an integral part of these financial statements.
Wells Fargo Disciplined U.S. Core Fund | 21
Table of Contents
Financial highlights
(For a share outstanding throughout each period)
| Year ended July 31 | ||||||||||||||||||||
| CLASS C | 2020 | 2019 | 2018 | 2017 | 2016 | |||||||||||||||
Net asset value, beginning of period | $15.85 | $16.28 | $15.04 | $13.45 | $14.50 | |||||||||||||||
Net investment income | 0.11 | 0.12 | 0.09 | 0.10 | 0.14 | |||||||||||||||
Net realized and unrealized gains (losses) on investments | 1.32 | 0.35 | 1.76 | 1.79 | 0.38 | |||||||||||||||
|
|
|
|
|
|
|
|
|
| |||||||||||
Total from investment operations | 1.43 | 0.47 | 1.85 | 1.89 | 0.52 | |||||||||||||||
Distributions to shareholders from | ||||||||||||||||||||
Net investment income | (0.14 | ) | (0.05 | ) | (0.02 | ) | (0.09 | ) | (0.13 | ) | ||||||||||
Net realized gains | (0.44 | ) | (0.85 | ) | (0.59 | ) | (0.21 | ) | (1.44 | ) | ||||||||||
|
|
|
|
|
|
|
|
|
| |||||||||||
Total distributions to shareholders | (0.58 | ) | (0.90 | ) | (0.61 | ) | (0.30 | ) | (1.57 | ) | ||||||||||
Net asset value, end of period | $16.70 | $15.85 | $16.28 | $15.04 | $13.45 | |||||||||||||||
Total return1 | 9.09 | % | 3.59 | % | 12.41 | % | 14.27 | % | 4.43 | % | ||||||||||
Ratios to average net assets (annualized) | ||||||||||||||||||||
Gross expenses | 1.60 | % | 1.59 | % | 1.58 | % | 1.60 | % | 1.62 | % | ||||||||||
Net expenses | 1.60 | % | 1.59 | % | 1.58 | % | 1.60 | % | 1.62 | % | ||||||||||
Net investment income | 0.51 | % | 0.66 | % | 0.58 | % | 0.69 | % | 0.82 | % | ||||||||||
Supplemental data | ||||||||||||||||||||
Portfolio turnover rate | 50 | % | 63 | % | 73 | % | 60 | % | 52 | % | ||||||||||
Net assets, end of period (000s omitted) | $29,141 | $38,708 | $52,647 | $54,054 | $46,801 | |||||||||||||||
| 1 | Total return calculations do not include any sales charges. |
The accompanying notes are an integral part of these financial statements.
22 | Wells Fargo Disciplined U.S. Core Fund
Table of Contents
Financial highlights
(For a share outstanding throughout each period)
| Year ended July 31 | ||||||||||||||||||||
| CLASS R | 2020 | 2019 | 2018 | 2017 | 20161 | |||||||||||||||
Net asset value, beginning of period | $17.44 | $17.88 | $16.51 | $14.77 | $14.62 | |||||||||||||||
Net investment income | 0.18 | 0.19 | 2 | 0.18 | 2 | 0.17 | 2 | 0.13 | 2 | |||||||||||
Net realized and unrealized gains (losses) on investments | 1.49 | 0.41 | 1.94 | 1.99 | 1.72 | |||||||||||||||
|
|
|
|
|
|
|
|
|
| |||||||||||
Total from investment operations | 1.67 | 0.60 | 2.12 | 2.16 | 1.85 | |||||||||||||||
Distributions to shareholders from | ||||||||||||||||||||
Net investment income | (0.29 | ) | (0.19 | ) | (0.16 | ) | (0.21 | ) | (0.26 | ) | ||||||||||
Net realized gains | (0.44 | ) | (0.85 | ) | (0.59 | ) | (0.21 | ) | (1.44 | ) | ||||||||||
|
|
|
|
|
|
|
|
|
| |||||||||||
Total distributions to shareholders | (0.73 | ) | (1.04 | ) | (0.75 | ) | (0.42 | ) | (1.70 | ) | ||||||||||
Net asset value, end of period | $18.38 | $17.44 | $17.88 | $16.51 | $14.77 | |||||||||||||||
Total return3 | 9.68 | % | 4.07 | % | 12.97 | % | 14.86 | % | 13.56 | % | ||||||||||
Ratios to average net assets (annualized) | ||||||||||||||||||||
Gross expenses | 1.10 | % | 1.09 | % | 1.08 | % | 1.10 | % | 1.12 | % | ||||||||||
Net expenses | 1.10 | % | 1.09 | % | 1.08 | % | 1.10 | % | 1.12 | % | ||||||||||
Net investment income | 0.97 | % | 1.15 | % | 1.04 | % | 1.10 | % | 1.12 | % | ||||||||||
Supplemental data | ||||||||||||||||||||
Portfolio turnover rate | 50 | % | 63 | % | 73 | % | 60 | % | 52 | % | ||||||||||
Net assets, end of period (000s omitted) | $3,507 | $3,126 | $3,298 | $2,001 | $201 | |||||||||||||||
| 1 | For the period from September 30, 2015 (commencement of class operations) to July 31, 2016 |
| 2 | Calculated based upon average shares outstanding |
| 3 | Returns for periods of less than one year are not annualized. |
The accompanying notes are an integral part of these financial statements.
Wells Fargo Disciplined U.S. Core Fund | 23
Table of Contents
Financial highlights
(For a share outstanding throughout each period)
| Year ended July 31 | ||||||||||||||||||||
| CLASS R6 | 2020 | 2019 | 2018 | 2017 | 20161 | |||||||||||||||
Net asset value, beginning of period | $17.76 | $18.17 | $16.71 | $14.86 | $14.62 | |||||||||||||||
Net investment income | 0.31 | 0.32 | 0.30 | 2 | 0.28 | 2 | 0.22 | 2 | ||||||||||||
Net realized and unrealized gains (losses) on investments | 1.51 | 0.40 | 1.97 | 1.99 | 1.72 | |||||||||||||||
|
|
|
|
|
|
|
|
|
| |||||||||||
Total from investment operations | 1.82 | 0.72 | 2.27 | 2.27 | 1.94 | |||||||||||||||
Distributions to shareholders from | ||||||||||||||||||||
Net investment income | (0.42 | ) | (0.28 | ) | (0.22 | ) | (0.21 | ) | (0.26 | ) | ||||||||||
Net realized gains | (0.44 | ) | (0.85 | ) | (0.59 | ) | (0.21 | ) | (1.44 | ) | ||||||||||
|
|
|
|
|
|
|
|
|
| |||||||||||
Total distributions to shareholders | (0.86 | ) | (1.13 | ) | (0.81 | ) | (0.42 | ) | (1.70 | ) | ||||||||||
Net asset value, end of period | $18.72 | $17.76 | $18.17 | $16.71 | $14.86 | |||||||||||||||
Total return3 | 10.39 | % | 4.77 | % | 13.78 | % | 15.56 | % | 14.24 | % | ||||||||||
Ratios to average net assets (annualized) | ||||||||||||||||||||
Gross expenses | 0.43 | % | 0.41 | % | 0.40 | % | 0.42 | % | 0.44 | % | ||||||||||
Net expenses | 0.42 | % | 0.41 | % | 0.40 | % | 0.42 | % | 0.43 | % | ||||||||||
Net investment income | 1.70 | % | 1.84 | % | 1.71 | % | 1.77 | % | 1.88 | % | ||||||||||
Supplemental data | ||||||||||||||||||||
Portfolio turnover rate | 50 | % | 63 | % | 73 | % | 60 | % | 52 | % | ||||||||||
Net assets, end of period (000s omitted) | $253,223 | $340,606 | $445,678 | $41,770 | $4,024 | |||||||||||||||
| 1 | For the period from September 30, 2015 (commencement of class operations) to July 31, 2016 |
| 2 | Calculated based upon average shares outstanding |
| 3 | Returns for periods of less than one year are not annualized. |
The accompanying notes are an integral part of these financial statements.
24 | Wells Fargo Disciplined U.S. Core Fund
Table of Contents
Financial highlights
(For a share outstanding throughout each period)
| Year ended July 31 | ||||||||||||||||||||
| ADMINISTRATOR CLASS | 2020 | 2019 | 2018 | 2017 | 2016 | |||||||||||||||
Net asset value, beginning of period | $17.80 | $18.17 | $16.71 | $14.85 | $15.80 | |||||||||||||||
Net investment income | 0.24 | 1 | 0.26 | 1 | 0.25 | 1 | 0.25 | 1 | 0.24 | 1 | ||||||||||
Net realized and unrealized gains (losses) on investments | 1.53 | 0.41 | 1.97 | 1.98 | 0.48 | |||||||||||||||
|
|
|
|
|
|
|
|
|
| |||||||||||
Total from investment operations | 1.77 | 0.67 | 2.22 | 2.23 | 0.72 | |||||||||||||||
Distributions to shareholders from | ||||||||||||||||||||
Net investment income | (0.35 | ) | (0.19 | ) | (0.17 | ) | (0.16 | ) | (0.23 | ) | ||||||||||
Net realized gains | (0.44 | ) | (0.85 | ) | (0.59 | ) | (0.21 | ) | (1.44 | ) | ||||||||||
|
|
|
|
|
|
|
|
|
| |||||||||||
Total distributions to shareholders | (0.79 | ) | (1.04 | ) | (0.76 | ) | (0.37 | ) | (1.67 | ) | ||||||||||
Net asset value, end of period | $18.78 | $17.80 | $18.17 | $16.71 | $14.85 | |||||||||||||||
Total return | 10.08 | % | 4.43 | % | 13.40 | % | 15.24 | % | 5.36 | % | ||||||||||
Ratios to average net assets (annualized) | ||||||||||||||||||||
Gross expenses | 0.77 | % | 0.76 | % | 0.75 | % | 0.77 | % | 0.78 | % | ||||||||||
Net expenses | 0.74 | % | 0.74 | % | 0.74 | % | 0.74 | % | 0.74 | % | ||||||||||
Net investment income | 1.37 | % | 1.50 | % | 1.42 | % | 1.60 | % | 1.71 | % | ||||||||||
Supplemental data | ||||||||||||||||||||
Portfolio turnover rate | 50 | % | 63 | % | 73 | % | 60 | % | 52 | % | ||||||||||
Net assets, end of period (000s omitted) | $50,655 | $58,808 | $94,058 | $94,294 | $116,807 | |||||||||||||||
| 1 | Calculated based upon average shares outstanding |
The accompanying notes are an integral part of these financial statements.
Wells Fargo Disciplined U.S. Core Fund | 25
Table of Contents
Financial highlights
(For a share outstanding throughout each period)
| Year ended July 31 | ||||||||||||||||||||
| INSTITUTIONAL CLASS | 2020 | 2019 | 2018 | 2017 | 2016 | |||||||||||||||
Net asset value, beginning of period | $17.57 | $17.98 | $16.55 | $14.72 | $15.66 | |||||||||||||||
Net investment income | 0.29 | 1 | 0.30 | 1 | 0.28 | 0.27 | 1 | 0.28 | 1 | |||||||||||
Net realized and unrealized gains (losses) on investments | 1.51 | 0.40 | 1.95 | 1.98 | 0.47 | |||||||||||||||
|
|
|
|
|
|
|
|
|
| |||||||||||
Total from investment operations | 1.80 | 0.70 | 2.23 | 2.25 | 0.75 | |||||||||||||||
Distributions to shareholders from | ||||||||||||||||||||
Net investment income | (0.39 | ) | (0.26 | ) | (0.21 | ) | (0.21 | ) | (0.25 | ) | ||||||||||
Net realized gains | (0.44 | ) | (0.85 | ) | (0.59 | ) | (0.21 | ) | (1.44 | ) | ||||||||||
|
|
|
|
|
|
|
|
|
| |||||||||||
Total distributions to shareholders | (0.83 | ) | (1.11 | ) | (0.80 | ) | (0.42 | ) | (1.69 | ) | ||||||||||
Net asset value, end of period | $18.54 | $17.57 | $17.98 | $16.55 | $14.72 | |||||||||||||||
Total return | 10.39 | % | 4.69 | % | 13.65 | % | 15.51 | % | 5.64 | % | ||||||||||
Ratios to average net assets (annualized) | ||||||||||||||||||||
Gross expenses | 0.52 | % | 0.51 | % | 0.50 | % | 0.52 | % | 0.54 | % | ||||||||||
Net expenses | 0.48 | % | 0.48 | % | 0.48 | % | 0.48 | % | 0.48 | % | ||||||||||
Net investment income | 1.67 | % | 1.77 | % | 1.67 | % | 1.76 | % | 1.96 | % | ||||||||||
Supplemental data | ||||||||||||||||||||
Portfolio turnover rate | 50 | % | 63 | % | 73 | % | 60 | % | 52 | % | ||||||||||
Net assets, end of period (000s omitted) | $146,707 | $285,616 | $411,988 | $353,573 | $163,674 | |||||||||||||||
| 1 | Calculated based upon average shares outstanding |
The accompanying notes are an integral part of these financial statements.
26 | Wells Fargo Disciplined U.S. Core Fund
Table of Contents
1. ORGANIZATION
Wells Fargo Funds Trust (the “Trust”), a Delaware statutory trust organized on March 10, 1999, is an open-end management investment company registered under the Investment Company Act of 1940, as amended (the “1940 Act”). As an investment company, the Trust follows the accounting and reporting guidance in Financial Accounting Standards Board (“FASB”) Accounting Standards Codification Topic 946, Financial Services – Investment Companies. These financial statements report on the Wells Fargo Disciplined U.S. Core Fund (the “Fund”) which is a diversified series of the Trust.
2. SIGNIFICANT ACCOUNTING POLICIES
The following significant accounting policies, which are consistently followed in the preparation of the financial statements of the Fund, are in conformity with U.S. generally accepted accounting principles which require management to make estimates and assumptions that affect the reported amounts of assets and liabilities, disclosure of contingent assets and liabilities at the date of the financial statements, and the reported amounts of revenues and expenses during the reporting period. Actual results could differ from those estimates.
Securities valuation
All investments are valued each business day as of the close of regular trading on the New York Stock Exchange (generally 4 p.m. Eastern Time), although the Fund may deviate from this calculation time under unusual or unexpected circumstances.
Equity securities and futures contracts that are listed on a foreign or domestic exchange or market are valued at the official closing price or, if none, the last sales price. If no sale occurs on the principal exchange or market that day, a fair value price will be determined in accordance with the Fund’s Valuation Procedures.
Debt securities are valued at the evaluated bid price provided by an independent pricing service (e.g. taking into account various factors, including yields, maturities, or credit ratings) or, if a reliable price is not available, the quoted bid price from an independent broker-dealer.
Investments in registered open-end investment companies are valued at net asset value. Interests in non-registered investment companies that are redeemable at net asset value are fair valued normally at net asset value.
Investments which are not valued using any of the methods discussed above are valued at their fair value, as determined in good faith by the Board of Trustees of the Fund. The Board of Trustees has established a Valuation Committee comprised of the Trustees and has delegated to it the authority to take any actions regarding the valuation of portfolio securities that the Valuation Committee deems necessary or appropriate, including determining the fair value of portfolio securities, unless the determination has been delegated to the Wells Fargo Asset Management Pricing Committee at Wells Fargo Funds Management, LLC (“Funds Management”). The Board of Trustees retains the authority to make or ratify any valuation decisions or approve any changes to the Valuation Procedures as it deems appropriate. On a quarterly basis, the Board of Trustees receives reports on any valuation actions taken by the Valuation Committee or the Wells Fargo Asset Management Pricing Committee which may include items for ratification.
Securities lending
The Fund may lend its securities from time to time in order to earn additional income in the form of fees or interest on securities received as collateral or the investment of any cash received as collateral. When securities are on loan, the Fund receives interest or dividends on those securities. Cash collateral received in connection with its securities lending transactions is invested in Securities Lending Cash Investments, LLC (the “Securities Lending Fund”). Investments in Securities Lending Fund are valued at the evaluated bid price provided by an independent pricing service. Income earned from investment in the Securities Lending Fund (net of fees and rebates), if any, is included in income from affiliated securities on the Statement of Operations.
In a securities lending transaction, the net asset value of the Fund is affected by an increase or decrease in the value of the securities loaned and by an increase or decrease in the value of the instrument in which collateral is invested. The amount of securities lending activity undertaken by the Fund fluctuates from time to time. The Fund has the right under the lending agreement to recover the securities from the borrower on demand. In the event of default or bankruptcy by the borrower, the Fund may be prevented from recovering the loaned securities or gaining access to the collateral or may experience delays or costs in doing so. In such an event, the terms of the agreement allow the unaffiliated securities lending agent to use the collateral to purchase replacement securities on behalf of the Fund or pay the Fund the market value of the loaned securities. The Fund bears the risk of loss with respect to depreciation of its investment of the cash collateral.
Futures contracts
Futures contracts are agreements between the Fund and a counterparty to buy or sell a specific amount of a commodity, financial instrument or currency at a specified price and on a specified date. The Fund may buy and sell futures contracts in
Wells Fargo Disciplined U.S. Core Fund | 27
Table of Contents
Notes to financial statements
order to gain exposure to, or protect against, changes in security values and is subject to equity price risk. The primary risks associated with the use of futures contracts are the imperfect correlation between changes in market values of securities held by the Fund and the prices of futures contracts, and the possibility of an illiquid market. Futures contracts are generally entered into on a regulated futures exchange and cleared through a clearinghouse associated with the exchange. With futures contracts, there is minimal counterparty risk to the Fund since futures contracts are exchange traded and the exchange’s clearinghouse, as the counterparty to all exchange traded futures, guarantees the futures contracts against default.
Upon entering into a futures contracts, the Fund is required to deposit either cash or securities (initial margin) with the broker in an amount equal to a certain percentage of the contract value. Subsequent payments (variation margin) are paid to or from the broker each day equal to the daily changes in the contract value. Such payments are recorded as unrealized gains or losses and, if any, shown as variation margin receivable (payable) in the Statement of Assets and Liabilities. Should the Fund fail to make requested variation margin payments, the broker can gain access to the initial margin to satisfy the Fund’s payment obligations. When the contracts are closed, a realized gain or loss is recorded in the Statement of Operations.
Security transactions and income recognition
Securities transactions are recorded on a trade date basis. Realized gains or losses are recorded on the basis of identified cost.
Interest income is accrued daily and bond discounts are accreted and premiums are amortized daily. To the extent debt obligations are placed on non-accrual status, any related interest income may be reduced by writing off interest receivables when the collection of all or a portion of interest has been determined to be doubtful based on consistently applied procedures and the fair value has decreased. If the issuer subsequently resumes interest payments or when the collectability of interest is reasonably assured, the debt obligation is removed from non-accrual status.
Dividend income is recognized on the ex-dividend date. Dividend income is recorded net of foreign taxes withheld where recovery of such taxes is not assured.
Distributions to shareholders
Distributions to shareholders from net investment income and any net realized gains are recorded on the ex-dividend date and paid at least annually. Such distributions are determined in accordance with income tax regulations and may differ from U.S. generally accepted accounting principles. Dividend sources are estimated at the time of declaration. The tax character of distributions is determined as of the Fund’s fiscal year end. Therefore, a portion of the Fund’s distributions made prior to the Fund’s fiscal year end may be categorized as a tax return of capital at year end.
Federal and other taxes
The Fund intends to continue to qualify as a regulated investment company by distributing substantially all of its investment company taxable income and any net realized capital gains (after reduction for capital loss carryforwards) sufficient to relieve it from all, or substantially all, federal income taxes. Accordingly, no provision for federal income taxes was required.
The Fund’s income and federal excise tax returns and all financial records supporting those returns for the prior three fiscal years are subject to examination by the federal and Delaware revenue authorities. Management has analyzed the Fund’s tax positions taken on federal, state, and foreign tax returns for all open tax years and does not believe that there are any uncertain tax positions that require recognition of a tax liability.
As of July 31, 2020, the aggregate cost of all investments for federal income tax purposes was $588,204,212 and the unrealized gains (losses) consisted of:
Gross unrealized gains | $ | 346,291,614 | ||
Gross unrealized losses | (30,802,338 | ) | ||
Net unrealized gains | $ | 315,489,276 | ||
Class allocations
The separate classes of shares offered by the Fund differ principally in applicable sales charges, distribution, shareholder servicing, and administration fees. Class specific expenses are charged directly to that share class. Investment income, common fund-level expenses, and realized and unrealized gains (losses) on investments are allocated daily to each class of shares based on the relative proportion of net assets of each class.
28 | Wells Fargo Disciplined U.S. Core Fund
Table of Contents
Notes to financial statements
3. FAIR VALUATION MEASUREMENTS
Fair value measurements of investments are determined within a framework that has established a fair value hierarchy based upon the various data inputs utilized in determining the value of the Fund’s investments. The three-level hierarchy gives the highest priority to unadjusted quoted prices in active markets for identical assets or liabilities (Level 1) and the lowest priority to unobservable inputs (Level 3). The Fund’s investments are classified within the fair value hierarchy based on the lowest level of input that is significant to the fair value measurement. The inputs are summarized into three broad levels as follows:
| ∎ | Level 1 – quoted prices in active markets for identical securities |
| ∎ | Level 2 – other significant observable inputs (including quoted prices for similar securities, interest rates, prepayment speeds, credit risk, etc.) |
| ∎ | Level 3 – significant unobservable inputs (including the Fund’s own assumptions in determining the fair value of investments) |
The inputs or methodologies used for valuing investments in securities are not necessarily an indication of the risk associated with investing in those securities.
The following is a summary of the inputs used in valuing the Fund’s assets and liabilities as of July 31, 2020:
| Quoted prices (Level 1) | Other significant observable inputs (Level 2) | Significant (Level 3) | Total | |||||||||||||
Assets | ||||||||||||||||
Investments in: | ||||||||||||||||
Common stocks | ||||||||||||||||
Communication services | $ | 91,931,174 | $ | 0 | $ | 0 | $ | 91,931,174 | ||||||||
Consumer discretionary | 107,148,861 | 0 | 0 | 107,148,861 | ||||||||||||
Consumer staples | 62,081,749 | 0 | 0 | 62,081,749 | ||||||||||||
Energy | 22,342,673 | 0 | 0 | 22,342,673 | ||||||||||||
Financials | 88,398,405 | 0 | 0 | 88,398,405 | ||||||||||||
Health care | 135,009,415 | 0 | 0 | 135,009,415 | ||||||||||||
Industrials | 65,896,314 | 0 | 0 | 65,896,314 | ||||||||||||
Information technology | 252,102,375 | 0 | 0 | 252,102,375 | ||||||||||||
Materials | 14,419,597 | 0 | 0 | 14,419,597 | ||||||||||||
Real estate | 25,306,046 | 0 | 0 | 25,306,046 | ||||||||||||
Utilities | 21,988,609 | 0 | 0 | 21,988,609 | ||||||||||||
Short-term investments | ||||||||||||||||
Investment companies | 15,915,451 | 0 | 0 | 15,915,451 | ||||||||||||
U.S. Treasury securities | 699,895 | 0 | 0 | 699,895 | ||||||||||||
| 903,240,564 | 0 | 0 | 903,240,564 | |||||||||||||
Futures contracts | 452,924 | 0 | 0 | 452,924 | ||||||||||||
Total assets | $ | 903,693,488 | $ | 0 | $ | 0 | $ | 903,693,488 | ||||||||
Additional sector, industry or geographic detail is included in the Portfolio of Investments.
Futures contracts are reported at their cumulative unrealized gains (losses) at measurement date as reported in the table following the Portfolio of Investments. For futures contracts, the current day’s variation margin is reported on the Statement of Assets and Liabilities. All other assets and liabilities are reported at their market value at measurement date.
For the year ended July 31, 2020, the Fund did not have any transfers into/out of Level 3.
4. TRANSACTIONS WITH AFFILIATES
Management fee
Funds Management, an indirect wholly owned subsidiary of Wells Fargo & Company (“Wells Fargo”), is the manager of the Fund and provides advisory and fund-level administrative services under an investment management agreement. Under the investment management agreement, Funds Management is responsible for, among other services, implementing the investment objectives and strategies of the Fund, supervising the subadviser and providing fund-level administrative services in connection
Wells Fargo Disciplined U.S. Core Fund | 29
Table of Contents
Notes to financial statements
with the Fund’s operations. As compensation for its services under the investment management agreement, Funds Management is entitled to receive a management fee at the following annual rate based on the Fund’s average daily net assets:
| Average daily net assets | Management fee | |||
First $1 billion | 0.350 | % | ||
Next $4 billion | 0.325 | |||
Next $5 billion | 0.290 | |||
Over $10 billion | 0.280 | |||
For the year ended July 31, 2020, the management fee was equivalent to an annual rate of 0.35% of the Fund’s average daily net assets.
Funds Management has retained the services of a subadviser to provide daily portfolio management to the Fund. The fee for subadvisory services is borne by Funds Management. Wells Capital Management Incorporated (“WellsCap”), an affiliate of Funds Management and an indirect wholly owned subsidiary of Wells Fargo, is subadviser to the Fund and is entitled to receive a fee from Funds Management at an annual rate starting at 0.25% and declining to 0.15% as the average daily net assets of the Fund increase.
Administration fees
Under a class-level administration agreement, Funds Management provides class-level administrative services to the Fund, which includes paying fees and expenses for services provided by the transfer agent, sub-transfer agents, omnibus account servicers and record-keepers. As compensation for its services under the class-level administration agreement, Funds Management receives an annual fee which is calculated based on the average daily net assets of each class as follows:
| Class-level administration fee | ||||
Class A, Class C, Class R | 0.21 | % | ||
Class R6 | 0.03 | |||
Administrator Class, Institutional Class | 0.13 | |||
Waivers and/or expense reimbursements
Funds Management has contractually waived and/or reimbursed management and administration fees to the extent necessary to maintain certain net operating expense ratios for the Fund. When each class of the Fund has exceeded its expense cap, Funds Management has waived fees and/or reimbursed expenses from fund-level expenses on a proportionate basis and then from class specific expenses. When only certain classes exceed their expense caps, waivers and/or reimbursements are applied against class specific expenses before fund-level expenses. Funds Management has committed through November 30, 2020 to waive fees and/or reimburse expenses to the extent necessary to cap the Fund’s expenses at 0.87% for Class A shares, 1.62% for Class C shares, 1.12% for Class R shares, 0.43% for Class R6 shares, 0.74% for Administrator Class shares, and 0.48% for Institutional Class shares. Prior to or after the commitment expiration date, the cap may be increased or the commitment to maintain the cap may be terminated only with the approval of the Board of Trustees.
Distribution fees
The Trust has adopted a distribution plan for Class C and Class R shares of the Fund pursuant to Rule 12b-1 under the 1940 Act. Distribution fees are charged to Class C and Class R shares and paid to Wells Fargo Funds Distributor, LLC (“Funds Distributor”), the principal underwriter, at an annual rate of 0.75% of the average daily net assets of Class C shares and 0.25% of the average daily net assets of Class R shares.
In addition, Funds Distributor is entitled to receive the front-end sales charge from the purchase of Class A shares and a contingent deferred sales charge on the redemption of certain Class A shares. Funds Distributor is also entitled to receive the contingent deferred sales charges from redemptions of Class C shares. For the year ended July 31, 2020, Funds Distributor received $7,246 from the sale of Class A shares and $45 in contingent deferred sales charges from redemptions of Class C shares. No contingent deferred sales charges were incurred by Class A shares for the year ended July 31, 2020.
Shareholder servicing fees
The Trust has entered into contracts with one or more shareholder servicing agents, whereby Class A, Class C, Class R, and Administrator Class of the Fund are charged a fee at an annual rate of 0.25% of the average daily net assets of each respective class. A portion of these total shareholder servicing fees were paid to affiliates of Wells Fargo.
30 | Wells Fargo Disciplined U.S. Core Fund
Table of Contents
Notes to financial statements
Interfund transactions
The Fund may purchase or sell portfolio investment securities to certain other Wells Fargo affiliates pursuant to Rule 17a-7 under the 1940 Act and under procedures adopted by the Board of Trustees. The procedures have been designed to ensure that these interfund transactions, which do not incur broker commissions, are effected at current market prices.
5. INVESTMENT PORTFOLIO TRANSACTIONS
Purchases and sales of investments, excluding U.S. government obligations (if any) and short-term securities, for the year ended July 31, 2020 were $485,091,042 and $819,657,602, respectively.
6. SECURITIES LENDING TRANSACTIONS
The Fund lends its securities through an unaffiliated securities lending agent and receives collateral in the form of cash or securities with a value at least equal to the value of the securities on loan. The value of the loaned securities is determined at the close of each business day and any increases or decreases in the required collateral are exchanged between the Fund and the counterparty on the next business day. Cash collateral received is invested in the Securities Lending Fund which seeks to provide a positive return compared to the daily Federal Funds Open Rate by investing in high-quality, U.S. dollar-denominated short-term money market instruments and is exempt from registration under Section 3(c)(7) of the 1940 Act. Securities Lending Fund is managed by Funds Management and is subadvised by WellsCap. Funds Management receives an advisory fee starting at 0.05% and declining to 0.01% as the average daily net assets of the Securities Lending Fund increase. All of the fees received by Funds Management are paid to WellsCap for its services as subadviser.
In the event of counterparty default or the failure of a borrower to return a loaned security, the Fund has the right to use the collateral to offset any losses incurred. As of July 31, 2020, the Fund did not have any securities on loan.
7. DERIVATIVE TRANSACTIONS
During the year ended July 31, 2020, the Fund entered into futures contracts for to gain market exposure. The Fund had an average notional amount of $7,054,992 in long futures contracts during the year ended July 31, 2020.
The fair value, realized gains or losses and change in unrealized gains or losses, if any, on derivative instruments are reflected in the corresponding financial statement captions.
8. BANK BORROWINGS
The Trust (excluding the money market funds), Wells Fargo Master Trust and Wells Fargo Variable Trust are parties to a $350,000,000 revolving credit agreement whereby the Fund is permitted to use bank borrowings for temporary or emergency purposes, such as to fund shareholder redemption requests. Interest under the credit agreement is charged to the Fund based on a borrowing rate equal to the higher of the Federal Funds rate in effect on that day plus 1.25% or the overnight LIBOR rate in effect on that day plus 1.25%. In addition, an annual commitment fee equal to 0.25% of the unused balance is allocated to each participating fund.
During the year ended July 31, 2020, the Fund had average borrowings outstanding of $76,968 at an average interest rate of 3.43% and paid interest in the amount of $2,640.
9. DISTRIBUTIONS TO SHAREHOLDERS
The tax character of distributions paid during the years ended July 31, 2020 and July 31, 2019 were as follows:
| Year ended July 31 | ||||||||
| 2020 | 2019 | |||||||
Ordinary income | $ | 20,794,580 | $ | 19,978,044 | ||||
Long-term capital gain | 24,799,534 | 63,886,088 | ||||||
As of July 31, 2020, the components of distributable earnings on a tax basis were as follows:
Undistributed ordinary income | Undistributed long-term gain | Unrealized gains | ||
| $18,004,981 | $67,624,612 | $315,489,276 | ||
Wells Fargo Disciplined U.S. Core Fund | 31
Table of Contents
Notes to financial statements
10. CONCENTRATION RISK
Concentration risks result from exposure to a limited number of sectors. As of the end of the period, the Fund invested a concentration of its portfolio in the information technology sector. A fund that invests a substantial portion of its assets in any sector may be more affected by changes in that sector than would be a fund whose investments are not heavily weighted in any sector.
11. INDEMNIFICATION
Under the Fund’s organizational documents, the officers and Trustees have been granted certain indemnification rights against certain liabilities that may arise out of performance of their duties to the Fund. The Fund has entered into a separate agreement with each Trustee that converts indemnification rights currently existing under the Fund’s organizational documents into contractual rights that cannot be changed in the future without the consent of the Trustee. Additionally, in the normal course of business, the Fund may enter into contracts with service providers that contain a variety of indemnification clauses. The Fund’s maximum exposure under these arrangements is dependent on future claims that may be made against the Fund and, therefore, cannot be estimated.
12. NEW ACCOUNTING PRONOUNCEMENT
In August 2018, FASB issued Accounting Standards Update (“ASU”) No. 2018-13, Fair Value Measurement (Topic 820) Disclosure Framework—Changes to the Disclosure Requirements for Fair Value Measurement. ASU 2018-13 updates the disclosure requirements on fair value measurements in Topic 820, Fair Value Measurements. The amendments are effective for fiscal years, and interim periods within those fiscal years, beginning after December 15, 2019. Management has adopted this guidance which did not have a material impact on the financial statements.
13. CORONAVIRUS (COVID-19) PANDEMIC
On March 11, 2020, the World Health Organization announced that it had made the assessment that coronavirus disease 2019 (“COVID-19”) is a pandemic. The impacts of COVID-19 are adversely affecting the entire global economy, individual companies and investment products, and the market in general. There is significant uncertainty around the extent and duration of business disruptions related to COVID-19 and the impacts may be short term or may last for an extended period of time. The risk of further spreading of COVID-19 has led to significant uncertainty and volatility in the financial markets.
32 | Wells Fargo Disciplined U.S. Core Fund
Table of Contents
Report of independent registered public accounting firm
To the Shareholders of the Fund and Board of Trustees
Wells Fargo Funds Trust:
Opinion on the Financial Statements
We have audited the accompanying statement of assets and liabilities of Wells Fargo Disciplined U.S. Core Fund (the Fund), one of the funds constituting Wells Fargo Funds Trust, including the portfolio of investments, as of July 31, 2020, the related statement of operations for the year then ended, the statements of changes in net assets for each of the years in the two-year period then ended, and the related notes (collectively, the financial statements) and the financial highlights for each of the years or periods in the five-year period then ended. In our opinion, the financial statements and financial highlights present fairly, in all material respects, the financial position of the Fund as of July 31, 2020, the results of its operations for the year then ended, the changes in its net assets for each of the years in the two-year period then ended, and the financial highlights for each of the years or periods in the five-year period then ended, in conformity with U.S. generally accepted accounting principles.
Basis for Opinion
These financial statements and financial highlights are the responsibility of the Fund’s management. Our responsibility is to express an opinion on these financial statements and financial highlights based on our audits. We are a public accounting firm registered with the Public Company Accounting Oversight Board (United States) (PCAOB) and are required to be independent with respect to the Fund in accordance with the U.S. federal securities laws and the applicable rules and regulations of the Securities and Exchange Commission and the PCAOB.
We conducted our audits in accordance with the standards of the PCAOB. Those standards require that we plan and perform the audit to obtain reasonable assurance about whether the financial statements and financial highlights are free of material misstatement, whether due to error or fraud. Our audits included performing procedures to assess the risks of material misstatement of the financial statements and financial highlights, whether due to error or fraud, and performing procedures that respond to those risks. Such procedures included examining, on a test basis, evidence regarding the amounts and disclosures in the financial statements and financial highlights. Such procedures also included confirmation of securities owned as of July 31, 2020, by correspondence with the custodian, transfer agent, and brokers. Our audits also included evaluating the accounting principles used and significant estimates made by management, as well as evaluating the overall presentation of the financial statements and financial highlights. We believe that our audits provide a reasonable basis for our opinion.

We have not been able to determine the specific year that we began serving as the auditor of one or more Wells Fargo Funds investment companies; however we are aware that we have served as the auditor of one or more Wells Fargo Funds investment companies since at least 1955.
Boston, Massachusetts
September 25, 2020
Wells Fargo Disciplined U.S. Core Fund | 33
Table of Contents
TAX INFORMATION
For corporate shareholders, pursuant to Section 854 of the Internal Revenue Code, 100% of ordinary income dividends qualify for the corporate dividends-received deduction for the fiscal year ended July 31, 2020.
Pursuant to Section 852 of the Internal Revenue Code, $24,799,534 was designated as a 20% rate gain distribution for the fiscal year ended July 31, 2020.
Pursuant to Section 854 of the Internal Revenue Code, $20,794,580 of income dividends paid during the fiscal year ended July 31, 2020 has been designated as qualified dividend income (QDI).
PROXY VOTING INFORMATION
A description of the policies and procedures used to determine how to vote proxies relating to portfolio securities is available, upon request, by calling 1-800-222-8222, visiting our website at wfam.com, or visiting the SEC website at sec.gov. Information regarding how the proxies related to portfolio securities were voted during the most recent 12-month period ended June 30 is available on the website at wfam.com or by visiting the SEC website at sec.gov.
QUARTERLY PORTFOLIO HOLDINGS INFORMATION
The Fund files its complete schedule of portfolio holdings with the SEC for the first and third quarters of each fiscal year as an exhibit to its reports on Form N-PORT. Shareholders may view the filed Form N-PORT by visiting the SEC website at sec.gov.
34 | Wells Fargo Disciplined U.S. Core Fund
Table of Contents
Other information (unaudited)
BOARD OF TRUSTEES AND OFFICERS
Each of the Trustees and Officers1 listed in the table below acts in identical capacities for each fund in the Wells Fargo family of funds, which consists of 147 mutual funds comprising the Wells Fargo Funds Trust, Wells Fargo Variable Trust, Wells Fargo Master Trust and four closed-end funds (collectively the “Fund Complex”). This table should be read in conjunction with the Prospectus and the Statement of Additional Information2. The mailing address of each Trustee and Officer is 525 Market Street, 12th Floor, San Francisco, CA 94105. Each Trustee and Officer serves an indefinite term, however, each Trustee serves such term until reaching the mandatory retirement age established by the Trustees.
Independent Trustees
Name and year of birth | Position held and length of service* | Principal occupations during past five years or longer | Current other public company or investment company directorships | |||
William R. Ebsworth (Born 1957) | Trustee, since 2015 | Retired. From 1984 to 2013, equities analyst, portfolio manager, research director and chief investment officer at Fidelity Management and Research Company in Boston, Tokyo, and Hong Kong, and retired in 2013 as Chief Investment Officer of Fidelity Strategic Advisers, Inc. where he led a team of investment professionals managing client assets. Prior thereto, Board member of Hong Kong Securities Clearing Co., Hong Kong Options Clearing Corp., the Thailand International Fund, Ltd., Fidelity Investments Life Insurance Company, and Empire Fidelity Investments Life Insurance Company. Audit Committee Chair and Investment Committee Chair of the Vincent Memorial Hospital Endowment (non-profit organization). Mr. Ebsworth is a CFA® charterholder. | N/A | |||
Jane A. Freeman (Born 1953) | Trustee, since 2015; Chair Liaison, since 2018 | Retired. From 2012 to 2014 and 1999 to 2008, Chief Financial Officer of Scientific Learning Corporation. From 2008 to 2012, Ms. Freeman provided consulting services related to strategic business projects. Prior to 1999, Portfolio Manager at Rockefeller & Co. and Scudder, Stevens & Clark. Board member of the Harding Loevner Funds from 1996 to 2014, serving as both Lead Independent Director and chair of the Audit Committee. Board member of the Russell Exchange Traded Funds Trust from 2011 to 2012 and the chair of the Audit Committee. Ms. Freeman is also an inactive Chartered Financial Analyst. | N/A | |||
Isaiah Harris, Jr. (Born 1952) | Trustee, since 2009; Audit Committee Chairman, since 2019 | Retired. Chairman of the Board of CIGNA Corporation since 2009, and Director since 2005. From 2003 to 2011, Director of Deluxe Corporation. Prior thereto, President and CEO of BellSouth Advertising and Publishing Corp. from 2005 to 2007, President and CEO of BellSouth Enterprises from 2004 to 2005 and President of BellSouth Consumer Services from 2000 to 2003. Emeritus member of the Iowa State University Foundation Board of Governors. Emeritus Member of the Advisory Board of Iowa State University School of Business. Advisory Board Member, Palm Harbor Academy (private school). Advisory Board Member, Child Evangelism Fellowship (non-profit). Mr. Harris is a certified public accountant (inactive status). | CIGNA Corporation | |||
Judith M. Johnson (Born 1949) | Trustee, since 2008; Audit Committee Chairman, from 2009 to 2018 | Retired. Prior thereto, Chief Executive Officer and Chief Investment Officer of Minneapolis Employees Retirement Fund from 1996 to 2008. Ms. Johnson is an attorney, certified public accountant and a certified managerial accountant. | N/A | |||
Wells Fargo Disciplined U.S. Core Fund | 35
Table of Contents
Other information (unaudited)
Name and year of birth | Position held and length of service* | Principal occupations during past five years or longer | Current other public company or investment company directorships | |||
David F. Larcker (Born 1950) | Trustee, since 2009 | James Irvin Miller Professor of Accounting at the Graduate School of Business, Stanford University, Director of the Corporate Governance Research Initiative and Senior Faculty of The Rock Center for Corporate Governance since 2006. From 2005 to 2008, Professor of Accounting at the Graduate School of Business, Stanford University. Prior thereto, Ernst & Young Professor of Accounting at The Wharton School, University of Pennsylvania from 1985 to 2005. | N/A | |||
Olivia S. Mitchell (Born 1953) | Trustee, since 2006; Nominating and Governance Committee Chair, since 2018 | International Foundation of Employee Benefit Plans Professor, Wharton School of the University of Pennsylvania since 1993. Director of Wharton’s Pension Research Council and Boettner Center on Pensions & Retirement Research, and Research Associate at the National Bureau of Economic Research. Previously, Cornell University Professor from 1978 to 1993. | N/A | |||
Timothy J. Penny (Born 1951) | Trustee, since 1996; Chairman, since 2018 | President and Chief Executive Officer of Southern Minnesota Initiative Foundation, a non-profit organization, since 2007. Member of the Board of Trustees of NorthStar Education Finance, Inc., a non-profit organization, since 2007. | N/A | |||
James G. Polisson (Born 1959) | Trustee, since 2018 | Retired. Chief Marketing Officer, Source (ETF) UK Services, Ltd, from 2015 to 2017. From 2012 to 2015, Principal of The Polisson Group, LLC, a management consulting, corporate advisory and principal investing company. Chief Executive Officer and Managing Director at Russell Investments, Global Exchange Traded Funds from 2010 to 2012. Managing Director of Barclays Global Investors from 1998 to 2010 and Global Chief Marketing Officer for iShares and Barclays Global Investors from 2000 to 2010. Trustee of the San Francisco Mechanics’ Institute, a non-profit organization, from 2013 to 2015. Board member of the Russell Exchange Traded Fund Trust from 2011 to 2012. Director of Barclays Global Investors Holdings Deutschland GmbH from 2006 to 2009. Mr. Polisson is an attorney and has a retired status with the Massachusetts and District of Columbia Bar Associations. | N/A | |||
Pamela Wheelock (Born 1959) | Trustee, since January 2020; previously Trustee from January 2018 to July 2019 | Board member of the Destination Medical Center Economic Development Agency, Rochester, Minnesota since 2019 and Interim President of the McKnight Foundation since 2020. Acting Commissioner, Minnesota Department of Human Services, July 2019 through September 2019. Human Services Manager (part-time), Minnesota Department of Human Services, October 2019 through December 2019. Chief Operating Officer, Twin Cities Habitat for Humanity from 2017 to 2019. Vice President of University Services, University of Minnesota from 2012 to 2016. Prior thereto, on the Board of Directors, Governance Committee and Finance Committee for the Minnesota Philanthropy Partners (Saint Paul Foundation) from 2012 to 2018, Interim Chief Executive Officer of Blue Cross Blue Shield of Minnesota from 2011 to 2012, Chairman of the Board from 2009 to 2012 and Board Director from 2003 to 2015. Vice President, Leadership and Community Engagement, Bush Foundation, Saint Paul, Minnesota (a private foundation) from 2009 to 2011. Executive Vice President and Chief Financial Officer, Minnesota Sports and Entertainment from 2004 to 2009 and Senior Vice President from 2002 to 2004. Executive Vice President of the Minnesota Wild Foundation from 2004 to 2008. Commissioner of Finance, State of Minnesota, from 1999 to 2002. Currently Board Chair of the Minnesota Wild Foundation since 2010. | N/A | |||
| * | Length of service dates reflect the Trustee’s commencement of service with the Trust’s predecessor entities, where applicable. |
36 | Wells Fargo Disciplined U.S. Core Fund
Table of Contents
Other information (unaudited)
Officers
Name and year of birth | Position held and length of service | Principal occupations during past five years or longer | ||
Andrew Owen (Born 1960) | President, since 2017 | Executive Vice President of Wells Fargo & Company and Head of Affiliated Managers, Wells Fargo Asset Management, since 2014. In addition, Mr. Owen is currently President, Chief Executive Officer and Director of Wells Fargo Funds Management, LLC since 2017. Prior thereto, Executive Vice President responsible for marketing, investments and product development for Wells Fargo Funds Management, LLC, from 2009 to 2014. | ||
Jeremy DePalma1 (Born 1974) | Treasurer, since 2012 | Senior Vice President of Wells Fargo Funds Management, LLC since 2009. Senior Vice President of Evergreen Investment Management Company, LLC from 2008 to 2010 and head of the Fund Reporting and Control Team within Fund Administration from 2005 to 2010. | ||
Michelle Rhee (Born 1966) | Chief Legal Officer, since 2019 | Secretary of Wells Fargo Funds Management, LLC, Chief Legal Counsel of Wells Fargo Asset Management and Assistant General Counsel of Wells Fargo Bank, N.A. since 2018. Associate General Counsel and Managing Director of Bank of America Corporation from 2004 to 2018. | ||
Catherine Kennedy (Born 1969) | Secretary, since 2019 | Vice President of Wells Fargo Funds Management, LLC and Senior Counsel of the Wells Fargo Legal Department since 2010. Vice President and Senior Counsel of Evergreen Investment Management Company, LLC from 1998 to 2010. | ||
Michael H. Whitaker (Born 1967) | Chief Compliance Officer, since 2016 | Chief Compliance Officer of Wells Fargo Asset Management since 2016. Senior Vice President and Chief Compliance Officer for Fidelity Investments from 2007 to 2016. | ||
David Berardi (Born 1975) | Assistant Treasurer, since 2009 | Vice President of Wells Fargo Funds Management, LLC since 2009. Vice President of Evergreen Investment Management Company, LLC from 2008 to 2010. Manager of Fund Reporting and Control for Evergreen Investment Management Company, LLC from 2004 to 2010. | ||
| 1 | Jeremy DePalma acts as Treasurer of 82 funds and Assistant Treasurer of 65 funds in the Fund Complex. |
| 2 | The Statement of Additional Information includes additional information about the Trustees and is available, without charge, upon request, by calling 1-800-222-8222 or by visiting the website at wfam.com. |
Wells Fargo Disciplined U.S. Core Fund | 37
Table of Contents
Other information (unaudited)
BOARD CONSIDERATION OF INVESTMENT MANAGEMENT AND SUB-ADVISORY AGREEMENTS:
Wells Fargo Disciplined U.S. Core Fund
Under the Investment Company Act of 1940 (the “1940 Act”), the Board of Trustees (the “Board”) of Wells Fargo Funds Trust (the “Trust”) must determine annually whether to approve the continuation of the Trust’s investment management and sub-advisory agreements. In this regard, at a Board meeting held on May 26, 2020 and May 28, 2020 (together, the “Meeting”), the Board, all the members of which have no direct or indirect interest in the investment management and sub-advisory agreements and are not “interested persons” of the Trust, as defined in the 1940 Act (the “Independent Trustees”), reviewed and approved for Wells Fargo Disciplined U.S. Core Fund (the “Fund”): (i) an investment management agreement (the “Management Agreement”) with Wells Fargo Funds Management, LLC (“Funds Management”); and (ii) an investment sub-advisory agreement (the “Sub-Advisory Agreement”) with Wells Capital Management Incorporated (the “Sub-Adviser”), an affiliate of Funds Management. The Management Agreement and the Sub-Advisory Agreement are collectively referred to as the “Advisory Agreements.”
At the Meeting, the Board considered the factors and reached the conclusions described below relating to the selection of Funds Management and the Sub-Adviser and the approval of the Advisory Agreements. Prior to the Meeting, including at a Board meeting held in April 2020, the Trustees conferred extensively among themselves and with representatives of Funds Management about these matters. Also, the Board has adopted a team-based approach, with each team consisting of a sub-set of Trustees, to assist the full Board in the discharge of its duties in reviewing investment performance and other matters throughout the year. The Independent Trustees were assisted in their evaluation of the Advisory Agreements by independent legal counsel, from whom they received separate legal advice and with whom they met separately.
In providing information to the Board, Funds Management and the Sub-Adviser were guided by a detailed set of requests for information submitted to them by independent legal counsel on behalf of the Independent Trustees at the start of the Board’s annual contract renewal process earlier in 2020. In considering and approving the Advisory Agreements, the Trustees considered the information they believed relevant, including but not limited to the information discussed below. The Board considered not only the specific information presented in connection with the Meeting, but also the knowledge gained over time through interaction with Funds Management and the Sub-Adviser about various topics. In this regard, the Board reviewed reports of Funds Management at each of its quarterly meetings, which included, among other things, portfolio reviews and investment performance reports. In addition, the Board and the teams mentioned above confer with portfolio managers at various times throughout the year. The Board did not identify any particular information or consideration that was all-important or controlling, and each individual Trustee may have attributed different weights to various factors.
After its deliberations, the Board unanimously approved the continuation of the Advisory Agreements for a one-year term and determined that the compensation payable to Funds Management and the Sub-Adviser under each of the Advisory Agreements was reasonable. The Board considered the approval of the Advisory Agreements for the Fund as part of its consideration of agreements for funds across the complex, but its approvals were made on a fund-by-fund basis. The following summarizes a number of important, but not necessarily all, factors considered by the Board in support of its approvals.
Nature, extent and quality of services
The Board received and considered various information regarding the nature, extent and quality of services provided to the Fund by Funds Management and the Sub-Adviser under the Advisory Agreements. This information included a description of the investment advisory services and Fund-level administrative services covered by the Management Agreement, as well as, among other things, a summary of the background and experience of senior management of Wells Fargo Asset Management (“WFAM”), of which Funds Management and the Sub-Adviser are a part, and a summary of investments made in the business of WFAM. The Board also received a description of Funds Management’s and the Sub-Adviser’s business continuity plans and of their approaches to data privacy and cybersecurity, and related testing. The Board also received and reviewed information about Funds Management’s role as administrator of the Fund’s liquidity risk management program, Funds Management’s approach to risk management, and Funds Management’s intermediary and vendor oversight program.
The Board also considered the qualifications, background, tenure and responsibilities of each of the portfolio managers primarily responsible for the day-to-day portfolio management of the Fund. The Board evaluated the ability of Funds Management and the Sub-Adviser to attract and retain qualified investment professionals, including research, advisory and supervisory personnel. The Board further considered the compliance programs and compliance records of Funds Management and the Sub-Adviser. In addition, the Board took into account the full range of services provided to the Fund by Funds Management and its affiliates.
38 | Wells Fargo Disciplined U.S. Core Fund
Table of Contents
Other information (unaudited)
Fund investment performance and expenses
The Board considered the investment performance results for the Fund over various time periods ended December 31, 2019. The Board also considered more current results for various time periods ended March 31, 2020. The Board considered these results in comparison to the investment performance of funds in a universe that was determined by Broadridge Inc. (“Broadridge”) to be similar to the Fund (the “Universe”), and in comparison to the Fund’s benchmark index and to other comparative data. Broadridge is an independent provider of investment company data. The Board received a description of the methodology used by Broadridge to select the mutual funds in the performance Universe. The Board noted that the investment performance of the Fund (Administrator Class) was lower than the average investment performance of the Universe for the one- and three-year periods ended December 31, 2019, and higher than the average investment performance of the Universe for the five- and ten-year periods ended December 31, 2019. The Board also noted that the investment performance of the Fund (Administrator Class) was in range of the average investment performance of the Universe for the one-year period ended March 31, 2020, lower than the average investment performance for the three-year period ended March 31, 2020, and higher than the average investment performance for the five- and ten-year periods ended March 31, 2020. The Board also noted that the investment performance of the Fund was lower than its benchmark index, the S&P 500 Index, for all periods ended December 31, 2019. The Board also noted that the investment performance of the Fund was lower than its benchmark index, the S&P 500 Index, for all periods ended March 31, 2020.
The Board received information concerning, and discussed factors contributing to, the underperformance of the Fund relative to the Universe and benchmark for the periods identified above. The Board took note of the explanations for the relative underperformance during these periods, including with respect to investment decisions and market factors that affected the Fund’s investment performance. The Board took note of a portfolio manager change that occurred in 2019. The Board also took note of the Fund’s outperformance relative to the Universe over the longer time periods under review.
The Board also received and considered information regarding the Fund’s net operating expense ratios and their various components, including actual management fees, custodian and other non-management fees, and Rule 12b-1 and non-Rule 12b-1 shareholder service fees. The Board considered these ratios in comparison to the median ratios of funds in class-specific expense groups that were determined by Broadridge to be similar to the Fund (the “Groups”). The Board received a description of the methodology used by Broadridge to select the mutual funds in the expense Groups and an explanation of how funds comprising expense groups and their expense ratios may vary from year-to-year. Based on the Broadridge reports, the Board noted that the net operating expense ratios of the Fund were lower than the median net operating expense ratios of the expense Groups for each share class.
The Board took into account the Fund’s investment performance and expense information provided to it among the factors considered in deciding to re-approve the Advisory Agreements.
Investment management and sub-advisory fee rates
The Board reviewed and considered the contractual fee rates payable by the Fund to Funds Management under the Management Agreement, as well as the contractual fee rates payable by the Fund to Funds Management for class-level administrative services under a Class-Level Administration Agreement, which include, among other things, class-level transfer agency and sub-transfer agency costs (collectively, the “Management Rates”). The Board also reviewed and considered the contractual investment sub-advisory fee rates that are payable by Funds Management to the Sub-Adviser for investment sub-advisory services.
Among other information reviewed by the Board was a comparison of the Fund’s Management Rates with the average contractual investment management fee rates of funds in the expense Groups at a common asset level as well as transfer agency costs of the funds in the expense Groups. The Board noted that the Management Rates of the Fund were lower than the sum of these average rates for the Fund’s expense Groups for all share classes.
The Board also received and considered information about the portion of the total management fee that was retained by Funds Management after payment of the fee to the Sub-Adviser for sub-advisory services. In assessing the reasonableness of this amount, the Board received and evaluated information about the nature and extent of responsibilities retained and risks assumed by Funds Management and not delegated to or assumed by the Sub-Adviser, and about Funds Management’s on-going oversight services. Given the affiliation between Funds Management and the Sub-Adviser, the Board ascribed limited relevance to the allocation of fees between them.
The Board also received and considered information about the nature and extent of services offered and fee rates charged by Funds Management and the Sub-Adviser to other types of clients with investment strategies similar to those of the Fund. In this regard, the Board received information about the significantly greater scope of services, and compliance, reporting and other legal burdens and risks of managing proprietary mutual funds compared with those associated with managing assets of other types of clients, including third-party sub-advised fund clients and non-mutual fund clients such as institutional separate accounts.
Wells Fargo Disciplined U.S. Core Fund | 39
Table of Contents
Other information (unaudited)
Based on its consideration of the factors and information it deemed relevant, including those described here, the Board determined that the compensation payable to Funds Management under the Management Agreement and to the Sub-Adviser under the Sub-Advisory Agreement was reasonable.
Profitability
The Board received and considered information concerning the profitability of Funds Management, as well as the profitability of both WFAM and Wells Fargo & Co. (“Wells Fargo”) from providing services to the fund family as a whole. The Board noted that the Sub-Adviser’s profitability information with respect to providing services to the Fund and other funds in the family was subsumed in the WFAM and Wells Fargo profitability analysis.
Funds Management reported on the methodologies and estimates used in calculating profitability, including a description of the methodology used to allocate certain expenses. Among other things, the Board noted that the levels of profitability reported on a fund-by-fund basis varied widely, depending on factors such as the size, type and age of fund.
Based on its review, the Board did not deem the profits reported by Funds Management, WFAM or Wells Fargo from services provided to the Fund to be at a level that would prevent it from approving the continuation of the Advisory Agreements.
Economies of scale
The Board received and considered information about the potential for Funds Management to experience economies of scale in the provision of management services to the Fund, the difficulties of calculating economies of scale at an individual fund level, and the extent to which potential scale benefits are shared with shareholders. The Board noted the existence of breakpoints in the Fund’s management fee structure, which operate generally to reduce the Fund’s expense ratios as the Fund grows in size, and the size of the Fund in relation to such breakpoints. The Board considered that in addition to management fee breakpoints, Funds Management shares potential economies of scale from its management business in a variety of ways, including through fee waiver and expense reimbursement arrangements, services that benefit shareholders, competitive management fee rates set at the outset without regard to breakpoints, and investments in the business intended to enhance services available to shareholders.
The Board concluded that Funds Management’s arrangements with respect to the Fund, including contractual breakpoints, constituted a reasonable approach to sharing potential economies of scale with the Fund and its shareholders.
Other benefits to Funds Management and the Sub-Adviser
The Board received and considered information regarding potential “fall-out” or ancillary benefits received by Funds Management and its affiliates, including the Sub-Adviser, as a result of their relationships with the Fund. Ancillary benefits could include, among others, benefits directly attributable to other relationships with the Fund and benefits potentially derived from an increase in Funds Management’s and the Sub-Adviser’s business as a result of their relationships with the Fund. The Board noted that various affiliates of Funds Management may receive distribution-related fees, shareholder servicing payments and sub-transfer agency fees in respect of shares sold or held through them and services provided.
The Board also reviewed information about soft dollar credits earned and utilized by the Sub-Adviser, fees earned by Funds Management and the Sub-Adviser from managing a private investment vehicle for the fund family’s securities lending collateral, and commissions earned by an affiliated broker from portfolio transactions.
Based on its consideration of the factors and information it deemed relevant, including those described here, the Board did not find that any ancillary benefits received by Funds Management and its affiliates, including the Sub-Adviser, were unreasonable.
Conclusion
At the Meeting, after considering the above-described factors and based on its deliberations and its evaluation of the information described above, the Board unanimously approved the continuation of the Advisory Agreements for a one-year term and determined that the compensation payable to Funds Management and the Sub-Adviser under each of the Advisory Agreements was reasonable.
40 | Wells Fargo Disciplined U.S. Core Fund
Table of Contents
Other information (unaudited)
LIQUIDITY RISK MANAGEMENT PROGRAM
In accordance with Rule 22e-4 under the Investment Company Act of 1940, as amended (the “Liquidity Rule”), Wells Fargo Funds Trust (the “Trust”) has adopted and implemented a liquidity risk management program (the “Program”) on behalf of each of its series, including the Fund, which is reasonably designed to assess and manage the Fund’s liquidity risk. “Liquidity risk” is defined as the risk that the Fund is unable to meet redemption requests without significantly diluting remaining investors’ interests in the Fund. The Trust’s Board of Trustees (the “Board”) previously approved the designation of Wells Fargo Funds Management, LLC (“Funds Management”), the Fund’s investment manager, as the administrator of the Program, and Funds Management has established a Liquidity Risk Management Council composed of personnel from multiple departments within Funds Management and its affiliates to assist Funds Management in the implementation and on-going administration of the Program.
The Program is comprised of various components designed to support the assessment and/or management of liquidity risk, including: (1) the periodic assessment (no less frequently than annually) of certain factors that influence the Fund’s liquidity risk; (2) the periodic classification (no less frequently than monthly) of the Fund’s investments into one of four liquidity categories that reflect an estimate of their liquidity under current market conditions; (3) a 15% limit on the acquisition of “illiquid investments” (as defined under the Liquidity Rule); (4) to the extent the Fund does not invest primarily in “highly liquid investments” (as defined under the Liquidity Rule), the determination of a minimum percentage of the Fund’s assets that generally will be invested in highly liquid investments (an “HLIM”); (5) if the Fund has established an HLIM, the periodic review (no less frequently than annually) of the HLIM and the adoption of policies and procedures for responding to a shortfall of the Fund’s “highly liquid investments” below its HLIM; and (6) periodic reporting to the Board.
At a meeting of the Board held on May 26 and 28, 2020, the Board received a written report (the “Report”) from Funds Management that addressed the operation of the Program and assessed its adequacy and effectiveness of implementation. The Report covered the initial period from December 1, 2018 through December 31, 2019 (the “Reporting Period”). No significant liquidity events impacting the Fund were noted in the Report. There were no material changes to the Program during the Reporting Period. The Report concluded that the Program is operating effectively to assess and manage the Fund’s liquidity risk, and that the Program has been and continues to be adequately and effectively implemented to monitor and, as applicable, respond to the Fund’s liquidity developments.
There can be no assurance that the Program will achieve its objectives under all circumstances in the future. Please refer to the Fund’s prospectus for more information regarding the Fund’s exposure to liquidity risk and other risks to which an investment in the Fund may be subject.
Wells Fargo Disciplined U.S. Core Fund | 41
Table of Contents
Effective on or after May 1, 2020, clients of Edward Jones (also referred to as “shareholders”) purchasing Fund shares on the Edward Jones commission and fee-based platforms are eligible only for the following sales charge discounts (also referred to as “breakpoints”) and waivers, which can differ from breakpoints and waivers described elsewhere in the Fund’s Prospectus or SAI or through another broker-dealer. In all instances, it is the shareholder’s responsibility to inform Edward Jones at the time of purchase of any relationship, holdings of Wells Fargo Funds or other facts qualifying the purchaser for breakpoints or waivers. Edward Jones can ask for documentation of such circumstance.
| Breakpoints available at Edward Jones |
| Rights of Accumulation (ROA) |
The applicable sales charge on a purchase of Class A shares is determined by taking into account all share classes (except any money market funds and retirement plan share classes) of Wells Fargo Funds held by the shareholder or in an account grouped by Edward Jones with other accounts for the purpose of providing certain pricing considerations (“pricing groups”). This includes all share classes held on the Edward Jones platform and/or held on another platform. The inclusion of eligible fund family assets in the rights of accumulation calculation is dependent on the shareholder notifying his or her financial advisor of such assets at the time of calculation. |
ROA is determined by calculating the higher of cost or market value (current shares x NAV). |
| Letter of Intent (LOI) |
Through a LOI, shareholders can receive the sales charge and breakpoint discounts for purchases shareholders intend to makeover a 13-month period from the date Edward Jones receives the LOI. The LOI is determined by calculating the higher of cost or market value of qualifying holdings at LOI initiation in combination with the value that the shareholder intends to buy over a 13-month period to calculate the front-end sales charge and any breakpoint discounts. Each purchase the shareholder makes during that 13-month period will receive the sales charge and breakpoint discount that applies to the total amount. The inclusion of eligible fund family assets in the LOI calculation is dependent on the shareholder notifying his or her financial advisor of such assets at the time of calculation. Purchases made before the LOI is received by Edward Jones are not covered under the LOI and will not reduce the sales charge previously paid. Sales charges will be adjusted if LOI is not met. |
| Sales charges are waived for the following shareholders and in the following situations at Edward Jones: |
● Associates of Edward Jones and its affiliates and their family members who are in the same pricing group (as determined by Edward Jones under its policies and procedures) as the associate. This waiver will continue for the remainder of the associate’s life if the associate retires from Edward Jones in good-standing. |
● Shares purchased in an Edward Jones fee-based program. |
● Shares purchased through reinvestment of capital gains distributions and dividend reinvestment. |
● Shares purchased from the proceeds of redeemed shares of the same fund family so long as the following conditions are met: 1) the proceeds are from the sale of shares within 60 days of the purchase, and 2) the sale and purchase are made in the same share class and the same account or the purchase is made in an individual retirement account with proceeds from liquidations in a non-retirement account. |
● Shares exchanged into Class A shares from another share class so long as the exchange is into the same fund and was initiated at the discretion of Edward Jones. Edward Jones is responsible for any remaining CDSC due to the fund company, if applicable. Any future purchases are subject to the applicable sales charge as disclosed in the prospectus. |
● Exchanges from Class C shares to Class A shares of the same fund, generally, in the 84th month following the anniversary of the purchase date or earlier at the discretion of Edward Jones. |
| If the shareholder purchases shares that are subject to a CDSC and those shares are redeemed before the CDSC is expired, the shareholder is responsible to pay the CDSC except in the following conditions available at Edward Jones: |
● The death or disability of the shareholder. |
● Systematic withdrawals with up to 10% per year of the account value. |
● Return of excess contributions from an Individual Retirement Account (IRA). |
● Shares sold as part of a required minimum distribution for IRA and retirement accounts if the redemption is taken in or after the year the shareholder reaches qualified age based on applicable IRS regulation. |
● Shares sold to pay Edward Jones fees or costs in such cases where the transaction is initiated by Edward Jones. |
● Shares exchanged in an Edward Jones fee-based program. |
● Shares acquired through NAV reinstatement. |
42 | Wells Fargo Disciplined U.S. Core Fund
Table of Contents
Appendix I (unaudited)
| Other Important Information for accounts at Edward Jones: |
| Minimum Purchase Amounts |
● $250 initial purchase minimum |
● $50 subsequent purchase minimum |
| Minimum Balances |
| Edward Jones has the right to redeem at its discretion fund holdings with a balance of $250 or less. The following are examples of accounts that are not included in this policy: |
● A fee-based account held on an Edward Jones platform |
● A 529 account held on an Edward Jones platform |
● An account with an active systematic investment plan or letter of intent (LOI) |
| Changing Share Classes |
| At any time it deems necessary, Edward Jones has the authority to exchange at NAV a shareholder’s holdings in a fund to Class A shares. |
Wells Fargo Disciplined U.S. Core Fund | 43
Table of Contents
Effective June 1, 2020, shareholders purchasing Fund shares through an Oppenheimer & Co. Inc. (“Oppenheimer”) platform or account are eligible only for the following load waivers (front-end sales charge waivers and contingent deferred or back-end, sales charge waivers) and discounts, which may differ from those disclosed in the Fund’s Prospectus or SAI.
| Front-end Sales Load Waivers on Class A Shares available at Oppenheimer |
| Employer-sponsored retirement, deferred compensation and employee benefit plans (including health savings accounts) and trusts used to fund those plans, provided that the shares are not held in a commission-based brokerage account and shares are held for the benefit of the plan. |
| Shares purchased by or through a 529 Plan. |
| Shares purchased through an Oppenheimer affiliated investment advisory program. |
| Shares purchased through reinvestment of capital gains distributions and dividend reinvestment when purchasing shares of the same fund (but not any other fund within the fund family). |
| Shares purchased from the proceeds of redemptions within the same fund family, provided (1) the repurchase occurs within 90 days following the redemption, (2) the redemption and purchase occur in the same account, and (3) redeemed shares were subject to a front-end or deferred sales load (known as Rights of Restatement). |
| A shareholder in the Fund’s Class C shares will have their shares exchanged at net asset value to Class A shares (or the appropriate share class) of the Fund if the shares are no longer subject to a CDSC and the exchange is in line with the policies and procedures of Oppenheimer. |
| Employees and registered representatives of Oppenheimer or its affiliates and their family members. |
| Directors or Trustees of the Fund, and employees of the Fund’s investment adviser or any of its affiliates, as described in the Prospectus. |
| CDSC Waivers on A and C Shares available at Oppenheimer |
| Death or disability of the shareholder. |
| Shares sold as part of a systematic withdrawal plan as described in the Prospectus. |
| Return of excess contributions from an IRA Account. |
| Shares sold as part of a required minimum distribution for IRA and retirement accounts due to the shareholder reaching the qualified age based on applicable IRS regulations as described in the Prospectus. |
| Shares sold to pay Oppenheimer fees but only if the transaction is initiated by Oppenheimer. |
| Shares acquired through a right of reinstatement. |
| Front-end load Discounts Available at Oppenheimer: Breakpoints, Rights of Accumulation & Letters of Intent |
| Breakpoints as described in the Prospectus. |
| Rights of Accumulation (ROA), which entitle shareholders to breakpoint discounts, will be automatically calculated based on the aggregated holding of fund family assets held by accounts within the purchaser’s household at Oppenheimer. Eligible fund family assets not held at Oppenheimer may be included in the ROA calculation only if the shareholder notifies his or her financial advisor about such assets. |
44 | Wells Fargo Disciplined U.S. Core Fund
Table of Contents
Effective June 15, 2020, shareholders purchasing fund shares through a Robert W. Baird & Co. (“Baird”) platform or account will only be eligible for the following sales charge waivers (front-end sales charge waivers and CDSC waivers) and discounts, which may differ from those disclosed elsewhere in the Fund’s Prospectus or the SAI.
| Front-end Sales Load Waivers on Class A Shares available at Baird |
| Shares purchased through reinvestment of capital gains distributions and dividend reinvestment when purchasing share of the same fund. |
| Share purchase by employees and registers representatives of Baird or its affiliate and their family members as designated by Baird. |
| Shares purchase from the proceeds of redemptions within the same fund family, provided (1) the repurchase occurs within 90 days following the redemption, (2) the redemption and purchase occur in the same accounts, and (3) redeemed shares were subject to a front-end or deferred sales charge (known as rights of reinstatement). |
| A shareholder in the Funds Investor C Shares will have their share exchanged at net asset value to Investor A shares of the fund if the shares are no longer subject to CDSC and the exchange is in line with the policies and procedures of Baird. |
| Employer-sponsored retirement plans or charitable accounts in a transactional brokerage account at Baird, including 401(k) plans, 457 plans, employer-sponsored 403(b) plans, profit sharing and money purchase pension plans and defined benefit plans. For purposes of this provision, employer-sponsored retirement plans do not include SEP IRAs, Simple IRAs or SAR-SEPs. |
| CDSC Waivers on A and C Shares available at Baird |
| Shares sold due to death or disability of the shareholder. |
| Shares sold as part of a systematic withdrawal plan as described in the Fund’s Prospectus. |
| Shares bought due to returns of excess contributions from an IRA Account. |
| Shares sold as part of a required minimum distribution for IRA and retirement accounts due to the shareholder reaching age 72 as described in the Fund’s Prospectus. |
| Shares sold to pay Baird fees but only if the transaction is initiated by Baird. |
| Shares acquired through a right of reinstatement. |
| Front-end load Discounts Available at Baird: Breakpoint and/or Rights of Accumulation |
| Breakpoints as described in the Prospectus. |
| Rights of accumulations which entitles shareholders to breakpoint discounts will be automatically calculated based on the aggregated holding of fund family assets held by accounts within the purchaser’s household at Baird. Eligible fund family assets not held at Baird may be included in the rights of accumulations calculation only if the shareholder notifies his or her financial advisor about such assets. |
| Letters of Intent (LOI) allow for breakpoint discounts based on anticipated purchases within a fund family through Baird, over a 13-month period of time. |
Wells Fargo Disciplined U.S. Core Fund | 45
Table of Contents
This page is intentionally left blank.
Table of Contents
This page is intentionally left blank.
Table of Contents
This page is intentionally left blank.
Table of Contents
For more information
More information about Wells Fargo Funds is available free upon request. To obtain literature, please write, visit the Fund’s website, or call:
Wells Fargo Funds
P.O. Box 219967
Kansas City, MO 64121-9967
Website: wfam.com
Individual investors: 1-800-222-8222
Retail investment professionals: 1-888-877-9275
Institutional investment professionals: 1-866-765-0778

This report and the financial statements contained herein are submitted for the general information of the shareholders of the Fund. If this report is used for promotional purposes, distribution of the report must be accompanied or preceded by a current prospectus. Before investing, please consider the investment objectives, risks, charges, and expenses of the investment. For a current prospectus and, if available, a summary prospectus, containing this information, call 1-800-222-8222 or visit the Fund’s website at wfam.com. Read the prospectus carefully before you invest or send money.
Wells Fargo Asset Management (WFAM) is the trade name for certain investment advisory/management firms owned by Wells Fargo & Company. These firms include but are not limited to Wells Capital Management Incorporated and Wells Fargo Funds Management, LLC. Certain products managed by WFAM entities are distributed by Wells Fargo Funds Distributor, LLC (a broker-dealer and Member FINRA).
This material is for general informational and educational purposes only and is NOT intended to provide investment advice or a recommendation of any kind—including a recommendation for any specific investment, strategy, or plan.
INVESTMENT PRODUCTS: NOT FDIC INSURED ◾ NO BANK GUARANTEE ◾ MAY LOSE VALUE
© 2020 Wells Fargo & Company. All rights reserved
PAR-0820-01025 09-20
A203/AR203 07-20
Table of Contents

Annual Report
July 31, 2020
Wells Fargo Endeavor Select Fund
Beginning on January 1, 2021, as permitted by new regulations adopted by the Securities and Exchange Commission, paper copies of the Wells Fargo Funds’ annual and semi-annual shareholder reports issued after this date will no longer be sent by mail, unless you specifically request paper copies of the reports. Instead, the reports will be made available on the Funds’ website, and you will be notified by mail each time a report is posted and provided with a website address to access the report.
If you already elected to receive shareholder reports electronically, you will not be affected by this change and you need not take any action. You may elect to receive shareholder reports and other communications from the Fund electronically at any time by contacting your financial intermediary (such as a broker-dealer or bank) or, if you are a direct investor, by calling 1-800-222-8222 or by enrolling at wellsfargo.com/advantagedelivery.
You may elect to receive all future reports in paper free of charge. If you invest through a financial intermediary, you can contact your financial intermediary to request that you continue to receive paper copies of your shareholder reports; if you invest directly with the Fund, you can call 1-800-222-8222. Your election to receive reports in paper will apply to all Wells Fargo Funds held in your account with your financial intermediary or, if you are a direct investor, to all Wells Fargo Funds that you hold.
Table of Contents
|
Reduce clutter. Save trees. |
Sign up for electronic delivery of prospectuses and shareholder reports at wellsfargo.com/advantagedelivery |
The views expressed and any forward-looking statements are as of July 31, 2020, unless otherwise noted, and are those of the Fund managers and/or Wells Fargo Asset Management. Discussions of individual securities, or the markets generally, or any Wells Fargo Fund are not intended as individual recommendations. Future events or results may vary significantly from those expressed in any forward-looking statements. The views expressed are subject to change at any time in response to changing circumstances in the market. Wells Fargo Asset Management and the Fund disclaim any obligation to publicly update or revise any views expressed or forward-looking statements.
INVESTMENT PRODUCTS: NOT FDIC INSURED ◾ NO BANK GUARANTEE ◾ MAY LOSE VALUE
Wells Fargo Endeavor Select Fund | 1
Table of Contents
Letter to shareholders (unaudited)

Andrew Owen
President
Wells Fargo Funds
Dear Shareholder:
We are pleased to offer you this annual report for the Wells Fargo Endeavor Select Fund for the 12-month period that ended July 31, 2020. Global stock markets saw earlier gains erased in February and March as governments around the world took unprecedented measures, attempting to stop the spread of the coronavirus at the expense of short-term economic output. However, markets rebounded from April on to offset much of the losses as central banks attempted to bolster capital markets and confidence. Fixed-income markets generally performed well overall, achieving widespread gains. Overall, U.S. stocks surpassed their international peers, while U.S. large-cap equity, as measured by the Russell 1000® Index1, easily outperformed small caps, as measured by the Russell 2000® Index2, for the 12-month period that began last August.
For the 12-month period, fixed-income securities generally had positive total returns while non-U.S. developed market equities had the weakest performance and U.S. stocks performed strongly despite sharp volatility in the late winter and early spring. For the period, U.S. stocks, based on the S&P 500 Index,3 gained 11.96%. International stocks, as measured by the MSCI ACWI ex USA Index (Net),4 returned 0.66%, while the MSCI EM Index (Net)5 had somewhat stronger performance, with a 6.55% gain. For bond investors, the Bloomberg Barclays U.S. Aggregate Bond Index6 returned a robust 10.12%, the Bloomberg Barclays Global Aggregate ex-USD Index7 gained a more modest 5.94%, and the Bloomberg Barclays Municipal Bond Index8 gained 5.36% while the ICE BofA U.S. High Yield Index9 returned 3.10%.
The fiscal year began with supportive central bank actions.
The period began with unresolved U.S.-China trade tensions showing no signs of compromise in August 2019. Evidence of a continued global economic slowdown mounted, and central banks in China, New Zealand, and Thailand cut interest rates after the U.S. Federal Reserve (Fed) had done so in late July. Industrial and manufacturing data declined in China, Canada, Japan, and Germany. Adding to global uncertainty, Italy’s prime minister resigned, many feared a crackdown in Hong Kong as protestors sustained their calls for reform, and U.K. Prime Minister Boris Johnson planned to suspend Parliament as Brexit’s deadline neared.
| 1 | The Russell 1000® Index measures the performance of the 1,000 largest companies in the Russell 3000® Index, which represents approximately 92% of the total market capitalization of the Russell 3000® Index. You cannot invest directly in an index. |
| 2 | The Russell 2000® Index measures the performance of the 2,000 smallest companies in the Russell 3000® Index, which represents approximately 8% of the total market capitalization of the Russell 3000® Index. You cannot invest directly in an index. |
| 3 | The S&P 500 Index consists of 500 stocks chosen for market size, liquidity, and industry group representation. It is a market-value-weighted index with each stock’s weight in the index proportionate to its market value. You cannot invest directly in an index. |
| 4 | The Morgan Stanley Capital International (MSCI) All Country World Index (ACWI) ex USA Index (Net) is a free-float-adjusted market-capitalization-weighted index that is designed to measure the equity market performance of developed and emerging markets, excluding the United States. Source: MSCI. MSCI makes no express or implied warranties or representations and shall have no liability whatsoever with respect to any MSCI data contained herein. The MSCI data may not be further redistributed or used as a basis for other indices or any securities or financial products. This report is not approved, reviewed, or produced by MSCI. You cannot invest directly in an index. |
| 5 | The MSCI Emerging Markets (EM) Index (Net) is a free-float-adjusted market-capitalization-weighted index that is designed to measure equity market performance of emerging markets. You cannot invest directly in an index. |
| 6 | The Bloomberg Barclays U.S. Aggregate Bond Index is a broad-based benchmark that measures the investment-grade, U.S. dollar-denominated, fixed-rate taxable bond market, including Treasuries, government-related and corporate securities, mortgage-backed securities (agency fixed-rate and hybrid adjustable-rate mortgage pass-throughs), asset-backed securities, and commercial mortgage-backed securities. You cannot invest directly in an index. |
| 7 | The Bloomberg Barclays Global Aggregate ex-USD Index is an unmanaged index that provides a broad-based measure of the global investment-grade fixed-income markets excluding the U.S.-dollar-denominated debt market. You cannot invest directly in an index. |
| 8 | The Bloomberg Barclays Municipal Bond Index is an unmanaged index composed of long-term tax-exempt bonds with a minimum credit rating of Baa. You cannot invest directly in an index. |
| 9 | The ICE BofA U.S. High Yield Index is a market-capitalization-weighted index of domestic and Yankee high-yield bonds. The index tracks the performance of high-yield securities traded in the U.S. bond market. You cannot invest directly in an index. Copyright 2020. ICE Data Indices, LLC. All rights reserved. |
2 | Wells Fargo Endeavor Select Fund
Table of Contents
Letter to shareholders (unaudited)
In the U.S., the Fed cut interest rates again in September. U.S. manufacturing data disappointed investors. The U.S. Congress announced it would pursue an impeachment investigation of President Trump. Meanwhile, the Brexit impasse showed no signs of resolution. Officials in China said that hitting the country’s economic growth goals for the year would be difficult considering the weight of tariffs and trade restrictions. Although the S&P 500 Index finished the third quarter with the best year-to-date returns in more than 20 years, concerns about future returns remained.
The fourth quarter started on a strong note, with U.S.-China trade tensions relaxing in October along with renewed optimism for a U.K. Brexit deal and positive macroeconomic data. The initial estimate of U.S. third-quarter gross domestic product (GDP) growth was a resilient 1.9% annualized rate, while the U.S. unemployment rate fell to a 50-year low of 3.5% in September. However, despite strength among U.S. consumers, business confidence declined while manufacturing activity contracted. Concerned with a potential economic slowdown, the Fed lowered interest rates another quarter point in late October—its third rate cut in four months. This helped push the S&P 500 Index to an all-time high while emerging market equities rallied and global bonds declined overall, reflecting a broad pickup in risk appetite.
Equity markets continued to rally in November despite ongoing geopolitical risks. Hopes for a U.S.-China trade deal buoyed investor confidence. U.S. business sentiment improved slightly, and manufacturing and services activity picked up. While consumer confidence and purchasing managers’ activity rose in the eurozone, China reported weakening manufacturing and consumer data. Bond yields rose marginally, leading to slightly negative returns for global government and investment-grade corporate bonds.
Financial markets ended 2019 with a boost from the U.S. and China accord on a Phase One trade deal. That, along with the landslide win by the pro-Brexit U.K. Conservative Party in a national election and ongoing central bank support, gave investors greater confidence. U.S. economic indicators were generally positive, with the exception of manufacturing activity and business confidence. Consumer confidence was resilient, fed by a robust labor market, tame inflation, and lower interest rates, which boosted housing affordability and stimulated homebuyer activity. The impeachment of President Trump had little impact on markets. Meanwhile, slowing Chinese economic activity, partly attributable to the trade war, led to further government stimulus at year-end through lower reserve ratios, allowing banks to lend more money.
The year-end rally continued in early January 2020. However, capital market volatility picked up sharply in late January on concerns over the potential impact of the coronavirus on the global economy and stock markets. With sentiment somewhat souring, perceived safe havens did well in January. The U.S. dollar and Japanese yen both rose, and government bonds outperformed equities. While the S&P 500 Index held its ground, emerging market equities tumbled, including those in Asia.
In February, the coronavirus became the major market focus. Fears of the virus’s impact on global growth led to expectations of increased global central bank monetary policy support. That led the 10-year U.S. Treasury yield to fall to an all-time low of 1.1%. Although equity markets initially shrugged off concerns about the outbreak, focusing instead on strong fourth-quarter earnings and improving business confidence in January, market sentiment turned sharply lower and the S&P 500 Index lost 8.2% for the month. Oil prices tumbled as Russia and the Organization of the Petroleum Exporting Countries compounded a major decline in oil demand with a brutal price war, partly aimed at dissuading further U.S. shale production, causing the price of West Texas Intermediate crude oil to plummet.
Wells Fargo Endeavor Select Fund | 3
Table of Contents
Letter to shareholders (unaudited)
“The global spread of the coronavirus led country after country to clamp down on social and business-related activity in order to contain the virus from causing even greater devastation and overwhelming health care systems.”
“Financial markets posted widely positive returns in June despite ongoing economic weakness and high levels of uncertainty on the containment of the coronavirus and the timing of an effective vaccine.”
The global spread of the coronavirus led country after country to clamp down on social and business-related activity in order to contain the virus from causing even greater devastation and overwhelming health care systems. This abrupt stoppage of economic activity led to the sharp deceleration of global output, sending economies into a deep contraction. Central banks responded swiftly, slashing interest rates and expanding quantitative easing programs to restore liquidity and confidence to the markets. In the U.S., the Fed introduced several new lending programs, funding investment-grade bonds, money market mutual funds, and commercial paper while purchasing Treasuries, mortgage-backed securities, and overnight repurchase agreements. Meanwhile, stock markets tumbled quickly into a bear market, ending the longest bull stock market in U.S. history.
Markets rebounded strongly in April, fueled by unprecedented government and central bank stimulus measures. The U.S. economy contracted by an annualized 5.0% pace in the first quarter, with 30 million new unemployment insurance claims in six weeks. In the eurozone, first-quarter real GDP shrank 3.8%, with the composite April Flash Purchasing Managers’ Index, a monthly survey of purchasing managers, falling to an all-time low of 13.5. The European Central Bank expanded its quantitative easing to include the purchase of additional government bonds of countries with the greatest virus-related need, including Italy and Spain. China’s first-quarter GDP fell by 6.8% year over year. However, retail sales, production, and investment showed signs of recovery. Extreme oil-price volatility continued as global supply far exceeded demand.
In May, the global equity market rebound continued, with widespread strong monthly gains. Investors regained confidence on reports of early signs of success in human trials of a coronavirus vaccine. Growth stocks continued to outperform value stocks while returns on global government bonds were generally flat. In the U.S., a gap grew between the stock market rebound and devastating economic data points, including an April unemployment rate of 14.7%, the highest level since World War II. Purchasing managers’ indices reflected weakening activity in May in both the manufacturing and services sectors. U.S. corporate earnings reports indicated a 14% year-over-year contraction in earnings from the first quarter of 2019. However, high demand for technology, driven by remote activity, supported robust information technology sector earnings, which helped drive major technology stocks higher.
Financial markets posted widely positive returns in June despite ongoing economic weakness and high levels of uncertainty on the containment of the coronavirus and the timing of an effective vaccine. There were hopeful signs as economies reopened, with both U.S. and U.K. retail sales rebounding substantially in May. However, year over year, sales remained depressed. Vitally important to market sentiment was the ongoing commitment by central banks globally to do all they could to provide economic support through liquidity and low borrowing costs. U.S. economic activity was aided by one-time $1,200 stimulus checks and $600 bonus weekly unemployment benefits due to expire at the end of July. However, unemployment remained in the double digits, easing somewhat from 14.7% in April to 11.1% in June. During June, numerous states reported alarming increases of coronavirus cases. China’s economic recovery picked up momentum in June, though it remained far from a full recovery.
July was a broadly positive month for both global equities and fixed income. However, economic data and a resurgence of coronavirus cases pointed to the vulnerability of the global economy and the ongoing imperative to regain control of the pandemic. Second-quarter GDP shrank by 9.5% and 12.1% in the U.S. and eurozone, respectively, from the previous quarter. In contrast, China reported a 3.2% year-over-year expansion in its second-quarter GDP. U.S. unemployment remained historically high despite adding 1.8 million jobs in July, with a double-digit jobless rate persisting. However, manufacturing activity grew in both the U.S. and eurozone. In Asia, while China’s manufacturing sector continued to expand, activity in Japan and South Korea contracted. In July, a rising concern
4 | Wells Fargo Endeavor Select Fund
Table of Contents
Letter to shareholders (unaudited)
was the rapid and broad reemergence of coronavirus infections. Despite the ongoing promise of positive early-stage vaccine trial results, economic activity could be held back by the continued spread of the virus and the end of a widely received $600-a-week bonus unemployment benefit in late July.
Don’t let short-term uncertainty derail long-term investment goals.
Periods of investment uncertainty can present challenges, but experience has taught us that maintaining long-term investment goals can be an effective way to plan for the future. To help you create a sound strategy based on your personal goals and risk tolerance, Wells Fargo Funds offers more than 100 mutual funds spanning a wide range of asset classes and investment styles. Although diversification cannot guarantee an investment profit or prevent losses, we believe it can be an effective way to manage investment risk and potentially smooth out overall portfolio performance. We encourage investors to know their investments and to understand that appropriate levels of risk-taking may unlock opportunities.
Thank you for choosing to invest with Wells Fargo Funds. We appreciate your confidence in us and remain committed to helping you meet your financial needs.
Sincerely,

Andrew Owen
President
Wells Fargo Funds
|
For further information about your Fund, contact your investment professional, visit our website at wfam.com, or call us directly at 1-800-222-8222. |
Notice to Shareholders
At a meeting held on August 10-12, 2020, the Board of Trustees of the Fund approved a change to the Fund’s automatic conversion feature for Class C shares in order to shorten the required holding period from 10 to 8 years. As a result, on a monthly basis beginning November 5, 2020, Class C shares will convert automatically into Class A shares 8 years after the initial date of purchase or, if you acquired your Class C shares through an exchange or conversion from another share class, 8 years after the date you acquired your Class C shares. When Class C shares that you acquired through a purchase or exchange convert, any other Class C shares that you purchased with reinvested dividends and distributions also will convert into Class A shares on a pro rata basis.
Please note that a shorter holding period may apply depending on your intermediary. Please see “Appendix A—Sales Charge Reductions and Waivers for Certain Intermediaries” in the Fund’s prospectus for further information.
Wells Fargo Endeavor Select Fund | 5
Table of Contents
Performance highlights (unaudited)
Investment objective
The Fund seeks long-term capital appreciation.
Manager
Wells Fargo Funds Management, LLC
Subadviser
Wells Capital Management Incorporated
Portfolio managers
Michael T. Smith, CFA®‡
Christopher J. Warner, CFA®‡
Average annual total returns (%) as of July 31, 2020
| Including sales charge | Excluding sales charge | Expense ratios1 (%) | ||||||||||||||||||||||||||||||||
| Inception date | 1 year | 5 year | 10 year | 1 year | 5 year | 10 year | Gross | Net2 | ||||||||||||||||||||||||||
| Class A (STAEX) | 12-29-2000 | 19.26 | 15.89 | 15.64 | 26.57 | 17.28 | 16.34 | 1.30 | 1.03 | |||||||||||||||||||||||||
| Class C (WECCX) | 12-29-2000 | 24.48 | 16.39 | 15.46 | 25.48 | 16.39 | 15.46 | 2.05 | 1.78 | |||||||||||||||||||||||||
| Class R6 (WECRX)3 | 9-20-2019 | – | – | – | 27.02 | 17.73 | 16.83 | 0.87 | 0.60 | |||||||||||||||||||||||||
| Administrator Class (WECDX) | 4-8-2005 | – | – | – | 26.59 | 17.49 | 16.59 | 1.22 | 0.94 | |||||||||||||||||||||||||
| Institutional Class (WFCIX) | 4-8-2005 | – | – | – | 26.91 | 17.71 | 16.82 | 0.97 | 0.70 | |||||||||||||||||||||||||
| Russell 1000® Growth Index4 | – | – | – | – | 29.84 | 16.84 | 17.29 | – | – | |||||||||||||||||||||||||
Figures quoted represent past performance, which is no guarantee of future results, and do not reflect taxes that a shareholder may pay on an investment in a fund. Investment return and principal value of an investment will fluctuate so that an investor’s shares, when redeemed, may be worth more or less than their original cost. Performance shown without sales charges would be lower if sales charges were reflected. Current performance may be lower or higher than the performance data quoted, which assumes the reinvestment of dividends and capital gains. Current month-end performance is available on the Fund’s website, wfam.com.
Please keep in mind that high double-digit returns were primarily achieved during favorable market conditions. You should not expect that such favorable returns can be consistently achieved. A fund’s performance, especially for short time periods, should not be the sole factor in making your investment decision.
Index returns do not include transaction costs associated with buying and selling securities, any mutual fund fees or expenses, or any taxes. It is not possible to invest directly in an index.
For Class A shares, the maximum front-end sales charge is 5.75%. For Class C shares, the maximum contingent deferred sales charge is 1.00%. Performance including a contingent deferred sales charge assumes the sales charge for the corresponding time period. Class R6, Administrator Class, and Institutional Class shares are sold without a front-end sales charge or contingent deferred sales charge.
Stock values fluctuate in response to the activities of individual companies and general market and economic conditions. Certain investment strategies tend to increase the total risk of an investment (relative to the broader market). The Fund is exposed to foreign investment risk, focused portfolio risk, and smaller-company securities risk. Consult the Fund’s prospectus for additional information on these and other risks.
Please see footnotes on page 7.
6 | Wells Fargo Endeavor Select Fund
Table of Contents
Performance highlights (unaudited)
| Growth of $10,000 investment as of July 31, 20205 |
|
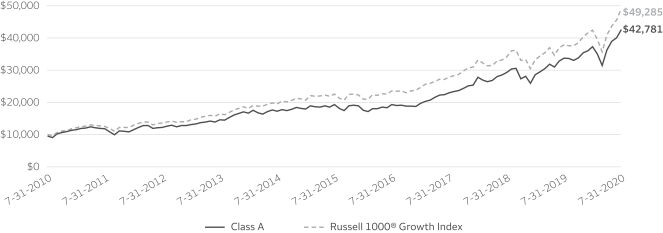
| ‡ | CFA® and Chartered Financial Analyst® are trademarks owned by CFA Institute. |
| 1 | Reflects the expense ratios as stated in the most recent prospectuses. The expense ratios shown are subject to change and may differ from the annualized expense ratios shown in the financial highlights of this report. |
| 2 | The manager has contractually committed through November 30, 2021, to waive fees and/or reimburse expenses to the extent necessary to cap total annual fund operating expenses after fee waivers at 1.03% for Class A, 1.78% for Class C, 0.60% for Class R6, 0.94% for Administrator Class, and 0.70% for Institutional Class. Brokerage commissions, stamp duty fees, interest, taxes, acquired fund fees and expenses (if any), and extraordinary expenses are excluded from the expense caps. Prior to or after the commitment expiration date, the caps may be increased or the commitment to maintain the caps may be terminated only with the approval of the Board of Trustees. Without these caps, the Fund’s returns would have been lower. The expense ratio paid by an investor is the net expense ratio (the total annual fund operating expenses after fee waivers) as stated in the prospectuses. |
| 3 | Historical performance shown for the Class R6 shares prior to their inception reflects the performance of the Institutional Class shares, and is not adjusted to reflect the Class R6 expenses. If these expenses had been included, returns for the Class R6 would be higher. |
| 4 | The Russell 1000® Growth Index measures the performance of those Russell 1000 companies with higher price/book ratios and higher forecasted growth values. You cannot invest directly in an index. |
| 5 | The chart compares the performance of Class A shares for the most recent ten years with the Russell 1000® Growth Index. The chart assumes a hypothetical investment of $10,000 in Class A shares and reflects all operating expenses and assumes the maximum initial sales charge of 5.75%. |
| 6 | The ten largest holdings, excluding cash, cash equivalents and any money market funds, are calculated based on the value of the investments divided by total net assets of the Fund. Holdings are subject to change and may have changed since the date specified. |
| 7 | Amounts are calculated based on the total long-term investments of the Fund. These amounts are subject to change and may have changed since the date specified. |
Wells Fargo Endeavor Select Fund | 7
Table of Contents
Performance highlights (unaudited)
MANAGER’S DISCUSSION
| ∎ | The Fund underperformed its benchmark, the Russell 1000® Growth Index, for the 12-month period that ended July 31, 2020. |
| ∎ | Stock selection and positioning within the information technology (IT) sector detracted from performance. |
| ∎ | Stock selection in the consumer discretionary sector was a key contributor to performance. |
Global pandemic triggers massive policy response.
Over the past 12 months, global economies shifted from long-toothed bull markets to rapid recessions, spurred by a global pandemic and shelter-at-home orders. Central banks and governments rallied quickly to prevent a possible depression by proposing massive stimulus packages. Within the United States, the Federal Reserve (Fed) took extraordinary measures to provide liquidity, including launching programs to purchase exchange-traded funds and corporate bonds. These aggressive actions signaled the Fed would effectively take any measures to support the economy. The equity markets were further fueled by optimism as progress continued on the development of therapeutic treatments and vaccines for the coronavirus.
Despite increased uncertainty, we have not significantly repositioned the Fund. It remains positioned toward companies with high visibility of earnings growth and those that we believe are positioned on the right side of change. We believe this strategy will prove beneficial should volatility levels remain elevated.
| Ten largest holdings (%) as of July 31, 20206 | ||||
Amazon.com Incorporated | 10.32 | |||
Microsoft Corporation | 9.03 | |||
Alphabet Incorporated Class A | 5.39 | |||
Visa Incorporated Class A | 4.26 | |||
PayPal Holdings Incorporated | 3.90 | |||
UnitedHealth Group Incorporated | 3.75 | |||
ServiceNow Incorporated | 3.31 | |||
The Home Depot Incorporated | 3.03 | |||
The Sherwin-Williams Company | 2.75 | |||
Waste Connections Incorporated | 2.48 | |||
Select IT holdings detracted from relative performance.
Within IT, shares in Motorola Solutions, Inc., detracted from performance. The company provides key technology to first responders and emergency command centers. It is expanding its software and service portfolio to provide an end-to-end solution for public safety customers. Motorola recently reported above-consensus earnings. However, it lowered expected revenue due to uncertainty in public sector spending as a result of the coronavirus. While this prompted a sell-off in the stock, we expect Motorola’s recurring revenue will soften the impact of near-term uncertainties.
Also within IT, not holding Apple Inc. significantly detracted from relative performance. Although a quality enterprise, Apple does not have the level of organic growth we seek in target investments. The company still relies heavily on smartphone sales, which have reached a saturation point. In our view, Apple share outperformance has been driven more by valuation expansion as opposed to a true acceleration in the company’s fundamentals.
| Sector allocation as of July 31, 20207 |
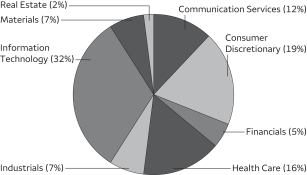 |
Stock selection in the consumer discretionary sector contributed to performance relative to the index.
Shares of Amazon.com, Inc., outperformed during the period. The e-commerce retailer continues to benefit from the powerful shift to online retail spending, which was accelerated during the coronavirus crisis. Additionally, the recurring revenue nature of Amazon Web Services, which functions as critical cloud infrastructure for enterprises, proved valuable during a global work-from-home environment.
Also within consumer discretionary, MercadoLibre, Inc., was a notable contributor. Similar to Amazon.com, the company has become a disruptive force to the traditional retail model in Latin America, yet it is much earlier in its life cycle. Furthermore, the
Please see footnotes on page 7.
8 | Wells Fargo Endeavor Select Fund
Table of Contents
Performance highlights (unaudited)
percentage of online transactions in Latin America rose sharply as a result of stringent shelter-in-place orders. Our research indicates that with rising adoption of e-commerce, new digital payments products, and buildout of its logistics network, MercadoLibre could continue to earn a market capitalization comparable to successful large-cap platform companies in other markets.
While volatility remains high, companies on the “right side of change” provide resiliency.
We do not believe the recovery will unfold in a linear, V-shaped fashion. The vexing challenges of an intertwined health care crisis, financial crisis, and social crisis remain. Progress is being made toward containing and treating the coronavirus, but recent spikes in cases serve as a reminder that we have a long way to go. Given the extreme lack of clarity in forecasting future results, we remain cautious in our outlook and anticipate that volatility will continue.
We did not make material changes to portfolio positioning as a result of the coronavirus. By emphasizing companies on the “right side of change,” we were well positioned to take advantage of the massive shift to themes such as telemedicine, digital payments, and e-commerce. These trends will likely continue for the foreseeable future. We are long-term investors focused on opportunities well beyond 2020. As growth remains scarce, secular growth stocks should have defensive qualities and continue to be rewarded with premium valuations. As financial guidance continues to be revised, we believe this is a great time for active management and deep fundamental research. While we are cautious on the markets overall, we remain optimistic and confident in companies that we believe are positioned on the “right side of change.”
Please see footnotes on page 7.
Wells Fargo Endeavor Select Fund | 9
Table of Contents
As a shareholder of the Fund, you incur two types of costs: (1) transaction costs, including sales charges (loads) on purchase payments and contingent deferred sales charges (if any) on redemptions and (2) ongoing costs, including management fees, distribution (12b-1) and/or shareholder servicing fees, and other Fund expenses. This example is intended to help you understand your ongoing costs (in dollars) of investing in the Fund and to compare these costs with the ongoing costs of investing in other mutual funds.
The example is based on an investment of $1,000 invested at the beginning of the six-month period and held for the entire period from February 1, 2020 to July 31, 2020.
Actual expenses
The “Actual” line of the table below provides information about actual account values and actual expenses. You may use the information in this line, together with the amount you invested, to estimate the expenses that you paid over the period. Simply divide your account value by $1,000 (for example, an $8,600 account value divided by $1,000 = 8.6), then multiply the result by the number in the “Actual” line under the heading entitled “Expenses paid during period” for your applicable class of shares to estimate the expenses you paid on your account during this period.
Hypothetical example for comparison purposes
The “Hypothetical” line of the table below provides information about hypothetical account values and hypothetical expenses based on the Fund’s actual expense ratio and an assumed rate of return of 5% per year before expenses, which is not the Fund’s actual return. The hypothetical account values and expenses may not be used to estimate the actual ending account balance or expenses you paid for the period. You may use this information to compare the ongoing costs of investing in the Fund and other funds. To do so, compare this 5% hypothetical example with the 5% hypothetical examples that appear in the shareholder reports of the other funds.
Please note that the expenses shown in the table are meant to highlight your ongoing costs only and do not reflect any transactional costs, such as sales charges (loads) and contingent deferred sales charges. Therefore, the “Hypothetical” line of the table is useful in comparing ongoing costs only and will not help you determine the relative total costs of owning different funds. In addition, if these transactional costs were included, your costs would have been higher.
| Beginning account value 2-1-2020 | Ending account value 7-31-2020 | Expenses paid during the period1 | Annualized net expense ratio | |||||||||||||
Class A | ||||||||||||||||
Actual | $ | 1,000.00 | $ | 1,143.88 | $ | 5.49 | 1.03 | % | ||||||||
Hypothetical (5% return before expenses) | $ | 1,000.00 | $ | 1,019.74 | $ | 5.17 | 1.03 | % | ||||||||
Class C | ||||||||||||||||
Actual | $ | 1,000.00 | $ | 1,140.97 | $ | 9.48 | 1.78 | % | ||||||||
Hypothetical (5% return before expenses) | $ | 1,000.00 | $ | 1,016.01 | $ | 8.92 | 1.78 | % | ||||||||
Class R6 | ||||||||||||||||
Actual | $ | 1,000.00 | $ | 1,146.17 | $ | 3.20 | 0.60 | % | ||||||||
Hypothetical (5% return before expenses) | $ | 1,000.00 | $ | 1,021.88 | $ | 3.02 | 0.60 | % | ||||||||
Administrator Class | ||||||||||||||||
Actual | $ | 1,000.00 | $ | 1,145.01 | $ | 5.01 | 0.94 | % | ||||||||
Hypothetical (5% return before expenses) | $ | 1,000.00 | $ | 1,020.19 | $ | 4.72 | 0.94 | % | ||||||||
Institutional Class | ||||||||||||||||
Actual | $ | 1,000.00 | $ | 1,146.32 | $ | 3.74 | 0.70 | % | ||||||||
Hypothetical (5% return before expenses) | $ | 1,000.00 | $ | 1,021.38 | $ | 3.52 | 0.70 | % | ||||||||
| 1 | Expenses paid is equal to the annualized net expense ratio of each class multiplied by the average account value over the period, multiplied by the number of days in the most recent fiscal half-year divided by the number of days in the fiscal year (to reflect the one-half-year period). |
10 | Wells Fargo Endeavor Select Fund
Table of Contents
Portfolio of investments—July 31, 2020
| Shares | Value | |||||||||||||||
| Common Stocks : 95.54% |
| |||||||||||||||
Communication Services : 11.69% |
| |||||||||||||||
| Entertainment : 2.35% | ||||||||||||||||
Netflix Incorporated † | 13,200 | $ | 6,453,216 | |||||||||||||
|
| |||||||||||||||
| Interactive Media & Services : 9.34% | ||||||||||||||||
Alphabet Incorporated Class A † | 9,957 | 14,815,518 | ||||||||||||||
Alphabet Incorporated Class C † | 1,650 | 2,446,884 | ||||||||||||||
Match Group Incorporated † | 33,886 | 3,480,092 | ||||||||||||||
Tencent Holdings Limited ADR | 71,750 | 4,914,158 | ||||||||||||||
| 25,656,652 | ||||||||||||||||
|
| |||||||||||||||
Consumer Discretionary : 18.34% |
| |||||||||||||||
| Auto Components : 1.17% | ||||||||||||||||
Aptiv plc | 41,550 | 3,230,513 | ||||||||||||||
|
| |||||||||||||||
| Automobiles : 1.43% | ||||||||||||||||
Ferrari NV | 21,600 | 3,924,720 | ||||||||||||||
|
| |||||||||||||||
| Internet & Direct Marketing Retail : 12.71% | ||||||||||||||||
Amazon.com Incorporated † | 8,958 | 28,349,202 | ||||||||||||||
MercadoLibre Incorporated † | 5,850 | 6,579,027 | ||||||||||||||
| 34,928,229 | ||||||||||||||||
|
| |||||||||||||||
| Specialty Retail : 3.03% | ||||||||||||||||
The Home Depot Incorporated | 31,316 | 8,314,085 | ||||||||||||||
|
| |||||||||||||||
| Financials : 4.61% | ||||||||||||||||
| Capital Markets : 4.61% | ||||||||||||||||
Intercontinental Exchange Incorporated | 65,190 | 6,309,088 | ||||||||||||||
S&P Global Incorporated | 18,141 | 6,353,885 | ||||||||||||||
| 12,662,973 | ||||||||||||||||
|
| |||||||||||||||
Health Care : 15.63% |
| |||||||||||||||
| Biotechnology : 1.88% | ||||||||||||||||
Exact Sciences Corporation † | 54,300 | 5,144,925 | ||||||||||||||
|
| |||||||||||||||
| Health Care Equipment & Supplies : 7.65% | ||||||||||||||||
Alcon Incorporated † | 83,150 | 4,987,337 | ||||||||||||||
DexCom Incorporated † | 11,450 | 4,986,933 | ||||||||||||||
Edwards Lifesciences Corporation † | 56,550 | 4,434,086 | ||||||||||||||
Intuitive Surgical Incorporated † | 9,650 | 6,614,496 | ||||||||||||||
| 21,022,852 | ||||||||||||||||
|
| |||||||||||||||
| Health Care Providers & Services : 3.75% | ||||||||||||||||
UnitedHealth Group Incorporated | 34,047 | 10,308,751 | ||||||||||||||
|
| |||||||||||||||
| Pharmaceuticals : 2.35% | ||||||||||||||||
Merck & Company Incorporated | 80,450 | 6,455,308 | ||||||||||||||
|
| |||||||||||||||
| Industrials : 7.03% | ||||||||||||||||
| Commercial Services & Supplies : 4.64% | ||||||||||||||||
Cintas Corporation | 19,700 | 5,946,839 | ||||||||||||||
Waste Connections Incorporated |
| 66,440 | 6,801,463 | |||||||||||||
| 12,748,302 | ||||||||||||||||
|
| |||||||||||||||
The accompanying notes are an integral part of these financial statements.
Wells Fargo Endeavor Select Fund | 11
Table of Contents
Portfolio of investments—July 31, 2020
| Shares | Value | |||||||||||||||
| Road & Rail : 2.39% | ||||||||||||||||
Union Pacific Corporation |
| 37,800 | $ | 6,552,630 | ||||||||||||
|
| |||||||||||||||
Information Technology : 29.96% |
| |||||||||||||||
| Communications Equipment : 1.41% | ||||||||||||||||
Motorola Solutions Incorporated |
| 27,700 | 3,872,460 | |||||||||||||
|
| |||||||||||||||
| IT Services : 12.63% | ||||||||||||||||
Fiserv Incorporated † |
| 56,294 | 5,617,578 | |||||||||||||
Global Payments Incorporated |
| 37,443 | 6,665,603 | |||||||||||||
PayPal Holdings Incorporated † |
| 54,700 | 10,725,029 | |||||||||||||
Visa Incorporated Class A |
| 61,428 | 11,695,891 | |||||||||||||
| 34,704,101 | ||||||||||||||||
|
| |||||||||||||||
| Software : 15.92% | ||||||||||||||||
Atlassian Corporation plc Class A † |
| 23,700 | 4,186,605 | |||||||||||||
Autodesk Incorporated † |
| 24,000 | 5,674,320 | |||||||||||||
Microsoft Corporation |
| 120,981 | 24,802,315 | |||||||||||||
ServiceNow Incorporated † |
| 20,680 | 9,082,656 | |||||||||||||
| 43,745,896 | ||||||||||||||||
|
| |||||||||||||||
| Materials : 6.26% | ||||||||||||||||
| Chemicals : 5.00% | ||||||||||||||||
Air Products & Chemicals Incorporated |
| 21,600 | 6,191,208 | |||||||||||||
The Sherwin-Williams Company |
| 11,650 | 7,548,268 | |||||||||||||
| 13,739,476 | ||||||||||||||||
|
| |||||||||||||||
| Construction Materials : 1.26% | ||||||||||||||||
Vulcan Materials Company |
| 29,500 | 3,463,890 | |||||||||||||
|
| |||||||||||||||
Real Estate : 2.02% |
| |||||||||||||||
| Equity REITs : 2.02% | ||||||||||||||||
SBA Communications Corporation |
| 17,800 | 5,545,412 | |||||||||||||
|
| |||||||||||||||
Total Common Stocks (Cost $118,853,104) |
| 262,474,391 | ||||||||||||||
|
| |||||||||||||||
| Yield | ||||||||||||||||
| Short-Term Investments : 4.51% | ||||||||||||||||
| Investment Companies : 4.51% | ||||||||||||||||
Wells Fargo Government Money Market Select Class (l)(u) | 0.10 | % | 12,402,416 | 12,402,416 | ||||||||||||
|
| |||||||||||||||
Total Short-Term Investments (Cost $12,402,416) |
| 12,402,416 | ||||||||||||||
|
| |||||||||||||||
| Total investments in securities (Cost $131,255,520) | 100.05 | % | 274,876,807 | |||||
Other assets and liabilities, net | (0.05 | ) | (133,968 | ) | ||||
|
|
|
| |||||
| Total net assets | 100.00 | % | $ | 274,742,839 | ||||
|
|
|
| |||||
| † | Non-income-earning security |
| (l) | The issuer of the security is an affiliated person of the Fund as defined in the Investment Company Act of 1940. |
| (u) | The rate represents the 7-day annualized yield at period end. |
Abbreviations:
| ADR | American depositary receipt |
| REIT | Real estate investment trust |
The accompanying notes are an integral part of these financial statements.
12 | Wells Fargo Endeavor Select Fund
Table of Contents
Portfolio of investments—July 31, 2020
Investments in Affiliates
An affiliated investment is an investment in which the Fund owns at least 5% of the outstanding voting shares of the issuer or as a result of other relationships, such as the Fund and the issuer having the same investment manager. Transactions with issuers that were either affiliated persons of the Fund at the beginning of the period or the end of the period were as follows:
| Value, beginning of period | Purchases | Sales proceeds | Net realized gains (losses) | Net change in unrealized gains (losses) | Income from affiliated securities | Value, end of period | % of net assets | |||||||||||||||||||||||||
| Short-Term Investments | ||||||||||||||||||||||||||||||||
Investment Companies | ||||||||||||||||||||||||||||||||
Securities Lending Cash Investments LLC * | $ | 0 | $ | 36,031,625 | $ | (36,032,437 | ) | $ | 812 | $ | 0 | $ | 18,480 | # | $ | 0 | ||||||||||||||||
Wells Fargo Government Money Market Fund Select Class | 4,314,739 | 69,536,177 | (61,448,500 | ) | 0 | 0 | 51,642 | 12,402,416 | ||||||||||||||||||||||||
|
|
|
|
|
|
|
|
|
| |||||||||||||||||||||||
| $ | 812 | $ | 0 | $ | 70,122 | $ | 12,402,416 | 4.51 | % | |||||||||||||||||||||||
|
|
|
|
|
|
|
|
|
| |||||||||||||||||||||||
| * | No longer held at the end of the period |
| # | Amount shown represents income before fees and rebates. |
The accompanying notes are an integral part of these financial statements.
Wells Fargo Endeavor Select Fund | 13
Table of Contents
Statement of assets and liabilities—July 31, 2020
Assets | ||||
Investments in unaffiliated securities, at value (cost $118,853,104) | $ | 262,474,391 | ||
Investments in affiliated securities, at value (cost $12,402,416) | 12,402,416 | |||
Receivable for Fund shares sold | 462,346 | |||
Receivable for dividends | 41,443 | |||
Prepaid expenses and other assets | 145,438 | |||
|
| |||
Total assets | 275,526,034 | |||
|
| |||
Liabilities | ||||
Payable for Fund shares redeemed | 551,382 | |||
Management fee payable | 113,344 | |||
Administration fees payable | 36,603 | |||
Distribution fee payable | 4,400 | |||
Trustees’ fees and expenses payable | 4,240 | |||
Accrued expenses and other liabilities | 73,226 | |||
|
| |||
Total liabilities | 783,195 | |||
|
| |||
Total net assets | $ | 274,742,839 | ||
|
| |||
Net assets consist of | ||||
Paid-in capital | $ | 116,502,182 | ||
Total distributable earnings | 158,240,657 | |||
|
| |||
Total net assets | $ | 274,742,839 | ||
|
| |||
Computation of net asset value and offering price per share | ||||
Net assets – Class A | $ | 124,271,256 | ||
Shares outstanding – Class A1 | 12,924,547 | |||
Net asset value per share – Class A | $9.62 | |||
Maximum offering price per share – Class A2 | $10.21 | |||
Net assets – Class C | $ | 6,650,574 | ||
Shares outstanding – Class C1 | 1,284,362 | |||
Net asset value per share – Class C | $5.18 | |||
Net assets – Class R6 | $ | 48,435,239 | ||
Shares outstanding – Class R61 | 4,259,486 | |||
Net asset value per share – Class R6 | $11.37 | |||
Net assets – Administrator Class | $ | 8,978,636 | ||
Shares outstanding – Administrator Class1 | 842,341 | |||
Net asset value per share – Administrator Class | $10.66 | |||
Net assets – Institutional Class | $ | 86,407,134 | ||
Shares outstanding – Institutional Class1 | 7,608,569 | |||
Net asset value per share – Institutional Class | $11.36 | |||
| 1 | The Fund has an unlimited number of authorized shares. |
| 2 | Maximum offering price is computed as 100/94.25 of net asset value. On investments of $50,000 or more, the offering price is reduced. |
The accompanying notes are an integral part of these financial statements.
14 | Wells Fargo Endeavor Select Fund
Table of Contents
Statement of operations—year ended July 31, 2020
Investment income | ||||
Dividends (net of foreign withholding taxes of $28,271) | $ | 1,588,691 | ||
Income from affiliated securities | 59,622 | |||
|
| |||
Total investment income | 1,648,313 | |||
|
| |||
Expenses | ||||
Management fee | 1,559,173 | |||
Administration fees |
| |||
Class A | 196,017 | |||
Class C | 8,973 | |||
Class R6 | 11,913 | 1 | ||
Administrator Class | 9,178 | |||
Institutional Class | 100,749 | |||
Shareholder servicing fees |
| |||
Class A | 233,200 | |||
Class C | 10,668 | |||
Administrator Class | 17,617 | |||
Distribution fee |
| |||
Class C | 31,885 | |||
Custody and accounting fees | 17,101 | |||
Professional fees | 45,786 | |||
Registration fees | 76,640 | |||
Shareholder report expenses | 40,228 | |||
Trustees’ fees and expenses | 21,866 | |||
Other fees and expenses | 19,119 | |||
|
| |||
Total expenses | 2,400,113 | |||
Less: Fee waivers and/or expense reimbursements |
| |||
Fund-level | (481,108 | ) | ||
Class A | (21,938 | ) | ||
Administrator Class | (1,436 | ) | ||
|
| |||
Net expenses | 1,895,631 | |||
|
| |||
Net investment loss | (247,318 | ) | ||
|
| |||
Realized and unrealized gains (losses) on investments | ||||
Net realized gains on |
| |||
Unaffiliated securities | 18,983,363 | |||
Affiliated securities | 812 | |||
|
| |||
Net realized gains on investments | 18,984,175 | |||
Net change in unrealized gains (losses) on investments | 39,967,714 | |||
|
| |||
Net realized and unrealized gains (losses) on investments | 58,951,889 | |||
|
| |||
Net increase in net assets resulting from operations | $ | 58,704,571 | ||
|
| |||
| 1 | For the period from September 20, 2019 (commencement of class operations) to July 31, 2020 |
The accompanying notes are an integral part of these financial statements.
Wells Fargo Endeavor Select Fund | 15
Table of Contents
Statement of changes in net assets
| Year ended July 31, 2020 | Year ended July 31, 2019 | |||||||||||||||
Operations | ||||||||||||||||
Net investment loss | $ | (247,318 | ) | $ | (39,219 | ) | ||||||||||
Net realized gains on investments | 18,984,175 | 21,279,816 | ||||||||||||||
Net change in unrealized gains (losses) on investments | 39,967,714 | (3,421,390 | ) | |||||||||||||
|
| |||||||||||||||
Net increase in net assets resulting from operations | 58,704,571 | 17,819,207 | ||||||||||||||
|
| |||||||||||||||
Distributions to shareholders from net investment income and net realized gains | ||||||||||||||||
Class A | (9,193,804 | ) | (3,430,850 | ) | ||||||||||||
Class C | (639,884 | ) | (1,168,306 | ) | ||||||||||||
Class R6 | (3,817,296 | )1 | N/A | |||||||||||||
Administrator Class | (594,711 | ) | (567,258 | ) | ||||||||||||
Institutional Class | (5,072,891 | ) | (23,115,770 | ) | ||||||||||||
|
| |||||||||||||||
Total distributions to shareholders | (19,318,586 | ) | (28,282,184 | ) | ||||||||||||
|
| |||||||||||||||
Capital share transactions | Shares | Shares | ||||||||||||||
Proceeds from shares sold | ||||||||||||||||
Class A | 2,464,894 | 20,299,260 | 695,352 | 5,403,334 | ||||||||||||
Class C | 659,230 | 2,859,235 | 135,403 | 567,944 | ||||||||||||
Class R6 | 6,365,048 | 1 | 60,326,316 | 1 | N/A | N/A | ||||||||||
Administrator Class | 256,326 | 2,382,284 | 17,483 | 134,106 | ||||||||||||
Institutional Class | 4,348,587 | 41,589,495 | 927,530 | 8,358,983 | ||||||||||||
|
| |||||||||||||||
| 127,456,590 | 14,464,367 | |||||||||||||||
|
| |||||||||||||||
Reinvestment of distributions | ||||||||||||||||
Class A | 1,136,944 | 8,970,487 | 460,780 | 3,073,403 | ||||||||||||
Class C | 145,449 | 621,069 | 298,729 | 1,168,031 | ||||||||||||
Class R6 | 410,012 | 1 | 3,813,107 | 1 | N/A | N/A | ||||||||||
Administrator Class | 67,574 | 590,592 | 77,420 | 566,717 | ||||||||||||
Institutional Class | 543,524 | 5,054,778 | 2,976,014 | 23,004,592 | ||||||||||||
|
| |||||||||||||||
| 19,050,033 | 27,812,743 | |||||||||||||||
|
| |||||||||||||||
Payment for shares redeemed | ||||||||||||||||
Class A | (2,755,225 | ) | (22,584,078 | ) | (731,194 | ) | (5,639,781 | ) | ||||||||
Class C | (362,899 | ) | (1,634,876 | ) | (585,440 | ) | (2,522,025 | ) | ||||||||
Class R6 | (2,770,957 | )1 | (26,106,890 | )1 | N/A | N/A | ||||||||||
Administrator Class | (304,554 | ) | (2,668,949 | ) | (114,882 | ) | (964,193 | ) | ||||||||
Institutional Class | (9,604,487 | ) | (91,582,332 | ) | (5,242,746 | ) | (47,188,366 | ) | ||||||||
|
| |||||||||||||||
| (144,577,125 | ) | (56,314,365 | ) | |||||||||||||
|
| |||||||||||||||
Net asset value of shares issued in acquisition | ||||||||||||||||
Class A | 9,924,795 | 82,228,406 | 0 | 0 | ||||||||||||
Class C | 406,964 | 1,963,250 | 0 | 0 | ||||||||||||
Class R6 | 255,383 | 1 | 2,459,686 | 1 | N/A | N/A | ||||||||||
Administrator Class | 539,878 | 4,913,234 | 0 | 0 | ||||||||||||
Institutional Class | 1,198,969 | 11,547,626 | 0 | 0 | ||||||||||||
|
| |||||||||||||||
| 103,112,202 | 0 | |||||||||||||||
|
| |||||||||||||||
Net increase (decrease) in net assets resulting from capital share transactions | 105,041,700 | (14,037,255 | ) | |||||||||||||
|
| |||||||||||||||
Total increase (decrease) in net assets | 144,427,685 | (24,500,232 | ) | |||||||||||||
|
| |||||||||||||||
Net assets | ||||||||||||||||
Beginning of period | 130,315,154 | 154,815,386 | ||||||||||||||
|
| |||||||||||||||
End of period | $ | 274,742,839 | $ | 130,315,154 | ||||||||||||
|
| |||||||||||||||
| 1 | For the period from September 20, 2019 (commencement of class operations) to July 31, 2020 |
The accompanying notes are an integral part of these financial statements.
16 | Wells Fargo Endeavor Select Fund
Table of Contents
(For a share outstanding throughout each period)
| Year ended July 31 | ||||||||||||||||||||
| CLASS A | 2020 | 2019 | 2018 | 2017 | 2016 | |||||||||||||||
Net asset value, beginning of period | $8.33 | $9.43 | $9.09 | $8.96 | $13.74 | |||||||||||||||
Net investment loss | (0.03 | )1 | (0.03 | )1 | (0.04 | )1 | (0.03 | )1 | (0.04 | )1 | ||||||||||
Net realized and unrealized gains (losses) on investments | 2.08 | 0.97 | 2.23 | 1.49 | (0.14 | ) | ||||||||||||||
|
|
|
|
|
|
|
|
|
| |||||||||||
Total from investment operations | 2.05 | 0.94 | 2.19 | 1.46 | (0.18 | ) | ||||||||||||||
Distributions to shareholders from | ||||||||||||||||||||
Net realized gains | (0.76 | ) | (2.04 | ) | (1.85 | ) | (1.33 | ) | (4.60 | ) | ||||||||||
Net asset value, end of period | $9.62 | $8.33 | $9.43 | $9.09 | $8.96 | |||||||||||||||
Total return2 | 26.57 | % | 15.37 | % | 27.35 | % | 19.39 | % | (0.07 | )% | ||||||||||
Ratios to average net assets (annualized) | ||||||||||||||||||||
Gross expenses | 1.26 | % | 1.30 | % | 1.25 | % | 1.22 | % | 1.28 | % | ||||||||||
Net expenses | 1.02 | % | 1.20 | % | 1.20 | % | 1.20 | % | 1.20 | % | ||||||||||
Net investment loss | (0.30 | )% | (0.35 | )% | (0.49 | )% | (0.33 | )% | (0.36 | )% | ||||||||||
Supplemental data | ||||||||||||||||||||
Portfolio turnover rate | 16 | % | 20 | % | 36 | % | 59 | % | 79 | % | ||||||||||
Net assets, end of period (000s omitted) | $124,271 | $17,940 | $16,301 | $12,953 | $18,498 | |||||||||||||||
| 1 | Calculated based upon average shares outstanding |
| 2 | Total return calculations do not include any sales charges. |
The accompanying notes are an integral part of these financial statements.
Wells Fargo Endeavor Select Fund | 17
Table of Contents
Financial highlights
(For a share outstanding throughout each period)
| Year ended July 31 | ||||||||||||||||||||
| CLASS C | 2020 | 2019 | 2018 | 2017 | 2016 | |||||||||||||||
Net asset value, beginning of period | $4.86 | $6.46 | $6.80 | $7.09 | $11.93 | |||||||||||||||
Net investment loss | (0.05 | )1 | (0.06 | )1 | (0.08 | )1 | (0.07 | )1 | (0.09 | )1 | ||||||||||
Net realized and unrealized gains (losses) on investments | 1.13 | 0.50 | 1.59 | 1.11 | (0.15 | ) | ||||||||||||||
|
|
|
|
|
|
|
|
|
| |||||||||||
Total from investment operations | 1.08 | 0.44 | 1.51 | 1.04 | (0.24 | ) | ||||||||||||||
Distributions to shareholders from | ||||||||||||||||||||
Net realized gains | (0.76 | ) | (2.04 | ) | (1.85 | ) | (1.33 | ) | (4.60 | ) | ||||||||||
Net asset value, end of period | $5.18 | $4.86 | $6.46 | $6.80 | $7.09 | |||||||||||||||
Total return2 | 25.48 | % | 14.51 | % | 26.43 | % | 18.46 | % | (0.76 | )% | ||||||||||
Ratios to average net assets (annualized) | ||||||||||||||||||||
Gross expenses | 2.01 | % | 2.05 | % | 2.00 | % | 1.97 | % | 2.03 | % | ||||||||||
Net expenses | 1.79 | % | 1.95 | % | 1.95 | % | 1.95 | % | 1.95 | % | ||||||||||
Net investment loss | (1.06 | )% | (1.12 | )% | (1.22 | )% | (1.08 | )% | (1.11 | )% | ||||||||||
Supplemental data | ||||||||||||||||||||
Portfolio turnover rate | 16 | % | 20 | % | 36 | % | 59 | % | 79 | % | ||||||||||
Net assets, end of period (000s omitted) | $6,651 | $2,116 | $3,792 | $3,676 | $4,845 | |||||||||||||||
| 1 | Calculated based upon average shares outstanding |
| 2 | Total return calculations do not include any sales charges. |
The accompanying notes are an integral part of these financial statements.
18 | Wells Fargo Endeavor Select Fund
Table of Contents
Financial highlights
(For a share outstanding throughout the period)
| CLASS R6 | Year ended July 31, 20201 | |||
Net asset value, beginning of period | $9.63 | |||
Net investment income | 0.01 | |||
Net realized and unrealized gains (losses) on investments | 2.49 | |||
|
| |||
Total from investment operations | 2.50 | |||
Distributions to shareholders from | ||||
Net realized gains | (0.76 | ) | ||
Net asset value, end of period | $11.37 | |||
Total return2 | 27.68 | % | ||
Ratios to average net assets (annualized) | ||||
Gross expenses | 0.82 | % | ||
Net expenses | 0.60 | % | ||
Net investment income | 0.11 | % | ||
Supplemental data | ||||
Portfolio turnover rate | 16 | % | ||
Net assets, end of period (000s omitted) | $48,435 | |||
| 1 | For the period from September 20, 2019 (commencement of class operations) to July 31, 2020 |
| 2 | Returns for periods of less than one year are not annualized. |
The accompanying notes are an integral part of these financial statements.
Wells Fargo Endeavor Select Fund | 19
Table of Contents
Financial highlights
(For a share outstanding throughout each period)
| Year ended July 31 | ||||||||||||||||||||
| ADMINISTRATOR CLASS | 2020 | 2019 | 2018 | 2017 | 2016 | |||||||||||||||
Net asset value, beginning of period | $9.15 | $10.12 | $9.62 | $9.38 | $14.13 | |||||||||||||||
Net investment income (loss) | (0.02 | )1 | (0.01 | )1 | (0.03 | )1 | (0.01 | )1 | 0.01 | 1 | ||||||||||
Net realized and unrealized gains (losses) on investments | 2.29 | 1.08 | 2.38 | 1.58 | (0.16 | ) | ||||||||||||||
|
|
|
|
|
|
|
|
|
| |||||||||||
Total from investment operations | 2.27 | 1.07 | 2.35 | 1.57 | (0.15 | ) | ||||||||||||||
Distributions to shareholders from | ||||||||||||||||||||
Net realized gains | (0.76 | ) | (2.04 | ) | (1.85 | ) | (1.33 | ) | (4.60 | ) | ||||||||||
Net asset value, end of period | $10.66 | $9.15 | $10.12 | $9.62 | $9.38 | |||||||||||||||
Total return | 26.59 | % | 15.63 | % | 27.55 | % | 19.71 | % | 0.16 | % | ||||||||||
Ratios to average net assets (annualized) | ||||||||||||||||||||
Gross expenses | 1.18 | % | 1.21 | % | 1.16 | % | 1.14 | % | 1.14 | % | ||||||||||
Net expenses | 0.94 | % | 1.00 | % | 1.00 | % | 1.00 | % | 1.00 | % | ||||||||||
Net investment income (loss) | (0.21 | )% | (0.16 | )% | (0.28 | )% | (0.12 | )% | 0.06 | % | ||||||||||
Supplemental data | ||||||||||||||||||||
Portfolio turnover rate | 16 | % | 20 | % | 36 | % | 59 | % | 79 | % | ||||||||||
Net assets, end of period (000s omitted) | $8,979 | $2,590 | $3,068 | $3,695 | $5,254 | |||||||||||||||
| 1 | Calculated based upon average shares outstanding |
The accompanying notes are an integral part of these financial statements.
20 | Wells Fargo Endeavor Select Fund
Table of Contents
Financial highlights
(For a share outstanding throughout each period)
| Year ended July 31 | ||||||||||||||||||||
| INSTITUTIONAL CLASS | 2020 | 2019 | 2018 | 2017 | 2016 | |||||||||||||||
Net asset value, beginning of period | $9.68 | $10.57 | $9.95 | $9.65 | $14.39 | |||||||||||||||
Net investment income (loss) | 0.01 | 1 | 0.00 | 1,2 | (0.01 | )1 | 0.00 | 1,2 | 0.00 | 1,2 | ||||||||||
Net realized and unrealized gains (losses) on investments | 2.43 | 1.15 | 2.49 | 1.64 | (0.14 | ) | ||||||||||||||
|
|
|
|
|
|
|
|
|
| |||||||||||
Total from investment operations | 2.44 | 1.15 | 2.48 | 1.64 | (0.14 | ) | ||||||||||||||
Distributions to shareholders from | ||||||||||||||||||||
Net investment income | 0.00 | 0.00 | (0.01 | ) | (0.01 | ) | 0.00 | |||||||||||||
Net realized gains | (0.76 | ) | (2.04 | ) | (1.85 | ) | (1.33 | ) | (4.60 | ) | ||||||||||
|
|
|
|
|
|
|
|
|
| |||||||||||
Total distributions to shareholders | (0.76 | ) | (2.04 | ) | (1.86 | ) | (1.34 | ) | (4.60 | ) | ||||||||||
Net asset value, end of period | $11.36 | $9.68 | $10.57 | $9.95 | $9.65 | |||||||||||||||
Total return | 26.91 | % | 15.76 | % | 28.01 | % | 19.87 | % | 0.27 | % | ||||||||||
Ratios to average net assets (annualized) | ||||||||||||||||||||
Gross expenses | 0.93 | % | 0.97 | % | 0.92 | % | 0.89 | % | 0.95 | % | ||||||||||
Net expenses | 0.72 | % | 0.80 | % | 0.80 | % | 0.80 | % | 0.80 | % | ||||||||||
Net investment income (loss) | 0.07 | % | 0.05 | % | (0.08 | )% | 0.05 | % | 0.04 | % | ||||||||||
Supplemental data | ||||||||||||||||||||
Portfolio turnover rate | 16 | % | 20 | % | 36 | % | 59 | % | 79 | % | ||||||||||
Net assets, end of period (000s omitted) | $86,407 | $107,670 | $131,655 | $144,199 | $162,935 | |||||||||||||||
| 1 | Calculated based upon average shares outstanding |
| 2 | Amount is less than $0.005. |
The accompanying notes are an integral part of these financial statements.
Wells Fargo Endeavor Select Fund | 21
Table of Contents
1. ORGANIZATION
Wells Fargo Funds Trust (the “Trust”), a Delaware statutory trust organized on March 10, 1999, is an open-end management investment company registered under the Investment Company Act of 1940, as amended (the “1940 Act”). As an investment company, the Trust follows the accounting and reporting guidance in Financial Accounting Standards Board (“FASB”) Accounting Standards Codification Topic 946, Financial Services – Investment Companies. These financial statements report on the Wells Fargo Endeavor Select Fund (the “Fund”) which is a diversified series of the Trust.
2. SIGNIFICANT ACCOUNTING POLICIES
The following significant accounting policies, which are consistently followed in the preparation of the financial statements of the Fund, are in conformity with U.S. generally accepted accounting principles which require management to make estimates and assumptions that affect the reported amounts of assets and liabilities, disclosure of contingent assets and liabilities at the date of the financial statements, and the reported amounts of revenues and expenses during the reporting period. Actual results could differ from those estimates.
Securities valuation
All investments are valued each business day as of the close of regular trading on the New York Stock Exchange (generally 4 p.m. Eastern Time), although the Fund may deviate from this calculation time under unusual or unexpected circumstances.
Equity securities that are listed on a foreign or domestic exchange or market are valued at the official closing price or, if none, the last sales price. If no sale occurs on the principal exchange or market that day, a fair value price will be determined in accordance with the Fund’s Valuation Procedures.
Investments in registered open-end investment companies are valued at net asset value. Interests in non-registered investment companies that are redeemable at net asset value are fair valued normally at net asset value.
Investments which are not valued using any of the methods discussed above are valued at their fair value, as determined in good faith by the Board of Trustees of the Fund. The Board of Trustees has established a Valuation Committee comprised of the Trustees and has delegated to it the authority to take any actions regarding the valuation of portfolio securities that the Valuation Committee deems necessary or appropriate, including determining the fair value of portfolio securities, unless the determination has been delegated to the Wells Fargo Asset Management Pricing Committee at Wells Fargo Funds Management, LLC (“Funds Management”). The Board of Trustees retains the authority to make or ratify any valuation decisions or approve any changes to the Valuation Procedures as it deems appropriate. On a quarterly basis, the Board of Trustees receives reports on any valuation actions taken by the Valuation Committee or the Wells Fargo Asset Management Pricing Committee which may include items for ratification.
Foreign currency translation
The accounting records of the Fund are maintained in U.S. dollars. The values of other assets and liabilities denominated in foreign currencies are translated into U.S. dollars at rates provided by an independent foreign currency pricing source at a time each business day specified by the Wells Fargo Asset Management Pricing Committee. Purchases and sales of securities, and income and expenses are converted at the rate of exchange on the respective dates of such transactions. Net realized foreign exchange gains or losses arise from sales of foreign currencies, currency gains or losses realized between the trade and settlement dates on securities transactions, and the difference between the amounts of dividends, interest and foreign withholding taxes recorded and the U.S. dollar equivalent of the amounts actually paid or received. Net unrealized foreign exchange gains and losses arise from changes in the fair value of assets and liabilities other than investments in securities resulting from changes in exchange rates. The changes in net assets arising from changes in exchange rates of securities and the changes in net assets resulting from changes in market prices of securities are not separately presented. Such changes are included in net realized and unrealized gains or losses from investments.
Securities lending
The Fund may lend its securities from time to time in order to earn additional income in the form of fees or interest on securities received as collateral or the investment of any cash received as collateral. When securities are on loan, the Fund receives interest or dividends on those securities. Cash collateral received in connection with its securities lending transactions is invested in Securities Lending Cash Investments, LLC (the “Securities Lending Fund”). Investments in Securities Lending Fund are valued at the evaluated bid price provided by an independent pricing service. Income earned from investment in the Securities Lending Fund (net of fees and rebates), if any, is included in income from affiliated securities on the Statement of Operations.
22 | Wells Fargo Endeavor Select Fund
Table of Contents
Notes to financial statements
In a securities lending transaction, the net asset value of the Fund is affected by an increase or decrease in the value of the securities loaned and by an increase or decrease in the value of the instrument in which collateral is invested. The amount of securities lending activity undertaken by the Fund fluctuates from time to time. The Fund has the right under the lending agreement to recover the securities from the borrower on demand. In the event of default or bankruptcy by the borrower, the Fund may be prevented from recovering the loaned securities or gaining access to the collateral or may experience delays or costs in doing so. In such an event, the terms of the agreement allow the unaffiliated securities lending agent to use the collateral to purchase replacement securities on behalf of the Fund or pay the Fund the market value of the loaned securities. The Fund bears the risk of loss with respect to depreciation of its investment of the cash collateral.
Security transactions and income recognition
Securities transactions are recorded on a trade date basis. Realized gains or losses are recorded on the basis of identified cost.
Dividend income is recognized on the ex-dividend date. Dividend income is recorded net of foreign taxes withheld where recovery of such taxes is not assured.
Distributions to shareholders
Distributions to shareholders from net investment income and any net realized gains are recorded on the ex-dividend date and paid at least annually. Such distributions are determined in accordance with income tax regulations and may differ from U.S. generally accepted accounting principles. Dividend sources are estimated at the time of declaration. The tax character of distributions is determined as of the Fund’s fiscal year end. Therefore, a portion of the Fund’s distributions made prior to the Fund’s fiscal year end may be categorized as a tax return of capital at year end.
Federal and other taxes
The Fund intends to continue to qualify as a regulated investment company by distributing substantially all of its investment company taxable income and any net realized capital gains (after reduction for capital loss carryforwards) sufficient to relieve it from all, or substantially all, federal income taxes. Accordingly, no provision for federal income taxes was required.
The Fund’s income and federal excise tax returns and all financial records supporting those returns for the prior three fiscal years are subject to examination by the federal and Delaware revenue authorities. Management has analyzed the Fund’s tax positions taken on federal, state, and foreign tax returns for all open tax years and does not believe that there are any uncertain tax positions that require recognition of a tax liability.
As of July 31, 2020, the aggregate cost of all investments for federal income tax purposes was $131,806,624 and the unrealized gains (losses) consisted of:
Gross unrealized gains | $ | 143,779,970 | ||
Gross unrealized losses | (709,787 | ) | ||
Net unrealized gains | $ | 143,070,183 | ||
Reclassifications are made to the Fund’s capital accounts for permanent tax differences to reflect income and gains available for distribution (or available capital loss carryforwards) under federal income tax regulations. U.S. generally accepted accounting principles require that certain components of net assets be adjusted to reflect permanent differences between financial and tax reporting. These reclassifications have no effect on net assets or net asset values per share. At July 31, 2020, as a result of permanent book-to-tax differences, the following reclassification adjustments were made on the Statement of Assets and Liabilities:
| Paid-in capital | Total distributable earnings | |
| $(14) | $14 | |
Class allocations
The separate classes of shares offered by the Fund differ principally in applicable sales charges, distribution, shareholder servicing, and administration fees. Class specific expenses are charged directly to that share class. Investment income, common fund-level expenses, and realized and unrealized gains (losses) on investments are allocated daily to each class of shares based on the relative proportion of net assets of each class.
Wells Fargo Endeavor Select Fund | 23
Table of Contents
Notes to financial statements
3. FAIR VALUATION MEASUREMENTS
Fair value measurements of investments are determined within a framework that has established a fair value hierarchy based upon the various data inputs utilized in determining the value of the Fund’s investments. The three-level hierarchy gives the highest priority to unadjusted quoted prices in active markets for identical assets or liabilities (Level 1) and the lowest priority to unobservable inputs (Level 3). The Fund’s investments are classified within the fair value hierarchy based on the lowest level of input that is significant to the fair value measurement. The inputs are summarized into three broad levels as follows:
| ∎ | Level 1 – quoted prices in active markets for identical securities |
| ∎ | Level 2 – other significant observable inputs (including quoted prices for similar securities, interest rates, prepayment speeds, credit risk, etc.) |
| ∎ | Level 3 – significant unobservable inputs (including the Fund’s own assumptions in determining the fair value of investments) |
The inputs or methodologies used for valuing investments in securities are not necessarily an indication of the risk associated with investing in those securities.
The following is a summary of the inputs used in valuing the Fund’s assets and liabilities as of July 31, 2020:
| Quoted prices (Level 1) | Other significant observable inputs (Level 2) | Significant (Level 3) | Total | |||||||||||||
Assets | ||||||||||||||||
Investments in: | ||||||||||||||||
Common stocks | ||||||||||||||||
Communication services | $ | 32,109,868 | $ | 0 | $ | 0 | $ | 32,109,868 | ||||||||
Consumer discretionary | 50,397,547 | 0 | 0 | 50,397,547 | ||||||||||||
Financials | 12,662,973 | 0 | 0 | 12,662,973 | ||||||||||||
Health care | 42,931,836 | 0 | 0 | 42,931,836 | ||||||||||||
Industrials | 19,300,932 | 0 | 0 | 19,300,932 | ||||||||||||
Information technology | 82,322,457 | 0 | 0 | 82,322,457 | ||||||||||||
Materials | 17,203,366 | 0 | 0 | 17,203,366 | ||||||||||||
Real estate | 5,545,412 | 0 | 0 | 5,545,412 | ||||||||||||
Short-term investments | ||||||||||||||||
Investment companies | 12,402,416 | 0 | 0 | 12,402,416 | ||||||||||||
Total assets | $ | 274,876,807 | $ | 0 | $ | 0 | $ | 274,876,807 | ||||||||
Additional sector, industry or geographic detail is included in the Portfolio of Investments.
For the year ended July 31, 2020, the Fund did not have any transfers into/out of Level 3.
24 | Wells Fargo Endeavor Select Fund
Table of Contents
Notes to financial statements
4. TRANSACTIONS WITH AFFILIATES
Management fee
Funds Management, an indirect wholly owned subsidiary of Wells Fargo & Company (“Wells Fargo”), is the manager of the Fund and provides advisory and fund-level administrative services under an investment management agreement. Under the investment management agreement, Funds Management is responsible for, among other services, implementing the investment objectives and strategies of the Fund, supervising the subadviser and providing fund-level administrative services in connection with the Fund’s operations. As compensation for its services under the investment management agreement, Funds Management is entitled to receive a management fee at the following annual rate based on the Fund’s average daily net assets:
| Average daily net assets | Management fee | |||
First $500 million | 0.700 | % | ||
Next $500 million | 0.675 | |||
Next $1 billion | 0.650 | |||
Next $2 billion | 0.625 | |||
Next $1 billion | 0.600 | |||
Next $3 billion | 0.590 | |||
Next $2 billion | 0.565 | |||
Next $2 billion | 0.555 | |||
Next $4 billion | 0.530 | |||
Over $16 billion | 0.505 | |||
For the year ended July 31, 2020, the management fee was equivalent to an annual rate of 0.70% of the Fund’s average daily net assets.
Funds Management has retained the services of a subadviser to provide daily portfolio management to the Fund. The fee for subadvisory services is borne by Funds Management. Wells Capital Management Incorporated (“WellsCap”), an affiliate of Funds Management and an indirect wholly owned subsidiary of Wells Fargo, is the subadviser to the Fund and is entitled to receive a fee from Funds Management at an annual rate starting at 0.30% and declining to 0.20% as the average daily net assets of the Fund increase.
Administration fees
Under a class-level administration agreement, Funds Management provides class-level administrative services to the Fund, which includes paying fees and expenses for services provided by the transfer agent, sub-transfer agents, omnibus account servicers and record-keepers. As compensation for its services under the class-level administration agreement, Funds Management receives an annual fee which is calculated based on the average daily net assets of each class as follows:
| Class-level administration fee | ||||
Class A, Class C | 0.21 | % | ||
Class R6 | 0.03 | |||
Administrator Class, Institutional Class | 0.13 | |||
Waivers and/or expense reimbursements
Funds Management has contractually waived and/or reimbursed management and administration fees to the extent necessary to maintain certain net operating expense ratios for the Fund. When each class of the Fund has exceeded its expense cap, Funds Management has waived fees and/or reimbursed expenses from fund-level expenses on a proportionate basis and then from class specific expenses. When only certain classes exceed their expense caps, waivers and/or reimbursements are applied against class specific expenses before fund-level expenses. Funds Management has committed through November 30, 2021 to waive fees and/or reimburse expenses to the extent necessary to cap the Fund’s expenses at 1.03% for Class A shares, 1.78% for Class C shares, 0.60% for Class R6 shares, 0.94% for Administrator Class shares, and 0.70% for Institutional Class shares. Prior to or after the commitment expiration date, the cap may be increased or the commitment to maintain the cap may be terminated only with the approval of the Board of Trustees. Prior to September 23, 2019, the Fund’s expenses were capped at 1.20% for Class A shares, 1.95% for Class C shares, 1.00% for Administrator Class shares, and 0.80% for Institutional Class shares.
Wells Fargo Endeavor Select Fund | 25
Table of Contents
Notes to financial statements
Distribution fee
The Trust has adopted a distribution plan for Class C shares of the Fund pursuant to Rule 12b-1 under the 1940 Act. A distribution fee is charged to Class C shares and paid to Wells Fargo Funds Distributor, LLC (“Funds Distributor”), the principal underwriter, at an annual rate of 0.75% of the average daily net assets of Class C shares.
In addition, Funds Distributor is entitled to receive the front-end sales charge from the purchase of Class A shares and a contingent deferred sales charge on the redemption of certain Class A shares. Funds Distributor is also entitled to receive the contingent deferred sales charges from redemptions of Class C shares. For the year ended July 31, 2020, Funds Distributor received $6,637 from the sale of Class A shares and $76 in contingent deferred sales charges from redemptions of Class C shares. No contingent deferred sales charges were incurred by Class A shares for the year ended July 31, 2020.
Shareholder servicing fees
The Trust has entered into contracts with one or more shareholder servicing agents, whereby Class A, Class C, and Administrator Class of the Fund are charged a fee at an annual rate of 0.25% of the average daily net assets of each respective class. A portion of these total shareholder servicing fees were paid to affiliates of Wells Fargo.
Interfund transactions
The Fund may purchase or sell portfolio investment securities to certain other Wells Fargo affiliates pursuant to Rule 17a-7 under the 1940 Act and under procedures adopted by the Board of Trustees. The procedures have been designed to ensure that these interfund transactions, which do not incur broker commissions, are effected at current market prices.
5. INVESTMENT PORTFOLIO TRANSACTIONS
Purchases and sales of investments, excluding U.S. government obligations (if any) and short-term securities, for the year ended July 31, 2020 were $33,631,496 and $57,427,802, respectively.
6. SECURITIES LENDING TRANSACTIONS
The Fund lends its securities through an unaffiliated securities lending agent and receives collateral in the form of cash or securities with a value at least equal to the value of the securities on loan. The value of the loaned securities is determined at the close of each business day and any increases or decreases in the required collateral are exchanged between the Fund and the counterparty on the next business day. Cash collateral received is invested in the Securities Lending Fund which seeks to provide a positive return compared to the daily Federal Funds Open Rate by investing in high-quality, U.S. dollar-denominated short-term money market instruments and is exempt from registration under Section 3(c)(7) of the 1940 Act. Securities Lending Fund is managed by Funds Management and is subadvised by WellsCap. Funds Management receives an advisory fee starting at 0.05% and declining to 0.01% as the average daily net assets of the Securities Lending Fund increase. All of the fees received by Funds Management are paid to WellsCap for its services as subadviser.
In the event of counterparty default or the failure of a borrower to return a loaned security, the Fund has the right to use the collateral to offset any losses incurred. As of July 31, 2020, the Fund did not have any securities on loan.
7. ACQUISITION
After the close of business on September 20, 2019, the Fund acquired the net assets of Wells Fargo Capital Growth Fund. The purpose of the transaction was to combine two funds with similar investment objectives and strategies. Shareholders holding Class A, Class C, Class R6, Administrator Class and Institutional Class shares of Wells Fargo Capital Growth Fund received Class A, Class C, Class R6, Administrator Class, and Institutional Class shares, respectively, of the Fund in the reorganization. The acquisition was accomplished by a tax-free exchange of all of the shares of Wells Fargo Capital Growth Fund for 12,325,989 shares of the Fund valued at $103,112,202 at an exchange ratio of 0.97, 1.03, 1.14, 1.09, and 1.13 for Class A, Class C, Class R6, Administrator Class and Institutional Class shares, respectively. The investment portfolio of Wells Fargo Capital Growth Fund with a fair value of $101,506,563, identified cost of $55,944,059 and unrealized gains of $45,562,504 at September 20, 2019 were the principal assets acquired by the Fund. The aggregate net assets of Wells Fargo Capital Growth Fund and the Fund immediately prior to the acquisition were $103,112,202 and $124,063,059, respectively. The aggregate net assets of the Fund immediately after the acquisition were $227,175,261. For financial reporting purposes, assets received and shares issued by the Fund were recorded at fair value; however, the cost basis of the investments received from Wells Fargo Capital Growth Fund was carried forward to align with ongoing reporting of the Fund’s realized and unrealized gains and losses with amounts distributable to shareholders for tax purposes.
26 | Wells Fargo Endeavor Select Fund
Table of Contents
Notes to financial statements
Assuming the acquisition had been completed August 1, 2019, the beginning of the annual reporting period for the Fund, the pro forma results of operations for the year ended July 31, 2020 would have been as follows (unaudited):
Net investment loss | $ | (273,003 | ) | |
Net realized and unrealized gains on investments | 62,562,425 | |||
Net increase in net assets resulting from operations | $ | 62,289,422 | ||
Because the combined investment portfolios have been managed as a single integrated portfolio since the acquisition was completed, it is not practicable to separate the amounts of revenue and earnings of Wells Fargo Capital Growth Fund that have been included in the Fund’s Statement of Operations since September 20, 2019.
8. BANK BORROWINGS
The Trust (excluding the money market funds), Wells Fargo Master Trust and Wells Fargo Variable Trust are parties to a $350,000,000 revolving credit agreement whereby the Fund is permitted to use bank borrowings for temporary or emergency purposes, such as to fund shareholder redemption requests. Interest under the credit agreement is charged to the Fund based on a borrowing rate equal to the higher of the Federal Funds rate in effect on that day plus 1.25% or the overnight LIBOR rate in effect on that day plus 1.25%. In addition, an annual commitment fee equal to 0.25% of the unused balance is allocated to each participating fund.
For the year ended July 31, 2020, there were no borrowings by the Fund under the agreement.
9. DISTRIBUTIONS TO SHAREHOLDERS
The tax character of distributions paid during the years ended July 31, 2020 and July 31, 2019 were as follows:
| Year ended July 31 | ||||||||
| 2020 | 2019 | |||||||
Ordinary income | $ | 750,080 | $ | 3,970,538 | ||||
Long-term capital gain | 18,568,506 | 24,311,646 | ||||||
As of July 31, 2020, the components of distributable earnings on a tax basis were as follows:
| Undistributed ordinary income | Undistributed long-term gain | Unrealized gains | ||
| $2,142,616 | $13,027,858 | $143,070,183 | ||
10. CONCENTRATION RISK
Concentration risks result from exposure to a limited number of sectors. As of the end of the period, the Fund invested a concentration of its portfolio in the information technology sector. A fund that invests a substantial portion of its assets in any sector may be more affected by changes in that sector than would be a fund whose investments are not heavily weighted in any sector.
11. INDEMNIFICATION
Under the Fund’s organizational documents, the officers and Trustees have been granted certain indemnification rights against certain liabilities that may arise out of performance of their duties to the Fund. The Fund has entered into a separate agreement with each Trustee that converts indemnification rights currently existing under the Fund’s organizational documents into contractual rights that cannot be changed in the future without the consent of the Trustee. Additionally, in the normal course of business, the Fund may enter into contracts with service providers that contain a variety of indemnification clauses. The Fund’s maximum exposure under these arrangements is dependent on future claims that may be made against the Fund and, therefore, cannot be estimated.
12. NEW ACCOUNTING PRONOUNCEMENT
In August 2018, FASB issued Accounting Standards Update (“ASU”) No. 2018-13, Fair Value Measurement (Topic 820) Disclosure Framework—Changes to the Disclosure Requirements for Fair Value Measurement. ASU 2018-13 updates the disclosure
Wells Fargo Endeavor Select Fund | 27
Table of Contents
Notes to financial statements
requirements on fair value measurements in Topic 820, Fair Value Measurements. The amendments are effective for fiscal years, and interim periods within those fiscal years, beginning after December 15, 2019. Management has adopted this guidance which did not have a material impact on the financial statements.
13. CORONAVIRUS (COVID-19) PANDEMIC
On March 11, 2020, the World Health Organization announced that it had made the assessment that coronavirus disease 2019 (“COVID-19”) is a pandemic. The impacts of COVID-19 are adversely affecting the entire global economy, individual companies and investment products, and the market in general. There is significant uncertainty around the extent and duration of business disruptions related to COVID-19 and the impacts may be short term or may last for an extended period of time. The risk of further spreading of COVID-19 has led to significant uncertainty and volatility in the financial markets.
28 | Wells Fargo Endeavor Select Fund
Table of Contents
Report of independent registered public accounting firm
To the Shareholders of the Fund and Board of Trustees
Wells Fargo Funds Trust:
Opinion on the Financial Statements
We have audited the accompanying statement of assets and liabilities of Wells Fargo Endeavor Select Fund (the Fund), one of the funds constituting Wells Fargo Funds Trust, including the portfolio of investments, as of July 31, 2020, the related statement of operations for the year then ended, the statements of changes in net assets for each of the years in the two-year period then ended, and the related notes (collectively, the financial statements) and the financial highlights for each of the years or periods in the five-year period then ended. In our opinion, the financial statements and financial highlights present fairly, in all material respects, the financial position of the Fund as of July 31, 2020, the results of its operations for the year then ended, the changes in its net assets for each of the years in the two-year period then ended, and the financial highlights for each of the years or periods in the five-year period then ended, in conformity with U.S. generally accepted accounting principles.
Basis for Opinion
These financial statements and financial highlights are the responsibility of the Fund’s management. Our responsibility is to express an opinion on these financial statements and financial highlights based on our audits. We are a public accounting firm registered with the Public Company Accounting Oversight Board (United States) (PCAOB) and are required to be independent with respect to the Fund in accordance with the U.S. federal securities laws and the applicable rules and regulations of the Securities and Exchange Commission and the PCAOB.
We conducted our audits in accordance with the standards of the PCAOB. Those standards require that we plan and perform the audit to obtain reasonable assurance about whether the financial statements and financial highlights are free of material misstatement, whether due to error or fraud. Our audits included performing procedures to assess the risks of material misstatement of the financial statements and financial highlights, whether due to error or fraud, and performing procedures that respond to those risks. Such procedures included examining, on a test basis, evidence regarding the amounts and disclosures in the financial statements and financial highlights. Such procedures also included confirmation of securities owned as of July 31, 2020, by correspondence with the custodian and transfer agent. Our audits also included evaluating the accounting principles used and significant estimates made by management, as well as evaluating the overall presentation of the financial statements and financial highlights. We believe that our audits provide a reasonable basis for our opinion.

We have not been able to determine the specific year that we began serving as the auditor of one or more Wells Fargo Funds investment companies; however we are aware that we have served as the auditor of one or more Wells Fargo Funds investment companies since at least 1955.
Boston, Massachusetts
September 25, 2020
Wells Fargo Endeavor Select Fund | 29
Table of Contents
TAX INFORMATION
For corporate shareholders, pursuant to Section 854 of the Internal Revenue Code, 52.53% of ordinary income dividends qualify for the corporate dividends-received deduction for the fiscal year ended July 31, 2020.
Pursuant to Section 852 of the Internal Revenue Code, $18,568,506 was designated as a 20% rate gain distribution for the fiscal year ended July 31, 2020.
Pursuant to Section 854 of the Internal Revenue Code, $440,710 of income dividends paid during the fiscal year ended July 31, 2020 has been designated as qualified dividend income (QDI).
For the fiscal year ended July 31, 2020, $750,080 has been designated as short-term capital gain dividends for nonresident alien shareholders pursuant to Section 871 of the Internal Revenue Code.
PROXY VOTING INFORMATION
A description of the policies and procedures used to determine how to vote proxies relating to portfolio securities is available, upon request, by calling 1-800-222-8222, visiting our website at wfam.com, or visiting the SEC website at sec.gov. Information regarding how the proxies related to portfolio securities were voted during the most recent 12-month period ended June 30 is available on the website at wfam.com or by visiting the SEC website at sec.gov.
QUARTERLY PORTFOLIO HOLDINGS INFORMATION
The Fund files its complete schedule of portfolio holdings with the SEC for the first and third quarters of each fiscal year as an exhibit to its reports on Form N-PORT. Shareholders may view the filed Form N-PORT by visiting the SEC website at sec.gov.
30 | Wells Fargo Endeavor Select Fund
Table of Contents
Other information (unaudited)
BOARD OF TRUSTEES AND OFFICERS
Each of the Trustees and Officers1 listed in the table below acts in identical capacities for each fund in the Wells Fargo family of funds, which consists of 147 mutual funds comprising the Wells Fargo Funds Trust, Wells Fargo Variable Trust, Wells Fargo Master Trust and four closed-end funds (collectively the “Fund Complex”). This table should be read in conjunction with the Prospectus and the Statement of Additional Information2. The mailing address of each Trustee and Officer is 525 Market Street, 12th Floor, San Francisco, CA 94105. Each Trustee and Officer serves an indefinite term, however, each Trustee serves such term until reaching the mandatory retirement age established by the Trustees.
Independent Trustees
Name and year of birth | Position held and length of service* | Principal occupations during past five years or longer | Current other public company or investment company directorships | |||
William R. Ebsworth (Born 1957) | Trustee, since 2015 | Retired. From 1984 to 2013, equities analyst, portfolio manager, research director and chief investment officer at Fidelity Management and Research Company in Boston, Tokyo, and Hong Kong, and retired in 2013 as Chief Investment Officer of Fidelity Strategic Advisers, Inc. where he led a team of investment professionals managing client assets. Prior thereto, Board member of Hong Kong Securities Clearing Co., Hong Kong Options Clearing Corp., the Thailand International Fund, Ltd., Fidelity Investments Life Insurance Company, and Empire Fidelity Investments Life Insurance Company. Audit Committee Chair and Investment Committee Chair of the Vincent Memorial Hospital Endowment (non-profit organization). Mr. Ebsworth is a CFA® charterholder. | N/A | |||
Jane A. Freeman (Born 1953) | Trustee, since 2015; Chair Liaison, since 2018 | Retired. From 2012 to 2014 and 1999 to 2008, Chief Financial Officer of Scientific Learning Corporation. From 2008 to 2012, Ms. Freeman provided consulting services related to strategic business projects. Prior to 1999, Portfolio Manager at Rockefeller & Co. and Scudder, Stevens & Clark. Board member of the Harding Loevner Funds from 1996 to 2014, serving as both Lead Independent Director and chair of the Audit Committee. Board member of the Russell Exchange Traded Funds Trust from 2011 to 2012 and the chair of the Audit Committee. Ms. Freeman is also an inactive Chartered Financial Analyst. | N/A | |||
Isaiah Harris, Jr. (Born 1952) | Trustee, since 2009; Audit Committee Chairman, since 2019 | Retired. Chairman of the Board of CIGNA Corporation since 2009, and Director since 2005. From 2003 to 2011, Director of Deluxe Corporation. Prior thereto, President and CEO of BellSouth Advertising and Publishing Corp. from 2005 to 2007, President and CEO of BellSouth Enterprises from 2004 to 2005 and President of BellSouth Consumer Services from 2000 to 2003. Emeritus member of the Iowa State University Foundation Board of Governors. Emeritus Member of the Advisory Board of Iowa State University School of Business. Advisory Board Member, Palm Harbor Academy (private school). Advisory Board Member, Child Evangelism Fellowship (non-profit). Mr. Harris is a certified public accountant (inactive status). | CIGNA Corporation | |||
Judith M. Johnson (Born 1949) | Trustee, since 2008; Audit Committee Chairman, from 2009 to 2018 | Retired. Prior thereto, Chief Executive Officer and Chief Investment Officer of Minneapolis Employees Retirement Fund from 1996 to 2008. Ms. Johnson is an attorney, certified public accountant and a certified managerial accountant. | N/A | |||
David F. Larcker (Born 1950) | Trustee, since 2009 | James Irvin Miller Professor of Accounting at the Graduate School of Business, Stanford University, Director of the Corporate Governance Research Initiative and Senior Faculty of The Rock Center for Corporate Governance since 2006. From 2005 to 2008, Professor of Accounting at the Graduate School of Business, Stanford University. Prior thereto, Ernst & Young Professor of Accounting at The Wharton School, University of Pennsylvania from 1985 to 2005. | N/A | |||
Wells Fargo Endeavor Select Fund | 31
Table of Contents
Other information (unaudited)
Name and year of birth | Position held and length of service* | Principal occupations during past five years or longer | Current other public company or investment company directorships | |||
Olivia S. Mitchell (Born 1953) | Trustee, since 2006; Nominating and Governance Committee Chair, since 2018 | International Foundation of Employee Benefit Plans Professor, Wharton School of the University of Pennsylvania since 1993. Director of Wharton’s Pension Research Council and Boettner Center on Pensions & Retirement Research, and Research Associate at the National Bureau of Economic Research. Previously, Cornell University Professor from 1978 to 1993. | N/A | |||
Timothy J. Penny (Born 1951) | Trustee, since 1996; Chairman, since 2018 | President and Chief Executive Officer of Southern Minnesota Initiative Foundation, a non-profit organization, since 2007. Member of the Board of Trustees of NorthStar Education Finance, Inc., a non-profit organization, since 2007. | N/A | |||
James G. Polisson (Born 1959) | Trustee, since 2018 | Retired. Chief Marketing Officer, Source (ETF) UK Services, Ltd, from 2015 to 2017. From 2012 to 2015, Principal of The Polisson Group, LLC, a management consulting, corporate advisory and principal investing company. Chief Executive Officer and Managing Director at Russell Investments, Global Exchange Traded Funds from 2010 to 2012. Managing Director of Barclays Global Investors from 1998 to 2010 and Global Chief Marketing Officer for iShares and Barclays Global Investors from 2000 to 2010. Trustee of the San Francisco Mechanics’ Institute, a non-profit organization, from 2013 to 2015. Board member of the Russell Exchange Traded Fund Trust from 2011 to 2012. Director of Barclays Global Investors Holdings Deutschland GmbH from 2006 to 2009. Mr. Polisson is an attorney and has a retired status with the Massachusetts and District of Columbia Bar Associations. | N/A | |||
Pamela Wheelock (Born 1959) | Trustee, since January 2020; previously Trustee from January 2018 to July 2019 | Board member of the Destination Medical Center Economic Development Agency, Rochester, Minnesota since 2019 and Interim President of the McKnight Foundation since 2020. Acting Commissioner, Minnesota Department of Human Services, July 2019 through September 2019. Human Services Manager (part-time), Minnesota Department of Human Services, October 2019 through December 2019. Chief Operating Officer, Twin Cities Habitat for Humanity from 2017 to 2019. Vice President of University Services, University of Minnesota from 2012 to 2016. Prior thereto, on the Board of Directors, Governance Committee and Finance Committee for the Minnesota Philanthropy Partners (Saint Paul Foundation) from 2012 to 2018, Interim Chief Executive Officer of Blue Cross Blue Shield of Minnesota from 2011 to 2012, Chairman of the Board from 2009 to 2012 and Board Director from 2003 to 2015. Vice President, Leadership and Community Engagement, Bush Foundation, Saint Paul, Minnesota (a private foundation) from 2009 to 2011. Executive Vice President and Chief Financial Officer, Minnesota Sports and Entertainment from 2004 to 2009 and Senior Vice President from 2002 to 2004. Executive Vice President of the Minnesota Wild Foundation from 2004 to 2008. Commissioner of Finance, State of Minnesota, from 1999 to 2002. Currently Board Chair of the Minnesota Wild Foundation since 2010. | N/A | |||
| * | Length of service dates reflect the Trustee’s commencement of service with the Trust’s predecessor entities, where applicable. |
32 | Wells Fargo Endeavor Select Fund
Table of Contents
Other information (unaudited)
Officers
Name and year of birth | Position held and length of service | Principal occupations during past five years or longer | ||
Andrew Owen (Born 1960) | President, since 2017 | Executive Vice President of Wells Fargo & Company and Head of Affiliated Managers, Wells Fargo Asset Management, since 2014. In addition, Mr. Owen is currently President, Chief Executive Officer and Director of Wells Fargo Funds Management, LLC since 2017. Prior thereto, Executive Vice President responsible for marketing, investments and product development for Wells Fargo Funds Management, LLC, from 2009 to 2014. | ||
Jeremy DePalma1 (Born 1974) | Treasurer, since 2012 | Senior Vice President of Wells Fargo Funds Management, LLC since 2009. Senior Vice President of Evergreen Investment Management Company, LLC from 2008 to 2010 and head of the Fund Reporting and Control Team within Fund Administration from 2005 to 2010. | ||
Michelle Rhee (Born 1966) | Chief Legal Officer, since 2019 | Secretary of Wells Fargo Funds Management, LLC, Chief Legal Counsel of Wells Fargo Asset Management and Assistant General Counsel of Wells Fargo Bank, N.A. since 2018. Associate General Counsel and Managing Director of Bank of America Corporation from 2004 to 2018. | ||
Catherine Kennedy (Born 1969) | Secretary, since 2019 | Vice President of Wells Fargo Funds Management, LLC and Senior Counsel of the Wells Fargo Legal Department since 2010. Vice President and Senior Counsel of Evergreen Investment Management Company, LLC from 1998 to 2010. | ||
Michael H. Whitaker (Born 1967) | Chief Compliance Officer, since 2016 | Chief Compliance Officer of Wells Fargo Asset Management since 2016. Senior Vice President and Chief Compliance Officer for Fidelity Investments from 2007 to 2016. | ||
David Berardi (Born 1975) | Assistant Treasurer, since 2009 | Vice President of Wells Fargo Funds Management, LLC since 2009. Vice President of Evergreen Investment Management Company, LLC from 2008 to 2010. Manager of Fund Reporting and Control for Evergreen Investment Management Company, LLC from 2004 to 2010. | ||
| 1 | Jeremy DePalma acts as Treasurer of 82 funds and Assistant Treasurer of 65 funds in the Fund Complex. |
| 2 | The Statement of Additional Information includes additional information about the Trustees and is available, without charge, upon request, by calling 1-800-222-8222 or by visiting the website at wfam.com. |
Wells Fargo Endeavor Select Fund | 33
Table of Contents
Other information (unaudited)
BOARD CONSIDERATION OF INVESTMENT MANAGEMENT AND SUB-ADVISORY AGREEMENTS:
Wells Fargo Endeavor Select Fund
Under the Investment Company Act of 1940 (the “1940 Act”), the Board of Trustees (the “Board”) of Wells Fargo Funds Trust (the “Trust”) must determine annually whether to approve the continuation of the Trust’s investment management and sub-advisory agreements. In this regard, at a Board meeting held on May 26, 2020 and May 28, 2020 (together, the “Meeting”), the Board, all the members of which have no direct or indirect interest in the investment management and sub-advisory agreements and are not “interested persons” of the Trust, as defined in the 1940 Act (the “Independent Trustees”), reviewed and approved for Wells Fargo Endeavor Select Fund (the “Fund”): (i) an investment management agreement (the “Management Agreement”) with Wells Fargo Funds Management, LLC (“Funds Management”); and (ii) an investment sub-advisory agreement (the “Sub-Advisory Agreement”) with Wells Capital Management Incorporated (the “Sub-Adviser”), an affiliate of Funds Management. The Management Agreement and the Sub-Advisory Agreement are collectively referred to as the “Advisory Agreements.”
At the Meeting, the Board considered the factors and reached the conclusions described below relating to the selection of Funds Management and the Sub-Adviser and the approval of the Advisory Agreements. Prior to the Meeting, including at a Board meeting held in April 2020, the Trustees conferred extensively among themselves and with representatives of Funds Management about these matters. Also, the Board has adopted a team-based approach, with each team consisting of a sub-set of Trustees, to assist the full Board in the discharge of its duties in reviewing investment performance and other matters throughout the year. The Independent Trustees were assisted in their evaluation of the Advisory Agreements by independent legal counsel, from whom they received separate legal advice and with whom they met separately.
In providing information to the Board, Funds Management and the Sub-Adviser were guided by a detailed set of requests for information submitted to them by independent legal counsel on behalf of the Independent Trustees at the start of the Board’s annual contract renewal process earlier in 2020. In considering and approving the Advisory Agreements, the Trustees considered the information they believed relevant, including but not limited to the information discussed below. The Board considered not only the specific information presented in connection with the Meeting, but also the knowledge gained over time through interaction with Funds Management and the Sub-Adviser about various topics. In this regard, the Board reviewed reports of Funds Management at each of its quarterly meetings, which included, among other things, portfolio reviews and investment performance reports. In addition, the Board and the teams mentioned above confer with portfolio managers at various times throughout the year. The Board did not identify any particular information or consideration that was all-important or controlling, and each individual Trustee may have attributed different weights to various factors.
After its deliberations, the Board unanimously approved the continuation of the Advisory Agreements for a one-year term and determined that the compensation payable to Funds Management and the Sub-Adviser under each of the Advisory Agreements was reasonable. The Board considered the approval of the Advisory Agreements for the Fund as part of its consideration of agreements for funds across the complex, but its approvals were made on a fund-by-fund basis. The following summarizes a number of important, but not necessarily all, factors considered by the Board in support of its approvals.
Nature, extent and quality of services
The Board received and considered various information regarding the nature, extent and quality of services provided to the Fund by Funds Management and the Sub-Adviser under the Advisory Agreements. This information included a description of the investment advisory services and Fund-level administrative services covered by the Management Agreement, as well as, among other things, a summary of the background and experience of senior management of Wells Fargo Asset Management (“WFAM”), of which Funds Management and the Sub-Adviser are a part, and a summary of investments made in the business of WFAM. The Board also received a description of Funds Management’s and the Sub-Adviser’s business continuity plans and of their approaches to data privacy and cybersecurity, and related testing. The Board also received and reviewed information about Funds Management’s role as administrator of the Fund’s liquidity risk management program, Funds Management’s approach to risk management, and Funds Management’s intermediary and vendor oversight program.
The Board also considered the qualifications, background, tenure and responsibilities of each of the portfolio managers primarily responsible for the day-to-day portfolio management of the Fund. The Board evaluated the ability of Funds Management and the Sub-Adviser to attract and retain qualified investment professionals, including research, advisory and supervisory personnel. The Board further considered the compliance programs and compliance records of Funds Management and the Sub-Adviser. In addition, the Board took into account the full range of services provided to the Fund by Funds Management and its affiliates.
34 | Wells Fargo Endeavor Select Fund
Table of Contents
Other information (unaudited)
Fund investment performance and expenses
The Board considered the investment performance results for the Fund over various time periods ended December 31, 2019. The Board also considered more current results for various time periods ended March 31, 2020. The Board considered these results in comparison to the investment performance of funds in a universe that was determined by Broadridge Inc. (“Broadridge”) to be similar to the Fund (the “Universe”), and in comparison to the Fund’s benchmark index and to other comparative data. Broadridge is an independent provider of investment company data. The Board received a description of the methodology used by Broadridge to select the mutual funds in the performance Universe. The Board noted that the investment performance of the Fund (Administrator Class) was higher than the average investment performance of the Universe for the one-, three-, five- and ten-year periods ended December 31, 2019. The Board also noted that the investment performance of the Fund (Administrator Class) was higher than the average investment performance of the Universe for all periods ended March 31, 2020. The Board also noted that the investment performance of the Fund was higher than its benchmark index, the Russell 1000® Growth Index, for the one-, three- and five-year periods ended December 31, 2019, and lower than its benchmark index for the ten-year period ended December 31, 2019. The Board also noted that the investment performance of the Fund was higher than its benchmark index, the Russell 1000 Growth® Index, for the one-, three- and five-year periods ended March 31, 2020, and lower than its benchmark index for the ten-year period ended March 31, 2020.
The Board also received and considered information regarding the Fund’s net operating expense ratios and their various components, including actual management fees, custodian and other non-management fees, and Rule 12b-1 and non-Rule 12b-1 shareholder service fees. The Board considered these ratios in comparison to the median ratios of funds in class-specific expense groups that were determined by Broadridge to be similar to the Fund (the “Groups”). The Board received a description of the methodology used by Broadridge to select the mutual funds in the expense Groups and an explanation of how funds comprising expense groups and their expense ratios may vary from year-to-year. Based on the Broadridge reports, the Board noted that the net operating expense ratios of the Fund were lower than the median net operating expense ratios of the expense Groups for each share class.
The Board took into account the Fund’s investment performance and expense information provided to it among the factors considered in deciding to re-approve the Advisory Agreements.
Investment management and sub-advisory fee rates
The Board reviewed and considered the contractual fee rates payable by the Fund to Funds Management under the Management Agreement, as well as the contractual fee rates payable by the Fund to Funds Management for class-level administrative services under a Class-Level Administration Agreement, which include, among other things, class-level transfer agency and sub-transfer agency costs (collectively, the “Management Rates”). The Board also reviewed and considered the contractual investment sub-advisory fee rates that are payable by Funds Management to the Sub-Adviser for investment sub-advisory services.
Among other information reviewed by the Board was a comparison of the Fund’s Management Rates with the average contractual investment management fee rates of funds in the expense Groups at a common asset level as well as transfer agency costs of the funds in the expense Groups. The Board noted that the Management Rates of the Fund were in range of the sum of these average rates for the Fund’s expense Groups for all share classes.
The Board also received and considered information about the portion of the total management fee that was retained by Funds Management after payment of the fee to the Sub-Adviser for sub-advisory services. In assessing the reasonableness of this amount, the Board received and evaluated information about the nature and extent of responsibilities retained and risks assumed by Funds Management and not delegated to or assumed by the Sub-Adviser, and about Funds Management’s on-going oversight services. Given the affiliation between Funds Management and the Sub-Adviser, the Board ascribed limited relevance to the allocation of fees between them.
The Board also received and considered information about the nature and extent of services offered and fee rates charged by Funds Management and the Sub-Adviser to other types of clients with investment strategies similar to those of the Fund. In this regard, the Board received information about the significantly greater scope of services, and compliance, reporting and other legal burdens and risks of managing proprietary mutual funds compared with those associated with managing assets of other types of clients, including third-party sub-advised fund clients and non-mutual fund clients such as institutional separate accounts.
Based on its consideration of the factors and information it deemed relevant, including those described here, the Board determined that the compensation payable to Funds Management under the Management Agreement and to the Sub-Adviser under the Sub-Advisory Agreement was reasonable.
Wells Fargo Endeavor Select Fund | 35
Table of Contents
Other information (unaudited)
Profitability
The Board received and considered information concerning the profitability of Funds Management, as well as the profitability of both WFAM and Wells Fargo & Co. (“Wells Fargo”) from providing services to the fund family as a whole. The Board noted that the Sub-Adviser’s profitability information with respect to providing services to the Fund and other funds in the family was subsumed in the WFAM and Wells Fargo profitability analysis.
Funds Management reported on the methodologies and estimates used in calculating profitability, including a description of the methodology used to allocate certain expenses. Among other things, the Board noted that the levels of profitability reported on a fund-by-fund basis varied widely, depending on factors such as the size, type and age of fund.
Based on its review, the Board did not deem the profits reported by Funds Management, WFAM or Wells Fargo from services provided to the Fund to be at a level that would prevent it from approving the continuation of the Advisory Agreements.
Economies of scale
The Board received and considered information about the potential for Funds Management to experience economies of scale in the provision of management services to the Fund, the difficulties of calculating economies of scale at an individual fund level, and the extent to which potential scale benefits are shared with shareholders. The Board noted the existence of breakpoints in the Fund’s management fee structure, which operate generally to reduce the Fund’s expense ratios as the Fund grows in size, and the size of the Fund in relation to such breakpoints. The Board considered that in addition to management fee breakpoints, Funds Management shares potential economies of scale from its management business in a variety of ways, including through fee waiver and expense reimbursement arrangements, services that benefit shareholders, competitive management fee rates set at the outset without regard to breakpoints, and investments in the business intended to enhance services available to shareholders.
The Board concluded that Funds Management’s arrangements with respect to the Fund, including contractual breakpoints, constituted a reasonable approach to sharing potential economies of scale with the Fund and its shareholders.
Other benefits to Funds Management and the Sub-Adviser
The Board received and considered information regarding potential “fall-out” or ancillary benefits received by Funds Management and its affiliates, including the Sub-Adviser, as a result of their relationships with the Fund. Ancillary benefits could include, among others, benefits directly attributable to other relationships with the Fund and benefits potentially derived from an increase in Funds Management’s and the Sub-Adviser’s business as a result of their relationships with the Fund. The Board noted that various affiliates of Funds Management may receive distribution-related fees, shareholder servicing payments and sub-transfer agency fees in respect of shares sold or held through them and services provided.
The Board also reviewed information about soft dollar credits earned and utilized by the Sub-Adviser, fees earned by Funds Management and the Sub-Adviser from managing a private investment vehicle for the fund family’s securities lending collateral, and commissions earned by an affiliated broker from portfolio transactions.
Based on its consideration of the factors and information it deemed relevant, including those described here, the Board did not find that any ancillary benefits received by Funds Management and its affiliates, including the Sub-Adviser, were unreasonable.
Conclusion
At the Meeting, after considering the above-described factors and based on its deliberations and its evaluation of the information described above, the Board unanimously approved the continuation of the Advisory Agreements for a one-year term and determined that the compensation payable to Funds Management and the Sub-Adviser under each of the Advisory Agreements was reasonable.
36 | Wells Fargo Endeavor Select Fund
Table of Contents
Other information (unaudited)
LIQUIDITY RISK MANAGEMENT PROGRAM
In accordance with Rule 22e-4 under the Investment Company Act of 1940, as amended (the “Liquidity Rule”), Wells Fargo Funds Trust (the “Trust”) has adopted and implemented a liquidity risk management program (the “Program”) on behalf of each of its series, including the Fund, which is reasonably designed to assess and manage the Fund’s liquidity risk. “Liquidity risk” is defined as the risk that the Fund is unable to meet redemption requests without significantly diluting remaining investors’ interests in the Fund. The Trust’s Board of Trustees (the “Board”) previously approved the designation of Wells Fargo Funds Management, LLC (“Funds Management”), the Fund’s investment manager, as the administrator of the Program, and Funds Management has established a Liquidity Risk Management Council composed of personnel from multiple departments within Funds Management and its affiliates to assist Funds Management in the implementation and on-going administration of the Program.
The Program is comprised of various components designed to support the assessment and/or management of liquidity risk, including: (1) the periodic assessment (no less frequently than annually) of certain factors that influence the Fund’s liquidity risk; (2) the periodic classification (no less frequently than monthly) of the Fund’s investments into one of four liquidity categories that reflect an estimate of their liquidity under current market conditions; (3) a 15% limit on the acquisition of “illiquid investments” (as defined under the Liquidity Rule); (4) to the extent the Fund does not invest primarily in “highly liquid investments” (as defined under the Liquidity Rule), the determination of a minimum percentage of the Fund’s assets that generally will be invested in highly liquid investments (an “HLIM”); (5) if the Fund has established an HLIM, the periodic review (no less frequently than annually) of the HLIM and the adoption of policies and procedures for responding to a shortfall of the Fund’s “highly liquid investments” below its HLIM; and (6) periodic reporting to the Board.
At a meeting of the Board held on May 26 and 28, 2020, the Board received a written report (the “Report”) from Funds Management that addressed the operation of the Program and assessed its adequacy and effectiveness of implementation. The Report covered the initial period from December 1, 2018 through December 31, 2019 (the “Reporting Period”). No significant liquidity events impacting the Fund were noted in the Report. There were no material changes to the Program during the Reporting Period. The Report concluded that the Program is operating effectively to assess and manage the Fund’s liquidity risk, and that the Program has been and continues to be adequately and effectively implemented to monitor and, as applicable, respond to the Fund’s liquidity developments.
There can be no assurance that the Program will achieve its objectives under all circumstances in the future. Please refer to the Fund’s prospectus for more information regarding the Fund’s exposure to liquidity risk and other risks to which an investment in the Fund may be subject.
Wells Fargo Endeavor Select Fund | 37
Table of Contents
Effective on or after May 1, 2020, clients of Edward Jones (also referred to as “shareholders”) purchasing Fund shares on the Edward Jones commission and fee-based platforms are eligible only for the following sales charge discounts (also referred to as “breakpoints”) and waivers, which can differ from breakpoints and waivers described elsewhere in the Fund’s Prospectus or SAI or through another broker-dealer. In all instances, it is the shareholder’s responsibility to inform Edward Jones at the time of purchase of any relationship, holdings of Wells Fargo Funds or other facts qualifying the purchaser for breakpoints or waivers. Edward Jones can ask for documentation of such circumstance.
| Breakpoints available at Edward Jones |
| Rights of Accumulation (ROA) |
The applicable sales charge on a purchase of Class A shares is determined by taking into account all share classes (except any money market funds and retirement plan share classes) of Wells Fargo Funds held by the shareholder or in an account grouped by Edward Jones with other accounts for the purpose of providing certain pricing considerations (“pricing groups”). This includes all share classes held on the Edward Jones platform and/or held on another platform. The inclusion of eligible fund family assets in the rights of accumulation calculation is dependent on the shareholder notifying his or her financial advisor of such assets at the time of calculation. |
ROA is determined by calculating the higher of cost or market value (current shares x NAV). |
| Letter of Intent (LOI) |
Through a LOI, shareholders can receive the sales charge and breakpoint discounts for purchases shareholders intend to makeover a 13-month period from the date Edward Jones receives the LOI. The LOI is determined by calculating the higher of cost or market value of qualifying holdings at LOI initiation in combination with the value that the shareholder intends to buy over a 13-month period to calculate the front-end sales charge and any breakpoint discounts. Each purchase the shareholder makes during that 13-month period will receive the sales charge and breakpoint discount that applies to the total amount. The inclusion of eligible fund family assets in the LOI calculation is dependent on the shareholder notifying his or her financial advisor of such assets at the time of calculation. Purchases made before the LOI is received by Edward Jones are not covered under the LOI and will not reduce the sales charge previously paid. Sales charges will be adjusted if LOI is not met. |
| Sales charges are waived for the following shareholders and in the following situations at Edward Jones: |
● Associates of Edward Jones and its affiliates and their family members who are in the same pricing group (as determined by Edward Jones under its policies and procedures) as the associate. This waiver will continue for the remainder of the associate’s life if the associate retires from Edward Jones in good-standing. |
● Shares purchased in an Edward Jones fee-based program. |
● Shares purchased through reinvestment of capital gains distributions and dividend reinvestment. |
● Shares purchased from the proceeds of redeemed shares of the same fund family so long as the following conditions are met: 1) the proceeds are from the sale of shares within 60 days of the purchase, and 2) the sale and purchase are made in the same share class and the same account or the purchase is made in an individual retirement account with proceeds from liquidations in a non-retirement account. |
● Shares exchanged into Class A shares from another share class so long as the exchange is into the same fund and was initiated at the discretion of Edward Jones. Edward Jones is responsible for any remaining CDSC due to the fund company, if applicable. Any future purchases are subject to the applicable sales charge as disclosed in the prospectus. |
● Exchanges from Class C shares to Class A shares of the same fund, generally, in the 84th month following the anniversary of the purchase date or earlier at the discretion of Edward Jones. |
| If the shareholder purchases shares that are subject to a CDSC and those shares are redeemed before the CDSC is expired, the shareholder is responsible to pay the CDSC except in the following conditions available at Edward Jones: |
● The death or disability of the shareholder. |
● Systematic withdrawals with up to 10% per year of the account value. |
● Return of excess contributions from an Individual Retirement Account (IRA). |
● Shares sold as part of a required minimum distribution for IRA and retirement accounts if the redemption is taken in or after the year the shareholder reaches qualified age based on applicable IRS regulation. |
● Shares sold to pay Edward Jones fees or costs in such cases where the transaction is initiated by Edward Jones. |
● Shares exchanged in an Edward Jones fee-based program. |
● Shares acquired through NAV reinstatement. |
38 | Wells Fargo Endeavor Select Fund
Table of Contents
Appendix I (unaudited)
| Other Important Information for accounts at Edward Jones: |
| Minimum Purchase Amounts |
● $250 initial purchase minimum |
● $50 subsequent purchase minimum |
| Minimum Balances |
| Edward Jones has the right to redeem at its discretion fund holdings with a balance of $250 or less. The following are examples of accounts that are not included in this policy: |
● A fee-based account held on an Edward Jones platform |
● A 529 account held on an Edward Jones platform |
● An account with an active systematic investment plan or letter of intent (LOI) |
| Changing Share Classes |
| At any time it deems necessary, Edward Jones has the authority to exchange at NAV a shareholder’s holdings in a fund to Class A shares. |
Wells Fargo Endeavor Select Fund | 39
Table of Contents
Effective June 1, 2020, shareholders purchasing Fund shares through an Oppenheimer & Co. Inc. (“Oppenheimer”) platform or account are eligible only for the following load waivers (front-end sales charge waivers and contingent deferred or back-end, sales charge waivers) and discounts, which may differ from those disclosed in the Fund’s Prospectus or SAI.
| Front-end Sales Load Waivers on Class A Shares available at Oppenheimer |
| Employer-sponsored retirement, deferred compensation and employee benefit plans (including health savings accounts) and trusts used to fund those plans, provided that the shares are not held in a commission-based brokerage account and shares are held for the benefit of the plan. |
| Shares purchased by or through a 529 Plan. |
| Shares purchased through an Oppenheimer affiliated investment advisory program. |
| Shares purchased through reinvestment of capital gains distributions and dividend reinvestment when purchasing shares of the same fund (but not any other fund within the fund family). |
| Shares purchased from the proceeds of redemptions within the same fund family, provided (1) the repurchase occurs within 90 days following the redemption, (2) the redemption and purchase occur in the same account, and (3) redeemed shares were subject to a front-end or deferred sales load (known as Rights of Restatement). |
| A shareholder in the Fund’s Class C shares will have their shares exchanged at net asset value to Class A shares (or the appropriate share class) of the Fund if the shares are no longer subject to a CDSC and the exchange is in line with the policies and procedures of Oppenheimer. |
| Employees and registered representatives of Oppenheimer or its affiliates and their family members. |
| Directors or Trustees of the Fund, and employees of the Fund’s investment adviser or any of its affiliates, as described in the Prospectus. |
| CDSC Waivers on A and C Shares available at Oppenheimer |
| Death or disability of the shareholder. |
| Shares sold as part of a systematic withdrawal plan as described in the Prospectus. |
| Return of excess contributions from an IRA Account. |
| Shares sold as part of a required minimum distribution for IRA and retirement accounts due to the shareholder reaching the qualified age based on applicable IRS regulations as described in the Prospectus. |
| Shares sold to pay Oppenheimer fees but only if the transaction is initiated by Oppenheimer. |
| Shares acquired through a right of reinstatement. |
| Front-end load Discounts Available at Oppenheimer: Breakpoints, Rights of Accumulation & Letters of Intent |
| Breakpoints as described in the Prospectus. |
| Rights of Accumulation (ROA), which entitle shareholders to breakpoint discounts, will be automatically calculated based on the aggregated holding of fund family assets held by accounts within the purchaser’s household at Oppenheimer. Eligible fund family assets not held at Oppenheimer may be included in the ROA calculation only if the shareholder notifies his or her financial advisor about such assets. |
40 | Wells Fargo Endeavor Select Fund
Table of Contents
Effective June 15, 2020, shareholders purchasing fund shares through a Robert W. Baird & Co. (“Baird”) platform or account will only be eligible for the following sales charge waivers (front-end sales charge waivers and CDSC waivers) and discounts, which may differ from those disclosed elsewhere in the Fund’s Prospectus or the SAI.
| Front-end Sales Load Waivers on Class A Shares available at Baird |
| Shares purchased through reinvestment of capital gains distributions and dividend reinvestment when purchasing share of the same fund. |
| Share purchase by employees and registers representatives of Baird or its affiliate and their family members as designated by Baird. |
| Shares purchase from the proceeds of redemptions within the same fund family, provided (1) the repurchase occurs within 90 days following the redemption, (2) the redemption and purchase occur in the same accounts, and (3) redeemed shares were subject to a front-end or deferred sales charge (known as rights of reinstatement). |
| A shareholder in the Funds Investor C Shares will have their share exchanged at net asset value to Investor A shares of the fund if the shares are no longer subject to CDSC and the exchange is in line with the policies and procedures of Baird. |
| Employer-sponsored retirement plans or charitable accounts in a transactional brokerage account at Baird, including 401(k) plans, 457 plans, employer-sponsored 403(b) plans, profit sharing and money purchase pension plans and defined benefit plans. For purposes of this provision, employer-sponsored retirement plans do not include SEP IRAs, Simple IRAs or SAR-SEPs. |
| CDSC Waivers on A and C Shares available at Baird |
| Shares sold due to death or disability of the shareholder. |
| Shares sold as part of a systematic withdrawal plan as described in the Fund’s Prospectus. |
| Shares bought due to returns of excess contributions from an IRA Account. |
| Shares sold as part of a required minimum distribution for IRA and retirement accounts due to the shareholder reaching age 72 as described in the Fund’s Prospectus. |
| Shares sold to pay Baird fees but only if the transaction is initiated by Baird. |
| Shares acquired through a right of reinstatement. |
| Front-end load Discounts Available at Baird: Breakpoint and/or Rights of Accumulation |
| Breakpoints as described in the Prospectus. |
| Rights of accumulations which entitles shareholders to breakpoint discounts will be automatically calculated based on the aggregated holding of fund family assets held by accounts within the purchaser’s household at Baird. Eligible fund family assets not held at Baird may be included in the rights of accumulations calculation only if the shareholder notifies his or her financial advisor about such assets. |
| Letters of Intent (LOI) allow for breakpoint discounts based on anticipated purchases within a fund family through Baird, over a 13-month period of time. |
Wells Fargo Endeavor Select Fund | 41
Table of Contents
This page is intentionally left blank.
Table of Contents
This page is intentionally left blank.
Table of Contents
This page is intentionally left blank.
Table of Contents
For more information
More information about Wells Fargo Funds is available free upon request. To obtain literature, please write, visit the Fund’s website, or call:
Wells Fargo Funds
P.O. Box 219967
Kansas City, MO 64121-9967
Website: wfam.com
Individual investors: 1-800-222-8222
Retail investment professionals: 1-888-877-9275
Institutional investment professionals: 1-866-765-0778

This report and the financial statements contained herein are submitted for the general information of the shareholders of the Fund. If this report is used for promotional purposes, distribution of the report must be accompanied or preceded by a current prospectus. Before investing, please consider the investment objectives, risks, charges, and expenses of the investment. For a current prospectus and, if available, a summary prospectus, containing this information, call 1-800-222-8222 or visit the Fund’s website at wfam.com. Read the prospectus carefully before you invest or send money.
Wells Fargo Asset Management (WFAM) is the trade name for certain investment advisory/management firms owned by Wells Fargo & Company. These firms include but are not limited to Wells Capital Management Incorporated and Wells Fargo Funds Management, LLC. Certain products managed by WFAM entities are distributed by Wells Fargo Funds Distributor, LLC (a broker-dealer and Member FINRA).
This material is for general informational and educational purposes only and is NOT intended to provide investment advice or a recommendation of any kind—including a recommendation for any specific investment, strategy, or plan.
INVESTMENT PRODUCTS: NOT FDIC INSURED ◾ NO BANK GUARANTEE ◾ MAY LOSE VALUE
© 2020 Wells Fargo & Company. All rights reserved
PAR-0820-01035 09-20
A205/AR205 07-20
Table of Contents

Annual Report
July 31, 2020
Wells Fargo Growth Fund
Beginning on January 1, 2021, as permitted by new regulations adopted by the Securities and Exchange Commission, paper copies of the Wells Fargo Funds’ annual and semi-annual shareholder reports issued after this date will no longer be sent by mail, unless you specifically request paper copies of the reports. Instead, the reports will be made available on the Funds’ website, and you will be notified by mail each time a report is posted and provided with a website address to access the report.
If you already elected to receive shareholder reports electronically, you will not be affected by this change and you need not take any action. You may elect to receive shareholder reports and other communications from the Fund electronically at any time by contacting your financial intermediary (such as a broker-dealer or bank) or, if you are a direct investor, by calling 1-800-222-8222 or by enrolling at wellsfargo.com/advantagedelivery.
You may elect to receive all future reports in paper free of charge. If you invest through a financial intermediary, you can contact your financial intermediary to request that you continue to receive paper copies of your shareholder reports; if you invest directly with the Fund, you can call 1-800-222-8222. Your election to receive reports in paper will apply to all Wells Fargo Funds held in your account with your financial intermediary or, if you are a direct investor, to all Wells Fargo Funds that you hold.
Table of Contents
|
Reduce clutter. Save trees. |
Sign up for electronic delivery of prospectuses and shareholder reports at wellsfargo.com/advantagedelivery |
The views expressed and any forward-looking statements are as of July 31, 2020, unless otherwise noted, and are those of the Fund managers and/or Wells Fargo Asset Management. Discussions of individual securities, or the markets generally, or any Wells Fargo Fund are not intended as individual recommendations. Future events or results may vary significantly from those expressed in any forward-looking statements. The views expressed are subject to change at any time in response to changing circumstances in the market. Wells Fargo Asset Management and the Fund disclaim any obligation to publicly update or revise any views expressed or forward-looking statements.
INVESTMENT PRODUCTS: NOT FDIC INSURED ◾ NO BANK GUARANTEE ◾ MAY LOSE VALUE
Wells Fargo Growth Fund | 1
Table of Contents
Letter to shareholders (unaudited)

Andrew Owen
President
Wells Fargo Funds
Dear Shareholder:
We are pleased to offer you this annual report for the Wells Fargo Growth Fund for the 12-month period that ended July 31, 2020. Global stock markets saw earlier gains erased in February and March as governments around the world took unprecedented measures, attempting to stop the spread of the coronavirus at the expense of short-term economic output. However, markets rebounded from April on to offset much of the losses as central banks attempted to bolster capital markets and confidence. Fixed-income markets generally performed well overall, achieving widespread gains. Overall, U.S. stocks surpassed their international peers, while U.S. large-cap equity, as measured by the Russell 1000® Index1, easily outperformed small caps, as measured by the Russell 2000® Index2, for the 12-month period that began last August.
For the 12-month period, fixed-income securities generally had positive total returns while non-U.S. developed market equities had the weakest performance and U.S. stocks performed strongly despite sharp volatility in the late winter and early spring. For the period, U.S. stocks, based on the S&P 500 Index,3 gained 11.96%. International stocks, as measured by the MSCI ACWI ex USA Index (Net),4 returned 0.66%, while the MSCI EM Index (Net)5 had somewhat stronger performance, with a 6.55% gain. For bond investors, the Bloomberg Barclays U.S. Aggregate Bond Index6 returned a robust 10.12%, the Bloomberg Barclays Global Aggregate ex-USD Index7 gained a more modest 5.94%, and the Bloomberg Barclays Municipal Bond Index8 gained 5.36% while the ICE BofA U.S. High Yield Index9 returned 3.10%.
The fiscal year began with supportive central bank actions.
The period began with unresolved U.S.-China trade tensions showing no signs of compromise in August 2019. Evidence of a continued global economic slowdown mounted, and central banks in China, New Zealand, and Thailand cut interest rates after the U.S. Federal Reserve (Fed) had done so in late July. Industrial and manufacturing data declined in China, Canada, Japan, and Germany. Adding to global uncertainty, Italy’s prime minister resigned, many feared a crackdown in Hong Kong as protestors sustained their calls for reform, and U.K. Prime Minister Boris Johnson planned to suspend Parliament as Brexit’s deadline neared.
| 1 | The Russell 1000® Index measures the performance of the 1,000 largest companies in the Russell 3000® Index, which represents approximately 92% of the total market capitalization of the Russell 3000® Index. You cannot invest directly in an index. |
| 2 | The Russell 2000® Index measures the performance of the 2,000 smallest companies in the Russell 3000® Index, which represents approximately 8% of the total market capitalization of the Russell 3000® Index. You cannot invest directly in an index. |
| 3 | The S&P 500 Index consists of 500 stocks chosen for market size, liquidity, and industry group representation. It is a market-value-weighted index with each stock’s weight in the index proportionate to its market value. You cannot invest directly in an index. |
| 4 | The Morgan Stanley Capital International (MSCI) All Country World Index (ACWI) ex USA Index (Net) is a free-float-adjusted market-capitalization-weighted index that is designed to measure the equity market performance of developed and emerging markets, excluding the United States. Source: MSCI. MSCI makes no express or implied warranties or representations and shall have no liability whatsoever with respect to any MSCI data contained herein. The MSCI data may not be further redistributed or used as a basis for other indices or any securities or financial products. This report is not approved, reviewed, or produced by MSCI. You cannot invest directly in an index. |
| 5 | The MSCI Emerging Markets (EM) Index (Net) is a free-float-adjusted market-capitalization-weighted index that is designed to measure equity market performance of emerging markets. You cannot invest directly in an index. |
| 6 | The Bloomberg Barclays U.S. Aggregate Bond Index is a broad-based benchmark that measures the investment-grade, U.S. dollar-denominated, fixed-rate taxable bond market, including Treasuries, government-related and corporate securities, mortgage-backed securities (agency fixed-rate and hybrid adjustable-rate mortgage pass-throughs), asset-backed securities, and commercial mortgage-backed securities. You cannot invest directly in an index. |
| 7 | The Bloomberg Barclays Global Aggregate ex-USD Index is an unmanaged index that provides a broad-based measure of the global investment-grade fixed-income markets excluding the U.S.-dollar-denominated debt market. You cannot invest directly in an index. |
| 8 | The Bloomberg Barclays Municipal Bond Index is an unmanaged index composed of long-term tax-exempt bonds with a minimum credit rating of Baa. You cannot invest directly in an index. |
| 9 | The ICE BofA U.S. High Yield Index is a market-capitalization-weighted index of domestic and Yankee high-yield bonds. The index tracks the performance of high-yield securities traded in the U.S. bond market. You cannot invest directly in an index. Copyright 2020. ICE Data Indices, LLC. All rights reserved. |
2 | Wells Fargo Growth Fund
Table of Contents
Letter to shareholders (unaudited)
In the U.S., the Fed cut interest rates again in September. U.S. manufacturing data disappointed investors. The U.S. Congress announced it would pursue an impeachment investigation of President Trump. Meanwhile, the Brexit impasse showed no signs of resolution. Officials in China said that hitting the country’s economic growth goals for the year would be difficult considering the weight of tariffs and trade restrictions. Although the S&P 500 Index finished the third quarter with the best year-to-date returns in more than 20 years, concerns about future returns remained.
The fourth quarter started on a strong note, with U.S.-China trade tensions relaxing in October along with renewed optimism for a U.K. Brexit deal and positive macroeconomic data. The initial estimate of U.S. third-quarter gross domestic product (GDP) growth was a resilient 1.9% annualized rate, while the U.S. unemployment rate fell to a 50-year low of 3.5% in September. However, despite strength among U.S. consumers, business confidence declined while manufacturing activity contracted. Concerned with a potential economic slowdown, the Fed lowered interest rates another quarter point in late October—its third rate cut in four months. This helped push the S&P 500 Index to an all-time high while emerging market equities rallied and global bonds declined overall, reflecting a broad pickup in risk appetite.
Equity markets continued to rally in November despite ongoing geopolitical risks. Hopes for a U.S.-China trade deal buoyed investor confidence. U.S. business sentiment improved slightly, and manufacturing and services activity picked up. While consumer confidence and purchasing managers’ activity rose in the eurozone, China reported weakening manufacturing and consumer data. Bond yields rose marginally, leading to slightly negative returns for global government and investment-grade corporate bonds.
Financial markets ended 2019 with a boost from the U.S. and China accord on a Phase One trade deal. That, along with the landslide win by the pro-Brexit U.K. Conservative Party in a national election and ongoing central bank support, gave investors greater confidence. U.S. economic indicators were generally positive, with the exception of manufacturing activity and business confidence. Consumer confidence was resilient, fed by a robust labor market, tame inflation, and lower interest rates, which boosted housing affordability and stimulated home buyer activity. The impeachment of President Trump had little impact on markets. Meanwhile, slowing Chinese economic activity, partly attributable to the trade war, led to further government stimulus at year-end through lower reserve ratios, allowing banks to lend more money.
The year-end rally continued in early January 2020. However, capital market volatility picked up sharply in late January on concerns over the potential impact of the coronavirus on the global economy and stock markets. With sentiment somewhat souring, perceived safe havens did well in January. The U.S. dollar and Japanese yen both rose, and government bonds outperformed equities. While the S&P 500 Index held its ground, emerging market equities tumbled, including those in Asia.
In February, the coronavirus became the major market focus. Fears of the virus’s impact on global growth led to expectations of increased global central bank monetary policy support. That led the 10-year U.S. Treasury yield to fall to an all-time low of 1.1%. Although equity markets initially shrugged off concerns about the outbreak, focusing instead on strong fourth-quarter earnings and improving business confidence in January, market sentiment turned sharply lower and the S&P 500 Index lost 8.2% for the month. Oil prices tumbled as Russia and the Organization of the Petroleum Exporting Countries compounded a major decline in oil demand with a brutal price war, partly aimed at dissuading further U.S. shale production, causing the price of West Texas Intermediate crude oil to plummet.
Wells Fargo Growth Fund | 3
Table of Contents
Letter to shareholders (unaudited)
“The global spread of the coronavirus led country after country to clamp down on social and business-related activity in order to contain the virus from causing even greater devastation and overwhelming health care systems.”
“Financial markets posted widely positive returns in June despite ongoing economic weakness and high levels of uncertainty on the containment of the coronavirus and the timing of an
effective vaccine.”
The global spread of the coronavirus led country after country to clamp down on social and business-related activity in order to contain the virus from causing even greater devastation and overwhelming health care systems. This abrupt stoppage of economic activity led to the sharp deceleration of global output, sending economies into a deep contraction. Central banks responded swiftly, slashing interest rates and expanding quantitative easing programs to restore liquidity and confidence to the markets. In the U.S., the Fed introduced several new lending programs, funding investment-grade bonds, money market mutual funds, and commercial paper while purchasing Treasuries, mortgage-backed securities, and overnight repurchase agreements. Meanwhile, stock markets tumbled quickly into a bear market, ending the longest bull stock market in U.S. history.
Markets rebounded strongly in April, fueled by unprecedented government and central bank stimulus measures. The U.S. economy contracted by an annualized 5.0% pace in the first quarter, with 30 million new unemployment insurance claims in six weeks. In the eurozone, first-quarter real GDP shrank 3.8%, with the composite April Flash Purchasing Managers’ Index, a monthly survey of purchasing managers, falling to an all-time low of 13.5. The European Central Bank expanded its quantitative easing to include the purchase of additional government bonds of countries with the greatest virus-related need, including Italy and Spain. China’s first-quarter GDP fell by 6.8% year over year. However, retail sales, production, and investment showed signs of recovery. Extreme oil-price volatility continued as global supply far exceeded demand.
In May, the global equity market rebound continued, with widespread strong monthly gains. Investors regained confidence on reports of early signs of success in human trials of a coronavirus vaccine. Growth stocks continued to outperform value stocks while returns on global government bonds were generally flat. In the U.S., a gap grew between the stock market rebound and devastating economic data points, including an April unemployment rate of 14.7%, the highest level since World War II. Purchasing managers’ indices reflected weakening activity in May in both the manufacturing and services sectors. U.S. corporate earnings reports indicated a 14% year-over-year contraction in earnings from the first quarter of 2019. However, high demand for technology, driven by remote activity, supported robust information technology sector earnings, which helped drive major technology stocks higher.
Financial markets posted widely positive returns in June despite ongoing economic weakness and high levels of uncertainty on the containment of the coronavirus and the timing of an effective vaccine. There were hopeful signs as economies reopened, with both U.S. and U.K. retail sales rebounding substantially in May. However, year over year, sales remained depressed. Vitally important to market sentiment was the ongoing commitment by central banks globally to do all they could to provide economic support through liquidity and low borrowing costs. U.S. economic activity was aided by one-time $1,200 stimulus checks and $600 bonus weekly unemployment benefits due to expire at the end of July. However, unemployment remained in the double digits, easing somewhat from 14.7% in April to 11.1% in June. During June, numerous states reported alarming increases of coronavirus cases. China’s economic recovery picked up momentum in June, though it remained far from a full recovery.
July was a broadly positive month for both global equities and fixed income. However, economic data and a resurgence of coronavirus cases pointed to the vulnerability of the global economy and the ongoing imperative to regain control of the pandemic. Second-quarter GDP shrank by 9.5% and 12.1% in the U.S. and eurozone, respectively, from the previous quarter. In contrast, China reported a 3.2% year-over-year expansion in its second-quarter GDP. U.S. unemployment remained historically high despite adding 1.8 million jobs in July, with a double-digit jobless rate persisting. However, manufacturing activity grew in both the U.S. and eurozone. In Asia, while China’s manufacturing sector continued to expand, activity in Japan and South Korea contracted. In July, a rising concern
4 | Wells Fargo Growth Fund
Table of Contents
Letter to shareholders (unaudited)
was the rapid and broad reemergence of coronavirus infections. Despite the ongoing promise of positive early-stage vaccine trial results, economic activity could be held back by the continued spread of the virus and the end of a widely received $600-a-week bonus unemployment benefit in late July.
Don’t let short-term uncertainty derail long-term investment goals.
Periods of investment uncertainty can present challenges, but experience has taught us that maintaining long-term investment goals can be an effective way to plan for the future. To help you create a sound strategy based on your personal goals and risk tolerance, Wells Fargo Funds offers more than 100 mutual funds spanning a wide range of asset classes and investment styles. Although diversification cannot guarantee an investment profit or prevent losses, we believe it can be an effective way to manage investment risk and potentially smooth out overall portfolio performance. We encourage investors to know their investments and to understand that appropriate levels of risk-taking may unlock opportunities.
Thank you for choosing to invest with Wells Fargo Funds. We appreciate your confidence in us and remain committed to helping you meet your financial needs.
Sincerely,

Andrew Owen
President
Wells Fargo Funds
|
For further information about your Fund, contact your investment professional, visit our website at wfam.com, or call us directly at 1-800-222-8222. |
Notice to Shareholders
At a meeting held on August 10-12, 2020, the Board of Trustees of the Fund approved a change to the Fund’s automatic conversion feature for Class C shares in order to shorten the required holding period from 10 to 8 years. As a result, on a monthly basis beginning November 5, 2020, Class C shares will convert automatically into Class A shares 8 years after the initial date of purchase or, if you acquired your Class C shares through an exchange or conversion from another share class, 8 years after the date you acquired your Class C shares. When Class C shares that you acquired through a purchase or exchange convert, any other Class C shares that you purchased with reinvested dividends and distributions also will convert into Class A shares on a pro rata basis.
Please note that a shorter holding period may apply depending on your intermediary. Please see “Appendix A—Sales Charge Reductions and Waivers for Certain Intermediaries” in the Fund’s prospectus for further information.
Wells Fargo Growth Fund | 5
Table of Contents
Performance highlights (unaudited)
Investment objective
The Fund seeks long-term capital appreciation.
Manager
Wells Fargo Funds Management, LLC
Subadviser
Wells Capital Management Incorporated
Portfolio managers
Joseph M. Eberhardy, CFA®‡, CPA
Robert Gruendyke, CFA®‡†
Thomas C. Ognar, CFA®‡
Average annual total returns (%) as of July 31, 2020
| Including sales charge | Excluding sales charge | Expense ratios1 (%) | ||||||||||||||||||||||||||||||||
| Inception date | 1 year | 5 year | 10 year | 1 year | 5 year | 10 year | Gross | Net2 | ||||||||||||||||||||||||||
| Class A (SGRAX) | 2-24-2000 | 19.77 | 14.63 | 16.43 | 27.08 | 16.00 | 17.12 | 1.18 | 1.16 | |||||||||||||||||||||||||
| Class C (WGFCX) | 12-26-2002 | 25.11 | 15.12 | 16.24 | 26.11 | 15.12 | 16.24 | 1.93 | 1.91 | |||||||||||||||||||||||||
| Class R6 (SGRHX)3 | 9-30-2015 | – | – | – | 27.65 | 16.52 | 17.64 | 0.75 | 0.70 | |||||||||||||||||||||||||
| Administrator Class (SGRKX) | 8-30-2002 | – | – | – | 27.31 | 16.22 | 17.37 | 1.10 | 0.96 | |||||||||||||||||||||||||
| Institutional Class (SGRNX) | 2-24-2000 | – | – | – | 27.58 | 16.46 | 17.61 | 0.85 | 0.75 | |||||||||||||||||||||||||
| Russell 3000® Growth Index4 | – | – | – | – | 28.24 | 16.18 | 16.96 | – | – | |||||||||||||||||||||||||
Figures quoted represent past performance, which is no guarantee of future results, and do not reflect taxes that a shareholder may pay on an investment in a fund. Investment return and principal value of an investment will fluctuate so that an investor’s shares, when redeemed, may be worth more or less than their original cost. Performance shown without sales charges would be lower if sales charges were reflected. Current performance may be lower or higher than the performance data quoted, which assumes the reinvestment of dividends and capital gains. Current month-end performance is available on the Fund’s website, wfam.com.
Please keep in mind that high double-digit returns were primarily achieved during favorable market conditions. You should not expect that such favorable returns can be consistently achieved. A fund’s performance, especially for short time periods, should not be the sole factor in making your investment decision.
Index returns do not include transaction costs associated with buying and selling securities, any mutual fund fees or expenses, or any taxes. It is not possible to invest directly in an index.
For Class A shares, the maximum front-end sales charge is 5.75%. For Class C shares, the maximum contingent deferred sales charge is 1.00%. Performance including a contingent deferred sales charge assumes the sales charge for the corresponding time period. Class R6, Administrator Class, and Institutional Class shares are sold without a front-end sales charge or contingent deferred sales charge.
Stock values fluctuate in response to the activities of individual companies and general market and economic conditions. Certain investment strategies tend to increase the total risk of an investment (relative to the broader market). The Fund is exposed to foreign investment risk and smaller-company securities risk. Consult the Fund’s prospectus for additional information on these and other risks.
Please see footnotes on page 7.
6 | Wells Fargo Growth Fund
Table of Contents
Performance highlights (unaudited)
| Growth of $10,000 investment as of July 31, 20205 |
|
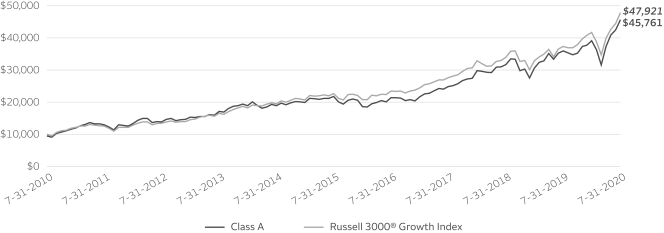
| ‡ | CFA® and Chartered Financial Analyst® are trademarks owned by CFA Institute. |
| † | Mr. Gruendyke became a portfolio manager of the Fund on July 28, 2020. |
| 1 | Reflects the expense ratios as stated in the most recent prospectuses. The expense ratios shown are subject to change and may differ from the annualized expense ratios shown in the financial highlights of this report. |
| 2 | The manager has contractually committed through November 30, 2020, to waive fees and/or reimburse expenses to the extent necessary to cap total annual fund operating expenses after fee waivers at 1.16% for Class A, 1.91% for Class C, 0.70% for Class R6, 0.96% for Administrator Class, and 0.75% for Institutional Class. Brokerage commissions, stamp duty fees, interest, taxes, acquired fund fees and expenses (if any), and extraordinary expenses are excluded from the expense caps. Prior to or after the commitment expiration date, the caps may be increased or the commitment to maintain the caps may be terminated only with the approval of the Board of Trustees. Without these caps, the Fund’s returns would have been lower. The expense ratio paid by an investor is the net expense ratio (the total annual fund operating expenses after fee waivers) as stated in the prospectuses. |
| 3 | Historical performance for the Class R6 shares prior to their inception reflects the performance of the Institutional Class shares, and includes the higher expenses applicable to the Institutional Class shares. If these expenses had not been included, returns for the Class R6 shares would be higher. |
| 4 | The Russell 3000® Growth Index measures the performance of those Russell 3000® Index companies with higher price/book ratios and higher forecasted growth values. You cannot invest directly in an index. |
| 5 | The chart compares the performance of Class A shares for the most recent ten years with the Russell 3000® Growth Index. The chart assumes a hypothetical investment of $10,000 in Class A shares and reflects all operating expenses and assumes the maximum initial sales charge of 5.75%. |
| 6 | The S&P 500 Index consists of 500 stocks chosen for market size, liquidity, and industry group representation. It is a market-value-weighted index with each stock’s weight in the index proportionate to its market value. You cannot invest directly in an index. |
| 7 | The ten largest holdings, excluding cash, cash equivalents and any money market funds, are calculated based on the value of the investments divided by total net assets of the Fund. Holdings are subject to change and may have changed since the date specified. |
| 8 | Amounts are calculated based on the total long-term investments of the Fund. These amounts are subject to change and may have changed since the date specified. |
| * | The security was no longer held at the end of the reporting period. |
Wells Fargo Growth Fund | 7
Table of Contents
Performance highlights (unaudited)
MANAGER’S DISCUSSION
| ∎ | The Fund underperformed its benchmark, the Russell 3000® Growth Index, for the 12-month period that ended July 31, 2020. |
| ∎ | The Fund’s performance was inhibited by select stocks within the consumer discretionary sector. |
| ∎ | Holdings within information technology (IT), financials, and consumer discretionary aided the Fund’s performance for the period. |
For much of the 12-month period, stocks were largely impervious to tariffs on Chinese goods and other geopolitical events. However, in the first quarter of 2020, the spread of the coronavirus pandemic crippled the global economy, sending U.S. equities into a laconic bear market. The unprecedented spread of the coronavirus prompted global central banks to quickly inject massive liquidity into the markets. On the fiscal side, the U.S. government passed the Coronavirus Aid, Relief, and Economic Security Act and other stimulative measures to support the economy. Shortly after setting a record for the quickest descent into bear market territory in the first quarter of 2020, the S&P 500 Index6 set another record, posting its best 50-day rally ever the following quarter. Although we believe new leadership may arise in the coming periods, we are positioning the Fund so it has the potential to capitalize on an array of outcomes. We believe our diversified and balanced approach to portfolio construction and strict emphasis on sell discipline should help mitigate risk with the goal of providing a less volatile experience for our clients.
| Ten largest holdings (%) as of July 31, 20207 | ||||
Amazon.com Incorporated | 9.78 | |||
Microsoft Corporation | 6.14 | |||
Alphabet Incorporated Class A | 4.92 | |||
Apple Incorporated | 3.62 | |||
MasterCard Incorporated Class A | 3.28 | |||
Facebook Incorporated Class A | 3.02 | |||
Envestnet Incorporated | 2.80 | |||
Visa Incorporated Class A | 2.72 | |||
MarketAxess Holdings Incorporated | 2.59 | |||
PayPal Holdings Incorporated | 2.59 | |||
Certain consumer discretionary stocks detracted from performance.
Within consumer discretionary, retailers Ulta Beauty Inc., Ollie’s Bargain Outlet Holdings Inc.*, and Levi Strauss & Co.* retraced sharply as traffic fell precipitously amid widespread store closings. Apparel holding Levi Strauss & Co. trailed the market after being hurt by reduced traffic, citing a decline in earnings before interest, taxes, depreciation, and amortization largely due to elevated selling, general, and administrative costs. However, we believe areas such as off-price retail are well positioned as the group has historically held up well relative to peers during recessions and rebounded strongly during the recovery periods. We also
expect that many of the specialty retailers and restaurants we own will rebound quickly as the virus subsides with increased pent-up demand for their offerings. Other detractors included IT stock Euronet Worldwide, Inc.*, which retraced after delivering weaker-than-expected revenue growth, citing a deceleration in profitability from its electronic funds transfer segment.
| Sector allocation as of July 31, 20208 |
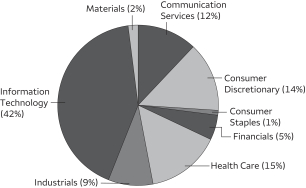 |
Performance of financials and IT holdings was beneficial to Fund performance.
Strength within the IT sector came from semiconductor Monolithic Power Systems Inc., which benefited from its BCD5 process technology, which allows it to manufacture chips with higher power density and a smaller footprint than comparable solutions. Other contributors included electronic bond platform MarketAxess Holdings, Inc., due to increased volumes exemplified during the coronavirus pandemic as many of its clients have turned to its platform for liquidity during the crisis. Electronic bond trading platforms provide good ballast to the portfolio due to their countercyclical elements. Also, Amazon.com, Inc., rallied 70%
after posting strong unit growth and Amazon Web Services metrics. The stock has been one of our best performers as demand for its e-commerce capabilities has increased considerably as most retailers had to close their doors during the coronavirus pandemic. The company continues to execute from its four main pillars of cloud computing, e-commerce (which includes groceries), digital advertising, and shipping and logistics.
Please see footnotes on page 7.
8 | Wells Fargo Growth Fund
Table of Contents
Performance highlights (unaudited)
Areas of focus remain in secular areas personified in our SCODIi acronym.
The coronavirus crisis has pulled forward many secular trends as several companies have cited years of transformation compressed into months. This trend can be encapsulated in our SCODIi acronym, which stands for software as a service (SaaS), cloud services, online retail, digital payments, the internet of things, and innovation. Within SaaS, companies that offer
communications capabilities are helping workers function remotely. In cloud computing, a surge in e-commerce spend and telemedicine has fostered a precipitous increase in cloud demand. Online shopping is fundamentally changing consumer behaviors and is having a profound effect on digital transactions, an area that is becoming a necessity rather than a luxury. The internet of things has played an essential role as the need for home office electronics are supported by more powerful underlying chip hardware. Lastly, within innovation, critical procedures have resumed eliciting a spur in demand for medical devices.
The equity market has shown marked resiliency this year. The economy appears to be improving, but there are many risks abound. We believe the recovery will be uneven as some businesses will be permanently impaired while others will likely see a pull forward in demand. It is an exciting time to be a stock picker in an area where change is occurring at a rapid pace and there is greater disparity among companies. Still, we believe this is the time to be extra vigilant on risk given the wider range of outcomes. We believe our approach is built for such markets and our long track record provides a useful guide in helping navigate potentially more volatile periods ahead.
Wells Fargo Growth Fund | 9
Table of Contents
As a shareholder of the Fund, you incur two types of costs: (1) transaction costs, including sales charges (loads) on purchase payments and contingent deferred sales charges (if any) on redemptions and (2) ongoing costs, including management fees, distribution (12b-1) and/or shareholder servicing fees, and other Fund expenses. This example is intended to help you understand your ongoing costs (in dollars) of investing in the Fund and to compare these costs with the ongoing costs of investing in other mutual funds.
The example is based on an investment of $1,000 invested at the beginning of the six-month period and held for the entire period from February 1, 2020 to July 31, 2020.
Actual expenses
The “Actual” line of the table below provides information about actual account values and actual expenses. You may use the information in this line, together with the amount you invested, to estimate the expenses that you paid over the period. Simply divide your account value by $1,000 (for example, an $8,600 account value divided by $1,000 = 8.6), then multiply the result by the number in the “Actual” line under the heading entitled “Expenses paid during period” for your applicable class of shares to estimate the expenses you paid on your account during this period.
Hypothetical example for comparison purposes
The “Hypothetical” line of the table below provides information about hypothetical account values and hypothetical expenses based on the Fund’s actual expense ratio and an assumed rate of return of 5% per year before expenses, which is not the Fund’s actual return. The hypothetical account values and expenses may not be used to estimate the actual ending account balance or expenses you paid for the period. You may use this information to compare the ongoing costs of investing in the Fund and other funds. To do so, compare this 5% hypothetical example with the 5% hypothetical examples that appear in the shareholder reports of the other funds.
Please note that the expenses shown in the table are meant to highlight your ongoing costs only and do not reflect any transactional costs, such as sales charges (loads) and contingent deferred sales charges. Therefore, the “Hypothetical” line of the table is useful in comparing ongoing costs only and will not help you determine the relative total costs of owning different funds. In addition, if these transactional costs were included, your costs would have been higher.
| Beginning account value 2-1-2020 | Ending account value 7-31-2020 | Expenses paid during the period1 | Annualized net expense ratio | |||||||||||||
Class A | ||||||||||||||||
Actual | $ | 1,000.00 | $ | 1,166.52 | $ | 6.25 | 1.16 | % | ||||||||
Hypothetical (5% return before expenses) | $ | 1,000.00 | $ | 1,019.10 | $ | 5.82 | 1.16 | % | ||||||||
Class C | ||||||||||||||||
Actual | $ | 1,000.00 | $ | 1,162.55 | $ | 10.27 | 1.91 | % | ||||||||
Hypothetical (5% return before expenses) | $ | 1,000.00 | $ | 1,015.37 | $ | 9.57 | 1.91 | % | ||||||||
Class R6 | ||||||||||||||||
Actual | $ | 1,000.00 | $ | 1,169.09 | $ | 3.78 | 0.70 | % | ||||||||
Hypothetical (5% return before expenses) | $ | 1,000.00 | $ | 1,021.38 | $ | 3.52 | 0.70 | % | ||||||||
Administrator Class | ||||||||||||||||
Actual | $ | 1,000.00 | $ | 1,167.81 | $ | 5.17 | 0.96 | % | ||||||||
Hypothetical (5% return before expenses) | $ | 1,000.00 | $ | 1,020.09 | $ | 4.82 | 0.96 | % | ||||||||
Institutional Class | ||||||||||||||||
Actual | $ | 1,000.00 | $ | 1,169.09 | $ | 4.04 | 0.75 | % | ||||||||
Hypothetical (5% return before expenses) | $ | 1,000.00 | $ | 1,021.13 | $ | 3.77 | 0.75 | % | ||||||||
| 1 | Expenses paid is equal to the annualized net expense ratio of each class multiplied by the average account value over the period, multiplied by the number of days in the most recent fiscal half-year divided by the number of days in the fiscal year (to reflect the one-half-year period). |
10 | Wells Fargo Growth Fund
Table of Contents
Portfolio of investments—July 31, 2020
| Shares | Value | |||||||||||||||
| Common Stocks: 99.90% | ||||||||||||||||
Communication Services: 11.91% | ||||||||||||||||
| Entertainment: 0.83% | ||||||||||||||||
Roku Incorporated † | 249,200 | $ | 38,598,588 | |||||||||||||
Spotify Technology SA † | 13,500 | 3,480,570 | ||||||||||||||
| 42,079,158 | ||||||||||||||||
|
| |||||||||||||||
| Interactive Media & Services: 10.46% | ||||||||||||||||
Alphabet Incorporated Class A † | 169,035 | 251,515,628 | ||||||||||||||
Alphabet Incorporated Class C † | 18,990 | 28,161,410 | ||||||||||||||
Facebook Incorporated Class A † | 609,800 | 154,687,966 | ||||||||||||||
Pinterest Incorporated Class A † | 2,587,906 | 88,739,297 | ||||||||||||||
ZoomInfo Technologies Incorporated † | 296,732 | 12,127,437 | ||||||||||||||
| 535,231,738 | ||||||||||||||||
|
| |||||||||||||||
| Media: 0.62% | ||||||||||||||||
Cardlytics Incorporated † | 479,300 | 31,835,106 | ||||||||||||||
|
| |||||||||||||||
Consumer Discretionary: 14.44% | ||||||||||||||||
| Diversified Consumer Services: 0.91% | ||||||||||||||||
Bright Horizons Family Solutions Incorporated † | 117,030 | 12,550,297 | ||||||||||||||
Chegg Incorporated † | 188,672 | 15,276,772 | ||||||||||||||
Grand Canyon Education Incorporated † | 211,450 | 18,764,073 | ||||||||||||||
| 46,591,142 | ||||||||||||||||
|
| |||||||||||||||
| Hotels, Restaurants & Leisure: 0.70% | ||||||||||||||||
Chipotle Mexican Grill Incorporated † | 19,700 | 22,756,652 | ||||||||||||||
Planet Fitness Incorporated Class A † | 120,000 | 6,264,000 | ||||||||||||||
Starbucks Corporation | 89,800 | 6,872,394 | ||||||||||||||
| 35,893,046 | ||||||||||||||||
|
| |||||||||||||||
| Internet & Direct Marketing Retail: 9.92% | ||||||||||||||||
Amazon.com Incorporated † | 158,070 | 500,240,968 | ||||||||||||||
Etsy Incorporated † | 60,600 | 7,173,828 | ||||||||||||||
| 507,414,796 | ||||||||||||||||
|
| |||||||||||||||
| Specialty Retail: 2.91% | ||||||||||||||||
Burlington Stores Incorporated † | �� | 317,750 | 59,737,000 | |||||||||||||
CarMax Incorporated † | 476,800 | 46,235,296 | ||||||||||||||
Five Below Incorporated † | 310,159 | 33,779,417 | ||||||||||||||
The Home Depot Incorporated | 29,010 | 7,701,865 | ||||||||||||||
Ulta Beauty Incorporated † | 6,100 | 1,177,239 | ||||||||||||||
| 148,630,817 | ||||||||||||||||
|
| |||||||||||||||
Consumer Staples: 0.85% | ||||||||||||||||
| Beverages: 0.49% | ||||||||||||||||
The Coca-Cola Company | 533,800 | 25,216,712 | ||||||||||||||
|
| |||||||||||||||
| Personal Products: 0.36% | ||||||||||||||||
The Estee Lauder Companies Incorporated Class A | 91,760 | 18,126,270 | ||||||||||||||
|
| |||||||||||||||
The accompanying notes are an integral part of these financial statements.
Wells Fargo Growth Fund | 11
Table of Contents
Portfolio of investments—July 31, 2020
| Shares | Value | |||||||||||||||
Financials: 5.10% | ||||||||||||||||
| Capital Markets: 4.23% | ||||||||||||||||
Assetmark Financial Holdings † | 766,187 | $ | 21,338,308 | |||||||||||||
MarketAxess Holdings Incorporated | 256,821 | 132,699,411 | ||||||||||||||
Tradeweb Markets Incorporated Class A | 1,150,867 | 62,227,379 | ||||||||||||||
| 216,265,098 | ||||||||||||||||
|
| |||||||||||||||
| Consumer Finance: 0.70% | ||||||||||||||||
LendingTree Incorporated † | 104,160 | 36,069,566 | ||||||||||||||
|
| |||||||||||||||
| Insurance: 0.17% | ||||||||||||||||
Lemonade Incorporated † | 152,653 | 8,881,352 | ||||||||||||||
|
| |||||||||||||||
Health Care: 14.49% | ||||||||||||||||
| Biotechnology: 3.61% | ||||||||||||||||
Biohaven Pharmaceutical Holding Company † | 554,000 | 35,478,160 | ||||||||||||||
BioMarin Pharmaceutical Incorporated † | 121,600 | 14,568,896 | ||||||||||||||
Emergent BioSolutions Incorporated † | 41,600 | 4,627,584 | ||||||||||||||
Exact Sciences Corporation † | 485,800 | 46,029,550 | ||||||||||||||
Natera Incorporated † | 1,309,895 | 62,901,158 | ||||||||||||||
Vertex Pharmaceuticals Incorporated † | 77,500 | 21,080,000 | ||||||||||||||
| 184,685,348 | ||||||||||||||||
|
| |||||||||||||||
| Health Care Equipment & Supplies: 6.92% | ||||||||||||||||
Boston Scientific Corporation † | 2,416,586 | 93,207,722 | ||||||||||||||
DexCom Incorporated † | 106,500 | 46,385,010 | ||||||||||||||
Edwards Lifesciences Corporation † | 784,500 | 61,512,645 | ||||||||||||||
Insulet Corporation † | 170,400 | 34,652,544 | ||||||||||||||
Intuitive Surgical Incorporated † | 50,000 | 34,272,000 | ||||||||||||||
iRhythm Technologies Incorporated † | 94,400 | 11,750,912 | ||||||||||||||
Novocure Limited † | 653,000 | 49,490,870 | ||||||||||||||
Stryker Corporation | 117,500 | 22,712,750 | ||||||||||||||
| 353,984,453 | ||||||||||||||||
|
| |||||||||||||||
| Health Care Technology: 1.76% | ||||||||||||||||
Veeva Systems Incorporated Class A † | 340,650 | 90,125,771 | ||||||||||||||
|
| |||||||||||||||
| Life Sciences Tools & Services: 1.32% | ||||||||||||||||
Adaptive Biotechnologies Corporation † | 591,737 | 22,083,625 | ||||||||||||||
Repligen Corporation † | 300,400 | 45,333,364 | ||||||||||||||
| 67,416,989 | ||||||||||||||||
|
| |||||||||||||||
| Pharmaceuticals: 0.88% | ||||||||||||||||
MyoKardia Incorporated † | 176,000 | 15,862,880 | ||||||||||||||
Pacira Pharmaceuticals Incorporated † | 233,400 | 12,279,174 | ||||||||||||||
Royalty Pharma plc Class A † | 55,866 | 2,405,031 | ||||||||||||||
Zoetis Incorporated | 97,370 | 14,769,082 | ||||||||||||||
| 45,316,167 | ||||||||||||||||
|
| |||||||||||||||
Industrials: 8.69% | ||||||||||||||||
| Building Products: 0.13% | ||||||||||||||||
The AZEK Company Incorporated † | 197,629 | 6,818,201 | ||||||||||||||
|
| |||||||||||||||
The accompanying notes are an integral part of these financial statements.
12 | Wells Fargo Growth Fund
Table of Contents
Portfolio of investments—July 31, 2020
| Shares | Value | |||||||||||||||
| Commercial Services & Supplies: 3.58% | ||||||||||||||||
Casella Waste Systems Incorporated Class A † | 669,624 | $ | 37,103,866 | |||||||||||||
Copart Incorporated † | 772,970 | 72,079,453 | ||||||||||||||
Waste Connections Incorporated | 721,205 | 73,829,756 | ||||||||||||||
| 183,013,075 | ||||||||||||||||
|
| |||||||||||||||
| Electrical Equipment: 0.16% | ||||||||||||||||
Generac Holdings Incorporated † | 51,400 | 8,099,612 | ||||||||||||||
|
| |||||||||||||||
| Professional Services: 1.30% | ||||||||||||||||
CoStar Group Incorporated † | 62,600 | 53,194,976 | ||||||||||||||
TransUnion | 146,600 | 13,130,962 | ||||||||||||||
| 66,325,938 | ||||||||||||||||
|
| |||||||||||||||
| Road & Rail: 3.52% | ||||||||||||||||
CSX Corporation | 709,346 | 50,604,744 | ||||||||||||||
Norfolk Southern Corporation | 351,890 | 67,636,777 | ||||||||||||||
Union Pacific Corporation | 358,460 | 62,139,041 | ||||||||||||||
| 180,380,562 | ||||||||||||||||
|
| |||||||||||||||
Information Technology: 42.89% | ||||||||||||||||
| IT Services: 13.66% | ||||||||||||||||
Global Payments Incorporated | 440,170 | 78,359,063 | ||||||||||||||
MasterCard Incorporated Class A | 544,470 | 167,985,329 | ||||||||||||||
MongoDB Incorporated † | 189,920 | 43,506,874 | ||||||||||||||
PayPal Holdings Incorporated † | 675,590 | 132,462,931 | ||||||||||||||
Switch Incorporated Class A | 2,129,125 | 38,302,959 | ||||||||||||||
Twilio Incorporated Class A † | 357,239 | 99,105,243 | ||||||||||||||
Visa Incorporated Class A | 729,910 | 138,974,864 | ||||||||||||||
| 698,697,263 | ||||||||||||||||
|
| |||||||||||||||
| Semiconductors & Semiconductor Equipment: 5.12% | ||||||||||||||||
Maxim Integrated Products Incorporated | 180,900 | 12,317,481 | ||||||||||||||
Microchip Technology Incorporated | 1,251,290 | 127,293,732 | ||||||||||||||
Monolithic Power Systems Incorporated | 299,470 | 79,362,545 | ||||||||||||||
Texas Instruments Incorporated | 337,880 | 43,096,594 | ||||||||||||||
| 262,070,352 | ||||||||||||||||
|
| |||||||||||||||
| Software: 20.49% | ||||||||||||||||
Adobe Incorporated † | 13,120 | 5,829,478 | ||||||||||||||
Anaplan Incorporated † | 267,439 | 12,144,405 | ||||||||||||||
Cloudflare Incorporated Class A † | 498,192 | 20,734,751 | ||||||||||||||
Dynatrace Incorporated † | 1,913,532 | 80,043,044 | ||||||||||||||
Envestnet Incorporated † | 1,761,670 | 143,047,604 | ||||||||||||||
Everbridge Incorporated † | 615,240 | 87,856,272 | ||||||||||||||
Globant SA † | 74,800 | 12,935,912 | ||||||||||||||
HubSpot Incorporated † | 100,440 | 23,564,223 | ||||||||||||||
Jamf Holding Corporation † | 504,763 | 20,493,378 | ||||||||||||||
Microsoft Corporation | 1,532,050 | 314,085,571 | ||||||||||||||
Mimecast Limited † | 350,100 | 16,430,193 | ||||||||||||||
Proofpoint Incorporated † | 82,090 | 9,495,350 | ||||||||||||||
Q2 Holdings Incorporated † | 270,900 | 25,478,145 | ||||||||||||||
Rapid7 Incorporated † | 687,700 | 40,966,289 | ||||||||||||||
RingCentral Incorporated Class A † | 23,400 | 6,792,319 | ||||||||||||||
Salesforce.com Incorporated † | 136,015 | 26,502,523 | ||||||||||||||
The accompanying notes are an integral part of these financial statements.
Wells Fargo Growth Fund | 13
Table of Contents
Portfolio of investments—July 31, 2020
| Shares | Value | |||||||||||||||
| Software (continued) | ||||||||||||||||
ServiceNow Incorporated † | 79,990 | $ | 35,131,608 | |||||||||||||
Splunk Incorporated † | 415,500 | 87,180,210 | ||||||||||||||
The Trade Desk Incorporated † | 72,600 | 32,765,832 | ||||||||||||||
Vertex Incorporated Class A † | 527,181 | 12,420,384 | ||||||||||||||
Zendesk Incorporated † | 377,200 | 34,381,780 | ||||||||||||||
| 1,048,279,271 | ||||||||||||||||
|
| |||||||||||||||
| Technology Hardware, Storage & Peripherals: 3.62% | ||||||||||||||||
Apple Incorporated | 435,340 | 185,036,914 | ||||||||||||||
|
| |||||||||||||||
Materials: 1.53% | ||||||||||||||||
| Chemicals: 1.53% | ||||||||||||||||
Air Products & Chemicals Incorporated | 67,900 | 19,462,177 | ||||||||||||||
Linde plc | 240,760 | 59,012,684 | ||||||||||||||
| 78,474,861 | ||||||||||||||||
|
| |||||||||||||||
Total Common Stocks (Cost $2,045,354,280) | 5,110,959,578 | |||||||||||||||
|
| |||||||||||||||
| Yield | ||||||||||||||||
| Short-Term Investments: 0.08% | ||||||||||||||||
Investment Companies: 0.08% | ||||||||||||||||
Securities Lending Cash Investments LLC (l)(r)(u) | 0.00 | % | 500 | 500 | ||||||||||||
Wells Fargo Government Money Market Select Class (l)(u) | 0.10 | 4,136,432 | 4,136,432 | |||||||||||||
Total Short-Term Investments (Cost $4,136,932) | 4,136,932 | |||||||||||||||
|
| |||||||||||||||
| Total investments in securities (Cost $2,049,491,212) | 99.98 | % | 5,115,096,510 | |||||
Other assets and liabilities, net | 0.02 | 775,166 | ||||||
|
|
|
| |||||
| Total net assets | 100.00 | % | $ | 5,115,871,676 | ||||
|
|
|
| |||||
| † | Non-income-earning security |
| (l) | The issuer of the security is an affiliated person of the Fund as defined in the Investment Company Act of 1940. |
| (r) | The investment is a non-registered investment company. |
| (u) | The rate represents the 7-day annualized yield at period end. |
Investments In Affiliates
An affiliated investment is an investment in which the Fund owns at least 5% of the outstanding voting shares of the issuer or as a result of other relationships, such as the Fund and the issuer having the same investment manager. Transactions with issuers that were either affiliates of the Fund at the beginning of the period or the end of the period were as follows:
| Value, beginning of period | Purchases | Sales proceeeds | Net realized gains (losses) | Net change in unrealized gains (losses) | Income from affiliated securities | Value, end of period | % of net assets | |||||||||||||||||||||||||
| Short-Term Investments | ||||||||||||||||||||||||||||||||
Investment Companies | ||||||||||||||||||||||||||||||||
Securities Lending Cash Investments LLC | $ | 18,743,952 | $ | 475,372,247 | $ | (494,120,312 | ) | $ | 6,165 | $ | (1,552 | ) | $ | 505,006 | # | $ | 500 | |||||||||||||||
Wells Fargo Government Money Market Fund Select Class | 62,114,127 | 597,894,234 | (655,871,929 | ) | 0 | 0 | 265,291 | 4,136,432 | ||||||||||||||||||||||||
|
|
|
|
|
|
|
|
|
| |||||||||||||||||||||||
| $ | 6,165 | $ | (1,552 | ) | $ | 770,297 | $ | 4,136,932 | 0.08 | % | ||||||||||||||||||||||
|
|
|
|
|
|
|
|
|
| |||||||||||||||||||||||
| # | Amount shown represents income before fees and rebates |
The accompanying notes are an integral part of these financial statements.
14 | Wells Fargo Growth Fund
Table of Contents
Statement of assets and liabilities—July 31, 2020
Assets | ||||
Investments in unaffiliated securities, at value (cost $2,045,354,280) | $ | 5,110,959,578 | ||
Investments in affiliated securities, at value (cost $4,136,932) | 4,136,932 | |||
Receivable for investments sold | 9,815,276 | |||
Receivable for Fund shares sold | 2,447,535 | |||
Receivable for dividends | 630,631 | |||
Receivable for securities lending income, net | 803 | |||
Prepaid expenses and other assets | 5,831 | |||
|
| |||
Total assets | 5,127,996,586 | |||
|
| |||
Liabilities | ||||
Payable for investments purchased | 4,464,973 | |||
Payable for Fund shares redeemed | 2,349,220 | |||
Management fee payable | 3,203,791 | |||
Administration fees payable | 726,681 | |||
Distribution fee payable | 83,978 | |||
Shareholder servicing fees payable | 677,769 | |||
Trustees’ fees and expenses payable | 4,989 | |||
Accrued expenses and other liabilities | 613,509 | |||
|
| |||
Total liabilities | 12,124,910 | |||
|
| |||
Total net assets | $ | 5,115,871,676 | ||
|
| |||
Net assets consist of | ||||
Paid-in capital | $ | 1,666,663,709 | ||
Total distributable earnings | 3,449,207,967 | |||
|
| |||
Total net assets | $ | 5,115,871,676 | ||
|
| |||
Computation of net asset value and offering price per share | ||||
Net assets – Class A | $ | 2,443,131,511 | ||
Shares outstanding – Class A1 | 61,293,961 | |||
Net asset value per share – Class A | $39.86 | |||
Maximum offering price per share – Class A2 | $42.29 | |||
Net assets – Class C | $ | 114,122,570 | ||
Shares outstanding – Class C1 | 4,177,586 | |||
Net asset value per share – Class C | $27.32 | |||
Net assets – Class R6 | $ | 391,705,431 | ||
Shares outstanding – Class R61 | 7,366,405 | |||
Net asset value per share – Class R6 | $53.17 | |||
Net assets – Administrator Class | $ | 559,108,992 | ||
Shares outstanding – Administrator Class1 | 11,745,700 | |||
Net asset value per share – Administrator Class | $47.60 | |||
Net assets – Institutional Class | $ | 1,607,803,172 | ||
Shares outstanding – Institutional Class1 | 30,359,157 | |||
Net asset value per share – Institutional Class | $52.96 | |||
| 1 | The Fund has an unlimited number of authorized shares. |
| 2 | Maximum offering price is computed as 100/94.25 of net asset value. On investments of $50,000 or more, the offering price is reduced. |
The accompanying notes are an integral part of these financial statements.
Wells Fargo Growth Fund | 15
Table of Contents
Statement of operations—year ended July 31, 2020
Investment income | ||||
Dividends (net of foreign withholding taxes of $85,147) | $ | 24,670,320 | ||
Income from affiliated securities | 458,075 | |||
|
| |||
Total investment income | 25,128,395 | |||
|
| |||
Expenses | ||||
Management fee | 31,831,092 | |||
Administration fees |
| |||
Class A | 4,431,260 | |||
Class C | 270,886 | |||
Class R6 | 103,070 | |||
Administrator Class | 673,857 | |||
Institutional Class | 1,884,247 | |||
Shareholder servicing fees |
| |||
Class A | 5,269,786 | |||
Class C | 322,006 | |||
Administrator Class | 1,292,522 | |||
Distribution fee |
| |||
Class C | 966,056 | |||
Custody and accounting fees | 165,389 | |||
Professional fees | 50,150 | |||
Registration fees | 120,987 | |||
Shareholder report expenses | 209,623 | |||
Trustees’ fees and expenses | 23,018 | |||
Other fees and expenses | 97,470 | |||
|
| |||
Total expenses | 47,711,419 | |||
Less: Fee waivers and/or expense reimbursements |
| |||
Fund-level | (566,346 | ) | ||
Class A | (358,148 | ) | ||
Class C | (4 | ) | ||
Class R6 | (103,070 | ) | ||
Administrator Class | (627,202 | ) | ||
Institutional Class | (1,187,300 | ) | ||
|
| |||
Net expenses | 44,869,349 | |||
|
| |||
Net investment loss | (19,740,954 | ) | ||
|
| |||
Realized and unrealized gains (losses) on investments | ||||
Net realized gains on |
| |||
Unaffiliated securities | 491,569,994 | |||
Affiliated securities | 6,165 | |||
|
| |||
Net realized gains on investments | 491,576,159 | |||
|
| |||
Net change in unrealized gains (losses) on |
| |||
Unaffiliated securities | 638,780,605 | |||
Affiiliated securities | (1,552 | ) | ||
|
| |||
Net change in unrealized gains (losses) on investments | 638,779,053 | |||
|
| |||
Net realized and unrealized gains (losses) on investments | 1,130,355,212 | |||
|
| |||
Net increase in net assets resulting from operations | $ | 1,110,614,258 | ||
|
| |||
The accompanying notes are an integral part of these financial statements.
16 | Wells Fargo Growth Fund
Table of Contents
Statement of changes in net assets
| Year ended July 31, 2020 | Year ended July 31, 2019 | |||||||||||||||
Operations |
| |||||||||||||||
Net investment loss | $ | (19,740,954 | ) | $ | (12,812,172 | ) | ||||||||||
Net realized gains on investments | 491,576,159 | 632,722,898 | ||||||||||||||
Net change in unrealized gains (losses) on investments | 638,779,053 | (63,288,246 | ) | |||||||||||||
|
| |||||||||||||||
Net increase in net assets resulting from operations | 1,110,614,258 | 556,622,480 | ||||||||||||||
|
| |||||||||||||||
Distributions to shareholders from net investment income and net | ||||||||||||||||
Class A | (247,668,290 | ) | (355,696,811 | ) | ||||||||||||
Class C | (20,979,782 | ) | (37,666,442 | ) | ||||||||||||
Class R6 | (31,160,181 | ) | (36,585,868 | ) | ||||||||||||
Administrator Class | (55,248,543 | ) | (78,768,918 | ) | ||||||||||||
Institutional Class | (133,918,973 | ) | (211,847,451 | ) | ||||||||||||
|
| |||||||||||||||
Total distributions to shareholders | (488,975,769 | ) | (720,565,490 | ) | ||||||||||||
|
| |||||||||||||||
Capital share transactions | Shares | Shares | ||||||||||||||
Proceeds from shares sold |
| |||||||||||||||
Class A | 3,604,965 | 123,362,300 | 2,458,750 | 81,981,928 | ||||||||||||
Class C | 559,222 | 12,911,460 | 746,761 | 17,066,886 | ||||||||||||
Class R6 | 1,488,420 | 65,868,480 | 2,698,823 | 114,509,957 | ||||||||||||
Administrator Class | 2,511,135 | 99,163,143 | 2,744,478 | 107,374,673 | ||||||||||||
Institutional Class | 6,059,936 | 267,887,037 | 5,400,449 | 232,172,883 | ||||||||||||
|
| |||||||||||||||
| 569,192,420 | 553,106,327 | |||||||||||||||
|
| |||||||||||||||
Reinvestment of distributions |
| |||||||||||||||
Class A | 7,496,110 | 239,800,544 | 12,007,593 | 343,056,930 | ||||||||||||
Class C | 799,568 | 17,614,481 | 1,566,352 | 32,721,099 | ||||||||||||
Class R6 | 688,571 | 29,298,699 | 995,813 | 36,576,208 | ||||||||||||
Administrator Class | 1,435,464 | 54,762,934 | 2,333,920 | 77,882,902 | ||||||||||||
Institutional Class | 3,048,613 | 129,230,698 | 5,586,200 | 204,566,633 | ||||||||||||
|
| |||||||||||||||
| 470,707,356 | 694,803,772 | |||||||||||||||
|
| |||||||||||||||
Payment for shares redeemed |
| |||||||||||||||
Class A | (9,330,225 | ) | (310,801,661 | ) | (10,353,405 | ) | (346,975,927 | ) | ||||||||
Class C | (3,213,997 | ) | (78,810,374 | ) | (2,391,955 | ) | (58,387,097 | ) | ||||||||
Class R6 | (2,167,510 | ) | (94,595,348 | ) | (1,446,729 | ) | (63,083,744 | ) | ||||||||
Administrator Class | (5,715,194 | ) | (225,497,878 | ) | (4,421,943 | ) | (173,395,539 | ) | ||||||||
Institutional Class | (11,657,374 | ) | (511,473,406 | ) | (12,123,280 | ) | (516,616,632 | ) | ||||||||
|
| |||||||||||||||
| (1,221,178,667 | ) | (1,158,458,939 | ) | |||||||||||||
|
| |||||||||||||||
Net increase (decrease) in net assets resulting from capital share transactions | (181,278,891 | ) | 89,451,160 | |||||||||||||
|
| |||||||||||||||
Total increase (decrease) in net assets | 440,359,598 | (74,491,850 | ) | |||||||||||||
|
| |||||||||||||||
Net assets | ||||||||||||||||
Beginning of period | 4,675,512,078 | 4,750,003,928 | ||||||||||||||
|
| |||||||||||||||
End of period | $ | 5,115,871,676 | $ | 4,675,512,078 | ||||||||||||
|
| |||||||||||||||
The accompanying notes are an integral part of these financial statements.
Wells Fargo Growth Fund | 17
Table of Contents
(For a share outstanding throughout each period)
| Year ended July 31 | ||||||||||||||||||||
| CLASS A | 2020 | 2019 | 2018 | 2017 | 2016 | |||||||||||||||
Net asset value, beginning of period | $35.56 | $38.67 | $40.38 | $42.28 | $49.50 | |||||||||||||||
Net investment loss | (0.19 | ) | (0.13 | ) | (0.12 | ) | (0.19 | )1 | (0.20 | )1 | ||||||||||
Net realized and unrealized gains (losses) on investments | 8.77 | 3.73 | 9.49 | 5.61 | (0.99 | ) | ||||||||||||||
|
|
|
|
|
|
|
|
|
| |||||||||||
Total from investment operations | 8.58 | 3.60 | 9.37 | 5.42 | (1.19 | ) | ||||||||||||||
Distributions to shareholders from | ||||||||||||||||||||
Net realized gains | (4.28 | ) | (6.71 | ) | (11.08 | ) | (7.32 | ) | (6.03 | ) | ||||||||||
Net asset value, end of period | $39.86 | $35.56 | $38.67 | $40.38 | $42.28 | |||||||||||||||
Total return2 | 27.08 | % | 13.55 | % | 27.66 | % | 15.95 | % | (1.69 | )% | ||||||||||
Ratios to average net assets (annualized) | ||||||||||||||||||||
Gross expenses | 1.17 | % | 1.18 | % | 1.18 | % | 1.17 | % | 1.15 | % | ||||||||||
Net expenses | 1.14 | % | 1.16 | % | 1.16 | % | 1.16 | % | 1.14 | % | ||||||||||
Net investment loss | (0.59 | )% | (0.45 | )% | (0.45 | )% | (0.49 | )% | (0.49 | )% | ||||||||||
Supplemental data | ||||||||||||||||||||
Portfolio turnover rate | 37 | % | 39 | % | 37 | % | 42 | % | 38 | % | ||||||||||
Net assets, end of period (000s omitted) | $2,443,132 | $2,116,542 | $2,142,855 | $1,950,551 | $2,582,955 | |||||||||||||||
| 1 | Calculated based upon average shares outstanding |
| 2 | Total return calculations do not include any sales charges. |
The accompanying notes are an integral part of these financial statements.
18 | Wells Fargo Growth Fund
Table of Contents
Financial highlights
(For a share outstanding throughout each period)
| Year ended July 31 | ||||||||||||||||||||
| CLASS C | 2020 | 2019 | 2018 | 2017 | 2016 | |||||||||||||||
Net asset value, beginning of period | $25.87 | $30.33 | $34.05 | $37.07 | $44.51 | |||||||||||||||
Net investment loss | (0.32 | )1 | (0.31 | )1 | (0.33 | ) | (0.41 | )1 | (0.46 | )1 | ||||||||||
Net realized and unrealized gains (losses) on investments | 6.05 | 2.56 | 7.69 | 4.71 | (0.95 | ) | ||||||||||||||
|
|
|
|
|
|
|
|
|
| |||||||||||
Total from investment operations | 5.73 | 2.25 | 7.36 | 4.30 | (1.41 | ) | ||||||||||||||
Distributions to shareholders from | ||||||||||||||||||||
Net realized gains | (4.28 | ) | (6.71 | ) | (11.08 | ) | (7.32 | ) | (6.03 | ) | ||||||||||
Net asset value, end of period | $27.32 | $25.87 | $30.33 | $34.05 | $37.07 | |||||||||||||||
Total return2 | 26.11 | % | 12.68 | % | 26.73 | % | 15.05 | % | (2.44 | )% | ||||||||||
Ratios to average net assets (annualized) | ||||||||||||||||||||
Gross expenses | 1.92 | % | 1.93 | % | 1.93 | % | 1.92 | % | 1.90 | % | ||||||||||
Net expenses | 1.91 | % | 1.91 | % | 1.91 | % | 1.91 | % | 1.89 | % | ||||||||||
Net investment loss | (1.35 | )% | (1.19 | )% | (1.19 | )% | (1.23 | )% | (1.24 | )% | ||||||||||
Supplemental data | ||||||||||||||||||||
Portfolio turnover rate | 37 | % | 39 | % | 37 | % | 42 | % | 38 | % | ||||||||||
Net assets, end of period (000s omitted) | $114,123 | $156,056 | $185,346 | $205,607 | $321,032 | |||||||||||||||
| 1 | Calculated based upon average shares outstanding |
| 2 | Total return calculations do not include any sales charges. |
The accompanying notes are an integral part of these financial statements.
Wells Fargo Growth Fund | 19
Table of Contents
Financial highlights
(For a share outstanding throughout each period)
| Year ended July 31 | ||||||||||||||||||||
| CLASS R6 | 2020 | 2019 | 2018 | 2017 | 20161 | |||||||||||||||
Net asset value, beginning of period | $45.84 | $47.53 | $47.13 | $47.90 | $48.97 | |||||||||||||||
Net investment income (loss) | (0.07 | ) | 0.00 | 2,3 | (0.01 | )2 | (0.02 | )2 | (0.02 | ) | ||||||||||
Net realized and unrealized gains (losses) on investments | 11.68 | 5.02 | 11.49 | 6.57 | 4.98 | |||||||||||||||
|
|
|
|
|
|
|
|
|
| |||||||||||
Total from investment operations | 11.61 | 5.02 | 11.48 | 6.55 | 4.96 | |||||||||||||||
Distributions to shareholders from | ||||||||||||||||||||
Net realized gains | (4.28 | ) | (6.71 | ) | (11.08 | ) | (7.32 | ) | (6.03 | ) | ||||||||||
Net asset value, end of period | $53.17 | $45.84 | $47.53 | $47.13 | $47.90 | |||||||||||||||
Total return4 | 27.65 | % | 14.06 | % | 28.26 | % | 16.49 | % | 10.89 | % | ||||||||||
Ratios to average net assets (annualized) | ||||||||||||||||||||
Gross expenses | 0.74 | % | 0.75 | % | 0.75 | % | 0.74 | % | 0.74 | % | ||||||||||
Net expenses | 0.70 | % | 0.70 | % | 0.70 | % | 0.70 | % | 0.70 | % | ||||||||||
Net investment income (loss) | (0.15 | )% | 0.00 | % | (0.02 | )% | (0.05 | )% | (0.23 | )% | ||||||||||
Supplemental data | ||||||||||||||||||||
Portfolio turnover rate | 37 | % | 39 | % | 37 | % | 42 | % | 38 | % | ||||||||||
Net assets, end of period (000s omitted) | $391,705 | $337,260 | $242,838 | $49,454 | $30,906 | |||||||||||||||
| 1 | For the period from September 30, 2015 (commencement of class operations) to July 31, 2016 |
| 2 | Calculated based upon average shares outstanding |
| 3 | Amount is less than $0.005. |
| 4 | Returns for periods of less than one year are not annualized. |
The accompanying notes are an integral part of these financial statements.
20 | Wells Fargo Growth Fund
Table of Contents
Financial highlights
(For a share outstanding throughout each period)
| Year ended July 31 | ||||||||||||||||||||
| ADMINISTRATOR CLASS | 2020 | 2019 | 2018 | 2017 | 2016 | |||||||||||||||
Net asset value, beginning of period | $41.58 | $43.89 | $44.40 | $45.66 | $52.86 | |||||||||||||||
Net investment loss | (0.16 | )1 | (0.10 | )1 | (0.11 | )1 | (0.11 | )1 | (0.14 | )1 | ||||||||||
Net realized and unrealized gains (losses) on investments | 10.46 | 4.50 | 10.68 | 6.17 | (1.03 | ) | ||||||||||||||
|
|
|
|
|
|
|
|
|
| |||||||||||
Total from investment operations | 10.30 | 4.40 | 10.57 | 6.06 | (1.17 | ) | ||||||||||||||
Distributions to shareholders from | ||||||||||||||||||||
Net realized gains | (4.28 | ) | (6.71 | ) | (11.08 | ) | (7.32 | ) | (6.03 | ) | ||||||||||
Net asset value, end of period | $47.60 | $41.58 | $43.89 | $44.40 | $45.66 | |||||||||||||||
Total return | 27.31 | % | 13.78 | % | 27.90 | % | 16.20 | % | (1.53 | )% | ||||||||||
Ratios to average net assets (annualized) | ||||||||||||||||||||
Gross expenses | 1.09 | % | 1.10 | % | 1.10 | % | 1.09 | % | 1.07 | % | ||||||||||
Net expenses | 0.96 | % | 0.96 | % | 0.96 | % | 0.96 | % | 0.96 | % | ||||||||||
Net investment loss | (0.40 | )% | (0.25 | )% | (0.24 | )% | (0.27 | )% | (0.31 | )% | ||||||||||
Supplemental data | ||||||||||||||||||||
Portfolio turnover rate | 37 | % | 39 | % | 37 | % | 42 | % | 38 | % | ||||||||||
Net assets, end of period (000s omitted) | $559,109 | $561,900 | $564,391 | $637,987 | $1,528,288 | |||||||||||||||
| 1 | Calculated based upon average shares outstanding |
The accompanying notes are an integral part of these financial statements.
Wells Fargo Growth Fund | 21
Table of Contents
Financial highlights
(For a share outstanding throughout each period)
| Year ended July 31 | ||||||||||||||||||||
| INSTITUTIONAL CLASS | 2020 | 2019 | 2018 | 2017 | 2016 | |||||||||||||||
Net asset value, beginning of period | $45.70 | $47.43 | $47.07 | $47.87 | $54.99 | |||||||||||||||
Net investment loss | (0.09 | )1 | (0.01 | )1 | (0.02 | )1 | (0.04 | )1 | (0.05 | )1 | ||||||||||
Net realized and unrealized gains (losses) on investments | 11.63 | 4.99 | 11.46 | 6.56 | (1.04 | ) | ||||||||||||||
|
|
|
|
|
|
|
|
|
| |||||||||||
Total from investment operations | 11.54 | 4.98 | 11.44 | 6.52 | (1.09 | ) | ||||||||||||||
Distributions to shareholders from | ||||||||||||||||||||
Net realized gains | (4.28 | ) | (6.71 | ) | (11.08 | ) | (7.32 | ) | (6.03 | ) | ||||||||||
Net asset value, end of period | $52.96 | $45.70 | $47.43 | $47.07 | $47.87 | |||||||||||||||
Total return | 27.58 | % | 14.00 | % | 28.21 | % | 16.44 | % | (1.31 | )% | ||||||||||
Ratios to average net assets (annualized) | ||||||||||||||||||||
Gross expenses | 0.84 | % | 0.85 | % | 0.85 | % | 0.84 | % | 0.82 | % | ||||||||||
Net expenses | 0.75 | % | 0.75 | % | 0.75 | % | 0.75 | % | 0.75 | % | ||||||||||
Net investment loss | (0.20 | )% | (0.03 | )% | (0.03 | )% | (0.08 | )% | (0.10 | )% | ||||||||||
Supplemental data | ||||||||||||||||||||
Portfolio turnover rate | 37 | % | 39 | % | 37 | % | 42 | % | 38 | % | ||||||||||
Net assets, end of period (000s omitted) | $1,607,803 | $1,503,753 | $1,614,575 | $1,655,724 | $2,398,134 | |||||||||||||||
| 1 | Calculated based upon average shares outstanding |
The accompanying notes are an integral part of these financial statements.
22 | Wells Fargo Growth Fund
Table of Contents
1. ORGANIZATION
Wells Fargo Funds Trust (the “Trust”), a Delaware statutory trust organized on March 10, 1999, is an open-end management investment company registered under the Investment Company Act of 1940, as amended (the “1940 Act”). As an investment company, the Trust follows the accounting and reporting guidance in Financial Accounting Standards Board (“FASB”) Accounting Standards Codification Topic 946, Financial Services – Investment Companies. These financial statements report on the Wells Fargo Growth Fund (the “Fund”) which is a diversified series of the Trust.
2. SIGNIFICANT ACCOUNTING POLICIES
The following significant accounting policies, which are consistently followed in the preparation of the financial statements of the Fund, are in conformity with U.S. generally accepted accounting principles which require management to make estimates and assumptions that affect the reported amounts of assets and liabilities, disclosure of contingent assets and liabilities at the date of the financial statements, and the reported amounts of revenues and expenses during the reporting period. Actual results could differ from those estimates.
Securities valuation
All investments are valued each business day as of the close of regular trading on the New York Stock Exchange (generally 4 p.m. Eastern Time), although the Fund may deviate from this calculation time under unusual or unexpected circumstances.
Equity securities that are listed on a foreign or domestic exchange or market are valued at the official closing price or, if none, the last sales price. If no sale occurs on the principal exchange or market that day, a fair value price will be determined in accordance with the Fund’s Valuation Procedures.
Investments in registered open-end investment companies are valued at net asset value. Certain interests in non-registered investment companies that are redeemable at net asset value are fair valued normally at net asset value.
Investments which are not valued using any of the methods discussed above are valued at their fair value, as determined in good faith by the Board of Trustees of the Fund. The Board of Trustees has established a Valuation Committee comprised of the Trustees and has delegated to it the authority to take any actions regarding the valuation of portfolio securities that the Valuation Committee deems necessary or appropriate, including determining the fair value of portfolio securities, unless the determination has been delegated to the Wells Fargo Asset Management Pricing Committee at Wells Fargo Funds Management, LLC (“Funds Management”). Board of Trustees retains the authority to make or ratify any valuation decisions or approve any changes to the Valuation Procedures as it deems appropriate. On a quarterly basis, the Board of Trustees receives reports on any valuation actions taken by the Valuation Committee or the Wells Fargo Asset Management Pricing Committee which may include items for ratification.
Foreign currency translation
The accounting records of the Fund are maintained in U.S. dollars. The values of other assets and liabilities denominated in foreign currencies are translated into U.S. dollars at rates provided by an independent foreign currency pricing source at a time each business day specified by the Wells Fargo Asset Management Pricing Committee. Purchases and sales of securities, and income and expenses are converted at the rate of exchange on the respective dates of such transactions. Net realized foreign exchange gains or losses arise from sales of foreign currencies, currency gains or losses realized between the trade and settlement dates on securities transactions, and the difference between the amounts of dividends, interest and foreign withholding taxes recorded and the U.S. dollar equivalent of the amounts actually paid or received. Net unrealized foreign exchange gains and losses arise from changes in the fair value of assets and liabilities other than investments in securities resulting from changes in exchange rates. The changes in net assets arising from changes in exchange rates of securities and the changes in net assets resulting from changes in market prices of securities are not separately presented. Such changes are included in net realized and unrealized gains or losses from investments.
Securities lending
The Fund may lend its securities from time to time in order to earn additional income in the form of fees or interest on securities received as collateral or the investment of any cash received as collateral. When securities are on loan, the Fund receives interest or dividends on those securities. Cash collateral received in connection with its securities lending transactions is invested in Securities Lending Cash Investments, LLC (the “Securities Lending Fund”). Investments in Securities Lending Fund are valued at the evaluated bid price provided by an independent pricing service. Income earned from investment in the Securities Lending Fund (net of fees and rebates), if any, is included in income from affiliated securities on the Statement of Operations.
In a securities lending transaction, the net asset value of the Fund is affected by an increase or decrease in the value of the securities loaned and by an increase or decrease in the value of the instrument in which collateral is invested. The amount of
Wells Fargo Growth Fund | 23
Table of Contents
Notes to financial statements
securities lending activity undertaken by the Fund fluctuates from time to time. The Fund has the right under the lending agreement to recover the securities from the borrower on demand. In the event of default or bankruptcy by the borrower, the Fund may be prevented from recovering the loaned securities or gaining access to the collateral or may experience delays or costs in doing so. In such an event, the terms of the agreement allow the unaffiliated securities lending agent to use the collateral to purchase replacement securities on behalf of the Fund or pay the Fund the market value of the loaned securities. The Fund bears the risk of loss with respect to depreciation of its investment of the cash collateral.
Security transactions and income recognition
Securities transactions are recorded on a trade date basis. Realized gains or losses are recorded on the basis of identified cost.
Dividend income is recognized on the ex-dividend date. Dividend income is recorded net of foreign taxes withheld where recovery of such taxes is not assured.
Distributions to shareholders
Distributions to shareholders from net investment income and any net realized gains are recorded on the ex-dividend date and paid at least annually. Such distributions are determined in accordance with income tax regulations and may differ from U.S. generally accepted accounting principles. Dividend sources are estimated at the time of declaration. The tax character of distributions is determined as of the Fund’s fiscal year end. Therefore, a portion of the Fund’s distributions made prior to the Fund’s fiscal year end may be categorized as a tax return of capital at year end.
Federal and other taxes
The Fund intends to continue to qualify as a regulated investment company by distributing substantially all of its investment company taxable income and any net realized capital gains (after reduction for capital loss carryforwards) sufficient to relieve it from all, or substantially all, federal income taxes. Accordingly, no provision for federal income taxes was required.
The Fund’s income and federal excise tax returns and all financial records supporting those returns for the prior three fiscal years are subject to examination by the federal and Delaware revenue authorities. Management has analyzed the Fund’s tax positions taken on federal, state, and foreign tax returns for all open tax years and does not believe that there are any uncertain tax positions that require recognition of a tax liability.
As of July 31, 2020, the aggregate cost of all investments for federal income tax purposes was $2,057,947,527 and the unrealized gains (losses) consisted of:
Gross unrealized gains | $ | 3,057,212,342 | ||
Gross unrealized losses | (63,359 | ) | ||
Net unrealized gains | $ | 3,057,148,983 | ||
Reclassifications are made to the Fund’s capital accounts for permanent tax differences to reflect income and gains available for distribution (or available capital loss carryforwards) under federal income tax regulations. U.S. generally accepted accounting principles require that certain components of net assets be adjusted to reflect permanent differences between financial and tax reporting. These reclassifications have no effect on net assets or net asset values per share. The primary permanent difference causing such reclassification is due to net operating losses. At July 31, 2020, as a result of permanent book-to-tax differences, the following reclassification adjustments were made on the Statement of Assets and Liabilities:
| Paid-in capital | Total distributable earnings | |
| $(6,064,383) | $6,064,383 | |
As of July 31, 2020, the Fund had a qualified late-year ordinary loss of $22,780,204 which will be recognized on the first day of the following fiscal year.
Class allocations
The separate classes of shares offered by the Fund differ principally in applicable sales charges, distribution, shareholder servicing, and administration fees. Class specific expenses are charged directly to that share class. Investment income, common fund-level expenses, and realized and unrealized gains (losses) on investments are allocated daily to each class of shares based on the relative proportion of net assets of each class.
24 | Wells Fargo Growth Fund
Table of Contents
Notes to financial statements
3. FAIR VALUATION MEASUREMENTS
Fair value measurements of investments are determined within a framework that has established a fair value hierarchy based upon the various data inputs utilized in determining the value of the Fund’s investments. The three-level hierarchy gives the highest priority to unadjusted quoted prices in active markets for identical assets or liabilities (Level 1) and the lowest priority to unobservable inputs (Level 3). The Fund’s investments are classified within the fair value hierarchy based on the lowest level of input that is significant to the fair value measurement. The inputs are summarized into three broad levels as follows:
| ∎ | Level 1 – quoted prices in active markets for identical securities |
| ∎ | Level 2 – other significant observable inputs (including quoted prices for similar securities, interest rates, prepayment speeds, credit risk, etc.) |
| ∎ | Level 3 – significant unobservable inputs (including the Fund’s own assumptions in determining the fair value of investments) |
The inputs or methodologies used for valuing investments in securities are not necessarily an indication of the risk associated with investing in those securities.
The following is a summary of the inputs used in valuing the Fund’s assets and liabilities as of July 31, 2020:
| Quoted prices (Level 1) | Other significant observable inputs (Level 2) | Significant (Level 3) | Total | |||||||||||||
Assets | ||||||||||||||||
Investments in: | ||||||||||||||||
Common stocks | ||||||||||||||||
Communication services | $ | 609,146,002 | $ | 0 | $ | 0 | $ | 609,146,002 | ||||||||
Consumer discretionary | 738,529,801 | 0 | 0 | 738,529,801 | ||||||||||||
Consumer staples | 43,342,982 | 0 | 0 | 43,342,982 | ||||||||||||
Financials | 261,216,016 | 0 | 0 | 261,216,016 | ||||||||||||
Health care | 741,528,728 | 0 | 0 | 741,528,728 | ||||||||||||
Industrials | 444,637,388 | 0 | 0 | 444,637,388 | ||||||||||||
Information technology | 2,194,083,800 | 0 | 0 | 2,194,083,800 | ||||||||||||
Materials | 78,474,861 | 0 | 0 | 78,474,861 | ||||||||||||
Short-term investments | ||||||||||||||||
Investment companies | 4,136,932 | 0 | 0 | 4,136,932 | ||||||||||||
Total assets | $ | 5,115,096,510 | $ | 0 | $ | 0 | $ | 5,115,096,510 | ||||||||
Additional sector, industry or geographic detail is included in the Portfolio of Investments.
For the year ended July 31, 2020, the Fund did not have any transfers into/out of Level 3.
Wells Fargo Growth Fund | 25
Table of Contents
Notes to financial statements
4. TRANSACTIONS WITH AFFILIATES
Management fee
Funds Management, an indirect wholly owned subsidiary of Wells Fargo & Company (“Wells Fargo”), is the manager of the Fund and provides advisory and fund-level administrative services under an investment management agreement. Under the investment management agreement, Funds Management is responsible for, among other services, implementing the investment objectives and strategies of the Fund, supervising the subadviser and providing fund-level administrative services in connection with the Fund’s operations. As compensation for its services under the investment management agreement, Funds Management is entitled to receive a management fee at the following annual rate based on the Fund’s average daily net assets:
| Average daily net assets | Management fee | |||
First $500 million | 0.800 | % | ||
Next $500 million | 0.750 | |||
Next $1 billion | 0.700 | |||
Next $2 billion | 0.675 | |||
Next $1 billion | 0.650 | |||
Next $3 billion | 0.640 | |||
Next $2 billion | 0.615 | |||
Next $2 billion | 0.605 | |||
Next $4 billion | 0.580 | |||
Over $16 billion | 0.555 | |||
For the year ended July 31, 2020, the management fee was equivalent to an annual rate of 0.70% of the Fund’s average daily net assets.
Funds Management has retained the services of a subadviser to provide daily portfolio management to the Fund. The fee for subadvisory services is borne by Funds Management. Wells Capital Management Incorporated (“WellsCap”), an affiliate of Funds Management and an indirect wholly owned subsidiary of Wells Fargo, is the subadviser to the Fund and is entitled to receive a fee from Funds Management at an annual rate starting at 0.45% and declining to 0.30% as the average daily net assets of the Fund increase.
Administration fees
Under a class-level administration agreement, Funds Management provides class-level administrative services to the Fund, which includes paying fees and expenses for services provided by the transfer agent, sub-transfer agents, omnibus account servicers and record-keepers. As compensation for its services under the class-level administration agreement, Funds Management receives an annual fee which is calculated based on the average daily net assets of each class as follows:
| Class-level administration fee | ||||
Class A, Class C | 0.21 | % | ||
Class R6 | 0.03 | |||
Administrator Class, Institutional Class | 0.13 | |||
Waivers and/or expense reimbursements
Funds Management has contractually waived and/or reimbursed management and administration fees to the extent necessary to maintain certain net operating expense ratios for the Fund. When each class of the Fund has exceeded its expense cap, Funds Management has waived fees and/or reimbursed expenses from fund-level expenses on a proportionate basis and then from class specific expenses. When only certain classes exceed their expense caps, waivers and/or reimbursements are applied against class specific expenses before fund-level expenses. Funds Management has committed through November 30, 2020 to waive fees and/or reimburse expenses to the extent necessary to cap the Fund’s expenses at 1.16% for Class A shares, 1.91% for Class C shares, 0.70% for Class R6 shares, 0.96% for Administrator Class shares, and 0.75% for Institutional Class shares. Prior to or after the commitment expiration date, the cap may be increased or the commitment to maintain the cap may be terminated only with the approval of the Board of Trustees.
26 | Wells Fargo Growth Fund
Table of Contents
Notes to financial statements
Distribution fee
The Trust has adopted a distribution plan for Class C shares of the Fund pursuant to Rule 12b-1 under the 1940 Act. A distribution fee is charged to Class C shares and paid to Wells Fargo Funds Distributor, LLC (“Funds Distributor”), the principal underwriter, at an annual rate of 0.75% of the average daily net assets of Class C shares.
In addition, Funds Distributor is entitled to receive the front-end sales charge from the purchase of Class A shares and a contingent deferred sales charge on the redemption of certain Class A shares. Funds Distributor is also entitled to receive the contingent deferred sales charges from redemptions of Class C shares. For the year ended July 31, 2020, Funds Distributor received $24,058 from the sale of Class A shares and $1,336 in contingent deferred sales charges from redemptions of Class C shares. No contingent deferred sales charges were incurred by Class A for the year ended July 31, 2020.
Shareholder servicing fees
The Trust has entered into contracts with one or more shareholder servicing agents, whereby Class A, Class C, and Administrator Class of the Fund are charged a fee at an annual rate of 0.25% of the average daily net assets of each respective class. A portion of these total shareholder servicing fees were paid to affiliates of Wells Fargo.
Interfund transactions
The Fund may purchase or sell portfolio investment securities to certain other Wells Fargo affiliates pursuant to Rule 17a-7 under the 1940 Act and under procedures adopted by the Board of Trustees. The procedures have been designed to ensure that these interfund transactions, which do not incur broker commissions, are effected at current market prices.
5. INVESTMENT PORTFOLIO TRANSACTIONS
Purchases and sales of investments, excluding U.S. government obligations (if any) and short-term securities, for the year ended July 31, 2020 were $1,695,506,449 and $2,322,582,987, respectively.
6. SECURITIES LENDING TRANSACTIONS
The Fund lends its securities through an unaffiliated securities lending agent and receives collateral in the form of cash or securities with a value at least equal to the value of the securities on loan. The value of the loaned securities is determined at the close of each business day and any increases or decreases in the required collateral are exchanged between the Fund and the counterparty on the next business day. Cash collateral received is invested in the Securities Lending Fund which seeks to provide a positive return compared to the daily Federal Funds Open Rate by investing in high-quality, U.S. dollar-denominated short-term money market instruments and is exempt from registration under Section 3(c)(7) of the 1940 Act. Securities Lending Fund is managed by Funds Management and is subadvised by WellsCap. Funds Management receives an advisory fee starting at 0.05% and declining to 0.01% as the average daily net assets of the Securities Lending Fund increase. All of the fees received by Funds Management are paid to WellsCap for its services as subadviser.
In the event of counterparty default or the failure of a borrower to return a loaned security, the Fund has the right to use the collateral to offset any losses incurred. As of July 31, 2020, the Fund did not have any securities on loan.
7. BANK BORROWINGS
The Trust (excluding the money market funds), Wells Fargo Master Trust and Wells Fargo Variable Trust are parties to a $350,000,000 revolving credit agreement whereby the Fund is permitted to use bank borrowings for temporary or emergency purposes, such as to fund shareholder redemption requests. Interest under the credit agreement is charged to the Fund based on a borrowing rate equal to the higher of the Federal Funds rate in effect on that day plus 1.25% or the overnight LIBOR rate in effect on that day plus 1.25%. In addition, an annual commitment fee equal to 0.25% of the unused balance is allocated to each participating fund.
For the year ended July 31, 2020, there were no borrowings by the Fund under the agreement.
8. DISTRIBUTIONS TO SHAREHOLDERS
The tax character of distributions paid during the years ended July 31, 2020 and July 31, 2019 were as follows:
| Year ended July 31 | ||||||||
| 2020 | 2019 | |||||||
Ordinary income | $ | 0 | $ | 25,417,735 | ||||
Long-term capital gain | 488,975,769 | 695,147,755 | ||||||
Wells Fargo Growth Fund | 27
Table of Contents
Notes to financial statements
As of July 31, 2020, the components of distributable earnings on a tax basis were as follows:
| Undistributed long-term gain | Unrealized gains | Late-year ordinary losses deferred | ||
| $414,839,188 | $3,057,148,983 | $(22,780,204) | ||
9. CONCENTRATION RISK
Concentration risks result from exposure to a limited number of sectors. As of the end of the period, the Fund invested a concentration of its portfolio in the information technology sector. A fund that invests a substantial portion of its assets in any sector may be more affected by changes in that sector than would be a fund whose investments are not heavily weighted in any sector.
10. INDEMNIFICATION
Under the Fund’s organizational documents, the officers and Trustees have been granted certain indemnification rights against certain liabilities that may arise out of performance of their duties to the Fund. The Fund has entered into a separate agreement with each Trustee that converts indemnification rights currently existing under the Fund’s organizational documents into contractual rights that cannot be changed in the future without the consent of the Trustee. Additionally, in the normal course of business, the Fund may enter into contracts with service providers that contain a variety of indemnification clauses. The Fund’s maximum exposure under these arrangements is dependent on future claims that may be made against the Fund and, therefore, cannot be estimated.
11. NEW ACCOUNTING PRONOUNCEMENT
In August 2018, FASB issued Accounting Standards Update (“ASU”) No. 2018-13, Fair Value Measurement (Topic 820) Disclosure Framework—Changes to the Disclosure Requirements for Fair Value Measurement. ASU 2018-13 updates the disclosure requirements on fair value measurements in Topic 820, Fair Value Measurements. The amendments are effective for fiscal years, and interim periods within those fiscal years, beginning after December 15, 2019. Management has adopted this guidance which did not have a material impact on the financial statements.
12. CORONAVIRUS (COVID-19) PANDEMIC
On March 11, 2020, the World Health Organization announced that it had made the assessment that coronavirus disease 2019 (“COVID-19”) is a pandemic. The impacts of COVID-19 are adversely affecting the entire global economy, individual companies and investment products, and the market in general. There is significant uncertainty around the extent and duration of business disruptions related to COVID-19 and the impacts may be short term or may last for an extended period of time. The risk of further spreading of COVID-19 has led to significant uncertainty and volatility in the financial markets.
13. SUBSEQUENT EVENT
On August 14, 2020, Class C of the Fund was reimbursed by Funds Management in the amount of $1,781,912. The reimbursement was in connection with resolving certain fee reimbursements.
28 | Wells Fargo Growth Fund
Table of Contents
Report of independent registered public accounting firm
To the Shareholders of the Fund and Board of Trustees
Wells Fargo Funds Trust:
Opinion on the Financial Statements
We have audited the accompanying statement of assets and liabilities of Wells Fargo Growth Fund (the Fund), one of the funds constituting Wells Fargo Funds Trust, including the portfolio of investments, as of July 31, 2020, the related statement of operations for the year then ended, the statements of changes in net assets for each of the years in the two-year period then ended, and the related notes (collectively, the financial statements) and the financial highlights for each of the years or periods in the five-year period then ended. In our opinion, the financial statements and financial highlights present fairly, in all material respects, the financial position of the Fund as of July 31, 2020, the results of its operations for the year then ended, the changes in its net assets for each of the years in the two-year period then ended, and the financial highlights for each of the years or periods in the five-year period then ended, in conformity with U.S. generally accepted accounting principles.
Basis for Opinion
These financial statements and financial highlights are the responsibility of the Fund’s management. Our responsibility is to express an opinion on these financial statements and financial highlights based on our audits. We are a public accounting firm registered with the Public Company Accounting Oversight Board (United States) (PCAOB) and are required to be independent with respect to the Fund in accordance with the U.S. federal securities laws and the applicable rules and regulations of the Securities and Exchange Commission and the PCAOB.
We conducted our audits in accordance with the standards of the PCAOB. Those standards require that we plan and perform the audit to obtain reasonable assurance about whether the financial statements and financial highlights are free of material misstatement, whether due to error or fraud. Our audits included performing procedures to assess the risks of material misstatement of the financial statements and financial highlights, whether due to error or fraud, and performing procedures that respond to those risks. Such procedures included examining, on a test basis, evidence regarding the amounts and disclosures in the financial statements and financial highlights. Such procedures also included confirmation of securities owned as of July 31, 2020, by correspondence with the custodian, transfer agent and brokers, or by other appropriate auditing procedures. Our audits also included evaluating the accounting principles used and significant estimates made by management, as well as evaluating the overall presentation of the financial statements and financial highlights. We believe that our audits provide a reasonable basis for our opinion.

We have not been able to determine the specific year that we began serving as the auditor of one or more Wells Fargo Funds investment companies; however we are aware that we have served as the auditor of one or more Wells Fargo Funds investment companies since at least 1955.
Boston, Massachusetts
September 25, 2020
Wells Fargo Growth Fund | 29
Table of Contents
TAX INFORMATION
Pursuant to Section 852 of the Internal Revenue Code, $488,975,769 was designated as a 20% rate gain distribution for the fiscal year ended July 31, 2020.
PROXY VOTING INFORMATION
A description of the policies and procedures used to determine how to vote proxies relating to portfolio securities is available, upon request, by calling 1-800-222-8222, visiting our website at wfam.com, or visiting the SEC website at sec.gov. Information regarding how the proxies related to portfolio securities were voted during the most recent 12-month period ended June 30 is available on the website at wfam.com or by visiting the SEC website at sec.gov.
QUARTERLY PORTFOLIO HOLDINGS INFORMATION
The Fund files its complete schedule of portfolio holdings with the SEC for the first and third quarters of each fiscal year as an exhibit to its reports on Form N-PORT. Shareholders may view the filed Form N-PORT by visiting the SEC website at sec.gov.
30 | Wells Fargo Growth Fund
Table of Contents
Other information (unaudited)
BOARD OF TRUSTEES AND OFFICERS
Each of the Trustees and Officers1 listed in the table below acts in identical capacities for each fund in the Wells Fargo family of funds, which consists of 147 mutual funds comprising the Wells Fargo Funds Trust, Wells Fargo Variable Trust, Wells Fargo Master Trust and four closed-end funds (collectively the “Fund Complex”). This table should be read in conjunction with the Prospectus and the Statement of Additional Information2. The mailing address of each Trustee and Officer is 525 Market Street, 12th Floor, San Francisco, CA 94105. Each Trustee and Officer serves an indefinite term, however, each Trustee serves such term until reaching the mandatory retirement age established by the Trustees.
Independent Trustees
Name and year of birth | Position held and length of service* | Principal occupations during past five years or longer | Current other public company or investment company directorships | |||
| William R. Ebsworth (Born 1957) | Trustee, since 2015 | Retired. From 1984 to 2013, equities analyst, portfolio manager, research director and chief investment officer at Fidelity Management and Research Company in Boston, Tokyo, and Hong Kong, and retired in 2013 as Chief Investment Officer of Fidelity Strategic Advisers, Inc. where he led a team of investment professionals managing client assets. Prior thereto, Board member of Hong Kong Securities Clearing Co., Hong Kong Options Clearing Corp., the Thailand International Fund, Ltd., Fidelity Investments Life Insurance Company, and Empire Fidelity Investments Life Insurance Company. Audit Committee Chair and Investment Committee Chair of the Vincent Memorial Hospital Endowment (non-profit organization). Mr. Ebsworth is a CFA® charterholder. | N/A | |||
| Jane A. Freeman (Born 1953) | Trustee, since 2015; Chair Liaison, since 2018 | Retired. From 2012 to 2014 and 1999 to 2008, Chief Financial Officer of Scientific Learning Corporation. From 2008 to 2012, Ms. Freeman provided consulting services related to strategic business projects. Prior to 1999, Portfolio Manager at Rockefeller & Co. and Scudder, Stevens & Clark. Board member of the Harding Loevner Funds from 1996 to 2014, serving as both Lead Independent Director and chair of the Audit Committee. Board member of the Russell Exchange Traded Funds Trust from 2011 to 2012 and the chair of the Audit Committee. Ms. Freeman is also an inactive Chartered Financial Analyst. | N/A | |||
| Isaiah Harris, Jr. (Born 1952) | Trustee, since 2009; Audit Committee Chairman, since 2019 | Retired. Chairman of the Board of CIGNA Corporation since 2009, and Director since 2005. From 2003 to 2011, Director of Deluxe Corporation. Prior thereto, President and CEO of BellSouth Advertising and Publishing Corp. from 2005 to 2007, President and CEO of BellSouth Enterprises from 2004 to 2005 and President of BellSouth Consumer Services from 2000 to 2003. Emeritus member of the Iowa State University Foundation Board of Governors. Emeritus Member of the Advisory Board of Iowa State University School of Business. Advisory Board Member, Palm Harbor Academy (private school). Advisory Board Member, Child Evangelism Fellowship (non-profit). Mr. Harris is a certified public accountant (inactive status). | CIGNA Corporation | |||
| Judith M. Johnson (Born 1949) | Trustee, since 2008; Audit Committee Chairman, from 2009 to 2018 | Retired. Prior thereto, Chief Executive Officer and Chief Investment Officer of Minneapolis Employees Retirement Fund from 1996 to 2008. Ms. Johnson is an attorney, certified public accountant and a certified managerial accountant. | N/A | |||
Wells Fargo Growth Fund | 31
Table of Contents
Other information (unaudited)
Name and year of birth | Position held and length of service* | Principal occupations during past five years or longer | Current other public company or investment company directorships | |||
| David F. Larcker (Born 1950) | Trustee, since 2009 | James Irvin Miller Professor of Accounting at the Graduate School of Business, Stanford University, Director of the Corporate Governance Research Initiative and Senior Faculty of The Rock Center for Corporate Governance since 2006. From 2005 to 2008, Professor of Accounting at the Graduate School of Business, Stanford University. Prior thereto, Ernst & Young Professor of Accounting at The Wharton School, University of Pennsylvania from 1985 to 2005. | N/A | |||
| Olivia S. Mitchell (Born 1953) | Trustee, since 2006; Nominating and Governance Committee Chair, since 2018 | International Foundation of Employee Benefit Plans Professor, Wharton School of the University of Pennsylvania since 1993. Director of Wharton’s Pension Research Council and Boettner Center on Pensions & Retirement Research, and Research Associate at the National Bureau of Economic Research. Previously, Cornell University Professor from 1978 to 1993. | N/A | |||
| Timothy J. Penny (Born 1951) | Trustee, since 1996; Chairman, since 2018 | President and Chief Executive Officer of Southern Minnesota Initiative Foundation, a non-profit organization, since 2007. Member of the Board of Trustees of NorthStar Education Finance, Inc., a non-profit organization, since 2007. | N/A | |||
| James G. Polisson (Born 1959) | Trustee, since 2018 | Retired. Chief Marketing Officer, Source (ETF) UK Services, Ltd, from 2015 to 2017. From 2012 to 2015, Principal of The Polisson Group, LLC, a management consulting, corporate advisory and principal investing company. Chief Executive Officer and Managing Director at Russell Investments, Global Exchange Traded Funds from 2010 to 2012. Managing Director of Barclays Global Investors from 1998 to 2010 and Global Chief Marketing Officer for iShares and Barclays Global Investors from 2000 to 2010. Trustee of the San Francisco Mechanics’ Institute, a non-profit organization, from 2013 to 2015. Board member of the Russell Exchange Traded Fund Trust from 2011 to 2012. Director of Barclays Global Investors Holdings Deutschland GmbH from 2006 to 2009. Mr. Polisson is an attorney and has a retired status with the Massachusetts and District of Columbia Bar Associations. | N/A | |||
| Pamela Wheelock (Born 1959) | Trustee, since January 2020; previously Trustee from January 2018 to July 2019 | Board member of the Destination Medical Center Economic Development Agency, Rochester, Minnesota since 2019 and Interim President of the McKnight Foundation since 2020. Acting Commissioner, Minnesota Department of Human Services, July 2019 through September 2019. Human Services Manager (part-time), Minnesota Department of Human Services, October 2019 through December 2019. Chief Operating Officer, Twin Cities Habitat for Humanity from 2017 to 2019. Vice President of University Services, University of Minnesota from 2012 to 2016. Prior thereto, on the Board of Directors, Governance Committee and Finance Committee for the Minnesota Philanthropy Partners (Saint Paul Foundation) from 2012 to 2018, Interim Chief Executive Officer of Blue Cross Blue Shield of Minnesota from 2011 to 2012, Chairman of the Board from 2009 to 2012 and Board Director from 2003 to 2015. Vice President, Leadership and Community Engagement, Bush Foundation, Saint Paul, Minnesota (a private foundation) from 2009 to 2011. Executive Vice President and Chief Financial Officer, Minnesota Sports and Entertainment from 2004 to 2009 and Senior Vice President from 2002 to 2004. Executive Vice President of the Minnesota Wild Foundation from 2004 to 2008. Commissioner of Finance, State of Minnesota, from 1999 to 2002. Currently Board Chair of the Minnesota Wild Foundation since 2010. | N/A | |||
| * | Length of service dates reflect the Trustee’s commencement of service with the Trust’s predecessor entities, where applicable. |
32 | Wells Fargo Growth Fund
Table of Contents
Other information (unaudited)
Officers
Name and year of birth | Position held and length of service | Principal occupations during past five years or longer | ||
Andrew Owen (Born 1960) | President, since 2017 | Executive Vice President of Wells Fargo & Company and Head of Affiliated Managers, Wells Fargo Asset Management, since 2014. In addition, Mr. Owen is currently President, Chief Executive Officer and Director of Wells Fargo Funds Management, LLC since 2017. Prior thereto, Executive Vice President responsible for marketing, investments and product development for Wells Fargo Funds Management, LLC, from 2009 to 2014. | ||
| Jeremy DePalma1 (Born 1974) | Treasurer, since 2012 | Senior Vice President of Wells Fargo Funds Management, LLC since 2009. Senior Vice President of Evergreen Investment Management Company, LLC from 2008 to 2010 and head of the Fund Reporting and Control Team within Fund Administration from 2005 to 2010. | ||
Michelle Rhee (Born 1966) | Chief Legal Officer, since 2019 | Secretary of Wells Fargo Funds Management, LLC, Chief Legal Counsel of Wells Fargo Asset Management and Assistant General Counsel of Wells Fargo Bank, N.A. since 2018. Associate General Counsel and Managing Director of Bank of America Corporation from 2004 to 2018. | ||
| Catherine Kennedy (Born 1969) | Secretary, since 2019 | Vice President of Wells Fargo Funds Management, LLC and Senior Counsel of the Wells Fargo Legal Department since 2010. Vice President and Senior Counsel of Evergreen Investment Management Company, LLC from 1998 to 2010. | ||
| Michael H. Whitaker (Born 1967) | Chief Compliance Officer, since 2016 | Chief Compliance Officer of Wells Fargo Asset Management since 2016. Senior Vice President and Chief Compliance Officer for Fidelity Investments from 2007 to 2016. | ||
David Berardi (Born 1975) | Assistant Treasurer, since 2009 | Vice President of Wells Fargo Funds Management, LLC since 2009. Vice President of Evergreen Investment Management Company, LLC from 2008 to 2010. Manager of Fund Reporting and Control for Evergreen Investment Management Company, LLC from 2004 to 2010. | ||
| 1 | Jeremy DePalma acts as Treasurer of 82 funds and Assistant Treasurer of 65 funds in the Fund Complex. |
| 2 | The Statement of Additional Information includes additional information about the Trustees and is available, without charge, upon request, by calling 1-800-222-8222 or by visiting the website at wfam.com. |
Wells Fargo Growth Fund | 33
Table of Contents
Other information (unaudited)
BOARD CONSIDERATION OF INVESTMENT MANAGEMENT AND SUB-ADVISORY AGREEMENTS:
Wells Fargo Growth Fund
Under the Investment Company Act of 1940 (the “1940 Act”), the Board of Trustees (the “Board”) of Wells Fargo Funds Trust (the “Trust”) must determine annually whether to approve the continuation of the Trust’s investment management and sub-advisory agreements. In this regard, at a Board meeting held on May 26, 2020 and May 28, 2020 (together, the “Meeting”), the Board, all the members of which have no direct or indirect interest in the investment management and sub-advisory agreements and are not “interested persons” of the Trust, as defined in the 1940 Act (the “Independent Trustees”), reviewed and approved for Wells Fargo Growth Fund (the “Fund”): (i) an investment management agreement (the “Management Agreement”) with Wells Fargo Funds Management, LLC (“Funds Management”); and (ii) an investment sub-advisory agreement (the “Sub-Advisory Agreement”) with Wells Capital Management Incorporated (the “Sub-Adviser”), an affiliate of Funds Management. The Management Agreement and the Sub-Advisory Agreement are collectively referred to as the “Advisory Agreements.”
At the Meeting, the Board considered the factors and reached the conclusions described below relating to the selection of Funds Management and the Sub-Adviser and the approval of the Advisory Agreements. Prior to the Meeting, including at a Board meeting held in April 2020, the Trustees conferred extensively among themselves and with representatives of Funds Management about these matters. Also, the Board has adopted a team-based approach, with each team consisting of a sub-set of Trustees, to assist the full Board in the discharge of its duties in reviewing investment performance and other matters throughout the year. The Independent Trustees were assisted in their evaluation of the Advisory Agreements by independent legal counsel, from whom they received separate legal advice and with whom they met separately.
In providing information to the Board, Funds Management and the Sub-Adviser were guided by a detailed set of requests for information submitted to them by independent legal counsel on behalf of the Independent Trustees at the start of the Board’s annual contract renewal process earlier in 2020. In considering and approving the Advisory Agreements, the Trustees considered the information they believed relevant, including but not limited to the information discussed below. The Board considered not only the specific information presented in connection with the Meeting, but also the knowledge gained over time through interaction with Funds Management and the Sub-Adviser about various topics. In this regard, the Board reviewed reports of Funds Management at each of its quarterly meetings, which included, among other things, portfolio reviews and investment performance reports. In addition, the Board and the teams mentioned above confer with portfolio managers at various times throughout the year. The Board did not identify any particular information or consideration that was all-important or controlling, and each individual Trustee may have attributed different weights to various factors.
After its deliberations, the Board unanimously approved the continuation of the Advisory Agreements for a one-year term and determined that the compensation payable to Funds Management and the Sub-Adviser under each of the Advisory Agreements was reasonable. The Board considered the approval of the Advisory Agreements for the Fund as part of its consideration of agreements for funds across the complex, but its approvals were made on a fund-by-fund basis. The following summarizes a number of important, but not necessarily all, factors considered by the Board in support of its approvals.
Nature, extent and quality of services
The Board received and considered various information regarding the nature, extent and quality of services provided to the Fund by Funds Management and the Sub-Adviser under the Advisory Agreements. This information included a description of the investment advisory services and Fund-level administrative services covered by the Management Agreement, as well as, among other things, a summary of the background and experience of senior management of Wells Fargo Asset Management (“WFAM”), of which Funds Management and the Sub-Adviser are a part, and a summary of investments made in the business of WFAM. The Board also received a description of Funds Management’s and the Sub-Adviser’s business continuity plans and of their approaches to data privacy and cybersecurity, and related testing. The Board also received and reviewed information about Funds Management’s role as administrator of the Fund’s liquidity risk management program, Funds Management’s approach to risk management, and Funds Management’s intermediary and vendor oversight program.
The Board also considered the qualifications, background, tenure and responsibilities of each of the portfolio managers primarily responsible for the day-to-day portfolio management of the Fund. The Board evaluated the ability of Funds Management and the Sub-Adviser to attract and retain qualified investment professionals, including research, advisory and supervisory personnel. The Board further considered the compliance programs and compliance records of Funds Management and the Sub-Adviser. In addition, the Board took into account the full range of services provided to the Fund by Funds Management and its affiliates.
34 | Wells Fargo Growth Fund
Table of Contents
Other information (unaudited)
Fund investment performance and expenses
The Board considered the investment performance results for the Fund over various time periods ended December 31, 2019. The Board also considered more current results for various time periods ended March 31, 2020. The Board considered these
results in comparison to the investment performance of funds in a universe that was determined by Broadridge Inc. (“Broadridge”) to be similar to the Fund (the “Universe”), and in comparison to the Fund’s benchmark index and to other comparative data. Broadridge is an independent provider of investment company data. The Board received a description of the methodology used by Broadridge to select the mutual funds in the performance Universe. The Board noted that the investment performance of the Fund (Administrator Class) was higher than the average investment performance of the Universe for the one-, three-, five- and ten-year periods ended December 31, 2019. The Board also noted that the investment performance of the Fund (Administrator Class) was higher than the average investment performance of the Universe for all periods ended March 31, 2020. The Board also noted that the investment performance of the Fund was higher than its benchmark index, the Russell 3000 Growth® Index, for the one-, three- and ten-year periods ended December 31, 2019, and lower than its benchmark index for the five-year period ended December 31, 2019. The Board also noted that the investment performance of the Fund was lower than its benchmark index, the Russell 3000 Growth® Index, for the one- and five -year periods ended March 31, 2020, and higher than its benchmark index for the three- and ten-year periods ended March 31, 2020.
The Board also received and considered information regarding the Fund’s net operating expense ratios and their various components, including actual management fees, custodian and other non-management fees, and Rule 12b-1 and non-Rule 12b-1 shareholder service fees. The Board considered these ratios in comparison to the median ratios of funds in class-specific expense groups that were determined by Broadridge to be similar to the Fund (the “Groups”). The Board received a description of the methodology used by Broadridge to select the mutual funds in the expense Groups and an explanation of how funds comprising expense groups and their expense ratios may vary from year-to-year. Based on the Broadridge reports, the Board noted that the net operating expense ratios of the Fund were equal to or in range of the median net operating expense ratios of the expense Groups for each share class.
The Board took into account the Fund’s investment performance and expense information provided to it among the factors considered in deciding to re-approve the Advisory Agreements.
Investment management and sub-advisory fee rates
The Board reviewed and considered the contractual fee rates payable by the Fund to Funds Management under the Management Agreement, as well as the contractual fee rates payable by the Fund to Funds Management for class-level administrative services under a Class-Level Administration Agreement, which include, among other things, class-level transfer agency and sub-transfer agency costs (collectively, the “Management Rates”). The Board also reviewed and considered the contractual investment sub-advisory fee rates that are payable by Funds Management to the Sub-Adviser for investment sub-advisory services.
Among other information reviewed by the Board was a comparison of the Fund’s Management Rates with the average contractual investment management fee rates of funds in the expense Groups at a common asset level as well as transfer agency costs of the funds in the expense Groups. The Board noted that the Management Rates of the Fund were higher than the sum of these average rates for the Fund’s expense Groups for Class A and Administrator Class, and in range of the sum of these average rates for the Fund’s expense Groups for the Institutional Class and Class R6. However, the Board noted that the net operating expense ratios of the Fund were equal to or in range of the median net operating expense ratios of the expense Groups for each share class.
The Board also received and considered information about the portion of the total management fee that was retained by Funds Management after payment of the fee to the Sub-Adviser for sub-advisory services. In assessing the reasonableness of this amount, the Board received and evaluated information about the nature and extent of responsibilities retained and risks assumed by Funds Management and not delegated to or assumed by the Sub-Adviser, and about Funds Management’s on-going oversight services. Given the affiliation between Funds Management and the Sub-Adviser, the Board ascribed limited relevance to the allocation of fees between them.
The Board also received and considered information about the nature and extent of services offered and fee rates charged by Funds Management and the Sub-Adviser to other types of clients with investment strategies similar to those of the Fund. In this regard, the Board received information about the significantly greater scope of services, and compliance, reporting and other legal burdens and risks of managing proprietary mutual funds compared with those associated with managing assets of other types of clients, including third-party sub-advised fund clients and non-mutual fund clients such as institutional separate accounts.
Wells Fargo Growth Fund | 35
Table of Contents
Other information (unaudited)
Based on its consideration of the factors and information it deemed relevant, including those described here, the Board determined that the compensation payable to Funds Management under the Management Agreement and to the Sub-Adviser under the Sub-Advisory Agreement was reasonable.
Profitability
The Board received and considered information concerning the profitability of Funds Management, as well as the profitability of both WFAM and Wells Fargo & Co. (“Wells Fargo”) from providing services to the fund family as a whole. The Board noted that the Sub-Adviser’s profitability information with respect to providing services to the Fund and other funds in the family was subsumed in the WFAM and Wells Fargo profitability analysis.
Funds Management reported on the methodologies and estimates used in calculating profitability, including a description of the methodology used to allocate certain expenses. Among other things, the Board noted that the levels of profitability reported on a fund-by-fund basis varied widely, depending on factors such as the size, type and age of fund.
Based on its review, the Board did not deem the profits reported by Funds Management, WFAM or Wells Fargo from services provided to the Fund to be at a level that would prevent it from approving the continuation of the Advisory Agreements.
Economies of scale
The Board received and considered information about the potential for Funds Management to experience economies of scale in the provision of management services to the Fund, the difficulties of calculating economies of scale at an individual fund level, and the extent to which potential scale benefits are shared with shareholders. The Board noted the existence of breakpoints in the Fund’s management fee structure, which operate generally to reduce the Fund’s expense ratios as the Fund grows in size, and the size of the Fund in relation to such breakpoints. The Board considered that in addition to management fee breakpoints, Funds Management shares potential economies of scale from its management business in a variety of ways, including through fee waiver and expense reimbursement arrangements, services that benefit shareholders, competitive management fee rates set at the outset without regard to breakpoints, and investments in the business intended to enhance services available to shareholders.
The Board concluded that Funds Management’s arrangements with respect to the Fund, including contractual breakpoints, constituted a reasonable approach to sharing potential economies of scale with the Fund and its shareholders.
Other benefits to Funds Management and the Sub-Adviser
The Board received and considered information regarding potential “fall-out” or ancillary benefits received by Funds Management and its affiliates, including the Sub-Adviser, as a result of their relationships with the Fund. Ancillary benefits could include, among others, benefits directly attributable to other relationships with the Fund and benefits potentially derived from an increase in Funds Management’s and the Sub-Adviser’s business as a result of their relationships with the Fund. The Board noted that various affiliates of Funds Management may receive distribution-related fees, shareholder servicing payments and sub-transfer agency fees in respect of shares sold or held through them and services provided.
The Board also reviewed information about soft dollar credits earned and utilized by the Sub-Adviser, fees earned by Funds Management and the Sub-Adviser from managing a private investment vehicle for the fund family’s securities lending collateral, and commissions earned by an affiliated broker from portfolio transactions.
Based on its consideration of the factors and information it deemed relevant, including those described here, the Board did not find that any ancillary benefits received by Funds Management and its affiliates, including the Sub-Adviser, were unreasonable.
Conclusion
At the Meeting, after considering the above-described factors and based on its deliberations and its evaluation of the information described above, the Board unanimously approved the continuation of the Advisory Agreements for a one-year term and determined that the compensation payable to Funds Management and the Sub-Adviser under each of the Advisory Agreements was reasonable.
36 | Wells Fargo Growth Fund
Table of Contents
Other information (unaudited)
LIQUIDITY RISK MANAGEMENT PROGRAM
In accordance with Rule 22e-4 under the Investment Company Act of 1940, as amended (the “Liquidity Rule”), Wells Fargo Funds Trust (the “Trust”) has adopted and implemented a liquidity risk management program (the “Program”) on behalf of each of its series, including the Fund, which is reasonably designed to assess and manage theFund’s liquidity risk. “Liquidity risk” is defined as the risk that theFund is unable to meet redemption requests without significantly diluting remaining investors’ interests in the Fund. The Trust’s Board of Trustees (the “Board”) previously approved the designationof Wells Fargo Funds Management, LLC (“Funds Management”), theFund’s investment manager, as the administrator of the Program, and Funds Management has established a Liquidity Risk Management Council composed of personnel from multiple departments within Funds Management and its affiliates to assist Funds Management in the implementationand on-going administration of the Program.
The Program is comprised of various components designed to support the assessment and/or management of liquidity risk, including: (1) the periodic assessment (no less frequently than annually) of certain factors that influence the Fund’s liquidity risk; (2) the periodic classification (no less frequently than monthly) of the Fund’s investments into one of four liquidity categories that reflect an estimate of their liquidity under current market conditions; (3) a 15% limit on the acquisition of “illiquid investments” (as defined under the Liquidity Rule); (4) to the extent the Fund does not invest primarily in “highly liquid investments” (as defined under the Liquidity Rule), the determination of a minimum percentage of the Fund’s assets that generally will be invested in highly liquid investments (an “HLIM”); (5) if the Fund has established an HLIM, the periodic review (no less frequently than annually) of the HLIM and the adoption of policies and procedures for responding to a shortfall of the Fund’s “highly liquid investments” below its HLIM; and (6) periodic reporting to the Board.
At a meeting of the Board held on May 26 and 28, 2020, the Board received a written report (the “Report”) from Funds Management that addressed the operation of the Program and assessed its adequacy and effectiveness of implementation. The Report covered the initial period from December 1, 2018 through December 31, 2019 (the “Reporting Period”). No significant liquidity events impacting the Fund were noted in the Report. There were no material changes to the Program during the Reporting Period.The Report concluded that the Program is operating effectively to assess and manage the Fund’s liquidity risk, and that the Program has been and continues to be adequately and effectively implemented to monitor and, as applicable, respond to the Fund’s liquidity developments.
There can be no assurance that the Program will achieve its objectives under all circumstances in the future. Please refer to theFund’s prospectus for more information regarding the Fund’s exposure to liquidity risk and other risks to which an investment in the Fund may be subject.
Wells Fargo Growth Fund | 37
Table of Contents
Effective on or after May 1, 2020, clients of Edward Jones (also referred to as “shareholders”) purchasing Fund shares onthe Edward Jones commission and fee-based platforms are eligible only for the following sales charge discounts (alsoreferred to as “breakpoints”) and waivers, which can differ from breakpoints and waivers described elsewhere in the Fund’sProspectus or SAI or through another broker-dealer. In all instances, it is the shareholder’s responsibility to inform EdwardJones at the time of purchase of any relationship, holdings of Wells Fargo Funds or other facts qualifying the purchaser forbreakpoints or waivers. Edward Jones can ask for documentation of such circumstance.
| Breakpoints available at Edward Jones |
| Rights of Accumulation (ROA) |
The applicable sales charge on a purchase of Class A shares is determined by taking into account all share classes (except anymoney market funds and retirement plan share classes) of Wells Fargo Funds held by the shareholder or in an account groupedby Edward Jones with other accounts for the purpose of providing certain pricing considerations (“pricing groups”). This includesall share classes held on the Edward Jones platform and/or held on another platform. The inclusion of eligible fund family assetsin the rights of accumulation calculation is dependent on the shareholder notifying his or her financial advisor of such assets atthe time of calculation. |
ROA is determined by calculating the higher of cost or market value (current shares x NAV). |
| Letter of Intent (LOI) |
Through a LOI, shareholders can receive the sales charge and breakpoint discounts for purchases shareholders intend to makeover a 13-month period from the date Edward Jones receives the LOI. The LOI is determined by calculating the higher of cost ormarket value of qualifying holdings at LOI initiation in combination with the value that the shareholder intends to buy over a13-month period to calculate the front-end sales charge and any breakpoint discounts. Each purchase the shareholder makesduring that 13-month period will receive the sales charge and breakpoint discount that applies to the total amount. Theinclusion of eligible fund family assets in the LOI calculation is dependent on the shareholder notifying his or her financialadvisor of such assets at the time of calculation. Purchases made before the LOI is received by Edward Jones are not coveredunder the LOI and will not reduce the sales charge previously paid. Sales charges will be adjusted if LOI is not met. |
| Sales charges are waived for the following shareholders and in the following situations at Edward Jones: |
● Associates of Edward Jones and its affiliates and their family members who are in the same pricing group (as determined by Edward Jones under its policies and procedures) as the associate.This waiver will continue for the remainder of the associate’slife if the associate retires from Edward Jones in good-standing. |
● Shares purchased in an Edward Jones fee-based program. |
● Shares purchased through reinvestment of capital gains distributions and dividend reinvestment. |
● Shares purchased from the proceeds of redeemed shares of the same fund family so long as the following conditions are met: 1)the proceeds are from the sale of shares within 60 days of the purchase, and 2) the sale and purchase are made in the same shareclass and the same account or the purchase is made in an individual retirement account with proceeds from liquidations in anon-retirement account. |
● Shares exchanged into Class A shares from another share class so long as the exchange is into the same fund and was initiated atthe discretion of Edward Jones.Edward Jones is responsible for any remaining CDSC due to the fund company, if applicable. Anyfuture purchases are subject to the applicable sales charge as disclosed in the prospectus. |
● Exchanges from Class C shares to Class A shares of the same fund, generally, in the 84th month following the anniversary of thepurchase date or earlier at the discretion of Edward Jones. |
| If the shareholder purchases shares that are subject to a CDSC and those shares are redeemed before the CDSC isexpired, the shareholder is responsible to pay the CDSC except in the following conditions available at Edward Jones: |
● The death or disability of the shareholder. |
● Systematic withdrawals with up to 10% per year of the account value. |
● Return of excess contributions from an Individual Retirement Account (IRA). |
● Shares sold as part of a required minimum distribution for IRA and retirement accounts if the redemption is taken in or after theyear the shareholder reaches qualified age based on applicable IRS regulation. |
● Shares sold to pay Edward Jones fees or costs in such cases where the transaction is initiated by Edward Jones. |
● Shares exchanged in an Edward Jones fee-based program. |
● Shares acquired through NAV reinstatement. |
38 | Wells Fargo Growth Fund
Table of Contents
Appendix I (unaudited)
| Other Important Information for accounts at Edward Jones: |
| Minimum Purchase Amounts |
● $250 initial purchase minimum |
● $50 subsequent purchase minimum |
| Minimum Balances |
| Edward Jones has the right to redeem at its discretion fund holdings with a balance of $250 or less. The following are examplesof accounts that are not included in this policy: |
● A fee-based account held on an Edward Jones platform |
● A 529 account held on an Edward Jones platform |
● An account with an active systematic investment plan or letter of intent (LOI) |
| Changing Share Classes |
| At any time it deems necessary, Edward Jones has the authority to exchange at NAV a shareholder’s holdings in a fund to ClassA shares. |
Wells Fargo Growth Fund | 39
Table of Contents
Effective June 1, 2020, shareholders purchasing Fund shares through an Oppenheimer & Co. Inc. (“Oppenheimer”)platform or account are eligibleonly for the following load waivers (front-end sales charge waivers and contingent deferred or back-end, sales chargewaivers) and discounts, which may differ from those disclosed in theFund’s Prospectus or SAI.
| Front-end Sales Load Waivers on Class A Shares available at Oppenheimer |
| Employer-sponsored retirement, deferred compensation and employee benefit plans (including health savings accounts) and trusts used to fund those plans, provided that the shares are not held in a commission-based brokerage account and shares are held for the benefit of the plan. |
| Shares purchased by or through a 529 Plan. |
| Shares purchased through an Oppenheimer affiliated investment advisory program. |
| Shares purchased through reinvestment of capital gains distributions and dividend reinvestment when purchasing shares of the same fund (but not any other fund within the fund family). |
| Shares purchased from the proceeds of redemptions within the same fund family, provided (1) the repurchase occurs within 90 days following the redemption, (2) the redemption and purchase occur in the same account, and (3) redeemed shares were subject to a front-end or deferred sales load (known as Rights of Restatement). |
| A shareholder in the Fund’s Class C shares will have their shares exchanged at net asset value to Class A shares (or the appropriate share class) of the Fund if the shares are no longer subject to a CDSC and the exchange is in line with the policies and procedures of Oppenheimer. |
| Employees and registered representatives of Oppenheimer or its affiliates and their family members. |
| Directors or Trustees of the Fund, and employees of the Fund’s investment adviser or any of its affiliates, as described in the Prospectus. |
| CDSC Waivers on A and C Shares available at Oppenheimer |
| Death or disability of the shareholder. |
| Shares sold as part of a systematic withdrawal plan as described in the Prospectus. |
| Return of excess contributions from an IRA Account. |
| Shares sold as part of a required minimum distribution for IRA and retirement accounts due to the shareholder reaching the qualified age based on applicable IRS regulations as described in the Prospectus. |
| Shares sold to pay Oppenheimer fees but only if the transaction is initiated by Oppenheimer. |
| Shares acquired through a right of reinstatement. |
| Front-end load Discounts Available at Oppenheimer: Breakpoints, Rights of Accumulation & Letters of Intent |
| Breakpoints as described in the Prospectus. |
| Rights of Accumulation (ROA), which entitle shareholders to breakpoint discounts, will be automatically calculated based on the aggregated holding of fund family assets held by accounts within the purchaser’s household at Oppenheimer. Eligible fund family assets not held at Oppenheimer may be included in the ROA calculation only if the shareholder notifies his or her financial advisor about such assets. |
40 | Wells Fargo Growth Fund
Table of Contents
Effective June 15, 2020, shareholders purchasing fund shares through a Robert W. Baird & Co. (“Baird”) platform or account will only be eligible for the following sales charge waivers (front-end sales charge waivers and CDSC waivers) and discounts, which may differ from those disclosed elsewhere in the Fund’s Prospectus or the SAI.
| Front-end Sales Load Waivers on Class A Shares available at Baird |
| Shares purchased through reinvestment of capital gains distributions and dividend reinvestment when purchasing share of the same fund. |
| Share purchase by employees and registers representatives of Baird or its affiliate and their family members as designated by Baird. |
| Shares purchase from the proceeds of redemptions within the same fund family, provided (1) the repurchase occurs within 90 days following the redemption, (2) the redemption and purchase occur in the same accounts, and (3) redeemed shares were subject to a front-end or deferred sales charge (known as rights of reinstatement). |
| A shareholder in the Funds Investor C Shares will have their share exchanged at net asset value to Investor A shares of the fund if the shares are no longer subject to CDSC and the exchange is in line with the policies and procedures of Baird. |
| Employer-sponsored retirement plans or charitable accounts in a transactional brokerage account at Baird, including 401(k)plans, 457 plans, employer-sponsored 403(b) plans, profit sharing and money purchase pension plans and defined benefit plans. For purposes of this provision, employer-sponsored retirement plans do not include SEP IRAs, Simple IRAs or SAR-SEPs. |
| CDSC Waivers on A and C Shares available at Baird |
| Shares sold due to death or disability of the shareholder. |
| Shares sold as part of a systematic withdrawal plan as described in the Fund’s Prospectus. |
| Shares bought due to returns of excess contributions from an IRA Account. |
| Shares sold as part of a required minimum distribution for IRA and retirement accounts due to the shareholder reaching age 72as described in the Fund’s Prospectus. |
| Shares sold to pay Baird fees but only if the transaction is initiated by Baird. |
| Shares acquired through a right of reinstatement. |
| Front-end load Discounts Available at Baird: Breakpoint and/or Rights of Accumulation |
| Breakpoints as described in the Prospectus. |
| Rights of accumulations which entitles shareholders to breakpoint discounts will be automatically calculated based on the aggregated holding of fund family assets held by accounts within the purchaser’s household at Baird. Eligible fund family assets not held at Baird may be included in the rights of accumulations calculation only if the shareholder notifies his or her financial advisor about such assets. |
| Letters of Intent (LOI) allow for breakpoint discounts based on anticipated purchases within a fund family through Baird, over a13-month period of time. |
Wells Fargo Growth Fund | 41
Table of Contents
This page is intentionally left blank.
Table of Contents
This page is intentionally left blank.
Table of Contents
This page is intentionally left blank.
Table of Contents
For more information
More information about Wells Fargo Funds is available free upon request. To obtain literature, please write, visit the Fund’s website, or call:
Wells Fargo Funds
P.O. Box 219967
Kansas City, MO 64121-9967
Website: wfam.com
Individual investors: 1-800-222-8222
Retail investment professionals: 1-888-877-9275
Institutional investment professionals: 1-866-765-0778

This report and the financial statements contained herein are submitted for the general information of the shareholders of the Fund. If this report is used for promotional purposes, distribution of the report must be accompanied or preceded by a current prospectus. Before investing, please consider the investment objectives, risks, charges, and expenses of the investment. For a current prospectus and, if available, a summary prospectus, containing this information, call 1-800-222-8222 or visit the Fund’s website at wfam.com. Read the prospectus carefully before you invest or send money.
Wells Fargo Asset Management (WFAM) is the trade name for certain investment advisory/management firms owned by Wells Fargo & Company. These firms include but are not limited to Wells Capital Management Incorporated and Wells Fargo Funds Management, LLC. Certain products managed by WFAM entities are distributed by Wells Fargo Funds Distributor, LLC (a broker-dealer and Member FINRA).
This material is for general informational and educational purposes only and is NOT intended to provide investment advice or a recommendation of any kind—including a recommendation for any specific investment, strategy, or plan.
INVESTMENT PRODUCTS: NOT FDIC INSURED ◾ NO BANK GUARANTEE ◾ MAY LOSE VALUE
© 2020 Wells Fargo & Company. All rights reserved
PAR-0820-01036 09-20
A206/AR206 07-20
Table of Contents

Annual Report
July 31, 2020
Wells Fargo Large Cap Core Fund
Beginning on January 1, 2021, as permitted by new regulations adopted by the Securities and Exchange Commission, paper copies of the Wells Fargo Funds’ annual and semi-annual shareholder reports issued after this date will no longer be sent by mail, unless you specifically request paper copies of the reports. Instead, the reports will be made available on the Funds’ website, and you will be notified by mail each time a report is posted and provided with a website address to access the report.
If you already elected to receive shareholder reports electronically, you will not be affected by this change and you need not take any action. You may elect to receive shareholder reports and other communications from the Fund electronically at any time by contacting your financial intermediary (such as a broker-dealer or bank) or, if you are a direct investor, by calling 1-800-222-8222 or by enrolling at wellsfargo.com/advantagedelivery.
You may elect to receive all future reports in paper free of charge. If you invest through a financial intermediary, you can contact your financial intermediary to request that you continue to receive paper copies of your shareholder reports; if you invest directly with the Fund, you can call 1-800-222-8222. Your election to receive reports in paper will apply to all Wells Fargo Funds held in your account with your financial intermediary or, if you are a direct investor, to all Wells Fargo Funds that you hold.
Table of Contents
|
Reduce clutter. Save trees. |
Sign up for |
The views expressed and any forward-looking statements are as of July 31, 2020, unless otherwise noted, and are those of the Fund managers and/or Wells Fargo Asset Management. Discussions of individual securities, or the markets generally, or any Wells Fargo Fund are not intended as individual recommendations. Future events or results may vary significantly from those expressed in any forward-looking statements. The views expressed are subject to change at any time in response to changing circumstances in the market. Wells Fargo Asset Management and the Fund disclaim any obligation to publicly update or revise any views expressed or forward-looking statements.
INVESTMENT PRODUCTS: NOT FDIC INSURED ◾ NO BANK GUARANTEE ◾ MAY LOSE VALUE
Wells Fargo Large Cap Core Fund | 1
Table of Contents
Letter to shareholders (unaudited)

Andrew Owen
President
Wells Fargo Funds
Dear Shareholder:
We are pleased to offer you this annual report for the Wells Fargo Large Cap Core Fund for the 12-month period that ended July 31, 2020. Global stock markets saw earlier gains erased in February and March as governments around the world took unprecedented measures, attempting to stop the spread of the coronavirus at the expense of short-term economic output. However, markets rebounded from April on to offset much of the losses as central banks attempted to bolster capital markets and confidence. Fixed-income markets generally performed well overall, achieving widespread gains. Overall, U.S. stocks surpassed their international peers, while U.S. large-cap equity, as measured by the Russell 1000® Index1, easily outperformed small caps, as measured by the Russell 2000® Index2, for the 12-month period that began last August.
For the 12-month period, fixed-income securities generally had positive total returns while non-U.S. developed market equities had the weakest performance and U.S. stocks performed strongly despite sharp volatility in the late winter and early spring. For the period, U.S. stocks, based on the S&P 500 Index,3 gained 11.96%. International stocks, as measured by the MSCI ACWI ex USA Index (Net),4 returned 0.66%, while the MSCI EM Index (Net)5 had somewhat stronger performance, with a 6.55% gain. For bond investors, the Bloomberg Barclays U.S. Aggregate Bond Index6 returned a robust 10.12%, the Bloomberg Barclays Global Aggregate ex-USD Index7 gained a more modest 5.94%, and the Bloomberg Barclays Municipal Bond Index8 gained 5.36% while the ICE BofA U.S. High Yield Index9 returned 3.10%.
The fiscal year began with supportive central bank actions.
The period began with unresolved U.S.-China trade tensions showing no signs of compromise in August 2019. Evidence of a continued global economic slowdown mounted, and central banks in China, New Zealand, and Thailand cut interest rates after the U.S. Federal Reserve (Fed) had done so in late July. Industrial and manufacturing data declined in China, Canada, Japan, and Germany. Adding to global uncertainty, Italy’s prime minister resigned, many feared a crackdown in Hong Kong as protestors sustained their calls for reform, and U.K. Prime Minister Boris Johnson planned to suspend Parliament as Brexit’s deadline neared.
| 1 | The Russell 1000® Index measures the performance of the 1,000 largest companies in the Russell 3000® Index, which represents approximately 92% of the total market capitalization of the Russell 3000® Index. You cannot invest directly in an index. |
| 2 | The Russell 2000® Index measures the performance of the 2,000 smallest companies in the Russell 3000® Index, which represents approximately 8% of the total market capitalization of the Russell 3000® Index. You cannot invest directly in an index. |
| 3 | The S&P 500 Index consists of 500 stocks chosen for market size, liquidity, and industry group representation. It is a market-value-weighted index with each stock’s weight in the index proportionate to its market value. You cannot invest directly in an index. |
| 4 | The Morgan Stanley Capital International (MSCI) All Country World Index (ACWI) ex USA Index (Net) is a free-float-adjusted market-capitalization-weighted index that is designed to measure the equity market performance of developed and emerging markets, excluding the United States. Source: MSCI. MSCI makes no express or implied warranties or representations and shall have no liability whatsoever with respect to any MSCI data contained herein. The MSCI data may not be further redistributed or used as a basis for other indices or any securities or financial products. This report is not approved, reviewed, or produced by MSCI. You cannot invest directly in an index. |
| 5 | The MSCI Emerging Markets (EM) Index (Net) is a free-float-adjusted market-capitalization-weighted index that is designed to measure equity market performance of emerging markets. You cannot invest directly in an index. |
| 6 | The Bloomberg Barclays U.S. Aggregate Bond Index is a broad-based benchmark that measures the investment-grade, U.S. dollar-denominated, fixed-rate taxable bond market, including Treasuries, government-related and corporate securities, mortgage-backed securities (agency fixed-rate and hybrid adjustable-rate mortgage pass-throughs), asset-backed securities, and commercial mortgage-backed securities. You cannot invest directly in an index. |
| 7 | The Bloomberg Barclays Global Aggregate ex-USD Index is an unmanaged index that provides a broad-based measure of the global investment-grade fixed-income markets excluding the U.S.-dollar-denominated debt market. You cannot invest directly in an index. |
| 8 | The Bloomberg Barclays Municipal Bond Index is an unmanaged index composed of long-term tax-exempt bonds with a minimum credit rating of Baa. You cannot invest directly in an index. |
| 9 | The ICE BofA U.S. High Yield Index is a market-capitalization-weighted index of domestic and Yankee high-yield bonds. The index tracks the performance of high-yield securities traded in the U.S. bond market. You cannot invest directly in an index. Copyright 2020. ICE Data Indices, LLC. All rights reserved. |
2 | Wells Fargo Large Cap Core Fund
Table of Contents
Letter to shareholders (unaudited)
In the U.S., the Fed cut interest rates again in September. U.S. manufacturing data disappointed investors. The U.S. Congress announced it would pursue an impeachment investigation of President Trump. Meanwhile, the Brexit impasse showed no signs of resolution. Officials in China said that hitting the country’s economic growth goals for the year would be difficult considering the weight of tariffs and trade restrictions. Although the S&P 500 Index finished the third quarter with the best year-to-date returns in more than 20 years, concerns about future returns remained.
The fourth quarter started on a strong note, with U.S.-China trade tensions relaxing in October along with renewed optimism for a U.K. Brexit deal and positive macroeconomic data. The initial estimate of U.S. third-quarter gross domestic product (GDP) growth was a resilient 1.9% annualized rate, while the U.S. unemployment rate fell to a 50-year low of 3.5% in September. However, despite strength among U.S. consumers, business confidence declined while manufacturing activity contracted. Concerned with a potential economic slowdown, the Fed lowered interest rates another quarter point in late October—its third rate cut in four months. This helped push the S&P 500 Index to an all-time high while emerging market equities rallied and global bonds declined overall, reflecting a broad pickup in risk appetite.
Equity markets continued to rally in November despite ongoing geopolitical risks. Hopes for a U.S.-China trade deal buoyed investor confidence. U.S. business sentiment improved slightly, and manufacturing and services activity picked up. While consumer confidence and purchasing managers’ activity rose in the eurozone, China reported weakening manufacturing and consumer data. Bond yields rose marginally, leading to slightly negative returns for global government and investment-grade corporate bonds.
Financial markets ended 2019 with a boost from the U.S. and China accord on a Phase One trade deal. That, along with the landslide win by the pro-Brexit U.K. Conservative Party in a national election and ongoing central bank support, gave investors greater confidence. U.S. economic indicators were generally positive, with the exception of manufacturing activity and business confidence. Consumer confidence was resilient, fed by a robust labor market, tame inflation, and lower interest rates, which boosted housing affordability and stimulated homebuyer activity. The impeachment of President Trump had little impact on markets. Meanwhile, slowing Chinese economic activity, partly attributable to the trade war, led to further government stimulus at year-end through lower reserve ratios, allowing banks to lend more money.
The year-end rally continued in early January 2020. However, capital market volatility picked up sharply in late January on concerns over the potential impact of the coronavirus on the global economy and stock markets. With sentiment somewhat souring, perceived safe havens did well in January. The U.S. dollar and Japanese yen both rose, and government bonds outperformed equities. While the S&P 500 Index held its ground, emerging market equities tumbled, including those in Asia.
In February, the coronavirus became the major market focus. Fears of the virus’s impact on global growth led to expectations of increased global central bank monetary policy support. That led the 10-year U.S. Treasury yield to fall to an all-time low of 1.1%. Although equity markets initially shrugged off concerns about the outbreak, focusing instead on strong fourth-quarter earnings and improving business confidence in January, market sentiment turned sharply lower and the S&P 500 Index lost 8.2% for the month. Oil prices tumbled as Russia and the Organization of the Petroleum Exporting Countries compounded a major decline in oil demand with a brutal price war, partly aimed at dissuading further U.S. shale production, causing the price of West Texas Intermediate crude oil to plummet.
Wells Fargo Large Cap Core Fund | 3
Table of Contents
Letter to shareholders (unaudited)
“The global spread of the coronavirus led country after country to clamp down on social and business-related activity in order to contain the virus from causing even greater devastation and overwhelming health care systems.”
“Financial markets posted widely positive returns in June despite ongoing economic weakness and high levels of uncertainty on the containment of the coronavirus and the timing of an effective vaccine.”
The global spread of the coronavirus led country after country to clamp down on social and business-related activity in order to contain the virus from causing even greater devastation and overwhelming health care systems. This abrupt stoppage of economic activity led to the sharp deceleration of global output, sending economies into a deep contraction. Central banks responded swiftly, slashing interest rates and expanding quantitative easing programs to restore liquidity and confidence to the markets. In the U.S., the Fed introduced several new lending programs, funding investment-grade bonds, money market mutual funds, and commercial paper while purchasing Treasuries, mortgage-backed securities, and overnight repurchase agreements. Meanwhile, stock markets tumbled quickly into a bear market, ending the longest bull stock market in U.S. history.
Markets rebounded strongly in April, fueled by unprecedented government and central bank stimulus measures. The U.S. economy contracted by an annualized 5.0% pace in the first quarter, with 30 million new unemployment insurance claims in six weeks. In the eurozone, first-quarter real GDP shrank 3.8%, with the composite April Flash Purchasing Managers’ Index, a monthly survey of purchasing managers, falling to an all-time low of 13.5. The European Central Bank expanded its quantitative easing to include the purchase of additional government bonds of countries with the greatest virus-related need, including Italy and Spain. China’s first-quarter GDP fell by 6.8% year over year. However, retail sales, production, and investment showed signs of recovery. Extreme oil-price volatility continued as global supply far exceeded demand.
In May, the global equity market rebound continued, with widespread strong monthly gains. Investors regained confidence on reports of early signs of success in human trials of a coronavirus vaccine. Growth stocks continued to outperform value stocks while returns on global government bonds were generally flat. In the U.S., a gap grew between the stock market rebound and devastating economic data points, including an April unemployment rate of 14.7%, the highest level since World War II. Purchasing managers’ indices reflected weakening activity in May in both the manufacturing and services sectors. U.S. corporate earnings reports indicated a 14% year-over-year contraction in earnings from the first quarter of 2019. However, high demand for technology, driven by remote activity, supported robust information technology sector earnings, which helped drive major technology stocks higher.
Financial markets posted widely positive returns in June despite ongoing economic weakness and high levels of uncertainty on the containment of the coronavirus and the timing of an effective vaccine. There were hopeful signs as economies reopened, with both U.S. and U.K. retail sales rebounding substantially in May. However, year over year, sales remained depressed. Vitally important to market sentiment was the ongoing commitment by central banks globally to do all they could to provide economic support through liquidity and low borrowing costs. U.S. economic activity was aided by one-time $1,200 stimulus checks and $600 bonus weekly unemployment benefits due to expire at the end of July. However, unemployment remained in the double digits, easing somewhat from 14.7% in April to 11.1% in June. During June, numerous states reported alarming increases of coronavirus cases. China’s economic recovery picked up momentum in June, though it remained far from a full recovery.
July was a broadly positive month for both global equities and fixed income. However, economic data and a resurgence of coronavirus cases pointed to the vulnerability of the global economy and the ongoing imperative to regain control of the pandemic. Second-quarter GDP shrank by 9.5% and 12.1% in the U.S. and eurozone, respectively, from the previous quarter. In contrast, China reported a 3.2% year-over-year expansion in its second-quarter GDP. U.S. unemployment remained historically high despite adding 1.8 million jobs in July, with a double-digit jobless rate persisting. However, manufacturing activity grew in both the U.S. and eurozone. In Asia, while China’s manufacturing sector continued to expand, activity in Japan and South Korea contracted. In July, a rising concern
4 | Wells Fargo Large Cap Core Fund
Table of Contents
Letter to shareholders (unaudited)
was the rapid and broad reemergence of coronavirus infections. Despite the ongoing promise of positive early-stage vaccine trial results, economic activity could be held back by the continued spread of the virus and the end of a widely received $600-a-week bonus unemployment benefit in late July.
Don’t let short-term uncertainty derail long-term investment goals.
Periods of investment uncertainty can present challenges, but experience has taught us that maintaining long-term investment goals can be an effective way to plan for the future. To help you create a sound strategy based on your personal goals and risk tolerance, Wells Fargo Funds offers more than 100 mutual funds spanning a wide range of asset classes and investment styles. Although diversification cannot guarantee an investment profit or prevent losses, we believe it can be an effective way to manage investment risk and potentially smooth out overall portfolio performance. We encourage investors to know their investments and to understand that appropriate levels of risk-taking may unlock opportunities.
Thank you for choosing to invest with Wells Fargo Funds. We appreciate your confidence in us and remain committed to helping you meet your financial needs.
Sincerely,

Andrew Owen
President
Wells Fargo Funds
|
For further information about your Fund, contact your investment professional, visit our website at wfam.com, or call us directly at 1-800-222-8222. |
Notice to Shareholders
At a meeting held on August 10-12, 2020, the Board of Trustees of the Fund approved a change to the Fund’s automatic conversion feature for Class C shares in order to shorten the required holding period from 10 to 8 years. As a result, on a monthly basis beginning November 5, 2020, Class C shares will convert automatically into Class A shares 8 years after the initial date of purchase or, if you acquired your Class C shares through an exchange or conversion from another share class, 8 years after the date you acquired your Class C shares. When Class C shares that you acquired through a purchase or exchange convert, any other Class C shares that you purchased with reinvested dividends and distributions also will convert into Class A shares on a pro rata basis.
Please note that a shorter holding period may apply depending on your intermediary. Please see “Appendix A—Sales Charge Reductions and Waivers for Certain Intermediaries” in the Fund’s prospectus for further information.
Wells Fargo Large Cap Core Fund | 5
Table of Contents
Performance highlights (unaudited)
Investment objective
The Fund seeks long-term capital appreciation.
Manager
Wells Fargo Funds Management, LLC
Subadviser
Wells Capital Management Incorporated
Portfolio managers
John R. Campbell, CFA®‡
Vince Fioramonti, CFA®‡*
Average annual total returns (%) as of July 31, 2020
| Including sales charge | Excluding sales charge | Expense ratios1 (%) | ||||||||||||||||||||||||||||||||
| Inception date | 1 year | 5 year | 10 year | 1 year | 5 year | 10 year | Gross | Net2 | ||||||||||||||||||||||||||
| Class A (EGOAX) | 12-17-2007 | -3.04 | 6.02 | 11.44 | 2.86 | 7.28 | 12.11 | 1.19 | 1.08 | |||||||||||||||||||||||||
| Class C (EGOCX) | 12-17-2007 | 1.01 | 6.46 | 11.26 | 2.01 | 6.46 | 11.26 | 1.94 | 1.83 | |||||||||||||||||||||||||
| Class R (EGOHX)3 | 9-30-2015 | – | – | – | 2.56 | 7.00 | 11.82 | 1.44 | 1.33 | |||||||||||||||||||||||||
| Class R6 (EGORX)4 | 9-30-2015 | – | – | – | 3.23 | 8.37 | 12.94 | 0.76 | 0.65 | |||||||||||||||||||||||||
| Administrator Class (WFLLX) | 7-16-2010 | – | – | – | 2.90 | 7.40 | 12.32 | 1.11 | 0.97 | |||||||||||||||||||||||||
| Institutional Class (EGOIX) | 12-17-2007 | – | – | – | 3.22 | 7.73 | 12.61 | 0.86 | 0.67 | |||||||||||||||||||||||||
| S&P 500 Index5 | – | – | – | – | 11.96 | 11.49 | 13.84 | – | – | |||||||||||||||||||||||||
Figures quoted represent past performance, which is no guarantee of future results, and do not reflect taxes that a shareholder may pay on an investment in a fund. Investment return and principal value of an investment will fluctuate so that an investor’s shares, when redeemed, may be worth more or less than their original cost. Performance shown without sales charges would be lower if sales charges were reflected. Current performance may be lower or higher than the performance data quoted, which assumes the reinvestment of dividends and capital gains. Current month-end performance is available on the Fund’s website, wfam.com.
Index returns do not include transaction costs associated with buying and selling securities, any mutual fund fees or expenses, or any taxes. It is not possible to invest directly in an index.
For Class A shares, the maximum front-end sales charge is 5.75%. For Class C shares, the maximum contingent deferred sales charge is 1.00%. Performance including a contingent deferred sales charge assumes the sales charge for the corresponding time period. Class R, Class R6, Administrator Class, and Institutional Class shares are sold without a front-end sales charge or contingent deferred sales charge.
Stock values fluctuate in response to the activities of individual companies and general market and economic conditions. Certain investment strategies tend to increase the total risk of an investment (relative to the broader market). The Fund is exposed to foreign investment risk and focused portfolio risk. Consult the Fund’s prospectus for additional information on these and other risks.
Please see footnotes on page 7.
6 | Wells Fargo Large Cap Core Fund
Table of Contents
Performance highlights (unaudited)
| Growth of $10,000 investment as of July 31, 20206 |
|
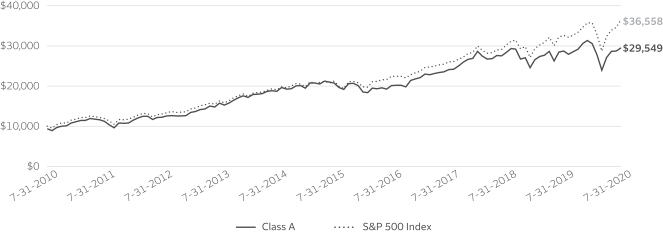
| ‡ | CFA® and Chartered Financial Analyst® are trademarks owned by CFA Institute. |
| * | Mr. Fioramonti became a portfolio manager of the Fund on October 21, 2019. |
| 1 | Reflects the expense ratios as stated in the most recent prospectuses. The expense ratios shown are subject to change and may differ from the annualized expense ratios shown in the financial highlights of this report. |
| 2 | The manager has contractually committed through November 30, 2020, to waive fees and/or reimburse expenses to the extent necessary to cap total annual fund operating expenses after fee waivers at 1.08% for Class A, 1.83% for Class C, 1.33% for Class R, 0.65% for Class R6, 0.97% for Administrator Class, and 0.67% for Institutional Class. Brokerage commissions, stamp duty fees, interest, taxes, acquired fund fees and expenses (if any), and extraordinary expenses are excluded from the expense caps. Prior to or after the commitment expiration date, the caps may be increased or the commitment to maintain the caps may be terminated only with the approval of the Board of Trustees. Without these caps, the Fund’s returns would have been lower. The expense ratio paid by an investor is the net expense ratio (the total annual fund operating expenses after fee waivers) as stated in the prospectuses. |
| 3 | Historical performance shown for the Class R shares prior to their inception reflects the performance of the Administrator Class shares, adjusted to reflect higher expenses applicable to Class R shares. |
| 4 | Historical performance shown for the Class R6 shares prior to their inception reflects the performance of the Institutional Class shares, and includes the higher expenses applicable to the Institutional Class shares. If these expenses had not been included, returns would be higher. |
| 5 | The S&P 500 Index consists of 500 stocks chosen for market size, liquidity, and industry group representation. It is a market-value-weighted index with each stock’s weight in the index proportionate to its market value. You cannot invest directly in an index. |
| 6 | The chart compares the performance of Class A shares for the most recent ten years with the S&P 500 Index. The chart assumes a hypothetical investment of $10,000 in Class A shares and reflects all operating expenses and assumes the maximum initial sales charge of 5.75%. |
| 7 | The ten largest holdings, excluding cash, cash equivalents and any money market funds, are calculated based on the value of the investments divided by total net assets of the Fund. Holdings are subject to change and may have changed since the date specified. |
| 8 | Amounts are calculated based on the total long-term investments of the Fund. These amounts are subject to change and may have changed since the date specified. |
| * | The security was no longer held at the end of the reporting period. |
Wells Fargo Large Cap Core Fund | 7
Table of Contents
Performance highlights (unaudited)
MANAGER’S DISCUSSION
| ∎ | The Fund underperformed its benchmark, the S&P 500 Index, for the 12-month period that ended July 31, 2020. |
| ∎ | Stock selection, a smaller size bias, and valuation characteristics such as price/earnings (P/E) detracted from performance relative to the benchmark index. |
| ∎ | From a sector standpoint, stock selection within the real estate sector contributed to results most significantly, with favorable performance from Prologis, Inc., and American Tower Corp. |
Heightened uncertainty and volatility influenced investors.
During the second half of 2019, U.S. equity markets rose sharply, capping off the S&P 500 Index’s largest annual gain since 2013. Investors entered 2020 with high expectations, bolstered by steady U.S. economic growth, accommodative monetary policy, and a reduction in global trade tensions. However, once the coronavirus outbreak spiraled into a global pandemic, equity markets rapidly entered bear territory as volatility and fear escalated across the world. The U.S. Congress responded by passing the $2 trillion Coronavirus Aid, Relief, and Economic Security Act, its most significant fiscal stimulus measure since World War II. The Federal Reserve implemented an “all means necessary” approach and used an arsenal of emergency monetary policy tools to ensure the liquidity and functioning of financial markets. The aggressiveness of the $18 trillion global monetary and fiscal response cushioned the pandemic’s initial economic blow and was a significant catalyst for the market rebound following March’s historic decline. U.S. equities rallied on better-than-expected economic data, a reduction in quarantine restrictions, optimism over potential vaccines and effective treatments, and signs that the global economic collapse had bottomed.
The Fund was misaligned with the large-cap growth theme that drove the market.
Characteristics that are typically favored in the portfolio include attractive valuation, earnings consistency, profitability, improving sentiment, and momentum. For the trailing 12 months, those characteristics, in aggregate, were misaligned with market trends, leading to weak relative performance. The smaller size, lower P/E ratios, and better profitability characteristics favored by our quantitative stock selection model have led to a higher exposure to cyclical value companies rather than secular growth or low-volatility companies. The market continued its extended trend of strongly preferring secular growth stocks over value. During the downturn, we reduced our exposure to travel and leisure, interest rate risk, supply-chain risk, and weak consumer spending. We continue to monitor the balance sheet strength and liquidity characteristics of our holdings to increase our confidence that they should be able to weather this crisis. We are looking for opportunities to increase exposure to secular growth companies, should their ranks improve, to meet our buy discipline while maintaining exposure to fundamentally strong companies at attractive valuations that may benefit from a broadening of the market when economic growth recovers.
| Ten largest holdings (%) as of July 31, 20207 | ||||
Apple Incorporated | 6.05 | |||
Microsoft Corporation | 5.27 | |||
Alphabet Incorporated Class C | 2.98 | |||
The Home Depot Incorporated | 2.57 | |||
Prologis Incorporated | 2.55 | |||
Walmart Incorporated | 2.42 | |||
Target Corporation | 2.36 | |||
BlackRock Incorporated | 2.32 | |||
Newmont Corporation | 2.23 | |||
Zebra Technologies Corporation Class A | 2.15 | |||
Some of the top individual contributors came from the IT, consumer discretionary, and health care sectors.
The IT, consumer discretionary, and health care sectors were the best-performing sectors in the index. Several of the Fund’s top contributors on a relative basis came from those sectors, such as Fortinet and Zebra Technologies Corp. (IT); Target Corp. and The Home Depot, Inc. (consumer discretionary); and AbbVie Inc. and Amgen Inc. (health care).
The Fund’s worst detractors included Delta Air Lines, Inc.*; Marathon Petroleum Corp.; Vistra Corp.; Fifth Third Bancorp*; and ConocoPhillips Co.
Please see footnotes on page 7.
8 | Wells Fargo Large Cap Core Fund
Table of Contents
Performance highlights (unaudited)
| Sector allocation as of July 31, 20208 |
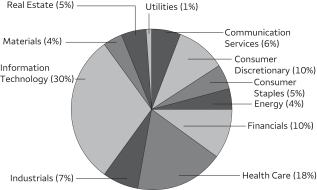 |
Our market outlook is cautious.
The coronavirus pandemic inflicted a major external shock to the global economic system and will have lasting repercussions. The massive global monetary and fiscal response did not eliminate the pandemic, but it may have prevented a deep recession from spiraling into an economic depression. Equity markets recovered most of their losses and an economic recovery has begun, but the true depth and duration of the damage is highly uncertain.
With most U.S. states reducing quarantine restrictions in May and June, the rebound in third-quarter gross domestic product is expected to be strong. However, the increase in coronavirus cases within the Western and Southeastern U.S. has investors worried about a second wave of infection,
which may restrain consumer spending and business confidence. If a second wave does appear and leads to another round of economic shutdowns, policymakers will likely pursue a more targeted quarantine approach in comparison to the initial outbreak.
Until a widely proven treatment or vaccine is available, the risk of a spike in infections and renewed quarantines will persist and delay a full economic recovery. The longer the crisis continues, the greater the risk of prolonged economic turmoil. However, there is growing optimism about vaccine clinical trials and the efficacy of inexpensive steroid treatments.
The devastating impact of the pandemic should dissipate as daily coronavirus infections peak, new therapies prove successful, and quarantines are no longer necessary. However, the depth and length of the coronavirus recession and the speed and strength of the recovery is still unclear. The path forward will be volatile as equity markets will be highly susceptible to positive and negative virus-related news. As we monitor the macroeconomic environment, we will continue to diligently focus on company fundamentals and disciplined portfolio risk management.
Please see footnotes on page 7.
Wells Fargo Large Cap Core Fund | 9
Table of Contents
As a shareholder of the Fund, you incur two types of costs: (1) transaction costs, including sales charges (loads) on purchase payments and contingent deferred sales charges (if any) on redemptions and (2) ongoing costs, including management fees, distribution (12b-1) and/or shareholder servicing fees, and other Fund expenses. This example is intended to help you understand your ongoing costs (in dollars) of investing in the Fund and to compare these costs with the ongoing costs of investing in other mutual funds.
The example is based on an investment of $1,000 invested at the beginning of the six-month period and held for the entire period from February 1, 2020 to July 31, 2020.
Actual expenses
The “Actual” line of the table below provides information about actual account values and actual expenses. You may use the information in this line, together with the amount you invested, to estimate the expenses that you paid over the period. Simply divide your account value by $1,000 (for example, an $8,600 account value divided by $1,000 = 8.6), then multiply the result by the number in the “Actual” line under the heading entitled “Expenses paid during period” for your applicable class of shares to estimate the expenses you paid on your account during this period.
Hypothetical example for comparison purposes
The “Hypothetical” line of the table below provides information about hypothetical account values and hypothetical expenses based on the Fund’s actual expense ratio and an assumed rate of return of 5% per year before expenses, which is not the Fund’s actual return. The hypothetical account values and expenses may not be used to estimate the actual ending account balance or expenses you paid for the period. You may use this information to compare the ongoing costs of investing in the Fund and other funds. To do so, compare this 5% hypothetical example with the 5% hypothetical examples that appear in the shareholder reports of the other funds.
Please note that the expenses shown in the table are meant to highlight your ongoing costs only and do not reflect any transactional costs, such as sales charges (loads) and contingent deferred sales charges. Therefore, the “Hypothetical” line of the table is useful in comparing ongoing costs only and will not help you determine the relative total costs of owning different funds. In addition, if these transactional costs were included, your costs would have been higher.
| Beginning account value 2-1-2020 | Ending account value 7-31-2020 | Expenses paid during the period1 | Annualized net expense ratio | |||||||||||||
Class A | ||||||||||||||||
Actual | $ | 1,000.00 | $ | 966.77 | $ | 5.28 | 1.08 | % | ||||||||
Hypothetical (5% return before expenses) | $ | 1,000.00 | $ | 1,019.49 | $ | 5.42 | 1.08 | % | ||||||||
Class C | ||||||||||||||||
Actual | $ | 1,000.00 | $ | 962.52 | $ | 8.93 | 1.83 | % | ||||||||
Hypothetical (5% return before expenses) | $ | 1,000.00 | $ | 1,015.76 | $ | 9.17 | 1.83 | % | ||||||||
Class R | ||||||||||||||||
Actual | $ | 1,000.00 | $ | 964.97 | $ | 6.50 | 1.33 | % | ||||||||
Hypothetical (5% return before expenses) | $ | 1,000.00 | $ | 1,018.25 | $ | 6.67 | 1.33 | % | ||||||||
Class R6 | ||||||||||||||||
Actual | $ | 1,000.00 | $ | 968.75 | $ | 3.18 | 0.65 | % | ||||||||
Hypothetical (5% return before expenses) | $ | 1,000.00 | $ | 1,021.63 | $ | 3.27 | 0.65 | % | ||||||||
Administrator Class | ||||||||||||||||
Actual | $ | 1,000.00 | $ | 966.69 | $ | 4.74 | 0.97 | % | ||||||||
Hypothetical (5% return before expenses) | $ | 1,000.00 | $ | 1,020.04 | $ | 4.87 | 0.97 | % | ||||||||
Institutional Class | ||||||||||||||||
Actual | $ | 1,000.00 | $ | 968.79 | $ | 3.28 | 0.67 | % | ||||||||
Hypothetical (5% return before expenses) | $ | 1,000.00 | $ | 1,021.53 | $ | 3.37 | 0.67 | % | ||||||||
| 1 | Expenses paid is equal to the annualized net expense ratio of each class multiplied by the average account value over the period, multiplied by the number of days in the most recent fiscal half-year divided by the number of days in the fiscal year (to reflect the one-half-year period). |
10 | Wells Fargo Large Cap Core Fund
Table of Contents
Portfolio of investments—July 31, 2020
| Shares | Value | |||||||||||||||
| Common Stocks: 99.30% | ||||||||||||||||
Communication Services: 5.99% | ||||||||||||||||
| Diversified Telecommunication Services: 1.57% | ||||||||||||||||
AT&T Incorporated | 259,071 | $ | 7,663,320 | |||||||||||||
|
| |||||||||||||||
| Interactive Media & Services: 2.98% | ||||||||||||||||
Alphabet Incorporated Class C † | 9,825 | 14,570,082 | ||||||||||||||
|
| |||||||||||||||
| Media: 1.44% | ||||||||||||||||
Discovery Communications Incorporated Class A † | 335,278 | 7,074,366 | ||||||||||||||
|
| |||||||||||||||
Consumer Discretionary: 10.27% | ||||||||||||||||
| Auto Components: 1.45% | ||||||||||||||||
Lear Corporation | 64,267 | 7,093,791 | ||||||||||||||
|
| |||||||||||||||
| Household Durables: 2.02% | ||||||||||||||||
Pulte Group Incorporated | 226,979 | 9,896,284 | ||||||||||||||
|
| |||||||||||||||
| Multiline Retail: 4.23% | ||||||||||||||||
Dollar General Corporation | 47,912 | 9,122,445 | ||||||||||||||
Target Corporation | 91,619 | 11,533,000 | ||||||||||||||
| 20,655,445 | ||||||||||||||||
|
| |||||||||||||||
| Specialty Retail: 2.57% | ||||||||||||||||
The Home Depot Incorporated | 47,413 | 12,587,677 | ||||||||||||||
|
| |||||||||||||||
Consumer Staples: 4.52% | ||||||||||||||||
| Food & Staples Retailing: 4.52% | ||||||||||||||||
Costco Wholesale Corporation | 31,472 | 10,245,080 | ||||||||||||||
Walmart Incorporated | 91,418 | 11,829,489 | ||||||||||||||
| 22,074,569 | ||||||||||||||||
|
| |||||||||||||||
Energy: 3.50% | ||||||||||||||||
| Oil, Gas & Consumable Fuels: 3.50% | ||||||||||||||||
Chevron Corporation | 60,181 | 5,051,593 | ||||||||||||||
ConocoPhillips | 149,415 | 5,586,627 | ||||||||||||||
Marathon Petroleum Corporation | 168,906 | 6,452,209 | ||||||||||||||
| 17,090,429 | ||||||||||||||||
|
| |||||||||||||||
Financials: 9.86% | ||||||||||||||||
| Banks: 3.68% | ||||||||||||||||
Citizens Financial Group Incorporated | 340,821 | 8,455,769 | ||||||||||||||
JPMorgan Chase & Company | 99,034 | 9,570,646 | ||||||||||||||
| 18,026,415 | ||||||||||||||||
|
| |||||||||||||||
| Capital Markets: 3.61% | ||||||||||||||||
BlackRock Incorporated | 19,706 | 11,331,147 | ||||||||||||||
Evercore Partners Incorporated Class A | 114,151 | 6,312,550 | ||||||||||||||
| 17,643,697 | ||||||||||||||||
|
| |||||||||||||||
| Insurance: 2.57% | ||||||||||||||||
Prudential Financial Incorporated | 85,432 | 5,413,826 | ||||||||||||||
The Allstate Corporation | 75,681 | 7,143,530 | ||||||||||||||
| 12,557,356 | ||||||||||||||||
|
| |||||||||||||||
The accompanying notes are an integral part of these financial statements.
Wells Fargo Large Cap Core Fund | 11
Table of Contents
Portfolio of investments—July 31, 2020
| Shares | Value | |||||||||||||||
Health Care: 17.80% | ||||||||||||||||
| Biotechnology: 6.72% | ||||||||||||||||
AbbVie Incorporated | 76,559 | $ | 7,266,215 | |||||||||||||
Amgen Incorporated | 38,471 | 9,412,700 | ||||||||||||||
Gilead Sciences Incorporated | 114,633 | 7,970,432 | ||||||||||||||
United Therapeutics Corporation † | 73,471 | 8,189,812 | ||||||||||||||
| 32,839,159 | ||||||||||||||||
|
| |||||||||||||||
| Health Care Equipment & Supplies: 2.00% | ||||||||||||||||
Baxter International Incorporated | 113,229 | 9,780,721 | ||||||||||||||
|
| |||||||||||||||
| Health Care Providers & Services: 5.62% | ||||||||||||||||
Anthem Incorporated | 34,407 | 9,420,637 | ||||||||||||||
CVS Health Corporation | 138,441 | 8,713,477 | ||||||||||||||
UnitedHealth Group Incorporated | 30,813 | 9,329,560 | ||||||||||||||
| 27,463,674 | ||||||||||||||||
|
| |||||||||||||||
| Pharmaceuticals: 3.46% | ||||||||||||||||
Bristol-Myers Squibb Company | 143,880 | 8,440,001 | ||||||||||||||
Johnson & Johnson | 58,277 | 8,494,456 | ||||||||||||||
| 16,934,457 | ||||||||||||||||
|
| |||||||||||||||
Industrials: 7.04% | ||||||||||||||||
| Aerospace & Defense: 2.13% | ||||||||||||||||
Lockheed Martin Corporation | 27,544 | 10,438,350 | ||||||||||||||
|
| |||||||||||||||
| Construction & Engineering: 1.61% | ||||||||||||||||
EMCOR Group Incorporated | 114,596 | 7,849,826 | ||||||||||||||
|
| |||||||||||||||
| Machinery: 3.30% | ||||||||||||||||
Allison Transmission Holdings Incorporated | 183,213 | 6,844,838 | ||||||||||||||
Cummins Incorporated | 47,993 | 9,275,127 | ||||||||||||||
| 16,119,965 | ||||||||||||||||
|
| |||||||||||||||
Information Technology: 30.16% | ||||||||||||||||
| Communications Equipment: 1.86% | ||||||||||||||||
Cisco Systems Incorporated | 193,498 | 9,113,756 | ||||||||||||||
|
| |||||||||||||||
| Electronic Equipment, Instruments & Components: 4.18% | ||||||||||||||||
CDW Corporation of Delaware | 85,359 | 9,922,984 | ||||||||||||||
Zebra Technologies Corporation Class A † | 37,443 | 10,512,122 | ||||||||||||||
| 20,435,106 | ||||||||||||||||
|
| |||||||||||||||
| IT Services: 3.74% | ||||||||||||||||
Leidos Holdings Incorporated | 90,433 | 8,605,604 | ||||||||||||||
MasterCard Incorporated Class A | 31,437 | 9,699,258 | ||||||||||||||
| 18,304,862 | ||||||||||||||||
|
| |||||||||||||||
| Semiconductors & Semiconductor Equipment: 1.63% | ||||||||||||||||
Intel Corporation | 166,453 | 7,944,802 | ||||||||||||||
|
| |||||||||||||||
| Software: 12.70% | ||||||||||||||||
Fortinet Incorporated † | 66,332 | 9,173,716 | ||||||||||||||
Intuit Incorporated | 33,378 | 10,226,018 | ||||||||||||||
Microsoft Corporation | 125,634 | 25,756,226 | ||||||||||||||
The accompanying notes are an integral part of these financial statements.
12 | Wells Fargo Large Cap Core Fund
Table of Contents
Portfolio of investments—July 31, 2020
| Shares | Value | |||||||||||||||
| Software (continued) | ||||||||||||||||
Oracle Corporation | 184,085 | $ | 10,207,513 | |||||||||||||
VMware Incorporated Class A † | 47,906 | 6,716,900 | ||||||||||||||
| 62,080,373 | ||||||||||||||||
|
| |||||||||||||||
| Technology Hardware, Storage & Peripherals: 6.05% | ||||||||||||||||
Apple Incorporated | 69,574 | 29,571,731 | ||||||||||||||
|
| |||||||||||||||
Materials: 4.28% | ||||||||||||||||
| Metals & Mining: 4.28% | ||||||||||||||||
Newmont Corporation | 157,367 | 10,889,796 | ||||||||||||||
Reliance Steel & Aluminum Company | 102,350 | 10,056,911 | ||||||||||||||
| 20,946,707 | ||||||||||||||||
|
| |||||||||||||||
Real Estate: 4.43% | ||||||||||||||||
| Equity REITs: 4.43% | ||||||||||||||||
American Tower Corporation | 35,056 | 9,163,288 | ||||||||||||||
Prologis Incorporated | 118,318 | 12,473,084 | ||||||||||||||
| 21,636,372 | ||||||||||||||||
|
| |||||||||||||||
Utilities: 1.45% | ||||||||||||||||
| Independent Power & Renewable Electricity Producers: 1.45% | ||||||||||||||||
Vistra Energy Corporation | 380,322 | 7,096,809 | ||||||||||||||
|
| |||||||||||||||
Total Common Stocks (Cost $380,183,209) | 485,490,101 | |||||||||||||||
|
| |||||||||||||||
| Yield | ||||||||||||||||
| Short-Term Investments: 0.94% | ||||||||||||||||
| Investment Companies: 0.94% | ||||||||||||||||
Wells Fargo Government Money Market Fund Select Class (l)(u) | 0.10 | % | 4,601,813 | 4,601,813 | ||||||||||||
|
| |||||||||||||||
Total Short-Term Investments (Cost $4,601,813) | 4,601,813 | |||||||||||||||
|
| |||||||||||||||
| Total investments in securities (Cost $384,785,022) | 100.24 | % | 490,091,914 | |||||
Other assets and liabilities, net | (0.24 | ) | (1,167,489 | ) | ||||
|
|
|
| |||||
| Total net assets | 100.00 | % | $ | 488,924,425 | ||||
|
|
|
| |||||
| † | Non-income-earning security |
| (l) | The issuer of the security is an affiliated person of the Fund as defined in the Investment Company Act of 1940. |
| (u) | The rate represents the 7-day annualized yield at period end. |
Abbreviations:
| REIT | Real estate investment trust |
The accompanying notes are an integral part of these financial statements.
Wells Fargo Large Cap Core Fund | 13
Table of Contents
Portfolio of investments—July 31, 2020
Investments in Affiliates
An affiliated investment is an investment in which the Fund owns at least 5% of the outstanding voting shares of the issuer or as a result of other relationships, such as the Fund and the issuer having the same investment manager. Transactions with issuers that were either affiliated persons of the Fund at the beginning of the period or the end of the period were as follows:
| Value, beginning of period | Purchases | Sales proceeds | Net realized gains (losses) | Net change in unrealized gains (losses) | Income from affiliated securities | Value, end of | % of net assets | |||||||||||||||||||||||||
| Short-Term Investments | ||||||||||||||||||||||||||||||||
Investment Companies | ||||||||||||||||||||||||||||||||
Securities Lending Cash Investments LLC * | $ | 0 | $ | 78,717,575 | $ | (78,716,125 | ) | $ | (1,450 | ) | $ | 0 | 56,728 | # | $ | 0 | ||||||||||||||||
Wells Fargo Government Money Market Fund Select Class | 5,360,147 | 373,665,483 | (374,423,817 | ) | 0 | 0 | 69,836 | 4,601,813 | ||||||||||||||||||||||||
|
|
|
|
|
|
|
|
|
| |||||||||||||||||||||||
| $ | (1,450 | ) | $ | 0 | $ | 126,564 | $ | 4,601,813 | 0.94 | % | ||||||||||||||||||||||
|
|
|
|
|
|
|
|
|
| |||||||||||||||||||||||
| * | No longer held at the end of the period |
| # | Amount shown represents income before fees and rebates. |
The accompanying notes are an integral part of these financial statements.
14 | Wells Fargo Large Cap Core Fund
Table of Contents
Statement of assets and liabilities—July 31, 2020
Assets | ||||
Investments in unaffiliated securities, at value (cost $380,183,209) | $ | 485,490,101 | ||
Investments in affiliated securities, at value (cost $4,601,813) | 4,601,813 | |||
Receivable for Fund shares sold | 86,017 | |||
Receivable for dividends | 598,924 | |||
Prepaid expenses and other assets | 46,503 | |||
|
| |||
Total assets | 490,823,358 | |||
|
| |||
Liabilities | ||||
Payable for Fund shares redeemed | 1,436,372 | |||
Management fee payable | 223,534 | |||
Administration fees payable | 81,017 | |||
Distribution fees payable | 24,438 | |||
Trustees’ fees and expenses payable | 5,851 | |||
Accrued expenses and other liabilities | 127,721 | |||
|
| |||
Total liabilities | 1,898,933 | |||
|
| |||
Total net assets | $ | 488,924,425 | ||
|
| |||
Net assets consist of | ||||
Paid-in capital | $ | 326,701,437 | ||
Total distributable earnings | 162,222,988 | |||
|
| |||
Total net assets | $ | 488,924,425 | ||
|
| |||
Computation of net asset value and offering price per share | ||||
Net assets – Class A | $ | 300,372,955 | ||
Shares outstanding – Class A1 | 19,123,127 | |||
Net asset value per share – Class A | $15.71 | |||
Maximum offering price per share – Class A2 | $16.67 | |||
Net assets – Class C | $ | 33,405,483 | ||
Shares outstanding – Class C1 | 2,167,339 | |||
Net asset value per share – Class C | $15.41 | |||
Net assets – Class R | $ | 910,381 | ||
Shares outstanding – Class R1 | 57,979 | |||
Net asset value per share – Class R | $15.70 | |||
Net assets – Class R6 | $ | 6,570,020 | ||
Shares outstanding – Class R61 | 415,603 | |||
Net asset value per share – Class R6 | $15.81 | |||
Net assets – Administrator Class | $ | 2,240,526 | ||
Shares outstanding – Administrator Class1 | 140,355 | |||
Net asset value per share – Administrator Class | $15.96 | |||
Net assets – Institutional Class | $ | 145,425,060 | ||
Shares outstanding – Institutional Class1 | 9,189,147 | |||
Net asset value per share – Institutional Class | $15.83 | |||
| 1 | The Fund has an unlimited number of authorized shares. |
| 2 | Maximum offering price is computed as 100/94.25 of net asset value. On investments of $50,000 or more, the offering price is reduced. |
The accompanying notes are an integral part of these financial statements.
Wells Fargo Large Cap Core Fund | 15
Table of Contents
Statement of operations—year ended July 31, 2020
Investment income | ||||
Dividends | $ | 13,233,957 | ||
Income from affiliated securities | 85,022 | |||
|
| |||
Total investment income | 13,318,979 | |||
|
| |||
Expenses | ||||
Management fee | 4,506,900 | |||
Administration fees | ||||
Class A | 664,018 | |||
Class C | 87,467 | |||
Class R | 3,770 | |||
Class R6 | 2,754 | |||
Administrator Class | 12,728 | |||
Institutional Class | 352,096 | |||
Shareholder servicing fees | ||||
Class A | 789,355 | |||
Class C | 103,908 | |||
Class R | 4,479 | |||
Administrator Class | 24,276 | |||
Distribution fees | ||||
Class C | 311,871 | |||
Class R | 4,443 | |||
Custody and accounting fees | 53,449 | |||
Professional fees | 47,340 | |||
Registration fees | 127,678 | |||
Shareholder report expenses | 153,687 | |||
Trustees’ fees and expenses | 21,871 | |||
Interest expense | 706 | |||
Other fees and expenses | 33,719 | |||
|
| |||
Total expenses | 7,306,515 | |||
Less: Fee waivers and/or expense reimbursements | ||||
Fund-level | (909,720 | ) | ||
Class A | (67,490 | ) | ||
Administrator Class | (1,677 | ) | ||
Institutional Class | (215,495 | ) | ||
|
| |||
Net expenses | 6,112,133 | |||
|
| |||
Net investment income | 7,206,846 | |||
|
| |||
Realized and unrealized gains (losses) on investments | ||||
Net realized gains (losses) on | ||||
Unaffiliated securities | 104,758,560 | |||
Affiliated securities | (1,450 | ) | ||
|
| |||
Net realized gains on investments | 104,757,110 | |||
Net change in unrealized gains (losses) on investments | (92,410,548 | ) | ||
|
| |||
Net realized and unrealized gains (losses) on investments | 12,346,562 | |||
|
| |||
Net increase in net assets resulting from operations | $ | 19,553,408 | ||
|
| |||
The accompanying notes are an integral part of these financial statements.
16 | Wells Fargo Large Cap Core Fund
Table of Contents
Statement of changes in net assets
| Year ended July 31, 2020 | Year ended July 31, 2019 | |||||||||||||||
Operations | ||||||||||||||||
Net investment income | $ | 7,206,846 | $ | 17,281,991 | ||||||||||||
Net realized gains on investments | 104,757,110 | 109,914,369 | ||||||||||||||
Net change in unrealized gains (losses) on investments | (92,410,548 | ) | (118,294,629 | ) | ||||||||||||
|
| |||||||||||||||
Net increase in net assets resulting from operations | 19,553,408 | 8,901,731 | ||||||||||||||
|
| |||||||||||||||
Distributions to shareholders from net investment income and net realized gains | ||||||||||||||||
Class A | (61,566,588 | ) | (37,574,345 | ) | ||||||||||||
Class C | (7,938,179 | ) | (5,864,767 | ) | ||||||||||||
Class R | (385,920 | ) | (218,389 | ) | ||||||||||||
Class R6 | (1,869,850 | ) | (1,664,230 | ) | ||||||||||||
Administrator Class | (2,568,605 | ) | (2,269,291 | ) | ||||||||||||
Institutional Class | (59,147,753 | ) | (74,264,283 | ) | ||||||||||||
|
| |||||||||||||||
Total distributions to shareholders | (133,476,895 | ) | (121,855,305 | ) | ||||||||||||
|
| |||||||||||||||
Capital share transactions | Shares | Shares | ||||||||||||||
Proceeds from shares sold | ||||||||||||||||
Class A | 1,500,692 | 25,056,011 | 2,037,136 | 37,064,625 | ||||||||||||
Class C | 198,258 | 3,124,973 | 396,352 | 7,080,379 | ||||||||||||
Class R | 42,012 | 683,541 | 14,501 | 264,703 | ||||||||||||
Class R6 | 46,727 | 745,853 | 159,006 | 3,008,830 | ||||||||||||
Administrator Class | 20,852 | 357,788 | 58,875 | 1,101,323 | ||||||||||||
Institutional Class | 2,471,565 | 41,971,331 | 8,077,444 | 146,618,727 | ||||||||||||
|
| |||||||||||||||
| 71,939,497 | 195,138,587 | |||||||||||||||
|
| |||||||||||||||
Reinvestment of distributions | ||||||||||||||||
Class A | 3,568,341 | 58,962,830 | 2,156,895 | 36,026,156 | ||||||||||||
Class C | 419,517 | 6,752,912 | 305,502 | 4,991,915 | ||||||||||||
Class R | 23,014 | 379,887 | 12,855 | 214,625 | ||||||||||||
Class R6 | 25,087 | 417,888 | 23,922 | 403,097 | ||||||||||||
Administrator Class | 151,848 | 2,548,476 | 133,494 | 2,258,572 | ||||||||||||
Institutional Class | 3,285,183 | 54,781,650 | 4,092,477 | 68,868,016 | ||||||||||||
|
| |||||||||||||||
| 123,843,643 | 112,762,381 | |||||||||||||||
|
| |||||||||||||||
Payment for shares redeemed | ||||||||||||||||
Class A | (4,307,171 | ) | (71,082,640 | ) | (3,169,819 | ) | (58,713,000 | ) | ||||||||
Class C | (1,065,243 | ) | (16,770,044 | ) | (1,097,796 | ) | (19,481,544 | ) | ||||||||
Class R | (117,013 | ) | (1,764,327 | ) | (15,514 | ) | (283,465 | ) | ||||||||
Class R6 | (364,215 | ) | (6,430,922 | ) | (202,585 | ) | (3,787,142 | ) | ||||||||
Administrator Class | (912,779 | ) | (13,878,044 | ) | (520,733 | ) | (9,967,464 | ) | ||||||||
Institutional Class | (28,685,504 | ) | (504,129,832 | ) | (13,024,243 | ) | (237,625,707 | ) | ||||||||
|
| |||||||||||||||
| (614,055,809 | ) | (329,858,322 | ) | |||||||||||||
|
| |||||||||||||||
Net decrease in net assets resulting from capital share transactions | (418,272,669 | ) | (21,957,354 | ) | ||||||||||||
|
| |||||||||||||||
Total decrease in net assets | (532,196,156 | ) | (134,910,928 | ) | ||||||||||||
|
| |||||||||||||||
Net assets | ||||||||||||||||
Beginning of period | 1,021,120,581 | 1,156,031,509 | ||||||||||||||
|
| |||||||||||||||
End of period | $ | 488,924,425 | $ | 1,021,120,581 | ||||||||||||
|
| |||||||||||||||
The accompanying notes are an integral part of these financial statements.
Wells Fargo Large Cap Core Fund | 17
Table of Contents
(For a share outstanding throughout each period)
| Year ended July 31 | ||||||||||||||||||||
| CLASS A | 2020 | 2019 | 2018 | 2017 | 2016 | |||||||||||||||
Net asset value, beginning of period | $18.57 | $20.82 | $18.01 | $15.13 | $15.81 | |||||||||||||||
Net investment income | 0.14 | 0.25 | 0.15 | 0.15 | 0.10 | |||||||||||||||
Net realized and unrealized gains (losses) on investments | 0.51 | (0.29 | ) | 3.01 | 2.85 | (0.60 | ) | |||||||||||||
|
|
|
|
|
|
|
|
|
| |||||||||||
Total from investment operations | 0.65 | (0.04 | ) | 3.16 | 3.00 | (0.50 | ) | |||||||||||||
Distributions to shareholders from | ||||||||||||||||||||
Net investment income | (0.29 | ) | (0.16 | ) | (0.13 | ) | (0.12 | ) | (0.05 | ) | ||||||||||
Net realized gains | (3.22 | ) | (2.05 | ) | (0.22 | ) | 0.00 | (0.13 | ) | |||||||||||
|
|
|
|
|
|
|
|
|
| |||||||||||
Total distributions to shareholders | (3.51 | ) | (2.21 | ) | (0.35 | ) | (0.12 | ) | (0.18 | ) | ||||||||||
Net asset value, end of period | $15.71 | $18.57 | $20.82 | $18.01 | $15.13 | |||||||||||||||
Total return1 | 2.86 | % | 1.10 | % | 17.66 | % | 19.94 | % | (3.18 | )% | ||||||||||
Ratios to average net assets (annualized) | ||||||||||||||||||||
Gross expenses | 1.23 | % | 1.19 | % | 1.18 | % | 1.19 | % | 1.20 | % | ||||||||||
Net expenses | 1.06 | % | 1.08 | % | 1.10 | % | 1.14 | % | 1.14 | % | ||||||||||
Net investment income | 0.97 | % | 1.42 | % | 0.73 | % | 0.82 | % | 0.80 | % | ||||||||||
Supplemental data | ||||||||||||||||||||
Portfolio turnover rate | 28 | % | 45 | % | 33 | % | 50 | % | 51 | % | ||||||||||
Net assets, end of period (000s omitted) | $300,373 | $341,045 | $360,937 | $329,974 | $359,971 | |||||||||||||||
| 1 | Total return calculations do not include any sales charges. |
The accompanying notes are an integral part of these financial statements.
18 | Wells Fargo Large Cap Core Fund
Table of Contents
Financial highlights
(For a share outstanding throughout each period)
| Year ended July 31 | ||||||||||||||||||||
| CLASS C | 2020 | 2019 | 2018 | 2017 | 2016 | |||||||||||||||
Net asset value, beginning of period | $18.22 | $20.44 | $17.70 | $14.87 | $15.61 | |||||||||||||||
Net investment income (loss) | 0.03 | 0.13 | (0.00 | )1 | 0.00 | 2 | 0.00 | 2,3 | ||||||||||||
Net realized and unrealized gains (losses) on investments | 0.47 | (0.30 | ) | 2.96 | 2.83 | (0.61 | ) | |||||||||||||
|
|
|
|
|
|
|
|
|
| |||||||||||
Total from investment operations | 0.50 | (0.17 | ) | 2.96 | 2.83 | (0.61 | ) | |||||||||||||
Distributions to shareholders from | ||||||||||||||||||||
Net investment income | (0.09 | ) | 0.00 | 0.00 | 0.00 | 0.00 | ||||||||||||||
Net realized gains | (3.22 | ) | (2.05 | ) | (0.22 | ) | 0.00 | (0.13 | ) | |||||||||||
|
|
|
|
|
|
|
|
|
| |||||||||||
Total distributions to shareholders | (3.31 | ) | (2.05 | ) | (0.22 | ) | 0.00 | (0.13 | ) | |||||||||||
Net asset value, end of period | $15.41 | $18.22 | $20.44 | $17.70 | $14.87 | |||||||||||||||
Total return4 | 2.01 | % | 0.34 | % | 16.78 | % | 19.03 | % | (3.90 | )% | ||||||||||
Ratios to average net assets (annualized) | ||||||||||||||||||||
Gross expenses | 1.97 | % | 1.94 | % | 1.93 | % | 1.94 | % | 1.95 | % | ||||||||||
Net expenses | 1.83 | % | 1.83 | % | 1.85 | % | 1.89 | % | 1.89 | % | ||||||||||
Net investment income (loss) | 0.21 | % | 0.67 | % | (0.02 | )% | 0.07 | % | 0.02 | % | ||||||||||
Supplemental data | ||||||||||||||||||||
Portfolio turnover rate | 28 | % | 45 | % | 33 | % | 50 | % | 51 | % | ||||||||||
Net assets, end of period (000s omitted) | $33,405 | $47,649 | $61,529 | $60,697 | $71,512 | |||||||||||||||
| 1 | Amount is more than $(0.005). |
| 2 | Amount is less than $0.005. |
| 3 | Calculated based upon average shares outstanding |
| 4 | Total return calculations do not include any sales charges. |
The accompanying notes are an integral part of these financial statements.
Wells Fargo Large Cap Core Fund | 19
Table of Contents
Financial highlights
(For a share outstanding throughout each period)
| Year ended July 31 | ||||||||||||||||||||
| CLASS R | 2020 | 2019 | 2018 | 2017 | 20161 | |||||||||||||||
Net asset value, beginning of period | $18.57 | $20.81 | $18.04 | $15.17 | $14.66 | |||||||||||||||
Net investment income | 0.11 | 2 | 0.21 | 0.12 | 0.13 | 0.06 | ||||||||||||||
Net realized and unrealized gains (losses) on investments | 0.49 | (0.29 | ) | 2.99 | 2.84 | 0.66 | ||||||||||||||
|
|
|
|
|
|
|
|
|
| |||||||||||
Total from investment operations | 0.60 | (0.08 | ) | 3.11 | 2.97 | 0.72 | ||||||||||||||
Distributions to shareholders from | ||||||||||||||||||||
Net investment income | (0.25 | ) | (0.11 | ) | (0.12 | ) | (0.10 | ) | (0.08 | ) | ||||||||||
Net realized gains | (3.22 | ) | (2.05 | ) | (0.22 | ) | 0.00 | (0.13 | ) | |||||||||||
|
|
|
|
|
|
|
|
|
| |||||||||||
Total distributions to shareholders | (3.47 | ) | (2.16 | ) | (0.34 | ) | (0.10 | ) | (0.21 | ) | ||||||||||
Net asset value, end of period | $15.70 | $18.57 | $20.81 | $18.04 | $15.17 | |||||||||||||||
Total return3 | 2.56 | % | 0.87 | % | 17.37 | % | 19.64 | % | 4.90 | % | ||||||||||
Ratios to average net assets (annualized) | ||||||||||||||||||||
Gross expenses | 1.47 | % | 1.44 | % | 1.43 | % | 1.44 | % | 1.46 | % | ||||||||||
Net expenses | 1.33 | % | 1.33 | % | 1.34 | % | 1.39 | % | 1.39 | % | ||||||||||
Net investment income | 0.69 | % | 1.18 | % | 0.48 | % | 0.51 | % | 0.52 | % | ||||||||||
Supplemental data | ||||||||||||||||||||
Portfolio turnover rate | 28 | % | 45 | % | 33 | % | 50 | % | 51 | % | ||||||||||
Net assets, end of period (000s omitted) | $910 | $2,043 | $2,042 | $1,369 | $26 | |||||||||||||||
| 1 | For the period from September 30, 2015 (commencement of class operations) to July 31, 2016 |
| 2 | Calculated based upon average shares outstanding |
| 3 | Returns for periods of less than one year are not annualized. |
The accompanying notes are an integral part of these financial statements.
20 | Wells Fargo Large Cap Core Fund
Table of Contents
Financial highlights
(For a share outstanding throughout each period)
| Year ended July 31 | ||||||||||||||||||||
| CLASS R6 | 2020 | 2019 | 2018 | 2017 | 20161 | |||||||||||||||
Net asset value, beginning of period | $18.68 | $20.92 | $18.09 | $15.24 | $14.66 | |||||||||||||||
Net investment income | 0.24 | 2 | 0.34 | 0.22 | 2 | 0.25 | 2 | 0.20 | ||||||||||||
Net realized and unrealized gains (losses) on investments | 0.48 | (0.30 | ) | 3.04 | 3.33 | 0.62 | ||||||||||||||
|
|
|
|
|
|
|
|
|
| |||||||||||
Total from investment operations | 0.72 | 0.04 | 3.26 | 3.58 | 0.82 | |||||||||||||||
Distributions to shareholders from | ||||||||||||||||||||
Net investment income | (0.37 | ) | (0.23 | ) | (0.21 | ) | (0.73 | ) | (0.11 | ) | ||||||||||
Net realized gains | (3.22 | ) | (2.05 | ) | (0.22 | ) | 0.00 | (0.13 | ) | |||||||||||
|
|
|
|
|
|
|
|
|
| |||||||||||
Total distributions to shareholders | (3.59 | ) | (2.28 | ) | (0.43 | ) | (0.73 | ) | (0.24 | ) | ||||||||||
Net asset value, end of period | $15.81 | $18.68 | $20.92 | $18.09 | $15.24 | |||||||||||||||
Total return3 | 3.23 | % | 1.60 | % | 18.16 | % | 24.01 | % | 5.57 | % | ||||||||||
Ratios to average net assets (annualized) | ||||||||||||||||||||
Gross expenses | 0.79 | % | 0.75 | % | 0.75 | % | 0.76 | % | 0.77 | % | ||||||||||
Net expenses | 0.65 | % | 0.65 | % | 0.65 | % | 0.68 | % | 0.68 | % | ||||||||||
Net investment income | 1.40 | % | 1.83 | % | 1.08 | % | 1.62 | % | 1.31 | % | ||||||||||
Supplemental data | ||||||||||||||||||||
Portfolio turnover rate | 28 | % | 45 | % | 33 | % | 50 | % | 51 | % | ||||||||||
Net assets, end of period (000s omitted) | $6,570 | $13,223 | $15,225 | $122 | $2,449 | |||||||||||||||
| 1 | For the period from September 30, 2015 (commencement of class operations) to July 31, 2016 |
| 2 | Calculated based upon average shares outstanding |
| 3 | Returns for periods of less than one year are not annualized. |
The accompanying notes are an integral part of these financial statements.
Wells Fargo Large Cap Core Fund | 21
Table of Contents
Financial highlights
(For a share outstanding throughout each period)
| Year ended July 31 | ||||||||||||||||||||
| ADMINISTRATOR CLASS | 2020 | 2019 | 2018 | 2017 | 2016 | |||||||||||||||
Net asset value, beginning of period | $18.82 | $21.05 | $18.21 | $15.18 | $15.87 | |||||||||||||||
Net investment income | 0.18 | 1 | 0.29 | 1 | 0.17 | 1 | 0.16 | 1 | 0.15 | |||||||||||
Net realized and unrealized gains (losses) on investments | 0.49 | (0.30 | ) | 3.05 | 2.87 | (0.62 | ) | |||||||||||||
|
|
|
|
|
|
|
|
|
| |||||||||||
Total from investment operations | 0.67 | (0.01 | ) | 3.22 | 3.03 | (0.47 | ) | |||||||||||||
Distributions to shareholders from | ||||||||||||||||||||
Net investment income | (0.31 | ) | (0.17 | ) | (0.16 | ) | (0.00 | )2 | (0.09 | ) | ||||||||||
Net realized gains | (3.22 | ) | (2.05 | ) | (0.22 | ) | 0.00 | (0.13 | ) | |||||||||||
|
|
|
|
|
|
|
|
|
| |||||||||||
Total distributions to shareholders | (3.53 | ) | (2.22 | ) | (0.38 | ) | (0.00 | )2 | (0.22 | ) | ||||||||||
Net asset value, end of period | $15.96 | $18.82 | $21.05 | $18.21 | $15.18 | |||||||||||||||
Total return | 2.90 | % | 1.26 | % | 17.81 | % | 19.99 | % | (2.98 | )% | ||||||||||
Ratios to average net assets (annualized) | ||||||||||||||||||||
Gross expenses | 1.13 | % | 1.10 | % | 1.10 | % | 1.10 | % | 1.12 | % | ||||||||||
Net expenses | 0.97 | % | 0.97 | % | 0.98 | % | 1.00 | % | 0.96 | % | ||||||||||
Net investment income | 1.04 | % | 1.52 | % | 0.86 | % | 1.00 | % | 0.95 | % | ||||||||||
Supplemental data | ||||||||||||||||||||
Portfolio turnover rate | 28 | % | 45 | % | 33 | % | 50 | % | 51 | % | ||||||||||
Net assets, end of period (000s omitted) | $2,241 | $16,566 | $25,444 | $32,091 | $57,879 | |||||||||||||||
| 1 | Calculated based upon average shares outstanding |
| 2 | Amount is less than $0.005. |
The accompanying notes are an integral part of these financial statements.
22 | Wells Fargo Large Cap Core Fund
Table of Contents
Financial highlights
(For a share outstanding throughout each period)
| Year ended July 31 | ||||||||||||||||||||
| INSTITUTIONAL CLASS | 2020 | 2019 | 2018 | 2017 | 2016 | |||||||||||||||
Net asset value, beginning of period | $18.70 | $20.95 | $18.12 | $15.23 | $15.91 | |||||||||||||||
Net investment income | 0.24 | 1 | 0.34 | 0.23 | 0.18 | 0.18 | 1 | |||||||||||||
Net realized and unrealized gains (losses) on investments | 0.48 | (0.30 | ) | 3.03 | 2.91 | (0.62 | ) | |||||||||||||
|
|
|
|
|
|
|
|
|
| |||||||||||
Total from investment operations | 0.72 | 0.04 | 3.26 | 3.09 | (0.44 | ) | ||||||||||||||
Distributions to shareholders from | ||||||||||||||||||||
Net investment income | (0.37 | ) | (0.24 | ) | (0.21 | ) | (0.20 | ) | (0.11 | ) | ||||||||||
Net realized gains | (3.22 | ) | (2.05 | ) | (0.22 | ) | 0.00 | (0.13 | ) | |||||||||||
|
|
|
|
|
|
|
|
|
| |||||||||||
Total distributions to shareholders | (3.59 | ) | (2.29 | ) | (0.43 | ) | (0.20 | ) | (0.24 | ) | ||||||||||
Net asset value, end of period | $15.83 | $18.70 | $20.95 | $18.12 | $15.23 | |||||||||||||||
Total return | 3.22 | % | 1.56 | % | 18.16 | % | 20.43 | % | (2.75 | )% | ||||||||||
Ratios to average net assets (annualized) | ||||||||||||||||||||
Gross expenses | 0.89 | % | 0.86 | % | 0.85 | % | 0.86 | % | 0.87 | % | ||||||||||
Net expenses | 0.67 | % | 0.67 | % | 0.68 | % | 0.70 | % | 0.70 | % | ||||||||||
Net investment income | 1.40 | % | 1.82 | % | 1.15 | % | 1.23 | % | 1.22 | % | ||||||||||
Supplemental data | ||||||||||||||||||||
Portfolio turnover rate | 28 | % | 45 | % | 33 | % | 50 | % | 51 | % | ||||||||||
Net assets, end of period (000s omitted) | $145,425 | $600,595 | $690,855 | $621,864 | $412,678 | |||||||||||||||
| 1 | Calculated based upon average shares outstanding |
The accompanying notes are an integral part of these financial statements.
Wells Fargo Large Cap Core Fund | 23
Table of Contents
1. ORGANIZATION
Wells Fargo Funds Trust (the “Trust”), a Delaware statutory trust organized on March 10, 1999, is an open-end management investment company registered under the Investment Company Act of 1940, as amended (the “1940 Act”). As an investment company, the Trust follows the accounting and reporting guidance in Financial Accounting Standards Board (“FASB”) Accounting Standards Codification Topic 946, Financial Services – Investment Companies. These financial statements report on the Wells Fargo Large Cap Core Fund (the “Fund”) which is a diversified series of the Trust.
2. SIGNIFICANT ACCOUNTING POLICIES
The following significant accounting policies, which are consistently followed in the preparation of the financial statements of the Fund, are in conformity with U.S. generally accepted accounting principles which require management to make estimates and assumptions that affect the reported amounts of assets and liabilities, disclosure of contingent assets and liabilities at the date of the financial statements, and the reported amounts of revenues and expenses during the reporting period. Actual results could differ from those estimates.
Securities valuation
All investments are valued each business day as of the close of regular trading on the New York Stock Exchange (generally 4 p.m. Eastern Time), although the Fund may deviate from this calculation time under unusual or unexpected circumstances.
Equity securities that are listed on a foreign or domestic exchange or market are valued at the official closing price or, if none, the last sales price. If no sale occurs on the principal exchange or market that day, a fair value price will be determined in accordance with the Fund’s Valuation Procedures.
Investments in registered open-end investment companies are valued at net asset value. Interests in non-registered investment companies that are redeemable at net asset value are fair valued normally at net asset value.
Investments which are not valued using any of the methods discussed above are valued at their fair value, as determined in good faith by the Board of Trustees of the Fund. The Board of Trustees has established a Valuation Committee comprised of the Trustees and has delegated to it the authority to take any actions regarding the valuation of portfolio securities that the Valuation Committee deems necessary or appropriate, including determining the fair value of portfolio securities, unless the determination has been delegated to the Wells Fargo Asset Management Pricing Committee at Wells Fargo Funds Management, LLC (“Funds Management”). The Board of Trustees retains the authority to make or ratify any valuation decisions or approve any changes to the Valuation Procedures as it deems appropriate. On a quarterly basis, the Board of Trustees receives reports on any valuation actions taken by the Valuation Committee or the Wells Fargo Asset Management Pricing Committee which may include items for ratification.
Securities lending
The Fund may lend its securities from time to time in order to earn additional income in the form of fees or interest on securities received as collateral or the investment of any cash received as collateral. When securities are on loan, the Fund receives interest or dividends on those securities. Cash collateral received in connection with its securities lending transactions is invested in Securities Lending Cash Investments, LLC (the “Securities Lending Fund”). Investments in Securities Lending Fund are valued at the evaluated bid price provided by an independent pricing service. Income earned from investment in the Securities Lending Fund (net of fees and rebates), if any, is included in income from affiliated securities on the Statement of Operations.
In a securities lending transaction, the net asset value of the Fund is affected by an increase or decrease in the value of the securities loaned and by an increase or decrease in the value of the instrument in which collateral is invested. The amount of securities lending activity undertaken by the Fund fluctuates from time to time. The Fund has the right under the lending agreement to recover the securities from the borrower on demand. In the event of default or bankruptcy by the borrower, the Fund may be prevented from recovering the loaned securities or gaining access to the collateral or may experience delays or costs in doing so. In such an event, the terms of the agreement allow the unaffiliated securities lending agent to use the collateral to purchase replacement securities on behalf of the Fund or pay the Fund the market value of the loaned securities. The Fund bears the risk of loss with respect to depreciation of its investment of the cash collateral.
Security transactions and income recognition
Securities transactions are recorded on a trade date basis. Realized gains or losses are recorded on the basis of identified cost.
Dividend income is recognized on the ex-dividend date.
24 | Wells Fargo Large Cap Core Fund
Table of Contents
Notes to financial statements
Distributions to shareholders
Distributions to shareholders from net investment income and any net realized gains are recorded on the ex-dividend date and paid at least annually. Such distributions are determined in accordance with income tax regulations and may differ from U.S. generally accepted accounting principles. Dividend sources are estimated at the time of declaration. The tax character of distributions is determined as of the Fund’s fiscal year end. Therefore, a portion of the Fund’s distributions made prior to the Fund’s fiscal year end may be categorized as a tax return of capital at year end.
Federal and other taxes
The Fund intends to continue to qualify as a regulated investment company by distributing substantially all of its investment company taxable income and any net realized capital gains (after reduction for capital loss carryforwards) sufficient to relieve it from all, or substantially all, federal income taxes. Accordingly, no provision for federal income taxes was required.
The Fund’s income and federal excise tax returns and all financial records supporting those returns for the prior three fiscal years are subject to examination by the federal and Delaware revenue authorities. Management has analyzed the Fund’s tax positions taken on federal, state, and foreign tax returns for all open tax years and does not believe that there are any uncertain tax positions that require recognition of a tax liability.
As of July 31, 2020, the aggregate cost of all investments for federal income tax purposes was $385,437,842 and the unrealized gains (losses) consisted of:
Gross unrealized gains | $ | 135,276,126 | ||
Gross unrealized losses | (30,622,054 | ) | ||
Net unrealized gains | $ | 104,654,072 | ||
Reclassifications are made to the Fund’s capital accounts for permanent tax differences to reflect income and gains available for distribution (or available capital loss carryforwards) under federal income tax regulations. U.S. generally accepted accounting principles require that certain components of net assets be adjusted to reflect permanent differences between financial and tax reporting. In addition, the Fund may utilize equalization accounting for tax purposes and designate earnings and profits, including net realized gains distributed to shareholders on redemption of shares, as a part of the dividends paid deduction for income tax purposes. These reclassifications have no effect on net assets or net asset values per share. The primary permanent difference causing such reclassifications is due to equalization payments. At July 31, 2020, as a result of permanent book-to-tax differences, the following reclassification adjustments were made on the Statement of Assets and Liabilities:
| Paid-in capital | Total distributable earnings | |
| $12,313,322 | $(12,313,322) | |
Class allocations
The separate classes of shares offered by the Fund differ principally in applicable sales charges, distribution, shareholder servicing, and administration fees. Class specific expenses are charged directly to that share class. Investment income, common fund-level expenses, and realized and unrealized gains (losses) on investments are allocated daily to each class of shares based on the relative proportion of net assets of each class.
3. FAIR VALUATION MEASUREMENTS
Fair value measurements of investments are determined within a framework that has established a fair value hierarchy based upon the various data inputs utilized in determining the value of the Fund’s investments. The three-level hierarchy gives the highest priority to unadjusted quoted prices in active markets for identical assets or liabilities (Level 1) and the lowest priority to unobservable inputs (Level 3). The Fund’s investments are classified within the fair value hierarchy based on the lowest level of input that is significant to the fair value measurement. The inputs are summarized into three broad levels as follows:
| ∎ | Level 1 – quoted prices in active markets for identical securities |
| ∎ | Level 2 – other significant observable inputs (including quoted prices for similar securities, interest rates, prepayment speeds, credit risk, etc.) |
| ∎ | Level 3 – significant unobservable inputs (including the Fund’s own assumptions in determining the fair value of investments) |
The inputs or methodologies used for valuing investments in securities are not necessarily an indication of the risk associated with investing in those securities.
Wells Fargo Large Cap Core Fund | 25
Table of Contents
Notes to financial statements
The following is a summary of the inputs used in valuing the Fund’s assets and liabilities as of July 31, 2020:
| Quoted prices (Level 1) | Other significant observable inputs (Level 2) | Significant (Level 3) | Total | |||||||||||||
Assets | ||||||||||||||||
Investments in: | ||||||||||||||||
Common stocks | ||||||||||||||||
Communication services | $ | 29,307,768 | $ | 0 | $ | 0 | $ | 29,307,768 | ||||||||
Consumer discretionary | 50,233,197 | 0 | 0 | 50,233,197 | ||||||||||||
Consumer staples | 22,074,569 | 0 | 0 | 22,074,569 | ||||||||||||
Energy | 17,090,429 | 0 | 0 | 17,090,429 | ||||||||||||
Financials | 48,227,468 | 0 | 0 | 48,227,468 | ||||||||||||
Health care | 87,018,011 | 0 | 0 | 87,018,011 | ||||||||||||
Industrials | 34,408,141 | 0 | 0 | 34,408,141 | ||||||||||||
Information technology | 147,450,630 | 0 | 0 | 147,450,630 | ||||||||||||
Materials | 20,946,707 | 0 | 0 | 20,946,707 | ||||||||||||
Real estate | 21,636,372 | 0 | 0 | 21,636,372 | ||||||||||||
Utilities | 7,096,809 | 0 | 0 | 7,096,809 | ||||||||||||
Short-term investments | ||||||||||||||||
Investment companies | 4,601,813 | 0 | 0 | 4,601,813 | ||||||||||||
Total assets | $ | 490,091,914 | $ | 0 | $ | 0 | $ | 490,091,914 | ||||||||
Additional sector, industry or geographic detail is included in the Portfolio of Investments.
For the year ended July 31, 2020, the Fund did not have any transfers into/out of Level 3.
4. TRANSACTIONS WITH AFFILIATES
Management fee
Funds Management, an indirect wholly owned subsidiary of Wells Fargo & Company (“Wells Fargo”), is the manager of the Fund and provides advisory and fund-level administrative services under an investment management agreement. Under the investment management agreement, Funds Management is responsible for, among other services, implementing the investment objectives and strategies of the Fund, supervising the subadviser and providing fund-level administrative services in connection with the Fund’s operations. As compensation for its services under the investment management agreement, Funds Management is entitled to receive a management fee at the following annual rate based on the Fund’s average daily net assets:
| Average daily net assets | Management fee | |||
First $500 million | 0.700 | % | ||
Next $500 million | 0.675 | |||
Next $1 billion | 0.650 | |||
Next $2 billion | 0.625 | |||
Next $1 billion | 0.600 | |||
Next $3 billion | 0.590 | |||
Next $2 billion | 0.565 | |||
Next $2 billion | 0.555 | |||
Next $4 billion | 0.530 | |||
Over $16 billion | 0.505 | |||
For the year ended July 31, 2020, the management fee was equivalent to an annual rate of 0.69% of the Fund’s average daily net assets.
26 | Wells Fargo Large Cap Core Fund
Table of Contents
Notes to financial statements
Funds Management has retained the services of a subadviser to provide daily portfolio management to the Fund. The fee for subadvisory services is borne by Funds Management. Wells Capital Management Incorporated (“WellsCap”), an affiliate of Funds Management and an indirect wholly owned subsidiary of Wells Fargo, is the subadviser to the Fund and is entitled to receive a fee from Funds Management at an annual rate starting at 0.35% and declining to 0.30% as the average daily net assets of the Fund increase.
Administration fees
Under a class-level administration agreement, Funds Management provides class-level administrative services to the Fund, which includes paying fees and expenses for services provided by the transfer agent, sub-transfer agents, omnibus account servicers and record-keepers. As compensation for its services under the class-level administration agreement, Funds Management receives an annual fee which is calculated based on the average daily net assets of each class as follows:
| Class-level administration fee | ||||
Class A, Class C, Class R | 0.21 | % | ||
Class R6 | 0.03 | |||
Administrator Class, Institutional Class | 0.13 | |||
Waivers and/or expense reimbursements
Funds Management has contractually waived and/or reimbursed management and administration fees to the extent necessary to maintain certain net operating expense ratios for the Fund. When each class of the Fund has exceeded its expense cap, Funds Management has waived fees and/or reimbursed expenses from fund-level expenses on a proportionate basis and then from class specific expenses. When only certain classes exceed their expense caps, waivers and/or reimbursements are applied against class specific expenses before fund-level expenses. Funds Management has committed through November 30, 2020 to waive fees and/or reimburse expenses to the extent necessary to cap the Fund’s expenses at 1.08% for Class A shares, 1.83% for Class C shares, 1.33% for Class R shares, 0.65% for Class R6 shares, 0.97% for Administrator Class shares, and 0.67% for Institutional Class shares. Prior to or after the commitment expiration date, the cap may be increased or the commitment to maintain the cap may be terminated only with the approval of the Board of Trustees.
Distribution fees
The Trust has adopted a distribution plan for Class C and Class R shares of the Fund pursuant to Rule 12b-1 under the 1940 Act. Distribution fees are charged to Class C and Class R shares and paid to Wells Fargo Funds Distributor, LLC (“Funds Distributor”), the principal underwriter, at an annual rate of 0.75% of the average daily net assets of Class C shares and 0.25% of the average daily net assets of Class R shares.
In addition, Funds Distributor is entitled to receive the front-end sales charge from the purchase of Class A shares and a contingent deferred sales charge on the redemption of certain Class A shares. Funds Distributor is also entitled to receive the contingent deferred sales charges from redemptions of Class C shares. For the year ended July 31, 2020, Funds Distributor received $3,643 from the sale of Class A shares and $29 in contingent deferred sales charges from redemptions of Class C shares. No contingent deferred sales charges were incurred by Class A shares for the year ended July 31, 2020.
Shareholder servicing fees
The Trust has entered into contracts with one or more shareholder servicing agents, whereby Class A, Class C, Class R, and Administrator Class of the Fund are charged a fee at an annual rate of 0.25% of the average daily net assets of each respective class. A portion of these total shareholder servicing fees were paid to affiliates of Wells Fargo.
Interfund transactions
The Fund may purchase or sell portfolio investment securities to certain other Wells Fargo affiliates pursuant to Rule 17a-7 under the 1940 Act and under procedures adopted by the Board of Trustees. The procedures have been designed to ensure that these interfund transactions, which do not incur broker commissions, are effected at current market prices.
5. INVESTMENT PORTFOLIO TRANSACTIONS
Purchases and sales of investments, excluding U.S. government obligations (if any) and short-term securities, for the year ended July 31, 2020 were $182,833,740 and $725,407,672, respectively.
Wells Fargo Large Cap Core Fund | 27
Table of Contents
Notes to financial statements
6. SECURITIES LENDING TRANSACTIONS
The Fund lends its securities through an unaffiliated securities lending agent and receives collateral in the form of cash or securities with a value at least equal to the value of the securities on loan. The value of the loaned securities is determined at the close of each business day and any increases or decreases in the required collateral are exchanged between the Fund and the counterparty on the next business day. Cash collateral received is invested in the Securities Lending Fund which seeks to provide a positive return compared to the daily Federal Funds Open Rate by investing in high-quality, U.S. dollar-denominated short-term money market instruments and is exempt from registration under Section 3(c)(7) of the 1940 Act. Securities Lending Fund is managed by Funds Management and is subadvised by WellsCap. Funds Management receives an advisory fee starting at 0.05% and declining to 0.01% as the average daily net assets of the Securities Lending Fund increase. All of the fees received by Funds Management are paid to WellsCap for its services as subadviser.
In the event of counterparty default or the failure of a borrower to return a loaned security, the Fund has the right to use the collateral to offset any losses incurred. As of July 31, 2020, the Fund did not have any securities on loan.
7. BANK BORROWINGS
The Trust (excluding the money market funds), Wells Fargo Master Trust and Wells Fargo Variable Trust are parties to a $350,000,000 revolving credit agreement whereby the Fund is permitted to use bank borrowings for temporary or emergency purposes, such as to fund shareholder redemption requests. Interest under the credit agreement is charged to the Fund based on a borrowing rate equal to the higher of the Federal Funds rate in effect on that day plus 1.25% or the overnight LIBOR rate in effect on that day plus 1.25%. In addition, an annual commitment fee equal to 0.25% of the unused balance is allocated to each participating fund.
During the year ended July 31, 2020, the Fund had average borrowings outstanding of $24,429 at an average rate of 2.89% and paid interest in the amount of $706.
8. DISTRIBUTIONS TO SHAREHOLDERS
The tax character of distributions paid during the years ended July 31, 2020 and July 31, 2019 were as follows:
| Year ended July 31 | ||||||||
| 2020 | 2019 | |||||||
Ordinary income | $ | 13,476,743 | $ | 11,587,477 | ||||
Long-term capital gain | 120,000,152 | 110,267,828 | ||||||
As of July 31, 2020, the components of distributable earnings on a tax basis were as follows:
| Undistributed ordinary income | Undistributed long-term gain | Unrealized gains | ||
| $3,332,089 | $54,236,874 | $104,654,072 | ||
9. CONCENTRATION RISK
Concentration risks result from exposure to a limited number of sectors. As of the end of the period, the Fund invested a concentration of its portfolio in the information technology sector. A fund that invests a substantial portion of its assets in any sector may be more affected by changes in that sector than would be a fund whose investments are not heavily weighted in any sector.
10. INDEMNIFICATION
Under the Fund’s organizational documents, the officers and Trustees have been granted certain indemnification rights against certain liabilities that may arise out of performance of their duties to the Fund. The Fund has entered into a separate agreement with each Trustee that converts indemnification rights currently existing under the Fund’s organizational documents into contractual rights that cannot be changed in the future without the consent of the Trustee. Additionally, in the normal course of business, the Fund may enter into contracts with service providers that contain a variety of indemnification clauses. The Fund’s maximum exposure under these arrangements is dependent on future claims that may be made against the Fund and, therefore, cannot be estimated.
28 | Wells Fargo Large Cap Core Fund
Table of Contents
Notes to financial statements
11. NEW ACCOUNTING PRONOUNCEMENT
In August 2018, FASB issued Accounting Standards Update (“ASU”) No. 2018-13, Fair Value Measurement (Topic 820) Disclosure Framework—Changes to the Disclosure Requirements for Fair Value Measurement. ASU 2018-13 updates the disclosure requirements on fair value measurements in Topic 820, Fair Value Measurements. The amendments are effective for fiscal years, and interim periods within those fiscal years, beginning after December 15, 2019. Management has adopted this guidance which did not have a material impact on the financial statements.
12. CORONAVIRUS (COVID-19) PANDEMIC
On March 11, 2020, the World Health Organization announced that it had made the assessment that coronavirus disease 2019 (“COVID-19”) is a pandemic. The impacts of COVID-19 are adversely affecting the entire global economy, individual companies and investment products, and the market in general. There is significant uncertainty around the extent and duration of business disruptions related to COVID-19 and the impacts may be short term or may last for an extended period of time. The risk of further spreading of COVID-19 has led to significant uncertainty and volatility in the financial markets.
Wells Fargo Large Cap Core Fund | 29
Table of Contents
Report of independent registered public accounting firm
To the Shareholders of the Fund and Board of Trustees
Wells Fargo Funds Trust:
Opinion on the Financial Statements
We have audited the accompanying statement of assets and liabilities of Wells Fargo Large Cap Core Fund (the Fund), one of the funds constituting Wells Fargo Funds Trust, including the portfolio of investments, as of July 31, 2020, the related statement of operations for the year then ended, the statements of changes in net assets for each of the years in the two-year period then ended, and the related notes (collectively, the financial statements) and the financial highlights for each of the years or periods in the five-year period then ended. In our opinion, the financial statements and financial highlights present fairly, in all material respects, the financial position of the Fund as of July 31, 2020, the results of its operations for the year then ended, the changes in its net assets for each of the years in the two-year period then ended, and the financial highlights for each of the years or periods in the five-year period then ended, in conformity with U.S. generally accepted accounting principles.
Basis for Opinion
These financial statements and financial highlights are the responsibility of the Fund’s management. Our responsibility is to express an opinion on these financial statements and financial highlights based on our audits. We are a public accounting firm registered with the Public Company Accounting Oversight Board (United States) (PCAOB) and are required to be independent with respect to the Fund in accordance with the U.S. federal securities laws and the applicable rules and regulations of the Securities and Exchange Commission and the PCAOB.
We conducted our audits in accordance with the standards of the PCAOB. Those standards require that we plan and perform the audit to obtain reasonable assurance about whether the financial statements and financial highlights are free of material misstatement, whether due to error or fraud. Our audits included performing procedures to assess the risks of material misstatement of the financial statements and financial highlights, whether due to error or fraud, and performing procedures that respond to those risks. Such procedures included examining, on a test basis, evidence regarding the amounts and disclosures in the financial statements and financial highlights. Such procedures also included confirmation of securities owned as of July 31, 2020, by correspondence with the custodian and transfer agent. Our audits also included evaluating the accounting principles used and significant estimates made by management, as well as evaluating the overall presentation of the financial statements and financial highlights. We believe that our audits provide a reasonable basis for our opinion.

We have not been able to determine the specific year that we began serving as the auditor of one or more Wells Fargo Funds investment companies; however we are aware that we have served as the auditor of one or more Wells Fargo Funds investment companies since at least 1955.
Boston, Massachusetts
September 25, 2020
30 | Wells Fargo Large Cap Core Fund
Table of Contents
TAX INFORMATION
For corporate shareholders, pursuant to Section 854 of the Internal Revenue Code, 100% of ordinary income dividends qualify for the corporate dividends-received deduction for the fiscal year ended July 31, 2020.
Pursuant to Section 852 of the Internal Revenue Code, $132,313,474 was designated as a 20% rate gain distribution for the fiscal year ended July 31, 2020. Long-term capital gains in the amount of $12,313,322 were distributed in connection with Fund share redemptions.
Pursuant to Section 854 of the Internal Revenue Code, $13,476,743 of income dividends paid during the fiscal year ended July 31, 2020 has been designated as qualified dividend income (QDI).
PROXY VOTING INFORMATION
A description of the policies and procedures used to determine how to vote proxies relating to portfolio securities is available, upon request, by calling 1-800-222-8222, visiting our website at wfam.com, or visiting the SEC website at sec.gov. Information regarding how the proxies related to portfolio securities were voted during the most recent 12-month period ended June 30 is available on the website at wfam.com or by visiting the SEC website at sec.gov.
QUARTERLY PORTFOLIO HOLDINGS INFORMATION
The Fund files its complete schedule of portfolio holdings with the SEC for the first and third quarters of each fiscal year as an exhibit to its reports on Form N-PORT. Shareholders may view the filed Form N-PORT by visiting the SEC website at sec.gov.
Wells Fargo Large Cap Core Fund | 31
Table of Contents
Other information (unaudited)
BOARD OF TRUSTEES AND OFFICERS
Each of the Trustees and Officers1 listed in the table below acts in identical capacities for each fund in the Wells Fargo family of funds, which consists of 147 mutual funds comprising the Wells Fargo Funds Trust, Wells Fargo Variable Trust, Wells Fargo Master Trust and four closed-end funds (collectively the “Fund Complex”). This table should be read in conjunction with the Prospectus and the Statement of Additional Information2. The mailing address of each Trustee and Officer is 525 Market Street, 12th Floor, San Francisco, CA 94105. Each Trustee and Officer serves an indefinite term, however, each Trustee serves such term until reaching the mandatory retirement age established by the Trustees.
Independent Trustees
Name and year of birth | Position held and length of service* | Principal occupations during past five years or longer | Current other public company or investment company directorships | |||
| William R. Ebsworth (Born 1957) | Trustee, since 2015 | Retired. From 1984 to 2013, equities analyst, portfolio manager, research director and chief investment officer at Fidelity Management and Research Company in Boston, Tokyo, and Hong Kong, and retired in 2013 as Chief Investment Officer of Fidelity Strategic Advisers, Inc. where he led a team of investment professionals managing client assets. Prior thereto, Board member of Hong Kong Securities Clearing Co., Hong Kong Options Clearing Corp., the Thailand International Fund, Ltd., Fidelity Investments Life Insurance Company, and Empire Fidelity Investments Life Insurance Company. Audit Committee Chair and Investment Committee Chair of the Vincent Memorial Hospital Endowment (non-profit organization). Mr. Ebsworth is a CFA® charterholder. | N/A | |||
| Jane A. Freeman (Born 1953) | Trustee, since 2015; Chair Liaison, | Retired. From 2012 to 2014 and 1999 to 2008, Chief Financial Officer of Scientific Learning Corporation. From 2008 to 2012, Ms. Freeman provided consulting services related to strategic business projects. Prior to 1999, Portfolio Manager at Rockefeller & Co. and Scudder, Stevens & Clark. Board member of the Harding Loevner Funds from 1996 to 2014, serving as both Lead Independent Director and chair of the Audit Committee. Board member of the Russell Exchange Traded Funds Trust from 2011 to 2012 and the chair of the Audit Committee. Ms. Freeman is also an inactive Chartered Financial Analyst. | N/A | |||
| Isaiah Harris, Jr. (Born 1952) | Trustee, since 2009; Audit Committee Chairman, since 2019 | Retired. Chairman of the Board of CIGNA Corporation since 2009, and Director since 2005. From 2003 to 2011, Director of Deluxe Corporation. Prior thereto, President and CEO of BellSouth Advertising and Publishing Corp. from 2005 to 2007, President and CEO of BellSouth Enterprises from 2004 to 2005 and President of BellSouth Consumer Services from 2000 to 2003. Emeritus member of the Iowa State University Foundation Board of Governors. Emeritus Member of the Advisory Board of Iowa State University School of Business. Advisory Board Member, Palm Harbor Academy (private school). Advisory Board Member, Child Evangelism Fellowship (non-profit). Mr. Harris is a certified public accountant (inactive status). | CIGNA Corporation | |||
| Judith M. Johnson (Born 1949) | Trustee, since 2008; Audit Committee Chairman, from 2009 to 2018 | Retired. Prior thereto, Chief Executive Officer and Chief Investment Officer of Minneapolis Employees Retirement Fund from 1996 to 2008. Ms. Johnson is an attorney, certified public accountant and a certified managerial accountant. | N/A | |||
32 | Wells Fargo Large Cap Core Fund
Table of Contents
Other information (unaudited)
Name and year of birth | Position held and length of service* | Principal occupations during past five years or longer | Current other public company or investment company directorships | |||
| David F. Larcker (Born 1950) | Trustee, since 2009 | James Irvin Miller Professor of Accounting at the Graduate School of Business, Stanford University, Director of the Corporate Governance Research Initiative and Senior Faculty of The Rock Center for Corporate Governance since 2006. From 2005 to 2008, Professor of Accounting at the Graduate School of Business, Stanford University. Prior thereto, Ernst & Young Professor of Accounting at The Wharton School, University of Pennsylvania from 1985 to 2005. | N/A | |||
| Olivia S. Mitchell (Born 1953) | Trustee, since 2006; Nominating and Governance Committee Chair, since 2018 | International Foundation of Employee Benefit Plans Professor, Wharton School of the University of Pennsylvania since 1993. Director of Wharton’s Pension Research Council and Boettner Center on Pensions & Retirement Research, and Research Associate at the National Bureau of Economic Research. Previously, Cornell University Professor from 1978 to 1993. | N/A | |||
| Timothy J. Penny (Born 1951) | Trustee, since 1996; Chairman, since 2018 | President and Chief Executive Officer of Southern Minnesota Initiative Foundation, a non-profit organization, since 2007. Member of the Board of Trustees of NorthStar Education Finance, Inc., a non-profit organization, since 2007. | N/A | |||
| James G. Polisson (Born 1959) | Trustee, since 2018 | Retired. Chief Marketing Officer, Source (ETF) UK Services, Ltd, from 2015 to 2017. From 2012 to 2015, Principal of The Polisson Group, LLC, a management consulting, corporate advisory and principal investing company. Chief Executive Officer and Managing Director at Russell Investments, Global Exchange Traded Funds from 2010 to 2012. Managing Director of Barclays Global Investors from 1998 to 2010 and Global Chief Marketing Officer for iShares and Barclays Global Investors from 2000 to 2010. Trustee of the San Francisco Mechanics’ Institute, a non-profit organization, from 2013 to 2015. Board member of the Russell Exchange Traded Fund Trust from 2011 to 2012. Director of Barclays Global Investors Holdings Deutschland GmbH from 2006 to 2009. Mr. Polisson is an attorney and has a retired status with the Massachusetts and District of Columbia Bar Associations. | N/A | |||
| Pamela Wheelock (Born 1959) | Trustee, since January 2020; previously Trustee from January 2018 to July 2019 | Board member of the Destination Medical Center Economic Development Agency, Rochester, Minnesota since 2019 and Interim President of the McKnight Foundation since 2020. Acting Commissioner, Minnesota Department of Human Services, July 2019 through September 2019. Human Services Manager (part-time), Minnesota Department of Human Services, October 2019 through December 2019. Chief Operating Officer, Twin Cities Habitat for Humanity from 2017 to 2019. Vice President of University Services, University of Minnesota from 2012 to 2016. Prior thereto, on the Board of Directors, Governance Committee and Finance Committee for the Minnesota Philanthropy Partners (Saint Paul Foundation) from 2012 to 2018, Interim Chief Executive Officer of Blue Cross Blue Shield of Minnesota from 2011 to 2012, Chairman of the Board from 2009 to 2012 and Board Director from 2003 to 2015. Vice President, Leadership and Community Engagement, Bush Foundation, Saint Paul, Minnesota (a private foundation) from 2009 to 2011. Executive Vice President and Chief Financial Officer, Minnesota Sports and Entertainment from 2004 to 2009 and Senior Vice President from 2002 to 2004. Executive Vice President of the Minnesota Wild Foundation from 2004 to 2008. Commissioner of Finance, State of Minnesota, from 1999 to 2002. Currently Board Chair of the Minnesota Wild Foundation since 2010. | N/A | |||
| * | Length of service dates reflect the Trustee’s commencement of service with the Trust’s predecessor entities, where applicable. |
Wells Fargo Large Cap Core Fund | 33
Table of Contents
Other information (unaudited)
Officers
Name and year of birth | Position held and length of service | Principal occupations during past five years or longer | ||
Andrew Owen (Born 1960) | President, since 2017 | Executive Vice President of Wells Fargo & Company and Head of Affiliated Managers, Wells Fargo Asset Management, since 2014. In addition, Mr. Owen is currently President, Chief Executive Officer and Director of Wells Fargo Funds Management, LLC since 2017. Prior thereto, Executive Vice President responsible for marketing, investments and product development for Wells Fargo Funds Management, LLC, from 2009 to 2014. | ||
| Jeremy DePalma1 (Born 1974) | Treasurer, since 2012 | Senior Vice President of Wells Fargo Funds Management, LLC since 2009. Senior Vice President of Evergreen Investment Management Company, LLC from 2008 to 2010 and head of the Fund Reporting and Control Team within Fund Administration from 2005 to 2010. | ||
Michelle Rhee (Born 1966) | Chief Legal Officer, since 2019 | Secretary of Wells Fargo Funds Management, LLC, Chief Legal Counsel of Wells Fargo Asset Management and Assistant General Counsel of Wells Fargo Bank, N.A. since 2018. Associate General Counsel and Managing Director of Bank of America Corporation from 2004 to 2018. | ||
| Catherine Kennedy (Born 1969) | Secretary, since 2019 | Vice President of Wells Fargo Funds Management, LLC and Senior Counsel of the Wells Fargo Legal Department since 2010. Vice President and Senior Counsel of Evergreen Investment Management Company, LLC from 1998 to 2010. | ||
| Michael H. Whitaker (Born 1967) | Chief Compliance Officer, since 2016 | Chief Compliance Officer of Wells Fargo Asset Management since 2016. Senior Vice President and Chief Compliance Officer for Fidelity Investments from 2007 to 2016. | ||
David Berardi (Born 1975) | Assistant Treasurer, since 2009 | Vice President of Wells Fargo Funds Management, LLC since 2009. Vice President of Evergreen Investment Management Company, LLC from 2008 to 2010. Manager of Fund Reporting and Control for Evergreen Investment Management Company, LLC from 2004 to 2010. | ||
| 1 | Jeremy DePalma acts as Treasurer of 82 funds and Assistant Treasurer of 65 funds in the Fund Complex. |
| 2 | The Statement of Additional Information includes additional information about the Trustees and is available, without charge, upon request, by calling 1-800-222-8222 or by visiting the website at wfam.com. |
34 | Wells Fargo Large Cap Core Fund
Table of Contents
Other information (unaudited)
BOARD CONSIDERATION OF INVESTMENT MANAGEMENT AND SUB-ADVISORY AGREEMENTS:
Wells Fargo Large Cap Core Fund
Under the Investment Company Act of 1940 (the “1940 Act”), the Board of Trustees (the “Board”) of Wells Fargo Funds Trust (the “Trust”) must determine annually whether to approve the continuation of the Trust’s investment management and sub-advisory agreements. In this regard, at a Board meeting held on May 26, 2020 and May 28, 2020 (together, the “Meeting”), the Board, all the members of which have no direct or indirect interest in the investment management and sub-advisory agreements and are not “interested persons” of the Trust, as defined in the 1940 Act (the “Independent Trustees”), reviewed and approved for Wells Fargo Large Cap Core Fund (the “Fund”): (i) an investment management agreement (the “Management Agreement”) with Wells Fargo Funds Management, LLC (“Funds Management”); and (ii) an investment sub-advisory agreement (the “Sub-Advisory Agreement”) with Wells Capital Management Incorporated (the “Sub-Adviser”), an affiliate of Funds Management. The Management Agreement and the Sub-Advisory Agreement are collectively referred to as the “Advisory Agreements.”
At the Meeting, the Board considered the factors and reached the conclusions described below relating to the selection of Funds Management and the Sub-Adviser and the approval of the Advisory Agreements. Prior to the Meeting, including at a Board meeting held in April 2020, the Trustees conferred extensively among themselves and with representatives of Funds Management about these matters. Also, the Board has adopted a team-based approach, with each team consisting of a sub-set of Trustees, to assist the full Board in the discharge of its duties in reviewing investment performance and other matters throughout the year. The Independent Trustees were assisted in their evaluation of the Advisory Agreements by independent legal counsel, from whom they received separate legal advice and with whom they met separately.
In providing information to the Board, Funds Management and the Sub-Adviser were guided by a detailed set of requests for information submitted to them by independent legal counsel on behalf of the Independent Trustees at the start of the Board’s annual contract renewal process earlier in 2020. In considering and approving the Advisory Agreements, the Trustees considered the information they believed relevant, including but not limited to the information discussed below. The Board considered not only the specific information presented in connection with the Meeting, but also the knowledge gained over time through interaction with Funds Management and the Sub-Adviser about various topics. In this regard, the Board reviewed reports of Funds Management at each of its quarterly meetings, which included, among other things, portfolio reviews and investment performance reports. In addition, the Board and the teams mentioned above confer with portfolio managers at various times throughout the year. The Board did not identify any particular information or consideration that was all-important or controlling, and each individual Trustee may have attributed different weights to various factors.
After its deliberations, the Board unanimously approved the continuation of the Advisory Agreements for a one-year term and determined that the compensation payable to Funds Management and the Sub-Adviser under each of the Advisory Agreements was reasonable. The Board considered the approval of the Advisory Agreements for the Fund as part of its consideration of agreements for funds across the complex, but its approvals were made on a fund-by-fund basis. The following summarizes a number of important, but not necessarily all, factors considered by the Board in support of its approvals.
Nature, extent and quality of services
The Board received and considered various information regarding the nature, extent and quality of services provided to the Fund by Funds Management and the Sub-Adviser under the Advisory Agreements. This information included a description of the investment advisory services and Fund-level administrative services covered by the Management Agreement, as well as, among other things, a summary of the background and experience of senior management of Wells Fargo Asset Management (“WFAM”), of which Funds Management and the Sub-Adviser are a part, and a summary of investments made in the business of WFAM. The Board also received a description of Funds Management’s and the Sub-Adviser’s business continuity plans and of their approaches to data privacy and cybersecurity, and related testing. The Board also received and reviewed information about Funds Management’s role as administrator of the Fund’s liquidity risk management program, Funds Management’s approach to risk management, and Funds Management’s intermediary and vendor oversight program.
The Board also considered the qualifications, background, tenure and responsibilities of each of the portfolio managers primarily responsible for the day-to-day portfolio management of the Fund. The Board evaluated the ability of Funds Management and the Sub-Adviser to attract and retain qualified investment professionals, including research, advisory and supervisory personnel. The Board further considered the compliance programs and compliance records of Funds Management and the Sub-Adviser. In addition, the Board took into account the full range of services provided to the Fund by Funds Management and its affiliates.
Wells Fargo Large Cap Core Fund | 35
Table of Contents
Other information (unaudited)
Fund investment performance and expenses
The Board considered the investment performance results for the Fund over various time periods ended December 31, 2019. The Board also considered more current results for various time periods ended March 31, 2020. The Board considered these results in comparison to the investment performance of funds in a universe that was determined by Broadridge Inc. (“Broadridge”) to be similar to the Fund (the “Universe”), and in comparison to the Fund’s benchmark index and to other comparative data. Broadridge is an independent provider of investment company data. The Board received a description of the methodology used by Broadridge to select the mutual funds in the performance Universe. The Board noted that the investment performance of the Fund (Class A) was lower than the average investment performance of the Universe for the one-year period ended December 31, 2019, and higher than the average investment performance of the Universe for the three-, five- and ten-year periods ended December 31, 2019. The Board also noted that the investment performance of the Fund (Administrator Class) was in range of or higher than the average investment performance of the Universe for the three-, five- and ten-year periods ended March 31, 2020, and lower than the average investment performance for the one-year period ended March 31, 2020. The Board also noted that the investment performance of the Fund was lower than its benchmark index, the S&P 500 Index, for all periods ended December 31, 2019. The Board also noted that the investment performance of the Fund was lower than its benchmark index, the S&P 500 Index, for all periods ended March 31, 2020.
The Board received information concerning, and discussed factors contributing to, the underperformance of the Fund relative to its benchmark for the periods identified above. The Board took note of the explanations for the relative underperformance during these periods, including with respect to investment decisions and market factors that affected the Fund’s investment performance. The Board also took note of the Fund’s outperformance relative to the Universe over the longer time periods under review.
The Board also received and considered information regarding the Fund’s net operating expense ratios and their various components, including actual management fees, custodian and other non-management fees, and Rule 12b-1 and non-Rule 12b-1 shareholder service fees. The Board considered these ratios in comparison to the median ratios of funds in class-specific expense groups that were determined by Broadridge to be similar to the Fund (the “Groups”). The Board received a description of the methodology used by Broadridge to select the mutual funds in the expense Groups and an explanation of how funds comprising expense groups and their expense ratios may vary from year-to-year. Based on the Broadridge reports, the Board noted that the net operating expense ratios of the Fund were lower than the median net operating expense ratios of the expense Groups for each share class.
The Board took into account the Fund’s investment performance and expense information provided to it among the factors considered in deciding to re-approve the Advisory Agreements.
Investment management and sub-advisory fee rates
The Board reviewed and considered the contractual fee rates payable by the Fund to Funds Management under the Management Agreement, as well as the contractual fee rates payable by the Fund to Funds Management for class-level administrative services under a Class-Level Administration Agreement, which include, among other things, class-level transfer agency and sub-transfer agency costs (collectively, the “Management Rates”). The Board also reviewed and considered the contractual investment sub-advisory fee rates that are payable by Funds Management to the Sub-Adviser for investment sub-advisory services.
Among other information reviewed by the Board was a comparison of the Fund’s Management Rates with the average contractual investment management fee rates of funds in the expense Groups at a common asset level as well as transfer agency costs of the funds in the expense Groups. The Board noted that the Management Rates of the Fund were in range of the sum of these average rates for the Fund’s expense Groups for all share classes.
The Board also received and considered information about the portion of the total management fee that was retained by Funds Management after payment of the fee to the Sub-Adviser for sub-advisory services. In assessing the reasonableness of this amount, the Board received and evaluated information about the nature and extent of responsibilities retained and risks assumed by Funds Management and not delegated to or assumed by the Sub-Adviser, and about Funds Management’s on-going oversight services. Given the affiliation between Funds Management and the Sub-Adviser, the Board ascribed limited relevance to the allocation of fees between them.
The Board also received and considered information about the nature and extent of services offered and fee rates charged by Funds Management and the Sub-Adviser to other types of clients with investment strategies similar to those of the Fund. In this regard, the Board received information about the significantly greater scope of services, and compliance, reporting and other legal burdens and risks of managing proprietary mutual funds compared with those associated with managing assets of other types of clients, including third-party sub-advised fund clients and non-mutual fund clients such as institutional separate accounts.
36 | Wells Fargo Large Cap Core Fund
Table of Contents
Other information (unaudited)
Based on its consideration of the factors and information it deemed relevant, including those described here, the Board determined that the compensation payable to Funds Management under the Management Agreement and to the Sub-Adviser under the Sub-Advisory Agreement was reasonable.
Profitability
The Board received and considered information concerning the profitability of Funds Management, as well as the profitability of both WFAM and Wells Fargo & Co. (“Wells Fargo”) from providing services to the fund family as a whole. The Board noted that the Sub-Adviser’s profitability information with respect to providing services to the Fund and other funds in the family was subsumed in the WFAM and Wells Fargo profitability analysis.
Funds Management reported on the methodologies and estimates used in calculating profitability, including a description of the methodology used to allocate certain expenses. Among other things, the Board noted that the levels of profitability reported on a fund-by-fund basis varied widely, depending on factors such as the size, type and age of fund.
Based on its review, the Board did not deem the profits reported by Funds Management, WFAM or Wells Fargo from services provided to the Fund to be at a level that would prevent it from approving the continuation of the Advisory Agreements.
Economies of scale
The Board received and considered information about the potential for Funds Management to experience economies of scale in the provision of management services to the Fund, the difficulties of calculating economies of scale at an individual fund level, and the extent to which potential scale benefits are shared with shareholders. The Board noted the existence of breakpoints in the Fund’s management fee structure, which operate generally to reduce the Fund’s expense ratios as the Fund grows in size, and the size of the Fund in relation to such breakpoints. The Board considered that in addition to management fee breakpoints, Funds Management shares potential economies of scale from its management business in a variety of ways, including through fee waiver and expense reimbursement arrangements, services that benefit shareholders, competitive management fee rates set at the outset without regard to breakpoints, and investments in the business intended to enhance services available to shareholders.
The Board concluded that Funds Management’s arrangements with respect to the Fund, including contractual breakpoints, constituted a reasonable approach to sharing potential economies of scale with the Fund and its shareholders.
Other benefits to Funds Management and the Sub-Adviser
The Board received and considered information regarding potential “fall-out” or ancillary benefits received by Funds Management and its affiliates, including the Sub-Adviser, as a result of their relationships with the Fund. Ancillary benefits could include, among others, benefits directly attributable to other relationships with the Fund and benefits potentially derived from an increase in Funds Management’s and the Sub-Adviser’s business as a result of their relationships with the Fund. The Board noted that various affiliates of Funds Management may receive distribution-related fees, shareholder servicing payments and sub-transfer agency fees in respect of shares sold or held through them and services provided.
The Board also reviewed information about soft dollar credits earned and utilized by the Sub-Adviser, fees earned by Funds Management and the Sub-Adviser from managing a private investment vehicle for the fund family’s securities lending collateral, and commissions earned by an affiliated broker from portfolio transactions.
Based on its consideration of the factors and information it deemed relevant, including those described here, the Board did not find that any ancillary benefits received by Funds Management and its affiliates, including the Sub-Adviser, were unreasonable.
Conclusion
At the Meeting, after considering the above-described factors and based on its deliberations and its evaluation of the information described above, the Board unanimously approved the continuation of the Advisory Agreements for a one-year term and determined that the compensation payable to Funds Management and the Sub-Adviser under each of the Advisory Agreements was reasonable.
Wells Fargo Large Cap Core Fund | 37
Table of Contents
Other information (unaudited)
LIQUIDITY RISK MANAGEMENT PROGRAM
In accordance with Rule 22e-4 under the Investment Company Act of 1940, as amended (the “Liquidity Rule”), Wells Fargo Funds Trust (the “Trust”) has adopted and implemented a liquidity risk management program (the “Program”) on behalf of each of its series, including the Fund, which is reasonably designed to assess and manage the Fund’s liquidity risk. “Liquidity risk” is defined as the risk that the Fund is unable to meet redemption requests without significantly diluting remaining investors’ interests in the Fund. The Trust’s Board of Trustees (the “Board”) previously approved the designation of Wells Fargo Funds Management, LLC (“Funds Management”), the Fund’s investment manager, as the administrator of the Program, and Funds Management has established a Liquidity Risk Management Council composed of personnel from multiple departments within Funds Management and its affiliates to assist Funds Management in the implementation and on-going administration of the Program.
The Program is comprised of various components designed to support the assessment and/or management of liquidity risk, including: (1) the periodic assessment (no less frequently than annually) of certain factors that influence the Fund’s liquidity risk; (2) the periodic classification (no less frequently than monthly) of the Fund’s investments into one of four liquidity categories that reflect an estimate of their liquidity under current market conditions; (3) a 15% limit on the acquisition of “illiquid investments” (as defined under the Liquidity Rule); (4) to the extent the Fund does not invest primarily in “highly liquid investments” (as defined under the Liquidity Rule), the determination of a minimum percentage of the Fund’s assets that generally will be invested in highly liquid investments (an “HLIM”); (5) if the Fund has established an HLIM, the periodic review (no less frequently than annually) of the HLIM and the adoption of policies and procedures for responding to a shortfall of the Fund’s “highly liquid investments” below its HLIM; and (6) periodic reporting to the Board.
At a meeting of the Board held on May 26 and 28, 2020, the Board received a written report (the “Report”) from Funds Management that addressed the operation of the Program and assessed its adequacy and effectiveness of implementation. The Report covered the initial period from December 1, 2018 through December 31, 2019 (the “Reporting Period”). No significant liquidity events impacting the Fund were noted in the Report. There were no material changes to the Program during the Reporting Period. The Report concluded that the Program is operating effectively to assess and manage the Fund’s liquidity risk, and that the Program has been and continues to be adequately and effectively implemented to monitor and, as applicable, respond to the Fund’s liquidity developments.
There can be no assurance that the Program will achieve its objectives under all circumstances in the future. Please refer to the Fund’s prospectus for more information regarding the Fund’s exposure to liquidity risk and other risks to which an investment in the Fund may be subject.
38 | Wells Fargo Large Cap Core Fund
Table of Contents
Effective on or after May 1, 2020, clients of Edward Jones (also referred to as “shareholders”) purchasing Fund shares on the Edward Jones commission and fee-based platforms are eligible only for the following sales charge discounts (also referred to as “breakpoints”) and waivers, which can differ from breakpoints and waivers described elsewhere in the Fund’s Prospectus or SAI or through another broker-dealer. In all instances, it is the shareholder’s responsibility to inform Edward Jones at the time of purchase of any relationship, holdings of Wells Fargo Funds or other facts qualifying the purchaser for breakpoints or waivers. Edward Jones can ask for documentation of such circumstance.
| Breakpoints available at Edward Jones |
| Rights of Accumulation (ROA) |
The applicable sales charge on a purchase of Class A shares is determined by taking into account all share classes (except any money market funds and retirement plan share classes) of Wells Fargo Funds held by the shareholder or in an account grouped by Edward Jones with other accounts for the purpose of providing certain pricing considerations (“pricing groups”). This includes all share classes held on the Edward Jones platform and/or held on another platform. The inclusion of eligible fund family assets in the rights of accumulation calculation is dependent on the shareholder notifying his or her financial advisor of such assets at the time of calculation. |
ROA is determined by calculating the higher of cost or market value (current shares x NAV). |
| Letter of Intent (LOI) |
Through a LOI, shareholders can receive the sales charge and breakpoint discounts for purchases shareholders intend to makeover a 13-month period from the date Edward Jones receives the LOI. The LOI is determined by calculating the higher of cost or market value of qualifying holdings at LOI initiation in combination with the value that the shareholder intends to buy over a 13-month period to calculate the front-end sales charge and any breakpoint discounts. Each purchase the shareholder makes during that 13-month period will receive the sales charge and breakpoint discount that applies to the total amount. The inclusion of eligible fund family assets in the LOI calculation is dependent on the shareholder notifying his or her financial advisor of such assets at the time of calculation. Purchases made before the LOI is received by Edward Jones are not covered under the LOI and will not reduce the sales charge previously paid. Sales charges will be adjusted if LOI is not met. |
| Sales charges are waived for the following shareholders and in the following situations at Edward Jones: |
● Associates of Edward Jones and its affiliates and their family members who are in the same pricing group (as determined by Edward Jones under its policies and procedures) as the associate. This waiver will continue for the remainder of the associate’s life if the associate retires from Edward Jones in good-standing. |
● Shares purchased in an Edward Jones fee-based program. |
● Shares purchased through reinvestment of capital gains distributions and dividend reinvestment. |
● Shares purchased from the proceeds of redeemed shares of the same fund family so long as the following conditions are met: 1)the proceeds are from the sale of shares within 60 days of the purchase, and 2) the sale and purchase are made in the same share class and the same account or the purchase is made in an individual retirement account with proceeds from liquidations in anon-retirement account. |
● Shares exchanged into Class A shares from another share class so long as the exchange is into the same fund and was initiated at the discretion of Edward Jones. Edward Jones is responsible for any remaining CDSC due to the fund company, if applicable. Any future purchases are subject to the applicable sales charge as disclosed in the prospectus. |
● Exchanges from Class C shares to Class A shares of the same fund, generally, in the 84th month following the anniversary of the purchase date or earlier at the discretion of Edward Jones. |
| If the shareholder purchases shares that are subject to a CDSC and those shares are redeemed before the CDSC is expired, the shareholder is responsible to pay the CDSC except in the following conditions available at Edward Jones: |
● The death or disability of the shareholder. |
● Systematic withdrawals with up to 10% per year of the account value. |
● Return of excess contributions from an Individual Retirement Account (IRA). |
● Shares sold as part of a required minimum distribution for IRA and retirement accounts if the redemption is taken in or after the year the shareholder reaches qualified age based on applicable IRS regulation. |
● Shares sold to pay Edward Jones fees or costs in such cases where the transaction is initiated by Edward Jones. |
● Shares exchanged in an Edward Jones fee-based program. |
● Shares acquired through NAV reinstatement. |
Wells Fargo Large Cap Core Fund | 39
Table of Contents
Appendix I (unaudited)
| Other Important Information for accounts at Edward Jones: |
| Minimum Purchase Amounts |
● $250 initial purchase minimum |
● $50 subsequent purchase minimum |
| Minimum Balances |
| Edward Jones has the right to redeem at its discretion fund holdings with a balance of $250 or less. The following are examples of accounts that are not included in this policy: |
● A fee-based account held on an Edward Jones platform |
● A 529 account held on an Edward Jones platform |
● An account with an active systematic investment plan or letter of intent (LOI) |
| Changing Share Classes |
| At any time it deems necessary, Edward Jones has the authority to exchange at NAV a shareholder’s holdings in a fund to Class A shares. |
40 | Wells Fargo Large Cap Core Fund
Table of Contents
Effective June 1, 2020, shareholders purchasing Fund shares through an Oppenheimer & Co. Inc. (“Oppenheimer”) platform or account are eligible only for the following load waivers (front-end sales charge waivers and contingent deferred or back-end, sales charge waivers) and discounts, which may differ from those disclosed in the Fund’s Prospectus or SAI.
| Front-end sales load waivers on Class A shares available at Oppenheimer |
| Employer-sponsored retirement, deferred compensation and employee benefit plans (including health savings accounts) and trusts used to fund those plans, provided that the shares are not held in a commission-based brokerage account and shares are held for the benefit of the plan. |
| Shares purchased by or through a 529 Plan. |
| Shares purchased through an Oppenheimer affiliated investment advisory program. |
| Shares purchased through reinvestment of capital gains distributions and dividend reinvestment when purchasing shares of the same fund (but not any other fund within the fund family). |
| Shares purchased from the proceeds of redemptions within the same fund family, provided (1) the repurchase occurs within 90 days following the redemption, (2) the redemption and purchase occur in the same account, and (3) redeemed shares were subject to a front-end or deferred sales load (known as Rights of Restatement). |
| A shareholder in the Fund’s Class C shares will have their shares exchanged at net asset value to Class A shares (or the appropriate share class) of the Fund if the shares are no longer subject to a CDSC and the exchange is in line with the policies and procedures of Oppenheimer. |
| Employees and registered representatives of Oppenheimer or its affiliates and their family members. |
| Directors or Trustees of the Fund, and employees of the Fund’s investment adviser or any of its affiliates, as described in the Prospectus. |
| CDSC waivers on A and C shares available at Oppenheimer |
| Death or disability of the shareholder. |
| Shares sold as part of a systematic withdrawal plan as described in the Prospectus. |
| Return of excess contributions from an IRA Account. |
| Shares sold as part of a required minimum distribution for IRA and retirement accounts due to the shareholder reaching the qualified age based on applicable IRS regulations as described in the Prospectus. |
| Shares sold to pay Oppenheimer fees but only if the transaction is initiated by Oppenheimer. |
| Shares acquired through a right of reinstatement. |
| Front-end load discounts available at Oppenheimer: breakpoints, rights of accumulation & letters of intent |
| Breakpoints as described in the Prospectus. |
| Rights of Accumulation (ROA), which entitle shareholders to breakpoint discounts, will be automatically calculated based on the aggregated holding of fund family assets held by accounts within the purchaser’s household at Oppenheimer. Eligible fund family assets not held at Oppenheimer may be included in the ROA calculation only if the shareholder notifies his or her financial advisor about such assets. |
Wells Fargo Large Cap Core Fund | 41
Table of Contents
Effective June 15, 2020, shareholders purchasing fund shares through a Robert W. Baird & Co. (“Baird”) platform or account will only be eligible for the following sales charge waivers (front-end sales charge waivers and CDSC waivers) and discounts, which may differ from those disclosed elsewhere in the Fund’s Prospectus or the SAI.
| Front-end sales load waivers on Class A shares available at Baird |
| Shares purchased through reinvestment of capital gains distributions and dividend reinvestment when purchasing share of the same fund. |
| Share purchase by employees and registers representatives of Baird or its affiliate and their family members as designated by Baird. |
| Shares purchase from the proceeds of redemptions within the same fund family, provided (1) the repurchase occurs within 90 days following the redemption, (2) the redemption and purchase occur in the same accounts, and (3) redeemed shares were subject to a front-end or deferred sales charge (known as rights of reinstatement). |
| A shareholder in the Funds Investor C Shares will have their share exchanged at net asset value to Investor A shares of the fund if the shares are no longer subject to CDSC and the exchange is in line with the policies and procedures of Baird. |
| Employer-sponsored retirement plans or charitable accounts in a transactional brokerage account at Baird, including 401(k)plans, 457 plans, employer-sponsored 403(b) plans, profit sharing and money purchase pension plans and defined benefit plans. For purposes of this provision, employer-sponsored retirement plans do not include SEP IRAs, Simple IRAs or SAR-SEPs. |
| CDSC waivers on A and C shares available at Baird |
| Shares sold due to death or disability of the shareholder. |
| Shares sold as part of a systematic withdrawal plan as described in the Fund’s Prospectus. |
| Shares bought due to returns of excess contributions from an IRA Account. |
| Shares sold as part of a required minimum distribution for IRA and retirement accounts due to the shareholder reaching age 72as described in the Fund’s Prospectus. |
| Shares sold to pay Baird fees but only if the transaction is initiated by Baird. |
| Shares acquired through a right of reinstatement. |
| Front-end load discounts available at Baird: breakpoint and/or rights of accumulation |
| Breakpoints as described in the Prospectus. |
| Rights of accumulations which entitles shareholders to breakpoint discounts will be automatically calculated based on the aggregated holding of fund family assets held by accounts within the purchaser’s household at Baird. Eligible fund family assets not held at Baird may be included in the rights of accumulations calculation only if the shareholder notifies his or her financial advisor about such assets. |
| Letters of Intent (LOI) allow for breakpoint discounts based on anticipated purchases within a fund family through Baird, over a13-month period of time. |
42 | Wells Fargo Large Cap Core Fund
Table of Contents
This page is intentionally left blank.
Table of Contents
This page is intentionally left blank.
Table of Contents
For more information
More information about Wells Fargo Funds is available free upon request. To obtain literature, please write, visit the Fund’s website, or call:
Wells Fargo Funds
P.O. Box 219967
Kansas City, MO 64121-9967
Website: wfam.com
Individual investors: 1-800-222-8222
Retail investment professionals: 1-888-877-9275
Institutional investment professionals: 1-866-765-0778

This report and the financial statements contained herein are submitted for the general information of the shareholders of the Fund. If this report is used for promotional purposes, distribution of the report must be accompanied or preceded by a current prospectus. Before investing, please consider the investment objectives, risks, charges, and expenses of the investment. For a current prospectus and, if available, a summary prospectus, containing this information, call 1-800-222-8222 or visit the Fund’s website at wfam.com. Read the prospectus carefully before you invest or send money.
Wells Fargo Asset Management (WFAM) is the trade name for certain investment advisory/management firms owned by Wells Fargo & Company. These firms include but are not limited to Wells Capital Management Incorporated and Wells Fargo Funds Management, LLC. Certain products managed by WFAM entities are distributed by Wells Fargo Funds Distributor, LLC (a broker-dealer and Member FINRA).
This material is for general informational and educational purposes only and is NOT intended to provide investment advice or a recommendation of any kind—including a recommendation for any specific investment, strategy, or plan.
INVESTMENT PRODUCTS: NOT FDIC INSURED ◾ NO BANK GUARANTEE ◾ MAY LOSE VALUE
© 2020 Wells Fargo & Company. All rights reserved
PAR-0820-01038 09-20
A208/AR208 07-20
Table of Contents

Annual Report
July 31, 2020
Wells Fargo Large Cap Growth Fund
Beginning on January 1, 2021, as permitted by new regulations adopted by the Securities and Exchange Commission, paper copies of the Wells Fargo Funds’ annual and semi-annual shareholder reports issued after this date will no longer be sent by mail, unless you specifically request paper copies of the reports. Instead, the reports will be made available on the Funds’ website, and you will be notified by mail each time a report is posted and provided with a website address to access the report.
If you already elected to receive shareholder reports electronically, you will not be affected by this change and you need not take any action. You may elect to receive shareholder reports and other communications from the Fund electronically at any time by contacting your financial intermediary (such as a broker-dealer or bank) or, if you are a direct investor, by calling 1-800-222-8222 or by enrolling at wellsfargo.com/advantagedelivery.
You may elect to receive all future reports in paper free of charge. If you invest through a financial intermediary, you can contact your financial intermediary to request that you continue to receive paper copies of your shareholder reports; if you invest directly with the Fund, you can call 1-800-222-8222. Your election to receive reports in paper will apply to all Wells Fargo Funds held in your account with your financial intermediary or, if you are a direct investor, to all Wells Fargo Funds that you hold.
Table of Contents
|
Reduce clutter. Save trees. |
Sign up for electronic delivery of prospectuses and shareholder reports at wellsfargo.com/advantagedelivery |
The views expressed and any forward-looking statements are as of July 31, 2020, unless otherwise noted, and are those of the Fund managers and/or Wells Fargo Asset Management. Discussions of individual securities, or the markets generally, or any Wells Fargo Fund are not intended as individual recommendations. Future events or results may vary significantly from those expressed in any forward-looking statements. The views expressed are subject to change at any time in response to changing circumstances in the market. Wells Fargo Asset Management and the Fund disclaim any obligation to publicly update or revise any views expressed or forward-looking statements.
INVESTMENT PRODUCTS: NOT FDIC INSURED ◾ NO BANK GUARANTEE ◾ MAY LOSE VALUE
Wells Fargo Large Cap Growth Fund | 1
Table of Contents
Letter to shareholders (unaudited)

Andrew Owen
President
Wells Fargo Funds
Dear Shareholder:
We are pleased to offer you this annual report for the Wells Fargo Large Cap Growth Fund for the 12-month period that ended July 31, 2020. Global stock markets saw earlier gains erased in February and March as governments around the world took unprecedented measures, attempting to stop the spread of the coronavirus at the expense of short-term economic output. However, markets rebounded from April on to offset much of the losses as central banks attempted to bolster capital markets and confidence. Fixed-income markets generally performed well overall, achieving widespread gains. Overall, U.S. stocks surpassed their international peers, while U.S. large-cap equity, as measured by the Russell 1000® Index1, easily outperformed small caps, as measured by the Russell 2000® Index2, for the 12-month period that began last August.
For the 12-month period, fixed-income securities generally had positive total returns while non-U.S. developed market equities had the weakest performance and U.S. stocks performed strongly despite sharp volatility in the late winter and early spring. For the period, U.S. stocks, based on the S&P 500 Index,3 gained 11.96%. International stocks, as measured by the MSCI ACWI ex USA Index (Net),4 returned 0.66%, while the MSCI EM Index (Net)5 had somewhat stronger performance, with a 6.55% gain. For bond investors, the Bloomberg Barclays U.S. Aggregate Bond Index6 returned a robust 10.12%, the Bloomberg Barclays Global Aggregate ex-USD Index7 gained a more modest 5.94%, and the Bloomberg Barclays Municipal Bond Index8 gained 5.36% while the ICE BofA U.S. High Yield Index9 returned 3.10%.
The fiscal year began with supportive central bank actions.
The period began with unresolved U.S.-China trade tensions showing no signs of compromise in August 2019. Evidence of a continued global economic slowdown mounted, and central banks in China, New Zealand, and Thailand cut interest rates after the U.S. Federal Reserve (Fed) had done so in late July. Industrial and manufacturing data declined in China, Canada, Japan, and Germany. Adding to global uncertainty, Italy’s prime minister resigned, many feared a crackdown in Hong Kong as protestors sustained their calls for reform, and U.K. Prime Minister Boris Johnson planned to suspend Parliament as Brexit’s deadline neared.
| 1 | The Russell 1000® Index measures the performance of the 1,000 largest companies in the Russell 3000® Index, which represents approximately 92% of the total market capitalization of the Russell 3000® Index. You cannot invest directly in an index. |
| 2 | The Russell 2000® Index measures the performance of the 2,000 smallest companies in the Russell 3000® Index, which represents approximately 8% of the total market capitalization of the Russell 3000® Index. You cannot invest directly in an index. |
| 3 | The S&P 500 Index consists of 500 stocks chosen for market size, liquidity, and industry group representation. It is a market-value-weighted index with each stock’s weight in the index proportionate to its market value. You cannot invest directly in an index. |
| 4 | The Morgan Stanley Capital International (MSCI) All Country World Index (ACWI) ex USA Index (Net) is a free-float-adjusted market-capitalization-weighted index that is designed to measure the equity market performance of developed and emerging markets, excluding the United States. Source: MSCI. MSCI makes no express or implied warranties or representations and shall have no liability whatsoever with respect to any MSCI data contained herein. The MSCI data may not be further redistributed or used as a basis for other indices or any securities or financial products. This report is not approved, reviewed, or produced by MSCI. You cannot invest directly in an index. |
| 5 | The MSCI Emerging Markets (EM) Index (Net) is a free-float-adjusted market-capitalization-weighted index that is designed to measure equity market performance of emerging markets. You cannot invest directly in an index. |
| 6 | The Bloomberg Barclays U.S. Aggregate Bond Index is a broad-based benchmark that measures the investment-grade, U.S. dollar-denominated, fixed-rate taxable bond market, including Treasuries, government-related and corporate securities, mortgage-backed securities (agency fixed-rate and hybrid adjustable-rate mortgage pass-throughs), asset-backed securities, and commercial mortgage-backed securities. You cannot invest directly in an index. |
| 7 | The Bloomberg Barclays Global Aggregate ex-USD Index is an unmanaged index that provides a broad-based measure of the global investment-grade fixed-income markets excluding the U.S.-dollar-denominated debt market. You cannot invest directly in an index. |
| 8 | The Bloomberg Barclays Municipal Bond Index is an unmanaged index composed of long-term tax-exempt bonds with a minimum credit rating of Baa. You cannot invest directly in an index. |
| 9 | The ICE BofA U.S. High Yield Index is a market-capitalization-weighted index of domestic and Yankee high-yield bonds. The index tracks the performance of high-yield securities traded in the U.S. bond market. You cannot invest directly in an index. Copyright 2020. ICE Data Indices, LLC. All rights reserved. |
2 | Wells Fargo Large Cap Growth Fund
Table of Contents
Letter to shareholders (unaudited)
In the U.S., the Fed cut interest rates again in September. U.S. manufacturing data disappointed investors. The U.S. Congress announced it would pursue an impeachment investigation of President Trump. Meanwhile, the Brexit impasse showed no signs of resolution. Officials in China said that hitting the country’s economic growth goals for the year would be difficult considering the weight of tariffs and trade restrictions. Although the S&P 500 Index finished the third quarter with the best year-to-date returns in more than 20 years, concerns about future returns remained.
The fourth quarter started on a strong note, with U.S.-China trade tensions relaxing in October along with renewed optimism for a U.K. Brexit deal and positive macroeconomic data. The initial estimate of U.S. third-quarter gross domestic product (GDP) growth was a resilient 1.9% annualized rate, while the U.S. unemployment rate fell to a 50-year low of 3.5% in September. However, despite strength among U.S. consumers, business confidence declined while manufacturing activity contracted. Concerned with a potential economic slowdown, the Fed lowered interest rates another quarter point in late October—its third rate cut in four months. This helped push the S&P 500 Index to an all-time high while emerging market equities rallied and global bonds declined overall, reflecting a broad pickup in risk appetite.
Equity markets continued to rally in November despite ongoing geopolitical risks. Hopes for a U.S.-China trade deal buoyed investor confidence. U.S. business sentiment improved slightly, and manufacturing and services activity picked up. While consumer confidence and purchasing managers’ activity rose in the eurozone, China reported weakening manufacturing and consumer data. Bond yields rose marginally, leading to slightly negative returns for global government and investment-grade corporate bonds.
Financial markets ended 2019 with a boost from the U.S. and China accord on a Phase One trade deal. That, along with the landslide win by the pro-Brexit U.K. Conservative Party in a national election and ongoing central bank support, gave investors greater confidence. U.S. economic indicators were generally positive, with the exception of manufacturing activity and business confidence. Consumer confidence was resilient, fed by a robust labor market, tame inflation, and lower interest rates, which boosted housing affordability and stimulated homebuyer activity. The impeachment of President Trump had little impact on markets. Meanwhile, slowing Chinese economic activity, partly attributable to the trade war, led to further government stimulus at year-end through lower reserve ratios, allowing banks to lend more money.
The year-end rally continued in early January 2020. However, capital market volatility picked up sharply in late January on concerns over the potential impact of the coronavirus on the global economy and stock markets. With sentiment somewhat souring, perceived safe havens did well in January. The U.S. dollar and Japanese yen both rose, and government bonds outperformed equities. While the S&P 500 Index held its ground, emerging market equities tumbled, including those in Asia.
In February, the coronavirus became the major market focus. Fears of the virus’s impact on global growth led to expectations of increased global central bank monetary policy support. That led the 10-year U.S. Treasury yield to fall to an all-time low of 1.1%. Although equity markets initially shrugged off concerns about the outbreak, focusing instead on strong fourth-quarter earnings and improving business confidence in January, market sentiment turned sharply lower and the S&P 500 Index lost 8.2% for the month. Oil prices tumbled as Russia and the Organization of the Petroleum Exporting Countries compounded a major decline in oil demand with a brutal price war, partly aimed at dissuading further U.S. shale production, causing the price of West Texas Intermediate crude oil to plummet.
Wells Fargo Large Cap Growth Fund | 3
Table of Contents
Letter to shareholders (unaudited)
“The global spread of the coronavirus led country after country to clamp down on social and business-related activity in order to contain the virus from causing even greater devastation and overwhelming health care systems.”
“Financial markets posted widely positive returns in June despite ongoing economic weakness and high levels of uncertainty on the containment of the coronavirus and the timing of an effective vaccine.”
The global spread of the coronavirus led country after country to clamp down on social and business-related activity in order to contain the virus from causing even greater devastation and overwhelming health care systems. This abrupt stoppage of economic activity led to the sharp deceleration of global output, sending economies into a deep contraction. Central banks responded swiftly, slashing interest rates and expanding quantitative easing programs to restore liquidity and confidence to the markets. In the U.S., the Fed introduced several new lending programs, funding investment-grade bonds, money market mutual funds, and commercial paper while purchasing Treasuries, mortgage-backed securities, and overnight repurchase agreements. Meanwhile, stock markets tumbled quickly into a bear market, ending the longest bull stock market in U.S. history.
Markets rebounded strongly in April, fueled by unprecedented government and central bank stimulus measures. The U.S. economy contracted by an annualized 5.0% pace in the first quarter, with 30 million new unemployment insurance claims in six weeks. In the eurozone, first-quarter real GDP shrank 3.8%, with the composite April Flash Purchasing Managers’ Index, a monthly survey of purchasing managers, falling to an all-time low of 13.5. The European Central Bank expanded its quantitative easing to include the purchase of additional government bonds of countries with the greatest virus-related need, including Italy and Spain. China’s first-quarter GDP fell by 6.8% year over year. However, retail sales, production, and investment showed signs of recovery. Extreme oil-price volatility continued as global supply far exceeded demand.
In May, the global equity market rebound continued, with widespread strong monthly gains. Investors regained confidence on reports of early signs of success in human trials of a coronavirus vaccine. Growth stocks continued to outperform value stocks while returns on global government bonds were generally flat. In the U.S., a gap grew between the stock market rebound and devastating economic data points, including an April unemployment rate of 14.7%, the highest level since World War II. Purchasing managers’ indices reflected weakening activity in May in both the manufacturing and services sectors. U.S. corporate earnings reports indicated a 14% year-over-year contraction in earnings from the first quarter of 2019. However, high demand for technology, driven by remote activity, supported robust information technology sector earnings, which helped drive major technology stocks higher.
Financial markets posted widely positive returns in June despite ongoing economic weakness and high levels of uncertainty on the containment of the coronavirus and the timing of an effective vaccine. There were hopeful signs as economies reopened, with both U.S. and U.K. retail sales rebounding substantially in May. However, year over year, sales remained depressed. Vitally important to market sentiment was the ongoing commitment by central banks globally to do all they could to provide economic support through liquidity and low borrowing costs. U.S. economic activity was aided by one-time $1,200 stimulus checks and $600 bonus weekly unemployment benefits due to expire at the end of July. However, unemployment remained in the double digits, easing somewhat from 14.7% in April to 11.1% in June. During June, numerous states reported alarming increases of coronavirus cases. China’s economic recovery picked up momentum in June, though it remained far from a full recovery.
July was a broadly positive month for both global equities and fixed income. However, economic data and a resurgence of coronavirus cases pointed to the vulnerability of the global economy and the ongoing imperative to regain control of the pandemic. Second-quarter GDP shrank by 9.5% and 12.1% in the U.S. and eurozone, respectively, from the previous quarter. In contrast, China reported a 3.2% year-over-year expansion in its second-quarter GDP. U.S. unemployment remained historically high despite adding 1.8 million jobs in July, with a double-digit jobless rate persisting. However, manufacturing activity grew in both the U.S. and eurozone. In Asia, while China’s manufacturing sector continued to expand, activity in Japan and South Korea contracted. In July, a rising concern
4 | Wells Fargo Large Cap Growth Fund
Table of Contents
Letter to shareholders (unaudited)
was the rapid and broad reemergence of coronavirus infections. Despite the ongoing promise of positive early-stage vaccine trial results, economic activity could be held back by the continued spread of the virus and the end of a widely received $600-a-week bonus unemployment benefit in late July.
Don’t let short-term uncertainty derail long-term investment goals.
Periods of investment uncertainty can present challenges, but experience has taught us that maintaining long-term investment goals can be an effective way to plan for the future. To help you create a sound strategy based on your personal goals and risk tolerance, Wells Fargo Funds offers more than 100 mutual funds spanning a wide range of asset classes and investment styles. Although diversification cannot guarantee an investment profit or prevent losses, we believe it can be an effective way to manage investment risk and potentially smooth out overall portfolio performance. We encourage investors to know their investments and to understand that appropriate levels of risk-taking may unlock opportunities.
Thank you for choosing to invest with Wells Fargo Funds. We appreciate your confidence in us and remain committed to helping you meet your financial needs.
Sincerely,

Andrew Owen
President
Wells Fargo Funds
|
For further information about your Fund, contact your investment professional, visit our website at wfam.com, or call us directly at 1-800-222-8222. |
Notice to Shareholders
At a meeting held on August 10-12, 2020, the Board of Trustees of the Fund approved a change to the Fund’s automatic conversion feature for Class C shares in order to shorten the required holding period from 10 to 8 years. As a result, on a monthly basis beginning November 5, 2020, Class C shares will convert automatically into Class A shares 8 years after the initial date of purchase or, if you acquired your Class C shares through an exchange or conversion from another share class, 8 years after the date you acquired your Class C shares. When Class C shares that you acquired through a purchase or exchange convert, any other Class C shares that you purchased with reinvested dividends and distributions also will convert into Class A shares on a pro rata basis.
Please note that a shorter holding period may apply depending on your intermediary. Please see “Appendix A—Sales Charge Reductions and Waivers for Certain Intermediaries” in the Fund’s prospectus for further information.
Wells Fargo Large Cap Growth Fund | 5
Table of Contents
Performance highlights (unaudited)
Investment objective
The Fund seeks long-term capital appreciation.
Manager
Wells Fargo Funds Management, LLC
Subadviser
Wells Capital Management Incorporated
Portfolio managers
Joseph M. Eberhardy, CFA®‡, CPA
Robert Gruendyke, CFA®‡
Thomas C. Ognar, CFA®‡
Average annual total returns (%) as of July 31, 2020
| Including sales charge | Excluding sales charge | Expense ratios1 (%) | ||||||||||||||||||||||||||||||||
| Inception date | 1 year | 5 year | 10 year | 1 year | 5 year | 10 year | Gross | Net2 | ||||||||||||||||||||||||||
| Class A (STAFX) | 7-30-2010 | 16.41 | 13.22 | 15.04 | 23.51 | 14.57 | 15.72 | 1.18 | 1.07 | |||||||||||||||||||||||||
| Class C (STOFX) | 7-30-2010 | 21.57 | 13.71 | 14.86 | 22.57 | 13.71 | 14.86 | 1.93 | 1.82 | |||||||||||||||||||||||||
| Class R (STMFX)3 | 6-15-2012 | – | – | – | 23.16 | 14.27 | 15.43 | 1.43 | 1.32 | |||||||||||||||||||||||||
| Class R4 (SLGRX)4 | 11-30-2012 | – | – | – | 23.59 | 14.85 | 16.06 | 0.90 | 0.80 | |||||||||||||||||||||||||
| Class R6 (STFFX)5 | 11-30-2012 | – | – | – | 24.03 | 15.06 | 16.21 | 0.75 | 0.65 | |||||||||||||||||||||||||
| Administrator Class (STDFX) | 7-30-2010 | – | – | – | 23.63 | 14.71 | 15.87 | 1.10 | 0.95 | |||||||||||||||||||||||||
| Institutional Class (STNFX) | 7-30-2010 | – | – | – | 23.89 | 14.94 | 16.14 | 0.85 | 0.75 | |||||||||||||||||||||||||
| Russell 1000® Growth Index6 | – | – | – | – | 29.84 | 16.84 | 17.29 | – | – | |||||||||||||||||||||||||
Figures quoted represent past performance, which is no guarantee of future results, and do not reflect taxes that a shareholder may pay on an investment in a fund. Investment return and principal value of an investment will fluctuate so that an investor’s shares, when redeemed, may be worth more or less than their original cost. Performance shown without sales charges would be lower if sales charges were reflected. Current performance may be lower or higher than the performance data quoted, which assumes the reinvestment of dividends and capital gains. Current month-end performance is available on the Fund’s website, wfam.com.
Index returns do not include transaction costs associated with buying and selling securities, any mutual fund fees or expenses, or any taxes. It is not possible to invest directly in an index.
For Class A shares, the maximum front-end sales charge is 5.75%. For Class C shares, the maximum contingent deferred sales charge is 1.00%. Performance including a contingent deferred sales charge assumes the sales charge for the corresponding time period. Class R, Class R4, Class R6, Administrator Class, and Institutional Class shares are sold without a front-end sales charge or contingent deferred sales charge.
Stock values fluctuate in response to the activities of individual companies and general market and economic conditions. Certain investment strategies tend to increase the total risk of an investment (relative to the broader market). The Fund is exposed to foreign investment risk. Consult the Fund’s prospectus for additional information on these and other risks.
Please see footnotes on page 7.
6 | Wells Fargo Large Cap Growth Fund
Table of Contents
Performance highlights (unaudited)
| Growth of $10,000 investment as of July 31, 20207 |
|
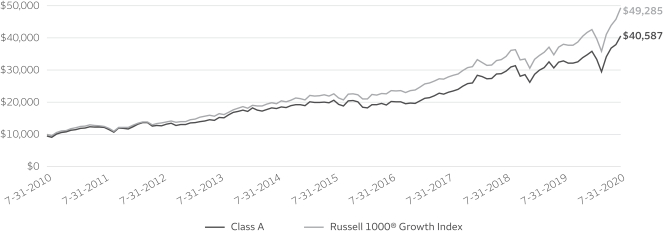
| ‡ | CFA® and Chartered Financial Analyst® are trademarks owned by CFA Institute. |
| 1 | Reflects the expense ratios as stated in the most recent prospectuses. The expense ratios shown are subject to change and may differ from the annualized expense ratios shown in the financial highlights of this report. |
| 2 | The manager has contractually committed through November 30, 2020, to waive fees and/or reimburse expenses to the extent necessary to cap total annual fund operating expenses after fee waivers at 1.07% for Class A, 1.82% for Class C, 1.32% for Class R, 0.80% Class R4, 0.65% for Class R6, 0.95% for Administrator Class, and 0.75% for Institutional Class. Brokerage commissions, stamp duty fees, interest, taxes, acquired fund fees and expenses (if any), and extraordinary expenses are excluded from the expense caps. Prior to or after the commitment expiration date, the caps may be increased or the commitment to maintain the caps may be terminated only with the approval of the Board of Trustees. Without these caps, the Fund’s returns would have been lower. The expense ratio paid by an investor is the net expense ratio (the total annual fund operating expenses after fee waivers) as stated in the prospectuses. |
| 3 | Historical performance shown for the Class R shares prior to their inception reflects the performance of the former Investor Class shares, adjusted to reflect the higher expenses applicable to the Class R shares. |
| 4 | Historical performance shown for the Class R4 shares prior to their inception reflects the performance of the Institutional Class shares, adjusted to reflect the higher expenses applicable to the Class R4 shares. |
| 5 | Historical performance shown for the Class R6 shares prior to their inception reflects the performance of the Institutional Class shares, and includes the higher expenses applicable to the Institutional Class shares. If these expenses had not been included, returns for the Class R6 shares would be higher. |
| 6 | The Russell 1000® Growth Index measures the performance of those Russell 1000 companies with higher price/book ratios and higher forecasted growth values. You cannot invest directly in an index. |
| 7 | The chart compares the performance of Class A shares for the most recent ten years with the Russell 1000® Growth Index. The chart assumes a hypothetical investment of $10,000 in Class A shares and reflects all operating expenses and assumes the maximum initial sales charge of 5.75%. |
| 8 | The S&P 500 Index consists of 500 stocks chosen for market size, liquidity, and industry group representation. It is a market-value-weighted index with each stock’s weight in the index proportionate to its market value. You cannot invest directly in an index. |
| 9 | The ten largest holdings, excluding cash, cash equivalents and any money market funds, are calculated based on the value of the investments divided by total net assets of the Fund. Holdings are subject to change and may have changed since the date specified. |
| 10 | Amounts are calculated based on the total long-term investments of the Fund. These amounts are subject to change and may have changed since the date specified. |
| * | The security was no longer held at the end of the reporting period. |
Wells Fargo Large Cap Growth Fund | 7
Table of Contents
Performance highlights (unaudited)
MANAGER’S DISCUSSION
| ∎ | The Fund underperformed its benchmark, the Russell 1000® Growth Index, for the 12-month period that ended July 31, 2020. |
| ∎ | The Fund’s performance was inhibited by stocks within the consumer discretionary and communication services sectors. |
| ∎ | Holdings within information technology (IT) and an underweight to consumer staples aided the Fund’s performance for the period. |
For much of the 12-month period, stocks were largely impervious to tariffs on Chinese goods and other geopolitical events. However, in the first quarter of 2020, the spread of the coronavirus pandemic crippled the global economy, sending U.S. equities into a laconic bear market. The unprecedented spread of the coronavirus prompted global central banks to quickly inject massive liquidity into the markets. On the fiscal side, the U.S. government passed the Coronavirus Aid, Relief, and Economic Security Act and other stimulative measures to support the economy. Shortly after setting a record for the quickest descent into bear market territory in the first quarter of 2020, the S&P 500 Index8 set another record, posting its best 50-day rally ever the following quarter. Although we believe new leadership may arise in the coming periods, we are positioning the Fund so it has the potential to capitalize on an array of outcomes. We believe our diversified and balanced approach to portfolio construction and strict emphasis on sell discipline should help mitigate risk with the goal of providing a less volatile experience for our clients.
| Ten largest holdings (%) as of July 31, 20209 | ||||
Amazon.com Incorporated | 10.36 | |||
Microsoft Corporation | 8.84 | |||
Facebook Incorporated Class A | 4.51 | |||
MasterCard Incorporated Class A | 4.25 | |||
Apple Incorporated | 4.22 | |||
PayPal Holdings Incorporated | 4.20 | |||
Visa Incorporated Class A | 3.49 | |||
Alphabet Incorporated Class A | 3.44 | |||
Alphabet Incorporated Class C | 3.37 | |||
MarketAxess Holdings Incorporated | 2.67 | |||
| Sector allocation as of July 31, 202010 |
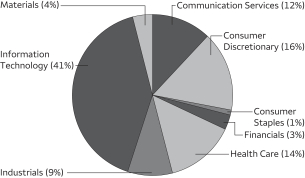 |
Certain consumer discretionary and communication services stocks detracted from performance.
Within consumer discretionary, retailers Ulta Beauty Inc. and Levi Strauss & Co.* retraced sharply as traffic fell precipitously amid widespread store closings. Apparel holding Levi Strauss & Co. trailed the market after being hurt by reduced traffic, citing a decline in earnings before interest, taxes, depreciation, and amortization largely due to elevated selling, general, and administrative costs. However, we believe areas such as off-price retail are well positioned as the group has historically held up well relative to peers during recessions and rebounded strongly during the recovery periods. We also expect that many of the specialty retailers and restaurants we own will rebound quickly as the virus subsides, with increased pent-up demand for their unique offerings. Other detractors within the communication services sector hindered results as Pinterest, Inc.*, fell 47% largely due to a deceleration in its U.S. segment toward the end of 2019. The Fund’s largest relative detractor was Apple Inc., which rallied sharply as it has witnessed strong demand from many products. While we recognize the company’s powerful ecosystem and strong propensity to return cash to shareholders, most of its services are tied to its hardware-installed base, which has matured in recent years. Due to its lower growth profile and increased elasticity for its main product, the iPhone, we don’t believe it warrants a larger weight within the Fund.
Performance of IT holdings was beneficial to Fund performance.
Strength within the IT sector came from payments processor PayPal Holdings Inc., which capitalized on growth within e-commerce and the pervasive shift from cash and check to plastic. The structural advantages of the software industry continue to feature benefits including a predictable cost of ownership to the customer, scale, and seamless implementation. Other contributors included Amazon.com, Inc., which rallied 70% after posting strong unit growth and Amazon Web Services metrics. The stock has been one of our best performers, as demand for its e-commerce capabilities has increased considerably as most retailers had to close their doors during the coronavirus pandemic. The company continues to execute from its four main pillars of cloud computing, e-commerce (which includes groceries), digital advertising, and shipping and logistics.
Please see footnotes on page 7.
8 | Wells Fargo Large Cap Growth Fund
Table of Contents
Performance highlights (unaudited)
Areas of focus remain in secular areas personified in our SCODIi acronym.
The coronavirus crisis has pulled forward many secular trends as several companies have cited years of transformation compressed into months. This trend can be encapsulated in our SCODIi acronym, which stands for software as a service (SaaS), cloud services, online retail, digital payments, the internet of things, and innovation. Within SaaS, companies that offer communications capabilities are helping workers function remotely. In cloud computing, a surge in e-commerce spend and telemedicine has fostered a precipitous increase in cloud demand. Online shopping is fundamentally changing consumer behaviors and is having a profound effect on digital transactions, an area that is becoming a necessity rather than a luxury. The internet of things has played an essential role as the need for home office electronics are supported by more powerful underlying chip hardware. Lastly, within innovation, critical procedures have resumed eliciting a spur in demand for medical devices.
The equity market has shown marked resiliency this year. The economy appears to be improving, but there are many risks abound. We believe the recovery will be uneven as some businesses will be permanently impaired while others will likely see a pull forward in demand. It is an exciting time to be a stock picker in an area where change is occurring at a rapid pace and there is greater disparity among companies. Still, we believe this is the time to be extra vigilant on risk given the wider range of outcomes. We believe our approach is built for such markets and our long track record provides a useful guide in helping navigate potentially more volatile periods ahead.
Please see footnotes on page 7.
Wells Fargo Large Cap Growth Fund | 9
Table of Contents
As a shareholder of the Fund, you incur two types of costs: (1) transaction costs, including sales charges (loads) on purchase payments and contingent deferred sales charges (if any) on redemptions and (2) ongoing costs, including management fees, distribution (12b-1) and/or shareholder servicing fees, and other Fund expenses. This example is intended to help you understand your ongoing costs (in dollars) of investing in the Fund and to compare these costs with the ongoing costs of investing in other mutual funds.
The example is based on an investment of $1,000 invested at the beginning of the six-month period and held for the entire period from February 1, 2020 to July 31, 2020.
Actual expenses
The “Actual” line of the table below provides information about actual account values and actual expenses. You may use the information in this line, together with the amount you invested, to estimate the expenses that you paid over the period. Simply divide your account value by $1,000 (for example, an $8,600 account value divided by $1,000 = 8.6), then multiply the result by the number in the “Actual” line under the heading entitled “Expenses paid during period” for your applicable class of shares to estimate the expenses you paid on your account during this period.
Hypothetical example for comparison purposes
The “Hypothetical” line of the table below provides information about hypothetical account values and hypothetical expenses based on the Fund’s actual expense ratio and an assumed rate of return of 5% per year before expenses, which is not the Fund’s actual return. The hypothetical account values and expenses may not be used to estimate the actual ending account balance or expenses you paid for the period. You may use this information to compare the ongoing costs of investing in the Fund and other funds. To do so, compare this 5% hypothetical example with the 5% hypothetical examples that appear in the shareholder reports of the other funds.
Please note that the expenses shown in the table are meant to highlight your ongoing costs only and do not reflect any transactional costs, such as sales charges (loads) and contingent deferred sales charges. Therefore, the “Hypothetical” line of the table is useful in comparing ongoing costs only and will not help you determine the relative total costs of owning different funds. In addition, if these transactional costs were included, your costs would have been higher.
Beginning account value 2-1-2020 | Ending account value 7-31-2020 | Expenses paid during the period1 | Annualized net expense ratio | |||||||||||||
Class A | ||||||||||||||||
Actual | $ | 1,000.00 | $ | 1,132.88 | $ | 5.67 | 1.07 | % | ||||||||
Hypothetical (5% return before expenses) | $ | 1,000.00 | $ | 1,019.54 | $ | 5.37 | 1.07 | % | ||||||||
Class C | ||||||||||||||||
Actual | $ | 1,000.00 | $ | 1,128.71 | $ | 9.63 | 1.82 | % | ||||||||
Hypothetical (5% return before expenses) | $ | 1,000.00 | $ | 1,015.81 | $ | 9.12 | 1.82 | % | ||||||||
Class R | ||||||||||||||||
Actual | $ | 1,000.00 | $ | 1,131.36 | $ | 7.00 | 1.32 | % | ||||||||
Hypothetical (5% return before expenses) | $ | 1,000.00 | $ | 1,018.30 | $ | 6.62 | 1.32 | % | ||||||||
Class R4 | ||||||||||||||||
Actual | $ | 1,000.00 | $ | 1,132.07 | $ | 4.24 | 0.80 | % | ||||||||
Hypothetical (5% return before expenses) | $ | 1,000.00 | $ | 1,020.89 | $ | 4.02 | 0.80 | % | ||||||||
Class R6 | ||||||||||||||||
Actual | $ | 1,000.00 | $ | 1,135.27 | $ | 3.45 | 0.65 | % | ||||||||
Hypothetical (5% return before expenses) | $ | 1,000.00 | $ | 1,021.63 | $ | 3.27 | 0.65 | % | ||||||||
Administrator Class | ||||||||||||||||
Actual | $ | 1,000.00 | $ | 1,133.42 | $ | 5.04 | 0.95 | % | ||||||||
Hypothetical (5% return before expenses) | $ | 1,000.00 | $ | 1,020.14 | $ | 4.77 | 0.95 | % | ||||||||
Institutional Class | ||||||||||||||||
Actual | $ | 1,000.00 | $ | 1,134.61 | $ | 3.98 | 0.75 | % | ||||||||
Hypothetical (5% return before expenses) | $ | 1,000.00 | $ | 1,021.13 | $ | 3.77 | 0.75 | % | ||||||||
| 1 | Expenses paid is equal to the annualized net expense ratio of each class multiplied by the average account value over the period, multiplied by the number of days in the most recent fiscal half-year divided by the number of days in the fiscal year (to reflect the one-half-year period). |
10 | Wells Fargo Large Cap Growth Fund
Table of Contents
Portfolio of investments—July 31, 2020
| Shares | Value | |||||||||||||||
| Common Stocks: 100.13% | ||||||||||||||||
Communication Services: 12.53% | ||||||||||||||||
| Entertainment: 1.21% | ||||||||||||||||
Activision Blizzard Incorporated | 126,925 | $ | 10,487,813 | |||||||||||||
Netflix Incorporated † | 4,825 | 2,358,846 | ||||||||||||||
Warner Music Group Corporation Class A † | 8,002 | 241,260 | ||||||||||||||
| 13,087,919 | ||||||||||||||||
|
| |||||||||||||||
| Interactive Media & Services: 11.32% | ||||||||||||||||
Alphabet Incorporated Class A † | 24,980 | 37,168,991 | ||||||||||||||
Alphabet Incorporated Class C † | 24,560 | 36,421,498 | ||||||||||||||
Facebook Incorporated Class A † | 192,025 | 48,710,982 | ||||||||||||||
| 122,301,471 | ||||||||||||||||
|
| |||||||||||||||
Consumer Discretionary: 16.28% | ||||||||||||||||
| Hotels, Restaurants & Leisure: 1.28% | ||||||||||||||||
Chipotle Mexican Grill Incorporated † | 10,630 | 12,279,351 | ||||||||||||||
Starbucks Corporation | 20,370 | 1,558,916 | ||||||||||||||
| 13,838,267 | ||||||||||||||||
|
| |||||||||||||||
| Internet & Direct Marketing Retail: 10.36% | ||||||||||||||||
Amazon.com Incorporated † | 35,360 | 111,903,085 | ||||||||||||||
|
| |||||||||||||||
| Specialty Retail: 3.85% | ||||||||||||||||
Burlington Stores Incorporated † | 86,080 | 16,183,040 | ||||||||||||||
CarMax Incorporated † | 97,995 | 9,502,575 | ||||||||||||||
The Home Depot Incorporated | 38,325 | 10,174,904 | ||||||||||||||
The TJX Companies Incorporated | 104,315 | 5,423,337 | ||||||||||||||
Ulta Beauty Incorporated † | 1,425 | 275,011 | ||||||||||||||
| 41,558,867 | ||||||||||||||||
|
| |||||||||||||||
| Textiles, Apparel & Luxury Goods: 0.79% | ||||||||||||||||
Nike Incorporated Class B | 88,045 | 8,594,072 | ||||||||||||||
|
| |||||||||||||||
Consumer Staples: 1.07% | ||||||||||||||||
| Beverages: 0.74% | ||||||||||||||||
The Coca-Cola Company | 169,410 | 8,002,928 | ||||||||||||||
|
| |||||||||||||||
| Personal Products: 0.33% | ||||||||||||||||
The Estee Lauder Companies Incorporated Class A | 18,220 | 3,599,179 | ||||||||||||||
|
| |||||||||||||||
Financials: 2.67% | ||||||||||||||||
| Capital Markets: 2.67% | ||||||||||||||||
MarketAxess Holdings Incorporated | 55,850 | 28,857,695 | ||||||||||||||
|
| |||||||||||||||
Health Care: 13.65% | ||||||||||||||||
| Biotechnology: 0.98% | ||||||||||||||||
Regeneron Pharmaceuticals Incorporated † | 9,125 | 5,767,639 | ||||||||||||||
Vertex Pharmaceuticals Incorporated † | 17,950 | 4,882,400 | ||||||||||||||
| 10,650,039 | ||||||||||||||||
|
| |||||||||||||||
| Health Care Equipment & Supplies: 9.69% | ||||||||||||||||
Abbott Laboratories | 158,740 | 15,975,594 | ||||||||||||||
Baxter International Incorporated | 165,340 | 14,282,069 | ||||||||||||||
The accompanying notes are an integral part of these financial statements.
Wells Fargo Large Cap Growth Fund | 11
Table of Contents
Portfolio of investments—July 31, 2020
| Shares | Value | |||||||||||||||
| Health Care Equipment & Supplies (continued) | ||||||||||||||||
Boston Scientific Corporation † | 636,459 | $ | 24,548,224 | |||||||||||||
Edwards Lifesciences Corporation † | 247,465 | 19,403,731 | ||||||||||||||
Intuitive Surgical Incorporated † | 26,400 | 18,095,616 | ||||||||||||||
Stryker Corporation | 63,945 | 12,360,569 | ||||||||||||||
| 104,665,803 | ||||||||||||||||
|
| |||||||||||||||
| Health Care Technology: 1.00% | ||||||||||||||||
Veeva Systems Incorporated Class A † | 40,895 | 10,819,590 | ||||||||||||||
|
| |||||||||||||||
| Life Sciences Tools & Services: 0.58% | ||||||||||||||||
Agilent Technologies Incorporated | 65,440 | 6,303,835 | ||||||||||||||
|
| |||||||||||||||
| Pharmaceuticals: 1.40% | ||||||||||||||||
Zoetis Incorporated | 99,650 | 15,114,912 | ||||||||||||||
|
| |||||||||||||||
Industrials: 8.63% | ||||||||||||||||
| Air Freight & Logistics: 0.15% | ||||||||||||||||
United Parcel Service Incorporated Class B | 11,200 | 1,598,912 | ||||||||||||||
|
| |||||||||||||||
| Commercial Services & Supplies: 2.69% | ||||||||||||||||
Copart Incorporated † | 105,595 | 9,846,734 | ||||||||||||||
Waste Connections Incorporated | 188,045 | 19,250,167 | ||||||||||||||
| 29,096,901 | ||||||||||||||||
|
| |||||||||||||||
| Industrial Conglomerates: 0.41% | ||||||||||||||||
Roper Technologies Incorporated | 10,175 | 4,400,179 | ||||||||||||||
|
| |||||||||||||||
| Professional Services: 0.84% | ||||||||||||||||
CoStar Group Incorporated † | 7,915 | 6,725,850 | ||||||||||||||
TransUnion | 27,090 | 2,426,451 | ||||||||||||||
| 9,152,301 | ||||||||||||||||
|
| |||||||||||||||
| Road & Rail: 4.54% | ||||||||||||||||
CSX Corporation | 181,635 | 12,957,841 | ||||||||||||||
Norfolk Southern Corporation | 97,545 | 18,749,124 | ||||||||||||||
Union Pacific Corporation | 100,130 | 17,357,536 | ||||||||||||||
| 49,064,501 | ||||||||||||||||
|
| |||||||||||||||
Information Technology: 41.29% | ||||||||||||||||
| IT Services: 16.21% | ||||||||||||||||
Fidelity National Information Services Incorporated | 182,448 | 26,693,967 | ||||||||||||||
Global Payments Incorporated | 67,715 | 12,054,624 | ||||||||||||||
MasterCard Incorporated Class A | 148,750 | 45,893,838 | ||||||||||||||
PayPal Holdings Incorporated † | 231,510 | 45,392,166 | ||||||||||||||
Square Incorporated Class A † | 23,000 | 2,986,550 | ||||||||||||||
Twilio Incorporated Class A † | 16,040 | 4,449,817 | ||||||||||||||
Visa Incorporated Class A | 198,075 | 37,713,480 | ||||||||||||||
| 175,184,442 | ||||||||||||||||
|
| |||||||||||||||
| Semiconductors & Semiconductor Equipment: 5.61% | ||||||||||||||||
Maxim Integrated Products Incorporated | 103,010 | 7,013,951 | ||||||||||||||
Microchip Technology Incorporated | 249,980 | 25,430,465 | ||||||||||||||
NVIDIA Corporation | 37,590 | 15,960,338 | ||||||||||||||
Texas Instruments Incorporated | 95,795 | 12,218,652 | ||||||||||||||
| 60,623,406 | ||||||||||||||||
|
| |||||||||||||||
The accompanying notes are an integral part of these financial statements.
12 | Wells Fargo Large Cap Growth Fund
Table of Contents
Portfolio of investments—July 31, 2020
| Shares | Value | |||||||||||||||
| Software: 15.25% | ||||||||||||||||
Adobe Incorporated † | 22,155 | $ | 9,843,910 | |||||||||||||
Microsoft Corporation | 466,050 | 95,544,911 | ||||||||||||||
Salesforce.com Incorporated † | 57,880 | 11,277,918 | ||||||||||||||
ServiceNow Incorporated † | 45,815 | 20,121,948 | ||||||||||||||
Splunk Incorporated † | 133,320 | 27,973,202 | ||||||||||||||
| 164,761,889 | ||||||||||||||||
|
| |||||||||||||||
| Technology Hardware, Storage & Peripherals: 4.22% | ||||||||||||||||
Apple Incorporated | 107,230 | 45,577,039 | ||||||||||||||
|
| |||||||||||||||
Materials: 4.01% | ||||||||||||||||
| Chemicals: 4.01% | ||||||||||||||||
Air Products & Chemicals Incorporated | 58,510 | 16,770,721 | ||||||||||||||
Ecolab Incorporated | 46,685 | 8,733,830 | ||||||||||||||
Linde plc | 72,520 | 17,775,375 | ||||||||||||||
| 43,279,926 | ||||||||||||||||
|
| |||||||||||||||
Total Common Stocks (Cost $448,845,499) | 1,082,037,158 | |||||||||||||||
|
| |||||||||||||||
| Yield | ||||||||||||||||
| Short-Term Investments: 0.26% | ||||||||||||||||
| Investment Companies: 0.26% | ||||||||||||||||
Wells Fargo Government Money Market Select Class (l)(u) | 0.10 | % | 2,815,713 | 2,815,713 | ||||||||||||
|
| |||||||||||||||
Total Short-Term Investments (Cost $2,815,713) |
| 2,815,713 | ||||||||||||||
|
| |||||||||||||||
| Total investments in securities (Cost $451,661,212) | 100.39 | % | 1,084,852,871 | |||||
Other assets and liabilities, net | (0.39 | ) | (4,225,339 | ) | ||||
|
|
|
| |||||
| Total net assets | 100.00 | % | $ | 1,080,627,532 | ||||
|
|
|
| |||||
| † | Non-income-earning security |
| (l) | The issuer of the security is an affiliated person of the Fund as defined in the Investment Company Act of 1940. |
| (u) | The rate represents the 7-day annualized yield at period end. |
Investments in Affiliates
An affiliated investment is an investment in which the Fund owns at least 5% of the outstanding voting shares of the issuer or as a result of other relationships, such as the Fund and the issuer having the same investment manager. Transactions with issuers that were either affiliated persons of the Fund at the beginning of the period or the end of the period were as follows:
Value, beginning of period | Purchases | Sales Proceeds | Net realized gains (losses) | Net change in unrealized gains (losses) | Income from affiliated securities | Value, end of period | % of net assets | |||||||||||||||||||||||||
| Short-Term Investments | ||||||||||||||||||||||||||||||||
Investment Companies | ||||||||||||||||||||||||||||||||
Securities Lending Cash Investments LLC * | $ | 39,217,430 | $ | 192,319,725 | $ | (231,537,854 | ) | $ | 575 | $ | 124 | $ | 197,667 | # | $ | 0 | ||||||||||||||||
Wells Fargo Government Money Market Fund Select Class | 5,937,879 | 177,232,476 | (180,354,642 | ) | 0 | 0 | 54,169 | 2,815,713 | ||||||||||||||||||||||||
|
|
|
|
|
|
|
|
|
| |||||||||||||||||||||||
| $ | 575 | $ | 124 | $ | 251,836 | $ | 2,815,713 | 0.26 | % | |||||||||||||||||||||||
|
|
|
|
|
|
|
|
|
| |||||||||||||||||||||||
| * | No longer held at the end of the period |
| # | Amount shown represents income before fees and rebates. |
The accompanying notes are an integral part of these financial statements.
Wells Fargo Large Cap Growth Fund | 13
Table of Contents
Statement of assets and liabilities—July 31, 2020
Assets | ||||
Investments in unaffiliated securities, at value (cost $448,845,499) | $ | 1,082,037,158 | ||
Investments in affiliated securities, at value (cost $2,815,713) | 2,815,713 | |||
Receivable for Fund shares sold | 409,708 | |||
Receivable for dividends | 298,020 | |||
Prepaid expenses and other assets | 19,039 | |||
|
| |||
Total assets | 1,085,579,638 | |||
|
| |||
Liabilities | ||||
Payable for investments purchased | 3,453,582 | |||
Payable for Fund shares redeemed | 516,966 | |||
Management fee payable | 548,830 | |||
Administration fees payable | 136,868 | |||
Distribution fees payable | 7,578 | |||
Trustees’ fees and expenses payable | 4,248 | |||
Accrued expenses and other liabilities | 284,034 | |||
|
| |||
Total liabilities | 4,952,106 | |||
|
| |||
Total net assets | $ | 1,080,627,532 | ||
|
| |||
Net assets consist of | ||||
Paid-in capital | $ | 360,767,862 | ||
Total distributable earnings | 719,859,670 | |||
|
| |||
Total net assets | $ | 1,080,627,532 | ||
|
| |||
Computation of net asset value and offering price per share | ||||
Net assets – Class A | $ | 587,771,027 | ||
Shares outstanding – Class A1 | 11,843,816 | |||
Net asset value per share – Class A | $49.63 | |||
Maximum offering price per share – Class A2 | $52.66 | |||
Net assets – Class C | $ | 9,917,881 | ||
Shares outstanding – Class C1 | 228,934 | |||
Net asset value per share – Class C | $43.32 | |||
Net assets – Class R | $ | 3,321,939 | ||
Shares outstanding – Class R1 | 69,488 | |||
Net asset value per share – Class R | $47.81 | |||
Net assets – Class R4 | $ | 18,156 | ||
Share outstanding – Class R41 | 353 | |||
Net asset value per share – Class R4 | $51.43 | |||
Net assets – Class R6 | $ | 327,583,627 | ||
Shares outstanding – Class R61 | 6,305,399 | |||
Net asset value per share – Class R6 | $51.95 | |||
Net assets – Administrator Class | $ | 79,334,300 | ||
Shares outstanding – Administrator Class1 | 1,571,964 | |||
Net asset value per share – Administrator Class | $50.47 | |||
Net assets – Institutional Class | $ | 72,680,602 | ||
Shares outstanding – Institutional Class1 | 1,406,606 | |||
Net asset value per share – Institutional Class | $51.67 | |||
| 1 | The Fund has an unlimited number of authorized shares. |
| 2 | Maximum offering price is computed as 100/94.25 of net asset value. On investments of $50,000 or more, the offering price is reduced. |
The accompanying notes are an integral part of these financial statements.
14 | Wells Fargo Large Cap Growth Fund
Table of Contents
Statement of operations—year ended July 31, 2020
Investment income | ||||
Dividends (net of foreign withholding taxes of $24,066) | $ | 7,861,752 | ||
Income from affiliated securities | 141,791 | |||
|
| |||
Total investment income | 8,003,543 | |||
|
| |||
Expenses | ||||
Management fee | 6,773,689 | |||
Administration fees | ||||
Class A | 1,098,477 | |||
Class C | 22,035 | |||
Class R | 8,276 | |||
Class R4 | 554 | |||
Class R6 | 92,221 | |||
Administrator Class | 90,483 | |||
Institutional Class | 91,240 | |||
Shareholder servicing fees | ||||
Class A | 1,306,617 | |||
Class C | 26,199 | |||
Class R | 9,409 | |||
Class R4 | 692 | |||
Administrator Class | 173,917 | |||
Distribution fees | ||||
Class C | 78,584 | |||
Class R | 9,244 | |||
Custody and accounting fees | 45,645 | |||
Professional fees | 44,775 | |||
Registration fees | 120,121 | |||
Shareholder report expenses | 76,731 | |||
Trustees’ fees and expenses | 21,002 | |||
Other fees and expenses | 33,501 | |||
|
| |||
Total expenses | 10,123,412 | |||
Less: Fee waivers and/or expense reimbursements | ||||
Fund-level | (1,005,756 | ) | ||
Class A | (156,070 | ) | ||
Class C | (1,043 | ) | ||
Class R | (1,176 | ) | ||
Administrator Class | (34,611 | ) | ||
|
| |||
Net expenses | 8,924,756 | |||
|
| |||
Net investment loss | (921,213 | ) | ||
|
| |||
Realized and unrealized gains (losses) on investments | ||||
Net realized gains on | ||||
Unaffiliated securities | 102,200,975 | |||
Affiliated securities | 575 | |||
|
| |||
Net realized gains on investments | 102,201,550 | |||
|
| |||
Net change in unrealized gains (losses) on | ||||
Unaffiliated securities | 109,642,565 | |||
Affiliated securities | 124 | |||
|
| |||
Net change in unrealized gains (losses) on investments | 109,642,689 | |||
|
| |||
Net realized and unrealized gains (losses) on investments | 211,844,239 | |||
|
| |||
Net increase in net assets resulting from operations | $ | 210,923,026 | ||
|
| |||
The accompanying notes are an integral part of these financial statements.
Wells Fargo Large Cap Growth Fund | 15
Table of Contents
Statement of changes in net assets
| Year ended July 31, 2020 | Year ended July 31, 2019 | |||||||||||||||
Operations | ||||||||||||||||
Net investment income (loss) | $ | (921,213 | ) | $ | 885,116 | |||||||||||
Net realized gains on investments | 102,201,550 | 127,678,132 | ||||||||||||||
Net change in unrealized gains (losses) on investments | 109,642,689 | (27,477,455 | ) | |||||||||||||
|
| |||||||||||||||
Net increase in net assets resulting from operations | 210,923,026 | 101,085,793 | ||||||||||||||
|
| |||||||||||||||
Distributions to shareholders from net investment income and net realized gains | ||||||||||||||||
Class A | (48,085,264 | ) | (111,706,240 | ) | ||||||||||||
Class C | (1,095,349 | ) | (3,431,246 | ) | ||||||||||||
Class R | (417,971 | ) | (1,280,121 | ) | ||||||||||||
Class R4 | (85,773 | ) | (455,047 | ) | ||||||||||||
Class R6 | (29,201,378 | ) | (66,047,400 | ) | ||||||||||||
Administrator Class | (6,247,883 | ) | (14,492,251 | ) | ||||||||||||
Institutional Class | (6,697,849 | ) | (18,149,003 | ) | ||||||||||||
|
| |||||||||||||||
Total distributions to shareholders | (91,831,467 | ) | (215,561,308 | ) | ||||||||||||
|
| |||||||||||||||
Capital share transactions | Shares | Shares | ||||||||||||||
Proceeds from shares sold | ||||||||||||||||
Class A | 380,850 | 16,129,700 | 399,711 | 17,356,631 | ||||||||||||
Class C | 51,726 | 1,741,347 | 71,966 | 2,571,501 | ||||||||||||
Class R | 32,914 | 1,386,119 | 49,362 | 1,986,257 | ||||||||||||
Class R4 | 10,868 | 467,147 | 9,684 | 457,992 | ||||||||||||
Class R6 | 1,409,952 | 60,242,135 | 780,490 | 34,878,326 | ||||||||||||
Administrator Class | 222,967 | 9,665,543 | 156,702 | 7,081,152 | ||||||||||||
Institutional Class | 196,605 | 8,571,145 | 275,036 | 12,403,795 | ||||||||||||
|
| |||||||||||||||
| 98,203,136 | 76,735,654 | |||||||||||||||
|
| |||||||||||||||
Reinvestment of distributions | ||||||||||||||||
Class A | 1,127,986 | 46,360,245 | 2,918,252 | 107,245,772 | ||||||||||||
Class C | 25,717 | 927,347 | 92,097 | 3,029,996 | ||||||||||||
Class R | 4,263 | 169,064 | 9,145 | 326,200 | ||||||||||||
Class R4 | 1,974 | 84,285 | 11,892 | 451,084 | ||||||||||||
Class R6 | 647,777 | 27,895,354 | 1,625,721 | 62,084,213 | ||||||||||||
Administrator Class | 149,395 | 6,242,050 | 388,367 | 14,470,567 | ||||||||||||
Institutional Class | 140,193 | 6,001,246 | 407,144 | 15,475,547 | ||||||||||||
|
| |||||||||||||||
| 87,679,591 | 203,083,379 | |||||||||||||||
|
| |||||||||||||||
Payment for shares redeemed | ||||||||||||||||
Class A | (1,628,537 | ) | (68,860,332 | ) | (1,635,497 | ) | (70,467,127 | ) | ||||||||
Class C | (140,447 | ) | (5,259,663 | ) | (197,048 | ) | (7,247,118 | ) | ||||||||
Class R | (72,655 | ) | (2,962,212 | ) | (64,781 | ) | (2,603,006 | ) | ||||||||
Class R4 | (32,078 | ) | (1,411,121 | ) | (41,238 | ) | (1,706,882 | ) | ||||||||
Class R6 | (2,851,205 | ) | (123,114,591 | ) | (1,438,307 | ) | (65,749,149 | ) | ||||||||
Administrator Class | (296,951 | ) | (12,894,932 | ) | (555,121 | ) | (25,132,488 | ) | ||||||||
Institutional Class | (679,804 | ) | (30,194,632 | ) | (729,747 | ) | (33,022,472 | ) | ||||||||
|
| |||||||||||||||
| (244,697,483 | ) | (205,928,242 | ) | |||||||||||||
|
| |||||||||||||||
Net increase (decrease) in net assets resulting from capital share transactions | (58,814,756 | ) | 73,890,791 | |||||||||||||
|
| |||||||||||||||
Total increase (decrease) in net assets | 60,276,803 | (40,584,724 | ) | |||||||||||||
|
| |||||||||||||||
Net assets | ||||||||||||||||
Beginning of period | 1,020,350,729 | 1,060,935,453 | ||||||||||||||
|
| |||||||||||||||
End of period | $ | 1,080,627,532 | $ | 1,020,350,729 | ||||||||||||
|
| |||||||||||||||
The accompanying notes are an integral part of these financial statements.
16 | Wells Fargo Large Cap Growth Fund
Table of Contents
(For a share outstanding throughout each period)
| Year ended July 31 | ||||||||||||||||||||
| CLASS A | 2020 | 2019 | 2018 | 2017 | 2016 | |||||||||||||||
Net asset value, beginning of period | $44.23 | $52.01 | $50.10 | $46.05 | $49.55 | |||||||||||||||
Net investment loss | (0.11 | ) | (0.03 | )1 | (0.08 | ) | (0.03 | )1 | (0.03 | )1 | ||||||||||
Net realized and unrealized gains (losses) on investments | 9.66 | 3.47 | 12.56 | 6.39 | (0.92 | ) | ||||||||||||||
|
|
|
|
|
|
|
|
|
| |||||||||||
Total from investment operations | 9.55 | 3.44 | 12.48 | 6.36 | (0.95 | ) | ||||||||||||||
Distributions to shareholders from | ||||||||||||||||||||
Net investment income | 0.00 | 0.00 | 0.00 | 0.00 | (0.00 | )2 | ||||||||||||||
Net realized gains | (4.15 | ) | (11.22 | ) | (10.57 | ) | (2.31 | ) | (2.55 | ) | ||||||||||
|
|
|
|
|
|
|
|
|
| |||||||||||
Total distributions to shareholders | (4.15 | ) | (11.22 | ) | (10.57 | ) | (2.31 | ) | (2.55 | ) | ||||||||||
Net asset value, end of period | $49.63 | $44.23 | $52.01 | $50.10 | $46.05 | |||||||||||||||
Total return3 | 23.51 | % | 11.00 | % | 27.98 | % | 14.60 | % | (1.83 | )% | ||||||||||
Ratios to average net assets (annualized) | ||||||||||||||||||||
Gross expenses | 1.18 | % | 1.18 | % | 1.17 | % | 1.17 | % | 1.16 | % | ||||||||||
Net expenses | 1.05 | % | 1.07 | % | 1.07 | % | 1.07 | % | 1.07 | % | ||||||||||
Net investment loss | (0.24 | )% | (0.07 | )% | (0.16 | )% | (0.06 | )% | (0.06 | )% | ||||||||||
Supplemental data | ||||||||||||||||||||
Portfolio turnover rate | 34 | % | 43 | % | 34 | % | 40 | % | 31 | % | ||||||||||
Net assets, end of period (000s omitted) | $587,771 | $529,110 | $534,694 | $516,410 | $576,502 | |||||||||||||||
| 1 | Calculated based upon average shares outstanding |
| 2 | Amount is less than $0.005. |
| 3 | Total return calculations do not include any sales charges. |
The accompanying notes are an integral part of these financial statements.
Wells Fargo Large Cap Growth Fund | 17
Table of Contents
Financial highlights
(For a share outstanding throughout each period)
| Year ended July 31 | ||||||||||||||||||||
| CLASS C | 2020 | 2019 | 2018 | 2017 | 2016 | |||||||||||||||
Net asset value, beginning of period | $39.41 | $47.97 | $47.25 | $43.88 | $47.68 | |||||||||||||||
Net investment loss | (0.38 | )1 | (0.32 | )1 | (0.31 | ) | (0.35 | )1 | (0.32 | )1 | ||||||||||
Net realized and unrealized gains (losses) on investments | 8.44 | 2.98 | 11.60 | 6.03 | (0.93 | ) | ||||||||||||||
|
|
|
|
|
|
|
|
|
| |||||||||||
Total from investment operations | 8.06 | 2.66 | 11.29 | 5.68 | (1.25 | ) | ||||||||||||||
Distributions to shareholders from | ||||||||||||||||||||
Net realized gains | (4.15 | ) | (11.22 | ) | (10.57 | ) | (2.31 | ) | (2.55 | ) | ||||||||||
Net asset value, end of period | $43.32 | $39.41 | $47.97 | $47.25 | $43.88 | |||||||||||||||
Total return2 | 22.57 | % | 10.17 | % | 27.03 | % | 13.74 | % | (2.56 | )% | ||||||||||
Ratios to average net assets (annualized) | ||||||||||||||||||||
Gross expenses | 1.93 | % | 1.93 | % | 1.92 | % | 1.91 | % | 1.91 | % | ||||||||||
Net expenses | 1.82 | % | 1.82 | % | 1.82 | % | 1.82 | % | 1.82 | % | ||||||||||
Net investment loss | (1.00 | )% | (0.80 | )% | (0.90 | )% | (0.81 | )% | (0.75 | )% | ||||||||||
Supplemental data | ||||||||||||||||||||
Portfolio turnover rate | 34 | % | 43 | % | 34 | % | 40 | % | 31 | % | ||||||||||
Net assets, end of period (000s omitted) | $9,918 | $11,504 | $15,586 | $14,640 | $18,877 | |||||||||||||||
| 1 | Calculated based upon average shares outstanding |
| 2 | Total return calculations do not include any sales charges. |
The accompanying notes are an integral part of these financial statements.
18 | Wells Fargo Large Cap Growth Fund
Table of Contents
Financial highlights
(For a share outstanding throughout each period)
| Year ended July 31 | ||||||||||||||||||||
| CLASS R | 2020 | 2019 | 2018 | 2017 | 2016 | |||||||||||||||
Net asset value, beginning of period | $42.86 | $50.89 | $49.34 | $45.50 | $49.11 | |||||||||||||||
Net investment loss | (0.20 | )1 | (0.13 | )1 | (0.20 | )1 | (0.14 | )1 | (0.10 | )1 | ||||||||||
Net realized and unrealized gains (losses) on investments | 9.30 | 3.32 | 12.32 | 6.29 | (0.96 | ) | ||||||||||||||
|
|
|
|
|
|
|
|
|
| |||||||||||
Total from investment operations | 9.10 | 3.19 | 12.12 | 6.15 | (1.06 | ) | ||||||||||||||
Distributions to shareholders from | ||||||||||||||||||||
Net realized gains | (4.15 | ) | (11.22 | ) | (10.57 | ) | (2.31 | ) | (2.55 | ) | ||||||||||
Net asset value, end of period | $47.81 | $42.86 | $50.89 | $49.34 | $45.50 | |||||||||||||||
Total return | 23.16 | % | 10.74 | % | 27.65 | % | 14.30 | % | (2.08 | )% | ||||||||||
Ratios to average net assets (annualized) | ||||||||||||||||||||
Gross expenses | 1.41 | % | 1.42 | % | 1.42 | % | 1.41 | % | 1.41 | % | ||||||||||
Net expenses | 1.32 | % | 1.32 | % | 1.32 | % | 1.32 | % | 1.32 | % | ||||||||||
Net investment loss | (0.49 | )% | (0.29 | )% | (0.40 | )% | (0.31 | )% | (0.23 | )% | ||||||||||
Supplemental data | ||||||||||||||||||||
Portfolio turnover rate | 34 | % | 43 | % | 34 | % | 40 | % | 31 | % | ||||||||||
Net assets, end of period (000s omitted) | $3,322 | $4,499 | $5,661 | $6,387 | $8,218 | |||||||||||||||
| 1 | Calculated based upon average shares outstanding |
The accompanying notes are an integral part of these financial statements.
Wells Fargo Large Cap Growth Fund | 19
Table of Contents
Financial highlights
(For a share outstanding throughout each period)
| Year ended July 31 | ||||||||||||||||||||
| CLASS R4 | 2020 | 2019 | 2018 | 2017 | 2016 | |||||||||||||||
Net asset value, beginning of period | $45.72 | $53.23 | $50.94 | $46.69 | $50.23 | |||||||||||||||
Net investment income | 0.02 | 1 | 0.11 | 1 | 0.05 | 1 | 0.11 | 1 | 0.13 | |||||||||||
Net realized and unrealized gains (losses) on investments | 9.91 | 3.60 | 12.81 | 6.50 | (0.95 | ) | ||||||||||||||
|
|
|
|
|
|
|
|
|
| |||||||||||
Total from investment operations | 9.93 | 3.71 | 12.86 | 6.61 | (0.82 | ) | ||||||||||||||
Distributions to shareholders from | ||||||||||||||||||||
Net investment income | (0.07 | ) | 0.00 | 0.00 | (0.05 | ) | (0.17 | ) | ||||||||||||
Net realized gains | (4.15 | ) | (11.22 | ) | (10.57 | ) | (2.31 | ) | (2.55 | ) | ||||||||||
|
|
|
|
|
|
|
|
|
| |||||||||||
Total distributions to shareholders | (4.22 | ) | (11.22 | ) | (10.57 | ) | (2.36 | ) | (2.72 | ) | ||||||||||
Net asset value, end of period | $51.43 | $45.72 | $53.23 | $50.94 | $46.69 | |||||||||||||||
Total return | 23.59 | % | 11.32 | % | 28.31 | % | 14.96 | % | (1.54 | )% | ||||||||||
Ratios to average net assets (annualized) | ||||||||||||||||||||
Gross expenses | 0.90 | % | 0.90 | % | 0.90 | % | 0.88 | % | 0.88 | % | ||||||||||
Net expenses | 0.80 | % | 0.80 | % | 0.80 | % | 0.80 | % | 0.78 | % | ||||||||||
Net investment income | 0.05 | % | 0.24 | % | 0.10 | % | 0.25 | % | 0.27 | % | ||||||||||
Supplemental data | ||||||||||||||||||||
Portfolio turnover rate | 34 | % | 43 | % | 34 | % | 40 | % | 31 | % | ||||||||||
Net assets, end of period (000s omitted) | $18 | $896 | $2,089 | $337 | $8,400 | |||||||||||||||
| 1 | Calculated based upon average shares outstanding |
The accompanying notes are an integral part of these financial statements.
20 | Wells Fargo Large Cap Growth Fund
Table of Contents
Financial highlights
(For a share outstanding throughout each period)
| Year ended July 31 | ||||||||||||||||||||
| CLASS R6 | 2020 | 2019 | 2018 | 2017 | 2016 | |||||||||||||||
Net asset value, beginning of period | $46.06 | $53.49 | $51.12 | $46.82 | $50.34 | |||||||||||||||
Net investment income | 0.08 | 1 | 0.16 | 1 | 0.14 | 0.17 | 0.22 | |||||||||||||
Net realized and unrealized gains (losses) on investments | 10.09 | 3.65 | 12.85 | 6.52 | (0.97 | ) | ||||||||||||||
|
|
|
|
|
|
|
|
|
| |||||||||||
Total from investment operations | 10.17 | 3.81 | 12.99 | 6.69 | (0.75 | ) | ||||||||||||||
Distributions to shareholders from | ||||||||||||||||||||
Net investment income | (0.13 | ) | (0.02 | ) | (0.05 | ) | (0.08 | ) | (0.22 | ) | ||||||||||
Net realized gains | (4.15 | ) | (11.22 | ) | (10.57 | ) | (2.31 | ) | (2.55 | ) | ||||||||||
|
|
|
|
|
|
|
|
|
| |||||||||||
Total distributions to shareholders | (4.28 | ) | (11.24 | ) | (10.62 | ) | (2.39 | ) | (2.77 | ) | ||||||||||
Net asset value, end of period | $51.95 | $46.06 | $53.49 | $51.12 | $46.82 | |||||||||||||||
Total return | 24.03 | % | 11.46 | % | 28.51 | % | 15.09 | % | (1.39 | )% | ||||||||||
Ratios to average net assets (annualized) | ||||||||||||||||||||
Gross expenses | 0.75 | % | 0.75 | % | 0.75 | % | 0.74 | % | 0.73 | % | ||||||||||
Net expenses | 0.65 | % | 0.65 | % | 0.65 | % | 0.65 | % | 0.64 | % | ||||||||||
Net investment income | 0.17 | % | 0.35 | % | 0.27 | % | 0.36 | % | 0.39 | % | ||||||||||
Supplemental data | ||||||||||||||||||||
Portfolio turnover rate | 34 | % | 43 | % | 34 | % | 40 | % | 31 | % | ||||||||||
Net assets, end of period (000s omitted) | $327,584 | $326,990 | $327,943 | $307,048 | $225,805 | |||||||||||||||
| 1 | Calculated based upon average shares outstanding |
The accompanying notes are an integral part of these financial statements.
Wells Fargo Large Cap Growth Fund | 21
Table of Contents
Financial highlights
(For a share outstanding throughout each period)
| Year ended July 31 | ||||||||||||||||||||
| ADMINISTRATOR CLASS | 2020 | 2019 | 2018 | 2017 | 2016 | |||||||||||||||
Net asset value, beginning of period | $44.87 | $52.54 | $50.46 | $46.32 | $49.84 | |||||||||||||||
Net investment income (loss) | (0.07 | ) | 0.02 | (0.01 | ) | 0.05 | 0.05 | |||||||||||||
Net realized and unrealized gains (losses) on investments | 9.83 | 3.53 | 12.66 | 6.41 | (0.94 | ) | ||||||||||||||
|
|
|
|
|
|
|
|
|
| |||||||||||
Total from investment operations | 9.76 | 3.55 | 12.65 | 6.46 | (0.89 | ) | ||||||||||||||
Distributions to shareholders from | ||||||||||||||||||||
Net investment income | (0.01 | ) | 0.00 | 0.00 | (0.01 | ) | (0.08 | ) | ||||||||||||
Net realized gains | (4.15 | ) | (11.22 | ) | (10.57 | ) | (2.31 | ) | (2.55 | ) | ||||||||||
|
|
|
|
|
|
|
|
|
| |||||||||||
Total distributions to shareholders | (4.16 | ) | (11.22 | ) | (10.57 | ) | (2.32 | ) | (2.63 | ) | ||||||||||
Net asset value, end of period | $50.47 | $44.87 | $52.54 | $50.46 | $46.32 | |||||||||||||||
Total return | 23.63 | % | 11.14 | % | 28.14 | % | 14.75 | % | (1.71 | )% | ||||||||||
Ratios to average net assets (annualized) | ||||||||||||||||||||
Gross expenses | 1.10 | % | 1.10 | % | 1.09 | % | 1.08 | % | 1.08 | % | ||||||||||
Net expenses | 0.95 | % | 0.95 | % | 0.95 | % | 0.95 | % | 0.95 | % | ||||||||||
Net investment income (loss) | (0.14 | )% | 0.05 | % | (0.03 | )% | 0.06 | % | 0.12 | % | ||||||||||
Supplemental data | ||||||||||||||||||||
Portfolio turnover rate | 34 | % | 43 | % | 34 | % | 40 | % | 31 | % | ||||||||||
Net assets, end of period (000s omitted) | $79,334 | $67,158 | $79,154 | $80,937 | $237,577 | |||||||||||||||
The accompanying notes are an integral part of these financial statements.
22 | Wells Fargo Large Cap Growth Fund
Table of Contents
Financial highlights
(For a share outstanding throughout each period)
| Year ended July 31 | ||||||||||||||||||||
| INSTITUTIONAL CLASS | 2020 | 2019 | 2018 | 2017 | 2016 | |||||||||||||||
Net asset value, beginning of period | $45.84 | $53.31 | $51.00 | $46.74 | $50.30 | |||||||||||||||
Net investment income | 0.03 | 1 | 0.12 | 1 | 0.10 | 1 | 0.12 | 1 | 0.17 | 1 | ||||||||||
Net realized and unrealized gains (losses) on investments | 10.04 | 3.63 | 12.80 | 6.51 | (0.96 | ) | ||||||||||||||
|
|
|
|
|
|
|
|
|
| |||||||||||
Total from investment operations | 10.07 | 3.75 | 12.90 | 6.63 | (0.79 | ) | ||||||||||||||
Distributions to shareholders from | ||||||||||||||||||||
Net investment income | (0.09 | ) | 0.00 | (0.02 | ) | (0.06 | ) | (0.22 | ) | |||||||||||
Net realized gains | (4.15 | ) | (11.22 | ) | (10.57 | ) | (2.31 | ) | (2.55 | ) | ||||||||||
|
|
|
|
|
|
|
|
|
| |||||||||||
Total distributions to shareholders | (4.24 | ) | (11.22 | ) | (10.59 | ) | (2.37 | ) | (2.77 | ) | ||||||||||
Net asset value, end of period | $51.67 | $45.84 | $53.31 | $51.00 | $46.74 | |||||||||||||||
Total return | 23.89 | % | 11.37 | % | 28.37 | % | 14.98 | % | (1.49 | )% | ||||||||||
Ratios to average net assets (annualized) | ||||||||||||||||||||
Gross expenses | 0.85 | % | 0.85 | % | 0.84 | % | 0.83 | % | 0.83 | % | ||||||||||
Net expenses | 0.75 | % | 0.75 | % | 0.75 | % | 0.75 | % | 0.71 | % | ||||||||||
Net investment income | 0.07 | % | 0.26 | % | 0.18 | % | 0.27 | % | 0.37 | % | ||||||||||
Supplemental data | ||||||||||||||||||||
Portfolio turnover rate | 34 | % | 43 | % | 34 | % | 40 | % | 31 | % | ||||||||||
Net assets, end of period (000s omitted) | $72,681 | $80,194 | $95,809 | $169,836 | $316,310 | |||||||||||||||
| 1 | Calculated based upon average shares outstanding |
The accompanying notes are an integral part of these financial statements.
Wells Fargo Large Cap Growth Fund | 23
Table of Contents
1. ORGANIZATION
Wells Fargo Funds Trust (the “Trust”), a Delaware statutory trust organized on March 10, 1999, is an open-end management investment company registered under the Investment Company Act of 1940, as amended (the “1940 Act”). As an investment company, the Trust follows the accounting and reporting guidance in Financial Accounting Standards Board (“FASB”) Accounting Standards Codification Topic 946, Financial Services – Investment Companies. These financial statements report on the Wells Fargo Large Cap Growth Fund (the “Fund”) which is a diversified series of the Trust.
2. SIGNIFICANT ACCOUNTING POLICIES
The following significant accounting policies, which are consistently followed in the preparation of the financial statements of the Fund, are in conformity with U.S. generally accepted accounting principles which require management to make estimates and assumptions that affect the reported amounts of assets and liabilities, disclosure of contingent assets and liabilities at the date of the financial statements, and the reported amounts of revenues and expenses during the reporting period. Actual results could differ from those estimates.
Securities valuation
All investments are valued each business day as of the close of regular trading on the New York Stock Exchange (generally 4 p.m. Eastern Time), although the Fund may deviate from this calculation time under unusual or unexpected circumstances.
Equity securities that are listed on a foreign or domestic exchange or market are valued at the official closing price or, if none, the last sales price. If no sale occurs on the principal exchange or market that day, a fair value price will be determined in accordance with the Fund’s Valuation Procedures.
Investments in registered open-end investment companies are valued at net asset value. Interests in non-registered investment companies that are redeemable at net asset value are fair valued normally at net asset value.
Investments which are not valued using any of the methods discussed above are valued at their fair value, as determined in good faith by the Board of Trustees of the Fund. The Board of Trustees has established a Valuation Committee comprised of the Trustees and has delegated to it the authority to take any actions regarding the valuation of portfolio securities that the Valuation Committee deems necessary or appropriate, including determining the fair value of portfolio securities, unless the determination has been delegated to the Wells Fargo Asset Management Pricing Committee at Wells Fargo Funds Management, LLC (“Funds Management”). The Board of Trustees retains the authority to make or ratify any valuation decisions or approve any changes to the Valuation Procedures as it deems appropriate. On a quarterly basis, the Board of Trustees receives reports on any valuation actions taken by the Valuation Committee or the Wells Fargo Asset Management Pricing Committee which may include items for ratification.
Foreign currency translation
The accounting records of the Fund are maintained in U.S. dollars. The values of other assets and liabilities denominated in foreign currencies are translated into U.S. dollars at rates provided by an independent foreign currency pricing source at a time each business day specified by the Wells Fargo Asset Management Pricing Committee. Purchases and sales of securities, and income and expenses are converted at the rate of exchange on the respective dates of such transactions. Net realized foreign exchange gains or losses arise from sales of foreign currencies, currency gains or losses realized between the trade and settlement dates on securities transactions, and the difference between the amounts of dividends, interest and foreign withholding taxes recorded and the U.S. dollar equivalent of the amounts actually paid or received. Net unrealized foreign exchange gains and losses arise from changes in the fair value of assets and liabilities other than investments in securities resulting from changes in exchange rates. The changes in net assets arising from changes in exchange rates of securities and the changes in net assets resulting from changes in market prices of securities are not separately presented. Such changes are included in net realized and unrealized gains or losses from investments.
Securities lending
The Fund may lend its securities from time to time in order to earn additional income in the form of fees or interest on securities received as collateral or the investment of any cash received as collateral. When securities are on loan, the Fund receives interest or dividends on those securities. Cash collateral received in connection with its securities lending transactions is invested in Securities Lending Cash Investments, LLC (the “Securities Lending Fund”). Investments in Securities Lending Fund are valued at the evaluated bid price provided by an independent pricing service. Income earned from investment in the Securities Lending Fund (net of fees and rebates), if any, is included in income from affiliated securities on the Statement of Operations.
24 | Wells Fargo Large Cap Growth Fund
Table of Contents
Notes to financial statements
In a securities lending transaction, the net asset value of the Fund is affected by an increase or decrease in the value of the securities loaned and by an increase or decrease in the value of the instrument in which collateral is invested. The amount of securities lending activity undertaken by the Fund fluctuates from time to time. The Fund has the right under the lending agreement to recover the securities from the borrower on demand. In the event of default or bankruptcy by the borrower, the Fund may be prevented from recovering the loaned securities or gaining access to the collateral or may experience delays or costs in doing so. In such an event, the terms of the agreement allow the unaffiliated securities lending agent to use the collateral to purchase replacement securities on behalf of the Fund or pay the Fund the market value of the loaned securities. The Fund bears the risk of loss with respect to depreciation of its investment of the cash collateral.
Security transactions and income recognition
Securities transactions are recorded on a trade date basis. Realized gains or losses are recorded on the basis of identified cost.
Dividend income is recognized on the ex-dividend date. Dividend income is recorded net of foreign taxes withheld where recovery of such taxes is not assured.
Distributions to shareholders
Distributions to shareholders from net investment income and any net realized gains are recorded on the ex-dividend date and paid at least annually. Such distributions are determined in accordance with income tax regulations and may differ from U.S. generally accepted accounting principles. Dividend sources are estimated at the time of declaration. The tax character of distributions is determined as of the Fund’s fiscal year end. Therefore, a portion of the Fund’s distributions made prior to the Fund’s fiscal year end may be categorized as a tax return of capital at year end.
Federal and other taxes
The Fund intends to continue to qualify as a regulated investment company by distributing substantially all of its investment company taxable income and any net realized capital gains (after reduction for capital loss carryforwards) sufficient to relieve it from all, or substantially all, federal income taxes. Accordingly, no provision for federal income taxes was required.
The Fund’s income and federal excise tax returns and all financial records supporting those returns for the prior three fiscal years are subject to examination by the federal and Delaware revenue authorities. Management has analyzed the Fund’s tax positions taken on federal, state, and foreign tax returns for all open tax years and does not believe that there are any uncertain tax positions that require recognition of a tax liability.
As of July 31, 2020, the aggregate cost of all investments for federal income tax purposes was $453,425,243 and the unrealized gains (losses) consisted of:
Gross unrealized gains | $ | 631,427,628 | ||
Gross unrealized losses | 0 | |||
Net unrealized gains | $ | 631,427,628 | ||
As of July 31, 2020, the Fund had a qualified late-year ordinary loss of $1,133,005 which will be recognized on the first day of the following fiscal year.
Class allocations
The separate classes of shares offered by the Fund differ principally in applicable sales charges, distribution, shareholder servicing, and administration fees. Class specific expenses are charged directly to that share class. Investment income, common fund-level expenses, and realized and unrealized gains (losses) on investments are allocated daily to each class of shares based on the relative proportion of net assets of each class.
3. FAIR VALUATION MEASUREMENTS
Fair value measurements of investments are determined within a framework that has established a fair value hierarchy based upon the various data inputs utilized in determining the value of the Fund’s investments. The three-level hierarchy gives the highest priority to unadjusted quoted prices in active markets for identical assets or liabilities (Level 1) and the lowest priority to unobservable inputs (Level 3). The Fund’s investments are classified within the fair value hierarchy based on the lowest level of input that is significant to the fair value measurement. The inputs are summarized into three broad levels as follows:
| ∎ | Level 1 – quoted prices in active markets for identical securities |
| ∎ | Level 2 – other significant observable inputs (including quoted prices for similar securities, interest rates, prepayment speeds, credit risk, etc.) |
| ∎ | Level 3 – significant unobservable inputs (including the Fund’s own assumptions in determining the fair value of investments) |
Wells Fargo Large Cap Growth Fund | 25
Table of Contents
Notes to financial statements
The inputs or methodologies used for valuing investments in securities are not necessarily an indication of the risk associated with investing in those securities.
The following is a summary of the inputs used in valuing the Fund’s assets and liabilities as of July 31, 2020:
Quoted prices (Level 1) | Other significant observable inputs (Level 2) | Significant unobservable inputs (Level 3) | Total | |||||||||||||
Assets | ||||||||||||||||
Investments in: | ||||||||||||||||
Common stocks | ||||||||||||||||
Communication services | $ | 135,389,390 | $ | 0 | $ | 0 | $ | 135,389,390 | ||||||||
Consumer discretionary | 175,894,291 | 0 | 0 | 175,894,291 | ||||||||||||
Consumer staples | 11,602,107 | 0 | 0 | 11,602,107 | ||||||||||||
Financials | 28,857,695 | 0 | 0 | 28,857,695 | ||||||||||||
Health care | 147,554,179 | 0 | 0 | 147,554,179 | ||||||||||||
Industrials | 93,312,794 | 0 | 0 | 93,312,794 | ||||||||||||
Information technology | 446,146,776 | 0 | 0 | 446,146,776 | ||||||||||||
Materials | 43,279,926 | 0 | 0 | 43,279,926 | ||||||||||||
Short-term investments | ||||||||||||||||
Investment companies | 2,815,713 | 0 | 0 | 2,815,713 | ||||||||||||
Total assets | $ | 1,084,852,871 | $ | 0 | $ | 0 | $ | 1,084,852,871 | ||||||||
Additional sector, industry or geographic detail is included in the Portfolio of Investments.
For the year ended July 31, 2020, the Fund did not have any transfers into/out of Level 3.
4. TRANSACTIONS WITH AFFILIATES
Management fee
Funds Management, an indirect wholly owned subsidiary of Wells Fargo & Company (“Wells Fargo”), is the manager of the Fund and provides advisory and fund-level administrative services under an investment management agreement. Under the investment management agreement, Funds Management is responsible for, among other services, implementing the investment objectives and strategies of the Fund, supervising the subadviser and providing fund-level administrative services in connection with the Fund’s operations. As compensation for its services under the investment management agreement, Funds Management is entitled to receive a management fee at the following annual rate based on the Fund’s average daily net assets:
| Average daily net assets | Management fee | |||
First $500 million | 0.700 | % | ||
Next $500 million | 0.675 | |||
Next $1 billion | 0.650 | |||
Next $2 billion | 0.625 | |||
Next $1 billion | 0.600 | |||
Next $3 billion | 0.590 | |||
Next $2 billion | 0.565 | |||
Next $2 billion | 0.555 | |||
Next $4 billion | 0.530 | |||
Over $16 billion | 0.505 | |||
For the year ended July 31, 2020, the management fee was equivalent to an annual rate of 0.69% of the Fund’s average daily net assets.
Funds Management has retained the services of a subadviser to provide daily portfolio management to the Fund. The fee for subadvisory services is borne by Funds Management. Wells Capital Management Incorporated (“WellsCap”), an affiliate of
26 | Wells Fargo Large Cap Growth Fund
Table of Contents
Notes to financial statements
Funds Management and an indirect wholly owned subsidiary of Wells Fargo, is the subadviser to the Fund and is entitled to receive a fee from Funds Management at an annual rate starting at 0.30% and declining to 0.20% as the average daily net assets of the Fund increase.
Administration fees
Under a class-level administration agreement, Funds Management provides class-level administrative services to the Fund, which includes paying fees and expenses for services provided by the transfer agent, sub-transfer agents, omnibus account servicers and record-keepers. As compensation for its services under the class-level administration agreement, Funds Management receives an annual fee which is calculated based on the average daily net assets of each class as follows:
Class-level administration fee | ||||
Class A, Class C, Class R | 0.21 | % | ||
Class R4 | 0.08 | |||
Class R6 | 0.03 | |||
Administrator Class, Institutional Class | 0.13 | |||
Waivers and/or expense reimbursements
Funds Management has contractually waived and/or reimbursed management and administration fees to the extent necessary to maintain certain net operating expense ratios for the Fund. When each class of the Fund has exceeded its expense cap, Funds Management has waived fees and/or reimbursed expenses from fund-level expenses on a proportionate basis and then from class specific expenses. When only certain classes exceed their expense caps, waivers and/or reimbursements are applied against class specific expenses before fund-level expenses. Funds Management has committed through November 30, 2020 to waive fees and/or reimburse expenses to the extent necessary to cap the Fund’s expenses at 1.07% for Class A shares, 1.82% for Class C shares, 1.32% for Class R shares, 0.80% for Class R4 shares, 0.65% for Class R6 shares, 0.95% for Administrator Class shares, and 0.75% for Institutional Class shares. Prior to or after the commitment expiration date, the cap may be increased or the commitment to maintain the cap may be terminated only with the approval of the Board of Trustees.
Distribution fees
The Trust has adopted a distribution plan for Class C and Class R shares of the Fund pursuant to Rule 12b-1 under the 1940 Act. Distribution fees are charged to Class C and Class R shares and paid to Wells Fargo Funds Distributor, LLC (“Funds Distributor”), the principal underwriter, at an annual rate of 0.75% of the average daily net assets of Class C shares and 0.25% of the average daily net assets of Class R shares.
In addition, Funds Distributor is entitled to receive the front-end sales charge from the purchase of Class A shares and a contingent deferred sales charge on the redemption of certain Class A shares. Funds Distributor is also entitled to receive the contingent deferred sales charges from redemptions of Class C shares. For the year ended July 31, 2020, Funds Distributor received $1,087 from the sale of Class A shares. No contingent deferred sales charges were incurred by Class A and Class C shares for the year ended July 31, 2020.
Shareholder servicing fees
The Trust has entered into contracts with one or more shareholder servicing agents, whereby Class A, Class C, Class R, and Administrator Class of the Fund are charged a fee at an annual rate of 0.25% of the average daily net assets of each respective class. Class R4 is charged a fee at an annual rate of 0.10% of its average daily net assets. A portion of these total shareholder servicing fees were paid to affiliates of Wells Fargo.
Interfund transactions
The Fund may purchase or sell portfolio investment securities to certain other Wells Fargo affiliates pursuant to Rule 17a-7 under the 1940 Act and under procedures adopted by the Board of Trustees. The procedures have been designed to ensure that these interfund transactions, which do not incur broker commissions, are effected at current market prices.
5. INVESTMENT PORTFOLIO TRANSACTIONS
Purchases and sales of investments, excluding U.S. government obligations (if any) and short-term securities, for the year ended July 31, 2020 were $329,451,576 and $470,909,977, respectively.
Wells Fargo Large Cap Growth Fund | 27
Table of Contents
Notes to financial statements
6. SECURITIES LENDING TRANSACTIONS
The Fund lends its securities through an unaffiliated securities lending agent and receives collateral in the form of cash or securities with a value at least equal to the value of the securities on loan. The value of the loaned securities is determined at the close of each business day and any increases or decreases in the required collateral are exchanged between the Fund and the counterparty on the next business day. Cash collateral received is invested in the Securities Lending Fund which seeks to provide a positive return compared to the daily Federal Funds Open Rate by investing in high-quality, U.S. dollar-denominated short-term money market instruments and is exempt from registration under Section 3(c)(7) of the 1940 Act. Securities Lending Fund is managed by Funds Management and is subadvised by WellsCap. Funds Management receives an advisory fee starting at 0.05% and declining to 0.01% as the average daily net assets of the Securities Lending Fund increase. All of the fees received by Funds Management are paid to WellsCap for its services as subadviser.
In the event of counterparty default or the failure of a borrower to return a loaned security, the Fund has the right to use the collateral to offset any losses incurred. As of July 31, 2020, the Fund did not have any securities on loan.
7. BANK BORROWINGS
The Trust (excluding the money market funds), Wells Fargo Master Trust and Wells Fargo Variable Trust are parties to a $350,000,000 revolving credit agreement whereby the Fund is permitted to use bank borrowings for temporary or emergency purposes, such as to fund shareholder redemption requests. Interest under the credit agreement is charged to the Fund based on a borrowing rate equal to the higher of the Federal Funds rate in effect on that day plus 1.25% or the overnight LIBOR rate in effect on that day plus 1.25%. In addition, an annual commitment fee equal to 0.25% of the unused balance is allocated to each participating fund.
For the year ended July 31, 2020, there were no borrowings by the Fund under the agreement.
8. DISTRIBUTIONS TO SHAREHOLDERS
The tax character of distributions paid during the years ended July 31, 2020 and July 31, 2019 were as follows:
| Year ended July 31 | ||||||||
| 2020 | 2019 | |||||||
Ordinary income | $ | 1,091,392 | $ | 137,477 | ||||
Long-term capital gain | 90,740,075 | 215,423,831 | ||||||
As of July 31, 2020, the components of distributable earnings on a tax basis were as follows:
Undistributed long-term gain | Unrealized gains | Late-year ordinary losses deferred | ||
| $89,584,430 | $631,427,628 | $(1,133,005) | ||
9. CONCENTRATION RISK
Concentration risks result from exposure to a limited number of sectors. As of the end of the period, the Fund invested a concentration of its portfolio in the information technology sector. A fund that invests a substantial portion of its assets in any sector may be more affected by changes in that sector than would be a fund whose investments are not heavily weighted in any sector.
10. INDEMNIFICATION
Under the Fund’s organizational documents, the officers and Trustees have been granted certain indemnification rights against certain liabilities that may arise out of performance of their duties to the Fund. The Fund has entered into a separate agreement with each Trustee that converts indemnification rights currently existing under the Fund’s organizational documents into contractual rights that cannot be changed in the future without the consent of the Trustee. Additionally, in the normal course of business, the Fund may enter into contracts with service providers that contain a variety of indemnification clauses. The Fund’s maximum exposure under these arrangements is dependent on future claims that may be made against the Fund and, therefore, cannot be estimated.
28 | Wells Fargo Large Cap Growth Fund
Table of Contents
Notes to financial statements
11. NEW ACCOUNTING PRONOUNCEMENT
In August 2018, FASB issued Accounting Standards Update (“ASU”) No. 2018-13, Fair Value Measurement (Topic 820) Disclosure Framework—Changes to the Disclosure Requirements for Fair Value Measurement. ASU 2018-13 updates the disclosure requirements on fair value measurements in Topic 820, Fair Value Measurements. The amendments are effective for fiscal years, and interim periods within those fiscal years, beginning after December 15, 2019. Management has adopted this guidance which did not have a material impact on the financial statements.
12. CORONAVIRUS (COVID-19) PANDEMIC
On March 11, 2020, the World Health Organization announced that it had made the assessment that coronavirus disease 2019 (“COVID-19”) is a pandemic. The impacts of COVID-19 are adversely affecting the entire global economy, individual companies and investment products, and the market in general. There is significant uncertainty around the extent and duration of business disruptions related to COVID-19 and the impacts may be short term or may last for an extended period of time. The risk of further spreading of COVID-19 has led to significant uncertainty and volatility in the financial markets.
Wells Fargo Large Cap Growth Fund | 29
Table of Contents
Report of independent registered public accounting firm
To the Shareholders of the Fund and Board of Trustees
Wells Fargo Funds Trust:
Opinion on the Financial Statements
We have audited the accompanying statement of assets and liabilities of Wells Fargo Large Cap Growth Fund (the Fund), one of the funds constituting Wells Fargo Funds Trust, including the portfolio of investments, as of July 31, 2020, the related statement of operations for the year then ended, the statements of changes in net assets for each of the years in the two-year period then ended, and the related notes (collectively, the financial statements) and the financial highlights for each of the years in the five-year period then ended. In our opinion, the financial statements and financial highlights present fairly, in all material respects, the financial position of the Fund as of July 31, 2020, the results of its operations for the year then ended, the changes in its net assets for each of the years in the two-year period then ended, and the financial highlights for each of the years in the five-year period then ended, in conformity with U.S. generally accepted accounting principles.
Basis for Opinion
These financial statements and financial highlights are the responsibility of the Fund’s management. Our responsibility is to express an opinion on these financial statements and financial highlights based on our audits. We are a public accounting firm registered with the Public Company Accounting Oversight Board (United States) (PCAOB) and are required to be independent with respect to the Fund in accordance with the U.S. federal securities laws and the applicable rules and regulations of the Securities and Exchange Commission and the PCAOB.
We conducted our audits in accordance with the standards of the PCAOB. Those standards require that we plan and perform the audit to obtain reasonable assurance about whether the financial statements and financial highlights are free of material misstatement, whether due to error or fraud. Our audits included performing procedures to assess the risks of material misstatement of the financial statements and financial highlights, whether due to error or fraud, and performing procedures that respond to those risks. Such procedures included examining, on a test basis, evidence regarding the amounts and disclosures in the financial statements and financial highlights. Such procedures also included confirmation of securities owned as of July 31, 2020, by correspondence with the custodian, transfer agent and brokers, or by other appropriate auditing procedures. Our audits also included evaluating the accounting principles used and significant estimates made by management, as well as evaluating the overall presentation of the financial statements and financial highlights. We believe that our audits provide a reasonable basis for our opinion.

We have not been able to determine the specific year that we began serving as the auditor of one or more Wells Fargo Funds investment companies; however we are aware that we have served as the auditor of one or more Wells Fargo Funds investment companies since at least 1955.
Boston, Massachusetts
September 25, 2020
30 | Wells Fargo Large Cap Growth Fund
Table of Contents
TAX INFORMATION
For corporate shareholders, pursuant to Section 854 of the Internal Revenue Code, 100% of ordinary income dividends qualify for the corporate dividends-received deduction for the fiscal year ended July 31, 2020.
Pursuant to Section 852 of the Internal Revenue Code, $90,740,075 was designated as a 20% rate gain distribution for the fiscal year ended July 31, 2020.
Pursuant to Section 854 of the Internal Revenue Code, $1,091,392 of income dividends paid during the fiscal year ended July 31, 2020 has been designated as qualified dividend income (QDI).
For the fiscal year ended July 31, 2020, $14,131 has been designated as interest-related dividends for nonresident alien shareholders pursuant to Section 871 of the Internal Revenue Code.
PROXY VOTING INFORMATION
A description of the policies and procedures used to determine how to vote proxies relating to portfolio securities is available, upon request, by calling 1-800-222-8222, visiting our website at wfam.com, or visiting the SEC website at sec.gov. Information regarding how the proxies related to portfolio securities were voted during the most recent 12-month period ended June 30 is available on the website at wfam.com or by visiting the SEC website at sec.gov.
QUARTERLY PORTFOLIO HOLDINGS INFORMATION
The Fund files its complete schedule of portfolio holdings with the SEC for the first and third quarters of each fiscal year as an exhibit to its reports on Form N-PORT. Shareholders may view the filed Form N-PORT by visiting the SEC website at sec.gov.
Wells Fargo Large Cap Growth Fund | 31
Table of Contents
Other information (unaudited)
BOARD OF TRUSTEES AND OFFICERS
Each of the Trustees and Officers1 listed in the table below acts in identical capacities for each fund in the Wells Fargo family of funds, which consists of 147 mutual funds comprising the Wells Fargo Funds Trust, Wells Fargo Variable Trust, Wells Fargo Master Trust and four closed-end funds (collectively the “Fund Complex”). This table should be read in conjunction with the Prospectus and the Statement of Additional Information2. The mailing address of each Trustee and Officer is 525 Market Street, 12th Floor, San Francisco, CA 94105. Each Trustee and Officer serves an indefinite term, however, each Trustee serves such term until reaching the mandatory retirement age established by the Trustees.
Independent Trustees
Name and year of birth | Position held and length of service* | Principal occupations during past five years or longer | Current other public company or investment company directorships | |||
William R. Ebsworth (Born 1957) | Trustee, since 2015 | Retired. From 1984 to 2013, equities analyst, portfolio manager, research director and chief investment officer at Fidelity Management and Research Company in Boston, Tokyo, and Hong Kong, and retired in 2013 as Chief Investment Officer of Fidelity Strategic Advisers, Inc. where he led a team of investment professionals managing client assets. Prior thereto, Board member of Hong Kong Securities Clearing Co., Hong Kong Options Clearing Corp., the Thailand International Fund, Ltd., Fidelity Investments Life Insurance Company, and Empire Fidelity Investments Life Insurance Company. Audit Committee Chair and Investment Committee Chair of the Vincent Memorial Hospital Endowment (non-profit organization). Mr. Ebsworth is a CFA® charterholder. | N/A | |||
Jane A. Freeman (Born 1953) | Trustee, since 2015; Chair Liaison, since 2018 | Retired. From 2012 to 2014 and 1999 to 2008, Chief Financial Officer of Scientific Learning Corporation. From 2008 to 2012, Ms. Freeman provided consulting services related to strategic business projects. Prior to 1999, Portfolio Manager at Rockefeller & Co. and Scudder, Stevens & Clark. Board member of the Harding Loevner Funds from 1996 to 2014, serving as both Lead Independent Director and chair of the Audit Committee. Board member of the Russell Exchange Traded Funds Trust from 2011 to 2012 and the chair of the Audit Committee. Ms. Freeman is also an inactive Chartered Financial Analyst. | N/A | |||
Isaiah Harris, Jr. (Born 1952) | Trustee, since 2009; Audit Committee Chairman, since 2019 | Retired. Chairman of the Board of CIGNA Corporation since 2009, and Director since 2005. From 2003 to 2011, Director of Deluxe Corporation. Prior thereto, President and CEO of BellSouth Advertising and Publishing Corp. from 2005 to 2007, President and CEO of BellSouth Enterprises from 2004 to 2005 and President of BellSouth Consumer Services from 2000 to 2003. Emeritus member of the Iowa State University Foundation Board of Governors. Emeritus Member of the Advisory Board of Iowa State University School of Business. Advisory Board Member, Palm Harbor Academy (private school). Advisory Board Member, Child Evangelism Fellowship (non-profit). Mr. Harris is a certified public accountant (inactive status). | CIGNA Corporation | |||
Judith M. Johnson (Born 1949) | Trustee, since 2008; Audit Committee Chairman, from 2009 to 2018 | Retired. Prior thereto, Chief Executive Officer and Chief Investment Officer of Minneapolis Employees Retirement Fund from 1996 to 2008. Ms. Johnson is an attorney, certified public accountant and a certified managerial accountant. | N/A | |||
32 | Wells Fargo Large Cap Growth Fund
Table of Contents
Other information (unaudited)
Name and year of birth | Position held and length of service* | Principal occupations during past five years or longer | Current other public company or investment company directorships | |||
David F. Larcker (Born 1950) | Trustee, since 2009 | James Irvin Miller Professor of Accounting at the Graduate School of Business, Stanford University, Director of the Corporate Governance Research Initiative and Senior Faculty of The Rock Center for Corporate Governance since 2006. From 2005 to 2008, Professor of Accounting at the Graduate School of Business, Stanford University. Prior thereto, Ernst & Young Professor of Accounting at The Wharton School, University of Pennsylvania from 1985 to 2005. | N/A | |||
Olivia S. Mitchell (Born 1953) | Trustee, since 2006; Nominating and Governance Committee Chair, since 2018 | International Foundation of Employee Benefit Plans Professor, Wharton School of the University of Pennsylvania since 1993. Director of Wharton’s Pension Research Council and Boettner Center on Pensions & Retirement Research, and Research Associate at the National Bureau of Economic Research. Previously, Cornell University Professor from 1978 to 1993. | N/A | |||
Timothy J. Penny (Born 1951) | Trustee, since 1996; Chairman, since 2018 | President and Chief Executive Officer of Southern Minnesota Initiative Foundation, a non-profit organization, since 2007. Member of the Board of Trustees of NorthStar Education Finance, Inc., a non-profit organization, since 2007. | N/A | |||
James G. Polisson (Born 1959) | Trustee, since 2018 | Retired. Chief Marketing Officer, Source (ETF) UK Services, Ltd, from 2015 to 2017. From 2012 to 2015, Principal of The Polisson Group, LLC, a management consulting, corporate advisory and principal investing company. Chief Executive Officer and Managing Director at Russell Investments, Global Exchange Traded Funds from 2010 to 2012. Managing Director of Barclays Global Investors from 1998 to 2010 and Global Chief Marketing Officer for iShares and Barclays Global Investors from 2000 to 2010. Trustee of the San Francisco Mechanics’ Institute, a non-profit organization, from 2013 to 2015. Board member of the Russell Exchange Traded Fund Trust from 2011 to 2012. Director of Barclays Global Investors Holdings Deutschland GmbH from 2006 to 2009. Mr. Polisson is an attorney and has a retired status with the Massachusetts and District of Columbia Bar Associations. | N/A | |||
Pamela Wheelock (Born 1959) | Trustee, since January 2020; previously Trustee from January 2018 to July 2019 | Board member of the Destination Medical Center Economic Development Agency, Rochester, Minnesota since 2019 and Interim President of the McKnight Foundation since 2020. Acting Commissioner, Minnesota Department of Human Services, July 2019 through September 2019. Human Services Manager (part-time), Minnesota Department of Human Services, October 2019 through December 2019. Chief Operating Officer, Twin Cities Habitat for Humanity from 2017 to 2019. Vice President of University Services, University of Minnesota from 2012 to 2016. Prior thereto, on the Board of Directors, Governance Committee and Finance Committee for the Minnesota Philanthropy Partners (Saint Paul Foundation) from 2012 to 2018, Interim Chief Executive Officer of Blue Cross Blue Shield of Minnesota from 2011 to 2012, Chairman of the Board from 2009 to 2012 and Board Director from 2003 to 2015. Vice President, Leadership and Community Engagement, Bush Foundation, Saint Paul, Minnesota (a private foundation) from 2009 to 2011. Executive Vice President and Chief Financial Officer, Minnesota Sports and Entertainment from 2004 to 2009 and Senior Vice President from 2002 to 2004. Executive Vice President of the Minnesota Wild Foundation from 2004 to 2008. Commissioner of Finance, State of Minnesota, from 1999 to 2002. Currently Board Chair of the Minnesota Wild Foundation since 2010. | N/A | |||
| * | Length of service dates reflect the Trustee’s commencement of service with the Trust’s predecessor entities, where applicable. |
Wells Fargo Large Cap Growth Fund | 33
Table of Contents
Other information (unaudited)
Officers
Name and year of birth | Position held and length of service | Principal occupations during past five years or longer | ||
Andrew Owen (Born 1960) | President, since 2017 | Executive Vice President of Wells Fargo & Company and Head of Affiliated Managers, Wells Fargo Asset Management, since 2014. In addition, Mr. Owen is currently President, Chief Executive Officer and Director of Wells Fargo Funds Management, LLC since 2017. Prior thereto, Executive Vice President responsible for marketing, investments and product development for Wells Fargo Funds Management, LLC, from 2009 to 2014. | ||
Jeremy DePalma1 (Born 1974) | Treasurer, since 2012 | Senior Vice President of Wells Fargo Funds Management, LLC since 2009. Senior Vice President of Evergreen Investment Management Company, LLC from 2008 to 2010 and head of the Fund Reporting and Control Team within Fund Administration from 2005 to 2010. | ||
Michelle Rhee (Born 1966) | Chief Legal Officer, since 2019 | Secretary of Wells Fargo Funds Management, LLC, Chief Legal Counsel of Wells Fargo Asset Management and Assistant General Counsel of Wells Fargo Bank, N.A. since 2018. Associate General Counsel and Managing Director of Bank of America Corporation from 2004 to 2018. | ||
Catherine Kennedy (Born 1969) | Secretary, since 2019 | Vice President of Wells Fargo Funds Management, LLC and Senior Counsel of the Wells Fargo Legal Department since 2010. Vice President and Senior Counsel of Evergreen Investment Management Company, LLC from 1998 to 2010. | ||
Michael H. Whitaker (Born 1967) | Chief Compliance Officer, since 2016 | Chief Compliance Officer of Wells Fargo Asset Management since 2016. Senior Vice President and Chief Compliance Officer for Fidelity Investments from 2007 to 2016. | ||
David Berardi (Born 1975) | Assistant Treasurer, since 2009 | Vice President of Wells Fargo Funds Management, LLC since 2009. Vice President of Evergreen Investment Management Company, LLC from 2008 to 2010. Manager of Fund Reporting and Control for Evergreen Investment Management Company, LLC from 2004 to 2010. | ||
| 1 | Jeremy DePalma acts as Treasurer of 82 funds and Assistant Treasurer of 65 funds in the Fund Complex. |
| 2 | The Statement of Additional Information includes additional information about the Trustees and is available, without charge, upon request, by calling 1-800-222-8222 or by visiting the website at wfam.com. |
34 | Wells Fargo Large Cap Growth Fund
Table of Contents
Other information (unaudited)
BOARD CONSIDERATION OF INVESTMENT MANAGEMENT AND SUB-ADVISORY AGREEMENTS:
Wells Fargo Large Cap Growth Fund
Under the Investment Company Act of 1940 (the “1940 Act”), the Board of Trustees (the “Board”) of Wells Fargo Funds Trust (the “Trust”) must determine annually whether to approve the continuation of the Trust’s investment management and sub-advisory agreements. In this regard, at a Board meeting held on May 26, 2020 and May 28, 2020 (together, the “Meeting”), the Board, all the members of which have no direct or indirect interest in the investment management and sub-advisory agreements and are not “interested persons” of the Trust, as defined in the 1940 Act (the “Independent Trustees”), reviewed and approved for Wells Fargo Large Cap Growth Fund (the “Fund”): (i) an investment management agreement (the “Management Agreement”) with Wells Fargo Funds Management, LLC (“Funds Management”); and (ii) an investment sub-advisory agreement (the “Sub-Advisory Agreement”) with Wells Capital Management Incorporated (the “Sub-Adviser”), an affiliate of Funds Management. The Management Agreement and the Sub-Advisory Agreement are collectively referred to as the “Advisory Agreements.”
At the Meeting, the Board considered the factors and reached the conclusions described below relating to the selection of Funds Management and the Sub-Adviser and the approval of the Advisory Agreements. Prior to the Meeting, including at a Board meeting held in April 2020, the Trustees conferred extensively among themselves and with representatives of Funds Management about these matters. Also, the Board has adopted a team-based approach, with each team consisting of a sub-set of Trustees, to assist the full Board in the discharge of its duties in reviewing investment performance and other matters throughout the year. The Independent Trustees were assisted in their evaluation of the Advisory Agreements by independent legal counsel, from whom they received separate legal advice and with whom they met separately.
In providing information to the Board, Funds Management and the Sub-Adviser were guided by a detailed set of requests for information submitted to them by independent legal counsel on behalf of the Independent Trustees at the start of the Board’s annual contract renewal process earlier in 2020. In considering and approving the Advisory Agreements, the Trustees considered the information they believed relevant, including but not limited to the information discussed below. The Board considered not only the specific information presented in connection with the Meeting, but also the knowledge gained over time through interaction with Funds Management and the Sub-Adviser about various topics. In this regard, the Board reviewed reports of Funds Management at each of its quarterly meetings, which included, among other things, portfolio reviews and investment performance reports. In addition, the Board and the teams mentioned above confer with portfolio managers at various times throughout the year. The Board did not identify any particular information or consideration that was all-important or controlling, and each individual Trustee may have attributed different weights to various factors.
After its deliberations, the Board unanimously approved the continuation of the Advisory Agreements for a one-year term and determined that the compensation payable to Funds Management and the Sub-Adviser under each of the Advisory Agreements was reasonable. The Board considered the approval of the Advisory Agreements for the Fund as part of its consideration of agreements for funds across the complex, but its approvals were made on a fund-by-fund basis. The following summarizes a number of important, but not necessarily all, factors considered by the Board in support of its approvals.
Nature, extent and quality of services
The Board received and considered various information regarding the nature, extent and quality of services provided to the Fund by Funds Management and the Sub-Adviser under the Advisory Agreements. This information included a description of the investment advisory services and Fund-level administrative services covered by the Management Agreement, as well as, among other things, a summary of the background and experience of senior management of Wells Fargo Asset Management (“WFAM”), of which Funds Management and the Sub-Adviser are a part, and a summary of investments made in the business of WFAM. The Board also received a description of Funds Management’s and the Sub-Adviser’s business continuity plans and of their approaches to data privacy and cybersecurity, and related testing. The Board also received and reviewed information about Funds Management’s role as administrator of the Fund’s liquidity risk management program, Funds Management’s approach to risk management, and Funds Management’s intermediary and vendor oversight program.
The Board also considered the qualifications, background, tenure and responsibilities of each of the portfolio managers primarily responsible for the day-to-day portfolio management of the Fund. The Board evaluated the ability of Funds Management and the Sub-Adviser to attract and retain qualified investment professionals, including research, advisory and supervisory personnel. The Board further considered the compliance programs and compliance records of Funds Management and the Sub-Adviser. In addition, the Board took into account the full range of services provided to the Fund by Funds Management and its affiliates.
Wells Fargo Large Cap Growth Fund | 35
Table of Contents
Other information (unaudited)
Fund investment performance and expenses
The Board considered the investment performance results for the Fund over various time periods ended December 31, 2019. The Board also considered more current results for various time periods ended March 31, 2020. The Board considered these results in comparison to the investment performance of funds in a universe that was determined by Broadridge Inc. (“Broadridge”) to be similar to the Fund (the “Universe”), and in comparison to the Fund’s benchmark index and to other comparative data. Broadridge is an independent provider of investment company data. The Board received a description of the methodology used by Broadridge to select the mutual funds in the performance Universe. The Board noted that the investment performance of the Fund (Administrator Class) was higher than the average investment performance of the Universe for the three- and ten-year periods ended December 31, 2019, and in range of the average investment performance of the Universe for the one- and five-year periods ended December 31, 2019. The Board also noted that the investment performance of the Fund (Administrator Class) was higher than or in range of the average investment performance of the Universe for the three- and ten-year periods ended March 31, 2020, and lower than the average investment performance for the one- and five-year periods ended March 31, 2020. The Board also noted that the investment performance of the Fund was lower than its benchmark index, the Russell 1000® Growth Index, for the one-, five- and ten-year periods ended December 31, 2019, and higher than its benchmark index for the three-year period ended December 31, 2019. The Board also noted that the investment performance of the Fund was lower than its benchmark index, the Russell 1000® Growth Index, for the one-, five- and ten-year periods ended March 31, 2020, and in range of its benchmark index for the three-year period ended March 31, 2020.
The Board received information concerning, and discussed factors contributing to, the underperformance of the Fund relative to the benchmark for the periods identified above. The Board took note of the explanations for the relative underperformance during these periods, including with respect to investment decisions and market factors that affected the Fund’s investment performance.
The Board also received and considered information regarding the Fund’s net operating expense ratios and their various components, including actual management fees, custodian and other non-management fees, and Rule 12b-1 and non-Rule 12b-1 shareholder service fees. The Board considered these ratios in comparison to the median ratios of funds in class-specific expense groups that were determined by Broadridge to be similar to the Fund (the “Groups”). The Board received a description of the methodology used by Broadridge to select the mutual funds in the expense Groups and an explanation of how funds comprising expense groups and their expense ratios may vary from year-to-year. Based on the Broadridge reports, the Board noted that the net operating expense ratios of the Fund were equal to or lower than the median net operating expense ratios of the expense Groups for each share class.
The Board took into account the Fund’s investment performance and expense information provided to it among the factors considered in deciding to re-approve the Advisory Agreements.
Investment management and sub-advisory fee rates
The Board reviewed and considered the contractual fee rates payable by the Fund to Funds Management under the Management Agreement, as well as the contractual fee rates payable by the Fund to Funds Management for class-level administrative services under a Class-Level Administration Agreement, which include, among other things, class-level transfer agency and sub-transfer agency costs (collectively, the “Management Rates”). The Board also reviewed and considered the contractual investment sub-advisory fee rates that are payable by Funds Management to the Sub-Adviser for investment sub-advisory services.
Among other information reviewed by the Board was a comparison of the Fund’s Management Rates with the average contractual investment management fee rates of funds in the expense Groups at a common asset level as well as transfer agency costs of the funds in the expense Groups. The Board noted that the Management Rates of the Fund were in range of the sum of these average rates for the Fund’s expense Groups for all share classes.
The Board also received and considered information about the portion of the total management fee that was retained by Funds Management after payment of the fee to the Sub-Adviser for sub-advisory services. In assessing the reasonableness of this amount, the Board received and evaluated information about the nature and extent of responsibilities retained and risks assumed by Funds Management and not delegated to or assumed by the Sub-Adviser, and about Funds Management’s on-going oversight services. Given the affiliation between Funds Management and the Sub-Adviser, the Board ascribed limited relevance to the allocation of fees between them.
The Board also received and considered information about the nature and extent of services offered and fee rates charged by Funds Management and the Sub-Adviser to other types of clients with investment strategies similar to those of the Fund. In this regard, the Board received information about the significantly greater scope of services, and compliance, reporting and other legal burdens and risks of managing proprietary mutual funds compared with those associated with managing assets of other types of clients, including third-party sub-advised fund clients and non-mutual fund clients such as institutional separate accounts.
36 | Wells Fargo Large Cap Growth Fund
Table of Contents
Other information (unaudited)
Based on its consideration of the factors and information it deemed relevant, including those described here, the Board determined that the compensation payable to Funds Management under the Management Agreement and to the Sub-Adviser under the Sub-Advisory Agreement was reasonable.
Profitability
The Board received and considered information concerning the profitability of Funds Management, as well as the profitability of both WFAM and Wells Fargo & Co. (“Wells Fargo”) from providing services to the fund family as a whole. The Board noted that the Sub-Adviser’s profitability information with respect to providing services to the Fund and other funds in the family was subsumed in the WFAM and Wells Fargo profitability analysis.
Funds Management reported on the methodologies and estimates used in calculating profitability, including a description of the methodology used to allocate certain expenses. Among other things, the Board noted that the levels of profitability reported on a fund-by-fund basis varied widely, depending on factors such as the size, type and age of fund.
Based on its review, the Board did not deem the profits reported by Funds Management, WFAM or Wells Fargo from services provided to the Fund to be at a level that would prevent it from approving the continuation of the Advisory Agreements.
Economies of scale
The Board received and considered information about the potential for Funds Management to experience economies of scale in the provision of management services to the Fund, the difficulties of calculating economies of scale at an individual fund level, and the extent to which potential scale benefits are shared with shareholders. The Board noted the existence of breakpoints in the Fund’s management fee structure, which operate generally to reduce the Fund’s expense ratios as the Fund grows in size, and the size of the Fund in relation to such breakpoints. The Board considered that in addition to management fee breakpoints, Funds Management shares potential economies of scale from its management business in a variety of ways, including through fee waiver and expense reimbursement arrangements, services that benefit shareholders, competitive management fee rates set at the outset without regard to breakpoints, and investments in the business intended to enhance services available to shareholders.
The Board concluded that Funds Management’s arrangements with respect to the Fund, including contractual breakpoints, constituted a reasonable approach to sharing potential economies of scale with the Fund and its shareholders.
Other benefits to Funds Management and the Sub-Adviser
The Board received and considered information regarding potential “fall-out” or ancillary benefits received by Funds Management and its affiliates, including the Sub-Adviser, as a result of their relationships with the Fund. Ancillary benefits could include, among others, benefits directly attributable to other relationships with the Fund and benefits potentially derived from an increase in Funds Management’s and the Sub-Adviser’s business as a result of their relationships with the Fund. The Board noted that various affiliates of Funds Management may receive distribution-related fees, shareholder servicing payments and sub-transfer agency fees in respect of shares sold or held through them and services provided.
The Board also reviewed information about soft dollar credits earned and utilized by the Sub-Adviser, fees earned by Funds Management and the Sub-Adviser from managing a private investment vehicle for the fund family’s securities lending collateral, and commissions earned by an affiliated broker from portfolio transactions.
Based on its consideration of the factors and information it deemed relevant, including those described here, the Board did not find that any ancillary benefits received by Funds Management and its affiliates, including the Sub-Adviser, were unreasonable.
Conclusion
At the Meeting, after considering the above-described factors and based on its deliberations and its evaluation of the information described above, the Board unanimously approved the continuation of the Advisory Agreements for a one-year term and determined that the compensation payable to Funds Management and the Sub-Adviser under each of the Advisory Agreements was reasonable.
Wells Fargo Large Cap Growth Fund | 37
Table of Contents
Other information (unaudited)
LIQUIDITY RISK MANAGEMENT PROGRAM
In accordance with Rule 22e-4 under the Investment Company Act of 1940, as amended (the “Liquidity Rule”), Wells Fargo Funds Trust (the “Trust”) has adopted and implemented a liquidity risk management program (the “Program”) on behalf of each of its series, including the Fund, which is reasonably designed to assess and manage the Fund’s liquidity risk. “Liquidity risk” is defined as the risk that the Fund is unable to meet redemption requests without significantly diluting remaining investors’ interests in the Fund. The Trust’s Board of Trustees (the “Board”) previously approved the designation of Wells Fargo Funds Management, LLC (“Funds Management”), the Fund’s investment manager, as the administrator of the Program, and Funds Management has established a Liquidity Risk Management Council composed of personnel from multiple departments within Funds Management and its affiliates to assist Funds Management in the implementation and on-going administration of the Program.
The Program is comprised of various components designed to support the assessment and/or management of liquidity risk, including: (1) the periodic assessment (no less frequently than annually) of certain factors that influence the Fund’s liquidity risk; (2) the periodic classification (no less frequently than monthly) of the Fund’s investments into one of four liquidity categories that reflect an estimate of their liquidity under current market conditions; (3) a 15% limit on the acquisition of “illiquid investments” (as defined under the Liquidity Rule); (4) to the extent the Fund does not invest primarily in “highly liquid investments” (as defined under the Liquidity Rule), the determination of a minimum percentage of the Fund’s assets that generally will be invested in highly liquid investments (an “HLIM”); (5) if the Fund has established an HLIM, the periodic review (no less frequently than annually) of the HLIM and the adoption of policies and procedures for responding to a shortfall of the Fund’s “highly liquid investments” below its HLIM; and (6) periodic reporting to the Board.
At a meeting of the Board held on May 26 and 28, 2020, the Board received a written report (the “Report”) from Funds Management that addressed the operation of the Program and assessed its adequacy and effectiveness of implementation. The Report covered the initial period from December 1, 2018 through December 31, 2019 (the “Reporting Period”). No significant liquidity events impacting the Fund were noted in the Report. There were no material changes to the Program during the Reporting Period. The Report concluded that the Program is operating effectively to assess and manage the Fund’s liquidity risk, and that the Program has been and continues to be adequately and effectively implemented to monitor and, as applicable, respond to the Fund’s liquidity developments.
There can be no assurance that the Program will achieve its objectives under all circumstances in the future. Please refer to the Fund’s prospectus for more information regarding the Fund’s exposure to liquidity risk and other risks to which an investment in the Fund may be subject.
38 | Wells Fargo Large Cap Growth Fund
Table of Contents
Effective on or after May 1, 2020, clients of Edward Jones (also referred to as “shareholders”) purchasing Fund shares on the Edward Jones commission and fee-based platforms are eligible only for the following sales charge discounts (also referred to as “breakpoints”) and waivers, which can differ from breakpoints and waivers described elsewhere in the Fund’s Prospectus or SAI or through another broker-dealer. In all instances, it is the shareholder’s responsibility to inform Edward Jones at the time of purchase of any relationship, holdings of Wells Fargo Funds or other facts qualifying the purchaser for breakpoints or waivers. Edward Jones can ask for documentation of such circumstance.
| Breakpoints available at Edward Jones |
| Rights of Accumulation (ROA) |
The applicable sales charge on a purchase of Class A shares is determined by taking into account all share classes (except any money market funds and retirement plan share classes) of Wells Fargo Funds held by the shareholder or in an account grouped by Edward Jones with other accounts for the purpose of providing certain pricing considerations (“pricing groups”). This includes all share classes held on the Edward Jones platform and/or held on another platform. The inclusion of eligible fund family assets in the rights of accumulation calculation is dependent on the shareholder notifying his or her financial advisor of such assets at the time of calculation. |
ROA is determined by calculating the higher of cost or market value (current shares x NAV). |
| Letter of Intent (LOI) |
Through a LOI, shareholders can receive the sales charge and breakpoint discounts for purchases shareholders intend to makeover a 13-month period from the date Edward Jones receives the LOI. The LOI is determined by calculating the higher of cost or market value of qualifying holdings at LOI initiation in combination with the value that the shareholder intends to buy over a 13-month period to calculate the front-end sales charge and any breakpoint discounts. Each purchase the shareholder makes during that 13-month period will receive the sales charge and breakpoint discount that applies to the total amount. The inclusion of eligible fund family assets in the LOI calculation is dependent on the shareholder notifying his or her financial advisor of such assets at the time of calculation. Purchases made before the LOI is received by Edward Jones are not covered under the LOI and will not reduce the sales charge previously paid. Sales charges will be adjusted if LOI is not met. |
| Sales charges are waived for the following shareholders and in the following situations at Edward Jones: |
● Associates of Edward Jones and its affiliates and their family members who are in the same pricing group (as determined by Edward Jones under its policies and procedures) as the associate. This waiver will continue for the remainder of the associate’s life if the associate retires from Edward Jones in good-standing. |
● Shares purchased in an Edward Jones fee-based program. |
● Shares purchased through reinvestment of capital gains distributions and dividend reinvestment. |
● Shares purchased from the proceeds of redeemed shares of the same fund family so long as the following conditions are met: 1) the proceeds are from the sale of shares within 60 days of the purchase, and 2) the sale and purchase are made in the same share class and the same account or the purchase is made in an individual retirement account with proceeds from liquidations in anon-retirement account. |
● Shares exchanged into Class A shares from another share class so long as the exchange is into the same fund and was initiated at the discretion of Edward Jones. Edward Jones is responsible for any remaining CDSC due to the fund company, if applicable. Any future purchases are subject to the applicable sales charge as disclosed in the prospectus. |
● Exchanges from Class C shares to Class A shares of the same fund, generally, in the 84th month following the anniversary of the purchase date or earlier at the discretion of Edward Jones. |
| If the shareholder purchases shares that are subject to a CDSC and those shares are redeemed before the CDSC is expired, the shareholder is responsible to pay the CDSC except in the following conditions available at Edward Jones: |
● The death or disability of the shareholder. |
● Systematic withdrawals with up to 10% per year of the account value. |
● Return of excess contributions from an Individual Retirement Account (IRA). |
● Shares sold as part of a required minimum distribution for IRA and retirement accounts if the redemption is taken in or after the year the shareholder reaches qualified age based on applicable IRS regulation. |
● Shares sold to pay Edward Jones fees or costs in such cases where the transaction is initiated by Edward Jones. |
● Shares exchanged in an Edward Jones fee-based program. |
● �� Shares acquired through NAV reinstatement. |
Wells Fargo Large Cap Growth Fund | 39
Table of Contents
Appendix I (unaudited)
| Other Important Information for accounts at Edward Jones: |
| Minimum Purchase Amounts |
● $250 initial purchase minimum |
● $50 subsequent purchase minimum |
| Minimum Balances |
| Edward Jones has the right to redeem at its discretion fund holdings with a balance of $250 or less. The following are examples of accounts that are not included in this policy: |
● A fee-based account held on an Edward Jones platform |
● A 529 account held on an Edward Jones platform |
● An account with an active systematic investment plan or letter of intent (LOI) |
| Changing Share Classes |
| At any time it deems necessary, Edward Jones has the authority to exchange at NAV a shareholder’s holdings in a fund to Class A shares. |
40 | Wells Fargo Large Cap Growth Fund
Table of Contents
Effective June 1, 2020, shareholders purchasing Fund shares through an Oppenheimer & Co. Inc. (“Oppenheimer”) platform or account are eligible only for the following load waivers (front-end sales charge waivers and contingent deferred or back-end, sales charge waivers) and discounts, which may differ from those disclosed in the Fund’s Prospectus or SAI.
| Front-end Sales Load Waivers on Class A Shares available at Oppenheimer |
| Employer-sponsored retirement, deferred compensation and employee benefit plans (including health savings accounts) and trusts used to fund those plans, provided that the shares are not held in a commission-based brokerage account and shares are held for the benefit of the plan. |
| Shares purchased by or through a 529 Plan. |
| Shares purchased through an Oppenheimer affiliated investment advisory program. |
| Shares purchased through reinvestment of capital gains distributions and dividend reinvestment when purchasing shares of the same fund (but not any other fund within the fund family). |
| Shares purchased from the proceeds of redemptions within the same fund family, provided (1) the repurchase occurs within 90 days following the redemption, (2) the redemption and purchase occur in the same account, and (3) redeemed shares were subject to a front-end or deferred sales load (known as Rights of Restatement). |
| A shareholder in the Fund’s Class C shares will have their shares exchanged at net asset value to Class A shares (or the appropriate share class) of the Fund if the shares are no longer subject to a CDSC and the exchange is in line with the policies and procedures of Oppenheimer. |
| Employees and registered representatives of Oppenheimer or its affiliates and their family members. |
| Directors or Trustees of the Fund, and employees of the Fund’s investment adviser or any of its affiliates, as described in the Prospectus. |
| CDSC Waivers on A and C Shares available at Oppenheimer |
| Death or disability of the shareholder. |
| Shares sold as part of a systematic withdrawal plan as described in the Prospectus. |
| Return of excess contributions from an IRA Account. |
| Shares sold as part of a required minimum distribution for IRA and retirement accounts due to the shareholder reaching the qualified age based on applicable IRS regulations as described in the Prospectus. |
| Shares sold to pay Oppenheimer fees but only if the transaction is initiated by Oppenheimer. |
| Shares acquired through a right of reinstatement. |
| Front-end load Discounts Available at Oppenheimer: Breakpoints, Rights of Accumulation & Letters of Intent |
| Breakpoints as described in the Prospectus. |
| Rights of Accumulation (ROA), which entitle shareholders to breakpoint discounts, will be automatically calculated based on the aggregated holding of fund family assets held by accounts within the purchaser’s household at Oppenheimer. Eligible fund family assets not held at Oppenheimer may be included in the ROA calculation only if the shareholder notifies his or her financial advisor about such assets. |
Wells Fargo Large Cap Growth Fund | 41
Table of Contents
Effective June 15, 2020, shareholders purchasing fund shares through a Robert W. Baird & Co. (“Baird”) platform or account will only be eligible for the following sales charge waivers (front-end sales charge waivers and CDSC waivers) and discounts, which may differ from those disclosed elsewhere in the Fund’s Prospectus or the SAI.
| Front-end Sales Load Waivers on Class A Shares available at Baird |
| Shares purchased through reinvestment of capital gains distributions and dividend reinvestment when purchasing share of the same fund. |
| Share purchase by employees and registers representatives of Baird or its affiliate and their family members as designated by Baird. |
| Shares purchase from the proceeds of redemptions within the same fund family, provided (1) the repurchase occurs within 90 days following the redemption, (2) the redemption and purchase occur in the same accounts, and (3) redeemed shares were subject to a front-end or deferred sales charge (known as rights of reinstatement). |
| A shareholder in the Funds Investor C Shares will have their share exchanged at net asset value to Investor A shares of the fund if the shares are no longer subject to CDSC and the exchange is in line with the policies and procedures of Baird. |
| Employer-sponsored retirement plans or charitable accounts in a transactional brokerage account at Baird, including 401(k) plans, 457 plans, employer-sponsored 403(b) plans, profit sharing and money purchase pension plans and defined benefit plans. For purposes of this provision, employer-sponsored retirement plans do not include SEP IRAs, Simple IRAs or SAR-SEPs. |
| CDSC Waivers on A and C Shares available at Baird |
| Shares sold due to death or disability of the shareholder. |
| Shares sold as part of a systematic withdrawal plan as described in the Fund’s Prospectus. |
| Shares bought due to returns of excess contributions from an IRA Account. |
| Shares sold as part of a required minimum distribution for IRA and retirement accounts due to the shareholder reaching age 72 as described in the Fund’s Prospectus. |
| Shares sold to pay Baird fees but only if the transaction is initiated by Baird. |
| Shares acquired through a right of reinstatement. |
| Front-end load Discounts Available at Baird: Breakpoint and/or Rights of Accumulation |
| Breakpoints as described in the Prospectus. |
| Rights of accumulations which entitles shareholders to breakpoint discounts will be automatically calculated based on the aggregated holding of fund family assets held by accounts within the purchaser’s household at Baird. Eligible fund family assets not held at Baird may be included in the rights of accumulations calculation only if the shareholder notifies his or her financial advisor about such assets. |
| Letters of Intent (LOI) allow for breakpoint discounts based on anticipated purchases within a fund family through Baird, over a 13-month period of time. |
42 | Wells Fargo Large Cap Growth Fund
Table of Contents
This page is intentionally left blank.
Table of Contents
This page is intentionally left blank.
Table of Contents
For more information
More information about Wells Fargo Funds is available free upon request. To obtain literature, please write, visit the Fund’s website, or call:
Wells Fargo Funds
P.O. Box 219967
Kansas City, MO 64121-9967
Website: wfam.com
Individual investors: 1-800-222-8222
Retail investment professionals: 1-888-877-9275
Institutional investment professionals: 1-866-765-0778

This report and the financial statements contained herein are submitted for the general information of the shareholders of the Fund. If this report is used for promotional purposes, distribution of the report must be accompanied or preceded by a current prospectus. Before investing, please consider the investment objectives, risks, charges, and expenses of the investment. For a current prospectus and, if available, a summary prospectus, containing this information, call 1-800-222-8222 or visit the Fund’s website at wfam.com. Read the prospectus carefully before you invest or send money.
Wells Fargo Asset Management (WFAM) is the trade name for certain investment advisory/management firms owned by Wells Fargo & Company. These firms include but are not limited to Wells Capital Management Incorporated and Wells Fargo Funds Management, LLC. Certain products managed by WFAM entities are distributed by Wells Fargo Funds Distributor, LLC (a broker-dealer and Member FINRA).
This material is for general informational and educational purposes only and is NOT intended to provide investment advice or a recommendation of any kind—including a recommendation for any specific investment, strategy, or plan.
INVESTMENT PRODUCTS: NOT FDIC INSURED ◾ NO BANK GUARANTEE ◾ MAY LOSE VALUE
© 2020 Wells Fargo & Company. All rights reserved
PAR-0820-01039 09-20
A209/AR209 07-20
Table of Contents

Annual Report
July 31, 2020
Wells Fargo
Large Company Value Fund
Beginning on January 1, 2021, as permitted by new regulations adopted by the Securities and Exchange Commission, paper copies of the Wells Fargo Funds’ annual and semi-annual shareholder reports issued after this date will no longer be sent by mail, unless you specifically request paper copies of the reports. Instead, the reports will be made available on the Funds’ website, and you will be notified by mail each time a report is posted and provided with a website address to access the report.
If you already elected to receive shareholder reports electronically, you will not be affected by this change and you need not take any action. You may elect to receive shareholder reports and other communications from the Fund electronically at any time by contacting your financial intermediary (such as a broker-dealer or bank) or, if you are a direct investor, by calling 1-800-222-8222 or by enrolling at wellsfargo.com/advantagedelivery.
You may elect to receive all future reports in paper free of charge. If you invest through a financial intermediary, you can contact your financial intermediary to request that you continue to receive paper copies of your shareholder reports; if you invest directly with the Fund, you can call 1-800-222-8222. Your election to receive reports in paper will apply to all Wells Fargo Funds held in your account with your financial intermediary or, if you are a direct investor, to all Wells Fargo Funds that you hold.
Table of Contents
|
Reduce clutter. Save trees. |
Sign up for electronic delivery of prospectuses and shareholder reports at wellsfargo.com/advantagedelivery |
The views expressed and any forward-looking statements are as of July 31, 2020, unless otherwise noted, and are those of the Fund managers and/or Wells Fargo Asset Management. Discussions of individual securities, or the markets generally, or any Wells Fargo Fund are not intended as individual recommendations. Future events or results may vary significantly from those expressed in any forward-looking statements. The views expressed are subject to change at any time in response to changing circumstances in the market. Wells Fargo Asset Management and the Fund disclaim any obligation to publicly update or revise any views expressed or forward-looking statements.
INVESTMENT PRODUCTS: NOT FDIC INSURED ◾ NO BANK GUARANTEE ◾ MAY LOSE VALUE
Wells Fargo Large Company Value Fund | 1
Table of Contents
Letter to shareholders (unaudited)

Andrew Owen
President
Wells Fargo Funds
Dear Shareholder:
We are pleased to offer you this annual report for the Wells Fargo Large Company Value Fund for the 12-month period that ended July 31, 2020. Global stock markets saw earlier gains erased in February and March as governments around the world took unprecedented measures, attempting to stop the spread of the coronavirus at the expense of short-term economic output. However, markets rebounded from April on to offset much of the losses as central banks attempted to bolster capital markets and confidence. Fixed-income markets generally performed well overall, achieving widespread gains. Overall, U.S. stocks surpassed their international peers, while U.S. large-cap equity, as measured by the Russell 1000® Index1, easily outperformed small caps, as measured by the Russell 2000® Index2, for the 12-month period that began last August.
For the 12-month period, fixed-income securities generally had positive total returns while non-U.S. developed market equities had the weakest performance and U.S. stocks performed strongly despite sharp volatility in the late winter and early spring. For the period, U.S. stocks, based on the S&P 500 Index,3 gained 11.96%. International stocks, as measured by the MSCI ACWI ex USA Index (Net),4 returned 0.66%, while the MSCI EM Index (Net)5 had somewhat stronger performance, with a 6.55% gain. For bond investors, the Bloomberg Barclays U.S. Aggregate Bond Index6 returned a robust 10.12%, the Bloomberg Barclays Global Aggregate ex-USD Index7 gained a more modest 5.94%, and the Bloomberg Barclays Municipal Bond Index8 gained 5.36% while the ICE BofA U.S. High Yield Index9 returned 3.10%.
The fiscal year began with supportive central bank actions.
The period began with unresolved U.S.-China trade tensions showing no signs of compromise in August 2019. Evidence of a continued global economic slowdown mounted, and central banks in China, New Zealand, and Thailand cut interest rates after the U.S. Federal Reserve (Fed) had done so in late July. Industrial and manufacturing data declined in China, Canada, Japan, and Germany. Adding to global uncertainty, Italy’s prime minister resigned, many feared a crackdown in Hong Kong as protestors sustained their calls for reform, and U.K. Prime Minister Boris Johnson planned to suspend Parliament as Brexit’s deadline neared.
| 1 | The Russell 1000® Index measures the performance of the 1,000 largest companies in the Russell 3000® Index, which represents approximately 92% of the total market capitalization of the Russell 3000® Index. You cannot invest directly in an index. |
| 2 | The Russell 2000® Index measures the performance of the 2,000 smallest companies in the Russell 3000® Index, which represents approximately 8% of the total market capitalization of the Russell 3000® Index. You cannot invest directly in an index. |
| 3 | The S&P 500 Index consists of 500 stocks chosen for market size, liquidity, and industry group representation. It is a market-value-weighted index with each stock’s weight in the index proportionate to its market value. You cannot invest directly in an index. |
| 4 | The Morgan Stanley Capital International (MSCI) All Country World Index (ACWI) ex USA Index (Net) is a free-float-adjusted market-capitalization-weighted index that is designed to measure the equity market performance of developed and emerging markets, excluding the United States. Source: MSCI. MSCI makes no express or implied warranties or representations and shall have no liability whatsoever with respect to any MSCI data contained herein. The MSCI data may not be further redistributed or used as a basis for other indices or any securities or financial products. This report is not approved, reviewed, or produced by MSCI. You cannot invest directly in an index. |
| 5 | The MSCI Emerging Markets (EM) Index (Net) is a free-float-adjusted market-capitalization-weighted index that is designed to measure equity market performance of emerging markets. You cannot invest directly in an index. |
| 6 | The Bloomberg Barclays U.S. Aggregate Bond Index is a broad-based benchmark that measures the investment-grade, U.S. dollar-denominated, fixed-rate taxable bond market, including Treasuries, government-related and corporate securities, mortgage-backed securities (agency fixed-rate and hybrid adjustable-rate mortgage pass-throughs), asset-backed securities, and commercial mortgage-backed securities. You cannot invest directly in an index. |
| 7 | The Bloomberg Barclays Global Aggregate ex-USD Index is an unmanaged index that provides a broad-based measure of the global investment-grade fixed-income markets excluding the U.S.-dollar-denominated debt market. You cannot invest directly in an index. |
| 8 | The Bloomberg Barclays Municipal Bond Index is an unmanaged index composed of long-term tax-exempt bonds with a minimum credit rating of Baa. You cannot invest directly in an index. |
| 9 | The ICE BofA U.S. High Yield Index is a market-capitalization-weighted index of domestic and Yankee high-yield bonds. The index tracks the performance of high-yield securities traded in the U.S. bond market. You cannot invest directly in an index. Copyright 2020. ICE Data Indices, LLC. All rights reserved. |
2 | Wells Fargo Large Company Value Fund
Table of Contents
Letter to shareholders (unaudited)
In the U.S., the Fed cut interest rates again in September. U.S. manufacturing data disappointed investors. The U.S. Congress announced it would pursue an impeachment investigation of President Trump. Meanwhile, the Brexit impasse showed no signs of resolution. Officials in China said that hitting the country’s economic growth goals for the year would be difficult considering the weight of tariffs and trade restrictions. Although the S&P 500 Index finished the third quarter with the best year-to-date returns in more than 20 years, concerns about future returns remained.
The fourth quarter started on a strong note, with U.S.-China trade tensions relaxing in October along with renewed optimism for a U.K. Brexit deal and positive macroeconomic data. The initial estimate of U.S. third-quarter gross domestic product (GDP) growth was a resilient 1.9% annualized rate, while the U.S. unemployment rate fell to a 50-year low of 3.5% in September. However, despite strength among U.S. consumers, business confidence declined while manufacturing activity contracted. Concerned with a potential economic slowdown, the Fed lowered interest rates another quarter point in late October—its third rate cut in four months. This helped push the S&P 500 Index to an all-time high while emerging market equities rallied and global bonds declined overall, reflecting a broad pickup in risk appetite.
Equity markets continued to rally in November despite ongoing geopolitical risks. Hopes for a U.S.-China trade deal buoyed investor confidence. U.S. business sentiment improved slightly, and manufacturing and services activity picked up. While consumer confidence and purchasing managers’ activity rose in the eurozone, China reported weakening manufacturing and consumer data. Bond yields rose marginally, leading to slightly negative returns for global government and investment-grade corporate bonds.
Financial markets ended 2019 with a boost from the U.S. and China accord on a Phase One trade deal. That, along with the landslide win by the pro-Brexit U.K. Conservative Party in a national election and ongoing central bank support, gave investors greater confidence. U.S. economic indicators were generally positive, with the exception of manufacturing activity and business confidence. Consumer confidence was resilient, fed by a robust labor market, tame inflation, and lower interest rates, which boosted housing affordability and stimulated homebuyer activity. The impeachment of President Trump had little impact on markets. Meanwhile, slowing Chinese economic activity, partly attributable to the trade war, led to further government stimulus at year-end through lower reserve ratios, allowing banks to lend more money.
The year-end rally continued in early January 2020. However, capital market volatility picked up sharply in late January on concerns over the potential impact of the coronavirus on the global economy and stock markets. With sentiment somewhat souring, perceived safe havens did well in January. The U.S. dollar and Japanese yen both rose, and government bonds outperformed equities. While the S&P 500 Index held its ground, emerging market equities tumbled, including those in Asia.
In February, the coronavirus became the major market focus. Fears of the virus’s impact on global growth led to expectations of increased global central bank monetary policy support. That led the 10-year U.S. Treasury yield to fall to an all-time low of 1.1%. Although equity markets initially shrugged off concerns about the outbreak, focusing instead on strong fourth-quarter earnings and improving business confidence in January, market sentiment turned sharply lower and the S&P 500 Index lost 8.2% for the month. Oil prices tumbled as Russia and the Organization of the Petroleum Exporting Countries compounded a major decline in oil demand with a brutal price war, partly aimed at dissuading further U.S. shale production, causing the price of West Texas Intermediate crude oil to plummet.
Wells Fargo Large Company Value Fund | 3
Table of Contents
Letter to shareholders (unaudited)
“The global spread of the coronavirus led country after country to clamp down on social and business-related activity in order to contain the virus from causing even greater devastation and overwhelming health care systems.”
“Financial markets posted widely positive returns in June despite ongoing economic weakness and high levels of uncertainty on the containment of the coronavirus and the timing of an effective vaccine.”
The global spread of the coronavirus led country after country to clamp down on social and business-related activity in order to contain the virus from causing even greater devastation and overwhelming health care systems. This abrupt stoppage of economic activity led to the sharp deceleration of global output, sending economies into a deep contraction. Central banks responded swiftly, slashing interest rates and expanding quantitative easing programs to restore liquidity and confidence to the markets. In the U.S., the Fed introduced several new lending programs, funding investment-grade bonds, money market mutual funds, and commercial paper while purchasing Treasuries, mortgage-backed securities, and overnight repurchase agreements. Meanwhile, stock markets tumbled quickly into a bear market, ending the longest bull stock market in U.S. history.
Markets rebounded strongly in April, fueled by unprecedented government and central bank stimulus measures. The U.S. economy contracted by an annualized 5.0% pace in the first quarter, with 30 million new unemployment insurance claims in six weeks. In the eurozone, first-quarter real GDP shrank 3.8%, with the composite April Flash Purchasing Managers’ Index, a monthly survey of purchasing managers, falling to an all-time low of 13.5. The European Central Bank expanded its quantitative easing to include the purchase of additional government bonds of countries with the greatest virus-related need, including Italy and Spain. China’s first-quarter GDP fell by 6.8% year over year. However, retail sales, production, and investment showed signs of recovery. Extreme oil-price volatility continued as global supply far exceeded demand.
In May, the global equity market rebound continued, with widespread strong monthly gains. Investors regained confidence on reports of early signs of success in human trials of a coronavirus vaccine. Growth stocks continued to outperform value stocks while returns on global government bonds were generally flat. In the U.S., a gap grew between the stock market rebound and devastating economic data points, including an April unemployment rate of 14.7%, the highest level since World War II. Purchasing managers’ indices reflected weakening activity in May in both the manufacturing and services sectors. U.S. corporate earnings reports indicated a 14% year-over-year contraction in earnings from the first quarter of 2019. However, high demand for technology, driven by remote activity, supported robust information technology sector earnings, which helped drive major technology stocks higher.
Financial markets posted widely positive returns in June despite ongoing economic weakness and high levels of uncertainty on the containment of the coronavirus and the timing of an effective vaccine. There were hopeful signs as economies reopened, with both U.S. and U.K. retail sales rebounding substantially in May. However, year over year, sales remained depressed. Vitally important to market sentiment was the ongoing commitment by central banks globally to do all they could to provide economic support through liquidity and low borrowing costs. U.S. economic activity was aided by one-time $1,200 stimulus checks and $600 bonus weekly unemployment benefits due to expire at the end of July. However, unemployment remained in the double digits, easing somewhat from 14.7% in April to 11.1% in June. During June, numerous states reported alarming increases of coronavirus cases. China’s economic recovery picked up momentum in June, though it remained far from a full recovery.
July was a broadly positive month for both global equities and fixed income. However, economic data and a resurgence of coronavirus cases pointed to the vulnerability of the global economy and the ongoing imperative to regain control of the pandemic. Second-quarter GDP shrank by 9.5% and 12.1% in the U.S. and eurozone, respectively, from the previous quarter. In contrast, China reported a 3.2% year-over-year expansion in its second-quarter GDP. U.S. unemployment remained historically high despite adding 1.8 million jobs in July, with a double-digit jobless rate persisting. However, manufacturing activity grew in both the U.S. and eurozone. In Asia, while China’s manufacturing sector continued to expand, activity in Japan and South Korea contracted. In July, a rising concern
4 | Wells Fargo Large Company Value Fund
Table of Contents
Letter to shareholders (unaudited)
was the rapid and broad reemergence of coronavirus infections. Despite the ongoing promise of positive early-stage vaccine trial results, economic activity could be held back by the continued spread of the virus and the end of a widely received $600-a-week bonus unemployment benefit in late July.
Don’t let short-term uncertainty derail long-term investment goals.
Periods of investment uncertainty can present challenges, but experience has taught us that maintaining long-term investment goals can be an effective way to plan for the future. To help you create a sound strategy based on your personal goals and risk tolerance, Wells Fargo Funds offers more than 100 mutual funds spanning a wide range of asset classes and investment styles. Although diversification cannot guarantee an investment profit or prevent losses, we believe it can be an effective way to manage investment risk and potentially smooth out overall portfolio performance. We encourage investors to know their investments and to understand that appropriate levels of risk-taking may unlock opportunities.
Thank you for choosing to invest with Wells Fargo Funds. We appreciate your confidence in us and remain committed to helping you meet your financial needs.
Sincerely,

Andrew Owen
President
Wells Fargo Funds
|
For further information about your Fund, contact your investment professional, visit our website at wfam.com, or call us directly at 1-800-222-8222. |
Notice to Shareholders
At a meeting held on August 10-12, 2020, the Board of Trustees of the Fund approved a change to the Fund’s automatic conversion feature for Class C shares in order to shorten the required holding period from 10 to 8 years. As a result, on a monthly basis beginning November 5, 2020, Class C shares will convert automatically into Class A shares 8 years after the initial date of purchase or, if you acquired your Class C shares through an exchange or conversion from another share class, 8 years after the date you acquired your Class C shares. When Class C shares that you acquired through a purchase or exchange convert, any other Class C shares that you purchased with reinvested dividends and distributions also will convert into Class A shares on a pro rata basis.
Please note that a shorter holding period may apply depending on your intermediary. Please see “Appendix A—Sales Charge Reductions and Waivers for Certain Intermediaries” in the Fund’s prospectus for further information.
Wells Fargo Large Company Value Fund | 5
Table of Contents
Performance highlights (unaudited)
Investment objective
The Fund seeks long-term capital appreciation.
Manager
Wells Fargo Funds Management, LLC
Subadviser
Wells Capital Management Incorporated
Portfolio managers
Dennis Bein, CFA®‡
Ryan Brown, CFA®‡
Harindra de Silva, Ph.D., CFA®‡
Average annual total returns (%) as of July 31, 2020
| Including sales charge | Excluding sales charge | Expense ratios1 (%) | ||||||||||||||||||||||||||||||||
| Inception date | 1 year | 5 year | 10 year | 1 year | 5 year | 10 year | Gross | Net2 | ||||||||||||||||||||||||||
| Class A (WLCAX) | 3-31-2008 | -8.10 | 2.90 | 7.83 | -2.49 | 4.13 | 8.47 | 0.97 | 0.83 | |||||||||||||||||||||||||
| Class C (WFLVX) | 3-31-2008 | -4.27 | 3.35 | 7.66 | -3.27 | 3.35 | 7.66 | 1.72 | 1.58 | |||||||||||||||||||||||||
| Class R6 (WTLVX)3 | 4-7-2017 | – | – | – | -2.09 | 4.58 | 8.96 | 0.54 | 0.40 | |||||||||||||||||||||||||
| Administrator Class (WWIDX) | 12-31-2001 | – | – | – | -2.41 | 4.25 | 8.67 | 0.89 | 0.75 | |||||||||||||||||||||||||
| Institutional Class (WLCIX) | 3-31-2008 | – | – | – | -2.20 | 4.51 | 8.93 | 0.64 | 0.50 | |||||||||||||||||||||||||
| Russell 1000® Value Index4 | – | – | – | – | -6.01 | 5.36 | 10.12 | – | – | |||||||||||||||||||||||||
Figures quoted represent past performance, which is no guarantee of future results, and do not reflect taxes that a shareholder may pay on an investment in a fund. Investment return and principal value of an investment will fluctuate so that an investor’s shares, when redeemed, may be worth more or less than their original cost. Performance shown without sales charges would be lower if sales charges were reflected. Current performance may be lower or higher than the performance data quoted, which assumes the reinvestment of dividends and capital gains. Current month-end performance is available on the Fund’s website, wfam.com.
Index returns do not include transaction costs associated with buying and selling securities, any mutual fund fees or expenses, or any taxes. It is not possible to invest directly in an index.
For Class A shares, the maximum front-end sales charge is 5.75%. For Class C shares, the maximum contingent deferred sales charge is 1.00%. Performance including a contingent deferred sales charge assumes the sales charge for the corresponding time period. Class R6, Administrator Class, and Institutional Class shares are sold without a front-end sales charge or contingent deferred sales charge.
Stock values fluctuate in response to the activities of individual companies and general market and economic conditions. Certain investment strategies tend to increase the total risk of an investment (relative to the broader market). The Fund is exposed to foreign investment risk. Consult the Fund’s prospectus for additional information on these and other risks.
Please see footnotes on page 7.
6 | Wells Fargo Large Company Value Fund
Table of Contents
Performance highlights (unaudited)
| Growth of $10,000 investment as of July 31, 20205 |
|
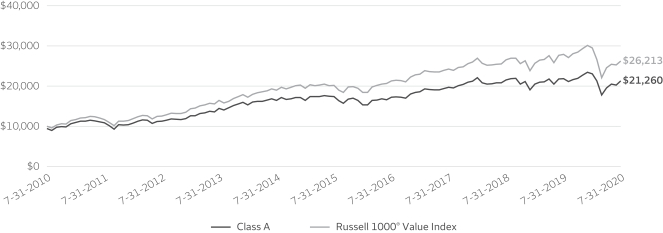
| ‡ | CFA® and Chartered Financial Analyst® are trademarks owned by CFA Institute. |
| 1 | Reflects the expense ratios as stated in the most recent prospectuses. The expense ratios shown are subject to change and may differ from the annualized expense ratios shown in the financial highlights of this report. |
| 2 | The manager has contractually committed through November 30, 2020, to waive fees and/or reimburse expenses to the extent necessary to cap total annual fund operating expenses after fee waivers at 0.83% for Class A, 1.58% for Class C, 0.40% for Class R6, 0.75% for Administrator Class, and 0.50% for Institutional Class. Brokerage commissions, stamp duty fees, interest, taxes, acquired fund fees and expenses (if any), and extraordinary expenses are excluded from the expense caps. Prior to or after the commitment expiration date, the caps may be increased or the commitment to maintain the caps may be terminated only with the approval of the Board of Trustees. Without these caps, the Fund’s returns would have been lower. The expense ratio paid by an investor is the net expense ratio (the total annual fund operating expenses after fee waivers) as stated in the prospectuses. |
| 3 | Historical performance shown for the Class R6 shares prior to their inception reflects the performance of the Institutional Class shares, and is not adjusted to reflect the Class R6 expenses. If these expenses had been included, returns for the Class R6 shares would be higher. |
| 4 | The Russell 1000® Value Index measures the performance of those Russell 1000 companies with lower price/book ratios and lower forecasted growth values. You cannot invest directly in an index. |
| 5 | The chart compares the performance of Class A shares for the most recent ten years with the Russell 1000® Value Index. The chart assumes a hypothetical investment of $10,000 in Class A shares and reflects all operating expenses and assumes the maximum initial sales charge of 5.75%. |
| 6 | The S&P 500 Index consists of 500 stocks chosen for market size, liquidity, and industry group representation. It is a market-value-weighted index with each stock’s weight in the index proportionate to its market value. You cannot invest directly in an index. |
| 7 | The Russell 1000® Index measures the performance of the 1,000 largest companies in the Russell 3000® Index, which represents approximately 92% of the total market capitalization of the Russell 3000® Index. You cannot invest directly in an index. |
| 8 | The ten largest holdings, excluding cash, cash equivalents and any money market funds, are calculated based on the value of the investments divided by total net assets of the Fund. Holdings are subject to change and may have changed since the date specified. |
| 9 | Amounts are calculated based on the total long-term investments of the Fund. These amounts are subject to change and may have changed since the date specified. |
Wells Fargo Large Company Value Fund | 7
Table of Contents
Performance highlights (unaudited)
MANAGER’S DISCUSSION
| ∎ | The Fund outperformed its benchmark, the Russell 1000® Value Index, for the 12-month period that ended July 31, 2020. |
| ∎ | The Fund’s outperformance was primarily due to factor tilts, driven by our proprietary alpha engine and stock-specific risk controls. |
| ∎ | Over the past year, the primary detractor from performance was the exposure to factors related to valuation. |
U.S. stocks delivered strong results during the reporting period.
Despite a tumultuous past 12 months, equity markets posted a solid 12% return for the period, as measured by the S&P 500 Index6. Markets hit a high on February 14, 2020, followed by a 32% sell-off associated with the coronavirus pandemic’s economic fallout. After about a month of freefalling, declining sharply in late February and March 2020, markets rallied back to levels just shy of the February 14 high, with the Russell 1000® Index7 ending the 12-month period up 12.03%. The largest stocks in the Russell 1000® Index outperformed all other stocks in a linear fashion for the period, meaning that, on average, the larger the company, the better the return for the period. The top 200 stocks in the Russell 1000® Index gained an average of 15.97% for the trailing 12 months, while the smallest 200 lost 11.83%, a 28% difference.
Factor tilts toward quality and growth, sector allocation added to performance; value tilts detracted.
Over the period, factor tilts toward quality, strong earnings revision, and certain growth characteristics were rewarded. Analytics’ proprietary factors, including liquidity and short interest, were also additive.
From a sector standpoint, the portfolio’s underweight to energy and financials and overweight to health care and information technology added roughly 200 basis points (bps; 100 bps equal 1.0%) of the portfolio’s outperformance. On the other hand, value tilts detracted from performance for the period.
| Ten largest holdings (%) as of July 31, 20208 | ||||
Merck & Company Incorporated | 2.71 | |||
Pfizer Incorporated | 2.65 | |||
Cisco Systems Incorporated | 2.57 | |||
International Business Machines Corporation | 2.53 | |||
Charter Communications Incorporated Class A | 2.49 | |||
Linde plc | 2.46 | |||
Walmart Incorporated | 2.27 | |||
AT&T Incorporated | 2.23 | |||
JPMorgan Chase & Company | 2.20 | |||
BlackRock Incorporated | 2.17 | |||
| Sector allocation as of July 31, 20209 |
|
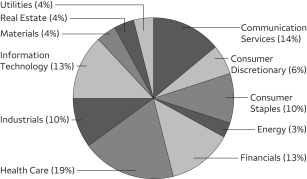
Going forward, our investment philosophy and process remain the same.
The investment philosophy employed in our value-equity strategy is based on the belief that security returns are predictable, based on common fundamental factors, and that market inefficiencies caused by patterns of investor behavior and economic change may be exploited to earn an excess return. The stock selection model uses more than 70 fundamental, technical, and proprietary factors to build a diversified portfolio that we believe is well positioned to generate excess returns over a three- to five-year market cycle.
Our process is based on the fundamental belief that there is persistency in the types of characteristics investors prefer. If this belief holds going forward, we expect the Fund to potentially benefit from being properly positioned toward stocks with characteristics favored by investors over the long term. We continue to focus on companies with above-average quality metrics, such as stocks with strong profit margins and return on assets. In addition, we continue to emphasize stocks with certain attractive valuation characteristics, such as above-average cash-flow-to-price ratios and dividend yields. Finally, we will continue to deemphasize risk, as typified by companies with above-average volatility of analyst earnings expectations.
Please see footnotes on page 7.
8 | Wells Fargo Large Company Value Fund
Table of Contents
As a shareholder of the Fund, you incur two types of costs: (1) transaction costs, including sales charges (loads) on purchase payments and contingent deferred sales charges (if any) on redemptions and (2) ongoing costs, including management fees, distribution (12b-1) and/or shareholder servicing fees, and other Fund expenses. This example is intended to help you understand your ongoing costs (in dollars) of investing in the Fund and to compare these costs with the ongoing costs of investing in other mutual funds.
The example is based on an investment of $1,000 invested at the beginning of the six-month period and held for the entire period from February 1, 2020 to July 31, 2020.
Actual expenses
The “Actual” line of the table below provides information about actual account values and actual expenses. You may use the information in this line, together with the amount you invested, to estimate the expenses that you paid over the period. Simply divide your account value by $1,000 (for example, an $8,600 account value divided by $1,000 = 8.6), then multiply the result by the number in the “Actual” line under the heading entitled “Expenses paid during period” for your applicable class of shares to estimate the expenses you paid on your account during this period.
Hypothetical example for comparison purposes
The “Hypothetical” line of the table below provides information about hypothetical account values and hypothetical expenses based on the Fund’s actual expense ratio and an assumed rate of return of 5% per year before expenses, which is not the Fund’s actual return. The hypothetical account values and expenses may not be used to estimate the actual ending account balance or expenses you paid for the period. You may use this information to compare the ongoing costs of investing in the Fund and other funds. To do so, compare this 5% hypothetical example with the 5% hypothetical examples that appear in the shareholder reports of the other funds.
Please note that the expenses shown in the table are meant to highlight your ongoing costs only and do not reflect any transactional costs, such as sales charges (loads) and contingent deferred sales charges. Therefore, the “Hypothetical” line of the table is useful in comparing ongoing costs only and will not help you determine the relative total costs of owning different funds. In addition, if these transactional costs were included, your costs would have been higher.
| Beginning account value 2-1-2020 | Ending account value 7-31-2020 | Expenses paid during the period1 | Annualized net expense ratio | |||||||||||||
Class A | ||||||||||||||||
Actual | $ | 1,000.00 | $ | 922.03 | $ | 3.97 | 0.83 | % | ||||||||
Hypothetical (5% return before expenses) | $ | 1,000.00 | $ | 1,020.74 | $ | 4.17 | 0.83 | % | ||||||||
Class C | ||||||||||||||||
Actual | $ | 1,000.00 | $ | 918.03 | $ | 7.53 | 1.58 | % | ||||||||
Hypothetical (5% return before expenses) | $ | 1,000.00 | $ | 1,017.01 | $ | 7.92 | 1.58 | % | ||||||||
Class R6 | ||||||||||||||||
Actual | $ | 1,000.00 | $ | 923.62 | $ | 1.91 | 0.40 | % | ||||||||
Hypothetical (5% return before expenses) | $ | 1,000.00 | $ | 1,022.87 | $ | 2.01 | 0.40 | % | ||||||||
Administrator Class | ||||||||||||||||
Actual | $ | 1,000.00 | $ | 922.48 | $ | 3.58 | 0.75 | % | ||||||||
Hypothetical (5% return before expenses) | $ | 1,000.00 | $ | 1,021.13 | $ | 3.77 | 0.75 | % | ||||||||
Institutional Class | ||||||||||||||||
Actual | $ | 1,000.00 | $ | 923.34 | $ | 2.39 | 0.50 | % | ||||||||
Hypothetical (5% return before expenses) | $ | 1,000.00 | $ | 1,022.38 | $ | 2.51 | 0.50 | % | ||||||||
| 1 | Expenses paid is equal to the annualized net expense ratio of each class multiplied by the average account value over the period, multiplied by the number of days in the most recent fiscal half-year divided by the number of days in the fiscal year (to reflect the one-half-year period). |
Wells Fargo Large Company Value Fund | 9
Table of Contents
Portfolio of investments—July 31, 2020
| Shares | Value | |||||||||||||||
| Common Stocks: 98.22% | ||||||||||||||||
| Communication Services: 13.87% | ||||||||||||||||
| Diversified Telecommunication Services: 3.89% | ||||||||||||||||
AT&T Incorporated | 141,902 | $ | 4,197,461 | |||||||||||||
Verizon Communications Incorporated | 54,676 | 3,142,776 | ||||||||||||||
| 7,340,237 | ||||||||||||||||
|
| |||||||||||||||
| Entertainment: 2.48% | ||||||||||||||||
Activision Blizzard Incorporated | 942 | 77,837 | ||||||||||||||
Spotify Technology SA † | 10,191 | 2,627,444 | ||||||||||||||
The Walt Disney Company | 16,926 | 1,979,326 | ||||||||||||||
| 4,684,607 | ||||||||||||||||
|
| |||||||||||||||
| Interactive Media & Services: 4.45% | ||||||||||||||||
Alphabet Incorporated Class A † | 1,856 | 2,761,635 | ||||||||||||||
Alphabet Incorporated Class C † | 1,785 | 2,647,084 | ||||||||||||||
Facebook Incorporated Class A † | 11,741 | 2,978,339 | ||||||||||||||
| 8,387,058 | ||||||||||||||||
|
| |||||||||||||||
| Media: 3.05% | ||||||||||||||||
Charter Communications Incorporated Class A † | 8,112 | 4,704,960 | ||||||||||||||
Comcast Corporation Class A | 24,514 | 1,049,199 | ||||||||||||||
| 5,754,159 | ||||||||||||||||
|
| |||||||||||||||
| Consumer Discretionary: 6.29% | ||||||||||||||||
| Auto Components: 1.42% | ||||||||||||||||
Gentex Corporation | 99,292 | 2,679,891 | ||||||||||||||
|
| |||||||||||||||
| Automobiles: 0.99% | ||||||||||||||||
Tesla Motors Incorporated † | 1,301 | 1,861,419 | ||||||||||||||
|
| |||||||||||||||
| Hotels, Restaurants & Leisure: 0.47% | ||||||||||||||||
Wingstop Incorporated | 5,625 | 878,906 | ||||||||||||||
|
| |||||||||||||||
| Specialty Retail: 1.21% | ||||||||||||||||
Aaron’s Incorporated | 43,815 | 2,286,267 | ||||||||||||||
|
| |||||||||||||||
| Textiles, Apparel & Luxury Goods: 2.20% | ||||||||||||||||
lululemon athletica Incorporated † | 5,872 | 1,911,864 | ||||||||||||||
Nike Incorporated Class B | 22,967 | 2,241,809 | ||||||||||||||
| 4,153,673 | ||||||||||||||||
|
| |||||||||||||||
| Consumer Staples: 9.87% | ||||||||||||||||
| Beverages: 1.06% | ||||||||||||||||
PepsiCo Incorporated | 741 | 102,006 | ||||||||||||||
The Coca-Cola Company | 40,146 | 1,896,497 | ||||||||||||||
| 1,998,503 | ||||||||||||||||
|
| |||||||||||||||
| Food & Staples Retailing: 3.17% | ||||||||||||||||
Costco Wholesale Corporation | 4,092 | 1,332,069 | ||||||||||||||
Performance Food Group Company † | 3,885 | 108,858 | ||||||||||||||
Sysco Corporation | 4,592 | 242,687 | ||||||||||||||
Walmart Incorporated | 33,100 | 4,283,140 | ||||||||||||||
| 5,966,754 | ||||||||||||||||
|
| |||||||||||||||
The accompanying notes are an integral part of these financial statements.
10 | Wells Fargo Large Company Value Fund
Table of Contents
Portfolio of investments—July 31, 2020
| Shares | Value | |||||||||||||||
| Food Products: 3.76% | ||||||||||||||||
Beyond Meat Incorporated † | 9,510 | $ | 1,197,309 | |||||||||||||
Darling Ingredients Incorporated † | 75,680 | 2,113,742 | ||||||||||||||
Mondelez International Incorporated Class A | 68,173 | 3,782,920 | ||||||||||||||
| 7,093,971 | ||||||||||||||||
|
| |||||||||||||||
| Household Products: 0.73% | ||||||||||||||||
The Procter & Gamble Company | 10,545 | 1,382,660 | ||||||||||||||
|
| |||||||||||||||
| Personal Products: 1.15% | ||||||||||||||||
The Estee Lauder Companies Incorporated Class A | 10,995 | 2,171,952 | ||||||||||||||
|
| |||||||||||||||
| Energy: 2.56% | ||||||||||||||||
| Energy Equipment & Services: 0.27% | ||||||||||||||||
ChampionX Corporation † | 53,155 | 505,504 | ||||||||||||||
|
| |||||||||||||||
| Oil, Gas & Consumable Fuels: 2.29% | ||||||||||||||||
Antero Midstream Corporation | 189,027 | 1,071,783 | ||||||||||||||
Cabot Oil & Gas Corporation | 3,690 | 69,003 | ||||||||||||||
Exxon Mobil Corporation | 7,922 | 333,358 | ||||||||||||||
Kinder Morgan Incorporated | 189,968 | 2,678,549 | ||||||||||||||
Occidental Petroleum Corporation | 2,614 | 41,144 | ||||||||||||||
ONEOK Incorporated | 4,578 | 127,772 | ||||||||||||||
| 4,321,609 | ||||||||||||||||
|
| |||||||||||||||
| Financials: 12.53% | ||||||||||||||||
| Banks: 5.27% | ||||||||||||||||
Bank of America Corporation | 112,363 | 2,795,591 | ||||||||||||||
Bank of N.T. Butterfield & Son Limited | 40,578 | 1,056,245 | ||||||||||||||
Citigroup Incorporated | 38,965 | 1,948,640 | ||||||||||||||
JPMorgan Chase & Company | 42,861 | 4,142,087 | ||||||||||||||
| 9,942,563 | ||||||||||||||||
|
| |||||||||||||||
| Capital Markets: 4.33% | ||||||||||||||||
BlackRock Incorporated | 7,126 | 4,097,521 | ||||||||||||||
Morgan Stanley | 13,849 | 676,939 | ||||||||||||||
The Goldman Sachs Group Incorporated | 9,640 | 1,908,334 | ||||||||||||||
Tradeweb Markets Incorporated Class A | 27,597 | 1,492,170 | ||||||||||||||
| 8,174,964 | ||||||||||||||||
|
| |||||||||||||||
| Diversified Financial Services: 1.88% | ||||||||||||||||
Berkshire Hathaway Incorporated Class B † | 18,080 | 3,539,702 | ||||||||||||||
|
| |||||||||||||||
| Insurance: 0.75% | ||||||||||||||||
Assured Guaranty Limited | 57,332 | 1,251,558 | ||||||||||||||
Chubb Limited | 1,353 | 172,156 | ||||||||||||||
| 1,423,714 | ||||||||||||||||
|
| |||||||||||||||
| Mortgage REITs: 0.30% | ||||||||||||||||
Hannon Armstrong Sustainable Infrastructure Capital Incorporated | 15,945 | 558,553 | ||||||||||||||
|
| |||||||||||||||
The accompanying notes are an integral part of these financial statements.
Wells Fargo Large Company Value Fund | 11
Table of Contents
Portfolio of investments—July 31, 2020
| Shares | Value | |||||||||||||||
| Health Care: 18.30% | ||||||||||||||||
| Biotechnology: 1.40% | ||||||||||||||||
Amicus Therapeutics Incorporated † | 48,889 | $ | 706,446 | |||||||||||||
OPKO Health Incorporated † | 249,788 | 1,286,408 | ||||||||||||||
Vertex Pharmaceuticals Incorporated † | 2,348 | 638,656 | ||||||||||||||
| 2,631,510 | ||||||||||||||||
|
| |||||||||||||||
| Health Care Equipment & Supplies: 1.91% | ||||||||||||||||
Abbott Laboratories | 8,065 | 811,662 | ||||||||||||||
DexCom Incorporated † | 4,131 | 1,799,216 | ||||||||||||||
Medtronic plc | 10,273 | 991,139 | ||||||||||||||
| 3,602,017 | ||||||||||||||||
|
| |||||||||||||||
| Health Care Providers & Services: 3.30% | ||||||||||||||||
Anthem Incorporated | 1,014 | 277,633 | ||||||||||||||
Cigna Corporation | 9,627 | 1,662,487 | ||||||||||||||
The Ensign Group Incorporated | 24,342 | 1,119,489 | ||||||||||||||
UnitedHealth Group Incorporated | 10,457 | 3,166,170 | ||||||||||||||
| 6,225,779 | ||||||||||||||||
|
| |||||||||||||||
| Health Care Technology: 1.82% | ||||||||||||||||
Cerner Corporation | 49,497 | 3,437,567 | ||||||||||||||
|
| |||||||||||||||
| Life Sciences Tools & Services: 2.79% | ||||||||||||||||
Agilent Technologies Incorporated | 36,323 | 3,498,995 | ||||||||||||||
Thermo Fisher Scientific Incorporated | 4,265 | 1,765,497 | ||||||||||||||
| 5,264,492 | ||||||||||||||||
|
| |||||||||||||||
| Pharmaceuticals: 7.08% | ||||||||||||||||
Bristol-Myers Squibb Company | 31,927 | 1,872,838 | ||||||||||||||
Johnson & Johnson | 9,372 | 1,366,063 | ||||||||||||||
Merck & Company Incorporated | 63,768 | 5,116,744 | ||||||||||||||
Pfizer Incorporated | 130,122 | 5,007,095 | ||||||||||||||
| 13,362,740 | ||||||||||||||||
|
| |||||||||||||||
| Industrials: 10.31% | ||||||||||||||||
| Aerospace & Defense: 0.40% | ||||||||||||||||
Raytheon Technologies Corporation | 13,323 | 755,148 | ||||||||||||||
|
| |||||||||||||||
| Air Freight & Logistics: 1.26% | ||||||||||||||||
FedEx Corporation | 13,692 | 2,305,733 | ||||||||||||||
XPO Logistics Incorporated † | 833 | 62,492 | ||||||||||||||
| 2,368,225 | ||||||||||||||||
|
| |||||||||||||||
| Airlines: 1.95% | ||||||||||||||||
Delta Air Lines Incorporated | 76,339 | 1,906,185 | ||||||||||||||
United Airlines Holdings Incorporated † | 56,597 | 1,776,014 | ||||||||||||||
| 3,682,199 | ||||||||||||||||
|
| |||||||||||||||
| Building Products: 0.41% | ||||||||||||||||
Trex Company Incorporated † | 5,494 | 765,479 | ||||||||||||||
|
| |||||||||||||||
| Commercial Services & Supplies: 1.54% | ||||||||||||||||
Rollins Incorporated | 55,569 | 2,911,816 | ||||||||||||||
|
| |||||||||||||||
The accompanying notes are an integral part of these financial statements.
12 | Wells Fargo Large Company Value Fund
Table of Contents
Portfolio of investments—July 31, 2020
| Shares | Value | |||||||||||||||
| Electrical Equipment: 1.77% | ||||||||||||||||
Emerson Electric Company | 53,892 | $ | 3,341,843 | |||||||||||||
|
| |||||||||||||||
| Machinery: 2.24% | ||||||||||||||||
Evoqua Water Technologies Company † | 109,521 | 2,106,089 | ||||||||||||||
Proto Labs Incorporated † | 17,606 | 2,114,833 | ||||||||||||||
| 4,220,922 | ||||||||||||||||
|
| |||||||||||||||
| Trading Companies & Distributors: 0.74% | ||||||||||||||||
Fastenal Company | 29,710 | 1,397,558 | ||||||||||||||
|
| |||||||||||||||
| Information Technology: 12.99% | ||||||||||||||||
| Communications Equipment: 2.57% | ||||||||||||||||
Cisco Systems Incorporated | 102,896 | 4,846,402 | ||||||||||||||
|
| |||||||||||||||
| IT Services: 3.65% | ||||||||||||||||
International Business Machines Corporation | 38,887 | 4,780,768 | ||||||||||||||
Square Incorporated Class A † | 16,098 | 2,090,325 | ||||||||||||||
| 6,871,093 | ||||||||||||||||
|
| |||||||||||||||
| Semiconductors & Semiconductor Equipment: 4.96% | ||||||||||||||||
Advanced Micro Devices Incorporated † | 47,702 | 3,693,566 | ||||||||||||||
Intel Corporation | 66,114 | 3,155,621 | ||||||||||||||
Monolithic Power Systems Incorporated | 9,464 | 2,508,055 | ||||||||||||||
| 9,357,242 | ||||||||||||||||
|
| |||||||||||||||
| Software: 1.81% | ||||||||||||||||
Cloudera Incorporated † | 80,196 | 903,809 | ||||||||||||||
Intuit Incorporated | 1,934 | 592,520 | ||||||||||||||
Manhattan Associates Incorporated † | 20,035 | 1,919,153 | ||||||||||||||
| 3,415,482 | ||||||||||||||||
|
| |||||||||||||||
| Materials: 3.90% | ||||||||||||||||
| Chemicals: 3.90% | ||||||||||||||||
Corteva Incorporated | 95,017 | 2,713,686 | ||||||||||||||
Linde plc | 18,958 | 4,646,795 | ||||||||||||||
| 7,360,481 | ||||||||||||||||
|
| |||||||||||||||
| Real Estate: 4.14% | ||||||||||||||||
| Equity REITs: 2.18% | ||||||||||||||||
American Tower Corporation | 1,587 | 414,826 | ||||||||||||||
Invitation Homes Incorporated | 17,563 | 523,729 | ||||||||||||||
Prologis Incorporated | 22,000 | 2,319,248 | ||||||||||||||
Simon Property Group Incorporated | 13,534 | 843,845 | ||||||||||||||
| 4,101,648 | ||||||||||||||||
|
| |||||||||||||||
| Real Estate Management & Development: 1.96% | ||||||||||||||||
CBRE Group Incorporated Class A † | 66,852 | 2,928,776 | ||||||||||||||
Redfin Corporation † | 18,586 | 772,806 | ||||||||||||||
| 3,701,582 | ||||||||||||||||
|
| |||||||||||||||
The accompanying notes are an integral part of these financial statements.
Wells Fargo Large Company Value Fund | 13
Table of Contents
Portfolio of investments—July 31, 2020
| Shares | Value | |||||||||||||||
| Utilities: 3.46% | ||||||||||||||||
| Electric Utilities: 2.01% | ||||||||||||||||
Duke Energy Corporation | 5,873 | $ | 497,678 | |||||||||||||
Entergy Corporation | 31,385 | 3,299,505 | ||||||||||||||
| 3,797,183 | ||||||||||||||||
|
| |||||||||||||||
| Multi-Utilities: 1.45% | ||||||||||||||||
MDU Resources Group Incorporated | 130,154 | 2,730,631 | ||||||||||||||
|
| |||||||||||||||
Total Common Stocks (Cost $168,550,200) | 185,255,705 | |||||||||||||||
|
| |||||||||||||||
| Yield | ||||||||||||||||
| Short-Term Investments: 1.47% | ||||||||||||||||
| Investment Companies: 1.47% | ||||||||||||||||
Wells Fargo Government Money Market Select Class (l)(u) | 0.10 | % | 2,774,458 | 2,774,458 | ||||||||||||
|
| |||||||||||||||
Total Short-Term Investments (Cost $2,774,458) | 2,774,458 | |||||||||||||||
|
| |||||||||||||||
| Total investments in securities (Cost $171,324,658) | 99.69 | % | 188,030,163 | |||||
Other assets and liabilities, net | 0.31 | 584,706 | ||||||
|
|
|
| |||||
| Total net assets | 100.00 | % | $ | 188,614,869 | ||||
|
|
|
| |||||
| † | Non-income-earning security |
| (l) | The issuer of the security is an affiliated person of the Fund as defined in the Investment Company Act of 1940. |
| (u) | The rate represents the 7-day annualized yield at period end. |
Abbreviations:
| REIT | Real estate investment trust |
Futures Contracts
| Description | Number of contracts | Expiration date | Notional cost | Notional value | Unrealized gains | Unrealized losses | ||||||||||||||||||
Long | ||||||||||||||||||||||||
S&P 500 E-Mini Index | 21 | 9-18-2020 | $ | 3,354,478 | $ | 3,426,675 | $ | 72,197 | $ | 0 | ||||||||||||||
Investments in Affiliates
An affiliated investment is an investment in which the Fund owns at least 5% of the outstanding voting shares of the issuer or as a result of other relationships, such as the Fund and the issuer having the same investment manager. Transactions with issuers that were either affiliated persons of the Fund at the beginning of the period or the end of the period were as follows:
| Value, beginning of period | Purchases | Sales proceeds | Net realized gains (losses) | Net change in unrealized gains (losses) | Income from affiliated securities | Value, end of | % of net assets | |||||||||||||||||||||||||
| Short-Term Investments | ||||||||||||||||||||||||||||||||
Investment Companies | ||||||||||||||||||||||||||||||||
Securities Lending Cash Investments LLC * | $ | 0 | $ | 11,038,275 | $ | (11,038,091 | ) | $ | (184 | ) | $ | 0 | $ | 2,849 | # | $ | 0 | |||||||||||||||
Wells Fargo Government Money Market Fund Select Class | 1,645,324 | 40,644,344 | (39,515,210 | ) | 0 | 0 | 34,568 | 2,774,458 | ||||||||||||||||||||||||
|
|
|
|
|
|
|
|
|
| |||||||||||||||||||||||
| $ | (184 | ) | $ | 0 | $ | 37,417 | $ | 2,774,458 | 1.47 | % | ||||||||||||||||||||||
|
|
|
|
|
|
|
|
|
| |||||||||||||||||||||||
| * | No longer held at the end of the period |
| # | Amount shown represents income before fees and rebates. |
The accompanying notes are an integral part of these financial statements.
14 | Wells Fargo Large Company Value Fund
Table of Contents
Statement of assets and liabilities—July 31, 2020
Assets | ||||
Investments in unaffiliated securities, at value (cost $168,550,200) | $ | 185,255,705 | ||
Investments in affiliated securities, at value (cost $2,774,458) | 2,774,458 | |||
Segregated cash for futures contracts | 425,000 | |||
Receivable for Fund shares sold | 1,250 | |||
Receivable for dividends | 315,682 | |||
Receivable for daily variation margin on open futures contracts | 15,435 | |||
Prepaid expenses and other assets | 92,964 | |||
|
| |||
Total assets | 188,880,494 | |||
|
| |||
Liabilities | ||||
Payable for Fund shares redeemed | 99,382 | |||
Management fee payable | 34,004 | |||
Administration fees payable | 34,089 | |||
Distribution fee payable | 424 | |||
Shareholder report expenses payable | 13,509 | |||
Shareholder servicing fees payable | 40,996 | |||
Professional fees payable | 23,379 | |||
Trustees’ fees and expenses payable | 4,571 | |||
Accrued expenses and other liabilities | 15,271 | |||
|
| |||
Total liabilities | 265,625 | |||
|
| |||
Total net assets | $ | 188,614,869 | ||
|
| |||
Net assets consist of | ||||
Paid-in capital | $ | 182,645,184 | ||
Total distributable earnings | 5,969,685 | |||
|
| |||
Total net assets | $ | 188,614,869 | ||
|
| |||
Computation of net asset value and offering price per share | ||||
Net assets – Class A | $ | 174,028,413 | ||
Shares outstanding – Class A1 | 14,131,857 | |||
Net asset value per share – Class A | $12.31 | |||
Maximum offering price per share – Class A2 | $13.06 | |||
Net assets – Class C | $ | 481,672 | ||
Shares outstanding – Class C1 | 37,764 | |||
Net asset value per share – Class C | $12.75 | |||
Net assets – Class R6 | $ | 150,598 | ||
Shares outstanding – Class R61 | 12,176 | |||
Net asset value per share – Class R6 | $12.37 | |||
Net assets – Administrator Class | $ | 11,812,650 | ||
Shares outstanding – Administrator Class1 | 949,911 | |||
Net asset value per share – Administrator Class | $12.44 | |||
Net assets – Institutional Class | $ | 2,141,536 | ||
Shares outstanding – Institutional Class1 | 172,918 | |||
Net asset value per share – Institutional Class | $12.38 | |||
| 1 | The Fund has an unlimited number of authorized shares. |
| 2 | Maximum offering price is computed as 100/94.25 of net asset value. On investments of $50,000 or more, the offering price is reduced. |
The accompanying notes are an integral part of these financial statements.
Wells Fargo Large Company Value Fund | 15
Table of Contents
Statement of operations—year ended July 31, 2020
Investment income | ||||
Dividends (net of foreign withholding taxes of $2,833) | $ | 4,820,377 | ||
Income from affiliated securities | 36,681 | |||
|
| |||
Total investment income | 4,857,058 | |||
|
| |||
Expenses | ||||
Management fee | 794,129 | |||
Administration fees | ||||
Class A | 383,228 | |||
Class C | 1,485 | |||
Class R6 | 24 | |||
Administrator Class | 16,483 | |||
Institutional Class | 3,350 | |||
Shareholder servicing fees | ||||
Class A | 455,711 | |||
Class C | 1,763 | |||
Administrator Class | 31,607 | |||
Distribution fee | ||||
Class C | 5,250 | |||
Custody and accounting fees | 20,459 | |||
Professional fees | 41,243 | |||
Registration fees | 89,755 | |||
Shareholder report expenses | 67,678 | |||
Trustees’ fees and expenses | 21,002 | |||
Other fees and expenses | 24,195 | |||
|
| |||
Total expenses | 1,957,362 | |||
Less: Fee waivers and/or expense reimbursements | ||||
Fund-level | (310,880 | ) | ||
Class A | (37,469 | ) | ||
Class C | (5 | ) | ||
Class R6 | (24 | ) | ||
Administrator Class | (332 | ) | ||
|
| |||
Net expenses | 1,608,652 | |||
|
| |||
Net investment income | 3,248,406 | |||
|
| |||
Realized and unrealized gains (losses) on investments | ||||
Net realized gains (losses) on | ||||
Unaffiliated securities | (6,871,094 | ) | ||
Affiliated securities | (184 | ) | ||
Futures contracts | 255,829 | |||
|
| |||
Net realized losses on investments | (6,615,449 | ) | ||
|
| |||
Net change in unrealized gains (losses) on | ||||
Unaffiliated securities | (1,716,003 | ) | ||
Futures contracts | 74,256 | |||
|
| |||
Net change in unrealized gains (losses) on investments | (1,641,747 | ) | ||
|
| |||
Net realized and unrealized gains (losses) on investments | (8,257,196 | ) | ||
|
| |||
Net decrease in net assets resulting from operations | $ | (5,008,790 | ) | |
|
| |||
The accompanying notes are an integral part of these financial statements.
16 | Wells Fargo Large Company Value Fund
Table of Contents
Statement of changes in net assets
| Year ended July 31, 2020 | Year ended July 31, 2019 | |||||||||||||||
Operations | ||||||||||||||||
Net investment income | $ | 3,248,406 | $ | 4,187,678 | ||||||||||||
Net realized losses on investments | (6,615,449 | ) | (1,776,559 | ) | ||||||||||||
Net change in unrealized gains (losses) on investments | (1,641,747 | ) | (1,219,504 | ) | ||||||||||||
|
| |||||||||||||||
Net increase (decrease) in net assets resulting from operations | (5,008,790 | ) | 1,191,615 | |||||||||||||
|
| |||||||||||||||
Distributions to shareholders from net investment income and net realized gains | ||||||||||||||||
Class A | (4,138,739 | ) | (23,627,979 | ) | ||||||||||||
Class C | (8,415 | ) | (266,385 | ) | ||||||||||||
Class R6 | (1,720 | ) | (2,636 | ) | ||||||||||||
Administrator Class | (307,818 | ) | (1,888,886 | ) | ||||||||||||
Institutional Class | (76,019 | ) | (1,871,851 | ) | ||||||||||||
|
| |||||||||||||||
Total distributions to shareholders | (4,532,711 | ) | (27,657,737 | ) | ||||||||||||
|
| |||||||||||||||
Capital share transactions | Shares | Shares | ||||||||||||||
Proceeds from shares sold | ||||||||||||||||
Class A | 393,071 | 4,710,162 | 328,569 | 4,172,689 | ||||||||||||
Class C | 1,205 | 16,645 | 6,704 | 85,717 | ||||||||||||
Class R6 | 10,550 | 145,462 | 0 | 0 | ||||||||||||
Administrator Class | 14,119 | 176,541 | 14,518 | 189,634 | ||||||||||||
Institutional Class | 71,355 | 926,976 | 68,756 | 908,749 | ||||||||||||
|
| |||||||||||||||
| 5,975,786 | 5,356,789 | |||||||||||||||
|
| |||||||||||||||
Reinvestment of distributions | ||||||||||||||||
Class A | 331,283 | 4,035,013 | 1,878,949 | 23,010,284 | ||||||||||||
Class C | 579 | 7,318 | 19,913 | 248,892 | ||||||||||||
Class R6 | 106 | 1,111 | 0 | 0 | ||||||||||||
Administrator Class | 24,225 | 299,549 | 150,186 | 1,857,902 | ||||||||||||
Institutional Class | 6,020 | 74,841 | 39,382 | 487,708 | ||||||||||||
|
| |||||||||||||||
| 4,417,832 | 25,604,786 | |||||||||||||||
|
| |||||||||||||||
Payment for shares redeemed | ||||||||||||||||
Class A | (1,762,779 | ) | (22,001,832 | ) | (1,858,015 | ) | (24,202,649 | ) | ||||||||
Class C | (36,432 | ) | (470,955 | ) | (151,734 | ) | (1,973,099 | ) | ||||||||
Class R6 | (29 | ) | (332 | ) | 0 | 0 | ||||||||||
Administrator Class | (149,524 | ) | (1,951,878 | ) | (251,379 | ) | (3,187,791 | ) | ||||||||
Institutional Class | (130,502 | ) | (1,675,849 | ) | (1,090,005 | ) | (12,813,608 | ) | ||||||||
|
| |||||||||||||||
| (26,100,846 | ) | (42,177,147 | ) | |||||||||||||
|
| |||||||||||||||
Net decrease in net assets resulting from capital share transactions | (15,707,228 | ) | (11,215,572 | ) | ||||||||||||
|
| |||||||||||||||
Total decrease in net assets | (25,248,729 | ) | (37,681,694 | ) | ||||||||||||
|
| |||||||||||||||
Net assets | ||||||||||||||||
Beginning of period | 213,863,598 | 251,545,292 | ||||||||||||||
|
| |||||||||||||||
End of period | $ | 188,614,869 | $ | 213,863,598 | ||||||||||||
|
| |||||||||||||||
The accompanying notes are an integral part of these financial statements.
Wells Fargo Large Company Value Fund | 17
Table of Contents
(For a share outstanding throughout each period)
| Year ended July 31 | ||||||||||||||||||||
| CLASS A | 2020 | 2019 | 2018 | 2017 | 2016 | |||||||||||||||
Net asset value, beginning of period | $12.92 | $14.46 | $16.54 | $14.58 | $16.10 | |||||||||||||||
Net investment income | 0.20 | 0.24 | 0.19 | 0.14 | 0.17 | |||||||||||||||
Net realized and unrealized gains (losses) on investments | (0.53 | ) | (0.15 | ) | 1.29 | 1.93 | (0.41 | ) | ||||||||||||
|
|
|
|
|
|
|
|
|
| |||||||||||
Total from investment operations | (0.33 | ) | 0.09 | 1.48 | 2.07 | (0.24 | ) | |||||||||||||
Distributions to shareholders from | ||||||||||||||||||||
Net investment income | (0.21 | ) | (0.25 | ) | (0.18 | ) | (0.11 | ) | (0.16 | ) | ||||||||||
Net realized gains | (0.07 | ) | (1.38 | ) | (3.38 | ) | 0.00 | (1.12 | ) | |||||||||||
|
|
|
|
|
|
|
|
|
| |||||||||||
Total distributions to shareholders | (0.28 | ) | (1.63 | ) | (3.56 | ) | (0.11 | ) | (1.28 | ) | ||||||||||
Net asset value, end of period | $12.31 | $12.92 | $14.46 | $16.54 | $14.58 | |||||||||||||||
Total return1 | (2.49 | )% | 1.44 | % | 9.39 | % | 14.24 | % | (0.98 | )% | ||||||||||
Ratios to average net assets (annualized) | ||||||||||||||||||||
Gross expenses | 0.99 | % | 0.97 | % | 0.94 | % | 1.09 | % | 1.24 | % | ||||||||||
Net expenses | 0.82 | % | 0.83 | % | 0.83 | % | 0.96 | % | 1.10 | % | ||||||||||
Net investment income | 1.63 | % | 1.84 | % | 1.28 | % | 0.91 | % | 1.19 | % | ||||||||||
Supplemental data | ||||||||||||||||||||
Portfolio turnover rate | 366 | % | 221 | % | 258 | % | 221 | % | 50 | % | ||||||||||
Net assets, end of period (000s omitted) | $174,028 | $196,075 | $214,247 | $221,207 | $218,922 | |||||||||||||||
| 1 | Total return calculations do not include any sales charges. |
The accompanying notes are an integral part of these financial statements.
18 | Wells Fargo Large Company Value Fund
Table of Contents
Financial highlights
(For a share outstanding throughout each period)
| Year ended July 31 | ||||||||||||||||||||
| CLASS C | 2020 | 2019 | 2018 | 2017 | 2016 | |||||||||||||||
Net asset value, beginning of period | $13.34 | $14.81 | $16.86 | $14.90 | $16.41 | |||||||||||||||
Net investment income | 0.12 | 1 | 0.16 | 1 | 0.08 | 0.03 | 1 | 0.06 | ||||||||||||
Net realized and unrealized gains (losses) on investments | (0.56 | ) | (0.15 | ) | 1.30 | 1.96 | (0.40 | ) | ||||||||||||
|
|
|
|
|
|
|
|
|
| |||||||||||
Total from investment operations | (0.44 | ) | 0.01 | 1.38 | 1.99 | (0.34 | ) | |||||||||||||
Distributions to shareholders from | ||||||||||||||||||||
Net investment income | (0.08 | ) | (0.10 | ) | (0.05 | ) | (0.03 | ) | (0.05 | ) | ||||||||||
Net realized gains | (0.07 | ) | (1.38 | ) | (3.38 | ) | 0.00 | (1.12 | ) | |||||||||||
|
|
|
|
|
|
|
|
|
| |||||||||||
Total distributions to shareholders | (0.15 | ) | (1.48 | ) | (3.43 | ) | (0.03 | ) | (1.17 | ) | ||||||||||
Net asset value, end of period | $12.75 | $13.34 | $14.81 | $16.86 | $14.90 | |||||||||||||||
Total return2 | (3.27 | )% | 0.76 | % | 8.49 | % | 13.40 | % | (1.68 | )% | ||||||||||
Ratios to average net assets (annualized) | ||||||||||||||||||||
Gross expenses | 1.74 | % | 1.71 | % | 1.69 | % | 1.84 | % | 1.99 | % | ||||||||||
Net expenses | 1.58 | % | 1.58 | % | 1.58 | % | 1.72 | % | 1.85 | % | ||||||||||
Net investment income | 0.92 | % | 1.15 | % | 0.55 | % | 0.16 | % | 0.44 | % | ||||||||||
Supplemental data | ||||||||||||||||||||
Portfolio turnover rate | 366 | % | 221 | % | 258 | % | 221 | % | 50 | % | ||||||||||
Net assets, end of period (000s omitted) | $482 | $966 | $2,926 | $3,356 | $3,674 | |||||||||||||||
| 1 | Calculated based upon average shares outstanding |
| 2 | Total return calculations do not include any sales charges. |
The accompanying notes are an integral part of these financial statements.
Wells Fargo Large Company Value Fund | 19
Table of Contents
Financial highlights
(For a share outstanding throughout each period)
| Year ended July 31 | ||||||||||||||||
| CLASS R6 | 2020 | 2019 | 2018 | 20171 | ||||||||||||
Net asset value, beginning of period | $13.04 | $14.59 | $16.66 | $16.14 | ||||||||||||
Net investment income | 0.30 | 0.30 | 0.26 | 0.03 | 2 | |||||||||||
Net realized and unrealized gains (losses) on investments | (0.57 | ) | (0.14 | ) | 1.30 | 0.49 | ||||||||||
|
|
|
|
|
|
|
| |||||||||
Total from investment operations | (0.27 | ) | 0.16 | 1.56 | 0.52 | |||||||||||
Distributions to shareholders from | ||||||||||||||||
Net investment income | (0.33 | ) | (0.33 | ) | (0.25 | ) | 0.00 | |||||||||
Net realized gains | (0.07 | ) | (1.38 | ) | (3.38 | ) | 0.00 | |||||||||
|
|
|
|
|
|
|
| |||||||||
Total distributions to shareholders | (0.40 | ) | (1.71 | ) | (3.63 | ) | 0.00 | |||||||||
Net asset value, end of period | $12.37 | $13.04 | $14.59 | $16.66 | ||||||||||||
Total return3 | (2.09 | )% | 1.92 | % | 9.88 | % | 3.22 | % | ||||||||
Ratios to average net assets (annualized) | ||||||||||||||||
Gross expenses | 0.58 | % | 0.55 | % | 0.51 | % | 0.49 | % | ||||||||
Net expenses | 0.40 | % | 0.40 | % | 0.40 | % | 0.40 | % | ||||||||
Net investment income | 1.69 | % | 2.26 | % | 1.73 | % | 0.52 | % | ||||||||
Supplemental data | ||||||||||||||||
Portfolio turnover rate | 366 | % | 221 | % | 258 | % | 221 | % | ||||||||
Net assets, end of period (000s omitted) | $151 | $20 | $23 | $26 | ||||||||||||
| 1 | For the period from April 7, 2017 (commencement of class operations) to July 31, 2017 |
| 2 | Calculated based upon average shares outstanding |
| 3 | Returns for periods of less than one year are not annualized. |
The accompanying notes are an integral part of these financial statements.
20 | Wells Fargo Large Company Value Fund
Table of Contents
Financial highlights
(For a share outstanding throughout each period)
| Year ended July 31 | ||||||||||||||||||||
| ADMINISTRATOR CLASS | 2020 | 2019 | 2018 | 2017 | 2016 | |||||||||||||||
Net asset value, beginning of period | $13.06 | $14.59 | $16.66 | $14.68 | $16.20 | |||||||||||||||
Net investment income | 0.22 | 0.26 | 0.20 | 0.16 | 1 | 0.20 | ||||||||||||||
Net realized and unrealized gains (losses) on investments | (0.54 | ) | (0.14 | ) | 1.30 | 1.94 | (0.41 | ) | ||||||||||||
|
|
|
|
|
|
|
|
|
| |||||||||||
Total from investment operations | (0.32 | ) | 0.12 | 1.50 | 2.10 | (0.21 | ) | |||||||||||||
Distributions to shareholders from | ||||||||||||||||||||
Net investment income | (0.23 | ) | (0.27 | ) | (0.19 | ) | (0.12 | ) | (0.19 | ) | ||||||||||
Net realized gains | (0.07 | ) | (1.38 | ) | (3.38 | ) | 0.00 | (1.12 | ) | |||||||||||
|
|
|
|
|
|
|
|
|
| |||||||||||
Total distributions to shareholders | (0.30 | ) | (1.65 | ) | (3.57 | ) | (0.12 | ) | (1.31 | ) | ||||||||||
Net asset value, end of period | $12.44 | $13.06 | $14.59 | $16.66 | $14.68 | |||||||||||||||
Total return | (2.41 | )% | 1.61 | % | 9.44 | % | 14.35 | % | (0.79 | )% | ||||||||||
Ratios to average net assets (annualized) | ||||||||||||||||||||
Gross expenses | 0.91 | % | 0.89 | % | 0.86 | % | 1.01 | % | 1.16 | % | ||||||||||
Net expenses | 0.75 | % | 0.75 | % | 0.75 | % | 0.87 | % | 0.93 | % | ||||||||||
Net investment income | 1.71 | % | 1.93 | % | 1.37 | % | 1.01 | % | 1.35 | % | ||||||||||
Supplemental data | ||||||||||||||||||||
Portfolio turnover rate | 366 | % | 221 | % | 258 | % | 221 | % | 50 | % | ||||||||||
Net assets, end of period (000s omitted) | $11,813 | $13,854 | $16,744 | $18,296 | $24,164 | |||||||||||||||
| 1 | Calculated based upon average shares outstanding |
The accompanying notes are an integral part of these financial statements.
Wells Fargo Large Company Value Fund | 21
Table of Contents
Financial highlights
(For a share outstanding throughout each period)
| Year ended July 31 | ||||||||||||||||||||
| INSTITUTIONAL CLASS | 2020 | 2019 | 2018 | 2017 | 2016 | |||||||||||||||
Net asset value, beginning of period | $13.04 | $14.58 | $16.65 | $14.66 | $16.17 | |||||||||||||||
Net investment income | 0.26 | 0.29 | 1 | 0.24 | 0.19 | 1 | 0.21 | 1 | ||||||||||||
Net realized and unrealized gains (losses) on investments | (0.55 | ) | (0.14 | ) | 1.30 | 1.94 | (0.38 | ) | ||||||||||||
|
|
|
|
|
|
|
|
|
| |||||||||||
Total from investment operations | (0.29 | ) | 0.15 | 1.54 | 2.13 | (0.17 | ) | |||||||||||||
Distributions to shareholders from | ||||||||||||||||||||
Net investment income | (0.30 | ) | (0.31 | ) | (0.23 | ) | (0.14 | ) | (0.22 | ) | ||||||||||
Net realized gains | (0.07 | ) | (1.38 | ) | (3.38 | ) | 0.00 | (1.12 | ) | |||||||||||
|
|
|
|
|
|
|
|
|
| |||||||||||
Total distributions to shareholders | (0.37 | ) | (1.69 | ) | (3.61 | ) | (0.14 | ) | (1.34 | ) | ||||||||||
Net asset value, end of period | $12.38 | $13.04 | $14.58 | $16.65 | $14.66 | |||||||||||||||
Total return | (2.20 | )% | 1.86 | % | 9.77 | % | 14.61 | % | (0.54 | )% | ||||||||||
Ratios to average net assets (annualized) | ||||||||||||||||||||
Gross expenses | 0.66 | % | 0.63 | % | 0.62 | % | 0.74 | % | 0.91 | % | ||||||||||
Net expenses | 0.50 | % | 0.50 | % | 0.50 | % | 0.61 | % | 0.74 | % | ||||||||||
Net investment income | 1.96 | % | 2.14 | % | 1.60 | % | 1.21 | % | 1.52 | % | ||||||||||
Supplemental data | ||||||||||||||||||||
Portfolio turnover rate | 366 | % | 221 | % | 258 | % | 221 | % | 50 | % | ||||||||||
Net assets, end of period (000s omitted) | $2,142 | $2,948 | $17,606 | $16,321 | $9,343 | |||||||||||||||
| 1 | Calculated based upon average shares outstanding |
The accompanying notes are an integral part of these financial statements.
22 | Wells Fargo Large Company Value Fund
Table of Contents
1. ORGANIZATION
Wells Fargo Funds Trust (the “Trust”), a Delaware statutory trust organized on March 10, 1999, is an open-end management investment company registered under the Investment Company Act of 1940, as amended (the “1940 Act”). As an investment company, the Trust follows the accounting and reporting guidance in Financial Accounting Standards Board (“FASB”) Accounting Standards Codification Topic 946, Financial Services – Investment Companies. These financial statements report on the Wells Fargo Large Company Value Fund (the “Fund”) which is a diversified series of the Trust.
2. SIGNIFICANT ACCOUNTING POLICIES
The following significant accounting policies, which are consistently followed in the preparation of the financial statements of the Fund, are in conformity with U.S. generally accepted accounting principles which require management to make estimates and assumptions that affect the reported amounts of assets and liabilities, disclosure of contingent assets and liabilities at the date of the financial statements, and the reported amounts of revenues and expenses during the reporting period. Actual results could differ from those estimates.
Securities valuation
All investments are valued each business day as of the close of regular trading on the New York Stock Exchange (generally 4 p.m. Eastern Time), although the Fund may deviate from this calculation time under unusual or unexpected circumstances.
Equity securities and futures contracts that are listed on a foreign or domestic exchange or market are valued at the official closing price or, if none, the last sales price. If no sale occurs on the principal exchange or market that day, a fair value price will be determined in accordance with the Fund’s Valuation Procedures.
Investments in registered open-end investment companies are valued at net asset value. Interests in non-registered investment companies that are redeemable at net asset value are fair valued normally at net asset value.
Investments which are not valued using any of the methods discussed above are valued at their fair value, as determined in good faith by the Board of Trustees of the Fund. The Board of Trustees has established a Valuation Committee comprised of the Trustees and has delegated to it the authority to take any actions regarding the valuation of portfolio securities that the Valuation Committee deems necessary or appropriate, including determining the fair value of portfolio securities, unless the determination has been delegated to the Wells Fargo Asset Management Pricing Committee at Wells Fargo Funds Management, LLC (“Funds Management”). The Board of Trustees retains the authority to make or ratify any valuation decisions or approve any changes to the Valuation Procedures as it deems appropriate. On a quarterly basis, the Board of Trustees receives reports on any valuation actions taken by the Valuation Committee or the Wells Fargo Asset Management Pricing Committee which may include items for ratification.
Securities lending
The Fund may lend its securities from time to time in order to earn additional income in the form of fees or interest on securities received as collateral or the investment of any cash received as collateral. When securities are on loan, the Fund receives interest or dividends on those securities. Cash collateral received in connection with its securities lending transactions is invested in Securities Lending Cash Investments, LLC (the “Securities Lending Fund”). Investments in Securities Lending Fund are valued at the evaluated bid price provided by an independent pricing service. Income earned from investment in the Securities Lending Fund (net of fees and rebates), if any, is included in income from affiliated securities on the Statement of Operations.
In a securities lending transaction, the net asset value of the Fund is affected by an increase or decrease in the value of the securities loaned and by an increase or decrease in the value of the instrument in which collateral is invested. The amount of securities lending activity undertaken by the Fund fluctuates from time to time. The Fund has the right under the lending agreement to recover the securities from the borrower on demand. In the event of default or bankruptcy by the borrower, the Fund may be prevented from recovering the loaned securities or gaining access to the collateral or may experience delays or costs in doing so. In such an event, the terms of the agreement allow the unaffiliated securities lending agent to use the collateral to purchase replacement securities on behalf of the Fund or pay the Fund the market value of the loaned securities. The Fund bears the risk of loss with respect to depreciation of its investment of the cash collateral.
Foreign currency translation
The accounting records of the Fund are maintained in U.S. dollars. The values of other assets and liabilities denominated in foreign currencies are translated into U.S. dollars at rates provided by an independent foreign currency pricing source at a time each business day specified by the Wells Fargo Asset Management Pricing Committee. Purchases and sales of securities, and income and expenses are converted at the rate of exchange on the respective dates of such transactions. Net realized foreign
Wells Fargo Large Company Value Fund | 23
Table of Contents
Notes to financial statements
exchange gains or losses arise from sales of foreign currencies, currency gains or losses realized between the trade and settlement dates on securities transactions, and the difference between the amounts of dividends, interest and foreign withholding taxes recorded and the U.S. dollar equivalent of the amounts actually paid or received. Net unrealized foreign exchange gains and losses arise from changes in the fair value of assets and liabilities other than investments in securities resulting from changes in exchange rates. The changes in net assets arising from changes in exchange rates of securities and the changes in net assets resulting from changes in market prices of securities are not separately presented. Such changes are included in net realized and unrealized gains or losses from investments.
Futures contracts
Futures contracts are agreements between the Fund and a counterparty to buy or sell a specific amount of a commodity, financial instrument or currency at a specified price and on a specified date. The Fund may buy and sell futures contracts in order to gain exposure to, or protect against, changes in security values and is subject to equity price risk. The primary risks associated with the use of futures contracts are the imperfect correlation between changes in market values of securities held by the Fund and the prices of futures contracts, and the possibility of an illiquid market. Futures contracts are generally entered into on a regulated futures exchange and cleared through a clearinghouse associated with the exchange. With futures contracts, there is minimal counterparty risk to the Fund since futures contracts are exchange traded and the exchange’s clearinghouse, as the counterparty to all exchange traded futures, guarantees the futures contracts against default.
Upon entering into a futures contracts, the Fund is required to deposit either cash or securities (initial margin) with the broker in an amount equal to a certain percentage of the contract value. Subsequent payments (variation margin) are paid to or from the broker each day equal to the daily changes in the contract value. Such payments are recorded as unrealized gains or losses and, if any, shown as variation margin receivable (payable) in the Statement of Assets and Liabilities. Should the Fund fail to make requested variation margin payments, the broker can gain access to the initial margin to satisfy the Fund’s payment obligations. When the contracts are closed, a realized gain or loss is recorded in the Statement of Operations.
Security transactions and income recognition
Securities transactions are recorded on a trade date basis. Realized gains or losses are recorded on the basis of identified cost.
Dividend income is recognized on the ex-dividend date. Dividend income is recorded net of foreign taxes withheld where recovery of such taxes is not assured.
Distributions to shareholders
Distributions to shareholders are recorded on the ex-dividend date and paid from net investment income quarterly and any net realized gains are paid at least annually. Such distributions are determined in accordance with income tax regulations and may differ from U.S. generally accepted accounting principles. Dividend sources are estimated at the time of declaration. The tax character of distributions is determined as of the Fund’s fiscal year end. Therefore, a portion of the Fund’s distributions made prior to the Fund’s fiscal year end may be categorized as a tax return of capital at year end.
Federal and other taxes
The Fund intends to continue to qualify as a regulated investment company by distributing substantially all of its investment company taxable income and any net realized capital gains (after reduction for capital loss carryforwards) sufficient to relieve it from all, or substantially all, federal income taxes. Accordingly, no provision for federal income taxes was required.
The Fund’s income and federal excise tax returns and all financial records supporting those returns for the prior three fiscal years are subject to examination by the federal and Delaware revenue authorities. Management has analyzed the Fund’s tax positions taken on federal, state, and foreign tax returns for all open tax years and does not believe that there are any uncertain tax positions that require recognition of a tax liability.
As of July 31, 2020, the aggregate cost of all investments for federal income tax purposes was $173,838,774 and the unrealized gains (losses) consisted of:
Gross unrealized gains | $ | 17,303,981 | ||
Gross unrealized losses | (3,040,395 | ) | ||
Net unrealized gains | $ | 14,263,586 | ||
Reclassifications are made to the Fund’s capital accounts for permanent tax differences to reflect income and gains available for distribution (or available capital loss carryforwards) under federal income tax regulations. U.S. generally accepted accounting principles require that certain components of net assets be adjusted to reflect permanent differences between financial and tax
24 | Wells Fargo Large Company Value Fund
Table of Contents
Notes to financial statements
reporting. These reclassifications have no effect on net assets or net asset values per share. At July 31, 2020, as a result of permanent book-to-tax differences, the following reclassification adjustments were made on the Statement of Assets and Liabilities:
| Paid-in capital | Total distributable earnings | |
| $1,022 | $(1,022) | |
As of July 31, 2020, the Fund had current year net deferred post-October capital losses consisting of $8,701,143 in short-term losses which will be recognized on the first day of the following fiscal year.
Class allocations
The separate classes of shares offered by the Fund differ principally in applicable sales charges, distribution, shareholder servicing, and administration fees. Class specific expenses are charged directly to that share class. Investment income, common fund-level expenses, and realized and unrealized gains (losses) on investments are allocated daily to each class of shares based on the relative proportion of net assets of each class.
3. FAIR VALUATION MEASUREMENTS
Fair value measurements of investments are determined within a framework that has established a fair value hierarchy based upon the various data inputs utilized in determining the value of the Fund’s investments. The three-level hierarchy gives the highest priority to unadjusted quoted prices in active markets for identical assets or liabilities (Level 1) and the lowest priority to unobservable inputs (Level 3). The Fund’s investments are classified within the fair value hierarchy based on the lowest level of input that is significant to the fair value measurement. The inputs are summarized into three broad levels as follows:
| ∎ | Level 1 – quoted prices in active markets for identical securities |
| ∎ | Level 2 – other significant observable inputs (including quoted prices for similar securities, interest rates, prepayment speeds, credit risk, etc.) |
| ∎ | Level 3 – significant unobservable inputs (including the Fund’s own assumptions in determining the fair value of investments) |
The inputs or methodologies used for valuing investments in securities are not necessarily an indication of the risk associated with investing in those securities.
Wells Fargo Large Company Value Fund | 25
Table of Contents
Notes to financial statements
The following is a summary of the inputs used in valuing the Fund’s assets and liabilities as of July 31, 2020:
| Quoted prices (Level 1) | Other significant observable inputs (Level 2) | Significant (Level 3) | Total | |||||||||||||
Assets | ||||||||||||||||
Investments in: | ||||||||||||||||
Common stocks | ||||||||||||||||
Communication services | $ | 26,166,061 | $ | 0 | $ | 0 | $ | 26,166,061 | ||||||||
Consumer discretionary | 11,860,156 | 0 | 0 | 11,860,156 | ||||||||||||
Consumer staples | 18,613,840 | 0 | 0 | 18,613,840 | ||||||||||||
Energy | 4,827,113 | 0 | 0 | 4,827,113 | ||||||||||||
Financials | 23,639,496 | 0 | 0 | 23,639,496 | ||||||||||||
Health care | 34,524,105 | 0 | 0 | 34,524,105 | ||||||||||||
Industrials | 19,443,190 | 0 | 0 | 19,443,190 | ||||||||||||
Information technology | 24,490,219 | 0 | 0 | 24,490,219 | ||||||||||||
Materials | 7,360,481 | 0 | 0 | 7,360,481 | ||||||||||||
Real Estate | 7,803,230 | 0 | 0 | 7,803,230 | ||||||||||||
Utilities | 6,527,814 | 0 | 0 | 6,527,814 | ||||||||||||
Short-term investments | ||||||||||||||||
Investment companies | 2,774,458 | 0 | 0 | 2,774,458 | ||||||||||||
| 188,030,163 | 188,030,163 | |||||||||||||||
Futures contracts | 72,197 | 0 | 0 | 72,197 | ||||||||||||
Total assets | $ | 188,102,360 | $ | 0 | $ | 0 | $ | 188,102,360 | ||||||||
Additional sector, industry or geographic detail is included in the Portfolio of Investments.
Futures contracts are reported at their cumulative unrealized gains (losses) at measurement date as reported in the table following the Portfolio of Investments. For futures contracts, the current day’s variation margin is reported on the Statement of Assets and Liabilities. All other assets and liabilities are reported at their market value at measurement date.
For the year ended July 31, 2020, the Fund did not have any transfers into/out of Level 3.
4. TRANSACTIONS WITH AFFILIATES
Management fee
Funds Management, an indirect wholly owned subsidiary of Wells Fargo & Company (“Wells Fargo”), is the manager of the Fund and provides advisory and fund-level administrative services under an investment management agreement. Under the investment management agreement, Funds Management is responsible for, among other services, implementing the investment objectives and strategies of the Fund, supervising the subadviser and providing fund-level administrative services in connection with the Fund’s operations. As compensation for its services under the investment management agreement, Funds Management is entitled to receive a management fee at the following annual rate based on the Fund’s average daily net assets:
| Average daily net assets | Management fee | |||
First $1 billion | 0.400 | % | ||
Next $4 billion | 0.375 | |||
Next $5 billion | 0.340 | |||
Over $10 billion | 0.330 | |||
For the year ended July 31, 2020, the management fee was equivalent to an annual rate of 0.40% of the Fund’s average daily net assets.
Funds Management has retained the services of a subadviser to provide daily portfolio management to the Fund. The fee for subadvisory services is borne by Funds Management. Wells Capital Management Incorporated (“WellsCap”), an affiliate of Funds Management and an indirect wholly owned subsidiary of Wells Fargo, is the subadviser to the Fund and is entitled to receive a fee from Funds Management at an annual rate starting at 0.25% and declining to 0.15% as the average daily net assets of the Fund increase.
26 | Wells Fargo Large Company Value Fund
Table of Contents
Notes to financial statements
Administration fees
Under a class-level administration agreement, Funds Management provides class-level administrative services to the Fund, which includes paying fees and expenses for services provided by the transfer agent, sub-transfer agents, omnibus account servicers and record-keepers. As compensation for its services under the class-level administration agreement, Funds Management receives an annual fee which is calculated based on the average daily net assets of each class as follows:
| Class-level administration fee | ||||
Class A, Class C | 0.21 | % | ||
Class R6 | 0.03 | |||
Administrator Class, Institutional Class | 0.13 | |||
Waivers and/or expense reimbursements
Funds Management has contractually waived and/or reimbursed management and administration fees to the extent necessary to maintain certain net operating expense ratios for the Fund. When each class of the Fund has exceeded its expense cap, Funds Management has waived fees and/or reimbursed expenses from fund-level expenses on a proportionate basis and then from class specific expenses. When only certain classes exceed their expense caps, waivers and/or reimbursements are applied against class specific expenses before fund-level expenses. Funds Management has committed through November 30, 2020 to waive fees and/or reimburse expenses to the extent necessary to cap the Fund’s expenses at 0.83% for Class A shares, 1.58% for Class C shares, 0.40% for Class R6 shares, 0.75% for Administrator Class shares, and 0.50% for Institutional Class shares. Prior to or after the commitment expiration date, the cap may be increased or the commitment to maintain the cap may be terminated only with the approval of the Board of Trustees.
Distribution fee
The Trust has adopted a distribution plan for Class C shares of the Fund pursuant to Rule 12b-1 under the 1940 Act. A distribution fee is charged to Class C shares and paid to Wells Fargo Funds Distributor, LLC (“Funds Distributor”), the principal underwriter, at an annual rate of 0.75% of the average daily net assets of Class C shares.
In addition, Funds Distributor is entitled to receive the front-end sales charge from the purchase of Class A shares and a contingent deferred sales charge on the redemption of certain Class A shares. Funds Distributor is also entitled to receive the contingent deferred sales charges from redemptions of Class C shares. For the year ended July 31, 2020, Funds Distributor received $1,650 from the sale of Class A shares. No contingent deferred sales charges were incurred by Class A and Class C shares for the year ended July 31, 2020.
Shareholder servicing fees
The Trust has entered into contracts with one or more shareholder servicing agents, whereby Class A, Class C, and Administrator Class of the Fund are charged a fee at an annual rate of 0.25% of the average daily net assets of each respective class. A portion of these total shareholder servicing fees were paid to affiliates of Wells Fargo.
Interfund transactions
The Fund may purchase or sell portfolio investment securities to certain other Wells Fargo affiliates pursuant to Rule 17a-7 under the 1940 Act and under procedures adopted by the Board of Trustees. The procedures have been designed to ensure that these interfund transactions, which do not incur broker commissions, are effected at current market prices.
5. INVESTMENT PORTFOLIO TRANSACTIONS
Purchases and sales of investments, excluding U.S. government obligations (if any) and short-term securities, for the year ended July 31, 2020 were $709,651,675 and $726,554,278, respectively.
6. SECURITIES LENDING TRANSACTIONS
The Fund lends its securities through an unaffiliated securities lending agent and receives collateral in the form of cash or securities with a value at least equal to the value of the securities on loan. The value of the loaned securities is determined at the close of each business day and any increases or decreases in the required collateral are exchanged between the Fund and the counterparty on the next business day. Cash collateral received is invested in the Securities Lending Fund which seeks to provide a positive return compared to the daily Federal Funds Open Rate by investing in high-quality, U.S. dollar-denominated short-term money market instruments and is exempt from registration under Section 3(c)(7) of the 1940 Act. Securities Lending Fund is managed by Funds Management and is subadvised by WellsCap. Funds Management receives an advisory fee starting at 0.05% and declining to 0.01% as the average daily net assets of the Securities Lending Fund increase. All of the fees received by Funds Management are paid to WellsCap for its services as subadviser.
Wells Fargo Large Company Value Fund | 27
Table of Contents
Notes to financial statements
In the event of counterparty default or the failure of a borrower to return a loaned security, the Fund has the right to use the collateral to offset any losses incurred. As of July 31, 2020, the Fund did not have any securities on loan.
7. DERIVATIVE TRANSACTIONS
During the year ended July 31, 2020, the Fund entered into futures contracts to gain market exposure. The Fund had an average notional amount of $3,818,139 in long futures contracts during the year ended July 31, 2020.
The fair value, realized gains or losses and change in unrealized gains or losses, if any, on derivative instruments are reflected in the corresponding financial statement captions.
8. BANK BORROWINGS
The Trust (excluding the money market funds), Wells Fargo Master Trust and Wells Fargo Variable Trust are parties to a $350,000,000 revolving credit agreement whereby the Fund is permitted to use bank borrowings for temporary or emergency purposes, such as to fund shareholder redemption requests. Interest under the credit agreement is charged to the Fund based on a borrowing rate equal to the higher of the Federal Funds rate in effect on that day plus 1.25% or the overnight LIBOR rate in effect on that day plus 1.25%. In addition, an annual commitment fee equal to 0.25% of the unused balance is allocated to each participating fund.
For the year ended July 31, 2020, there were no borrowings by the Fund under the agreement.
9. DISTRIBUTIONS TO SHAREHOLDERS
The tax character of distributions paid during the years ended July 31, 2020 and July 31, 2019 were as follows:
| Year ended July 31 | ||||||||
| 2020 | 2019 | |||||||
Ordinary income | $ | 3,440,629 | $ | 21,161,855 | ||||
Long-term capital gain | 1,092,082 | 6,495,882 | ||||||
As of July 31, 2020, the components of distributable earnings on a tax basis were as follows:
| Undistributed ordinary income | Unrealized | Post-October capital losses deferred | ||
| $416,027 | $14,263,586 | $(8,701,143) | ||
10. INDEMNIFICATION
Under the Fund’s organizational documents, the officers and Trustees have been granted certain indemnification rights against certain liabilities that may arise out of performance of their duties to the Fund. The Fund has entered into a separate agreement with each Trustee that converts indemnification rights currently existing under the Fund’s organizational documents into contractual rights that cannot be changed in the future without the consent of the Trustee. Additionally, in the normal course of business, the Fund may enter into contracts with service providers that contain a variety of indemnification clauses. The Fund’s maximum exposure under these arrangements is dependent on future claims that may be made against the Fund and, therefore, cannot be estimated.
11. NEW ACCOUNTING PRONOUNCEMENT
In August 2018, FASB issued Accounting Standards Update (“ASU”) No. 2018-13, Fair Value Measurement (Topic 820) Disclosure Framework—Changes to the Disclosure Requirements for Fair Value Measurement. ASU 2018-13 updates the disclosure requirements on fair value measurements in Topic 820, Fair Value Measurements. The amendments are effective for fiscal years, and interim periods within those fiscal years, beginning after December 15, 2019. Management has adopted this guidance which did not have a material impact on the financial statements.
28 | Wells Fargo Large Company Value Fund
Table of Contents
Notes to financial statements
12. CORONAVIRUS (COVID-19) PANDEMIC
On March 11, 2020, the World Health Organization announced that it had made the assessment that coronavirus disease 2019 (“COVID-19”) is a pandemic. The impacts of COVID-19 are adversely affecting the entire global economy, individual companies and investment products, and the market in general. There is significant uncertainty around the extent and duration of business disruptions related to COVID-19 and the impacts may be short term or may last for an extended period of time. The risk of further spreading of COVID-19 has led to significant uncertainty and volatility in the financial markets.
Wells Fargo Large Company Value Fund | 29
Table of Contents
Report of independent registered public accounting firm
To the Shareholders of the Fund and Board of Trustees
Wells Fargo Funds Trust:
Opinion on the Financial Statements
We have audited the accompanying statement of assets and liabilities of Wells Fargo Large Company Value Fund (the Fund), one of the funds constituting Wells Fargo Funds Trust, including the portfolio of investments, as of July 31, 2020, the related statement of operations for the year then ended, the statements of changes in net assets for each of the years in the two-year period then ended, and the related notes (collectively, the financial statements) and the financial highlights for each of the years or periods in the five-year period then ended. In our opinion, the financial statements and financial highlights present fairly, in all material respects, the financial position of the Fund as of July 31, 2020, the results of its operations for the year then ended, the changes in its net assets for each of the years in the two-year period then ended, and the financial highlights for each of the years or periods in the five-year period then ended, in conformity with U.S. generally accepted accounting principles.
Basis for Opinion
These financial statements and financial highlights are the responsibility of the Fund’s management. Our responsibility is to express an opinion on these financial statements and financial highlights based on our audits. We are a public accounting firm registered with the Public Company Accounting Oversight Board (United States) (PCAOB) and are required to be independent with respect to the Fund in accordance with the U.S. federal securities laws and the applicable rules and regulations of the Securities and Exchange Commission and the PCAOB.
We conducted our audits in accordance with the standards of the PCAOB. Those standards require that we plan and perform the audit to obtain reasonable assurance about whether the financial statements and financial highlights are free of material misstatement, whether due to error or fraud. Our audits included performing procedures to assess the risks of material misstatement of the financial statements and financial highlights, whether due to error or fraud, and performing procedures that respond to those risks. Such procedures included examining, on a test basis, evidence regarding the amounts and disclosures in the financial statements and financial highlights. Such procedures also included confirmation of securities owned as of July 31, 2020, by correspondence with the custodian, transfer agent and brokers. Our audits also included evaluating the accounting principles used and significant estimates made by management, as well as evaluating the overall presentation of the financial statements and financial highlights. We believe that our audits provide a reasonable basis for our opinion.

We have not been able to determine the specific year that we began serving as the auditor of one or more Wells Fargo Funds investment companies; however we are aware that we have served as the auditor of one or more Wells Fargo Funds investment companies since at least 1955.
Boston, Massachusetts
September 25, 2020
30 | Wells Fargo Large Company Value Fund
Table of Contents
TAX INFORMATION
For corporate shareholders, pursuant to Section 854 of the Internal Revenue Code, 100% of ordinary income dividends qualify for the corporate dividends-received deduction for the fiscal year ended July 31, 2020.
Pursuant to Section 852 of the Internal Revenue Code, $1,092,082 was designated as a 20% rate gain distribution for the fiscal year ended July 31, 2020.
Pursuant to Section 854 of the Internal Revenue Code, $3,440,629 of income dividends paid during the fiscal year ended July 31, 2020, has been designated as qualified dividend income (QDI).
PROXY VOTING INFORMATION
A description of the policies and procedures used to determine how to vote proxies relating to portfolio securities is available, upon request, by calling 1-800-222-8222, visiting our website at wfam.com, or visiting the SEC website at sec.gov. Information regarding how the proxies related to portfolio securities were voted during the most recent 12-month period ended June 30 is available on the website at wfam.com or by visiting the SEC website at sec.gov.
QUARTERLY PORTFOLIO HOLDINGS INFORMATION
The Fund files its complete schedule of portfolio holdings with the SEC for the first and third quarters of each fiscal year as an exhibit to its reports on Form N-PORT. Shareholders may view the filed Form N-PORT by visiting the SEC website at sec.gov.
Wells Fargo Large Company Value Fund | 31
Table of Contents
Other information (unaudited)
BOARD OF TRUSTEES AND OFFICERS
Each of the Trustees and Officers1 listed in the table below acts in identical capacities for each fund in the Wells Fargo family of funds, which consists of 147 mutual funds comprising the Wells Fargo Funds Trust, Wells Fargo Variable Trust, Wells Fargo Master Trust and four closed-end funds (collectively the “Fund Complex”). This table should be read in conjunction with the Prospectus and the Statement of Additional Information2. The mailing address of each Trustee and Officer is 525 Market Street, 12th Floor, San Francisco, CA 94105. Each Trustee and Officer serves an indefinite term, however, each Trustee serves such term until reaching the mandatory retirement age established by the Trustees.
Independent Trustees
Name and year of birth | Position held and length of service* | Principal occupations during past five years or longer | Current other public company or investment company directorships | |||
William R. Ebsworth (Born 1957) | Trustee, since 2015 | Retired. From 1984 to 2013, equities analyst, portfolio manager, research director and chief investment officer at Fidelity Management and Research Company in Boston, Tokyo, and Hong Kong, and retired in 2013 as Chief Investment Officer of Fidelity Strategic Advisers, Inc. where he led a team of investment professionals managing client assets. Prior thereto, Board member of Hong Kong Securities Clearing Co., Hong Kong Options Clearing Corp., the Thailand International Fund, Ltd., Fidelity Investments Life Insurance Company, and Empire Fidelity Investments Life Insurance Company. Audit Committee Chair and Investment Committee Chair of the Vincent Memorial Hospital Endowment (non-profit organization). Mr. Ebsworth is a CFA® charterholder. | N/A | |||
Jane A. Freeman (Born 1953) | Trustee, since 2015; Chair Liaison, since 2018 | Retired. From 2012 to 2014 and 1999 to 2008, Chief Financial Officer of Scientific Learning Corporation. From 2008 to 2012, Ms. Freeman provided consulting services related to strategic business projects. Prior to 1999, Portfolio Manager at Rockefeller & Co. and Scudder, Stevens & Clark. Board member of the Harding Loevner Funds from 1996 to 2014, serving as both Lead Independent Director and chair of the Audit Committee. Board member of the Russell Exchange Traded Funds Trust from 2011 to 2012 and the chair of the Audit Committee. Ms. Freeman is also an inactive Chartered Financial Analyst. | N/A | |||
Isaiah Harris, Jr. (Born 1952) | Trustee, since 2009; Audit Committee Chairman, since 2019 | Retired. Chairman of the Board of CIGNA Corporation since 2009, and Director since 2005. From 2003 to 2011, Director of Deluxe Corporation. Prior thereto, President and CEO of BellSouth Advertising and Publishing Corp. from 2005 to 2007, President and CEO of BellSouth Enterprises from 2004 to 2005 and President of BellSouth Consumer Services from 2000 to 2003. Emeritus member of the Iowa State University Foundation Board of Governors. Emeritus Member of the Advisory Board of Iowa State University School of Business. Advisory Board Member, Palm Harbor Academy (private school). Advisory Board Member, Child Evangelism Fellowship (non-profit). Mr. Harris is a certified public accountant (inactive status). | CIGNA Corporation | |||
Judith M. Johnson (Born 1949) | Trustee, since 2008; Audit Committee Chairman, from 2009 to 2018 | Retired. Prior thereto, Chief Executive Officer and Chief Investment Officer of Minneapolis Employees Retirement Fund from 1996 to 2008. Ms. Johnson is an attorney, certified public accountant and a certified managerial accountant. | N/A | |||
32 | Wells Fargo Large Company Value Fund
Table of Contents
Other information (unaudited)
Name and year of birth | Position held and length of service* | Principal occupations during past five years or longer | Current other public company or investment company directorships | |||
David F. Larcker (Born 1950) | Trustee, since 2009 | James Irvin Miller Professor of Accounting at the Graduate School of Business, Stanford University, Director of the Corporate Governance Research Initiative and Senior Faculty of The Rock Center for Corporate Governance since 2006. From 2005 to 2008, Professor of Accounting at the Graduate School of Business, Stanford University. Prior thereto, Ernst & Young Professor of Accounting at The Wharton School, University of Pennsylvania from 1985 to 2005. | N/A | |||
Olivia S. Mitchell (Born 1953) | Trustee, since 2006; Nominating and Governance Committee Chair, since 2018 | International Foundation of Employee Benefit Plans Professor, Wharton School of the University of Pennsylvania since 1993. Director of Wharton’s Pension Research Council and Boettner Center on Pensions & Retirement Research, and Research Associate at the National Bureau of Economic Research. Previously, Cornell University Professor from 1978 to 1993. | N/A | |||
Timothy J. Penny (Born 1951) | Trustee, since 1996; Chairman, since 2018 | President and Chief Executive Officer of Southern Minnesota Initiative Foundation, a non-profit organization, since 2007. Member of the Board of Trustees of NorthStar Education Finance, Inc., a non-profit organization, since 2007. | N/A | |||
James G. Polisson (Born 1959) | Trustee, since 2018 | Retired. Chief Marketing Officer, Source (ETF) UK Services, Ltd, from 2015 to 2017. From 2012 to 2015, Principal of The Polisson Group, LLC, a management consulting, corporate advisory and principal investing company. Chief Executive Officer and Managing Director at Russell Investments, Global Exchange Traded Funds from 2010 to 2012. Managing Director of Barclays Global Investors from 1998 to 2010 and Global Chief Marketing Officer for iShares and Barclays Global Investors from 2000 to 2010. Trustee of the San Francisco Mechanics’ Institute, a non-profit organization, from 2013 to 2015. Board member of the Russell Exchange Traded Fund Trust from 2011 to 2012. Director of Barclays Global Investors Holdings Deutschland GmbH from 2006 to 2009. Mr. Polisson is an attorney and has a retired status with the Massachusetts and District of Columbia Bar Associations. | N/A | |||
Pamela Wheelock (Born 1959) | Trustee, since January 2020; previously Trustee from January 2018 to July 2019 | Board member of the Destination Medical Center Economic Development Agency, Rochester, Minnesota since 2019 and Interim President of the McKnight Foundation since 2020. Acting Commissioner, Minnesota Department of Human Services, July 2019 through September 2019. Human Services Manager (part-time), Minnesota Department of Human Services, October 2019 through December 2019. Chief Operating Officer, Twin Cities Habitat for Humanity from 2017 to 2019. Vice President of University Services, University of Minnesota from 2012 to 2016. Prior thereto, on the Board of Directors, Governance Committee and Finance Committee for the Minnesota Philanthropy Partners (Saint Paul Foundation) from 2012 to 2018, Interim Chief Executive Officer of Blue Cross Blue Shield of Minnesota from 2011 to 2012, Chairman of the Board from 2009 to 2012 and Board Director from 2003 to 2015. Vice President, Leadership and Community Engagement, Bush Foundation, Saint Paul, Minnesota (a private foundation) from 2009 to 2011. Executive Vice President and Chief Financial Officer, Minnesota Sports and Entertainment from 2004 to 2009 and Senior Vice President from 2002 to 2004. Executive Vice President of the Minnesota Wild Foundation from 2004 to 2008. Commissioner of Finance, State of Minnesota, from 1999 to 2002. Currently Board Chair of the Minnesota Wild Foundation since 2010. | N/A | |||
| * | Length of service dates reflect the Trustee’s commencement of service with the Trust’s predecessor entities, where applicable. |
Wells Fargo Large Company Value Fund | 33
Table of Contents
Other information (unaudited)
Officers
Name and year of birth | Position held and length of service | Principal occupations during past five years or longer | ||
Andrew Owen (Born 1960) | President, since 2017 | Executive Vice President of Wells Fargo & Company and Head of Affiliated Managers, Wells Fargo Asset Management, since 2014. In addition, Mr. Owen is currently President, Chief Executive Officer and Director of Wells Fargo Funds Management, LLC since 2017. Prior thereto, Executive Vice President responsible for marketing, investments and product development for Wells Fargo Funds Management, LLC, from 2009 to 2014. | ||
Jeremy DePalma1 (Born 1974) | Treasurer, since 2012 | Senior Vice President of Wells Fargo Funds Management, LLC since 2009. Senior Vice President of Evergreen Investment Management Company, LLC from 2008 to 2010 and head of the Fund Reporting and Control Team within Fund Administration from 2005 to 2010. | ||
Michelle Rhee (Born 1966) | Chief Legal Officer, since 2019 | Secretary of Wells Fargo Funds Management, LLC, Chief Legal Counsel of Wells Fargo Asset Management and Assistant General Counsel of Wells Fargo Bank, N.A. since 2018. Associate General Counsel and Managing Director of Bank of America Corporation from 2004 to 2018. | ||
Catherine Kennedy (Born 1969) | Secretary, since 2019 | Vice President of Wells Fargo Funds Management, LLC and Senior Counsel of the Wells Fargo Legal Department since 2010. Vice President and Senior Counsel of Evergreen Investment Management Company, LLC from 1998 to 2010. | ||
Michael H. Whitaker (Born 1967) | Chief Compliance Officer, since 2016 | Chief Compliance Officer of Wells Fargo Asset Management since 2016. Senior Vice President and Chief Compliance Officer for Fidelity Investments from 2007 to 2016. | ||
David Berardi (Born 1975) | Assistant Treasurer, since 2009 | Vice President of Wells Fargo Funds Management, LLC since 2009. Vice President of Evergreen Investment Management Company, LLC from 2008 to 2010. Manager of Fund Reporting and Control for Evergreen Investment Management Company, LLC from 2004 to 2010. | ||
| 1 | Jeremy DePalma acts as Treasurer of 82 funds and Assistant Treasurer of 65 funds in the Fund Complex. |
| 2 | The Statement of Additional Information includes additional information about the Trustees and is available, without charge, upon request, by calling 1-800-222-8222 or by visiting the website at wfam.com. |
34 | Wells Fargo Large Company Value Fund
Table of Contents
Other information (unaudited)
BOARD CONSIDERATION OF INVESTMENT MANAGEMENT AND SUB-ADVISORY AGREEMENTS:
Wells Fargo Large Company Value Fund
Under the Investment Company Act of 1940 (the “1940 Act”), the Board of Trustees (the “Board”) of Wells Fargo Funds Trust (the “Trust”) must determine annually whether to approve the continuation of the Trust’s investment management and sub-advisory agreements. In this regard, at a Board meeting held on May 26, 2020 and May 28, 2020 (together, the “Meeting”), the Board, all the members of which have no direct or indirect interest in the investment management and sub-advisory agreements and are not “interested persons” of the Trust, as defined in the 1940 Act (the “Independent Trustees”), reviewed and approved for Wells Fargo Large Company Value Fund (the “Fund”): (i) an investment management agreement (the “Management Agreement”) with Wells Fargo Funds Management, LLC (“Funds Management”); and (ii) an investment sub-advisory agreement (the “Sub-Advisory Agreement”) with Wells Capital Management Incorporated (the “Sub-Adviser”), an affiliate of Funds Management. The Management Agreement and the Sub-Advisory Agreement are collectively referred to as the “Advisory Agreements.”
At the Meeting, the Board considered the factors and reached the conclusions described below relating to the selection of Funds Management and the Sub-Adviser and the approval of the Advisory Agreements. Prior to the Meeting, including at a Board meeting held in April 2020, the Trustees conferred extensively among themselves and with representatives of Funds Management about these matters. Also, the Board has adopted a team-based approach, with each team consisting of a sub-set of Trustees, to assist the full Board in the discharge of its duties in reviewing investment performance and other matters throughout the year. The Independent Trustees were assisted in their evaluation of the Advisory Agreements by independent legal counsel, from whom they received separate legal advice and with whom they met separately.
In providing information to the Board, Funds Management and the Sub-Adviser were guided by a detailed set of requests for information submitted to them by independent legal counsel on behalf of the Independent Trustees at the start of the Board’s annual contract renewal process earlier in 2020. In considering and approving the Advisory Agreements, the Trustees considered the information they believed relevant, including but not limited to the information discussed below. The Board considered not only the specific information presented in connection with the Meeting, but also the knowledge gained over time through interaction with Funds Management and the Sub-Adviser about various topics. In this regard, the Board reviewed reports of Funds Management at each of its quarterly meetings, which included, among other things, portfolio reviews and investment performance reports. In addition, the Board and the teams mentioned above confer with portfolio managers at various times throughout the year. The Board did not identify any particular information or consideration that was all-important or controlling, and each individual Trustee may have attributed different weights to various factors.
After its deliberations, the Board unanimously approved the continuation of the Advisory Agreements for a one-year term and determined that the compensation payable to Funds Management and the Sub-Adviser under each of the Advisory Agreements was reasonable. The Board considered the approval of the Advisory Agreements for the Fund as part of its consideration of agreements for funds across the complex, but its approvals were made on a fund-by-fund basis.
The following summarizes a number of important, but not necessarily all, factors considered by the Board in support of its approvals.
Nature, extent and quality of services
The Board received and considered various information regarding the nature, extent and quality of services provided to the Fund by Funds Management and the Sub-Adviser under the Advisory Agreements. This information included a description of the investment advisory services and Fund-level administrative services covered by the Management Agreement, as well as, among other things, a summary of the background and experience of senior management of Wells Fargo Asset Management (“WFAM”), of which Funds Management and the Sub-Adviser are a part, and a summary of investments made in the business of WFAM. The Board also received a description of Funds Management’s and the Sub-Adviser’s business continuity plans and of their approaches to data privacy and cybersecurity, and related testing. The Board also received and reviewed information about Funds Management’s role as administrator of the Fund’s liquidity risk management program, Funds Management’s approach to risk management, and Funds Management’s intermediary and vendor oversight program.
The Board also considered the qualifications, background, tenure and responsibilities of each of the portfolio managers primarily responsible for the day-to-day portfolio management of the Fund. The Board evaluated the ability of Funds Management and the Sub-Adviser to attract and retain qualified investment professionals, including research, advisory and supervisory personnel. The Board further considered the compliance programs and compliance records of Funds Management and the Sub-Adviser. In addition, the Board took into account the full range of services provided to the Fund by Funds Management and its affiliates.
Wells Fargo Large Company Value Fund | 35
Table of Contents
Other information (unaudited)
Fund investment performance and expenses
The Board considered the investment performance results for the Fund over various time periods ended December 31, 2019. The Board also considered more current results for various time periods ended March 31, 2020. The Board considered these results in comparison to the investment performance of funds in a universe that was determined by Broadridge Inc. (“Broadridge”) to be similar to the Fund (the “Universe”), and in comparison to the Fund’s benchmark index and to other comparative data. Broadridge is an independent provider of investment company data. The Board received a description of the methodology used by Broadridge to select the mutual funds in the performance Universe. The Board noted that the investment performance of the Fund (Administrator Class) was lower than the average investment performance of the Universe for the one-, five- and ten-year periods ended December 31, 2019, and in range of the average investment performance of the Universe for the three-year period ended December 31, 2019. The Board also noted that the investment performance of the Fund (Administrator Class) was higher than the average investment performance of the Universe for all periods ended March 31, 2020. The Board also noted that the investment performance of the Fund was lower than its benchmark index, the Russell 1000® Value Index, for all periods ended December 31, 2019. The Board also noted that the investment performance of the Fund was higher than or in range of its benchmark index, the Russell 1000® Value Index, for the one- and three- year periods ended March 31, 2020, and lower than its benchmark index for the five- and ten-year periods ended March 31, 2020.
The Board received information concerning, and discussed factors contributing to, the underperformance of the Fund relative to the Universe and benchmark for the periods identified above. The Board took note of the explanations for the relative underperformance during these periods, including with respect to investment decisions and market factors that affected the Fund’s investment performance.
The Board also received and considered information regarding the Fund’s net operating expense ratios and their various components, including actual management fees, custodian and other non-management fees, and Rule 12b-1 and non-Rule 12b-1 shareholder service fees. The Board considered these ratios in comparison to the median ratios of funds in class-specific expense groups that were determined by Broadridge to be similar to the Fund (the “Groups”). The Board received a description of the methodology used by Broadridge to select the mutual funds in the expense Groups and an explanation of how funds comprising expense groups and their expense ratios may vary from year-to-year. Based on the Broadridge reports, the Board noted that the net operating expense ratios of the Fund were lower than the median net operating expense ratios of the expense Groups for all share classes.
The Board took into account the Fund’s investment performance and expense information provided to it among the factors considered in deciding to re-approve the Advisory Agreements.
Investment management and sub-advisory fee rates
The Board reviewed and considered the contractual fee rates payable by the Fund to Funds Management under the Management Agreement, as well as the contractual fee rates payable by the Fund to Funds Management for class-level administrative services under a Class-Level Administration Agreement, which include, among other things, class-level transfer agency and sub-transfer agency costs (collectively, the “Management Rates”). The Board also reviewed and considered the contractual investment sub-advisory fee rates that are payable by Funds Management to the Sub-Adviser for investment sub-advisory services.
Among other information reviewed by the Board was a comparison of the Fund’s Management Rates with the average contractual investment management fee rates of funds in the expense Groups at a common asset level as well as transfer agency costs of the funds in the expense Groups. The Board noted that the Management Rates of the Fund were in range of the sum of these average rates for the Fund’s expense Groups for all share classes.
The Board also received and considered information about the portion of the total management fee that was retained by Funds Management after payment of the fee to the Sub-Adviser for sub-advisory services. In assessing the reasonableness of this amount, the Board received and evaluated information about the nature and extent of responsibilities retained and risks assumed by Funds Management and not delegated to or assumed by the Sub-Adviser, and about Funds Management’s on-going oversight services. Given the affiliation between Funds Management and the Sub-Adviser, the Board ascribed limited relevance to the allocation of fees between them.
The Board also received and considered information about the nature and extent of services offered and fee rates charged by Funds Management and the Sub-Adviser to other types of clients with investment strategies similar to those of the Fund. In this regard, the Board received information about the significantly greater scope of services, and compliance, reporting and other legal burdens and risks of managing proprietary mutual funds compared with those associated with managing assets of other types of clients, including third-party sub-advised fund clients and non-mutual fund clients such as institutional separate accounts.
36 | Wells Fargo Large Company Value Fund
Table of Contents
Other information (unaudited)
Based on its consideration of the factors and information it deemed relevant, including those described here, the Board determined that the compensation payable to Funds Management under the Management Agreement and to the Sub-Adviser under the Sub-Advisory Agreement was reasonable.
Profitability
The Board received and considered information concerning the profitability of Funds Management, as well as the profitability of both WFAM and Wells Fargo & Co. (“Wells Fargo”) from providing services to the fund family as a whole. The Board noted that the Sub-Adviser’s profitability information with respect to providing services to the Fund and other funds in the family was subsumed in the WFAM and Wells Fargo profitability analysis.
Funds Management reported on the methodologies and estimates used in calculating profitability, including a description of the methodology used to allocate certain expenses. Among other things, the Board noted that the levels of profitability reported on a fund-by-fund basis varied widely, depending on factors such as the size, type and age of fund.
Based on its review, the Board did not deem the profits reported by Funds Management, WFAM or Wells Fargo from services provided to the Fund to be at a level that would prevent it from approving the continuation of the Advisory Agreements.
Economies of scale
The Board received and considered information about the potential for Funds Management to experience economies of scale in the provision of management services to the Fund, the difficulties of calculating economies of scale at an individual fund level, and the extent to which potential scale benefits are shared with shareholders. The Board noted the existence of breakpoints in the Fund’s management fee structure, which operate generally to reduce the Fund’s expense ratios as the Fund grows in size, and the size of the Fund in relation to such breakpoints. The Board considered that in addition to management fee breakpoints, Funds Management shares potential economies of scale from its management business in a variety of ways, including through fee waiver and expense reimbursement arrangements, services that benefit shareholders, competitive management fee rates set at the outset without regard to breakpoints, and investments in the business intended to enhance services available to shareholders.
The Board concluded that Funds Management’s arrangements with respect to the Fund, including contractual breakpoints, constituted a reasonable approach to sharing potential economies of scale with the Fund and its shareholders.
Other benefits to Funds Management and the Sub-Adviser
The Board received and considered information regarding potential “fall-out” or ancillary benefits received by Funds Management and its affiliates, including the Sub-Adviser, as a result of their relationships with the Fund. Ancillary benefits could include, among others, benefits directly attributable to other relationships with the Fund and benefits potentially derived from an increase in Funds Management’s and the Sub-Adviser’s business as a result of their relationships with the Fund. The Board noted that various affiliates of Funds Management may receive distribution-related fees, shareholder servicing payments and sub-transfer agency fees in respect of shares sold or held through them and services provided.
The Board also reviewed information about soft dollar credits earned and utilized by the Sub-Adviser, fees earned by Funds Management and the Sub-Adviser from managing a private investment vehicle for the fund family’s securities lending collateral, and commissions earned by an affiliated broker from portfolio transactions.
Based on its consideration of the factors and information it deemed relevant, including those described here, the Board did not find that any ancillary benefits received by Funds Management and its affiliates, including the Sub-Adviser, were unreasonable.
Conclusion
At the Meeting, after considering the above-described factors and based on its deliberations and its evaluation of the information described above, the Board unanimously approved the continuation of the Advisory Agreements for a one-year term and determined that the compensation payable to Funds Management and the Sub-Adviser under each of the Advisory Agreements was reasonable.
Wells Fargo Large Company Value Fund | 37
Table of Contents
Other information (unaudited)
LIQUIDITY RISK MANAGEMENT PROGRAM
In accordance with Rule 22e-4 under the Investment Company Act of 1940, as amended (the “Liquidity Rule”), Wells Fargo Funds Trust (the “Trust”) has adopted and implemented a liquidity risk management program (the “Program”) on behalf of each of its series, including the Fund, which is reasonably designed to assess and manage the Fund’s liquidity risk. “Liquidity risk” is defined as the risk that the Fund is unable to meet redemption requests without significantly diluting remaining investors’ interests in the Fund. The Trust’s Board of Trustees (the “Board”) previously approved the designation of Wells Fargo Funds Management, LLC (“Funds Management”), the Fund’s investment manager, as the administrator of the Program, and Funds Management has established a Liquidity Risk Management Council composed of personnel from multiple departments within Funds Management and its affiliates to assist Funds Management in the implementation and on-going administration of the Program.
The Program is comprised of various components designed to support the assessment and/or management of liquidity risk, including: (1) the periodic assessment (no less frequently than annually) of certain factors that influence the Fund’s liquidity risk; (2) the periodic classification (no less frequently than monthly) of the Fund’s investments into one of four liquidity categories that reflect an estimate of their liquidity under current market conditions; (3) a 15% limit on the acquisition of “illiquid investments” (as defined under the Liquidity Rule); (4) to the extent the Fund does not invest primarily in “highly liquid investments” (as defined under the Liquidity Rule), the determination of a minimum percentage of the Fund’s assets that generally will be invested in highly liquid investments (an “HLIM”); (5) if the Fund has established an HLIM, the periodic review (no less frequently than annually) of the HLIM and the adoption of policies and procedures for responding to a shortfall of the Fund’s “highly liquid investments” below its HLIM; and (6) periodic reporting to the Board.
At a meeting of the Board held on May 26 and 28, 2020, the Board received a written report (the “Report”) from Funds Management that addressed the operation of the Program and assessed its adequacy and effectiveness of implementation. The Report covered the initial period from December 1, 2018 through December 31, 2019 (the “Reporting Period”). No significant liquidity events impacting the Fund were noted in the Report. There were no material changes to the Program during the Reporting Period. The Report concluded that the Program is operating effectively to assess and manage the Fund’s liquidity risk, and that the Program has been and continues to be adequately and effectively implemented to monitor and, as applicable, respond to the Fund’s liquidity developments.
There can be no assurance that the Program will achieve its objectives under all circumstances in the future. Please refer to the Fund’s prospectus for more information regarding the Fund’s exposure to liquidity risk and other risks to which an investment in the Fund may be subject.
38 | Wells Fargo Large Company Value Fund
Table of Contents
Effective on or after May 1, 2020, clients of Edward Jones (also referred to as “shareholders”) purchasing Fund shares on the Edward Jones commission and fee-based platforms are eligible only for the following sales charge discounts (also referred to as “breakpoints”) and waivers, which can differ from breakpoints and waivers described elsewhere in the Fund’s Prospectus or SAI or through another broker-dealer. In all instances, it is the shareholder’s responsibility to inform Edward Jones at the time of purchase of any relationship, holdings of Wells Fargo Funds or other facts qualifying the purchaser for breakpoints or waivers. Edward Jones can ask for documentation of such circumstance.
| Breakpoints available at Edward Jones |
| Rights of Accumulation (ROA) |
The applicable sales charge on a purchase of Class A shares is determined by taking into account all share classes (except any money market funds and retirement plan share classes) of Wells Fargo Funds held by the shareholder or in an account grouped by Edward Jones with other accounts for the purpose of providing certain pricing considerations (“pricing groups”). This includes all share classes held on the Edward Jones platform and/or held on another platform. The inclusion of eligible fund family assets in the rights of accumulation calculation is dependent on the shareholder notifying his or her financial advisor of such assets at the time of calculation. |
ROA is determined by calculating the higher of cost or market value (current shares x NAV). |
| Letter of Intent (LOI) |
Through a LOI, shareholders can receive the sales charge and breakpoint discounts for purchases shareholders intend to makeover a 13-month period from the date Edward Jones receives the LOI. The LOI is determined by calculating the higher of cost or market value of qualifying holdings at LOI initiation in combination with the value that the shareholder intends to buy over a 13-month period to calculate the front-end sales charge and any breakpoint discounts. Each purchase the shareholder makes during that 13-month period will receive the sales charge and breakpoint discount that applies to the total amount. The inclusion of eligible fund family assets in the LOI calculation is dependent on the shareholder notifying his or her financial advisor of such assets at the time of calculation. Purchases made before the LOI is received by Edward Jones are not covered under the LOI and will not reduce the sales charge previously paid. Sales charges will be adjusted if LOI is not met. |
| Sales charges are waived for the following shareholders and in the following situations at Edward Jones: |
● Associates of Edward Jones and its affiliates and their family members who are in the same pricing group (as determined by Edward Jones under its policies and procedures) as the associate. This waiver will continue for the remainder of the associate’s life if the associate retires from Edward Jones in good-standing. |
● Shares purchased in an Edward Jones fee-based program. |
● Shares purchased through reinvestment of capital gains distributions and dividend reinvestment. |
● Shares purchased from the proceeds of redeemed shares of the same fund family so long as the following conditions are met: 1) the proceeds are from the sale of shares within 60 days of the purchase, and 2) the sale and purchase are made in the same share class and the same account or the purchase is made in an individual retirement account with proceeds from liquidations in a non-retirement account. |
● Shares exchanged into Class A shares from another share class so long as the exchange is into the same fund and was initiated at the discretion of Edward Jones. Edward Jones is responsible for any remaining CDSC due to the fund company, if applicable. Any future purchases are subject to the applicable sales charge as disclosed in the prospectus. |
● Exchanges from Class C shares to Class A shares of the same fund, generally, in the 84th month following the anniversary of the purchase date or earlier at the discretion of Edward Jones. |
| If the shareholder purchases shares that are subject to a CDSC and those shares are redeemed before the CDSC is expired, the shareholder is responsible to pay the CDSC except in the following conditions available at Edward Jones: |
● The death or disability of the shareholder. |
● Systematic withdrawals with up to 10% per year of the account value. |
● Return of excess contributions from an Individual Retirement Account (IRA). |
● Shares sold as part of a required minimum distribution for IRA and retirement accounts if the redemption is taken in or after the year the shareholder reaches qualified age based on applicable IRS regulation. |
● Shares sold to pay Edward Jones fees or costs in such cases where the transaction is initiated by Edward Jones. |
● Shares exchanged in an Edward Jones fee-based program. |
● Shares acquired through NAV reinstatement. |
Wells Fargo Large Company Value Fund | 39
Table of Contents
Appendix I (unaudited)
| Other Important Information for accounts at Edward Jones: |
| Minimum Purchase Amounts |
● $250 initial purchase minimum |
● $50 subsequent purchase minimum |
| Minimum Balances |
| Edward Jones has the right to redeem at its discretion fund holdings with a balance of $250 or less. The following are examples of accounts that are not included in this policy: |
● A fee-based account held on an Edward Jones platform |
● A 529 account held on an Edward Jones platform |
● An account with an active systematic investment plan or letter of intent (LOI) |
| Changing Share Classes |
| At any time it deems necessary, Edward Jones has the authority to exchange at NAV a shareholder’s holdings in a fund to Class A shares. |
40 | Wells Fargo Large Company Value Fund
Table of Contents
Effective June 1, 2020, shareholders purchasing Fund shares through an Oppenheimer & Co. Inc. (“Oppenheimer”) platform or account are eligible only for the following load waivers (front-end sales charge waivers and contingent deferred or back-end, sales charge waivers) and discounts, which may differ from those disclosed in the Fund’s Prospectus or SAI.
| Front-end Sales Load Waivers on Class A Shares available at Oppenheimer |
| Employer-sponsored retirement, deferred compensation and employee benefit plans (including health savings accounts) and trusts used to fund those plans, provided that the shares are not held in a commission-based brokerage account and shares are held for the benefit of the plan. |
| Shares purchased by or through a 529 Plan. |
| Shares purchased through an Oppenheimer affiliated investment advisory program. |
| Shares purchased through reinvestment of capital gains distributions and dividend reinvestment when purchasing shares of the same fund (but not any other fund within the fund family). |
| Shares purchased from the proceeds of redemptions within the same fund family, provided (1) the repurchase occurs within 90 days following the redemption, (2) the redemption and purchase occur in the same account, and (3) redeemed shares were subject to a front-end or deferred sales load (known as Rights of Restatement). |
| A shareholder in the Fund’s Class C shares will have their shares exchanged at net asset value to Class A shares (or the appropriate share class) of the Fund if the shares are no longer subject to a CDSC and the exchange is in line with the policies and procedures of Oppenheimer. |
| Employees and registered representatives of Oppenheimer or its affiliates and their family members. |
| Directors or Trustees of the Fund, and employees of the Fund’s investment adviser or any of its affiliates, as described in the Prospectus. |
| CDSC Waivers on A and C Shares available at Oppenheimer |
| Death or disability of the shareholder. |
| Shares sold as part of a systematic withdrawal plan as described in the Prospectus. |
| Return of excess contributions from an IRA Account. |
| Shares sold as part of a required minimum distribution for IRA and retirement accounts due to the shareholder reaching the qualified age based on applicable IRS regulations as described in the Prospectus. |
| Shares sold to pay Oppenheimer fees but only if the transaction is initiated by Oppenheimer. |
| Shares acquired through a right of reinstatement. |
| Front-end load Discounts Available at Oppenheimer: Breakpoints, Rights of Accumulation & Letters of Intent |
| Breakpoints as described in the Prospectus. |
| Rights of Accumulation (ROA), which entitle shareholders to breakpoint discounts, will be automatically calculated based on the aggregated holding of fund family assets held by accounts within the purchaser’s household at Oppenheimer. Eligible fund family assets not held at Oppenheimer may be included in the ROA calculation only if the shareholder notifies his or her financial advisor about such assets. |
Wells Fargo Large Company Value Fund | 41
Table of Contents
Effective June 15, 2020, shareholders purchasing fund shares through a Robert W. Baird & Co. (“Baird”) platform or account will only be eligible for the following sales charge waivers (front-end sales charge waivers and CDSC waivers) and discounts, which may differ from those disclosed elsewhere in the Fund’s Prospectus or the SAI.
| Front-end Sales Load Waivers on Class A Shares available at Baird |
| Shares purchased through reinvestment of capital gains distributions and dividend reinvestment when purchasing share of the same fund. |
| Share purchase by employees and registers representatives of Baird or its affiliate and their family members as designated by Baird. |
| Shares purchase from the proceeds of redemptions within the same fund family, provided (1) the repurchase occurs within 90 days following the redemption, (2) the redemption and purchase occur in the same accounts, and (3) redeemed shares were subject to a front-end or deferred sales charge (known as rights of reinstatement). |
| A shareholder in the Funds Investor C Shares will have their share exchanged at net asset value to Investor A shares of the fund if the shares are no longer subject to CDSC and the exchange is in line with the policies and procedures of Baird. |
| Employer-sponsored retirement plans or charitable accounts in a transactional brokerage account at Baird, including 401(k) plans, 457 plans, employer-sponsored 403(b) plans, profit sharing and money purchase pension plans and defined benefit plans. For purposes of this provision, employer-sponsored retirement plans do not include SEP IRAs, Simple IRAs or SAR-SEPs. |
| CDSC Waivers on A and C Shares available at Baird |
| Shares sold due to death or disability of the shareholder. |
| Shares sold as part of a systematic withdrawal plan as described in the Fund’s Prospectus. |
| Shares bought due to returns of excess contributions from an IRA Account. |
| Shares sold as part of a required minimum distribution for IRA and retirement accounts due to the shareholder reaching age 72 as described in the Fund’s Prospectus. |
| Shares sold to pay Baird fees but only if the transaction is initiated by Baird. |
| Shares acquired through a right of reinstatement. |
| Front-end load Discounts Available at Baird: Breakpoint and/or Rights of Accumulation |
| Breakpoints as described in the Prospectus. |
| Rights of accumulations which entitles shareholders to breakpoint discounts will be automatically calculated based on the aggregated holding of fund family assets held by accounts within the purchaser’s household at Baird. Eligible fund family assets not held at Baird may be included in the rights of accumulations calculation only if the shareholder notifies his or her financial advisor about such assets. |
| Letters of Intent (LOI) allow for breakpoint discounts based on anticipated purchases within a fund family through Baird, over a 13-month period of time. |
42 | Wells Fargo Large Company Value Fund
Table of Contents
This page is intentionally left blank.
Table of Contents
This page is intentionally left blank.
Table of Contents
For more information
More information about Wells Fargo Funds is available free upon request. To obtain literature, please write, visit the Fund’s website, or call:
Wells Fargo Funds
P.O. Box 219967
Kansas City, MO 64121-9967
Website: wfam.com
Individual investors: 1-800-222-8222
Retail investment professionals: 1-888-877-9275
Institutional investment professionals: 1-866-765-0778

This report and the financial statements contained herein are submitted for the general information of the shareholders of the Fund. If this report is used for promotional purposes, distribution of the report must be accompanied or preceded by a current prospectus. Before investing, please consider the investment objectives, risks, charges, and expenses of the investment. For a current prospectus and, if available, a summary prospectus, containing this information, call 1-800-222-8222 or visit the Fund’s website at wfam.com. Read the prospectus carefully before you invest or send money.
Wells Fargo Asset Management (WFAM) is the trade name for certain investment advisory/management firms owned by Wells Fargo & Company. These firms include but are not limited to Wells Capital Management Incorporated and Wells Fargo Funds Management, LLC. Certain products managed by WFAM entities are distributed by Wells Fargo Funds Distributor, LLC (a broker-dealer and Member FINRA).
This material is for general informational and educational purposes only and is NOT intended to provide investment advice or a recommendation of any kind—including a recommendation for any specific investment, strategy, or plan.
INVESTMENT PRODUCTS: NOT FDIC INSURED ◾ NO BANK GUARANTEE ◾ MAY LOSE VALUE
© 2020 Wells Fargo & Company. All rights reserved
PAR-0820-01040 09-20
A210/AR210 07-20
Table of Contents

Annual Report
July 31, 2020
Wells Fargo
Low Volatility U.S. Equity Fund
Beginning on January 1, 2021, as permitted by new regulations adopted by the Securities and Exchange Commission, paper copies of the Wells Fargo Funds’ annual and semi-annual shareholder reports issued after this date will no longer be sent by mail, unless you specifically request paper copies of the reports. Instead, the reports will be made available on the Funds’ website, and you will be notified by mail each time a report is posted and provided with a website address to access the report.
If you already elected to receive shareholder reports electronically, you will not be affected by this change and you need not take any action. You may elect to receive shareholder reports and other communications from the Fund electronically at any time by contacting your financial intermediary (such as a broker-dealer or bank) or, if you are a direct investor, by calling 1-800-222-8222 or by enrolling at wellsfargo.com/advantagedelivery.
You may elect to receive all future reports in paper free of charge. If you invest through a financial intermediary, you can contact your financial intermediary to request that you continue to receive paper copies of your shareholder reports; if you invest directly with the Fund, you can call 1-800-222-8222. Your election to receive reports in paper will apply to all Wells Fargo Funds held in your account with your financial intermediary or, if you are a direct investor, to all Wells Fargo Funds that you hold.
Table of Contents
|
Reduce clutter. Save trees. |
Sign up for electronic delivery of prospectuses and shareholder reports at wellsfargo.com/advantagedelivery |
The views expressed and any forward-looking statements are as of July 31, 2020, unless otherwise noted, and are those of the Fund managers and/or Wells Fargo Asset Management. Discussions of individual securities, or the markets generally, or any Wells Fargo Fund are not intended as individual recommendations. Future events or results may vary significantly from those expressed in any forward-looking statements. The views expressed are subject to change at any time in response to changing circumstances in the market. Wells Fargo Asset Management and the Fund disclaim any obligation to publicly update or revise any views expressed or forward-looking statements.
INVESTMENT PRODUCTS: NOT FDIC INSURED ◾ NO BANK GUARANTEE ◾ MAY LOSE VALUE
Wells Fargo Low Volatility U.S. Equity Fund | 1
Table of Contents
Letter to shareholders (unaudited)

Andrew Owen
President
Wells Fargo Funds
Dear Shareholder:
We are pleased to offer you this annual report for the Wells Fargo Low Volatility U.S. Equity Fund for the 12-month period that ended July 31, 2020. Global stock markets saw earlier gains erased in February and March as governments around the world took unprecedented measures, attempting to stop the spread of the coronavirus at the expense of short-term economic output. However, markets rebounded from April on to offset much of the losses as central banks attempted to bolster capital markets and confidence. Fixed-income markets generally performed well overall, achieving widespread gains. Overall, U.S. stocks surpassed their international peers, while U.S. large-cap equity, as measured by the Russell 1000® Index1, easily outperformed small caps, as measured by the Russell 2000® Index2, for the 12-month period that began last August.
For the 12-month period, fixed-income securities generally had positive total returns while non-U.S. developed market equities had the weakest performance and U.S. stocks performed strongly despite sharp volatility in the late winter and early spring. For the period, U.S. stocks, based on the S&P 500 Index,3 gained 11.96%. International stocks, as measured by the MSCI ACWI ex USA Index (Net),4 returned 0.66%, while the MSCI EM Index (Net)5 had somewhat stronger performance, with a 6.55% gain. For bond investors, the Bloomberg Barclays U.S. Aggregate Bond Index6 returned a robust 10.12%, the Bloomberg Barclays Global Aggregate ex-USD Index7 gained a more modest 5.94%, and the Bloomberg Barclays Municipal Bond Index8 gained 5.36% while the ICE BofA U.S. High Yield Index9 returned 3.10%.
The fiscal year began with supportive central bank actions.
The period began with unresolved U.S.-China trade tensions showing no signs of compromise in August 2019. Evidence of a continued global economic slowdown mounted, and central banks in China, New Zealand, and Thailand cut interest rates after the U.S. Federal Reserve (Fed) had done so in late July. Industrial and manufacturing data declined in China, Canada, Japan, and Germany. Adding to global uncertainty, Italy’s prime minister resigned, many feared a crackdown in Hong Kong as protestors sustained their calls for reform, and U.K. Prime Minister Boris Johnson planned to suspend Parliament as Brexit’s deadline neared.
| 1 | The Russell 1000® Index measures the performance of the 1,000 largest companies in the Russell 3000® Index, which represents approximately 92% of the total market capitalization of the Russell 3000® Index. You cannot invest directly in an index. |
| 2 | The Russell 2000® Index measures the performance of the 2,000 smallest companies in the Russell 3000® Index, which represents approximately 8% of the total market capitalization of the Russell 3000® Index. You cannot invest directly in an index. |
| 3 | The S&P 500 Index consists of 500 stocks chosen for market size, liquidity, and industry group representation. It is a market-value-weighted index with each stock’s weight in the index proportionate to its market value. You cannot invest directly in an index. |
| 4 | The Morgan Stanley Capital International (MSCI) All Country World Index (ACWI) ex USA Index (Net) is a free-float-adjusted market-capitalization-weighted index that is designed to measure the equity market performance of developed and emerging markets, excluding the United States. Source: MSCI. MSCI makes no express or implied warranties or representations and shall have no liability whatsoever with respect to any MSCI data contained herein. The MSCI data may not be further redistributed or used as a basis for other indices or any securities or financial products. This report is not approved, reviewed, or produced by MSCI. You cannot invest directly in an index. |
| 5 | The MSCI Emerging Markets (EM) Index (Net) is a free-float-adjusted market-capitalization-weighted index that is designed to measure equity market performance of emerging markets. You cannot invest directly in an index. |
| 6 | The Bloomberg Barclays U.S. Aggregate Bond Index is a broad-based benchmark that measures the investment-grade, U.S. dollar-denominated, fixed-rate taxable bond market, including Treasuries, government-related and corporate securities, mortgage-backed securities (agency fixed-rate and hybrid adjustable-rate mortgage pass-throughs), asset-backed securities, and commercial mortgage-backed securities. You cannot invest directly in an index. |
| 7 | The Bloomberg Barclays Global Aggregate ex-USD Index is an unmanaged index that provides a broad-based measure of the global investment-grade fixed-income markets excluding the U.S.-dollar-denominated debt market. You cannot invest directly in an index. |
| 8 | The Bloomberg Barclays Municipal Bond Index is an unmanaged index composed of long-term tax-exempt bonds with a minimum credit rating of Baa. You cannot invest directly in an index. |
| 9 | The ICE BofA U.S. High Yield Index is a market-capitalization-weighted index of domestic and Yankee high-yield bonds. The index tracks the performance of high-yield securities traded in the U.S. bond market. You cannot invest directly in an index. Copyright 2020. ICE Data Indices, LLC. All rights reserved. |
2 | Wells Fargo Low Volatility U.S. Equity Fund
Table of Contents
Letter to shareholders (unaudited)
In the U.S., the Fed cut interest rates again in September. U.S. manufacturing data disappointed investors. The U.S. Congress announced it would pursue an impeachment investigation of President Trump. Meanwhile, the Brexit impasse showed no signs of resolution. Officials in China said that hitting the country’s economic growth goals for the year would be difficult considering the weight of tariffs and trade restrictions. Although the S&P 500 Index finished the third quarter with the best year-to-date returns in more than 20 years, concerns about future returns remained.
The fourth quarter started on a strong note, with U.S.-China trade tensions relaxing in October along with renewed optimism for a U.K. Brexit deal and positive macroeconomic data. The initial estimate of U.S. third-quarter gross domestic product (GDP) growth was a resilient 1.9% annualized rate, while the U.S. unemployment rate fell to a 50-year low of 3.5% in September. However, despite strength among U.S. consumers, business confidence declined while manufacturing activity contracted. Concerned with a potential economic slowdown, the Fed lowered interest rates another quarter point in late October—its third rate cut in four months. This helped push the S&P 500 Index to an all-time high while emerging market equities rallied and global bonds declined overall, reflecting a broad pickup in risk appetite.
Equity markets continued to rally in November despite ongoing geopolitical risks. Hopes for a U.S.-China trade deal buoyed investor confidence. U.S. business sentiment improved slightly, and manufacturing and services activity picked up. While consumer confidence and purchasing managers’ activity rose in the eurozone, China reported weakening manufacturing and consumer data. Bond yields rose marginally, leading to slightly negative returns for global government and investment-grade corporate bonds.
Financial markets ended 2019 with a boost from the U.S. and China accord on a Phase One trade deal. That, along with the landslide win by the pro-Brexit U.K. Conservative Party in a national election and ongoing central bank support, gave investors greater confidence. U.S. economic indicators were generally positive, with the exception of manufacturing activity and business confidence. Consumer confidence was resilient, fed by a robust labor market, tame inflation, and lower interest rates, which boosted housing affordability and stimulated homebuyer activity. The impeachment of President Trump had little impact on markets. Meanwhile, slowing Chinese economic activity, partly attributable to the trade war, led to further government stimulus at year-end through lower reserve ratios, allowing banks to lend more money.
The year-end rally continued in early January 2020. However, capital market volatility picked up sharply in late January on concerns over the potential impact of the coronavirus on the global economy and stock markets. With sentiment somewhat souring, perceived safe havens did well in January. The U.S. dollar and Japanese yen both rose, and government bonds outperformed equities. While the S&P 500 Index held its ground, emerging market equities tumbled, including those in Asia.
In February, the coronavirus became the major market focus. Fears of the virus’s impact on global growth led to expectations of increased global central bank monetary policy support. That led the 10-year U.S. Treasury yield to fall to an all-time low of 1.1%. Although equity markets initially shrugged off concerns about the outbreak, focusing instead on strong fourth-quarter earnings and improving business confidence in January, market sentiment turned sharply lower and the S&P 500 Index lost 8.2% for the month. Oil prices tumbled as Russia and the Organization of the Petroleum Exporting Countries compounded a major decline in oil demand with a brutal price war, partly aimed at dissuading further U.S. shale production, causing the price of West Texas Intermediate crude oil to plummet.
Wells Fargo Low Volatility U.S. Equity Fund | 3
Table of Contents
Letter to shareholders (unaudited)
“The global spread of the coronavirus led country after country to clamp down on social and business-related activity in order to contain the virus from causing even greater devastation and overwhelming health care systems.”
“Financial markets posted widely positive returns in June despite ongoing economic weakness and high levels of uncertainty on the containment of the coronavirus and the timing of an effective vaccine.”
The global spread of the coronavirus led country after country to clamp down on social and business-related activity in order to contain the virus from causing even greater devastation and overwhelming health care systems. This abrupt stoppage of economic activity led to the sharp deceleration of global output, sending economies into a deep contraction. Central banks responded swiftly, slashing interest rates and expanding quantitative easing programs to restore liquidity and confidence to the markets. In the U.S., the Fed introduced several new lending programs, funding investment-grade bonds, money market mutual funds, and commercial paper while purchasing Treasuries, mortgage-backed securities, and overnight repurchase agreements. Meanwhile, stock markets tumbled quickly into a bear market, ending the longest bull stock market in U.S. history.
Markets rebounded strongly in April, fueled by unprecedented government and central bank stimulus measures. The U.S. economy contracted by an annualized 5.0% pace in the first quarter, with 30 million new unemployment insurance claims in six weeks. In the eurozone, first-quarter real GDP shrank 3.8%, with the composite April Flash Purchasing Managers’ Index, a monthly survey of purchasing managers, falling to an all-time low of 13.5. The European Central Bank expanded its quantitative easing to include the purchase of additional government bonds of countries with the greatest virus-related need, including Italy and Spain. China’s first-quarter GDP fell by 6.8% year over year. However, retail sales, production, and investment showed signs of recovery. Extreme oil-price volatility continued as global supply far exceeded demand.
In May, the global equity market rebound continued, with widespread strong monthly gains. Investors regained confidence on reports of early signs of success in human trials of a coronavirus vaccine. Growth stocks continued to outperform value stocks while returns on global government bonds were generally flat. In the U.S., a gap grew between the stock market rebound and devastating economic data points, including an April unemployment rate of 14.7%, the highest level since World War II. Purchasing managers’ indices reflected weakening activity in May in both the manufacturing and services sectors. U.S. corporate earnings reports indicated a 14% year-over-year contraction in earnings from the first quarter of 2019. However, high demand for technology, driven by remote activity, supported robust information technology sector earnings, which helped drive major technology stocks higher.
Financial markets posted widely positive returns in June despite ongoing economic weakness and high levels of uncertainty on the containment of the coronavirus and the timing of an effective vaccine. There were hopeful signs as economies reopened, with both U.S. and U.K. retail sales rebounding substantially in May. However, year over year, sales remained depressed. Vitally important to market sentiment was the ongoing commitment by central banks globally to do all they could to provide economic support through liquidity and low borrowing costs. U.S. economic activity was aided by one-time $1,200 stimulus checks and $600 bonus weekly unemployment benefits due to expire at the end of July. However, unemployment remained in the double digits, easing somewhat from 14.7% in April to 11.1% in June. During June, numerous states reported alarming increases of coronavirus cases. China’s economic recovery picked up momentum in June, though it remained far from a full recovery.
July was a broadly positive month for both global equities and fixed income. However, economic data and a resurgence of coronavirus cases pointed to the vulnerability of the global economy and the ongoing imperative to regain control of the pandemic. Second-quarter GDP shrank by 9.5% and 12.1% in the U.S. and eurozone, respectively, from the previous quarter. In contrast, China reported a 3.2% year-over-year expansion in its second-quarter GDP. U.S. unemployment remained historically high despite adding 1.8 million jobs in July, with a double-digit jobless rate persisting. However, manufacturing activity grew in both the U.S. and eurozone. In Asia, while China’s manufacturing sector continued to expand, activity in Japan and South Korea contracted. In July, a rising concern
4 | Wells Fargo Low Volatility U.S. Equity Fund
Table of Contents
Letter to shareholders (unaudited)
was the rapid and broad reemergence of coronavirus infections. Despite the ongoing promise of positive early-stage vaccine trial results, economic activity could be held back by the continued spread of the virus and the end of a widely received $600-a-week bonus unemployment benefit in late July.
Don’t let short-term uncertainty derail long-term investment goals.
Periods of investment uncertainty can present challenges, but experience has taught us that maintaining long-term investment goals can be an effective way to plan for the future. To help you create a sound strategy based on your personal goals and risk tolerance, Wells Fargo Funds offers more than 100 mutual funds spanning a wide range of asset classes and investment styles. Although diversification cannot guarantee an investment profit or prevent losses, we believe it can be an effective way to manage investment risk and potentially smooth out overall portfolio performance. We encourage investors to know their investments and to understand that appropriate levels of risk-taking may unlock opportunities.
Thank you for choosing to invest with Wells Fargo Funds. We appreciate your confidence in us and remain committed to helping you meet your financial needs.
Sincerely,

Andrew Owen
President
Wells Fargo Funds
|
For further information about your Fund, contact your investment professional, visit our website at wfam.com, or call us directly at 1-800-222-8222. |
Notice to Shareholders
At a meeting held on August 10-12, 2020, the Board of Trustees of the Fund approved a change to the Fund’s automatic conversion feature for Class C shares in order to shorten the required holding period from 10 to 8 years. As a result, on a monthly basis beginning November 5, 2020, Class C shares will convert automatically into Class A shares 8 years after the initial date of purchase or, if you acquired your Class C shares through an exchange or conversion from another share class, 8 years after the date you acquired your Class C shares. When Class C shares that you acquired through a purchase or exchange convert, any other Class C shares that you purchased with reinvested dividends and distributions also will convert into Class A shares on a pro rata basis.
Please note that a shorter holding period may apply depending on your intermediary. Please see “Appendix A—Sales Charge Reductions and Waivers for Certain Intermediaries” in the Fund’s prospectus for further information.
Wells Fargo Low Volatility U.S. Equity Fund | 5
Table of Contents
Performance highlights (unaudited)
Investment objective
The Fund seeks long-term capital appreciation.
Manager
Wells Fargo Funds Management, LLC
Subadviser
Wells Capital Management Incorporated
Portfolio managers
Dennis Bein, CFA®‡
Ryan Brown, CFA®‡
Harindra de Silva, Ph.D., CFA®‡
Average annual total returns (%) as of July 31, 2020
| Including sales charge | Excluding sales charge | Expense ratios1 (%) | ||||||||||||||||||||||||
| Inception date | 1 year | Since inception | 1 year | Since inception | Gross | Net2 | ||||||||||||||||||||
| Class A (WLVLX) | 10-31-2016 | -2.22 | 7.70 | 3.76 | 9.42 | 1.50 | 0.73 | |||||||||||||||||||
| Class C (WLVKX) | 10-31-2016 | 1.89 | 8.59 | 2.89 | 8.59 | 2.25 | 1.48 | |||||||||||||||||||
| Class R6 (WLVJX) | 10-31-2016 | – | – | 4.10 | 9.86 | 1.07 | 0.30 | |||||||||||||||||||
| Administrator Class (WLVDX) | 10-31-2016 | – | – | 3.77 | 9.48 | 1.42 | 0.65 | |||||||||||||||||||
| Institutional Class (WLVOX) | 10-31-2016 | – | – | 4.01 | 9.76 | 1.17 | 0.40 | |||||||||||||||||||
| Russell 1000® Index3 | – | – | – | 12.03 | 14.46 | * | – | – | ||||||||||||||||||
| * | Based on the inception date of the oldest Fund class. |
Figures quoted represent past performance, which is no guarantee of future results, and do not reflect taxes that a shareholder may pay on an investment in a fund. Investment return and principal value of an investment will fluctuate so that an investor’s shares, when redeemed, may be worth more or less than their original cost. Performance shown without sales charges would be lower if sales charges were reflected. Current performance may be lower or higher than the performance data quoted, which assumes the reinvestment of dividends and capital gains. Current month-end performance is available on the Fund’s website, wfam.com.
Index returns do not include transaction costs associated with buying and selling securities, any mutual fund fees or expenses, or any taxes. It is not possible to invest directly in an index.
For Class A shares, the maximum front-end sales charge is 5.75%. For Class C shares, the maximum contingent deferred sales charge is 1.00%. Performance including a contingent deferred sales charge assumes the sales charge for the corresponding time period. Class R6, Administrator Class, and Institutional Class shares are sold without a front-end sales charge or contingent deferred sales charge.
Stock values fluctuate in response to the activities of individual companies and general market and economic conditions. Certain investment strategies tend to increase the total risk of an investment (relative to the broader market). The Fund is exposed to smaller-company securities risk. Consult the Fund’s prospectus for additional information on these and other risks.
Please see footnotes on page 7.
6 | Wells Fargo Low Volatility U.S. Equity Fund
Table of Contents
Performance highlights (unaudited)
| Growth of $10,000 investment as of July 31, 20204 |
|
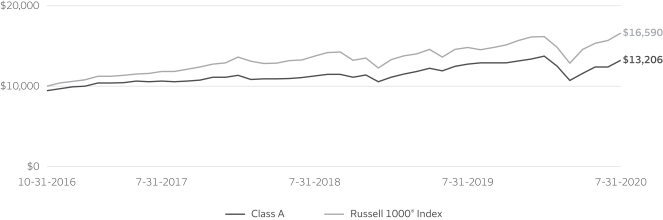
| ‡ | CFA® and Chartered Financial Analyst® are trademarks owned by CFA Institute. |
| 1 | Reflects the expense ratios as stated in the most recent prospectuses. The expense ratios shown are subject to change and may differ from the annualized expense ratios shown in the financial highlights of this report. |
| 2 | The manager has contractually committed through November 30, 2020, to waive fees and/or reimburse expenses to the extent necessary to cap total annual fund operating expenses after fee waivers at 0.73% for Class A, 1.48% for Class C, 0.30% for Class R6, 0.65% for Administrator Class, and 0.40% for Institutional Class. Brokerage commissions, stamp duty fees, interest, taxes, acquired fund fees and expenses (if any), and extraordinary expenses are excluded from the expense caps. Prior to or after the commitment expiration date, the caps may be increased or the commitment to maintain the caps may be terminated only with the approval of the Board of Trustees. Without these caps, the Fund’s returns would have been lower. The expense ratio paid by an investor is the net expense ratio (the total annual fund operating expenses after fee waivers) as stated in the prospectuses. |
| 3 | The Russell 1000® Index measures the performance of the 1,000 largest companies in the Russell 3000® Index, which represents approximately 92% of the total market capitalization of the Russell 3000® Index. You cannot invest directly in an index. |
| 4 | The chart compares the performance of Class A shares since inception with the Russell 1000® Index. The chart assumes a hypothetical investment of $10,000 in Class A shares and reflects all operating expenses and assumes the maximum initial sales charge of 5.75%. |
| 5 | The ten largest holdings, excluding cash, cash equivalents and any money market funds, are calculated based on the value of the investments divided by total net assets of the Fund. Holdings are subject to change and may have changed since the date specified. |
| 6 | The S&P 500 Index consists of 500 stocks chosen for market size, liquidity, and industry group representation. It is a market-value-weighted index with each stock’s weight in the index proportionate to its market value. You cannot invest directly in an index. |
| 7 | Amounts are calculated based on the total long-term investments of the Fund. These amounts are subject to change and may have changed since the date specified. |
Wells Fargo Low Volatility U.S. Equity Fund | 7
Table of Contents
Performance highlights (unaudited)
MANAGER’S DISCUSSION
| ∎ | The Fund underperformed its benchmark, the Russell 1000® Index, for the 12-month period that ended July 31, 2020. |
| ∎ | The portfolio’s smaller size tilt versus the index, which has a mega-cap bias, significantly detracted from results for the period. This market-cap effect caused most of the portfolio’s underperformance versus the Russell 1000® Index. From a sector perspective, the underweight position in information technology (IT) and an overweight in consumer staples also detracted from performance. |
| ∎ | Primary contributors to Fund performance during the reporting period included our focus on lower-risk/lower-beta stocks, which outperformed both high-risk stocks and the index during the period. Beta is a measure of a stock’s volatility relative to general market movements. Lower-beta stocks tend to deliver lower variation in returns compared with the overall market. The alpha signal also contributed to performance for the period. |
| Ten largest holdings (%) as of July 31, 20205 | ||||
West Pharmaceutical Services Incorporated | 2.00 | |||
Walmart Incorporated | 1.78 | |||
PepsiCo Incorporated | 1.73 | |||
Verizon Communications Incorporated | 1.67 | |||
Linde plc | 1.61 | |||
Fastenal Company | 1.61 | |||
The Hershey Company | 1.57 | |||
Mondelez International Incorporated Class A | 1.53 | |||
Merck & Company Incorporated | 1.53 | |||
The Procter & Gamble Company | 1.50 | |||
U.S. stocks delivered strong results during the reporting period.
Despite a tumultuous past 12 months, equity markets posted a solid 12% return for the period as measured by the S&P 500 Index6. Markets hit a high on February 14, 2020, followed by a 32% sell-off associated with the coronavirus pandemic’s economic fallout. After about a month of freefalling, declining sharply in late February and March 2020, markets rallied back to levels just shy of the February 14 high, with the Russell 1000® Index ending the 12-month period up 12.03%. The largest stocks in the Russell 1000® Index outperformed all other stocks in a linear fashion for the period, meaning that, on average, the larger the company, the better the return for the period. The top 200 stocks in the Russell 1000® Index gained an average of 15.97% for the trailing 12 months, while the smallest 200 lost 11.83%, a 27% difference.
Lower-risk/lower-beta stocks outperformed high-beta stocks for the period, which contributed to performance, as the portfolio maintained its low-beta bias. For example, the lowest-beta quintile of stocks delivered a 17.1% return while the highest-beta stocks returned only 5.7%.
From a factor perspective, the portfolio maintained an overweight to quality, momentum, and stocks with positive earnings revisions while underweighting stocks with high financial risk. The alpha model reduced its overweight to value over the period and ended the period at a slight underweight to the value factor. The portfolio’s smaller capitalization relative to the Russell 1000® Index caused it to trail the benchmark during the period.
From a sector perspective, the portfolio maintained an underweight to IT, health care, and energy and an overweight to consumer staples, utilities, materials, and industrials. The sector underweights and overweights enabled the portfolio to achieve a lower-beta bias. On balance, the sector tilts were a net detractor from performance for this period.
| Sector allocation as of July 31, 20207 |
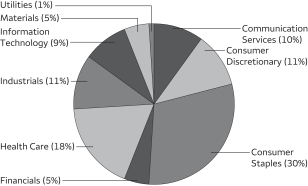 |
The Fund seeks to have less volatility than the overall stock market.
Our investment process focuses primarily on volatility reduction. We seek to maintain a standard deviation (variation between highest and lowest returns) that is 20% to 30% less than that of the index while delivering a similar or higher level of return over a full market cycle. Using our fundamental and statistical risk models, we construct the portfolio by quantitatively identifying companies that possess lower forecasted risks.
Please see footnotes on page 7.
8 | Wells Fargo Low Volatility U.S. Equity Fund
Table of Contents
Performance highlights (unaudited)
Due to our low-volatility emphasis, sector weights within the Fund tend to deviate meaningfully from those of the benchmark. During the period, the Fund held underweights to sectors that generally exhibited higher betas, such as energy, and overweight positions to consumer staples and utilities, sectors that are considered defensive in nature.
Going forward, we will continue to favor low-beta stocks as they have served the Fund’s goal: to reduce volatility.
Using our fundamental and statistical risk models, we will quantitatively identify companies with lower forecasted risks. In addition, we will use our comprehensive alpha-prediction model when selecting lower-risk stocks. Our process quantitatively forecasts returns using more than 70 fundamental, technical, and proprietary factors, also known as alpha signals. As a result, our process not only assesses investment opportunities from a risk perspective but also from an alpha standpoint. We believe this increases the likelihood that, over a full market cycle, the Fund may provide investors with lower overall portfolio risk relative to the index while delivering a similar or higher level of return.
Please see footnotes on page 7.
Wells Fargo Low Volatility U.S. Equity Fund | 9
Table of Contents
As a shareholder of the Fund, you incur two types of costs: (1) transaction costs, including sales charges (loads) on purchase payments and contingent deferred sales charges (if any) on redemptions and (2) ongoing costs, including management fees, distribution (12b-1) and/or shareholder servicing fees, and other Fund expenses. This example is intended to help you understand your ongoing costs (in dollars) of investing in the Fund and to compare these costs with the ongoing costs of investing in other mutual funds.
The example is based on an investment of $1,000 invested at the beginning of the six-month period and held for the entire period from February 1, 2020 to July 31, 2020.
Actual expenses
The “Actual” line of the table below provides information about actual account values and actual expenses. You may use the information in this line, together with the amount you invested, to estimate the expenses that you paid over the period. Simply divide your account value by $1,000 (for example, an $8,600 account value divided by $1,000 = 8.6), then multiply the result by the number in the “Actual” line under the heading entitled “Expenses paid during period” for your applicable class of shares to estimate the expenses you paid on your account during this period.
Hypothetical example for comparison purposes
The “Hypothetical” line of the table below provides information about hypothetical account values and hypothetical expenses based on the Fund’s actual expense ratio and an assumed rate of return of 5% per year before expenses, which is not the Fund’s actual return. The hypothetical account values and expenses may not be used to estimate the actual ending account balance or expenses you paid for the period. You may use this information to compare the ongoing costs of investing in the Fund and other funds. To do so, compare this 5% hypothetical example with the 5% hypothetical examples that appear in the shareholder reports of the other funds.
Please note that the expenses shown in the table are meant to highlight your ongoing costs only and do not reflect any transactional costs, such as sales charges (loads) and contingent deferred sales charges. Therefore, the “Hypothetical” line of the table is useful in comparing ongoing costs only and will not help you determine the relative total costs of owning different funds. In addition, if these transactional costs were included, your costs would have been higher.
| Beginning account value 2-1-2020 | Ending account value 7-31-2020 | Expenses paid during the period1 | Annualized net expense ratio | |||||||||||||
Class A | ||||||||||||||||
Actual | $ | 1,000.00 | $ | 961.54 | $ | 3.56 | 0.73 | % | ||||||||
Hypothetical (5% return before expenses) | $ | 1,000.00 | $ | 1,021.23 | $ | 3.67 | 0.73 | % | ||||||||
Class C | ||||||||||||||||
Actual | $ | 1,000.00 | $ | 957.33 | $ | 7.20 | 1.48 | % | ||||||||
Hypothetical (5% return before expenses) | $ | 1,000.00 | $ | 1,017.50 | $ | 7.42 | 1.48 | % | ||||||||
Class R6 | ||||||||||||||||
Actual | $ | 1,000.00 | $ | 963.11 | $ | 1.46 | 0.30 | % | ||||||||
Hypothetical (5% return before expenses) | $ | 1,000.00 | $ | 1,023.37 | $ | 1.51 | 0.30 | % | ||||||||
Administrator Class | ||||||||||||||||
Actual | $ | 1,000.00 | $ | 961.48 | $ | 3.17 | 0.65 | % | ||||||||
Hypothetical (5% return before expenses) | $ | 1,000.00 | $ | 1,021.63 | $ | 3.27 | 0.65 | % | ||||||||
Institutional Class | ||||||||||||||||
Actual | $ | 1,000.00 | $ | 962.40 | $ | 1.95 | 0.40 | % | ||||||||
Hypothetical (5% return before expenses) | $ | 1,000.00 | $ | 1,022.87 | $ | 2.01 | 0.40 | % | ||||||||
| 1 | Expenses paid is equal to the annualized net expense ratio of each class multiplied by the average account value over the period, multiplied by the number of days in the most recent fiscal half-year divided by the number of days in the fiscal year (to reflect the one-half-year period). |
10 | Wells Fargo Low Volatility U.S. Equity Fund
Table of Contents
Portfolio of investments—July 31, 2020
| Shares | Value | |||||||||||||||
| Common Stocks: 97.94% |
| |||||||||||||||
Communication Services: 9.78% |
| |||||||||||||||
| Diversified Telecommunication Services: 1.67% | ||||||||||||||||
Verizon Communications Incorporated | 16,352 | $ | 939,913 | |||||||||||||
|
| |||||||||||||||
| Entertainment: 6.85% | ||||||||||||||||
Activision Blizzard Incorporated | 9,469 | 782,423 | ||||||||||||||
Electronic Arts Incorporated † | 4,776 | 676,377 | ||||||||||||||
Spotify Technology SA † | 3,138 | 809,039 | ||||||||||||||
Take-Two Interactive Software Incorporated † | 4,586 | 752,196 | ||||||||||||||
The Madison Square Garden Company Class A | 1,754 | 269,572 | ||||||||||||||
Zynga Incorporated Class A † | 57,998 | 570,120 | ||||||||||||||
| 3,859,727 | ||||||||||||||||
|
| |||||||||||||||
| Media: 1.15% | ||||||||||||||||
Discovery Communications Incorporated Class C † | 8,740 | 165,623 | ||||||||||||||
John Wiley & Sons Incorporated Class A | 4,672 | 158,054 | ||||||||||||||
The New York Times Company Class A | 7,050 | 325,287 | ||||||||||||||
| 648,964 | ||||||||||||||||
|
| |||||||||||||||
| Wireless Telecommunication Services: 0.11% | ||||||||||||||||
United States Cellular Corporation † | 2,119 | 62,871 | ||||||||||||||
|
| |||||||||||||||
Consumer Discretionary: 10.96% |
| |||||||||||||||
| Auto Components: 0.86% | ||||||||||||||||
Gentex Corporation | 17,887 | 482,770 | ||||||||||||||
|
| |||||||||||||||
| Automobiles: 0.83% | ||||||||||||||||
Tesla Motors Incorporated † | 327 | 467,859 | ||||||||||||||
|
| |||||||||||||||
| Distributors: 0.14% | ||||||||||||||||
Pool Corporation | 240 | 76,008 | ||||||||||||||
|
| |||||||||||||||
| Diversified Consumer Services: 3.22% | ||||||||||||||||
Bright Horizons Family Solutions Incorporated † | 1,977 | 212,013 | ||||||||||||||
Chegg Incorporated † | 7,695 | 623,064 | ||||||||||||||
Frontdoor Incorporated † | 9,630 | 404,412 | ||||||||||||||
Grand Canyon Education Incorporated † | 6,491 | 576,011 | ||||||||||||||
| 1,815,500 | ||||||||||||||||
|
| |||||||||||||||
| Hotels, Restaurants & Leisure: 1.55% | ||||||||||||||||
Chipotle Mexican Grill Incorporated † | 114 | 131,688 | ||||||||||||||
Domino’s Pizza Incorporated | 1,916 | 740,745 | ||||||||||||||
| 872,433 | ||||||||||||||||
|
| |||||||||||||||
| Household Durables: 1.30% | ||||||||||||||||
Garmin Limited | 7,421 | 731,636 | ||||||||||||||
|
| |||||||||||||||
| Multiline Retail: 1.15% | ||||||||||||||||
Dollar General Corporation | 805 | 153,272 | ||||||||||||||
Ollie’s Bargain Outlet Holdings Incorporated † | 4,728 | 496,913 | ||||||||||||||
| 650,185 | ||||||||||||||||
|
| |||||||||||||||
The accompanying notes are an integral part of these financial statements.
Wells Fargo Low Volatility U.S. Equity Fund | 11
Table of Contents
Portfolio of investments—July 31, 2020
| Shares | Value | |||||||||||||||
| Textiles, Apparel & Luxury Goods: 1.91% | ||||||||||||||||
lululemon athletica Incorporated † | 1,564 | $ | 509,223 | |||||||||||||
Nike Incorporated Class B | 5,806 | 566,724 | ||||||||||||||
| 1,075,947 | ||||||||||||||||
|
| |||||||||||||||
Consumer Staples: 29.02% |
| |||||||||||||||
| Beverages: 4.48% | ||||||||||||||||
Keurig Dr. Pepper Incorporated | 12,635 | 386,505 | ||||||||||||||
Monster Beverage Corporation † | 3,344 | 262,437 | ||||||||||||||
PepsiCo Incorporated | 7,082 | 974,908 | ||||||||||||||
The Boston Beer Company Incorporated Class A † | 695 | 563,256 | ||||||||||||||
The Coca-Cola Company | 7,158 | 338,144 | ||||||||||||||
| 2,525,250 | ||||||||||||||||
|
| |||||||||||||||
| Food & Staples Retailing: 4.30% | ||||||||||||||||
Casey’s General Stores Incorporated | 2,259 | 359,610 | ||||||||||||||
Sprouts Farmers Market Incorporated † | 12,485 | 329,354 | ||||||||||||||
The Kroger Company | 20,981 | 729,929 | ||||||||||||||
Walmart Incorporated | 7,761 | 1,004,273 | ||||||||||||||
| 2,423,166 | ||||||||||||||||
|
| |||||||||||||||
| Food Products: 13.00% | ||||||||||||||||
Beyond Meat Incorporated † | 3,522 | 443,420 | ||||||||||||||
Campbell Soup Company | 15,015 | 744,294 | ||||||||||||||
Conagra Brands Incorporated | 2,496 | 93,475 | ||||||||||||||
Flowers Foods Incorporated | 27,212 | 619,073 | ||||||||||||||
General Mills Incorporated | 12,492 | 790,369 | ||||||||||||||
Hain Celestial Group Incorporated † | 3,831 | 130,177 | ||||||||||||||
Hormel Foods Corporation | 16,584 | 843,462 | ||||||||||||||
Kellogg Company | 8,562 | 590,692 | ||||||||||||||
McCormick & Company Incorporated | 4,246 | 827,545 | ||||||||||||||
Mondelez International Incorporated Class A | 15,574 | 864,201 | ||||||||||||||
The Hershey Company | 6,099 | 886,856 | ||||||||||||||
The J.M. Smucker Company | 4,464 | 488,138 | ||||||||||||||
| 7,321,702 | ||||||||||||||||
|
| |||||||||||||||
| Household Products: 6.09% | ||||||||||||||||
Church & Dwight Company Incorporated | 7,674 | 739,236 | ||||||||||||||
Colgate-Palmolive Company | 10,727 | 828,124 | ||||||||||||||
Kimberly-Clark Corporation | 1,163 | 176,823 | ||||||||||||||
The Clorox Company | 3,566 | 843,395 | ||||||||||||||
The Procter & Gamble Company | 6,443 | 844,806 | ||||||||||||||
| 3,432,384 | ||||||||||||||||
|
| |||||||||||||||
| Personal Products: 1.15% | ||||||||||||||||
The Estee Lauder Companies Incorporated Class A | 3,273 | 646,548 | ||||||||||||||
|
| |||||||||||||||
Energy: 0.04% |
| |||||||||||||||
| Oil, Gas & Consumable Fuels: 0.04% | ||||||||||||||||
Antero Midstream Corporation | 4,280 | 24,268 | ||||||||||||||
|
| |||||||||||||||
Financials: 5.46% |
| |||||||||||||||
| Banks: 0.20% | ||||||||||||||||
Commerce Bancshares Incorporated | 1,960 | 112,230 | ||||||||||||||
|
| |||||||||||||||
The accompanying notes are an integral part of these financial statements.
12 | Wells Fargo Low Volatility U.S. Equity Fund
Table of Contents
Portfolio of investments—July 31, 2020
| Shares | Value | |||||||||||||||
| Capital Markets: 3.01% | ||||||||||||||||
Cboe Global Markets Incorporated | 6,436 | $ | 564,437 | |||||||||||||
MarketAxess Holdings Incorporated | 1,076 | 555,969 | ||||||||||||||
SEI Investments Company | 2,528 | 132,290 | ||||||||||||||
Tradeweb Markets Incorporated Class A | 5,202 | 281,272 | ||||||||||||||
VIRTU Financial Incorporated Class A | 6,456 | 160,109 | ||||||||||||||
| 1,694,077 | ||||||||||||||||
|
| |||||||||||||||
| Insurance: 2.25% | ||||||||||||||||
American National Group Incorporated | 379 | 27,913 | ||||||||||||||
Erie Indemnity Company Class A | 695 | 146,033 | ||||||||||||||
Mercury General Corporation | 6,652 | 285,437 | ||||||||||||||
The Progressive Corporation | 7,411 | 669,510 | ||||||||||||||
White Mountains Insurance Group Limited | 156 | 137,300 | ||||||||||||||
| 1,266,193 | ||||||||||||||||
|
| |||||||||||||||
Health Care: 17.37% |
| |||||||||||||||
| Biotechnology: 0.76% | ||||||||||||||||
Alexion Pharmaceuticals Incorporated † | 606 | 62,109 | ||||||||||||||
Incyte Corporation † | 3,732 | 368,572 | ||||||||||||||
| 430,681 | ||||||||||||||||
|
| |||||||||||||||
| Health Care Equipment & Supplies: 4.98% | ||||||||||||||||
Baxter International Incorporated | 4,508 | 389,401 | ||||||||||||||
IDEXX Laboratories Incorporated † | 1,568 | 623,672 | ||||||||||||||
Masimo Corporation † | 2,810 | 618,537 | ||||||||||||||
Tandem Diabetes Care Incorporated † | 491 | 51,290 | ||||||||||||||
West Pharmaceutical Services Incorporated | 4,182 | 1,124,414 | ||||||||||||||
| 2,807,314 | ||||||||||||||||
|
| |||||||||||||||
| Health Care Providers & Services: 1.70% | ||||||||||||||||
Chemed Corporation | 1,197 | 589,151 | ||||||||||||||
Premier Incorporated Class A † | 10,536 | 368,444 | ||||||||||||||
| 957,595 | ||||||||||||||||
|
| |||||||||||||||
| Health Care Technology: 1.43% | ||||||||||||||||
Cerner Corporation | 11,559 | 802,773 | ||||||||||||||
|
| |||||||||||||||
| Life Sciences Tools & Services: 1.62% | ||||||||||||||||
Agilent Technologies Incorporated | 2,823 | 271,940 | ||||||||||||||
Bio-Rad Laboratories Incorporated Class A † | 455 | 238,825 | ||||||||||||||
Mettler-Toledo International Incorporated † | 432 | 403,920 | ||||||||||||||
| 914,685 | ||||||||||||||||
|
| |||||||||||||||
| Pharmaceuticals: 6.88% | ||||||||||||||||
Bristol-Myers Squibb Company | 12,092 | 709,320 | ||||||||||||||
Eli Lilly & Company | 5,117 | 769,034 | ||||||||||||||
Johnson & Johnson | 5,052 | 736,380 | ||||||||||||||
Merck & Company Incorporated | 10,731 | 861,055 | ||||||||||||||
Pfizer Incorporated | 20,732 | 797,767 | ||||||||||||||
| 3,873,556 | ||||||||||||||||
|
| |||||||||||||||
Industrials: 10.83% |
| |||||||||||||||
| Aerospace & Defense: 0.19% | ||||||||||||||||
BWX Technologies Incorporated | 2,003 | 109,204 | ||||||||||||||
|
| |||||||||||||||
The accompanying notes are an integral part of these financial statements.
Wells Fargo Low Volatility U.S. Equity Fund | 13
Table of Contents
Portfolio of investments—July 31, 2020
| Shares | Value | |||||||||||||||
| Air Freight & Logistics: 2.60% | ||||||||||||||||
C.H. Robinson Worldwide Incorporated | 8,060 | $ | 755,383 | |||||||||||||
Expeditors International of Washington Incorporated | 8,364 | 706,842 | ||||||||||||||
| 1,462,225 | ||||||||||||||||
|
| |||||||||||||||
| Building Products: 0.09% | ||||||||||||||||
Allegion plc | 524 | 52,117 | ||||||||||||||
|
| |||||||||||||||
| Commercial Services & Supplies: 0.29% | ||||||||||||||||
Rollins Incorporated | 3,097 | 162,283 | ||||||||||||||
|
| |||||||||||||||
| Industrial Conglomerates: 0.68% | ||||||||||||||||
Carlisle Companies Incorporated | 3,216 | 382,961 | ||||||||||||||
|
| |||||||||||||||
| Machinery: 1.27% | ||||||||||||||||
Graco Incorporated | 2,788 | 148,433 | ||||||||||||||
The Toro Company | 7,933 | 566,020 | ||||||||||||||
| 714,453 | ||||||||||||||||
|
| |||||||||||||||
| Professional Services: 2.61% | ||||||||||||||||
CoStar Group Incorporated † | 874 | 742,690 | ||||||||||||||
IHS Markit Limited | 6,577 | 530,961 | ||||||||||||||
Robert Half International Incorporated | 3,876 | 197,172 | ||||||||||||||
| 1,470,823 | ||||||||||||||||
|
| |||||||||||||||
| Road & Rail: 0.80% | ||||||||||||||||
Old Dominion Freight Line Incorporated | 2,477 | 452,845 | ||||||||||||||
|
| |||||||||||||||
| Trading Companies & Distributors: 2.30% | ||||||||||||||||
Fastenal Company | 19,256 | 905,802 | ||||||||||||||
Watsco Incorporated | 1,642 | 387,627 | ||||||||||||||
| 1,293,429 | ||||||||||||||||
|
| |||||||||||||||
Information Technology: 8.57% |
| |||||||||||||||
| Communications Equipment: 1.15% | ||||||||||||||||
Arista Networks Incorporated † | 2,049 | 532,269 | ||||||||||||||
F5 Networks Incorporated † | 851 | 115,651 | ||||||||||||||
| 647,920 | ||||||||||||||||
|
| |||||||||||||||
| Electronic Equipment, Instruments & Components: 0.49% | ||||||||||||||||
Amphenol Corporation Class A | 182 | 19,248 | ||||||||||||||
National Instruments Corporation | 7,274 | 258,227 | ||||||||||||||
| 277,475 | ||||||||||||||||
|
| |||||||||||||||
| IT Services: 2.16% | ||||||||||||||||
Amdocs Limited | 1,106 | 68,683 | ||||||||||||||
Booz Allen Hamilton Holding Corporation | 5,378 | 439,705 | ||||||||||||||
Jack Henry & Associates Incorporated | 3,965 | 706,960 | ||||||||||||||
| 1,215,348 | ||||||||||||||||
|
| |||||||||||||||
| Software: 4.77% | ||||||||||||||||
Atlassian Corporation plc Class A † | 3,153 | 556,977 | ||||||||||||||
DocuSign Incorporated † | 2,933 | 635,962 | ||||||||||||||
Dropbox Incorporated Class A † | 14,193 | 322,891 | ||||||||||||||
Zoom Video Communications Incorporated † | 2,108 | 535,242 | ||||||||||||||
Zscaler Incorporated † | 4,911 | 637,693 | ||||||||||||||
| 2,688,765 | ||||||||||||||||
|
| |||||||||||||||
The accompanying notes are an integral part of these financial statements.
14 | Wells Fargo Low Volatility U.S. Equity Fund
Table of Contents
Portfolio of investments—July 31, 2020
| Shares | Value | |||||||||||||||
| Materials: 5.29% | ||||||||||||||||
| Chemicals: 1.66% | ||||||||||||||||
Linde plc | 3,707 | $ | 908,623 | |||||||||||||
NewMarket Corporation | 72 | 26,986 | ||||||||||||||
| 935,609 | ||||||||||||||||
|
| |||||||||||||||
| Containers & Packaging: 2.57% | ||||||||||||||||
AptarGroup Incorporated | 6,154 | 708,941 | ||||||||||||||
Ball Corporation | 7,066 | 520,270 | ||||||||||||||
Sonoco Products Company | 4,219 | 218,291 | ||||||||||||||
| 1,447,502 | ||||||||||||||||
|
| |||||||||||||||
| Metals & Mining: 1.06% | ||||||||||||||||
Royal Gold Incorporated | 4,274 | 598,061 | ||||||||||||||
|
| |||||||||||||||
Utilities: 0.62% |
| |||||||||||||||
| Electric Utilities: 0.56% | ||||||||||||||||
Hawaiian Electric Industries Incorporated | 8,736 | 316,767 | ||||||||||||||
|
| |||||||||||||||
| Multi-Utilities: 0.06% | ||||||||||||||||
MDU Resources Group Incorporated | 1,474 | 30,925 | ||||||||||||||
|
| |||||||||||||||
Total Common Stocks (Cost $47,646,564) |
| 55,174,947 | ||||||||||||||
|
| |||||||||||||||
| Yield | ||||||||||||||||
| Short-Term Investments: 2.16% | ||||||||||||||||
| Investment Companies: 2.16% | ||||||||||||||||
Wells Fargo Government Money Market Fund Select Class (I)(u) | 0.10 | % | 1,214,586 | 1,214,586 | ||||||||||||
|
| |||||||||||||||
Total Short-Term Investments (Cost $1,214,586) |
| 1,214,586 | ||||||||||||||
|
| |||||||||||||||
| Total investments in securities (Cost $48,861,150) | 100.10 | % | 56,389,533 | |||||
Other assets and liabilities, net | (0.10 | ) | (53,784 | ) | ||||
|
|
|
| |||||
| Total net assets | 100.00 | % | $ | 56,335,749 | ||||
|
|
|
| |||||
| † | Non-income-earning security |
| (I) | The issue of the security is an affiliated person of the fund as defined in the investment company Act of 1940. |
| (u) | The rate represents the 7-day annualized yield at period end. |
Investments in Affiliates
An affiliated investment is an investment in which the Fund owns at least 5% of the outstanding voting shares of the issuer or as a result of other relationships, such as the Fund and the issuer having the same investment manager. Transactions with issuers that were either affiliated persons of the Fund at the beginning of the period or the end of the period were as follows:
| Value, beginning of period | Purchases | Sales proceeds | Net realized gains (losses) | Net change in unrealized gains (losses) | Income from affiliated securities |
end of period | % of net assets | |||||||||||||||||||||||||
| Short-Term Invesstments | ||||||||||||||||||||||||||||||||
Investment Companies | ||||||||||||||||||||||||||||||||
Wells Fargo Government Money Market Fund Select Class | $ | 1,153,395 | $ | 31,082,991 | $ | (31,021,800 | ) | $ | 0 | $ | 0 | $ | 17,504 | $ | 1,214,586 | 2.16 | % | |||||||||||||||
The accompanying notes are an integral part of these financial statements.
Wells Fargo Low Volatility U.S. Equity Fund | 15
Table of Contents
Statement of assets and liabilities—July 31, 2020
Assets | ||||
Investments in unaffiliated securities, at value (cost $47,646,564) | $ | 55,174,947 | ||
Investments in affiliated securities, at value (cost $1,214,586) | 1,214,586 | |||
Receivable for Fund shares sold | 700 | |||
Receivable for dividends | 58,404 | |||
Receivable from manager | 7,828 | |||
Prepaid expenses and other assets | 3,550 | |||
|
| |||
Total assets | 56,460,015 | |||
|
| |||
Liabilities | ||||
Shareholder report expenses payable | 42,221 | |||
Professional fees payable | 41,331 | |||
Registration fee | 20,254 | |||
Administration fees payable | 6,444 | |||
Trustees’ fees and expenses payable | 4,992 | |||
Payable for Fund shares redeemed | 1,159 | |||
Distribution fee payable | 105 | |||
Accrued expenses and other liabilities | 7,760 | |||
|
| |||
Total liabilities | 124,266 | |||
|
| |||
Total net assets | $ | 56,335,749 | ||
|
| |||
Net assets consist of | ||||
Paid-in capital | $ | 50,937,981 | ||
Total distributable earnings | 5,397,768 | |||
|
| |||
Total net assets | $ | 56,335,749 | ||
|
| |||
Computation of net asset value and offering price per share | ||||
Net assets – Class A | $ | 1,687,049 | ||
Shares outstanding – Class A1 | 140,638 | |||
Net asset value per share – Class A | $12.00 | |||
Maximum offering price per share – Class A2 | $12.73 | |||
Net assets – Class C | $ | 377,484 | ||
Shares outstanding – Class C1 | 31,751 | |||
Net asset value per share – Class C | $11.89 | |||
Net assets – Class R6 | $ | 1,207,075 | ||
Shares outstanding – Class R61 | 100,480 | |||
Net asset value per share – Class R6 | $12.01 | |||
Net assets – Administrator Class | $ | 120,334 | ||
Shares outstanding – Administrator Class1 | 10,042 | |||
Net asset value per share – Administrator Class | $11.98 | |||
Net assets – Institutional Class | $ | 52,943,807 | ||
Shares outstanding – Institutional Class1 | 4,400,573 | |||
Net asset value per share – Institutional Class | $12.03 | |||
| ¹ | The Fund has an unlimited number of authorized shares. |
| ² | Maximum offering price is computed as 100/94.25 of net asset value. On investments of $50,000 or more, the offering price is reduced. |
The accompanying notes are an integral part of these financial statements.
16 | Wells Fargo Low Volatility U.S. Equity Fund
Table of Contents
Statement of operations—year ended July 31, 2020
Investment income | ||||
Dividends (net of foreign withholding taxes of $82) | $ | 983,848 | ||
Income from affiliated securities | 17,504 | |||
|
| |||
Total investment income | 1,001,352 | |||
|
| |||
Expenses | ||||
Management fee | 201,546 | |||
Administration fees |
| |||
Class A | 3,457 | |||
Class C | 766 | |||
Class R6 | 354 | |||
Administrator Class | 153 | |||
Institutional Class | 61,201 | |||
Shareholder servicing fees |
| |||
Class A | 4,113 | |||
Class C | 831 | |||
Administrator Class | 294 | |||
Distribution fee |
| |||
Class C | 2,227 | |||
Custody and accounting fees | 11,773 | |||
Professional fees | 50,981 | |||
Registration fees | 101,380 | |||
Shareholder report expenses | 43,704 | |||
Trustees’ fees and expenses | 21,002 | |||
Other fees and expenses | 8,772 | |||
|
| |||
Total expenses | 512,554 | |||
Less: Fee waivers and/or expense reimbursements |
| |||
Fund-level | (302,526 | ) | ||
Class A | (491 | ) | ||
Class R6 | (117 | ) | ||
Administrator Class | (12 | ) | ||
|
| |||
Net expenses | 209,408 | |||
|
| |||
Net investment income | 791,944 | |||
|
| |||
Realized and unrealized gains (losses) on investments | ||||
Net realized losses on investments | (993,101 | ) | ||
Net change in unrealized gains (losses) on investments | 2,023,097 | |||
|
| |||
Net realized and unrealized gains (losses) on investments | 1,029,996 | |||
|
| |||
Net increase in net assets resulting from operations | $ | 1,821,940 | ||
|
| |||
The accompanying notes are an integral part of these financial statements.
Wells Fargo Low Volatility U.S. Equity Fund | 17
Table of Contents
Statement of changes in net assets
| Year ended July 31, 2020 | Year ended July 31, 2019 | |||||||||||||||
Operations | ||||||||||||||||
Net investment income | $ | 791,944 | $ | 797,854 | ||||||||||||
Net realized gains (losses) on investments | (993,101 | ) | 1,004,676 | |||||||||||||
Net change in unrealized gains (losses) on investments | 2,023,097 | 2,805,492 | ||||||||||||||
|
| |||||||||||||||
Net increase in net assets resulting from operations | 1,821,940 | 4,608,022 | ||||||||||||||
|
| |||||||||||||||
Distributions to shareholders from net investment income and net realized gains | ||||||||||||||||
Class A | (74,979 | ) | (97,183 | ) | ||||||||||||
Class C | (14,949 | ) | (13,679 | ) | ||||||||||||
Class R6 | (59,692 | ) | (88,854 | ) | ||||||||||||
Administrator Class | (5,557 | ) | (8,480 | ) | ||||||||||||
Institutional Class | (2,494,914 | ) | (2,610,423 | ) | ||||||||||||
|
| |||||||||||||||
Total distributions to shareholders | (2,650,091 | ) | (2,818,619 | ) | ||||||||||||
|
| |||||||||||||||
Capital share transactions | Shares | Shares | ||||||||||||||
Proceeds from shares sold |
| |||||||||||||||
Class A | 42,642 | 495,950 | 22,375 | 258,259 | ||||||||||||
Class C | 11,609 | 138,302 | 14,213 | 159,144 | ||||||||||||
Institutional Class | 1,647,036 | 20,200,973 | 98,413 | 1,093,577 | ||||||||||||
|
| |||||||||||||||
| 20,835,225 | 1,510,980 | |||||||||||||||
|
| |||||||||||||||
Reinvestment of distributions |
| |||||||||||||||
Class A | 5,757 | 69,533 | 8,338 | 88,821 | ||||||||||||
Class C | 857 | 10,265 | 567 | 5,999 | ||||||||||||
Institutional Class | 39,816 | 481,655 | 50,399 | 537,420 | ||||||||||||
|
| |||||||||||||||
| 561,453 | 632,240 | |||||||||||||||
|
| |||||||||||||||
Payment for shares redeemed |
| |||||||||||||||
Class A | (35,036 | ) | (396,795 | ) | (16,971 | ) | (182,876 | ) | ||||||||
Class C | (6,078 | ) | (66,025 | ) | (5,662 | ) | (66,877 | ) | ||||||||
Institutional Class | (303,612 | ) | (3,484,213 | ) | (205,601 | ) | (2,340,479 | ) | ||||||||
|
| |||||||||||||||
| (3,947,033 | ) | (2,590,232 | ) | |||||||||||||
|
| |||||||||||||||
Net increase (decrease) in net assets resulting from capital share transactions | 17,449,645 | (447,012 | ) | |||||||||||||
|
| |||||||||||||||
Total increase in net assets | 16,621,494 | 1,342,391 | ||||||||||||||
|
| |||||||||||||||
Net assets | ||||||||||||||||
Beginning of period | 39,714,255 | 38,371,864 | ||||||||||||||
|
| |||||||||||||||
End of period | $ | 56,335,749 | $ | 39,714,255 | ||||||||||||
|
| |||||||||||||||
The accompanying notes are an integral part of these financial statements.
18 | Wells Fargo Low Volatility U.S. Equity Fund
Table of Contents
(For a share outstanding throughout each period)
| Year ended July 31 | ||||||||||||||||
| CLASS A | 2020 | 2019 | 2018 | 20171 | ||||||||||||
Net asset value, beginning of period | $12.09 | $11.56 | $11.21 | $10.00 | ||||||||||||
Net investment income | 0.14 | 0.19 | 0.16 | 0.13 | ||||||||||||
Net realized and unrealized gains (losses) on investments | 0.31 | 1.17 | 0.54 | 1.12 | ||||||||||||
|
|
|
|
|
|
|
| |||||||||
Total from investment operations | 0.45 | 1.36 | 0.70 | 1.25 | ||||||||||||
Distributions to shareholders from | ||||||||||||||||
Net investment income | (0.19 | ) | (0.18 | ) | (0.17 | ) | (0.04 | ) | ||||||||
Net realized gains | (0.35 | ) | (0.65 | ) | (0.18 | ) | 0.00 | |||||||||
|
|
|
|
|
|
|
| |||||||||
Total distributions to shareholders | (0.54 | ) | (0.83 | ) | (0.35 | ) | (0.04 | ) | ||||||||
Net asset value, end of period | $12.00 | $12.09 | $11.56 | $11.21 | ||||||||||||
Total return2 | 3.76 | % | 12.87 | % | 6.32 | % | 12.53 | % | ||||||||
Ratios to average net assets (annualized) | ||||||||||||||||
Gross expenses | 1.34 | % | 1.50 | % | 1.55 | % | 1.61 | % | ||||||||
Net expenses | 0.71 | % | 0.76 | % | 0.83 | % | 0.82 | % | ||||||||
Net investment income | 1.29 | % | 1.83 | % | 1.53 | % | 1.78 | % | ||||||||
Supplemental data | ||||||||||||||||
Portfolio turnover rate | 165 | % | 74 | % | 75 | % | 39 | % | ||||||||
Net assets, end of period (000s omitted) | $1,687 | $1,539 | $1,312 | $1,096 | ||||||||||||
| 1 | For the period from October 31, 2016 (commencement of class operations) to July 31, 2017 |
| 2 | Total return calculations do not include any sales charges. Returns for periods of less than one year are not annualized. |
The accompanying notes are an integral part of these financial statements.
Wells Fargo Low Volatility U.S. Equity Fund | 19
Table of Contents
Financial highlights
(For a share outstanding throughout each period)
| Year ended July 31 | ||||||||||||||||
| CLASS C | 2020 | 2019 | 2018 | 20171 | ||||||||||||
Net asset value, beginning of period | $12.01 | $11.49 | $11.16 | $10.00 | ||||||||||||
Net investment income | 0.05 | 0.11 | 0.08 | �� | 0.08 | |||||||||||
Net realized and unrealized gains (losses) on investments | 0.30 | 1.17 | 0.52 | 1.11 | ||||||||||||
|
|
|
|
|
|
|
| |||||||||
Total from investment operations | 0.35 | 1.28 | 0.60 | 1.19 | ||||||||||||
Distributions to shareholders from | ||||||||||||||||
Net investment income | (0.12 | ) | (0.11 | ) | (0.09 | ) | (0.03 | ) | ||||||||
Net realized gains | (0.35 | ) | (0.65 | ) | (0.18 | ) | 0.00 | |||||||||
|
|
|
|
|
|
|
| |||||||||
Total distributions to shareholders | (0.47 | ) | (0.76 | ) | (0.27 | ) | (0.03 | ) | ||||||||
Net asset value, end of period | $11.89 | $12.01 | $11.49 | $11.16 | ||||||||||||
Total return2 | 2.89 | % | 12.15 | % | 5.45 | % | 11.91 | % | ||||||||
Ratios to average net assets (annualized) | ||||||||||||||||
Gross expenses | 1.93 | % | 2.18 | % | 2.31 | % | 2.40 | % | ||||||||
Net expenses | 1.48 | % | 1.51 | % | 1.58 | % | 1.58 | % | ||||||||
Net investment income | 0.52 | % | 1.10 | % | 0.76 | % | 1.01 | % | ||||||||
Supplemental data | ||||||||||||||||
Portfolio turnover rate | 165 | % | 74 | % | 75 | % | 39 | % | ||||||||
Net assets, end of period (000s omitted) | $377 | $305 | $187 | $112 | ||||||||||||
| 1 | For the period from October 31, 2016 (commencement of class operations) to July 31, 2017 |
| 2 | Total return calculations do not include any sales charges. Returns for periods of less than one year are not annualized. |
The accompanying notes are an integral part of these financial statements.
20 | Wells Fargo Low Volatility U.S. Equity Fund
Table of Contents
Financial highlights
(For a share outstanding throughout each period)
| Year ended July 31 | ||||||||||||||||
| CLASS R6 | 2020 | 2019 | 2018 | 20171 | ||||||||||||
Net asset value, beginning of period | $12.11 | $11.58 | $11.24 | $10.00 | ||||||||||||
Net investment income | 0.20 | 0.26 | 0.22 | 0.18 | ||||||||||||
Net realized and unrealized gains (losses) on investments | 0.30 | 1.15 | 0.52 | 1.11 | ||||||||||||
|
|
|
|
|
|
|
| |||||||||
Total from investment operations | 0.50 | 1.41 | 0.74 | 1.29 | ||||||||||||
Distributions to shareholders from | ||||||||||||||||
Net investment income | (0.25 | ) | (0.23 | ) | (0.22 | ) | (0.05 | ) | ||||||||
Net realized gains | (0.35 | ) | (0.65 | ) | (0.18 | ) | 0.00 | |||||||||
|
|
|
|
|
|
|
| |||||||||
Total distributions to shareholders | (0.60 | ) | (0.88 | ) | (0.40 | ) | (0.05 | ) | ||||||||
Net asset value, end of period | $12.01 | $12.11 | $11.58 | $11.24 | ||||||||||||
Total return2 | 4.10 | % | 13.39 | % | 6.70 | % | 12.94 | % | ||||||||
Ratios to average net assets (annualized) | ||||||||||||||||
Gross expenses | 0.91 | % | 1.07 | % | 1.12 | % | 1.22 | % | ||||||||
Net expenses | 0.30 | % | 0.33 | % | 0.40 | % | 0.40 | % | ||||||||
Net investment income | 1.71 | % | 2.27 | % | 1.96 | % | 2.19 | % | ||||||||
Supplemental data | ||||||||||||||||
Portfolio turnover rate | 165 | % | 74 | % | 75 | % | 39 | % | ||||||||
Net assets, end of period (000s omitted) | $1,207 | $1,217 | $1,164 | $1,129 | ||||||||||||
| 1 | For the period from October 31, 2016 (commencement of class operations) to July 31, 2017 |
| 2 | Returns for periods of less than one year are not annualized. |
The accompanying notes are an integral part of these financial statements.
Wells Fargo Low Volatility U.S. Equity Fund | 21
Table of Contents
Financial highlights
(For a share outstanding throughout each period)
| Year ended July 31 | ||||||||||||||||
| ADMINISTRATOR CLASS | 2020 | 2019 | 2018 | 20171 | ||||||||||||
Net asset value, beginning of period | $12.08 | $11.55 | $11.21 | $10.00 | ||||||||||||
Net investment income | 0.16 | 0.22 | 0.18 | 0.15 | ||||||||||||
Net realized and unrealized gains (losses) on investments | 0.30 | 1.15 | 0.53 | 1.10 | ||||||||||||
|
|
|
|
|
|
|
| |||||||||
Total from investment operations | 0.46 | 1.37 | 0.71 | 1.25 | ||||||||||||
Distributions to shareholders from | ||||||||||||||||
Net investment income | (0.21 | ) | (0.19 | ) | (0.19 | ) | (0.04 | ) | ||||||||
Net realized gains | (0.35 | ) | (0.65 | ) | (0.18 | ) | 0.00 | |||||||||
|
|
|
|
|
|
|
| |||||||||
Total distributions to shareholders | (0.56 | ) | (0.84 | ) | (0.37 | ) | (0.04 | ) | ||||||||
Net asset value, end of period | $11.98 | $12.08 | $11.55 | $11.21 | ||||||||||||
Total return2 | 3.77 | % | 13.00 | % | 6.36 | % | 12.57 | % | ||||||||
Ratios to average net assets (annualized) | ||||||||||||||||
Gross expenses | 1.26 | % | 1.42 | % | 1.47 | % | 1.57 | % | ||||||||
Net expenses | 0.65 | % | 0.68 | % | 0.75 | % | 0.75 | % | ||||||||
Net investment income | 1.36 | % | 1.92 | % | 1.61 | % | 1.87 | % | ||||||||
Supplemental data | ||||||||||||||||
Portfolio turnover rate | 165 | % | 74 | % | 75 | % | 39 | % | ||||||||
Net assets, end of period (000s omitted) | $120 | $121 | $116 | $113 | ||||||||||||
| 1 | For the period from October 31, 2016 (commencement of class operations) to July 31, 2017 |
| 2 | Returns for periods of less than one year are not annualized. |
The accompanying notes are an integral part of these financial statements.
22 | Wells Fargo Low Volatility U.S. Equity Fund
Table of Contents
Financial highlights
(For a share outstanding throughout each period)
| Year ended July 31 | ||||||||||||||||
| INSTITUTIONAL CLASS | 2020 | 2019 | 2018 | 20171 | ||||||||||||
Net asset value, beginning of period | $12.11 | $11.58 | $11.23 | $10.00 | ||||||||||||
Net investment income | 0.19 | 2 | 0.25 | 0.20 | 0.16 | |||||||||||
Net realized and unrealized gains (losses) on investments | 0.29 | 1.15 | 0.54 | 1.12 | ||||||||||||
|
|
|
|
|
|
|
| |||||||||
Total from investment operations | 0.48 | 1.40 | 0.74 | 1.28 | ||||||||||||
Distributions to shareholders from | ||||||||||||||||
Net investment income | (0.21 | ) | (0.22 | ) | (0.21 | ) | (0.05 | ) | ||||||||
Net realized gains | (0.35 | ) | (0.65 | ) | (0.18 | ) | 0.00 | |||||||||
|
|
|
|
|
|
|
| |||||||||
Total distributions to shareholders | (0.56 | ) | (0.87 | ) | (0.39 | ) | (0.05 | ) | ||||||||
Net asset value, end of period | $12.03 | $12.11 | $11.58 | $11.23 | ||||||||||||
Total return3 | 4.01 | % | 13.28 | % | 6.64 | % | 12.82 | % | ||||||||
Ratios to average net assets (annualized) | ||||||||||||||||
Gross expenses | 1.00 | % | 1.17 | % | 1.22 | % | 1.31 | % | ||||||||
Net expenses | 0.40 | % | 0.43 | % | 0.50 | % | 0.50 | % | ||||||||
Net investment income | 1.59 | % | 2.17 | % | 1.87 | % | 2.09 | % | ||||||||
Supplemental data | ||||||||||||||||
Portfolio turnover rate | 165 | % | 74 | % | 75 | % | 39 | % | ||||||||
Net assets, end of period (000s omitted) | $52,944 | $36,533 | $35,593 | $33,169 | ||||||||||||
| 1 | For the period from October 31, 2016 (commencement of class operations) to July 31, 2017 |
| 2 | Calculated based upon average shares outstanding |
| 3 | Returns for periods of less than one year are not annualized. |
The accompanying notes are an integral part of these financial statements.
Wells Fargo Low Volatility U.S. Equity Fund | 23
Table of Contents
1. ORGANIZATION
Wells Fargo Funds Trust (the “Trust”), a Delaware statutory trust organized on March 10, 1999, is an open-end management investment company registered under the Investment Company Act of 1940, as amended (the “1940 Act”). As an investment company, the Trust follows the accounting and reporting guidance in Financial Accounting Standards Board (“FASB”) Accounting Standards Codification Topic 946, Financial Services – Investment Companies. These financial statements report on the Wells Fargo Low Volatility U.S. Equity Fund (the “Fund”) which is a diversified series of the Trust.
2. SIGNIFICANT ACCOUNTING POLICIES
The following significant accounting policies, which are consistently followed in the preparation of the financial statements of the Fund, are in conformity with U.S. generally accepted accounting principles which require management to make estimates and assumptions that affect the reported amounts of assets and liabilities, disclosure of contingent assets and liabilities at the date of the financial statements, and the reported amounts of revenues and expenses during the reporting period. Actual results could differ from those estimates.
Securities valuation
All investments are valued each business day as of the close of regular trading on the New York Stock Exchange (generally 4 p.m. Eastern Time), although the Fund may deviate from this calculation time under unusual or unexpected circumstances.
Equity securities that are listed on a foreign or domestic exchange or market are valued at the official closing price or, if none, the last sales price. If no sale occurs on the principal exchange or market that day, a fair value price will be determined in accordance with the Fund’s Valuation Procedures.
Investments in registered open-end investment companies are valued at net asset value.
Investments which are not valued using any of the methods discussed above are valued at their fair value, as determined in good faith by the Board of Trustees of the Fund. The Board of Trustees has established a Valuation Committee comprised of the Trustees and has delegated to it the authority to take any actions regarding the valuation of portfolio securities that the Valuation Committee deems necessary or appropriate, including determining the fair value of portfolio securities, unless the determination has been delegated to the Wells Fargo Asset Management Pricing Committee at Wells Fargo Funds Management, LLC (“Funds Management”). The Board of Trustees retains the authority to make or ratify any valuation decisions or approve any changes to the Valuation Procedures as it deems appropriate. On a quarterly basis, the Board of Trustees receives reports on any valuation actions taken by the Valuation Committee or the Wells Fargo Asset Management Pricing Committee which may include items for ratification.
Security transactions and income recognition
Securities transactions are recorded on a trade date basis. Realized gains or losses are recorded on the basis of identified cost.
Dividend income is recognized on the ex-dividend date. Dividend income is recorded net of foreign taxes withheld where recovery of such taxes is not assured.
Distributions to shareholders
Distributions to shareholders from net investment income and any net realized gains are recorded on the ex-dividend date and paid at least annually. Such distributions are determined in accordance with income tax regulations and may differ from U.S. generally accepted accounting principles. Dividend sources are estimated at the time of declaration. The tax character of distributions is determined as of the Fund’s fiscal year end. Therefore, a portion of the Fund’s distributions made prior to the Fund’s fiscal year end may be categorized as a tax return of capital at year end.
Federal and other taxes
The Fund intends to continue to qualify as a regulated investment company by distributing substantially all of its investment company taxable income and any net realized capital gains (after reduction for capital loss carryforwards) sufficient to relieve it from all, or substantially all, federal income taxes. Accordingly, no provision for federal income taxes was required.
The Fund’s income and federal excise tax returns and all financial records supporting those returns for the prior three fiscal years are subject to examination by the federal and Delaware revenue authorities. Management has analyzed the Fund’s tax positions taken on federal, state, and foreign tax returns for all open tax years and does not believe that there are any uncertain tax positions that require recognition of a tax liability.
24 | Wells Fargo Low Volatility U.S. Equity Fund
Table of Contents
Notes to financial statements
As of July 31, 2020, the aggregate cost of all investments for federal income tax purposes was $49,125,075 and the unrealized gains (losses) consisted of:
Gross unrealized gains | $ | 7,994,821 | ||
Gross unrealized losses | (730,363) | |||
Net unrealized gains | $ | 7,264,458 | ||
As of July 31, 2020, the Fund had current year deferred post-October capital losses consisting of $2,104,568 in short-term losses which will be recognized on the first day of the following fiscal year.
Class allocations
The separate classes of shares offered by the Fund differ principally in applicable sales charges, distribution, shareholder servicing, and administration fees. Class specific expenses are charged directly to that share class. Investment income, common fund-level expenses, and realized and unrealized gains (losses) on investments are allocated daily to each class of shares based on the relative proportion of net assets of each class.
3. FAIR VALUATION MEASUREMENTS
Fair value measurements of investments are determined within a framework that has established a fair value hierarchy based upon the various data inputs utilized in determining the value of the Fund’s investments. The three-level hierarchy gives the highest priority to unadjusted quoted prices in active markets for identical assets or liabilities (Level 1) and the lowest priority to unobservable inputs (Level 3). The Fund’s investments are classified within the fair value hierarchy based on the lowest level of input that is significant to the fair value measurement. The inputs are summarized into three broad levels as follows:
| ∎ | Level 1 – quoted prices in active markets for identical securities |
| ∎ | Level 2 – other significant observable inputs (including quoted prices for similar securities, interest rates, prepayment speeds, credit risk, etc.) |
| ∎ | Level 3 – significant unobservable inputs (including the Fund’s own assumptions in determining the fair value of investments) |
The inputs or methodologies used for valuing investments in securities are not necessarily an indication of the risk associated with investing in those securities.
The following is a summary of the inputs used in valuing the Fund’s assets and liabilities as of July 31, 2020:
| Quoted prices (Level 1) | Other significant observable inputs (Level 2) | Significant (Level 3) | Total | |||||||||||||
Assets | ||||||||||||||||
Investments in: | ||||||||||||||||
Common stocks | ||||||||||||||||
Communication services | $ | 5,511,475 | $ | 0 | $ | 0 | $ | 5,511,475 | ||||||||
Consumer discretionary | 6,172,338 | 0 | 0 | 6,172,338 | ||||||||||||
Consumer staples | 16,349,050 | 0 | 0 | 16,349,050 | ||||||||||||
Energy | 24,268 | 0 | 0 | 24,268 | ||||||||||||
Financials | 3,072,500 | 0 | 0 | 3,072,500 | ||||||||||||
Health care | 9,786,604 | 0 | 0 | 9,786,604 | ||||||||||||
Industrials | 6,100,340 | 0 | 0 | 6,100,340 | ||||||||||||
Information technology | 4,829,508 | 0 | 0 | 4,829,508 | ||||||||||||
Materials | 2,981,172 | 0 | 0 | 2,981,172 | ||||||||||||
Utilities | 347,692 | 0 | 0 | 347,692 | ||||||||||||
Short-term investments | ||||||||||||||||
Investment companies | 1,214,586 | 0 | 0 | 1,214,586 | ||||||||||||
Total assets | $ | 56,389,533 | $ | 0 | $ | 0 | $ | 56,389,533 | ||||||||
Additional sector, industry or geographic detail is included in the Portfolio of Investments.
For the year ended July 31, 2020, the Fund did not have any transfers into/out of Level 3.
Wells Fargo Low Volatility U.S. Equity Fund | 25
Table of Contents
Notes to financial statements
4. TRANSACTIONS WITH AFFILIATES
Management fee
Funds Management, an indirect wholly owned subsidiary of Wells Fargo & Company (“Wells Fargo”), is the manager of the Fund and provides advisory and fund-level administrative services under an investment management agreement. Under the investment management agreement, Funds Management is responsible for, among other services, implementing the investment objectives and strategies of the Fund, supervising the subadviser and providing fund-level administrative services in connection with the Fund’s operations. As compensation for its services under the investment management agreement, Funds Management is entitled to receive a management fee at the following annual rate based on the Fund’s average daily net assets:
| Average daily net assets | Management fee | |||
First $1 billion | 0.400 | % | ||
Next $4 billion | 0.375 | |||
Next $5 billion | 0.340 | |||
Over $10 billion | 0.330 | |||
For the year ended July 31, 2020, the management fee was equivalent to an annual rate of 0.40% of the Fund’s average daily net assets.
Funds Management has retained the services of a subadviser to provide daily portfolio management to the Fund. The fee for subadvisory services is borne by Funds Management. Wells Capital Management Incorporated, an affiliate of Funds Management and an indirect wholly owned subsidiary of Wells Fargo, is the subadviser to the Fund and is entitled to receive a fee from Funds Management at an annual rate starting at 0.20% and declining to 0.12% as the average daily net assets of the Fund increase.
Administration fee
Under a class-level administration agreement, Funds Management provides class-level administrative services to the Fund, which includes paying fees and expenses for services provided by the transfer agent, sub-transfer agents, omnibus account servicers and record-keepers. As compensation for its services under the class-level administration agreement, Funds Management receives an annual fee which is calculated based on the average daily net assets of each class as follows:
| Class-level administration fee | ||||
Class A, Class C | 0.21 | % | ||
Class R6 | 0.03 | |||
Administrator Class, Institutional Class | 0.13 | |||
Waivers and/or expense reimbursements
Funds Management has contractually waived and/or reimbursed management and administration fees to the extent necessary to maintain certain net operating expense ratios for the Fund. When each class of the Fund has exceeded its expense cap, Funds Management has waived fees and/or reimbursed expenses from fund-level expenses on a proportionate basis and then from class specific expenses. When only certain classes exceed their expense caps, waivers and/or reimbursements are applied against class specific expenses before fund-level expenses. Funds Management has committed through November 30, 2020 to waive fees and/or reimburse expenses to the extent necessary to cap the Fund’s expenses at 0.73% for Class A shares, 1.48% for Class C shares, 0.30% for Class R6 shares, 0.65% for Administrator Class shares, and 0.40% for Institutional Class shares. Prior to or after the commitment expiration date, the cap may be increased or the commitment to maintain the cap may be terminated only with the approval of the Board of Trustees.
Distribution fee
The Trust has adopted a distribution plan for Class C shares of the Fund pursuant to Rule 12b-1 under the 1940 Act. A distribution fee is charged to Class C shares and paid to Wells Fargo Funds Distributor, LLC (“Funds Distributor”), the principal underwriter, at an annual rate of 0.75% of the average daily net assets of Class C shares.
In addition, Funds Distributor is entitled to receive the front-end sales charge from the purchase of Class A shares and a contingent deferred sales charge on the redemption of certain Class A shares. Funds Distributor is also entitled to receive the contingent deferred sales charges from redemptions of Class C shares. Funds Distributor did not receive any front-end or contingent deferred sales charges from Class A or Class C shares for the year ended July 31, 2020.
26 | Wells Fargo Low Volatility U.S. Equity Fund
Table of Contents
Notes to financial statements
Shareholder servicing fees
The Trust has entered into contracts with one or more shareholder servicing agents, whereby Class A, Class C, and Administrator Class of the Fund are charged a fee at an annual rate of 0.25% of the average daily net assets of each respective class. A portion of these total shareholder servicing fees were paid to affiliates of Wells Fargo.
Interfund transactions
The Fund may purchase or sell portfolio investment securities to certain other Wells Fargo affiliates pursuant to Rule 17a-7 under the 1940 Act and under procedures adopted by the Board of Trustees. The procedures have been designed to ensure that these interfund transactions, which do not incur broker commissions, are effected at current market prices.
5. INVESTMENT PORTFOLIO TRANSACTIONS
Purchases and sales of investments, excluding U.S. government obligations (if any) and short-term securities, for the year ended July 31, 2020 were $96,281,873 and $80,661,260, respectively.
6. BANK BORROWINGS
The Trust (excluding the money market funds), Wells Fargo Master Trust and Wells Fargo Variable Trust are parties to a $350,000,000 revolving credit agreement whereby the Fund is permitted to use bank borrowings for temporary or emergency purposes, such as to fund shareholder redemption requests. Interest under the credit agreement is charged to the Fund based on a borrowing rate equal to the higher of the Federal Funds rate in effect on that day plus 1.25% or the overnight LIBOR rate in effect on that day plus 1.25%. In addition, an annual commitment fee equal to 0.25% of the unused balance is allocated to each participating fund.
For the year ended July 31, 2020, there were no borrowings by the Fund under the agreement.
7. DISTRIBUTIONS TO SHAREHOLDERS
The tax character of distributions paid during the years ended July 31, 2020 and July 31, 2019 were as follows:
| Year ended July 31 | ||||||||
| 2020 | 2019 | |||||||
Ordinary income | $ | 1,028,365 | $ | 979,209 | ||||
Long-term capital gain | 1,621,726 | 1,839,410 | ||||||
As of July 31, 2020, the components of distributable earnings on a tax basis were as follows:
Undistributed ordinary income | Undistributed long-term gain | Unrealized gains | Post-October capital losses deferred | |||
| $222,583 | $15,295 | $7,264,458 | $(2,104,568) | |||
8. CONCENTRATION RISK
Concentration risks result from exposure to a limited number of sectors. As of the end of the period, the Fund invested a concentration of its portfolio in the consumer staples sector. A fund that invests a substantial portion of its assets in any sector may be more affected by changes in that sector than would be a fund whose investments are not heavily weighted in any sector.
9. INDEMNIFICATION
Under the Trust’s organizational documents, the officers and Trustees have been granted certain indemnification rights against certain liabilities that may arise out of performance of their duties to the Trust. The Fund has entered into a separate agreement with each Trustee that converts indemnification rights currently existing under the Trust’s organizational documents into contractual rights that cannot be changed in the future without the consent of the Trustee. Additionally, in the normal course of business, the Trust may enter into contracts with service providers that contain a variety of indemnification clauses. The Trust’s maximum exposure under these arrangements is dependent on future claims that may be made against the Fund and, therefore, cannot be estimated.
Wells Fargo Low Volatility U.S. Equity Fund | 27
Table of Contents
Notes to financial statements
10. NEW ACCOUNTING PRONOUNCEMENT
In August 2018, FASB issued Accounting Standards Update (“ASU”) No. 2018-13, Fair Value Measurement (Topic 820) Disclosure Framework—Changes to the Disclosure Requirements for Fair Value Measurement. ASU 2018-13 updates the disclosure requirements on fair value measurements in Topic 820, Fair Value Measurements. The amendments are effective for fiscal years, and interim periods within those fiscal years, beginning after December 15, 2019. Management has adopted this guidance which did not have a material impact on the financial statements.
11. CORONAVIRUS (COVID-19) PANDEMIC
On March 11, 2020, the World Health Organization announced that it had made the assessment that coronavirus disease 2019 (“COVID-19”) is a pandemic. The impacts of COVID-19 are adversely affecting the entire global economy, individual companies and investment products, and the market in general. There is significant uncertainty around the extent and duration of business disruptions related to COVID-19 and the impacts may be short term or may last for an extended period of time. The risk of further spreading of COVID-19 has led to significant uncertainty and volatility in the financial markets.
28 | Wells Fargo Low Volatility U.S. Equity Fund
Table of Contents
Report of independent registered public accounting firm
To the Shareholders of the Fund and Board of Trustees
Wells Fargo Funds Trust:
Opinion on the Financial Statements
We have audited the accompanying statement of assets and liabilities of Wells Fargo Low Volatility U.S. Equity Fund (the Fund), one of the funds constituting Wells Fargo Funds Trust, including the portfolio of investments, as of July 31, 2020, the related statement of operations for the year then ended, the statements of changes in net assets for each of the years in the two-year period then ended, and the related notes (collectively, the financial statements) and the financial highlights for each of the years or periods from October 31, 2016 (commencement of operations) to July 31, 2020. In our opinion, the financial statements and financial highlights present fairly, in all material respects, the financial position of the Fund as of July 31, 2020, the results of its operations for the year then ended, the changes in its net assets for each of the years in the two-year period then ended, and the financial highlights for each of the years or periods from October 31, 2016 to July 31, 2020, in conformity with U.S. generally accepted accounting principles.
Basis for Opinion
These financial statements and financial highlights are the responsibility of the Fund’s management. Our responsibility is to express an opinion on these financial statements and financial highlights based on our audits. We are a public accounting firm registered with the Public Company Accounting Oversight Board (United States) (PCAOB) and are required to be independent with respect to the Fund in accordance with the U.S. federal securities laws and the applicable rules and regulations of the Securities and Exchange Commission and the PCAOB.
We conducted our audits in accordance with the standards of the PCAOB. Those standards require that we plan and perform the audit to obtain reasonable assurance about whether the financial statements and financial highlights are free of material misstatement, whether due to error or fraud. Our audits included performing procedures to assess the risks of material misstatement of the financial statements and financial highlights, whether due to error or fraud, and performing procedures that respond to those risks. Such procedures included examining, on a test basis, evidence regarding the amounts and disclosures in the financial statements and financial highlights. Such procedures also included confirmation of securities owned as of July 31, 2020, by correspondence with the custodian and transfer agent. Our audits also included evaluating the accounting principles used and significant estimates made by management, as well as evaluating the overall presentation of the financial statements and financial highlights. We believe that our audits provide a reasonable basis for our opinion.

We have not been able to determine the specific year that we began serving as the auditor of one or more Wells Fargo Funds investment companies; however we are aware that we have served as the auditor of one or more Wells Fargo Funds investment companies since at least 1955.
Boston, Massachusetts
September 25, 2020
Wells Fargo Low Volatility U.S. Equity Fund | 29
Table of Contents
TAX INFORMATION
For corporate shareholders, pursuant to Section 854 of the Internal Revenue Code, 93.12% of ordinary income dividends qualify for the corporate dividends-received deduction for the fiscal year ended July 31, 2020.
Pursuant to Section 852 of the Internal Revenue Code, $1,621,726 was designated as a 20% rate gain distribution for the fiscal year ended July 31, 2020.
Pursuant to Section 854 of the Internal Revenue Code, $978,480 of income dividends paid during the fiscal year ended July 31, 2020 has been designated as qualified dividend income (QDI).
For the fiscal year ended July 31, 2020, $19,768 has been designated as interest-related dividends for nonresident alien shareholders pursuant to Section 871 of the Internal Revenue Code.
For the fiscal year ended July 31, 2020, $15,386 has been designated as short-term capital gain dividends for nonresident alien shareholders pursuant to Section 871 of the Internal Revenue Code.
PROXY VOTING INFORMATION
A description of the policies and procedures used to determine how to vote proxies relating to portfolio securities is available, upon request, by calling 1-800-222-8222, visiting our website at wfam.com, or visiting the SEC website at sec.gov. Information regarding how the proxies related to portfolio securities were voted during the most recent 12-month period ended June 30 is available on the website at wfam.com or by visiting the SEC website at sec.gov.
QUARTERLY PORTFOLIO HOLDINGS INFORMATION
The Fund files its complete schedule of portfolio holdings with the SEC for the first and third quarters of each fiscal year as an exhibit to its reports on Form N-PORT. Shareholders may view the filed Form N-PORT by visiting the SEC website at sec.gov.
30 | Wells Fargo Low Volatility U.S. Equity Fund
Table of Contents
Other information (unaudited)
BOARD OF TRUSTEES AND OFFICERS
Each of the Trustees and Officers1 listed in the table below acts in identical capacities for each fund in the Wells Fargo family of funds, which consists of 147 mutual funds comprising the Wells Fargo Funds Trust, Wells Fargo Variable Trust, Wells Fargo Master Trust and four closed-end funds (collectively the “Fund Complex”). This table should be read in conjunction with the Prospectus and the Statement of Additional Information2. The mailing address of each Trustee and Officer is 525 Market Street, 12th Floor, San Francisco, CA 94105. Each Trustee and Officer serves an indefinite term, however, each Trustee serves such term until reaching the mandatory retirement age established by the Trustees.
Independent Trustees
Name and year of birth | Position held and length of service* | Principal occupations during past five years or longer | Current other public company or investment company directorships | |||
William R. Ebsworth (Born 1957) | Trustee, since 2015 | Retired. From 1984 to 2013, equities analyst, portfolio manager, research director and chief investment officer at Fidelity Management and Research Company in Boston, Tokyo, and Hong Kong, and retired in 2013 as Chief Investment Officer of Fidelity Strategic Advisers, Inc. where he led a team of investment professionals managing client assets. Prior thereto, Board member of Hong Kong Securities Clearing Co., Hong Kong Options Clearing Corp., the Thailand International Fund, Ltd., Fidelity Investments Life Insurance Company, and Empire Fidelity Investments Life Insurance Company. Audit Committee Chair and Investment Committee Chair of the Vincent Memorial Hospital Endowment (non-profit organization). Mr. Ebsworth is a CFA® charterholder. | N/A | |||
Jane A. Freeman (Born 1953) | Trustee, since 2015; Chair Liaison, since 2018 | Retired. From 2012 to 2014 and 1999 to 2008, Chief Financial Officer of Scientific Learning Corporation. From 2008 to 2012, Ms. Freeman provided consulting services related to strategic business projects. Prior to 1999, Portfolio Manager at Rockefeller & Co. and Scudder, Stevens & Clark. Board member of the Harding Loevner Funds from 1996 to 2014, serving as both Lead Independent Director and chair of the Audit Committee. Board member of the Russell Exchange Traded Funds Trust from 2011 to 2012 and the chair of the Audit Committee. Ms. Freeman is also an inactive Chartered Financial Analyst. | N/A | |||
Isaiah Harris, Jr. (Born 1952) | Trustee, since 2009; Audit Committee Chairman, since 2019 | Retired. Chairman of the Board of CIGNA Corporation since 2009, and Director since 2005. From 2003 to 2011, Director of Deluxe Corporation. Prior thereto, President and CEO of BellSouth Advertising and Publishing Corp. from 2005 to 2007, President and CEO of BellSouth Enterprises from 2004 to 2005 and President of BellSouth Consumer Services from 2000 to 2003. Emeritus member of the Iowa State University Foundation Board of Governors. Emeritus Member of the Advisory Board of Iowa State University School of Business. Advisory Board Member, Palm Harbor Academy (private school). Advisory Board Member, Child Evangelism Fellowship (non-profit). Mr. Harris is a certified public accountant (inactive status). | CIGNA Corporation | |||
Judith M. Johnson (Born 1949) | Trustee, since 2008; Audit Committee Chairman, from 2009 to 2018 | Retired. Prior thereto, Chief Executive Officer and Chief Investment Officer of Minneapolis Employees Retirement Fund from 1996 to 2008. Ms. Johnson is an attorney, certified public accountant and a certified managerial accountant. | N/A | |||
David F. Larcker (Born 1950) | Trustee, since 2009 | James Irvin Miller Professor of Accounting at the Graduate School of Business, Stanford University, Director of the Corporate Governance Research Initiative and Senior Faculty of The Rock Center for Corporate Governance since 2006. From 2005 to 2008, Professor of Accounting at the Graduate School of Business, Stanford University. Prior thereto, Ernst & Young Professor of Accounting at The Wharton School, University of Pennsylvania from 1985 to 2005. | N/A | |||
Wells Fargo Low Volatility U.S. Equity Fund | 31
Table of Contents
Other information (unaudited)
Name and year of birth | Position held and length of service* | Principal occupations during past five years or longer | Current other public company or investment company directorships | |||
Olivia S. Mitchell (Born 1953) | Trustee, since 2006; Nominating and Governance Committee Chair, since 2018 | International Foundation of Employee Benefit Plans Professor, Wharton School of the University of Pennsylvania since 1993. Director of Wharton’s Pension Research Council and Boettner Center on Pensions & Retirement Research, and Research Associate at the National Bureau of Economic Research. Previously, Cornell University Professor from 1978 to 1993. | N/A | |||
Timothy J. Penny (Born 1951) | Trustee, since 1996; Chairman, since 2018 | President and Chief Executive Officer of Southern Minnesota Initiative Foundation, a non-profit organization, since 2007. Member of the Board of Trustees of NorthStar Education Finance, Inc., a non-profit organization, since 2007. | N/A | |||
James G. Polisson (Born 1959) | Trustee, since 2018 | Retired. Chief Marketing Officer, Source (ETF) UK Services, Ltd, from 2015 to 2017. From 2012 to 2015, Principal of The Polisson Group, LLC, a management consulting, corporate advisory and principal investing company. Chief Executive Officer and Managing Director at Russell Investments, Global Exchange Traded Funds from 2010 to 2012. Managing Director of Barclays Global Investors from 1998 to 2010 and Global Chief Marketing Officer for iShares and Barclays Global Investors from 2000 to 2010. Trustee of the San Francisco Mechanics’ Institute, a non-profit organization, from 2013 to 2015. Board member of the Russell Exchange Traded Fund Trust from 2011 to 2012. Director of Barclays Global Investors Holdings Deutschland GmbH from 2006 to 2009. Mr. Polisson is an attorney and has a retired status with the Massachusetts and District of Columbia Bar Associations. | N/A | |||
Pamela Wheelock (Born 1959) | Trustee, since January 2020; previously Trustee from January 2018 to July 2019 | Board member of the Destination Medical Center Economic Development Agency, Rochester, Minnesota since 2019 and Interim President of the McKnight Foundation since 2020. Acting Commissioner, Minnesota Department of Human Services, July 2019 through September 2019. Human Services Manager (part-time), Minnesota Department of Human Services, October 2019 through December 2019. Chief Operating Officer, Twin Cities Habitat for Humanity from 2017 to 2019. Vice President of University Services, University of Minnesota from 2012 to 2016. Prior thereto, on the Board of Directors, Governance Committee and Finance Committee for the Minnesota Philanthropy Partners (Saint Paul Foundation) from 2012 to 2018, Interim Chief Executive Officer of Blue Cross Blue Shield of Minnesota from 2011 to 2012, Chairman of the Board from 2009 to 2012 and Board Director from 2003 to 2015. Vice President, Leadership and Community Engagement, Bush Foundation, Saint Paul, Minnesota (a private foundation) from 2009 to 2011. Executive Vice President and Chief Financial Officer, Minnesota Sports and Entertainment from 2004 to 2009 and Senior Vice President from 2002 to 2004. Executive Vice President of the Minnesota Wild Foundation from 2004 to 2008. Commissioner of Finance, State of Minnesota, from 1999 to 2002. Currently Board Chair of the Minnesota Wild Foundation since 2010. | N/A | |||
| * | Length of service dates reflect the Trustee’s commencement of service with the Trust’s predecessor entities, where applicable. |
32 | Wells Fargo Low Volatility U.S. Equity Fund
Table of Contents
Other information (unaudited)
Officers
Name and year of birth | Position held and length of service | Principal occupations during past five years or longer | ||
Andrew Owen (Born 1960) | President, since 2017 | Executive Vice President of Wells Fargo & Company and Head of Affiliated Managers, Wells Fargo Asset Management, since 2014. In addition, Mr. Owen is currently President, Chief Executive Officer and Director of Wells Fargo Funds Management, LLC since 2017. Prior thereto, Executive Vice President responsible for marketing, investments and product development for Wells Fargo Funds Management, LLC, from 2009 to 2014. | ||
Nancy Wiser1 (Born 1967) | Treasurer, since 2012 | Executive Vice President of Wells Fargo Funds Management, LLC since 2011. Chief Operating Officer and Chief Compliance Officer at LightBox Capital Management LLC, from 2008 to 2011. | ||
Michelle Rhee (Born 1966) | Chief Legal Officer, since 2019 | Secretary of Wells Fargo Funds Management, LLC, Chief Legal Counsel of Wells Fargo Asset Management and Assistant General Counsel of Wells Fargo Bank, N.A. since 2018. Associate General Counsel and Managing Director of Bank of America Corporation from 2004 to 2018. | ||
Catherine Kennedy (Born 1969) | Secretary, since 2019 | Vice President of Wells Fargo Funds Management, LLC and Senior Counsel of the Wells Fargo Legal Department since 2010. Vice President and Senior Counsel of Evergreen Investment Management Company, LLC from 1998 to 2010. | ||
Michael H. Whitaker (Born 1967) | Chief Compliance Officer, since 2016 | Chief Compliance Officer of Wells Fargo Asset Management since 2016. Senior Vice President and Chief Compliance Officer for Fidelity Investments from 2007 to 2016. | ||
David Berardi (Born 1975) | Assistant Treasurer, since 2009 | Vice President of Wells Fargo Funds Management, LLC since 2009. Vice President of Evergreen Investment Management Company, LLC from 2008 to 2010. Manager of Fund Reporting and Control for Evergreen Investment Management Company, LLC from 2004 to 2010. | ||
Jeremy DePalma1 (Born 1974) | Assistant Treasurer, since 2009 | Senior Vice President of Wells Fargo Funds Management, LLC since 2009. Senior Vice President of Evergreen Investment Management Company, LLC from 2008 to 2010 and head of the Fund Reporting and Control Team within Fund Administration from 2005 to 2010. | ||
| 1 | Nancy Wiser acts as Treasurer of 65 funds in the Fund Complex. Jeremy DePalma acts as the Treasurer of 82 funds and Assistant Treasurer of 65 funds in the Fund Complex. |
| 2 | The Statement of Additional Information includes additional information about the Trustees and is available, without charge, upon request, by calling 1-800-222-8222 or by visiting the website at wfam.com. |
Wells Fargo Low Volatility U.S. Equity Fund | 33
Table of Contents
Other information (unaudited)
BOARD CONSIDERATION OF INVESTMENT MANAGEMENT AND SUB-ADVISORY AGREEMENTS:
Wells Fargo Low Volatility U.S. Equity Fund
Under the Investment Company Act of 1940 (the “1940 Act”), the Board of Trustees (the “Board”) of Wells Fargo Funds Trust (the “Trust”) must determine annually whether to approve the continuation of the Trust’s investment management and sub-advisory agreements. In this regard, at a Board meeting held on May 26, 2020 and May 28, 2020 (together, the “Meeting”), the Board, all the members of which have no direct or indirect interest in the investment management and sub-advisory agreements and are not “interested persons” of the Trust, as defined in the 1940 Act (the “Independent Trustees”), reviewed and approved for Wells Fargo Low Volatility U.S. Equity Fund (the “Fund”): (i) an investment management agreement (the “Management Agreement”) with Wells Fargo Funds Management, LLC (“Funds Management”); and (ii) an investment sub-advisory agreement (the “Sub-Advisory Agreement”) with Wells Capital Management Incorporated (the “Sub-Adviser”), an affiliate of Funds Management. The Management Agreement and the Sub-Advisory Agreement are collectively referred to as the “Advisory Agreements.”
At the Meeting, the Board considered the factors and reached the conclusions described below relating to the selection of Funds Management and the Sub-Adviser and the approval of the Advisory Agreements. Prior to the Meeting, including at a Board meeting held in April 2020, the Trustees conferred extensively among themselves and with representatives of Funds Management about these matters. Also, the Board has adopted a team-based approach, with each team consisting of a sub-set of Trustees, to assist the full Board in the discharge of its duties in reviewing investment performance and other matters throughout the year. The Independent Trustees were assisted in their evaluation of the Advisory Agreements by independent legal counsel, from whom they received separate legal advice and with whom they met separately.
In providing information to the Board, Funds Management and the Sub-Adviser were guided by a detailed set of requests for information submitted to them by independent legal counsel on behalf of the Independent Trustees at the start of the Board’s annual contract renewal process earlier in 2020. In considering and approving the Advisory Agreements, the Trustees considered the information they believed relevant, including but not limited to the information discussed below. The Board considered not only the specific information presented in connection with the Meeting, but also the knowledge gained over time through interaction with Funds Management and the Sub-Adviser about various topics. In this regard, the Board reviewed reports of Funds Management at each of its quarterly meetings, which included, among other things, portfolio reviews and investment performance reports. In addition, the Board and the teams mentioned above confer with portfolio managers at various times throughout the year. The Board did not identify any particular information or consideration that was all-important or controlling, and each individual Trustee may have attributed different weights to various factors.
After its deliberations, the Board unanimously approved the continuation of the Advisory Agreements for a one-year term and determined that the compensation payable to Funds Management and the Sub-Adviser under each of the Advisory Agreements was reasonable. The Board considered the approval of the Advisory Agreements for the Fund as part of its consideration of agreements for funds across the complex, but its approvals were made on a fund-by-fund basis. The following summarizes a number of important, but not necessarily all, factors considered by the Board in support of its approvals.
Nature, extent and quality of services
The Board received and considered various information regarding the nature, extent and quality of services provided to the Fund by Funds Management and the Sub-Adviser under the Advisory Agreements. This information included a description of the investment advisory services and Fund-level administrative services covered by the Management Agreement, as well as, among other things, a summary of the background and experience of senior management of Wells Fargo Asset Management (“WFAM”), of which Funds Management and the Sub-Adviser are a part, and a summary of investments made in the business of WFAM. The Board also received a description of Funds Management’s and the Sub-Adviser’s business continuity plans and of their approaches to data privacy and cybersecurity, and related testing. The Board also received and reviewed information about Funds Management’s role as administrator of the Fund’s liquidity risk management program, Funds Management’s approach to risk management, and Funds Management’s intermediary and vendor oversight program.
The Board also considered the qualifications, background, tenure and responsibilities of each of the portfolio managers primarily responsible for the day-to-day portfolio management of the Fund. The Board evaluated the ability of Funds Management and the Sub-Adviser to attract and retain qualified investment professionals, including research, advisory and supervisory personnel. The Board further considered the compliance programs and compliance records of Funds Management and the Sub-Adviser. In addition, the Board took into account the full range of services provided to the Fund by Funds Management and its affiliates.
34 | Wells Fargo Low Volatility U.S. Equity Fund
Table of Contents
Other information (unaudited)
Fund investment performance and expenses
The Board considered the investment performance results for the Fund over various time periods ended December 31, 2019. The Board also considered more current results for various time periods ended March 31, 2020. The Board considered these results in comparison to the investment performance of funds in a universe that was determined by Broadridge Inc. (“Broadridge”) to be similar to the Fund (the “Universe”), and in comparison to the Fund’s benchmark index and to other comparative data. Broadridge is an independent provider of investment company data. The Board received a description of the methodology used by Broadridge to select the mutual funds in the performance Universe. The Board noted that the investment performance of the Fund (Administrator Class) was lower than the average investment performance of the Universe for the one- and three-year periods ended December 31, 2019. The Board also noted that the investment performance of the Fund (Administrator Class) was higher than or in range of the average investment performance of the Universe for all periods ended March 31, 2020. The Board also noted that the investment performance of the Fund was lower than its benchmark index, the Russell 1000® Index, for all periods ended December 31, 2019. The Board also noted that the investment performance of the Fund was lower than its benchmark index, the Russell 1000® Index, all periods ended March 31, 2020.
The Board received information concerning, and discussed factors contributing to, the underperformance of the Fund relative to the Universe and benchmark for the periods identified above. The Board took note of the explanations for the relative underperformance during these periods. The Board also took note of the Fund’s lower volatility compared to its benchmark.
The Board also received and considered information regarding the Fund’s net operating expense ratios and their various components, including actual management fees, custodian and other non-management fees, and Rule 12b-1 and non-Rule 12b-1 shareholder service fees. The Board considered these ratios in comparison to the median ratios of funds in class-specific expense groups that were determined by Broadridge to be similar to the Fund (the “Groups”). The Board received a description of the methodology used by Broadridge to select the mutual funds in the expense Groups and an explanation of how funds comprising expense groups and their expense ratios may vary from year-to-year. Based on the Broadridge reports, the Board noted that the net operating expense ratios of the Fund were lower than the median net operating expense ratios of the expense Groups for all share classes.
The Board took into account the Fund’s investment performance and expense information provided to it among the factors considered in deciding to re-approve the Advisory Agreements.
Investment management and sub-advisory fee rates
The Board reviewed and considered the contractual fee rates payable by the Fund to Funds Management under the Management Agreement, as well as the contractual fee rates payable by the Fund to Funds Management for class-level administrative services under a Class-Level Administration Agreement, which include, among other things, class-level transfer agency and sub-transfer agency costs (collectively, the “Management Rates”). The Board also reviewed and considered the contractual investment sub-advisory fee rates that are payable by Funds Management to the Sub-Adviser for investment sub-advisory services.
Among other information reviewed by the Board was a comparison of the Fund’s Management Rates with the average contractual investment management fee rates of funds in the expense Groups at a common asset level as well as transfer agency costs of the funds in the expense Groups. The Board noted that the Management Rates of the Fund were lower than the sum of these average rates for the Fund’s expense Groups for all share classes.
The Board also received and considered information about the portion of the total management fee that was retained by Funds Management after payment of the fee to the Sub-Adviser for sub-advisory services. In assessing the reasonableness of this amount, the Board received and evaluated information about the nature and extent of responsibilities retained and risks assumed by Funds Management and not delegated to or assumed by the Sub-Adviser, and about Funds Management’s on-going oversight services. Given the affiliation between Funds Management and the Sub-Adviser, the Board ascribed limited relevance to the allocation of fees between them.
The Board also received and considered information about the nature and extent of services offered and fee rates charged by Funds Management and the Sub-Adviser to other types of clients with investment strategies similar to those of the Fund. In this regard, the Board received information about the significantly greater scope of services, and compliance, reporting and other legal burdens and risks of managing proprietary mutual funds compared with those associated with managing assets of other types of clients, including third-party sub-advised fund clients and non-mutual fund clients such as institutional separate accounts.
Based on its consideration of the factors and information it deemed relevant, including those described here, the Board determined that the compensation payable to Funds Management under the Management Agreement and to the Sub-Adviser under the Sub-Advisory Agreement was reasonable.
Wells Fargo Low Volatility U.S. Equity Fund | 35
Table of Contents
Other information (unaudited)
Profitability
The Board received and considered information concerning the profitability of Funds Management, as well as the profitability of both WFAM and Wells Fargo & Co. (“Wells Fargo”) from providing services to the fund family as a whole. The Board noted that the Sub-Adviser’s profitability information with respect to providing services to the Fund and other funds in the family was subsumed in the WFAM and Wells Fargo profitability analysis.
Funds Management reported on the methodologies and estimates used in calculating profitability, including a description of the methodology used to allocate certain expenses. Among other things, the Board noted that the levels of profitability reported on a fund-by-fund basis varied widely, depending on factors such as the size, type and age of fund.
Based on its review, the Board did not deem the profits reported by Funds Management, WFAM or Wells Fargo from services provided to the Fund to be at a level that would prevent it from approving the continuation of the Advisory Agreements.
Economies of scale
The Board received and considered information about the potential for Funds Management to experience economies of scale in the provision of management services to the Fund, the difficulties of calculating economies of scale at an individual fund level, and the extent to which potential scale benefits are shared with shareholders. The Board noted the existence of breakpoints in the Fund’s management fee structure, which operate generally to reduce the Fund’s expense ratios as the Fund grows in size, and the size of the Fund in relation to such breakpoints. The Board considered that in addition to management fee breakpoints, Funds Management shares potential economies of scale from its management business in a variety of ways, including through fee waiver and expense reimbursement arrangements, services that benefit shareholders, competitive management fee rates set at the outset without regard to breakpoints, and investments in the business intended to enhance services available to shareholders.
The Board concluded that Funds Management’s arrangements with respect to the Fund, including contractual breakpoints, constituted a reasonable approach to sharing potential economies of scale with the Fund and its shareholders.
Other benefits to Funds Management and the Sub-Adviser
The Board received and considered information regarding potential “fall-out” or ancillary benefits received by Funds Management and its affiliates, including the Sub-Adviser, as a result of their relationships with the Fund. Ancillary benefits could include, among others, benefits directly attributable to other relationships with the Fund and benefits potentially derived from an increase in Funds Management’s and the Sub-Adviser’s business as a result of their relationships with the Fund. The Board noted that various affiliates of Funds Management may receive distribution-related fees, shareholder servicing payments and sub-transfer agency fees in respect of shares sold or held through them and services provided.
The Board also reviewed information about soft dollar credits earned and utilized by the Sub-Adviser, fees earned by Funds Management and the Sub-Adviser from managing a private investment vehicle for the fund family’s securities lending collateral, and commissions earned by an affiliated broker from portfolio transactions.
Based on its consideration of the factors and information it deemed relevant, including those described here, the Board did not find that any ancillary benefits received by Funds Management and its affiliates, including the Sub-Adviser, were unreasonable.
Conclusion
At the Meeting, after considering the above-described factors and based on its deliberations and its evaluation of the information described above, the Board unanimously approved the continuation of the Advisory Agreements for a one-year term and determined that the compensation payable to Funds Management and the Sub-Adviser under each of the Advisory Agreements was reasonable.
36 | Wells Fargo Low Volatility U.S. Equity Fund
Table of Contents
Other information (unaudited)
LIQUIDITY RISK MANAGEMENT PROGRAM
In accordance with Rule 22e-4 under the Investment Company Act of 1940, as amended (the “Liquidity Rule”), Wells Fargo Funds Trust (the “Trust”) has adopted and implemented a liquidity risk management program (the “Program”) on behalf of each of its series, including the Fund, which is reasonably designed to assess and manage the Fund’s liquidity risk. “Liquidity risk” is defined as the risk that the Fund is unable to meet redemption requests without significantly diluting remaining investors’ interests in the Fund. The Trust’s Board of Trustees (the “Board”) previously approved the designation of Wells Fargo Funds Management, LLC (“Funds Management”), the Fund’s investment manager, as the administrator of the Program, and Funds Management has established a Liquidity Risk Management Council composed of personnel from multiple departments within Funds Management and its affiliates to assist Funds Management in the implementation and on-going administration of the Program.
The Program is comprised of various components designed to support the assessment and/or management of liquidity risk, including: (1) the periodic assessment (no less frequently than annually) of certain factors that influence the Fund’s liquidity risk; (2) the periodic classification (no less frequently than monthly) of the Fund’s investments into one of four liquidity categories that reflect an estimate of their liquidity under current market conditions; (3) a 15% limit on the acquisition of “illiquid investments” (as defined under the Liquidity Rule); (4) to the extent the Fund does not invest primarily in “highly liquid investments” (as defined under the Liquidity Rule), the determination of a minimum percentage of the Fund’s assets that generally will be invested in highly liquid investments (an “HLIM”); (5) if the Fund has established an HLIM, the periodic review (no less frequently than annually) of the HLIM and the adoption of policies and procedures for responding to a shortfall of the Fund’s “highly liquid investments” below its HLIM; and (6) periodic reporting to the Board.
At a meeting of the Board held on May 26 and 28, 2020, the Board received a written report (the “Report”) from Funds Management that addressed the operation of the Program and assessed its adequacy and effectiveness of implementation. The Report covered the initial period from December 1, 2018 through December 31, 2019 (the “Reporting Period”). No significant liquidity events impacting the Fund were noted in the Report. There were no material changes to the Program during the Reporting Period. The Report concluded that the Program is operating effectively to assess and manage the Fund’s liquidity risk, and that the Program has been and continues to be adequately and effectively implemented to monitor and, as applicable, respond to the Fund’s liquidity developments.
There can be no assurance that the Program will achieve its objectives under all circumstances in the future. Please refer to the Fund’s prospectus for more information regarding the Fund’s exposure to liquidity risk and other risks to which an investment in the Fund may be subject.
Wells Fargo Low Volatility U.S. Equity Fund | 37
Table of Contents
Effective on or after May 1, 2020, clients of Edward Jones (also referred to as “shareholders”) purchasing Fund shares on the Edward Jones commission and fee-based platforms are eligible only for the following sales charge discounts (also referred to as “breakpoints”) and waivers, which can differ from breakpoints and waivers described elsewhere in the Fund’s Prospectus or SAI or through another broker-dealer. In all instances, it is the shareholder’s responsibility to inform Edward Jones at the time of purchase of any relationship, holdings of Wells Fargo Funds or other facts qualifying the purchaser for breakpoints or waivers. Edward Jones can ask for documentation of such circumstance.
| Breakpoints available at Edward Jones |
| Rights of Accumulation (ROA) |
The applicable sales charge on a purchase of Class A shares is determined by taking into account all share classes (except any money market funds and retirement plan share classes) of Wells Fargo Funds held by the shareholder or in an account grouped by Edward Jones with other accounts for the purpose of providing certain pricing considerations (“pricing groups”). This includes all share classes held on the Edward Jones platform and/or held on another platform. The inclusion of eligible fund family assets in the rights of accumulation calculation is dependent on the shareholder notifying his or her financial advisor of such assets at the time of calculation. |
ROA is determined by calculating the higher of cost or market value (current shares x NAV). |
| Letter of Intent (LOI) |
Through a LOI, shareholders can receive the sales charge and breakpoint discounts for purchases shareholders intend to makeover a 13-month period from the date Edward Jones receives the LOI. The LOI is determined by calculating the higher of cost or market value of qualifying holdings at LOI initiation in combination with the value that the shareholder intends to buy over a 13-month period to calculate the front-end sales charge and any breakpoint discounts. Each purchase the shareholder makes during that 13-month period will receive the sales charge and breakpoint discount that applies to the total amount. The inclusion of eligible fund family assets in the LOI calculation is dependent on the shareholder notifying his or her financial advisor of such assets at the time of calculation. Purchases made before the LOI is received by Edward Jones are not covered under the LOI and will not reduce the sales charge previously paid. Sales charges will be adjusted if LOI is not met. |
| Sales charges are waived for the following shareholders and in the following situations at Edward Jones: |
● Associates of Edward Jones and its affiliates and their family members who are in the same pricing group (as determined by Edward Jones under its policies and procedures) as the associate. This waiver will continue for the remainder of the associate’s life if the associate retires from Edward Jones in good-standing. |
● Shares purchased in an Edward Jones fee-based program. |
● Shares purchased through reinvestment of capital gains distributions and dividend reinvestment. |
● Shares purchased from the proceeds of redeemed shares of the same fund family so long as the following conditions are met: 1) the proceeds are from the sale of shares within 60 days of the purchase, and 2) the sale and purchase are made in the same share class and the same account or the purchase is made in an individual retirement account with proceeds from liquidations in a non-retirement account. |
● Shares exchanged into Class A shares from another share class so long as the exchange is into the same fund and was initiated at the discretion of Edward Jones. Edward Jones is responsible for any remaining CDSC due to the fund company, if applicable. Any future purchases are subject to the applicable sales charge as disclosed in the prospectus. |
● Exchanges from Class C shares to Class A shares of the same fund, generally, in the 84th month following the anniversary of the purchase date or earlier at the discretion of Edward Jones. |
| If the shareholder purchases shares that are subject to a CDSC and those shares are redeemed before the CDSC is expired, the shareholder is responsible to pay the CDSC except in the following conditions available at Edward Jones: |
● The death or disability of the shareholder. |
● Systematic withdrawals with up to 10% per year of the account value. |
● Return of excess contributions from an Individual Retirement Account (IRA). |
● Shares sold as part of a required minimum distribution for IRA and retirement accounts if the redemption is taken in or after the year the shareholder reaches qualified age based on applicable IRS regulation. |
● Shares sold to pay Edward Jones fees or costs in such cases where the transaction is initiated by Edward Jones. |
● Shares exchanged in an Edward Jones fee-based program. |
● Shares acquired through NAV reinstatement. |
38 | Wells Fargo Low Volatility U.S. Equity Fund
Table of Contents
Appendix I (unaudited)
| Other Important Information for accounts at Edward Jones: |
| Minimum Purchase Amounts |
● $250 initial purchase minimum |
● $50 subsequent purchase minimum |
| Minimum Balances |
| Edward Jones has the right to redeem at its discretion fund holdings with a balance of $250 or less. The following are examples of accounts that are not included in this policy: |
● A fee-based account held on an Edward Jones platform |
● A 529 account held on an Edward Jones platform |
● An account with an active systematic investment plan or letter of intent (LOI) |
| Changing Share Classes |
| At any time it deems necessary, Edward Jones has the authority to exchange at NAV a shareholder’s holdings in a fund to Class A shares. |
Wells Fargo Low Volatility U.S. Equity Fund | 39
Table of Contents
Effective June 1, 2020, shareholders purchasing Fund shares through an Oppenheimer & Co. Inc. (“Oppenheimer”) platform or account are eligible only for the following load waivers (front-end sales charge waivers and contingent deferred or back-end, sales charge waivers) and discounts, which may differ from those disclosed in the Fund’s Prospectus or SAI.
| Front-end Sales Load Waivers on Class A Shares available at Oppenheimer |
| Employer-sponsored retirement, deferred compensation and employee benefit plans (including health savings accounts) and trusts used to fund those plans, provided that the shares are not held in a commission-based brokerage account and shares are held for the benefit of the plan. |
| Shares purchased by or through a 529 Plan. |
| Shares purchased through an Oppenheimer affiliated investment advisory program. |
| Shares purchased through reinvestment of capital gains distributions and dividend reinvestment when purchasing shares of the same fund (but not any other fund within the fund family). |
| Shares purchased from the proceeds of redemptions within the same fund family, provided (1) the repurchase occurs within 90 days following the redemption, (2) the redemption and purchase occur in the same account, and (3) redeemed shares were subject to a front-end or deferred sales load (known as Rights of Restatement). |
| A shareholder in the Fund’s Class C shares will have their shares exchanged at net asset value to Class A shares (or the appropriate share class) of the Fund if the shares are no longer subject to a CDSC and the exchange is in line with the policies and procedures of Oppenheimer. |
| Employees and registered representatives of Oppenheimer or its affiliates and their family members. |
| Directors or Trustees of the Fund, and employees of the Fund’s investment adviser or any of its affiliates, as described in the Prospectus. |
| CDSC Waivers on A and C Shares available at Oppenheimer |
| Death or disability of the shareholder. |
| Shares sold as part of a systematic withdrawal plan as described in the Prospectus. |
| Return of excess contributions from an IRA Account. |
| Shares sold as part of a required minimum distribution for IRA and retirement accounts due to the shareholder reaching the qualified age based on applicable IRS regulations as described in the Prospectus. |
| Shares sold to pay Oppenheimer fees but only if the transaction is initiated by Oppenheimer. |
| Shares acquired through a right of reinstatement. |
| Front-end load Discounts Available at Oppenheimer: Breakpoints, Rights of Accumulation & Letters of Intent |
| Breakpoints as described in the Prospectus. |
| Rights of Accumulation (ROA), which entitle shareholders to breakpoint discounts, will be automatically calculated based on the aggregated holding of fund family assets held by accounts within the purchaser’s household at Oppenheimer. Eligible fund family assets not held at Oppenheimer may be included in the ROA calculation only if the shareholder notifies his or her financial advisor about such assets. |
40 | Wells Fargo Low Volatility U.S. Equity Fund
Table of Contents
Effective June 15, 2020, shareholders purchasing fund shares through a Robert W. Baird & Co. (“Baird”) platform or account will only be eligible for the following sales charge waivers (front-end sales charge waivers and CDSC waivers) and discounts, which may differ from those disclosed elsewhere in the Fund’s Prospectus or the SAI.
| Front-end Sales Load Waivers on Class A Shares available at Baird |
| Shares purchased through reinvestment of capital gains distributions and dividend reinvestment when purchasing share of the same fund. |
| Share purchase by employees and registers representatives of Baird or its affiliate and their family members as designated by Baird. |
| Shares purchase from the proceeds of redemptions within the same fund family, provided (1) the repurchase occurs within 90 days following the redemption, (2) the redemption and purchase occur in the same accounts, and (3) redeemed shares were subject to a front-end or deferred sales charge (known as rights of reinstatement). |
| A shareholder in the Funds Investor C Shares will have their share exchanged at net asset value to Investor A shares of the fund if the shares are no longer subject to CDSC and the exchange is in line with the policies and procedures of Baird. |
| Employer-sponsored retirement plans or charitable accounts in a transactional brokerage account at Baird, including 401(k) plans, 457 plans, employer-sponsored 403(b) plans, profit sharing and money purchase pension plans and defined benefit plans. For purposes of this provision, employer-sponsored retirement plans do not include SEP IRAs, Simple IRAs or SAR-SEPs. |
| CDSC Waivers on A and C Shares available at Baird |
| Shares sold due to death or disability of the shareholder. |
| Shares sold as part of a systematic withdrawal plan as described in the Fund’s Prospectus. |
| Shares bought due to returns of excess contributions from an IRA Account. |
| Shares sold as part of a required minimum distribution for IRA and retirement accounts due to the shareholder reaching age 72 as described in the Fund’s Prospectus. |
| Shares sold to pay Baird fees but only if the transaction is initiated by Baird. |
| Shares acquired through a right of reinstatement. |
| Front-end load Discounts Available at Baird: Breakpoint and/or Rights of Accumulation |
| Breakpoints as described in the Prospectus. |
| Rights of accumulations which entitles shareholders to breakpoint discounts will be automatically calculated based on the aggregated holding of fund family assets held by accounts within the purchaser’s household at Baird. Eligible fund family assets not held at Baird may be included in the rights of accumulations calculation only if the shareholder notifies his or her financial advisor about such assets. |
| Letters of Intent (LOI) allow for breakpoint discounts based on anticipated purchases within a fund family through Baird, over a 13-month period of time. |
Wells Fargo Low Volatility U.S. Equity Fund | 41
Table of Contents
This page is intentionally left blank.
Table of Contents
This page is intentionally left blank.
Table of Contents
This page is intentionally left blank.
Table of Contents
For more information
More information about Wells Fargo Funds is available free upon request. To obtain literature, please write, visit the Fund’s website, or call:
Wells Fargo Funds
P.O. Box 219967
Kansas City, MO 64121-9967
Website: wfam.com
Individual investors: 1-800-222-8222
Retail investment professionals: 1-888-877-9275
Institutional investment professionals: 1-866-765-0778

This report and the financial statements contained herein are submitted for the general information of the shareholders of the Fund. If this report is used for promotional purposes, distribution of the report must be accompanied or preceded by a current prospectus. Before investing, please consider the investment objectives, risks, charges, and expenses of the investment. For a current prospectus and, if available, a summary prospectus, containing this information, call 1-800-222-8222 or visit the Fund’s website at wfam.com. Read the prospectus carefully before you invest or send money.
Wells Fargo Asset Management (WFAM) is the trade name for certain investment advisory/management firms owned by Wells Fargo & Company. These firms include but are not limited to Wells Capital Management Incorporated and Wells Fargo Funds Management, LLC. Certain products managed by WFAM entities are distributed by Wells Fargo Funds Distributor, LLC (a broker-dealer and Member FINRA).
This material is for general informational and educational purposes only and is NOT intended to provide investment advice or a recommendation of any kind—including a recommendation for any specific investment, strategy, or plan.
INVESTMENT PRODUCTS: NOT FDIC INSURED ◾ NO BANK GUARANTEE ◾ MAY LOSE VALUE
© 2020 Wells Fargo & Company. All rights reserved
PAR-0820-01041 09-20
A270/AR270 07-20
Table of Contents

Annual Report
July 31, 2020
Wells Fargo Omega Growth Fund
Beginning on January 1, 2021, as permitted by new regulations adopted by the Securities and Exchange Commission, paper copies of the Wells Fargo Funds’ annual and semi-annual shareholder reports issued after this date will no longer be sent by mail, unless you specifically request paper copies of the reports. Instead, the reports will be made available on the Funds’ website, and you will be notified by mail each time a report is posted and provided with a website address to access the report.
If you already elected to receive shareholder reports electronically, you will not be affected by this change and you need not take any action. You may elect to receive shareholder reports and other communications from the Fund electronically at any time by contacting your financial intermediary (such as a broker-dealer or bank) or, if you are a direct investor, by calling 1-800-222-8222 or by enrolling at wellsfargo.com/advantagedelivery.
You may elect to receive all future reports in paper free of charge. If you invest through a financial intermediary, you can contact your financial intermediary to request that you continue to receive paper copies of your shareholder reports; if you invest directly with the Fund, you can call 1-800-222-8222. Your election to receive reports in paper will apply to all Wells Fargo Funds held in your account with your financial intermediary or, if you are a direct investor, to all Wells Fargo Funds that you hold.
Table of Contents
|
Reduce clutter. Save trees. |
Sign up for electronic delivery of prospectuses and shareholder reports at wellsfargo.com/ |
The views expressed and any forward-looking statements are as of July 31, 2020, unless otherwise noted, and are those of the Fund managers and/or Wells Fargo Asset Management. Discussions of individual securities, or the markets generally, or any Wells Fargo Fund are not intended as individual recommendations. Future events or results may vary significantly from those expressed in any forward-looking statements. The views expressed are subject to change at any time in response to changing circumstances in the market. Wells Fargo Asset Management and the Fund disclaim any obligation to publicly update or revise any views expressed or forward-looking statements.
INVESTMENT PRODUCTS: NOT FDIC INSURED ◾ NO BANK GUARANTEE ◾ MAY LOSE VALUE
Wells Fargo Omega Growth Fund | 1
Table of Contents
Letter to shareholders (unaudited)

Andrew Owen
President
Wells Fargo Funds
Dear Shareholder:
We are pleased to offer you this annual report for the Wells Fargo Omega Growth Fund for the 12-month period that ended July 31, 2020. Global stock markets saw earlier gains erased in February and March as governments around the world took unprecedented measures, attempting to stop the spread of the coronavirus at the expense of short-term economic output. However, markets rebounded from April on to offset much of the losses as central banks attempted to bolster capital markets and confidence. Fixed-income markets generally performed well overall, achieving widespread gains. Overall, U.S. stocks surpassed their international peers, while U.S. large-cap equity, as measured by the Russell 1000® Index1, easily outperformed small caps, as measured by the Russell 2000® Index2, for the 12-month period that began last August.
For the 12-month period, fixed-income securities generally had positive total returns while non-U.S. developed market equities had the weakest performance and U.S. stocks performed strongly despite sharp volatility in the late winter and early spring. For the period, U.S. stocks, based on the S&P 500 Index,3 gained 11.96%. International stocks, as measured by the MSCI ACWI ex USA Index (Net),4 returned 0.66%, while the MSCI EM Index (Net)5 had somewhat stronger performance, with a 6.55% gain. For bond investors, the Bloomberg Barclays U.S. Aggregate Bond Index6 returned a robust 10.12%, the Bloomberg Barclays Global Aggregate ex-USD Index7 gained a more modest 5.94%, and the Bloomberg Barclays Municipal Bond Index8 gained 5.36% while the ICE BofA U.S. High Yield Index9 returned 3.10%.
The fiscal year began with supportive central bank actions.
The period began with unresolved U.S.-China trade tensions showing no signs of compromise in August 2019. Evidence of a continued global economic slowdown mounted, and central banks in China, New Zealand, and Thailand cut interest rates after the U.S. Federal Reserve (Fed) had done so in late July. Industrial and manufacturing data declined in China, Canada, Japan, and Germany. Adding to global uncertainty, Italy’s prime minister resigned, many feared a crackdown in Hong Kong as protestors sustained their calls for reform, and U.K. Prime Minister Boris Johnson planned to suspend Parliament as Brexit’s deadline neared.
| 1 | The Russell 1000® Index measures the performance of the 1,000 largest companies in the Russell 3000® Index, which represents approximately 92% of the total market capitalization of the Russell 3000® Index. You cannot invest directly in an index. |
| 2 | The Russell 2000® Index measures the performance of the 2,000 smallest companies in the Russell 3000® Index, which represents approximately 8% of the total market capitalization of the Russell 3000® Index. You cannot invest directly in an index. |
| 3 | The S&P 500 Index consists of 500 stocks chosen for market size, liquidity, and industry group representation. It is a market-value-weighted index with each stock’s weight in the index proportionate to its market value. You cannot invest directly in an index. |
| 4 | The Morgan Stanley Capital International (MSCI) All Country World Index (ACWI) ex USA Index (Net) is a free-float-adjusted market-capitalization-weighted index that is designed to measure the equity market performance of developed and emerging markets, excluding the United States. Source: MSCI. MSCI makes no express or implied warranties or representations and shall have no liability whatsoever with respect to any MSCI data contained herein. The MSCI data may not be further redistributed or used as a basis for other indices or any securities or financial products. This report is not approved, reviewed, or produced by MSCI. You cannot invest directly in an index. |
| 5 | The MSCI Emerging Markets (EM) Index (Net) is a free-float-adjusted market-capitalization-weighted index that is designed to measure equity market performance of emerging markets. You cannot invest directly in an index. |
| 6 | The Bloomberg Barclays U.S. Aggregate Bond Index is a broad-based benchmark that measures the investment-grade, U.S. dollar-denominated, fixed-rate taxable bond market, including Treasuries, government-related and corporate securities, mortgage-backed securities (agency fixed-rate and hybrid adjustable-rate mortgage pass-throughs), asset-backed securities, and commercial mortgage-backed securities. You cannot invest directly in an index. |
| 7 | The Bloomberg Barclays Global Aggregate ex-USD Index is an unmanaged index that provides a broad-based measure of the global investment-grade fixed-income markets excluding the U.S.-dollar-denominated debt market. You cannot invest directly in an index. |
| 8 | The Bloomberg Barclays Municipal Bond Index is an unmanaged index composed of long-term tax-exempt bonds with a minimum credit rating of Baa. You cannot invest directly in an index. |
| 9 | The ICE BofA U.S. High Yield Index is a market-capitalization-weighted index of domestic and Yankee high-yield bonds. The index tracks the performance of high-yield securities traded in the U.S. bond market. You cannot invest directly in an index. Copyright 2020. ICE Data Indices, LLC. All rights reserved. |
2 | Wells Fargo Omega Growth Fund
Table of Contents
Letter to shareholders (unaudited)
In the U.S., the Fed cut interest rates again in September. U.S. manufacturing data disappointed investors. The U.S. Congress announced it would pursue an impeachment investigation of President Trump. Meanwhile, the Brexit impasse showed no signs of resolution. Officials in China said that hitting the country’s economic growth goals for the year would be difficult considering the weight of tariffs and trade restrictions. Although the S&P 500 Index finished the third quarter with the best year-to-date returns in more than 20 years, concerns about future returns remained.
The fourth quarter started on a strong note, with U.S.-China trade tensions relaxing in October along with renewed optimism for a U.K. Brexit deal and positive macroeconomic data. The initial estimate of U.S. third-quarter gross domestic product (GDP) growth was a resilient 1.9% annualized rate, while the U.S. unemployment rate fell to a 50-year low of 3.5% in September. However, despite strength among U.S. consumers, business confidence declined while manufacturing activity contracted. Concerned with a potential economic slowdown, the Fed lowered interest rates another quarter point in late October—its third rate cut in four months. This helped push the S&P 500 Index to an all-time high while emerging market equities rallied and global bonds declined overall, reflecting a broad pickup in risk appetite.
Equity markets continued to rally in November despite ongoing geopolitical risks. Hopes for a U.S.-China trade deal buoyed investor confidence. U.S. business sentiment improved slightly, and manufacturing and services activity picked up. While consumer confidence and purchasing managers’ activity rose in the eurozone, China reported weakening manufacturing and consumer data. Bond yields rose marginally, leading to slightly negative returns for global government and investment-grade corporate bonds.
Financial markets ended 2019 with a boost from the U.S. and China accord on a Phase One trade deal. That, along with the landslide win by the pro-Brexit U.K. Conservative Party in a national election and ongoing central bank support, gave investors greater confidence. U.S. economic indicators were generally positive, with the exception of manufacturing activity and business confidence. Consumer confidence was resilient, fed by a robust labor market, tame inflation, and lower interest rates, which boosted housing affordability and stimulated homebuyer activity. The impeachment of President Trump had little impact on markets. Meanwhile, slowing Chinese economic activity, partly attributable to the trade war, led to further government stimulus at year-end through lower reserve ratios, allowing banks to lend more money.
The year-end rally continued in early January 2020. However, capital market volatility picked up sharply in late January on concerns over the potential impact of the coronavirus on the global economy and stock markets. With sentiment somewhat souring, perceived safe havens did well in January. The U.S. dollar and Japanese yen both rose, and government bonds outperformed equities. While the S&P 500 Index held its ground, emerging market equities tumbled, including those in Asia.
In February, the coronavirus became the major market focus. Fears of the virus’s impact on global growth led to expectations of increased global central bank monetary policy support. That led the 10-year U.S. Treasury yield to fall to an all-time low of 1.1%. Although equity markets initially shrugged off concerns about the outbreak, focusing instead on strong fourth-quarter earnings and improving business confidence in January, market sentiment turned sharply lower and the S&P 500 Index lost 8.2% for the month. Oil prices tumbled as Russia and the Organization of the Petroleum Exporting Countries compounded a major decline in oil demand with a brutal price war, partly aimed at dissuading further U.S. shale production, causing the price of West Texas Intermediate crude oil to plummet.
Wells Fargo Omega Growth Fund | 3
Table of Contents
Letter to shareholders (unaudited)
“The global spread of the coronavirus led country after country to clamp down on social and business-related activity in order to contain the virus from causing even greater devastation and overwhelming health care systems.”
“Financial markets posted widely positive returns in June despite ongoing economic weakness and high levels of uncertainty on the containment of the coronavirus and the timing of an effective vaccine.”
The global spread of the coronavirus led country after country to clamp down on social and business-related activity in order to contain the virus from causing even greater devastation and overwhelming health care systems. This abrupt stoppage of economic activity led to the sharp deceleration of global output, sending economies into a deep contraction. Central banks responded swiftly, slashing interest rates and expanding quantitative easing programs to restore liquidity and confidence to the markets. In the U.S., the Fed introduced several new lending programs, funding investment-grade bonds, money market mutual funds, and commercial paper while purchasing Treasuries, mortgage-backed securities, and overnight repurchase agreements. Meanwhile, stock markets tumbled quickly into a bear market, ending the longest bull stock market in U.S. history.
Markets rebounded strongly in April, fueled by unprecedented government and central bank stimulus measures. The U.S. economy contracted by an annualized 5.0% pace in the first quarter, with 30 million new unemployment insurance claims in six weeks. In the eurozone, first-quarter real GDP shrank 3.8%, with the composite April Flash Purchasing Managers’ Index, a monthly survey of purchasing managers, falling to an all-time low of 13.5. The European Central Bank expanded its quantitative easing to include the purchase of additional government bonds of countries with the greatest virus-related need, including Italy and Spain. China’s first-quarter GDP fell by 6.8% year over year. However, retail sales, production, and investment showed signs of recovery. Extreme oil-price volatility continued as global supply far exceeded demand.
In May, the global equity market rebound continued, with widespread strong monthly gains. Investors regained confidence on reports of early signs of success in human trials of a coronavirus vaccine. Growth stocks continued to outperform value stocks while returns on global government bonds were generally flat. In the U.S., a gap grew between the stock market rebound and devastating economic data points, including an April unemployment rate of 14.7%, the highest level since World War II. Purchasing managers’ indices reflected weakening activity in May in both the manufacturing and services sectors. U.S. corporate earnings reports indicated a 14% year-over-year contraction in earnings from the first quarter of 2019. However, high demand for technology, driven by remote activity, supported robust information technology sector earnings, which helped drive major technology stocks higher.
Financial markets posted widely positive returns in June despite ongoing economic weakness and high levels of uncertainty on the containment of the coronavirus and the timing of an effective vaccine. There were hopeful signs as economies reopened, with both U.S. and U.K. retail sales rebounding substantially in May. However, year over year, sales remained depressed. Vitally important to market sentiment was the ongoing commitment by central banks globally to do all they could to provide economic support through liquidity and low borrowing costs. U.S. economic activity was aided by one-time $1,200 stimulus checks and $600 bonus weekly unemployment benefits due to expire at the end of July. However, unemployment remained in the double digits, easing somewhat from 14.7% in April to 11.1% in June. During June, numerous states reported alarming increases of coronavirus cases. China’s economic recovery picked up momentum in June, though it remained far from a full recovery.
July was a broadly positive month for both global equities and fixed income. However, economic data and a resurgence of coronavirus cases pointed to the vulnerability of the global economy and the ongoing imperative to regain control of the pandemic. Second-quarter GDP shrank by 9.5% and 12.1% in the U.S. and eurozone, respectively, from the previous quarter. In contrast, China reported a 3.2% year-over-year expansion in its second-quarter GDP. U.S. unemployment remained historically high despite adding 1.8 million jobs in July, with a double-digit jobless rate persisting. However, manufacturing activity grew in both the U.S. and eurozone. In Asia, while China’s manufacturing sector continued to expand, activity in Japan and South Korea contracted. In July, a rising concern
4 | Wells Fargo Omega Growth Fund
Table of Contents
Letter to shareholders (unaudited)
was the rapid and broad reemergence of coronavirus infections. Despite the ongoing promise of positive early-stage vaccine trial results, economic activity could be held back by the continued spread of the virus and the end of a widely received $600-a-week bonus unemployment benefit in late July.
Don’t let short-term uncertainty derail long-term investment goals.
Periods of investment uncertainty can present challenges, but experience has taught us that maintaining long-term investment goals can be an effective way to plan for the future. To help you create a sound strategy based on your personal goals and risk tolerance, Wells Fargo Funds offers more than 100 mutual funds spanning a wide range of asset classes and investment styles. Although diversification cannot guarantee an investment profit or prevent losses, we believe it can be an effective way to manage investment risk and potentially smooth out overall portfolio performance. We encourage investors to know their investments and to understand that appropriate levels of risk-taking may unlock opportunities.
Thank you for choosing to invest with Wells Fargo Funds. We appreciate your confidence in us and remain committed to helping you meet your financial needs.
Sincerely,

Andrew Owen
President
Wells Fargo Funds
|
For further information about your Fund, contact your investment professional, visit our website at wfam.com, or call us directly at 1-800-222-8222. |
Notice to Shareholders
At a meeting held on August 10-12, 2020, the Board of Trustees of the Fund approved a change to the Fund’s automatic conversion feature for Class C shares in order to shorten the required holding period from 10 to 8 years. As a result, on a monthly basis beginning November 5, 2020, Class C shares will convert automatically into Class A shares 8 years after the initial date of purchase or, if you acquired your Class C shares through an exchange or conversion from another share class, 8 years after the date you acquired your Class C shares. When Class C shares that you acquired through a purchase or exchange convert, any other Class C shares that you purchased with reinvested dividends and distributions also will convert into Class A shares on a pro rata basis.
Please note that a shorter holding period may apply depending on your intermediary. Please see “Appendix A—Sales Charge Reductions and Waivers for Certain Intermediaries” in the Fund’s prospectus for further information.
Wells Fargo Omega Growth Fund | 5
Table of Contents
Performance highlights (unaudited)
Investment objective
The Fund seeks long-term capital appreciation.
Manager
Wells Fargo Funds Management, LLC
Subadviser
Wells Capital Management Incorporated
Portfolio managers
Michael T. Smith, CFA®‡
Christopher J. Warner, CFA®‡
Average annual total returns (%) as of July 31, 2020
| Including sales charge | Excluding sales charge | Expense ratios1 (%) | ||||||||||||||||||||||||||||||||
| Inception date | 1 year | 5 year | 10 year | 1 year | 5 year | 10 year | Gross | Net2 | ||||||||||||||||||||||||||
| Class A (EKOAX) | 4-29-1968 | 17.39 | 14.34 | 15.32 | 24.55 | 15.70 | 16.00 | 1.28 | 1.28 | |||||||||||||||||||||||||
| Class C (EKOCX) | 8-2-1993 | 22.61 | 14.84 | 15.14 | 23.61 | 14.84 | 15.14 | 2.03 | 2.03 | |||||||||||||||||||||||||
| Class R (EKORX) | 10-10-2003 | – | – | – | 24.24 | 15.42 | 15.72 | 1.53 | 1.53 | |||||||||||||||||||||||||
| Administrator Class (EOMYX) | 1-13-1997 | – | – | – | 24.78 | 15.92 | 16.25 | 1.20 | 1.10 | |||||||||||||||||||||||||
| Institutional Class (EKONX) | 7-30-2010 | – | – | – | 25.09 | 16.21 | 16.55 | 0.95 | 0.85 | |||||||||||||||||||||||||
| Russell 3000® Growth Index3 | – | – | – | – | 28.24 | 16.18 | 16.96 | – | – | |||||||||||||||||||||||||
Figures quoted represent past performance, which is no guarantee of future results, and do not reflect taxes that a shareholder may pay on an investment in a fund. Investment return and principal value of an investment will fluctuate so that an investor’s shares, when redeemed, may be worth more or less than their original cost. Performance shown without sales charges would be lower if sales charges were reflected. Current performance may be lower or higher than the performance data quoted, which assumes the reinvestment of dividends and capital gains. Current month-end performance is available on the Fund’s website, wfam.com.
Please keep in mind that high double-digit returns were primarily achieved during favorable market conditions. You should not expect that such favorable returns can be consistently achieved. A fund’s performance, especially for short time periods, should not be the sole factor in making your investment decision.
Index returns do not include transaction costs associated with buying and selling securities, any mutual fund fees or expenses, or any taxes. It is not possible to invest directly in an index.
For Class A shares, the maximum front-end sales charge is 5.75%. For Class C shares, the maximum contingent deferred sales charge is 1.00%. Performance including a contingent deferred sales charge assumes the sales charge for the corresponding time period. Class R, Administrator Class, and Institutional Class shares are sold without a front-end sales charge or contingent deferred sales charge.
Stock values fluctuate in response to the activities of individual companies and general market and economic conditions. Certain investment strategies tend to increase the total risk of an investment (relative to the broader market). The Fund is exposed to foreign investment risk and smaller-company securities risk. Consult the Fund’s prospectus for additional information on these and other risks.
Please see footnotes on page 7.
6 | Wells Fargo Omega Growth Fund
Table of Contents
Performance highlights (unaudited)
| Growth of $10,000 investment as of July 31, 20204 |
|
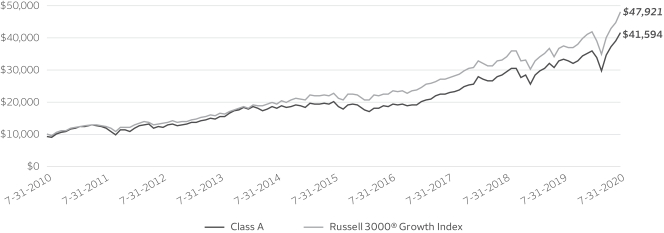
| ‡ | CFA® and Chartered Financial Analyst® are trademarks owned by CFA Institute. |
| 1 | Reflects the expense ratios as stated in the most recent prospectuses. The expense ratios shown are subject to change and may differ from the annualized expense ratios shown in the financial highlights of this report. |
| 2 | The manager has contractually committed through November 30, 2020, to waive fees and/or reimburse expenses to the extent necessary to cap total annual fund operating expenses after fee waivers at 1.30% for Class A, 2.05% for Class C, 1.55% for Class R, 1.10% for Administrator Class, and 0.85% for Institutional Class. Brokerage commissions, stamp duty fees, interest, taxes, acquired fund fees and expenses (if any), and extraordinary expenses are excluded from the expense caps. Prior to or after the commitment expiration date, the caps may be increased or the commitment to maintain the caps may be terminated only with the approval of the Board of Trustees. Without these caps, the Fund’s returns would have been lower. The expense ratio paid by an investor is the net expense ratio (the total annual fund operating expenses after fee waivers) as stated in the prospectuses. |
| 3 | The Russell 3000® Growth Index measures the performance of those Russell 3000® Index companies with higher price/book ratios and higher forecasted growth values. You cannot invest directly in an index. |
| 4 | The chart compares the performance of Class A shares for the most recent ten years with the Russell 3000® Growth Index. The chart assumes a hypothetical investment of $10,000 in Class A shares and reflects all operating expenses and assumes the maximum initial sales charge of 5.75%. |
| 5 | The ten largest holdings, excluding cash, cash equivalents and any money market funds, are calculated based on the value of the investments divided by total net assets of the Fund. Holdings are subject to change and may have changed since the date specified. |
| 6 | Amounts are calculated based on the total long-term investments of the Fund. These amounts are subject to change and may have changed since the date specified. |
Wells Fargo Omega Growth Fund | 7
Table of Contents
Performance highlights (unaudited)
MANAGER’S DISCUSSION
| ∎ | The Fund underperformed its benchmark, the Russell 3000® Growth Index, for the 12-month period that ended July 31, 2020. |
| ∎ | Stock selection and positioning within the information technology (IT) sector detracted from performance. |
| ∎ | Stock selection in communication services and consumer discretionary were key contributors to performance. |
Over the past 12 months, global economies shifted from long-toothed bull markets to rapid recessions, spurred by a global pandemic and shelter-at-home orders. Central banks and governments rallied quickly to prevent a possible depression by proposing massive stimulus packages. Within the United States, the Federal Reserve (Fed) took extraordinary measures to provide liquidity, including launching programs to purchase exchange-traded funds and corporate bonds. These aggressive actions signaled the Fed would effectively take any measures to support the economy. The equity markets were further fueled by optimism as progress continued in the development of therapeutic treatments and vaccines for the coronavirus.
Despite increased uncertainty, we have not significantly repositioned the Fund. It remains positioned toward companies with high visibility of earnings growth and those that we believe are positioned on the right side of change. We believe this strategy will prove beneficial should volatility levels remain elevated.
Select IT holdings detracted from relative performance. Within IT, shares of Motorola Solutions detracted from performance. The company provides key technology to first responders and emergency command centers. The company is expanding its software and service portfolio to provide an end-to-end solution for public safety customers. Motorola recently reported above-consensus earnings. However, it lowered expected revenue due to uncertainty in public sector spending as a result of the coronavirus pandemic. While this prompted a sell-off in the stock, we expect Motorola’s recurring revenue should soften the impact of near-term uncertainties.
| Ten largest holdings (%) as of July 31, 20205 | ||||
Amazon.com Incorporated | 9.56 | |||
Microsoft Corporation | 8.92 | |||
Alphabet Incorporated Class A | 4.13 | |||
Visa Incorporated Class A | 3.42 | |||
UnitedHealth Group Incorporated | 3.26 | |||
PayPal Holdings Incorporated | 3.18 | |||
ServiceNow Incorporated | 2.39 | |||
Chipotle Mexican Grill Incorporated | 2.34 | |||
EPAM Systems Incorporated | 2.20 | |||
Netflix Incorporated | 2.09 | |||
Also within IT, not holding Apple Inc. significantly detracted from relative performance. Although a quality enterprise, Apple does not have the level of organic growth we seek in target investments. The company still relies heavily on smartphone sales, which have reached a saturation point. In our view, Apple share outperformance has been driven more by valuation expansion as opposed to a true acceleration in the company’s fundamentals.
Stock selection in the communication services and consumer discretionary sectors contributed to performance relative to the index.
Within the communication services sector, InterActiveCorp (IAC) is a holding company that incubates and grows digital technology companies. Currently, IAC’s primary assets are Match Group; ANGI Homeservices, Inc.; and Vimeo. Demand for these companies increased during the shift to working remotely. IAC’s track record of identifying compelling innovations to create value for shareholders has validated our investment thesis in the stock.
Please see footnotes on page 7.
8 | Wells Fargo Omega Growth Fund
Table of Contents
Performance highlights (unaudited)
| Sector allocation as of July 31, 20206 |
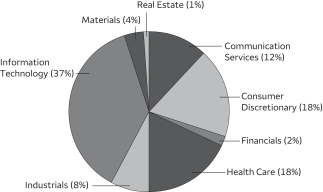 |
Within consumer discretionary, MercadoLibre, Inc., was a notable contributor. Similar to Amazon.com, Inc., the company has become a disruptive force to the traditional retail model in Latin America, yet it is much earlier in its life cycle. Furthermore, the percentage of online transactions in Latin America rose sharply as a result of stringent shelter-in-place orders. Our research indicates that with rising adoption of e-commerce, new digital payments products, and buildout of its logistics network, MercadoLibre could continue to earn a market capitalization comparable to successful large-cap platform companies in other markets.
While volatility remains high, secular growth stocks provide defensive positioning.
We do not believe the recovery will unfold in a linear, V-shaped fashion. The vexing challenges of an intertwined health care crisis, financial crisis, and social crisis remain. Progress is being made toward containing and treating the coronavirus, but recent spikes in cases serve as a reminder that we have a long way to go. Given the extreme lack of clarity in forecasting future results, we remain cautious in our outlook and anticipate that volatility will continue.
We did not make material changes to portfolio positioning as a result of the coronavirus. By emphasizing companies on the “right side of change,” we were well positioned to take advantage of the massive shift to themes such as telemedicine, digital payments, and e-commerce. These trends will likely continue for the foreseeable future. We are long-term investors focused on opportunities well beyond 2020. As growth remains scarce, we believe secular growth stocks should have defensive qualities and continue to be rewarded with premium valuations. As financial guidance continues to be revised, we believe this is a great time for active management and deep fundamental research. While we are cautious on the markets overall, we remain optimistic and confident in companies that we believe are positioned on the “right side of change.”
Please see footnotes on page 7.
Wells Fargo Omega Growth Fund | 9
Table of Contents
As a shareholder of the Fund, you incur two types of costs: (1) transaction costs, including sales charges (loads) on purchase payments and contingent deferred sales charges (if any) on redemptions and (2) ongoing costs, including management fees, distribution (12b-1) and/or shareholder servicing fees, and other Fund expenses. This example is intended to help you understand your ongoing costs (in dollars) of investing in the Fund and to compare these costs with the ongoing costs of investing in other mutual funds.
The example is based on an investment of $1,000 invested at the beginning of the six-month period and held for the entire period from February 1, 2020 to July 31, 2020.
Actual expenses
The “Actual” line of the table below provides information about actual account values and actual expenses. You may use the information in this line, together with the amount you invested, to estimate the expenses that you paid over the period. Simply divide your account value by $1,000 (for example, an $8,600 account value divided by $1,000 = 8.6), then multiply the result by the number in the “Actual” line under the heading entitled “Expenses paid during period” for your applicable class of shares to estimate the expenses you paid on your account during this period.
Hypothetical example for comparison purposes
The “Hypothetical” line of the table below provides information about hypothetical account values and hypothetical expenses based on the Fund’s actual expense ratio and an assumed rate of return of 5% per year before expenses, which is not the Fund’s actual return. The hypothetical account values and expenses may not be used to estimate the actual ending account balance or expenses you paid for the period. You may use this information to compare the ongoing costs of investing in the Fund and other funds. To do so, compare this 5% hypothetical example with the 5% hypothetical examples that appear in the shareholder reports of the other funds.
Please note that the expenses shown in the table are meant to highlight your ongoing costs only and do not reflect any transactional costs, such as sales charges (loads) and contingent deferred sales charges. Therefore, the “Hypothetical” line of the table is useful in comparing ongoing costs only and will not help you determine the relative total costs of owning different funds. In addition, if these transactional costs were included, your costs would have been higher.
Beginning account value 2-1-2020 | Ending account value 7-31-2020 | Expenses paid during the period1 | Annualized net expense ratio | |||||||||||||
Class A | ||||||||||||||||
Actual | $ | 1,000.00 | $ | 1,155.08 | $ | 6.86 | 1.28 | % | ||||||||
Hypothetical (5% return before expenses) | $ | 1,000.00 | $ | 1,018.50 | $ | 6.42 | 1.28 | % | ||||||||
Class C | ||||||||||||||||
Actual | $ | 1,000.00 | $ | 1,150.81 | $ | 10.86 | 2.03 | % | ||||||||
Hypothetical (5% return before expenses) | $ | 1,000.00 | $ | 1,014.77 | $ | 10.17 | 2.03 | % | ||||||||
Class R | ||||||||||||||||
Actual | $ | 1,000.00 | $ | 1,153.63 | $ | 8.09 | 1.51 | % | ||||||||
Hypothetical (5% return before expenses) | $ | 1,000.00 | $ | 1,017.35 | $ | 7.57 | 1.51 | % | ||||||||
Administrator Class | ||||||||||||||||
Actual | $ | 1,000.00 | $ | 1,156.01 | $ | 5.90 | 1.10 | % | ||||||||
Hypothetical (5% return before expenses) | $ | 1,000.00 | $ | 1,019.39 | $ | 5.52 | 1.10 | % | ||||||||
Institutional Class | ||||||||||||||||
Actual | $ | 1,000.00 | $ | 1,157.62 | $ | 4.56 | 0.85 | % | ||||||||
Hypothetical (5% return before expenses) | $ | 1,000.00 | $ | 1,020.64 | $ | 4.27 | 0.85 | % | ||||||||
| 1 | Expenses paid is equal to the annualized net expense ratio of each class multiplied by the average account value over the period, multiplied by the number of days in the most recent fiscal half-year divided by the number of days in the fiscal year (to reflect the one-half-year period). |
10 | Wells Fargo Omega Growth Fund
Table of Contents
Portfolio of investments—July 31, 2020
| Shares | Value | |||||||||||||||
| Common Stocks: 99.49% | ||||||||||||||||
Communication Services: 11.89% | ||||||||||||||||
| Entertainment: 3.18% | ||||||||||||||||
Netflix Incorporated † | 40,400 | $ | 19,750,752 | |||||||||||||
Spotify Technology SA † | 40,200 | 10,364,364 | ||||||||||||||
| 30,115,116 | ||||||||||||||||
|
| |||||||||||||||
| Interactive Media & Services: 8.71% | ||||||||||||||||
Alphabet Incorporated Class A † | 26,300 | 39,133,085 | ||||||||||||||
Alphabet Incorporated Class C † | 6,885 | 10,210,180 | ||||||||||||||
IAC/InterActiveCorp † | 54,500 | 7,216,890 | ||||||||||||||
Match Group Incorporated † | 117,632 | 12,080,806 | ||||||||||||||
Tencent Holdings Limited ADR | 201,100 | 13,773,339 | ||||||||||||||
| 82,414,300 | ||||||||||||||||
|
| |||||||||||||||
Consumer Discretionary: 18.41% | ||||||||||||||||
| Auto Components: 0.99% | ||||||||||||||||
Aptiv plc | 120,600 | 9,376,650 | ||||||||||||||
|
| |||||||||||||||
| Automobiles: 0.83% | ||||||||||||||||
Ferrari NV | 43,100 | 7,831,270 | ||||||||||||||
|
| |||||||||||||||
| Diversified Consumer Services: 0.67% | ||||||||||||||||
Bright Horizons Family Solutions Incorporated † | 58,957 | 6,322,549 | ||||||||||||||
|
| |||||||||||||||
| Hotels, Restaurants & Leisure: 2.34% | ||||||||||||||||
Chipotle Mexican Grill Incorporated † | 19,200 | 22,179,072 | ||||||||||||||
|
| |||||||||||||||
| Internet & Direct Marketing Retail: 11.57% | ||||||||||||||||
Amazon.com Incorporated † | 28,600 | 90,509,848 | ||||||||||||||
MercadoLibre Incorporated † | 16,900 | 19,006,078 | ||||||||||||||
| 109,515,926 | ||||||||||||||||
|
| |||||||||||||||
| Specialty Retail: 2.01% | ||||||||||||||||
The Home Depot Incorporated | 71,800 | 19,062,182 | ||||||||||||||
|
| |||||||||||||||
Financials: 1.55% | ||||||||||||||||
| Capital Markets: 1.55% | ||||||||||||||||
Intercontinental Exchange Incorporated | 151,800 | 14,691,204 | ||||||||||||||
|
| |||||||||||||||
Health Care: 18.45% | ||||||||||||||||
| Biotechnology: 1.94% | ||||||||||||||||
Exact Sciences Corporation † | 160,800 | 15,235,800 | ||||||||||||||
Sarepta Therapeutics Incorporated † | 20,500 | 3,147,160 | ||||||||||||||
| 18,382,960 | ||||||||||||||||
|
| |||||||||||||||
| Health Care Equipment & Supplies: 8.60% | ||||||||||||||||
ABIOMED Incorporated † | 35,900 | 10,767,846 | ||||||||||||||
Alcon Incorporated † | 191,200 | 11,468,176 | ||||||||||||||
Align Technology Incorporated † | 50,000 | 14,691,000 | ||||||||||||||
DexCom Incorporated † | 35,000 | 15,243,900 | ||||||||||||||
Edwards Lifesciences Corporation † | 130,100 | 10,201,141 | ||||||||||||||
Intuitive Surgical Incorporated † | 27,800 | 19,055,232 | ||||||||||||||
| 81,427,295 | ||||||||||||||||
|
| |||||||||||||||
The accompanying notes are an integral part of these financial statements.
Wells Fargo Omega Growth Fund | 11
Table of Contents
Portfolio of investments—July 31, 2020
| Shares | Value | |||||||||||||||
| Health Care Providers & Services: 4.12% | ||||||||||||||||
HealthEquity Incorporated † | 157,648 | $ | 8,128,331 | |||||||||||||
UnitedHealth Group Incorporated | 101,800 | 30,823,004 | ||||||||||||||
| 38,951,335 | ||||||||||||||||
|
| |||||||||||||||
| Health Care Technology: 1.80% | ||||||||||||||||
Veeva Systems Incorporated Class A † | 64,300 | 17,011,851 | ||||||||||||||
|
| |||||||||||||||
| Pharmaceuticals: 1.99% | ||||||||||||||||
Eli Lilly & Company | 1 | 150 | ||||||||||||||
Merck & Company Incorporated | 235,000 | 18,856,400 | ||||||||||||||
| 18,856,550 | ||||||||||||||||
|
| |||||||||||||||
Industrials: 8.04% | ||||||||||||||||
| Aerospace & Defense: 0.65% | ||||||||||||||||
HEICO Corporation | 64,300 | 6,180,516 | ||||||||||||||
|
| |||||||||||||||
| Commercial Services & Supplies: 2.97% | ||||||||||||||||
Cintas Corporation | 39,300 | 11,863,491 | ||||||||||||||
Waste Connections Incorporated | 158,622 | 16,238,134 | ||||||||||||||
| 28,101,625 | ||||||||||||||||
|
| |||||||||||||||
| Construction & Engineering: 1.03% | ||||||||||||||||
Jacobs Engineering Group Incorporated | 113,500 | 9,687,225 | ||||||||||||||
|
| |||||||||||||||
| Professional Services: 1.74% | ||||||||||||||||
IHS Markit Limited | 203,700 | 16,444,701 | ||||||||||||||
|
| |||||||||||||||
| Road & Rail: 1.65% | ||||||||||||||||
Union Pacific Corporation | 90,200 | 15,636,170 | ||||||||||||||
|
| |||||||||||||||
Information Technology: 36.68% | ||||||||||||||||
| Communications Equipment: 1.19% | ||||||||||||||||
Motorola Solutions Incorporated | 80,600 | 11,267,880 | ||||||||||||||
|
| |||||||||||||||
| Electronic Equipment, Instruments & Components: 1.09% | ||||||||||||||||
Zebra Technologies Corporation Class A † | 36,600 | 10,275,450 | ||||||||||||||
|
| |||||||||||||||
| IT Services: 18.04% | ||||||||||||||||
Black Knight Incorporated † | 195,700 | 14,661,844 | ||||||||||||||
EPAM Systems Incorporated † | 71,641 | 20,781,621 | ||||||||||||||
Euronet Worldwide Incorporated † | 87,500 | 8,412,250 | ||||||||||||||
Fiserv Incorporated † | 130,240 | 12,996,650 | ||||||||||||||
Global Payments Incorporated | 78,749 | 14,018,897 | ||||||||||||||
PayPal Holdings Incorporated † | 153,700 | 30,135,959 | ||||||||||||||
Shopify Incorporated Class A † | 13,400 | 13,721,600 | ||||||||||||||
Square Incorporated Class A † | 121,500 | 15,776,775 | ||||||||||||||
Visa Incorporated Class A | 170,004 | 32,368,762 | ||||||||||||||
WEX Incorporated † | 50,002 | 7,918,817 | �� | |||||||||||||
| 170,793,175 | ||||||||||||||||
|
| |||||||||||||||
| Software: 16.36% | ||||||||||||||||
Atlassian Corporation plc Class A † | 58,800 | 10,387,020 | ||||||||||||||
Autodesk Incorporated † | 63,400 | 14,989,662 | ||||||||||||||
Cadence Design Systems Incorporated † | 142,100 | 15,524,425 | ||||||||||||||
Microsoft Corporation | 411,700 | 84,402,617 | ||||||||||||||
The accompanying notes are an integral part of these financial statements.
12 | Wells Fargo Omega Growth Fund
Table of Contents
Portfolio of investments—July 31, 2020
| Shares | Value | |||||||||||||||
| Software (continued) | ||||||||||||||||
ServiceNow Incorporated † | 51,500 | $ | 22,618,800 | |||||||||||||
Zoom Video Communications Incorporated † | 27,200 | 6,906,352 | ||||||||||||||
| 154,828,876 | ||||||||||||||||
|
| |||||||||||||||
Materials: 3.60% | ||||||||||||||||
| Chemicals: 2.48% | ||||||||||||||||
Ingevity Corporation † | 76,700 | 4,485,416 | ||||||||||||||
The Sherwin-Williams Company | 29,400 | 19,048,848 | ||||||||||||||
| 23,534,264 | ||||||||||||||||
|
| |||||||||||||||
| Construction Materials: 1.12% | ||||||||||||||||
Vulcan Materials Company | 90,100 | 10,579,542 | ||||||||||||||
|
| |||||||||||||||
Real Estate: 0.87% | ||||||||||||||||
| Equity REITs: 0.87% | ||||||||||||||||
SBA Communications Corporation | 26,300 | 8,193,501 | ||||||||||||||
|
| |||||||||||||||
Total Common Stocks (Cost $455,582,375) | 941,661,185 | |||||||||||||||
|
| |||||||||||||||
| Yield | ||||||||||||||||
| Short-Term Investments: 0.65% | ||||||||||||||||
| Investment Companies: 0.65% | ||||||||||||||||
Wells Fargo Government Money Market Select Class (l)(u) | 0.10 | % | 6,153,039 | 6,153,039 | ||||||||||||
|
| |||||||||||||||
Total Short-Term Investments (Cost $6,153,039) |
| 6,153,039 | ||||||||||||||
|
| |||||||||||||||
| Total investments in securities (Cost $461,735,414) | 100.14 | % | 947,814,224 | |||||
Other assets and liabilities, net | (0.14 | ) | (1,280,424 | ) | ||||
|
|
|
| |||||
| Total net assets | 100.00 | % | $ | 946,533,800 | ||||
|
|
|
| |||||
| † | Non-income-earning security |
| (l) | The issuer of the security is an affiliated person of the Fund as defined in the Investment Company Act of 1940. |
| (u) | The rate represents the 7-day annualized yield at period end. |
Abbreviations:
| ADR | American depositary receipt |
| REIT | Real estate investment trust |
The accompanying notes are an integral part of these financial statements.
Wells Fargo Omega Growth Fund | 13
Table of Contents
Portfolio of investments—July 31, 2020
Investments in Affiliates
An affiliated investment is an investment in which the Fund owns at least 5% of the outstanding voting shares of the issuer or as a result of other relationships, such as the Fund and the issuer having the same investment manager. Transactions with issuers that were either affiliated persons of the Fund at the beginning of the period or the end of the period were as follows:
| Value, beginning of period | Purchases | Shares proceeds | Net realized gains (losses) | Net change in unrealized gains (losses) | Income from affiliated securities | Value, end of period | % of net assets | |||||||||||||||||||||||||
| Short-Term Investments | ||||||||||||||||||||||||||||||||
Investment Companies | ||||||||||||||||||||||||||||||||
Securities Lending Cash Investments LLC * | $ | 0 | $ | 27,421,125 | $ | (27,422,171 | ) | $ | 1,046 | $ | 0 | $ | 74,161 | # | $ | 0 | ||||||||||||||||
Wells Fargo Government Money Market Fund Select Class | 6,308,644 | 153,039,564 | (153,195,169 | ) | 0 | 0 | 65,830 | 6,153,039 | ||||||||||||||||||||||||
|
|
|
|
|
|
|
|
|
| |||||||||||||||||||||||
| $ | 1,046 | $ | 0 | $ | 139,991 | $ | 6,153,039 | 0.65 | % | |||||||||||||||||||||||
|
|
|
|
|
|
|
|
|
| |||||||||||||||||||||||
| * | No longer held at the end of the period |
| # | Amount shown represents income before fees and rebates. |
The accompanying notes are an integral part of these financial statements.
14 | Wells Fargo Omega Growth Fund
Table of Contents
Statement of assets and liabilities—July 31, 2020
Assets | ||||
Investments in unaffiliated securities, at value (cost $455,582,375) | $ | 941,661,185 | ||
Investments in affiliated securities, at value (cost $6,153,039) | 6,153,039 | |||
Receivable for Fund shares sold | 44,529 | |||
Receivable for dividends | 75,854 | |||
Prepaid expenses and other assets | 34,546 | |||
|
| |||
Total assets | 947,969,153 | |||
|
| |||
Liabilities | ||||
Payable for Fund shares redeemed | 349,530 | |||
Management fee payable | 639,436 | |||
Administration fees payable | 167,148 | |||
Distribution fees payable | 15,940 | |||
Shareholder servicing fees payable | 187,838 | |||
Trustees’ fees and expenses payable | 4,374 | |||
Accrued expenses and other liabilities | 71,087 | |||
|
| |||
Total liabilities | 1,435,353 | |||
|
| |||
Total net assets | $ | 946,533,800 | ||
|
| |||
Net assets consist of | ||||
Paid-in capital | $ | 421,390,671 | ||
Total distributable earnings | 525,143,129 | |||
|
| |||
Total net assets | $ | 946,533,800 | ||
|
| |||
Computation of net asset value and offering price per share | ||||
Net assets – Class A | $ | 800,198,658 | ||
Shares outstanding – Class A1 | 12,320,281 | |||
Net asset value per share – Class A | $64.95 | |||
Maximum offering price per share – Class A2 | $68.91 | |||
Net assets – Class C | $ | 22,076,640 | ||
Shares outstanding – Class C1 | 544,838 | |||
Net asset value per share – Class C | $40.52 | |||
Net assets – Class R | $ | 4,646,688 | ||
Shares outstanding – Class R1 | 76,679 | |||
Net asset value per share – Class R | $60.60 | |||
Net assets – Administrator Class | $ | 28,712,109 | ||
Shares outstanding – Administrator Class1 | 399,883 | |||
Net asset value per share – Administrator Class | $71.80 | |||
Net assets – Institutional Class | $ | 90,899,705 | ||
Shares outstanding – Institutional Class1 | 1,218,198 | |||
Net asset value per share – Institutional Class | $74.62 | |||
| 1 | The Fund has an unlimited number of authorized shares. |
| 2 | Maximum offering price is computed as 100/94.25 of net asset value. On investments of $50,000 or more, the offering price is reduced. |
The accompanying notes are an integral part of these financial statements.
Wells Fargo Omega Growth Fund | 15
Table of Contents
Statement of operations—year ended July 31, 2020
Investment income | ||||
Dividends (net of foreign withholding taxes of $79,112) | $ | 4,937,580 | ||
Income from affiliated securities | 79,944 | |||
|
| |||
Total investment income | 5,017,524 | |||
|
| |||
Expenses | ||||
Management fee | 6,501,542 | |||
Administration fees | ||||
Class A | 1,475,714 | |||
Class C | 45,824 | |||
Class R | 10,187 | |||
Administrator Class | 32,554 | |||
Institutional Class | 102,598 | |||
Shareholder servicing fees | ||||
Class A | 1,755,291 | |||
Class C | 54,498 | |||
Class R | 11,578 | |||
Administrator Class | 62,068 | |||
Distribution fees | ||||
Class C | 163,251 | |||
Class R | 11,908 | |||
Custody and accounting fees | 41,647 | |||
Professional fees | 52,660 | |||
Registration fees | 94,670 | |||
Shareholder report expenses | 120,987 | |||
Trustees’ fees and expenses | 21,002 | |||
Other fees and expenses | 24,557 | |||
|
| |||
Total expenses | 10,582,536 | |||
Less: Fee waivers and/or expense reimbursements | ||||
Fund-level | (734 | ) | ||
Class A | (22,211 | ) | ||
Class C | (165 | ) | ||
Administrator Class | (27,920 | ) | ||
Institutional Class | (81,342 | ) | ||
|
| |||
Net expenses | 10,450,164 | |||
|
| |||
Net investment loss | (5,432,640 | ) | ||
|
| |||
Realized and unrealized gains (losses) on investments | ||||
Net realized gains on | ||||
Unaffiliated securities | 59,455,701 | |||
Affiliated securities | 1,046 | |||
|
| |||
Net realized gains on investments | 59,456,747 | |||
Net change in unrealized gains (losses) on investments | 134,698,602 | |||
|
| |||
Net realized and unrealized gains (losses) on investments | 194,155,349 | |||
|
| |||
Net increase in net assets resulting from operations | $ | 188,722,709 | ||
|
| |||
The accompanying notes are an integral part of these financial statements.
16 | Wells Fargo Omega Growth Fund
Table of Contents
Statement of changes in net assets
| Year ended July 31, 2020 | Year ended July 31, 2019 | |||||||||||||||
Operations | ||||||||||||||||
Net investment loss | $ | (5,432,640 | ) | $ | (5,063,447 | ) | ||||||||||
Net realized gains on investments | 59,456,747 | 47,925,154 | ||||||||||||||
Net change in unrealized gains (losses) on investments | 134,698,602 | 60,465,004 | ||||||||||||||
|
| |||||||||||||||
Net increase in net assets resulting from operations | 188,722,709 | 103,326,711 | ||||||||||||||
|
| |||||||||||||||
Distributions to shareholders from net investment income and net realized gains | ||||||||||||||||
Class A | (38,639,530 | ) | (68,419,305 | ) | ||||||||||||
Class C | (1,862,430 | ) | (8,678,201 | ) | ||||||||||||
Class R | (304,034 | ) | (707,933 | ) | ||||||||||||
Administrator Class | (1,255,690 | ) | (2,403,661 | ) | ||||||||||||
Institutional Class | (3,766,464 | ) | (6,323,228 | ) | ||||||||||||
|
| |||||||||||||||
Total distributions to shareholders | (45,828,148 | ) | (86,532,328 | ) | ||||||||||||
|
| |||||||||||||||
Capital share transactions | Shares | Shares | ||||||||||||||
Proceeds from shares sold | ||||||||||||||||
Class A | 272,882 | 14,921,263 | 957,256 | 46,969,436 | ||||||||||||
Class C | 51,013 | 1,731,016 | 74,164 | 2,327,314 | ||||||||||||
Class R | 25,891 | 1,308,361 | 28,311 | 1,316,755 | ||||||||||||
Administrator Class | 9,639 | 598,496 | 21,538 | 1,243,245 | ||||||||||||
Institutional Class | 231,605 | 13,472,238 | 247,352 | 14,363,418 | ||||||||||||
|
| |||||||||||||||
| 32,031,374 | 66,220,168 | |||||||||||||||
|
| |||||||||||||||
Reinvestment of distributions | ||||||||||||||||
Class A | 697,108 | 37,030,375 | 1,458,710 | 65,102,208 | ||||||||||||
Class C | 53,921 | 1,795,565 | 288,212 | 8,392,731 | ||||||||||||
Class R | 4,691 | 232,868 | 9,582 | 402,155 | ||||||||||||
Administrator Class | 19,576 | 1,148,300 | 44,842 | 2,194,127 | ||||||||||||
Institutional Class | 61,188 | 3,723,927 | 123,606 | 6,249,540 | ||||||||||||
|
| |||||||||||||||
| 43,931,035 | 82,340,761 | |||||||||||||||
|
| |||||||||||||||
Payment for shares redeemed | ||||||||||||||||
Class A | (1,593,178 | ) | (85,882,986 | ) | (1,573,949 | ) | (79,522,009 | ) | ||||||||
Class C | (289,079 | ) | (10,068,981 | ) | (1,265,970 | ) | (40,375,871 | ) | ||||||||
Class R | (71,554 | ) | (3,669,955 | ) | (64,569 | ) | (3,197,822 | ) | ||||||||
Administrator Class | (60,813 | ) | (3,572,488 | ) | (41,328 | ) | (2,257,844 | ) | ||||||||
Institutional Class | (278,139 | ) | (17,354,985 | ) | (227,834 | ) | (13,026,557 | ) | ||||||||
|
| |||||||||||||||
| (120,549,395 | ) | (138,380,103 | ) | |||||||||||||
|
| |||||||||||||||
Net increase (decrease) in net assets resulting from capital share transactions | (44,586,986 | ) | 10,180,826 | |||||||||||||
|
| |||||||||||||||
Total increase in net assets | 98,307,575 | 26,975,209 | ||||||||||||||
|
| |||||||||||||||
Net assets | ||||||||||||||||
Beginning of period | 848,226,225 | 821,251,016 | ||||||||||||||
|
| |||||||||||||||
End of period | $ | 946,533,800 | $ | 848,226,225 | ||||||||||||
|
| |||||||||||||||
The accompanying notes are an integral part of these financial statements.
Wells Fargo Omega Growth Fund | 17
Table of Contents
(For a share outstanding throughout each period)
| Year ended July 31 | ||||||||||||||||||||
| CLASS A | 2020 | 2019 | 2018 | 2017 | 2016 | |||||||||||||||
Net asset value, beginning of period | $55.19 | $54.77 | $49.43 | $42.73 | $48.29 | |||||||||||||||
Net investment loss | (0.38 | )1 | (0.33 | )1 | (0.32 | )1 | (0.22 | )1 | (0.19 | )1 | ||||||||||
Net realized and unrealized gains (losses) on investments | 13.24 | 6.56 | 12.57 | 8.07 | (1.44 | ) | ||||||||||||||
|
|
|
|
|
|
|
|
|
| |||||||||||
Total from investment operations | 12.86 | 6.23 | 12.25 | 7.85 | (1.63 | ) | ||||||||||||||
Distributions to shareholders from | ||||||||||||||||||||
Net realized gains | (3.10 | ) | (5.81 | ) | (6.91 | ) | (1.15 | ) | (3.93 | ) | ||||||||||
Net asset value, end of period | $64.95 | $55.19 | $54.77 | $49.43 | $42.73 | |||||||||||||||
Total return2 | 24.55 | % | 13.89 | % | 26.86 | % | 18.88 | % | (3.07 | )% | ||||||||||
Ratios to average net assets (annualized) | ||||||||||||||||||||
Gross expenses | 1.28 | % | 1.28 | % | 1.28 | % | 1.28 | % | 1.28 | % | ||||||||||
Net expenses | 1.28 | % | 1.28 | % | 1.28 | % | 1.28 | % | 1.28 | % | ||||||||||
Net investment loss | (0.68 | )% | (0.64 | )% | (0.63 | )% | (0.50 | )% | (0.47 | )% | ||||||||||
Supplemental data | ||||||||||||||||||||
Portfolio turnover rate | 23 | % | 39 | % | 48 | % | 76 | % | 84 | % | ||||||||||
Net assets, end of period (000s omitted) | $800,199 | $714,411 | $662,751 | $581,967 | $573,304 | |||||||||||||||
| 1 | Calculated based upon average shares outstanding |
| 2 | Total return calculations do not include any sales charges. |
The accompanying notes are an integral part of these financial statements.
18 | Wells Fargo Omega Growth Fund
Table of Contents
Financial highlights
(For a share outstanding throughout each period)
| Year ended July 31 | ||||||||||||||||||||
| CLASS C | 2020 | 2019 | 2018 | 2017 | 2016 | |||||||||||||||
Net asset value, beginning of period | $35.83 | $38.02 | $36.47 | $32.07 | $37.55 | |||||||||||||||
Net investment loss | (0.50 | )1 | (0.48 | )1 | (0.50 | )1 | (0.41 | )1 | (0.39 | )1 | ||||||||||
Net realized and unrealized gains (losses) on investments | 8.29 | 4.10 | 8.96 | 5.96 | (1.16 | ) | ||||||||||||||
|
|
|
|
|
|
|
|
|
| |||||||||||
Total from investment operations | 7.79 | 3.62 | 8.46 | 5.55 | (1.55 | ) | ||||||||||||||
Distributions to shareholders from | ||||||||||||||||||||
Net realized gains | (3.10 | ) | (5.81 | ) | (6.91 | ) | (1.15 | ) | (3.93 | ) | ||||||||||
Net asset value, end of period | $40.52 | $35.83 | $38.02 | $36.47 | $32.07 | |||||||||||||||
Total return2 | 23.61 | % | 13.04 | % | 25.88 | % | 18.00 | % | (3.75 | )% | ||||||||||
Ratios to average net assets (annualized) | ||||||||||||||||||||
Gross expenses | 2.03 | % | 2.03 | % | 2.03 | % | 2.03 | % | 2.03 | % | ||||||||||
Net expenses | 2.03 | % | 2.03 | % | 2.03 | % | 2.03 | % | 2.03 | % | ||||||||||
Net investment loss | (1.42 | )% | (1.40 | )% | (1.38 | )% | (1.24 | )% | (1.22 | )% | ||||||||||
Supplemental data | ||||||||||||||||||||
Portfolio turnover rate | 23 | % | 39 | % | 48 | % | 76 | % | 84 | % | ||||||||||
Net assets, end of period (000s omitted) | $22,077 | $26,122 | $62,074 | $62,543 | $74,337 | |||||||||||||||
| 1 | Calculated based upon average shares outstanding |
| 2 | Total return calculations do not include any sales charges. |
The accompanying notes are an integral part of these financial statements.
Wells Fargo Omega Growth Fund | 19
Table of Contents
Financial highlights
(For a share outstanding throughout each period)
| Year ended July 31 | ||||||||||||||||||||
| CLASS R | 2020 | 2019 | 2018 | 2017 | 2016 | |||||||||||||||
Net asset value, beginning of period | $51.82 | $51.92 | $47.30 | $41.04 | $46.66 | |||||||||||||||
Net investment loss | (0.47 | )1 | (0.43 | )1 | (0.43 | )1 | (0.30 | )1 | (0.29 | )1 | ||||||||||
Net realized and unrealized gains (losses) on investments | 12.35 | 6.14 | 11.96 | 7.71 | (1.40 | ) | ||||||||||||||
|
|
|
|
|
|
|
|
|
| |||||||||||
Total from investment operations | 11.88 | 5.71 | 11.53 | 7.41 | (1.69 | ) | ||||||||||||||
Distributions to shareholders from | ||||||||||||||||||||
Net realized gains | (3.10 | ) | (5.81 | ) | (6.91 | ) | (1.15 | ) | (3.93 | ) | ||||||||||
Net asset value, end of period | $60.60 | $51.82 | $51.92 | $47.30 | $41.04 | |||||||||||||||
Total return | 24.24 | % | 13.63 | % | 26.53 | % | 18.58 | % | (3.30 | )% | ||||||||||
Ratios to average net assets (annualized) | ||||||||||||||||||||
Gross expenses | 1.52 | % | 1.53 | % | 1.53 | % | 1.53 | % | 1.53 | % | ||||||||||
Net expenses | 1.52 | % | 1.53 | % | 1.53 | % | 1.53 | % | 1.53 | % | ||||||||||
Net investment loss | (0.91 | )% | (0.88 | )% | (0.88 | )% | (0.72 | )% | (0.71 | )% | ||||||||||
Supplemental data | ||||||||||||||||||||
Portfolio turnover rate | 23 | % | 39 | % | 48 | % | 76 | % | 84 | % | ||||||||||
Net assets, end of period (000s omitted) | $4,647 | $6,097 | $7,494 | $6,298 | $10,122 | |||||||||||||||
| 1 | Calculated based upon average shares outstanding |
The accompanying notes are an integral part of these financial statements.
20 | Wells Fargo Omega Growth Fund
Table of Contents
Financial highlights
(For a share outstanding throughout each period)
| Year ended July 31 | ||||||||||||||||||||
| ADMINISTRATOR CLASS | 2020 | 2019 | 2018 | 2017 | 2016 | |||||||||||||||
Net asset value, beginning of period | $60.58 | $59.39 | $52.99 | $45.65 | $51.20 | |||||||||||||||
Net investment loss | (0.30 | )1 | (0.25 | )1 | (0.25 | )1 | (0.12 | )1 | (0.12 | )1 | ||||||||||
Net realized and unrealized gains (losses) on investments | 14.62 | 7.25 | 13.56 | 8.61 | (1.50 | ) | ||||||||||||||
|
|
|
|
|
|
|
|
|
| |||||||||||
Total from investment operations | 14.32 | 7.00 | 13.31 | 8.49 | (1.62 | ) | ||||||||||||||
Distributions to shareholders from | ||||||||||||||||||||
Net realized gains | (3.10 | ) | (5.81 | ) | (6.91 | ) | (1.15 | ) | (3.93 | ) | ||||||||||
Net asset value, end of period | $71.80 | $60.58 | $59.39 | $52.99 | $45.65 | |||||||||||||||
Total return | 24.78 | % | 14.12 | % | 27.07 | % | 19.08 | % | (2.84 | )% | ||||||||||
Ratios to average net assets (annualized) | ||||||||||||||||||||
Gross expenses | 1.20 | % | 1.20 | % | 1.20 | % | 1.20 | % | 1.19 | % | ||||||||||
Net expenses | 1.09 | % | 1.10 | % | 1.10 | % | 1.10 | % | 1.08 | % | ||||||||||
Net investment loss | (0.49 | )% | (0.45 | )% | (0.45 | )% | (0.25 | )% | (0.27 | )% | ||||||||||
Supplemental data | ||||||||||||||||||||
Portfolio turnover rate | 23 | % | 39 | % | 48 | % | 76 | % | 84 | % | ||||||||||
Net assets, end of period (000s omitted) | $28,712 | $26,141 | $24,140 | $19,754 | $38,039 | |||||||||||||||
| 1 | Calculated based upon average shares outstanding |
The accompanying notes are an integral part of these financial statements.
Wells Fargo Omega Growth Fund | 21
Table of Contents
Financial highlights
(For a share outstanding throughout each period)
| Year ended July 31 | ||||||||||||||||||||
| INSTITUTIONAL CLASS | 2020 | 2019 | 2018 | 2017 | 2016 | |||||||||||||||
Net asset value, beginning of period | $62.69 | $61.10 | $54.21 | $46.55 | $52.01 | |||||||||||||||
Net investment loss | (0.16 | )1 | (0.12 | )1 | (0.11 | )1 | (0.03 | )1 | (0.00 | )2 | ||||||||||
Net realized and unrealized gains (losses) on investments | 15.19 | 7.52 | 13.91 | 8.84 | (1.53 | ) | ||||||||||||||
|
|
|
|
|
|
|
|
|
| |||||||||||
Total from investment operations | 15.03 | 7.40 | 13.80 | 8.81 | (1.53 | ) | ||||||||||||||
Distributions to shareholders from | ||||||||||||||||||||
Net realized gains | (3.10 | ) | (5.81 | ) | (6.91 | ) | (1.15 | ) | (3.93 | ) | ||||||||||
Net asset value, end of period | $74.62 | $62.69 | $61.10 | $54.21 | $46.55 | |||||||||||||||
Total return | 25.09 | % | 14.39 | % | 27.39 | % | 19.40 | % | (2.61 | )% | ||||||||||
Ratios to average net assets (annualized) | ||||||||||||||||||||
Gross expenses | 0.95 | % | 0.95 | % | 0.95 | % | 0.95 | % | 0.95 | % | ||||||||||
Net expenses | 0.85 | % | 0.85 | % | 0.85 | % | 0.85 | % | 0.83 | % | ||||||||||
Net investment loss | (0.25 | )% | (0.20 | )% | (0.20 | )% | (0.06 | )% | (0.01 | )% | ||||||||||
Supplemental data | ||||||||||||||||||||
Portfolio turnover rate | 23 | % | 39 | % | 48 | % | 76 | % | 84 | % | ||||||||||
Net assets, end of period (000s omitted) | $90,900 | $75,456 | $64,792 | $62,987 | $76,980 | |||||||||||||||
| 1 | Calculated based upon average shares outstanding |
| 2 | Amount is more than $(0.005). |
The accompanying notes are an integral part of these financial statements.
22 | Wells Fargo Omega Growth Fund
Table of Contents
1. ORGANIZATION
Wells Fargo Funds Trust (the “Trust”), a Delaware statutory trust organized on March 10, 1999, is an open-end management investment company registered under the Investment Company Act of 1940, as amended (the “1940 Act”). As an investment company, the Trust follows the accounting and reporting guidance in Financial Accounting Standards Board (“FASB”) Accounting Standards Codification Topic 946, Financial Services – Investment Companies. These financial statements report on the Wells Fargo Omega Growth Fund (the “Fund”) which is a diversified series of the Trust.
2. SIGNIFICANT ACCOUNTING POLICIES
The following significant accounting policies, which are consistently followed in the preparation of the financial statements of the Fund, are in conformity with U.S. generally accepted accounting principles which require management to make estimates and assumptions that affect the reported amounts of assets and liabilities, disclosure of contingent assets and liabilities at the date of the financial statements, and the reported amounts of revenues and expenses during the reporting period. Actual results could differ from those estimates.
Securities valuation
All investments are valued each business day as of the close of regular trading on the New York Stock Exchange (generally 4 p.m. Eastern Time), although the Fund may deviate from this calculation time under unusual or unexpected circumstances.
Equity securities that are listed on a foreign or domestic exchange or market are valued at the official closing price or, if none, the last sales price. If no sale occurs on the principal exchange or market that day, a fair value price will be determined in accordance with the Fund’s Valuation Procedures.
Investments in registered open-end investment companies are valued at net asset value. Interests in non-registered investment companies that are redeemable at net asset value are fair valued normally at net asset value.
Investments which are not valued using any of the methods discussed above are valued at their fair value, as determined in good faith by the Board of Trustees of the Fund. The Board of Trustees has established a Valuation Committee comprised of the Trustees and has delegated to it the authority to take any actions regarding the valuation of portfolio securities that the Valuation Committee deems necessary or appropriate, including determining the fair value of portfolio securities, unless the determination has been delegated to the Wells Fargo Asset Management Pricing Committee at Wells Fargo Funds Management, LLC (“Funds Management”). The Board of Trustees retains the authority to make or ratify any valuation decisions or approve any changes to the Valuation Procedures as it deems appropriate. On a quarterly basis, the Board of Trustees receives reports on any valuation actions taken by the Valuation Committee or the Wells Fargo Asset Management Pricing Committee which may include items for ratification.
Foreign currency translation
The accounting records of the Fund are maintained in U.S. dollars. The values of other assets and liabilities denominated in foreign currencies are translated into U.S. dollars at rates provided by an independent foreign currency pricing source at a time each business day specified by the Wells Fargo Asset Management Pricing Committee. Purchases and sales of securities, and income and expenses are converted at the rate of exchange on the respective dates of such transactions. Net realized foreign exchange gains or losses arise from sales of foreign currencies, currency gains or losses realized between the trade and settlement dates on securities transactions, and the difference between the amounts of dividends, interest and foreign withholding taxes recorded and the U.S. dollar equivalent of the amounts actually paid or received. Net unrealized foreign exchange gains and losses arise from changes in the fair value of assets and liabilities other than investments in securities resulting from changes in exchange rates. The changes in net assets arising from changes in exchange rates of securities and the changes in net assets resulting from changes in market prices of securities are not separately presented. Such changes are included in net realized and unrealized gains or losses from investments.
Securities lending
The Fund may lend its securities from time to time in order to earn additional income in the form of fees or interest on securities received as collateral or the investment of any cash received as collateral. When securities are on loan, the Fund receives interest or dividends on those securities. Cash collateral received in connection with its securities lending transactions is invested in Securities Lending Cash Investments, LLC (the “Securities Lending Fund”). Investments in Securities Lending Fund are valued at the evaluated bid price provided by an independent pricing service. Income earned from investment in the Securities Lending Fund (net of fees and rebates), if any, is included in income from affiliated securities on the Statement of Operations.
Wells Fargo Omega Growth Fund | 23
Table of Contents
Notes to financial statements
In a securities lending transaction, the net asset value of the Fund is affected by an increase or decrease in the value of the securities loaned and by an increase or decrease in the value of the instrument in which collateral is invested. The amount of securities lending activity undertaken by the Fund fluctuates from time to time. The Fund has the right under the lending agreement to recover the securities from the borrower on demand. In the event of default or bankruptcy by the borrower, the Fund may be prevented from recovering the loaned securities or gaining access to the collateral or may experience delays or costs in doing so. In such an event, the terms of the agreement allow the unaffiliated securities lending agent to use the collateral to purchase replacement securities on behalf of the Fund or pay the Fund the market value of the loaned securities. The Fund bears the risk of loss with respect to depreciation of its investment of the cash collateral.
Security transactions and income recognition
Securities transactions are recorded on a trade date basis. Realized gains or losses are recorded on the basis of identified cost.
Dividend income is recognized on the ex-dividend date. Dividend income is recorded net of foreign taxes withheld where recovery of such taxes is not assured.
Distributions to shareholders
Distributions to shareholders from net investment income and any net realized gains are recorded on the ex-dividend date and paid at least annually. Such distributions are determined in accordance with income tax regulations and may differ from U.S. generally accepted accounting principles. Dividend sources are estimated at the time of declaration. The tax character of distributions is determined as of the Fund’s fiscal year end. Therefore, a portion of the Fund’s distributions made prior to the Fund’s fiscal year end may be categorized as a tax return of capital at year end.
Federal and other taxes
The Fund intends to continue to qualify as a regulated investment company by distributing substantially all of its investment company taxable income and any net realized capital gains (after reduction for capital loss carryforwards) sufficient to relieve it from all, or substantially all, federal income taxes. Accordingly, no provision for federal income taxes was required.
The Fund’s income and federal excise tax returns and all financial records supporting those returns for the prior three fiscal years are subject to examination by the federal and Delaware revenue authorities. Management has analyzed the Fund’s tax positions taken on federal, state, and foreign tax returns for all open tax years and does not believe that there are any uncertain tax positions that require recognition of a tax liability.
As of July 31, 2020, the aggregate cost of all investments for federal income tax purposes was $463,186,002 and the unrealized gains (losses) consisted of:
Gross unrealized gains | $ | 493,308,523 | ||
Gross unrealized losses | (8,680,301 | ) | ||
Net unrealized gains | $ | 484,628,222 | ||
As of July 31, 2020, the Fund had a qualified late-year ordinary loss of $1,808,659 which will be recognized on the first day of the following fiscal year.
Class allocations
The separate classes of shares offered by the Fund differ principally in applicable sales charges, distribution, shareholder servicing, and administration fees. Class specific expenses are charged directly to that share class. Investment income, common fund-level expenses, and realized and unrealized gains (losses) on investments are allocated daily to each class of shares based on the relative proportion of net assets of each class.
3. FAIR VALUATION MEASUREMENTS
Fair value measurements of investments are determined within a framework that has established a fair value hierarchy based upon the various data inputs utilized in determining the value of the Fund’s investments. The three-level hierarchy gives the highest priority to unadjusted quoted prices in active markets for identical assets or liabilities (Level 1) and the lowest priority to unobservable inputs (Level 3). The Fund’s investments are classified within the fair value hierarchy based on the lowest level of input that is significant to the fair value measurement. The inputs are summarized into three broad levels as follows:
| ∎ | Level 1 – quoted prices in active markets for identical securities |
| ∎ | Level 2 – other significant observable inputs (including quoted prices for similar securities, interest rates, prepayment speeds, credit risk, etc.) |
| ∎ | Level 3 – significant unobservable inputs (including the Fund’s own assumptions in determining the fair value of investments) |
24 | Wells Fargo Omega Growth Fund
Table of Contents
Notes to financial statements
The inputs or methodologies used for valuing investments in securities are not necessarily an indication of the risk associated with investing in those securities.
The following is a summary of the inputs used in valuing the Fund’s assets and liabilities as of July 31, 2020:
Quoted prices (Level 1) | Other significant observable inputs (Level 2) | Significant unobservable inputs (Level 3) | Total | |||||||||||||
Assets | ||||||||||||||||
Investments in: | ||||||||||||||||
Common stocks | ||||||||||||||||
Communication services | $ | 112,529,416 | $ | 0 | $ | 0 | $ | 112,529,416 | ||||||||
Consumer discretionary | 174,287,649 | 0 | 0 | 174,287,649 | ||||||||||||
Financials | 14,691,204 | 0 | 0 | 14,691,204 | ||||||||||||
Health care | 174,629,991 | 0 | 0 | 174,629,991 | ||||||||||||
Industrials | 76,050,237 | 0 | 0 | 76,050,237 | ||||||||||||
Information technology | 347,165,381 | 0 | 0 | 347,165,381 | ||||||||||||
Materials | 34,113,806 | 0 | 0 | 34,113,806 | ||||||||||||
Real estate | 8,193,501 | 0 | 0 | 8,193,501 | ||||||||||||
Short-term investments | ||||||||||||||||
Investment companies | 6,153,039 | 0 | 0 | 6,153,039 | ||||||||||||
Total assets | $ | 947,814,224 | $ | 0 | $ | 0 | $ | 947,814,224 | ||||||||
Additional sector, industry or geographic detail is included in the Portfolio of Investments.
For the year ended July 31, 2020, the Fund did not have any transfers into/out of Level 3.
4. TRANSACTIONS WITH AFFILIATES
Management fee
Funds Management, an indirect wholly owned subsidiary of Wells Fargo & Company (“Wells Fargo”), is the manager of the Fund and provides advisory and fund-level administrative services under an investment management agreement. Under the investment management agreement, Funds Management is responsible for, among other services, implementing the investment objectives and strategies of the Fund, supervising the subadviser and providing fund-level administrative services in connection with the Fund’s operations. As compensation for its services under the investment management agreement, Funds Management is entitled to receive a management fee at the following annual rate based on the Fund’s average daily net assets:
| Average daily net assets | Management fee | |||
First $500 million | 0.800 | % | ||
Next $500 million | 0.750 | |||
Next $1 billion | 0.700 | |||
Next $2 billion | 0.675 | |||
Next $1 billion | 0.650 | |||
Next $3 billion | 0.640 | |||
Next $2 billion | 0.615 | |||
Next $2 billion | 0.605 | |||
Next $4 billion | 0.580 | |||
Over $16 billion | 0.555 | |||
For the year ended July 31, 2020, the management fee was equivalent to an annual rate of 0.78% of the Fund’s average daily net assets.
Funds Management has retained the services of a subadviser to provide daily portfolio management to the Fund. The fee for subadvisory services is borne by Funds Management. Wells Capital Management Incorporated (“WellsCap”), an affiliate of
Wells Fargo Omega Growth Fund | 25
Table of Contents
Notes to financial statements
Funds Management and an indirect wholly owned subsidiary of Wells Fargo, is the subadviser to the Fund and is entitled to receive a fee from Funds Management at an annual rate starting at 0.45% and declining to 0.30% as the average daily net assets of the Fund increase.
Administration fees
Under a class-level administration agreement, Funds Management provides class-level administrative services to the Fund, which includes paying fees and expenses for services provided by the transfer agent, sub-transfer agents, omnibus account servicers and record-keepers. As compensation for its services under the class-level administration agreement, Funds Management receives an annual fee which is calculated based on the average daily net assets of each class as follows:
Class-level administration fee | ||||
Class A, Class C, Class R | 0.21 | % | ||
Administrator Class, Institutional Class | 0.13 | |||
Waivers and/or expense reimbursements
Funds Management has contractually waived and/or reimbursed management and administration fees to the extent necessary to maintain certain net operating expense ratios for the Fund. When each class of the Fund has exceeded its expense cap, Funds Management has waived fees and/or reimbursed expenses from fund-level expenses on a proportionate basis and then from class specific expenses. When only certain classes exceed their expense caps, waivers and/or reimbursements are applied against class specific expenses before fund-level expenses. Funds Management has committed through November 30, 2020 to waive fees and/or reimburse expenses to the extent necessary to cap the Fund’s expenses at 1.30% for Class A shares, 2.05% for Class C shares, 1.55% for Class R shares, 1.10% for Administrator Class shares, and 0.85% for Institutional Class shares. Prior to or after the commitment expiration date, the cap may be increased or the commitment to maintain the cap may be terminated only with the approval of the Board of Trustees.
Distribution fees
The Trust has adopted a distribution plan for Class C and Class R shares of the Fund pursuant to Rule 12b-1 under the 1940 Act. Distribution fees are charged to Class C and Class R shares and paid to Wells Fargo Funds Distributor, LLC (“Funds Distributor”), the principal underwriter, at an annual rate of 0.75% of the average daily net assets of Class C shares and 0.25% of the average daily net assets of Class R shares.
In addition, Funds Distributor is entitled to receive the front-end sales charge from the purchase of Class A shares and a contingent deferred sales charge on the redemption of certain Class A shares. Funds Distributor is also entitled to receive the contingent deferred sales charges from redemptions of Class C shares. For the year ended July 31, 2020, Funds Distributor received $15,755 from the sale of Class A shares and $104 and $45 in contingent deferred sales charges from redemptions of Class A and Class C shares, respectively.
Shareholder servicing fees
The Trust has entered into contracts with one or more shareholder servicing agents, whereby Class A, Class C, Class R, and Administrator Class of the Fund are charged a fee at an annual rate of 0.25% of the average daily net assets of each respective class. A portion of these total shareholder servicing fees were paid to affiliates of Wells Fargo.
Interfund transactions
The Fund may purchase or sell portfolio investment securities to certain other Wells Fargo affiliates pursuant to Rule 17a-7 under the 1940 Act and under procedures adopted by the Board of Trustees. The procedures have been designed to ensure that these interfund transactions, which do not incur broker commissions, are effected at current market prices.
5. INVESTMENT PORTFOLIO TRANSACTIONS
Purchases and sales of investments, excluding U.S. government obligations (if any) and short-term securities, for the year ended July 31, 2020 were $191,949,088 and $289,714,112, respectively.
6. SECURITIES LENDING TRANSACTIONS
The Fund lends its securities through an unaffiliated securities lending agent and receives collateral in the form of cash or securities with a value at least equal to the value of the securities on loan. The value of the loaned securities is determined at the close of each business day and any increases or decreases in the required collateral are exchanged between the Fund and the counterparty on the next business day. Cash collateral received is invested in the Securities Lending Fund which seeks to
26 | Wells Fargo Omega Growth Fund
Table of Contents
Notes to financial statements
provide a positive return compared to the daily Federal Funds Open Rate by investing in high-quality, U.S. dollar-denominated short-term money market instruments and is exempt from registration under Section 3(c)(7) of the 1940 Act. Securities Lending Fund is managed by Funds Management and is subadvised by WellsCap. Funds Management receives an advisory fee starting at 0.05% and declining to 0.01% as the average daily net assets of the Securities Lending Fund increase. All of the fees received by Funds Management are paid to WellsCap for its services as subadviser.
In the event of counterparty default or the failure of a borrower to return a loaned security, the Fund has the right to use the collateral to offset any losses incurred. As of July 31, 2020, the Fund did not have any securities on loan.
7. BANK BORROWINGS
The Trust (excluding the money market funds), Wells Fargo Master Trust and Wells Fargo Variable Trust are parties to a $350,000,000 revolving credit agreement whereby the Fund is permitted to use bank borrowings for temporary or emergency purposes, such as to fund shareholder redemption requests. Interest under the credit agreement is charged to the Fund based on a borrowing rate equal to the higher of the Federal Funds rate in effect on that day plus 1.25% or the overnight LIBOR rate in effect on that day plus 1.25%. In addition, an annual commitment fee equal to 0.25% of the unused balance is allocated to each participating fund.
For the year ended July 31, 2020, there were no borrowings by the Fund under the agreement.
8. DISTRIBUTIONS TO SHAREHOLDERS
The tax character of distributions paid during the years ended July 31, 2020 and July 31, 2019 were as follows:
| Year ended July 31 | ||||||||
| 2020 | 2019 | |||||||
Ordinary income | $ | 0 | $ | 12,379,292 | ||||
Long-term capital gain | 45,828,148 | 74,153,036 | ||||||
As of July 31, 2020, the components of distributable earnings on a tax basis were as follows:
Undistributed long-term gain | Unrealized gains | Late-year ordinary losses deferred | ||
| $42,342,017 | $484,628,222 | $(1,808,659) | ||
9. CONCENTRATION RISK
Concentration risks result from exposure to a limited number of sectors. As of the end of the period, the Fund invested a concentration of its portfolio in the information technology sector. A fund that invests a substantial portion of its assets in any sector may be more affected by changes in that sector than would be a fund whose investments are not heavily weighted in any sector.
10. INDEMNIFICATION
Under the Fund’s organizational documents, the officers and Trustees have been granted certain indemnification rights against certain liabilities that may arise out of performance of their duties to the Fund. The Fund has entered into a separate agreement with each Trustee that converts indemnification rights currently existing under the Fund’s organizational documents into contractual rights that cannot be changed in the future without the consent of the Trustee. Additionally, in the normal course of business, the Fund may enter into contracts with service providers that contain a variety of indemnification clauses. The Fund’s maximum exposure under these arrangements is dependent on future claims that may be made against the Fund and, therefore, cannot be estimated.
11. NEW ACCOUNTING PRONOUNCEMENT
In August 2018, FASB issued Accounting Standards Update (“ASU”) No. 2018-13, Fair Value Measurement (Topic 820) Disclosure Framework—Changes to the Disclosure Requirements for Fair Value Measurement. ASU 2018-13 updates the disclosure requirements on fair value measurements in Topic 820, Fair Value Measurements. The amendments are effective for fiscal years, and interim periods within those fiscal years, beginning after December 15, 2019. Management has adopted this guidance which did not have a material impact on the financial statements.
Wells Fargo Omega Growth Fund | 27
Table of Contents
Notes to financial statements
12. CORONAVIRUS (COVID-19) PANDEMIC
On March 11, 2020, the World Health Organization announced that it had made the assessment that coronavirus disease 2019 (“COVID-19”) is a pandemic. The impacts of COVID-19 are adversely affecting the entire global economy, individual companies and investment products, and the market in general. There is significant uncertainty around the extent and duration of business disruptions related to COVID-19 and the impacts may be short term or may last for an extended period of time. The risk of further spreading of COVID-19 has led to significant uncertainty and volatility in the financial markets.
13. SUBSEQUENT EVENT
On August 14, 2020, Class C of the Fund was reimbursed by Funds Management in the amount of $72,542. The reimbursement was in connection with resolving certain fee reimbursements.
28 | Wells Fargo Omega Growth Fund
Table of Contents
Report of independent registered public accounting firm
To the Shareholders of the Fund and Board of Trustees
Wells Fargo Funds Trust:
Opinion on the Financial Statements
We have audited the accompanying statement of assets and liabilities of Wells Fargo Omega Growth Fund (the Fund), one of the funds constituting Wells Fargo Funds Trust, including the portfolio of investments, as of July 31, 2020, the related statement of operations for the year then ended, the statements of changes in net assets for each of the years in the two-year period then ended, and the related notes (collectively, the financial statements) and the financial highlights for each of the years in the five-year period then ended. In our opinion, the financial statements and financial highlights present fairly, in all material respects, the financial position of the Fund as of July 31, 2020, the results of its operations for the year then ended, the changes in its net assets for each of the years in the two-year period then ended, and the financial highlights for each of the years in the five-year period then ended, in conformity with U.S. generally accepted accounting principles.
Basis for Opinion
These financial statements and financial highlights are the responsibility of the Fund’s management. Our responsibility is to express an opinion on these financial statements and financial highlights based on our audits. We are a public accounting firm registered with the Public Company Accounting Oversight Board (United States) (PCAOB) and are required to be independent with respect to the Fund in accordance with the U.S. federal securities laws and the applicable rules and regulations of the Securities and Exchange Commission and the PCAOB.
We conducted our audits in accordance with the standards of the PCAOB. Those standards require that we plan and perform the audit to obtain reasonable assurance about whether the financial statements and financial highlights are free of material misstatement, whether due to error or fraud. Our audits included performing procedures to assess the risks of material misstatement of the financial statements and financial highlights, whether due to error or fraud, and performing procedures that respond to those risks. Such procedures included examining, on a test basis, evidence regarding the amounts and disclosures in the financial statements and financial highlights. Such procedures also included confirmation of securities owned as of July 31, 2020, by correspondence with the custodian and transfer agent. Our audits also included evaluating the accounting principles used and significant estimates made by management, as well as evaluating the overall presentation of the financial statements and financial highlights. We believe that our audits provide a reasonable basis for our opinion.

We have not been able to determine the specific year that we began serving as the auditor of one or more Wells Fargo Funds investment companies; however we are aware that we have served as the auditor of one or more Wells Fargo Funds investment companies since at least 1955.
Boston, Massachusetts
September 25, 2020
Wells Fargo Omega Growth Fund | 29
Table of Contents
TAX INFORMATION
Pursuant to Section 852 of the Internal Revenue Code, $45,828,148 was designated as a 20% rate gain distribution for the fiscal year ended July 31, 2020.
PROXY VOTING INFORMATION
A description of the policies and procedures used to determine how to vote proxies relating to portfolio securities is available, upon request, by calling 1-800-222-8222, visiting our website at wfam.com, or visiting the SEC website at sec.gov. Information regarding how the proxies related to portfolio securities were voted during the most recent 12-month period ended June 30 is available on the website at wfam.com or by visiting the SEC website at sec.gov.
QUARTERLY PORTFOLIO HOLDINGS INFORMATION
The Fund files its complete schedule of portfolio holdings with the SEC for the first and third quarters of each fiscal year as an exhibit to its reports on Form N-PORT. Shareholders may view the filed Form N-PORT by visiting the SEC website at sec.gov.
30 | Wells Fargo Omega Growth Fund
Table of Contents
Other information (unaudited)
BOARD OF TRUSTEES AND OFFICERS
Each of the Trustees and Officers1 listed in the table below acts in identical capacities for each fund in the Wells Fargo family of funds, which consists of 147 mutual funds comprising the Wells Fargo Funds Trust, Wells Fargo Variable Trust, Wells Fargo Master Trust and four closed-end funds (collectively the “Fund Complex”). This table should be read in conjunction with the Prospectus and the Statement of Additional Information2. The mailing address of each Trustee and Officer is 525 Market Street, 12th Floor, San Francisco, CA 94105. Each Trustee and Officer serves an indefinite term, however, each Trustee serves such term until reaching the mandatory retirement age established by the Trustees.
Independent Trustees
Name and year of birth | Position held and length of service* | Principal occupations during past five years or longer | Current other public company or investment company directorships | |||
William R. Ebsworth (Born 1957) | Trustee, since 2015 | Retired. From 1984 to 2013, equities analyst, portfolio manager, research director and chief investment officer at Fidelity Management and Research Company in Boston, Tokyo, and Hong Kong, and retired in 2013 as Chief Investment Officer of Fidelity Strategic Advisers, Inc. where he led a team of investment professionals managing client assets. Prior thereto, Board member of Hong Kong Securities Clearing Co., Hong Kong Options Clearing Corp., the Thailand International Fund, Ltd., Fidelity Investments Life Insurance Company, and Empire Fidelity Investments Life Insurance Company. Audit Committee Chair and Investment Committee Chair of the Vincent Memorial Hospital Endowment (non-profit organization). Mr. Ebsworth is a CFA® charterholder. | N/A | |||
Jane A. Freeman (Born 1953) | Trustee, since 2015; Chair Liaison, since 2018 | Retired. From 2012 to 2014 and 1999 to 2008, Chief Financial Officer of Scientific Learning Corporation. From 2008 to 2012, Ms. Freeman provided consulting services related to strategic business projects. Prior to 1999, Portfolio Manager at Rockefeller & Co. and Scudder, Stevens & Clark. Board member of the Harding Loevner Funds from 1996 to 2014, serving as both Lead Independent Director and chair of the Audit Committee. Board member of the Russell Exchange Traded Funds Trust from 2011 to 2012 and the chair of the Audit Committee. Ms. Freeman is also an inactive Chartered Financial Analyst. | N/A | |||
Isaiah Harris, Jr. (Born 1952) | Trustee, since 2009; Audit Committee Chairman, since 2019 | Retired. Chairman of the Board of CIGNA Corporation since 2009, and Director since 2005. From 2003 to 2011, Director of Deluxe Corporation. Prior thereto, President and CEO of BellSouth Advertising and Publishing Corp. from 2005 to 2007, President and CEO of BellSouth Enterprises from 2004 to 2005 and President of BellSouth Consumer Services from 2000 to 2003. Emeritus member of the Iowa State University Foundation Board of Governors. Emeritus Member of the Advisory Board of Iowa State University School of Business. Advisory Board Member, Palm Harbor Academy (private school). Advisory Board Member, Child Evangelism Fellowship (non-profit). Mr. Harris is a certified public accountant (inactive status). | CIGNA Corporation | |||
Judith M. Johnson (Born 1949) | Trustee, since 2008; Audit Committee Chairman, from 2009 to 2018 | Retired. Prior thereto, Chief Executive Officer and Chief Investment Officer of Minneapolis Employees Retirement Fund from 1996 to 2008. Ms. Johnson is an attorney, certified public accountant and a certified managerial accountant. | N/A | |||
Wells Fargo Omega Growth Fund | 31
Table of Contents
Other information (unaudited)
Name and year of birth | Position held and length of service* | Principal occupations during past five years or longer | Current other public company or investment company directorships | |||
David F. Larcker (Born 1950) | Trustee, since 2009 | James Irvin Miller Professor of Accounting at the Graduate School of Business, Stanford University, Director of the Corporate Governance Research Initiative and Senior Faculty of The Rock Center for Corporate Governance since 2006. From 2005 to 2008, Professor of Accounting at the Graduate School of Business, Stanford University. Prior thereto, Ernst & Young Professor of Accounting at The Wharton School, University of Pennsylvania from 1985 to 2005. | N/A | |||
Olivia S. Mitchell (Born 1953) | Trustee, since 2006; Nominating and Governance Committee Chair, since 2018 | International Foundation of Employee Benefit Plans Professor, Wharton School of the University of Pennsylvania since 1993. Director of Wharton’s Pension Research Council and Boettner Center on Pensions & Retirement Research, and Research Associate at the National Bureau of Economic Research. Previously, Cornell University Professor from 1978 to 1993. | N/A | |||
Timothy J. Penny (Born 1951) | Trustee, since 1996; Chairman, since 2018 | President and Chief Executive Officer of Southern Minnesota Initiative Foundation, a non-profit organization, since 2007. Member of the Board of Trustees of NorthStar Education Finance, Inc., a non-profit organization, since 2007. | N/A | |||
James G. Polisson (Born 1959) | Trustee, since 2018 | Retired. Chief Marketing Officer, Source (ETF) UK Services, Ltd, from 2015 to 2017. From 2012 to 2015, Principal of The Polisson Group, LLC, a management consulting, corporate advisory and principal investing company. Chief Executive Officer and Managing Director at Russell Investments, Global Exchange Traded Funds from 2010 to 2012. Managing Director of Barclays Global Investors from 1998 to 2010 and Global Chief Marketing Officer for iShares and Barclays Global Investors from 2000 to 2010. Trustee of the San Francisco Mechanics’ Institute, a non-profit organization, from 2013 to 2015. Board member of the Russell Exchange Traded Fund Trust from 2011 to 2012. Director of Barclays Global Investors Holdings Deutschland GmbH from 2006 to 2009. Mr. Polisson is an attorney and has a retired status with the Massachusetts and District of Columbia Bar Associations. | N/A | |||
Pamela Wheelock (Born 1959) | Trustee, since January 2020; previously Trustee from January 2018 to July 2019 | Board member of the Destination Medical Center Economic Development Agency, Rochester, Minnesota since 2019 and Interim President of the McKnight Foundation since 2020. Acting Commissioner, Minnesota Department of Human Services, July 2019 through September 2019. Human Services Manager (part-time), Minnesota Department of Human Services, October 2019 through December 2019. Chief Operating Officer, Twin Cities Habitat for Humanity from 2017 to 2019. Vice President of University Services, University of Minnesota from 2012 to 2016. Prior thereto, on the Board of Directors, Governance Committee and Finance Committee for the Minnesota Philanthropy Partners (Saint Paul Foundation) from 2012 to 2018, Interim Chief Executive Officer of Blue Cross Blue Shield of Minnesota from 2011 to 2012, Chairman of the Board from 2009 to 2012 and Board Director from 2003 to 2015. Vice President, Leadership and Community Engagement, Bush Foundation, Saint Paul, Minnesota (a private foundation) from 2009 to 2011. Executive Vice President and Chief Financial Officer, Minnesota Sports and Entertainment from 2004 to 2009 and Senior Vice President from 2002 to 2004. Executive Vice President of the Minnesota Wild Foundation from 2004 to 2008. Commissioner of Finance, State of Minnesota, from 1999 to 2002. Currently Board Chair of the Minnesota Wild Foundation since 2010. | N/A | |||
| * | Length of service dates reflect the Trustee’s commencement of service with the Trust’s predecessor entities, where applicable. |
32 | Wells Fargo Omega Growth Fund
Table of Contents
Other information (unaudited)
Officers
Name and year of birth | Position held and length of service | Principal occupations during past five years or longer | ||
Andrew Owen (Born 1960) | President, since 2017 | Executive Vice President of Wells Fargo & Company and Head of Affiliated Managers, Wells Fargo Asset Management, since 2014. In addition, Mr. Owen is currently President, Chief Executive Officer and Director of Wells Fargo Funds Management, LLC since 2017. Prior thereto, Executive Vice President responsible for marketing, investments and product development for Wells Fargo Funds Management, LLC, from 2009 to 2014. | ||
Jeremy DePalma1 (Born 1974) | Treasurer, since 2012 | Senior Vice President of Wells Fargo Funds Management, LLC since 2009. Senior Vice President of Evergreen Investment Management Company, LLC from 2008 to 2010 and head of the Fund Reporting and Control Team within Fund Administration from 2005 to 2010. | ||
Michelle Rhee (Born 1966) | Chief Legal Officer, since 2019 | Secretary of Wells Fargo Funds Management, LLC, Chief Legal Counsel of Wells Fargo Asset Management and Assistant General Counsel of Wells Fargo Bank, N.A. since 2018. Associate General Counsel and Managing Director of Bank of America Corporation from 2004 to 2018. | ||
Catherine Kennedy (Born 1969) | Secretary, since 2019 | Vice President of Wells Fargo Funds Management, LLC and Senior Counsel of the Wells Fargo Legal Department since 2010. Vice President and Senior Counsel of Evergreen Investment Management Company, LLC from 1998 to 2010. | ||
Michael H. Whitaker (Born 1967) | Chief Compliance Officer, since 2016 | Chief Compliance Officer of Wells Fargo Asset Management since 2016. Senior Vice President and Chief Compliance Officer for Fidelity Investments from 2007 to 2016. | ||
David Berardi (Born 1975) | Assistant Treasurer, since 2009 | Vice President of Wells Fargo Funds Management, LLC since 2009. Vice President of Evergreen Investment Management Company, LLC from 2008 to 2010. Manager of Fund Reporting and Control for Evergreen Investment Management Company, LLC from 2004 to 2010. | ||
| 1 | Jeremy DePalma acts as Treasurer of 82 funds and Assistant Treasurer of 65 funds in the Fund Complex. |
| 2 | The Statement of Additional Information includes additional information about the Trustees and is available, without charge, upon request, by calling 1-800-222-8222 or by visiting the website at wfam.com. |
Wells Fargo Omega Growth Fund | 33
Table of Contents
Other information (unaudited)
BOARD CONSIDERATION OF INVESTMENT MANAGEMENT AND SUB-ADVISORY AGREEMENTS:
Wells Fargo Omega Growth Fund
Under the Investment Company Act of 1940 (the “1940 Act”), the Board of Trustees (the “Board”) of Wells Fargo Funds Trust (the “Trust”) must determine annually whether to approve the continuation of the Trust’s investment management and sub-advisory agreements. In this regard, at a Board meeting held on May 26, 2020 and May 28, 2020 (together, the “Meeting”), the Board, all the members of which have no direct or indirect interest in the investment management and sub-advisory agreements and are not “interested persons” of the Trust, as defined in the 1940 Act (the “Independent Trustees”), reviewed and approved for Wells Fargo Omega Growth Fund (the “Fund”): (i) an investment management agreement (the “Management Agreement”) with Wells Fargo Funds Management, LLC (“Funds Management”); and (ii) an investment sub-advisory agreement (the “Sub-Advisory Agreement”) with Wells Capital Management Incorporated (the “Sub-Adviser”), an affiliate of Funds Management. The Management Agreement and the Sub-Advisory Agreement are collectively referred to as the “Advisory Agreements.”
At the Meeting, the Board considered the factors and reached the conclusions described below relating to the selection of Funds Management and the Sub-Adviser and the approval of the Advisory Agreements. Prior to the Meeting, including at a Board meeting held in April 2020, the Trustees conferred extensively among themselves and with representatives of Funds Management about these matters. Also, the Board has adopted a team-based approach, with each team consisting of a sub-set of Trustees, to assist the full Board in the discharge of its duties in reviewing investment performance and other matters throughout the year. The Independent Trustees were assisted in their evaluation of the Advisory Agreements by independent legal counsel, from whom they received separate legal advice and with whom they met separately.
In providing information to the Board, Funds Management and the Sub-Adviser were guided by a detailed set of requests for information submitted to them by independent legal counsel on behalf of the Independent Trustees at the start of the Board’s annual contract renewal process earlier in 2020. In considering and approving the Advisory Agreements, the Trustees considered the information they believed relevant, including but not limited to the information discussed below. The Board considered not only the specific information presented in connection with the Meeting, but also the knowledge gained over time through interaction with Funds Management and the Sub-Adviser about various topics. In this regard, the Board reviewed reports of Funds Management at each of its quarterly meetings, which included, among other things, portfolio reviews and investment performance reports. In addition, the Board and the teams mentioned above confer with portfolio managers at various times throughout the year. The Board did not identify any particular information or consideration that was all-important or controlling, and each individual Trustee may have attributed different weights to various factors.
After its deliberations, the Board unanimously approved the continuation of the Advisory Agreements for a one-year term and determined that the compensation payable to Funds Management and the Sub-Adviser under each of the Advisory Agreements was reasonable. The Board considered the approval of the Advisory Agreements for the Fund as part of its consideration of agreements for funds across the complex, but its approvals were made on a fund-by-fund basis. The following summarizes a number of important, but not necessarily all, factors considered by the Board in support of its approvals.
Nature, extent and quality of services
The Board received and considered various information regarding the nature, extent and quality of services provided to the Fund by Funds Management and the Sub-Adviser under the Advisory Agreements. This information included a description of the investment advisory services and Fund-level administrative services covered by the Management Agreement, as well as, among other things, a summary of the background and experience of senior management of Wells Fargo Asset Management (“WFAM”), of which Funds Management and the Sub-Adviser are a part, and a summary of investments made in the business of WFAM. The Board also received a description of Funds Management’s and the Sub-Adviser’s business continuity plans and of their approaches to data privacy and cybersecurity, and related testing. The Board also received and reviewed information about Funds Management’s role as administrator of the Fund’s liquidity risk management program, Funds Management’s approach to risk management, and Funds Management’s intermediary and vendor oversight program.
The Board also considered the qualifications, background, tenure and responsibilities of each of the portfolio managers primarily responsible for the day-to-day portfolio management of the Fund. The Board evaluated the ability of Funds Management and the Sub-Adviser to attract and retain qualified investment professionals, including research, advisory and supervisory personnel. The Board further considered the compliance programs and compliance records of Funds Management and the Sub-Adviser. In addition, the Board took into account the full range of services provided to the Fund by Funds Management and its affiliates.
34 | Wells Fargo Omega Growth Fund
Table of Contents
Other information (unaudited)
Fund investment performance and expenses
The Board considered the investment performance results for the Fund over various time periods ended December 31, 2019. The Board also considered more current results for various time periods ended March 31, 2020. The Board considered these results in comparison to the investment performance of funds in a universe that was determined by Broadridge Inc. (“Broadridge”) to be similar to the Fund (the “Universe”), and in comparison to the Fund’s benchmark index and to other comparative data. Broadridge is an independent provider of investment company data. The Board received a description of the methodology used by Broadridge to select the mutual funds in the performance Universe. The Board noted that the investment performance of the Fund (Administrator Class) was higher than the average investment performance of the Universe for the one-, three-, five- and ten-year periods ended December 31, 2019. The Board also noted that the investment performance of the Fund (Administrator Class) was higher than the average investment performance of the Universe for all periods ended March 31, 2020. The Board also noted that the investment performance of the Fund was higher than its benchmark index, the Russell 3000® Growth Index, for the one- and three-year periods ended December 31, 2019, and lower than its benchmark index for the five- and ten-year periods ended December 31, 2019. The Board also noted that the investment performance of the Fund was higher than its benchmark index, the Russell 3000® Growth Index, for the three-year period ended March 31, 2020, and lower than its benchmark index for the one-, five- and ten-year periods ended March 31, 2020.
The Board also received and considered information regarding the Fund’s net operating expense ratios and their various components, including actual management fees, custodian and other non-management fees, and Rule 12b-1 and non-Rule 12b-1 shareholder service fees. The Board considered these ratios in comparison to the median ratios of funds in class-specific expense groups that were determined by Broadridge to be similar to the Fund (the “Groups”). The Board received a description of the methodology used by Broadridge to select the mutual funds in the expense Groups and an explanation of how funds comprising expense groups and their expense ratios may vary from year-to-year. Based on the Broadridge reports, the Board noted that the net operating expense ratios of the Fund were equal to, lower than or in range of the median net operating expense ratios of the expense Groups for each share class.
The Board took into account the Fund’s investment performance and expense information provided to it among the factors considered in deciding to re-approve the Advisory Agreements.
Investment management and sub-advisory fee rates
The Board reviewed and considered the contractual fee rates payable by the Fund to Funds Management under the Management Agreement, as well as the contractual fee rates payable by the Fund to Funds Management for class-level administrative services under a Class-Level Administration Agreement, which include, among other things, class-level transfer agency and sub-transfer agency costs (collectively, the “Management Rates”). The Board also reviewed and considered the contractual investment sub-advisory fee rates that are payable by Funds Management to the Sub-Adviser for investment sub-advisory services.
Among other information reviewed by the Board was a comparison of the Fund’s Management Rates with the average contractual investment management fee rates of funds in the expense Groups at a common asset level as well as transfer agency costs of the funds in the expense Groups. The Board noted that the Management Rates of the Fund were in range of the sum of these average rates for the Fund’s expense Groups for all share classes.
The Board also received and considered information about the portion of the total management fee that was retained by Funds Management after payment of the fee to the Sub-Adviser for sub-advisory services. In assessing the reasonableness of this amount, the Board received and evaluated information about the nature and extent of responsibilities retained and risks assumed by Funds Management and not delegated to or assumed by the Sub-Adviser, and about Funds Management’s on-going oversight services. Given the affiliation between Funds Management and the Sub-Adviser, the Board ascribed limited relevance to the allocation of fees between them.
The Board also received and considered information about the nature and extent of services offered and fee rates charged by Funds Management and the Sub-Adviser to other types of clients with investment strategies similar to those of the Fund. In this regard, the Board received information about the significantly greater scope of services, and compliance, reporting and other legal burdens and risks of managing proprietary mutual funds compared with those associated with managing assets of other types of clients, including third-party sub-advised fund clients and non-mutual fund clients such as institutional separate accounts.
Based on its consideration of the factors and information it deemed relevant, including those described here, the Board determined that the compensation payable to Funds Management under the Management Agreement and to the Sub-Adviser under the Sub-Advisory Agreement was reasonable.
Wells Fargo Omega Growth Fund | 35
Table of Contents
Other information (unaudited)
Profitability
The Board received and considered information concerning the profitability of Funds Management, as well as the profitability of both WFAM and Wells Fargo & Co. (“Wells Fargo”) from providing services to the fund family as a whole. The Board noted that the Sub-Adviser’s profitability information with respect to providing services to the Fund and other funds in the family was subsumed in the WFAM and Wells Fargo profitability analysis.
Funds Management reported on the methodologies and estimates used in calculating profitability, including a description of the methodology used to allocate certain expenses. Among other things, the Board noted that the levels of profitability reported on a fund-by-fund basis varied widely, depending on factors such as the size, type and age of fund.
Based on its review, the Board did not deem the profits reported by Funds Management, WFAM or Wells Fargo from services provided to the Fund to be at a level that would prevent it from approving the continuation of the Advisory Agreements.
Economies of scale
The Board received and considered information about the potential for Funds Management to experience economies of scale in the provision of management services to the Fund, the difficulties of calculating economies of scale at an individual fund level, and the extent to which potential scale benefits are shared with shareholders. The Board noted the existence of breakpoints in the Fund’s management fee structure, which operate generally to reduce the Fund’s expense ratios as the Fund grows in size, and the size of the Fund in relation to such breakpoints. The Board considered that in addition to management fee breakpoints, Funds Management shares potential economies of scale from its management business in a variety of ways, including through fee waiver and expense reimbursement arrangements, services that benefit shareholders, competitive management fee rates set at the outset without regard to breakpoints, and investments in the business intended to enhance services available to shareholders.
The Board concluded that Funds Management’s arrangements with respect to the Fund, including contractual breakpoints, constituted a reasonable approach to sharing potential economies of scale with the Fund and its shareholders.
Other benefits to Funds Management and the Sub-Adviser
The Board received and considered information regarding potential “fall-out” or ancillary benefits received by Funds Management and its affiliates, including the Sub-Adviser, as a result of their relationships with the Fund. Ancillary benefits could include, among others, benefits directly attributable to other relationships with the Fund and benefits potentially derived from an increase in Funds Management’s and the Sub-Adviser’s business as a result of their relationships with the Fund. The Board noted that various affiliates of Funds Management may receive distribution-related fees, shareholder servicing payments and sub-transfer agency fees in respect of shares sold or held through them and services provided.
The Board also reviewed information about soft dollar credits earned and utilized by the Sub-Adviser, fees earned by Funds Management and the Sub-Adviser from managing a private investment vehicle for the fund family’s securities lending collateral, and commissions earned by an affiliated broker from portfolio transactions.
Based on its consideration of the factors and information it deemed relevant, including those described here, the Board did not find that any ancillary benefits received by Funds Management and its affiliates, including the Sub-Adviser, were unreasonable.
Conclusion
At the Meeting, after considering the above-described factors and based on its deliberations and its evaluation of the information described above, the Board unanimously approved the continuation of the Advisory Agreements for a one-year term and determined that the compensation payable to Funds Management and the Sub-Adviser under each of the Advisory Agreements was reasonable.
36 | Wells Fargo Omega Growth Fund
Table of Contents
Other information (unaudited)
LIQUIDITY RISK MANAGEMENT PROGRAM
In accordance with Rule 22e-4 under the Investment Company Act of 1940, as amended (the “Liquidity Rule”), Wells Fargo Funds Trust (the “Trust”) has adopted and implemented a liquidity risk management program (the “Program”) on behalf of each of its series, including the Fund, which is reasonably designed to assess and manage the Fund’s liquidity risk. “Liquidity risk” is defined as the risk that the Fund is unable to meet redemption requests without significantly diluting remaining investors’ interests in the Fund. The Trust’s Board of Trustees (the “Board”) previously approved the designation of Wells Fargo Funds Management, LLC (“Funds Management”), the Fund’s investment manager, as the administrator of the Program, and Funds Management has established a Liquidity Risk Management Council composed of personnel from multiple departments within Funds Management and its affiliates to assist Funds Management in the implementation and on-going administration of the Program.
The Program is comprised of various components designed to support the assessment and/or management of liquidity risk, including: (1) the periodic assessment (no less frequently than annually) of certain factors that influence the Fund’s liquidity risk; (2) the periodic classification (no less frequently than monthly) of the Fund’s investments into one of four liquidity categories that reflect an estimate of their liquidity under current market conditions; (3) a 15% limit on the acquisition of “illiquid investments” (as defined under the Liquidity Rule); (4) to the extent the Fund does not invest primarily in “highly liquid investments” (as defined under the Liquidity Rule), the determination of a minimum percentage of the Fund’s assets that generally will be invested in highly liquid investments (an “HLIM”); (5) if the Fund has established an HLIM, the periodic review (no less frequently than annually) of the HLIM and the adoption of policies and procedures for responding to a shortfall of the Fund’s “highly liquid investments” below its HLIM; and (6) periodic reporting to the Board.
At a meeting of the Board held on May 26 and 28, 2020, the Board received a written report (the “Report”) from Funds Management that addressed the operation of the Program and assessed its adequacy and effectiveness of implementation. The Report covered the initial period from December 1, 2018 through December 31, 2019 (the “Reporting Period”). No significant liquidity events impacting the Fund were noted in the Report. There were no material changes to the Program during the Reporting Period. The Report concluded that the Program is operating effectively to assess and manage the Fund’s liquidity risk, and that the Program has been and continues to be adequately and effectively implemented to monitor and, as applicable, respond to the Fund’s liquidity developments.
There can be no assurance that the Program will achieve its objectives under all circumstances in the future. Please refer to the Fund’s prospectus for more information regarding the Fund’s exposure to liquidity risk and other risks to which an investment in the Fund may be subject.
Wells Fargo Omega Growth Fund | 37
Table of Contents
Effective on or after May 1, 2020, clients of Edward Jones (also referred to as “shareholders”) purchasing Fund shares on the Edward Jones commission and fee-based platforms are eligible only for the following sales charge discounts (also referred to as “breakpoints”) and waivers, which can differ from breakpoints and waivers described elsewhere in the Fund’s Prospectus or SAI or through another broker-dealer. In all instances, it is the shareholder’s responsibility to inform Edward Jones at the time of purchase of any relationship, holdings of Wells Fargo Funds or other facts qualifying the purchaser for breakpoints or waivers. Edward Jones can ask for documentation of such circumstance.
| Breakpoints available at Edward Jones |
| Rights of Accumulation (ROA) |
The applicable sales charge on a purchase of Class A shares is determined by taking into account all share classes (except any money market funds and retirement plan share classes) of Wells Fargo Funds held by the shareholder or in an account grouped by Edward Jones with other accounts for the purpose of providing certain pricing considerations (“pricing groups”). This includes all share classes held on the Edward Jones platform and/or held on another platform. The inclusion of eligible fund family assets in the rights of accumulation calculation is dependent on the shareholder notifying his or her financial advisor of such assets at the time of calculation. |
ROA is determined by calculating the higher of cost or market value (current shares x NAV). |
| Letter of Intent (LOI) |
Through a LOI, shareholders can receive the sales charge and breakpoint discounts for purchases shareholders intend to makeover a 13-month period from the date Edward Jones receives the LOI. The LOI is determined by calculating the higher of cost or market value of qualifying holdings at LOI initiation in combination with the value that the shareholder intends to buy over a 13-month period to calculate the front-end sales charge and any breakpoint discounts. Each purchase the shareholder makes during that 13-month period will receive the sales charge and breakpoint discount that applies to the total amount. The inclusion of eligible fund family assets in the LOI calculation is dependent on the shareholder notifying his or her financial advisor of such assets at the time of calculation. Purchases made before the LOI is received by Edward Jones are not covered under the LOI and will not reduce the sales charge previously paid. Sales charges will be adjusted if LOI is not met. |
| Sales charges are waived for the following shareholders and in the following situations at Edward Jones: |
● Associates of Edward Jones and its affiliates and their family members who are in the same pricing group (as determined by Edward Jones under its policies and procedures) as the associate. This waiver will continue for the remainder of the associate’s life if the associate retires from Edward Jones in good-standing. |
● Shares purchased in an Edward Jones fee-based program. |
● Shares purchased through reinvestment of capital gains distributions and dividend reinvestment. |
● Shares purchased from the proceeds of redeemed shares of the same fund family so long as the following conditions are met: 1) the proceeds are from the sale of shares within 60 days of the purchase, and 2) the sale and purchase are made in the same share class and the same account or the purchase is made in an individual retirement account with proceeds from liquidations in anon-retirement account. |
● Shares exchanged into Class A shares from another share class so long as the exchange is into the same fund and was initiated at the discretion of Edward Jones. Edward Jones is responsible for any remaining CDSC due to the fund company, if applicable. Any future purchases are subject to the applicable sales charge as disclosed in the prospectus. |
● Exchanges from Class C shares to Class A shares of the same fund, generally, in the 84th month following the anniversary of the purchase date or earlier at the discretion of Edward Jones. |
| If the shareholder purchases shares that are subject to a CDSC and those shares are redeemed before the CDSC is expired, the shareholder is responsible to pay the CDSC except in the following conditions available at Edward Jones: |
● The death or disability of the shareholder. |
● Systematic withdrawals with up to 10% per year of the account value. |
● Return of excess contributions from an Individual Retirement Account (IRA). |
● Shares sold as part of a required minimum distribution for IRA and retirement accounts if the redemption is taken in or after the year the shareholder reaches qualified age based on applicable IRS regulation. |
● Shares sold to pay Edward Jones fees or costs in such cases where the transaction is initiated by Edward Jones. |
● Shares exchanged in an Edward Jones fee-based program. |
● Shares acquired through NAV reinstatement. |
38 | Wells Fargo Omega Growth Fund
Table of Contents
Appendix I (unaudited)
| Other Important Information for accounts at Edward Jones: |
| Minimum Purchase Amounts |
● $250 initial purchase minimum |
● $50 subsequent purchase minimum |
| Minimum Balances |
| Edward Jones has the right to redeem at its discretion fund holdings with a balance of $250 or less. The following are examples of accounts that are not included in this policy: |
● A fee-based account held on an Edward Jones platform |
● A 529 account held on an Edward Jones platform |
● An account with an active systematic investment plan or letter of intent (LOI) |
| Changing Share Classes |
| At any time it deems necessary, Edward Jones has the authority to exchange at NAV a shareholder’s holdings in a fund to Class A shares. |
Wells Fargo Omega Growth Fund | 39
Table of Contents
Effective June 1, 2020, shareholders purchasing Fund shares through an Oppenheimer & Co. Inc. (“Oppenheimer”) platform or account are eligible only for the following load waivers (front-end sales charge waivers and contingent deferred or back-end, sales charge waivers) and discounts, which may differ from those disclosed in the Fund’s Prospectus or SAI.
| Front-end Sales Load Waivers on Class A Shares available at Oppenheimer |
| Employer-sponsored retirement, deferred compensation and employee benefit plans (including health savings accounts) and trusts used to fund those plans, provided that the shares are not held in a commission-based brokerage account and shares are held for the benefit of the plan. |
| Shares purchased by or through a 529 Plan. |
| Shares purchased through an Oppenheimer affiliated investment advisory program. |
| Shares purchased through reinvestment of capital gains distributions and dividend reinvestment when purchasing shares of the same fund (but not any other fund within the fund family). |
| Shares purchased from the proceeds of redemptions within the same fund family, provided (1) the repurchase occurs within 90 days following the redemption, (2) the redemption and purchase occur in the same account, and (3) redeemed shares were subject to a front-end or deferred sales load (known as Rights of Restatement). |
| A shareholder in the Fund’s Class C shares will have their shares exchanged at net asset value to Class A shares (or the appropriate share class) of the Fund if the shares are no longer subject to a CDSC and the exchange is in line with the policies and procedures of Oppenheimer. |
| Employees and registered representatives of Oppenheimer or its affiliates and their family members. |
| Directors or Trustees of the Fund, and employees of the Fund’s investment adviser or any of its affiliates, as described in the Prospectus. |
| CDSC Waivers on A and C Shares available at Oppenheimer |
| Death or disability of the shareholder. |
| Shares sold as part of a systematic withdrawal plan as described in the Prospectus. |
| Return of excess contributions from an IRA Account. |
| Shares sold as part of a required minimum distribution for IRA and retirement accounts due to the shareholder reaching the qualified age based on applicable IRS regulations as described in the Prospectus. |
| Shares sold to pay Oppenheimer fees but only if the transaction is initiated by Oppenheimer. |
| Shares acquired through a right of reinstatement. |
| Front-end load Discounts Available at Oppenheimer: Breakpoints, Rights of Accumulation & Letters of Intent |
| Breakpoints as described in the Prospectus. |
| Rights of Accumulation (ROA), which entitle shareholders to breakpoint discounts, will be automatically calculated based on the aggregated holding of fund family assets held by accounts within the purchaser’s household at Oppenheimer. Eligible fund family assets not held at Oppenheimer may be included in the ROA calculation only if the shareholder notifies his or her financial advisor about such assets. |
40 | Wells Fargo Omega Growth Fund
Table of Contents
Effective June 15, 2020, shareholders purchasing fund shares through a Robert W. Baird & Co. (“Baird”) platform or account will only be eligible for the following sales charge waivers (front-end sales charge waivers and CDSC waivers) and discounts, which may differ from those disclosed elsewhere in the Fund’s Prospectus or the SAI.
| Front-end Sales Load Waivers on Class A Shares available at Baird |
| Shares purchased through reinvestment of capital gains distributions and dividend reinvestment when purchasing share of the same fund. |
| Share purchase by employees and registers representatives of Baird or its affiliate and their family members as designated by Baird. |
| Shares purchase from the proceeds of redemptions within the same fund family, provided (1) the repurchase occurs within 90 days following the redemption, (2) the redemption and purchase occur in the same accounts, and (3) redeemed shares were subject to a front-end or deferred sales charge (known as rights of reinstatement). |
| A shareholder in the Funds Investor C Shares will have their share exchanged at net asset value to Investor A shares of the fund if the shares are no longer subject to CDSC and the exchange is in line with the policies and procedures of Baird. |
| Employer-sponsored retirement plans or charitable accounts in a transactional brokerage account at Baird, including 401(k) plans, 457 plans, employer-sponsored 403(b) plans, profit sharing and money purchase pension plans and defined benefit plans. For purposes of this provision, employer-sponsored retirement plans do not include SEP IRAs, Simple IRAs or SAR-SEPs. |
| CDSC Waivers on A and C Shares available at Baird |
| Shares sold due to death or disability of the shareholder. |
| Shares sold as part of a systematic withdrawal plan as described in the Fund’s Prospectus. |
| Shares bought due to returns of excess contributions from an IRA Account. |
| Shares sold as part of a required minimum distribution for IRA and retirement accounts due to the shareholder reaching age 72 as described in the Fund’s Prospectus. |
| Shares sold to pay Baird fees but only if the transaction is initiated by Baird. |
| Shares acquired through a right of reinstatement. |
| Front-end load Discounts Available at Baird: Breakpoint and/or Rights of Accumulation |
| Breakpoints as described in the Prospectus. |
| Rights of accumulations which entitles shareholders to breakpoint discounts will be automatically calculated based on the aggregated holding of fund family assets held by accounts within the purchaser’s household at Baird. Eligible fund family assets not held at Baird may be included in the rights of accumulations calculation only if the shareholder notifies his or her financial advisor about such assets. |
| Letters of Intent (LOI) allow for breakpoint discounts based on anticipated purchases within a fund family through Baird, over a 13-month period of time. |
Wells Fargo Omega Growth Fund | 41
Table of Contents
This page is intentionally left blank.
Table of Contents
This page is intentionally left blank.
Table of Contents
This page is intentionally left blank.
Table of Contents
For more information
More information about Wells Fargo Funds is available free upon request. To obtain literature, please write, visit the Fund’s website, or call:
Wells Fargo Funds
P.O. Box 219967
Kansas City, MO 64121-9967
Website: wfam.com
Individual investors: 1-800-222-8222
Retail investment professionals: 1-888-877-9275
Institutional investment professionals: 1-866-765-0778

This report and the financial statements contained herein are submitted for the general information of the shareholders of the Fund. If this report is used for promotional purposes, distribution of the report must be accompanied or preceded by a current prospectus. Before investing, please consider the investment objectives, risks, charges, and expenses of the investment. For a current prospectus and, if available, a summary prospectus, containing this information, call 1-800-222-8222 or visit the Fund’s website at wfam.com. Read the prospectus carefully before you invest or send money.
Wells Fargo Asset Management (WFAM) is the trade name for certain investment advisory/management firms owned by Wells Fargo & Company. These firms include but are not limited to Wells Capital Management Incorporated and Wells Fargo Funds Management, LLC. Certain products managed by WFAM entities are distributed by Wells Fargo Funds Distributor, LLC (a broker-dealer and Member FINRA).
This material is for general informational and educational purposes only and is NOT intended to provide investment advice or a recommendation of any kind—including a recommendation for any specific investment, strategy, or plan.
INVESTMENT PRODUCTS: NOT FDIC INSURED ◾ NO BANK GUARANTEE ◾ MAY LOSE VALUE
© 2020 Wells Fargo & Company. All rights reserved
PAR-0820-01042 09-20
A211/AR211 07-20
Table of Contents

Annual Report
July 31, 2020
Wells Fargo
Premier Large Company Growth Fund
Beginning on January 1, 2021, as permitted by new regulations adopted by the Securities and Exchange Commission, paper copies of the Wells Fargo Funds’ annual and semi-annual shareholder reports issued after this date will no longer be sent by mail, unless you specifically request paper copies of the reports. Instead, the reports will be made available on the Funds’ website, and you will be notified by mail each time a report is posted and provided with a website address to access the report.
If you already elected to receive shareholder reports electronically, you will not be affected by this change and you need not take any action. You may elect to receive shareholder reports and other communications from the Fund electronically at any time by contacting your financial intermediary (such as a broker-dealer or bank) or, if you are a direct investor, by calling 1-800-222-8222 or by enrolling at wellsfargo.com/advantagedelivery.
You may elect to receive all future reports in paper free of charge. If you invest through a financial intermediary, you can contact your financial intermediary to request that you continue to receive paper copies of your shareholder reports; if you invest directly with the Fund, you can call 1-800-222-8222. Your election to receive reports in paper will apply to all Wells Fargo Funds held in your account with your financial intermediary or, if you are a direct investor, to all Wells Fargo Funds that you hold.
Table of Contents
|
Reduce clutter. Save trees. |
Sign up for |
The views expressed and any forward-looking statements are as of July 31, 2020, unless otherwise noted, and are those of the Fund managers and/or Wells Fargo Asset Management. Discussions of individual securities, or the markets generally, or any Wells Fargo Fund are not intended as individual recommendations. Future events or results may vary significantly from those expressed in any forward-looking statements. The views expressed are subject to change at any time in response to changing circumstances in the market. Wells Fargo Asset Management and the Fund disclaim any obligation to publicly update or revise any views expressed or forward-looking statements.
INVESTMENT PRODUCTS: NOT FDIC INSURED ◾ NO BANK GUARANTEE ◾ MAY LOSE VALUE
Wells Fargo Premier Large Company Growth Fund | 1
Table of Contents
Letter to shareholders (unaudited)

Andrew Owen
President
Wells Fargo Funds
Dear Shareholder:
We are pleased to offer you this annual report for the Wells Fargo Premier Large Company Growth Fund for the 12-month period that ended July 31, 2020. Global stock markets saw earlier gains erased in February and March as governments around the world took unprecedented measures, attempting to stop the spread of the coronavirus at the expense of short-term economic output. However, markets rebounded from April on to offset much of the losses as central banks attempted to bolster capital markets and confidence. Fixed-income markets generally performed well overall, achieving widespread gains. Overall, U.S. stocks surpassed their international peers, while U.S. large-cap equity, as measured by the Russell 1000® Index1, easily outperformed small caps, as measured by the Russell 2000® Index2, for the 12-month period that began last August.
For the 12-month period, fixed-income securities generally had positive total returns while non-U.S. developed market equities had the weakest performance and U.S. stocks performed strongly despite sharp volatility in the late winter and early spring. For the period, U.S. stocks, based on the S&P 500 Index,3 gained 11.96%. International stocks, as measured by the MSCI ACWI ex USA Index (Net),4 returned 0.66%, while the MSCI EM Index (Net)5 had somewhat stronger performance, with a 6.55% gain. For bond investors, the Bloomberg Barclays U.S. Aggregate Bond Index6 returned a robust 10.12%, the Bloomberg Barclays Global Aggregate ex-USD Index7 gained a more modest 5.94%, and the Bloomberg Barclays Municipal Bond Index8 gained 5.36% while the ICE BofA U.S. High Yield Index9 returned 3.10%.
The fiscal year began with supportive central bank actions.
The period began with unresolved U.S.-China trade tensions showing no signs of compromise in August 2019. Evidence of a continued global economic slowdown mounted, and central banks in China, New Zealand, and Thailand cut interest rates after the U.S. Federal Reserve (Fed) had done so in late July. Industrial and manufacturing data declined in China, Canada, Japan, and Germany. Adding to global uncertainty, Italy’s prime minister resigned, many feared a crackdown in Hong Kong as protestors sustained their calls for reform, and U.K. Prime Minister Boris Johnson planned to suspend Parliament as Brexit’s deadline neared.
| 1 | The Russell 1000® Index measures the performance of the 1,000 largest companies in the Russell 3000® Index, which represents approximately 92% of the total market capitalization of the Russell 3000® Index. You cannot invest directly in an index. |
| 2 | The Russell 2000® Index measures the performance of the 2,000 smallest companies in the Russell 3000® Index, which represents approximately 8% of the total market capitalization of the Russell 3000® Index. You cannot invest directly in an index. |
| 3 | The S&P 500 Index consists of 500 stocks chosen for market size, liquidity, and industry group representation. It is a market-value-weighted index with each stock’s weight in the index proportionate to its market value. You cannot invest directly in an index. |
| 4 | The Morgan Stanley Capital International (MSCI) All Country World Index (ACWI) ex USA Index (Net) is a free-float-adjusted market-capitalization-weighted index that is designed to measure the equity market performance of developed and emerging markets, excluding the United States. Source: MSCI. MSCI makes no express or implied warranties or representations and shall have no liability whatsoever with respect to any MSCI data contained herein. The MSCI data may not be further redistributed or used as a basis for other indices or any securities or financial products. This report is not approved, reviewed, or produced by MSCI. You cannot invest directly in an index. |
| 5 | The MSCI Emerging Markets (EM) Index (Net) is a free-float-adjusted market-capitalization-weighted index that is designed to measure equity market performance of emerging markets. You cannot invest directly in an index. |
| 6 | The Bloomberg Barclays U.S. Aggregate Bond Index is a broad-based benchmark that measures the investment-grade, U.S. dollar-denominated, fixed-rate taxable bond market, including Treasuries, government-related and corporate securities, mortgage-backed securities (agency fixed-rate and hybrid adjustable-rate mortgage pass-throughs), asset-backed securities, and commercial mortgage-backed securities. You cannot invest directly in an index. |
| 7 | The Bloomberg Barclays Global Aggregate ex-USD Index is an unmanaged index that provides a broad-based measure of the global investment-grade fixed-income markets excluding the U.S.-dollar-denominated debt market. You cannot invest directly in an index. |
| 8 | The Bloomberg Barclays Municipal Bond Index is an unmanaged index composed of long-term tax-exempt bonds with a minimum credit rating of Baa. You cannot invest directly in an index. |
| 9 | The ICE BofA U.S. High Yield Index is a market-capitalization-weighted index of domestic and Yankee high-yield bonds. The index tracks the performance of high-yield securities traded in the U.S. bond market. You cannot invest directly in an index. Copyright 2020. ICE Data Indices, LLC. All rights reserved. |
2 | Wells Fargo Premier Large Company Growth Fund
Table of Contents
Letter to shareholders (unaudited)
In the U.S., the Fed cut interest rates again in September. U.S. manufacturing data disappointed investors. The U.S. Congress announced it would pursue an impeachment investigation of President Trump. Meanwhile, the Brexit impasse showed no signs of resolution. Officials in China said that hitting the country’s economic growth goals for the year would be difficult considering the weight of tariffs and trade restrictions. Although the S&P 500 Index finished the third quarter with the best year-to-date returns in more than 20 years, concerns about future returns remained.
The fourth quarter started on a strong note, with U.S.-China trade tensions relaxing in October along with renewed optimism for a U.K. Brexit deal and positive macroeconomic data. The initial estimate of U.S. third-quarter gross domestic product (GDP) growth was a resilient 1.9% annualized rate, while the U.S. unemployment rate fell to a 50-year low of 3.5% in September. However, despite strength among U.S. consumers, business confidence declined while manufacturing activity contracted. Concerned with a potential economic slowdown, the Fed lowered interest rates another quarter point in late October—its third rate cut in four months. This helped push the S&P 500 Index to an all-time high while emerging market equities rallied and global bonds declined overall, reflecting a broad pickup in risk appetite.
Equity markets continued to rally in November despite ongoing geopolitical risks. Hopes for a U.S.-China trade deal buoyed investor confidence. U.S. business sentiment improved slightly, and manufacturing and services activity picked up. While consumer confidence and purchasing managers’ activity rose in the eurozone, China reported weakening manufacturing and consumer data. Bond yields rose marginally, leading to slightly negative returns for global government and investment-grade corporate bonds.
Financial markets ended 2019 with a boost from the U.S. and China accord on a Phase One trade deal. That, along with the landslide win by the pro-Brexit U.K. Conservative Party in a national election and ongoing central bank support, gave investors greater confidence. U.S. economic indicators were generally positive, with the exception of manufacturing activity and business confidence. Consumer confidence was resilient, fed by a robust labor market, tame inflation, and lower interest rates, which boosted housing affordability and stimulated homebuyer activity. The impeachment of President Trump had little impact on markets. Meanwhile, slowing Chinese economic activity, partly attributable to the trade war, led to further government stimulus at year-end through lower reserve ratios, allowing banks to lend more money.
The year-end rally continued in early January 2020. However, capital market volatility picked up sharply in late January on concerns over the potential impact of the coronavirus on the global economy and stock markets. With sentiment somewhat souring, perceived safe havens did well in January. The U.S. dollar and Japanese yen both rose, and government bonds outperformed equities. While the S&P 500 Index held its ground, emerging market equities tumbled, including those in Asia.
In February, the coronavirus became the major market focus. Fears of the virus’s impact on global growth led to expectations of increased global central bank monetary policy support. That led the 10-year U.S. Treasury yield to fall to an all-time low of 1.1%. Although equity markets initially shrugged off concerns about the outbreak, focusing instead on strong fourth-quarter earnings and improving business confidence in January, market sentiment turned sharply lower and the S&P 500 Index lost 8.2% for the month. Oil prices tumbled as Russia and the Organization of the Petroleum Exporting Countries compounded a major decline in oil demand with a brutal price war, partly aimed at dissuading further U.S. shale production, causing the price of West Texas Intermediate crude oil to plummet.
Wells Fargo Premier Large Company Growth Fund | 3
Table of Contents
Letter to shareholders (unaudited)
“The global spread of the coronavirus led country after country to clamp down on social and business-related activity in order to contain the virus from causing even greater devastation and overwhelming health care systems.”
“Financial markets posted widely positive returns in June despite ongoing economic weakness and high levels of uncertainty on the containment of the coronavirus and the timing of an effective vaccine.”
The global spread of the coronavirus led country after country to clamp down on social and business-related activity in order to contain the virus from causing even greater devastation and overwhelming health care systems. This abrupt stoppage of economic activity led to the sharp deceleration of global output, sending economies into a deep contraction. Central banks responded swiftly, slashing interest rates and expanding quantitative easing programs to restore liquidity and confidence to the markets. In the U.S., the Fed introduced several new lending programs, funding investment-grade bonds, money market mutual funds, and commercial paper while purchasing Treasuries, mortgage-backed securities, and overnight repurchase agreements. Meanwhile, stock markets tumbled quickly into a bear market, ending the longest bull stock market in U.S. history.
Markets rebounded strongly in April, fueled by unprecedented government and central bank stimulus measures. The U.S. economy contracted by an annualized 5.0% pace in the first quarter, with 30 million new unemployment insurance claims in six weeks. In the eurozone, first-quarter real GDP shrank 3.8%, with the composite April Flash Purchasing Managers’ Index, a monthly survey of purchasing managers, falling to an all-time low of 13.5. The European Central Bank expanded its quantitative easing to include the purchase of additional government bonds of countries with the greatest virus-related need, including Italy and Spain. China’s first-quarter GDP fell by 6.8% year over year. However, retail sales, production, and investment showed signs of recovery. Extreme oil-price volatility continued as global supply far exceeded demand.
In May, the global equity market rebound continued, with widespread strong monthly gains. Investors regained confidence on reports of early signs of success in human trials of a coronavirus vaccine. Growth stocks continued to outperform value stocks while returns on global government bonds were generally flat. In the U.S., a gap grew between the stock market rebound and devastating economic data points, including an April unemployment rate of 14.7%, the highest level since World War II. Purchasing managers’ indices reflected weakening activity in May in both the manufacturing and services sectors. U.S. corporate earnings reports indicated a 14% year-over-year contraction in earnings from the first quarter of 2019. However, high demand for technology, driven by remote activity, supported robust information technology sector earnings, which helped drive major technology stocks higher.
Financial markets posted widely positive returns in June despite ongoing economic weakness and high levels of uncertainty on the containment of the coronavirus and the timing of an effective vaccine. There were hopeful signs as economies reopened, with both U.S. and U.K. retail sales rebounding substantially in May. However, year over year, sales remained depressed. Vitally important to market sentiment was the ongoing commitment by central banks globally to do all they could to provide economic support through liquidity and low borrowing costs. U.S. economic activity was aided by one-time $1,200 stimulus checks and $600 bonus weekly unemployment benefits due to expire at the end of July. However, unemployment remained in the double digits, easing somewhat from 14.7% in April to 11.1% in June. During June, numerous states reported alarming increases of coronavirus cases. China’s economic recovery picked up momentum in June, though it remained far from a full recovery.
July was a broadly positive month for both global equities and fixed income. However, economic data and a resurgence of coronavirus cases pointed to the vulnerability of the global economy and the ongoing imperative to regain control of the pandemic. Second-quarter GDP shrank by 9.5% and 12.1% in the U.S. and eurozone, respectively, from the previous quarter. In contrast, China reported a 3.2% year-over-year expansion in its second-quarter GDP. U.S. unemployment remained historically high despite adding 1.8 million jobs in July, with a double-digit jobless rate persisting. However, manufacturing activity grew in both the U.S. and eurozone. In Asia, while China’s manufacturing sector continued to expand, activity in Japan and South Korea contracted. In July, a rising concern
4 | Wells Fargo Premier Large Company Growth Fund
Table of Contents
Letter to shareholders (unaudited)
was the rapid and broad reemergence of coronavirus infections. Despite the ongoing promise of positive early-stage vaccine trial results, economic activity could be held back by the continued spread of the virus and the end of a widely received $600-a-week bonus unemployment benefit in late July.
Don’t let short-term uncertainty derail long-term investment goals.
Periods of investment uncertainty can present challenges, but experience has taught us that maintaining long-term investment goals can be an effective way to plan for the future. To help you create a sound strategy based on your personal goals and risk tolerance, Wells Fargo Funds offers more than 100 mutual funds spanning a wide range of asset classes and investment styles. Although diversification cannot guarantee an investment profit or prevent losses, we believe it can be an effective way to manage investment risk and potentially smooth out overall portfolio performance. We encourage investors to know their investments and to understand that appropriate levels of risk-taking may unlock opportunities.
Thank you for choosing to invest with Wells Fargo Funds. We appreciate your confidence in us and remain committed to helping you meet your financial needs.
Sincerely,

Andrew Owen
President
Wells Fargo Funds
|
For further information about your Fund, contact your investment professional, visit our website at wfam.com, or call us directly at 1-800-222-8222. |
Notice to Shareholders
At a meeting held on August 10-12, 2020, the Board of Trustees of the Fund approved a change to the Fund’s automatic conversion feature for Class C shares in order to shorten the required holding period from 10 to 8 years. As a result, on a monthly basis beginning November 5, 2020, Class C shares will convert automatically into Class A shares 8 years after the initial date of purchase or, if you acquired your Class C shares through an exchange or conversion from another share class, 8 years after the date you acquired your Class C shares. When Class C shares that you acquired through a purchase or exchange convert, any other Class C shares that you purchased with reinvested dividends and distributions also will convert into Class A shares on a pro rata basis.
Please note that a shorter holding period may apply depending on your intermediary. Please see “Appendix A—Sales Charge Reductions and Waivers for Certain Intermediaries” in the Fund’s prospectus for further information.
Wells Fargo Premier Large Company Growth Fund | 5
Table of Contents
Performance highlights (unaudited)
Investment objective
The Fund seeks long-term capital appreciation.
Manager
Wells Fargo Funds Management, LLC
Subadviser
Wells Capital Management Incorporated
Portfolio managers
Joseph M. Eberhardy, CFA®‡, CPA
Robert Gruendyke, CFA®‡
Thomas C. Ognar, CFA®‡
Average annual total returns (%) as of July 31, 2020
| Including sales charge | Excluding sales charge | Expense ratios1 (%) | ||||||||||||||||||||||||||||||||
| Inception date | 1 year | 5 year | 10 year | 1 year | 5 year | 10 year | Gross | Net2 | ||||||||||||||||||||||||||
| Class A (EKJAX) | 1-20-1998 | 15.68 | 13.19 | 15.05 | 22.78 | 14.53 | 15.73 | 1.15 | 1.11 | |||||||||||||||||||||||||
| Class C (EKJCX) | 1-22-1998 | 20.87 | 13.67 | 14.87 | 21.87 | 13.67 | 14.87 | 1.90 | 1.86 | |||||||||||||||||||||||||
| Class R4 (EKJRX)3 | 11-30-2012 | – | – | – | 23.20 | 14.88 | 16.11 | 0.87 | 0.80 | |||||||||||||||||||||||||
| Class R6 (EKJFX)4 | 11-30-2012 | – | – | – | 23.39 | 15.06 | 16.25 | 0.72 | 0.65 | |||||||||||||||||||||||||
| Administrator Class (WFPDX) | 7-16-2010 | – | – | – | 23.02 | 14.66 | 15.90 | 1.07 | 1.00 | |||||||||||||||||||||||||
| Institutional Class (EKJYX) | 6-30-1999 | – | – | – | 23.28 | 14.99 | 16.20 | 0.82 | 0.70 | |||||||||||||||||||||||||
| Russell 1000® Growth Index5 | – | – | – | – | 29.84 | 16.84 | 17.29 | – | – | |||||||||||||||||||||||||
Figures quoted represent past performance, which is no guarantee of future results, and do not reflect taxes that a shareholder may pay on an investment in a fund. Investment return and principal value of an investment will fluctuate so that an investor’s shares, when redeemed, may be worth more or less than their original cost. Performance shown without sales charges would be lower if sales charges were reflected. Current performance may be lower or higher than the performance data quoted, which assumes the reinvestment of dividends and capital gains. Current month-end performance is available on the Fund’s website, wfam.com.
Index returns do not include transaction costs associated with buying and selling securities, any mutual fund fees or expenses, or any taxes. It is not possible to invest directly in an index.
For Class A shares, the maximum front-end sales charge is 5.75%. For Class C shares, the maximum contingent deferred sales charge is 1.00%. Performance including a contingent deferred sales charge assumes the sales charge for the corresponding time period. Class R4, Class R6, Administrator Class, and Institutional Class shares are sold without a front-end sales charge or contingent deferred sales charge.
Stock values fluctuate in response to the activities of individual companies and general market and economic conditions. Certain investment strategies tend to increase the total risk of an investment (relative to the broader market). The Fund is exposed to foreign investment risk. Consult the Fund’s prospectus for additional information on these and other risks.
Please see footnotes on page 7.
6 | Wells Fargo Premier Large Company Growth Fund
Table of Contents
Performance highlights (unaudited)
| Growth of $10,000 investment as of July 31, 20206 |
|
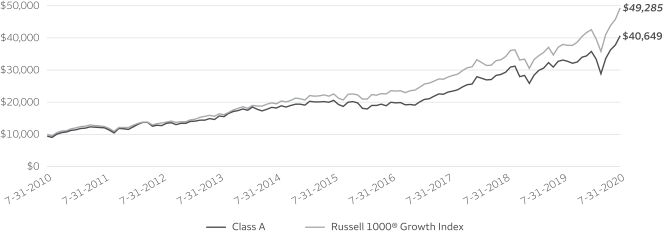
| ‡ | CFA® and Chartered Financial Analyst® are trademarks owned by CFA Institute. |
| 1 | Reflects the expense ratios as stated in the most recent prospectuses. The expense ratios shown are subject to change and may differ from the annualized expense ratios shown in the financial highlights of this report. |
| 2 | The manager has contractually committed through November 30, 2020, to waive fees and/or reimburse expenses to the extent necessary to cap total annual fund operating expenses after fee waivers at 1.11% for Class A, 1.86% for Class C, 0.80% for Class R4, 0.65% for Class R6, 1.00% for Administrator Class, and 0.70% for Institutional Class. Brokerage commissions, stamp duty fees, interest, taxes, acquired fund fees and expenses (if any), and extraordinary expenses are excluded from the expense caps. Prior to or after the commitment expiration date, the caps may be increased or the commitment to maintain the caps may be terminated only with the approval of the Board of Trustees. Without these caps, the Fund’s returns would have been lower. The expense ratio paid by an investor is the net expense ratio (the total annual fund operating expenses after fee waivers) as stated in the prospectuses. |
| 3 | Historical performance shown for the Class R4 shares prior to their inception reflects the performance of the Institutional Class shares, adjusted to reflect the higher expenses applicable to Class R4 shares. |
| 4 | Historical performance shown for the Class R6 shares prior to their inception reflects the performance of the Institutional Class shares, and includes the higher expenses applicable to the Institutional Class shares. If these expenses had not been included, returns for the Class R6 shares would be higher. |
| 5 | The Russell 1000® Growth Index measures the performance of those Russell 1000 companies with higher price/book ratios and higher forecasted growth values. You cannot invest directly in an index. |
| 6 | The chart compares the performance of Class A shares for the most recent ten years with the Russell 1000® Growth Index. The chart assumes a hypothetical investment of $10,000 in Class A shares and reflects all operating expenses and assumes the maximum initial sales charge of 5.75%. |
| 7 | The S&P 500 Index consists of 500 stocks chosen for market size, liquidity, and industry group representation. It is a market-value-weighted index with each stock’s weight in the index proportionate to its market value. You cannot invest directly in an index. |
| 8 | The ten largest holdings, excluding cash, cash equivalents and any money market funds, are calculated based on the value of the investments divided by total net assets of the Fund. Holdings are subject to change and may have changed since the date specified. |
| 9 | Amounts are calculated based on the total long-term investments of the Fund. These amounts are subject to change and may have changed since the date specified. |
| * | This security was no longer held at the end of the reporting period. |
Wells Fargo Premier Large Company Growth Fund | 7
Table of Contents
Performance highlights (unaudited)
MANAGER’S DISCUSSION
| ∎ | The Fund underperformed its benchmark, the Russell 1000® Growth Index, for the 12-month period that ended July 31, 2020. |
| ∎ | The Fund’s performance was inhibited by certain stocks within the consumer discretionary sector. |
| ∎ | Holdings within information technology (IT), financials, and consumer discretionary aided the Fund’s performance for the period. |
For much of the 12-month period, stocks were largely impervious to tariffs on Chinese goods and other geopolitical events. However, in the first quarter of 2020, the spread of the coronavirus pandemic crippled the global economy, sending U.S. equities into a laconic bear market. The unprecedented spread of the coronavirus prompted global central banks to quickly inject massive liquidity into the markets. On the fiscal side, the U.S. government passed the Coronavirus Aid, Relief, and Economic Security Act and other stimulative measures to support the economy. Shortly after setting a record for the quickest descent into bear market territory in the first quarter of 2020, the S&P 500 Index7 set another record posting its best 50-day rally ever the following quarter. Although we believe new leadership may arise in the coming periods, we are positioning the Fund so it can capitalize on an array of outcomes. We believe our diversified and balanced approach to portfolio construction and strict emphasis on sell discipline should help mitigate risk with the goal of providing a less volatile experience for our clients.
| Ten largest holdings (%) as of July 31, 20208 | ||||
Amazon.com Incorporated | 9.93 | |||
Microsoft Corporation | 8.08 | |||
Alphabet Incorporated Class A | 5.06 | |||
MasterCard Incorporated Class A | 3.12 | |||
Facebook Incorporated Class A | 2.86 | |||
CoStar Group Incorporated | 2.65 | |||
Visa Incorporated Class A | 2.48 | |||
Microchip Technology Incorporated | 2.35 | |||
PayPal Holdings Incorporated | 2.16 | |||
MarketAxess Holdings Incorporated | 1.84 | |||
Certain consumer discretionary stocks detracted from performance.
The main source of weakness in the Fund came from select holdings within the consumer discretionary sector as many retailers, including Planet Fitness, Inc., and CarMax, Inc.*, retracted sharply as traffic fell precipitously amid widespread store closings during the pandemic. We expect that many of the retailers that we own will rebound quickly as the virus subsides as we believe these companies should benefit from pent-up demand for their offerings. The Fund’s largest relative detractor was Apple Inc., which rallied sharply as it has witnessed strong demand for many products. While we recognize the company’s powerful ecosystem and strong propensity to return cash to shareholders, most of its
services are tied to its hardware-installed base, which has matured in recent years. Due to its lower growth profile and increased elasticity for its main product, the iPhone, we don’t believe it warrants a larger weight in the Fund. Other detractors included technology stock Euronet Worldwide, Inc.*, which retraced after delivering weaker-than-expected revenue growth, citing a deceleration in profitability from its electronic funds transfer segment.
| Sector allocation as of July 31, 20209 |
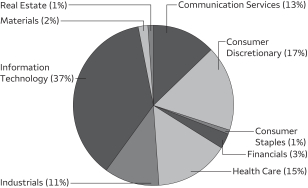 |
Strength within the financials sector came from electronic bond platform MarketAxess Holdings, Inc., which contributed to the Fund’s performance due to increased volumes exemplified during the coronavirus pandemic as many of its clients have turned to its platform for liquidity during the crisis. Electronic bond trading platforms provide good ballast to the portfolio due to their countercyclical elements. Within the IT sector, payments processor PayPal Holdings Inc. capitalized on growth within e-commerce and the pervasive shift from cash and check to plastic. Consumer discretionary holding Amazon.com, Inc., rallied 70% after posting strong unit growth and Amazon Web Services metrics. The stock has been one of our best performers as demand for its e-commerce capabilities has increased
considerably as most retailers had to close their doors during the coronavirus pandemic. The company continues to execute from its four main pillars of cloud computing, e-commerce (which includes groceries), digital advertising, and shipping and logistics.
Please see footnotes on page 7.
8 | Wells Fargo Premier Large Company Growth Fund
Table of Contents
Performance highlights (unaudited)
Areas of focus remain in secular areas personified in our SCODIi acronym.
The coronavirus crisis has pulled forward many secular trends as several companies have cited years of transformation compressed into months. This trend can be encapsulated in our SCODIi acronym, which stands for software as a service (SaaS), cloud services, online retail, digital payments, the internet of things, and innovation. Within SaaS, companies that offer communications capabilities are helping workers function remotely. In cloud computing, a surge in e-commerce spend and telemedicine has fostered a precipitous increase in cloud demand. Online shopping is fundamentally changing consumer behaviors and is having a profound effect on digital transactions, an area that is becoming a necessity rather than a luxury. The internet of things has played an essential role as the need for home office electronics are supported by more powerful underlying chip hardware. Lastly, within innovation, critical procedures have resumed eliciting a spur in demand for medical devices.
The equity market has shown marked resiliency this year. The economy appears to be improving, but there are many risks abound. We believe the recovery will likely be uneven as some businesses may be permanently impaired while others will likely see a pull forward in demand. It is an exciting time to be a stock picker in an area where change is occurring at a rapid pace and there is greater disparity among companies. Still, we believe this is the time to be extra vigilant on risk given the wider range of outcomes. We believe our approach is built for such markets and our long track record provides a useful guide in helping navigate potentially more volatile periods ahead.
Wells Fargo Premier Large Company Growth Fund | 9
Table of Contents
As a shareholder of the Fund, you incur two types of costs: (1) transaction costs, including sales charges (loads) on purchase payments and contingent deferred sales charges (if any) on redemptions and (2) ongoing costs, including management fees, distribution (12b-1) and/or shareholder servicing fees, and other Fund expenses. This example is intended to help you understand your ongoing costs (in dollars) of investing in the Fund and to compare these costs with the ongoing costs of investing in other mutual funds.
The example is based on an investment of $1,000 invested at the beginning of the six-month period and held for the entire period from February 1, 2020 to July 31, 2020.
Actual expenses
The “Actual” line of the table below provides information about actual account values and actual expenses. You may use the information in this line, together with the amount you invested, to estimate the expenses that you paid over the period. Simply divide your account value by $1,000 (for example, an $8,600 account value divided by $1,000 = 8.6), then multiply the result by the number in the “Actual” line under the heading entitled “Expenses paid during period” for your applicable class of shares to estimate the expenses you paid on your account during this period.
Hypothetical example for comparison purposes
The “Hypothetical” line of the table below provides information about hypothetical account values and hypothetical expenses based on the Fund’s actual expense ratio and an assumed rate of return of 5% per year before expenses, which is not the Fund’s actual return. The hypothetical account values and expenses may not be used to estimate the actual ending account balance or expenses you paid for the period. You may use this information to compare the ongoing costs of investing in the Fund and other funds. To do so, compare this 5% hypothetical example with the 5% hypothetical examples that appear in the shareholder reports of the other funds.
Please note that the expenses shown in the table are meant to highlight your ongoing costs only and do not reflect any transactional costs, such as sales charges (loads) and contingent deferred sales charges. Therefore, the “Hypothetical” line of the table is useful in comparing ongoing costs only and will not help you determine the relative total costs of owning different funds. In addition, if these transactional costs were included, your costs would have been higher.
| Beginning account value 2-1-2020 | Ending account value 7-31-2020 | Expenses paid during the period1 | Annualized net expense ratio | |||||||||||||
Class A | ||||||||||||||||
Actual | $ | 1,000.00 | $ | 1,136.40 | $ | 5.90 | 1.11 | % | ||||||||
Hypothetical (5% return before expenses) | $ | 1,000.00 | $ | 1,019.34 | $ | 5.57 | 1.11 | % | ||||||||
Class C | ||||||||||||||||
Actual | $ | 1,000.00 | $ | 1,133.20 | $ | 9.87 | 1.86 | % | ||||||||
Hypothetical (5% return before expenses) | $ | 1,000.00 | $ | 1,015.61 | $ | 9.32 | 1.86 | % | ||||||||
Class R4 | ||||||||||||||||
Actual | $ | 1,000.00 | $ | 1,138.65 | $ | 4.25 | 0.80 | % | ||||||||
Hypothetical (5% return before expenses) | $ | 1,000.00 | $ | 1,020.89 | $ | 4.02 | 0.80 | % | ||||||||
Class R6 | ||||||||||||||||
Actual | $ | 1,000.00 | $ | 1,139.57 | $ | 3.46 | 0.65 | % | ||||||||
Hypothetical (5% return before expenses) | $ | 1,000.00 | $ | 1,021.63 | $ | 3.27 | 0.65 | % | ||||||||
Administrator Class | ||||||||||||||||
Actual | $ | 1,000.00 | $ | 1,137.43 | $ | 5.31 | 1.00 | % | ||||||||
Hypothetical (5% return before expenses) | $ | 1,000.00 | $ | 1,019.89 | $ | 5.02 | 1.00 | % | ||||||||
Institutional Class | ||||||||||||||||
Actual | $ | 1,000.00 | $ | 1,138.89 | $ | 3.72 | 0.70 | % | ||||||||
Hypothetical (5% return before expenses) | $ | 1,000.00 | $ | 1,021.38 | $ | 3.52 | 0.70 | % | ||||||||
| 1 | Expenses paid is equal to the annualized net expense ratio of each class multiplied by the average account value over the period, multiplied by the number of days in the most recent fiscal half-year divided by the number of days in the fiscal year (to reflect the one-half-year period). |
10 | Wells Fargo Premier Large Company Growth Fund
Table of Contents
Portfolio of investments—July 31, 2020
| Shares | Value | |||||||||||||||
| Common Stocks: 100.10% | ||||||||||||||||
Communication Services: 12.56% | ||||||||||||||||
| Entertainment: 2.06% | ||||||||||||||||
Activision Blizzard Incorporated | 483,480 | $ | 39,949,952 | |||||||||||||
Roku Incorporated † | 44,740 | 6,929,779 | ||||||||||||||
Warner Music Group Corporation Class A † | 464,266 | 13,997,620 | ||||||||||||||
| 60,877,351 | ||||||||||||||||
|
| |||||||||||||||
| Interactive Media & Services: 10.50% | ||||||||||||||||
Alphabet Incorporated Class A † | 100,320 | 149,271,144 | ||||||||||||||
Alphabet Incorporated Class C † | 19,288 | 28,603,332 | ||||||||||||||
Facebook Incorporated Class A † | 331,870 | 84,185,463 | ||||||||||||||
Pinterest Incorporated Class A † | 1,082,145 | 37,106,752 | ||||||||||||||
ZoomInfo Technologies Incorporated † | 251,158 | 10,264,827 | ||||||||||||||
| 309,431,518 | ||||||||||||||||
|
| |||||||||||||||
Consumer Discretionary: 17.03% | ||||||||||||||||
| Hotels, Restaurants & Leisure: 1.18% | ||||||||||||||||
Chipotle Mexican Grill Incorporated † | 7,560 | 8,733,010 | ||||||||||||||
Domino’s Pizza Incorporated | 53,810 | 20,803,484 | ||||||||||||||
Planet Fitness Incorporated Class A † | 98,350 | 5,133,870 | ||||||||||||||
| 34,670,364 | ||||||||||||||||
|
| |||||||||||||||
| Internet & Direct Marketing Retail: 9.93% | ||||||||||||||||
Amazon.com Incorporated † | 92,520 | 292,796,194 | ||||||||||||||
|
| |||||||||||||||
| Multiline Retail: 0.97% | ||||||||||||||||
Dollar General Corporation | 150,600 | 28,674,240 | ||||||||||||||
|
| |||||||||||||||
| Specialty Retail: 2.53% | ||||||||||||||||
Burlington Stores Incorporated † | 177,150 | 33,304,200 | ||||||||||||||
Five Below Incorporated † | 126,710 | 13,799,986 | ||||||||||||||
Floor & Decor Holdings Incorporated Class A † | 232,390 | 15,314,501 | ||||||||||||||
O’Reilly Automotive Incorporated † | 25,490 | 12,168,416 | ||||||||||||||
| 74,587,103 | ||||||||||||||||
|
| |||||||||||||||
| Textiles, Apparel & Luxury Goods: 2.42% | ||||||||||||||||
Deckers Outdoor Corporation † | 93,150 | 19,491,638 | ||||||||||||||
lululemon athletica Incorporated † | 159,080 | 51,794,857 | ||||||||||||||
| 71,286,495 | ||||||||||||||||
|
| |||||||||||||||
Consumer Staples: 1.05% | ||||||||||||||||
| Beverages: 1.05% | ||||||||||||||||
Boston Beer Company Incorporated Class A † | 38,000 | 30,796,720 | ||||||||||||||
|
| |||||||||||||||
Financials: 3.48% | ||||||||||||||||
| Capital Markets: 2.57% | ||||||||||||||||
MarketAxess Holdings Incorporated | 104,840 | 54,170,828 | ||||||||||||||
Tradeweb Markets Incorporated Class A | 400,130 | 21,635,029 | ||||||||||||||
| 75,805,857 | ||||||||||||||||
|
| |||||||||||||||
| Consumer Finance: 0.91% | ||||||||||||||||
LendingTree Incorporated † | 77,500 | 26,837,475 | ||||||||||||||
|
| |||||||||||||||
The accompanying notes are an integral part of these financial statements.
Wells Fargo Premier Large Company Growth Fund | 11
Table of Contents
Portfolio of investments—July 31, 2020
| Shares | Value | |||||||||||||||
Health Care: 15.32% | ||||||||||||||||
| Biotechnology: 3.03% | ||||||||||||||||
Alnylam Pharmaceuticals Incorporated † | 126,690 | $ | 18,466,334 | |||||||||||||
BioMarin Pharmaceutical Incorporated † | 165,250 | 19,798,603 | ||||||||||||||
Exact Sciences Corporation † | 240,860 | 22,821,485 | ||||||||||||||
Sarepta Therapeutics Incorporated † | 52,150 | 8,006,068 | ||||||||||||||
Vertex Pharmaceuticals Incorporated † | 74,230 | 20,190,560 | ||||||||||||||
| 89,283,050 | ||||||||||||||||
|
| |||||||||||||||
| Health Care Equipment & Supplies: 5.79% | ||||||||||||||||
Abbott Laboratories | 354,170 | 35,643,669 | ||||||||||||||
Boston Scientific Corporation † | 1,224,960 | 47,246,707 | ||||||||||||||
DexCom Incorporated † | 40,520 | 17,648,081 | ||||||||||||||
Edwards Lifesciences Corporation † | 415,000 | 32,540,150 | ||||||||||||||
Insulet Corporation † | 152,580 | 31,028,669 | ||||||||||||||
Novocure Limited † | 86,320 | 6,542,193 | ||||||||||||||
| 170,649,469 | ||||||||||||||||
|
| |||||||||||||||
| Health Care Providers & Services: 1.10% | ||||||||||||||||
Amedisys Incorporated † | 138,800 | 32,501,408 | ||||||||||||||
|
| |||||||||||||||
| Health Care Technology: 1.46% | ||||||||||||||||
Veeva Systems Incorporated Class A † | 163,030 | 43,132,847 | ||||||||||||||
|
| |||||||||||||||
| Life Sciences Tools & Services: 1.71% | ||||||||||||||||
Bio-Techne Corporation | 64,000 | 17,610,240 | ||||||||||||||
Repligen Corporation † | 218,030 | 32,902,907 | ||||||||||||||
| 50,513,147 | ||||||||||||||||
|
| |||||||||||||||
| Pharmaceuticals: 2.23% | ||||||||||||||||
Royalty Pharma plc Class A † | 288,116 | 12,403,394 | ||||||||||||||
Zoetis Incorporated | 350,618 | 53,181,738 | ||||||||||||||
| 65,585,132 | ||||||||||||||||
|
| |||||||||||||||
Industrials: 11.22% | ||||||||||||||||
| Building Products: 0.43% | ||||||||||||||||
The AZEK Company Incorporated † | 368,309 | 12,706,661 | ||||||||||||||
|
| |||||||||||||||
| Commercial Services & Supplies: 2.89% | ||||||||||||||||
Copart Incorporated † | 437,670 | 40,812,728 | ||||||||||||||
Waste Connections Incorporated | 433,305 | 44,357,433 | ||||||||||||||
| 85,170,161 | ||||||||||||||||
|
| |||||||||||||||
| Electrical Equipment: 1.15% | ||||||||||||||||
Generac Holdings Incorporated † | 215,000 | 33,879,700 | ||||||||||||||
|
| |||||||||||||||
| Industrial Conglomerates: 1.48% | ||||||||||||||||
Roper Technologies Incorporated | 100,620 | 43,513,119 | ||||||||||||||
|
| |||||||||||||||
| Professional Services: 3.17% | ||||||||||||||||
CoStar Group Incorporated † | 92,030 | 78,203,413 | ||||||||||||||
TransUnion | 171,610 | 15,371,108 | ||||||||||||||
| 93,574,521 | ||||||||||||||||
|
| |||||||||||||||
The accompanying notes are an integral part of these financial statements.
12 | Wells Fargo Premier Large Company Growth Fund
Table of Contents
Portfolio of investments—July 31, 2020
| Shares | Value | |||||||||||||||
| Road & Rail: 2.10% | ||||||||||||||||
CSX Corporation | 116,220 | $ | 8,291,135 | |||||||||||||
Norfolk Southern Corporation | 91,640 | 17,614,124 | ||||||||||||||
Union Pacific Corporation | 208,640 | 36,167,744 | ||||||||||||||
| 62,073,003 | ||||||||||||||||
|
| |||||||||||||||
Information Technology: 37.00% | ||||||||||||||||
| IT Services: 11.11% | ||||||||||||||||
Fidelity National Information Services Incorporated | 252,440 | 36,934,496 | ||||||||||||||
Global Payments Incorporated | 220,700 | 39,289,014 | ||||||||||||||
MasterCard Incorporated Class A | 297,840 | 91,892,575 | ||||||||||||||
PayPal Holdings Incorporated † | 324,780 | 63,679,615 | ||||||||||||||
Square Incorporated Class A † | 174,578 | 22,668,953 | ||||||||||||||
Visa Incorporated Class A | 384,240 | 73,159,296 | ||||||||||||||
| 327,623,949 | ||||||||||||||||
|
| |||||||||||||||
| Semiconductors & Semiconductor Equipment: 6.11% | ||||||||||||||||
Microchip Technology Incorporated | 680,870 | 69,264,905 | ||||||||||||||
Monolithic Power Systems Incorporated | 106,800 | 28,303,068 | ||||||||||||||
NXP Semiconductors NV | 337,970 | 39,721,614 | ||||||||||||||
Texas Instruments Incorporated | 335,070 | 42,738,179 | ||||||||||||||
| 180,027,766 | ||||||||||||||||
|
| |||||||||||||||
| Software: 19.58% | ||||||||||||||||
Adobe Incorporated † | 59,509 | 26,441,039 | ||||||||||||||
Anaplan Incorporated † | 393,420 | 17,865,202 | ||||||||||||||
Atlassian Corporation plc Class A † | 25,200 | 4,451,580 | ||||||||||||||
Cloudflare Incorporated Class A † | 705,190 | 29,350,008 | ||||||||||||||
Dynatrace Incorporated † | 723,653 | 30,270,405 | ||||||||||||||
Everbridge Incorporated † | 172,500 | 24,633,000 | ||||||||||||||
HubSpot Incorporated † | 111,657 | 26,195,849 | ||||||||||||||
Microsoft Corporation | 1,161,950 | 238,211,370 | ||||||||||||||
RingCentral Incorporated Class A † | 102,180 | 29,659,789 | ||||||||||||||
Salesforce.com Incorporated † | 222,940 | 43,439,859 | ||||||||||||||
ServiceNow Incorporated † | 82,900 | 36,409,680 | ||||||||||||||
Splunk Incorporated † | 169,325 | 35,527,772 | ||||||||||||||
Zendesk Incorporated † | 380,900 | 34,719,035 | ||||||||||||||
| 577,174,588 | ||||||||||||||||
|
| |||||||||||||||
| Technology Hardware, Storage & Peripherals: 0.20% | ||||||||||||||||
Apple Incorporated | 14,250 | 6,056,820 | ||||||||||||||
|
| |||||||||||||||
Materials: 1.57% | ||||||||||||||||
| Chemicals: 1.57% | ||||||||||||||||
Linde plc | 188,580 | 46,222,844 | ||||||||||||||
|
| |||||||||||||||
Real Estate: 0.87% | ||||||||||||||||
| Equity REITs: 0.87% | ||||||||||||||||
SBA Communications Corporation | 81,830 | 25,493,315 | ||||||||||||||
|
| |||||||||||||||
Total Common Stocks (Cost $1,358,786,598) | 2,950,944,817 | |||||||||||||||
|
| |||||||||||||||
The accompanying notes are an integral part of these financial statements.
Wells Fargo Premier Large Company Growth Fund | 13
Table of Contents
Portfolio of investments—July 31, 2020
| Yield | Shares | Value | ||||||||||||||
| Short-Term Investments: 0.08% | ||||||||||||||||
| Investment Companies: 0.08% | ||||||||||||||||
Wells Fargo Government Money Market Fund Select Class (l)(u) | 0.10 | % | 2,465,488 | $ | 2,465,488 | |||||||||||
|
| |||||||||||||||
Total Short-Term Investments (Cost $2,465,488) | 2,465,488 | |||||||||||||||
|
| |||||||||||||||
| Total investments in securities (Cost $1,361,252,086) | 100.18 | % | 2,953,410,305 | |||||
Other assets and liabilities, net | (0.18 | ) | (5,232,778 | ) | ||||
|
|
|
| |||||
| Total net assets | 100.00 | % | $ | 2,948,177,527 | ||||
|
|
|
| |||||
| † | Non-income-earning security |
| (l) | The issuer of the security is an affiliated person of the Fund as defined in the Investment Company Act of 1940. |
| (u) | The rate represents the 7-day annualized yield at period end. |
Abbreviations:
| REIT | Real estate investment trust |
Investments in Affiliates
An affiliated investment is an investment in which the Fund owns at least 5% of the outstanding voting shares of the issuer or as a result of other relationships, such as the Fund and the issuer having the same investment manager. Transactions with issuers that were either affiliated persons of the Fund at the beginning of the period or the end of the period were as follows:
| Value, beginning of period | Purchases | Sales proceeds | Net realized gains (losses) | Net change in unrealized gains (losses) | Income from affiliated securities | Value, end of period | % of net assets | |||||||||||||||||||||||||
| Short-Term Investments | ||||||||||||||||||||||||||||||||
Investment Companies | ||||||||||||||||||||||||||||||||
Securities Lending Cash Investments LLC * | $ | 96,454,199 | $ | 351,116,079 | $ | (447,569,689 | ) | $ | (589 | ) | $ | 0 | $ | 614,665 | # | $ | 0 | |||||||||||||||
Wells Fargo Government Money Market Fund Select Class | 2,551,452 | 428,057,734 | (428,143,698 | ) | 0 | 0 | 97,454 | 2,465,488 | ||||||||||||||||||||||||
|
|
|
|
|
|
|
|
|
| |||||||||||||||||||||||
| $ | (589 | ) | $ | 0 | $ | 712,119 | $ | 2,465,488 | 0.08 | % | ||||||||||||||||||||||
|
|
|
|
|
|
|
|
|
| |||||||||||||||||||||||
| * | No longer held at the end of the period |
| # | Amount shown represents income before fees and rebates. |
The accompanying notes are an integral part of these financial statements.
14 | Wells Fargo Premier Large Company Growth Fund
Table of Contents
Statement of assets and liabilities—July 31, 2020
Assets | ||||
Investments in unaffiliated securities, at value (cost $1,358,786,598) | $ | 2,950,944,817 | ||
Investments in affiliated securities, at value (cost $2,465,488) | 2,465,488 | |||
Receivable for investments sold | 10,897,361 | |||
Receivable for Fund shares sold | 1,300,993 | |||
Receivable for dividends | 652,535 | |||
Prepaid expenses and other assets | 70,488 | |||
|
| |||
Total assets | 2,966,331,682 | |||
|
| |||
Liabilities | ||||
Payable for investments purchased | 12,624,989 | |||
Payable for Fund shares redeemed | 2,775,537 | |||
Management fee payable | 1,641,062 | |||
Administration fees payable | 342,380 | |||
Distribution fee payable | 81,269 | |||
Trustees’ fees and expenses payable | 4,529 | |||
Accrued expenses and other liabilities | 684,389 | |||
|
| |||
Total liabilities | 18,154,155 | |||
|
| |||
Total net assets | $ | 2,948,177,527 | ||
|
| |||
Net assets consist of | ||||
Paid-in capital | $ | 1,213,807,707 | ||
Total distributable earnings | 1,734,369,820 | |||
|
| |||
Total net assets | $ | 2,948,177,527 | ||
|
| |||
Computation of net asset value and offering price per share | ||||
Net assets – Class A | $ | 1,178,453,249 | ||
Shares outstanding – Class A1 | 73,272,285 | |||
Net asset value per share – Class A | $16.08 | |||
Maximum offering price per share – Class A2 | $17.06 | |||
Net assets – Class C | $ | 111,045,702 | ||
Shares outstanding – Class C1 | 9,741,550 | |||
Net asset value per share – Class C | $11.40 | |||
Net assets – Class R4 | $ | 1,128,887 | ||
Share outstanding – Class R41 | 66,397 | |||
Net asset value per share – Class R4 | $17.00 | |||
Net assets – Class R6 | $ | 954,851,626 | ||
Shares outstanding – Class R61 | 55,157,501 | |||
Net asset value per share – Class R6 | $17.31 | |||
Net assets – Administrator Class | $ | 54,340,741 | ||
Shares outstanding – Administrator Class1 | 3,300,075 | |||
Net asset value per share – Administrator Class | $16.47 | |||
Net assets – Institutional Class | $ | 648,357,322 | ||
Shares outstanding – Institutional Class1 | 37,642,743 | |||
Net asset value per share – Institutional Class | $17.22 | |||
| 1 | The Fund has an unlimited number of authorized shares. |
| 2 | Maximum offering price is computed as 100/94.25 of net asset value. On investments of $50,000 or more, the offering price is reduced. |
The accompanying notes are an integral part of these financial statements.
Wells Fargo Premier Large Company Growth Fund | 15
Table of Contents
Statement of operations—year ended July 31, 2020
Investment income | ||||
Dividends (net of foreign withholding taxes of $119,277) | $ | 14,900,161 | ||
Income from affiliated securities | 414,660 | |||
|
| |||
Total investment income | 15,314,821 | |||
|
| |||
Expenses | ||||
Management fee | 17,398,285 | |||
Administration fees | ||||
Class A | 2,167,658 | |||
Class C | 267,324 | |||
Class R4 | 2,031 | |||
Class R6 | 248,282 | |||
Administrator Class | 62,640 | |||
Institutional Class | 786,665 | |||
Shareholder servicing fees | ||||
Class A | 2,576,230 | |||
Class C | 317,753 | |||
Class R4 | 2,508 | |||
Administrator Class | 120,006 | |||
Distribution fee | ||||
Class C | 952,767 | |||
Custody and accounting fees | 117,375 | |||
Professional fees | 53,320 | |||
Registration fees | 123,992 | |||
Shareholder report expenses | 203,457 | |||
Trustees’ fees and expenses | 21,002 | |||
Other fees and expenses | 56,302 | |||
|
| |||
Total expenses | 25,477,597 | |||
Less: Fee waivers and/or expense reimbursements | ||||
Fund-level | (733,925 | ) | ||
Class A | (104,177 | ) | ||
Class C | (55 | ) | ||
Class R4 | (778 | ) | ||
Class R6 | (268,561 | ) | ||
Administrator Class | (15,241 | ) | ||
Institutional Class | (495,269 | ) | ||
|
| |||
Net expenses | 23,859,591 | |||
|
| |||
Net investment loss | (8,544,770 | ) | ||
|
| |||
Realized and unrealized gains (losses) on investments | ||||
Net realized gains (losses) on | ||||
Unaffiliated securities | 152,796,066 | |||
Affiliated securities | (589 | ) | ||
|
| |||
Net realized gains on investments | 152,795,477 | |||
Net change in unrealized gains (losses) on investments | 410,793,163 | |||
|
| |||
Net realized and unrealized gains (losses) on investments | 563,588,640 | |||
|
| |||
Net increase in net assets resulting from operations | $ | 555,043,870 | ||
|
| |||
The accompanying notes are an integral part of these financial statements.
16 | Wells Fargo Premier Large Company Growth Fund
Table of Contents
Statement of changes in net assets
| Year ended July 31, 2020 | Year ended July 31, 2019 | |||||||||||||||
Operations | ||||||||||||||||
Net investment loss | $ | (8,544,770 | ) | $ | (5,976,680 | ) | ||||||||||
Net realized gains on investments | 152,795,477 | 281,042,857 | ||||||||||||||
Net change in unrealized gains (losses) on investments | 410,793,163 | 880,406 | ||||||||||||||
|
| |||||||||||||||
Net increase in net assets resulting from operations | 555,043,870 | 275,946,583 | ||||||||||||||
|
| |||||||||||||||
Distributions to shareholders from net investment income and net realized gains | ||||||||||||||||
Class A | (79,445,426 | ) | (157,260,447 | ) | ||||||||||||
Class C | (13,534,953 | ) | (37,119,006 | ) | ||||||||||||
Class R4 | (288,415 | ) | (524,816 | ) | ||||||||||||
Class R6 | (58,912,621 | ) | (27,912,392 | ) | ||||||||||||
Administrator Class | (3,631,494 | ) | (7,935,426 | ) | ||||||||||||
Institutional Class | (44,767,006 | ) | (149,877,161 | ) | ||||||||||||
|
| |||||||||||||||
Total distributions to shareholders | (200,579,915 | ) | (380,629,248 | ) | ||||||||||||
|
| |||||||||||||||
Capital share transactions | Shares | Shares | ||||||||||||||
Proceeds from shares sold | ||||||||||||||||
Class A | 5,450,625 | 77,021,734 | 4,978,668 | 64,852,617 | ||||||||||||
Class C | 768,733 | 7,336,013 | 1,500,469 | 13,864,166 | ||||||||||||
Class R4 | 15,508 | 231,846 | 40,306 | 500,326 | ||||||||||||
Class R6 | 5,901,603 | 86,487,057 | 43,509,076 | 654,543,608 | ||||||||||||
Administrator Class | 1,510,542 | 21,788,823 | 330,627 | 4,405,388 | ||||||||||||
Institutional Class | 5,199,312 | 74,602,092 | 9,977,465 | 140,174,907 | ||||||||||||
|
| |||||||||||||||
| 267,467,565 | 878,341,012 | |||||||||||||||
|
| |||||||||||||||
Reinvestment of distributions | ||||||||||||||||
Class A | 5,635,528 | 74,670,743 | 12,562,848 | 146,357,178 | ||||||||||||
Class C | 1,226,541 | 11,578,543 | 3,761,732 | 32,426,128 | ||||||||||||
Class R4 | 20,543 | 287,184 | 42,768 | 522,194 | ||||||||||||
Class R6 | 4,072,770 | 57,914,790 | 2,036,361 | 25,210,147 | ||||||||||||
Administrator Class | 258,688 | 3,507,809 | 643,091 | 7,646,354 | ||||||||||||
Institutional Class | 2,794,274 | 39,538,976 | 11,058,800 | 136,355,009 | ||||||||||||
|
| |||||||||||||||
| 187,498,045 | 348,517,010 | |||||||||||||||
|
| |||||||||||||||
Payment for shares redeemed | ||||||||||||||||
Class A | (11,885,781 | ) | (161,114,742 | ) | (12,892,646 | ) | (172,044,344 | ) | ||||||||
Class C | (6,937,436 | ) | (70,405,278 | ) | (7,522,098 | ) | (72,094,200 | ) | ||||||||
Class R4 | (234,231 | ) | (3,635,661 | ) | (56,058 | ) | (848,702 | ) | ||||||||
Class R6 | (9,076,035 | ) | (132,489,008 | ) | (3,699,221 | ) | (52,309,727 | ) | ||||||||
Administrator Class | (1,855,137 | ) | (26,245,495 | ) | (1,338,333 | ) | (18,694,385 | ) | ||||||||
Institutional Class | (13,095,393 | ) | (188,459,918 | ) | (44,233,595 | ) | (636,259,361 | ) | ||||||||
|
| |||||||||||||||
| (582,350,102 | ) | (952,250,719 | ) | |||||||||||||
|
| |||||||||||||||
Net increase (decrease) in net assets resulting from capital share transactions | (127,384,492 | ) | 274,607,303 | |||||||||||||
|
| |||||||||||||||
Total increase in net assets | 227,079,463 | 169,924,638 | ||||||||||||||
|
| |||||||||||||||
Net assets | ||||||||||||||||
Beginning of period | 2,721,098,064 | 2,551,173,426 | ||||||||||||||
|
| |||||||||||||||
End of period | $ | 2,948,177,527 | $ | 2,721,098,064 | ||||||||||||
|
| |||||||||||||||
The accompanying notes are an integral part of these financial statements.
Wells Fargo Premier Large Company Growth Fund | 17
Table of Contents
(For a share outstanding throughout each period)
| Year ended July 31 | ||||||||||||||||||||
| CLASS A | 2020 | 2019 | 2018 | 2017 | 2016 | |||||||||||||||
Net asset value, beginning of period | $14.19 | $15.10 | $15.34 | $14.68 | $16.28 | |||||||||||||||
Net investment loss | (0.07 | ) | (0.05 | ) | (0.05 | ) | (0.03 | )1 | (0.03 | ) | ||||||||||
Net realized and unrealized gains (losses) on investments | 3.07 | 1.50 | 3.56 | 2.12 | (0.52 | ) | ||||||||||||||
|
|
|
|
|
|
|
|
|
| |||||||||||
Total from investment operations | 3.00 | 1.45 | 3.51 | 2.09 | (0.55 | ) | ||||||||||||||
Distributions to shareholders from | ||||||||||||||||||||
Net realized gains | (1.11 | ) | (2.36 | ) | (3.75 | ) | (1.43 | ) | (1.05 | ) | ||||||||||
Net asset value, end of period | $16.08 | $14.19 | $15.10 | $15.34 | $14.68 | |||||||||||||||
Total return2 | 22.78 | % | 12.97 | % | 26.54 | % | 16.01 | % | (3.22 | )% | ||||||||||
Ratios to average net assets (annualized) | ||||||||||||||||||||
Gross expenses | 1.14 | % | 1.15 | % | 1.15 | % | 1.14 | % | 1.13 | % | ||||||||||
Net expenses | 1.10 | % | 1.11 | % | 1.11 | % | 1.11 | % | 1.11 | % | ||||||||||
Net investment loss | (0.52 | )% | (0.40 | )% | (0.34 | )% | (0.20 | )% | (0.17 | )% | ||||||||||
Supplemental data | ||||||||||||||||||||
Portfolio turnover rate | 45 | % | 60 | % | 45 | % | 65 | % | 47 | % | ||||||||||
Net assets, end of period (000s omitted) | $1,178,453 | $1,050,751 | $1,048,632 | $986,791 | $1,697,746 | |||||||||||||||
| 1 | Calculated based upon average shares outstanding |
| 2 | Total return calculations do not include any sales charges. |
The accompanying notes are an integral part of these financial statements.
18 | Wells Fargo Premier Large Company Growth Fund
Table of Contents
Financial highlights
(For a share outstanding throughout each period)
| Year ended July 31 | ||||||||||||||||||||
| CLASS C | 2020 | 2019 | 2018 | 2017 | 2016 | |||||||||||||||
Net asset value, beginning of period | $10.45 | $11.87 | $12.86 | $12.64 | $14.27 | |||||||||||||||
Net investment loss | (0.13 | )1 | (0.12 | )1 | (0.13 | )1 | (0.12 | )1 | (0.12 | )1 | ||||||||||
Net realized and unrealized gains (losses) on investments | 2.19 | 1.06 | 2.89 | 1.77 | (0.46 | ) | ||||||||||||||
|
|
|
|
|
|
|
|
|
| |||||||||||
Total from investment operations | 2.06 | 0.94 | 2.76 | 1.65 | (0.58 | ) | ||||||||||||||
Distributions to shareholders from | ||||||||||||||||||||
Net realized gains | (1.11 | ) | (2.36 | ) | (3.75 | ) | (1.43 | ) | (1.05 | ) | ||||||||||
Net asset value, end of period | $11.40 | $10.45 | $11.87 | $12.86 | $12.64 | |||||||||||||||
Total return2 | 21.87 | % | 12.09 | % | 25.68 | % | 15.05 | % | (3.92 | )% | ||||||||||
Ratios to average net assets (annualized) | ||||||||||||||||||||
Gross expenses | 1.89 | % | 1.90 | % | 1.90 | % | 1.89 | % | 1.88 | % | ||||||||||
Net expenses | 1.86 | % | 1.86 | % | 1.86 | % | 1.86 | % | 1.86 | % | ||||||||||
Net investment loss | (1.27 | )% | (1.14 | )% | (1.09 | )% | (0.95 | )% | (0.92 | )% | ||||||||||
Supplemental data | ||||||||||||||||||||
Portfolio turnover rate | 45 | % | 60 | % | 45 | % | 65 | % | 47 | % | ||||||||||
Net assets, end of period (000s omitted) | $111,046 | $153,404 | $201,138 | $206,026 | $296,896 | |||||||||||||||
| 1 | Calculated based upon average shares outstanding |
| 2 | Total return calculations do not include any sales charges. |
The accompanying notes are an integral part of these financial statements.
Wells Fargo Premier Large Company Growth Fund | 19
Table of Contents
Financial highlights
(For a share outstanding throughout each period)
| Year ended July 31 | ||||||||||||||||||||
| CLASS R4 | 2020 | 2019 | 2018 | 2017 | 2016 | |||||||||||||||
Net asset value, beginning of period | $14.89 | $15.69 | $15.75 | $15.00 | $16.56 | |||||||||||||||
Net investment income (loss) | (0.03 | )1 | (0.03 | ) | (0.00 | )1,2 | 0.01 | 1 | 0.02 | 1 | ||||||||||
Net realized and unrealized gains (losses) on investments | 3.25 | 1.59 | 3.69 | 2.17 | (0.53 | ) | ||||||||||||||
|
|
|
|
|
|
|
|
|
| |||||||||||
Total from investment operations | 3.22 | 1.56 | 3.69 | 2.18 | (0.51 | ) | ||||||||||||||
Distributions to shareholders from | ||||||||||||||||||||
Net realized gains | (1.11 | ) | (2.36 | ) | (3.75 | ) | (1.43 | ) | (1.05 | ) | ||||||||||
Net asset value, end of period | $17.00 | $14.89 | $15.69 | $15.75 | $15.00 | |||||||||||||||
Total return | 23.20 | % | 13.21 | % | 27.06 | % | 16.30 | % | (2.91 | )% | ||||||||||
Ratios to average net assets (annualized) | ||||||||||||||||||||
Gross expenses | 0.86 | % | 0.87 | % | 0.87 | % | 0.86 | % | 0.85 | % | ||||||||||
Net expenses | 0.80 | % | 0.80 | % | 0.80 | % | 0.80 | % | 0.80 | % | ||||||||||
Net investment income (loss) | (0.20 | )% | (0.10 | )% | (0.02 | )% | 0.09 | % | 0.13 | % | ||||||||||
Supplemental data | ||||||||||||||||||||
Portfolio turnover rate | 45 | % | 60 | % | 45 | % | 65 | % | 47 | % | ||||||||||
Net assets, end of period (000s omitted) | $1,129 | $3,940 | $3,727 | $3,559 | $3,988 | |||||||||||||||
| 1 | Calculated based upon average shares outstanding |
| 2 | Amount is more than $(0.005). |
The accompanying notes are an integral part of these financial statements.
20 | Wells Fargo Premier Large Company Growth Fund
Table of Contents
Financial highlights
(For a share outstanding throughout each period)
| Year ended July 31 | ||||||||||||||||||||
| CLASS R6 | 2020 | 2019 | 2018 | 2017 | 2016 | |||||||||||||||
Net asset value, beginning of period | $15.12 | $15.87 | $15.87 | $15.08 | $16.62 | |||||||||||||||
Net investment income (loss) | (0.01 | ) | (0.00 | )1,2 | 0.02 | 1 | 0.03 | 1 | 0.04 | 1 | ||||||||||
Net realized and unrealized gains (losses) on investments | 3.31 | 1.61 | 3.73 | 2.19 | (0.53 | ) | ||||||||||||||
|
|
|
|
|
|
|
|
|
| |||||||||||
Total from investment operations | 3.30 | 1.61 | 3.75 | 2.22 | (0.49 | ) | ||||||||||||||
Distributions to shareholders from | ||||||||||||||||||||
Net realized gains | (1.11 | ) | (2.36 | ) | (3.75 | ) | (1.43 | ) | (1.05 | ) | ||||||||||
Net asset value, end of period | $17.31 | $15.12 | $15.87 | $15.87 | $15.08 | |||||||||||||||
Total return | 23.39 | % | 13.40 | % | 27.27 | % | 16.48 | % | (2.78 | )% | ||||||||||
Ratios to average net assets (annualized) | ||||||||||||||||||||
Gross expenses | 0.71 | % | 0.71 | % | 0.72 | % | 0.71 | % | 0.70 | % | ||||||||||
Net expenses | 0.65 | % | 0.65 | % | 0.65 | % | 0.65 | % | 0.65 | % | ||||||||||
Net investment income (loss) | (0.07 | )% | (0.02 | )% | 0.12 | % | 0.25 | % | 0.28 | % | ||||||||||
Supplemental data | ||||||||||||||||||||
Portfolio turnover rate | 45 | % | 60 | % | 45 | % | 65 | % | 47 | % | ||||||||||
Net assets, end of period (000s omitted) | $954,852 | $820,383 | $196,934 | $170,657 | $179,198 | |||||||||||||||
| 1 | Calculated based upon average shares outstanding |
| 2 | Amount is more than $(0.005). |
The accompanying notes are an integral part of these financial statements.
Wells Fargo Premier Large Company Growth Fund | 21
Table of Contents
Financial highlights
(For a share outstanding throughout each period)
| Year ended July 31 | ||||||||||||||||||||
| ADMINISTRATOR CLASS | 2020 | 2019 | 2018 | 2017 | 2016 | |||||||||||||||
Net asset value, beginning of period | $14.48 | $15.35 | $15.52 | $14.82 | $16.41 | |||||||||||||||
Net investment loss | (0.06 | )1 | (0.04 | )1 | (0.03 | )1 | (0.01 | )1 | (0.00 | )1,2 | ||||||||||
Net realized and unrealized gains (losses) on investments | 3.16 | 1.53 | 3.61 | 2.14 | (0.54 | ) | ||||||||||||||
|
|
|
|
|
|
|
|
|
| |||||||||||
Total from investment operations | 3.10 | 1.49 | 3.58 | 2.13 | (0.54 | ) | ||||||||||||||
Distributions to shareholders from | ||||||||||||||||||||
Net realized gains | (1.11 | ) | (2.36 | ) | (3.75 | ) | (1.43 | ) | (1.05 | ) | ||||||||||
Net asset value, end of period | $16.47 | $14.48 | $15.35 | $15.52 | $14.82 | |||||||||||||||
Total return | 23.02 | % | 13.02 | % | 26.70 | % | 16.14 | % | (3.13 | )% | ||||||||||
Ratios to average net assets (annualized) | ||||||||||||||||||||
Gross expenses | 1.06 | % | 1.07 | % | 1.07 | % | 1.06 | % | 1.04 | % | ||||||||||
Net expenses | 1.00 | % | 1.00 | % | 1.00 | % | 1.00 | % | 0.98 | % | ||||||||||
Net investment loss | (0.42 | )% | (0.29 | )% | (0.22 | )% | (0.06 | )% | (0.02 | )% | ||||||||||
Supplemental data | ||||||||||||||||||||
Portfolio turnover rate | 45 | % | 60 | % | 45 | % | 65 | % | 47 | % | ||||||||||
Net assets, end of period (000s omitted) | $54,341 | $49,042 | $57,582 | $82,998 | $292,900 | |||||||||||||||
| 1 | Calculated based upon average shares outstanding |
| 2 | Amount is more than $(0.005). |
The accompanying notes are an integral part of these financial statements.
22 | Wells Fargo Premier Large Company Growth Fund
Table of Contents
Financial highlights
(For a share outstanding throughout each period)
| Year ended July 31 | ||||||||||||||||||||
| INSTITUTIONAL CLASS | 2020 | 2019 | 2018 | 2017 | 2016 | |||||||||||||||
Net asset value, beginning of period | $15.06 | $15.82 | $15.84 | $15.06 | $16.61 | |||||||||||||||
Net investment income (loss) | (0.02 | )1 | 0.00 | 1,2 | 0.01 | 1 | 0.02 | 1 | 0.03 | 1 | ||||||||||
Net realized and unrealized gains (losses) on investments | 3.29 | 1.60 | 3.72 | 2.19 | (0.53 | ) | ||||||||||||||
|
|
|
|
|
|
|
|
|
| |||||||||||
Total from investment operations | 3.27 | 1.60 | 3.73 | 2.21 | (0.50 | ) | ||||||||||||||
Distributions to shareholders from | ||||||||||||||||||||
Net realized gains | (1.11 | ) | (2.36 | ) | (3.75 | ) | (1.43 | ) | (1.05 | ) | ||||||||||
Net asset value, end of period | $17.22 | $15.06 | $15.82 | $15.84 | $15.06 | |||||||||||||||
Total return | 23.28 | % | 13.38 | % | 27.17 | % | 16.44 | % | (2.85 | )% | ||||||||||
Ratios to average net assets (annualized) | ||||||||||||||||||||
Gross expenses | 0.81 | % | 0.82 | % | 0.82 | % | 0.81 | % | 0.80 | % | ||||||||||
Net expenses | 0.70 | % | 0.70 | % | 0.70 | % | 0.70 | % | 0.70 | % | ||||||||||
Net investment income (loss) | (0.12 | )% | 0.02 | % | 0.07 | % | 0.19 | % | 0.23 | % | ||||||||||
Supplemental data | ||||||||||||||||||||
Portfolio turnover rate | 45 | % | 60 | % | 45 | % | 65 | % | 47 | % | ||||||||||
Net assets, end of period (000s omitted) | $648,357 | $643,578 | $1,043,161 | $949,344 | $1,097,976 | |||||||||||||||
| 1 | Calculated based upon average shares outstanding |
| 2 | Amount is less than $0.005. |
The accompanying notes are an integral part of these financial statements.
Wells Fargo Premier Large Company Growth Fund | 23
Table of Contents
1. ORGANIZATION
Wells Fargo Funds Trust (the “Trust”), a Delaware statutory trust organized on March 10, 1999, is an open-end management investment company registered under the Investment Company Act of 1940, as amended (the “1940 Act”). As an investment company, the Trust follows the accounting and reporting guidance in Financial Accounting Standards Board (“FASB”) Accounting Standards Codification Topic 946, Financial Services – Investment Companies. These financial statements report on the Wells Fargo Premier Large Company Growth Fund (the “Fund”) which is a diversified series of the Trust.
2. SIGNIFICANT ACCOUNTING POLICIES
The following significant accounting policies, which are consistently followed in the preparation of the financial statements of the Fund, are in conformity with U.S. generally accepted accounting principles which require management to make estimates and assumptions that affect the reported amounts of assets and liabilities, disclosure of contingent assets and liabilities at the date of the financial statements, and the reported amounts of revenues and expenses during the reporting period. Actual results could differ from those estimates.
Securities valuation
All investments are valued each business day as of the close of regular trading on the New York Stock Exchange (generally 4 p.m. Eastern Time), although the Fund may deviate from this calculation time under unusual or unexpected circumstances.
Equity securities that are listed on a foreign or domestic exchange or market are valued at the official closing price or, if none, the last sales price. If no sale occurs on the principal exchange or market that day, a fair value price will be determined in accordance with the Fund’s Valuation Procedures.
Investments in registered open-end investment companies are valued at net asset value. Interests in non-registered investment companies that are redeemable at net asset value are fair valued normally at net asset value.
Investments which are not valued using any of the methods discussed above are valued at their fair value, as determined in good faith by the Board of Trustees of the Fund. The Board of Trustees has established a Valuation Committee comprised of the Trustees and has delegated to it the authority to take any actions regarding the valuation of portfolio securities that the Valuation Committee deems necessary or appropriate, including determining the fair value of portfolio securities, unless the determination has been delegated to the Wells Fargo Asset Management Pricing Committee at Wells Fargo Funds Management, LLC (“Funds Management”). The Board of Trustees retains the authority to make or ratify any valuation decisions or approve any changes to the Valuation Procedures as it deems appropriate. On a quarterly basis, the Board of Trustees receives reports on any valuation actions taken by the Valuation Committee or the Wells Fargo Asset Management Pricing Committee which may include items for ratification.
Foreign currency translation
The accounting records of the Fund are maintained in U.S. dollars. The values of other assets and liabilities denominated in foreign currencies are translated into U.S. dollars at rates provided by an independent foreign currency pricing source at a time each business day specified by the Wells Fargo Asset Management Pricing Committee. Purchases and sales of securities, and income and expenses are converted at the rate of exchange on the respective dates of such transactions. Net realized foreign exchange gains or losses arise from sales of foreign currencies, currency gains or losses realized between the trade and settlement dates on securities transactions, and the difference between the amounts of dividends, interest and foreign withholding taxes recorded and the U.S. dollar equivalent of the amounts actually paid or received. Net unrealized foreign exchange gains and losses arise from changes in the fair value of assets and liabilities other than investments in securities resulting from changes in exchange rates. The changes in net assets arising from changes in exchange rates of securities and the changes in net assets resulting from changes in market prices of securities are not separately presented. Such changes are included in net realized and unrealized gains or losses from investments.
Securities lending
The Fund may lend its securities from time to time in order to earn additional income in the form of fees or interest on securities received as collateral or the investment of any cash received as collateral. When securities are on loan, the Fund receives interest or dividends on those securities. Cash collateral received in connection with its securities lending transactions is invested in Securities Lending Cash Investments, LLC (the “Securities Lending Fund”). Investments in Securities Lending Fund are valued at the evaluated bid price provided by an independent pricing service. Income earned from investment in the Securities Lending Fund (net of fees and rebates), if any, is included in income from affiliated securities on the Statement of Operations.
In a securities lending transaction, the net asset value of the Fund is affected by an increase or decrease in the value of the securities loaned and by an increase or decrease in the value of the instrument in which collateral is invested. The amount of
24 | Wells Fargo Premier Large Company Growth Fund
Table of Contents
Notes to financial statements
securities lending activity undertaken by the Fund fluctuates from time to time. The Fund has the right under the lending agreement to recover the securities from the borrower on demand. In the event of default or bankruptcy by the borrower, the Fund may be prevented from recovering the loaned securities or gaining access to the collateral or may experience delays or costs in doing so. In such an event, the terms of the agreement allow the unaffiliated securities lending agent to use the collateral to purchase replacement securities on behalf of the Fund or pay the Fund the market value of the loaned securities. The Fund bears the risk of loss with respect to depreciation of its investment of the cash collateral.
Security transactions and income recognition
Securities transactions are recorded on a trade date basis. Realized gains or losses are recorded on the basis of identified cost.
Dividend income is recognized on the ex-dividend date. Dividend income is recorded net of foreign taxes withheld where recovery of such taxes is not assured.
Distributions to shareholders
Distributions to shareholders from net investment income and any net realized gains are recorded on the ex-dividend date and paid at least annually. Such distributions are determined in accordance with income tax regulations and may differ from U.S. generally accepted accounting principles. Dividend sources are estimated at the time of declaration. The tax character of distributions is determined as of the Fund’s fiscal year end. Therefore, a portion of the Fund’s distributions made prior to the Fund’s fiscal year end may be categorized as a tax return of capital at year end.
Federal and other taxes
The Fund intends to continue to qualify as a regulated investment company by distributing substantially all of its investment company taxable income and any net realized capital gains (after reduction for capital loss carryforwards) sufficient to relieve it from all, or substantially all, federal income taxes. Accordingly, no provision for federal income taxes was required.
The Fund’s income and federal excise tax returns and all financial records supporting those returns for the prior three fiscal years are subject to examination by the federal and Delaware revenue authorities. Management has analyzed the Fund’s tax positions taken on federal, state, and foreign tax returns for all open tax years and does not believe that there are any uncertain tax positions that require recognition of a tax liability.
As of July 31, 2020, the aggregate cost of all investments for federal income tax purposes was $1,365,920,070 and the unrealized gains (losses) consisted of:
Gross unrealized gains | $ | 1,592,208,277 | ||
Gross unrealized losses | (4,718,042 | ) | ||
Net unrealized gains | $ | 1,587,490,235 | ||
Reclassifications are made to the Fund’s capital accounts for permanent tax differences to reflect income and gains available for distribution (or available capital loss carryforwards) under federal income tax regulations. U.S. generally accepted accounting principles require that certain components of net assets be adjusted to reflect permanent differences between financial and tax reporting. These reclassifications have no effect on net assets or net asset values per share. The primary permanent difference causing such reclassifications is due to net operating losses. At July 31, 2020, as a result of permanent book-to-tax differences, the following reclassification adjustments were made on the Statement of Assets and Liabilities:
| Paid-in capital | Total distributable earnings | |
| $(7,060,919) | $7,060,919 | |
As of July 31, 2020, the Fund had a qualified late-year ordinary loss of $6,045,614 which will be recognized on the first day of the following fiscal year.
Class allocations
The separate classes of shares offered by the Fund differ principally in applicable sales charges, distribution, shareholder servicing, and administration fees. Class specific expenses are charged directly to that share class. Investment income, common fund-level expenses, and realized and unrealized gains (losses) on investments are allocated daily to each class of shares based on the relative proportion of net assets of each class.
Wells Fargo Premier Large Company Growth Fund | 25
Table of Contents
Notes to financial statements
3. FAIR VALUATION MEASUREMENTS
Fair value measurements of investments are determined within a framework that has established a fair value hierarchy based upon the various data inputs utilized in determining the value of the Fund’s investments. The three-level hierarchy gives the highest priority to unadjusted quoted prices in active markets for identical assets or liabilities (Level 1) and the lowest priority to unobservable inputs (Level 3). The Fund’s investments are classified within the fair value hierarchy based on the lowest level of input that is significant to the fair value measurement. The inputs are summarized into three broad levels as follows:
| ∎ | Level 1 – quoted prices in active markets for identical securities |
| ∎ | Level 2 – other significant observable inputs (including quoted prices for similar securities, interest rates, prepayment speeds, credit risk, etc.) |
| ∎ | Level 3 – significant unobservable inputs (including the Fund’s own assumptions in determining the fair value of investments) |
The inputs or methodologies used for valuing investments in securities are not necessarily an indication of the risk associated with investing in those securities.
The following is a summary of the inputs used in valuing the Fund’s assets and liabilities as of July 31, 2020:
| Quoted prices (Level 1) | Other significant observable inputs (Level 2) | Significant (Level 3) | Total | |||||||||||||
Assets | ||||||||||||||||
Investments in: | ||||||||||||||||
Common stocks | ||||||||||||||||
Communication services | $ | 370,308,869 | $ | 0 | $ | 0 | $ | 370,308,869 | ||||||||
Consumer discretionary | 502,014,396 | 0 | 0 | 502,014,396 | ||||||||||||
Consumer staples | 30,796,720 | 0 | 0 | 30,796,720 | ||||||||||||
Financials | 102,643,332 | 0 | 0 | 102,643,332 | ||||||||||||
Health care | 451,665,053 | 0 | 0 | 451,665,053 | ||||||||||||
Industrials | 330,917,165 | 0 | 0 | 330,917,165 | ||||||||||||
Information technology | 1,090,883,123 | 0 | 0 | 1,090,883,123 | ||||||||||||
Materials | 46,222,844 | 0 | 0 | 46,222,844 | ||||||||||||
Real estate | 25,493,315 | 0 | 0 | 25,493,315 | ||||||||||||
Short-term investments | ||||||||||||||||
Investment companies | 2,465,488 | 0 | 0 | 2,465,488 | ||||||||||||
Total assets | $ | 2,953,410,305 | $ | 0 | $ | 0 | $ | 2,953,410,305 | ||||||||
Additional sector, industry or geographic detail is included in the Portfolio of Investments.
For the year ended July 31, 2020, the Fund did not have any transfers into/out of Level 3.
26 | Wells Fargo Premier Large Company Growth Fund
Table of Contents
Notes to financial statements
4. TRANSACTIONS WITH AFFILIATES
Management fee
Funds Management, an indirect wholly owned subsidiary of Wells Fargo & Company (“Wells Fargo”), is the manager of the Fund and provides advisory and fund-level administrative services under an investment management agreement. Under the investment management agreement, Funds Management is responsible for, among other services, implementing the investment objectives and strategies of the Fund, supervising the subadviser and providing fund-level administrative services in
connection with the Fund’s operations. As compensation for its services under the investment management agreement, Funds Management is entitled to receive a management fee at the following annual rate based on the Fund’s average daily net assets:
| Average daily net assets | Management fee | |
First $500 million | 0.700% | |
Next $500 million | 0.675 | |
Next $1 billion | 0.650 | |
Next $2 billion | 0.625 | |
Next $1 billion | 0.600 | |
Next $3 billion | 0.590 | |
Next $2 billion | 0.565 | |
Next $2 billion | 0.555 | |
Next $4 billion | 0.530 | |
Over $16 billion | 0.505 | |
For the year ended July 31, 2020, the management fee was equivalent to an annual rate of 0.66% of the Fund’s average daily net assets.
Funds Management has retained the services of a subadviser to provide daily portfolio management to the Fund. The fee for subadvisory services is borne by Funds Management. Wells Capital Management Incorporated (“WellsCap”), an affiliate of Funds Management and an indirect wholly owned subsidiary of Wells Fargo, is the subadviser to the Fund and is entitled to receive a fee from Funds Management at an annual rate starting at 0.35% and declining to 0.275% as the average daily net assets of the Fund increase.
Administration fees
Under a class-level administration agreement, Funds Management provides class-level administrative services to the Fund, which includes paying fees and expenses for services provided by the transfer agent, sub-transfer agents, omnibus account servicers and record-keepers. As compensation for its services under the class-level administration agreement, Funds Management receives an annual fee which is calculated based on the average daily net assets of each class as follows:
| Class-level administration fee | ||||
Class A, Class C | 0.21 | % | ||
Class R4 | 0.08 | |||
Class R6 | 0.03 | |||
Administrator Class, Institutional Class | 0.13 | |||
Waivers and/or expense reimbursements
Funds Management has contractually waived and/or reimbursed management and administration fees to the extent necessary to maintain certain net operating expense ratios for the Fund. When each class of the Fund has exceeded its expense cap, Funds Management has waived fees and/or reimbursed expenses from fund-level expenses on a proportionate basis and then from class specific expenses. When only certain classes exceed their expense caps, waivers and/or reimbursements are applied against class specific expenses before fund-level expenses. Funds Management has committed through November 30, 2020 to waive fees and/or reimburse expenses to the extent necessary to cap the Fund’s expenses at 1.11% for Class A shares, 1.86% for Class C shares, 0.80% for Class R4 shares, 0.65% for Class R6 shares, 1.00% for Administrator Class shares, and 0.70% for Institutional Class shares. Prior to or after the commitment expiration date, the cap may be increased or the commitment to maintain the cap may be terminated only with the approval of the Board of Trustees.
Wells Fargo Premier Large Company Growth Fund | 27
Table of Contents
Notes to financial statements
Distribution fee
The Trust has adopted a distribution plan for Class C shares of the Fund pursuant to Rule 12b-1 under the 1940 Act. A distribution fee is charged to Class C shares and paid to Wells Fargo Funds Distributor, LLC (“Funds Distributor”), the principal underwriter, at an annual rate of 0.75% of the average daily net assets of Class C shares.
In addition, Funds Distributor is entitled to receive the front-end sales charge from the purchase of Class A shares and a contingent deferred sales charge on the redemption of certain Class A shares. Funds Distributor is also entitled to receive the contingent deferred sales charges from redemptions of Class C shares. For the year ended July 31, 2020, Funds Distributor received $19,674 from the sale of Class A shares and $14 in contingent deferred sales charges from redemptions of Class C shares. No contingent deferred sales charges were incurred by Class A shares for the year ended July 31, 2020.
Shareholder servicing fees
The Trust has entered into contracts with one or more shareholder servicing agents, whereby Class A, Class C, and Administrator Class of the Fund are charged a fee at an annual rate of 0.25% of the average daily net assets of each respective class. Class R4 is charged a fee at an annual rate of 0.10% of its average daily net assets. A portion of these total shareholder servicing fees were paid to affiliates of Wells Fargo.
Interfund transactions
The Fund may purchase or sell portfolio investment securities to certain other Wells Fargo affiliates pursuant to Rule 17a-7 under the 1940 Act and under procedures adopted by the Board of Trustees. The procedures have been designed to ensure that these interfund transactions, which do not incur broker commissions, are effected at current market prices.
5. INVESTMENT PORTFOLIO TRANSACTIONS
Purchases and sales of investments, excluding U.S. government obligations (if any) and short-term securities, for the year ended July 31, 2020 were $1,197,600,716 and $1,526,138,708, respectively.
6. SECURITIES LENDING TRANSACTIONS
The Fund lends its securities through an unaffiliated securities lending agent and receives collateral in the form of cash or securities with a value at least equal to the value of the securities on loan. The value of the loaned securities is determined at the close of each business day and any increases or decreases in the required collateral are exchanged between the Fund and the counterparty on the next business day. Cash collateral received is invested in the Securities Lending Fund which seeks to provide a positive return compared to the daily Federal Funds Open Rate by investing in high-quality, U.S. dollar-denominated short-term money market instruments and is exempt from registration under Section 3(c)(7) of the 1940 Act. Securities Lending Fund is managed by Funds Management and is subadvised by WellsCap. Funds Management receives an advisory fee starting at 0.05% and declining to 0.01% as the average daily net assets of the Securities Lending Fund increase. All of the fees received by Funds Management are paid to WellsCap for its services as subadviser.
In the event of counterparty default or the failure of a borrower to return a loaned security, the Fund has the right to use the collateral to offset any losses incurred. As of July 31, 2020, the Fund did not have any securities on loan.
7. BANK BORROWINGS
The Trust (excluding the money market funds), Wells Fargo Master Trust and Wells Fargo Variable Trust are parties to a $350,000,000 revolving credit agreement whereby the Fund is permitted to use bank borrowings for temporary or emergency purposes, such as to fund shareholder redemption requests. Interest under the credit agreement is charged to the Fund based on a borrowing rate equal to the higher of the Federal Funds rate in effect on that day plus 1.25% or the overnight LIBOR rate in effect on that day plus 1.25%. In addition, an annual commitment fee equal to 0.25% of the unused balance is allocated to each participating fund.
For the year ended July 31, 2020, there were no borrowings by the Fund under the agreement.
8. DISTRIBUTIONS TO SHAREHOLDERS
The tax character of distributions paid during the years ended July 31, 2020 and July 31, 2019 were as follows:
| Year ended July 31 | ||||||||
| 2020 | 2019 | |||||||
Ordinary income | $ | 0 | $ | 2,032,129 | ||||
Long-term capital gain | 200,579,915 | 378,597,119 | ||||||
28 | Wells Fargo Premier Large Company Growth Fund
Table of Contents
Notes to financial statements
As of July 31, 2020, the components of distributable earnings on a tax basis were as follows:
| Undistributed long-term gain | Unrealized gains | Late-year ordinary losses deferred | ||
| $152,939,501 | $1,587,490,235 | $(6,045,692) | ||
9. CONCENTRATION RISK
Concentration risks result from exposure to a limited number of sectors. As of the end of the period, the Fund invested a concentration of its portfolio in the information technology sector. A fund that invests a substantial portion of its assets in any sector may be more affected by changes in that sector than would be a fund whose investments are not heavily weighted in any sector.
10. INDEMNIFICATION
Under the Fund’s organizational documents, the officers and Trustees have been granted certain indemnification rights against certain liabilities that may arise out of performance of their duties to the Fund. The Fund has entered into a separate agreement with each Trustee that converts indemnification rights currently existing under the Fund’s organizational documents into contractual rights that cannot be changed in the future without the consent of the Trustee. Additionally, in the normal course of business, the Fund may enter into contracts with service providers that contain a variety of indemnification clauses. The Fund’s maximum exposure under these arrangements is dependent on future claims that may be made against the Fund and, therefore, cannot be estimated.
11. NEW ACCOUNTING PRONOUNCEMENT
In August 2018, FASB issued Accounting Standards Update (“ASU”) No. 2018-13, Fair Value Measurement (Topic 820) Disclosure Framework—Changes to the Disclosure Requirements for Fair Value Measurement. ASU 2018-13 updates the disclosure requirements on fair value measurements in Topic 820, Fair Value Measurements. The amendments are effective for fiscal years, and interim periods within those fiscal years, beginning after December 15, 2019. Management has adopted this guidance which did not have a material impact on the financial statements.
12. CORONAVIRUS (COVID-19) PANDEMIC
On March 11, 2020, the World Health Organization announced that it had made the assessment that coronavirus disease 2019 (“COVID-19”) is a pandemic. The impacts of COVID-19 are adversely affecting the entire global economy, individual companies and investment products, and the market in general. There is significant uncertainty around the extent and duration of business disruptions related to COVID-19 and the impacts may be short term or may last for an extended period of time. The risk of further spreading of COVID-19 has led to significant uncertainty and volatility in the financial markets.
Wells Fargo Premier Large Company Growth Fund | 29
Table of Contents
Report of independent registered public accounting firm
To the Shareholders of the Fund and Board of Trustees
Wells Fargo Funds Trust:
Opinion on the Financial Statements
We have audited the accompanying statement of assets and liabilities of Wells Fargo Premier Large Company Growth Fund (the Fund), one of the funds constituting Wells Fargo Funds Trust, including the portfolio of investments, as of July 31, 2020, the related statement of operations for the year then ended, the statements of changes in net assets for each of the years in the two-year period then ended, and the related notes (collectively, the financial statements) and the financial highlights for each of the years in the five-year period then ended. In our opinion, the financial statements and financial highlights present fairly, in all material respects, the financial position of the Fund as of July 31, 2020, the results of its operations for the year then ended, the changes in its net assets for each of the years in the two-year period then ended, and the financial highlights for each of the years in the five-year period then ended, in conformity with U.S. generally accepted accounting principles.
Basis for Opinion
These financial statements and financial highlights are the responsibility of the Fund’s management. Our responsibility is to express an opinion on these financial statements and financial highlights based on our audits. We are a public accounting firm registered with the Public Company Accounting Oversight Board (United States) (PCAOB) and are required to be independent with respect to the Fund in accordance with the U.S. federal securities laws and the applicable rules and regulations of the Securities and Exchange Commission and the PCAOB.
We conducted our audits in accordance with the standards of the PCAOB. Those standards require that we plan and perform the audit to obtain reasonable assurance about whether the financial statements and financial highlights are free of material misstatement, whether due to error or fraud. Our audits included performing procedures to assess the risks of material misstatement of the financial statements and financial highlights, whether due to error or fraud, and performing procedures that respond to those risks. Such procedures included examining, on a test basis, evidence regarding the amounts and disclosures in the financial statements and financial highlights. Such procedures also included confirmation of securities owned as of July 31, 2020, by correspondence with the custodian, transfer agent and brokers, or by other appropriate auditing procedures. Our audits also included evaluating the accounting principles used and significant estimates made by management, as well as evaluating the overall presentation of the financial statements and financial highlights. We believe that our audits provide a reasonable basis for our opinion.

We have not been able to determine the specific year that we began serving as the auditor of one or more Wells Fargo Funds investment companies; however we are aware that we have served as the auditor of one or more Wells Fargo Funds investment companies since at least 1955.
Boston, Massachusetts
September 25, 2020
30 | Wells Fargo Premier Large Company Growth Fund
Table of Contents
TAX INFORMATION
Pursuant to Section 852 of the Internal Revenue Code, $200,579,915 was designated as a 20% rate gain distribution for the fiscal year ended July 31, 2020.
PROXY VOTING INFORMATION
A description of the policies and procedures used to determine how to vote proxies relating to portfolio securities is available, upon request, by calling 1-800-222-8222, visiting our website at wfam.com, or visiting the SEC website at sec.gov. Information regarding how the proxies related to portfolio securities were voted during the most recent 12-month period ended June 30 is available on the website at wfam.com or by visiting the SEC website at sec.gov.
QUARTERLY PORTFOLIO HOLDINGS INFORMATION
The Fund files its complete schedule of portfolio holdings with the SEC for the first and third quarters of each fiscal year as an exhibit to its reports on Form N-PORT. Shareholders may view the filed Form N-PORT by visiting the SEC website at sec.gov.
Wells Fargo Premier Large Company Growth Fund | 31
Table of Contents
Other information (unaudited)
BOARD OF TRUSTEES AND OFFICERS
Each of the Trustees and Officers1 listed in the table below acts in identical capacities for each fund in the Wells Fargo family of funds, which consists of 147 mutual funds comprising the Wells Fargo Funds Trust, Wells Fargo Variable Trust, Wells Fargo Master Trust and four closed-end funds (collectively the “Fund Complex”). This table should be read in conjunction with the Prospectus and the Statement of Additional Information2. The mailing address of each Trustee and Officer is 525 Market Street, 12th Floor, San Francisco, CA 94105. Each Trustee and Officer serves an indefinite term, however, each Trustee serves such term until reaching the mandatory retirement age established by the Trustees.
Independent Trustees
| Name and year of birth | Position held and length of service* | Principal occupations during past five years or longer | Current other public company or investment company directorships | |||
| William R. Ebsworth (Born 1957) | Trustee, since 2015 | Retired. From 1984 to 2013, equities analyst, portfolio manager, research director and chief investment officer at Fidelity Management and Research Company in Boston, Tokyo, and Hong Kong, and retired in 2013 as Chief Investment Officer of Fidelity Strategic Advisers, Inc. where he led a team of investment professionals managing client assets. Prior thereto, Board member of Hong Kong Securities Clearing Co., Hong Kong Options Clearing Corp., the Thailand International Fund, Ltd., Fidelity Investments Life Insurance Company, and Empire Fidelity Investments Life Insurance Company. Audit Committee Chair and Investment Committee Chair of the Vincent Memorial Hospital Endowment (non-profit organization). Mr. Ebsworth is a CFA® charterholder. | N/A | |||
| Jane A. Freeman (Born 1953) | Trustee, since 2015; Chair Liaison, since 2018 | Retired. From 2012 to 2014 and 1999 to 2008, Chief Financial Officer of Scientific Learning Corporation. From 2008 to 2012, Ms. Freeman provided consulting services related to strategic business projects. Prior to 1999, Portfolio Manager at Rockefeller & Co. and Scudder, Stevens & Clark. Board member of the Harding Loevner Funds from 1996 to 2014, serving as both Lead Independent Director and chair of the Audit Committee. Board member of the Russell Exchange Traded Funds Trust from 2011 to 2012 and the chair of the Audit Committee. Ms. Freeman is also an inactive Chartered Financial Analyst. | N/A | |||
| Isaiah Harris, Jr. (Born 1952) | Trustee, since 2009; Audit Committee Chairman, since 2019 | Retired. Chairman of the Board of CIGNA Corporation since 2009, and Director since 2005. From 2003 to 2011, Director of Deluxe Corporation. Prior thereto, President and CEO of BellSouth Advertising and Publishing Corp. from 2005 to 2007, President and CEO of BellSouth Enterprises from 2004 to 2005 and President of BellSouth Consumer Services from 2000 to 2003. Emeritus member of the Iowa State University Foundation Board of Governors. Emeritus Member of the Advisory Board of Iowa State University School of Business. Advisory Board Member, Palm Harbor Academy (private school). Advisory Board Member, Child Evangelism Fellowship (non-profit). Mr. Harris is a certified public accountant (inactive status). | CIGNA Corporation | |||
| Judith M. Johnson (Born 1949) | Trustee, since 2008; Audit Committee Chairman, from 2009 to 2018 | Retired. Prior thereto, Chief Executive Officer and Chief Investment Officer of Minneapolis Employees Retirement Fund from 1996 to 2008. Ms. Johnson is an attorney, certified public accountant and a certified managerial accountant. | N/A | |||
32 | Wells Fargo Premier Large Company Growth Fund
Table of Contents
Other information (unaudited)
| Name and year of birth | Position held and length of service* | Principal occupations during past five years or longer | Current other public company or investment company directorships | |||
| David F. Larcker (Born 1950) | Trustee, since 2009 | James Irvin Miller Professor of Accounting at the Graduate School of Business, Stanford University, Director of the Corporate Governance Research Initiative and Senior Faculty of The Rock Center for Corporate Governance since 2006. From 2005 to 2008, Professor of Accounting at the Graduate School of Business, Stanford University. Prior thereto, Ernst & Young Professor of Accounting at The Wharton School, University of Pennsylvania from 1985 to 2005. | N/A | |||
| Olivia S. Mitchell (Born 1953) | Trustee, since 2006; Nominating and Governance Committee Chair, since 2018 | International Foundation of Employee Benefit Plans Professor, Wharton School of the University of Pennsylvania since 1993. Director of Wharton’s Pension Research Council and Boettner Center on Pensions & Retirement Research, and Research Associate at the National Bureau of Economic Research. Previously, Cornell University Professor from 1978 to 1993. | N/A | |||
| Timothy J. Penny (Born 1951) | Trustee, since 1996; Chairman, since 2018 | President and Chief Executive Officer of Southern Minnesota Initiative Foundation, a non-profit organization, since 2007. Member of the Board of Trustees of NorthStar Education Finance, Inc., a non-profit organization, since 2007. | N/A | |||
| James G. Polisson (Born 1959) | Trustee, since 2018 | Retired. Chief Marketing Officer, Source (ETF) UK Services, Ltd, from 2015 to 2017. From 2012 to 2015, Principal of The Polisson Group, LLC, a management consulting, corporate advisory and principal investing company. Chief Executive Officer and Managing Director at Russell Investments, Global Exchange Traded Funds from 2010 to 2012. Managing Director of Barclays Global Investors from 1998 to 2010 and Global Chief Marketing Officer for iShares and Barclays Global Investors from 2000 to 2010. Trustee of the San Francisco Mechanics’ Institute, a non-profit organization, from 2013 to 2015. Board member of the Russell Exchange Traded Fund Trust from 2011 to 2012. Director of Barclays Global Investors Holdings Deutschland GmbH from 2006 to 2009. Mr. Polisson is an attorney and has a retired status with the Massachusetts and District of Columbia Bar Associations. | N/A | |||
| Pamela Wheelock (Born 1959) | Trustee, since January 2020; previously Trustee from January 2018 to July 2019 | Board member of the Destination Medical Center Economic Development Agency, Rochester, Minnesota since 2019 and Interim President of the McKnight Foundation since 2020. Acting Commissioner, Minnesota Department of Human Services, July 2019 through September 2019. Human Services Manager (part-time), Minnesota Department of Human Services, October 2019 through December 2019. Chief Operating Officer, Twin Cities Habitat for Humanity from 2017 to 2019. Vice President of University Services, University of Minnesota from 2012 to 2016. Prior thereto, on the Board of Directors, Governance Committee and Finance Committee for the Minnesota Philanthropy Partners (Saint Paul Foundation) from 2012 to 2018, Interim Chief Executive Officer of Blue Cross Blue Shield of Minnesota from 2011 to 2012, Chairman of the Board from 2009 to 2012 and Board Director from 2003 to 2015. Vice President, Leadership and Community Engagement, Bush Foundation, Saint Paul, Minnesota (a private foundation) from 2009 to 2011. Executive Vice President and Chief Financial Officer, Minnesota Sports and Entertainment from 2004 to 2009 and Senior Vice President from 2002 to 2004. Executive Vice President of the Minnesota Wild Foundation from 2004 to 2008. Commissioner of Finance, State of Minnesota, from 1999 to 2002. Currently Board Chair of the Minnesota Wild Foundation since 2010. | N/A | |||
| * | Length of service dates reflect the Trustee’s commencement of service with the Trust’s predecessor entities, where applicable. |
Wells Fargo Premier Large Company Growth Fund | 33
Table of Contents
Other information (unaudited)
Officers
| Name and year of birth | Position held and length of service | Principal occupations during past five years or longer | ||
| Andrew Owen (Born 1960) | President, since 2017 | Executive Vice President of Wells Fargo & Company and Head of Affiliated Managers, Wells Fargo Asset Management, since 2014. In addition, Mr. Owen is currently President, Chief Executive Officer and Director of Wells Fargo Funds Management, LLC since 2017. Prior thereto, Executive Vice President responsible for marketing, investments and product development for Wells Fargo Funds Management, LLC, from 2009 to 2014. | ||
| Jeremy DePalma1 (Born 1974) | Treasurer, since 2012 | Senior Vice President of Wells Fargo Funds Management, LLC since 2009. Senior Vice President of Evergreen Investment Management Company, LLC from 2008 to 2010 and head of the Fund Reporting and Control Team within Fund Administration from 2005 to 2010. | ||
| Michelle Rhee (Born 1966) | Chief Legal Officer, since 2019 | Secretary of Wells Fargo Funds Management, LLC, Chief Legal Counsel of Wells Fargo Asset Management and Assistant General Counsel of Wells Fargo Bank, N.A. since 2018. Associate General Counsel and Managing Director of Bank of America Corporation from 2004 to 2018. | ||
| Catherine Kennedy (Born 1969) | Secretary, since 2019 | Vice President of Wells Fargo Funds Management, LLC and Senior Counsel of the Wells Fargo Legal Department since 2010. Vice President and Senior Counsel of Evergreen Investment Management Company, LLC from 1998 to 2010. | ||
| Michael H. Whitaker (Born 1967) | Chief Compliance Officer, since 2016 | Chief Compliance Officer of Wells Fargo Asset Management since 2016. Senior Vice President and Chief Compliance Officer for Fidelity Investments from 2007 to 2016. | ||
| David Berardi (Born 1975) | Assistant Treasurer, since 2009 | Vice President of Wells Fargo Funds Management, LLC since 2009. Vice President of Evergreen Investment Management Company, LLC from 2008 to 2010. Manager of Fund Reporting and Control for Evergreen Investment Management Company, LLC from 2004 to 2010. | ||
| 1 | Jeremy DePalma acts as Treasurer of 82 funds and Assistant Treasurer of 65 funds in the Fund Complex. |
| 2 | The Statement of Additional Information includes additional information about the Trustees and is available, without charge, upon request, by calling 1-800-222-8222 or by visiting the website at wfam.com. |
34 | Wells Fargo Premier Large Company Growth Fund
Table of Contents
Other information (unaudited)
BOARD CONSIDERATION OF INVESTMENT MANAGEMENT AND SUB-ADVISORY AGREEMENTS:
Wells Fargo Premier Large Company Growth Fund
Under the Investment Company Act of 1940 (the “1940 Act”), the Board of Trustees (the “Board”) of Wells Fargo Funds Trust (the “Trust”) must determine annually whether to approve the continuation of the Trust’s investment management and sub-advisory agreements. In this regard, at a Board meeting held on May 26, 2020 and May 28, 2020 (together, the “Meeting”), the Board, all the members of which have no direct or indirect interest in the investment management and sub-advisory agreements and are not “interested persons” of the Trust, as defined in the 1940 Act (the “Independent Trustees”), reviewed and approved for Wells Fargo Premier Large Company Growth Fund (the “Fund”): (i) an investment management agreement (the “Management Agreement”) with Wells Fargo Funds Management, LLC (“Funds Management”); and (ii) an investment sub-advisory agreement (the “Sub-Advisory Agreement”) with Wells Capital Management Incorporated (the “Sub-Adviser”), an affiliate of Funds Management. The Management Agreement and the Sub-Advisory Agreement are collectively referred to as the “Advisory Agreements.”
At the Meeting, the Board considered the factors and reached the conclusions described below relating to the selection of Funds Management and the Sub-Adviser and the approval of the Advisory Agreements. Prior to the Meeting, including at a Board meeting held in April 2020, the Trustees conferred extensively among themselves and with representatives of Funds Management about these matters. Also, the Board has adopted a team-based approach, with each team consisting of a sub-set of Trustees, to assist the full Board in the discharge of its duties in reviewing investment performance and other matters throughout the year. The Independent Trustees were assisted in their evaluation of the Advisory Agreements by independent legal counsel, from whom they received separate legal advice and with whom they met separately.
In providing information to the Board, Funds Management and the Sub-Adviser were guided by a detailed set of requests for information submitted to them by independent legal counsel on behalf of the Independent Trustees at the start of the Board’s annual contract renewal process earlier in 2020. In considering and approving the Advisory Agreements, the Trustees considered the information they believed relevant, including but not limited to the information discussed below. The Board considered not only the specific information presented in connection with the Meeting, but also the knowledge gained over time through interaction with Funds Management and the Sub-Adviser about various topics. In this regard, the Board reviewed reports of Funds Management at each of its quarterly meetings, which included, among other things, portfolio reviews and investment performance reports. In addition, the Board and the teams mentioned above confer with portfolio managers at various times throughout the year. The Board did not identify any particular information or consideration that was all-important or controlling, and each individual Trustee may have attributed different weights to various factors.
After its deliberations, the Board unanimously approved the continuation of the Advisory Agreements for a one-year term and determined that the compensation payable to Funds Management and the Sub-Adviser under each of the Advisory Agreements was reasonable. The Board considered the approval of the Advisory Agreements for the Fund as part of its consideration of agreements for funds across the complex, but its approvals were made on a fund-by-fund basis. The following summarizes a number of important, but not necessarily all, factors considered by the Board in support of its approvals.
Nature, extent and quality of services
The Board received and considered various information regarding the nature, extent and quality of services provided to the Fund by Funds Management and the Sub-Adviser under the Advisory Agreements. This information included a description of the investment advisory services and Fund-level administrative services covered by the Management Agreement, as well as, among other things, a summary of the background and experience of senior management of Wells Fargo Asset Management (“WFAM”), of which Funds Management and the Sub-Adviser are a part, and a summary of investments made in the business of WFAM. The Board also received a description of Funds Management’s and the Sub-Adviser’s business continuity plans and of their approaches to data privacy and cybersecurity, and related testing. The Board also received and reviewed information about Funds Management’s role as administrator of the Fund’s liquidity risk management program, Funds Management’s approach to risk management, and Funds Management’s intermediary and vendor oversight program.
The Board also considered the qualifications, background, tenure and responsibilities of each of the portfolio managers primarily responsible for the day-to-day portfolio management of the Fund. The Board evaluated the ability of Funds Management and the Sub-Adviser to attract and retain qualified investment professionals, including research, advisory and supervisory personnel. The Board further considered the compliance programs and compliance records of Funds Management and the Sub-Adviser. In addition, the Board took into account the full range of services provided to the Fund by Funds Management and its affiliates.
Wells Fargo Premier Large Company Growth Fund | 35
Table of Contents
Other information (unaudited)
Fund investment performance and expenses
The Board considered the investment performance results for the Fund over various time periods ended December 31, 2019. The Board also considered more current results for various time periods ended March 31, 2020. The Board considered these results in comparison to the investment performance of funds in a universe that was determined by Broadridge Inc. (“Broadridge”) to be similar to the Fund (the “Universe”), and in comparison to the Fund’s benchmark index and to other comparative data. Broadridge is an independent provider of investment company data. The Board received a description of the methodology used by Broadridge to select the mutual funds in the performance Universe. The Board noted that the investment performance of the Fund (Class A) was higher than the average investment performance of the Universe for the one-, three-, five- and ten-year periods ended December 31, 2019. The Board also noted that the investment performance of the Fund (Administrator Class) was higher than the average investment performance of the Universe for the three-, five- and ten-year periods ended March 31, 2020, and lower than the average investment performance of the Universe for the one-year period ended March 31, 2020. The Board also noted that the investment performance of the Fund was higher than its benchmark index, the Russell 1000® Growth Index, for the three-year period ended December 31, 2019, and lower than its benchmark index for the one-, five- and ten-year periods ended December 31, 2019. The Board also noted that the investment performance of the Fund was lower than its benchmark index, the Russell 1000® Growth Index, for the one-, five- and ten-year periods ended March 31, 2020, and in range of its benchmark index for the three-year period ended March 31, 2020.
The Board received information concerning, and discussed factors contributing to, the underperformance of the Fund relative to the benchmark for the periods identified above. The Board took note of the explanations for the relative underperformance during these periods, including with respect to investment decisions and market factors that affected the Fund’s investment performance. The Board also noted the Fund’s outperformance relative to the Universe for all periods ending December 31, 2019 and the benchmark over the three-year period.
The Board also received and considered information regarding the Fund’s net operating expense ratios and their various components, including actual management fees, custodian and other non-management fees, and Rule 12b-1 and non-Rule 12b-1 shareholder service fees. The Board considered these ratios in comparison to the median ratios of funds in class-specific expense groups that were determined by Broadridge to be similar to the Fund (the “Groups”). The Board received a description of the methodology used by Broadridge to select the mutual funds in the expense Groups and an explanation of how funds comprising expense groups and their expense ratios may vary from year-to-year. Based on the Broadridge reports, the Board noted that the net operating expense ratios of the Fund were lower than or in range of the median net operating expense ratios of the expense Groups for all share classes.
The Board took into account the Fund’s investment performance and expense information provided to it among the factors considered in deciding to re-approve the Advisory Agreements.
Investment management and sub-advisory fee rates
The Board reviewed and considered the contractual fee rates payable by the Fund to Funds Management under the Management Agreement, as well as the contractual fee rates payable by the Fund to Funds Management for class-level administrative services under a Class-Level Administration Agreement, which include, among other things, class-level transfer agency and sub-transfer agency costs (collectively, the “Management Rates”). The Board also reviewed and considered the contractual investment sub-advisory fee rates that are payable by Funds Management to the Sub-Adviser for investment sub-advisory services.
Among other information reviewed by the Board was a comparison of the Fund’s Management Rates with the average contractual investment management fee rates of funds in the expense Groups at a common asset level as well as transfer agency costs of the funds in the expense Groups. The Board noted that the Management Rates of the Fund were lower than or in range of the sum of these average rates for the Fund’s expense Groups for all share classes.
The Board also received and considered information about the portion of the total management fee that was retained by Funds Management after payment of the fee to the Sub-Adviser for sub-advisory services. In assessing the reasonableness of this amount, the Board received and evaluated information about the nature and extent of responsibilities retained and risks assumed by Funds Management and not delegated to or assumed by the Sub-Adviser, and about Funds Management’s on-going oversight services. Given the affiliation between Funds Management and the Sub-Adviser, the Board ascribed limited relevance to the allocation of fees between them.
The Board also received and considered information about the nature and extent of services offered and fee rates charged by Funds Management and the Sub-Adviser to other types of clients with investment strategies similar to those of the Fund. In this regard, the Board received information about the significantly greater scope of services, and compliance, reporting and
36 | Wells Fargo Premier Large Company Growth Fund
Table of Contents
Other information (unaudited)
other legal burdens and risks of managing proprietary mutual funds compared with those associated with managing assets of other types of clients, including third-party sub-advised fund clients and non-mutual fund clients such as institutional separate accounts.
Based on its consideration of the factors and information it deemed relevant, including those described here, the Board determined that the compensation payable to Funds Management under the Management Agreement and to the Sub-Adviser under the Sub-Advisory Agreement was reasonable.
Profitability
The Board received and considered information concerning the profitability of Funds Management, as well as the profitability of both WFAM and Wells Fargo & Co. (“Wells Fargo”) from providing services to the fund family as a whole. The Board noted that the Sub-Adviser’s profitability information with respect to providing services to the Fund and other funds in the family was subsumed in the WFAM and Wells Fargo profitability analysis.
Funds Management reported on the methodologies and estimates used in calculating profitability, including a description of the methodology used to allocate certain expenses. Among other things, the Board noted that the levels of profitability reported on a fund-by-fund basis varied widely, depending on factors such as the size, type and age of fund.
Based on its review, the Board did not deem the profits reported by Funds Management, WFAM or Wells Fargo from services provided to the Fund to be at a level that would prevent it from approving the continuation of the Advisory Agreements.
Economies of scale
The Board received and considered information about the potential for Funds Management to experience economies of scale in the provision of management services to the Fund, the difficulties of calculating economies of scale at an individual fund level, and the extent to which potential scale benefits are shared with shareholders. The Board noted the existence of breakpoints in the Fund’s management fee structure, which operate generally to reduce the Fund’s expense ratios as the Fund grows in size, and the size of the Fund in relation to such breakpoints. The Board considered that in addition to management fee breakpoints, Funds Management shares potential economies of scale from its management business in a variety of ways, including through fee waiver and expense reimbursement arrangements, services that benefit shareholders, competitive management fee rates set at the outset without regard to breakpoints, and investments in the business intended to enhance services available to shareholders.
The Board concluded that Funds Management’s arrangements with respect to the Fund, including contractual breakpoints, constituted a reasonable approach to sharing potential economies of scale with the Fund and its shareholders.
Other benefits to Funds Management and the Sub-Adviser
The Board received and considered information regarding potential “fall-out” or ancillary benefits received by Funds Management and its affiliates, including the Sub-Adviser, as a result of their relationships with the Fund. Ancillary benefits could include, among others, benefits directly attributable to other relationships with the Fund and benefits potentially derived from an increase in Funds Management’s and the Sub-Adviser’s business as a result of their relationships with the Fund. The Board noted that various affiliates of Funds Management may receive distribution-related fees, shareholder servicing payments and sub-transfer agency fees in respect of shares sold or held through them and services provided.
The Board also reviewed information about soft dollar credits earned and utilized by the Sub-Adviser, fees earned by Funds Management and the Sub-Adviser from managing a private investment vehicle for the fund family’s securities lending collateral, and commissions earned by an affiliated broker from portfolio transactions.
Based on its consideration of the factors and information it deemed relevant, including those described here, the Board did not find that any ancillary benefits received by Funds Management and its affiliates, including the Sub-Adviser, were unreasonable.
Conclusion
At the Meeting, after considering the above-described factors and based on its deliberations and its evaluation of the information described above, the Board unanimously approved the continuation of the Advisory Agreements for a one-year term and determined that the compensation payable to Funds Management and the Sub-Adviser under each of the Advisory Agreements was reasonable.
Wells Fargo Premier Large Company Growth Fund | 37
Table of Contents
Other information (unaudited)
LIQUIDITY RISK MANAGEMENT PROGRAM
In accordance with Rule 22e-4 under the Investment Company Act of 1940, as amended (the “Liquidity Rule”), Wells Fargo Funds Trust (the “Trust”) has adopted and implemented a liquidity risk management program (the “Program”) on behalf of each of its series, including the Fund, which is reasonably designed to assess and manage the Fund’s liquidity risk. “Liquidity risk” is defined as the risk that the Fund is unable to meet redemption requests without significantly diluting remaining investors’ interests in the Fund. The Trust’s Board of Trustees (the “Board”) previously approved the designation of Wells Fargo Funds Management, LLC (“Funds Management”), the Fund’s investment manager, as the administrator of the Program, and Funds Management has established a Liquidity Risk Management Council composed of personnel from multiple departments within Funds Management and its affiliates to assist Funds Management in the implementation and on-going administration of the Program.
The Program is comprised of various components designed to support the assessment and/or management of liquidity risk, including: (1) the periodic assessment (no less frequently than annually) of certain factors that influence the Fund’s liquidity risk; (2) the periodic classification (no less frequently than monthly) of the Fund’s investments into one of four liquidity categories that reflect an estimate of their liquidity under current market conditions; (3) a 15% limit on the acquisition of “illiquid investments” (as defined under the Liquidity Rule); (4) to the extent the Fund does not invest primarily in “highly liquid investments” (as defined under the Liquidity Rule), the determination of a minimum percentage of the Fund’s assets that generally will be invested in highly liquid investments (an “HLIM”); (5) if the Fund has established an HLIM, the periodic review (no less frequently than annually) of the HLIM and the adoption of policies and procedures for responding to a shortfall of the Fund’s “highly liquid investments” below its HLIM; and (6) periodic reporting to the Board.
At a meeting of the Board held on May 26 and 28, 2020, the Board received a written report (the “Report”) from Funds Management that addressed the operation of the Program and assessed its adequacy and effectiveness of implementation. The Report covered the initial period from December 1, 2018 through December 31, 2019 (the “Reporting Period”). No significant liquidity events impacting the Fund were noted in the Report. There were no material changes to the Program during the Reporting Period. The Report concluded that the Program is operating effectively to assess and manage the Fund’s liquidity risk, and that the Program has been and continues to be adequately and effectively implemented to monitor and, as applicable, respond to the Fund’s liquidity developments.
There can be no assurance that the Program will achieve its objectives under all circumstances in the future. Please refer to the Fund’s prospectus for more information regarding the Fund’s exposure to liquidity risk and other risks to which an investment in the Fund may be subject.
38 | Wells Fargo Premier Large Company Growth Fund
Table of Contents
Effective on or after May 1, 2020, clients of Edward Jones (also referred to as “shareholders”) purchasing Fund shares on the Edward Jones commission and fee-based platforms are eligible only for the following sales charge discounts (also referred to as “breakpoints”) and waivers, which can differ from breakpoints and waivers described elsewhere in the Fund’s Prospectus or SAI or through another broker-dealer. In all instances, it is the shareholder’s responsibility to inform Edward Jones at the time of purchase of any relationship, holdings of Wells Fargo Funds or other facts qualifying the purchaser for breakpoints or waivers. Edward Jones can ask for documentation of such circumstance.
| Breakpoints available at Edward Jones |
| Rights of Accumulation (ROA) |
The applicable sales charge on a purchase of Class A shares is determined by taking into account all share classes (except any money market funds and retirement plan share classes) of Wells Fargo Funds held by the shareholder or in an account grouped by Edward Jones with other accounts for the purpose of providing certain pricing considerations (“pricing groups”). This includes all share classes held on the Edward Jones platform and/or held on another platform. The inclusion of eligible fund family assets in the rights of accumulation calculation is dependent on the shareholder notifying his or her financial advisor of such assets at the time of calculation. |
ROA is determined by calculating the higher of cost or market value (current shares x NAV). |
| Letter of Intent (LOI) |
Through a LOI, shareholders can receive the sales charge and breakpoint discounts for purchases shareholders intend to makeover a 13-month period from the date Edward Jones receives the LOI. The LOI is determined by calculating the higher of cost or market value of qualifying holdings at LOI initiation in combination with the value that the shareholder intends to buy over a13-month period to calculate the front-end sales charge and any breakpoint discounts. Each purchase the shareholder makes during that 13-month period will receive the sales charge and breakpoint discount that applies to the total amount. The inclusion of eligible fund family assets in the LOI calculation is dependent on the shareholder notifying his or her financial advisor of such assets at the time of calculation. Purchases made before the LOI is received by Edward Jones are not covered under the LOI and will not reduce the sales charge previously paid. Sales charges will be adjusted if LOI is not met. |
| Sales charges are waived for the following shareholders and in the following situations at Edward Jones: |
● Associates of Edward Jones and its affiliates and their family members who are in the same pricing group (as determined by Edward Jones under its policies and procedures) as the associate. This waiver will continue for the remainder of the associate’s life if the associate retires from Edward Jones in good-standing. |
● Shares purchased in an Edward Jones fee-based program. |
● Shares purchased through reinvestment of capital gains distributions and dividend reinvestment. |
● Shares purchased from the proceeds of redeemed shares of the same fund family so long as the following conditions are met: 1) the proceeds are from the sale of shares within 60 days of the purchase, and 2) the sale and purchase are made in the same share class and the same account or the purchase is made in an individual retirement account with proceeds from liquidations in anon-retirement account. |
● Shares exchanged into Class A shares from another share class so long as the exchange is into the same fund and was initiated at the discretion of Edward Jones. Edward Jones is responsible for any remaining CDSC due to the fund company, if applicable. Any future purchases are subject to the applicable sales charge as disclosed in the prospectus. |
● Exchanges from Class C shares to Class A shares of the same fund, generally, in the 84th month following the anniversary of the purchase date or earlier at the discretion of Edward Jones. |
| If the shareholder purchases shares that are subject to a CDSC and those shares are redeemed before the CDSC is expired, the shareholder is responsible to pay the CDSC except in the following conditions available at Edward Jones: |
● The death or disability of the shareholder. |
● Systematic withdrawals with up to 10% per year of the account value. |
● Return of excess contributions from an Individual Retirement Account (IRA). |
● Shares sold as part of a required minimum distribution for IRA and retirement accounts if the redemption is taken in or after the year the shareholder reaches qualified age based on applicable IRS regulation. |
● Shares sold to pay Edward Jones fees or costs in such cases where the transaction is initiated by Edward Jones. |
● Shares exchanged in an Edward Jones fee-based program. |
● Shares acquired through NAV reinstatement. |
Wells Fargo Premier Large Company Growth Fund | 39
Table of Contents
Appendix I (unaudited)
| Other Important Information for accounts at Edward Jones: |
| Minimum Purchase Amounts |
● $250 initial purchase minimum |
● $50 subsequent purchase minimum |
| Minimum Balances |
| Edward Jones has the right to redeem at its discretion fund holdings with a balance of $250 or less. The following are examples of accounts that are not included in this policy: |
● A fee-based account held on an Edward Jones platform |
● A 529 account held on an Edward Jones platform |
● An account with an active systematic investment plan or letter of intent (LOI) |
| Changing Share Classes |
| At any time it deems necessary, Edward Jones has the authority to exchange at NAV a shareholder’s holdings in a fund to Class A shares. |
40 | Wells Fargo Premier Large Company Growth Fund
Table of Contents
Effective June 1, 2020, shareholders purchasing Fund shares through an Oppenheimer & Co. Inc. (“Oppenheimer”) platform or account are eligible only for the following load waivers (front-end sales charge waivers and contingent deferred or back-end, sales charge waivers) and discounts, which may differ from those disclosed in the Fund’s Prospectus or SAI.
| Front-end Sales Load Waivers on Class A Shares available at Oppenheimer |
| Employer-sponsored retirement, deferred compensation and employee benefit plans (including health savings accounts) and trusts used to fund those plans, provided that the shares are not held in a commission-based brokerage account and shares are held for the benefit of the plan. |
| Shares purchased by or through a 529 Plan. |
| Shares purchased through an Oppenheimer affiliated investment advisory program. |
| Shares purchased through reinvestment of capital gains distributions and dividend reinvestment when purchasing shares of the same fund (but not any other fund within the fund family). |
| Shares purchased from the proceeds of redemptions within the same fund family, provided (1) the repurchase occurs within 90 days following the redemption, (2) the redemption and purchase occur in the same account, and (3) redeemed shares were subject to a front-end or deferred sales load (known as Rights of Restatement). |
| A shareholder in the Fund’s Class C shares will have their shares exchanged at net asset value to Class A shares (or the appropriate share class) of the Fund if the shares are no longer subject to a CDSC and the exchange is in line with the policies and procedures of Oppenheimer. |
| Employees and registered representatives of Oppenheimer or its affiliates and their family members. |
| Directors or Trustees of the Fund, and employees of the Fund’s investment adviser or any of its affiliates, as described in the Prospectus. |
| CDSC Waivers on A and C Shares available at Oppenheimer |
| Death or disability of the shareholder. |
| Shares sold as part of a systematic withdrawal plan as described in the Prospectus. |
| Return of excess contributions from an IRA Account. |
| Shares sold as part of a required minimum distribution for IRA and retirement accounts due to the shareholder reaching the qualified age based on applicable IRS regulations as described in the Prospectus. |
| Shares sold to pay Oppenheimer fees but only if the transaction is initiated by Oppenheimer. |
| Shares acquired through a right of reinstatement. |
| Front-end load Discounts Available at Oppenheimer: Breakpoints, Rights of Accumulation & Letters of Intent |
| Breakpoints as described in the Prospectus. |
| Rights of Accumulation (ROA), which entitle shareholders to breakpoint discounts, will be automatically calculated based on the aggregated holding of fund family assets held by accounts within the purchaser’s household at Oppenheimer. Eligible fund family assets not held at Oppenheimer may be included in the ROA calculation only if the shareholder notifies his or her financial advisor about such assets. |
Wells Fargo Premier Large Company Growth Fund | 41
Table of Contents
Effective June 15, 2020, shareholders purchasing fund shares through a Robert W. Baird & Co. (“Baird”) platform or account will only be eligible for the following sales charge waivers (front-end sales charge waivers and CDSC waivers) and discounts, which may differ from those disclosed elsewhere in the Fund’s Prospectus or the SAI.
| Front-end Sales Load Waivers on Class A Shares available at Baird |
| Shares purchased through reinvestment of capital gains distributions and dividend reinvestment when purchasing share of the same fund. |
| Share purchase by employees and registers representatives of Baird or its affiliate and their family members as designated by Baird. |
| Shares purchase from the proceeds of redemptions within the same fund family, provided (1) the repurchase occurs within 90 days following the redemption, (2) the redemption and purchase occur in the same accounts, and (3) redeemed shares were subject to a front-end or deferred sales charge (known as rights of reinstatement). |
| A shareholder in the Funds Investor C Shares will have their share exchanged at net asset value to Investor A shares of the fund if the shares are no longer subject to CDSC and the exchange is in line with the policies and procedures of Baird. |
| Employer-sponsored retirement plans or charitable accounts in a transactional brokerage account at Baird, including 401(k) plans, 457 plans, employer-sponsored 403(b) plans, profit sharing and money purchase pension plans and defined benefit plans. For purposes of this provision, employer-sponsored retirement plans do not include SEP IRAs, Simple IRAs or SAR-SEPs. |
| CDSC Waivers on A and C Shares available at Baird |
| Shares sold due to death or disability of the shareholder. |
| Shares sold as part of a systematic withdrawal plan as described in the Fund’s Prospectus. |
| Shares bought due to returns of excess contributions from an IRA Account. |
| Shares sold as part of a required minimum distribution for IRA and retirement accounts due to the shareholder reaching age 72 as described in the Fund’s Prospectus. |
| Shares sold to pay Baird fees but only if the transaction is initiated by Baird. |
| Shares acquired through a right of reinstatement. |
| Front-end load Discounts Available at Baird: Breakpoint and/or Rights of Accumulation |
| Breakpoints as described in the Prospectus. |
| Rights of accumulations which entitles shareholders to breakpoint discounts will be automatically calculated based on the aggregated holding of fund family assets held by accounts within the purchaser’s household at Baird. Eligible fund family assets not held at Baird may be included in the rights of accumulations calculation only if the shareholder notifies his or her financial advisor about such assets. |
| Letters of Intent (LOI) allow for breakpoint discounts based on anticipated purchases within a fund family through Baird, over a13-month period of time. |
42 | Wells Fargo Premier Large Company Growth Fund
Table of Contents
This page is intentionally left blank.
Table of Contents
This page is intentionally left blank.
Table of Contents
For more information
More information about Wells Fargo Funds is available free upon request. To obtain literature, please write, visit the Fund’s website, or call:
Wells Fargo Funds
P.O. Box 219967
Kansas City, MO 64121-9967
Website: wfam.com
Individual investors: 1-800-222-8222
Retail investment professionals: 1-888-877-9275
Institutional investment professionals: 1-866-765-0778

This report and the financial statements contained herein are submitted for the general information of the shareholders of the Fund. If this report is used for promotional purposes, distribution of the report must be accompanied or preceded by a current prospectus. Before investing, please consider the investment objectives, risks, charges, and expenses of the investment. For a current prospectus and, if available, a summary prospectus, containing this information, call 1-800-222-8222 or visit the Fund’s website at wfam.com. Read the prospectus carefully before you invest or send money.
Wells Fargo Asset Management (WFAM) is the trade name for certain investment advisory/management firms owned by Wells Fargo & Company. These firms include but are not limited to Wells Capital Management Incorporated and Wells Fargo Funds Management, LLC. Certain products managed by WFAM entities are distributed by Wells Fargo Funds Distributor, LLC (a broker-dealer and Member FINRA).
This material is for general informational and educational purposes only and is NOT intended to provide investment advice or a recommendation of any kind—including a recommendation for any specific investment, strategy, or plan.
INVESTMENT PRODUCTS: NOT FDIC INSURED ◾ NO BANK GUARANTEE ◾ MAY LOSE VALUE
© 2020 Wells Fargo & Company. All rights reserved
PAR-0820-01043 09-20
A212/AR212 07-20
Table of Contents
ITEM 2. CODE OF ETHICS
(a) As of the end of the period covered by the report, Wells Fargo Funds Trust has adopted a code of ethics that applies to its President and Treasurer. A copy of the code of ethics is filed as an exhibit to this Form N-CSR.
(c) During the period covered by this report, there were no amendments to the provisions of the code of ethics adopted in Item 2(a) above.
(d) During the period covered by this report, there were no implicit or explicit waivers to the provisions of the code of ethics adopted in Item 2(a) above.
ITEM 3. AUDIT COMMITTEE FINANCIAL EXPERT
The Board of Trustees of Wells Fargo Funds Trust has determined that Judith Johnson is an audit committee financial expert, as defined in Item 3 of Form N-CSR. Mrs. Johnson is independent for purposes of Item 3 of Form N-CSR.
ITEM 4. PRINCIPAL ACCOUNTANT FEES AND SERVICES
(a), (b), (c), (d) The following table presents aggregate fees billed in each of the last two fiscal years for services rendered
to the Registrant by the Registrant’s principal accountant. These fees were billed to the registrant and were approved by
the Registrant’s audit committee.
| Fiscal year ended July 31, 2020 | Fiscal year ended July 31, 2019 | |||||||
Audit fees | $ | 329,340 | $ | 319,330 | ||||
Audit-related fees(1) | 16,510 | 12,900 | ||||||
Tax fees (2) | 43,400 | 42,700 | ||||||
All other fees | — | — | ||||||
|
|
|
| |||||
| $ | 389,250 | $ | 374,930 | |||||
|
|
|
| |||||
| (1) | Amounts represent fees related to the merger of Wells Fargo Capital Growth Fund into Wells Fargo Endeavor Select Fund on September 20, 2019. |
| (2) | Tax fees consist of fees for tax compliance, tax advice, tax planning and excise tax. |
(e) The Chairman of the Audit Committees is authorized to pre-approve: (1) audit services for the mutual funds of Wells Fargo Funds Trust; (2) non-audit tax or compliance consulting or training services provided to the Funds by the independent auditors (“Auditors”) if the fees for any particular engagement are not anticipated to exceed $50,000; and (3) non-audit tax or compliance consulting or training services provided by the Auditors to a Fund’s investment adviser and its controlling entities (where pre-approval is required because the engagement relates directly to the operations and financial reporting of the Fund) if the fee to the Auditors for any particular engagement is not anticipated to exceed $50,000. For any such pre-approval sought from the Chairman,
Table of Contents
Management shall prepare a brief description of the proposed services.
If the Chairman approves of such service, he or she shall sign the statement prepared by Management.
Such written statement shall be presented to the full Committees at their next regularly scheduled meetings.
(f) Not applicable
(g) Not applicable
(h) Not applicable
ITEM 5. AUDIT COMMITTEE OF LISTED REGISTRANTS
Not applicable.
ITEM 6. INVESTMENTS
A Portfolio of Investments for each series of Wells Fargo Funds Trust is included as part of the report to shareholders filed under Item 1 of this Form.
ITEM 7. DISCLOSURE OF PROXY VOTING POLICIES AND PROCEDURES FOR CLOSED-END MANAGEMENT INVESTMENT COMPANIES
Not applicable.
ITEM 8. PORTFOLIO MANAGERS OF CLOSED-END MANAGEMENT INVESTMENT COMPANIES
Not applicable.
ITEM 9. PURCHASES OF EQUITY SECURITIES BY CLOSED-END MANAGEMENT INVESTMENT COMPANY AND AFFILIATED PURCHASERS
Not applicable.
ITEM 10. SUBMISSION OF MATTERS TO A VOTE OF SECURITY HOLDERS
There have been no material changes to the procedures by which shareholders may recommend nominees to the registrant’s Board of Trustees that have been implemented since the registrant’s last provided disclosure in response to the requirements of this Item.
ITEM 11. CONTROLS AND PROCEDURES
(a) The President and Treasurer have concluded that the Wells Fargo Funds Trust disclosure controls and procedures (as defined in Rule 30a-3(c) under the Investment Company Act of 1940) provide reasonable assurances that material information relating to the registrant is made known to them by the appropriate persons based on their evaluation of these controls and procedures as of a date within 90 days of the filing of this report.
Table of Contents
(b) There were no significant changes in the registrant’s internal controls over financial reporting (as defined in Rule 30a-3(d) under the Investment Company Act of 1940) that occurred during the most recent fiscal half-year of the period covered by this report that materially affected, or is reasonably likely to materially affect, the registrant’s internal control over financial reporting.
ITEM 12. DISCLOSURES OF SECURITIES LENDING ACTIVITES FOR CLOSED-END MANAGEMENT INVESTMENT COMPANIES
Not applicable.
ITEM 13. EXHIBITS
(a)(2) Certifications pursuant to Section 302 of the Sarbanes-Oxley Act of 2002.
(b) Certifications pursuant to Section 906 of the Sarbanes-Oxley Act of 2002.
Table of Contents
SIGNATURES
Pursuant to the requirements of the Securities Exchange Act of 1934 and the Investment Company Act of 1940, the registrant has duly caused this report to be signed on its behalf by the undersigned, thereunto duly authorized.
| Wells Fargo Funds Trust | ||
| By: | ||
| /s/ Andrew Owen | ||
| Andrew Owen | ||
| President | ||
| Date: | September 25, 2020 | |
Pursuant to the requirements of the Securities Exchange Act of 1934 and the Investment Company Act of 1940, this report has been signed below by the following persons on behalf of the registrant and in the capacities and on the date indicated.
| Wells Fargo Funds Trust | ||
| By: | ||
| /s/ Andrew Owen | ||
| Andrew Owen | ||
| President | ||
| Date: | September 25, 2020 | |
| By: | ||
| /s/ Nancy Wiser | ||
| Nancy Wiser | ||
| Treasurer | ||
| Date: | September 25, 2020 | |
| By: | ||
| /s/ Jeremy DePalma | ||
| Jeremy DePalma | ||
| Treasurer | ||
| Date: | September 25, 2020 | |