Table of Contents

UNITED STATES
SECURITIES AND EXCHANGE COMMISSION
Washington, D.C. 20549
FORM N-CSR
CERTIFIED SHAREHOLDER REPORT OF REGISTERED
MANAGEMENT INVESTMENT COMPANIES
Investment Company Act file number: 811-09253
Wells Fargo Funds Trust
(Exact name of registrant as specified in charter)
525 Market St., San Francisco, CA 94105
(Address of principal executive offices) (Zip code)
Catherine Kennedy
Wells Fargo Funds Management, LLC
525 Market St., San Francisco, CA 94105
(Name and address of agent for service)
Registrant’s telephone number, including area code: 800-222-8222
Date of fiscal year end: September 30
Registrant is making a filing for 12 of its series:
Wells Fargo Diversified Capital Builder Fund, Wells Fargo Diversified Income Builder Fund, Wells Fargo Index Asset Allocation Fund, Wells Fargo International Bond Fund, Wells Fargo Income Plus Fund, Wells Fargo Global Investment Grade Credit Fund, Wells Fargo C&B Mid Cap Value Fund, Wells Fargo Common Stock Fund, Wells Fargo Discovery Fund, Wells Fargo Enterprise Fund, Wells Fargo Opportunity Fund, and Wells Fargo Special Mid Cap Value Fund.
Date of reporting period: September 30, 2020
Table of Contents
| ITEM 1. | REPORT TO STOCKHOLDERS |
Table of Contents

Annual Report
September 30, 2020
Wells Fargo
Index Asset Allocation Fund
Beginning on January 1, 2021, as permitted by new regulations adopted by the Securities and Exchange Commission, paper copies of the Wells Fargo Funds’ annual and semi-annual shareholder reports issued after this date will no longer be sent by mail, unless you specifically request paper copies of the reports. Instead, the reports will be made available on the Funds’ website, and you will be notified by mail each time a report is posted and provided with a website address to access the report.
If you already elected to receive shareholder reports electronically, you will not be affected by this change and you need not take any action. You may elect to receive shareholder reports and other communications from the Fund electronically at any time by contacting your financial intermediary (such as a broker-dealer or bank) or, if you are a direct investor, by calling 1-800-222-8222 or by enrolling at wellsfargo.com/advantagedelivery.
You may elect to receive all future reports in paper free of charge. If you invest through a financial intermediary, you can contact your financial intermediary to request that you continue to receive paper copies of your shareholder reports; if you invest directly with the Fund, you can call 1-800-222-8222. Your election to receive reports in paper will apply to all Wells Fargo Funds held in your account with your financial intermediary or, if you are a direct investor, to all Wells Fargo Funds that you hold.
Table of Contents
|
Reduce clutter. Save trees. |
Sign up for electronic delivery |
The views expressed and any forward-looking statements are as of September 30, 2020, unless otherwise noted, and are those of the Fund’s portfolio managers and/or Wells Fargo Asset Management. Discussions of individual securities, or the markets generally, or any Wells Fargo Fund are not intended as individual recommendations. Future events or results may vary significantly from those expressed in any forward-looking statements. The views expressed are subject to change at any time in response to changing circumstances in the market. Wells Fargo Asset Management and the Fund disclaim any obligation to publicly update or revise any views expressed or forward-looking statements.
INVESTMENT PRODUCTS: NOT FDIC INSURED ◾ NO BANK GUARANTEE ◾ MAY LOSE VALUE
Wells Fargo Index Asset Allocation Fund | 1
Table of Contents
Letter to shareholders (unaudited)

Andrew Owen
President
Wells Fargo Funds
Dear Shareholder:
We are pleased to offer you this annual report for the Wells Fargo Index Asset Allocation Fund for the 12-month period that ended September 30, 2020. Global stock markets saw earlier gains erased in March as governments around the world took unprecedented measures, attempting to stop the spread of COVID-19 at the expense of short-term economic output. However, markets rallied strongly from April on to more than offset those short-term losses as central banks bolstered capital markets and confidence.
For the 12-month period, equities had broadly positive total returns despite intense volatility in March. Non-U.S. developed market equities had weaker performance than emerging market and U.S. stocks. While gains from fixed-income securities were positive, they were more modest than equities. For the period, U.S. stocks, based on the S&P 500 Index,1 gained 15.15%. International stocks, as measured by the MSCI ACWI ex USA Index (Net),2 returned 3.00%, while the MSCI EM Index (Net)3 had stronger performance, with a 10.54% gain. For bond investors, the Bloomberg Barclays U.S. Aggregate Bond Index4 returned 6.98%, the Bloomberg Barclays Global Aggregate ex-USD Index5 gained 5.48%, and the Bloomberg Barclays Municipal Bond Index6 returned 4.09% while the ICE BofA U.S. High Yield Index7 returned 2.30%.
The period began with mixed economic readings.
The fourth quarter of 2019 started on a strong note. U.S.-China trade tensions, which had been building for months, relaxed in October; optimism rose for a U.K. Brexit deal; and macroeconomic data turned positive. The initial estimate of U.S. third-quarter gross domestic product (GDP) growth was a resilient 1.9% annualized rate, while the U.S. unemployment rate fell to a 50-year low of 3.5% in September. However, despite strength among U.S. consumers, business confidence declined while manufacturing activity contracted. Concerned with a potential economic slowdown, the U.S. Federal Reserve (Fed) lowered interest rates a quarter point in late October—its third rate cut in four months. This helped push the S&P 500 Index to an all-time high while emerging market equities rallied and global bonds declined overall, reflecting a broad pickup in risk appetite.
Equity markets continued to rally in November despite ongoing geopolitical risks. Hopes for a U.S.-China trade deal buoyed investor confidence. U.S. business sentiment improved slightly and manufacturing and services activity picked up. While consumer confidence and purchasing managers’ activity rose in the eurozone, China reported weakening manufacturing and consumer data. Bond yields rose marginally, leading to slightly negative returns for global government and investment-grade corporate bonds.
| 1 | The S&P 500 Index consists of 500 stocks chosen for market size, liquidity, and industry group representation. It is a market-value-weighted index with each stock’s weight in the index proportionate to its market value. You cannot invest directly in an index. |
| 2 | The Morgan Stanley Capital International (MSCI) All Country World Index (ACWI) ex USA Index (Net) is a free-float-adjusted market-capitalization-weighted index that is designed to measure the equity market performance of developed and emerging markets, excluding the United States. Source: MSCI. MSCI makes no express or implied warranties or representations and shall have no liability whatsoever with respect to any MSCI data contained herein. The MSCI data may not be further redistributed or used as a basis for other indices or any securities or financial products. This report is not approved, reviewed, or produced by MSCI. You cannot invest directly in an index. |
| 3 | The MSCI Emerging Markets (EM) Index (Net) is a free-float-adjusted market-capitalization-weighted index that is designed to measure equity market performance of emerging markets. You cannot invest directly in an index. |
| 4 | The Bloomberg Barclays U.S. Aggregate Bond Index is a broad-based benchmark that measures the investment-grade, U.S. dollar-denominated, fixed-rate taxable bond market, including Treasuries, government-related and corporate securities, mortgage-backed securities (agency fixed-rate and hybrid adjustable-rate mortgage pass-throughs), asset-backed securities, and commercial mortgage-backed securities. You cannot invest directly in an index. |
| 5 | The Bloomberg Barclays Global Aggregate ex-USD Index is an unmanaged index that provides a broad-based measure of the global investment-grade fixed-income markets excluding the U.S. dollar-denominated debt market. You cannot invest directly in an index. |
| 6 | The Bloomberg Barclays Municipal Bond Index is an unmanaged index composed of long-term tax-exempt bonds with a minimum credit rating of Baa. You cannot invest directly in an index. |
| 7 | The ICE BofA U.S. High Yield Index is a market-capitalization-weighted index of domestic and Yankee high-yield bonds. The index tracks the performance of high-yield securities traded in the U.S. bond market. You cannot invest directly in an index. Copyright 2020. ICE Data Indices, LLC. All rights reserved. |
2 | Wells Fargo Index Asset Allocation Fund
Table of Contents
Letter to shareholders (unaudited)
Financial markets ended 2019 with a boost from the U.S. and China accord on a Phase One trade deal. That, along with the landslide win by the pro-Brexit U.K. Conservative Party in a national election and ongoing central bank support, gave investors greater confidence. U.S. economic indicators were generally positive, with the exception of manufacturing activity and business confidence. Consumer confidence was resilient, fed by a robust labor market, tame inflation, and lower interest rates, which boosted housing affordability and stimulated homebuyer activity. The impeachment of President Trump had little impact on the markets. Meanwhile, slowing Chinese economic activity, partly attributable to the trade war, led to further government stimulus at year-end through lower reserve ratios, allowing banks to lend more money.
The year-end rally continued in early January 2020. However, capital market volatility spiked in late January on concerns over the potential impact of COVID-19 on the global economy and stock markets. With sentiment somewhat souring, perceived safe havens did well in January. The U.S. dollar and Japanese yen both rose and government bonds outperformed equities. While the S&P 500 Index held its ground, emerging market equities tumbled, including those in Asia.
In February, COVID-19 became the major market focus. Fears of the virus’s impact on Chinese and global growth led to expectations of increased global central bank monetary policy support. That led the 10-year U.S. Treasury yield to fall to an all-time low of 1.1%. Although equity markets initially shrugged off concerns about the outbreak, focusing instead on strong fourth-quarter earnings and improving business confidence in January, market sentiment turned sharply lower and the S&P 500 Index lost 8.2% for the month. Oil prices tumbled as Russia and the Organization of the Petroleum Exporting Countries compounded a major decline in oil demand with a brutal price war, partly aimed at dissuading further U.S. shale production, causing the price of West Texas Intermediate crude oil to plummet.
The global spread of COVID-19 led country after country to clamp down on social and business-related activity in order to contain the virus from causing even greater devastation and overwhelming health care systems. This abrupt stoppage of economic activity led to the sharp deceleration of global output, sending economies into a deep contraction. Central banks responded swiftly, slashing interest rates and expanding quantitative easing programs to restore liquidity and confidence to the markets. In the U.S., the Fed introduced several new lending programs, funding investment-grade bonds, money market mutual funds, and commercial paper while purchasing Treasuries, mortgage-backed securities, and overnight repurchase agreements. Meanwhile, stock markets tumbled quickly into a bear market, ending the longest bull stock market in U.S. history.
Markets rebounded strongly in April, fueled by unprecedented government and central bank stimulus measures. The U.S. economy contracted by an annualized 5.0% pace in the first quarter, with 30 million new unemployment insurance claims in six weeks. In the eurozone, first-quarter real GDP shrank 3.8%, with the composite April Flash Purchasing Managers’ Index (PMI), a monthly survey of purchasing managers, falling to an all-time low of 13.5. The European Central Bank expanded its quantitative easing to include the purchase of additional government bonds of countries with the greatest virus-related need, including Italy and Spain. China’s first-quarter GDP fell by 6.8% year over year. However, retail sales, production, and investment showed signs of recovery. Extreme oil-price volatility continued as global supply far exceeded demand.
The global equity market rebound continued in May, with widespread strong monthly gains. Investors regained confidence on reports of early signs of success in human trials of a COVID-19 vaccine. Growth stocks continued to outperform value stocks while returns on global government bonds were generally flat. In the U.S., a gap grew between the stock market rebound and devastating economic data points, including an April unemployment rate of 14.7%, the highest level since World War II. PMIs reflected
“The global spread of COVID-19 led country after country to clamp down on social and business related activity in order to contain the virus from causing even greater devastation and overwhelming health care systems.”
Wells Fargo Index Asset Allocation Fund | 3
Table of Contents
Letter to shareholders (unaudited)
“The stock market continued to rally in August despite concerns over rising numbers of COVID-19 cases in the United States and several European countries, including France and Spain, as well as the expiration of the $600 weekly bonus unemployment benefit at the end of July.”
weakening activity in May in both the manufacturing and services sectors. U.S. corporate earnings reports indicated a 14% year-over-year contraction in earnings from the first quarter of 2019. However, high demand for technology, driven by remote activity, supported robust information technology sector earnings, which helped drive major technology stocks higher.
Financial markets posted widely positive returns in June despite ongoing economic weakness and high levels of uncertainty on the containment of COVID-19 and the timing of an effective vaccine. There were hopeful signs as economies reopened, with both U.S. and U.K. retail sales rebounding sharply in May. However, year over year, sales remained depressed. Vitally important to market sentiment was the ongoing commitment by central banks globally to do all they could to provide economic support through liquidity and low borrowing costs. U.S. economic activity was aided by one-time $1,200 stimulus checks and $600 bonus weekly unemployment benefits that expired at the end of July. However, unemployment remained historically high, easing somewhat from 14.7% in April to 11.1% in June. By month-end, numerous states reported increases of COVID-19 cases. China’s economic recovery picked up momentum in June, though it remained far from a full recovery.
July was a broadly positive month for both global equities and fixed income. However, economic data and a resurgence of COVID-19 cases pointed to the vulnerability of the global economy and the ongoing imperative to regain control of the pandemic. Second-quarter GDP shrank from the previous quarter by 9.5% and 12.1% in the U.S. and the eurozone, respectively. In contrast, China reported a 3.2% year-over-year expansion in its second-quarter GDP. U.S. unemployment remained high despite adding 1.8 million jobs in July, with a double-digit jobless rate persisting. However, manufacturing activity grew in both the U.S. and the eurozone. In Asia, while China’s manufacturing sector continued to expand, activity in Japan and South Korea contracted. In July, a rising concern was the rapid and broad reemergence of COVID-19 infections.
The stock market continued to rally in August despite concerns over rising numbers of COVID-19 cases in the United States and several European countries, including France and Spain, as well as the expiration of the $600 weekly bonus unemployment benefit at the end of July. U.S. stocks had strong monthly gains, led by the FAANG stocks—Facebook, Apple, Amazon, Netflix, and Google (Alphabet)—which dominate these indices and continued to rally. U.S. stocks generally surpassed other broadly positive global equity performance while fixed-income market monthly returns were broadly flat. Generally stronger-than-expected second-quarter earnings boosted investor sentiment along with the Fed’s announcement of a policy shift that will likely lead to longer-term low interest rates and supportive monetary policy. The U.S. Flash PMIs for both manufacturing and services beat expectations while U.S. housing market indicators were strong. In Europe, retail sales expanded and consumer confidence remained steady. China’s economy continued its fairly steady expansion. Overall, developed markets performed better than emerging market equities for the month of August as people took comfort in better-known equities in perceived safer markets.
Stocks grew more volatile in September on mixed economic data. U.S. PMIs showed solid growth in economic activity in both manufacturing and services. However, six months after the bottom fell out of the labor market in the early spring, only half of the 22 million jobs lost had returned. The U.S. unemployment rate fell to 7.9% in September, the fifth straight month of improvement but far higher than the 3.5% pre-COVID-19 rate. Only 661,000 jobs were added for the month, down from 1.5 million in August. Meanwhile, a reported 2.3 million people have given up looking for work. With U.S. Congress failing to pass further fiscal relief and uncertainties surrounding a possible vaccine, doubts crept back into the financial markets. In the U.K., a lack of progress in Brexit talks with the European Union weighed on markets. China’s economy picked up steam, however, with growth fueled by increased global demand, and China’s service sector had its strongest PMI reading in seven years.
4 | Wells Fargo Index Asset Allocation Fund
Table of Contents
Letter to shareholders (unaudited)
Don’t let short-term uncertainty derail long-term investment goals.
Periods of investment uncertainty can present challenges, but experience has taught us that maintaining long-term investment goals can be an effective way to plan for the future. To help you create a sound strategy based on your personal goals and risk tolerance, Wells Fargo Funds offers more than 100 mutual funds spanning a wide range of asset classes and investment styles. Although diversification cannot guarantee an investment profit or prevent losses, we believe it can be an effective way to manage investment risk and potentially smooth out overall portfolio performance. We encourage investors to know their investments and to understand that appropriate levels of risk-taking may unlock opportunities.
Thank you for choosing to invest with Wells Fargo Funds. We appreciate your confidence in us and remain committed to helping you meet your financial needs.
Sincerely,

Andrew Owen
President
Wells Fargo Funds
|
For further information about your Fund, contact your investment professional, visit our website at wfam.com, or call us directly at 1-800-222-8222. |
Notice to Shareholders
At a meeting held on August 10-12, 2020, the Board of Trustees of the Fund approved a change to the Fund’s automatic conversion feature for Class C shares in order to shorten the required holding period from 10 to 8 years. As a result, on a monthly basis beginning November 5, 2020, Class C shares will convert automatically into Class A shares 8 years after the initial date of purchase or, if you acquired your Class C shares through an exchange or conversion from another share class, 8 years after the date you acquired your Class C shares. When Class C shares that you acquired through a purchase or exchange convert, any other Class C shares that you purchased with reinvested dividends and distributions also will convert into Class A shares on a pro rata basis.
Please note that a shorter holding period may apply depending on your intermediary. Please see “Appendix A—Sales Charge Reductions and Waivers for Certain Intermediaries” in the Fund’s prospectus for further information.
Wells Fargo Index Asset Allocation Fund | 5
Table of Contents
Letter to shareholders (unaudited)
Notice to Shareholders
Preparing for LIBOR Transition
The global financial industry is preparing to transition away from the London Interbank Offered Rate (LIBOR), a key benchmark interest rate, to new alternative rates. LIBOR underpins more than $350 trillion of financial contracts. It is the benchmark rate for a wide spectrum of products ranging from residential mortgages to corporate bonds to derivatives. Regulators have called for a market-wide transition away from LIBOR to successor reference rates by the end of 2021, which requires proactive steps be taken by issuers, counterparties, and asset managers to identify impacted products and adopt new reference rates.
The Fund holds at least one security that uses LIBOR as a floating reference rate and has a maturity date after 12-31-2021.
Although the transition process away from LIBOR has become increasingly well-defined in advance of the anticipated discontinuation date, there remains uncertainty regarding the nature of successor reference rates, and any potential effects of the transition away from LIBOR on investment instruments that use it as a benchmark rate. The transition process may result in, among other things, increased volatility or illiquidity in markets for instruments that currently rely on LIBOR and could negatively impact the value of certain instruments held by the Fund.
Wells Fargo Asset Management is monitoring LIBOR exposure closely and has put resources and controls in place to manage this transition effectively. The Fund’s portfolio management team is evaluating LIBOR holdings to understand what happens to those securities when LIBOR ceases to exist, including examining security documentation to identify the presence or absence of fallback language identifying a replacement rate to LIBOR.
While the pace of transition away from LIBOR will differ by asset class and investment strategy, the portfolio management team will monitor market conditions for those holdings to identify and mitigate deterioration or volatility in pricing and liquidity and ensure appropriate actions are taken in a timely manner.
Further information regarding the potential risks associated with the discontinuation of LIBOR can be found in the Fund’s Statement of Additional Information.
6 | Wells Fargo Index Asset Allocation Fund
Table of Contents
This page is intentionally left blank.
Table of Contents
Performance highlights (unaudited)
Investment objective
The Fund seeks long-term total return, consisting of capital appreciation and current income.
Manager
Wells Fargo Funds Management, LLC
Subadviser
Wells Capital Management Incorporated
Portfolio managers
Kandarp R. Acharya, CFA®‡, FRM
Petros N. Bocray, CFA®‡, FRM
Christian L. Chan, CFA®‡
Average annual total returns (%) as of September 30, 2020
| Including sales charge | Excluding sales charge | Expense ratios1 (%) | ||||||||||||||||||||||||||||||||
| Inception date | 1 year | 5 year | 10 year | 1 year | 5 year | 10 year | Gross | Net2 | ||||||||||||||||||||||||||
| Class A (SFAAX) | 11-13-1986 | 6.59 | 8.30 | 10.14 | 13.08 | 9.58 | 10.80 | 1.11 | 1.08 | |||||||||||||||||||||||||
| Class C (WFALX) | 4-1-1998 | 11.22 | 8.76 | 9.96 | 12.22 | 8.76 | 9.96 | 1.86 | 1.83 | |||||||||||||||||||||||||
| Administrator Class (WFAIX) | 11-8-1999 | – | – | – | 13.26 | 9.78 | 11.04 | 1.03 | 0.90 | |||||||||||||||||||||||||
| Institutional Class (WFATX)3 | 10-31-2016 | – | – | – | 13.44 | 9.91 | 11.10 | 0.78 | 0.75 | |||||||||||||||||||||||||
| Index Asset Allocation Blended Index4 | – | – | – | – | 13.17 | 10.25 | 10.92 | – | – | |||||||||||||||||||||||||
| Bloomberg Barclays U.S. Treasury Index5 | – | – | – | �� | – | 8.04 | 3.75 | 3.15 | – | – | ||||||||||||||||||||||||
| S&P 500 Index6 | – | – | – | – | 15.15 | 14.15 | 13.74 | – | – | |||||||||||||||||||||||||
Figures quoted represent past performance, which is no guarantee of future results, and do not reflect taxes that a shareholder may pay on an investment in a fund. Investment return and principal value of an investment will fluctuate so that an investor’s shares, when redeemed, may be worth more or less than their original cost. Performance shown without sales charges would be lower if sales charges were reflected. Current performance may be lower or higher than the performance data quoted, which assumes the reinvestment of dividends and capital gains. Current month-end performance is available on the Fund’s website, wfam.com.
Index returns do not include transaction costs associated with buying and selling securities, any mutual fund fees or expenses, or any taxes. It is not possible to invest directly in an index.
For Class A shares, the maximum front-end sales charge is 5.75%. For Class C shares, the maximum contingent deferred sales charge is 1.00%. Performance including a contingent deferred sales charge assumes the sales charge for the corresponding time period. Administrator Class and Institutional Class shares are sold without a front-end sales charge or contingent deferred sales charge.
Balanced funds may invest in stocks and bonds. Stock values fluctuate in response to the activities of individual companies and general market and economic conditions. Bond values fluctuate in response to the financial condition of individual issuers, general market and economic conditions, and changes in interest rates. Changes in market conditions and government policies may lead to periods of heightened volatility in the bond market and reduced liquidity for certain bonds held by the Fund. In general, when interest rates rise, bond values fall and investors may lose principal value. Interest rate changes and their impact on the Fund and its share price can be sudden and unpredictable. The use of derivatives may reduce returns and/or increase volatility. Consult the Fund’s prospectus for additional information on these and other risks.
Please see footnotes on page 9.
8 | Wells Fargo Index Asset Allocation Fund
Table of Contents
Performance highlights (unaudited)
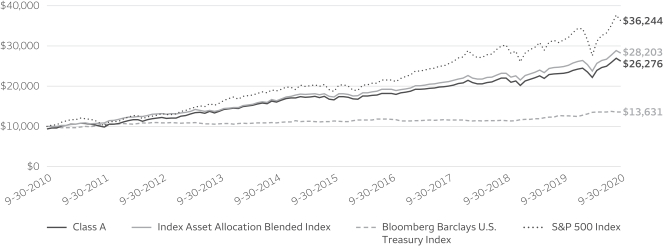
| Growth of $10,000 investment as of September 30, 20207 |
|
| ‡ | CFA® and Chartered Financial Analyst® are trademarks owned by CFA Institute. |
| 1 | Reflects the expense ratios as stated in the most recent prospectuses. The expense ratios shown are subject to change and may differ from the annualized expense ratios shown in the financial highlights of this report. |
| 2 | The manager has contractually committed through January 31, 2021, to waive fees and/or reimburse expenses to the extent necessary to cap total annual fund operating expenses after fee waivers at 1.08% for Class A, 1.83% for Class C, 0.90% for Administrator Class, and 0.75% for Institutional Class. Brokerage commissions, stamp duty fees, interest, taxes, acquired fund fees and expenses (if any), and extraordinary expenses are excluded from the expense caps. Prior to or after the commitment expiration date, the caps may be increased or the commitment to maintain the caps may be terminated only with the approval of the Board of Trustees. Without these caps, the Fund’s returns would have been lower. The expense ratio paid by an investor is the net expense ratio (the total annual fund operating expenses after fee waivers) as stated in the prospectuses. |
| 3 | Historical performance shown for the Institutional Class shares prior to their inception reflects the performance of the Administrator Class shares, and is not adjusted to reflect the expenses of the Institutional Class shares. If these expenses had been included, returns for the Institutional Class shares would be higher. |
| 4 | Source: Wells Fargo Funds Management, LLC. Index Asset Allocation Blended Index is composed 60% of the S&P 500 Index and 40% of the Bloomberg Barclays U.S. Treasury Index. Prior to April 1, 2015, the Index Asset Allocation Blended Index was composed 60% of the S&P 500 Index and 40% of the Bloomberg Barclays U.S. Treasury 20+ Year Index. You cannot invest directly in an index. |
| 5 | The Bloomberg Barclays U.S. Treasury Index is an unmanaged index of prices of U.S. Treasury bonds with maturities of 1 to 30 years. You cannot invest directly in an index. |
| 6 | The S&P 500 Index consists of 500 stocks chosen for market size, liquidity, and industry group representation. It is a market-value weighted index with each stock’s weight in the index proportionate to its market value. You cannot invest directly in an index. |
| 7 | The chart compares the performance of Class A shares for the most recent ten years with the Index Asset Allocation Blended Index, Bloomberg Barclays U.S. Treasury Index, and the S&P 500 Index. The chart assumes a hypothetical investment of $10,000 in Class A shares and reflects all operating expenses and assumes the maximum initial sales charge of 5.75%. |
| 8 | The Morgan Stanley Capital International (MSCI) All Country World Index (ACWI) ex USA Index (Net) is a free-float-adjusted market-capitalization-weighted index that is designed to measure the equity market performance of developed and emerging markets, excluding the U.S. You cannot invest directly in an index. |
| 9 | The Bloomberg Barclays 20+ Year U.S. Treasury Index is an unmanaged index composed of securities in the U.S. Treasury Index with maturities of 20 years or greater. You cannot invest directly in an index. |
| 10 | The ten largest holdings, excluding cash, cash equivalents and any money market funds, are calculated based on the value of the investments divided by total net assets of the Fund. Holdings are subject to change and may have changed since the date specified. |
| 11 | The effective allocation reflects the effect of the tactical futures overlay that may be in place. Effective cash, if any, represents the net offset to such future positions. Effective allocations are subject to change and may have changed since the date specified. |
Wells Fargo Index Asset Allocation Fund | 9
Table of Contents
Performance highlights (unaudited)
MANAGER’S DISCUSSION
Fund highlights
| ∎ | The Fund (Class A, excluding sales charges) underperformed its benchmark, the Index Asset Allocation Blended Index, for the 12-month period that ended September 30, 2020. |
| ∎ | Tactical defensive positions detracted from relative performance late in 2019. |
| ∎ | The Fund’s tactical asset allocation overlay, which is implemented with liquid futures contracts, contributed to performance during the period. |
| ∎ | The Fund’s stock allocation performed in line with its respective benchmark, the S&P 500 Index, while the Fund’s bond allocation outperformed its respective benchmark, the Bloomberg Barclays U.S. Treasury Index. |
Equity markets posted more-than-decent gains during the 12-month period, despite the sharp sell-off in the first quarter. After a relatively quiet start to the year, mounting fears of the rapid spread of the coronavirus and the economic impact of shutdowns in the U.S. and across the globe sent markets reeling in February and March. In fact, markets experienced their fastest bear market in history. The subsequent recovery, which picked up steam in the second quarter, was just as remarkable. After a miserable first quarter, equity markets posted their strongest second-quarter gains in more than 20 years. During the 12-month period as a whole, U.S. equity markets—as measured by the S&P 500 Index—rose by 15.15%. International equity returns, meanwhile, were more muted. The MSCI ACWI ex USA Index (Net)8—a measure of international developed and emerging market stocks—gained 3.00% during the same period.
Longer-duration U.S. government bond prices rose sharply amid a precipitous decline in yields. For the 12-month period, the yield on 30-year U.S. Treasury bonds fell by 0.65%, from 2.11% to 1.46%, while yields on 10-year U.S. Treasury notes fell by 0.98%, from 1.67% to 0.69%. The Bloomberg Barclays U.S. Treasury Index, a broad measure of U.S. Treasury notes and bonds, gained 8.04% during the 12-month period, while the Bloomberg Barclays U.S. Treasury 20+ Year Index9 returned 16.62%.
| Ten largest holdings (%) as of September 30, 202010 | ||||
Apple Incorporated | 4.01 | |||
Microsoft Corporation | 3.42 | |||
Amazon.com Incorporated | 2.88 | |||
Facebook Incorporated Class A | 1.37 | |||
Alphabet Incorporated Class A | 0.95 | |||
Alphabet Incorporated Class C | 0.93 | |||
Berkshire Hathaway Incorporated Class B | 0.91 | |||
Johnson & Johnson | 0.85 | |||
The Procter & Gamble Company | 0.75 | |||
Visa Incorporated Class A | 0.72 | |||
Tactical asset allocation shifts contributed to performance during the 12-month period.
The Fund’s stock holdings seek to replicate the holdings of the S&P 500 Index, while its bond holdings seek to replicate the holdings of the Bloomberg Barclays U.S. Treasury Index. The Fund’s neutral target allocation is 60% stocks and 40% bonds. As of fiscal year-end, the Fund had an effective target allocation of 60% stocks, 34% bonds, and 6% effective cash.
During the period, the portfolio management team implemented tactical shifts between stocks and bonds in order to adjust the Fund’s effective allocations based on the relative attractiveness of the two asset classes. The Fund’s positioning can be divided into two periods: the final three months of 2019 and the first nine months of 2020.
| Allocation (%) as of September 30, 2020 | ||||||||
| Neutral Allocation | Effective Allocation11 | |||||||
Bonds | 40 | 34 | ||||||
Stocks | 60 | 60 | ||||||
Effective Cash | 0 | 6 | ||||||
During the fourth quarter of 2019, the team maintained a defensively tilted posture, which was initiated in the summer of 2019. Specifically, the team started the quarter with a short position in S&P 500 futures and a long position in 10-year U.S. Treasury futures. The team closed out the short S&P 500 futures position in October 2019 and also trimmed the long 10-year U.S. Treasury position toward the end of November.
The tactical positions detracted from performance in the last three months of 2019 amid a rise in risk markets.
In January 2020, as bond prices rose, the team decided to lock in some gains by closing out its long exposure to 10-year U.S. Treasury futures. After a brief period in which the team maintained a neutral allocation between stocks and bonds, we found an opportunity to add risk to the portfolio amid the height of the COVID-19-induced sell-off. Specifically, in mid-March, the team
Please see footnotes on page 9.
10 | Wells Fargo Index Asset Allocation Fund
Table of Contents
Performance highlights (unaudited)
initiated a long position in S&P 500 futures, which was held until July when the team sold the position at a handsome profit. The team reestablished a long position in August along with a short position in the Ultra U.S. Treasury futures (the longest-dated U.S. Treasury futures traded on the Chicago Mercantile Exchange). The team closed the long S&P 500 futures position toward the end of September.
The Fund’s effective allocation is determined by a combination of inputs from multiple quantitative and qualitative factors. As of the close of the period, relative to its benchmark, the Fund maintained a neutral weight to stocks and an underweight to bonds. All of the changes to the effective asset allocation were implemented with liquid futures contracts.
On the whole, the tactical positions implemented during the 12-month period contributed approximately 0.70% to the performance of the overall Fund.
Looking ahead, the team is cautiously optimistic.
Our macroeconomic outlook is best defined as cautious optimism. There is a massive amount of uncertainty surrounding the virus, as well as the upcoming U.S. elections, that this view is subject to change quickly. On the positive side of the ledger, coordinated global policy action has released trillions of dollars into the market, which is one reason we believe it is unlikely that we will hit the March 2020 market lows again. From an investor psychology aspect, we suspect that even if a significant second wave of the coronavirus strikes, the economy now has a path to follow forward and that markets should not behave as negatively as they did in March. However, the “easy money” off the low may have been realized; upside from here should be limited. We have moved from a market-wide beta-driven market recovery to more of a sector- and issuer-driven market. Market participants went from fear of recession to the reality of recession faster than at any other time in history. We find it reasonable to conclude that the recovery should be in proportion to the decline.
We will continue to monitor the situation very carefully and stand ready to adjust exposures as needed.
Wells Fargo Index Asset Allocation Fund | 11
Table of Contents
As a shareholder of the Fund, you incur two types of costs: (1) transaction costs, including sales charges (loads) on purchase payments and contingent deferred sales charges (if any) on redemptions and (2) ongoing costs, including management fees, distribution (12b-1) and/or shareholder servicing fees, and other Fund expenses. This example is intended to help you understand your ongoing costs (in dollars) of investing in the Fund and to compare these costs with the ongoing costs of investing in other mutual funds.
The example is based on an investment of $1,000 invested at the beginning of the six-month period and held for the entire period from April 1, 2020 to September 30, 2020.
Actual expenses
The “Actual” line of the table below provides information about actual account values and actual expenses. You may use the information in this line, together with the amount you invested, to estimate the expenses that you paid over the period. Simply divide your account value by $1,000 (for example, an $8,600 account value divided by $1,000 = 8.6), then multiply the result by the number in the “Actual” line under the heading entitled “Expenses paid during period” for your applicable class of shares to estimate the expenses you paid on your account during this period.
Hypothetical example for comparison purposes
The “Hypothetical” line of the table below provides information about hypothetical account values and hypothetical expenses based on the Fund’s actual expense ratio and an assumed rate of return of 5% per year before expenses, which is not the Fund’s actual return. The hypothetical account values and expenses may not be used to estimate the actual ending account balance or expenses you paid for the period. You may use this information to compare the ongoing costs of investing in the Fund and other funds. To do so, compare this 5% hypothetical example with the 5% hypothetical examples that appear in the shareholder reports of the other funds.
Please note that the expenses shown in the table are meant to highlight your ongoing costs only and do not reflect any transactional costs, such as sales charges (loads) and contingent deferred sales charges. Therefore, the “Hypothetical” line of the table is useful in comparing ongoing costs only and will not help you determine the relative total costs of owning different funds. In addition, if these transactional costs were included, your costs would have been higher.
| Beginning account value 4-1-2020 | Ending account value 9-30-2020 | Expenses paid during the period1 | Annualized net expense ratio | |||||||||||||
Class A | ||||||||||||||||
Actual | $ | 1,000.00 | $ | 1,183.83 | $ | 5.90 | 1.08 | % | ||||||||
Hypothetical (5% return before expenses) | $ | 1,000.00 | $ | 1,019.66 | $ | 5.46 | 1.08 | % | ||||||||
Class C | ||||||||||||||||
Actual | $ | 1,000.00 | $ | 1,179.32 | $ | 10.00 | 1.83 | % | ||||||||
Hypothetical (5% return before expenses) | $ | 1,000.00 | $ | 1,015.89 | $ | 9.25 | 1.83 | % | ||||||||
Administrator Class | ||||||||||||||||
Actual | $ | 1,000.00 | $ | 1,184.90 | $ | 4.93 | 0.90 | % | ||||||||
Hypothetical (5% return before expenses) | $ | 1,000.00 | $ | 1,020.56 | $ | 4.56 | 0.90 | % | ||||||||
Institutional Class | ||||||||||||||||
Actual | $ | 1,000.00 | $ | 1,185.66 | $ | 4.11 | 0.75 | % | ||||||||
Hypothetical (5% return before expenses) | $ | 1,000.00 | $ | 1,021.31 | $ | 3.80 | 0.75 | % | ||||||||
| 1 | Expenses paid is equal to the annualized net expense ratio of each class multiplied by the average account value over the period, multiplied by the number of days in the most recent fiscal half-year divided by the number of days in the fiscal year (to reflect the one-half-year period). |
12 | Wells Fargo Index Asset Allocation Fund
Table of Contents
Portfolio of investments—September 30, 2020
| Interest rate | Maturity date | Principal | Value | |||||||||||||
| Agency Securities: 0.00% | ||||||||||||||||
FNMA Series 2002-T1 Class A4 | 9.50 | % | 11-25-2031 | $ | 29,884 | $ | 36,944 | |||||||||
|
| |||||||||||||||
Total Agency Securities (Cost $29,884) | 36,944 | |||||||||||||||
|
| |||||||||||||||
| Shares | ||||||||||||||||
| Common Stocks: 60.05% | ||||||||||||||||
Communication Services: 6.50% | ||||||||||||||||
| Diversified Telecommunication Services: 0.99% | ||||||||||||||||
AT&T Incorporated | 226,935 | 6,469,917 | ||||||||||||||
CenturyLink Incorporated | 31,346 | 316,281 | ||||||||||||||
Verizon Communications Incorporated | 131,489 | 7,822,281 | ||||||||||||||
| 14,608,479 | ||||||||||||||||
|
| |||||||||||||||
| Entertainment: 1.24% | ||||||||||||||||
Activision Blizzard Incorporated | 24,458 | 1,979,875 | ||||||||||||||
Electronic Arts Incorporated † | 9,157 | 1,194,164 | ||||||||||||||
Live Nation Entertainment Incorporated † | 4,502 | 242,568 | ||||||||||||||
Netflix Incorporated † | 14,068 | 7,034,422 | ||||||||||||||
Take-Two Interactive Software Incorporated † | 3,611 | 596,609 | ||||||||||||||
The Walt Disney Company | 57,705 | 7,160,036 | ||||||||||||||
| 18,207,674 | ||||||||||||||||
|
| |||||||||||||||
| Interactive Media & Services: 3.32% | ||||||||||||||||
Alphabet Incorporated Class A † | 9,569 | 14,024,326 | ||||||||||||||
Alphabet Incorporated Class C † | 9,346 | 13,734,882 | ||||||||||||||
Facebook Incorporated Class A † | 76,885 | 20,136,182 | ||||||||||||||
Twitter Incorporated † | 25,089 | 1,116,461 | ||||||||||||||
| 49,011,851 | ||||||||||||||||
|
| |||||||||||||||
| Media: 0.81% | ||||||||||||||||
Charter Communications Incorporated Class A † | 4,738 | 2,958,123 | ||||||||||||||
Comcast Corporation Class A | 144,213 | 6,671,293 | ||||||||||||||
Discovery Communications Incorporated Class C † | 9,804 | 192,158 | ||||||||||||||
Discovery Incorporated Class A † | 5,087 | 110,744 | ||||||||||||||
DISH Network Corporation Class A † | 7,846 | 227,769 | ||||||||||||||
Fox Corporation Class A | 11,000 | 306,130 | ||||||||||||||
Fox Corporation Class B | 5,006 | 140,018 | ||||||||||||||
Interpublic Group of Companies Incorporated | 12,356 | 205,975 | ||||||||||||||
News Corporation Class A | 12,330 | 172,867 | ||||||||||||||
News Corporation Class B | 3,850 | 53,823 | ||||||||||||||
Omnicom Group Incorporated | 6,817 | 337,442 | ||||||||||||||
ViacomCBS Incorporated Class B | 17,824 | 499,250 | ||||||||||||||
| 11,875,592 | ||||||||||||||||
|
| |||||||||||||||
| Wireless Telecommunication Services: 0.14% | ||||||||||||||||
T-Mobile US Incorporated † | 18,441 | 2,108,913 | ||||||||||||||
|
| |||||||||||||||
Consumer Discretionary: 6.93% | ||||||||||||||||
| Auto Components: 0.07% | ||||||||||||||||
Aptiv plc | 8,622 | 790,465 | ||||||||||||||
BorgWarner Incorporated | 6,563 | 254,251 | ||||||||||||||
| 1,044,716 | ||||||||||||||||
|
| |||||||||||||||
The accompanying notes are an integral part of these financial statements.
Wells Fargo Index Asset Allocation Fund | 13
Table of Contents
Portfolio of investments—September 30, 2020
| Shares | Value | |||||||||||||||
| Automobiles: 0.14% | ||||||||||||||||
Ford Motor Company | 124,089 | $ | 826,433 | |||||||||||||
General Motors Company | 39,904 | 1,180,759 | ||||||||||||||
| 2,007,192 | ||||||||||||||||
|
| |||||||||||||||
| Distributors: 0.05% | ||||||||||||||||
Genuine Parts Company | 4,574 | 435,308 | ||||||||||||||
LKQ Corporation † | 8,832 | 244,911 | ||||||||||||||
| 680,219 | ||||||||||||||||
|
| |||||||||||||||
| Hotels, Restaurants & Leisure: 0.99% | ||||||||||||||||
Carnival Corporation | 16,476 | 250,106 | ||||||||||||||
Chipotle Mexican Grill Incorporated † | 891 | 1,108,146 | ||||||||||||||
Darden Restaurants Incorporated | 4,162 | 419,280 | ||||||||||||||
Domino’s Pizza Incorporated | 1,247 | 530,324 | ||||||||||||||
Hilton Worldwide Holdings Incorporated | 8,749 | 746,465 | ||||||||||||||
Las Vegas Sands Corporation | 10,428 | 486,570 | ||||||||||||||
Marriott International Incorporated Class A | 8,417 | 779,246 | ||||||||||||||
McDonald’s Corporation | 23,598 | 5,179,525 | ||||||||||||||
MGM Resorts International | 12,986 | 282,446 | ||||||||||||||
Norwegian Cruise Line Holdings Limited †« | 8,782 | 150,260 | ||||||||||||||
Royal Caribbean Cruises Limited | 5,650 | 365,725 | ||||||||||||||
Starbucks Corporation | 37,057 | 3,183,937 | ||||||||||||||
Wynn Resorts Limited | 3,071 | 220,529 | ||||||||||||||
Yum! Brands Incorporated | 9,573 | 874,015 | ||||||||||||||
| 14,576,574 | ||||||||||||||||
|
| |||||||||||||||
| Household Durables: 0.25% | ||||||||||||||||
D.R. Horton Incorporated | 10,509 | 794,796 | ||||||||||||||
Garmin Limited | 4,736 | 449,257 | ||||||||||||||
Leggett & Platt Incorporated | 4,182 | 172,173 | ||||||||||||||
Lennar Corporation Class A | 8,728 | 712,903 | ||||||||||||||
Mohawk Industries Incorporated † | 1,895 | 184,933 | ||||||||||||||
Newell Rubbermaid Incorporated | 12,006 | 206,023 | ||||||||||||||
NVR Incorporated † | 111 | 453,226 | ||||||||||||||
Pulte Group Incorporated | 8,500 | 393,465 | ||||||||||||||
Whirlpool Corporation | 1,966 | 361,528 | ||||||||||||||
| 3,728,304 | ||||||||||||||||
|
| |||||||||||||||
| Internet & Direct Marketing Retail: 3.16% | ||||||||||||||||
Amazon.com Incorporated † | 13,479 | 42,441,732 | ||||||||||||||
Booking Holdings Incorporated † | 1,297 | 2,218,752 | ||||||||||||||
eBay Incorporated | 20,963 | 1,092,172 | ||||||||||||||
Etsy Incorporated † | 3,792 | 461,221 | ||||||||||||||
Expedia Group Incorporated | 4,311 | 395,276 | ||||||||||||||
| 46,609,153 | ||||||||||||||||
|
| |||||||||||||||
| Leisure Products: 0.02% | ||||||||||||||||
Hasbro Incorporated | 4,088 | 338,159 | ||||||||||||||
|
| |||||||||||||||
| Multiline Retail: 0.33% | ||||||||||||||||
Dollar General Corporation | 7,891 | 1,654,111 | ||||||||||||||
Dollar Tree Incorporated † | 7,504 | 685,415 | ||||||||||||||
Target Corporation | 15,900 | 2,502,978 | ||||||||||||||
| 4,842,504 | ||||||||||||||||
|
| |||||||||||||||
The accompanying notes are an integral part of these financial statements.
14 | Wells Fargo Index Asset Allocation Fund
Table of Contents
Portfolio of investments—September 30, 2020
| Shares | Value | |||||||||||||||
| Specialty Retail: 1.49% | ||||||||||||||||
Advance Auto Parts Incorporated | 2,190 | $ | 336,165 | |||||||||||||
AutoZone Incorporated † | 741 | 872,631 | ||||||||||||||
Best Buy Company Incorporated | 7,309 | 813,419 | ||||||||||||||
CarMax Incorporated † | 5,167 | 474,899 | ||||||||||||||
L Brands Incorporated | 7,335 | 233,326 | ||||||||||||||
Lowe’s Companies Incorporated | 23,949 | 3,972,181 | ||||||||||||||
O’Reilly Automotive Incorporated † | 2,346 | 1,081,694 | ||||||||||||||
Ross Stores Incorporated | 11,316 | 1,056,009 | ||||||||||||||
The Gap Incorporated | 6,529 | 111,189 | ||||||||||||||
The Home Depot Incorporated | 34,187 | 9,494,072 | ||||||||||||||
The TJX Companies Incorporated | 38,036 | 2,116,703 | ||||||||||||||
Tiffany & Company | 3,439 | 398,408 | ||||||||||||||
Tractor Supply Company | 3,681 | 527,635 | ||||||||||||||
Ulta Beauty Incorporated † | 1,801 | 403,388 | ||||||||||||||
| 21,891,719 | ||||||||||||||||
|
| |||||||||||||||
| Textiles, Apparel & Luxury Goods: 0.43% | ||||||||||||||||
HanesBrands Incorporated | 11,043 | 173,927 | ||||||||||||||
Nike Incorporated Class B | 39,676 | 4,980,925 | ||||||||||||||
PVH Corporation | 2,233 | 133,176 | ||||||||||||||
Ralph Lauren Corporation | 1,512 | 102,771 | ||||||||||||||
Tapestry Incorporated | 8,664 | 135,418 | ||||||||||||||
Under Armour Incorporated Class A † | 6,006 | 67,447 | ||||||||||||||
Under Armour Incorporated Class C † | 6,192 | 60,929 | ||||||||||||||
VF Corporation | 10,153 | 713,248 | ||||||||||||||
| 6,367,841 | ||||||||||||||||
|
| |||||||||||||||
Consumer Staples: 4.22% |
| |||||||||||||||
| Beverages: 1.00% | ||||||||||||||||
Brown-Forman Corporation Class B | 5,776 | 435,048 | ||||||||||||||
Constellation Brands Incorporated Class A | 5,324 | 1,008,951 | ||||||||||||||
Molson Coors Brewing Company Class B | 5,867 | 196,897 | ||||||||||||||
Monster Beverage Corporation † | 11,695 | 937,939 | ||||||||||||||
PepsiCo Incorporated | 43,807 | 6,071,650 | ||||||||||||||
The Coca-Cola Company | 122,516 | 6,048,615 | ||||||||||||||
| 14,699,100 | ||||||||||||||||
|
| |||||||||||||||
Food & Staples Retailing: 0.94% |
| |||||||||||||||
Costco Wholesale Corporation | 14,075 | 4,996,625 | ||||||||||||||
Sysco Corporation | 16,150 | 1,004,853 | ||||||||||||||
The Kroger Company | 24,800 | 840,968 | ||||||||||||||
Walgreens Boots Alliance Incorporated | 22,696 | 815,240 | ||||||||||||||
Walmart Incorporated | 44,132 | 6,174,508 | ||||||||||||||
| 13,832,194 | ||||||||||||||||
|
| |||||||||||||||
| Food Products: 0.66% | ||||||||||||||||
Archer Daniels Midland Company | 17,638 | 819,991 | ||||||||||||||
Campbell Soup Company | 6,443 | 311,648 | ||||||||||||||
ConAgra Foods Incorporated | 15,542 | 555,005 | ||||||||||||||
General Mills Incorporated | 19,422 | 1,197,949 | ||||||||||||||
Hormel Foods Corporation | 8,894 | 434,828 | ||||||||||||||
Kellogg Company | 8,065 | 520,918 | ||||||||||||||
Lamb Weston Holdings Incorporated | 4,596 | 304,577 | ||||||||||||||
McCormick & Company Incorporated | 3,966 | 769,801 | ||||||||||||||
Mondelez International Incorporated Class A | 45,339 | 2,604,726 | ||||||||||||||
The accompanying notes are an integral part of these financial statements.
Wells Fargo Index Asset Allocation Fund | 15
Table of Contents
Portfolio of investments—September 30, 2020
| Shares | Value | |||||||||||||||
| Food Products (continued) | ||||||||||||||||
The Hershey Company | 4,679 | $ | 670,688 | |||||||||||||
The J.M. Smucker Company | 3,629 | 419,222 | ||||||||||||||
The Kraft Heinz Company | 20,584 | 616,491 | ||||||||||||||
Tyson Foods Incorporated Class A | 9,336 | 555,305 | ||||||||||||||
| 9,781,149 | ||||||||||||||||
|
| |||||||||||||||
| Household Products: 1.10% | ||||||||||||||||
Church & Dwight Company Incorporated | 7,846 | 735,249 | ||||||||||||||
Colgate-Palmolive Company | 27,244 | 2,101,875 | ||||||||||||||
Kimberly-Clark Corporation | 10,824 | 1,598,272 | ||||||||||||||
The Clorox Company | 3,998 | 840,260 | ||||||||||||||
The Procter & Gamble Company | 79,177 | 11,004,811 | ||||||||||||||
| 16,280,467 | ||||||||||||||||
|
| |||||||||||||||
| Personal Products: 0.11% | ||||||||||||||||
The Estee Lauder Companies Incorporated Class A | 7,171 | 1,565,071 | ||||||||||||||
|
| |||||||||||||||
| Tobacco: 0.41% | ||||||||||||||||
Altria Group Incorporated | 58,777 | 2,271,143 | ||||||||||||||
Philip Morris International Incorporated | 49,270 | 3,694,757 | ||||||||||||||
| 5,965,900 | ||||||||||||||||
|
| |||||||||||||||
| Energy: 1.24% | ||||||||||||||||
| Energy Equipment & Services: 0.10% | ||||||||||||||||
Baker Hughes Incorporated | 20,828 | 276,804 | ||||||||||||||
Halliburton Company | 27,578 | 332,315 | ||||||||||||||
National Oilwell Varco Incorporated | 12,335 | 111,755 | ||||||||||||||
Schlumberger Limited | 43,826 | 681,933 | ||||||||||||||
TechnipFMC plc | 13,451 | 84,876 | ||||||||||||||
| 1,487,683 | ||||||||||||||||
|
| |||||||||||||||
| Oil, Gas & Consumable Fuels: 1.14% | ||||||||||||||||
Apache Corporation | 11,864 | 112,352 | ||||||||||||||
Cabot Oil & Gas Corporation | 12,779 | 221,843 | ||||||||||||||
Chevron Corporation | 59,304 | 4,269,888 | ||||||||||||||
Concho Resources Incorporated | 6,299 | 277,912 | ||||||||||||||
ConocoPhillips | 33,883 | 1,112,718 | ||||||||||||||
Devon Energy Corporation | 12,473 | 117,995 | ||||||||||||||
Diamondback Energy Incorporated | 5,078 | 152,949 | ||||||||||||||
EOG Resources Incorporated | 18,724 | 672,941 | ||||||||||||||
Exxon Mobil Corporation | 134,208 | 4,607,361 | ||||||||||||||
Hess Corporation | 8,762 | 358,629 | ||||||||||||||
HollyFrontier Corporation | 4,707 | 92,775 | ||||||||||||||
Kinder Morgan Incorporated | 61,894 | 763,153 | ||||||||||||||
Marathon Oil Corporation | 25,312 | 103,526 | ||||||||||||||
Marathon Petroleum Corporation | 20,579 | 603,788 | ||||||||||||||
Noble Energy Incorporated | 15,402 | 131,687 | ||||||||||||||
Occidental Petroleum Corporation | 26,582 | 266,086 | ||||||||||||||
ONEOK Incorporated | 14,177 | 368,318 | ||||||||||||||
Phillips 66 | 13,822 | 716,532 | ||||||||||||||
Pioneer Natural Resources Company | 5,262 | 452,479 | ||||||||||||||
The Williams Companies Incorporated | 38,438 | 755,307 | ||||||||||||||
Valero Energy Corporation | 12,869 | 557,485 | ||||||||||||||
| 16,715,724 | ||||||||||||||||
|
| |||||||||||||||
The accompanying notes are an integral part of these financial statements.
16 | Wells Fargo Index Asset Allocation Fund
Table of Contents
Portfolio of investments—September 30, 2020
| Shares | Value | |||||||||||||||
| Financials: 5.81% | ||||||||||||||||
| Banks: 2.00% | ||||||||||||||||
Bank of America Corporation | 242,428 | $ | 5,840,091 | |||||||||||||
Citigroup Incorporated | 66,233 | 2,855,305 | ||||||||||||||
Citizens Financial Group Incorporated | 13,549 | 342,519 | ||||||||||||||
Comerica Incorporated | 4,432 | 169,524 | ||||||||||||||
Fifth Third Bancorp | 22,644 | 482,770 | ||||||||||||||
First Republic Bank | 5,457 | 595,140 | ||||||||||||||
Huntington Bancshares Incorporated | 32,395 | 297,062 | ||||||||||||||
JPMorgan Chase & Company | 97,067 | 9,344,640 | ||||||||||||||
KeyCorp | 31,065 | 370,605 | ||||||||||||||
M&T Bank Corporation | 4,080 | 375,727 | ||||||||||||||
People’s United Financial Incorporated | 13,553 | 139,731 | ||||||||||||||
PNC Financial Services Group Incorporated | 13,528 | 1,486,862 | ||||||||||||||
Regions Financial Corporation | 30,536 | 352,080 | ||||||||||||||
SVB Financial Group † | 1,647 | 396,301 | ||||||||||||||
Truist Financial Corporation | 43,052 | 1,638,129 | ||||||||||||||
US Bancorp | 43,661 | 1,565,247 | ||||||||||||||
Wells Fargo & Company (l) | 130,650 | 3,071,582 | ||||||||||||||
Zions Bancorporation | 5,205 | 152,090 | ||||||||||||||
| 29,475,405 | ||||||||||||||||
|
| |||||||||||||||
| Capital Markets: 1.53% | ||||||||||||||||
Ameriprise Financial Incorporated | 3,831 | 590,395 | ||||||||||||||
Bank of New York Mellon Corporation | 25,904 | 889,543 | ||||||||||||||
BlackRock Incorporated | 4,501 | 2,536,539 | ||||||||||||||
Cboe Global Markets Incorporated | 3,455 | 303,142 | ||||||||||||||
CME Group Incorporated | 11,352 | 1,899,303 | ||||||||||||||
E*TRADE Financial Corporation | 6,995 | 350,100 | ||||||||||||||
Franklin Resources Incorporated | 8,518 | 173,341 | ||||||||||||||
Intercontinental Exchange Incorporated | 17,822 | 1,783,091 | ||||||||||||||
Invesco Limited | 12,040 | 137,376 | ||||||||||||||
MarketAxess Holdings Incorporated | 1,209 | 582,242 | ||||||||||||||
Moody’s Corporation | 5,122 | 1,484,612 | ||||||||||||||
Morgan Stanley | 37,918 | 1,833,335 | ||||||||||||||
MSCI Incorporated | 2,655 | 947,251 | ||||||||||||||
Northern Trust Corporation | 6,599 | 514,524 | ||||||||||||||
Raymond James Financial Incorporated | 3,875 | 281,945 | ||||||||||||||
S&P Global Incorporated | 7,650 | 2,758,590 | ||||||||||||||
State Street Corporation | 11,211 | 665,149 | ||||||||||||||
T. Rowe Price Group Incorporated | 7,206 | 923,953 | ||||||||||||||
The Charles Schwab Corporation | 36,827 | 1,334,242 | ||||||||||||||
The Goldman Sachs Group Incorporated | 10,941 | 2,198,813 | ||||||||||||||
The NASDAQ OMX Group Incorporated | 3,645 | 447,278 | ||||||||||||||
| 22,634,764 | ||||||||||||||||
|
| |||||||||||||||
| Consumer Finance: 0.28% | ||||||||||||||||
American Express Company | 20,661 | 2,071,265 | ||||||||||||||
Capital One Financial Corporation | 14,474 | 1,040,102 | ||||||||||||||
Discover Financial Services | 9,691 | 559,946 | ||||||||||||||
Synchrony Financial | 17,222 | 450,700 | ||||||||||||||
| 4,122,013 | ||||||||||||||||
|
| |||||||||||||||
| Diversified Financial Services: 0.91% | ||||||||||||||||
Berkshire Hathaway Incorporated Class B † | 62,813 | 13,375,400 | ||||||||||||||
|
| |||||||||||||||
The accompanying notes are an integral part of these financial statements.
Wells Fargo Index Asset Allocation Fund | 17
Table of Contents
Portfolio of investments—September 30, 2020
| Shares | Value | |||||||||||||||
| Insurance: 1.09% | ||||||||||||||||
AFLAC Incorporated | 21,111 | $ | 767,385 | |||||||||||||
American International Group Incorporated | 27,376 | 753,661 | ||||||||||||||
Aon plc Class A | 7,398 | 1,526,207 | ||||||||||||||
Arthur J. Gallagher & Company | 6,083 | 642,243 | ||||||||||||||
Assurant Incorporated | 1,903 | 230,853 | ||||||||||||||
Chubb Limited | 14,348 | 1,666,090 | ||||||||||||||
Cincinnati Financial Corporation | 4,765 | 371,527 | ||||||||||||||
Everest Reinsurance Group Limited | 1,269 | 250,678 | ||||||||||||||
Globe Life Incorporated | 3,111 | 248,569 | ||||||||||||||
Lincoln National Corporation | 5,757 | 180,367 | ||||||||||||||
Loews Corporation | 7,577 | 263,301 | ||||||||||||||
Marsh & McLennan Companies Incorporated | 16,096 | 1,846,211 | ||||||||||||||
MetLife Incorporated | 24,508 | 910,962 | ||||||||||||||
Principal Financial Group Incorporated | 8,160 | 328,603 | ||||||||||||||
Prudential Financial Incorporated | 12,557 | 797,621 | ||||||||||||||
The Allstate Corporation | 9,949 | 936,599 | ||||||||||||||
The Hartford Financial Services Group Incorporated | 11,441 | 421,715 | ||||||||||||||
The Progressive Corporation | 18,613 | 1,762,093 | ||||||||||||||
The Travelers Companies Incorporated | 8,036 | 869,415 | ||||||||||||||
Unum Group | 6,477 | 109,008 | ||||||||||||||
W.R. Berkley Corporation | 4,471 | 273,402 | ||||||||||||||
Willis Towers Watson plc | 4,106 | 857,415 | ||||||||||||||
| 16,013,925 | ||||||||||||||||
|
| |||||||||||||||
Health Care: 8.54% |
| |||||||||||||||
| Biotechnology: 1.29% | ||||||||||||||||
AbbVie Incorporated | 56,191 | 4,921,770 | ||||||||||||||
Alexion Pharmaceuticals Incorporated † | 6,961 | 796,547 | ||||||||||||||
Amgen Incorporated | 18,686 | 4,749,234 | ||||||||||||||
Biogen Incorporated † | 5,024 | 1,425,208 | ||||||||||||||
Gilead Sciences Incorporated | 39,809 | 2,515,531 | ||||||||||||||
Incyte Corporation † | 5,867 | 526,505 | ||||||||||||||
Regeneron Pharmaceuticals Incorporated † | 3,317 | 1,856,790 | ||||||||||||||
Vertex Pharmaceuticals Incorporated † | 8,304 | 2,259,684 | ||||||||||||||
| 19,051,269 | ||||||||||||||||
|
| |||||||||||||||
| Health Care Equipment & Supplies: 2.37% | ||||||||||||||||
Abbott Laboratories | 56,108 | 6,106,234 | ||||||||||||||
ABIOMED Incorporated † | 1,428 | 395,642 | ||||||||||||||
Align Technology Incorporated † | 2,259 | 739,506 | ||||||||||||||
Baxter International Incorporated | 15,972 | 1,284,468 | ||||||||||||||
Becton Dickinson & Company | 9,203 | 2,141,354 | ||||||||||||||
Boston Scientific Corporation † | 45,403 | 1,734,849 | ||||||||||||||
Danaher Corporation | 20,084 | 4,324,688 | ||||||||||||||
Dentsply Sirona Incorporated | 6,899 | 301,693 | ||||||||||||||
DexCom Incorporated † | 3,038 | 1,252,355 | ||||||||||||||
Edwards Lifesciences Corporation † | 19,640 | 1,567,665 | ||||||||||||||
Hologic Incorporated † | 8,223 | 546,583 | ||||||||||||||
IDEXX Laboratories Incorporated † | 2,691 | 1,057,859 | ||||||||||||||
Intuitive Surgical Incorporated † | 3,684 | 2,613,945 | ||||||||||||||
Medtronic plc | 42,577 | 4,424,602 | ||||||||||||||
ResMed Incorporated | 4,606 | 789,607 | ||||||||||||||
STERIS plc | 2,702 | 476,065 | ||||||||||||||
Stryker Corporation | 10,373 | 2,161,422 | ||||||||||||||
The accompanying notes are an integral part of these financial statements.
18 | Wells Fargo Index Asset Allocation Fund
Table of Contents
Portfolio of investments—September 30, 2020
| Shares | Value | |||||||||||||||
| Health Care Equipment & Supplies (continued) | ||||||||||||||||
Teleflex Incorporated | 1,471 | $ | 500,758 | |||||||||||||
The Cooper Companies Incorporated | 1,558 | 525,233 | ||||||||||||||
Varian Medical Systems Incorporated † | 2,898 | 498,456 | ||||||||||||||
West Pharmaceutical Services Incorporated | 2,339 | 642,991 | ||||||||||||||
Zimmer Biomet Holdings Incorporated | 6,575 | 895,121 | ||||||||||||||
| 34,981,096 | ||||||||||||||||
|
| |||||||||||||||
| Health Care Providers & Services: 1.58% | ||||||||||||||||
AmerisourceBergen Corporation | 4,658 | 451,453 | ||||||||||||||
Anthem Incorporated | 8,007 | 2,150,600 | ||||||||||||||
Cardinal Health Incorporated | 9,267 | 435,086 | ||||||||||||||
Centene Corporation † | 18,474 | 1,077,588 | ||||||||||||||
Cigna Corporation | 11,694 | 1,981,081 | ||||||||||||||
CVS Health Corporation | 41,662 | 2,433,061 | ||||||||||||||
DaVita HealthCare Partners Incorporated † | 2,395 | 205,132 | ||||||||||||||
HCA Healthcare Incorporated | 8,440 | 1,052,299 | ||||||||||||||
Henry Schein Incorporated † | 4,526 | 266,038 | ||||||||||||||
Humana Incorporated | 4,208 | 1,741,649 | ||||||||||||||
Laboratory Corporation of America Holdings † | 3,104 | 584,390 | ||||||||||||||
McKesson Corporation | 5,133 | 764,458 | ||||||||||||||
Quest Diagnostics Incorporated | 4,275 | 489,445 | ||||||||||||||
UnitedHealth Group Incorporated | 30,316 | 9,451,619 | ||||||||||||||
Universal Health Services Incorporated Class B | 2,486 | 266,052 | ||||||||||||||
| 23,349,951 | ||||||||||||||||
|
| |||||||||||||||
| Health Care Technology: 0.05% | ||||||||||||||||
Cerner Corporation | 9,667 | 698,827 | ||||||||||||||
|
| |||||||||||||||
| Life Sciences Tools & Services: 0.74% | ||||||||||||||||
Agilent Technologies Incorporated | 9,798 | 989,010 | ||||||||||||||
Bio-Rad Laboratories Incorporated Class A † | 679 | 349,997 | ||||||||||||||
Illumina Incorporated † | 4,645 | 1,435,677 | ||||||||||||||
IQVIA Holdings Incorporated † | 6,057 | 954,765 | ||||||||||||||
Mettler-Toledo International Incorporated † | 763 | 736,867 | ||||||||||||||
PerkinElmer Incorporated | 3,557 | 446,439 | ||||||||||||||
Thermo Fisher Scientific Incorporated | 12,585 | 5,556,529 | ||||||||||||||
Waters Corporation † | 1,968 | 385,098 | ||||||||||||||
| 10,854,382 | ||||||||||||||||
|
| |||||||||||||||
| Pharmaceuticals: 2.51% | ||||||||||||||||
Bristol-Myers Squibb Company | 71,241 | 4,295,120 | ||||||||||||||
Catalent Incorporated † | 5,215 | 446,717 | ||||||||||||||
Eli Lilly & Company | 25,130 | 3,719,743 | ||||||||||||||
Johnson & Johnson | 83,802 | 12,476,442 | ||||||||||||||
Merck & Company Incorporated | 80,136 | 6,647,281 | ||||||||||||||
Mylan NV † | 16,332 | 242,204 | ||||||||||||||
Perrigo Company plc | 4,336 | 199,066 | ||||||||||||||
Pfizer Incorporated | 176,387 | 6,473,403 | ||||||||||||||
Zoetis Incorporated | 15,093 | 2,495,929 | ||||||||||||||
| 36,995,905 | ||||||||||||||||
|
| |||||||||||||||
Industrials: 4.97% |
| |||||||||||||||
| Aerospace & Defense: 0.96% | ||||||||||||||||
General Dynamics Corporation | 7,380 | 1,021,613 | ||||||||||||||
Howmet Aerospace Incorporated | 12,455 | 208,248 | ||||||||||||||
The accompanying notes are an integral part of these financial statements.
Wells Fargo Index Asset Allocation Fund | 19
Table of Contents
Portfolio of investments—September 30, 2020
| Shares | Value | |||||||||||||||
| Aerospace & Defense (continued) | ||||||||||||||||
Huntington Ingalls Industries Incorporated | 1,283 | $ | 180,582 | |||||||||||||
L3Harris Technologies Incorporated | 6,852 | 1,163,744 | ||||||||||||||
Lockheed Martin Corporation | 7,813 | 2,994,567 | ||||||||||||||
Northrop Grumman Corporation | 4,921 | 1,552,526 | ||||||||||||||
Raytheon Technologies Corporation | 48,381 | 2,783,843 | ||||||||||||||
Teledyne Technologies Incorporated † | 1,171 | 363,256 | ||||||||||||||
Textron Incorporated | 7,254 | 261,797 | ||||||||||||||
The Boeing Company | 16,863 | 2,786,779 | ||||||||||||||
TransDigm Group Incorporated | 1,719 | 816,731 | ||||||||||||||
| 14,133,686 | ||||||||||||||||
|
| |||||||||||||||
| Air Freight & Logistics: 0.45% | ||||||||||||||||
C.H. Robinson Worldwide Incorporated | 4,276 | 436,964 | ||||||||||||||
Expeditors International of Washington Incorporated | 5,330 | 482,472 | ||||||||||||||
FedEx Corporation | 7,626 | 1,918,092 | ||||||||||||||
United Parcel Service Incorporated Class B | 22,426 | 3,736,844 | ||||||||||||||
| 6,574,372 | ||||||||||||||||
|
| |||||||||||||||
| Airlines: 0.13% | ||||||||||||||||
Alaska Air Group Incorporated | 3,926 | 143,809 | ||||||||||||||
American Airlines Group Incorporated « | 16,085 | 197,685 | ||||||||||||||
Delta Air Lines Incorporated | 20,246 | 619,123 | ||||||||||||||
Southwest Airlines Company | 18,765 | 703,688 | ||||||||||||||
United Airlines Holdings Incorporated † | 9,202 | 319,770 | ||||||||||||||
| 1,984,075 | ||||||||||||||||
|
| |||||||||||||||
| Building Products: 0.27% | ||||||||||||||||
A.O. Smith Corporation | 4,298 | 226,934 | ||||||||||||||
Allegion plc | 2,926 | 289,411 | ||||||||||||||
Carrier Global Corporation | 25,896 | 790,864 | ||||||||||||||
Fortune Brands Home & Security Incorporated | 4,379 | 378,871 | ||||||||||||||
Johnson Controls International plc | 23,640 | 965,694 | ||||||||||||||
Masco Corporation | 8,295 | 457,303 | ||||||||||||||
Trane Technologies plc | 7,591 | 920,409 | ||||||||||||||
| 4,029,486 | ||||||||||||||||
|
| |||||||||||||||
| Commercial Services & Supplies: 0.26% | ||||||||||||||||
Cintas Corporation | 2,760 | 918,611 | ||||||||||||||
Copart Incorporated † | 6,562 | 690,060 | ||||||||||||||
Republic Services Incorporated | 6,663 | 621,991 | ||||||||||||||
Rollins Incorporated | 4,675 | 253,338 | ||||||||||||||
Waste Management Incorporated | 12,329 | 1,395,273 | ||||||||||||||
| 3,879,273 | ||||||||||||||||
|
| |||||||||||||||
| Construction & Engineering: 0.04% | ||||||||||||||||
Jacobs Engineering Group Incorporated | 4,131 | 383,233 | ||||||||||||||
Quanta Services Incorporated | 4,379 | 231,474 | ||||||||||||||
| 614,707 | ||||||||||||||||
|
| |||||||||||||||
| Electrical Equipment: 0.28% | ||||||||||||||||
AMETEK Incorporated | 7,299 | 725,521 | ||||||||||||||
Eaton Corporation plc | 12,685 | 1,294,251 | ||||||||||||||
Emerson Electric Company | 18,973 | 1,244,060 | ||||||||||||||
Rockwell Automation Incorporated | 3,689 | 814,089 | ||||||||||||||
| 4,077,921 | ||||||||||||||||
|
| |||||||||||||||
The accompanying notes are an integral part of these financial statements.
20 | Wells Fargo Index Asset Allocation Fund
Table of Contents
Portfolio of investments—September 30, 2020
| Shares | Value | |||||||||||||||
| Industrial Conglomerates: 0.65% | ||||||||||||||||
3M Company | 18,279 | $ | 2,927,930 | |||||||||||||
General Electric Company | 278,336 | 1,734,033 | ||||||||||||||
Honeywell International Incorporated | 22,299 | 3,670,638 | ||||||||||||||
Roper Technologies Incorporated | 3,328 | 1,314,926 | ||||||||||||||
| 9,647,527 | ||||||||||||||||
|
| |||||||||||||||
| Machinery: 0.99% | ||||||||||||||||
Caterpillar Incorporated | 17,207 | 2,566,424 | ||||||||||||||
Cummins Incorporated | 4,698 | 992,030 | ||||||||||||||
Deere & Company | 9,960 | 2,207,435 | ||||||||||||||
Dover Corporation | 4,577 | 495,872 | ||||||||||||||
Flowserve Corporation | 4,128 | 112,653 | ||||||||||||||
Fortive Corporation | 10,729 | 817,657 | ||||||||||||||
IDEX Corporation | 2,400 | 437,784 | ||||||||||||||
Illinois Tool Works Incorporated | 9,116 | 1,761,302 | ||||||||||||||
Ingersoll Rand Incorporated † | 11,786 | 419,582 | ||||||||||||||
Otis Worldwide Corporation | 12,944 | 807,964 | ||||||||||||||
PACCAR Incorporated | 10,987 | 936,971 | ||||||||||||||
Parker-Hannifin Corporation | 4,087 | 826,964 | ||||||||||||||
Pentair plc | 5,274 | 241,391 | ||||||||||||||
Snap-on Incorporated | 1,730 | 254,535 | ||||||||||||||
Stanley Black & Decker Incorporated | 5,054 | 819,759 | ||||||||||||||
Wabtec Corporation | 5,686 | 351,850 | ||||||||||||||
Xylem Incorporated | 5,719 | 481,082 | ||||||||||||||
| 14,531,255 | ||||||||||||||||
|
| |||||||||||||||
| Professional Services: 0.19% | ||||||||||||||||
Equifax Incorporated | 3,851 | 604,222 | ||||||||||||||
IHS Markit Limited | 11,762 | 923,435 | ||||||||||||||
Nielsen Holdings plc | 11,314 | 160,433 | ||||||||||||||
Robert Half International Incorporated | 3,632 | 192,278 | ||||||||||||||
Verisk Analytics Incorporated | 5,130 | 950,640 | ||||||||||||||
| 2,831,008 | ||||||||||||||||
|
| |||||||||||||||
| Road & Rail: 0.63% | ||||||||||||||||
CSX Corporation | 24,160 | 1,876,507 | ||||||||||||||
J.B. Hunt Transport Services Incorporated | 2,637 | 333,264 | ||||||||||||||
Kansas City Southern | 2,986 | 539,958 | ||||||||||||||
Norfolk Southern Corporation | 8,015 | 1,715,130 | ||||||||||||||
Old Dominion Freight Line Incorporated | 3,054 | 552,530 | ||||||||||||||
Union Pacific Corporation | 21,521 | 4,236,839 | ||||||||||||||
| 9,254,228 | ||||||||||||||||
|
| |||||||||||||||
| Trading Companies & Distributors: 0.12% | ||||||||||||||||
Fastenal Company | 18,191 | 820,232 | ||||||||||||||
United Rentals Incorporated † | 2,291 | 399,780 | ||||||||||||||
W.W. Grainger Incorporated | 1,431 | 510,538 | ||||||||||||||
| 1,730,550 | ||||||||||||||||
|
| |||||||||||||||
Information Technology: 16.90% |
| |||||||||||||||
| Communications Equipment: 0.47% | ||||||||||||||||
Arista Networks Incorporated † | 1,747 | 361,507 | ||||||||||||||
Cisco Systems Incorporated | 134,464 | 5,296,537 | ||||||||||||||
F5 Networks Incorporated † | 1,942 | 238,419 | ||||||||||||||
The accompanying notes are an integral part of these financial statements.
Wells Fargo Index Asset Allocation Fund | 21
Table of Contents
Portfolio of investments—September 30, 2020
| Shares | Value | |||||||||||||||
| Communications Equipment (continued) | ||||||||||||||||
Juniper Networks Incorporated | 10,535 | $ | 226,503 | |||||||||||||
Motorola Solutions Incorporated | 5,388 | 844,892 | ||||||||||||||
| 6,967,858 | ||||||||||||||||
|
| |||||||||||||||
| Electronic Equipment, Instruments & Components: 0.32% | ||||||||||||||||
Amphenol Corporation Class A | 9,500 | 1,028,565 | ||||||||||||||
CDW Corporation of Delaware | 4,545 | 543,264 | ||||||||||||||
Corning Incorporated | 24,120 | 781,729 | ||||||||||||||
FLIR Systems Incorporated | 4,173 | 149,602 | ||||||||||||||
IPG Photonics Corporation † | 1,136 | 193,086 | ||||||||||||||
Keysight Technologies Incorporated † | 5,924 | 585,173 | ||||||||||||||
TE Connectivity Limited | 10,502 | 1,026,465 | ||||||||||||||
Zebra Technologies Corporation Class A † | 1,691 | 426,910 | ||||||||||||||
| 4,734,794 | ||||||||||||||||
|
| |||||||||||||||
| IT Services: 3.38% | ||||||||||||||||
Accenture plc Class A | 20,240 | 4,574,038 | ||||||||||||||
Akamai Technologies Incorporated † | 5,172 | 571,713 | ||||||||||||||
Automatic Data Processing Incorporated | 13,661 | 1,905,573 | ||||||||||||||
Broadridge Financial Solutions Incorporated | 3,657 | 482,724 | ||||||||||||||
Cognizant Technology Solutions Corporation Class A | 17,193 | 1,193,538 | ||||||||||||||
DXC Technology Company | 8,202 | 146,406 | ||||||||||||||
Fidelity National Information Services Incorporated | 19,733 | 2,904,895 | ||||||||||||||
Fiserv Incorporated † | 17,652 | 1,819,039 | ||||||||||||||
FleetCor Technologies Incorporated † | 2,664 | 634,298 | ||||||||||||||
Gartner Incorporated † | 2,828 | 353,359 | ||||||||||||||
Global Payments Incorporated | 9,488 | 1,684,879 | ||||||||||||||
International Business Machines Corporation | 28,300 | 3,443,261 | ||||||||||||||
Jack Henry & Associates Incorporated | 2,430 | 395,094 | ||||||||||||||
Leidos Holdings Incorporated | 4,249 | 378,798 | ||||||||||||||
MasterCard Incorporated Class A | 27,985 | 9,463,687 | ||||||||||||||
Paychex Incorporated | 10,169 | 811,181 | ||||||||||||||
PayPal Holdings Incorporated † | 37,342 | 7,357,494 | ||||||||||||||
The Western Union Company | 13,026 | 279,147 | ||||||||||||||
VeriSign Incorporated † | 3,209 | 657,364 | ||||||||||||||
Visa Incorporated Class A | 53,340 | 10,666,400 | ||||||||||||||
| 49,722,888 | ||||||||||||||||
|
| |||||||||||||||
| Semiconductors & Semiconductor Equipment: 3.04% | ||||||||||||||||
Advanced Micro Devices Incorporated † | 37,586 | 3,081,676 | ||||||||||||||
Analog Devices Incorporated | 11,741 | 1,370,644 | ||||||||||||||
Applied Materials Incorporated | 29,054 | 1,727,260 | ||||||||||||||
Broadcom Incorporated | 12,721 | 4,634,515 | ||||||||||||||
Intel Corporation | 135,026 | 6,991,646 | ||||||||||||||
KLA Corporation | 4,932 | 955,526 | ||||||||||||||
Lam Research Corporation | 4,616 | 1,531,358 | ||||||||||||||
Maxim Integrated Products Incorporated | 8,470 | 572,657 | ||||||||||||||
Microchip Technology Incorporated | 8,029 | 825,060 | ||||||||||||||
Micron Technology Incorporated † | 35,335 | 1,659,332 | ||||||||||||||
NVIDIA Corporation | 19,641 | 10,630,102 | ||||||||||||||
Qorvo Incorporated † | 3,623 | 467,403 | ||||||||||||||
QUALCOMM Incorporated | 35,738 | 4,205,648 | ||||||||||||||
Skyworks Solutions Incorporated | 5,292 | 769,986 | ||||||||||||||
Teradyne Incorporated | 5,273 | 418,993 | ||||||||||||||
Texas Instruments Incorporated | 29,078 | 4,152,048 | ||||||||||||||
Xilinx Incorporated | 7,764 | 809,319 | ||||||||||||||
| 44,803,173 | ||||||||||||||||
|
| |||||||||||||||
The accompanying notes are an integral part of these financial statements.
22 | Wells Fargo Index Asset Allocation Fund
Table of Contents
Portfolio of investments—September 30, 2020
| Shares | Value | |||||||||||||||
| Software: 5.52% | ||||||||||||||||
Adobe Incorporated † | 15,256 | $ | 7,482,000 | |||||||||||||
ANSYS Incorporated † | 2,731 | 893,665 | ||||||||||||||
Autodesk Incorporated † | 6,972 | 1,610,602 | ||||||||||||||
Cadence Design Systems Incorporated † | 8,836 | 942,183 | ||||||||||||||
Citrix Systems Incorporated | 3,909 | 538,308 | ||||||||||||||
Fortinet Incorporated † | 4,254 | 501,164 | ||||||||||||||
Intuit Incorporated | 8,294 | 2,705,586 | ||||||||||||||
Microsoft Corporation | 239,819 | 50,441,130 | ||||||||||||||
NortonLifeLock Incorporated | 18,751 | 390,771 | ||||||||||||||
Oracle Corporation | 61,290 | 3,659,013 | ||||||||||||||
Paycom Software Incorporated † | 1,570 | 488,741 | ||||||||||||||
Salesforce.com Incorporated † | 29,048 | 7,300,343 | ||||||||||||||
ServiceNow Incorporated † | 6,114 | 2,965,290 | ||||||||||||||
Synopsys Incorporated † | 4,809 | 1,029,030 | ||||||||||||||
Tyler Technologies Incorporated † | 1,278 | 445,460 | ||||||||||||||
| 81,393,286 | ||||||||||||||||
|
| |||||||||||||||
| Technology Hardware, Storage & Peripherals: 4.17% | ||||||||||||||||
Apple Incorporated | 510,848 | 59,161,307 | ||||||||||||||
Hewlett Packard Enterprise Company | 40,751 | 381,837 | ||||||||||||||
HP Incorporated | 43,610 | 828,154 | ||||||||||||||
NetApp Incorporated | 7,063 | 309,642 | ||||||||||||||
Seagate Technology plc | 7,094 | 349,521 | ||||||||||||||
Western Digital Corporation | 9,587 | 350,405 | ||||||||||||||
Xerox Holdings Corporation | 5,693 | 106,858 | ||||||||||||||
| 61,487,724 | ||||||||||||||||
|
| |||||||||||||||
Materials: 1.57% |
| |||||||||||||||
| Chemicals: 1.10% | ||||||||||||||||
Air Products & Chemicals Incorporated | 7,017 | 2,090,084 | ||||||||||||||
Albemarle Corporation | 3,384 | 302,124 | ||||||||||||||
Celanese Corporation Series A | 3,748 | 402,723 | ||||||||||||||
CF Industries Holdings Incorporated | 6,765 | 207,753 | ||||||||||||||
Corteva Incorporated | 23,728 | 683,604 | ||||||||||||||
Dow Incorporated | 23,491 | 1,105,252 | ||||||||||||||
DuPont de Nemours Incorporated | 23,236 | 1,289,133 | ||||||||||||||
Eastman Chemical Company | 4,286 | 334,822 | ||||||||||||||
Ecolab Incorporated | 7,877 | 1,574,140 | ||||||||||||||
FMC Corporation | 4,116 | 435,926 | ||||||||||||||
International Flavors & Fragrances Incorporated « | 3,394 | 415,595 | ||||||||||||||
Linde plc | 16,667 | 3,968,913 | ||||||||||||||
LyondellBasell Industries NV Class A | 8,142 | 573,930 | ||||||||||||||
PPG Industries Incorporated | 7,466 | 911,449 | ||||||||||||||
The Mosaic Company | 10,891 | 198,979 | ||||||||||||||
The Sherwin-Williams Company | 2,594 | 1,807,344 | ||||||||||||||
| 16,301,771 | ||||||||||||||||
|
| |||||||||||||||
| Construction Materials: 0.07% | ||||||||||||||||
Martin Marietta Materials Incorporated | 1,988 | 467,896 | ||||||||||||||
Vulcan Materials Company | 4,219 | 571,843 | ||||||||||||||
| 1,039,739 | ||||||||||||||||
|
| |||||||||||||||
| Containers & Packaging: 0.21% | ||||||||||||||||
Amcor plc | 49,844 | 550,776 | ||||||||||||||
Avery Dennison Corporation | 2,656 | 339,543 | ||||||||||||||
The accompanying notes are an integral part of these financial statements.
Wells Fargo Index Asset Allocation Fund | 23
Table of Contents
Portfolio of investments—September 30, 2020
| Shares | Value | |||||||||||||||
| Containers & Packaging (continued) | ||||||||||||||||
Ball Corporation | 10,383 | $ | 863,035 | |||||||||||||
International Paper Company | 12,461 | 505,169 | ||||||||||||||
Packaging Corporation of America | 2,992 | 326,278 | ||||||||||||||
Sealed Air Corporation | 4,958 | 192,420 | ||||||||||||||
WestRock Company | 8,234 | 286,049 | ||||||||||||||
| 3,063,270 | ||||||||||||||||
|
| |||||||||||||||
Metals & Mining: 0.19% |
| |||||||||||||||
Freeport-McMoRan Incorporated | 45,571 | 712,730 | ||||||||||||||
Newmont Corporation | 25,474 | 1,616,325 | ||||||||||||||
Nucor Corporation | 9,562 | 428,951 | ||||||||||||||
| 2,758,006 | ||||||||||||||||
|
| |||||||||||||||
Real Estate: 1.59% | ||||||||||||||||
| Equity REITs: 1.56% | ||||||||||||||||
Alexandria Real Estate Equities Incorporated | 3,730 | 596,800 | ||||||||||||||
American Tower Corporation | 14,098 | 3,407,910 | ||||||||||||||
Apartment Investment & Management Company Class A | 4,720 | 159,158 | ||||||||||||||
AvalonBay Communities Incorporated | 4,471 | 667,699 | ||||||||||||||
Boston Properties Incorporated | 4,501 | 361,430 | ||||||||||||||
Crown Castle International Corporation | 13,373 | 2,226,605 | ||||||||||||||
Digital Realty Trust Incorporated | 8,565 | 1,256,999 | ||||||||||||||
Duke Realty Corporation | 11,818 | 436,084 | ||||||||||||||
Equinix Incorporated | 2,813 | 2,138,246 | ||||||||||||||
Equity Residential | 10,882 | 558,573 | ||||||||||||||
Essex Property Trust Incorporated | 2,063 | 414,230 | ||||||||||||||
Extra Space Storage Incorporated | 4,104 | 439,087 | ||||||||||||||
Federal Realty Investment Trust | 2,195 | 161,201 | ||||||||||||||
Healthpeak Properties Incorporated | 17,167 | 466,084 | ||||||||||||||
Host Hotels & Resorts Incorporated | 22,574 | 243,573 | ||||||||||||||
Iron Mountain Incorporated | 9,204 | 246,575 | ||||||||||||||
Kimco Realty Corporation | 13,841 | 155,850 | ||||||||||||||
Mid-America Apartment Communities Incorporated | 3,633 | 421,246 | ||||||||||||||
Prologis Incorporated | 23,457 | 2,360,243 | ||||||||||||||
Public Storage Incorporated | 4,842 | 1,078,410 | ||||||||||||||
Realty Income Corporation | 10,979 | 666,974 | ||||||||||||||
Regency Centers Corporation | 5,018 | 190,784 | ||||||||||||||
SBA Communications Corporation | 3,571 | 1,137,292 | ||||||||||||||
Simon Property Group Incorporated | 9,738 | 629,854 | ||||||||||||||
SL Green Realty Corporation | 2,333 | 108,181 | ||||||||||||||
UDR Incorporated | 9,349 | 304,871 | ||||||||||||||
Ventas Incorporated | 11,936 | 500,835 | ||||||||||||||
Vornado Realty Trust | 5,010 | 168,887 | ||||||||||||||
Welltower Incorporated | 13,374 | 736,774 | ||||||||||||||
Weyerhaeuser Company | 23,674 | 675,182 | ||||||||||||||
| 22,915,637 | ||||||||||||||||
|
| |||||||||||||||
| Real Estate Management & Development: 0.03% | ||||||||||||||||
CBRE Group Incorporated Class A † | 10,671 | 501,217 | ||||||||||||||
|
| |||||||||||||||
Utilities: 1.78% | ||||||||||||||||
| Electric Utilities: 1.11% | ||||||||||||||||
Alliant Energy Corporation | 7,907 | 408,397 | ||||||||||||||
American Electric Power Company Incorporated | 15,771 | 1,288,964 | ||||||||||||||
Duke Energy Corporation | 23,299 | 2,063,359 | ||||||||||||||
The accompanying notes are an integral part of these financial statements.
24 | Wells Fargo Index Asset Allocation Fund
Table of Contents
Portfolio of investments—September 30, 2020
| Shares | Value | |||||||||||||||
| Electric Utilities (continued) | ||||||||||||||||
Edison International | 11,988 | $ | 609,470 | |||||||||||||
Entergy Corporation | 6,355 | 626,158 | ||||||||||||||
Evergy Incorporated | 7,204 | 366,107 | ||||||||||||||
Eversource Energy | 10,887 | 909,609 | ||||||||||||||
Exelon Corporation | 30,892 | 1,104,698 | ||||||||||||||
FirstEnergy Corporation | 17,293 | 496,482 | ||||||||||||||
NextEra Energy Incorporated | 15,539 | 4,313,005 | ||||||||||||||
NRG Energy Incorporated | 7,755 | 238,389 | ||||||||||||||
Pinnacle West Capital Corporation | 3,567 | 265,920 | ||||||||||||||
PPL Corporation | 24,374 | 663,217 | ||||||||||||||
The Southern Company | 33,580 | 1,820,708 | ||||||||||||||
Xcel Energy Incorporated | 16,671 | 1,150,466 | ||||||||||||||
| 16,324,949 | ||||||||||||||||
|
| |||||||||||||||
| Gas Utilities: 0.02% | ||||||||||||||||
Atmos Energy Corporation | 3,918 | 374,522 | ||||||||||||||
|
| |||||||||||||||
| Independent Power & Renewable Electricity Producers: 0.02% | ||||||||||||||||
AES Corporation | 21,129 | 382,646 | ||||||||||||||
|
| |||||||||||||||
| Multi-Utilities: 0.57% | ||||||||||||||||
Ameren Corporation | 7,863 | 621,806 | ||||||||||||||
CenterPoint Energy Incorporated | 17,320 | 335,142 | ||||||||||||||
CMS Energy Corporation | 9,078 | 557,480 | ||||||||||||||
Consolidated Edison Incorporated | 10,638 | 827,636 | ||||||||||||||
Dominion Energy Incorporated | 26,620 | 2,101,117 | ||||||||||||||
DTE Energy Company | 6,122 | 704,275 | ||||||||||||||
NiSource Incorporated | 12,197 | 268,334 | ||||||||||||||
Public Service Enterprise Group Incorporated | 16,089 | 883,447 | ||||||||||||||
Sempra Energy | 9,170 | 1,085,361 | ||||||||||||||
WEC Energy Group Incorporated | 10,024 | 971,326 | ||||||||||||||
| 8,355,924 | ||||||||||||||||
|
| |||||||||||||||
| Water Utilities: 0.06% | ||||||||||||||||
American Water Works Company Incorporated | 5,755 | 833,784 | ||||||||||||||
|
| |||||||||||||||
Total Common Stocks (Cost $336,570,424) | 885,028,391 | |||||||||||||||
|
| |||||||||||||||
| Interest rate | Maturity date | Principal | ||||||||||||||
| Non-Agency Mortgage-Backed Securities: 0.00% | ||||||||||||||||
Citigroup Mortgage Loan Trust Incorporated Series 2004-HYB4 Class AA (1 Month LIBOR +0.33%) ± | 0.48 | % | 12-25-2034 | $ | 4,904 | 4,891 | ||||||||||
|
| |||||||||||||||
Total Non-Agency Mortgage-Backed Securities (Cost $4,904) | 4,891 | |||||||||||||||
|
| |||||||||||||||
| U.S. Treasury Securities: 37.91% | ||||||||||||||||
U.S. Treasury Bond | 0.25 | 6-30-2025 | 2,925,000 | 2,923,286 | ||||||||||||
U.S. Treasury Bond | 0.25 | 8-31-2025 | 3,153,000 | 3,149,798 | ||||||||||||
U.S. Treasury Bond | 0.38 | 7-31-2027 | 2,771,000 | 2,756,712 | ||||||||||||
U.S. Treasury Bond | 0.50 | 8-31-2027 | 2,918,000 | 2,925,637 | ||||||||||||
U.S. Treasury Bond | 0.63 | 8-15-2030 | 4,582,000 | 4,556,047 | ||||||||||||
U.S. Treasury Bond | 1.13 | 5-15-2040 | 2,251,000 | 2,215,476 | ||||||||||||
U.S. Treasury Bond | 1.13 | 8-15-2040 | 2,981,000 | 2,924,873 | ||||||||||||
U.S. Treasury Bond | 1.25 | 5-15-2050 | 3,785,000 | 3,586,879 | ||||||||||||
U.S. Treasury Bond | 1.38 | 8-15-2050 | 3,103,000 | 3,036,334 | ||||||||||||
The accompanying notes are an integral part of these financial statements.
Wells Fargo Index Asset Allocation Fund | 25
Table of Contents
Portfolio of investments—September 30, 2020
| Interest rate | Maturity date | Principal | Value | |||||||||||||
| U.S. Treasury Securities (continued) | ||||||||||||||||
U.S. Treasury Bond | 1.50 | % | 1-31-2027 | $ | 1,873,000 | $ | 2,001,257 | |||||||||
U.S. Treasury Bond | 1.50 | 2-15-2030 | 4,305,000 | 4,643,346 | ||||||||||||
U.S. Treasury Bond | 2.00 | 2-15-2050 | 3,135,000 | 3,545,979 | ||||||||||||
U.S. Treasury Bond | 2.13 | 9-30-2024 | 1,844,000 | 1,984,245 | ||||||||||||
U.S. Treasury Bond | 2.13 | 11-30-2024 | 1,852,000 | 1,997,339 | ||||||||||||
U.S. Treasury Bond | 2.25 | 8-15-2046 | 1,961,000 | 2,315,742 | ||||||||||||
U.S. Treasury Bond | 2.25 | 8-15-2049 | 3,118,000 | 3,707,862 | ||||||||||||
U.S. Treasury Bond | 2.38 | 11-15-2049 | 2,096,000 | 2,559,003 | ||||||||||||
U.S. Treasury Bond | 2.50 | 2-15-2045 | 2,144,000 | 2,638,711 | ||||||||||||
U.S. Treasury Bond | 2.50 | 2-15-2046 | 1,960,000 | 2,419,758 | ||||||||||||
U.S. Treasury Bond | 2.50 | 5-15-2046 | 1,949,000 | 2,407,852 | ||||||||||||
U.S. Treasury Bond | 2.75 | 8-15-2042 | 1,218,000 | 1,560,658 | ||||||||||||
U.S. Treasury Bond | 2.75 | 11-15-2042 | 1,369,000 | 1,752,908 | ||||||||||||
U.S. Treasury Bond | 2.75 | 8-15-2047 | 1,864,000 | 2,419,341 | ||||||||||||
U.S. Treasury Bond | 2.75 | 11-15-2047 | 1,853,000 | 2,407,959 | ||||||||||||
U.S. Treasury Bond | 2.88 | 5-15-2028 | 3,462,000 | 4,072,989 | ||||||||||||
U.S. Treasury Bond | 2.88 | 5-15-2043 | 1,822,000 | 2,378,991 | ||||||||||||
U.S. Treasury Bond | 2.88 | 8-15-2045 | 2,027,000 | 2,663,050 | ||||||||||||
U.S. Treasury Bond | 2.88 | 11-15-2046 | 1,779,000 | 2,351,268 | ||||||||||||
U.S. Treasury Bond | 2.88 | 5-15-2049 | 2,582,000 | 3,456,955 | ||||||||||||
U.S. Treasury Bond | 3.00 | 5-15-2042 | 776,000 | 1,031,534 | ||||||||||||
U.S. Treasury Bond | 3.00 | 11-15-2044 | 1,951,000 | 2,606,795 | ||||||||||||
U.S. Treasury Bond | 3.00 | 5-15-2045 | 1,907,000 | 2,553,145 | ||||||||||||
U.S. Treasury Bond | 3.00 | 11-15-2045 | 1,791,000 | 2,406,097 | ||||||||||||
U.S. Treasury Bond | 3.00 | 2-15-2047 | 1,889,000 | 2,555,094 | ||||||||||||
U.S. Treasury Bond | 3.00 | 5-15-2047 | 1,921,000 | 2,602,430 | ||||||||||||
U.S. Treasury Bond | 3.00 | 2-15-2048 | 2,119,000 | 2,879,605 | ||||||||||||
U.S. Treasury Bond | 3.00 | 8-15-2048 | 2,099,000 | 2,860,789 | ||||||||||||
U.S. Treasury Bond | 3.00 | 2-15-2049 | 2,614,000 | 3,573,215 | ||||||||||||
U.S. Treasury Bond | 3.13 | 11-15-2041 | 846,000 | 1,143,158 | ||||||||||||
U.S. Treasury Bond | 3.13 | 2-15-2042 | 919,000 | 1,244,958 | ||||||||||||
U.S. Treasury Bond | 3.13 | 2-15-2043 | 1,334,000 | 1,807,518 | ||||||||||||
U.S. Treasury Bond | 3.13 | 8-15-2044 | 1,999,000 | 2,720,046 | ||||||||||||
U.S. Treasury Bond | 3.13 | 5-15-2048 | 2,283,000 | 3,173,905 | ||||||||||||
U.S. Treasury Bond | 3.38 | 5-15-2044 | 1,848,000 | 2,607,629 | ||||||||||||
U.S. Treasury Bond | 3.38 | 11-15-2048 | 2,541,000 | 3,697,056 | ||||||||||||
U.S. Treasury Bond | 3.50 | 2-15-2039 | 731,000 | 1,026,141 | ||||||||||||
U.S. Treasury Bond | 3.63 | 8-15-2043 | 1,504,000 | 2,192,785 | ||||||||||||
U.S. Treasury Bond | 3.63 | 2-15-2044 | 1,897,000 | 2,771,917 | ||||||||||||
U.S. Treasury Bond | 3.75 | 8-15-2041 | 929,000 | 1,363,598 | ||||||||||||
U.S. Treasury Bond | 3.75 | 11-15-2043 | 1,660,000 | 2,465,878 | ||||||||||||
U.S. Treasury Bond | 3.88 | 8-15-2040 | 946,000 | 1,400,191 | ||||||||||||
U.S. Treasury Bond | 4.25 | 5-15-2039 | 681,000 | 1,044,803 | ||||||||||||
U.S. Treasury Bond | 4.25 | 11-15-2040 | 977,000 | 1,516,754 | ||||||||||||
U.S. Treasury Bond | 4.38 | 2-15-2038 | 381,000 | 586,204 | ||||||||||||
U.S. Treasury Bond | 4.38 | 11-15-2039 | 757,000 | 1,182,724 | ||||||||||||
U.S. Treasury Bond | 4.38 | 5-15-2040 | 1,078,000 | 1,692,123 | ||||||||||||
U.S. Treasury Bond | 4.38 | 5-15-2041 | 842,000 | 1,332,531 | ||||||||||||
U.S. Treasury Bond | 4.50 | 2-15-2036 | 837,000 | 1,266,551 | ||||||||||||
U.S. Treasury Bond | 4.50 | 5-15-2038 | 428,000 | 668,600 | ||||||||||||
U.S. Treasury Bond | 4.50 | 8-15-2039 | 721,000 | 1,140,109 | ||||||||||||
U.S. Treasury Bond | 4.63 | 2-15-2040 | 730,000 | 1,175,443 | ||||||||||||
U.S. Treasury Bond | 4.75 | 2-15-2037 | 264,000 | 415,975 | ||||||||||||
U.S. Treasury Bond | 4.75 | 2-15-2041 | 1,084,000 | 1,787,965 | ||||||||||||
U.S. Treasury Bond | 5.00 | 5-15-2037 | 375,000 | 607,544 | ||||||||||||
U.S. Treasury Bond | 5.25 | 11-15-2028 | 479,000 | 658,868 | ||||||||||||
The accompanying notes are an integral part of these financial statements.
26 | Wells Fargo Index Asset Allocation Fund
Table of Contents
Portfolio of investments—September 30, 2020
| Interest rate | Maturity date | Principal | Value | |||||||||||||
| U.S. Treasury Securities (continued) | ||||||||||||||||
U.S. Treasury Bond | 5.25 | % | 2-15-2029 | $ | 349,000 | $ | 483,324 | |||||||||
U.S. Treasury Bond | 5.38 | 2-15-2031 | 752,000 | 1,107,849 | ||||||||||||
U.S. Treasury Bond | 5.50 | 8-15-2028 | 369,000 | 511,137 | ||||||||||||
U.S. Treasury Bond | 6.13 | 11-15-2027 | 525,000 | 734,262 | ||||||||||||
U.S. Treasury Bond | 6.13 | 8-15-2029 | 293,000 | 434,041 | ||||||||||||
U.S. Treasury Bond | 6.25 | 5-15-2030 | 478,000 | 729,790 | ||||||||||||
U.S. Treasury Bond | 6.38 | 8-15-2027 | 224,000 | 314,195 | ||||||||||||
U.S. Treasury Bond | 6.88 | 8-15-2025 | 224,000 | 295,593 | ||||||||||||
U.S. Treasury Note | 0.13 | 4-30-2022 | 2,499,000 | 2,498,707 | ||||||||||||
U.S. Treasury Note | 0.13 | 5-31-2022 | 2,659,000 | 2,658,377 | ||||||||||||
U.S. Treasury Note | 0.13 | 5-15-2023 | 2,501,000 | 2,499,242 | ||||||||||||
U.S. Treasury Note | 0.25 | 4-15-2023 | 2,385,000 | 2,390,963 | ||||||||||||
U.S. Treasury Note | 0.25 | 5-31-2025 | 2,714,000 | 2,713,576 | ||||||||||||
U.S. Treasury Note | 0.25 | 7-31-2025 | 3,039,000 | 3,036,270 | ||||||||||||
U.S. Treasury Note | 0.38 | 4-30-2025 | 2,591,000 | 2,605,878 | ||||||||||||
U.S. Treasury Note | 0.50 | 3-15-2023 | 2,052,000 | 2,069,554 | ||||||||||||
U.S. Treasury Note | 0.50 | 3-31-2025 | 2,469,000 | 2,496,969 | ||||||||||||
U.S. Treasury Note | 0.50 | 4-30-2027 | 2,015,000 | 2,023,894 | ||||||||||||
U.S. Treasury Note | 0.50 | 5-31-2027 | 2,282,000 | 2,291,181 | ||||||||||||
U.S. Treasury Note | 0.50 | 6-30-2027 | 2,520,000 | 2,529,253 | ||||||||||||
U.S. Treasury Note | 0.63 | 3-31-2027 | 1,681,000 | 1,702,275 | ||||||||||||
U.S. Treasury Note | 0.63 | 5-15-2030 | 3,675,000 | 3,661,793 | ||||||||||||
U.S. Treasury Note | 1.13 | 8-31-2021 | 1,807,000 | 1,822,811 | ||||||||||||
U.S. Treasury Note | 1.13 | 9-30-2021 | 2,188,000 | 2,209,196 | ||||||||||||
U.S. Treasury Note | 1.13 | 2-28-2025 | 2,444,000 | 2,539,182 | ||||||||||||
U.S. Treasury Note | 1.13 | 2-28-2027 | 964,000 | 1,007,305 | ||||||||||||
U.S. Treasury Note | 1.25 | 10-31-2021 | 2,188,000 | 2,214,153 | ||||||||||||
U.S. Treasury Note | 1.25 | 7-31-2023 | 1,829,000 | 1,885,227 | ||||||||||||
U.S. Treasury Note | 1.25 | 8-31-2024 | 1,400,000 | 1,456,383 | ||||||||||||
U.S. Treasury Note | 1.38 | 1-31-2022 | 2,315,000 | 2,352,800 | ||||||||||||
U.S. Treasury Note | 1.38 | 10-15-2022 | 2,223,000 | 2,278,836 | ||||||||||||
U.S. Treasury Note | 1.38 | 2-15-2023 | 1,589,000 | 1,635,056 | ||||||||||||
U.S. Treasury Note | 1.38 | 6-30-2023 | 1,733,000 | 1,791,218 | ||||||||||||
U.S. Treasury Note | 1.38 | 8-31-2023 | 1,817,000 | 1,881,305 | ||||||||||||
U.S. Treasury Note | 1.38 | 9-30-2023 | 1,778,000 | 1,842,522 | ||||||||||||
U.S. Treasury Note | 1.38 | 1-31-2025 | 2,372,000 | 2,488,191 | ||||||||||||
U.S. Treasury Note | 1.38 | 8-31-2026 | 1,787,000 | 1,891,916 | ||||||||||||
U.S. Treasury Note | 1.50 | 10-31-2021 | 2,358,000 | 2,392,449 | ||||||||||||
U.S. Treasury Note | 1.50 | 11-30-2021 | 2,360,000 | 2,396,691 | ||||||||||||
U.S. Treasury Note | 1.50 | 1-31-2022 | 1,625,000 | 1,654,326 | ||||||||||||
U.S. Treasury Note | 1.50 | 8-15-2022 | 2,254,000 | 2,311,407 | ||||||||||||
U.S. Treasury Note | 1.50 | 9-15-2022 | 2,264,000 | 2,324,226 | ||||||||||||
U.S. Treasury Note | 1.50 | 1-15-2023 | 2,250,000 | 2,319,434 | ||||||||||||
U.S. Treasury Note | 1.50 | 2-28-2023 | 1,635,000 | 1,688,393 | ||||||||||||
U.S. Treasury Note | 1.50 | 3-31-2023 | 1,679,000 | 1,735,469 | ||||||||||||
U.S. Treasury Note | 1.50 | 9-30-2024 | 2,442,000 | 2,566,676 | ||||||||||||
U.S. Treasury Note | 1.50 | 10-31-2024 | 2,391,000 | 2,514,940 | ||||||||||||
U.S. Treasury Note | 1.50 | 11-30-2024 | 2,394,000 | 2,520,246 | ||||||||||||
U.S. Treasury Note | 1.50 | 8-15-2026 | 3,430,000 | 3,655,764 | ||||||||||||
U.S. Treasury Note | 1.63 | 12-31-2021 | 2,357,000 | 2,400,089 | ||||||||||||
U.S. Treasury Note | 1.63 | 8-15-2022 | 1,250,000 | 1,284,912 | ||||||||||||
U.S. Treasury Note | 1.63 | 8-31-2022 | 1,827,000 | 1,878,955 | ||||||||||||
U.S. Treasury Note | 1.63 | 11-15-2022 | 3,435,000 | 3,542,478 | ||||||||||||
U.S. Treasury Note | 1.63 | 12-15-2022 | 2,239,000 | 2,312,205 | ||||||||||||
U.S. Treasury Note | 1.63 | 4-30-2023 | 1,711,000 | 1,776,031 | ||||||||||||
U.S. Treasury Note | 1.63 | 5-31-2023 | 1,714,000 | 1,781,288 | ||||||||||||
The accompanying notes are an integral part of these financial statements.
Wells Fargo Index Asset Allocation Fund | 27
Table of Contents
Portfolio of investments—September 30, 2020
| Interest rate | Maturity date | Principal | Value | |||||||||||||
| U.S. Treasury Securities (continued) | ||||||||||||||||
U.S. Treasury Note | 1.63 | % | 10-31-2023 | $ | 1,824,000 | $ | 1,906,080 | |||||||||
U.S. Treasury Note | 1.63 | 2-15-2026 | 3,342,000 | 3,573,851 | ||||||||||||
U.S. Treasury Note | 1.63 | 5-15-2026 | 3,385,000 | 3,625,917 | ||||||||||||
U.S. Treasury Note | 1.63 | 9-30-2026 | 1,851,000 | 1,988,017 | ||||||||||||
U.S. Treasury Note | 1.63 | 10-31-2026 | 1,800,000 | 1,934,086 | ||||||||||||
U.S. Treasury Note | 1.63 | 11-30-2026 | 1,912,000 | 2,055,624 | ||||||||||||
U.S. Treasury Note | 1.63 | 8-15-2029 | 2,854,000 | 3,106,401 | ||||||||||||
U.S. Treasury Note | 1.75 | 11-30-2021 | 2,003,000 | 2,040,322 | ||||||||||||
U.S. Treasury Note | 1.75 | 2-28-2022 | 1,637,000 | 1,674,152 | ||||||||||||
U.S. Treasury Note | 1.75 | 3-31-2022 | 1,640,000 | 1,679,463 | ||||||||||||
U.S. Treasury Note | 1.75 | 4-30-2022 | 1,612,000 | 1,652,993 | ||||||||||||
U.S. Treasury Note | 1.75 | 5-15-2022 | 1,448,000 | 1,485,784 | ||||||||||||
U.S. Treasury Note | 1.75 | 5-31-2022 | 1,819,000 | 1,867,744 | ||||||||||||
U.S. Treasury Note | 1.75 | 6-15-2022 | 2,235,000 | 2,296,113 | ||||||||||||
U.S. Treasury Note | 1.75 | 6-30-2022 | 1,819,000 | 1,870,159 | ||||||||||||
U.S. Treasury Note | 1.75 | 7-15-2022 | 2,129,000 | 2,190,042 | ||||||||||||
U.S. Treasury Note | 1.75 | 9-30-2022 | 1,771,000 | 1,828,142 | ||||||||||||
U.S. Treasury Note | 1.75 | 1-31-2023 | 1,684,000 | 1,746,821 | ||||||||||||
U.S. Treasury Note | 1.75 | 5-15-2023 | 3,117,000 | 3,246,916 | ||||||||||||
U.S. Treasury Note | 1.75 | 6-30-2024 | 2,424,000 | 2,564,327 | ||||||||||||
U.S. Treasury Note | 1.75 | 7-31-2024 | 2,406,000 | 2,547,916 | ||||||||||||
U.S. Treasury Note | 1.75 | 12-31-2024 | 2,381,000 | 2,533,719 | ||||||||||||
U.S. Treasury Note | 1.75 | 12-31-2026 | 1,893,000 | 2,051,391 | ||||||||||||
U.S. Treasury Note | 1.75 | 11-15-2029 | 3,007,000 | 3,310,402 | ||||||||||||
U.S. Treasury Note | 1.88 | 11-30-2021 | 1,649,000 | 1,682,109 | ||||||||||||
U.S. Treasury Note | 1.88 | 1-31-2022 | 1,826,000 | 1,868,226 | ||||||||||||
U.S. Treasury Note | 1.88 | 2-28-2022 | 1,725,000 | 1,766,980 | ||||||||||||
U.S. Treasury Note | 1.88 | 3-31-2022 | 1,810,000 | 1,856,947 | ||||||||||||
U.S. Treasury Note | 1.88 | 4-30-2022 | 1,812,000 | 1,861,688 | ||||||||||||
U.S. Treasury Note | 1.88 | 5-31-2022 | 1,795,000 | 1,846,887 | ||||||||||||
U.S. Treasury Note | 1.88 | 7-31-2022 | 1,815,000 | 1,872,711 | ||||||||||||
U.S. Treasury Note | 1.88 | 8-31-2022 | 1,754,000 | 1,812,170 | ||||||||||||
U.S. Treasury Note | 1.88 | 9-30-2022 | 2,248,000 | 2,325,978 | ||||||||||||
U.S. Treasury Note | 1.88 | 10-31-2022 | 1,650,000 | 1,709,490 | ||||||||||||
U.S. Treasury Note | 1.88 | 8-31-2024 | 1,345,000 | 1,432,162 | ||||||||||||
U.S. Treasury Note | 1.88 | 6-30-2026 | 1,825,000 | 1,982,691 | ||||||||||||
U.S. Treasury Note | 1.88 | 7-31-2026 | 1,828,000 | 1,987,450 | ||||||||||||
U.S. Treasury Note | 2.00 | 8-31-2021 | 1,641,000 | 1,668,435 | ||||||||||||
U.S. Treasury Note | 2.00 | 10-31-2021 | 1,649,000 | 1,681,916 | ||||||||||||
U.S. Treasury Note | 2.00 | 11-15-2021 | 2,485,000 | 2,536,156 | ||||||||||||
U.S. Treasury Note | 2.00 | 12-31-2021 | 1,821,000 | 1,862,968 | ||||||||||||
U.S. Treasury Note | 2.00 | 2-15-2022 | 1,679,000 | 1,721,696 | ||||||||||||
U.S. Treasury Note | 2.00 | 7-31-2022 | 1,778,000 | 1,838,494 | ||||||||||||
U.S. Treasury Note | 2.00 | 10-31-2022 | 2,238,000 | 2,324,723 | ||||||||||||
U.S. Treasury Note | 2.00 | 11-30-2022 | 3,346,000 | 3,480,363 | ||||||||||||
U.S. Treasury Note | 2.00 | 2-15-2023 | 3,077,000 | 3,211,138 | ||||||||||||
U.S. Treasury Note | 2.00 | 4-30-2024 | 1,930,000 | 2,054,319 | ||||||||||||
U.S. Treasury Note | 2.00 | 5-31-2024 | 1,934,000 | 2,061,145 | ||||||||||||
U.S. Treasury Note | 2.00 | 6-30-2024 | 1,939,000 | 2,069,277 | ||||||||||||
U.S. Treasury Note | 2.00 | 2-15-2025 | 3,537,000 | 3,806,973 | ||||||||||||
U.S. Treasury Note | 2.00 | 8-15-2025 | 3,491,000 | 3,782,144 | ||||||||||||
U.S. Treasury Note | 2.00 | 11-15-2026 | 3,370,000 | 3,698,575 | ||||||||||||
U.S. Treasury Note | 2.13 | 8-15-2021 | 2,440,000 | 2,482,033 | ||||||||||||
U.S. Treasury Note | 2.13 | 9-30-2021 | 1,633,000 | 1,664,958 | ||||||||||||
U.S. Treasury Note | 2.13 | 12-31-2021 | 1,626,000 | 1,666,015 | ||||||||||||
U.S. Treasury Note | 2.13 | 5-15-2022 | 2,105,000 | 2,172,508 | ||||||||||||
The accompanying notes are an integral part of these financial statements.
28 | Wells Fargo Index Asset Allocation Fund
Table of Contents
Portfolio of investments—September 30, 2020
| Interest rate | Maturity date | Principal | Value | |||||||||||||
| U.S. Treasury Securities (continued) | ||||||||||||||||
U.S. Treasury Note | 2.13 | % | 6-30-2022 | $ | 1,615,000 | $ | 1,671,020 | |||||||||
U.S. Treasury Note | 2.13 | 12-31-2022 | 3,385,000 | 3,535,606 | ||||||||||||
U.S. Treasury Note | 2.13 | 11-30-2023 | 1,638,000 | 1,738,903 | ||||||||||||
U.S. Treasury Note | 2.13 | 2-29-2024 | 1,298,000 | 1,383,840 | ||||||||||||
U.S. Treasury Note | 2.13 | 3-31-2024 | 1,961,000 | 2,093,444 | ||||||||||||
U.S. Treasury Note | 2.13 | 7-31-2024 | 1,927,000 | 2,068,062 | ||||||||||||
U.S. Treasury Note | 2.13 | 5-15-2025 | 3,005,000 | 3,262,421 | ||||||||||||
U.S. Treasury Note | 2.13 | 5-31-2026 | 1,793,000 | 1,971,530 | ||||||||||||
U.S. Treasury Note | 2.25 | 7-31-2021 | 1,573,000 | 1,600,528 | ||||||||||||
U.S. Treasury Note | 2.25 | 4-15-2022 | 2,204,000 | 2,275,200 | ||||||||||||
U.S. Treasury Note | 2.25 | 12-31-2023 | 1,247,000 | 1,330,783 | ||||||||||||
U.S. Treasury Note | 2.25 | 1-31-2024 | 1,334,000 | 1,425,660 | ||||||||||||
U.S. Treasury Note | 2.25 | 4-30-2024 | 2,418,000 | 2,595,383 | ||||||||||||
U.S. Treasury Note | 2.25 | 10-31-2024 | 1,882,000 | 2,037,044 | ||||||||||||
U.S. Treasury Note | 2.25 | 11-15-2024 | 3,535,000 | 3,827,742 | ||||||||||||
U.S. Treasury Note | 2.25 | 12-31-2024 | 1,911,000 | 2,073,808 | ||||||||||||
U.S. Treasury Note | 2.25 | 11-15-2025 | 3,473,000 | 3,816,908 | ||||||||||||
U.S. Treasury Note | 2.25 | 3-31-2026 | 1,872,000 | 2,067,536 | ||||||||||||
U.S. Treasury Note | 2.25 | 2-15-2027 | 3,350,000 | 3,739,307 | ||||||||||||
U.S. Treasury Note | 2.25 | 8-15-2027 | 3,338,000 | 3,743,645 | ||||||||||||
U.S. Treasury Note | 2.25 | 11-15-2027 | 3,248,000 | 3,651,209 | ||||||||||||
U.S. Treasury Note | 2.38 | 3-15-2022 | 2,243,000 | 2,315,898 | ||||||||||||
U.S. Treasury Note | 2.38 | 1-31-2023 | 2,325,000 | 2,445,700 | ||||||||||||
U.S. Treasury Note | 2.38 | 2-29-2024 | 1,671,000 | 1,795,542 | ||||||||||||
U.S. Treasury Note | 2.38 | 8-15-2024 | 3,101,000 | 3,359,982 | ||||||||||||
U.S. Treasury Note | 2.38 | 4-30-2026 | 1,812,000 | 2,015,921 | ||||||||||||
U.S. Treasury Note | 2.38 | 5-15-2027 | 3,375,000 | 3,803,994 | ||||||||||||
U.S. Treasury Note | 2.38 | 5-15-2029 | 3,295,000 | 3,791,181 | ||||||||||||
U.S. Treasury Note | 2.50 | 1-15-2022 | 2,241,000 | 2,309,018 | ||||||||||||
U.S. Treasury Note | 2.50 | 2-15-2022 | 2,245,000 | 2,317,612 | ||||||||||||
U.S. Treasury Note | 2.50 | 3-31-2023 | 2,278,000 | 2,411,744 | ||||||||||||
U.S. Treasury Note | 2.50 | 8-15-2023 | 2,662,000 | 2,840,437 | ||||||||||||
U.S. Treasury Note | 2.50 | 1-31-2024 | 1,876,000 | 2,020,511 | ||||||||||||
U.S. Treasury Note | 2.50 | 5-15-2024 | 3,424,000 | 3,708,754 | ||||||||||||
U.S. Treasury Note | 2.50 | 1-31-2025 | 1,936,000 | 2,125,138 | ||||||||||||
U.S. Treasury Note | 2.50 | 2-28-2026 | 1,888,000 | 2,108,734 | ||||||||||||
U.S. Treasury Note | 2.63 | 12-15-2021 | 2,277,000 | 2,344,776 | ||||||||||||
U.S. Treasury Note | 2.63 | 2-28-2023 | 2,359,000 | 2,499,895 | ||||||||||||
U.S. Treasury Note | 2.63 | 6-30-2023 | 2,304,000 | 2,459,970 | ||||||||||||
U.S. Treasury Note | 2.63 | 12-31-2023 | 2,404,000 | 2,594,254 | ||||||||||||
U.S. Treasury Note | 2.63 | 3-31-2025 | 1,884,000 | 2,084,396 | ||||||||||||
U.S. Treasury Note | 2.63 | 12-31-2025 | 1,914,000 | 2,144,727 | ||||||||||||
U.S. Treasury Note | 2.63 | 1-31-2026 | 1,869,000 | 2,097,149 | ||||||||||||
U.S. Treasury Note | 2.63 | 2-15-2029 | 3,512,000 | 4,101,358 | ||||||||||||
U.S. Treasury Note | 2.75 | 4-30-2023 | 2,279,000 | 2,431,319 | ||||||||||||
U.S. Treasury Note | 2.75 | 5-31-2023 | 2,334,000 | 2,495,010 | ||||||||||||
U.S. Treasury Note | 2.75 | 7-31-2023 | 2,347,000 | 2,518,716 | ||||||||||||
U.S. Treasury Note | 2.75 | 8-31-2023 | 2,402,000 | 2,582,431 | ||||||||||||
U.S. Treasury Note | 2.75 | 11-15-2023 | 3,078,000 | 3,324,721 | ||||||||||||
U.S. Treasury Note | 2.75 | 2-15-2024 | 2,325,000 | 2,526,167 | ||||||||||||
U.S. Treasury Note | 2.75 | 2-28-2025 | 1,955,000 | 2,170,508 | ||||||||||||
U.S. Treasury Note | 2.75 | 6-30-2025 | 1,959,000 | 2,188,341 | ||||||||||||
U.S. Treasury Note | 2.75 | 8-31-2025 | 2,020,000 | 2,263,663 | ||||||||||||
U.S. Treasury Note | 2.75 | 2-15-2028 | 3,068,000 | 3,568,707 | ||||||||||||
U.S. Treasury Note | 2.88 | 10-15-2021 | 2,081,000 | 2,139,853 | ||||||||||||
U.S. Treasury Note | 2.88 | 11-15-2021 | 2,137,000 | 2,201,945 | ||||||||||||
The accompanying notes are an integral part of these financial statements.
Wells Fargo Index Asset Allocation Fund | 29
Table of Contents
Portfolio of investments—September 30, 2020
| Interest rate | Maturity date | Principal | Value | |||||||||||||
| U.S. Treasury Securities (continued) | ||||||||||||||||
U.S. Treasury Note | 2.88 | % | 9-30-2023 | $ | 2,444,000 | $ | 2,641,620 | |||||||||
U.S. Treasury Note | 2.88 | 10-31-2023 | 2,318,000 | 2,510,503 | ||||||||||||
U.S. Treasury Note | 2.88 | 11-30-2023 | 2,370,000 | 2,571,913 | ||||||||||||
U.S. Treasury Note | 2.88 | 4-30-2025 | 1,884,000 | 2,109,050 | ||||||||||||
U.S. Treasury Note | 2.88 | 5-31-2025 | 1,939,000 | 2,174,104 | ||||||||||||
U.S. Treasury Note | 2.88 | 7-31-2025 | 1,949,000 | 2,192,473 | ||||||||||||
U.S. Treasury Note | 2.88 | 11-30-2025 | 1,880,000 | 2,127,998 | ||||||||||||
U.S. Treasury Note | 2.88 | 8-15-2028 | 3,133,000 | 3,698,021 | ||||||||||||
U.S. Treasury Note | 3.00 | 9-30-2025 | 1,994,000 | 2,262,645 | ||||||||||||
U.S. Treasury Note | 3.00 | 10-31-2025 | 1,814,000 | 2,061,441 | ||||||||||||
U.S. Treasury Note | 3.13 | 11-15-2028 | 3,621,000 | 4,361,466 | ||||||||||||
U.S. Treasury Note | 6.00 | 2-15-2026 | 445,000 | 579,543 | ||||||||||||
U.S. Treasury Note | 6.25 | 8-15-2023 | 378,000 | 444,180 | ||||||||||||
U.S. Treasury Note | 6.50 | 11-15-2026 | 296,000 | 405,890 | ||||||||||||
U.S. Treasury Note | 6.63 | 2-15-2027 | 215,000 | 299,497 | ||||||||||||
U.S. Treasury Note | 6.75 | 8-15-2026 | 221,000 | 303,288 | ||||||||||||
U.S. Treasury Note | 7.13 | 2-15-2023 | 260,000 | 303,144 | ||||||||||||
U.S. Treasury Note | 7.25 | 8-15-2022 | 261,000 | 295,746 | ||||||||||||
U.S. Treasury Note | 7.50 | 11-15-2024 | 240,000 | 312,019 | ||||||||||||
U.S. Treasury Note | 7.63 | 11-15-2022 | 140,000 | 162,269 | ||||||||||||
U.S. Treasury Note | 7.63 | 2-15-2025 | 216,000 | 285,542 | ||||||||||||
U.S. Treasury Note | 8.00 | 11-15-2021 | 511,000 | 555,872 | ||||||||||||
U.S. Treasury Note | 8.13 | 8-15-2021 | 175,000 | 187,182 | ||||||||||||
Total U.S. Treasury Securities (Cost $508,234,187) | 558,688,900 | |||||||||||||||
|
| |||||||||||||||
| Yield | Shares | |||||||||||||||
| Short-Term Investments: 3.20% | ||||||||||||||||
| Investment Companies: 3.20% | ||||||||||||||||
Securities Lending Cash Investments LLC (l)(r)(u) | 0.12 | 727,900 | 727,900 | |||||||||||||
Wells Fargo Government Money Market Fund Select Class (l)(u) | 0.05 | 46,480,772 | 46,480,772 | |||||||||||||
Total Short-Term Investments (Cost $47,208,672) | 47,208,672 | |||||||||||||||
|
| |||||||||||||||
| Total investments in securities (Cost $892,048,071) | 101.16 | % | 1,490,967,798 | |||||
Other assets and liabilities, net | (1.16 | ) | (17,121,360 | ) | ||||
|
|
|
| |||||
| Total net assets | 100.00 | % | $ | 1,473,846,438 | ||||
|
|
|
| |||||
| † | Non-income-earning security |
| « | All or a portion of this security is on loan. |
| (l) | The issuer of the security is an affiliated person of the Fund as defined in the Investment Company Act of 1940. |
| ± | Variable rate investment. The rate shown is the rate in effect at period end. |
| (r) | The investment is a non-registered investment company purchased with cash collateral received from securities on loan. |
| (u) | The rate represents the 7-day annualized yield at period end. |
Abbreviations:
| FNMA | Federal National Mortgage Association |
| LIBOR | London Interbank Offered Rate |
| REIT | Real estate investment trust |
The accompanying notes are an integral part of these financial statements.
30 | Wells Fargo Index Asset Allocation Fund
Table of Contents
Portfolio of investments—September 30, 2020
Futures Contracts
| Description | Number of contracts | Expiration date | Notional cost | Notional value | Unrealized gains | Unrealized losses | ||||||||||||||||||
Long | ||||||||||||||||||||||||
10-Year U.S. Treasury Notes | 82 | 12-21-2020 | $ | 11,442,342 | $ | 11,441,563 | $ | 0 | $ | (779 | ) | |||||||||||||
U.S. Long Term Bonds | 13 | 12-21-2020 | 2,295,566 | 2,291,656 | 0 | (3,910 | ) | |||||||||||||||||
U.S. Ultra Bond | 61 | 12-21-2020 | 13,565,695 | 13,530,563 | 0 | (35,132 | ) | |||||||||||||||||
2-Year U.S. Treasury Notes | 21 | 12-31-2020 | 4,639,570 | 4,640,180 | 610 | 0 | ||||||||||||||||||
5-Year U.S. Treasury Notes | 119 | 12-31-2020 | 14,986,008 | 14,997,719 | 11,711 | 0 | ||||||||||||||||||
Short | ||||||||||||||||||||||||
U.S. Long Term Bonds | (11) | 12-21-2020 | (1,945,127 | ) | (1,939,093 | ) | 6,034 | 0 | ||||||||||||||||
U.S. Ultra Bond | (407) | 12-21-2020 | (89,279,031 | ) | (90,277,688 | ) | 0 | (998,657 | ) | |||||||||||||||
5-Year U.S. Treasury Notes | (31) | 12-31-2020 | (3,908,097 | ) | (3,906,969 | ) | 1,128 | 0 | ||||||||||||||||
|
|
|
| |||||||||||||||||||||
| $ | 19,483 | $ | (1,038,478 | ) | ||||||||||||||||||||
|
|
|
| |||||||||||||||||||||
Investments in Affiliates
An affiliated investment is an investment in which the Fund owns at least 5% of the outstanding voting shares of the issuer or as a result of other relationships, such as the Fund and the issuer having the same investment manager. Transactions with issuers that were either affiliated persons of the Fund at the beginning of the period or the end of the period were as follows:
| Value, beginning of period | Purchases | Sales proceeds | Net realized gains (losses) | Net change in unrealized gains (losses) | Income from affiliated securities | Value, end of period | % of net assets | |||||||||||||||||||||||||
| Common Stocks | ||||||||||||||||||||||||||||||||
Financials | ||||||||||||||||||||||||||||||||
Banks | ||||||||||||||||||||||||||||||||
Wells Fargo & Company | $ | 6,533,039 | $ | 555,566 | $ | (776,700 | ) | $ | 62,177 | $ | (3,302,500 | ) | $ | 200,684 | $ | 3,071,582 | 0.21 | % | ||||||||||||||
Short-Term Investments | ||||||||||||||||||||||||||||||||
Investment Companies | ||||||||||||||||||||||||||||||||
Securities Lending Cash Investments LLC | 819,373 | 18,620,545 | (18,712,200 | ) | 182 | 0 | 8,149 | # | 727,900 | |||||||||||||||||||||||
Wells Fargo Government Money Market Fund Select Class | 12,325,531 | 322,216,978 | (288,061,737 | ) | 0 | 0 | 114,104 | 46,480,772 | 3.20 | |||||||||||||||||||||||
|
|
|
|
|
|
|
|
|
| |||||||||||||||||||||||
| $ | 62,359 | $ | (3,302,500 | ) | $ | 322,937 | $ | 50,280,254 | 3.41 | % | ||||||||||||||||||||||
|
|
|
|
|
|
|
|
|
| |||||||||||||||||||||||
| # | Amount shown represents income before fees and rebates. |
The accompanying notes are an integral part of these financial statements.
Wells Fargo Index Asset Allocation Fund | 31
Table of Contents
Statement of assets and liabilities—September 30, 2020
Assets | ||||
Investments in unaffiliated securities (including $720,661 of securities loaned), at value (cost $841,196,071) | $ | 1,440,687,544 | ||
Investments in affiliated securities, at value (cost $50,852,000) | 50,280,254 | |||
Cash | 4,891 | |||
Segregated cash for futures contracts | 5,447,235 | |||
Receivable for investments sold | 5,205,572 | |||
Receivable for Fund shares sold | 1,275,398 | |||
Receivable for dividends and interest | 3,138,529 | |||
Receivable for daily variation margin on open futures contracts | 600,716 | |||
Receivable for securities lending income, net | 275 | |||
Prepaid expenses and other assets | 473,487 | |||
|
| |||
Total assets | 1,507,113,901 | |||
|
| |||
Liabilities | ||||
Payable upon receipt of securities loaned | 727,900 | |||
Payable for investments purchased | 30,544,007 | |||
Payable for Fund shares redeemed | 811,023 | |||
Management fee payable | 687,355 | |||
Administration fees payable | 226,524 | |||
Distribution fee payable | 89,149 | |||
Trustees’ fees and expenses payable | 3,313 | |||
Accrued expenses and other liabilities | 178,192 | |||
|
| |||
Total liabilities | 33,267,463 | |||
|
| |||
Total net assets | $ | 1,473,846,438 | ||
|
| |||
Net assets consist of | ||||
Paid-in capital | $ | 863,970,458 | ||
Total distributable earnings | 609,875,980 | |||
|
| |||
Total net assets | $ | 1,473,846,438 | ||
|
| |||
Computation of net asset value and offering price per share | ||||
Net assets – Class A | $ | 907,134,363 | ||
Shares outstanding – Class A1 | 23,328,359 | |||
Net asset value per share – Class A | $38.89 | |||
Maximum offering price per share – Class A2 | $41.26 | |||
Net assets – Class C | $ | 144,828,093 | ||
Shares outstanding – Class C1 | 6,126,512 | |||
Net asset value per share – Class C | $23.64 | |||
Net assets – Administrator Class | $ | 281,988,256 | ||
Shares outstanding – Administrator Class1 | 7,250,948 | |||
Net asset value per share – Administrator Class | $38.89 | |||
Net assets – Institutional Class | $ | 139,895,726 | ||
Shares outstanding – Institutional Class1 | 3,601,743 | |||
Net asset value per share – Institutional Class | $38.84 | |||
| 1 | The Fund has an unlimited number of authorized shares. |
| 2 | Maximum offering price is computed as 100/94.25 of net asset value. On investments of $50,000 or more, the offering price is reduced. |
The accompanying notes are an integral part of these financial statements.
32 | Wells Fargo Index Asset Allocation Fund
Table of Contents
Statement of operations—year ended September 30, 2020
Investment income | ||||
Dividends | $ | 15,475,165 | ||
Interest | 10,411,665 | |||
Income from affiliated securities | 318,814 | |||
|
| |||
Total investment income | 26,205,644 | |||
|
| |||
Expenses | ||||
Management fee | 8,300,974 | |||
Administration fees | ||||
Class A | 1,789,415 | |||
Class C | 305,756 | |||
Administrator Class | 322,594 | |||
Institutional Class | 165,171 | |||
Shareholder servicing fees | ||||
Class A | 2,129,454 | |||
Class C | 363,846 | |||
Administrator Class | 620,147 | |||
Distribution fee | ||||
Class C | 1,091,361 | |||
Custody and accounting fees | 94,392 | |||
Professional fees | 50,215 | |||
Registration fees | 92,569 | |||
Shareholder report expenses | 111,821 | |||
Trustees’ fees and expenses | 21,260 | |||
Other fees and expenses | 147,149 | |||
|
| |||
Total expenses | 15,606,124 | |||
Less: Fee waivers and/or expense reimbursements | ||||
Fund-level | (301,125 | ) | ||
Class A | (39,833 | ) | ||
Class C | (58 | ) | ||
Administrator Class | (249,324 | ) | ||
|
| |||
Net expenses | 15,015,784 | |||
|
| |||
Net investment income | 11,189,860 | |||
|
| |||
Realized and unrealized gains on investments | ||||
Net realized gains on | ||||
Unaffiliated securities | 23,993,467 | |||
Affiliated securities | 62,359 | |||
Futures contracts | 15,988,206 | |||
|
| |||
Net realized gains on investments | 40,044,032 | |||
|
| |||
Net change in unrealized gains (losses) on | ||||
Unaffiliated securities | 119,020,835 | |||
Affiliated securities | (3,302,500 | ) | ||
Futures contracts | 13,775 | |||
|
| |||
Net change in unrealized gains (losses) on investments | 115,732,110 | |||
|
| |||
Net realized and unrealized gains (losses) on investments | 155,776,142 | |||
|
| |||
Net increase in net assets resulting from operations | $ | 166,966,002 | ||
|
| |||
The accompanying notes are an integral part of these financial statements.
Wells Fargo Index Asset Allocation Fund | 33
Table of Contents
Statement of changes in net assets
| Year ended September 30, 2020 | Year ended September 30, 2019 | |||||||||||||||
Operations | ||||||||||||||||
Net investment income | $ | 11,189,860 | $ | 12,377,035 | ||||||||||||
Net realized gains on investments | 40,044,032 | 12,893,012 | ||||||||||||||
Net change in unrealized gains (losses) on investments | 115,732,110 | 43,905,080 | ||||||||||||||
|
| |||||||||||||||
Net increase in net assets resulting from operations | 166,966,002 | 69,175,127 | ||||||||||||||
|
| |||||||||||||||
Distributions to shareholders from net investment income and net realized gains | ||||||||||||||||
Class A | (17,758,837 | ) | (30,578,240 | ) | ||||||||||||
Class C | (2,008,094 | ) | (4,678,185 | ) | ||||||||||||
Administrator Class | (5,552,976 | ) | (8,535,707 | ) | ||||||||||||
Institutional Class | (3,074,796 | ) | (4,671,806 | ) | ||||||||||||
|
| |||||||||||||||
Total distributions to shareholders | (28,394,703 | ) | (48,463,938 | ) | ||||||||||||
|
| |||||||||||||||
Capital share transactions | Shares | Shares | ||||||||||||||
Proceeds from shares sold | ||||||||||||||||
Class A | 1,620,062 | 59,463,146 | 1,611,898 | 53,557,954 | ||||||||||||
Class C | 1,140,277 | 25,072,330 | 1,502,173 | 30,141,540 | ||||||||||||
Administrator Class | 2,246,311 | 82,510,100 | 1,697,812 | 56,951,283 | ||||||||||||
Institutional Class | 941,118 | 34,233,056 | 1,028,853 | 34,231,892 | ||||||||||||
|
| |||||||||||||||
| 201,278,632 | 174,882,669 | |||||||||||||||
|
| |||||||||||||||
Reinvestment of distributions | ||||||||||||||||
Class A | 487,086 | 17,291,503 | 923,477 | 29,806,219 | ||||||||||||
Class C | 82,795 | 1,783,971 | 218,202 | 4,231,633 | ||||||||||||
Administrator Class | 155,359 | 5,523,135 | 262,175 | 8,483,181 | ||||||||||||
Institutional Class | 59,824 | 2,126,023 | 94,639 | 3,065,617 | ||||||||||||
|
| |||||||||||||||
| 26,724,632 | 45,586,650 | |||||||||||||||
|
| |||||||||||||||
Payment for shares redeemed | ||||||||||||||||
Class A | (2,527,189 | ) | (90,588,709 | ) | (2,768,227 | ) | (92,564,816 | ) | ||||||||
Class C | (1,850,849 | ) | (40,492,095 | ) | (2,243,406 | ) | (45,218,687 | ) | ||||||||
Administrator Class | (1,679,186 | ) | (60,419,227 | ) | (1,685,138 | ) | (56,224,079 | ) | ||||||||
Institutional Class | (918,575 | ) | (32,675,213 | ) | (800,255 | ) | (26,710,901 | ) | ||||||||
|
| |||||||||||||||
| (224,175,244 | ) | (220,718,483 | ) | |||||||||||||
|
| |||||||||||||||
Net increase (decrease) in net assets resulting from capital share transactions | 3,828,020 | (249,164 | ) | |||||||||||||
|
| |||||||||||||||
Total increase in net assets | 142,399,319 | 20,462,025 | ||||||||||||||
|
| |||||||||||||||
Net assets | ||||||||||||||||
Beginning of period | 1,331,447,119 | 1,310,985,094 | ||||||||||||||
|
| |||||||||||||||
End of period | $ | 1,473,846,438 | $ | 1,331,447,119 | ||||||||||||
|
| |||||||||||||||
The accompanying notes are an integral part of these financial statements.
34 | Wells Fargo Index Asset Allocation Fund
Table of Contents
(For a share outstanding throughout each period)
| Year ended September 30 | ||||||||||||||||||||
| CLASS A | 2020 | 2019 | 2018 | 2017 | 2016 | |||||||||||||||
Net asset value, beginning of period | $35.13 | $34.63 | $31.99 | $29.61 | $28.72 | |||||||||||||||
Net investment income | 0.30 | 0.33 | 0.27 | 0.25 | 0.22 | |||||||||||||||
Net realized and unrealized gains (losses) on investments | 4.22 | 1.46 | 2.83 | 2.67 | 2.45 | |||||||||||||||
|
|
|
|
|
|
|
|
|
| |||||||||||
Total from investment operations | 4.52 | 1.79 | 3.10 | 2.92 | 2.67 | |||||||||||||||
Distributions to shareholders from | ||||||||||||||||||||
Net investment income | (0.30 | ) | (0.33 | ) | (0.27 | ) | (0.27 | ) | (0.21 | ) | ||||||||||
Net realized gains | (0.46 | ) | (0.96 | ) | (0.19 | ) | (0.27 | ) | (1.57 | ) | ||||||||||
|
|
|
|
|
|
|
|
|
| |||||||||||
Total distributions to shareholders | (0.76 | ) | (1.29 | ) | (0.46 | ) | (0.54 | ) | (1.78 | ) | ||||||||||
Net asset value, end of period | $38.89 | $35.13 | $34.63 | $31.99 | $29.61 | |||||||||||||||
Total return1 | 13.08 | % | 5.54 | % | 9.76 | % | 9.99 | % | 9.68 | % | ||||||||||
Ratios to average net assets (annualized) | ||||||||||||||||||||
Gross expenses | 1.10 | % | 1.11 | % | 1.08 | % | 1.09 | % | 1.10 | % | ||||||||||
Net expenses | 1.08 | % | 1.08 | % | 1.07 | % | 1.09 | % | 1.10 | % | ||||||||||
Net investment income | 0.83 | % | 0.99 | % | 0.80 | % | 0.79 | % | 0.79 | % | ||||||||||
Supplemental data | ||||||||||||||||||||
Portfolio turnover rate | 19 | % | 14 | % | 9 | % | 9 | % | 8 | % | ||||||||||
Net assets, end of period (000s omitted) | $907,134 | $834,289 | $830,487 | $822,769 | $828,421 | |||||||||||||||
| 1 | Total return calculations do not include any sales charges. |
The accompanying notes are an integral part of these financial statements.
Wells Fargo Index Asset Allocation Fund | 35
Table of Contents
Financial highlights
(For a share outstanding throughout each period)
| Year ended September 30 | ||||||||||||||||||||
| CLASS C | 2020 | 2019 | 2018 | 2017 | 2016 | |||||||||||||||
Net asset value, beginning of period | $21.36 | $21.07 | $19.45 | $17.99 | $17.47 | |||||||||||||||
Net investment income | 0.01 | 0.05 | 0.01 | 0.01 | 0.01 | 1 | ||||||||||||||
Net realized and unrealized gains (losses) on investments | 2.57 | 0.88 | 1.73 | 1.62 | 1.48 | |||||||||||||||
|
|
|
|
|
|
|
|
|
| |||||||||||
Total from investment operations | 2.58 | 0.93 | 1.74 | 1.63 | 1.49 | |||||||||||||||
Distributions to shareholders from | ||||||||||||||||||||
Net investment income | (0.02 | ) | (0.06 | ) | (0.00 | )2 | (0.01 | ) | (0.02 | ) | ||||||||||
Net realized gains | (0.28 | ) | (0.58 | ) | (0.12 | ) | (0.16 | ) | (0.95 | ) | ||||||||||
|
|
|
|
|
|
|
|
|
| |||||||||||
Total distributions to shareholders | (0.30 | ) | (0.64 | ) | (0.12 | ) | (0.17 | ) | (0.97 | ) | ||||||||||
Net asset value, end of period | $23.64 | $21.36 | $21.07 | $19.45 | $17.99 | |||||||||||||||
Total return3 | 12.22 | % | 4.75 | % | 8.97 | % | 9.14 | % | 8.86 | % | ||||||||||
Ratios to average net assets (annualized) | ||||||||||||||||||||
Gross expenses | 1.85 | % | 1.86 | % | 1.83 | % | 1.84 | % | 1.85 | % | ||||||||||
Net expenses | 1.83 | % | 1.83 | % | 1.82 | % | 1.84 | % | 1.85 | % | ||||||||||
Net investment income | 0.08 | % | 0.24 | % | 0.05 | % | 0.04 | % | 0.03 | % | ||||||||||
Supplemental data | ||||||||||||||||||||
Portfolio turnover rate | 19 | % | 14 | % | 9 | % | 9 | % | 8 | % | ||||||||||
Net assets, end of period (000s omitted) | $144,828 | $144,264 | $153,322 | $152,820 | $136,881 | |||||||||||||||
| 1 | Calculated based upon average shares outstanding |
| 2 | Amount is less than $0.005. |
| 3 | Total return calculations do not include any sales charges. |
The accompanying notes are an integral part of these financial statements.
36 | Wells Fargo Index Asset Allocation Fund
Table of Contents
Financial highlights
(For a share outstanding throughout each period)
| Year ended September 30 | ||||||||||||||||||||
| ADMINISTRATOR CLASS | 2020 | 2019 | 2018 | 2017 | 2016 | |||||||||||||||
Net asset value, beginning of period | $35.14 | $34.64 | $31.99 | $29.63 | $28.75 | |||||||||||||||
Net investment income | 0.37 | 0.39 | 0.32 | 0.30 | 0.28 | |||||||||||||||
Net realized and unrealized gains (losses) on investments | 4.20 | 1.46 | 2.84 | 2.68 | 2.45 | |||||||||||||||
|
|
|
|
|
|
|
|
|
| |||||||||||
Total from investment operations | 4.57 | 1.85 | 3.16 | 2.98 | 2.73 | |||||||||||||||
Distributions to shareholders from | ||||||||||||||||||||
Net investment income | (0.36 | ) | (0.39 | ) | (0.32 | ) | (0.35 | ) | (0.28 | ) | ||||||||||
Net realized gains | (0.46 | ) | (0.96 | ) | (0.19 | ) | (0.27 | ) | (1.57 | ) | ||||||||||
|
|
|
|
|
|
|
|
|
| |||||||||||
Total distributions to shareholders | (0.82 | ) | (1.35 | ) | (0.51 | ) | (0.62 | ) | (1.85 | ) | ||||||||||
Net asset value, end of period | $38.89 | $35.14 | $34.64 | $31.99 | $29.63 | |||||||||||||||
Total return | 13.26 | % | 5.73 | % | 9.94 | % | 10.20 | % | 9.91 | % | ||||||||||
Ratios to average net assets (annualized) | ||||||||||||||||||||
Gross expenses | 1.02 | % | 1.03 | % | 1.00 | % | 0.99 | % | 1.02 | % | ||||||||||
Net expenses | 0.90 | % | 0.90 | % | 0.90 | % | 0.90 | % | 0.90 | % | ||||||||||
Net investment income | 1.01 | % | 1.17 | % | 0.97 | % | 0.96 | % | 0.98 | % | ||||||||||
Supplemental data | ||||||||||||||||||||
Portfolio turnover rate | 19 | % | 14 | % | 9 | % | 9 | % | 8 | % | ||||||||||
Net assets, end of period (000s omitted) | $281,988 | $229,390 | $216,611 | $268,512 | $206,908 | |||||||||||||||
The accompanying notes are an integral part of these financial statements.
Wells Fargo Index Asset Allocation Fund | 37
Table of Contents
Financial highlights
(For a share outstanding throughout each period)
| Year ended September 30 | ||||||||||||||||
| INSTITUTIONAL CLASS | 2020 | 2019 | 2018 | 20171 | ||||||||||||
Net asset value, beginning of period | $35.09 | $34.59 | $31.96 | $29.27 | ||||||||||||
Net investment income | 0.42 | 0.44 | 0.39 | 0.35 | ||||||||||||
Net realized and unrealized gains (losses) on investments | 4.21 | 1.46 | 2.81 | 3.03 | ||||||||||||
|
|
|
|
|
|
|
| |||||||||
Total from investment operations | 4.63 | 1.90 | 3.20 | 3.38 | ||||||||||||
Distributions to shareholders from | ||||||||||||||||
Net investment income | (0.42 | ) | (0.44 | ) | (0.38 | ) | (0.42 | ) | ||||||||
Net realized gains | (0.46 | ) | (0.96 | ) | (0.19 | ) | (0.27 | ) | ||||||||
|
|
|
|
|
|
|
| |||||||||
Total distributions to shareholders | (0.88 | ) | (1.40 | ) | (0.57 | ) | (0.69 | ) | ||||||||
Net asset value, end of period | $38.84 | $35.09 | $34.59 | $31.96 | ||||||||||||
Total return2 | 13.44 | % | 5.89 | % | 10.11 | % | 11.70 | % | ||||||||
Ratios to average net assets (annualized) | ||||||||||||||||
Gross expenses | 0.77 | % | 0.78 | % | 0.75 | % | 0.74 | % | ||||||||
Net expenses | 0.75 | % | 0.75 | % | 0.74 | % | 0.74 | % | ||||||||
Net investment income | 1.16 | % | 1.32 | % | 1.13 | % | 1.08 | % | ||||||||
Supplemental data | ||||||||||||||||
Portfolio turnover rate | 19 | % | 14 | % | 9 | % | 9 | % | ||||||||
Net assets, end of period (000s omitted) | $139,896 | $123,504 | $110,566 | $61,060 | ||||||||||||
| 1 | For the period from October 31, 2016 (commencement of class operations) to September 30, 2017 |
| 2 | Returns for periods of less than one year are not annualized. |
The accompanying notes are an integral part of these financial statements.
38 | Wells Fargo Index Asset Allocation Fund
Table of Contents
1. ORGANIZATION
Wells Fargo Funds Trust (the “Trust”), a Delaware statutory trust organized on March 10, 1999, is an open-end management investment company registered under the Investment Company Act of 1940, as amended (the “1940 Act”). As an investment company, the Trust follows the accounting and reporting guidance in Financial Accounting Standards Board (“FASB”) Accounting Standards Codification Topic 946, Financial Services – Investment Companies. These financial statements report on the Wells Fargo Index Asset Allocation Fund (the “Fund”) which is a diversified series of the Trust.
2. SIGNIFICANT ACCOUNTING POLICIES
The following significant accounting policies, which are consistently followed in the preparation of the financial statements of the Fund, are in conformity with U.S. generally accepted accounting principles which require management to make estimates and assumptions that affect the reported amounts of assets and liabilities, disclosure of contingent assets and liabilities at the date of the financial statements, and the reported amounts of revenues and expenses during the reporting period. Actual results could differ from those estimates.
Securities valuation
All investments are valued each business day as of the close of regular trading on the New York Stock Exchange (generally 4 p.m. Eastern Time), although the Fund may deviate from this calculation time under unusual or unexpected circumstances.
Equity securities and futures that are listed on a foreign or domestic exchange or market are valued at the official closing price or, if none, the last sales price. If no sale occurs on the principal exchange or market that day, a fair value price will be determined in accordance with the Fund’s Valuation Procedures.
Debt securities are valued at the evaluated bid price provided by an independent pricing service (e.g. taking into account various factors, including yields, maturities, or credit ratings) or, if a reliable price is not available, the quoted bid price from an independent broker-dealer.
Investments in registered open-end investment companies are valued at net asset value. Interests in non-registered investment companies that are redeemable at net asset value are fair valued normally at net asset value.
Investments which are not valued using any of the methods discussed above are valued at their fair value, as determined in good faith by the Board of Trustees of the Fund. The Board of Trustees has established a Valuation Committee comprised of the Trustees and has delegated to it the authority to take any actions regarding the valuation of portfolio securities that the Valuation Committee deems necessary or appropriate, including determining the fair value of portfolio securities, unless the determination has been delegated to the Wells Fargo Asset Management Pricing Committee at Wells Fargo Funds Management, LLC (“Funds Management”). The Board of Trustees retains the authority to make or ratify any valuation decisions or approve any changes to the Valuation Procedures as it deems appropriate. On a quarterly basis, the Board of Trustees receives reports on any valuation actions taken by the Valuation Committee or the Wells Fargo Asset Management Pricing Committee which may include items for ratification.
Securities lending
The Fund may lend its securities from time to time in order to earn additional income in the form of fees or interest on securities received as collateral or the investment of any cash received as collateral. When securities are on loan, the Fund receives interest or dividends on those securities. Cash collateral received in connection with its securities lending transactions is invested in Securities Lending Cash Investments, LLC (the “Securities Lending Fund”). Investments in Securities Lending Fund are valued at the evaluated bid price provided by an independent pricing service. Income earned from investment in the Securities Lending Fund (net of fees and rebates), if any, is included in income from affiliated securities on the Statement of Operations.
In a securities lending transaction, the net asset value of the Fund is affected by an increase or decrease in the value of the securities loaned and by an increase or decrease in the value of the instrument in which collateral is invested. The amount of securities lending activity undertaken by the Fund fluctuates from time to time. The Fund has the right under the lending agreement to recover the securities from the borrower on demand. In the event of default or bankruptcy by the borrower, the Fund may be prevented from recovering the loaned securities or gaining access to the collateral or may experience delays or costs in doing so. In such an event, the terms of the agreement allow the unaffiliated securities lending agent to use the collateral to purchase replacement securities on behalf of the Fund or pay the Fund the market value of the loaned securities. The Fund bears the risk of loss with respect to depreciation of its investment of the cash collateral.
Wells Fargo Index Asset Allocation Fund | 39
Table of Contents
Notes to financial statements
Futures contracts
Futures contracts are agreements between the Fund and a counterparty to buy or sell a specific amount of a commodity, financial instrument or currency at a specified price and on a specified date. The Fund may buy and sell futures contracts in order to gain exposure to, or protect against, changes in interest rates and security values and is subject to interest rate risk and equity price risk. The primary risks associated with the use of futures contracts are the imperfect correlation between changes in market values of securities held by the Fund and the prices of futures contracts, and the possibility of an illiquid market. Futures contracts are generally entered into on a regulated futures exchange and cleared through a clearinghouse associated with the exchange. With futures contracts, there is minimal counterparty risk to the Fund since futures contracts are exchange traded and the exchange’s clearinghouse, as the counterparty to all exchange traded futures, guarantees the futures contracts against default.
Upon entering into a futures contracts, the Fund is required to deposit either cash or securities (initial margin) with the broker in an amount equal to a certain percentage of the contract value. Subsequent payments (variation margin) are paid to or from the broker each day equal to the daily changes in the contract value. Such payments are recorded as unrealized gains or losses and, if any, shown as variation margin receivable (payable) in the Statement of Assets and Liabilities. Should the Fund fail to make requested variation margin payments, the broker can gain access to the initial margin to satisfy the Fund’s payment obligations. When the contracts are closed, a realized gain or loss is recorded in the Statement of Operations.
Security transactions and income recognition
Securities transactions are recorded on a trade date basis. Realized gains or losses are recorded on the basis of identified cost.
Dividend income is recognized on the ex-dividend date.
Interest income is accrued daily and bond discounts are accreted and premiums are amortized daily. To the extent debt obligations are placed on non-accrual status, any related interest income may be reduced by writing off interest receivables when the collection of all or a portion of interest has been determined to be doubtful based on consistently applied procedures and the fair value has decreased. If the issuer subsequently resumes interest payments or when the collectability of interest is reasonably assured, the debt obligation is removed from non-accrual status.
Distributions to shareholders
Distributions to shareholders are recorded on the ex-dividend date and paid from net investment income quarterly and any net realized gains are paid at least annually. Such distributions are determined in accordance with income tax regulations and may differ from U.S. generally accepted accounting principles. Dividend sources are estimated at the time of declaration. The tax character of distributions is determined as of the Fund’s fiscal year end. Therefore, a portion of the Fund’s distributions made prior to the Fund’s fiscal year end may be categorized as a tax return of capital at year end.
Federal and other taxes
The Fund intends to continue to qualify as a regulated investment company by distributing substantially all of its investment company taxable income and any net realized capital gains (after reduction for capital loss carryforwards) sufficient to relieve it from all, or substantially all, federal income taxes. Accordingly, no provision for federal income taxes was required.
The Fund’s income and federal excise tax returns and all financial records supporting those returns for the prior three fiscal years are subject to examination by the federal and Delaware revenue authorities. Management has analyzed the Fund’s tax positions taken on federal, state, and foreign tax returns for all open tax years and does not believe that there are any uncertain tax positions that require recognition of a tax liability.
As of September 30, 2020, the aggregate cost of all investments for federal income tax purposes was $924,477,481 and the unrealized gains (losses) consisted of:
Gross unrealized gains | $ | 586,306,591 | ||
Gross unrealized losses | (20,835,269 | ) | ||
Net unrealized gains | $ | 565,471,322 | ||
Class allocations
The separate classes of shares offered by the Fund differ principally in applicable sales charges, distribution, shareholder servicing, and administration fees. Class specific expenses are charged directly to that share class. Investment income, common fund-level expenses, and realized and unrealized gains (losses) on investments are allocated daily to each class of shares based on the relative proportion of net assets of each class.
40 | Wells Fargo Index Asset Allocation Fund
Table of Contents
Notes to financial statements
3. FAIR VALUATION MEASUREMENTS
Fair value measurements of investments are determined within a framework that has established a fair value hierarchy based upon the various data inputs utilized in determining the value of the Fund’s investments. The three-level hierarchy gives the highest priority to unadjusted quoted prices in active markets for identical assets or liabilities (Level 1) and the lowest priority to unobservable inputs (Level 3). The Fund’s investments are classified within the fair value hierarchy based on the lowest level of input that is significant to the fair value measurement. The inputs are summarized into three broad levels as follows:
| ∎ | Level 1 – quoted prices in active markets for identical securities |
| ∎ | Level 2 – other significant observable inputs (including quoted prices for similar securities, interest rates, prepayment speeds, credit risk, etc.) |
| ∎ | Level 3 – significant unobservable inputs (including the Fund’s own assumptions in determining the fair value of investments) |
The inputs or methodologies used for valuing investments in securities are not necessarily an indication of the risk associated with investing in those securities.
The following is a summary of the inputs used in valuing the Fund’s assets and liabilities as of September 30, 2020:
| Quoted prices (Level 1) | Other significant observable inputs (Level 2) | Significant unobservable inputs (Level 3) | Total | |||||||||||||
Assets | ||||||||||||||||
Investments in: | ||||||||||||||||
Agency securities | $ | 0 | $ | 36,944 | $ | 0 | $ | 36,944 | ||||||||
Common stocks | ||||||||||||||||
Communication services | 95,812,509 | 0 | 0 | 95,812,509 | ||||||||||||
Consumer discretionary | 102,086,381 | 0 | 0 | 102,086,381 | ||||||||||||
Consumer staples | 62,123,881 | 0 | 0 | 62,123,881 | ||||||||||||
Energy | 18,203,407 | 0 | 0 | 18,203,407 | ||||||||||||
Financials | 85,621,507 | 0 | 0 | 85,621,507 | ||||||||||||
Health care | 125,931,430 | 0 | 0 | 125,931,430 | ||||||||||||
Industrials | 73,288,088 | 0 | 0 | 73,288,088 | ||||||||||||
Information technology | 249,109,723 | 0 | 0 | 249,109,723 | ||||||||||||
Materials | 23,162,786 | 23,162,786 | ||||||||||||||
Real estate | 23,416,854 | 0 | 0 | 23,416,854 | ||||||||||||
Utilities | 26,271,825 | 0 | 0 | 26,271,825 | ||||||||||||
Non-agency mortgage-backed securities | 0 | 4,891 | 0 | 4,891 | ||||||||||||
U.S. Treasury securities | 558,688,900 | 0 | 0 | 558,688,900 | ||||||||||||
Short-term investments | ||||||||||||||||
Investment companies | 47,208,672 | 0 | 0 | 47,208,672 | ||||||||||||
| 1,490,925,963 | 41,835 | 0 | 1,490,967,798 | |||||||||||||
Futures contracts | 19,483 | 0 | 0 | 19,483 | ||||||||||||
Total assets | $ | 1,490,945,446 | $ | 41,835 | $ | 0 | $ | 1,490,987,281 | ||||||||
Liabilities | ||||||||||||||||
Futures contracts | $ | 1,038,478 | $ | 0 | $ | 0 | $ | 1,038,478 | ||||||||
Total liabilities | $ | 1,038,478 | $ | 0 | $ | 0 | $ | 1,038,478 | ||||||||
Additional sector, industry or geographic detail is included in the Portfolio of Investments.
Futures contracts are reported at their cumulative unrealized gains (losses) at measurement date as reported in the table following the Portfolio of Investments. For futures contracts, the current day’s variation margin is reported on the Statement of Assets and Liabilities. All other assets and liabilities are reported at their market value at measurement date.
For the year ended September 30, 2020, the Fund did not have any transfers into/out of Level 3.
Wells Fargo Index Asset Allocation Fund | 41
Table of Contents
Notes to financial statements
4. TRANSACTIONS WITH AFFILIATES
Management fee
Funds Management, an indirect wholly owned subsidiary of Wells Fargo & Company (“Wells Fargo”), is the manager of the Fund and provides advisory and fund-level administrative services under an investment management agreement. Under the investment management agreement, Funds Management is responsible for, among other services, implementing the investment objectives and strategies of the Fund, supervising the subadviser and providing fund-level administrative services in connection with the Fund’s operations. As compensation for its services under the investment management agreement, Funds Management is entitled to receive a management fee at the following annual rate based on the Fund’s average daily net assets:
| Average daily net assets | Management fee | |
First $500 million | 0.650% | |
Next $500 million | 0.600 | |
Next $2 billion | 0.550 | |
Next $2 billion | 0.525 | |
Next $5 billion | 0.490 | |
Over $10 billion | 0.480 | |
For the year ended September 30, 2020, the management fee was equivalent to an annual rate of 0.60% of the Fund’s average daily net assets.
Funds Management has retained the services of a subadviser to provide daily portfolio management to the Fund. The fee for subadvisory services is borne by Funds Management. Wells Capital Management Incorporated (“WellsCap”), an affiliate of Funds Management and an indirect wholly owned subsidiary of Wells Fargo, is the subadviser to the Fund and is entitled to receive a fee from Funds Management at an annual rate starting at 0.15% and declining to 0.10% as the average daily net assets of the Fund increase.
Administration fees
Under a class-level administration agreement, Funds Management provides class-level administrative services to the Fund, which includes paying fees and expenses for services provided by the transfer agent, sub-transfer agents, omnibus account servicers and record-keepers. As compensation for its services under the class-level administration agreement, Funds Management receives an annual fee which is calculated based on the average daily net assets of each class as follows:
| Class-level administration fee | ||
Class A, Class C | 0.21% | |
Administrator Class, Institutional Class | 0.13 | |
Waivers and/or expense reimbursements
Funds Management has contractually waived and/or reimbursed management and administration fees to the extent necessary to maintain certain net operating expense ratios for the Fund. When each class of the Fund has exceeded its expense cap, Funds Management has waived fees and/or reimbursed expenses from fund-level expenses on a proportionate basis and then from class specific expenses. When only certain classes exceed their expense caps, waivers and/or reimbursements are applied against class specific expenses before fund-level expenses. Funds Management has committed through January 31, 2021 to waive fees and/or reimburse expenses to the extent necessary to cap the Fund’s expenses at 1.08% for Class A shares, 1.83% for Class C shares, 0.90% for Administrator Class shares, and 0.75% for Institutional Class shares. Prior to or after the commitment expiration date, the cap may be increased or the commitment to maintain the cap may be terminated only with the approval of the Board of Trustees.
Distribution fee
The Trust has adopted a distribution plan for Class C shares of the Fund pursuant to Rule 12b-1 under the 1940 Act. A distribution fee is charged to Class C shares and paid to Wells Fargo Funds Distributor, LLC (“Funds Distributor”), the principal underwriter, at an annual rate of 0.75% of the average daily net assets of Class C shares.
In addition, Funds Distributor is entitled to receive the front-end sales charge from the purchase of Class A shares and a contingent deferred sales charge on the redemption of certain Class A shares. Funds Distributor is also entitled to receive the
42 | Wells Fargo Index Asset Allocation Fund
Table of Contents
Notes to financial statements
contingent deferred sales charges from redemptions of Class C shares. For the year ended September 30, 2020, Funds Distributor received $82,626 from the sale of Class A shares and $14 in contingent deferred sales charges from redemptions of Class C shares. No contingent deferred sales charges were incurred by Class A shares for the year ended September 30, 2020.
Shareholder servicing fees
The Trust has entered into contracts with one or more shareholder servicing agents, whereby Class A, Class C, and Administrator Class of the Fund are charged a fee at an annual rate of 0.25% of the average daily net assets of each respective class. A portion of these total shareholder servicing fees were paid to affiliates of Wells Fargo.
Interfund transactions
The Fund may purchase or sell portfolio investment securities to certain other Wells Fargo affiliates pursuant to Rule 17a-7 under the 1940 Act and under procedures adopted by the Board of Trustees. The procedures have been designed to ensure that these interfund transactions, which do not incur broker commissions, are effected at current market prices.
5. INVESTMENT PORTFOLIO TRANSACTIONS
Purchases and sales of investments, excluding short-term securities, for the year ended September 30, 2020 were as follows:
Purchases at cost | Sales proceeds | |||||
| U.S. government | Non-U.S. government | U.S. government | Non-U.S. government | |||
| $146,800,140 | $105,742,295 | $135,203,574 | $124,076,473 | |||
6. SECURITIES LENDING TRANSACTIONS
The Fund lends its securities through an unaffiliated securities lending agent and receives collateral in the form of cash or securities with a value at least equal to the value of the securities on loan. The value of the loaned securities is determined at the close of each business day and any increases or decreases in the required collateral are exchanged between the Fund and the counterparty on the next business day. Cash collateral received is invested in the Securities Lending Fund which seeks to provide a positive return compared to the daily Federal Funds Open Rate by investing in high-quality, U.S. dollar-denominated short-term money market instruments and is exempt from registration under Section 3(c)(7) of the 1940 Act. Securities Lending Fund is managed by Funds Management and is subadvised by WellsCap. Funds Management receives an advisory fee starting at 0.05% and declining to 0.01% as the average daily net assets of the Securities Lending Fund increase. All of the fees received by Funds Management are paid to WellsCap for its services as subadviser.
In the event of counterparty default or the failure of a borrower to return a loaned security, the Fund has the right to use the collateral to offset any losses incurred. As of September 30, 2020, the Fund had securities lending transactions with the following counterparties which are subject to offset:
| Counterparty | Value of securities on loan | Collateral received1 | Net amount | |||||||||
BNP Paribas Securities Corp. | $ | 328,821 | $ | (328,821 | ) | $ | 0 | |||||
Morgan Stanley & Co. LLC | 391,840 | (391,840 | ) | 0 | ||||||||
| 1 | Collateral received within this table is limited to the collateral for the net transaction with the counterparty. |
7. DERIVATIVE TRANSACTIONS
During the year ended September 30, 2020, the Fund entered into futures contracts to manage the duration of the portfolio and to gain market exposure to certain asset classes by implementing tactical asset allocation shifts. The Fund had an average notional amount of $102,342,405 in long futures contracts and $16,597,655 in short futures contracts during the year ended September 30, 2020.
The cumulative unrealized gains (losses) reported in the table following the Portfolio of Investments represents the fair value of futures contracts at the end of the period. Only the current day’s variation margin as of September 30, 2020 is reported separately on the Statement of Assets and Liabilities.
Wells Fargo Index Asset Allocation Fund | 43
Table of Contents
Notes to financial statements
The effect of derivative instruments on the Statement of Operations for the year ended September 30, 2020 was as follows for the Fund:
Amount of realized gains (losses) on | Change in unrealized gains (losses) on derivatives | |||||||
Equity risk | $ | 16,703,280 | $ | (359,280 | ) | |||
Interest rate risk | (715,074 | ) | 373,055 | |||||
| $ | 15,988,206 | $ | 13,775 | |||||
8. BANK BORROWINGS
The Trust (excluding the money market funds), Wells Fargo Master Trust and Wells Fargo Variable Trust are parties to a $350,000,000 revolving credit agreement whereby the Fund is permitted to use bank borrowings for temporary or emergency purposes, such as to fund shareholder redemption requests. Interest under the credit agreement is charged to the Fund based on a borrowing rate equal to the higher of the Federal Funds rate in effect on that day plus 1.25% or the overnight LIBOR rate in effect on that day plus 1.25%. In addition, an annual commitment fee equal to 0.25% of the unused balance is allocated to each participating fund.
For the year ended September 30, 2020, there were no borrowings by the Fund under the agreement.
9. DISTRIBUTIONS TO SHAREHOLDERS
The tax character of distributions paid during the years ended September 30, 2020 and September 30, 2019 were as follows:
| Year ended September 30 | ||||||||
| 2020 | 2019 | |||||||
Ordinary income | $ | 13,174,894 | $ | 16,601,787 | ||||
Long-term capital gain | 15,219,809 | 31,862,151 | ||||||
As of September 30, 2020, the components of distributable earnings on a tax basis were as follows:
| Undistributed ordinary income | Undistributed long-term gain | Unrealized | ||
| $15,180,788 | $29,223,870 | $565,471,322 | ||
10. INDEMNIFICATION
Under the Fund’s organizational documents, the officers and Trustees have been granted certain indemnification rights against certain liabilities that may arise out of performance of their duties to the Fund. The Fund has entered into a separate agreement with each Trustee that converts indemnification rights currently existing under the Fund’s organizational documents into contractual rights that cannot be changed in the future without the consent of the Trustee. Additionally, in the normal course of business, the Fund may enter into contracts with service providers that contain a variety of indemnification clauses. The Fund’s maximum exposure under these arrangements is dependent on future claims that may be made against the Fund and, therefore, cannot be estimated.
11. NEW ACCOUNTING PRONOUNCEMENT
In August 2018, FASB issued Accounting Standards Update (“ASU”) No. 2018-13, Fair Value Measurement (Topic 820) Disclosure Framework—Changes to the Disclosure Requirements for Fair Value Measurement. ASU 2018-13 updates the disclosure requirements on fair value measurements in Topic 820, Fair Value Measurements. The amendments are effective for fiscal years, and interim periods within those fiscal years, beginning after December 15, 2019. Management has adopted this guidance which did not have a material impact on the financial statements.
44 | Wells Fargo Index Asset Allocation Fund
Table of Contents
Notes to financial statements
12. CORONAVIRUS (COVID-19) PANDEMIC
On March 11, 2020, the World Health Organization announced that it had made the assessment that coronavirus disease 2019 (“COVID-19”) is a pandemic. The impacts of COVID-19 are adversely affecting the entire global economy, individual companies and investment products, and the market in general. There is significant uncertainty around the extent and duration of business disruptions related to COVID-19 and the impacts may be short term or may last for an extended period of time. The risk of further spreading of COVID-19 has led to significant uncertainty and volatility in the financial markets.
Wells Fargo Index Asset Allocation Fund | 45
Table of Contents
Report of independent registered public accounting firm
To the Shareholders of the Fund and Board of Trustees
Wells Fargo Funds Trust:
Opinion on the Financial Statements
We have audited the accompanying statement of assets and liabilities of Wells Fargo Index Asset Allocation Fund (the Fund), one of the funds constituting Wells Fargo Funds Trust, including the portfolio of investments, as of September 30, 2020, the related statement of operations for the year then ended, the statements of changes in net assets for each of the years in the two-year period then ended, and the related notes (collectively, the financial statements) and the financial highlights for each of the years or periods in the five-year period then ended. In our opinion, the financial statements and financial highlights present fairly, in all material respects, the financial position of the Fund as of September 30, 2020, the results of its operations for the year then ended, the changes in its net assets for each of the years in the two-year period then ended, and the financial highlights for each of the years or periods in the five-year period then ended, in conformity with U.S. generally accepted accounting principles.
Basis for Opinion
These financial statements and financial highlights are the responsibility of the Fund’s management. Our responsibility is to express an opinion on these financial statements and financial highlights based on our audits. We are a public accounting firm registered with the Public Company Accounting Oversight Board (United States) (PCAOB) and are required to be independent with respect to the Fund in accordance with the U.S. federal securities laws and the applicable rules and regulations of the Securities and Exchange Commission and the PCAOB.
We conducted our audits in accordance with the standards of the PCAOB. Those standards require that we plan and perform the audit to obtain reasonable assurance about whether the financial statements and financial highlights are free of material misstatement, whether due to error or fraud. Our audits included performing procedures to assess the risks of material misstatement of the financial statements and financial highlights, whether due to error or fraud, and performing procedures that respond to those risks. Such procedures included examining, on a test basis, evidence regarding the amounts and disclosures in the financial statements and financial highlights. Such procedures also included confirmation of securities owned as of September 30, 2020, by correspondence with the custodian, transfer agent and brokers, or by other appropriate auditing procedures. Our audits also included evaluating the accounting principles used and significant estimates made by management, as well as evaluating the overall presentation of the financial statements and financial highlights. We believe that our audits provide a reasonable basis for our opinion.

We have not been able to determine the specific year that we began serving as the auditor of one or more Wells Fargo Funds investment companies; however we are aware that we have served as the auditor of one or more Wells Fargo Funds investment companies since at least 1955.
Boston, Massachusetts
November 24, 2020
46 | Wells Fargo Index Asset Allocation Fund
Table of Contents
TAX INFORMATION
For corporate shareholders, pursuant to Section 854 of the Internal Revenue Code, 60.64% of ordinary income dividends qualify for the corporate dividends-received deduction for the fiscal year ended September 30, 2020.
Pursuant to Section 852 of the Internal Revenue Code, $15,219,809 was designated as a 20% rate gain distribution for the fiscal year ended September 30, 2020.
Pursuant to Section 854 of the Internal Revenue Code, $8,265,187 of income dividends paid during the fiscal year ended September 30, 2020 has been designated as qualified dividend income (QDI).
For the fiscal year ended September 30, 2020, $4,133,053 has been designated as interest-related dividends for nonresident alien shareholders pursuant to Section 871 of the Internal Revenue Code.
For the fiscal year ended September 30, 2020, $2,102,311 has been designated as short-term capital gain dividends for nonresident alien shareholders pursuant to Section 871 of the Internal Revenue Code.
For the fiscal year ended September 30, 2020, 33.58% of the ordinary income distributed was derived from interest on U.S. government securities.
PROXY VOTING INFORMATION
A description of the policies and procedures used to determine how to vote proxies relating to portfolio securities is available, upon request, by calling 1-800-222-8222, visiting our website at wfam.com, or visiting the SEC website at sec.gov. Information regarding how the proxies related to portfolio securities were voted during the most recent 12-month period ended June 30 is available on the website at wfam.com or by visiting the SEC website at sec.gov.
QUARTERLY PORTFOLIO HOLDINGS INFORMATION
The Fund files its complete schedule of portfolio holdings with the SEC for the first and third quarters of each fiscal year as an exhibit to its reports on Form N-PORT. Shareholders may view the filed Form N-PORT by visiting the SEC website at sec.gov.
Wells Fargo Index Asset Allocation Fund | 47
Table of Contents
Other information (unaudited)
BOARD OF TRUSTEES AND OFFICERS
Each of the Trustees and Officers1 listed in the table below acts in identical capacities for each fund in the Wells Fargo family of funds, which consists of 142 mutual funds comprising the Wells Fargo Funds Trust, Wells Fargo Variable Trust, Wells Fargo Master Trust and four closed-end funds (collectively the “Fund Complex”). This table should be read in conjunction with the Prospectus and the Statement of Additional Information2. The mailing address of each Trustee and Officer is 525 Market Street, 12th Floor, San Francisco, CA 94105. Each Trustee and Officer serves an indefinite term, however, each Trustee serves such term until reaching the mandatory retirement age established by the Trustees.
Independent Trustees
| Name and year of birth | Position held and length of service* | Principal occupations during past five years or longer | Current other public company or investment company directorships | |||
William R. Ebsworth (Born 1957) | Trustee, | Retired. From 1984 to 2013, equities analyst, portfolio manager, research director and chief investment officer at Fidelity Management and Research Company in Boston, Tokyo, and Hong Kong, and retired in 2013 as Chief Investment Officer of Fidelity Strategic Advisers, Inc. where he led a team of investment professionals managing client assets. Prior thereto, Board member of Hong Kong Securities Clearing Co., Hong Kong Options Clearing Corp., the Thailand International Fund, Ltd., Fidelity Investments Life Insurance Company, and Empire Fidelity Investments Life Insurance Company. Audit Committee Chair and Investment Committee Chair of the Vincent Memorial Hospital Endowment (non-profit organization). Mr. Ebsworth is a CFA® charterholder. | N/A | |||
| Jane A. Freeman (Born 1953) | Trustee, since 2015; Chair Liaison, since 2018 | Retired. From 2012 to 2014 and 1999 to 2008, Chief Financial Officer of Scientific Learning Corporation. From 2008 to 2012, Ms. Freeman provided consulting services related to strategic business projects. Prior to 1999, Portfolio Manager at Rockefeller & Co. and Scudder, Stevens & Clark. Board member of the Harding Loevner Funds from 1996 to 2014, serving as both Lead Independent Director and chair of the Audit Committee. Board member of the Russell Exchange Traded Funds Trust from 2011 to 2012 and the chair of the Audit Committee. Ms. Freeman is also an inactive Chartered Financial Analyst. | N/A | |||
| Isaiah Harris, Jr. (Born 1952) | Trustee, since 2009; | Retired. Chairman of the Board of CIGNA Corporation since 2009, and Director since 2005. From 2003 to 2011, Director of Deluxe Corporation. Prior thereto, President and CEO of BellSouth Advertising and Publishing Corp. from 2005 to 2007, President and CEO of BellSouth Enterprises from 2004 to 2005 and President of BellSouth Consumer Services from 2000 to 2003. Emeritus member of the Iowa State University Foundation Board of Governors. Emeritus Member of the Advisory Board of Iowa State University School of Business. Advisory Board Member, Palm Harbor Academy (private school). Mr. Harris is a certified public accountant (inactive status). | CIGNA Corporation | |||
| Judith M. Johnson (Born 1949) | Trustee, since 2008 | Retired. Prior thereto, Chief Executive Officer and Chief Investment Officer of Minneapolis Employees Retirement Fund from 1996 to 2008. Ms. Johnson is an attorney, certified public accountant and a certified managerial accountant. | N/A | |||
| David F. Larcker (Born 1950) | Trustee, since 2009 | James Irvin Miller Professor of Accounting at the Graduate School of Business (Emeritus), Stanford University, Director of the Corporate Governance Research Initiative and Senior Faculty of The Rock Center for Corporate Governance since 2006. From 2005 to 2008, Professor of Accounting at the Graduate School of Business, Stanford University. Prior thereto, Ernst & Young Professor of Accounting at The Wharton School, University of Pennsylvania from 1985 to 2005. | N/A | |||
48 | Wells Fargo Index Asset Allocation Fund
Table of Contents
Other information (unaudited)
| Name and year of birth | Position held and length of service* | Principal occupations during past five years or longer | Current other public company or investment company directorships | |||
| Olivia S. Mitchell (Born 1953) | Trustee, since 2006; Nominating and Governance Committee Chair, since 2018 | International Foundation of Employee Benefit Plans Professor, Wharton School of the University of Pennsylvania since 1993. Director of Wharton’s Pension Research Council and Boettner Center on Pensions & Retirement Research, and Research Associate at the National Bureau of Economic Research. Previously, Cornell University Professor from 1978 to 1993. | N/A | |||
| Timothy J. Penny (Born 1951) | Trustee, since 1996; Chairman, since 2018 | President and Chief Executive Officer of Southern Minnesota Initiative Foundation, a non-profit organization, since 2007. Member of the Board of Trustees of NorthStar Education Finance, Inc., a non-profit organization, since 2007. | N/A | |||
| James G. Polisson (Born 1959) | Trustee, since 2018 | Retired. Chief Marketing Officer, Source (ETF) UK Services, Ltd, from 2015 to 2017. From 2012 to 2015, Principal of The Polisson Group, LLC, a management consulting, corporate advisory and principal investing company. Chief Executive Officer and Managing Director at Russell Investments, Global Exchange Traded Funds from 2010 to 2012. Managing Director of Barclays Global Investors from 1998 to 2010 and Global Chief Marketing Officer for iShares and Barclays Global Investors from 2000 to 2010. Trustee of the San Francisco Mechanics’ Institute, a non-profit organization, from 2013 to 2015. Board member of the Russell Exchange Traded Fund Trust from 2011 to 2012. Director of Barclays Global Investors Holdings Deutschland GmbH from 2006 to 2009. Mr. Polisson is an attorney and has a retired status with the Massachusetts and District of Columbia Bar Associations. | N/A | |||
| Pamela Wheelock (Born 1959) | Trustee, since January 2020; previously Trustee from January 2018 to July 2019 | Board member of the Destination Medical Center Economic Development Agency, Rochester, Minnesota since 2019. Interim President of the McKnight Foundation from January to September 2020. Acting Commissioner, Minnesota Department of Human Services, July 2019 through September 2019. Human Services Manager (part-time), Minnesota Department of Human Services, October 2019 through December 2019. Chief Operating Officer, Twin Cities Habitat for Humanity from 2017 to 2019. Vice President of University Services, University of Minnesota from 2012 to 2016. Prior thereto, on the Board of Directors, Governance Committee and Finance Committee for the Minnesota Philanthropy Partners (Saint Paul Foundation) from 2012 to 2018, Interim Chief Executive Officer of Blue Cross Blue Shield of Minnesota from 2011 to 2012, Chairman of the Board from 2009 to 2012 and Board Director from 2003 to 2015. Vice President, Leadership and Community Engagement, Bush Foundation, Saint Paul, Minnesota (a private foundation) from 2009 to 2011. Executive Vice President and Chief Financial Officer, Minnesota Sports and Entertainment from 2004 to 2009 and Senior Vice President from 2002 to 2004. Executive Vice President of the Minnesota Wild Foundation from 2004 to 2008. Commissioner of Finance, State of Minnesota, from 1999 to 2002. Currently Board Chair of the Minnesota Wild Foundation since 2010. | N/A | |||
| * | Length of service dates reflect the Trustee’s commencement of service with the Trust’s predecessor entities, where applicable. |
Wells Fargo Index Asset Allocation Fund | 49
Table of Contents
Other information (unaudited)
Officers
| Name and year of birth | Position held and length of service | Principal occupations during past five years or longer | ||
| Andrew Owen (Born 1960) | President, since 2017 | Executive Vice President of Wells Fargo & Company and Head of Affiliated Managers, Wells Fargo Asset Management, since 2014. In addition, Mr. Owen is currently President, Chief Executive Officer and Director of Wells Fargo Funds Management, LLC since 2017. Prior thereto, Executive Vice President responsible for marketing, investments and product development for Wells Fargo Funds Management, LLC, from 2009 to 2014. | ||
| Jeremy DePalma1 (Born 1974) | Treasurer, since 2012 | Senior Vice President of Wells Fargo Funds Management, LLC since 2009. Senior Vice President of Evergreen Investment Management Company, LLC from 2008 to 2010 and head of the Fund Reporting and Control Team within Fund Administration from 2005 to 2010. | ||
| Michelle Rhee (Born 1966) | Chief Legal Officer, since 2019 | Secretary of Wells Fargo Funds Management, LLC, Chief Legal Counsel of Wells Fargo Asset Management and Assistant General Counsel of Wells Fargo Bank, N.A. since 2018. Associate General Counsel and Managing Director of Bank of America Corporation from 2004 to 2018. | ||
| Catherine Kennedy (Born 1969) | Secretary, since 2019 | Vice President of Wells Fargo Funds Management, LLC and Senior Counsel of the Wells Fargo Legal Department since 2010. Vice President and Senior Counsel of Evergreen Investment Management Company, LLC from 1998 to 2010. | ||
| Michael H. Whitaker (Born 1967) | Chief Compliance Officer, since 2016 | Chief Compliance Officer of Wells Fargo Asset Management since 2016. Senior Vice President and Chief Compliance Officer for Fidelity Investments from 2007 to 2016. | ||
| 1 | Jeremy DePalma acts as Treasurer of 77 funds in the Fund Complex. |
| 2 | The Statement of Additional Information includes additional information about the Trustees and is available, without charge, upon request, by calling 1-800-222-8222 or by visiting the website at wfam.com. |
50 | Wells Fargo Index Asset Allocation Fund
Table of Contents
Other information (unaudited)
BOARD CONSIDERATION OF INVESTMENT MANAGEMENT AND SUB-ADVISORY AGREEMENTS:
Wells Fargo Index Asset Allocation Fund
Under the Investment Company Act of 1940 (the “1940 Act”), the Board of Trustees (the “Board”) of Wells Fargo Funds Trust (the “Trust”) must determine annually whether to approve the continuation of the Trust’s investment management and sub-advisory agreements. In this regard, at a Board meeting held on May 26, 2020 and May 28, 2020 (together, the “Meeting”), the Board, all the members of which have no direct or indirect interest in the investment management and sub-advisory agreements and are not “interested persons” of the Trust, as defined in the 1940 Act (the “Independent Trustees”), reviewed and approved for Wells Fargo Index Asset Allocation Fund (the “Fund”): (i) an investment management agreement (the “Management Agreement”) with Wells Fargo Funds Management, LLC (“Funds Management”); and (ii) an investment sub-advisory agreement (the “Sub-Advisory Agreement”) with Wells Capital Management Incorporated (the “Sub-Adviser”), an affiliate of Funds Management. The Management Agreement and the Sub-Advisory Agreement are collectively referred to as the “Advisory Agreements.”
At the Meeting, the Board considered the factors and reached the conclusions described below relating to the selection of Funds Management and the Sub-Adviser and the approval of the Advisory Agreements. Prior to the Meeting, including at a Board meeting held in April 2020, the Trustees conferred extensively among themselves and with representatives of Funds Management about these matters. Also, the Board has adopted a team-based approach, with each team consisting of a sub-set of Trustees, to assist the full Board in the discharge of its duties in reviewing investment performance and other matters throughout the year. The Independent Trustees were assisted in their evaluation of the Advisory Agreements by independent legal counsel, from whom they received separate legal advice and with whom they met separately.
In providing information to the Board, Funds Management and the Sub-Adviser were guided by a detailed set of requests for information submitted to them by independent legal counsel on behalf of the Independent Trustees at the start of the Board’s annual contract renewal process earlier in 2020. In considering and approving the Advisory Agreements, the Trustees considered the information they believed relevant, including but not limited to the information discussed below. The Board considered not only the specific information presented in connection with the Meeting, but also the knowledge gained over time through interaction with Funds Management and the Sub-Adviser about various topics. In this regard, the Board reviewed reports of Funds Management at each of its quarterly meetings, which included, among other things, portfolio reviews and investment performance reports. In addition, the Board and the teams mentioned above confer with portfolio managers at various times throughout the year. The Board did not identify any particular information or consideration that was all-important or controlling, and each individual Trustee may have attributed different weights to various factors.
After its deliberations, the Board unanimously approved the continuation of the Advisory Agreements for a one-year term and determined that the compensation payable to Funds Management and the Sub-Adviser under each of the Advisory Agreements was reasonable. The Board considered the approval of the Advisory Agreements for the Fund as part of its consideration of agreements for funds across the complex, but its approvals were made on a fund-by-fund basis. The following summarizes a number of important, but not necessarily all, factors considered by the Board in support of its approvals.
Nature, extent and quality of services
The Board received and considered various information regarding the nature, extent and quality of services provided to the Fund by Funds Management and the Sub-Adviser under the Advisory Agreements. This information included a description of the investment advisory services and Fund-level administrative services covered by the Management Agreement, as well as, among other things, a summary of the background and experience of senior management of Wells Fargo Asset Management (“WFAM”), of which Funds Management and the Sub-Adviser are a part, and a summary of investments made in the business of WFAM. The Board also received a description of Funds Management’s and the Sub-Adviser’s business continuity plans and of their approaches to data privacy and cybersecurity, and related testing. The Board also received and reviewed information about Funds Management’s role as administrator of the Fund’s liquidity risk management program, Funds Management’s approach to risk management, and Funds Management’s intermediary and vendor oversight program.
The Board also considered the qualifications, background, tenure and responsibilities of each of the portfolio managers primarily responsible for the day-to-day portfolio management of the Fund. The Board evaluated the ability of Funds Management and the Sub-Adviser to attract and retain qualified investment professionals, including research, advisory and supervisory personnel. The Board further considered the compliance programs and compliance records of Funds Management and the Sub-Adviser. In addition, the Board took into account the full range of services provided to the Fund by Funds Management and its affiliates.
Wells Fargo Index Asset Allocation Fund | 51
Table of Contents
Other information (unaudited)
Fund investment performance and expenses
The Board considered the investment performance results for the Fund over various time periods ended December 31, 2019. The Board also considered more current results for various time periods ended March 31, 2020. The Board considered these results in comparison to the investment performance of funds in a universe that was determined by Broadridge Inc. (“Broadridge”)to be similar to the Fund (the “Universe”), and in comparison to the Fund’s benchmark index and to other comparative data. Broadridge is an independent provider of investment company data. The Board received a description of the methodology used by Broadridge to select the mutual funds in the performance Universe. The Board noted that the investment performance of the Fund (Administrator Class) was higher than the average investment performance of the Universe for the one-, three-, five- and ten-year periods ended December 31, 2019. The Board also noted that the investment performance of the Fund (Administrator Class) was higher than the average performance of the Universe for the one-, three-, five-, and ten-year periods ended March 31, 2020. The Board also noted that the investment performance of the Fund was lower than its benchmark index, the Index Asset Allocation Blended Index, for the one-, three-, five- and ten-year periods ended December 31, 2019. The Board also noted that the investment performance of the Fund was lower than its benchmark index, the Index Asset Allocation Blended Index, for the one-, three-, and ten-year periods ended March 31, 2020, but in range of its benchmark index for the five-year period ended March 31, 2020.
The Board also received and considered information regarding the Fund’s net operating expense ratios and their various components, including actual management fees, custodian and other non-management fees, and Rule 12b-1 and non-Rule 12b-1 shareholder service fees. The Board considered these ratios in comparison to the median ratios of funds in class-specific expense groups that were determined by Broadridge to be similar to the Fund (the “Groups”). The Board received a description of the methodology used by Broadridge to select the mutual funds in the expense Groups and an explanation of how funds comprising expense groups and their expense ratios may vary from year-to-year. Based on the Broadridge reports, the Board noted that the net operating expense ratios of the Fund were lower than or in range of the median net operating expense ratios of the expense Groups for each share class.
The Board took into account the Fund’s investment performance and expense information provided to it among the factors considered in deciding to re-approve the Advisory Agreements.
Investment management and sub-advisory fee rates
The Board reviewed and considered the contractual fee rates payable by the Fund to Funds Management under the Management Agreement, as well as the contractual fee rates payable by the Fund to Funds Management for class-level administrative services under a Class-Level Administration Agreement, which include, among other things, class-level transfer agency and sub-transfer agency costs (collectively, the “Management Rates”). The Board also reviewed and considered the contractual investment sub-advisory fee rates that are payable by Funds Management to the Sub-Adviser for investment sub-advisory services.
Among other information reviewed by the Board was a comparison of the Fund’s Management Rates with the average contractual investment management fee rates of funds in the expense Groups at a common asset level as well as transfer agency costs of the funds in the expense Groups. The Board noted that the Management Rates of the Fund were lower than or in range of the sum of these average rates for the Fund’s expense Groups for all share classes.
The Board also received and considered information about the portion of the total management fee that was retained by Funds Management after payment of the fee to the Sub-Adviser for sub-advisory services. In assessing the reasonableness of this amount, the Board received and evaluated information about the nature and extent of responsibilities retained and risks assumed by Funds Management and not delegated to or assumed by the Sub-Adviser, and about Funds Management’s on-going oversight services. Given the affiliation between Funds Management and the Sub-Adviser, the Board ascribed limited relevance to the allocation of fees between them.
The Board also received and considered information about the nature and extent of services offered and fee rates charged by Funds Management and the Sub-Adviser to other types of clients with investment strategies similar to those of the Fund. In this regard, the Board received information about the significantly greater scope of services, and compliance, reporting and other legal burdens and risks of managing proprietary mutual funds compared with those associated with managing assets of other types of clients, including third-party sub-advised fund clients and non-mutual fund clients such as institutional separate accounts.
Based on its consideration of the factors and information it deemed relevant, including those described here, the Board determined that the compensation payable to Funds Management under the Management Agreement and to the Sub-Adviser under the Sub-Advisory Agreement was reasonable.
52 | Wells Fargo Index Asset Allocation Fund
Table of Contents
Other information (unaudited)
Profitability
The Board received and considered information concerning the profitability of Funds Management, as well as the profitability of both WFAM and Wells Fargo & Co. (“Wells Fargo”) from providing services to the fund family as a whole. The Board noted that the Sub-Adviser’s profitability information with respect to providing services to the Fund and other funds in the family was subsumed in the WFAM and Wells Fargo profitability analysis.
Funds Management reported on the methodologies and estimates used in calculating profitability, including a description of the methodology used to allocate certain expenses. Among other things, the Board noted that the levels of profitability reported on a fund-by-fund basis varied widely, depending on factors such as the size, type and age of fund.
Based on its review, the Board did not deem the profits reported by Funds Management, WFAM or Wells Fargo from services provided to the Fund to be at a level that would prevent it from approving the continuation of the Advisory Agreements.
Economies of scale
The Board received and considered information about the potential for Funds Management to experience economies of scale in the provision of management services to the Fund, the difficulties of calculating economies of scale at an individual fund level, and the extent to which potential scale benefits are shared with shareholders. The Board noted the existence of breakpoints in the Fund’s management fee structure, which operate generally to reduce the Fund’s expense ratios as the Fund grows in size, and the size of the Fund in relation to such breakpoints. The Board considered that in addition to management fee breakpoints, Funds Management shares potential economies of scale from its management business in a variety of ways, including through fee waiver and expense reimbursement arrangements, services that benefit shareholders, competitive management fee rates set at the outset without regard to breakpoints, and investments in the business intended to enhance services available to shareholders.
The Board concluded that Funds Management’s arrangements with respect to the Fund, including contractual breakpoints, constituted a reasonable approach to sharing potential economies of scale with the Fund and its shareholders.
Other benefits to Funds Management and the Sub-Adviser
The Board received and considered information regarding potential “fall-out” or ancillary benefits received by Funds Management and its affiliates, including the Sub-Adviser, as a result of their relationships with the Fund. Ancillary benefits could include, among others, benefits directly attributable to other relationships with the Fund and benefits potentially derived from an increase in Funds Management’s and the Sub-Adviser’s business as a result of their relationships with the Fund. The Board noted that various affiliates of Funds Management may receive distribution-related fees, shareholder servicing payments and sub-transfer agency fees in respect of shares sold or held through them and services provided.
The Board also reviewed information about soft dollar credits earned and utilized by the Sub-Adviser, fees earned by Funds Management and the Sub-Adviser from managing a private investment vehicle for the fund family’s securities lending collateral, and commissions earned by an affiliated broker from portfolio transactions.
Based on its consideration of the factors and information it deemed relevant, including those described here, the Board did not find that any ancillary benefits received by Funds Management and its affiliates, including the Sub-Adviser, were unreasonable.
Conclusion
At the Meeting, after considering the above-described factors and based on its deliberations and its evaluation of the information described above, the Board unanimously approved the continuation of the Advisory Agreements for a one-year term and determined that the compensation payable to Funds Management and the Sub-Adviser under each of the Advisory Agreements was reasonable.
Wells Fargo Index Asset Allocation Fund | 53
Table of Contents
Other information (unaudited)
LIQUIDITY RISK MANAGEMENT PROGRAM
In accordance with Rule 22e-4 under the Investment Company Act of 1940, as amended (the “Liquidity Rule”), Wells Fargo Funds Trust (the “Trust”) has adopted and implemented a liquidity risk management program (the “Program”) on behalf of each of its series, including the Fund, which is reasonably designed to assess and manage the Fund’s liquidity risk. “Liquidity risk” is defined as the risk that the Fund is unable to meet redemption requests without significantly diluting remaining investors’ interests in the Fund. The Trust’s Board of Trustees (the “Board”) previously approved the designation of Wells Fargo Funds Management, LLC (“Funds Management”), the Fund’s investment manager, as the administrator of the Program, and Funds Management has established a Liquidity Risk Management Council composed of personnel from multiple departments within Funds Management and its affiliates to assist Funds Management in the implementation and on-going administration of the Program.
The Program is comprised of various components designed to support the assessment and/or management of liquidity risk, including: (1) the periodic assessment (no less frequently than annually) of certain factors that influence the Fund’s liquidity risk; (2) the periodic classification (no less frequently than monthly) of the Fund’s investments into one of four liquidity categories that reflect an estimate of their liquidity under current market conditions; (3) a 15% limit on the acquisition of “illiquid investments” (as defined under the Liquidity Rule); (4) to the extent the Fund does not invest primarily in “highly liquid investments” (as defined under the Liquidity Rule), the determination of a minimum percentage of the Fund’s assets that generally will be invested in highly liquid investments (an “HLIM”); (5) if the Fund has established an HLIM, the periodic review (no less frequently than annually) of the HLIM and the adoption of policies and procedures for responding to a shortfall of the Fund’s “highly liquid investments” below its HLIM; and (6) periodic reporting to the Board.
At a meeting of the Board held on May 26 and 28, 2020, the Board received a written report (the “Report”) from Funds Management that addressed the operation of the Program and assessed its adequacy and effectiveness of implementation. The Report covered the initial period from December 1, 2018 through December 31, 2019 (the “Reporting Period”). No significant liquidity events impacting the Fund were noted in the Report. There were no material changes to the Program during the Reporting Period. The Report concluded that the Program is operating effectively to assess and manage the Fund’s liquidity risk, and that the Program has been and continues to be adequately and effectively implemented to monitor and, as applicable, respond to the Fund’s liquidity developments.
There can be no assurance that the Program will achieve its objectives under all circumstances in the future. Please refer to the Fund’s prospectus for more information regarding the Fund’s exposure to liquidity risk and other risks to which an investment in the Fund may be subject.
54 | Wells Fargo Index Asset Allocation Fund
Table of Contents
Effective June 1, 2020, shareholders purchasing Fund shares through an Oppenheimer & Co. Inc. (“Oppenheimer”) platform or account are eligible only for the following load waivers (front-end sales charge waivers and contingent deferred or back-end, sales charge waivers) and discounts, which may differ from those disclosed in the Fund’s Prospectus or SAI.
| Front-end Sales Load Waivers on Class A Shares available at Oppenheimer |
| Employer-sponsored retirement, deferred compensation and employee benefit plans (including health savings accounts) and trusts used to fund those plans, provided that the shares are not held in a commission-based brokerage account and shares are held for the benefit of the plan. |
| Shares purchased by or through a 529 Plan. |
| Shares purchased through an Oppenheimer affiliated investment advisory program. |
| Shares purchased through reinvestment of capital gains distributions and dividend reinvestment when purchasing shares of the same fund (but not any other fund within the fund family). |
| Shares purchased from the proceeds of redemptions within the same fund family, provided (1) the repurchase occurs within 90 days following the redemption, (2) the redemption and purchase occur in the same account, and (3)��redeemed shares were subject to a front-end or deferred sales load (known as Rights of Restatement). |
| A shareholder in the Fund’s Class C shares will have their shares exchanged at net asset value to Class A shares (or the appropriate share class) of the Fund if the shares are no longer subject to a CDSC and the exchange is in line with the policies and procedures of Oppenheimer. |
| Employees and registered representatives of Oppenheimer or its affiliates and their family members. |
| Directors or Trustees of the Fund, and employees of the Fund’s investment adviser or any of its affiliates, as described in the Prospectus. |
| CDSC Waivers on A and C Shares available at Oppenheimer |
| Death or disability of the shareholder. |
| Shares sold as part of a systematic withdrawal plan as described in the Prospectus. |
| Return of excess contributions from an IRA Account. |
| Shares sold as part of a required minimum distribution for IRA and retirement accounts due to the shareholder reaching the qualified age based on applicable IRS regulations as described in the Prospectus. |
| Shares sold to pay Oppenheimer fees but only if the transaction is initiated by Oppenheimer. |
| Shares acquired through a right of reinstatement. |
| Front-end load Discounts Available at Oppenheimer: Breakpoints, Rights of Accumulation & Letters of Intent |
| Breakpoints as described in the Prospectus. |
| Rights of Accumulation (ROA), which entitle shareholders to breakpoint discounts, will be automatically calculated based on the aggregated holding of fund family assets held by accounts within the purchaser’s household at Oppenheimer. Eligible fund family assets not held at Oppenheimer may be included in the ROA calculation only if the shareholder notifies his or her financial advisor about such assets. |
Wells Fargo Index Asset Allocation Fund | 55
Table of Contents
Effective June 15, 2020, shareholders purchasing fund shares through a Robert W. Baird & Co. (“Baird”) platform or account will only be eligible for the following sales charge waivers (front-end sales charge waivers and CDSC waivers) and discounts, which may differ from those disclosed elsewhere in the Fund’s Prospectus or the SAI.
| Front-end Sales Load Waivers on Class A Shares available at Baird |
| Shares purchased through reinvestment of capital gains distributions and dividend reinvestment when purchasing share of the same fund. |
| Share purchase by employees and registers representatives of Baird or its affiliate and their family members as designated by Baird. |
| Shares purchase from the proceeds of redemptions within the same fund family, provided (1) the repurchase occurs within 90 days following the redemption, (2) the redemption and purchase occur in the same accounts, and (3) redeemed shares were subject to a front-end or deferred sales charge (known as rights of reinstatement). |
| A shareholder in the Funds Investor C Shares will have their share exchanged at net asset value to Investor A shares of the fund if the shares are no longer subject to CDSC and the exchange is in line with the policies and procedures of Baird. |
| Employer-sponsored retirement plans or charitable accounts in a transactional brokerage account at Baird, including 401(k)plans, 457 plans, employer-sponsored 403(b) plans, profit sharing and money purchase pension plans and defined benefit plans. For purposes of this provision, employer-sponsored retirement plans do not include SEP IRAs, Simple IRAs or SAR-SEPs. |
| CDSC Waivers on A and C Shares available at Baird |
| Shares sold due to death or disability of the shareholder. |
| Shares sold as part of a systematic withdrawal plan as described in the Fund’s Prospectus. |
| Shares bought due to returns of excess contributions from an IRA Account. |
| Shares sold as part of a required minimum distribution for IRA and retirement accounts due to the shareholder reaching age 72as described in the Fund’s Prospectus. |
| Shares sold to pay Baird fees but only if the transaction is initiated by Baird. |
| Shares acquired through a right of reinstatement. |
| Front-end load Discounts Available at Baird: Breakpoint and/or Rights of Accumulation |
| Breakpoints as described in the Prospectus. |
| Rights of accumulations which entitles shareholders to breakpoint discounts will be automatically calculated based on the aggregated holding of fund family assets held by accounts within the purchaser’s household at Baird. Eligible fund family assets not held at Baird may be included in the rights of accumulations calculation only if the shareholder notifies his or her financial advisor about such assets. |
| Letters of Intent (LOI) allow for breakpoint discounts based on anticipated purchases within a fund family through Baird, over a 13-month period of time. |
56 | Wells Fargo Index Asset Allocation Fund
Table of Contents
For more information
More information about Wells Fargo Funds is available free upon request. To obtain literature, please write, visit the Fund’s website, or call:
Wells Fargo Funds
P.O. Box 219967
Kansas City, MO 64121-9967
Website: wfam.com
Individual investors: 1-800-222-8222
Retail investment professionals: 1-888-877-9275
Institutional investment professionals: 1-866-765-0778

This report and the financial statements contained herein are submitted for the general information of the shareholders of the Fund. If this report is used for promotional purposes, distribution of the report must be accompanied or preceded by a current prospectus. Before investing, please consider the investment objectives, risks, charges, and expenses of the investment. For a current prospectus and, if available, a summary prospectus, containing this information, call 1-800-222-8222 or visit the Fund’s website at wfam.com. Read the prospectus carefully before you invest or send money.
Wells Fargo Asset Management (WFAM) is the trade name for certain investment advisory/management firms owned by Wells Fargo & Company. These firms include but are not limited to Wells Capital Management Incorporated and Wells Fargo Funds Management, LLC. Certain products managed by WFAM entities are distributed by Wells Fargo Funds Distributor, LLC (a broker-dealer and Member FINRA).
This material is for general informational and educational purposes only and is NOT intended to provide investment advice or a recommendation of any kind—including a recommendation for any specific investment, strategy, or plan.
INVESTMENT PRODUCTS: NOT FDIC INSURED ◾ NO BANK GUARANTEE ◾ MAY LOSE VALUE
© 2020 Wells Fargo & Company. All rights reserved.
PAR-020-00569 11-20
A227/AR227 09-20
Table of Contents

Annual Report
September 30, 2020
Wells Fargo C&B Mid Cap Value Fund
Beginning on January 1, 2021, as permitted by new regulations adopted by the Securities and Exchange Commission, paper copies of the Wells Fargo Funds’ annual and semi-annual shareholder reports issued after this date will no longer be sent by mail, unless you specifically request paper copies of the reports. Instead, the reports will be made available on the Funds’ website, and you will be notified by mail each time a report is posted and provided with a website address to access the report.
If you already elected to receive shareholder reports electronically, you will not be affected by this change and you need not take any action. You may elect to receive shareholder reports and other communications from the Fund electronically at any time by contacting your financial intermediary (such as a broker-dealer or bank) or, if you are a direct investor, by calling 1-800-222-8222 or by enrolling at wellsfargo.com/advantagedelivery.
You may elect to receive all future reports in paper free of charge. If you invest through a financial intermediary, you can contact your financial intermediary to request that you continue to receive paper copies of your shareholder reports; if you invest directly with the Fund, you can call 1-800-222-8222. Your election to receive reports in paper will apply to all Wells Fargo Funds held in your account with your financial intermediary or, if you are a direct investor, to all Wells Fargo Funds that you hold.
Table of Contents
|
Reduce clutter. Save trees. |
Sign up for electronic delivery of prospectuses and shareholder reports at wellsfargo.com/ |
The views expressed and any forward-looking statements are as of September 30, 2020, unless otherwise noted, and are those of the Fund’s portfolio managers and/or Wells Fargo Asset Management. Discussions of individual securities, or the markets generally, or any Wells Fargo Fund are not intended as individual recommendations. Future events or results may vary significantly from those expressed in any forward-looking statements. The views expressed are subject to change at any time in response to changing circumstances in the market. Wells Fargo Asset Management and the Fund disclaim any obligation to publicly update or revise any views expressed or forward-looking statements.
INVESTMENT PRODUCTS: NOT FDIC INSURED ◾ NO BANK GUARANTEE ◾ MAY LOSE VALUE
Wells Fargo C&B Mid Cap Value Fund | 1
Table of Contents
Letter to shareholders (unaudited)

Andrew Owen
President
Wells Fargo Funds
Dear Shareholder:
We are pleased to offer you this annual report for the Wells Fargo C&B Mid Cap Value Fund for the 12-month period that ended September 30, 2020. Global stock markets saw earlier gains erased in March as governments around the world took unprecedented measures, attempting to stop the spread of COVID-19 at the expense of short-term economic output. However, markets rallied strongly from April on to more than offset those short-term losses as central banks bolstered capital markets and confidence.
For the 12-month period, equities had broadly positive total returns despite intense volatility in March. Non-U.S. developed market equities had weaker performance than emerging market and U.S. stocks. While gains from fixed-income securities were positive, they were more modest than equities. For the period, U.S. stocks, based on the S&P 500 Index,1 gained 15.15%. International stocks, as measured by the MSCI ACWI ex USA Index (Net),2 returned 3.00%, while the MSCI EM Index (Net)3 had stronger performance, with a 10.54% gain. For bond investors, the Bloomberg Barclays U.S. Aggregate Bond Index4 returned 6.98%, the Bloomberg Barclays Global Aggregate ex-USD Index5 gained 5.48%, and the Bloomberg Barclays Municipal Bond Index6 returned 4.09% while the ICE BofA U.S. High Yield Index7 returned 2.30%.
The period began with mixed economic readings.
The fourth quarter of 2019 started on a strong note. U.S.-China trade tensions, which had been building for months, relaxed in October; optimism rose for a U.K. Brexit deal; and macroeconomic data turned positive. The initial estimate of U.S. third-quarter gross domestic product (GDP) growth was a resilient 1.9% annualized rate, while the U.S. unemployment rate fell to a 50-year low of 3.5% in September. However, despite strength among U.S. consumers, business confidence declined while manufacturing activity contracted. Concerned with a potential economic slowdown, the U.S. Federal Reserve (Fed) lowered interest rates a quarter point in late October—its third rate cut in four months. This helped push the S&P 500 Index to an all-time high while emerging market equities rallied and global bonds declined overall, reflecting a broad pickup in risk appetite.
Equity markets continued to rally in November despite ongoing geopolitical risks. Hopes for a U.S.-China trade deal buoyed investor confidence. U.S. business sentiment improved slightly and manufacturing and services activity picked up. While consumer confidence and purchasing managers’ activity rose in the eurozone, China reported weakening manufacturing and consumer data. Bond yields rose marginally, leading to slightly negative returns for global government and investment-grade corporate bonds.
| 1 | The S&P 500 Index consists of 500 stocks chosen for market size, liquidity, and industry group representation. It is a market-value-weighted index with each stock’s weight in the index proportionate to its market value. You cannot invest directly in an index. |
| 2 | The Morgan Stanley Capital International (MSCI) All Country World Index (ACWI) ex USA Index (Net) is a free-float-adjusted market-capitalization-weighted index that is designed to measure the equity market performance of developed and emerging markets, excluding the United States. Source: MSCI. MSCI makes no express or implied warranties or representations and shall have no liability whatsoever with respect to any MSCI data contained herein. The MSCI data may not be further redistributed or used as a basis for other indices or any securities or financial products. This report is not approved, reviewed, or produced by MSCI. You cannot invest directly in an index. |
| 3 | The MSCI Emerging Markets (EM) Index (Net) is a free-float-adjusted market-capitalization-weighted index that is designed to measure equity market performance of emerging markets. You cannot invest directly in an index. |
| 4 | The Bloomberg Barclays U.S. Aggregate Bond Index is a broad-based benchmark that measures the investment-grade, U.S. dollar-denominated, fixed-rate taxable bond market, including Treasuries, government-related and corporate securities, mortgage-backed securities (agency fixed-rate and hybrid adjustable-rate mortgage pass-throughs), asset-backed securities, and commercial mortgage-backed securities. You cannot invest directly in an index. |
| 5 | The Bloomberg Barclays Global Aggregate ex-USD Index is an unmanaged index that provides a broad-based measure of the global investment-grade fixed-income markets excluding the U.S. dollar-denominated debt market. You cannot invest directly in an index. |
| 6 | The Bloomberg Barclays Municipal Bond Index is an unmanaged index composed of long-term tax-exempt bonds with a minimum credit rating of Baa. You cannot invest directly in an index. |
| 7 | The ICE BofA U.S. High Yield Index is a market-capitalization-weighted index of domestic and Yankee high-yield bonds. The index tracks the performance of high-yield securities traded in the U.S. bond market. You cannot invest directly in an index. Copyright 2020. ICE Data Indices, LLC. All rights reserved. |
2 | Wells Fargo C&B Mid Cap Value Fund
Table of Contents
Letter to shareholders (unaudited)
Financial markets ended 2019 with a boost from the U.S. and China accord on a Phase One trade deal. That, along with the landslide win by the pro-Brexit U.K. Conservative Party in a national election and ongoing central bank support, gave investors greater confidence. U.S. economic indicators were generally positive, with the exception of manufacturing activity and business confidence. Consumer confidence was resilient, fed by a robust labor market, tame inflation, and lower interest rates, which boosted housing affordability and stimulated homebuyer activity. The impeachment of President Trump had little impact on the markets. Meanwhile, slowing Chinese economic activity, partly attributable to the trade war, led to further government stimulus at year-end through lower reserve ratios, allowing banks to lend more money.
The year-end rally continued in early January 2020. However, capital market volatility spiked in late January on concerns over the potential impact of COVID-19 on the global economy and stock markets. With sentiment somewhat souring, perceived safe havens did well in January. The U.S. dollar and Japanese yen both rose and government bonds outperformed equities. While the S&P 500 Index held its ground, emerging market equities tumbled, including those in Asia.
In February, COVID-19 became the major market focus. Fears of the virus’s impact on Chinese and global growth led to expectations of increased global central bank monetary policy support. That led the 10-year U.S. Treasury yield to fall to an all-time low of 1.1%. Although equity markets initially shrugged off concerns about the outbreak, focusing instead on strong fourth-quarter earnings and improving business confidence in January, market sentiment turned sharply lower and the S&P 500 Index lost 8.2% for the month. Oil prices tumbled as Russia and the Organization of the Petroleum Exporting Countries compounded a major decline in oil demand with a brutal price war, partly aimed at dissuading further U.S. shale production, causing the price of West Texas Intermediate crude oil to plummet.
The global spread of COVID-19 led country after country to clamp down on social and business-related activity in order to contain the virus from causing even greater devastation and overwhelming health care systems. This abrupt stoppage of economic activity led to the sharp deceleration of global output, sending economies into a deep contraction. Central banks responded swiftly, slashing interest rates and expanding quantitative easing programs to restore liquidity and confidence to the markets. In the U.S., the Fed introduced several new lending programs, funding investment-grade bonds, money market mutual funds, and commercial paper while purchasing Treasuries, mortgage-backed securities, and overnight repurchase agreements. Meanwhile, stock markets tumbled quickly into a bear market, ending the longest bull stock market in U.S. history.
Markets rebounded strongly in April, fueled by unprecedented government and central bank stimulus measures. The U.S. economy contracted by an annualized 5.0% pace in the first quarter, with 30 million new unemployment insurance claims in six weeks. In the eurozone, first-quarter real GDP shrank 3.8%, with the composite April Flash Purchasing Managers’ Index (PMI), a monthly survey of purchasing managers, falling to an all-time low of 13.5. The European Central Bank expanded its quantitative easing to include the purchase of additional government bonds of countries with the greatest virus-related need, including Italy and Spain. China’s first-quarter GDP fell by 6.8% year over year. However, retail sales, production, and investment showed signs of recovery. Extreme oil-price volatility continued as global supply far exceeded demand.
The global equity market rebound continued in May, with widespread strong monthly gains. Investors regained confidence on reports of early signs of success in human trials of a COVID-19 vaccine. Growth stocks continued to outperform value stocks while returns on global government bonds were generally flat. In the U.S., a gap grew between the stock market rebound and devastating economic data points, including an April unemployment rate of 14.7%, the highest level since World War II. PMIs reflected
“The global spread of COVID-19 led country after country to clamp down on social and business-related activity in order to contain the virus from causing even greater devastation and overwhelming health care systems.”
Wells Fargo C&B Mid Cap Value Fund | 3
Table of Contents
Letter to shareholders (unaudited)
“The stock market continued to rally in August despite concerns over rising numbers of COVID-19 cases in the United States and several European countries, including France and Spain, as well as the expiration of the $600 weekly bonus unemployment benefit at the end of July.”
weakening activity in May in both the manufacturing and services sectors. U.S. corporate earnings reports indicated a 14% year-over-year contraction in earnings from the first quarter of 2019. However, high demand for technology, driven by remote activity, supported robust information technology sector earnings, which helped drive major technology stocks higher.
Financial markets posted widely positive returns in June despite ongoing economic weakness and high levels of uncertainty on the containment of COVID-19 and the timing of an effective vaccine. There were hopeful signs as economies reopened, with both U.S. and U.K. retail sales rebounding sharply in May. However, year over year, sales remained depressed. Vitally important to market sentiment was the ongoing commitment by central banks globally to do all they could to provide economic support through liquidity and low borrowing costs. U.S. economic activity was aided by one-time $1,200 stimulus checks and $600 bonus weekly unemployment benefits that expired at the end of July. However, unemployment remained historically high, easing somewhat from 14.7% in April to 11.1% in June. By month-end, numerous states reported increases of COVID-19 cases. China’s economic recovery picked up momentum in June, though it remained far from a full recovery.
July was a broadly positive month for both global equities and fixed income. However, economic data and a resurgence of COVID-19 cases pointed to the vulnerability of the global economy and the ongoing imperative to regain control of the pandemic. Second-quarter GDP shrank from the previous quarter by 9.5% and 12.1% in the U.S. and the eurozone, respectively. In contrast, China reported a 3.2% year-over-year expansion in its second-quarter GDP. U.S. unemployment remained high despite adding 1.8 million jobs in July, with a double-digit jobless rate persisting. However, manufacturing activity grew in both the U.S. and the eurozone. In Asia, while China’s manufacturing sector continued to expand, activity in Japan and South Korea contracted. In July, a rising concern was the rapid and broad reemergence of COVID-19 infections.
The stock market continued to rally in August despite concerns over rising numbers of COVID-19 cases in the United States and several European countries, including France and Spain, as well as the expiration of the $600 weekly bonus unemployment benefit at the end of July. U.S. stocks had strong monthly gains, led by the FAANG stocks—Facebook, Apple, Amazon, Netflix, and Google (Alphabet)—which dominate these indices and continued to rally. U.S. stocks generally surpassed other broadly positive global equity performance while fixed-income market monthly returns were broadly flat. Generally stronger-than-expected second-quarter earnings boosted investor sentiment along with the Fed’s announcement of a policy shift that will likely lead to longer-term low interest rates and supportive monetary policy. The U.S. Flash PMIs for both manufacturing and services beat expectations while U.S. housing market indicators were strong. In Europe, retail sales expanded and consumer confidence remained steady. China’s economy continued its fairly steady expansion. Overall, developed markets performed better than emerging market equities for the month of August as people took comfort in better-known equities in perceived safer markets.
Stocks grew more volatile in September on mixed economic data. U.S. PMIs showed solid growth in economic activity in both manufacturing and services. However, six months after the bottom fell out of the labor market in the early spring, only half of the 22 million jobs lost had returned. The U.S. unemployment rate fell to 7.9% in September, the fifth straight month of improvement but far higher than the 3.5% pre-COVID-19 rate. Only 661,000 jobs were added for the month, down from 1.5 million in August. Meanwhile, a reported 2.3 million people have given up looking for work. With U.S. Congress failing to pass further fiscal relief and uncertainties surrounding a possible vaccine, doubts crept back into the financial markets. In the U.K., a lack of progress in Brexit talks with the European Union weighed on markets. China’s economy picked up steam, however, with growth fueled by increased global demand, and China’s service sector had its strongest PMI reading in seven years.
4 | Wells Fargo C&B Mid Cap Value Fund
Table of Contents
Letter to shareholders (unaudited)
Don’t let short-term uncertainty derail long-term investment goals.
Periods of investment uncertainty can present challenges, but experience has taught us that maintaining long-term investment goals can be an effective way to plan for the future. To help you create a sound strategy based on your personal goals and risk tolerance, Wells Fargo Funds offers more than 100 mutual funds spanning a wide range of asset classes and investment styles. Although diversification cannot guarantee an investment profit or prevent losses, we believe it can be an effective way to manage investment risk and potentially smooth out overall portfolio performance. We encourage investors to know their investments and to understand that appropriate levels of risk-taking may unlock opportunities.
Thank you for choosing to invest with Wells Fargo Funds. We appreciate your confidence in us and remain committed to helping you meet your financial needs.
Sincerely,

Andrew Owen
President
Wells Fargo Funds
|
For further information about your Fund, contact your investment professional, visit our website at wfam.com, or call us directly at 1-800-222-8222. |
Notice to Shareholders
At a meeting held on August 10-12, 2020, the Board of Trustees of the Fund approved a change to the Fund’s automatic conversion feature for Class C shares in order to shorten the required holding period from 10 to 8 years. As a result, on a monthly basis beginning November 5, 2020, Class C shares will convert automatically into Class A shares 8 years after the initial date of purchase or, if you acquired your Class C shares through an exchange or conversion from another share class, 8 years after the date you acquired your Class C shares. When Class C shares that you acquired through a purchase or exchange convert, any other Class C shares that you purchased with reinvested dividends and distributions also will convert into Class A shares on a pro rata basis.
Please note that a shorter holding period may apply depending on your intermediary. Please see “Appendix A—Sales Charge Reductions and Waivers for Certain Intermediaries” in the Fund’s prospectus for further information.
Wells Fargo C&B Mid Cap Value Fund | 5
Table of Contents
Performance highlights (unaudited)
Investment objective
The Fund seeks maximum long-term return (current income and capital appreciation), consistent with minimizing risk to principal.
Manager
Wells Fargo Funds Management, LLC
Subadviser
Cooke and Bieler, L.P.
Portfolio managers
Andrew B. Armstrong, CFA®‡
Wesley Lim, CFA®‡
Steve Lyons, CFA®‡
Michael M. Meyer, CFA®‡
Edward W. O’Connor, CFA®‡
R. James O’Neil, CFA®‡
Mehul Trivedi, CFA®‡
William Weber, CFA®‡
Average annual total returns (%) as of September 30, 2020
| Including sales charge | Excluding sales charge | Expense ratios1 (%) | ||||||||||||||||||||||||||||||||
| Inception date | 1 year | 5 year | 10 year | 1 year | 5 year | 10 year | Gross | Net2 | ||||||||||||||||||||||||||
| Class A (CBMAX) | 7-26-2004 | -15.94 | 5.92 | 9.30 | -10.81 | 7.18 | 9.94 | 1.30 | 1.26 | |||||||||||||||||||||||||
| Class C (CBMCX) | 7-26-2004 | -12.32 | 6.42 | 9.14 | -11.32 | 6.42 | 9.14 | 2.05 | 2.01 | |||||||||||||||||||||||||
| Class R6 (CBMYX)3 | 7-31-2018 | – | – | – | -10.42 | 7.60 | 10.32 | 0.87 | 0.81 | |||||||||||||||||||||||||
| Administrator Class (CBMIX) | 7-26-2004 | – | – | – | -10.74 | 7.28 | 10.02 | 1.22 | 1.16 | |||||||||||||||||||||||||
| Institutional Class (CBMSX) | 7-26-2004 | – | – | – | -10.52 | 7.55 | 10.30 | 0.97 | 0.91 | |||||||||||||||||||||||||
| Russell Midcap® Value Index4 | – | – | – | – | -7.30 | 6.38 | 9.71 | – | – | |||||||||||||||||||||||||
Figures quoted represent past performance, which is no guarantee of future results, and do not reflect taxes that a shareholder may pay on an investment in a fund. Investment return and principal value of an investment will fluctuate so that an investor’s shares, when redeemed, may be worth more or less than their original cost. Performance shown without sales charges would be lower if sales charges were reflected. Current performance may be lower or higher than the performance data quoted, which assumes the reinvestment of dividends and capital gains. Current month-end performance is available on the Fund’s website, wfam.com.
Index returns do not include transaction costs associated with buying and selling securities, any mutual fund fees or expenses, or any taxes. It is not possible to invest directly in an index.
For Class A shares, the maximum front-end sales charge is 5.75%. For Class C shares, the maximum contingent deferred sales charge is 1.00%. Performance including a contingent deferred sales charge assumes the sales charge for the corresponding time period. Class R6, Administrator Class, and Institutional Class shares are sold without a front-end sales charge or contingent deferred sales charge.
Stock values fluctuate in response to the activities of individual companies and general market and economic conditions. Smaller-company stocks tend to be more volatile and less liquid than those of larger companies. Consult the Fund’s prospectus for additional information on these and other risks.
Please see footnotes on page 7.
6 | Wells Fargo C&B Mid Cap Value Fund
Table of Contents
Performance highlights (unaudited)
| Growth of $10,000 investment as of September 30, 20205 |
|
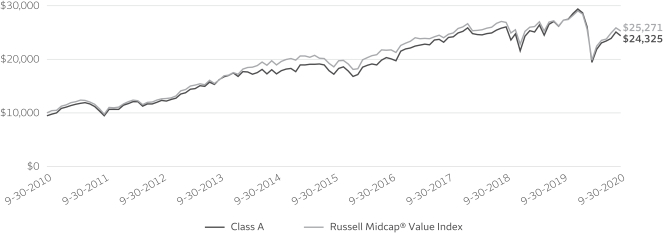
| ‡ | CFA® and Chartered Financial Analyst® are trademarks owned by CFA Institute. |
| 1 | Reflects the expense ratios as stated in the most recent prospectuses, which include the impact of 0.01% in acquired fund fees and expenses. The expense ratios shown are subject to change and may differ from the annualized expense ratios shown in the financial highlights of this report, which do not include acquired fund fees and expenses. |
| 2 | The manager has contractually committed through January 31, 2021, to waive fees and/or reimburse expenses to the extent necessary to cap total annual fund operating expenses after fee waivers at 1.25% for Class A, 2.00% for Class C, 0.80% for Class R6, 1.15% for Administrator Class, and 0.90% for Institutional Class. Brokerage commissions, stamp duty fees, interest, taxes, acquired fund fees and expenses (if any), and extraordinary expenses are excluded from the expense caps. Prior to or after the commitment expiration date, the caps may be increased or the commitment to maintain the caps may be terminated only with the approval of the Board of Trustees. Without these caps, the Fund’s returns would have been lower. The expense ratio paid by an investor is the net expense ratio (the total annual fund operating expenses after fee waivers) as stated in the prospectuses. |
| 3 | Historical performance shown for the Class R6 shares prior to their inception reflects the performance of the Institutional Class shares, and includes the higher expenses applicable to the Institutional Class shares. If these expenses had not been included, returns for the Class R6 shares would be higher. |
| 4 | The Russell Midcap® Value Index measures the performance of those Russell Midcap companies with lower price/book ratios and lower forecasted growth values. The stocks are also members of the Russell 1000® Value Index. You cannot invest directly in an index. |
| 5 | The chart compares the performance of Class A shares for the most recent ten years with the Russell Midcap® Value Index. The chart assumes a hypothetical investment of $10,000 in Class A shares and reflects all operating expenses and assumes the maximum initial sales charge of 5.75%. |
| 6 | The ten largest holdings, excluding cash, cash equivalents and any money market funds, are calculated based on the value of the investments divided by total net assets of the Fund. Holdings are subject to change and may have changed since the date specified. |
| 7 | Amounts are calculated based on the total long-term investments of the Fund. These amounts are subject to change and may have changed since the date specified. |
| * | This security was no longer held at the end of the reporting period. |
Wells Fargo C&B Mid Cap Value Fund | 7
Table of Contents
Performance highlights (unaudited)
MANAGER’S DISCUSSION
Fund highlights
| ∎ | The Fund underperformed its benchmark, the Russell Midcap® Value Index, for the 12-month period that ended September 30, 2020. |
| ∎ | Stock selection was significantly negative, with industrials stocks detracting most from relative performance. Health care and consumer discretionary stocks also detracted from relative results. |
| ∎ | Sector allocation effect was significantly positive, particularly due to the underweight to real estate and energy as well as the overweight to industrials. Stock selection within financials also added to relative results. |
Overview
Although markets remain down overall during the trailing 12 months, especially due to COVID-19-related market lows in March, U.S. equity markets continued higher in the third quarter on the heels of further government stimulus, improving economic data, encouraging readouts from COVID-19 vaccine trials, and better clinical outcomes for COVID-19 patients. Even though the trend somewhat reversed in September, growth stocks again led the charge, as has been the case over the last number of years. Given continued resilience in consumer spending and increasing evidence of economic recovery over the past two quarters, the generally broad-based market advance included particular strength among consumer discretionary and other economically sensitive constituents, though energy stocks declined meaningfully during the quarter and the trailing 12 months in the face of persistently low oil prices.
| Ten largest holdings (%) as of September 30, 20206 | ||||
American Eagle Outfitters Incorporated | 3.62 | |||
Arrow Electronics Incorporated | 3.46 | |||
Helen of Troy Limited | 3.05 | |||
Whirlpool Corporation | 2.83 | |||
Gildan Activewear Incorporated | 2.67 | |||
Colfax Corporation | 2.61 | |||
The Progressive Corporation | 2.57 | |||
Synchrony Financial | 2.56 | |||
Essent Group Limited | 2.55 | |||
Alleghany Corporation | 2.49 | |||
Fund updates
We continue to find compelling opportunities for the Fund as market disruptions create pockets of valuation weakness despite strong fundamentals. This has been especially true in 2020, as portfolio turnover increased due to COVID-19-related volatility. We initiated positions across multiple industries, including consumer discretionary company Gentex, health care company Integra LifeSciences, two financials companies (Alleghany and Essent Group), and two industrials companies (Huntington Ingalls and IAA).
In order to make room for these holdings, we eliminated communication services company Activision Blizzard, consumer discretionary holding Williams-Sonoma, health care company MEDNAX, materials company Crown, and two information technology companies (Alliance Data Systems and Applied Materials).
| Sector allocation as of September 30, 20207 |
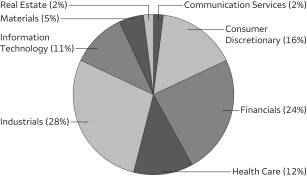 |
The five largest detractors from the Fund were balanced across multiple sectors, with cruise operator Norwegian having the most negative impact on the Fund.
Norwegian Cruise Lines*, the third-largest cruise operator in the world, was forced to cease operations indefinitely as cruise ships were deemed vectors for COVID-19 transmission early in the pandemic. Hexcel, a global leader in designing and manufacturing advanced composites, lagged due to uncertainty regarding the length and depth of Airbus and Boeing’s COVID-19-related production cuts, which led to continued weakness of exposed aerospace suppliers. AerCap, the largest independent aircraft lessor, suffered from investor
Please see footnotes on page 7.
8 | Wells Fargo C&B Mid Cap Value Fund
Table of Contents
Performance highlights (unaudited)
concerns about the financial health of its airline customers as the pandemic roils the global airline industry. Gildan and TCF Financial were the fourth- and fifth-largest detractors, respectively. From a positioning standpoint, the Fund’s overweight to financials and underweight to materials were headwinds.
The five largest stock contributors to the Fund’s return were led by consumer goods company Helen of Troy.
Helen of Troy, a consumer goods company with leading brands in niche categories, demonstrated strong organic trends prior to the emergence of COVID-19 but has also emerged as a slight net beneficiary of the pandemic.
Colfax, an acquisitive conglomerate with strong welding and orthopedic franchises, showed evidence that management had successfully integrated a recent acquisition, and investor optimism about end market recovery benefited the stock. Progressive, a leading personal auto insurer in North America, continued to demonstrate strong growth and profitability during the period. TE Connectivity and Arrow Electronics were the fourth- and fifth-largest contributors, respectively. From a positioning standpoint, the Fund benefited from the underweight to real estate and energy—the two worst sectors in terms of performance over the period—as well as the overweight to industrials.
Outlook
We remain generally constructive on the investing environment. The U.S. economy is exiting a recession and we expect the nascent recovery to persist as people slowly return to many pre-COVID-19 routines, driven by human nature and emboldened by improving therapies and eventually vaccines. This process likely will not be linear, and we expect market volatility along the way, but highly accommodative fiscal and monetary policy should provide continuing support. Offsetting the improving fundamental backdrop to some degree are very high expectations embedded in valuations in parts of the market. As the economy normalizes, we expect investors will better appreciate the enormous valuation disparity between the stocks of companies that have benefited from the pandemic and those that have been negatively affected. We have selectively favored the latter group, emphasizing reasonably valued stocks of the best positioned, financially strong companies that possess both staying power and latent fundamental improvement potential. We expect the portfolio to perform well as underlying fundamentals progress and these characteristics are better recognized.
Please see footnotes on page 7.
Wells Fargo C&B Mid Cap Value Fund | 9
Table of Contents
As a shareholder of the Fund, you incur two types of costs: (1) transaction costs, including sales charges (loads) on purchase payments and contingent deferred sales charges (if any) on redemptions and (2) ongoing costs, including management fees, distribution (12b-1) and/or shareholder servicing fees, and other Fund expenses. This example is intended to help you understand your ongoing costs (in dollars) of investing in the Fund and to compare these costs with the ongoing costs of investing in other mutual funds.
The example is based on an investment of $1,000 invested at the beginning of the six-month period and held for the entire period from April 1, 2020 to September 30, 2020.
Actual expenses
The “Actual” line of the table below provides information about actual account values and actual expenses. You may use the information in this line, together with the amount you invested, to estimate the expenses that you paid over the period. Simply divide your account value by $1,000 (for example, an $8,600 account value divided by $1,000 = 8.6), then multiply the result by the number in the “Actual” line under the heading entitled “Expenses paid during period” for your applicable class of shares to estimate the expenses you paid on your account during this period.
Hypothetical example for comparison purposes
The “Hypothetical” line of the table below provides information about hypothetical account values and hypothetical expenses based on the Fund’s actual expense ratio and an assumed rate of return of 5% per year before expenses, which is not the Fund’s actual return. The hypothetical account values and expenses may not be used to estimate the actual ending account balance or expenses you paid for the period. You may use this information to compare the ongoing costs of investing in the Fund and other funds. To do so, compare this 5% hypothetical example with the 5% hypothetical examples that appear in the shareholder reports of the other funds.
Please note that the expenses shown in the table are meant to highlight your ongoing costs only and do not reflect any transactional costs, such as sales charges (loads) and contingent deferred sales charges. Therefore, the “Hypothetical” line of the table is useful in comparing ongoing costs only and will not help you determine the relative total costs of owning different funds. In addition, if these transactional costs were included, your costs would have been higher.
Beginning account value 4-1-2020 | Ending account value 9-30-2020 | Expenses paid during the period1 | Annualized net expense ratio | |||||||||||||
Class A | ||||||||||||||||
Actual | $ | 1,000.00 | $ | 1,255.47 | $ | 7.05 | 1.25 | % | ||||||||
Hypothetical (5% return before expenses) | $ | 1,000.00 | $ | 1,018.81 | $ | 6.31 | 1.25 | % | ||||||||
Class C | ||||||||||||||||
Actual | $ | 1,000.00 | $ | 1,253.04 | $ | 11.28 | 2.00 | % | ||||||||
Hypothetical (5% return before expenses) | $ | 1,000.00 | $ | 1,015.05 | $ | 10.09 | 2.00 | % | ||||||||
Class R6 | ||||||||||||||||
Actual | $ | 1,000.00 | $ | 1,258.41 | $ | 4.53 | 0.80 | % | ||||||||
Hypothetical (5% return before expenses) | $ | 1,000.00 | $ | 1,021.06 | $ | 4.05 | 0.80 | % | ||||||||
Administrator Class | ||||||||||||||||
Actual | $ | 1,000.00 | $ | 1,255.86 | $ | 6.50 | 1.15 | % | ||||||||
Hypothetical (5% return before expenses) | $ | 1,000.00 | $ | 1,019.30 | $ | 5.82 | 1.15 | % | ||||||||
Institutional Class | ||||||||||||||||
Actual | $ | 1,000.00 | $ | 1,257.33 | $ | 5.09 | 0.90 | % | ||||||||
Hypothetical (5% return before expenses) | $ | 1,000.00 | $ | 1,020.56 | $ | 4.56 | 0.90 | % | ||||||||
| 1 | Expenses paid is equal to the annualized net expense ratio of each class multiplied by the average account value over the period, multiplied by the number of days in the most recent fiscal half-year divided by the number of days in the fiscal year (to reflect the one-half-year period). |
10 | Wells Fargo C&B Mid Cap Value Fund
Table of Contents
Portfolio of investments—September 30, 2020
| Shares | Value | |||||||||||||||
| Common Stocks: 97.99% |
| |||||||||||||||
Communication Services: 1.73% | ||||||||||||||||
| Media: 1.73% | ||||||||||||||||
Omnicom Group Incorporated | 160,200 | $ | 7,929,900 | |||||||||||||
|
| |||||||||||||||
Consumer Discretionary: 15.94% | ||||||||||||||||
| Auto Components: 1.00% | ||||||||||||||||
Gentex Corporation | 178,800 | 4,604,100 | ||||||||||||||
|
| |||||||||||||||
| Hotels, Restaurants & Leisure: 0.77% | ||||||||||||||||
Extended Stay America Incorporated | 296,550 | 3,543,773 | ||||||||||||||
|
| |||||||||||||||
| Household Durables: 5.88% | ||||||||||||||||
Helen of Troy Limited † | 72,500 | 14,030,200 | ||||||||||||||
Whirlpool Corporation | 70,700 | 13,001,023 | ||||||||||||||
| 27,031,223 | ||||||||||||||||
|
| |||||||||||||||
| Specialty Retail: 3.62% | ||||||||||||||||
American Eagle Outfitters Incorporated | 1,123,600 | 16,640,514 | ||||||||||||||
|
| |||||||||||||||
| Textiles, Apparel & Luxury Goods: 4.67% | ||||||||||||||||
Gildan Activewear Incorporated | 624,300 | 12,279,981 | ||||||||||||||
HanesBrands Incorporated | 581,300 | 9,155,475 | ||||||||||||||
| 21,435,456 | ||||||||||||||||
|
| |||||||||||||||
Financials: 23.68% | ||||||||||||||||
| Banks: 3.24% | ||||||||||||||||
Commerce Bancshares Incorporated | 81,703 | 4,599,062 | ||||||||||||||
TCF Financial Corporation | 440,510 | 10,290,314 | ||||||||||||||
| 14,889,376 | ||||||||||||||||
|
| |||||||||||||||
| Capital Markets: 2.30% | ||||||||||||||||
State Street Corporation | 178,600 | 10,596,338 | ||||||||||||||
|
| |||||||||||||||
Consumer Finance: 4.90% | ||||||||||||||||
FirstCash Financial Services Incorporated | 187,600 | 10,732,596 | ||||||||||||||
Synchrony Financial | 450,200 | 11,781,734 | ||||||||||||||
| 22,514,330 | ||||||||||||||||
|
| |||||||||||||||
| Insurance: 10.69% | ||||||||||||||||
Alleghany Corporation | 22,000 | 11,449,900 | ||||||||||||||
Arch Capital Group Limited † | 331,750 | 9,703,688 | ||||||||||||||
Fidelity National Financial Incorporated | 167,300 | 5,238,163 | ||||||||||||||
Globe Life Incorporated | 136,200 | 10,882,380 | ||||||||||||||
The Progressive Corporation | 124,900 | 11,824,283 | ||||||||||||||
| 49,098,414 | ||||||||||||||||
|
| |||||||||||||||
| Thrifts & Mortgage Finance: 2.55% | ||||||||||||||||
Essent Group Limited | 316,400 | 11,709,964 | ||||||||||||||
|
| |||||||||||||||
Health Care: 11.48% |
| |||||||||||||||
| Health Care Equipment & Supplies: 4.46% | ||||||||||||||||
Hill-Rom Holdings Incorporated | 108,900 | 9,094,239 | ||||||||||||||
Integra LifeSciences Holdings Corporation † | 241,500 | 11,403,630 | ||||||||||||||
| 20,497,869 | ||||||||||||||||
|
| |||||||||||||||
The accompanying notes are an integral part of these financial statements.
Wells Fargo C&B Mid Cap Value Fund | 11
Table of Contents
Portfolio of investments—September 30, 2020
| Shares | Value | |||||||||||||||
| Health Care Providers & Services: 2.46% | ||||||||||||||||
Laboratory Corporation of America Holdings † | 60,000 | $ | 11,296,200 | |||||||||||||
|
| |||||||||||||||
| Life Sciences Tools & Services: 2.47% | ||||||||||||||||
Syneos Health Incorporated † | 213,800 | 11,365,608 | ||||||||||||||
|
| |||||||||||||||
| Pharmaceuticals: 2.09% | ||||||||||||||||
Perrigo Company plc | 208,700 | 9,581,417 | ||||||||||||||
|
| |||||||||||||||
Industrials: 27.17% | ||||||||||||||||
| Aerospace & Defense: 5.29% | ||||||||||||||||
BWX Technologies Incorporated | 190,400 | 10,721,424 | ||||||||||||||
Hexcel Corporation | 118,800 | 3,985,740 | ||||||||||||||
Huntington Ingalls Industries Incorporated | 68,100 | 9,585,075 | ||||||||||||||
| 24,292,239 | ||||||||||||||||
|
| |||||||||||||||
| Building Products: 1.39% | ||||||||||||||||
Johnson Controls International plc | 157,000 | 6,413,450 | ||||||||||||||
|
| |||||||||||||||
| Commercial Services & Supplies: 3.40% | ||||||||||||||||
IAA Incorporated † | 219,200 | 11,413,744 | ||||||||||||||
Steelcase Incorporated Class A | 416,200 | 4,207,782 | ||||||||||||||
| 15,621,526 | ||||||||||||||||
|
| |||||||||||||||
| Electrical Equipment: 6.42% | ||||||||||||||||
Acuity Brands Incorporated | 86,600 | 8,863,510 | ||||||||||||||
AMETEK Incorporated | 95,200 | 9,462,880 | ||||||||||||||
Eaton Corporation plc | 109,700 | 11,192,691 | ||||||||||||||
| 29,519,081 | ||||||||||||||||
|
| |||||||||||||||
| Machinery: 8.74% | ||||||||||||||||
Colfax Corporation † | 382,300 | 11,988,928 | ||||||||||||||
Donaldson Company Incorporated | 91,900 | 4,265,998 | ||||||||||||||
Gates Industrial Corporation plc † | 400,650 | 4,455,228 | ||||||||||||||
Snap-on Incorporated | 67,500 | 9,931,275 | ||||||||||||||
Woodward Governor Company | 118,600 | 9,506,976 | ||||||||||||||
| 40,148,405 | ||||||||||||||||
|
| |||||||||||||||
| Trading Companies & Distributors: 1.93% | ||||||||||||||||
AerCap Holdings NV † | 351,600 | 8,856,804 | ||||||||||||||
|
| |||||||||||||||
Information Technology: 11.36% | ||||||||||||||||
| Electronic Equipment, Instruments & Components: 5.70% | ||||||||||||||||
Arrow Electronics Incorporated † | 202,100 | 15,897,186 | ||||||||||||||
TE Connectivity Limited | 105,200 | 10,282,248 | ||||||||||||||
| 26,179,434 | ||||||||||||||||
|
| |||||||||||||||
| IT Services: 3.96% | ||||||||||||||||
Amdocs Limited | 165,000 | 9,472,650 | ||||||||||||||
Leidos Holdings Incorporated | 97,700 | 8,709,955 | ||||||||||||||
| 18,182,605 | ||||||||||||||||
|
| |||||||||||||||
| Semiconductors & Semiconductor Equipment: 1.70% | ||||||||||||||||
MKS Instruments Incorporated | 71,600 | 7,820,868 | ||||||||||||||
|
| |||||||||||||||
The accompanying notes are an integral part of these financial statements.
12 | Wells Fargo C&B Mid Cap Value Fund
Table of Contents
Portfolio of investments—September 30, 2020
| Shares | Value | |||||||||||||||
Materials: 4.80% | ||||||||||||||||
| Chemicals: 1.55% | ||||||||||||||||
Axalta Coating Systems Limited † | 320,700 | $ | 7,109,919 | |||||||||||||
|
| |||||||||||||||
| Metals & Mining: 2.22% | ||||||||||||||||
Reliance Steel & Aluminum Company | 100,000 | 10,204,000 | ||||||||||||||
|
| |||||||||||||||
| Paper & Forest Products: 1.03% | ||||||||||||||||
Schweitzer-Mauduit International Incorporated | 155,200 | 4,716,528 | ||||||||||||||
|
| |||||||||||||||
Real Estate: 1.83% | ||||||||||||||||
| Real Estate Management & Development: 1.83% | ||||||||||||||||
CBRE Group Incorporated Class A † | 179,000 | 8,407,630 | ||||||||||||||
|
| |||||||||||||||
Total Common Stocks (Cost $423,107,192) |
| 450,206,971 | ||||||||||||||
|
| |||||||||||||||
| Yield | ||||||||||||||||
| Short-Term Investments: 2.29% | ||||||||||||||||
| Investment Companies: 2.29% | ||||||||||||||||
Wells Fargo Government Money Market Fund Select Class (l)(u) | 0.05 | % | 10,498,142 | 10,498,142 | ||||||||||||
|
| |||||||||||||||
Total Short-Term Investments (Cost $10,498,142) |
| 10,498,142 | ||||||||||||||
|
| |||||||||||||||
| Total investments in securities (Cost $433,605,334) | 100.28 | % | 460,705,113 | |||||
Other assets and liabilities, net | (0.28 | ) | (1,270,213 | ) | ||||
|
|
|
| |||||
| Total net assets | 100.00 | % | $ | 459,434,900 | ||||
|
|
|
| |||||
| † | Non-income-earning security |
| (l) | The issuer of the security is an affiliated person of the Fund as defined in the Investment Company Act of 1940. |
| (u) | The rate represents the 7-day annualized yield at period end. |
Investments in Affiliates
An affiliated investment is an investment in which the Fund owns at least 5% of the outstanding voting shares of the issuer or as a result of other relationships, such as the Fund and the issuer having the same investment manager. Transactions with issuers that were either affiliated persons of the Fund at the beginning of the period or the end of the period were as follows:
Value, beginning of period | Purchases | Sales proceeds | Net realized gains (losses) | Net change in unrealized gains (losses) | Income from affiliated securities | Value, end of period | % of net assets | |||||||||||||||||||||||||
| Short-Term Investments | ||||||||||||||||||||||||||||||||
Investment Companies | ||||||||||||||||||||||||||||||||
Securities Lending Cash Investments LLC * | $ | 5,733,750 | $ | 18,977,050 | $ | (24,710,655 | ) | $ | (145 | ) | $ | 0 | $ | 3,957 | # | $ | 0 | |||||||||||||||
Wells Fargo Government Money Market Fund Select Class | 17,446,499 | 241,557,419 | (248,505,776 | ) | 0 | 0 | 213,947 | 10,498,142 | ||||||||||||||||||||||||
|
|
|
|
|
|
|
|
|
| |||||||||||||||||||||||
| $ | (145 | ) | $ | 0 | $ | 217,904 | $ | 10,498,142 | 2.29 | % | ||||||||||||||||||||||
|
|
|
|
|
|
|
|
|
| |||||||||||||||||||||||
| * | No longer held at the end of the period. |
| # | Amount shown represents income before fees and rebates. |
The accompanying notes are an integral part of these financial statements.
Wells Fargo C&B Mid Cap Value Fund | 13
Table of Contents
Statement of assets and liabilities—September 30, 2020
Assets | ||||
Investments in unaffiliated securities, at value (cost $423,107,192) | $ | 450,206,971 | ||
Investments in affiliated securities, at value (cost $10,498,142) | 10,498,142 | |||
Receivable for investments sold | 135,939 | |||
Receivable for Fund shares sold | 1,240,110 | |||
Receivable for dividends | 293,156 | |||
Prepaid expenses and other assets | 93,706 | |||
|
| |||
Total assets | 462,468,024 | |||
|
| |||
Liabilities | ||||
Payable for investments purchased | 1,707,223 | |||
Payable for Fund shares redeemed | 979,237 | |||
Management fee payable | 274,973 | |||
Administration fees payable | 56,098 | |||
Distribution fee payable | 1,983 | |||
Trustees’ fees and expenses payable | 3,445 | |||
Accrued expenses and other liabilities | 10,165 | |||
|
| |||
Total liabilities | 3,033,124 | |||
|
| |||
Total net assets | $ | 459,434,900 | ||
|
| |||
Net assets consist of | ||||
Paid-in capital | $ | 447,128,391 | ||
Total distributable earnings | 12,306,509 | |||
|
| |||
Total net assets | $ | 459,434,900 | ||
|
| |||
Computation of net asset value and offering price per share | ||||
Net assets – Class A | $ | 104,921,741 | ||
Shares outstanding – Class A1 | 3,050,122 | |||
Net asset value per share – Class A | $34.40 | |||
Maximum offering price per share – Class A2 | $36.50 | |||
Net assets – Class C | $ | 3,217,079 | ||
Shares outstanding – Class C1 | 100,734 | |||
Net asset value per share – Class C | $31.94 | |||
Net assets – Class R6 | $ | 12,156,030 | ||
Shares outstanding – Class R61 | 349,648 | |||
Net asset value per share – Class R6 | $34.77 | |||
Net assets – Administrator Class | $ | 23,690,907 | ||
Shares outstanding – Administrator Class1 | 680,700 | |||
Net asset value per share – Administrator Class | $34.80 | |||
Net assets – Institutional Class | $ | 315,449,143 | ||
Shares outstanding – Institutional Class1 | 9,080,353 | |||
Net asset value per share – Institutional Class | $34.74 | |||
| 1 | The Fund has an unlimited number of authorized shares. |
| 2 | Maximum offering price is computed as 100/94.25 of net asset value. On investments of $50,000 or more, the offering price is reduced. |
The accompanying notes are an integral part of these financial statements.
14 | Wells Fargo C&B Mid Cap Value Fund
Table of Contents
Statement of operations—year ended September 30, 2020
Investment income | ||||
Dividends (net of foreign withholding taxes of $18,778) | $ | 6,516,198 | ||
Income from affiliated securities | 214,745 | |||
|
| |||
Total investment income | 6,730,943 | |||
|
| |||
Expenses | ||||
Management fee | 3,291,258 | |||
Administration fees | ||||
Class A | 224,655 | |||
Class C | 8,093 | |||
Class R6 | 4,079 | |||
Administrator Class | 35,284 | |||
Institutional Class | 373,465 | |||
Shareholder servicing fees | ||||
Class A | 267,060 | |||
Class C | 9,618 | |||
Administrator Class | 67,655 | |||
Distribution fee | ||||
Class C | 28,664 | |||
Custody and accounting fees | 22,190 | |||
Professional fees | 40,168 | |||
Registration fees | 101,439 | |||
Shareholder report expenses | 65,400 | |||
Trustees’ fees and expenses | 21,260 | |||
Other fees and expenses | 16,277 | |||
|
| |||
Total expenses | 4,576,565 | |||
Less: Fee waivers and/or expense reimbursements | ||||
Fund-level | (60,941 | ) | ||
Class A | (11,852 | ) | ||
Class R6 | (3,585 | ) | ||
Administrator Class | (6,886 | ) | ||
Institutional Class | (77,816 | ) | ||
|
| |||
Net expenses | 4,415,485 | |||
|
| |||
Net investment income | 2,315,458 | |||
|
| |||
Realized and unrealized gains (losses) on investments | ||||
Net realized losses on | ||||
Unaffiliated securities | (13,737,741 | ) | ||
Affiliated securities | (145 | ) | ||
|
| |||
Net realized losses on investments | (13,737,886 | ) | ||
Net change in unrealized gains (losses) on investments | (31,020,572 | ) | ||
|
| |||
Net realized and unrealized gains (losses) on investments | (44,758,458 | ) | ||
|
| |||
Net decrease in net assets resulting from operations | $ | (42,443,000 | ) | |
|
| |||
The accompanying notes are an integral part of these financial statements.
Wells Fargo C&B Mid Cap Value Fund | 15
Table of Contents
Statement of changes in net assets
| Year ended September 30, 2020 | Year ended September 30, 2019 | |||||||||||||||
Operations | ||||||||||||||||
Net investment income | $ | 2,315,458 | $ | 2,205,049 | ||||||||||||
Net realized gains (losses) on investments | (13,737,886 | ) | 10,275,898 | |||||||||||||
Net change in unrealized gains (losses) on investments | (31,020,572 | ) | 6,365,733 | |||||||||||||
|
| |||||||||||||||
Net increase (decrease) in net assets resulting from operations | (42,443,000 | ) | 18,846,680 | |||||||||||||
|
| |||||||||||||||
Distributions to shareholders from net investment income and net realized gains | ||||||||||||||||
Class A | (3,368,775 | ) | (159,086 | ) | ||||||||||||
Class C | (116,894 | ) | 0 | |||||||||||||
Class R6 | (485,361 | ) | (76,727 | ) | ||||||||||||
Administrator Class | (945,399 | ) | (60,977 | ) | ||||||||||||
Institutional Class | (8,727,328 | ) | (1,010,122 | ) | ||||||||||||
|
| |||||||||||||||
Total distributions to shareholders | (13,643,757 | ) | (1,306,912 | ) | ||||||||||||
|
| |||||||||||||||
Capital share transactions | Shares | Shares | ||||||||||||||
Proceeds from shares sold | ||||||||||||||||
Class A | 960,999 | 33,921,828 | 316,284 | 11,568,529 | ||||||||||||
Class C | 27,501 | 911,966 | 28,128 | 897,999 | ||||||||||||
Class R6 | 81,470 | 2,854,895 | 475,263 | 17,075,950 | ||||||||||||
Administrator Class | 317,699 | 12,268,162 | 200,859 | 7,561,359 | ||||||||||||
Institutional Class | 7,166,530 | 244,342,104 | 3,096,014 | 113,109,321 | ||||||||||||
|
| |||||||||||||||
| 294,298,955 | 150,213,158 | |||||||||||||||
|
| |||||||||||||||
Reinvestment of distributions | ||||||||||||||||
Class A | 79,402 | 3,248,552 | 4,720 | 154,816 | ||||||||||||
Class C | 2,989 | 113,505 | 0 | 0 | ||||||||||||
Class R6 | 6,228 | 257,557 | 995 | 32,841 | ||||||||||||
Administrator Class | 22,658 | 938,447 | 1,590 | 52,718 | ||||||||||||
Institutional Class | 210,740 | 8,708,954 | 30,350 | 1,001,844 | ||||||||||||
|
| |||||||||||||||
| 13,267,015 | 1,242,219 | |||||||||||||||
|
| |||||||||||||||
Payment for shares redeemed | ||||||||||||||||
Class A | (686,660 | ) | (23,231,821 | ) | (564,439 | ) | (20,529,618 | ) | ||||||||
Class C | (53,935 | ) | (1,754,560 | ) | (139,702 | ) | (4,695,256 | ) | ||||||||
Class R6 | (115,303 | ) | (4,078,132 | ) | (99,674 | ) | (3,641,646 | ) | ||||||||
Administrator Class | (258,443 | ) | (8,985,442 | ) | (150,211 | ) | (5,462,836 | ) | ||||||||
Institutional Class | (4,458,883 | ) | (151,411,494 | ) | (2,201,065 | ) | (78,294,383 | ) | ||||||||
|
| |||||||||||||||
| (189,461,449 | ) | (112,623,739 | ) | |||||||||||||
|
| |||||||||||||||
Net increase in net assets resulting from capital share transactions | 118,104,521 | 38,831,638 | ||||||||||||||
|
| |||||||||||||||
Total increase in net assets | 62,017,764 | 56,371,406 | ||||||||||||||
|
| |||||||||||||||
Net assets | ||||||||||||||||
Beginning of period | 397,417,136 | 341,045,730 | ||||||||||||||
|
| |||||||||||||||
End of period | $ | 459,434,900 | $ | 397,417,136 | ||||||||||||
|
| |||||||||||||||
The accompanying notes are an integral part of these financial statements.
16 | Wells Fargo C&B Mid Cap Value Fund
Table of Contents
(For a share outstanding throughout each period)
| Year ended September 30 | ||||||||||||||||||||
| CLASS A | 2020 | 2019 | 2018 | 2017 | 2016 | |||||||||||||||
Net asset value, beginning of period | $39.67 | $37.88 | $35.07 | $29.27 | $25.12 | |||||||||||||||
Net investment income (loss) | 0.10 | 1 | 0.16 | 0.06 | (0.00 | )1,2 | 0.07 | 1 | ||||||||||||
Net realized and unrealized gains (losses) on investments | (4.21 | ) | 1.69 | 2.75 | 5.82 | 4.13 | ||||||||||||||
|
|
|
|
|
|
|
|
|
| |||||||||||
Total from investment operations | (4.11 | ) | 1.85 | 2.81 | 5.82 | 4.20 | ||||||||||||||
Distributions to shareholders from | ||||||||||||||||||||
Net investment income | (0.15 | ) | (0.06 | ) | (0.00 | )3 | (0.02 | ) | (0.05 | ) | ||||||||||
Net realized gains | (1.01 | ) | 0.00 | 0.00 | 0.00 | 0.00 | ||||||||||||||
|
|
|
|
|
|
|
|
|
| |||||||||||
Total distributions to shareholders | (1.16 | ) | (0.06 | ) | (0.00 | )3 | (0.02 | ) | (0.05 | ) | ||||||||||
Net asset value, end of period | $34.40 | $39.67 | $37.88 | $35.07 | $29.27 | |||||||||||||||
Total return4 | (10.81 | )% | 4.91 | % | 8.02 | % | 19.89 | % | 16.73 | % | ||||||||||
Ratios to average net assets (annualized) | ||||||||||||||||||||
Gross expenses | 1.27 | % | 1.29 | % | 1.29 | % | 1.30 | % | 1.33 | % | ||||||||||
Net expenses | 1.25 | % | 1.25 | % | 1.25 | % | 1.25 | % | 1.24 | % | ||||||||||
Net investment income (loss) | 0.29 | % | 0.43 | % | 0.16 | % | (0.00 | )% | 0.27 | % | ||||||||||
Supplemental data | ||||||||||||||||||||
Portfolio turnover rate | 45 | % | 42 | % | 39 | % | 54 | % | 35 | % | ||||||||||
Net assets, end of period (000s omitted) | $104,922 | $106,975 | $111,354 | $115,258 | $120,020 | |||||||||||||||
| 1 | Calculated based upon average shares outstanding |
| 2 | Amount is more than $(0.005). |
| 3 | Amount is less than $0.005. |
| 4 | Total return calculations do not include any sales charges. |
The accompanying notes are an integral part of these financial statements.
Wells Fargo C&B Mid Cap Value Fund | 17
Table of Contents
Financial highlights
(For a share outstanding throughout each period)
| Year ended September 30 | ||||||||||||||||||||
| CLASS C | 2020 | 2019 | 2018 | 2017 | 2016 | |||||||||||||||
Net asset value, beginning of period | $36.98 | $35.51 | $33.12 | $27.83 | $24.02 | |||||||||||||||
Net investment loss | (0.16 | )1 | (0.12 | )1 | (0.20 | )1 | (0.26 | )1 | (0.14 | )1 | ||||||||||
Net realized and unrealized gains (losses) on investments | (3.87 | ) | 1.59 | 2.59 | 5.55 | 3.95 | ||||||||||||||
|
|
|
|
|
|
|
|
|
| |||||||||||
Total from investment operations | (4.03 | ) | 1.47 | 2.39 | 5.29 | 3.81 | ||||||||||||||
Distributions to shareholders from | ||||||||||||||||||||
Net realized gains | (1.01 | ) | 0.00 | 0.00 | 0.00 | 0.00 | ||||||||||||||
Net asset value, end of period | $31.94 | $36.98 | $35.51 | $33.12 | $27.83 | |||||||||||||||
Total return2 | (11.32 | )% | 4.14 | % | 7.22 | % | 19.01 | % | 15.86 | % | ||||||||||
Ratios to average net assets (annualized) | ||||||||||||||||||||
Gross expenses | 2.01 | % | 2.04 | % | 2.04 | % | 2.05 | % | 2.08 | % | ||||||||||
Net expenses | 2.00 | % | 2.00 | % | 2.00 | % | 2.00 | % | 1.98 | % | ||||||||||
Net investment loss | (0.47 | )% | (0.36 | )% | (0.59 | )% | (0.74 | )% | (0.55 | )% | ||||||||||
Supplemental data | ||||||||||||||||||||
Portfolio turnover rate | 45 | % | 42 | % | 39 | % | 54 | % | 35 | % | ||||||||||
Net assets, end of period (000s omitted) | $3,217 | $4,592 | $8,371 | $8,567 | $7,314 | |||||||||||||||
| 1 | Calculated based upon average shares outstanding |
| 2 | Total return calculations do not include any sales charges. |
The accompanying notes are an integral part of these financial statements.
18 | Wells Fargo C&B Mid Cap Value Fund
Table of Contents
Financial highlights
(For a share outstanding throughout each period)
| Year ended September 30 | ||||||||||||
| CLASS R6 | 2020 | 2019 | 20181 | |||||||||
Net asset value, beginning of period | $40.06 | $38.27 | $37.39 | |||||||||
Net investment income | 0.27 | 0.35 | 2 | 0.08 | 2 | |||||||
Net realized and unrealized gains (losses) on investments | (4.25 | ) | 1.67 | 0.80 | ||||||||
|
|
|
|
|
| |||||||
Total from investment operations | (3.98 | ) | 2.02 | 0.88 | ||||||||
Distributions to shareholders from | ||||||||||||
Net investment income | (0.30 | ) | (0.23 | ) | 0.00 | |||||||
Net realized gains | (1.01 | ) | 0.00 | 0.00 | ||||||||
|
|
|
|
|
| |||||||
Total distributions to shareholders | (1.31 | ) | (0.23 | ) | 0.00 | |||||||
Net asset value, end of period | $34.77 | $40.06 | $38.27 | |||||||||
Total return3 | (10.42 | )% | 5.39 | % | 2.35 | % | ||||||
Ratios to average net assets (annualized) | ||||||||||||
Gross expenses | 0.84 | % | 0.86 | % | 0.86 | % | ||||||
Net expenses | 0.80 | % | 0.80 | % | 0.80 | % | ||||||
Net investment income | 0.73 | % | 0.95 | % | 1.24 | % | ||||||
Supplemental data | ||||||||||||
Portfolio turnover rate | 45 | % | 42 | % | 39 | % | ||||||
Net assets, end of period (000s omitted) | $12,156 | $15,112 | $26 | |||||||||
| 1 | For the period from July 31, 2018 (commencement of class operations) to September 30, 2018 |
| 2 | Calculated based upon average shares outstanding |
| 3 | Returns for periods of less than one year are not annualized. |
The accompanying notes are an integral part of these financial statements.
Wells Fargo C&B Mid Cap Value Fund | 19
Table of Contents
Financial highlights
(For a share outstanding throughout each period)
| Year ended September 30 | ||||||||||||||||||||
| ADMINISTRATOR CLASS | 2020 | 2019 | 2018 | 2017 | 2016 | |||||||||||||||
Net asset value, beginning of period | $40.14 | $38.35 | $35.52 | $29.63 | $25.42 | |||||||||||||||
Net investment income | 0.14 | 1 | 0.20 | 1 | 0.10 | 1 | 0.04 | 1 | 0.08 | 1 | ||||||||||
Net realized and unrealized gains (losses) on investments | (4.27 | ) | 1.70 | 2.78 | 5.89 | 4.19 | ||||||||||||||
|
|
|
|
|
|
|
|
|
| |||||||||||
Total from investment operations | (4.13 | ) | 1.90 | 2.88 | 5.93 | 4.27 | ||||||||||||||
Distributions to shareholders from | ||||||||||||||||||||
Net investment income | (0.20 | ) | (0.11 | ) | (0.05 | ) | (0.04 | ) | (0.06 | ) | ||||||||||
Net realized gains | (1.01 | ) | 0.00 | 0.00 | 0.00 | 0.00 | ||||||||||||||
|
|
|
|
|
|
|
|
|
| |||||||||||
Total distributions to shareholders | (1.21 | ) | (0.11 | ) | (0.05 | ) | (0.04 | ) | (0.06 | ) | ||||||||||
Net asset value, end of period | $34.80 | $40.14 | $38.35 | $35.52 | $29.63 | |||||||||||||||
Total return | (10.74 | )% | 5.03 | % | 8.13 | % | 20.02 | % | 16.82 | % | ||||||||||
Ratios to average net assets (annualized) | ||||||||||||||||||||
Gross expenses | 1.19 | % | 1.21 | % | 1.21 | % | 1.22 | % | 1.25 | % | ||||||||||
Net expenses | 1.15 | % | 1.15 | % | 1.15 | % | 1.15 | % | 1.15 | % | ||||||||||
Net investment income | 0.38 | % | 0.53 | % | 0.26 | % | 0.12 | % | 0.28 | % | ||||||||||
Supplemental data | ||||||||||||||||||||
Portfolio turnover rate | 45 | % | 42 | % | 39 | % | 54 | % | 35 | % | ||||||||||
Net assets, end of period (000s omitted) | $23,691 | $24,036 | $20,960 | $21,267 | $8,302 | |||||||||||||||
| 1 | Calculated based upon average shares outstanding |
The accompanying notes are an integral part of these financial statements.
20 | Wells Fargo C&B Mid Cap Value Fund
Table of Contents
Financial highlights
(For a share outstanding throughout each period)
| Year ended September 30 | ||||||||||||||||||||
| INSTITUTIONAL CLASS | 2020 | 2019 | 2018 | 2017 | 2016 | |||||||||||||||
Net asset value, beginning of period | $40.04 | $38.26 | $35.41 | $29.53 | $25.34 | |||||||||||||||
Net investment income | 0.23 | 1 | 0.28 | 0.19 | 0.16 | 0.16 | ||||||||||||||
Net realized and unrealized gains (losses) on investments | (4.25 | ) | 1.70 | 2.78 | 5.82 | 4.17 | ||||||||||||||
|
|
|
|
|
|
|
|
|
| |||||||||||
Total from investment operations | (4.02 | ) | 1.98 | 2.97 | 5.98 | 4.33 | ||||||||||||||
Distributions to shareholders from | ||||||||||||||||||||
Net investment income | (0.27 | ) | (0.20 | ) | (0.12 | ) | (0.10 | ) | (0.14 | ) | ||||||||||
Net realized gains | (1.01 | ) | 0.00 | 0.00 | 0.00 | 0.00 | ||||||||||||||
|
|
|
|
|
|
|
|
|
| |||||||||||
Total distributions to shareholders | (1.28 | ) | (0.20 | ) | (0.12 | ) | (0.10 | ) | (0.14 | ) | ||||||||||
Net asset value, end of period | $34.74 | $40.04 | $38.26 | $35.41 | $29.53 | |||||||||||||||
Total return | (10.52 | )% | 5.29 | % | 8.41 | % | 20.30 | % | 17.11 | % | ||||||||||
Ratios to average net assets (annualized) | ||||||||||||||||||||
Gross expenses | 0.94 | % | 0.96 | % | 0.96 | % | 0.97 | % | 1.00 | % | ||||||||||
Net expenses | 0.90 | % | 0.90 | % | 0.90 | % | 0.90 | % | 0.90 | % | ||||||||||
Net investment income | 0.64 | % | 0.79 | % | 0.56 | % | 0.37 | % | 0.54 | % | ||||||||||
Supplemental data | ||||||||||||||||||||
Portfolio turnover rate | 45 | % | 42 | % | 39 | % | 54 | % | 35 | % | ||||||||||
Net assets, end of period (000s omitted) | $315,449 | $246,702 | $200,335 | $105,550 | $38,161 | |||||||||||||||
| 1 | Calculated based upon average shares outstanding |
The accompanying notes are an integral part of these financial statements.
Wells Fargo C&B Mid Cap Value Fund | 21
Table of Contents
1. ORGANIZATION
Wells Fargo Funds Trust (the “Trust”), a Delaware statutory trust organized on March 10, 1999, is an open-end management investment company registered under the Investment Company Act of 1940, as amended (the “1940 Act”). As an investment company, the Trust follows the accounting and reporting guidance in Financial Accounting Standards Board (“FASB”) Accounting Standards Codification Topic 946, Financial Services – Investment Companies. These financial statements report on the Wells Fargo C&B Mid Cap Value Fund (the “Fund”) which is a diversified series of the Trust.
2. SIGNIFICANT ACCOUNTING POLICIES
The following significant accounting policies, which are consistently followed in the preparation of the financial statements of the Fund, are in conformity with U.S. generally accepted accounting principles which require management to make estimates and assumptions that affect the reported amounts of assets and liabilities, disclosure of contingent assets and liabilities at the date of the financial statements, and the reported amounts of revenues and expenses during the reporting period. Actual results could differ from those estimates.
Securities valuation
All investments are valued each business day as of the close of regular trading on the New York Stock Exchange (generally 4 p.m. Eastern Time), although the Fund may deviate from this calculation time under unusual or unexpected circumstances.
Equity securities that are listed on a foreign or domestic exchange or market are valued at the official closing price or, if none, the last sales price. If no sale occurs on the principal exchange or market that day, a fair value price will be determined in accordance with the Fund’s Valuation Procedures.
Investments in registered open-end investment companies are valued at net asset value. Interests in non-registered investment companies that are redeemable at net asset value are fair valued normally at net asset value.
Investments which are not valued using any of the methods discussed above are valued at their fair value, as determined in good faith by the Board of Trustees of the Fund. The Board of Trustees has established a Valuation Committee comprised of the Trustees and has delegated to it the authority to take any actions regarding the valuation of portfolio securities that the Valuation Committee deems necessary or appropriate, including determining the fair value of portfolio securities, unless the determination has been delegated to the Wells Fargo Asset Management Pricing Committee at Wells Fargo Funds Management, LLC (“Funds Management”). The Board of Trustees retains the authority to make or ratify any valuation decisions or approve any changes to the Valuation Procedures as it deems appropriate. On a quarterly basis, the Board of Trustees receives reports on any valuation actions taken by the Valuation Committee or the Wells Fargo Asset Management Pricing Committee which may include items for ratification.
Securities lending
The Fund may lend its securities from time to time in order to earn additional income in the form of fees or interest on securities received as collateral or the investment of any cash received as collateral. When securities are on loan, the Fund receives interest or dividends on those securities. Cash collateral received in connection with its securities lending transactions is invested in Securities Lending Cash Investments, LLC (the “Securities Lending Fund”). Investments in Securities Lending Fund are valued at the evaluated bid price provided by an independent pricing service. Income earned from investment in the Securities Lending Fund (net of fees and rebates), if any, is included in income from affiliated securities on the Statement of Operations.
In a securities lending transaction, the net asset value of the Fund is affected by an increase or decrease in the value of the securities loaned and by an increase or decrease in the value of the instrument in which collateral is invested. The amount of securities lending activity undertaken by the Fund fluctuates from time to time. The Fund has the right under the lending agreement to recover the securities from the borrower on demand. In the event of default or bankruptcy by the borrower, the Fund may be prevented from recovering the loaned securities or gaining access to the collateral or may experience delays or costs in doing so. In such an event, the terms of the agreement allow the unaffiliated securities lending agent to use the collateral to purchase replacement securities on behalf of the Fund or pay the Fund the market value of the loaned securities. The Fund bears the risk of loss with respect to depreciation of its investment of the cash collateral.
Security transactions and income recognition
Securities transactions are recorded on a trade date basis. Realized gains or losses are recorded on the basis of identified cost.
Dividend income is recognized on the ex-dividend date. Dividend income is recorded net of foreign taxes withheld where recovery of such taxes is not assured.
22 | Wells Fargo C&B Mid Cap Value Fund
Table of Contents
Notes to financial statements
Distributions to shareholders
Distributions to shareholders from net investment income and any net realized gains are recorded on the ex-dividend date and paid at least annually. Such distributions are determined in accordance with income tax regulations and may differ from U.S. generally accepted accounting principles. Dividend sources are estimated at the time of declaration. The tax character of distributions is determined as of the Fund’s fiscal year end. Therefore, a portion of the Fund’s distributions made prior to the Fund’s fiscal year end may be categorized as a tax return of capital at year end.
Federal and other taxes
The Fund intends to continue to qualify as a regulated investment company by distributing substantially all of its investment company taxable income and any net realized capital gains (after reduction for capital loss carryforwards) sufficient to relieve it from all, or substantially all, federal income taxes. Accordingly, no provision for federal income taxes was required.
The Fund’s income and federal excise tax returns and all financial records supporting those returns for the prior three fiscal years are subject to examination by the federal and Delaware revenue authorities. Management has analyzed the Fund’s tax positions taken on federal, state, and foreign tax returns for all open tax years and does not believe that there are any uncertain tax positions that require recognition of a tax liability.
As of September 30, 2020, the aggregate cost of all investments for federal income tax purposes was $444,558,274 and the unrealized gains (losses) consisted of:
Gross unrealized gains | $ | 46,255,983 | ||
Gross unrealized losses | (30,109,144 | ) | ||
Net unrealized gains | $ | 16,146,839 | ||
As of September 30, 2020, the Fund had capital loss carryforwards which consist of $5,283,545 in short-term capital losses.
Class allocations
The separate classes of shares offered by the Fund differ principally in applicable sales charges, distribution, shareholder servicing, and administration fees. Class specific expenses are charged directly to that share class. Investment income, common fund-level expenses, and realized and unrealized gains (losses) on investments are allocated daily to each class of shares based on the relative proportion of net assets of each class.
3. FAIR VALUATION MEASUREMENTS
Fair value measurements of investments are determined within a framework that has established a fair value hierarchy based upon the various data inputs utilized in determining the value of the Fund’s investments. The three-level hierarchy gives the highest priority to unadjusted quoted prices in active markets for identical assets or liabilities (Level 1) and the lowest priority to unobservable inputs (Level 3). The Fund’s investments are classified within the fair value hierarchy based on the lowest level of input that is significant to the fair value measurement. The inputs are summarized into three broad levels as follows:
| ∎ | Level 1 – quoted prices in active markets for identical securities |
| ∎ | Level 2 – other significant observable inputs (including quoted prices for similar securities, interest rates, prepayment speeds, credit risk, etc.) |
| ∎ | Level 3 – significant unobservable inputs (including the Fund’s own assumptions in determining the fair value of investments) |
The inputs or methodologies used for valuing investments in securities are not necessarily an indication of the risk associated with investing in those securities.
Wells Fargo C&B Mid Cap Value Fund | 23
Table of Contents
Notes to financial statements
The following is a summary of the inputs used in valuing the Fund’s assets and liabilities as of September 30, 2020:
Quoted prices (Level 1) | Other significant observable inputs (Level 2) | Significant unobservable inputs (Level 3) | Total | |||||||||||||
Assets | ||||||||||||||||
Investments in: | ||||||||||||||||
Common stocks | ||||||||||||||||
Communication services | $ | 7,929,900 | $ | 0 | $ | 0 | $ | 7,929,900 | ||||||||
Consumer discretionary | 73,255,066 | 0 | 0 | 73,255,066 | ||||||||||||
Financials | 108,808,422 | 0 | 0 | 108,808,422 | ||||||||||||
Health care | 52,741,094 | 0 | 0 | 52,741,094 | ||||||||||||
Industrials | 124,851,505 | 0 | 0 | 124,851,505 | ||||||||||||
Information technology | 52,182,907 | 0 | 0 | 52,182,907 | ||||||||||||
Materials | 22,030,447 | 0 | 0 | 22,030,447 | ||||||||||||
Real estate | 8,407,630 | 0 | 0 | 8,407,630 | ||||||||||||
Short-term investments | ||||||||||||||||
Investment companies | 10,498,142 | 0 | 0 | 10,498,142 | ||||||||||||
Total assets | $ | 460,705,113 | $ | 0 | $ | 0 | $ | 460,705,113 | ||||||||
Additional sector, industry or geographic detail is included in the Portfolio of Investments.
For the year ended September 30, 2020, the Fund did not have any transfers into/out of Level 3.
4. TRANSACTIONS WITH AFFILIATES AND OTHER EXPENSES
Management fee
Funds Management, an indirect wholly owned subsidiary of Wells Fargo & Company (“Wells Fargo”), is the manager of the Fund and provides advisory and fund-level administrative services under an investment management agreement. Under the investment management agreement, Funds Management is responsible for, among other services, implementing the investment objectives and strategies of the Fund, supervising the subadviser and providing fund-level administrative services in connection with the Fund’s operations. As compensation for its services under the investment management agreement, Funds Management is entitled to receive a management fee at the following annual rate based on the Fund’s average daily net assets:
| Average daily net assets | Management fee | |||
First $500 million | 0.750 | % | ||
Next $500 million | 0.725 | |||
Next $1 billion | 0.700 | |||
Next $2 billion | 0.675 | |||
Next $1 billion | 0.650 | |||
Next $5 billion | 0.640 | |||
Next $2 billion | 0.630 | |||
Next $4 billion | 0.620 | |||
Over $16 billion | 0.610 | |||
For the year ended September 30, 2020, the management fee was equivalent to an annual rate of 0.75% of the Fund’s average daily net assets.
Funds Management has retained the services of a subadviser provide daily portfolio management to the Fund. The fee for subadvisory services is borne by Funds Management. Cooke & Bieler, L.P., which is not an affiliate of Funds Management, is the subadviser to the Fund and is entitled to receive a fee from Funds Management at an annual rate starting at 0.45% and declining to 0.35% as the average daily net assets of the Fund increase.
24 | Wells Fargo C&B Mid Cap Value Fund
Table of Contents
Notes to financial statements
Administration fees
Under a class-level administration agreement, Funds Management provides class-level administrative services to the Fund, which includes paying fees and expenses for services provided by the transfer agent, sub-transfer agents, omnibus account servicers and record-keepers. As compensation for its services under the class-level administration agreement, Funds Management receives an annual fee which is calculated based on the average daily net assets of each class as follows:
Class-level administration fee | ||||
Class A, Class C | 0.21 | % | ||
Class R6 | 0.03 | |||
Administrator Class, Institutional Class | 0.13 | |||
Waivers and/or expense reimbursements
Funds Management has contractually waived and/or reimbursed management and administration fees to the extent necessary to maintain certain net operating expense ratios for the Fund. When each class of the Fund has exceeded its expense cap, Funds Management has waived fees and/or reimbursed expenses from fund-level expenses on a proportionate basis and then from class specific expenses. When only certain classes exceed their expense caps, waivers and/or reimbursements are applied against class specific expenses before fund-level expenses. Funds Management has committed through January 31, 2021 to waive fees and/or reimburse expenses to the extent necessary to cap the Fund’s expenses 1.25% for Class A shares, 2.00% for Class C shares, 0.80% for Class R6 shares, 1.15% for Administrator Class shares, and 0.90% for Institutional Class shares. Prior to or after the commitment expiration date, the cap may be increased or the commitment to maintain the cap may be terminated only with the approval of the Board of Trustees.
Distribution fee
The Trust has adopted a distribution plan for Class C shares of the Fund pursuant to Rule 12b-1 under the 1940 Act. A distribution fee is charged to Class C shares and paid to Wells Fargo Funds Distributor, LLC (“Funds Distributor”), the principal underwriter, at an annual rate of 0.75% of the average daily net assets of Class C shares.
In addition, Funds Distributor is entitled to receive the front-end sales charge from the purchase of Class A shares and a contingent deferred sales charge on the redemption of certain Class A shares. Funds Distributor is also entitled to receive the contingent deferred sales charges from redemptions of Class C shares. For the year ended September 30, 2020, Funds Distributor received $5,145 from the sale of Class A shares. No contingent deferred sales charges were incurred by Class A and Class C shares for the year ended September 30, 2020.
Shareholder servicing fees
The Trust has entered into contracts with one or more shareholder servicing agents, whereby Class A, Class C, and Administrator Class of the Fund are charged a fee at an annual rate of 0.25% of the average daily net assets of each respective class. A portion of these total shareholder servicing fees were paid to affiliates of Wells Fargo.
Interfund transactions
The Fund may purchase or sell portfolio investment securities to certain other Wells Fargo affiliates pursuant to Rule 17a-7 under the 1940 Act and under procedures adopted by the Board of Trustees. The procedures have been designed to ensure that these interfund transactions, which do not incur broker commissions, are effected at current market prices.
5. INVESTMENT PORTFOLIO TRANSACTIONS
Purchases and sales of investments, excluding U.S. government obligations (if any) and short-term securities, for the year ended September 30, 2020 were $301,302,733 and $187,244,248, respectively.
6. SECURITIES LENDING TRANSACTIONS
The Fund lends its securities through an unaffiliated securities lending agent and receives collateral in the form of cash or securities with a value at least equal to the value of the securities on loan. The value of the loaned securities is determined at the close of each business day and any increases or decreases in the required collateral are exchanged between the Fund and the counterparty on the next business day. Cash collateral received is invested in the Securities Lending Fund which seeks to provide a positive return compared to the daily Federal Funds Open Rate by investing in high-quality, U.S. dollar-denominated short-term money market instruments and is exempt from registration under Section 3(c)(7) of the 1940 Act. Securities Lending Fund is managed by Funds Management and is subadvised by Wells Capital Management Incorporated (“WellsCap”), an affiliate of Funds Management and an indirect wholly owned subsidiary of Wells Fargo. Funds Management receives an advisory fee starting at 0.05% and declining to 0.01% as the average daily net assets of the Securities Lending Fund increase. All of the fees received by Funds Management are paid to WellsCap for its services as subadviser.
Wells Fargo C&B Mid Cap Value Fund | 25
Table of Contents
Notes to financial statements
In the event of counterparty default or the failure of a borrower to return a loaned security, the Fund has the right to use the collateral to offset any losses incurred. As of September 30, 2020, the Fund did not have any securities on loan.
7. BANK BORROWINGS
The Trust (excluding the money market funds), Wells Fargo Master Trust and Wells Fargo Variable Trust are parties to a $350,000,000 revolving credit agreement whereby the Fund is permitted to use bank borrowings for temporary or emergency purposes, such as to fund shareholder redemption requests. Interest under the credit agreement is charged to the Fund based on a borrowing rate equal to the higher of the Federal Funds rate in effect on that day plus 1.25% or the overnight LIBOR rate in effect on that day plus 1.25%. In addition, an annual commitment fee equal to 0.25% of the unused balance is allocated to each participating fund.
For the year ended September 30, 2020, there were no borrowings by the Fund under the agreement.
8. DISTRIBUTIONS TO SHAREHOLDERS
The tax character of distributions paid during the years ended September 30, 2020 and September 30, 2019 were as follows:
| Year ended September 30 | ||||||||
| 2020 | 2019 | |||||||
Ordinary income | $ | 5,458,221 | $ | 1,306,912 | ||||
Long-term capital gain | 8,185,536 | 0 | ||||||
As of September 30, 2020, the components of distributable earnings on a tax basis were as follows:
Undistributed ordinary income | Unrealized gains | Capital loss carryforward | ||
$1,443,215 | $16,146,839 | $(5,283,545) | ||
9. CONCENTRATION RISK
Concentration risks result from exposure to a limited number of sectors. As of the end of the period, the Fund invests a concentration of its portfolio in the industrials sector. A fund that invests a substantial portion of its assets in any sector may be more affected by changes in that sector than would be a fund whose investments are not heavily weighted in any sector.
10. INDEMNIFICATION
Under the Fund’s organizational documents, the officers and Trustees have been granted certain indemnification rights against certain liabilities that may arise out of performance of their duties to the Fund. The Fund has entered into a separate agreement with each Trustee that converts indemnification rights currently existing under the Fund’s organizational documents into contractual rights that cannot be changed in the future without the consent of the Trustee. Additionally, in the normal course of business, the Fund may enter into contracts with service providers that contain a variety of indemnification clauses. The Fund’s maximum exposure under these arrangements is dependent on future claims that may be made against the Fund and, therefore, cannot be estimated.
11. NEW ACCOUNTING PRONOUNCEMENT
In August 2018, FASB issued Accounting Standards Update (“ASU”) No. 2018-13, Fair Value Measurement (Topic 820) Disclosure Framework—Changes to the Disclosure Requirements for Fair Value Measurement. ASU 2018-13 updates the disclosure requirements on fair value measurements in Topic 820, Fair Value Measurements. The amendments are effective for fiscal years, and interim periods within those fiscal years, beginning after December 15, 2019. Management has adopted this guidance which did not have a material impact on the financial statements.
12. CORONAVIRUS (COVID-19) PANDEMIC
On March 11, 2020, the World Health Organization announced that it had made the assessment that coronavirus disease 2019 (“COVID-19”) is a pandemic. The impacts of COVID-19 are adversely affecting the entire global economy, individual companies and investment products, and the market in general. There is significant uncertainty around the extent and duration of business disruptions related to COVID-19 and the impacts may be short term or may last for an extended period of time. The risk of further spreading of COVID-19 has led to significant uncertainty and volatility in the financial markets.
26 | Wells Fargo C&B Mid Cap Value Fund
Table of Contents
Report of independent registered public accounting firm
To the Shareholders of the Fund and Board of Trustees
Wells Fargo Funds Trust:
Opinion on the Financial Statements
We have audited the accompanying statement of assets and liabilities of Wells Fargo C&B Mid Cap Value Fund (the Fund), one of the funds constituting Wells Fargo Funds Trust, including the portfolio of investments, as of September 30, 2020, the related statement of operations for the year then ended, the statements of changes in net assets for each of the years in the two-year period then ended, and the related notes (collectively, the financial statements) and the financial highlights for each of the years or periods in the five-year period then ended. In our opinion, the financial statements and financial highlights present fairly, in all material respects, the financial position of the Fund as of September 30, 2020, the results of its operations for the year then ended, the changes in its net assets for each of the years in the two-year period then ended, and the financial highlights for each of the years or periods in the five-year period then ended, in conformity with U.S. generally accepted accounting principles.
Basis for Opinion
These financial statements and financial highlights are the responsibility of the Fund’s management. Our responsibility is to express an opinion on these financial statements and financial highlights based on our audits. We are a public accounting firm registered with the Public Company Accounting Oversight Board (United States) (PCAOB) and are required to be independent with respect to the Fund in accordance with the U.S. federal securities laws and the applicable rules and regulations of the Securities and Exchange Commission and the PCAOB.
We conducted our audits in accordance with the standards of the PCAOB. Those standards require that we plan and perform the audit to obtain reasonable assurance about whether the financial statements and financial highlights are free of material misstatement, whether due to error or fraud. Our audits included performing procedures to assess the risks of material misstatement of the financial statements and financial highlights, whether due to error or fraud, and performing procedures that respond to those risks. Such procedures included examining, on a test basis, evidence regarding the amounts and disclosures in the financial statements and financial highlights. Such procedures also included confirmation of securities owned as of September 30, 2020, by correspondence with the custodian, transfer agent and brokers, or by other appropriate auditing procedures. Our audits also included evaluating the accounting principles used and significant estimates made by management, as well as evaluating the overall presentation of the financial statements and financial highlights. We believe that our audits provide a reasonable basis for our opinion.

We have not been able to determine the specific year that we began serving as the auditor of one or more Wells Fargo Funds investment companies; however we are aware that we have served as the auditor of one or more Wells Fargo Funds investment companies since at least 1955.
Boston, Massachusetts
November 24, 2020
Wells Fargo C&B Mid Cap Value Fund | 27
Table of Contents
TAX INFORMATION
For corporate shareholders, pursuant to Section 854 of the Internal Revenue Code, 82.69% of ordinary income dividends qualify for the corporate dividends-received deduction for the fiscal year ended September 30, 2020.
Pursuant to Section 852 of the Internal Revenue Code, $8,185,536 was designated as a 20% rate gain distribution for the fiscal year ended September 30, 2020.
Pursuant to Section 854 of the Internal Revenue Code, $5,434,615 of income dividends paid during the fiscal year ended September 30, 2020 has been designated as qualified dividend income (QDI).
For the fiscal year ended September 30, 2020, $136,204 has been designated as interest-related dividends for nonresident alien shareholders pursuant to Section 871 of the Internal Revenue Code.
For the fiscal year ended September 30, 2020, $2,841,539 has been designated as short-term capital gain dividends for nonresident alien shareholders pursuant to Section 871 of the Internal Revenue Code.
PROXY VOTING INFORMATION
A description of the policies and procedures used to determine how to vote proxies relating to portfolio securities is available, upon request, by calling 1-800-222-8222, visiting our website at wfam.com, or visiting the SEC website at sec.gov. Information regarding how the proxies related to portfolio securities were voted during the most recent 12-month period ended June 30 is available on the website at wfam.com or by visiting the SEC website at sec.gov.
QUARTERLY PORTFOLIO HOLDINGS INFORMATION
The Fund files its complete schedule of portfolio holdings with the SEC for the first and third quarters of each fiscal year as an exhibit to its reports on Form N-PORT. Shareholders may view the filed Form N-PORT by visiting the SEC website at sec.gov.
28 | Wells Fargo C&B Mid Cap Value Fund
Table of Contents
Other information (unaudited)
BOARD OF TRUSTEES AND OFFICERS
Each of the Trustees and Officers1 listed in the table below acts in identical capacities for each fund in the Wells Fargo family of funds, which consists of 142 mutual funds comprising the Wells Fargo Funds Trust, Wells Fargo Variable Trust, Wells Fargo Master Trust and four closed-end funds (collectively the “Fund Complex”). This table should be read in conjunction with the Prospectus and the Statement of Additional Information2. The mailing address of each Trustee and Officer is 525 Market Street, 12th Floor, San Francisco, CA 94105. Each Trustee and Officer serves an indefinite term, however, each Trustee serves such term until reaching the mandatory retirement age established by the Trustees.
Independent Trustees
Name and year of birth | Position held and length of service* | Principal occupations during past five years or longer | Current other public company or investment company directorships | |||
William R. Ebsworth (Born 1957) | Trustee, since 2015 | Retired. From 1984 to 2013, equities analyst, portfolio manager, research director and chief investment officer at Fidelity Management and Research Company in Boston, Tokyo, and Hong Kong, and retired in 2013 as Chief Investment Officer of Fidelity Strategic Advisers, Inc. where he led a team of investment professionals managing client assets. Prior thereto, Board member of Hong Kong Securities Clearing Co., Hong Kong Options Clearing Corp., the Thailand International Fund, Ltd., Fidelity Investments Life Insurance Company, and Empire Fidelity Investments Life Insurance Company. Audit Committee Chair and Investment Committee Chair of the Vincent Memorial Hospital Endowment (non-profit organization). Mr. Ebsworth is a CFA® charterholder. | N/A | |||
Jane A. Freeman (Born 1953) | Trustee, since 2015; Chair Liaison, since 2018 | Retired. From 2012 to 2014 and 1999 to 2008, Chief Financial Officer of Scientific Learning Corporation. From 2008 to 2012, Ms. Freeman provided consulting services related to strategic business projects. Prior to 1999, Portfolio Manager at Rockefeller & Co. and Scudder, Stevens & Clark. Board member of the Harding Loevner Funds from 1996 to 2014, serving as both Lead Independent Director and chair of the Audit Committee. Board member of the Russell Exchange Traded Funds Trust from 2011 to 2012 and the chair of the Audit Committee. Ms. Freeman is also an inactive Chartered Financial Analyst. | N/A | |||
Isaiah Harris, Jr. (Born 1952) | Trustee, since 2009; Audit Committee Chairman, since 2019 | Retired. Chairman of the Board of CIGNA Corporation since 2009, and Director since 2005. From 2003 to 2011, Director of Deluxe Corporation. Prior thereto, President and CEO of BellSouth Advertising and Publishing Corp. from 2005 to 2007, President and CEO of BellSouth Enterprises from 2004 to 2005 and President of BellSouth Consumer Services from 2000 to 2003. Emeritus member of the Iowa State University Foundation Board of Governors. Emeritus Member of the Advisory Board of Iowa State University School of Business. Advisory Board Member, Palm Harbor Academy (private school). Mr. Harris is a certified public accountant (inactive status). | CIGNA Corporation | |||
Judith M. Johnson (Born 1949) | Trustee, since 2008 | Retired. Prior thereto, Chief Executive Officer and Chief Investment Officer of Minneapolis Employees Retirement Fund from 1996 to 2008. Ms. Johnson is an attorney, certified public accountant and a certified managerial accountant. | N/A | |||
David F. Larcker (Born 1950) | Trustee, since 2009 | James Irvin Miller Professor of Accounting at the Graduate School of Business (Emeritus), Stanford University, Director of the Corporate Governance Research Initiative and Senior Faculty of The Rock Center for Corporate Governance since 2006. From 2005 to 2008, Professor of Accounting at the Graduate School of Business, Stanford University. Prior thereto, Ernst & Young Professor of Accounting at The Wharton School, University of Pennsylvania from 1985 to 2005. | N/A | |||
Wells Fargo C&B Mid Cap Value Fund | 29
Table of Contents
Other information (unaudited)
Name and year of birth | Position held and length of service* | Principal occupations during past five years or longer | Current other public company or investment company directorships | |||
Olivia S. Mitchell (Born 1953) | Trustee, since 2006; Nominating and Governance Committee Chair, since 2018 | International Foundation of Employee Benefit Plans Professor, Wharton School of the University of Pennsylvania since 1993. Director of Wharton’s Pension Research Council and Boettner Center on Pensions & Retirement Research, and Research Associate at the National Bureau of Economic Research. Previously, Cornell University Professor from 1978 to 1993. | N/A | |||
Timothy J. Penny (Born 1951) | Trustee, since 1996; Chairman, since 2018 | President and Chief Executive Officer of Southern Minnesota Initiative Foundation, a non-profit organization, since 2007. Member of the Board of Trustees of NorthStar Education Finance, Inc., a non-profit organization, since 2007. | N/A | |||
James G. Polisson (Born 1959) | Trustee, since 2018 | Retired. Chief Marketing Officer, Source (ETF) UK Services, Ltd, from 2015 to 2017. From 2012 to 2015, Principal of The Polisson Group, LLC, a management consulting, corporate advisory and principal investing company. Chief Executive Officer and Managing Director at Russell Investments, Global Exchange Traded Funds from 2010 to 2012. Managing Director of Barclays Global Investors from 1998 to 2010 and Global Chief Marketing Officer for iShares and Barclays Global Investors from 2000 to 2010. Trustee of the San Francisco Mechanics’ Institute, a non-profit organization, from 2013 to 2015. Board member of the Russell Exchange Traded Fund Trust from 2011 to 2012. Director of Barclays Global Investors Holdings Deutschland GmbH from 2006 to 2009. Mr. Polisson is an attorney and has a retired status with the Massachusetts and District of Columbia Bar Associations. | N/A | |||
Pamela Wheelock (Born 1959) | Trustee, since January 2020; previously Trustee from January 2018 to July 2019 | Board member of the Destination Medical Center Economic Development Agency, Rochester, Minnesota since 2019. Interim President of the McKnight Foundation from January to September 2020. Acting Commissioner, Minnesota Department of Human Services, July 2019 through September 2019. Human Services Manager (part-time), Minnesota Department of Human Services, October 2019 through December 2019. Chief Operating Officer, Twin Cities Habitat for Humanity from 2017 to 2019. Vice President of University Services, University of Minnesota from 2012 to 2016. Prior thereto, on the Board of Directors, Governance Committee and Finance Committee for the Minnesota Philanthropy Partners (Saint Paul Foundation) from 2012 to 2018, Interim Chief Executive Officer of Blue Cross Blue Shield of Minnesota from 2011 to 2012, Chairman of the Board from 2009 to 2012 and Board Director from 2003 to 2015. Vice President, Leadership and Community Engagement, Bush Foundation, Saint Paul, Minnesota (a private foundation) from 2009 to 2011. Executive Vice President and Chief Financial Officer, Minnesota Sports and Entertainment from 2004 to 2009 and Senior Vice President from 2002 to 2004. Executive Vice President of the Minnesota Wild Foundation from 2004 to 2008. Commissioner of Finance, State of Minnesota, from 1999 to 2002. Currently Board Chair of the Minnesota Wild Foundation since 2010. | N/A | |||
| * | Length of service dates reflect the Trustee’s commencement of service with the Trust’s predecessor entities, where applicable. |
30 | Wells Fargo C&B Mid Cap Value Fund
Table of Contents
Other information (unaudited)
Officers
Name and year of birth | Position held and length of service | Principal occupations during past five years or longer | ||
Andrew Owen (Born 1960) | President, since 2017 | Executive Vice President of Wells Fargo & Company and Head of Affiliated Managers, Wells Fargo Asset Management, since 2014. In addition, Mr. Owen is currently President, Chief Executive Officer and Director of Wells Fargo Funds Management, LLC since 2017. Prior thereto, Executive Vice President responsible for marketing, investments and product development for Wells Fargo Funds Management, LLC, from 2009 to 2014. | ||
Nancy Wiser1 (Born 1967) | Treasurer, since 2012 | Executive Vice President of Wells Fargo Funds Management, LLC since 2011. Chief Operating Officer and Chief Compliance Officer at LightBox Capital Management LLC, from 2008 to 2011. | ||
Michelle Rhee (Born 1966) | Chief Legal Officer, since 2019 | Secretary of Wells Fargo Funds Management, LLC, Chief Legal Counsel of Wells Fargo Asset Management and Assistant General Counsel of Wells Fargo Bank, N.A. since 2018. Associate General Counsel and Managing Director of Bank of America Corporation from 2004 to 2018. | ||
Catherine Kennedy (Born 1969) | Secretary, since 2019 | Vice President of Wells Fargo Funds Management, LLC and Senior Counsel of the Wells Fargo Legal Department since 2010. Vice President and Senior Counsel of Evergreen Investment Management Company, LLC from 1998 to 2010. | ||
Michael H. Whitaker (Born 1967) | Chief Compliance Officer, since 2016 | Chief Compliance Officer of Wells Fargo Asset Management since 2016. Senior Vice President and Chief Compliance Officer for Fidelity Investments from 2007 to 2016. | ||
Jeremy DePalma1 (Born 1974) | Assistant Treasurer, since 2009 | Senior Vice President of Wells Fargo Funds Management, LLC since 2009. Senior Vice President of Evergreen Investment Management Company, LLC from 2008 to 2010 and head of the Fund Reporting and Control Team within Fund Administration from 2005 to 2010. | ||
| 1 | Nancy Wiser acts as Treasurer of 65 funds in the Fund Complex. Jeremy DePalma acts as the Treasurer of 77 funds and Assistant Treasurer of 65 funds in the Fund Complex. |
| 2 | The Statement of Additional Information includes additional information about the Trustees and is available, without charge, upon request, by calling 1-800-222-8222 or by visiting the website at wfam.com. |
Wells Fargo C&B Mid Cap Value Fund | 31
Table of Contents
Other information (unaudited)
BOARD CONSIDERATION OF INVESTMENT MANAGEMENT AND SUB-ADVISORY AGREEMENTS:
Wells Fargo C&B Mid Cap Value Fund
Under the Investment Company Act of 1940 (the “1940 Act”), the Board of Trustees (the “Board”) of Wells Fargo Funds Trust (the “Trust”) must determine annually whether to approve the continuation of the Trust’s investment management and sub-advisory agreements. In this regard, at a Board meeting held on May 26, 2020 and May 28, 2020 (together, the “Meeting”), the Board, all the members of which have no direct or indirect interest in the investment management and sub-advisory agreements and are not “interested persons” of the Trust, as defined in the 1940 Act (the “Independent Trustees”), reviewed and approved for Wells Fargo C&B Mid Cap Value Fund (the “Fund”): (i) an investment management agreement (the “Management Agreement”) with Wells Fargo Funds Management, LLC (“Funds Management”); and (ii) an investment sub-advisory agreement (the “Sub-Advisory Agreement”) with Cooke & Bieler, L.P. (the “Sub-Adviser”). The Management Agreement and the Sub-Advisory Agreement are collectively referred to as the “Advisory Agreements.”
At the Meeting, the Board considered the factors and reached the conclusions described below relating to the selection of Funds Management and the Sub-Adviser and the approval of the Advisory Agreements. Prior to the Meeting, including at a Board meeting held in April 2020, the Trustees conferred extensively among themselves and with representatives of Funds Management about these matters. Also, the Board has adopted a team-based approach, with each team consisting of a sub-set of Trustees, to assist the full Board in the discharge of its duties in reviewing investment performance and other matters throughout the year. The Independent Trustees were assisted in their evaluation of the Advisory Agreements by independent legal counsel, from whom they received separate legal advice and with whom they met separately.
In providing information to the Board, Funds Management and the Sub-Adviser were guided by a detailed set of requests for information submitted to them by independent legal counsel on behalf of the Independent Trustees at the start of the Board’s annual contract renewal process earlier in 2020. In considering and approving the Advisory Agreements, the Trustees considered the information they believed relevant, including but not limited to the information discussed below. The Board considered not only the specific information presented in connection with the Meeting, but also the knowledge gained over time through interaction with Funds Management and the Sub-Adviser about various topics. In this regard, the Board reviewed reports of Funds Management at each of its quarterly meetings, which included, among other things, portfolio reviews and investment performance reports. In addition, the Board and the teams mentioned above confer with portfolio managers at various times throughout the year. The Board did not identify any particular information or consideration that was all-important or controlling, and each individual Trustee may have attributed different weights to various factors.
After its deliberations, the Board unanimously approved the continuation of the Advisory Agreements for a one-year term and determined that the compensation payable to Funds Management and the Sub-Adviser under each of the Advisory Agreements was reasonable. The Board considered the approval of the Advisory Agreements for the Fund as part of its consideration of agreements for funds across the complex, but its approvals were made on a fund-by-fund basis. The following summarizes a number of important, but not necessarily all, factors considered by the Board in support of its approvals.
Nature, extent and quality of services
The Board received and considered various information regarding the nature, extent and quality of services provided to the Fund by Funds Management and the Sub-Adviser under the Advisory Agreements. This information included a description of the investment advisory services and Fund-level administrative services covered by the Management Agreement, as well as, among other things, a summary of the background and experience of senior management of Wells Fargo Asset Management (“WFAM”), of which Funds Management is a part, and a summary of investments made in the business of WFAM. The Board also received a description of Funds Management’s and the Sub-Adviser’s business continuity plans and of their approaches to data privacy and cybersecurity, and related testing. The Board also received and reviewed information about Funds Management’s role as administrator of the Fund’s liquidity risk management program, Funds Management’s approach to risk management, and Funds Management’s intermediary and vendor oversight program.
The Board also considered the qualifications, background, tenure and responsibilities of each of the portfolio managers primarily responsible for the day-to-day portfolio management of the Fund. The Board evaluated the ability of Funds Management and the Sub-Adviser to attract and retain qualified investment professionals, including research, advisory and supervisory personnel. The Board further considered the compliance programs and compliance records of Funds Management and the Sub-Adviser. In addition, the Board took into account the full range of services provided to the Fund by Funds Management and its affiliates.
32 | Wells Fargo C&B Mid Cap Value Fund
Table of Contents
Other information (unaudited)
Fund investment performance and expenses
The Board considered the investment performance results for the Fund over various time periods ended December 31, 2019. The Board also considered more current results for various time periods ended March 31, 2020. The Board considered these results in comparison to the investment performance of funds in a universe that was determined by Broadridge Inc. (“Broadridge”) to be similar to the Fund (the “Universe”), and in comparison to the Fund’s benchmark index and to other comparative data. Broadridge is an independent provider of investment company data. The Board received a description of the methodology used by Broadridge to select the mutual funds in the performance Universe. The Board noted that the investment performance of the Fund (Administrator Class) was higher than the average investment performance of the Universe for the one, three-, five- and ten-year periods ended December 31, 2019. The Board also noted that the investment performance of the Fund (Administrator Class) was higher than the average investment performance of the Universe for the five- and ten-year periods ended March 31, 2020, but lower than the average investment performance of the Universe for the one- and three-year periods ended March 31, 2020. The Board also noted that the investment performance of the Fund was higher than its benchmark index, the Russell Midcap® Value Index, for all periods ended December 31, 2019. The Board also noted that the investment performance of the Fund was higher than its benchmark index, the Russell Midcap® Value Index, for all periods ended March 31, 2020.
The Board also received and considered information regarding the Fund’s net operating expense ratios and their various components, including actual management fees, custodian and other non-management fees, and Rule 12b-1 and non-Rule 12b-1 shareholder service fees. The Board considered these ratios in comparison to the median ratios of funds in class-specific expense groups that were determined by Broadridge to be similar to the Fund (the “Groups”). The Board received a description of the methodology used by Broadridge to select the mutual funds in the expense Groups and an explanation of how funds comprising expense groups and their expense ratios may vary from year-to-year. Based on the Broadridge reports, the Board noted that the net operating expense ratios of the Fund were lower than, equal to, or in range of the median net operating expense ratios of the expense Groups for each share class.
The Board took into account the Fund’s investment performance and expense information provided to it among the factors considered in deciding to re-approve the Advisory Agreements.
Investment management and sub-advisory fee rates
The Board reviewed and considered the contractual fee rates payable by the Fund to Funds Management under the Management Agreement, as well as the contractual fee rates payable by the Fund to Funds Management for class-level administrative services under a Class-Level Administration Agreement, which include, among other things, class-level transfer agency and sub-transfer agency costs (collectively, the “Management Rates”). The Board also reviewed and considered the contractual investment sub-advisory fee rates that are payable by Funds Management to the Sub-Adviser for investment sub-advisory services.
Among other information reviewed by the Board was a comparison of the Fund’s Management Rates with the average contractual investment management fee rates of funds in the expense Groups at a common asset level as well as transfer agency costs of the funds in the expense Groups. The Board noted that the Management Rates of the Fund were in range of the sum of these average rates for the Fund’s expense Groups for all share classes.
The Board also received and considered information about the portion of the total management fee that was retained by Funds Management after payment of the fee to the Sub-Adviser for sub-advisory services. The Board considered this amount in comparison to the median amount retained by advisers to funds in a sub-advised expense universe that was determined by Broadridge to be similar to the Fund. The Board noted the small size of the sub-advised expense universe. In assessing the reasonableness of this amount, the Board received and evaluated information about the nature and extent of responsibilities retained and risks assumed by Funds Management and not delegated to or assumed by the Sub-Adviser, and about Funds Management’s on-going oversight services. The Board also considered that the sub-advisory fees paid to the Sub-Adviser had been negotiated by Funds Management on an arm’s length basis.
The Board also received and considered information about the nature and extent of services offered and fee rates charged by Funds Management and the Sub-Adviser to other types of clients with investment strategies similar to those of the Fund. In this regard, the Board received information about the significantly greater scope of services, and compliance, reporting and other legal burdens and risks of managing proprietary mutual funds compared with those associated with managing assets of other types of clients, including third-party sub-advised fund clients and non-mutual fund clients such as institutional separate accounts.
Based on its consideration of the factors and information it deemed relevant, including those described here, the Board determined that the compensation payable to Funds Management under the Management Agreement and to the Sub-Adviser under the Sub-Advisory Agreement was reasonable.
Wells Fargo C&B Mid Cap Value Fund | 33
Table of Contents
Other information (unaudited)
Profitability
The Board received and considered information concerning the profitability of Funds Management, as well as the profitability of both WFAM and Wells Fargo & Co. (“Wells Fargo”) from providing services to the fund family as a whole. Funds Management reported on the methodologies and estimates used in calculating profitability, including a description of the methodology used to allocate certain expenses. Among other things, the Board noted that the levels of profitability reported on a fund-by-fund basis varied widely, depending on factors such as the size, type and age of fund. The Board did not consider profitability with respect to the Sub-Adviser, as the sub-advisory fees paid to the Sub-Adviser had been negotiated by Funds Management on an arm’s-length basis.
Based on its review, the Board did not deem the profits reported by Funds Management, WFAM or Wells Fargo from services provided to the Fund to be at a level that would prevent it from approving the continuation of the Advisory Agreements.
Economies of scale
The Board received and considered information about the potential for Funds Management to experience economies of scale in the provision of management services to the Fund, the difficulties of calculating economies of scale at an individual fund level, and the extent to which potential scale benefits are shared with shareholders. The Board noted the existence of breakpoints in the Fund’s management fee structure, which operate generally to reduce the Fund’s expense ratios as the Fund grows in size, and the size of the Fund in relation to such breakpoints. The Board considered that in addition to management fee breakpoints, Funds Management shares potential economies of scale from its management business in a variety of ways, including through fee waiver and expense reimbursement arrangements, services that benefit shareholders, competitive management fee rates set at the outset without regard to breakpoints, and investments in the business intended to enhance services available to shareholders.
The Board concluded that Funds Management’s arrangements with respect to the Fund, including contractual breakpoints, constituted a reasonable approach to sharing potential economies of scale with the Fund and its shareholders.
Other benefits to Funds Management and the Sub-Adviser
The Board received and considered information regarding potential “fall-out” or ancillary benefits received by Funds Management, the Sub-Adviser, and their affiliates as a result of their relationships with the Fund. Ancillary benefits could include, among others, benefits directly attributable to other relationships with the Fund and benefits potentially derived from an increase in Funds Management’s and the Sub-Adviser’s business as a result of their relationships with the Fund. The Board noted that various affiliates of Funds Management may receive distribution-related fees, shareholder servicing payments and sub-transfer agency fees in respect of shares sold or held through them and services provided.
The Board also reviewed information about soft dollar credits earned and utilized by the Sub-Adviser, fees earned by Funds Management and its affiliate from managing a private investment vehicle for the fund family’s securities lending collateral, and commissions earned by an affiliated broker from portfolio transactions.
Based on its consideration of the factors and information it deemed relevant, including those described here, the Board did not find that any ancillary benefits received by Funds Management, the Sub-Adviser, and their affiliates were unreasonable.
Conclusion
At the Meeting, after considering the above-described factors and based on its deliberations and its evaluation of the information described above, the Board unanimously approved the continuation of the Advisory Agreements for a one-year term and determined that the compensation payable to Funds Management and the Sub-Adviser under each of the Advisory Agreements was reasonable.
34 | Wells Fargo C&B Mid Cap Value Fund
Table of Contents
Other information (unaudited)
LIQUIDITY RISK MANAGEMENT PROGRAM
In accordance with Rule 22e-4 under the Investment Company Act of 1940, as amended (the “Liquidity Rule”), Wells Fargo Funds Trust (the “Trust”) has adopted and implemented a liquidity risk management program (the “Program”) on behalf of each of its series, including the Fund, which is reasonably designed to assess and manage the Fund’s liquidity risk. “Liquidity risk” is defined as the risk that the Fund is unable to meet redemption requests without significantly diluting remaining investors’ interests in the Fund. The Trust’s Board of Trustees (the “Board”) previously approved the designation of Wells Fargo Funds Management, LLC (“Funds Management”), the Fund’s investment manager, as the administrator of the Program, and Funds Management has established a Liquidity Risk Management Council composed of personnel from multiple departments within Funds Management and its affiliates to assist Funds Management in the implementation and on-going administration of the Program.
The Program is comprised of various components designed to support the assessment and/or management of liquidity risk, including: (1) the periodic assessment (no less frequently than annually) of certain factors that influence the Fund’s liquidity risk; (2) the periodic classification (no less frequently than monthly) of the Fund’s investments into one of four liquidity categories that reflect an estimate of their liquidity under current market conditions; (3) a 15% limit on the acquisition of “illiquid investments” (as defined under the Liquidity Rule); (4) to the extent the Fund does not invest primarily in “highly liquid investments” (as defined under the Liquidity Rule), the determination of a minimum percentage of the Fund’s assets that generally will be invested in highly liquid investments (an “HLIM”); (5) if the Fund has established an HLIM, the periodic review (no less frequently than annually) of the HLIM and the adoption of policies and procedures for responding to a shortfall of the Fund’s “highly liquid investments” below its HLIM; and (6) periodic reporting to the Board.
At a meeting of the Board held on May 26 and 28, 2020, the Board received a written report (the “Report”) from Funds Management that addressed the operation of the Program and assessed its adequacy and effectiveness of implementation. The Report covered the initial period from December 1, 2018 through December 31, 2019 (the “Reporting Period”). No significant liquidity events impacting the Fund were noted in the Report. There were no material changes to the Program during the Reporting Period. The Report concluded that the Program is operating effectively to assess and manage the Fund’s liquidity risk, and that the Program has been and continues to be adequately and effectively implemented to monitor and, as applicable, respond to the Fund’s liquidity developments.
There can be no assurance that the Program will achieve its objectives under all circumstances in the future. Please refer to the Fund’s prospectus for more information regarding the Fund’s exposure to liquidity risk and other risks to which an investment in the Fund may be subject.
Wells Fargo C&B Mid Cap Value Fund | 35
Table of Contents
Effective June 1, 2020, shareholders purchasing Fund shares through an Oppenheimer & Co. Inc. (“Oppenheimer”) platform or account are eligible only for the following load waivers (front-end sales charge waivers and contingent deferred or back-end, sales charge waivers) and discounts, which may differ from those disclosed in the Fund’s Prospectus or SAI.
| Front-end Sales Load Waivers on Class A Shares available at Oppenheimer |
| Employer-sponsored retirement, deferred compensation and employee benefit plans (including health savings accounts) and trusts used to fund those plans, provided that the shares are not held in a commission-based brokerage account and shares are held for the benefit of the plan. |
| Shares purchased by or through a 529 Plan. |
| Shares purchased through an Oppenheimer affiliated investment advisory program. |
| Shares purchased through reinvestment of capital gains distributions and dividend reinvestment when purchasing shares of the same fund (but not any other fund within the fund family). |
| Shares purchased from the proceeds of redemptions within the same fund family, provided (1) the repurchase occurs within 90 days following the redemption, (2) the redemption and purchase occur in the same account, and (3) redeemed shares were subject to a front-end or deferred sales load (known as Rights of Restatement). |
| A shareholder in the Fund’s Class C shares will have their shares exchanged at net asset value to Class A shares (or the appropriate share class) of the Fund if the shares are no longer subject to a CDSC and the exchange is in line with the policies and procedures of Oppenheimer. |
| Employees and registered representatives of Oppenheimer or its affiliates and their family members. |
| Directors or Trustees of the Fund, and employees of the Fund’s investment adviser or any of its affiliates, as described in the Prospectus. |
| CDSC Waivers on A and C Shares available at Oppenheimer |
| Death or disability of the shareholder. |
| Shares sold as part of a systematic withdrawal plan as described in the Prospectus. |
| Return of excess contributions from an IRA Account. |
| Shares sold as part of a required minimum distribution for IRA and retirement accounts due to the shareholder reaching the qualified age based on applicable IRS regulations as described in the Prospectus. |
| Shares sold to pay Oppenheimer fees but only if the transaction is initiated by Oppenheimer. |
| Shares acquired through a right of reinstatement. |
| Front-end load Discounts Available at Oppenheimer: Breakpoints, Rights of Accumulation & Letters of Intent |
| Breakpoints as described in the Prospectus. |
| Rights of Accumulation (ROA), which entitle shareholders to breakpoint discounts, will be automatically calculated based on the aggregated holding of fund family assets held by accounts within the purchaser’s household at Oppenheimer. Eligible fund family assets not held at Oppenheimer may be included in the ROA calculation only if the shareholder notifies his or her financial advisor about such assets. |
36 | Wells Fargo C&B Mid Cap Value Fund
Table of Contents
Effective June 15, 2020, shareholders purchasing fund shares through a Robert W. Baird & Co. (“Baird”) platform or account will only be eligible for the following sales charge waivers (front-end sales charge waivers and CDSC waivers) and discounts, which may differ from those disclosed elsewhere in the Fund’s Prospectus or the SAI.
| Front-end Sales Load Waivers on Class A Shares available at Baird |
| Shares purchased through reinvestment of capital gains distributions and dividend reinvestment when purchasing share of the same fund. |
| Share purchase by employees and registers representatives of Baird or its affiliate and their family members as designated by Baird. |
| Shares purchase from the proceeds of redemptions within the same fund family, provided (1) the repurchase occurs within 90 days following the redemption, (2) the redemption and purchase occur in the same accounts, and (3) redeemed shares were subject to a front-end or deferred sales charge (known as rights of reinstatement). |
| A shareholder in the Funds Investor C Shares will have their share exchanged at net asset value to Investor A shares of the fund if the shares are no longer subject to CDSC and the exchange is in line with the policies and procedures of Baird. |
| Employer-sponsored retirement plans or charitable accounts in a transactional brokerage account at Baird, including 401(k) plans, 457 plans, employer-sponsored 403(b) plans, profit sharing and money purchase pension plans and defined benefit plans. For purposes of this provision, employer-sponsored retirement plans do not include SEP IRAs, Simple IRAs or SAR-SEPs. |
| CDSC Waivers on A and C Shares available at Baird |
| Shares sold due to death or disability of the shareholder. |
| Shares sold as part of a systematic withdrawal plan as described in the Fund’s Prospectus. |
| Shares bought due to returns of excess contributions from an IRA Account. |
| Shares sold as part of a required minimum distribution for IRA and retirement accounts due to the shareholder reaching age 72 as described in the Fund’s Prospectus. |
| Shares sold to pay Baird fees but only if the transaction is initiated by Baird. |
| Shares acquired through a right of reinstatement. |
| Front-end load Discounts Available at Baird: Breakpoint and/or Rights of Accumulation |
| Breakpoints as described in the Prospectus. |
| Rights of accumulations which entitles shareholders to breakpoint discounts will be automatically calculated based on the aggregated holding of fund family assets held by accounts within the purchaser’s household at Baird. Eligible fund family assets not held at Baird may be included in the rights of accumulations calculation only if the shareholder notifies his or her financial advisor about such assets. |
| Letters of Intent (LOI) allow for breakpoint discounts based on anticipated purchases within a fund family through Baird, over a 13-month period of time. |
Wells Fargo C&B Mid Cap Value Fund | 37
Table of Contents
This page is intentionally left blank.
Table of Contents
This page is intentionally left blank.
Table of Contents
This page is intentionally left blank.
Table of Contents
For more information
More information about Wells Fargo Funds is available free upon request. To obtain literature, please write, visit the Fund’s website, or call:
Wells Fargo Funds
P.O. Box 219967
Kansas City, MO 64121-9967
Website: wfam.com
Individual investors: 1-800-222-8222
Retail investment professionals: 1-888-877-9275
Institutional investment professionals: 1-866-765-0778

This report and the financial statements contained herein are submitted for the general information of the shareholders of the Fund. If this report is used for promotional purposes, distribution of the report must be accompanied or preceded by a current prospectus. Before investing, please consider the investment objectives, risks, charges, and expenses of the investment. For a current prospectus and, if available, a summary prospectus, containing this information, call 1-800-222-8222 or visit the Fund’s website at wfam.com. Read the prospectus carefully before you invest or send money.
Wells Fargo Asset Management (WFAM) is the trade name for certain investment advisory/management firms owned by Wells Fargo & Company. These firms include but are not limited to Wells Capital Management Incorporated and Wells Fargo Funds Management, LLC. Certain products managed by WFAM entities are distributed by Wells Fargo Funds Distributor, LLC (a broker-dealer and Member FINRA).
This material is for general informational and educational purposes only and is NOT intended to provide investment advice or a recommendation of any kind—including a recommendation for any specific investment, strategy, or plan.
INVESTMENT PRODUCTS: NOT FDIC INSURED ◾ NO BANK GUARANTEE ◾ MAY LOSE VALUE
© 2020 Wells Fargo & Company. All rights reserved.
PAR-1020-00562 11-20
A228/AR228 09-20
Table of Contents

Annual Report
September 30, 2020
Wells Fargo Common Stock Fund
Beginning on January 1, 2021, as permitted by new regulations adopted by the Securities and Exchange Commission, paper copies of the Wells Fargo Funds’ annual and semi-annual shareholder reports issued after this date will no longer be sent by mail, unless you specifically request paper copies of the reports. Instead, the reports will be made available on the Funds’ website, and you will be notified by mail each time a report is posted and provided with a website address to access the report.
If you already elected to receive shareholder reports electronically, you will not be affected by this change and you need not take any action. You may elect to receive shareholder reports and other communications from the Fund electronically at any time by contacting your financial intermediary (such as a broker-dealer or bank) or, if you are a direct investor, by calling 1-800-222-8222 or by enrolling at wellsfargo.com/advantagedelivery.
You may elect to receive all future reports in paper free of charge. If you invest through a financial intermediary, you can contact your financial intermediary to request that you continue to receive paper copies of your shareholder reports; if you invest directly with the Fund, you can call 1-800-222-8222. Your election to receive reports in paper will apply to all Wells Fargo Funds held in your account with your financial intermediary or, if you are a direct investor, to all Wells Fargo Funds that you hold.
Table of Contents
|
Reduce clutter. Save trees. |
Sign up for electronic delivery of prospectuses and shareholder reports at wellsfargo.com/ |
The views expressed and any forward-looking statements are as of September 30, 2020, unless otherwise noted, and are those of the Fund’s portfolio managers and/or Wells Fargo Asset Management. Discussions of individual securities, or the markets generally, or any Wells Fargo Fund are not intended as individual recommendations. Future events or results may vary significantly from those expressed in any forward-looking statements. The views expressed are subject to change at any time in response to changing circumstances in the market. Wells Fargo Asset Management and the Fund disclaim any obligation to publicly update or revise any views expressed or forward-looking statements.
INVESTMENT PRODUCTS: NOT FDIC INSURED ◾ NO BANK GUARANTEE ◾ MAY LOSE VALUE
Wells Fargo Common Stock Fund | 1
Table of Contents
Letter to shareholders (unaudited)

Andrew Owen
President
Wells Fargo Funds
Dear Shareholder:
We are pleased to offer you this annual report for the Wells Fargo Common Stock Fund for the 12-month period that ended September 30, 2020. Global stock markets saw earlier gains erased in March as governments around the world took unprecedented measures, attempting to stop the spread of COVID-19 at the expense of short-term economic output. However, markets rallied strongly from April on to more than offset those short-term losses as central banks bolstered capital markets and confidence.
For the 12-month period, equities had broadly positive total returns despite intense volatility in March. Non-U.S. developed market equities had weaker performance than emerging market and U.S. stocks. While gains from fixed-income securities were positive, they were more modest than equities. For the period, U.S. stocks, based on the S&P 500 Index,1 gained 15.15%. International stocks, as measured by the MSCI ACWI ex USA Index (Net),2 returned 3.00%, while the MSCI EM Index (Net)3 had stronger performance, with a 10.54% gain. For bond investors, the Bloomberg Barclays U.S. Aggregate Bond Index4 returned 6.98%, the Bloomberg Barclays Global Aggregate ex-USD Index5 gained 5.48%, and the Bloomberg Barclays Municipal Bond Index6 returned 4.09% while the ICE BofA U.S. High Yield Index7 returned 2.30%.
The period began with mixed economic readings.
The fourth quarter of 2019 started on a strong note. U.S.-China trade tensions, which had been building for months, relaxed in October; optimism rose for a U.K. Brexit deal; and macroeconomic data turned positive. The initial estimate of U.S. third-quarter gross domestic product (GDP) growth was a resilient 1.9% annualized rate, while the U.S. unemployment rate fell to a 50-year low of 3.5% in September. However, despite strength among U.S. consumers, business confidence declined while manufacturing activity contracted. Concerned with a potential economic slowdown, the U.S. Federal Reserve (Fed) lowered interest rates a quarter point in late October—its third rate cut in four months. This helped push the S&P 500 Index to an all-time high while emerging market equities rallied and global bonds declined overall, reflecting a broad pickup in risk appetite.
Equity markets continued to rally in November despite ongoing geopolitical risks. Hopes for a U.S.-China trade deal buoyed investor confidence. U.S. business sentiment improved slightly and manufacturing and services activity picked up. While consumer confidence and purchasing managers’ activity rose in the eurozone, China reported weakening manufacturing and consumer data. Bond yields rose marginally, leading to slightly negative returns for global government and investment-grade corporate bonds.
| 1 | The S&P 500 Index consists of 500 stocks chosen for market size, liquidity, and industry group representation. It is a market-value-weighted index with each stock’s weight in the index proportionate to its market value. You cannot invest directly in an index. |
| 2 | The Morgan Stanley Capital International (MSCI) All Country World Index (ACWI) ex USA Index (Net) is a free-float-adjusted market-capitalization-weighted index that is designed to measure the equity market performance of developed and emerging markets, excluding the United States. Source: MSCI. MSCI makes no express or implied warranties or representations and shall have no liability whatsoever with respect to any MSCI data contained herein. The MSCI data may not be further redistributed or used as a basis for other indices or any securities or financial products. This report is not approved, reviewed, or produced by MSCI. You cannot invest directly in an index. |
| 3 | The MSCI Emerging Markets (EM) Index (Net) is a free-float-adjusted market-capitalization-weighted index that is designed to measure equity market performance of emerging markets. You cannot invest directly in an index. |
| 4 | The Bloomberg Barclays U.S. Aggregate Bond Index is a broad-based benchmark that measures the investment-grade, U.S. dollar-denominated, fixed-rate taxable bond market, including Treasuries, government-related and corporate securities, mortgage-backed securities (agency fixed-rate and hybrid adjustable-rate mortgage pass-throughs), asset-backed securities, and commercial mortgage-backed securities. You cannot invest directly in an index. |
| 5 | The Bloomberg Barclays Global Aggregate ex-USD Index is an unmanaged index that provides a broad-based measure of the global investment-grade fixed-income markets excluding the U.S. dollar-denominated debt market. You cannot invest directly in an index. |
| 6 | The Bloomberg Barclays Municipal Bond Index is an unmanaged index composed of long-term tax-exempt bonds with a minimum credit rating of Baa. You cannot invest directly in an index. |
| 7 | The ICE BofA U.S. High Yield Index is a market-capitalization-weighted index of domestic and Yankee high-yield bonds. The index tracks the performance of high-yield securities traded in the U.S. bond market. You cannot invest directly in an index. Copyright 2020. ICE Data Indices, LLC. All rights reserved. |
2 | Wells Fargo Common Stock Fund
Table of Contents
Letter to shareholders (unaudited)
Financial markets ended 2019 with a boost from the U.S. and China accord on a Phase One trade deal. That, along with the landslide win by the pro-Brexit U.K. Conservative Party in a national election and ongoing central bank support, gave investors greater confidence. U.S. economic indicators were generally positive, with the exception of manufacturing activity and business confidence. Consumer confidence was resilient, fed by a robust labor market, tame inflation, and lower interest rates, which boosted housing affordability and stimulated homebuyer activity. The impeachment of President Trump had little impact on the markets. Meanwhile, slowing Chinese economic activity, partly attributable to the trade war, led to further government stimulus at year-end through lower reserve ratios, allowing banks to lend more money.
The year-end rally continued in early January 2020. However, capital market volatility spiked in late January on concerns over the potential impact of COVID-19 on the global economy and stock markets. With sentiment somewhat souring, perceived safe havens did well in January. The U.S. dollar and Japanese yen both rose and government bonds outperformed equities. While the S&P 500 Index held its ground, emerging market equities tumbled, including those in Asia.
In February, COVID-19 became the major market focus. Fears of the virus’s impact on Chinese and global growth led to expectations of increased global central bank monetary policy support. That led the 10-year U.S. Treasury yield to fall to an all-time low of 1.1%. Although equity markets initially shrugged off concerns about the outbreak, focusing instead on strong fourth-quarter earnings and improving business confidence in January, market sentiment turned sharply lower and the S&P 500 Index lost 8.2% for the month. Oil prices tumbled as Russia and the Organization of the Petroleum Exporting Countries compounded a major decline in oil demand with a brutal price war, partly aimed at dissuading further U.S. shale production, causing the price of West Texas Intermediate crude oil to plummet.
The global spread of COVID-19 led country after country to clamp down on social and business-related activity in order to contain the virus from causing even greater devastation and overwhelming health care systems. This abrupt stoppage of economic activity led to the sharp deceleration of global output, sending economies into a deep contraction. Central banks responded swiftly, slashing interest rates and expanding quantitative easing programs to restore liquidity and confidence to the markets. In the U.S., the Fed introduced several new lending programs, funding investment-grade bonds, money market mutual funds, and commercial paper while purchasing Treasuries, mortgage-backed securities, and overnight repurchase agreements. Meanwhile, stock markets tumbled quickly into a bear market, ending the longest bull stock market in U.S. history.
Markets rebounded strongly in April, fueled by unprecedented government and central bank stimulus measures. The U.S. economy contracted by an annualized 5.0% pace in the first quarter, with 30 million new unemployment insurance claims in six weeks. In the eurozone, first-quarter real GDP shrank 3.8%, with the composite April Flash Purchasing Managers’ Index (PMI), a monthly survey of purchasing managers, falling to an all-time low of 13.5. The European Central Bank expanded its quantitative easing to include the purchase of additional government bonds of countries with the greatest virus-related need, including Italy and Spain. China’s first-quarter GDP fell by 6.8% year over year. However, retail sales, production, and investment showed signs of recovery. Extreme oil-price volatility continued as global supply far exceeded demand.
The global equity market rebound continued in May, with widespread strong monthly gains. Investors regained confidence on reports of early signs of success in human trials of a COVID-19 vaccine. Growth stocks continued to outperform value stocks while returns on global government bonds were generally flat. In the U.S., a gap grew between the stock market rebound and devastating economic data points, including an April unemployment rate of 14.7%, the highest level since World War II. PMIs reflected
“The global spread of COVID-19 led country after country to clamp down on social and business-related activity in order to contain the virus from causing even greater devastation and overwhelming health care systems.”
Wells Fargo Common Stock Fund | 3
Table of Contents
Letter to shareholders (unaudited)
“The stock market continued to rally in August despite concerns over rising numbers of COVID-19 cases in the United States and several European countries, including France and Spain, as well as the expiration of the $600 weekly bonus unemployment benefit at the end of July.”
weakening activity in May in both the manufacturing and services sectors. U.S. corporate earnings reports indicated a 14% year-over-year contraction in earnings from the first quarter of 2019. However, high demand for technology, driven by remote activity, supported robust information technology sector earnings, which helped drive major technology stocks higher.
Financial markets posted widely positive returns in June despite ongoing economic weakness and high levels of uncertainty on the containment of COVID-19 and the timing of an effective vaccine. There were hopeful signs as economies reopened, with both U.S. and U.K. retail sales rebounding sharply in May. However, year over year, sales remained depressed. Vitally important to market sentiment was the ongoing commitment by central banks globally to do all they could to provide economic support through liquidity and low borrowing costs. U.S. economic activity was aided by one-time $1,200 stimulus checks and $600 bonus weekly unemployment benefits that expired at the end of July. However, unemployment remained historically high, easing somewhat from 14.7% in April to 11.1% in June. By month-end, numerous states reported increases of COVID-19 cases. China’s economic recovery picked up momentum in June, though it remained far from a full recovery.
July was a broadly positive month for both global equities and fixed income. However, economic data and a resurgence of COVID-19 cases pointed to the vulnerability of the global economy and the ongoing imperative to regain control of the pandemic. Second-quarter GDP shrank from the previous quarter by 9.5% and 12.1% in the U.S. and the eurozone, respectively. In contrast, China reported a 3.2% year-over-year expansion in its second-quarter GDP. U.S. unemployment remained high despite adding 1.8 million jobs in July, with a double-digit jobless rate persisting. However, manufacturing activity grew in both the U.S. and the eurozone. In Asia, while China’s manufacturing sector continued to expand, activity in Japan and South Korea contracted. In July, a rising concern was the rapid and broad reemergence of COVID-19 infections.
The stock market continued to rally in August despite concerns over rising numbers of COVID-19 cases in the United States and several European countries, including France and Spain, as well as the expiration of the $600 weekly bonus unemployment benefit at the end of July. U.S. stocks had strong monthly gains, led by the FAANG stocks—Facebook, Apple, Amazon, Netflix, and Google (Alphabet)—which dominate these indices and continued to rally. U.S. stocks generally surpassed other broadly positive global equity performance while fixed-income market monthly returns were broadly flat. Generally stronger-than-expected second-quarter earnings boosted investor sentiment along with the Fed’s announcement of a policy shift that will likely lead to longer-term low interest rates and supportive monetary policy. The U.S. Flash PMIs for both manufacturing and services beat expectations while U.S. housing market indicators were strong. In Europe, retail sales expanded and consumer confidence remained steady. China’s economy continued its fairly steady expansion. Overall, developed markets performed better than emerging market equities for the month of August as people took comfort in better-known equities in perceived safer markets.
Stocks grew more volatile in September on mixed economic data. U.S. PMIs showed solid growth in economic activity in both manufacturing and services. However, six months after the bottom fell out of the labor market in the early spring, only half of the 22 million jobs lost had returned. The U.S. unemployment rate fell to 7.9% in September, the fifth straight month of improvement but far higher than the 3.5% pre-COVID-19 rate. Only 661,000 jobs were added for the month, down from 1.5 million in August. Meanwhile, a reported 2.3 million people have given up looking for work. With U.S. Congress failing to pass further fiscal relief and uncertainties surrounding a possible vaccine, doubts crept back into the financial markets. In the U.K., a lack of progress in Brexit talks with the European Union weighed on markets. China’s economy picked up steam, however, with growth fueled by increased global demand, and China’s service sector had its strongest PMI reading in seven years.
4 | Wells Fargo Common Stock Fund
Table of Contents
Letter to shareholders (unaudited)
Don’t let short-term uncertainty derail long-term investment goals.
Periods of investment uncertainty can present challenges, but experience has taught us that maintaining long-term investment goals can be an effective way to plan for the future. To help you create a sound strategy based on your personal goals and risk tolerance, Wells Fargo Funds offers more than 100 mutual funds spanning a wide range of asset classes and investment styles. Although diversification cannot guarantee an investment profit or prevent losses, we believe it can be an effective way to manage investment risk and potentially smooth out overall portfolio performance. We encourage investors to know their investments and to understand that appropriate levels of risk-taking may unlock opportunities.
Thank you for choosing to invest with Wells Fargo Funds. We appreciate your confidence in us and remain committed to helping you meet your financial needs.
Sincerely,

Andrew Owen
President
Wells Fargo Funds
|
For further information about your Fund, contact your investment professional, visit our website at wfam.com, or call us directly at 1-800-222-8222. |
Notice to Shareholders
At a meeting held on August 10-12, 2020, the Board of Trustees of the Fund approved a change to the Fund’s automatic conversion feature for Class C shares in order to shorten the required holding period from 10 to 8 years. As a result, on a monthly basis beginning November 5, 2020, Class C shares will convert automatically into Class A shares 8 years after the initial date of purchase or, if you acquired your Class C shares through an exchange or conversion from another share class, 8 years after the date you acquired your Class C shares. When Class C shares that you acquired through a purchase or exchange convert, any other Class C shares that you purchased with reinvested dividends and distributions also will convert into Class A shares on a pro rata basis.
Please note that a shorter holding period may apply depending on your intermediary. Please see “Appendix A—Sales Charge Reductions and Waivers for Certain Intermediaries” in the Fund’s prospectus for further information.
Wells Fargo Common Stock Fund | 5
Table of Contents
Performance highlights (unaudited)
Investment objective
The Fund seeks long-term capital appreciation.
Manager
Wells Fargo Funds Management, LLC
Subadviser
Wells Capital Management Incorporated
Portfolio managers
Christopher G. Miller, CFA®‡
Garth B. Newport, CFA®‡*
Average annual total returns (%) as of September 30, 2020
| Including sales charge | Excluding sales charge | Expense ratios1 (%) | ||||||||||||||||||||||||||||||||
| Inception date | 1 year | 5 year | 10 year | 1 year | 5 year | 10 year | Gross | Net2 | ||||||||||||||||||||||||||
| Class A (SCSAX) | 11-30-2000 | -9.05 | 6.36 | 8.66 | -3.48 | 7.63 | 9.31 | 1.27 | 1.27 | |||||||||||||||||||||||||
| Class C (STSAX) | 11-30-2000 | -4.88 | 6.89 | 8.53 | -3.88 | 6.89 | 8.53 | 2.02 | 2.02 | |||||||||||||||||||||||||
| Class R6 (SCSRX)3 | 6-28-2013 | – | – | – | -3.10 | 8.08 | 9.77 | 0.83 | 0.83 | |||||||||||||||||||||||||
| Administrator Class (SCSDX) | 7-30-2010 | – | – | – | -1.68 | 8.16 | 9.67 | 1.19 | 1.11 | |||||||||||||||||||||||||
| Institutional Class (SCNSX) | 7-30-2010 | – | – | – | -3.13 | 8.06 | 9.74 | 0.94 | 0.86 | |||||||||||||||||||||||||
| Russell 2500TM Index4 | – | – | – | – | 2.22 | 8.97 | 10.81 | – | – | |||||||||||||||||||||||||
Figures quoted represent past performance, which is no guarantee of future results, and do not reflect taxes that a shareholder may pay on an investment in a fund. Investment return and principal value of an investment will fluctuate so that an investor’s shares, when redeemed, may be worth more or less than their original cost. Performance shown without sales charges would be lower if sales charges were reflected. Current performance may be lower or higher than the performance data quoted, which assumes the reinvestment of dividends and capital gains. Current month-end performance is available on the Fund’s website, wfam.com.
Index returns do not include transaction costs associated with buying and selling securities, any mutual fund fees or expenses, or any taxes. It is not possible to invest directly in an index.
For Class A shares, the maximum front-end sales charge is 5.75%. For Class C shares, the maximum contingent deferred sales charge is 1.00%. Performance including a contingent deferred sales charge assumes the sales charge for the corresponding time period. Class R6, Administrator Class, and Institutional Class shares are sold without a front-end sales charge or contingent deferred sales charge.
Stock values fluctuate in response to the activities of individual companies and general market and economic conditions. Smaller-company stocks tend to be more volatile and less liquid than those of larger companies. Certain investment strategies tend to increase the total risk of an investment (relative to the broader market). The Fund is exposed to foreign investment risk. Consult the Fund’s prospectus for additional information on these and other risks.
Please see footnotes on page 7.
6 | Wells Fargo Common Stock Fund
Table of Contents
Performance highlights (unaudited)
| Growth of $10,000 investment as of September 30, 20205 |
|
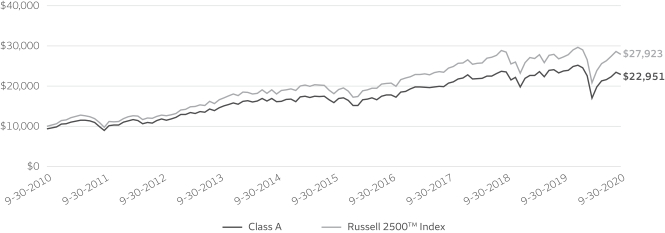
| ‡ | CFA® and Chartered Financial Analyst® are trademarks owned by CFA Institute. |
| * | Mr. Newport became a portfolio manager of the Fund on February 1, 2020. |
| 1 | Reflects the expense ratios as stated in the most recent prospectuses, which include the impact of 0.01% in acquired fund fees and expenses. The expense ratios shown are subject to change and may differ from the annualized expense ratios shown in the financial highlights of this report, which do not include acquired fund fees and expenses. |
| 2 | The manager has contractually committed through January 31, 2021, to waive fees and/or reimburse expenses to the extent necessary to cap total annual fund operating expenses after fee waivers at 1.26% for Class A, 2.01% for Class C, 0.83% for Class R6, 1.10% for Administrator Class, and 0.85% for Institutional Class. Brokerage commissions, stamp duty fees, interest, taxes, acquired fund fees and expenses (if any), and extraordinary expenses are excluded from the expense caps. Prior to or after the commitment expiration date, the caps may be increased or the commitment to maintain the caps may be terminated only with the approval of the Board of Trustees. Without these caps, the Fund’s returns would have been lower. The expense ratio paid by an investor is the net expense ratio (the total annual fund operating expenses after fee waivers) as stated in the prospectuses. |
| 3 | Historical performance shown for the Class R6 shares prior to their inception reflects the performance of the Institutional Class shares, and includes the higher expenses applicable to the Institutional Class shares. If these expenses had not been included, the returns for the Class R6 shares would be higher. |
| 4 | The Russell 2500TM Index measures the performance of the 2,500 smallest companies in the Russell 3000® Index, which represents approximately 16% of the total market capitalization of the Russell 3000® Index. You cannot invest directly in an index. |
| 5 | The chart compares the performance of Class A shares for the most recent ten years with the Russell 2500TM Index. The chart assumes a hypothetical investment of $10,000 in Class A shares and reflects all operating expenses and assumes the maximum initial sales charge of 5.75%. |
| 6 | The ten largest holdings, excluding cash, cash equivalents and any money market funds, are calculated based on the value of the investments divided by total net assets of the Fund. Holdings are subject to change and may have changed since the date specified. |
| 7 | Amounts are calculated based on the total long-term investments of the Fund. These amounts are subject to change and may have changed since the date specified. |
Wells Fargo Common Stock Fund | 7
Table of Contents
Performance highlights (unaudited)
MANAGER’S DISCUSSION
Fund highlights
| ∎ | The Fund underperformed its benchmark, the Russell 2500TM Index, for the 12-month period that ended September 30, 2020. |
| ∎ | Stock selection in health care, consumer discretionary, and information technology (IT) detracted from relative performance, even though IT and health care were the sources of absolute return. |
| ∎ | Stock selection in real estate and low exposure to utilities and energy contributed to relative performance. |
The global pandemic caused market volatility to spike, prompting aggressive monetary and fiscal policy responses.
The U.S. equity markets were extremely volatile and moved sharply in both directions during the reporting period. The markets rose in all four quarters in 2019 and into mid-February, hitting new all-time highs along the way. Then, as the global pandemic took hold, the equity markets proceeded to lose more than 35% of their value in less than six weeks, ending the longest bull market in U.S. history while entering bear market territory in record time. Beginning in the last week of March, U.S. equities began to recover and rose for the next five months before retreating a bit in September. The Fund’s benchmark followed a similar pattern and ended up gaining 15% for the 12-month period. IT, consumer discretionary, and health care were the best-performing sectors in the benchmark while energy, financials, and real estate declined the most. Growth stocks generally outperformed value.
Leading up to the mid-February high, U.S. equities benefited from a dovish U.S. Federal Reserve (Fed), lower corporate taxes, less regulation, share buybacks, capital spending, and high-profile merger and acquisition activity that boosted optimism in U.S. businesses. Rising wages, low unemployment, low inflation, and declining household debt fueled consumer confidence. COVID-19 evolved into a global pandemic, largely shutting down the international economy and eventually accumulating a worldwide death toll of around 1 million by the end of the period. The six-week market decline was followed by a recovery that can mostly be attributed to the speed and aggressiveness of the U.S. government’s fiscal and monetary policy response. Sentiment ebbed and flowed with news of infection rates, mortality rates, vaccines, therapeutics, and partial business openings. The legislature approved three stimulus bills, including the Coronavirus Aid, Relief, and Economic Security Act, representing the largest stimulus bill in U.S. history at $2.2 trillion. The Fed had cut interest rates to near zero by mid-March and announced an aggressive open-ended commitment to keep buying assets under its quantitative easing measures to also include corporate bonds for the first time in its history. The Fed’s “whatever it takes” mantra increased its balance sheet to over $7.2 trillion. Through the period, we continued to seek companies with solid business models, strong management teams, and healthy cash flow prospects.
Holdings in health care, consumer discretionary, and IT were the largest detractors to relative performance.
| Ten largest holdings (%) as of September 30, 20206 | ||||
Masonite International Corporation | 2.88 | |||
Bio-Rad Laboratories Incorporated Class A | 2.31 | |||
United Rentals Incorporated | 2.05 | |||
Marvell Technology Group Limited | 2.01 | |||
VICI Properties Incorporated | 1.99 | |||
AMETEK Incorporated | 1.91 | |||
Sun Communities Incorporated | 1.87 | |||
Discover Financial Services | 1.85 | |||
Zendesk Incorporated | 1.81 | |||
ITT Incorporated | 1.72 | |||
Holdings in health care generally underperformed their peers in the benchmark, particularly in medical technologies and biopharma, with a few notable exceptions in life sciences and insurance. LivaNova PLC (LIVN) is a medical technology company that specializes in neuromodulation, cardiac surgery, and cardiac rhythm management. The stock declined 39% during the period, affected by a pandemic-related delay in clinical trial timelines and postponement of non-emergent procedures that hurt the firm’s neuromodulation business. Conversely, in the life sciences industry, Bio-Rad Laboratories, Incorporated (BIO), was one of the largest relative contributors to the Fund. BIO is a leading life science company providing instruments, software, consumables, reagents, and related content. The
stock rose 55% on increased demand for its products, including a real-time PCR screening assay and a blood-based immunoassay kit to identify antibodies to COVID-19. Holdings in the consumer discretionary sector were hurt by the pandemic, especially in the leisure, travel, restaurant, and retail industries. Norwegian Cruise Line Holdings Limited (NCLH) operates brands with a combined fleet of 28 ships. The stock declined 69% as cruise lines were at the epicenter of the pandemic and all major carriers were suspending voyages. The Fund’s holdings in IT made the largest contribution to overall returns but underperformed their peers in the benchmark. The largest individual detractor was Hexcel Corporation (HXL) in the industrials
Please see footnotes on page 7.
8 | Wells Fargo Common Stock Fund
Table of Contents
Performance highlights (unaudited)
sector, a leading producer of carbon fiber reinforcements and resin systems and honeycomb manufacturing for the commercial aerospace, industrial, and defense industries. Travel restrictions severely curtailed demand from aircraft manufacturers, causing the stock to decline 59% during the period.
| Sector allocation as of September 30, 20207 |
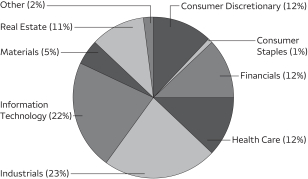 |
Real estate, utilities, and energy contributed the most to relative performance.
The real estate sector in the benchmark declined during the period, but the Fund’s holdings outperformed the group. Cell towers and data centers benefited from increased use of cloud computing and electronic commerce by businesses and increased electronic communications between/among people and things. SBA Communications Corporation (SBA) rose 33% as an owner and operator of wireless communications infrastructure. The energy sector was affected by the collapse in the price of crude oil, as global demand faded from the pandemic-induced economic slowdown without a proportional reduction in supply. Energy
was the worst-performing sector in the benchmark with a decline of 55%, but an underweight position made it a relative contributor to the Fund. Utilities also declined during the period and lack of exposure there was also a source of relative gains. The largest individual contributor was Nuance Communications, Incorporated (NUAN), which provides voice and language solutions for the health care, mobile, consumer, enterprise customer service, and imaging markets. The stock rose 134%, benefiting from corporate partnerships and the new normal of virtual communications.
Our focus is constant: To add value by investing in attractively priced holdings.
We seek to buy stocks at a discount to their estimated private market valuation (PMV) and sell them as they reach the top of their PMV range. The PMV represents the expected price an investor would pay for the entire company as a stand-alone private entity. Our disciplined, bottom-up investment process leads us to be overweight or underweight certain sectors. This positioning changes over time based on macroeconomic and industry-specific factors. During the reporting period, we were most overweight the industrials and IT sectors while being most underweight utilities and communication services. Through our disciplined investment process, we remain keenly aware of both price and enterprise values on a company-by-company basis.
The economic impact of the global coronavirus pandemic will consume the equity markets for the foreseeable future. As infection rates have slowed down and patient recovery rates have improved, the country has been gradually opening up and eventually the economy will get back in motion. The U.S. economy is in a recession, but it’s too early to know how deep the economic damage will be, how soon it can begin to recover, and whether the extraordinary responses to date will be effective. We now know a lot more about COVID-19, and we believe there is a lot of promise in the vaccines and therapeutics under development. This economic downturn has been different from anything else in recent history, and there is the possibility that things could get back to normal sooner than expected.
Please see footnotes on page 7.
Wells Fargo Common Stock Fund | 9
Table of Contents
As a shareholder of the Fund, you incur two types of costs: (1) transaction costs, including sales charges (loads) on purchase payments and contingent deferred sales charges (if any) on redemptions and (2) ongoing costs, including management fees, distribution (12b-1) and/or shareholder servicing fees, and other Fund expenses. This example is intended to help you understand your ongoing costs (in dollars) of investing in the Fund and to compare these costs with the ongoing costs of investing in other mutual funds.
The example is based on an investment of $1,000 invested at the beginning of the six-month period and held for the entire period from April 1, 2020 to September 30, 2020.
Actual expenses
The “Actual” line of the table below provides information about actual account values and actual expenses. You may use the information in this line, together with the amount you invested, to estimate the expenses that you paid over the period. Simply divide your account value by $1,000 (for example, an $8,600 account value divided by $1,000 = 8.6), then multiply the result by the number in the “Actual” line under the heading entitled “Expenses paid during period” for your applicable class of shares to estimate the expenses you paid on your account during this period.
Hypothetical example for comparison purposes
The “Hypothetical” line of the table below provides information about hypothetical account values and hypothetical expenses based on the Fund’s actual expense ratio and an assumed rate of return of 5% per year before expenses, which is not the Fund’s actual return. The hypothetical account values and expenses may not be used to estimate the actual ending account balance or expenses you paid for the period. You may use this information to compare the ongoing costs of investing in the Fund and other funds. To do so, compare this 5% hypothetical example with the 5% hypothetical examples that appear in the shareholder reports of the other funds.
Please note that the expenses shown in the table are meant to highlight your ongoing costs only and do not reflect any transactional costs, such as sales charges (loads) and contingent deferred sales charges. Therefore, the “Hypothetical” line of the table is useful in comparing ongoing costs only and will not help you determine the relative total costs of owning different funds. In addition, if these transactional costs were included, your costs would have been higher.
| Beginning account value 4-1-2020 | Ending account value 9-30-2020 | Expenses paid during the period1 | Annualized net expense ratio | |||||||||||||
Class A | ||||||||||||||||
Actual | $ | 1,000.00 | $ | 1,344.36 | $ | 7.32 | 1.25 | % | ||||||||
Hypothetical (5% return before expenses) | $ | 1,000.00 | $ | 1,018.82 | $ | 6.30 | 1.25 | % | ||||||||
Class C | ||||||||||||||||
Actual | $ | 1,000.00 | $ | 1,344.83 | $ | 11.79 | 2.01 | % | ||||||||
Hypothetical (5% return before expenses) | $ | 1,000.00 | $ | 1,015.01 | $ | 10.13 | 2.01 | % | ||||||||
Class R6 | ||||||||||||||||
Actual | $ | 1,000.00 | $ | 1,347.40 | $ | 4.88 | 0.83 | % | ||||||||
Hypothetical (5% return before expenses) | $ | 1,000.00 | $ | 1,020.91 | $ | 4.20 | 0.83 | % | ||||||||
Administrator Class | ||||||||||||||||
Actual | $ | 1,000.00 | $ | 1,368.77 | $ | 6.49 | 1.09 | % | ||||||||
Hypothetical (5% return before expenses) | $ | 1,000.00 | $ | 1,019.59 | $ | 5.54 | 1.09 | % | ||||||||
Institutional Class | ||||||||||||||||
Actual | $ | 1,000.00 | $ | 1,347.21 | $ | 5.00 | 0.85 | % | ||||||||
Hypothetical (5% return before expenses) | $ | 1,000.00 | $ | 1,020.81 | $ | 4.31 | 0.85 | % | ||||||||
| 1 | Expenses paid is equal to the annualized net expense ratio of each class multiplied by the average account value over the period, multiplied by the number of days in the most recent fiscal half-year divided by the number of days in the fiscal year (to reflect the one-half-year period). |
10 | Wells Fargo Common Stock Fund
Table of Contents
Portfolio of investments—September 30, 2020
| Shares | Value | |||||||||||||||
| Common Stocks: 98.63% |
| |||||||||||||||
Consumer Discretionary: 12.16% |
| |||||||||||||||
| Auto Components: 1.50% | ||||||||||||||||
Dana Incorporated | 1,077,585 | $ | 13,275,843 | |||||||||||||
|
| |||||||||||||||
| Diversified Consumer Services: 0.12% | ||||||||||||||||
Houghton Mifflin Harcourt Company † | 628,107 | 1,086,625 | ||||||||||||||
|
| |||||||||||||||
| Hotels, Restaurants & Leisure: 3.92% | ||||||||||||||||
Jack in the Box Incorporated | 143,610 | 11,389,709 | ||||||||||||||
Norwegian Cruise Line Holdings Limited Ǡ | 205,710 | 3,519,698 | ||||||||||||||
Planet Fitness Incorporated Class A † | 195,111 | 12,022,740 | ||||||||||||||
Texas Roadhouse Incorporated | 125,569 | 7,633,340 | ||||||||||||||
| 34,565,487 | ||||||||||||||||
|
| |||||||||||||||
| Household Durables: 0.93% | ||||||||||||||||
Mohawk Industries Incorporated † | 83,734 | 8,171,601 | ||||||||||||||
|
| |||||||||||||||
| Internet & Direct Marketing Retail: 0.81% | ||||||||||||||||
The RealReal Incorporated † | 491,582 | 7,113,192 | ||||||||||||||
|
| |||||||||||||||
| Specialty Retail: 3.78% | ||||||||||||||||
Burlington Stores Incorporated † | 72,881 | 15,020,045 | ||||||||||||||
Tractor Supply Company | 46,735 | 6,698,995 | ||||||||||||||
Ulta Beauty Incorporated † | 51,831 | 11,609,107 | ||||||||||||||
| 33,328,147 | ||||||||||||||||
|
| |||||||||||||||
| Textiles, Apparel & Luxury Goods: 1.10% | ||||||||||||||||
Levi Strauss & Company Class A | �� | 722,067 | 9,675,698 | |||||||||||||
|
| |||||||||||||||
| Consumer Staples: 0.88% | ||||||||||||||||
| Household Products: 0.88% | ||||||||||||||||
Church & Dwight Company Incorporated | 83,139 | 7,790,956 | ||||||||||||||
|
| |||||||||||||||
Financials: 12.28% |
| |||||||||||||||
| Banks: 1.47% | ||||||||||||||||
Pinnacle Financial Partners Incorporated | 185,017 | 6,584,755 | ||||||||||||||
Sterling Bancorp | 603,606 | 6,349,935 | ||||||||||||||
| 12,934,690 | ||||||||||||||||
|
| |||||||||||||||
| Capital Markets: 1.74% | ||||||||||||||||
Cboe Global Markets Incorporated | 108,218 | 9,495,047 | ||||||||||||||
Raymond James Financial Incorporated | 80,197 | 5,835,134 | ||||||||||||||
| 15,330,181 | ||||||||||||||||
|
| |||||||||||||||
| Consumer Finance: 1.84% | ||||||||||||||||
Discover Financial Services | 281,565 | 16,268,826 | ||||||||||||||
|
| |||||||||||||||
| Insurance: 5.97% | ||||||||||||||||
Arch Capital Group Limited † | 288,991 | 8,452,987 | ||||||||||||||
Axis Capital Holdings Limited | 214,811 | 9,460,276 | ||||||||||||||
CNO Financial Group Incorporated | 828,994 | 13,297,064 | ||||||||||||||
Reinsurance Group of America Incorporated | 104,187 | 9,917,561 | ||||||||||||||
Willis Towers Watson plc | 54,922 | 11,468,812 | ||||||||||||||
| 52,596,700 | ||||||||||||||||
|
| |||||||||||||||
The accompanying notes are an integral part of these financial statements.
Wells Fargo Common Stock Fund | 11
Table of Contents
Portfolio of investments—September 30, 2020
| Shares | Value | |||||||||||||||
| Thrifts & Mortgage Finance: 1.26% |
| |||||||||||||||
Essent Group Limited | 301,272 | $ | 11,150,077 | |||||||||||||
|
| |||||||||||||||
Health Care: 12.19% |
| |||||||||||||||
| Biotechnology: 1.71% | ||||||||||||||||
Acceleron Pharma Incorporated † | 31,192 | 3,510,036 | ||||||||||||||
Agios Pharmaceuticals Incorporated † | 73,361 | 2,567,635 | ||||||||||||||
Neurocrine Biosciences Incorporated † | 59,060 | 5,679,210 | ||||||||||||||
Sage Therapeutics Incorporated † | 54,125 | 3,308,120 | ||||||||||||||
| 15,065,001 | ||||||||||||||||
|
| |||||||||||||||
| Health Care Equipment & Supplies: 4.02% | ||||||||||||||||
Haemonetics Corporation † | 154,817 | 13,507,783 | ||||||||||||||
Integer Holdings Corporation † | 154,679 | 9,127,608 | ||||||||||||||
LivaNova plc † | 283,008 | 12,794,792 | ||||||||||||||
| 35,430,183 | ||||||||||||||||
|
| |||||||||||||||
| Health Care Providers & Services: 3.75% | ||||||||||||||||
Humana Incorporated | 33,485 | 13,859,107 | ||||||||||||||
Laboratory Corporation of America Holdings † | 76,554 | 14,412,822 | ||||||||||||||
Universal Health Services Incorporated Class B | 44,831 | 4,797,814 | ||||||||||||||
| 33,069,743 | ||||||||||||||||
|
| |||||||||||||||
| Life Sciences Tools & Services: 2.71% | ||||||||||||||||
Bio-Rad Laboratories Incorporated Class A † | 39,430 | 20,324,588 | ||||||||||||||
Codexis Incorporated † | 308,115 | 3,617,270 | ||||||||||||||
| 23,941,858 | ||||||||||||||||
|
| |||||||||||||||
Industrials: 23.20% |
| |||||||||||||||
| Aerospace & Defense: 1.83% | ||||||||||||||||
Hexcel Corporation | 131,726 | 4,419,407 | ||||||||||||||
MTU Aero Engines AG † | 70,477 | 11,683,017 | ||||||||||||||
| 16,102,424 | ||||||||||||||||
|
| |||||||||||||||
| Building Products: 2.88% | ||||||||||||||||
Masonite International Corporation † | 258,315 | 25,418,196 | ||||||||||||||
|
| |||||||||||||||
| Commercial Services & Supplies: 4.42% | ||||||||||||||||
IAA Incorporated † | 268,610 | 13,986,523 | ||||||||||||||
Republic Services Incorporated | 144,528 | 13,491,689 | ||||||||||||||
Stericycle Incorporated † | 182,353 | 11,499,180 | ||||||||||||||
| 38,977,392 | ||||||||||||||||
|
| |||||||||||||||
| Construction & Engineering: 0.67% | ||||||||||||||||
API Group Corporation 144A† | 414,149 | 5,893,340 | ||||||||||||||
|
| |||||||||||||||
| Electrical Equipment: 3.41% | ||||||||||||||||
AMETEK Incorporated | 169,252 | 16,823,649 | ||||||||||||||
Sensata Technologies Holding plc † | 308,175 | 13,294,670 | ||||||||||||||
| 30,118,319 | ||||||||||||||||
|
| |||||||||||||||
| Industrial Conglomerates: 1.23% | ||||||||||||||||
Carlisle Companies Incorporated | 88,430 | 10,821,179 | ||||||||||||||
|
| |||||||||||||||
The accompanying notes are an integral part of these financial statements.
12 | Wells Fargo Common Stock Fund
Table of Contents
Portfolio of investments—September 30, 2020
| Shares | Value | |||||||||||||||
| Machinery: 4.47% |
| |||||||||||||||
Altra Industrial Motion Corporation | 373,274 | $ | 13,799,940 | |||||||||||||
Ingersoll Rand Incorporated † | 293,781 | 10,458,604 | ||||||||||||||
ITT Incorporated | 256,676 | 15,156,718 | ||||||||||||||
| 39,415,262 | ||||||||||||||||
|
| |||||||||||||||
| Road & Rail: 0.59% | ||||||||||||||||
Saia Incorporated † | 40,951 | 5,165,559 | ||||||||||||||
|
| |||||||||||||||
| Trading Companies & Distributors: 3.70% | ||||||||||||||||
Air Lease Corporation | 494,051 | 14,534,980 | ||||||||||||||
United Rentals Incorporated † | 103,600 | 18,078,200 | ||||||||||||||
| 32,613,180 | ||||||||||||||||
|
| |||||||||||||||
Information Technology: 21.59% |
| |||||||||||||||
| IT Services: 4.14% | ||||||||||||||||
Black Knight Incorporated † | 147,128 | 12,807,492 | ||||||||||||||
EVO Payments Incorporated Class A † | 487,408 | 12,112,089 | ||||||||||||||
Genpact Limited | 297,609 | 11,591,871 | ||||||||||||||
| 36,511,452 | ||||||||||||||||
|
| |||||||||||||||
| Semiconductors & Semiconductor Equipment: 6.36% | ||||||||||||||||
Brooks Automation Incorporated | 323,990 | 14,987,777 | ||||||||||||||
Marvell Technology Group Limited | 445,647 | 17,692,186 | ||||||||||||||
Maxim Integrated Products Incorporated | 170,763 | 11,545,286 | ||||||||||||||
ON Semiconductor Corporation † | 547,146 | 11,867,597 | ||||||||||||||
| 56,092,846 | ||||||||||||||||
|
| |||||||||||||||
| Software: 11.09% | ||||||||||||||||
8x8 Incorporated † | 756,884 | 11,769,546 | ||||||||||||||
Fair Isaac Corporation † | 30,441 | 12,948,993 | ||||||||||||||
Medallia Incorporated † | 384,081 | 10,531,501 | ||||||||||||||
Nuance Communications Incorporated | 412,147 | 13,679,159 | ||||||||||||||
Proofpoint Incorporated † | 116,361 | 12,281,904 | ||||||||||||||
RealPage Incorporated † | 201,482 | 11,613,422 | ||||||||||||||
SPS Commerce Incorporated † | 115,002 | 8,955,206 | ||||||||||||||
Zendesk Incorporated † | 154,820 | 15,934,074 | ||||||||||||||
| 97,713,805 | ||||||||||||||||
|
| |||||||||||||||
Materials: 5.19% |
| |||||||||||||||
| Chemicals: 1.48% | ||||||||||||||||
Westlake Chemical Corporation | 206,276 | 13,040,769 | ||||||||||||||
|
| |||||||||||||||
| Containers & Packaging: 1.30% | ||||||||||||||||
Crown Holdings Incorporated † | 149,250 | 11,471,355 | ||||||||||||||
|
| |||||||||||||||
| Metals & Mining: 2.41% | ||||||||||||||||
Royal Gold Incorporated | 64,214 | 7,716,596 | ||||||||||||||
Steel Dynamics Incorporated | 472,104 | 13,516,338 | ||||||||||||||
| 21,232,934 | ||||||||||||||||
|
| |||||||||||||||
Real Estate: 11.14% |
| |||||||||||||||
| Equity REITs: 10.19% | ||||||||||||||||
American Homes 4 Rent Class A | 217,917 | 6,206,276 | ||||||||||||||
Camden Property Trust | 92,995 | 8,274,695 | ||||||||||||||
CoreSite Realty Corporation | 91,773 | 10,909,974 | ||||||||||||||
The accompanying notes are an integral part of these financial statements.
Wells Fargo Common Stock Fund | 13
Table of Contents
Portfolio of investments—September 30, 2020
| Shares | Value | |||||||||||||||
| Equity REITs (continued) | ||||||||||||||||
Four Corners Property Trust Incorporated | 411,389 | $ | 10,527,445 | |||||||||||||
SBA Communications Corporation | 36,227 | 11,537,575 | ||||||||||||||
STAG Industrial Incorporated | 275,682 | 8,405,544 | ||||||||||||||
Sun Communities Incorporated | 117,241 | 16,485,257 | ||||||||||||||
VICI Properties Incorporated | 749,219 | 17,509,248 | ||||||||||||||
| 89,856,014 | ||||||||||||||||
|
| |||||||||||||||
| Real Estate Management & Development: 0.95% | ||||||||||||||||
Jones Lang LaSalle Incorporated | 87,784 | 8,397,417 | ||||||||||||||
|
| |||||||||||||||
Total Common Stocks (Cost $682,761,988) |
| 869,636,251 | ||||||||||||||
|
| |||||||||||||||
| Exchange-Traded Funds: 1.25% | ||||||||||||||||
SPDR S&P Biotech ETF « | 99,390 | 11,075,028 | ||||||||||||||
|
| |||||||||||||||
Total Exchange-Traded Funds (Cost $6,115,593) |
| 11,075,028 | ||||||||||||||
|
| |||||||||||||||
| Yield | ||||||||||||||||
| Short-Term Investments: 1.80% | ||||||||||||||||
| Investment Companies: 1.80% | ||||||||||||||||
Securities Lending Cash Investments LLC (l)(r)(u) | 0.12 | % | 14,083,400 | 14,083,400 | ||||||||||||
Wells Fargo Government Money Market Fund Select Class (l)(u) | 0.05 | 1,768,345 | 1,768,345 | |||||||||||||
Total Short-Term Investments (Cost $15,851,745) |
| 15,851,745 | ||||||||||||||
|
| |||||||||||||||
| Total investments in securities (Cost $704,729,326) | 101.68 | % | 896,563,024 | |||||
Other assets and liabilities, net | (1.68 | ) | (14,850,384 | ) | ||||
|
|
|
| |||||
| Total net assets | 100.00 | % | $ | 881,712,640 | ||||
|
|
|
| |||||
| † | Non-income-earning security |
| « | All or a portion of this security is on loan. |
| 144A | The security may be resold in transactions exempt from registration, normally to qualified institutional buyers, pursuant to Rule 144A under the Securities Act of 1933. |
| (l) | The issuer of the security is an affiliated person of the Fund as defined in the Investment Company Act of 1940. |
| (r) | The investment is a non-registered investment company purchased with cash collateral received from securities on loan. |
| (u) | The rate represents the 7-day annualized yield at period end. |
Abbreviations:
| REIT | Real estate investment trust |
Investments in Affiliates
An affiliated investment is an investment in which the Fund owns at least 5% of the outstanding voting shares of the issuer or as a result of other relationships, such as the Fund and the issuer having the same investment manager. Transactions with issuers that were either affiliated persons of the Fund at the beginning of the period or the end of the period were as follows:
| Value, beginning of period | Purchases | Sales proceeds | Net realized gains (losses) | Net change in unrealized gains (losses) | Income from affiliated securities | Value, end of period | % of net assets | |||||||||||||||||||||||||
| Short-Term Investments | ||||||||||||||||||||||||||||||||
Investment Companies | ||||||||||||||||||||||||||||||||
Securities Lending Cash Investments LLC | $ | 9,519,016 | $ | 108,335,256 | $ | (103,771,246 | ) | $ | 610 | $ | (236 | ) | $ | 88,824 | # | $ | 14,083,400 | |||||||||||||||
Wells Fargo Government Money Market Fund Select Class | 15,119,436 | 281,175,232 | (294,526,323 | ) | 0 | 0 | 107,095 | 1,768,345 | ||||||||||||||||||||||||
|
|
|
|
|
|
|
|
|
| |||||||||||||||||||||||
| $ | 610 | $ | (236 | ) | $ | 195,919 | $ | 15,851,745 | 1.80 | % | ||||||||||||||||||||||
|
|
|
|
|
|
|
|
|
| |||||||||||||||||||||||
| # | Amount shown represents income before fees and rebates. |
The accompanying notes are an integral part of these financial statements.
14 | Wells Fargo Common Stock Fund
Table of Contents
Statement of assets and liabilities—September 30, 2020
Assets | ||||
Investments in unaffiliated securities (including $13,862,286 of securities loaned), at value (cost $688,877,581) | $ | 880,711,279 | ||
Investments in affiliated securities, at value (cost $15,851,745) | 15,851,745 | |||
Receivable for Fund shares sold | 57,451 | |||
Receivable for dividends | 1,082,657 | |||
Receivable for securities lending income, net | 8,231 | |||
|
| |||
Total assets | 897,711,363 | |||
|
| |||
Liabilities | ||||
Payable upon receipt of securities loaned | 14,083,400 | |||
Payable for Fund shares redeemed | 801,394 | |||
Management fee payable | 610,259 | |||
Administration fees payable | 140,855 | |||
Distribution fee payable | 1,912 | |||
Trustees’ fees and expenses payable | 5,395 | |||
Accrued expenses and other liabilities | 355,508 | |||
|
| |||
Total liabilities | 15,998,723 | |||
|
| |||
Total net assets | $ | 881,712,640 | ||
|
| |||
Net assets consist of | ||||
Paid-in capital | $ | 687,264,141 | ||
Total distributable earnings | 194,448,499 | |||
|
| |||
Total net assets | $ | 881,712,640 | ||
|
| |||
Computation of net asset value and offering price per share | ||||
Net assets – Class A | $ | 722,546,862 | ||
Shares outstanding – Class A1 | 40,408,182 | |||
Net asset value per share – Class A | $17.88 | |||
Maximum offering price per share – Class A2 | $18.97 | |||
Net assets – Class C | $ | 3,019,798 | ||
Shares outstanding – Class C1 | 258,105 | |||
Net asset value per share – Class C | $11.70 | |||
Net assets – Class R6 | $ | 27,627,518 | ||
Shares outstanding – Class R61 | 1,441,861 | |||
Net asset value per share – Class R6 | $19.16 | |||
Net assets – Administrator Class | $ | 2,239,113 | ||
Shares outstanding – Administrator Class1 | 119,928 | |||
Net asset value per share – Administrator Class | $18.67 | |||
Net assets – Institutional Class | $ | 126,279,349 | ||
Shares outstanding – Institutional Class1 | 6,614,535 | |||
Net asset value per share – Institutional Class | $19.09 | |||
| 1 | The Fund has an unlimited number of authorized shares. |
| 2 | Maximum offering price is computed as 100/94.25 of net asset value. On investments of $50,000 or more, the offering price is reduced. |
The accompanying notes are an integral part of these financial statements.
Wells Fargo Common Stock Fund | 15
Table of Contents
Statement of operations—year ended September 30, 2020
Investment income | ||||
Dividends (net of foreign withholding taxes of $501) | $ | 10,161,021 | ||
Income from affiliated securities | 147,811 | |||
|
| |||
Total investment income | 10,308,832 | |||
|
| |||
Expenses | ||||
Management fee | 7,304,119 | |||
Administration fees | ||||
Class A | 1,607,607 | |||
Class C | 9,854 | |||
Class R6 | 9,752 | |||
Administrator Class | 3,373 | |||
Institutional Class | 179,072 | |||
Shareholder servicing fees | ||||
Class A | 1,909,772 | |||
Class C | 11,686 | |||
Administrator Class | 5,967 | |||
Distribution fee | ||||
Class C | 34,979 | |||
Custody and accounting fees | 64,355 | |||
Professional fees | 50,991 | |||
Registration fees | 75,795 | |||
Shareholder report expenses | 63,246 | |||
Trustees’ fees and expenses | 23,368 | |||
Other fees and expenses | 33,992 | |||
|
| |||
Total expenses | 11,387,928 | |||
Less: Fee waivers and/or expense reimbursements | ||||
Fund-level | (43,170 | ) | ||
Class A | (255,218 | ) | ||
Class C | (9 | ) | ||
Class R6 | (1,006 | ) | ||
Administrator Class | (1,703 | ) | ||
Institutional Class | (113,963 | ) | ||
|
| |||
Net expenses | 10,972,859 | |||
|
| |||
Net investment loss | (664,027 | ) | ||
|
| |||
Payment from affiliate | 50,779 | |||
|
| |||
Realized and unrealized gains (losses) on investments | ||||
Net realized gains on investments | ||||
Unaffiliated securities | 27,865,620 | |||
Affiiliated securities | 610 | |||
|
| |||
Net realized gains on investments | 27,866,230 | |||
|
| |||
Net change in unrealized gains (losses) on | ||||
Unaffiliated securities | (71,533,875 | ) | ||
Affiiliated securities | (236 | ) | ||
|
| |||
Net change in unrealized gains (losses) on investments | (71,534,111 | ) | ||
|
| |||
Net realized and unrealized gains (losses) on investments | (43,667,881 | ) | ||
|
| |||
Net decrease in net assets resulting from operations | $ | (44,281,129 | ) | |
|
| |||
The accompanying notes are an integral part of these financial statements.
16 | Wells Fargo Common Stock Fund
Table of Contents
Statement of changes in net assets
| Year ended September 30, 2020 | Year ended September 30, 2019 | |||||||||||||||
Operations | ||||||||||||||||
Net investment income (loss) | $ | (664,027 | ) | $ | 399,291 | |||||||||||
Payment from affiliate | 50,779 | 0 | ||||||||||||||
Net realized gains on investments | 27,866,230 | 120,517,533 | ||||||||||||||
Net change in unrealized gains (losses) on investments | (71,534,111 | ) | (119,779,061 | ) | ||||||||||||
|
| |||||||||||||||
Net increase (decrease) in net assets resulting from operations | (44,281,129 | ) | 1,137,763 | |||||||||||||
|
| |||||||||||||||
Distributions to shareholders from net investment income and net realized gains | ||||||||||||||||
Class A | (106,772,268 | ) | (128,198,379 | ) | ||||||||||||
Class C | (1,096,288 | ) | (2,840,840 | ) | ||||||||||||
Class R6 | (4,612,059 | ) | (4,757,555 | ) | ||||||||||||
Administrator Class | (452,132 | ) | (749,896 | ) | ||||||||||||
Institutional Class | (18,968,188 | ) | (20,825,630 | ) | ||||||||||||
|
| |||||||||||||||
Total distributions to shareholders | (131,900,935 | ) | (157,372,300 | ) | ||||||||||||
|
| |||||||||||||||
Capital share transactions | Shares | Shares | ||||||||||||||
Proceeds from shares sold | ||||||||||||||||
Class A | 829,934 | 14,670,933 | 957,344 | 19,146,985 | ||||||||||||
Class C | 30,986 | 364,118 | 120,120 | 1,584,422 | ||||||||||||
Class R6 | 435,113 | 8,658,699 | 410,149 | 9,044,599 | ||||||||||||
Administrator Class | 40,426 | 781,386 | 7,616 | 156,460 | ||||||||||||
Institutional Class | 936,815 | 17,943,308 | 958,488 | 21,044,807 | ||||||||||||
|
| |||||||||||||||
| 42,418,444 | 50,977,273 | |||||||||||||||
|
| |||||||||||||||
Reinvestment of distributions | ||||||||||||||||
Class A | 5,292,160 | 101,875,798 | 6,577,466 | 122,340,875 | ||||||||||||
Class C | 74,887 | 945,077 | 202,645 | 2,648,573 | ||||||||||||
Class R6 | 222,029 | 4,582,449 | 240,179 | 4,729,116 | ||||||||||||
Administrator Class | 20,980 | 414,636 | 36,844 | 700,411 | ||||||||||||
Institutional Class | 903,544 | 18,584,525 | 1,038,739 | 20,390,438 | ||||||||||||
|
| |||||||||||||||
| 126,402,485 | 150,809,413 | |||||||||||||||
|
| |||||||||||||||
Payment for shares redeemed | ||||||||||||||||
Class A | (7,019,117 | ) | (123,527,409 | ) | (5,755,346 | ) | (115,611,722 | ) | ||||||||
Class C | (386,221 | ) | (4,798,830 | ) | (683,062 | ) | (9,629,160 | ) | ||||||||
Class R6 | (826,169 | ) | (14,778,156 | ) | (453,488 | ) | (10,013,010 | ) | ||||||||
Administrator Class | (107,155 | ) | (1,980,852 | ) | (124,075 | ) | (2,358,961 | ) | ||||||||
Institutional Class | (2,368,945 | ) | (43,202,567 | ) | (1,546,702 | ) | (33,665,647 | ) | ||||||||
|
| |||||||||||||||
| (188,287,814 | ) | (171,278,500 | ) | |||||||||||||
|
| |||||||||||||||
Net increase (decrease) in net assets resulting from capital share transactions | (19,466,885 | ) | 30,508,186 | |||||||||||||
|
| |||||||||||||||
Total decrease in net assets | (195,648,949 | ) | (125,726,351 | ) | ||||||||||||
|
| |||||||||||||||
Net assets | ||||||||||||||||
Beginning of period | 1,077,361,589 | 1,203,087,940 | ||||||||||||||
|
| |||||||||||||||
End of period | $ | 881,712,640 | $ | 1,077,361,589 | ||||||||||||
|
| |||||||||||||||
The accompanying notes are an integral part of these financial statements.
Wells Fargo Common Stock Fund | 17
Table of Contents
(For a share outstanding throughout each period)
| Year ended September 30 | ||||||||||||||||||||
| CLASS A | 2020 | 2019 | 2018 | 2017 | 2016 | |||||||||||||||
Net asset value, beginning of period | $21.07 | $24.58 | $24.06 | $21.50 | $21.62 | |||||||||||||||
Net investment loss | (0.03 | ) | (0.01 | ) | (0.04 | ) | (0.09 | ) | (0.01 | )1 | ||||||||||
Net realized and unrealized gains (losses) on investments | (0.52 | ) | (0.20 | ) | 3.10 | 3.48 | 2.45 | |||||||||||||
|
|
|
|
|
|
|
|
|
| |||||||||||
Total from investment operations | (0.55 | ) | (0.21 | ) | 3.06 | 3.39 | 2.44 | |||||||||||||
Distributions to shareholders from | ||||||||||||||||||||
Net investment income | (0.00 | )2 | 0.00 | 0.00 | 0.00 | 0.00 | ||||||||||||||
Net realized gains | (2.64 | ) | (3.30 | ) | (2.54 | ) | (0.83 | ) | (2.56 | ) | ||||||||||
|
|
|
|
|
|
|
|
|
| |||||||||||
Total distributions to shareholders | (2.64 | ) | (3.30 | ) | (2.54 | ) | (0.83 | ) | (2.56 | ) | ||||||||||
Net asset value, end of period | $17.88 | $21.07 | $24.58 | $24.06 | $21.50 | |||||||||||||||
Total return3 | (3.48 | )% | 0.91 | % | 13.62 | % | 16.10 | % | 12.43 | % | ||||||||||
Ratios to average net assets (annualized) | ||||||||||||||||||||
Gross expenses | 1.27 | % | 1.26 | % | 1.25 | % | 1.25 | % | 1.25 | % | ||||||||||
Net expenses | 1.23 | % | 1.26 | % | 1.25 | % | 1.25 | % | 1.25 | % | ||||||||||
Net investment loss | (0.14 | )% | (0.03 | )% | (0.18 | )% | (0.38 | )% | (0.05 | )% | ||||||||||
Supplemental data | ||||||||||||||||||||
Portfolio turnover rate | 61 | % | 40 | % | 33 | % | 35 | % | 32 | % | ||||||||||
Net assets, end of period (000s omitted) | $722,547 | $870,369 | $971,731 | $942,596 | $924,864 | |||||||||||||||
| 1 | Calculated based upon average shares outstanding |
| 2 | Amount is less than $0.005. |
| 3 | Total return calculations do not include any sales charges. |
The accompanying notes are an integral part of these financial statements.
18 | Wells Fargo Common Stock Fund
Table of Contents
Financial highlights
(For a share outstanding throughout each period)
| Year ended September 30 | ||||||||||||||||||||
| CLASS C | 2020 | 2019 | 2018 | 2017 | 2016 | |||||||||||||||
Net asset value, beginning of period | $14.72 | $18.40 | $18.75 | $17.04 | $17.77 | |||||||||||||||
Net investment loss | (0.11 | )1 | (0.11 | )1 | (0.17 | )1 | (0.20 | )1 | (0.14 | )1 | ||||||||||
Payment from affiliate | 0.05 | 0.00 | 0.00 | 0.00 | 0.00 | |||||||||||||||
Net realized and unrealized gains (losses) on investments | (0.32 | ) | (0.27 | ) | 2.36 | 2.74 | 1.97 | |||||||||||||
|
|
|
|
|
|
|
|
|
| |||||||||||
Total from investment operations | (0.38 | ) | (0.38 | ) | 2.19 | 2.54 | 1.83 | |||||||||||||
Distributions to shareholders from | ||||||||||||||||||||
Net realized gains | (2.64 | ) | (3.30 | ) | (2.54 | ) | (0.83 | ) | (2.56 | ) | ||||||||||
Net asset value, end of period | $11.70 | $14.72 | $18.40 | $18.75 | $17.04 | |||||||||||||||
Total return2 | (3.88 | )%3 | 0.17 | % | 12.74 | % | 15.29 | % | 11.52 | % | ||||||||||
Ratios to average net assets (annualized) | ||||||||||||||||||||
Gross expenses | 2.01 | % | 2.01 | % | 2.00 | % | 2.00 | % | 2.00 | % | ||||||||||
Net expenses | 2.01 | % | 2.01 | % | 2.00 | % | 2.00 | % | 2.00 | % | ||||||||||
Net investment loss | (0.92 | )% | (0.78 | )% | (0.94 | )% | (1.14 | )% | (0.87 | )% | ||||||||||
Supplemental data | ||||||||||||||||||||
Portfolio turnover rate | 61 | % | 40 | % | 33 | % | 35 | % | 32 | % | ||||||||||
Net assets, end of period (000s omitted) | $3,020 | $7,925 | $16,541 | $18,978 | $22,902 | |||||||||||||||
| 1 | Calculated based upon average shares outstanding |
| 2 | Total return calculations do not include any sales charges. |
| 3 | During the year ended September 30, 2020, the Fund received a payment from an affiliate which had a 0.39% impact on the total return. See Note 4 in the Notes to Financial Statements for additional information. |
The accompanying notes are an integral part of these financial statements.
Wells Fargo Common Stock Fund | 19
Table of Contents
Financial highlights
(For a share outstanding throughout each period)
| Year ended September 30 | ||||||||||||||||||||
| CLASS R6 | 2020 | 2019 | 2018 | 2017 | 2016 | |||||||||||||||
Net asset value, beginning of period | $22.39 | $25.80 | $25.03 | $22.25 | $22.20 | |||||||||||||||
Net investment income | 0.05 | 1 | 0.09 | 1 | 0.05 | 1 | 0.01 | 0.07 | 1 | |||||||||||
Net realized and unrealized gains (losses) on investments | (0.56 | ) | (0.20 | ) | 3.26 | 3.60 | 2.54 | |||||||||||||
|
|
|
|
|
|
|
|
|
| |||||||||||
Total from investment operations | (0.51 | ) | (0.11 | ) | 3.31 | 3.61 | 2.61 | |||||||||||||
Distributions to shareholders from | ||||||||||||||||||||
Net investment income | (0.08 | ) | 0.00 | 0.00 | 0.00 | 0.00 | ||||||||||||||
Net realized gains | (2.64 | ) | (3.30 | ) | (2.54 | ) | (0.83 | ) | (2.56 | ) | ||||||||||
|
|
|
|
|
|
|
|
|
| |||||||||||
Total distributions to shareholders | (2.72 | ) | (3.30 | ) | (2.54 | ) | (0.83 | ) | (2.56 | ) | ||||||||||
Net asset value, end of period | $19.16 | $22.39 | $25.80 | $25.03 | $22.25 | |||||||||||||||
Total return | (3.10 | )% | 1.31 | % | 14.12 | % | 16.56 | % | 12.91 | % | ||||||||||
Ratios to average net assets (annualized) | ||||||||||||||||||||
Gross expenses | 0.84 | % | 0.83 | % | 0.82 | % | 0.82 | % | 0.82 | % | ||||||||||
Net expenses | 0.83 | % | 0.83 | % | 0.82 | % | 0.82 | % | 0.82 | % | ||||||||||
Net investment income | 0.27 | % | 0.40 | % | 0.20 | % | 0.05 | % | 0.32 | % | ||||||||||
Supplemental data | ||||||||||||||||||||
Portfolio turnover rate | 61 | % | 40 | % | 33 | % | 35 | % | 32 | % | ||||||||||
Net assets, end of period (000s omitted) | $27,628 | $36,069 | $36,477 | $115,641 | $101,436 | |||||||||||||||
| 1 | Calculated based upon average shares outstanding |
The accompanying notes are an integral part of these financial statements.
20 | Wells Fargo Common Stock Fund
Table of Contents
Financial highlights
(For a share outstanding throughout each period)
| Year ended September 30 | ||||||||||||||||||||
| ADMINISTRATOR CLASS | 2020 | 2019 | 2018 | 2017 | 2016 | |||||||||||||||
Net asset value, beginning of period | $21.56 | $25.04 | $24.42 | $21.78 | $21.84 | |||||||||||||||
Net investment income (loss) | 0.00 | 1,2 | 0.03 | (0.01 | )1 | (0.06 | )1 | 0.02 | ||||||||||||
Payment from affiliate | 0.32 | 0.00 | 0.00 | 0.00 | 0.00 | |||||||||||||||
Net realized and unrealized gains (losses) on investments | (0.54 | ) | (0.21 | ) | 3.17 | 3.53 | 2.48 | |||||||||||||
|
|
|
|
|
|
|
|
|
| |||||||||||
Total from investment operations | (0.22 | ) | (0.18 | ) | 3.16 | 3.47 | 2.50 | |||||||||||||
Distributions to shareholders from | ||||||||||||||||||||
Net investment income | (0.03 | ) | 0.00 | 0.00 | 0.00 | 0.00 | ||||||||||||||
Net realized gains | (2.64 | ) | (3.30 | ) | (2.54 | ) | (0.83 | ) | (2.56 | ) | ||||||||||
|
|
|
|
|
|
|
|
|
| |||||||||||
Total distributions to shareholders | (2.67 | ) | (3.30 | ) | (2.54 | ) | (0.83 | ) | (2.56 | ) | ||||||||||
Net asset value, end of period | $18.67 | $21.56 | $25.04 | $24.42 | $21.78 | |||||||||||||||
Total return | (1.68 | )%3 | 1.03 | % | 13.84 | % | 16.26 | % | 12.59 | % | ||||||||||
Ratios to average net assets (annualized) | ||||||||||||||||||||
Gross expenses | 1.17 | % | 1.18 | % | 1.17 | % | 1.17 | % | 1.17 | % | ||||||||||
Net expenses | 1.10 | % | 1.10 | % | 1.10 | % | 1.10 | % | 1.10 | % | ||||||||||
Net investment income (loss) | 0.01 | % | 0.14 | % | (0.04 | )% | (0.27 | )% | 0.03 | % | ||||||||||
Supplemental data | ||||||||||||||||||||
Portfolio turnover rate | 61 | % | 40 | % | 33 | % | 35 | % | 32 | % | ||||||||||
Net assets, end of period (000s omitted) | $2,239 | $3,572 | $6,141 | $6,336 | $16,720 | |||||||||||||||
| 1 | Calculated based upon average shares outstanding |
| 2 | Amount is less than $0.005. |
| 3 | During the year ended September 30, 2020, the Fund received a payment from an affiliate which had a 1.69% impact on the total return. See Note 4 in the Notes to Financial Statements for additional information. |
The accompanying notes are an integral part of these financial statements.
Wells Fargo Common Stock Fund | 21
Table of Contents
Financial highlights
(For a share outstanding throughout each period)
| Year ended September 30 | ||||||||||||||||||||
| INSTITUTIONAL CLASS | 2020 | 2019 | 2018 | 2017 | 2016 | |||||||||||||||
Net asset value, beginning of period | $22.32 | $25.73 | $24.97 | $22.20 | $22.16 | |||||||||||||||
Net investment income | 0.05 | 1 | 0.08 | 1 | 0.05 | 1 | 0.00 | 1,2 | 0.06 | 1 | ||||||||||
Net realized and unrealized gains (losses) on investments | (0.56 | ) | (0.19 | ) | 3.25 | 3.60 | 2.54 | |||||||||||||
|
|
|
|
|
|
|
|
|
| |||||||||||
Total from investment operations | (0.51 | ) | (0.11 | ) | 3.30 | 3.60 | 2.60 | |||||||||||||
Distributions to shareholders from | ||||||||||||||||||||
Net investment income | (0.08 | ) | 0.00 | 0.00 | 0.00 | 0.00 | ||||||||||||||
Net realized gains | (2.64 | ) | (3.30 | ) | (2.54 | ) | (0.83 | ) | (2.56 | ) | ||||||||||
|
|
|
|
|
|
|
|
|
| |||||||||||
Total distributions to shareholders | (2.72 | ) | (3.30 | ) | (2.54 | ) | (0.83 | ) | (2.56 | ) | ||||||||||
Net asset value, end of period | $19.09 | $22.32 | $25.73 | $24.97 | $22.20 | |||||||||||||||
Total return | (3.13 | )% | 1.31 | % | 14.12 | % | 16.55 | % | 12.88 | % | ||||||||||
Ratios to average net assets (annualized) | ||||||||||||||||||||
Gross expenses | 0.94 | % | 0.93 | % | 0.92 | % | 0.92 | % | 0.92 | % | ||||||||||
Net expenses | 0.85 | % | 0.85 | % | 0.85 | % | 0.85 | % | 0.85 | % | ||||||||||
Net investment income | 0.24 | % | 0.37 | % | 0.21 | % | 0.02 | % | 0.28 | % | ||||||||||
Supplemental data | ||||||||||||||||||||
Portfolio turnover rate | 61 | % | 40 | % | 33 | % | 35 | % | 32 | % | ||||||||||
Net assets, end of period (000s omitted) | $126,279 | $159,426 | $172,197 | $167,552 | $173,175 | |||||||||||||||
| 1 | Calculated based upon average shares outstanding |
| 2 | Amount is less than $0.005. |
The accompanying notes are an integral part of these financial statements.
22 | Wells Fargo Common Stock Fund
Table of Contents
1. ORGANIZATION
Wells Fargo Funds Trust (the “Trust”), a Delaware statutory trust organized on March 10, 1999, is an open-end management investment company registered under the Investment Company Act of 1940, as amended (the “1940 Act”). As an investment company, the Trust follows the accounting and reporting guidance in Financial Accounting Standards Board (“FASB”) Accounting Standards Codification Topic 946, Financial Services – Investment Companies. These financial statements report on the Wells Fargo Common Stock Fund (the “Fund”) which is a diversified series of the Trust.
2. SIGNIFICANT ACCOUNTING POLICIES
The following significant accounting policies, which are consistently followed in the preparation of the financial statements of the Fund, are in conformity with U.S. generally accepted accounting principles which require management to make estimates and assumptions that affect the reported amounts of assets and liabilities, disclosure of contingent assets and liabilities at the date of the financial statements, and the reported amounts of revenues and expenses during the reporting period. Actual results could differ from those estimates.
Securities valuation
All investments are valued each business day as of the close of regular trading on the New York Stock Exchange (generally 4 p.m. Eastern Time), although the Fund may deviate from this calculation time under unusual or unexpected circumstances.
Equity securities that are listed on a foreign or domestic exchange or market are valued at the official closing price or, if none, the last sales price. If no sale occurs on the principal exchange or market that day, a fair value price will be determined in accordance with the Fund’s Valuation Procedures.
The values of securities denominated in foreign currencies are translated into U.S. dollars at rates provided by an independent foreign currency pricing source at a time each business day specified by the Wells Fargo Asset Management Pricing Committee at Wells Fargo Funds Management, LLC (“Funds Management”).
Many securities markets and exchanges outside the U.S. close prior to the close of the New York Stock Exchange and therefore may not fully reflect trading or events that occur after the close of the principal exchange in which the foreign securities are traded, but before the close of the New York Stock Exchange. If such trading or events are expected to materially affect the value of such securities, then fair value pricing procedures approved by the Board of Trustees of the Fund are applied. These procedures take into account multiple factors including movements in U.S. securities markets after foreign exchanges close. Foreign securities that are fair valued under these procedures are categorized as Level 2 and the application of these procedures may result in transfers between Level 1 and Level 2. Depending on market activity, such fair valuations may be frequent. Such fair value pricing may result in net asset values that are higher or lower than net asset values based on the last reported sales price or latest quoted bid price. On September 30, 2020, such fair value pricing was used in pricing certain foreign securities.
Investments in registered open-end investment companies are valued at net asset value. Interests in non-registered investment companies that are redeemable at net asset value are fair valued normally at net asset value.
Investments which are not valued using any of the methods discussed above are valued at their fair value, as determined in good faith by the Board of Trustees. The Board of Trustees has established a Valuation Committee comprised of the Trustees and has delegated to it the authority to take any actions regarding the valuation of portfolio securities that the Valuation Committee deems necessary or appropriate, including determining the fair value of portfolio securities, unless the determination has been delegated to the Wells Fargo Asset Management Pricing Committee. The Board of Trustees retains the authority to make or ratify any valuation decisions or approve any changes to the Valuation Procedures as it deems appropriate. On a quarterly basis, the Board of Trustees receives reports on any valuation actions taken by the Valuation Committee or the Wells Fargo Asset Management Pricing Committee which may include items for ratification.
Foreign currency translation
The accounting records of the Fund are maintained in U.S. dollars. The values of other assets and liabilities denominated in foreign currencies are translated into U.S. dollars at rates provided by an independent foreign currency pricing source at a time each business day specified by the Wells Fargo Asset Management Pricing Committee. Purchases and sales of securities, and income and expenses are converted at the rate of exchange on the respective dates of such transactions. Net realized foreign exchange gains or losses arise from sales of foreign currencies, currency gains or losses realized between the trade and settlement dates on securities transactions, and the difference between the amounts of dividends, interest and foreign withholding taxes recorded and the U.S. dollar equivalent of the amounts actually paid or received. Net unrealized foreign exchange gains and losses arise from changes in the fair value of assets and liabilities other than investments in securities resulting from changes in exchange rates. The changes in net assets arising from changes in exchange rates of securities and the changes in net assets resulting from changes in market prices of securities are not separately presented. Such changes are included in net realized and unrealized gains or losses from investments.
Wells Fargo Common Stock Fund | 23
Table of Contents
Notes to financial statements
Securities lending
The Fund may lend its securities from time to time in order to earn additional income in the form of fees or interest on securities received as collateral or the investment of any cash received as collateral. When securities are on loan, the Fund receives interest or dividends on those securities. Cash collateral received in connection with its securities lending transactions is invested in Securities Lending Cash Investments, LLC (the “Securities Lending Fund”). Investments in Securities Lending Fund are valued at the evaluated bid price provided by an independent pricing service. Income earned from investment in the Securities Lending Fund (net of fees and rebates), if any, is included in income from affiliated securities on the Statement of Operations.
In a securities lending transaction, the net asset value of the Fund is affected by an increase or decrease in the value of the securities loaned and by an increase or decrease in the value of the instrument in which collateral is invested. The amount of securities lending activity undertaken by the Fund fluctuates from time to time. The Fund has the right under the lending agreement to recover the securities from the borrower on demand. In the event of default or bankruptcy by the borrower, the Fund may be prevented from recovering the loaned securities or gaining access to the collateral or may experience delays or costs in doing so. In such an event, the terms of the agreement allows the unaffiliated securities lending agent to use the collateral to purchase replacement securities on behalf of the Fund or pay the Fund the market value of the loaned securities. The Fund bears the risk of loss with respect to depreciation of its investment of the cash collateral.
Security transactions and income recognition
Securities transactions are recorded on a trade date basis. Realized gains or losses are recorded on the basis of identified cost.
Dividend income is recognized on the ex-dividend date, except for certain dividends from foreign securities, which are recorded as soon as the custodian verifies the ex-dividend date. Dividend income from foreign securities is recorded net of foreign taxes withheld where recovery of such taxes is not assured.
Distributions to shareholders
Distributions to shareholders from net investment income and any net realized gains are recorded on the ex-dividend date and paid at least annually. Such distributions are determined in accordance with income tax regulations and may differ from U.S. generally accepted accounting principles. Dividend sources are estimated at the time of declaration. The tax character of distributions is determined as of the Fund’s fiscal year end. Therefore, a portion of the Fund’s distributions made prior to the Fund’s fiscal year end may be categorized as a tax return of capital at year end.
Federal and other taxes
The Fund intends to continue to qualify as a regulated investment company by distributing substantially all of its investment company taxable income and any net realized capital gains (after reduction for capital loss carryforwards) sufficient to relieve it from all, or substantially all, federal income taxes. Accordingly, no provision for federal income taxes was required.
The Fund’s income and federal excise tax returns and all financial records supporting those returns for the prior three fiscal years are subject to examination by the federal and Delaware revenue authorities. Management has analyzed the Fund’s tax positions taken on federal, state, and foreign tax returns for all open tax years and does not believe that there are any uncertain tax positions that require recognition of a tax liability.
As of September 30, 2020, the aggregate cost of all investments for federal income tax purposes was $725,142,845 and the unrealized gains (losses) consisted of:
Gross unrealized gains | $ | 214,080,616 | ||
Gross unrealized losses | (42,660,437 | ) | ||
Net unrealized gains | $ | 171,420,179 | ||
Reclassifications are made to the Fund’s capital accounts for permanent tax differences to reflect income and gains available for distribution (or available capital loss carryforwards) under federal income tax regulations. U.S. generally accepted accounting principles require that certain components of net assets be adjusted to reflect permanent differences between financial and tax reporting. These reclassifications have no effect on net assets or net asset values per share. At September 30, 2020, as a result of permanent book-to-tax differences, the following reclassification adjustments were made on the Statement of Assets and Liabilities:
| Paid-in capital | Total distributable earnings | |
| $(164,981) | $164,981 | |
24 | Wells Fargo Common Stock Fund
Table of Contents
Notes to financial statements
As of September 30, 2020, the Fund had current year net deferred post-October capital losses consisting of $23,458,101 in short-term losses which will be recognized on the first day of the following fiscal year.
As of September 30, 2020, the Fund had a qualified late-year ordinary loss of $908,184 which will be recognized on the first day of the following fiscal year.
Class allocations
The separate classes of shares offered by the Fund differ principally in applicable sales charges, distribution, shareholder servicing, and administration fees. Class specific expenses are charged directly to that share class. Investment income, common fund-level expenses, and realized and unrealized gains (losses) on investments are allocated daily to each class of shares based on the relative proportion of net assets of each class.
3. FAIR VALUATION MEASUREMENTS
Fair value measurements of investments are determined within a framework that has established a fair value hierarchy based upon the various data inputs utilized in determining the value of the Fund’s investments. The three-level hierarchy gives the highest priority to unadjusted quoted prices in active markets for identical assets or liabilities (Level 1) and the lowest priority to unobservable inputs (Level 3). The Fund’s investments are classified within the fair value hierarchy based on the lowest level of input that is significant to the fair value measurement. The inputs are summarized into three broad levels as follows:
| ∎ | Level 1 – quoted prices in active markets for identical securities |
| ∎ | Level 2 – other significant observable inputs (including quoted prices for similar securities, interest rates, prepayment speeds, credit risk, etc.) |
| ∎ | Level 3 – significant unobservable inputs (including the Fund’s own assumptions in determining the fair value of investments) |
The inputs or methodologies used for valuing investments in securities are not necessarily an indication of the risk associated with investing in those securities.
The following is a summary of the inputs used in valuing the Fund’s assets and liabilities as of September 30, 2020:
| Quoted prices (Level 1) | Other significant observable inputs (Level 2) | Significant (Level 3) | Total | |||||||||||||
Assets | ||||||||||||||||
Investments in: | ||||||||||||||||
Common stocks | ||||||||||||||||
Consumer discretionary | $ | 107,216,593 | $ | 0 | $ | 0 | $ | 107,216,593 | ||||||||
Consumer staples | 7,790,956 | 0 | 0 | 7,790,956 | ||||||||||||
Financials | 108,280,474 | 0 | 0 | 108,280,474 | ||||||||||||
Health care | 107,506,785 | 0 | 0 | 107,506,785 | ||||||||||||
Industrials | 192,841,834 | 11,683,017 | 0 | 204,524,851 | ||||||||||||
Information technology | 190,318,103 | 0 | 0 | 190,318,103 | ||||||||||||
Materials | 45,745,058 | 0 | 0 | 45,745,058 | ||||||||||||
Real estate | 98,253,431 | 0 | 0 | 98,253,431 | ||||||||||||
Exchange-traded funds | 11,075,028 | 0 | 0 | 11,075,028 | ||||||||||||
Short-term investments | ||||||||||||||||
Investment companies | 15,851,745 | 0 | 0 | 15,851,745 | ||||||||||||
Total assets | $ | 884,880,007 | $ | 11,683,017 | $ | 0 | $ | 896,563,024 | ||||||||
Additional sector, industry or geographic detail is included in the Portfolio of Investments.
For the year ended September 30, 2020, the Fund did not have any transfers into/out of Level 3.
4. TRANSACTIONS WITH AFFILIATES
Management fee
Funds Management, an indirect wholly owned subsidiary of Wells Fargo & Company (“Wells Fargo”), is the manager of the Fund and provides advisory and fund-level administrative services under an investment management agreement. Under the
Wells Fargo Common Stock Fund | 25
Table of Contents
Notes to financial statements
investment management agreement, Funds Management is responsible for, among other services, implementing the investment objectives and strategies of the Fund, supervising the subadviser and providing fund-level administrative services in connection with the Fund’s operations. As compensation for its services under the investment management agreement, Funds Management is entitled to receive a management fee at the following annual rate based on the Fund’s average daily net assets:
| Average daily net assets | Management fee | |||
First $500 million | 0.800 | % | ||
Next $500 million | 0.750 | |||
Next $1 billion | 0.700 | |||
Next $2 billion | 0.675 | |||
Next $1 billion | 0.650 | |||
Next $5 billion | 0.640 | |||
Over $10 billion | 0.630 | |||
For the year ended September 30, 2020, the management fee was equivalent to an annual rate of 0.77% of the Fund’s average daily net assets.
Funds Management has retained the services of a subadviser to provide daily portfolio management to the Fund. The fee for subadvisory services is borne by Funds Management. Wells Capital Management Incorporated (“WellsCap”), an affiliate of Funds Management and an indirect wholly owned subsidiary of Wells Fargo, is the subadviser to the Fund and is entitled to receive a fee from Funds Management at an annual rate starting at 0.45% and declining to 0.30% as the average daily net assets of the Fund increase.
Administration fees
Under a class-level administration agreement, Funds Management provides class-level administrative services to the Fund, which includes paying fees and expenses for services provided by the transfer agent, sub-transfer agents, omnibus account servicers and record-keepers. As compensation for its services under the class-level administration agreement, Funds Management receives an annual fee which is calculated based on the average daily net assets of each class as follows:
| Class-level administration fee | ||||
Class A, Class C | 0.21 | % | ||
Class R6 | 0.03 | |||
Administrator Class, Institutional Class | 0.13 | |||
Waivers and/or expense reimbursements
Funds Management has contractually waived and/or reimbursed management and administration fees to the extent necessary to maintain certain net operating expense ratios for the Fund. When each class of the Fund has exceeded its expense cap, Funds Management has waived fees and/or reimbursed expenses from fund-level expenses on a proportionate basis and then from class specific expenses. When only certain classes exceed their expense caps, waivers and/or reimbursements are applied against class specific expenses before fund-level expenses. Funds Management has committed through January 31, 2021 to waive fees and/or reimburse expenses to the extent necessary to cap the Fund’s expenses at 1.26% for Class A shares, 2.01% for Class C shares, 0.83% for Class R6 shares, 1.10% for Administrator Class shares, and 0.85% for Institutional Class shares. Prior to or after the commitment expiration date, the cap may be increased or the commitment to maintain the cap may be terminated only with the approval of the Board of Trustees. Prior to February 1, 2020, the Fund’s expenses were capped at 0.85% for Class R6 shares.
Other transactions
On September 30, 2020, Class C and Administrator Class of the Fund were reimbursed by Funds Management in the amount of $12,380 and $38,399, respectively. The reimbursements were made in connection with resolving certain fee reimbursements.
Distribution fee
The Trust has adopted a distribution plan for Class C shares of the Fund pursuant to Rule 12b-1 under the 1940 Act. A distribution fee is charged to Class C shares and paid to Wells Fargo Funds Distributor, LLC (“Funds Distributor”), the principal underwriter, at an annual rate of 0.75% of the average daily net assets of Class C shares.
26 | Wells Fargo Common Stock Fund
Table of Contents
Notes to financial statements
In addition, Funds Distributor is entitled to receive the front-end sales charge from the purchase of Class A shares and a contingent deferred sales charge on the redemption of certain Class A shares. Funds Distributor is also entitled to receive the contingent deferred sales charges from redemptions of Class C shares. For the year ended September 30, 2020, Funds Distributor received $1,598 from the sale of Class A shares. No contingent deferred sales charges were incurred by Class A and Class C shares for the year ended September 30, 2020.
Shareholder servicing fees
The Trust has entered into contracts with one or more shareholder servicing agents, whereby Class A, Class C, and Administrator Class of the Fund are charged a fee at an annual rate of 0.25% of the average daily net assets of each respective class. A portion of these total shareholder servicing fees were paid to affiliates of Wells Fargo.
Interfund transactions
The Fund may purchase or sell portfolio investment securities to certain other Wells Fargo affiliates pursuant to Rule 17a-7 under the 1940 Act and under procedures adopted by the Board of Trustees. The procedures have been designed to ensure that these interfund transactions, which do not incur broker commissions, are effected at current market prices.
5. INVESTMENT PORTFOLIO TRANSACTIONS
Purchases and sales of investments, excluding U.S. government obligations (if any) and short-term securities, for the year ended September 30, 2020 were $569,050,484 and $708,501,052, respectively.
6. SECURITIES LENDING TRANSACTIONS
The Fund lends its securities through an unaffiliated securities lending agent and receives collateral in the form of cash or securities with a value at least equal to the value of the securities on loan. The value of the loaned securities is determined at the close of each business day and any increases or decreases in the required collateral are exchanged between the Fund and the counterparty on the next business day. Cash collateral received is invested in the Securities Lending Fund which seeks to provide a positive return compared to the daily Fed Funds Open Rate by investing in high-quality, U.S. dollar-denominated short-term money market instruments and is exempt from registration under Section 3(c)(7) of the 1940 Act. Securities Lending Fund is managed by Funds Management and is subadvised by WellsCap. Funds Management receives an advisory fee starting at 0.05% and declining to 0.01% as the average daily net assets of the Securities Lending Fund increase. All of the fees received by Funds Management are paid to WellsCap for its services as subadviser.
In the event of counterparty default or the failure of a borrower to return a loaned security, the Fund has the right to use the collateral to offset any losses incurred. As of September 30, 2020, the Fund had securities lending transactions with the following counterparties which are subject to offset:
| Counterparty | Value of securities on loan | Collateral received1 | Net amount | |||||||||
BNP Paribas Securities Corp. | $ | 3,343,294 | $ | (3,343,294 | ) | $ | 0 | |||||
Credit Suisse Securities (USA) LLC | 2,228,600 | (2,228,600 | ) | 0 | ||||||||
SG Americas Securities LLC | 8,290,392 | (8,290,392 | ) | 0 | ||||||||
| 1 | Collateral received within this table is limited to the collateral for the net transaction with the counterparty. |
7. BANK BORROWINGS
The Trust (excluding the money market funds), Wells Fargo Master Trust and Wells Fargo Variable Trust are parties to a $350,000,000 revolving credit agreement whereby the Fund is permitted to use bank borrowings for temporary or emergency purposes, such as to fund shareholder redemption requests. Interest under the credit agreement is charged to the Fund based on a borrowing rate equal to the higher of the Federal Funds rate in effect on that day plus 1.25% or the overnight LIBOR rate in effect on that day plus 1.25%. In addition, an annual commitment fee equal to 0.25% of the unused balance is allocated to each participating fund.
For the year ended September 30, 2020, there were no borrowings by the Fund under the agreement.
Wells Fargo Common Stock Fund | 27
Table of Contents
Notes to financial statements
8. DISTRIBUTIONS TO SHAREHOLDERS
The tax character of distributions paid during the years ended September 30, 2020 and September 30, 2019 were as follows:
| Year ended September 30 | ||||||||
| 2020 | 2019 | |||||||
Ordinary income | $ | 11,024,481 | $ | 16,373,230 | ||||
Long-term capital gain | 120,876,454 | 140,999,070 | ||||||
As of September 30, 2020, the components of distributable earnings on a tax basis were as follows:
Undistributed long-term gain | Unrealized gains | Late-year ordinary losses deferred | Post-October capital losses deferred | |||
| $47,397,630 | $171,420,179 | $(908,184) | $(23,458,101) | |||
9. INDEMNIFICATION
Under the Fund’s organizational documents, the officers and Trustees have been granted certain indemnification rights against certain liabilities that may arise out of performance of their duties to the Fund. The Fund has entered into a separate agreement with each Trustee that converts indemnification rights currently existing under the Fund’s organizational documents into contractual rights that cannot be changed in the future without the consent of the Trustee. Additionally, in the normal course of business, the Fund may enter into contracts with service providers that contain a variety of indemnification clauses. The Fund’s maximum exposure under these arrangements is dependent on future claims that may be made against the Fund and, therefore, cannot be estimated.
10. NEW ACCOUNTING PRONOUNCEMENT
In August 2018, FASB issued Accounting Standards Update (“ASU”) No. 2018-13, Fair Value Measurement (Topic 820) Disclosure Framework—Changes to the Disclosure Requirements for Fair Value Measurement. ASU 2018-13 updates the disclosure requirements on fair value measurements in Topic 820, Fair Value Measurements. The amendments are effective for fiscal years, and interim periods within those fiscal years, beginning after December 15, 2019. Management has adopted this guidance which did not have a material impact on the financial statements.
11. CORONAVIRUS (COVID -19) PANDEMIC
On March 11, 2020, the World Health Organization announced that it had made the assessment that coronavirus disease 2019 (“COVID-19”) is a pandemic. The impacts of COVID-19 are adversely affecting the entire global economy, individual companies and investment products, and the market in general. There is significant uncertainty around the extent and duration of business disruptions related to COVID-19 and the impacts may be short term or may last for an extended period of time. The risk of further spreading of COVID-19 has led to significant uncertainty and volatility in the financial markets.
28 | Wells Fargo Common Stock Fund
Table of Contents
Report of independent registered public accounting firm
To the Shareholders of the Fund and Board of Trustees
Wells Fargo Funds Trust:
Opinion on the Financial Statements
We have audited the accompanying statement of assets and liabilities of Wells Fargo Common Stock Fund (the Fund), one of the funds constituting Wells Fargo Funds Trust, including the portfolio of investments, as of September 30, 2020, the related statement of operations for the year then ended, the statements of changes in net assets for each of the years in the two-year period then ended, and the related notes (collectively, the financial statements) and the financial highlights for each of the years in the five-year period then ended. In our opinion, the financial statements and financial highlights present fairly, in all material respects, the financial position of the Fund as of September 30, 2020, the results of its operations for the year then ended, the changes in its net assets for each of the years in the two-year period then ended, and the financial highlights for each of the years in the five-year period then ended, in conformity with U.S. generally accepted accounting principles.
Basis for Opinion
These financial statements and financial highlights are the responsibility of the Fund’s management. Our responsibility is to express an opinion on these financial statements and financial highlights based on our audits. We are a public accounting firm registered with the Public Company Accounting Oversight Board (United States) (PCAOB) and are required to be independent with respect to the Fund in accordance with the U.S. federal securities laws and the applicable rules and regulations of the Securities and Exchange Commission and the PCAOB.
We conducted our audits in accordance with the standards of the PCAOB. Those standards require that we plan and perform the audit to obtain reasonable assurance about whether the financial statements and financial highlights are free of material misstatement, whether due to error or fraud. Our audits included performing procedures to assess the risks of material misstatement of the financial statements and financial highlights, whether due to error or fraud, and performing procedures that respond to those risks. Such procedures included examining, on a test basis, evidence regarding the amounts and disclosures in the financial statements and financial highlights. Such procedures also included confirmation of securities owned as of September 30, 2020, by correspondence with the custodian, transfer agent and brokers. Our audits also included evaluating the accounting principles used and significant estimates made by management, as well as evaluating the overall presentation of the financial statements and financial highlights. We believe that our audits provide a reasonable basis for our opinion.

We have not been able to determine the specific year that we began serving as the auditor of one or more Wells Fargo Funds investment companies; however we are aware that we have served as the auditor of one or more Wells Fargo Funds investment companies since at least 1955.
Boston, Massachusetts
November 24, 2020
Wells Fargo Common Stock Fund | 29
Table of Contents
TAX INFORMATION
For corporate shareholders, pursuant to Section 854 of the Internal Revenue Code, 100% of ordinary income dividends qualify for the corporate dividends-received deduction for the fiscal year ended September 30, 2020.
Pursuant to Section 852 of the Internal Revenue Code, $120,876,454 was designated as a 20% rate gain distribution for the fiscal year ended September 30, 2020.
Pursuant to Section 854 of the Internal Revenue Code, $11,024,481 of income dividends paid during the fiscal year ended September 30, 2020 has been designated as qualified dividend income (QDI).
For the fiscal year ended September 30, 2020, $16,791 has been designated as interest-related dividends for nonresident alien shareholders pursuant to Section 871 of the Internal Revenue Code.
For the fiscal year ended September 30, 2020, $5,751,461 has been designated as short-term capital gain dividends for nonresident alien shareholders pursuant to Section 871 of the Internal Revenue Code.
PROXY VOTING INFORMATION
A description of the policies and procedures used to determine how to vote proxies relating to portfolio securities is available, upon request, by calling 1-800-222-8222, visiting our website at wfam.com, or visiting the SEC website at sec.gov. Information regarding how the proxies related to portfolio securities were voted during the most recent 12-month period ended June 30 is available on the website at wfam.com or by visiting the SEC website at sec.gov.
QUARTERLY PORTFOLIO HOLDINGS INFORMATION
The Fund files its complete schedule of portfolio holdings with the SEC for the first and third quarters of each fiscal year as an exhibit to its reports on Form N-PORT. Shareholders may view the filed Form N-PORT by visiting the SEC website at sec.gov.
30 | Wells Fargo Common Stock Fund
Table of Contents
Other information (unaudited)
BOARD OF TRUSTEES AND OFFICERS
Each of the Trustees and Officers1 listed in the table below acts in identical capacities for each fund in the Wells Fargo family of funds, which consists of 142 mutual funds comprising the Wells Fargo Funds Trust, Wells Fargo Variable Trust, Wells Fargo Master Trust and four closed-end funds (collectively the “Fund Complex”). This table should be read in conjunction with the Prospectus and the Statement of Additional Information2. The mailing address of each Trustee and Officer is 525 Market Street, 12th Floor, San Francisco, CA 94105. Each Trustee and Officer serves an indefinite term, however, each Trustee serves such term until reaching the mandatory retirement age established by the Trustees.
Independent Trustees
Name and year of birth | Position held and length of service* | Principal occupations during past five years or longer | Current other public company or investment company directorships | |||
William R. Ebsworth (Born 1957) | Trustee, since 2015 | Retired. From 1984 to 2013, equities analyst, portfolio manager, research director and chief investment officer at Fidelity Management and Research Company in Boston, Tokyo, and Hong Kong, and retired in 2013 as Chief Investment Officer of Fidelity Strategic Advisers, Inc. where he led a team of investment professionals managing client assets. Prior thereto, Board member of Hong Kong Securities Clearing Co., Hong Kong Options Clearing Corp., the Thailand International Fund, Ltd., Fidelity Investments Life Insurance Company, and Empire Fidelity Investments Life Insurance Company. Audit Committee Chair and Investment Committee Chair of the Vincent Memorial Hospital Endowment (non-profit organization). Mr. Ebsworth is a CFA® charterholder. | N/A | |||
Jane A. Freeman (Born 1953) | Trustee, since 2015; Chair Liaison, since 2018 | Retired. From 2012 to 2014 and 1999 to 2008, Chief Financial Officer of Scientific Learning Corporation. From 2008 to 2012, Ms. Freeman provided consulting services related to strategic business projects. Prior to 1999, Portfolio Manager at Rockefeller & Co. and Scudder, Stevens & Clark. Board member of the Harding Loevner Funds from 1996 to 2014, serving as both Lead Independent Director and chair of the Audit Committee. Board member of the Russell Exchange Traded Funds Trust from 2011 to 2012 and the chair of the Audit Committee. Ms. Freeman is also an inactive Chartered Financial Analyst. | N/A | |||
Isaiah Harris, Jr. (Born 1952) | Trustee, since 2009; Audit Committee Chairman, since 2019 | Retired. Chairman of the Board of CIGNA Corporation since 2009, and Director since 2005. From 2003 to 2011, Director of Deluxe Corporation. Prior thereto, President and CEO of BellSouth Advertising and Publishing Corp. from 2005 to 2007, President and CEO of BellSouth Enterprises from 2004 to 2005 and President of BellSouth Consumer Services from 2000 to 2003. Emeritus member of the Iowa State University Foundation Board of Governors. Emeritus Member of the Advisory Board of Iowa State University School of Business. Advisory Board Member, Palm Harbor Academy (private school). Mr. Harris is a certified public accountant (inactive status). | CIGNA Corporation | |||
Judith M. Johnson (Born 1949) | Trustee, since 2008 | Retired. Prior thereto, Chief Executive Officer and Chief Investment Officer of Minneapolis Employees Retirement Fund from 1996 to 2008. Ms. Johnson is an attorney, certified public accountant and a certified managerial accountant. | N/A | |||
David F. Larcker (Born 1950) | Trustee, since 2009 | James Irvin Miller Professor of Accounting at the Graduate School of Business (Emeritus), Stanford University, Director of the Corporate Governance Research Initiative and Senior Faculty of The Rock Center for Corporate Governance since 2006. From 2005 to 2008, Professor of Accounting at the Graduate School of Business, Stanford University. Prior thereto, Ernst & Young Professor of Accounting at The Wharton School, University of Pennsylvania from 1985 to 2005. | N/A | |||
Wells Fargo Common Stock Fund | 31
Table of Contents
Other information (unaudited)
Name and year of birth | Position held and length of service* | Principal occupations during past five years or longer | Current other public company or investment company directorships | |||
Olivia S. Mitchell (Born 1953) | Trustee, since 2006; Nominating and Governance Committee Chair, since 2018 | International Foundation of Employee Benefit Plans Professor, Wharton School of the University of Pennsylvania since 1993. Director of Wharton’s Pension Research Council and Boettner Center on Pensions & Retirement Research, and Research Associate at the National Bureau of Economic Research. Previously, Cornell University Professor from 1978 to 1993. | N/A | |||
Timothy J. Penny (Born 1951) | Trustee, since 1996; Chairman, since 2018 | President and Chief Executive Officer of Southern Minnesota Initiative Foundation, a non-profit organization, since 2007. Member of the Board of Trustees of NorthStar Education Finance, Inc., a non-profit organization, since 2007. | N/A | |||
James G. Polisson (Born 1959) | Trustee, since 2018 | Retired. Chief Marketing Officer, Source (ETF) UK Services, Ltd, from 2015 to 2017. From 2012 to 2015, Principal of The Polisson Group, LLC, a management consulting, corporate advisory and principal investing company. Chief Executive Officer and Managing Director at Russell Investments, Global Exchange Traded Funds from 2010 to 2012. Managing Director of Barclays Global Investors from 1998 to 2010 and Global Chief Marketing Officer for iShares and Barclays Global Investors from 2000 to 2010. Trustee of the San Francisco Mechanics’ Institute, a non-profit organization, from 2013 to 2015. Board member of the Russell Exchange Traded Fund Trust from 2011 to 2012. Director of Barclays Global Investors Holdings Deutschland GmbH from 2006 to 2009. Mr. Polisson is an attorney and has a retired status with the Massachusetts and District of Columbia Bar Associations. | N/A | |||
Pamela Wheelock (Born 1959) | Trustee, since January 2020; previously Trustee from January 2018 to July 2019 | Board member of the Destination Medical Center Economic Development Agency, Rochester, Minnesota since 2019. Interim President of the McKnight Foundation from January to September 2020. Acting Commissioner, Minnesota Department of Human Services, July 2019 through September 2019. Human Services Manager (part-time), Minnesota Department of Human Services, October 2019 through December 2019. Chief Operating Officer, Twin Cities Habitat for Humanity from 2017 to 2019. Vice President of University Services, University of Minnesota from 2012 to 2016. Prior thereto, on the Board of Directors, Governance Committee and Finance Committee for the Minnesota Philanthropy Partners (Saint Paul Foundation) from 2012 to 2018, Interim Chief Executive Officer of Blue Cross Blue Shield of Minnesota from 2011 to 2012, Chairman of the Board from 2009 to 2012 and Board Director from 2003 to 2015. Vice President, Leadership and Community Engagement, Bush Foundation, Saint Paul, Minnesota (a private foundation) from 2009 to 2011. Executive Vice President and Chief Financial Officer, Minnesota Sports and Entertainment from 2004 to 2009 and Senior Vice President from 2002 to 2004. Executive Vice President of the Minnesota Wild Foundation from 2004 to 2008. Commissioner of Finance, State of Minnesota, from 1999 to 2002. Currently Board Chair of the Minnesota Wild Foundation since 2010. | N/A | |||
| * | Length of service dates reflect the Trustee’s commencement of service with the Trust’s predecessor entities, where applicable. |
32 | Wells Fargo Common Stock Fund
Table of Contents
Other information (unaudited)
Officers
Name and year of birth | Position held and length of service | Principal occupations during past five years or longer | ||
Andrew Owen (Born 1960) | President, since 2017 | Executive Vice President of Wells Fargo & Company and Head of Affiliated Managers, Wells Fargo Asset Management, since 2014. In addition, Mr. Owen is currently President, Chief Executive Officer and Director of Wells Fargo Funds Management, LLC since 2017. Prior thereto, Executive Vice President responsible for marketing, investments and product development for Wells Fargo Funds Management, LLC, from 2009 to 2014. | ||
Nancy Wiser1 (Born 1967) | Treasurer, since 2012 | Executive Vice President of Wells Fargo Funds Management, LLC since 2011. Chief Operating Officer and Chief Compliance Officer at LightBox Capital Management LLC, from 2008 to 2011. | ||
Michelle Rhee (Born 1966) | Chief Legal Officer, since 2019 | Secretary of Wells Fargo Funds Management, LLC, Chief Legal Counsel of Wells Fargo Asset Management and Assistant General Counsel of Wells Fargo Bank, N.A. since 2018. Associate General Counsel and Managing Director of Bank of America Corporation from 2004 to 2018. | ||
Catherine Kennedy (Born 1969) | Secretary, since 2019 | Vice President of Wells Fargo Funds Management, LLC and Senior Counsel of the Wells Fargo Legal Department since 2010. Vice President and Senior Counsel of Evergreen Investment Management Company, LLC from 1998 to 2010. | ||
Michael H. Whitaker (Born 1967) | Chief Compliance Officer, since 2016 | Chief Compliance Officer of Wells Fargo Asset Management since 2016. Senior Vice President and Chief Compliance Officer for Fidelity Investments from 2007 to 2016. | ||
Jeremy DePalma1 (Born 1974) | Assistant Treasurer, since 2009 | Senior Vice President of Wells Fargo Funds Management, LLC since 2009. Senior Vice President of Evergreen Investment Management Company, LLC from 2008 to 2010 and head of the Fund Reporting and Control Team within Fund Administration from 2005 to 2010. | ||
| 1 | Nancy Wiser acts as Treasurer of 65 funds in the Fund Complex. Jeremy DePalma acts as the Treasurer of 77 funds and Assistant Treasurer of 65 funds in the Fund Complex. |
| 2 | The Statement of Additional Information includes additional information about the Trustees and is available, without charge, upon request, by calling 1-800-222-8222 or by visiting the website at wfam.com. |
Wells Fargo Common Stock Fund | 33
Table of Contents
Other information (unaudited)
BOARD CONSIDERATION OF INVESTMENT MANAGEMENT AND SUB-ADVISORY AGREEMENTS:
Wells Fargo Common Stock Fund
Under the Investment Company Act of 1940 (the “1940 Act”), the Board of Trustees (the “Board”) of Wells Fargo Funds Trust (the “Trust”) must determine annually whether to approve the continuation of the Trust’s investment management and sub-advisory agreements. In this regard, at a Board meeting held on May 26, 2020 and May 28, 2020 (together, the “Meeting”), the Board, all the members of which have no direct or indirect interest in the investment management and sub-advisory agreements and are not “interested persons” of the Trust, as defined in the 1940 Act (the “Independent Trustees”), reviewed and approved for Wells Fargo Common Stock Fund (the “Fund”): (i) an investment management agreement (the “Management Agreement”) with Wells Fargo Funds Management, LLC (“Funds Management”); and (ii) an investment sub-advisory agreement (the “Sub-Advisory Agreement”) with Wells Capital Management Incorporated (the “Sub-Adviser”), an affiliate of Funds Management. The Management Agreement and the Sub-Advisory Agreement are collectively referred to as the “Advisory Agreements.”
At the Meeting, the Board considered the factors and reached the conclusions described below relating to the selection of Funds Management and the Sub-Adviser and the approval of the Advisory Agreements. Prior to the Meeting, including at a Board meeting held in April 2020, the Trustees conferred extensively among themselves and with representatives of Funds Management about these matters. Also, the Board has adopted a team-based approach, with each team consisting of a sub-set of Trustees, to assist the full Board in the discharge of its duties in reviewing investment performance and other matters throughout the year. The Independent Trustees were assisted in their evaluation of the Advisory Agreements by independent legal counsel, from whom they received separate legal advice and with whom they met separately.
In providing information to the Board, Funds Management and the Sub-Adviser were guided by a detailed set of requests for information submitted to them by independent legal counsel on behalf of the Independent Trustees at the start of the Board’s annual contract renewal process earlier in 2020. In considering and approving the Advisory Agreements, the Trustees considered the information they believed relevant, including but not limited to the information discussed below. The Board considered not only the specific information presented in connection with the Meeting, but also the knowledge gained over time through interaction with Funds Management and the Sub-Adviser about various topics. In this regard, the Board reviewed reports of Funds Management at each of its quarterly meetings, which included, among other things, portfolio reviews and investment performance reports. In addition, the Board and the teams mentioned above confer with portfolio managers at various times throughout the year. The Board did not identify any particular information or consideration that was all-important or controlling, and each individual Trustee may have attributed different weights to various factors.
After its deliberations, the Board unanimously approved the continuation of the Advisory Agreements for a one-year term and determined that the compensation payable to Funds Management and the Sub-Adviser under each of the Advisory Agreements was reasonable. The Board considered the approval of the Advisory Agreements for the Fund as part of its consideration of agreements for funds across the complex, but its approvals were made on a fund-by-fund basis. The following summarizes a number of important, but not necessarily all, factors considered by the Board in support of its approvals.
Nature, extent and quality of services
The Board received and considered various information regarding the nature, extent and quality of services provided to the Fund by Funds Management and the Sub-Adviser under the Advisory Agreements. This information included a description of the investment advisory services and Fund-level administrative services covered by the Management Agreement, as well as, among other things, a summary of the background and experience of senior management of Wells Fargo Asset Management (“WFAM”), of which Funds Management and the Sub-Adviser are a part, and a summary of investments made in the business of WFAM. The Board also received a description of Funds Management’s and the Sub-Adviser’s business continuity plans and of their approaches to data privacy and cybersecurity, and related testing. The Board also received and reviewed information about Funds Management’s role as administrator of the Fund’s liquidity risk management program, Funds Management’s approach to risk management, and Funds Management’s intermediary and vendor oversight program.
The Board also considered the qualifications, background, tenure and responsibilities of each of the portfolio managers primarily responsible for the day-to-day portfolio management of the Fund. The Board evaluated the ability of Funds Management and the Sub-Adviser to attract and retain qualified investment professionals, including research, advisory and supervisory personnel. The Board further considered the compliance programs and compliance records of Funds Management and the Sub-Adviser. In addition, the Board took into account the full range of services provided to the Fund by Funds Management and its affiliates.
34 | Wells Fargo Common Stock Fund
Table of Contents
Other information (unaudited)
Fund investment performance and expenses
The Board considered the investment performance results for the Fund over various time periods ended December 31, 2019. The Board also considered more current results for various time periods ended March 31, 2020. The Board considered these results in comparison to the investment performance of funds in a universe that was determined by Broadridge Inc. (“Broadridge”) to be similar to the Fund (the “Universe”), and in comparison to the Fund’s benchmark index and to other comparative data. Broadridge is an independent provider of investment company data. The Board received a description of the methodology used by Broadridge to select the mutual funds in the performance Universe. The Board noted that the investment performance of the Fund (Class A) was in range of or higher than the average investment performance of the Universe for the one-, three-, five- and ten-year periods ended December 31, 2019. The Board also noted that the investment performance of the Fund (Administrator Class) was in range of or higher than the average investment performance of the Universe for the three-, five- and ten-year periods ended March 31, 2020, and lower than the average investment performance of the Universe for the one-year period ended March 31, 2020. The Board also noted that the investment performance of the Fund was in range of or higher than its benchmark index, the Russell 2500™ Index, for the three- and five-year periods ended December 31, 2019, and lower than its benchmark for the one- and ten-year periods ended December 31, 2019. The Board also noted that the investment performance of the Fund was lower than its benchmark index, the Russell 2500™ Index, for all periods ended March 31, 2020.
The Board received information concerning, and discussed factors contributing to, the underperformance of the Fund relative to the Universe and benchmark for the periods identified above. The Board took note of the explanations for the relative underperformance during these periods, including with respect to investment decisions that affected the Fund’s investment performance.
The Board also received and considered information regarding the Fund’s net operating expense ratios and their various components, including actual management fees, custodian and other non-management fees, and Rule 12b-1 and non-Rule 12b-1 shareholder service fees. The Board considered these ratios in comparison to the median ratios of funds in class-specific expense groups that were determined by Broadridge to be similar to the Fund (the “Groups”). The Board received a description of the methodology used by Broadridge to select the mutual funds in the expense Groups and an explanation of how funds comprising expense groups and their expense ratios may vary from year-to-year. Based on the Broadridge reports, the Board noted that the net operating expense ratios of the Fund were lower than or in range of the median net operating expense ratios of the expense Groups for each share class.
The Board took into account the Fund’s investment performance and expense information provided to it among the factors considered in deciding to re-approve the Advisory Agreements.
Investment management and sub-advisory fee rates
The Board reviewed and considered the contractual fee rates payable by the Fund to Funds Management under the Management Agreement, as well as the contractual fee rates payable by the Fund to Funds Management for class-level administrative services under a Class-Level Administration Agreement, which include, among other things, class-level transfer agency and sub-transfer agency costs (collectively, the “Management Rates”). The Board also reviewed and considered the contractual investment sub-advisory fee rates that are payable by Funds Management to the Sub-Adviser for investment sub-advisory services.
Among other information reviewed by the Board was a comparison of the Fund’s Management Rates with the average contractual investment management fee rates of funds in the expense Groups at a common asset level as well as transfer agency costs of the funds in the expense Groups. The Board noted that the Management Rates of the Fund were in range of the sum of these average rates for the Fund’s expense Groups for all share classes.
The Board also received and considered information about the portion of the total management fee that was retained by Funds Management after payment of the fee to the Sub-Adviser for sub-advisory services. In assessing the reasonableness of this amount, the Board received and evaluated information about the nature and extent of responsibilities retained and risks assumed by Funds Management and not delegated to or assumed by the Sub-Adviser, and about Funds Management’s on-going oversight services. Given the affiliation between Funds Management and the Sub-Adviser, the Board ascribed limited relevance to the allocation of fees between them.
The Board also received and considered information about the nature and extent of services offered and fee rates charged by Funds Management and the Sub-Adviser to other types of clients with investment strategies similar to those of the Fund. In this regard, the Board received information about the significantly greater scope of services, and compliance, reporting and other legal burdens and risks of managing proprietary mutual funds compared with those associated with managing assets of other types of clients, including third-party sub-advised fund clients and non-mutual fund clients such as institutional separate accounts.
Wells Fargo Common Stock Fund | 35
Table of Contents
Other information (unaudited)
Based on its consideration of the factors and information it deemed relevant, including those described here, the Board determined that the compensation payable to Funds Management under the Management Agreement and to the Sub-Adviser under the Sub-Advisory Agreement was reasonable.
Profitability
The Board received and considered information concerning the profitability of Funds Management, as well as the profitability of both WFAM and Wells Fargo & Co. (“Wells Fargo”) from providing services to the fund family as a whole. The Board noted that the Sub-Adviser’s profitability information with respect to providing services to the Fund and other funds in the family was subsumed in the WFAM and Wells Fargo profitability analysis.
Funds Management reported on the methodologies and estimates used in calculating profitability, including a description of the methodology used to allocate certain expenses. Among other things, the Board noted that the levels of profitability reported on a fund-by-fund basis varied widely, depending on factors such as the size, type and age of fund.
Based on its review, the Board did not deem the profits reported by Funds Management, WFAM or Wells Fargo from services provided to the Fund to be at a level that would prevent it from approving the continuation of the Advisory Agreements.
Economies of scale
The Board received and considered information about the potential for Funds Management to experience economies of scale in the provision of management services to the Fund, the difficulties of calculating economies of scale at an individual fund level, and the extent to which potential scale benefits are shared with shareholders. The Board noted the existence of breakpoints in the Fund’s management fee structure, which operate generally to reduce the Fund’s expense ratios as the Fund grows in size, and the size of the Fund in relation to such breakpoints. The Board considered that in addition to management fee breakpoints, Funds Management shares potential economies of scale from its management business in a variety of ways, including through fee waiver and expense reimbursement arrangements, services that benefit shareholders, competitive management fee rates set at the outset without regard to breakpoints, and investments in the business intended to enhance services available to shareholders.
The Board concluded that Funds Management’s arrangements with respect to the Fund, including contractual breakpoints, constituted a reasonable approach to sharing potential economies of scale with the Fund and its shareholders.
Other benefits to Funds Management and the Sub-Adviser
The Board received and considered information regarding potential “fall-out” or ancillary benefits received by Funds Management and its affiliates, including the Sub-Adviser, as a result of their relationships with the Fund. Ancillary benefits could include, among others, benefits directly attributable to other relationships with the Fund and benefits potentially derived from an increase in Funds Management’s and the Sub-Adviser’s business as a result of their relationships with the Fund. The Board noted that various affiliates of Funds Management may receive distribution-related fees, shareholder servicing payments and sub-transfer agency fees in respect of shares sold or held through them and services provided.
The Board also reviewed information about soft dollar credits earned and utilized by the Sub-Adviser, fees earned by Funds Management and the Sub-Adviser from managing a private investment vehicle for the fund family’s securities lending collateral, and commissions earned by an affiliated broker from portfolio transactions.
Based on its consideration of the factors and information it deemed relevant, including those described here, the Board did not find that any ancillary benefits received by Funds Management and its affiliates, including the Sub-Adviser, were unreasonable.
Conclusion
At the Meeting, after considering the above-described factors and based on its deliberations and its evaluation of the information described above, the Board unanimously approved the continuation of the Advisory Agreements for a one-year term and determined that the compensation payable to Funds Management and the Sub-Adviser under each of the Advisory Agreements was reasonable.
36 | Wells Fargo Common Stock Fund
Table of Contents
Other information (unaudited)
LIQUIDITY RISK MANAGEMENT PROGRAM
In accordance with Rule 22e-4 under the Investment Company Act of 1940, as amended (the “Liquidity Rule”), Wells Fargo Funds Trust (the “Trust”) has adopted and implemented a liquidity risk management program (the “Program”) on behalf of each of its series, including the Fund, which is reasonably designed to assess and manage the Fund’s liquidity risk. “Liquidity risk” is defined as the risk that the Fund is unable to meet redemption requests without significantly diluting remaining investors’ interests in the Fund. The Trust’s Board of Trustees (the “Board”) previously approved the designation of Wells Fargo Funds Management, LLC (“Funds Management”), the Fund’s investment manager, as the administrator of the Program, and Funds Management has established a Liquidity Risk Management Council composed of personnel from multiple departments within Funds Management and its affiliates to assist Funds Management in the implementation and on-going administration of the Program.
The Program is comprised of various components designed to support the assessment and/or management of liquidity risk, including: (1) the periodic assessment (no less frequently than annually) of certain factors that influence the Fund’s liquidity risk; (2) the periodic classification (no less frequently than monthly) of the Fund’s investments into one of four liquidity categories that reflect an estimate of their liquidity under current market conditions; (3) a 15% limit on the acquisition of “illiquid investments” (as defined under the Liquidity Rule); (4) to the extent the Fund does not invest primarily in “highly liquid investments” (as defined under the Liquidity Rule), the determination of a minimum percentage of the Fund’s assets that generally will be invested in highly liquid investments (an “HLIM”); (5) if the Fund has established an HLIM, the periodic review (no less frequently than annually) of the HLIM and the adoption of policies and procedures for responding to a shortfall of the Fund’s “highly liquid investments” below its HLIM; and (6) periodic reporting to the Board.
At a meeting of the Board held on May 26 and 28, 2020, the Board received a written report (the “Report”) from Funds Management that addressed the operation of the Program and assessed its adequacy and effectiveness of implementation. The Report covered the initial period from December 1, 2018 through December 31, 2019 (the “Reporting Period”). No significant liquidity events impacting the Fund were noted in the Report. There were no material changes to the Program during the Reporting Period. The Report concluded that the Program is operating effectively to assess and manage the Fund’s liquidity risk, and that the Program has been and continues to be adequately and effectively implemented to monitor and, as applicable, respond to the Fund’s liquidity developments.
There can be no assurance that the Program will achieve its objectives under all circumstances in the future. Please refer to the Fund’s prospectus for more information regarding the Fund’s exposure to liquidity risk and other risks to which an investment in the Fund may be subject.
Wells Fargo Common Stock Fund | 37
Table of Contents
Effective June 1, 2020, shareholders purchasing Fund shares through an Oppenheimer & Co. Inc. (“Oppenheimer”) platform or account are eligible only for the following load waivers (front-end sales charge waivers and contingent deferred or back-end, sales charge waivers) and discounts, which may differ from those disclosed in the Fund’s Prospectus or SAI.
| Front-end Sales Load Waivers on Class A Shares available at Oppenheimer |
| Employer-sponsored retirement, deferred compensation and employee benefit plans (including health savings accounts) and trusts used to fund those plans, provided that the shares are not held in a commission-based brokerage account and shares are held for the benefit of the plan. |
| Shares purchased by or through a 529 Plan. |
| Shares purchased through an Oppenheimer affiliated investment advisory program. |
| Shares purchased through reinvestment of capital gains distributions and dividend reinvestment when purchasing shares of the same fund (but not any other fund within the fund family). |
| Shares purchased from the proceeds of redemptions within the same fund family, provided (1) the repurchase occurs within 90 days following the redemption, (2) the redemption and purchase occur in the same account, and (3) redeemed shares were subject to a front-end or deferred sales load (known as Rights of Restatement). |
| A shareholder in the Fund’s Class C shares will have their shares exchanged at net asset value to Class A shares (or the appropriate share class) of the Fund if the shares are no longer subject to a CDSC and the exchange is in line with the policies and procedures of Oppenheimer. |
| Employees and registered representatives of Oppenheimer or its affiliates and their family members. |
| Directors or Trustees of the Fund, and employees of the Fund’s investment adviser or any of its affiliates, as described in the Prospectus. |
| CDSC Waivers on A and C Shares available at Oppenheimer |
| Death or disability of the shareholder. |
| Shares sold as part of a systematic withdrawal plan as described in the Prospectus. |
| Return of excess contributions from an IRA Account. |
| Shares sold as part of a required minimum distribution for IRA and retirement accounts due to the shareholder reaching the qualified age based on applicable IRS regulations as described in the Prospectus. |
| Shares sold to pay Oppenheimer fees but only if the transaction is initiated by Oppenheimer. |
| Shares acquired through a right of reinstatement. |
| Front-end load Discounts Available at Oppenheimer: Breakpoints, Rights of Accumulation & Letters of Intent |
| Breakpoints as described in the Prospectus. |
| Rights of Accumulation (ROA), which entitle shareholders to breakpoint discounts, will be automatically calculated based on the aggregated holding of fund family assets held by accounts within the purchaser’s household at Oppenheimer. Eligible fund family assets not held at Oppenheimer may be included in the ROA calculation only if the shareholder notifies his or her financial advisor about such assets. |
38 | Wells Fargo Common Stock Fund
Table of Contents
Effective June 15, 2020, shareholders purchasing fund shares through a Robert W. Baird & Co. (“Baird”) platform or account will only be eligible for the following sales charge waivers (front-end sales charge waivers and CDSC waivers) and discounts, which may differ from those disclosed elsewhere in the Fund’s Prospectus or the SAI.
| Front-end Sales Load Waivers on Class A Shares available at Baird |
| Shares purchased through reinvestment of capital gains distributions and dividend reinvestment when purchasing share of the same fund. |
| Share purchase by employees and registers representatives of Baird or its affiliate and their family members as designated by Baird. |
| Shares purchase from the proceeds of redemptions within the same fund family, provided (1) the repurchase occurs within 90 days following the redemption, (2) the redemption and purchase occur in the same accounts, and (3) redeemed shares were subject to a front-end or deferred sales charge (known as rights of reinstatement). |
| A shareholder in the Funds Investor C Shares will have their share exchanged at net asset value to Investor A shares of the fund if the shares are no longer subject to CDSC and the exchange is in line with the policies and procedures of Baird. |
| Employer-sponsored retirement plans or charitable accounts in a transactional brokerage account at Baird, including 401(k) plans, 457 plans, employer-sponsored 403(b) plans, profit sharing and money purchase pension plans and defined benefit plans. For purposes of this provision, employer-sponsored retirement plans do not include SEP IRAs, Simple IRAs or SAR-SEPs. |
| CDSC Waivers on A and C Shares available at Baird |
| Shares sold due to death or disability of the shareholder. |
| Shares sold as part of a systematic withdrawal plan as described in the Fund’s Prospectus. |
| Shares bought due to returns of excess contributions from an IRA Account. |
| Shares sold as part of a required minimum distribution for IRA and retirement accounts due to the shareholder reaching age 72 as described in the Fund’s Prospectus. |
| Shares sold to pay Baird fees but only if the transaction is initiated by Baird. |
| Shares acquired through a right of reinstatement. |
| Front-end load Discounts Available at Baird: Breakpoint and/or Rights of Accumulation |
| Breakpoints as described in the Prospectus. |
| Rights of accumulations which entitles shareholders to breakpoint discounts will be automatically calculated based on the aggregated holding of fund family assets held by accounts within the purchaser’s household at Baird. Eligible fund family assets not held at Baird may be included in the rights of accumulations calculation only if the shareholder notifies his or her financial advisor about such assets. |
| Letters of Intent (LOI) allow for breakpoint discounts based on anticipated purchases within a fund family through Baird, over a 13-month period of time. |
Wells Fargo Common Stock Fund | 39
Table of Contents
This page is intentionally left blank.
Table of Contents
For more information
More information about Wells Fargo Funds is available free upon request. To obtain literature, please write, visit the Fund’s website, or call:
Wells Fargo Funds
P.O. Box 219967
Kansas City, MO 64121-9967
Website: wfam.com
Individual investors: 1-800-222-8222
Retail investment professionals: 1-888-877-9275
Institutional investment professionals: 1-866-765-0778

This report and the financial statements contained herein are submitted for the general information of the shareholders of the Fund. If this report is used for promotional purposes, distribution of the report must be accompanied or preceded by a current prospectus. Before investing, please consider the investment objectives, risks, charges, and expenses of the investment. For a current prospectus and, if available, a summary prospectus, containing this information, call 1-800-222-8222 or visit the Fund’s website at wfam.com. Read the prospectus carefully before you invest or send money.
Wells Fargo Asset Management (WFAM) is the trade name for certain investment advisory/management firms owned by Wells Fargo & Company. These firms include but are not limited to Wells Capital Management Incorporated and Wells Fargo Funds Management, LLC. Certain products managed by WFAM entities are distributed by Wells Fargo Funds Distributor, LLC (a broker-dealer and Member FINRA).
This material is for general informational and educational purposes only and is NOT intended to provide investment advice or a recommendation of any kind—including a recommendation for any specific investment, strategy, or plan.
INVESTMENT PRODUCTS: NOT FDIC INSURED ◾ NO BANK GUARANTEE ◾ MAY LOSE VALUE
© 2020 Wells Fargo & Company. All rights reserved.
PAR-1020-00568 11-20
A229/AR229 09-20
Table of Contents

Annual Report
September 30, 2020
Wells Fargo Discovery Fund
Beginning on January 1, 2021, as permitted by new regulations adopted by the Securities and Exchange Commission, paper copies of the Wells Fargo Funds’ annual and semi-annual shareholder reports issued after this date will no longer be sent by mail, unless you specifically request paper copies of the reports. Instead, the reports will be made available on the Funds’ website, and you will be notified by mail each time a report is posted and provided with a website address to access the report.
If you already elected to receive shareholder reports electronically, you will not be affected by this change and you need not take any action. You may elect to receive shareholder reports and other communications from the Fund electronically at any time by contacting your financial intermediary (such as a broker-dealer or bank) or, if you are a direct investor, by calling 1-800-222-8222 or by enrolling at wellsfargo.com/advantagedelivery.
You may elect to receive all future reports in paper free of charge. If you invest through a financial intermediary, you can contact your financial intermediary to request that you continue to receive paper copies of your shareholder reports; if you invest directly with the Fund, you can call 1-800-222-8222. Your election to receive reports in paper will apply to all Wells Fargo Funds held in your account with your financial intermediary or, if you are a direct investor, to all Wells Fargo Funds that you hold.
Table of Contents
|
Reduce clutter. Save trees. |
Sign up for electronic delivery of prospectuses and shareholder reports at wellsfargo.com/ |
The views expressed and any forward-looking statements are as of September 30, 2020, unless otherwise noted, and are those of the Fund’s portfolio managers and/or Wells Fargo Asset Management. Discussions of individual securities, or the markets generally, or any Wells Fargo Fund are not intended as individual recommendations. Future events or results may vary significantly from those expressed in any forward-looking statements. The views expressed are subject to change at any time in response to changing circumstances in the market. Wells Fargo Asset Management and the Fund disclaim any obligation to publicly update or revise any views expressed or forward-looking statements.
INVESTMENT PRODUCTS: NOT FDIC INSURED ◾ NO BANK GUARANTEE ◾ MAY LOSE VALUE
Wells Fargo Discovery Fund | 1
Table of Contents
Letter to shareholders (unaudited)

Andrew Owen
President
Wells Fargo Funds
Dear Shareholder:
We are pleased to offer you this annual report for the Wells Fargo Discovery Fund for the 12-month period that ended September 30, 2020. Global stock markets saw earlier gains erased in March as governments around the world took unprecedented measures, attempting to stop the spread of COVID-19 at the expense of short-term economic output. However, markets rallied strongly from April on to more than offset those short-term losses as central banks bolstered capital markets and confidence.
For the 12-month period, equities had broadly positive total returns despite intense volatility in March. Non-U.S. developed market equities had weaker performance than emerging market and U.S. stocks. While gains from fixed-income securities were positive, they were more modest than equities. For the period, U.S. stocks, based on the S&P 500 Index,1 gained 15.15%. International stocks, as measured by the MSCI ACWI ex USA Index (Net),2 returned 3.00%, while the MSCI EM Index (Net)3 had stronger performance, with a 10.54% gain. For bond investors, the Bloomberg Barclays U.S. Aggregate Bond Index4 returned 6.98%, the Bloomberg Barclays Global Aggregate ex-USD Index5 gained 5.48%, and the Bloomberg Barclays Municipal Bond Index6 returned 4.09% while the ICE BofA U.S. High Yield Index7 returned 2.30%.
The period began with mixed economic readings.
The fourth quarter of 2019 started on a strong note. U.S.-China trade tensions, which had been building for months, relaxed in October; optimism rose for a U.K. Brexit deal; and macroeconomic data turned positive. The initial estimate of U.S. third-quarter gross domestic product (GDP) growth was a resilient 1.9% annualized rate, while the U.S. unemployment rate fell to a 50-year low of 3.5% in September. However, despite strength among U.S. consumers, business confidence declined while manufacturing activity contracted. Concerned with a potential economic slowdown, the U.S. Federal Reserve (Fed) lowered interest rates a quarter point in late October—its third rate cut in four months. This helped push the S&P 500 Index to an all-time high while emerging market equities rallied and global bonds declined overall, reflecting a broad pickup in risk appetite.
Equity markets continued to rally in November despite ongoing geopolitical risks. Hopes for a U.S.-China trade deal buoyed investor confidence. U.S. business sentiment improved slightly and manufacturing and services activity picked up. While consumer confidence and purchasing managers’ activity rose in the eurozone, China reported weakening manufacturing and consumer data. Bond yields rose marginally, leading to slightly negative returns for global government and investment-grade corporate bonds.
| 1 | The S&P 500 Index consists of 500 stocks chosen for market size, liquidity, and industry group representation. It is a market-value-weighted index with each stock’s weight in the index proportionate to its market value. You cannot invest directly in an index. |
| 2 | The Morgan Stanley Capital International (MSCI) All Country World Index (ACWI) ex USA Index (Net) is a free-float-adjusted market-capitalization-weighted index that is designed to measure the equity market performance of developed and emerging markets, excluding the United States. Source: MSCI. MSCI makes no express or implied warranties or representations and shall have no liability whatsoever with respect to any MSCI data contained herein. The MSCI data may not be further redistributed or used as a basis for other indices or any securities or financial products. This report is not approved, reviewed, or produced by MSCI. You cannot invest directly in an index. |
| 3 | The MSCI Emerging Markets (EM) Index (Net) is a free-float-adjusted market-capitalization-weighted index that is designed to measure equity market performance of emerging markets. You cannot invest directly in an index. |
| 4 | The Bloomberg Barclays U.S. Aggregate Bond Index is a broad-based benchmark that measures the investment-grade, U.S. dollar-denominated, fixed-rate taxable bond market, including Treasuries, government-related and corporate securities, mortgage-backed securities (agency fixed-rate and hybrid adjustable-rate mortgage pass-throughs), asset-backed securities, and commercial mortgage-backed securities. You cannot invest directly in an index. |
| 5 | The Bloomberg Barclays Global Aggregate ex-USD Index is an unmanaged index that provides a broad-based measure of the global investment-grade fixed-income markets excluding the U.S. dollar-denominated debt market. You cannot invest directly in an index. |
| 6 | The Bloomberg Barclays Municipal Bond Index is an unmanaged index composed of long-term tax-exempt bonds with a minimum credit rating of Baa. You cannot invest directly in an index. |
| 7 | The ICE BofA U.S. High Yield Index is a market-capitalization-weighted index of domestic and Yankee high-yield bonds. The index tracks the performance of high-yield securities traded in the U.S. bond market. You cannot invest directly in an index. Copyright 2020. ICE Data Indices, LLC. All rights reserved. |
2 | Wells Fargo Discovery Fund
Table of Contents
Letter to shareholders (unaudited)
Financial markets ended 2019 with a boost from the U.S. and China accord on a Phase One trade deal. That, along with the landslide win by the pro-Brexit U.K. Conservative Party in a national election and ongoing central bank support, gave investors greater confidence. U.S. economic indicators were generally positive, with the exception of manufacturing activity and business confidence. Consumer confidence was resilient, fed by a robust labor market, tame inflation, and lower interest rates, which boosted housing affordability and stimulated homebuyer activity. The impeachment of President Trump had little impact on the markets. Meanwhile, slowing Chinese economic activity, partly attributable to the trade war, led to further government stimulus at year-end through lower reserve ratios, allowing banks to lend more money.
The year-end rally continued in early January 2020. However, capital market volatility spiked in late January on concerns over the potential impact of COVID-19 on the global economy and stock markets. With sentiment somewhat souring, perceived safe havens did well in January. The U.S. dollar and Japanese yen both rose and government bonds outperformed equities. While the S&P 500 Index held its ground, emerging market equities tumbled, including those in Asia.
In February, COVID-19 became the major market focus. Fears of the virus’s impact on Chinese and global growth led to expectations of increased global central bank monetary policy support. That led the 10-year U.S. Treasury yield to fall to an all-time low of 1.1%. Although equity markets initially shrugged off concerns about the outbreak, focusing instead on strong fourth-quarter earnings and improving business confidence in January, market sentiment turned sharply lower and the S&P 500 Index lost 8.2% for the month. Oil prices tumbled as Russia and the Organization of the Petroleum Exporting Countries compounded a major decline in oil demand with a brutal price war, partly aimed at dissuading further U.S. shale production, causing the price of West Texas Intermediate crude oil to plummet.
The global spread of COVID-19 led country after country to clamp down on social and business-related activity in order to contain the virus from causing even greater devastation and overwhelming health care systems. This abrupt stoppage of economic activity led to the sharp deceleration of global output, sending economies into a deep contraction. Central banks responded swiftly, slashing interest rates and expanding quantitative easing programs to restore liquidity and confidence to the markets. In the U.S., the Fed introduced several new lending programs, funding investment-grade bonds, money market mutual funds, and commercial paper while purchasing Treasuries, mortgage-backed securities, and overnight repurchase agreements. Meanwhile, stock markets tumbled quickly into a bear market, ending the longest bull stock market in U.S. history.
Markets rebounded strongly in April, fueled by unprecedented government and central bank stimulus measures. The U.S. economy contracted by an annualized 5.0% pace in the first quarter, with 30 million new unemployment insurance claims in six weeks. In the eurozone, first-quarter real GDP shrank 3.8%, with the composite April Flash Purchasing Managers’ Index (PMI), a monthly survey of purchasing managers, falling to an all-time low of 13.5. The European Central Bank expanded its quantitative easing to include the purchase of additional government bonds of countries with the greatest virus-related need, including Italy and Spain. China’s first-quarter GDP fell by 6.8% year over year. However, retail sales, production, and investment showed signs of recovery. Extreme oil-price volatility continued as global supply far exceeded demand.
The global equity market rebound continued in May, with widespread strong monthly gains. Investors regained confidence on reports of early signs of success in human trials of a COVID-19 vaccine. Growth stocks continued to outperform value stocks while returns on global government bonds were generally flat. In the U.S., a gap grew between the stock market rebound and devastating economic data points, including an April unemployment rate of 14.7%, the highest level since World War II. PMIs reflected
“The global spread of COVID-19 led country after country to clamp down on social and business-related activity in order to contain the virus from causing even greater devastation and overwhelming health care systems.”
Wells Fargo Discovery Fund | 3
Table of Contents
Letter to shareholders (unaudited)
“The stock market continued to rally in August despite concerns over rising numbers of COVID-19 cases in the United States and several European countries, including France and Spain, as well as the expiration of the $600 weekly bonus unemployment benefit at the end of July.”
weakening activity in May in both the manufacturing and services sectors. U.S. corporate earnings reports indicated a 14% year-over-year contraction in earnings from the first quarter of 2019. However, high demand for technology, driven by remote activity, supported robust information technology sector earnings, which helped drive major technology stocks higher.
Financial markets posted widely positive returns in June despite ongoing economic weakness and high levels of uncertainty on the containment of COVID-19 and the timing of an effective vaccine. There were hopeful signs as economies reopened, with both U.S. and U.K. retail sales rebounding sharply in May. However, year over year, sales remained depressed. Vitally important to market sentiment was the ongoing commitment by central banks globally to do all they could to provide economic support through liquidity and low borrowing costs. U.S. economic activity was aided by one-time $1,200 stimulus checks and $600 bonus weekly unemployment benefits that expired at the end of July. However, unemployment remained historically high, easing somewhat from 14.7% in April to 11.1% in June. By month-end, numerous states reported increases of COVID-19 cases. China’s economic recovery picked up momentum in June, though it remained far from a full recovery.
July was a broadly positive month for both global equities and fixed income. However, economic data and a resurgence of COVID-19 cases pointed to the vulnerability of the global economy and the ongoing imperative to regain control of the pandemic. Second-quarter GDP shrank from the previous quarter by 9.5% and 12.1% in the U.S. and the eurozone, respectively. In contrast, China reported a 3.2% year-over-year expansion in its second-quarter GDP. U.S. unemployment remained high despite adding 1.8 million jobs in July, with a double-digit jobless rate persisting. However, manufacturing activity grew in both the U.S. and the eurozone. In Asia, while China’s manufacturing sector continued to expand, activity in Japan and South Korea contracted. In July, a rising concern was the rapid and broad reemergence of COVID-19 infections.
The stock market continued to rally in August despite concerns over rising numbers of COVID-19 cases in the United States and several European countries, including France and Spain, as well as the expiration of the $600 weekly bonus unemployment benefit at the end of July. U.S. stocks had strong monthly gains, led by the FAANG stocks—Facebook, Apple, Amazon, Netflix, and Google (Alphabet)—which dominate these indices and continued to rally. U.S. stocks generally surpassed other broadly positive global equity performance while fixed-income market monthly returns were broadly flat. Generally stronger-than-expected second-quarter earnings boosted investor sentiment along with the Fed’s announcement of a policy shift that will likely lead to longer-term low interest rates and supportive monetary policy. The U.S. Flash PMIs for both manufacturing and services beat expectations while U.S. housing market indicators were strong. In Europe, retail sales expanded and consumer confidence remained steady. China’s economy continued its fairly steady expansion. Overall, developed markets performed better than emerging market equities for the month of August as people took comfort in better-known equities in perceived safer markets.
Stocks grew more volatile in September on mixed economic data. U.S. PMIs showed solid growth in economic activity in both manufacturing and services. However, six months after the bottom fell out of the labor market in the early spring, only half of the 22 million jobs lost had returned. The U.S. unemployment rate fell to 7.9% in September, the fifth straight month of improvement but far higher than the 3.5% pre-COVID-19 rate. Only 661,000 jobs were added for the month, down from 1.5 million in August. Meanwhile, a reported 2.3 million people have given up looking for work. With U.S. Congress failing to pass further fiscal relief and uncertainties surrounding a possible vaccine, doubts crept back into the financial markets. In the U.K., a lack of progress in Brexit talks with the European Union weighed on markets. China’s economy picked up steam, however, with growth fueled by increased global demand, and China’s service sector had its strongest PMI reading in seven years.
4 | Wells Fargo Discovery Fund
Table of Contents
Letter to shareholders (unaudited)
Don’t let short-term uncertainty derail long-term investment goals.
Periods of investment uncertainty can present challenges, but experience has taught us that maintaining long-term investment goals can be an effective way to plan for the future. To help you create a sound strategy based on your personal goals and risk tolerance, Wells Fargo Funds offers more than 100 mutual funds spanning a wide range of asset classes and investment styles. Although diversification cannot guarantee an investment profit or prevent losses, we believe it can be an effective way to manage investment risk and potentially smooth out overall portfolio performance. We encourage investors to know their investments and to understand that appropriate levels of risk-taking may unlock opportunities.
Thank you for choosing to invest with Wells Fargo Funds. We appreciate your confidence in us and remain committed to helping you meet your financial needs.
Sincerely,

Andrew Owen
President
Wells Fargo Funds
|
For further information about your Fund, contact your investment professional, visit our website at wfam.com, or call us directly at 1-800-222-8222. |
Notice to Shareholders
At a meeting held on August 10-12, 2020, the Board of Trustees of the Fund approved a change to the Fund’s automatic conversion feature for Class C shares in order to shorten the required holding period from 10 to 8 years. As a result, on a monthly basis beginning November 5, 2020, Class C shares will convert automatically into Class A shares 8 years after the initial date of purchase or, if you acquired your Class C shares through an exchange or conversion from another share class, 8 years after the date you acquired your Class C shares. When Class C shares that you acquired through a purchase or exchange convert, any other Class C shares that you purchased with reinvested dividends and distributions also will convert into Class A shares on a pro rata basis.
Please note that a shorter holding period may apply depending on your intermediary. Please see “Appendix A—Sales Charge Reductions and Waivers for Certain Intermediaries” in the Fund’s prospectus for further information.
Wells Fargo Discovery Fund | 5
Table of Contents
Performance highlights (unaudited)
Investment objective
The Fund seeks long-term capital appreciation.
Manager
Wells Fargo Funds Management, LLC
Subadviser
Wells Capital Management Incorporated
Portfolio managers
Michael T. Smith, CFA®‡
Christopher J. Warner, CFA®‡
Average annual total returns (%) as of September 30, 2020
| Including sales charge | Excluding sales charge | Expense ratios1 (%) | ||||||||||||||||||||||||||||||||
| Inception date | 1 year | 5 year | 10 year | 1 year | 5 year | 10 year | Gross | Net2 | ||||||||||||||||||||||||||
| Class A (WFDAX) | 7-31-2007 | 29.58 | 17.15 | 15.27 | 37.49 | 18.55 | 15.96 | 1.21 | 1.21 | |||||||||||||||||||||||||
| Class C (WDSCX) | 7-31-2007 | 35.54 | 17.67 | 15.09 | 36.54 | 17.67 | 15.09 | 1.96 | 1.96 | |||||||||||||||||||||||||
| Class R6 (WFDRX)3 | 6-28-2013 | – | – | – | 38.06 | 19.06 | 16.44 | 0.78 | 0.78 | |||||||||||||||||||||||||
| Administrator Class (WFDDX) | 4-8-2005 | – | – | – | 37.61 | 18.65 | 16.07 | 1.13 | 1.13 | |||||||||||||||||||||||||
| Institutional Class (WFDSX) | 8-31-2006 | – | – | – | 37.91 | 18.94 | 16.37 | 0.88 | 0.88 | |||||||||||||||||||||||||
| Russell 2500TM Growth Index4 | – | – | – | – | 23.37 | 14.19 | 14.06 | – | – | |||||||||||||||||||||||||
Figures quoted represent past performance, which is no guarantee of future results, and do not reflect taxes that a shareholder may pay on an investment in a fund. Investment return and principal value of an investment will fluctuate so that an investor’s shares, when redeemed, may be worth more or less than their original cost. Performance shown without sales charges would be lower if sales charges were reflected. Current performance may be lower or higher than the performance data quoted, which assumes the reinvestment of dividends and capital gains. Current month-end performance is available on the Fund’s website, wfam.com.
Please keep in mind that high double-digit returns were primarily achieved during favorable market conditions. You should not expect that such favorable returns can be consistently achieved. A fund’s performance, especially for short time periods, should not be the sole factor in making your investment decision.
Index returns do not include transaction costs associated with buying and selling securities, any mutual fund fees or expenses, or any taxes. It is not possible to invest directly in an index.
For Class A shares, the maximum front-end sales charge is 5.75%. For Class C shares, the maximum contingent deferred sales charge is 1.00%. Performance including a contingent deferred sales charge assumes the sales charge for the corresponding time period. Class R6, Administrator Class, and Institutional Class shares are sold without a front-end sales charge or contingent deferred sales charge.
Stock values fluctuate in response to the activities of individual companies and general market and economic conditions. Smaller-company stocks tend to be more volatile and less liquid than those of larger companies. Certain investment strategies tend to increase the total risk of an investment (relative to the broader market). The Fund is exposed to foreign investment risk. Consult the Fund’s prospectus for additional information on these and other risks.
Please see footnotes on page 7.
6 | Wells Fargo Discovery Fund
Table of Contents
Performance highlights (unaudited)
| Growth of $10,000 investment as of September 30, 20205 |
|
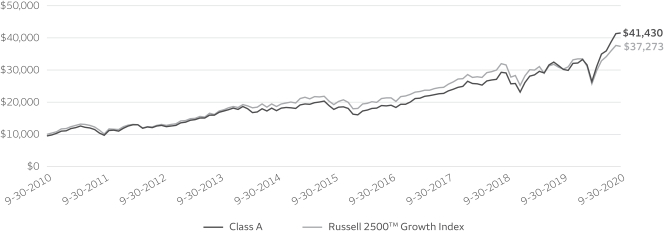
| ‡ | CFA® and Chartered Financial Analyst® are trademarks owned by CFA Institute. |
| 1 | Reflects the expense ratios as stated in the most recent prospectuses, which include the impact of 0.01% in acquired fund fees and expenses. The expense ratios shown are subject to change and may differ from the annualized expense ratios shown in the financial highlights of this report, which do not include acquired fund fees and expenses. |
| 2 | The manager has contractually committed through January 31, 2021, to waive fees and/or reimburse expenses to the extent necessary to cap total annual fund operating expenses after fee waivers at 1.22% for Class A, 1.97% for Class C, 0.79% for Class R6, 1.14% for Administrator Class, and 0.89% for Institutional Class. Brokerage commissions, stamp duty fees, interest, taxes, acquired fund fees and expenses (if any), and extraordinary expenses are excluded from the expense caps. Prior to or after the commitment expiration date, the caps may be increased or the commitment to maintain the caps may be terminated only with the approval of the Board of Trustees. Without these caps, the Fund’s returns would have been lower. The expense ratio paid by an investor is the net expense ratio (the total annual fund operating expenses after fee waivers) as stated in the prospectuses. |
| 3 | Historical performance shown for the Class R6 shares prior to their inception reflects the performance of the Institutional Class shares, and includes the higher expenses applicable to the Institutional Class shares. If these expenses had not been included, the returns for the Class R6 shares would be higher. |
| 4 | The Russell 2500™ Growth Index measures the performance of those Russell 2500 companies with higher price/book ratios and higher forecasted growth values. You cannot invest directly in an index. |
| 5 | The chart compares the performance of Class A shares for the most recent ten years with the Russell 2500™ Growth Index. The chart assumes a hypothetical investment of $10,000 in Class A shares and reflects all operating expenses and assumes the maximum initial sales charge of 5.75%. |
| 6 | The ten largest holdings, excluding cash, cash equivalents and any money market funds, are calculated based on the value of the investments divided by total net assets of the Fund. Holdings are subject to change and may have changed since the date specified. |
| 7 | Amounts are calculated based on the total long-term investments of the Fund. These amounts are subject to change and may have changed since the date specified. |
Wells Fargo Discovery Fund | 7
Table of Contents
Performance highlights (unaudited)
MANAGER’S DISCUSSION
Fund highlights
| ∎ | The Fund outperformed its benchmark, the Russell 2500TM Growth Index, for the 12-month period that ended September 30, 2020. |
| ∎ | Stock selection in the health care and consumer discretionary sectors contributed to performance. |
| ∎ | Stock selection in the consumer staples sector and select holdings within information technology (IT) detracted from performance. |
Global pandemic triggers massive policy response.
Over the past 12 months, global economies shifted from long-toothed bull markets to rapid recessions, spurred by a global pandemic and shelter-at-home orders to combat the coronavirus. Central banks and governments rallied quickly to prevent a possible depression by proposing massive stimulus packages. Within the United States, the Federal Reserve (Fed) took extraordinary measures to provide liquidity, including purchasing corporate bonds and indicating short-term interest rates would stay near zero until at least 2023. These aggressive actions signaled the Fed would effectively take any measures to support the economy. With persistently low Treasury bond yields, U.S. stocks were propelled by the sentiment of “there is no alternative.” The equity markets were further fueled by optimism as progress continued on the development of therapeutic treatments and vaccines for the coronavirus.
Our investment process has long focused on companies harnessing technology to create superior growth. The Fund remains positioned toward companies that we believe are on the right side of change. As a result, our portfolios were well positioned for the changes in 2020 and we have not made significant changes to our portfolio.
| Ten largest holdings (%) as of September 30, 20206 | ||||
iRhythm Technologies Incorporated | 2.71 | |||
MercadoLibre Incorporated | 2.50 | |||
Black Knight Incorporated | 2.36 | |||
Generac Holdings Incorporated | 2.34 | |||
Chipotle Mexican Grill Incorporated | 2.26 | |||
Veeva Systems Incorporated Class A | 2.16 | |||
MongoDB Incorporated | 2.08 | |||
Five9 Incorporated | 1.96 | |||
Booz Allen Hamilton Holding Corporation | 1.90 | |||
StoneCo Limited Class A | 1.89 | |||
Stock selection in the health care and consumer discretionary sectors contributed to performance relative to the index.
Veeva Systems Incorporated was a standout health care performer. Veeva is at the intersection of health care and technology. The company provides cloud-based customer relationship management software with a specific emphasis on the biotechnology and life sciences industries. Its software suite spans the full lifecycle from drug development to commercialization. The opportunity to penetrate a large target market, as well as upgrade offerings for additional services, has driven rapid growth for the company. Furthermore, the subscription revenue business model gives Veeva high visibility
into future growth, an attractive trait to investors in a slow-growth environment. Recent financial results supported our thesis by meaningfully exceeding expectations. Veeva is also expanding into new industries beyond health care, which allowed the company to raise future guidance.
Within consumer discretionary, MercadoLibre, Incorporated, contributed to performance. MercadoLibre is the dominant Latin American e-commerce provider, where e-commerce penetration rates are accelerating but remain far below that of developed countries. The company also owns MercadoPago, a digital payment application, which has been fueling strong growth and is now the leading online payment solution in Latin America. In addition to growth in the core e-commerce marketplace, we believe MercadoPago will significantly contribute to earnings going forward.
Please see footnotes on page 7.
8 | Wells Fargo Discovery Fund
Table of Contents
Performance highlights (unaudited)
| Sector allocation as of September 30, 20207 |
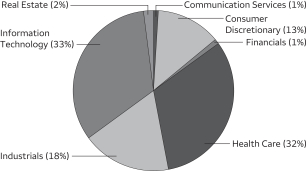 |
Stock selection within the consumer staples sector and select IT holdings detracted from relative performance.
Within consumer staples, shares of foodservice distributor US Foods Holding Corporation were negatively affected by the global pandemic. Diminished demand from restaurants, hospitals, and hotels weighed on the shares for most of the year. With uncertainty as to when demand may return to pre-pandemic levels, we exited our position.
Within IT, shares of Euronet Worldwide, Incorporated, underperformed as a result of the coronavirus crisis. Euronet is an electronic payments and financial transaction processor for banks and retailers, with most of its transactions originating from tourists in Europe. As travel has been halted, lower transaction volumes at automated teller machines exerted pressure on the shares.
While volatility remains high, companies on the “right side of change” should provide resiliency.
We do not believe the recovery will unfold in a linear, V-shaped fashion. The vexing challenges of an intertwined health care crisis, financial crisis, and social crisis will likely remain. Progress is being made toward containing and treating the coronavirus, but cases continue to spike and the distribution of a vaccine will take considerable time. Political and policy uncertainty will represent an ongoing risk to markets. Given the lack of clarity, we remain cautious in our outlook and anticipate that volatility will continue.
We continue to emphasizing companies on the “right side of change.” These are dynamic businesses positioned to take advantage of the massive shift around digital transformation. Trillions of dollars have moved online from offline. Growth themes, such as telemedicine, cloud software, digital payments, and e-commerce, will likely continue for the foreseeable future. We are long-term investors focused on opportunities well beyond 2020. As economic growth remains scarce, stocks with superior fundamentals should have defensive qualities and continue to be rewarded with premium valuations. As financial guidance continues to be revised, we believe this is a great time for active management and deep fundamental research. While we are cautious on the markets overall, we remain optimistic and confident in companies that we believe are positioned on the “right side of change.”
Please see footnotes on page 7.
Wells Fargo Discovery Fund | 9
Table of Contents
As a shareholder of the Fund, you incur two types of costs: (1) transaction costs, including sales charges (loads) on purchase payments and contingent deferred sales charges (if any) on redemptions and (2) ongoing costs, including management fees, distribution (12b-1) and/or shareholder servicing fees, and other Fund expenses. This example is intended to help you understand your ongoing costs (in dollars) of investing in the Fund and to compare these costs with the ongoing costs of investing in other mutual funds.
The example is based on an investment of $1,000 invested at the beginning of the six-month period and held for the entire period from April 1, 2020 to September 30, 2020.
Actual expenses
The “Actual” line of the table below provides information about actual account values and actual expenses. You may use the information in this line, together with the amount you invested, to estimate the expenses that you paid over the period. Simply divide your account value by $1,000 (for example, an $8,600 account value divided by $1,000 = 8.6), then multiply the result by the number in the “Actual” line under the heading entitled “Expenses paid during period” for your applicable class of shares to estimate the expenses you paid on your account during this period.
Hypothetical example for comparison purposes
The “Hypothetical” line of the table below provides information about hypothetical account values and hypothetical expenses based on the Fund’s actual expense ratio and an assumed rate of return of 5% per year before expenses, which is not the Fund’s actual return. The hypothetical account values and expenses may not be used to estimate the actual ending account balance or expenses you paid for the period. You may use this information to compare the ongoing costs of investing in the Fund and other funds. To do so, compare this 5% hypothetical example with the 5% hypothetical examples that appear in the shareholder reports of the other funds.
Please note that the expenses shown in the table are meant to highlight your ongoing costs only and do not reflect any transactional costs, such as sales charges (loads) and contingent deferred sales charges. Therefore, the “Hypothetical” line of the table is useful in comparing ongoing costs only and will not help you determine the relative total costs of owning different funds. In addition, if these transactional costs were included, your costs would have been higher.
| Beginning account value 4-1-2020 | Ending account value 9-30-2020 | Expenses paid during the period1 | Annualized net expense ratio | |||||||||||||
Class A | ||||||||||||||||
Actual | $ | 1,000.00 | $ | 1,569.13 | $ | 7.72 | 1.20 | % | ||||||||
Hypothetical (5% return before expenses) | $ | 1,000.00 | $ | 1,019.06 | $ | 6.06 | 1.20 | % | ||||||||
Class C | ||||||||||||||||
Actual | $ | 1,000.00 | $ | 1,564.22 | $ | 12.54 | 1.95 | % | ||||||||
Hypothetical (5% return before expenses) | $ | 1,000.00 | $ | 1,015.29 | $ | 9.86 | 1.95 | % | ||||||||
Class R6 | ||||||||||||||||
Actual | $ | 1,000.00 | $ | 1,572.73 | $ | 5.00 | 0.77 | % | ||||||||
Hypothetical (5% return before expenses) | $ | 1,000.00 | $ | 1,021.18 | $ | 3.93 | 0.77 | % | ||||||||
Administrator Class | ||||||||||||||||
Actual | $ | 1,000.00 | $ | 1,569.87 | $ | 7.22 | 1.12 | % | ||||||||
Hypothetical (5% return before expenses) | $ | 1,000.00 | $ | 1,019.45 | $ | 5.68 | 1.12 | % | ||||||||
Institutional Class | ||||||||||||||||
Actual | $ | 1,000.00 | $ | 1,571.58 | $ | 5.64 | 0.87 | % | ||||||||
Hypothetical (5% return before expenses) | $ | 1,000.00 | $ | 1,020.68 | $ | 4.43 | 0.87 | % | ||||||||
| 1 | Expenses paid is equal to the annualized net expense ratio of each class multiplied by the average account value over the period, multiplied by the number of days in the most recent fiscal half-year divided by the number of days in the fiscal year (to reflect the one-half-year period). |
10 | Wells Fargo Discovery Fund
Table of Contents
Portfolio of investments—September 30, 2020
| Shares | Value | |||||||||||||||
| Common Stocks: 99.71% | ||||||||||||||||
Communication Services: 1.40% | ||||||||||||||||
| Interactive Media & Services: 1.40% | ||||||||||||||||
Match Group Incorporated † | 337,700 | $ | 37,366,505 | |||||||||||||
|
| |||||||||||||||
Consumer Discretionary: 12.74% |
| |||||||||||||||
| Diversified Consumer Services: 3.21% | ||||||||||||||||
Bright Horizons Family Solutions Incorporated † | 303,940 | 46,211,038 | ||||||||||||||
Chegg Incorporated † | 552,500 | 39,470,600 | ||||||||||||||
| 85,681,638 | ||||||||||||||||
|
| |||||||||||||||
| Hotels, Restaurants & Leisure: 3.64% | ||||||||||||||||
Chipotle Mexican Grill Incorporated † | 48,600 | 60,444,306 | ||||||||||||||
Domino’s Pizza Incorporated | 86,365 | 36,729,307 | ||||||||||||||
| 97,173,613 | ||||||||||||||||
|
| |||||||||||||||
| Internet & Direct Marketing Retail: 5.04% | ||||||||||||||||
Chewy Incorporated Class A † | 482,800 | 26,471,924 | ||||||||||||||
Etsy Incorporated † | 340,000 | 41,354,200 | ||||||||||||||
MercadoLibre Incorporated † | 61,811 | 66,909,171 | ||||||||||||||
| 134,735,295 | ||||||||||||||||
|
| |||||||||||||||
| Specialty Retail: 0.85% | ||||||||||||||||
Carvana Company † | 102,600 | 22,885,956 | ||||||||||||||
|
| |||||||||||||||
| Financials: 0.92% | ||||||||||||||||
| Consumer Finance: 0.92% | ||||||||||||||||
LendingTree Incorporated † | 80,063 | 24,570,534 | ||||||||||||||
|
| |||||||||||||||
| Health Care: 32.07% | ||||||||||||||||
| Biotechnology: 8.81% | ||||||||||||||||
Black Diamond Therapeutics Incorporated †« | 222,300 | 6,720,129 | ||||||||||||||
CRISPR Therapeutics AG † | 189,700 | 15,866,508 | ||||||||||||||
Deciphera Pharmaceuticals Incorporated † | 207,900 | 10,665,270 | ||||||||||||||
Exact Sciences Corporation † | 492,400 | 50,200,180 | ||||||||||||||
Mirati Therapeutics Incorporated † | 79,000 | 13,117,950 | ||||||||||||||
Natera Incorporated † | 453,800 | 32,782,512 | ||||||||||||||
ORIC Pharmaceuticals Incorporated †« | 311,800 | 7,798,118 | ||||||||||||||
Sarepta Therapeutics Incorporated † | 171,035 | 24,018,445 | ||||||||||||||
Turning Point Therapeutics Incorporated † | 244,800 | 21,385,728 | ||||||||||||||
Twist Bioscience Corporation † | 323,400 | 24,568,698 | ||||||||||||||
Zai Lab Limited ADR † | 235,344 | 19,573,560 | ||||||||||||||
Zymeworks Incorporated † | 187,400 | 8,729,092 | ||||||||||||||
| 235,426,190 | ||||||||||||||||
|
| |||||||||||||||
| Health Care Equipment & Supplies: 10.93% | ||||||||||||||||
ABIOMED Incorporated † | 88,600 | 24,547,516 | ||||||||||||||
Align Technology Incorporated † | 130,700 | 42,785,952 | ||||||||||||||
DexCom Incorporated † | 76,100 | 31,370,703 | ||||||||||||||
Haemonetics Corporation † | 283,000 | 24,691,750 | ||||||||||||||
Inari Medical Incorporated † | 237,900 | 16,419,858 | ||||||||||||||
Insulet Corporation † | 169,541 | 40,111,705 | ||||||||||||||
iRhythm Technologies Incorporated † | 303,900 | 72,361,629 | ||||||||||||||
Shockwave Medical Incorporated † | 525,409 | 39,826,002 | ||||||||||||||
| 292,115,115 | ||||||||||||||||
|
| |||||||||||||||
The accompanying notes are an integral part of these financial statements.
Wells Fargo Discovery Fund | 11
Table of Contents
Portfolio of investments—September 30, 2020
| Shares | Value | |||||||||||||||
| Health Care Providers & Services: 6.55% | ||||||||||||||||
Amedisys Incorporated † | 170,400 | $ | 40,287,672 | |||||||||||||
Chemed Corporation | 85,600 | 41,117,960 | ||||||||||||||
Guardant Health Incorporated † | 316,397 | 35,366,857 | ||||||||||||||
HealthEquity Incorporated † | 492,200 | 25,284,314 | ||||||||||||||
Molina Healthcare Incorporated † | 179,628 | 32,879,109 | ||||||||||||||
| 174,935,912 | ||||||||||||||||
|
| |||||||||||||||
| Health Care Technology: 2.16% | ||||||||||||||||
Veeva Systems Incorporated Class A † | 204,900 | 57,615,831 | ||||||||||||||
|
| |||||||||||||||
| Life Sciences Tools & Services: 2.18% | ||||||||||||||||
Berkeley Lights Incorporated † | 260,061 | 19,858,258 | ||||||||||||||
Bio-Rad Laboratories Incorporated Class A † | 74,600 | 38,453,316 | ||||||||||||||
| 58,311,574 | ||||||||||||||||
|
| |||||||||||||||
| Pharmaceuticals: 1.44% | ||||||||||||||||
Catalent Incorporated † | 447,600 | 38,341,416 | ||||||||||||||
|
| |||||||||||||||
| Industrials: 17.71% | ||||||||||||||||
| Aerospace & Defense: 3.56% | ||||||||||||||||
HEICO Corporation | 267,500 | 27,996,550 | ||||||||||||||
Mercury Systems Incorporated † | 480,619 | 37,228,748 | ||||||||||||||
Teledyne Technologies Incorporated † | 96,600 | 29,966,286 | ||||||||||||||
| 95,191,584 | ||||||||||||||||
|
| |||||||||||||||
| Building Products: 1.61% | ||||||||||||||||
Trex Company Incorporated † | 601,600 | 43,074,560 | ||||||||||||||
|
| |||||||||||||||
| Commercial Services & Supplies: 5.95% | ||||||||||||||||
Casella Waste Systems Incorporated Class A † | 780,457 | 43,588,523 | ||||||||||||||
IAA Incorporated † | 784,600 | 40,854,122 | ||||||||||||||
Tetra Tech Incorporated | 393,000 | 37,531,500 | ||||||||||||||
Waste Connections Incorporated | 356,529 | 37,007,710 | ||||||||||||||
| 158,981,855 | ||||||||||||||||
|
| |||||||||||||||
| Electrical Equipment: 2.35% | ||||||||||||||||
Generac Holdings Incorporated † | 323,520 | 62,646,413 | ||||||||||||||
|
| |||||||||||||||
| Professional Services: 1.73% | ||||||||||||||||
Clarivate plc † | 1,488,330 | 46,123,347 | ||||||||||||||
|
| |||||||||||||||
| Road & Rail: 1.22% | ||||||||||||||||
Saia Incorporated † | 259,100 | 32,682,874 | ||||||||||||||
|
| |||||||||||||||
| Trading Companies & Distributors: 1.29% | ||||||||||||||||
SiteOne Landscape Supply Incorporated † | 282,543 | 34,456,119 | ||||||||||||||
|
| |||||||||||||||
Information Technology: 33.29% |
| |||||||||||||||
| Electronic Equipment, Instruments & Components: 1.10% | ||||||||||||||||
Novanta Incorporated † | 279,070 | 29,397,234 | ||||||||||||||
|
| |||||||||||||||
| IT Services: 17.46% | ||||||||||||||||
Black Knight Incorporated † |
| 724,885 | 63,101,239 | |||||||||||||
Booz Allen Hamilton Holding Corporation |
| 610,200 | 50,634,396 | |||||||||||||
EPAM Systems Incorporated † |
| 132,179 | 42,730,827 | |||||||||||||
The accompanying notes are an integral part of these financial statements.
12 | Wells Fargo Discovery Fund
Table of Contents
Portfolio of investments—September 30, 2020
| Shares | Value | |||||||||||||||
| IT Services (continued) | ||||||||||||||||
Euronet Worldwide Incorporated † |
| 237,200 | $ | 21,608,920 | ||||||||||||
MongoDB Incorporated † |
| 239,756 | 55,505,912 | |||||||||||||
Okta Incorporated † |
| 164,100 | 35,092,785 | |||||||||||||
Square Incorporated Class A † |
| 237,900 | 38,670,645 | |||||||||||||
StoneCo Limited Class A † |
| 953,973 | 50,455,632 | |||||||||||||
Twilio Incorporated Class A † |
| 190,800 | 47,144,772 | |||||||||||||
WEX Incorporated † |
| 208,100 | 28,919,657 | |||||||||||||
WNS Holdings Limited ADR † |
| 507,300 | 32,446,908 | |||||||||||||
| 466,311,693 | ||||||||||||||||
|
| |||||||||||||||
| Semiconductors & Semiconductor Equipment: 3.74% | ||||||||||||||||
Lattice Semiconductor Corporation † |
| 1,046,700 | 30,312,432 | |||||||||||||
MKS Instruments Incorporated |
| 362,800 | 39,628,644 | |||||||||||||
Universal Display Corporation |
| 166,400 | 30,075,136 | |||||||||||||
| 100,016,212 | ||||||||||||||||
|
| |||||||||||||||
| Software: 10.99% | ||||||||||||||||
Avalara Incorporated † |
| 278,800 | 35,502,392 | |||||||||||||
Bill.com Holdings Incorporated † |
| 272,946 | 27,379,213 | |||||||||||||
Crowdstrike Holdings Incorporated Class A † |
| 281,895 | 38,709,821 | |||||||||||||
Elastic NV † |
| 389,500 | 42,023,155 | |||||||||||||
Envestnet Incorporated † |
| 376,325 | 29,037,237 | |||||||||||||
Five9 Incorporated † |
| 404,442 | 52,448,039 | |||||||||||||
Globant SA † |
| 247,401 | 44,339,207 | |||||||||||||
Unity Software Incorporated † |
| 275,775 | 24,069,642 | |||||||||||||
| 293,508,706 | ||||||||||||||||
|
| |||||||||||||||
Real Estate: 1.58% |
| |||||||||||||||
| Equity REITs: 1.58% | ||||||||||||||||
QTS Realty Trust Incorporated Class A |
| 670,757 | 42,271,107 | |||||||||||||
|
| |||||||||||||||
Total Common Stocks (Cost $1,557,583,255) |
| 2,663,821,283 | ||||||||||||||
|
| |||||||||||||||
| Yield | ||||||||||||||||
| Short-Term Investments: 0.83% |
| |||||||||||||||
| Investment Companies: 0.83% | ||||||||||||||||
Securities Lending Cash Investments LLC (l)(r)(u) | 0.12 | % | 11,803,125 | 11,803,125 | ||||||||||||
Wells Fargo Government Money Market Fund Select Class (l)(u) | 0.05 | 10,524,388 | 10,524,388 | |||||||||||||
Total Short-Term Investments (Cost $22,327,513) |
| 22,327,513 | ||||||||||||||
|
| |||||||||||||||
| Total investments in securities (Cost $1,579,910,768) | 100.54 | % | 2,686,148,796 | |||||
Other assets and liabilities, net | (0.54 | ) | (14,507,179 | ) | ||||
|
|
|
| |||||
| Total net assets | 100.00 | % | $ | 2,671,641,617 | ||||
|
|
|
| |||||
| † | Non-income-earning security |
| « | All or a portion of this security is on loan. |
| (l) | The issuer of the security is an affiliated person of the Fund as defined in the Investment Company Act of 1940. |
| (r) | The investment is a non-registered investment company purchased with cash collateral received from securities on loan. |
| (u) | The rate represents the 7-day annualized yield at period end. |
Abbreviations:
| ADR | American depositary receipt |
| REIT | Real estate investment trust |
The accompanying notes are an integral part of these financial statements.
Wells Fargo Discovery Fund | 13
Table of Contents
Portfolio of investments—September 30, 2020
Investments in Affiliates
An affiliated investment is an investment in which the Fund owns at least 5% of the outstanding voting shares of the issuer or as a result of other relationships, such as the Fund and the issuer having the same investment manager. Transactions with issuers that were either affiliated persons of the Fund at the beginning of the period or the end of the period were as follows:
| Value, beginning of period | Purchases | Sales proceeds | Net realized gains (losses) | Net change in unrealized gains (losses) | Income from affiliated securities | Value, end of period | % of net assets | |||||||||||||||||||||||||
| Short-Term Investments | ||||||||||||||||||||||||||||||||
Investment Companies | ||||||||||||||||||||||||||||||||
Securities Lending Cash Investments LLC | $ | 125,456,815 | $ | 399,582,065 | $ | (513,228,410 | ) | $ | (7,049 | ) | $ | (296 | ) | $ | 678,579 | # | $ | 11,803,125 | ||||||||||||||
Wells Fargo Government Money Market Fund Select Class | 34,896,690 | 646,068,691 | (670,440,993 | ) | 0 | 0 | 229,134 | 10,524,388 | ||||||||||||||||||||||||
|
|
|
|
|
|
|
|
|
| |||||||||||||||||||||||
| $ | (7,049 | ) | $ | (296 | ) | $ | 907,713 | $ | 22,327,513 | 0.83 | % | |||||||||||||||||||||
|
|
|
|
|
|
|
|
|
| |||||||||||||||||||||||
| # | Amount shown represents income before fees and rebates. |
The accompanying notes are an integral part of these financial statements.
14 | Wells Fargo Discovery Fund
Table of Contents
Statement of assets and liabilities—September 30, 2020
Assets | ||||
Investments in unaffiliated securities (including $12,002,991 of securities loaned), at value (cost $1,557,583,255) | $ | 2,663,821,283 | ||
Investments in affiliated securities, at value (cost $22,327,513) | 22,327,513 | |||
Receivable for Fund shares sold | 1,948,160 | |||
Receivable for dividends | 315,899 | |||
Receivable for securities lending income, net | 7,177 | |||
Prepaid expenses and other assets | 2,617 | |||
|
| |||
Total assets | 2,688,422,649 | |||
|
| |||
Liabilities | ||||
Payable upon receipt of securities loaned | 11,803,125 | |||
Payable for Fund shares redeemed | 2,464,574 | |||
Management fee payable | 1,621,285 | |||
Administration fees payable | 278,447 | |||
Distribution fee payable | 17,069 | |||
Trustees’ fees and expenses payable | 3,678 | |||
Accrued expenses and other liabilities | 592,854 | |||
|
| |||
Total liabilities | 16,781,032 | |||
|
| |||
Total net assets | $ | 2,671,641,617 | ||
|
| |||
Net assets consist of | ||||
Paid-in capital | $ | 1,425,228,705 | ||
Total distributable earnings | 1,246,412,912 | |||
|
| |||
Total net assets | $ | 2,671,641,617 | ||
|
| |||
Computation of net asset value and offering price per share | ||||
Net assets – Class A | $ | 762,758,316 | ||
Shares outstanding – Class A1 | 19,091,146 | |||
Net asset value per share – Class A | $39.95 | |||
Maximum offering price per share – Class A2 | $42.39 | |||
Net assets – Class C | $ | 28,509,465 | ||
Shares outstanding – Class C1 | 867,051 | |||
Net asset value per share – Class C | $32.88 | |||
Net assets – Class R6 | $ | 597,851,094 | ||
Shares outstanding – Class R61 | 13,290,805 | |||
Net asset value per share – Class R6 | $44.98 | |||
Net assets – Administrator Class | $ | 374,365,586 | ||
Shares outstanding – Administrator Class1 | 8,958,699 | |||
Net asset value per share – Administrator Class | $41.79 | |||
Net assets – Institutional Class | $ | 908,157,156 | ||
Shares outstanding – Institutional Class1 | 20,373,757 | |||
Net asset value per share – Institutional Class | $44.57 | |||
| 1 | The Fund has an unlimited number of authorized shares. |
| 2 | Maximum offering price is computed as 100/94.25 of net asset value. On investments of $50,000 or more, the offering price is reduced. |
The accompanying notes are an integral part of these financial statements.
Wells Fargo Discovery Fund | 15
Table of Contents
Statement of operations—year ended September 30, 2020
Investment income | ||||
Dividends (net of foreign withholding taxes of $48,848) | $ | 5,616,653 | ||
Securities lending income from affiliates, net | 777,870 | |||
Income from affiliated securities | 229,134 | |||
|
| |||
Total investment income | 6,623,657 | |||
|
| |||
Expenses | ||||
Management fee | 16,764,664 | |||
Administration fees | ||||
Class A | 1,364,361 | |||
Class C | 57,407 | |||
Class R6 | 140,514 | |||
Administrator Class | 428,373 | |||
Institutional Class | 1,071,817 | |||
Shareholder servicing fees | ||||
Class A | 1,622,193 | |||
Class C | 68,213 | |||
Administrator Class | 817,285 | |||
Distribution fee | ||||
Class C | 204,406 | |||
Custody and accounting fees | 148,609 | |||
Professional fees | 44,858 | |||
Registration fees | 62,000 | |||
Shareholder report expenses | 137,636 | |||
Trustees’ fees and expenses | 21,260 | |||
Interest expense | 3,081 | |||
Other fees and expenses | 49,642 | |||
|
| |||
Total expenses | 23,006,319 | |||
Less: Fee waivers and/or expense reimbursements | ||||
Fund-level | (24,007 | ) | ||
Class A | (90,835 | ) | ||
Administrator Class | (27 | ) | ||
|
| |||
Net expenses | 22,891,450 | |||
|
| |||
Net investment loss | (16,267,793 | ) | ||
|
| |||
Realized and unrealized gains (losses) on investments | ||||
Net realized gains (losses) on | ||||
Unaffiliated securities | 196,920,981 | |||
Affiliated securities | (7,049 | ) | ||
|
| |||
Net realized gains on investments | 196,913,932 | |||
|
| |||
Net change in unrealized gains (losses) on | ||||
Unaffiliated securities | 560,078,991 | |||
Affiiliated securities | (296 | ) | ||
|
| |||
Net change in unrealized gains (losses) on investments | 560,078,695 | |||
|
| |||
Net realized and unrealized gains (losses) on investments | 756,992,627 | |||
|
| |||
Net increase in net assets resulting from operations | $ | 740,724,834 | ||
|
| |||
The accompanying notes are an integral part of these financial statements.
16 | Wells Fargo Discovery Fund
Table of Contents
Statement of changes in net assets
| Year ended September 30, 2020 | Year ended September 30, 2019 | |||||||||||||||
Operations | ||||||||||||||||
Net investment loss | $ | (16,267,793 | ) | $ | (13,725,416 | ) | ||||||||||
Net realized gains on investments | 196,913,932 | 288,857,556 | ||||||||||||||
Net change in unrealized gains (losses) on investments | 560,078,695 | (222,176,352 | ) | |||||||||||||
|
| |||||||||||||||
Net increase in net assets resulting from operations | 740,724,834 | 52,955,788 | ||||||||||||||
|
| |||||||||||||||
Distributions to shareholders from net investment income and net realized gains | ||||||||||||||||
Class A | (80,675,264 | ) | (88,695,435 | ) | ||||||||||||
Class C | (4,218,619 | ) | (5,933,378 | ) | ||||||||||||
Class R6 | (47,628,599 | ) | (63,357,174 | ) | ||||||||||||
Administrator Class | (40,537,083 | ) | (44,501,716 | ) | ||||||||||||
Institutional Class | (104,185,623 | ) | (163,733,298 | ) | ||||||||||||
|
| |||||||||||||||
Total distributions to shareholders | (277,245,188 | ) | (366,221,001 | ) | ||||||||||||
|
| |||||||||||||||
Capital share transactions | Shares | Shares | ||||||||||||||
Proceeds from shares sold | ||||||||||||||||
Class A | 1,810,982 | 59,278,614 | 1,673,589 | 53,100,356 | ||||||||||||
Class C | 108,226 | 2,824,773 | 124,395 | 3,331,641 | ||||||||||||
Class R6 | 5,528,146 | 196,888,388 | 3,358,382 | 119,049,338 | ||||||||||||
Administrator Class | 1,559,841 | 48,274,606 | 1,093,053 | 36,588,024 | ||||||||||||
Institutional Class | 6,616,298 | 239,218,211 | 7,459,402 | 263,872,998 | ||||||||||||
|
| |||||||||||||||
| 546,484,592 | 475,942,357 | |||||||||||||||
|
| |||||||||||||||
Reinvestment of distributions | ||||||||||||||||
Class A | 2,585,318 | 78,180,006 | 3,194,495 | 86,155,536 | ||||||||||||
Class C | 155,290 | 3,886,912 | 234,117 | 5,403,420 | ||||||||||||
Class R6 | 1,396,303 | 47,376,552 | 2,119,233 | 62,983,596 | ||||||||||||
Administrator Class | 1,269,437 | 40,126,892 | 1,575,742 | 44,136,530 | ||||||||||||
Institutional Class | 2,676,859 | 90,076,315 | 5,074,483 | 149,849,493 | ||||||||||||
|
| |||||||||||||||
| 259,646,677 | 348,528,575 | |||||||||||||||
|
| |||||||||||||||
Payment for shares redeemed | ||||||||||||||||
Class A | (4,177,689 | ) | (132,866,024 | ) | (3,794,967 | ) | (119,681,413 | ) | ||||||||
Class C | (492,255 | ) | (13,351,854 | ) | (483,874 | ) | (12,595,548 | ) | ||||||||
Class R6 | (4,667,957 | ) | (169,978,976 | ) | (7,308,955 | ) | (259,235,727 | ) | ||||||||
Administrator Class | (3,531,376 | ) | (112,276,268 | ) | (1,998,197 | ) | (66,501,847 | ) | ||||||||
Institutional Class | (18,973,610 | ) | (664,126,116 | ) | (15,416,303 | ) | (512,299,731 | ) | ||||||||
|
| |||||||||||||||
| (1,092,599,238 | ) | (970,314,266 | ) | |||||||||||||
|
| |||||||||||||||
Net decrease in net assets resulting from capital share transactions | (286,467,969 | ) | (145,843,334 | ) | ||||||||||||
|
| |||||||||||||||
Total increase (decrease) in net assets | 177,011,677 | (459,108,547 | ) | |||||||||||||
|
| |||||||||||||||
Net assets | ||||||||||||||||
Beginning of period | 2,494,629,940 | 2,953,738,487 | ||||||||||||||
|
| |||||||||||||||
End of period | $ | 2,671,641,617 | $ | 2,494,629,940 | ||||||||||||
|
| |||||||||||||||
The accompanying notes are an integral part of these financial statements.
Wells Fargo Discovery Fund | 17
Table of Contents
(For a share outstanding throughout each period)
| Year ended September 30 | ||||||||||||||||||||
| CLASS A | 2020 | 2019 | 2018 | 2017 | 2016 | |||||||||||||||
Net asset value, beginning of period | $33.24 | $38.03 | $36.47 | $29.94 | $30.48 | |||||||||||||||
Net investment loss | (0.31 | ) | (0.26 | ) | (0.26 | ) | (0.23 | ) | (0.18 | )1 | ||||||||||
Net realized and unrealized gains (losses) on investments | 11.37 | 0.53 | 7.85 | 7.17 | 2.23 | |||||||||||||||
|
|
|
|
|
|
|
|
|
| |||||||||||
Total from investment operations | 11.06 | 0.27 | 7.59 | 6.94 | 2.05 | |||||||||||||||
Distributions to shareholders from | ||||||||||||||||||||
Net realized gains | (4.35 | ) | (5.06 | ) | (6.03 | ) | (0.41 | ) | (2.59 | ) | ||||||||||
Net asset value, end of period | $39.95 | $33.24 | $38.03 | $36.47 | $29.94 | |||||||||||||||
Total return2 | 37.49 | % | 3.81 | % | 23.86 | % | 23.42 | % | 7.33 | % | ||||||||||
Ratios to average net assets (annualized) | ||||||||||||||||||||
Gross expenses | 1.21 | % | 1.21 | % | 1.20 | % | 1.21 | % | 1.20 | % | ||||||||||
Net expenses | 1.19 | % | 1.20 | % | 1.20 | % | 1.21 | % | 1.20 | % | ||||||||||
Net investment loss | (0.91 | )% | (0.77 | )% | (0.69 | )% | (0.70 | )% | (0.64 | )% | ||||||||||
Supplemental data | ||||||||||||||||||||
Portfolio turnover rate | 53 | % | 71 | % | 67 | % | 73 | % | 78 | % | ||||||||||
Net assets, end of period (000s omitted) | $762,758 | $627,336 | $676,930 | $607,318 | $641,786 | |||||||||||||||
| 1 | Calculated based upon average shares outstanding |
| 2 | Total return calculations do not include any sales charges. |
The accompanying notes are an integral part of these financial statements.
18 | Wells Fargo Discovery Fund
Table of Contents
Financial highlights
(For a share outstanding throughout each period)
| Year ended September 30 | ||||||||||||||||||||
| CLASS C | 2020 | 2019 | 2018 | 2017 | 2016 | |||||||||||||||
Net asset value, beginning of period | $28.27 | $33.46 | $32.99 | $27.32 | $28.24 | |||||||||||||||
Net investment loss | (0.45 | )1 | (0.41 | )1 | (0.46 | ) | (0.42 | )1 | (0.37 | )1 | ||||||||||
Net realized and unrealized gains (losses) on investments | 9.41 | 0.28 | 6.96 | 6.50 | 2.04 | |||||||||||||||
|
|
|
|
|
|
|
|
|
| |||||||||||
Total from investment operations | 8.96 | (0.13 | ) | 6.50 | 6.08 | 1.67 | ||||||||||||||
Distributions to shareholders from | ||||||||||||||||||||
Net realized gains | (4.35 | ) | (5.06 | ) | (6.03 | ) | (0.41 | ) | (2.59 | ) | ||||||||||
Net asset value, end of period | $32.88 | $28.27 | $33.46 | $32.99 | $27.32 | |||||||||||||||
Total return2 | 36.54 | % | 3.01 | % | 22.94 | % | 22.51 | % | 6.51 | % | ||||||||||
Ratios to average net assets (annualized) | ||||||||||||||||||||
Gross expenses | 1.96 | % | 1.95 | % | 1.95 | % | 1.96 | % | 1.95 | % | ||||||||||
Net expenses | 1.96 | % | 1.95 | % | 1.95 | % | 1.96 | % | 1.95 | % | ||||||||||
Net investment loss | (1.66 | )% | (1.51 | )% | (1.45 | )% | (1.45 | )% | (1.41 | )% | ||||||||||
Supplemental data | ||||||||||||||||||||
Portfolio turnover rate | 53 | % | 71 | % | 67 | % | 73 | % | 78 | % | ||||||||||
Net assets, end of period (000s omitted) | $28,509 | $30,982 | $40,860 | $40,070 | $49,538 | |||||||||||||||
| 1 | Calculated based upon average shares outstanding |
| 2 | Total return calculations do not include any sales charges. |
The accompanying notes are an integral part of these financial statements.
Wells Fargo Discovery Fund | 19
Table of Contents
Financial highlights
(For a share outstanding throughout each period)
| Year ended September 30 | ||||||||||||||||||||
| CLASS R6 | 2020 | 2019 | 2018 | 2017 | 2016 | |||||||||||||||
Net asset value, beginning of period | $36.76 | $41.26 | $38.93 | $31.80 | $32.08 | |||||||||||||||
Net investment loss | (0.18 | )1 | (0.12 | )1 | (0.10 | )1 | (0.08 | ) | (0.07 | ) | ||||||||||
Net realized and unrealized gains (losses) on investments | 12.75 | 0.68 | 8.46 | 7.62 | 2.38 | |||||||||||||||
|
|
|
|
|
|
|
|
|
| |||||||||||
Total from investment operations | 12.57 | 0.56 | 8.36 | 7.54 | 2.31 | |||||||||||||||
Distributions to shareholders from | ||||||||||||||||||||
Net realized gains | (4.35 | ) | (5.06 | ) | (6.03 | ) | (0.41 | ) | (2.59 | ) | ||||||||||
Net asset value, end of period | $44.98 | $36.76 | $41.26 | $38.93 | $31.80 | |||||||||||||||
Total return | 38.06 | % | 4.26 | % | 24.39 | % | 23.98 | % | 7.77 | % | ||||||||||
Ratios to average net assets (annualized) | ||||||||||||||||||||
Gross expenses | 0.78 | % | 0.77 | % | 0.78 | % | 0.78 | % | 0.77 | % | ||||||||||
Net expenses | 0.78 | % | 0.77 | % | 0.78 | % | 0.78 | % | 0.77 | % | ||||||||||
Net investment loss | (0.50 | )% | (0.33 | )% | (0.26 | )% | (0.27 | )% | (0.22 | )% | ||||||||||
Supplemental data | ||||||||||||||||||||
Portfolio turnover rate | 53 | % | 71 | % | 67 | % | 73 | % | 78 | % | ||||||||||
Net assets, end of period (000s omitted) | $597,851 | $405,610 | $530,879 | $351,268 | $300,118 | |||||||||||||||
| 1 | Calculated based upon average shares outstanding |
The accompanying notes are an integral part of these financial statements.
20 | Wells Fargo Discovery Fund
Table of Contents
Financial highlights
(For a share outstanding throughout each period)
| Year ended September 30 | ||||||||||||||||||||
| ADMINISTRATOR CLASS | 2020 | 2019 | 2018 | 2017 | 2016 | |||||||||||||||
Net asset value, beginning of period | $34.55 | $39.27 | $37.44 | $30.70 | $31.17 | |||||||||||||||
Net investment loss | (0.29 | )1 | (0.23 | )1 | (0.23 | ) | (0.20 | )1 | (0.17 | )1 | ||||||||||
Net realized and unrealized gains (losses) on investments | 11.88 | 0.57 | 8.09 | 7.35 | 2.29 | |||||||||||||||
|
|
|
|
|
|
|
|
|
| |||||||||||
Total from investment operations | 11.59 | 0.34 | 7.86 | 7.15 | 2.12 | |||||||||||||||
Distributions to shareholders from | ||||||||||||||||||||
Net realized gains | (4.35 | ) | (5.06 | ) | (6.03 | ) | (0.41 | ) | (2.59 | ) | ||||||||||
Net asset value, end of period | $41.79 | $34.55 | $39.27 | $37.44 | $30.70 | |||||||||||||||
Total return | 37.61 | % | 3.88 | % | 23.97 | % | 23.52 | % | 7.40 | % | ||||||||||
Ratios to average net assets (annualized) | ||||||||||||||||||||
Gross expenses | 1.13 | % | 1.13 | % | 1.12 | % | 1.13 | % | 1.12 | % | ||||||||||
Net expenses | 1.13 | % | 1.13 | % | 1.12 | % | 1.13 | % | 1.12 | % | ||||||||||
Net investment loss | (0.84 | )% | (0.70 | )% | (0.62 | )% | (0.62 | )% | (0.58 | )% | ||||||||||
Supplemental data | ||||||||||||||||||||
Portfolio turnover rate | 53 | % | 71 | % | 67 | % | 73 | % | 78 | % | ||||||||||
Net assets, end of period (000s omitted) | $374,366 | $333,814 | $353,042 | $335,898 | $400,997 | |||||||||||||||
| 1 | Calculated based upon average shares outstanding |
The accompanying notes are an integral part of these financial statements.
Wells Fargo Discovery Fund | 21
Table of Contents
Financial highlights
(For a share outstanding throughout each period)
| Year ended September 30 | ||||||||||||||||||||
| INSTITUTIONAL CLASS | 2020 | 2019 | 2018 | 2017 | 2016 | |||||||||||||||
Net asset value, beginning of period | $36.50 | $41.05 | $38.79 | $31.72 | $32.04 | |||||||||||||||
Net investment loss | (0.21 | )1 | (0.15 | )1 | (0.18 | ) | (0.13 | )1 | (0.10 | ) | ||||||||||
Net realized and unrealized gains (losses) on investments | 12.63 | 0.66 | 8.47 | 7.61 | 2.37 | |||||||||||||||
|
|
|
|
|
|
|
|
|
| |||||||||||
Total from investment operations | 12.42 | 0.51 | 8.29 | 7.48 | 2.27 | |||||||||||||||
Distributions to shareholders from | ||||||||||||||||||||
Net realized gains | (4.35 | ) | (5.06 | ) | (6.03 | ) | (0.41 | ) | (2.59 | ) | ||||||||||
Net asset value, end of period | $44.57 | $36.50 | $41.05 | $38.79 | $31.72 | |||||||||||||||
Total return | 37.91 | % | 4.15 | % | 24.25 | % | 23.88 | % | 7.68 | % | ||||||||||
Ratios to average net assets (annualized) | ||||||||||||||||||||
Gross expenses | 0.88 | % | 0.87 | % | 0.87 | % | 0.88 | % | 0.87 | % | ||||||||||
Net expenses | 0.88 | % | 0.87 | % | 0.87 | % | 0.88 | % | 0.87 | % | ||||||||||
Net investment loss | (0.58 | )% | (0.42 | )% | (0.36 | )% | (0.37 | )% | (0.32 | )% | ||||||||||
Supplemental data | ||||||||||||||||||||
Portfolio turnover rate | 53 | % | 71 | % | 67 | % | 73 | % | 78 | % | ||||||||||
Net assets, end of period (000s omitted) | $908,157 | $1,096,888 | $1,352,027 | $1,157,148 | $1,316,107 | |||||||||||||||
| 1 | Calculated based upon average shares outstanding |
The accompanying notes are an integral part of these financial statements.
22 | Wells Fargo Discovery Fund
Table of Contents
1. ORGANIZATION
Wells Fargo Funds Trust (the “Trust”), a Delaware statutory trust organized on March 10, 1999, is an open-end management investment company registered under the Investment Company Act of 1940, as amended (the “1940 Act”). As an investment company, the Trust follows the accounting and reporting guidance in Financial Accounting Standards Board (“FASB”) Accounting Standards Codification Topic 946, Financial Services – Investment Companies. These financial statements report on the Wells Fargo Discovery Fund (the “Fund”) which is a diversified series of the Trust.
2. SIGNIFICANT ACCOUNTING POLICIES
The following significant accounting policies, which are consistently followed in the preparation of the financial statements of the Fund, are in conformity with U.S. generally accepted accounting principles which require management to make estimates and assumptions that affect the reported amounts of assets and liabilities, disclosure of contingent assets and liabilities at the date of the financial statements, and the reported amounts of revenues and expenses during the reporting period. Actual results could differ from those estimates.
Securities valuation
All investments are valued each business day as of the close of regular trading on the New York Stock Exchange (generally 4 p.m. Eastern Time), although the Fund may deviate from this calculation time under unusual or unexpected circumstances.
Equity securities that are listed on a foreign or domestic exchange or market are valued at the official closing price or, if none, the last sales price. If no sale occurs on the principal exchange or market that day, a fair value price will be determined in accordance with the Fund’s Valuation Procedures.
Investments in registered open-end investment companies are valued at net asset value. Interests in non-registered investment companies that are redeemable at net asset value are fair valued normally at net asset value.
Investments which are not valued using any of the methods discussed above are valued at their fair value, as determined in good faith by the Board of Trustees of the Fund. The Board of Trustees has established a Valuation Committee comprised of the Trustees and has delegated to it the authority to take any actions regarding the valuation of portfolio securities that the Valuation Committee deems necessary or appropriate, including determining the fair value of portfolio securities, unless the determination has been delegated to the Wells Fargo Asset Management Pricing Committee at Wells Fargo Funds Management, LLC (“Funds Management”). The Board of Trustees retains the authority to make or ratify any valuation decisions or approve any changes to the Valuation Procedures as it deems appropriate. On a quarterly basis, the Board of Trustees receives reports on any valuation actions taken by the Valuation Committee or the Wells Fargo Asset Management Pricing Committee which may include items for ratification.
Foreign currency translation
The accounting records of the Fund are maintained in U.S. dollars. The values of other assets and liabilities denominated in foreign currencies are translated into U.S. dollars at rates provided by an independent foreign currency pricing source at a time each business day specified by the Wells Fargo Asset Management Pricing Committee. Purchases and sales of securities, and income and expenses are converted at the rate of exchange on the respective dates of such transactions. Net realized foreign exchange gains or losses arise from sales of foreign currencies, currency gains or losses realized between the trade and settlement dates on securities transactions, and the difference between the amounts of dividends, interest and foreign withholding taxes recorded and the U.S. dollar equivalent of the amounts actually paid or received. Net unrealized foreign exchange gains and losses arise from changes in the fair value of assets and liabilities other than investments in securities resulting from changes in exchange rates. The changes in net assets arising from changes in exchange rates of securities and the changes in net assets resulting from changes in market prices of securities are not separately presented. Such changes are included in net realized and unrealized gains or losses from investments.
Securities lending
The Fund may lend its securities from time to time in order to earn additional income in the form of fees or interest on securities received as collateral or the investment of any cash received as collateral. When securities are on loan, the Fund receives interest or dividends on those securities. Cash collateral received in connection with its securities lending transactions is invested in Securities Lending Cash Investments, LLC (the “Securities Lending Fund”). Investments in Securities Lending Fund are valued at the evaluated bid price provided by an independent pricing service. Income earned from investment in the Securities Lending Fund, if any, is included in securities lending income from affiliates (net of fees and rebates) on the Statement of Operations.
In a securities lending transaction, the net asset value of the Fund is affected by an increase or decrease in the value of the securities loaned and by an increase or decrease in the value of the instrument in which collateral is invested. The amount of
Wells Fargo Discovery Fund | 23
Table of Contents
Notes to financial statements
securities lending activity undertaken by the Fund fluctuates from time to time. The Fund has the right under the lending agreement to recover the securities from the borrower on demand. In the event of default or bankruptcy by the borrower, the Fund may be prevented from recovering the loaned securities or gaining access to the collateral or may experience delays or costs in doing so. In such an event, the terms of the agreement allow the unaffiliated securities lending agent to use the collateral to purchase replacement securities on behalf of the Fund or pay the Fund the market value of the loaned securities. The Fund bears the risk of loss with respect to depreciation of its investment of the cash collateral.
Security transactions and income recognition
Securities transactions are recorded on a trade date basis. Realized gains or losses are recorded on the basis of identified cost.
Dividend income is recognized on the ex-dividend date. Dividend income is recorded net of foreign taxes withheld where recovery of such taxes is not assured.
Distributions to shareholders
Distributions to shareholders from net investment income and any net realized gains are recorded on the ex-dividend date and paid at least annually. Such distributions are determined in accordance with income tax regulations and may differ from U.S. generally accepted accounting principles. Dividend sources are estimated at the time of declaration. The tax character of distributions is determined as of the Fund’s fiscal year end. Therefore, a portion of the Fund’s distributions made prior to the Fund’s fiscal year end may be categorized as a tax return of capital at year end.
Federal and other taxes
The Fund intends to continue to qualify as a regulated investment company by distributing substantially all of its investment company taxable income and any net realized capital gains (after reduction for capital loss carryforwards) sufficient to relieve it from all, or substantially all, federal income taxes. Accordingly, no provision for federal income taxes was required.
The Fund’s income and federal excise tax returns and all financial records supporting those returns for the prior three fiscal years are subject to examination by the federal and Delaware revenue authorities. Management has analyzed the Fund’s tax positions taken on federal, state, and foreign tax returns for all open tax years and does not believe that there are any uncertain tax positions that require recognition of a tax liability.
As of September 30, 2020, the aggregate cost of all investments for federal income tax purposes was $1,593,568,091 and the unrealized gains (losses) consisted of:
Gross unrealized gains | $ | 1,106,839,885 | ||
Gross unrealized losses | (14,259,180 | ) | ||
Net unrealized gains | $ | 1,092,580,705 | ||
Reclassifications are made to the Fund’s capital accounts for permanent tax differences to reflect income and gains available for distribution (or available capital loss carryforwards) under federal income tax regulations. U.S. generally accepted accounting principles require that certain components of net assets be adjusted to reflect permanent differences between financial and tax reporting. These reclassifications have no effect on net assets or net asset values per share. The primary permanent differences causing such reclassification are due to net operating losses and redemptions in-kind. At September 30, 2020, as a result of permanent book-to-tax differences, the following reclassification adjustments were made on the Statement of Assets and Liabilities:
| Paid-in capital | Total distributable earnings | |
| $(7,318,897) | $7,318,897 | |
Class allocations
The separate classes of shares offered by the Fund differ principally in applicable sales charges, distribution, shareholder servicing, and administration fees. Class specific expenses are charged directly to that share class. Investment income, common fund-level expenses, and realized and unrealized gains (losses) on investments are allocated daily to each class of shares based on the relative proportion of net assets of each class.
3. FAIR VALUATION MEASUREMENTS
Fair value measurements of investments are determined within a framework that has established a fair value hierarchy based upon the various data inputs utilized in determining the value of the Fund’s investments. The three-level hierarchy gives the
24 | Wells Fargo Discovery Fund
Table of Contents
Notes to financial statements
highest priority to unadjusted quoted prices in active markets for identical assets or liabilities (Level 1) and the lowest priority to unobservable inputs (Level 3). The Fund’s investments are classified within the fair value hierarchy based on the lowest level of input that is significant to the fair value measurement. The inputs are summarized into three broad levels as follows:
| ∎ | Level 1 – quoted prices in active markets for identical securities |
| ∎ | Level 2 – other significant observable inputs (including quoted prices for similar securities, interest rates, prepayment speeds, credit risk, etc.) |
| ∎ | Level 3 – significant unobservable inputs (including the Fund’s own assumptions in determining the fair value of investments) |
The inputs or methodologies used for valuing investments in securities are not necessarily an indication of the risk associated with investing in those securities.
The following is a summary of the inputs used in valuing the Fund’s assets and liabilities as of September 30, 2020:
Quoted prices (Level 1) | Other significant observable inputs (Level 2) | Significant (Level 3) | Total | |||||||||||||
Assets | ||||||||||||||||
Investments in: | ||||||||||||||||
Common stocks | ||||||||||||||||
Communications services | $ | 37,366,505 | $ | 0 | $ | 0 | $ | 37,366,505 | ||||||||
Consumer discretionary | 340,476,502 | 0 | 0 | 340,476,502 | ||||||||||||
Financials | 24,570,534 | 0 | 0 | 24,570,534 | ||||||||||||
Health care | 856,746,038 | 0 | 0 | 856,746,038 | ||||||||||||
Industrials | 473,156,752 | 0 | 0 | 473,156,752 | ||||||||||||
Information technology | 889,233,845 | 0 | 0 | 889,233,845 | ||||||||||||
Real estate | 42,271,107 | 0 | 0 | 42,271,107 | ||||||||||||
Short-term investments | ||||||||||||||||
Investment companies | 22,327,513 | 0 | 0 | 22,327,513 | ||||||||||||
Total assets | 2,686,148,796 | 0 | 0 | 2,686,148,796 | ||||||||||||
Additional sector, industry or geographic detail is included in the Portfolio of Investments.
For the year ended September 30, 2020, the Fund did not have any transfers into/out of Level 3.
4. TRANSACTIONS WITH AFFILIATES
Management fee
Funds Management, an indirect wholly owned subsidiary of Wells Fargo & Company (“Wells Fargo”), is the manager of the Fund and provides advisory and fund-level administrative services under an investment management agreement. Under the investment management agreement, Funds Management is responsible for, among other services, implementing the investment objectives and strategies of the Fund, supervising the subadviser and providing fund-level administrative services in connection with the Fund’s operations. As compensation for its services under the investment management agreement, Funds Management is entitled to receive a management fee at the following annual rate based on the Fund’s average daily net assets:
| Average daily net assets | Management fee | |||
First $500 million | 0.800 | % | ||
Next $500 million | 0.750 | |||
Next $1 billion | 0.700 | |||
Next $2 billion | 0.675 | |||
Next $1 billion | 0.650 | |||
Next $5 billion | 0.640 | |||
Over $10 billion | 0.630 | |||
Wells Fargo Discovery Fund | 25
Table of Contents
Notes to financial statements
For the year ended September 30, 2020, the management fee was equivalent to an annual rate of 0.73% of the Fund’s average daily net assets.
Funds Management has retained the services of a subadviser to provide daily portfolio management to the Fund. The fee for subadvisory services is borne by Funds Management. Wells Capital Management Incorporated (“WellsCap”), an affiliate of Funds Management and an indirect wholly owned subsidiary of Wells Fargo, is the subadviser to the Fund and is entitled to receive a fee from Funds Management at an annual rate starting at 0.45% and declining to 0.35% as the average daily net assets of the Fund increase.
Administration fees
Under a class-level administration agreement, Funds Management provides class-level administrative services to the Fund, which includes paying fees and expenses for services provided by the transfer agent, sub-transfer agents, omnibus account servicers and record-keepers. As compensation for its services under the class-level administration agreement, Funds Management receives an annual fee which is calculated based on the average daily net assets of each class as follows:
| Class-level administration fee | ||||
Class A, Class C | 0.21 | % | ||
Class R6 | 0.03 | |||
Administrator Class, Institutional Class | 0.13 | |||
Waivers and/or expense reimbursements
Funds Management has contractually waived and/or reimbursed management and administration fees to the extent necessary to maintain certain net operating expense ratios for the Fund. When each class of the Fund has exceeded its expense cap, Funds Management has waived fees and/or reimbursed expenses from fund-level expenses on a proportionate basis and then from class specific expenses. When only certain classes exceed their expense caps, waivers and/or reimbursements are applied against class specific expenses before fund-level expenses. Funds Management has committed through January 31, 2021 to waive fees and/or reimburse expenses to the extent necessary to cap the Fund’s expenses at 1.22% for Class A shares, 1.97% for Class C shares, 0.79% for Class R6 shares, and 1.14% for Administrator Class shares and 0.89% for Institutional Class shares. Prior to or after the commitment expiration date, the cap may be increased or the commitment to maintain the cap may be terminated only with the approval of the Board of Trustees. Prior to February 1, 2020, the Fund’s expenses were capped at 0.84% for Class R6 shares and 1.15% for Administrator Class shares.
Distribution fee
The Trust has adopted a distribution plan for Class C of the Fund pursuant to Rule 12b-1 under the 1940 Act. A distribution fee is charged to Class C shares and paid to Wells Fargo Funds Distributor, LLC (“Funds Distributor”), the principal underwriter, at an annual rate of 0.75% of the average daily net assets of Class C shares.
In addition, Funds Distributor is entitled to receive the front-end sales charge from the purchase of Class A shares and a contingent deferred sales charge on the redemption of certain Class A shares. Funds Distributor is also entitled to receive the contingent deferred sales charges from redemptions of Class C shares. For the year ended September 30, 2020, Funds Distributor received $10,827 from the sale of Class A shares and $37 in contingent deferred sales charges from redemptions of Class C shares. No contingent deferred sales charges were incurred by Class A shares for the year ended September 30, 2020.
Shareholder servicing fees
The Trust has entered into contracts with one or more shareholder servicing agents, whereby Class A, Class C, and Administrator Class of the Fund are charged a fee at an annual rate of 0.25% of the average daily net assets of each respective class. A portion of these total shareholder servicing fees were paid to affiliates of Wells Fargo.
Interfund transactions
The Fund may purchase or sell portfolio investment securities to certain other Wells Fargo affiliates pursuant to Rule 17a-7 under the 1940 Act and under procedures adopted by the Board of Trustees. The procedures have been designed to ensure that these interfund transactions, which do not incur broker commissions, are effected at current market prices.
5. INVESTMENT PORTFOLIO TRANSACTIONS
Purchases and sales of investments, excluding U.S. government obligations (if any) and short-term securities, for the year ended September 30, 2020 were $1,217,038,507 and $1,597,646,144, respectively.
26 | Wells Fargo Discovery Fund
Table of Contents
Notes to financial statements
6. SECURITIES LENDING TRANSACTIONS
The Fund lends its securities through an unaffiliated securities lending agent and receives collateral in the form of cash or securities with a value at least equal to the value of the securities on loan. The value of the loaned securities is determined at the close of each business day and any increases or decreases in the required collateral are exchanged between the Fund and the counterparty on the next business day. Cash collateral received is invested in the Securities Lending Fund which seeks to provide a positive return compared to the daily Federal Funds Open Rate by investing in high-quality, U.S. dollar-denominated short-term money market instruments and is exempt from registration under Section 3(c)(7) of the 1940 Act. Securities Lending Fund is managed by Funds Management and is subadvised by WellsCap. Funds Management receives an advisory fee starting at 0.05% and declining to 0.01% as the average daily net assets of the Securities Lending Fund increase. All of the fees received by Funds Management are paid to WellsCap for its services as subadviser.
In the event of counterparty default or the failure of a borrower to return a loaned security, the Fund has the right to use the collateral to offset any losses incurred. As of September 30, 2020, the Fund had securities lending transactions with the following counterparties which are subject to offset:
| Counterparty | Value of securities on loan | Collateral received1 | Net amount | |||||||||
Bank of America Securities Inc. | $ | 637,755 | $ | (605,625 | ) | $ | 32,130 | |||||
JPMorgan Securities LLC | 4,812,616 | (4,812,616 | ) | 0 | ||||||||
National Financial Services LLC | 6,487,594 | (6,160,750 | ) | 326,844 | ||||||||
UBS Securities LLC | 65,026 | (61,750 | ) | 3,276 | ||||||||
| 1 | Collateral received within this table is limited to the collateral for the net transaction with the counterparty. |
7. BANK BORROWINGS
The Trust (excluding the money market funds), Wells Fargo Master Trust and Wells Fargo Variable Trust are parties to a $350,000,000 revolving credit agreement whereby the Fund is permitted to use bank borrowings for temporary or emergency purposes, such as to fund shareholder redemption requests. Interest under the credit agreement is charged to the Fund based on a borrowing rate equal to the higher of the Federal Funds rate in effect on that day plus 1.25% or the overnight LIBOR rate in effect on that day plus 1.25%. In addition, an annual commitment fee equal to 0.25% of the unused balance is allocated to each participating fund.
During the year ended September 30, 2020, the Fund had average borrowings outstanding of $107,352 at an average rate of 2.87% and paid interest in the amount of $3,081.
8. DISTRIBUTIONS TO SHAREHOLDERS
The tax character of distributions paid during the years ended September 30, 2020 and September 30, 2019 were as follows:
| Year ended September 30 | ||||||||
| 2020 | 2019 | |||||||
Ordinary income | $ | 18,015,375 | $ | 51,161,930 | ||||
Long-term capital gain | 259,229,813 | 315,059,071 | ||||||
As of September 30, 2020, the components of distributable earnings on a tax basis were as follows:
Undistributed long-term gain | Unrealized gains | |
| $153,832,517 | $1,092,580,705 | |
9. CONCENTRATION RISK
Concentration risks result from exposure to a limited number of sectors. As of the end of the period, the Fund invests a concentration of its portfolio in the information technology and health care sectors. A fund that invests a substantial portion of its assets in any sector may be more affected by changes in that sector than would be a fund whose investments are not heavily weighted in any sector.
Wells Fargo Discovery Fund | 27
Table of Contents
Notes to financial statements
10. INDEMNIFICATION
Under the Fund’s organizational documents, the officers and Trustees have been granted certain indemnification rights against certain liabilities that may arise out of performance of their duties to the Fund. The Fund has entered into a separate agreement with each Trustee that converts indemnification rights currently existing under the Fund’s organizational documents into contractual rights that cannot be changed in the future without the consent of the Trustee. Additionally, in the normal course of business, the Fund may enter into contracts with service providers that contain a variety of indemnification clauses. The Fund’s maximum exposure under these arrangements is dependent on future claims that may be made against the Fund and, therefore, cannot be estimated.
11. REDEMPTIONS IN-KIND
During the year ended September 30, 2020, the Fund redeemed assets through in-kind redemptions for shareholders in Class R6 and Institutional Class. The realized gains (losses) recognized by the Fund are reflected on the Statement of Operations and these redemption transactions are reflected on the Statement of Changes in Net Assets. The date of each redemption transaction, value of securities distributed from the redemption, cash paid, realized gains (losses), the shareholder class and the percentage of the Fund redeemed by the shareholder was as follows:
| Date | Value of securities distributed | Cash | Realized gains (losses) | Share class redeemed | % of the Fund | |||||||||||||||
| 10-2-2019 | $ | 102,113,126 | $ | 2,769,688 | $ | (1,236,201 | ) | Institutional Class | 4.32 | % | ||||||||||
| 12-20-2019 | 32,614,848 | 412,769 | 5,934,047 | Institutional Class | 1.39 | |||||||||||||||
| 8-25-2020 | 15,911,701 | 33,846 | 4,564,841 | Class R6 | 0.61 | |||||||||||||||
12. NEW ACCOUNTING PRONOUNCEMENT
In August 2018, FASB issued Accounting Standards Update (“ASU”) No. 2018-13, Fair Value Measurement (Topic 820) Disclosure Framework—Changes to the Disclosure Requirements for Fair Value Measurement. ASU 2018-13 updates the disclosure requirements on fair value measurements in Topic 820, Fair Value Measurements. The amendments are effective for fiscal years, and interim periods within those fiscal years, beginning after December 15, 2019. Management has adopted this guidance which did not have a material impact on the financial statements.
13. CORONAVIRUS (COVID-19) PANDEMIC
On March 11, 2020, the World Health Organization announced that it had made the assessment that coronavirus disease 2019 (“COVID-19”) is a pandemic. The impacts of COVID-19 are adversely affecting the entire global economy, individual companies and investment products, and the market in general. There is significant uncertainty around the extent and duration of business disruptions related to COVID-19 and the impacts may be short term or may last for an extended period of time. The risk of further spreading of COVID-19 has led to significant uncertainty and volatility in the financial markets.
28 | Wells Fargo Discovery Fund
Table of Contents
Report of independent registered public accounting firm
To the Shareholders of the Fund and Board of Trustees
Wells Fargo Funds Trust:
Opinion on the Financial Statements
We have audited the accompanying statement of assets and liabilities of Wells Fargo Discovery Fund (the Fund), one of the funds constituting Wells Fargo Funds Trust, including the portfolio of investments, as of September 30, 2020, the related statement of operations for the year then ended, the statements of changes in net assets for each of the years in the two-year period then ended, and the related notes (collectively, the financial statements) and the financial highlights for each of the years in the five-year period then ended. In our opinion, the financial statements and financial highlights present fairly, in all material respects, the financial position of the Fund as of September 30, 2020, the results of its operations for the year then ended, the changes in its net assets for each of the years in the two-year period then ended, and the financial highlights for each of the years in the five-year period then ended, in conformity with U.S. generally accepted accounting principles.
Basis for Opinion
These financial statements and financial highlights are the responsibility of the Fund’s management. Our responsibility is to express an opinion on these financial statements and financial highlights based on our audits. We are a public accounting firm registered with the Public Company Accounting Oversight Board (United States) (PCAOB) and are required to be independent with respect to the Fund in accordance with the U.S. federal securities laws and the applicable rules and regulations of the Securities and Exchange Commission and the PCAOB.
We conducted our audits in accordance with the standards of the PCAOB. Those standards require that we plan and perform the audit to obtain reasonable assurance about whether the financial statements and financial highlights are free of material misstatement, whether due to error or fraud. Our audits included performing procedures to assess the risks of material misstatement of the financial statements and financial highlights, whether due to error or fraud, and performing procedures that respond to those risks. Such procedures included examining, on a test basis, evidence regarding the amounts and disclosures in the financial statements and financial highlights. Such procedures also included confirmation of securities owned as of September 30, 2020, by correspondence with the custodian, transfer agent and brokers. Our audits also included evaluating the accounting principles used and significant estimates made by management, as well as evaluating the overall presentation of the financial statements and financial highlights. We believe that our audits provide a reasonable basis for our opinion.

We have not been able to determine the specific year that we began serving as the auditor of one or more Wells Fargo Funds investment companies; however we are aware that we have served as the auditor of one or more Wells Fargo Funds investment companies since at least 1955.
Boston, Massachusetts
November 24, 2020
Wells Fargo Discovery Fund | 29
Table of Contents
TAX INFORMATION
For corporate shareholders, pursuant to Section 854 of the Internal Revenue Code, 32.57% of ordinary income dividends qualify for the corporate dividends-received deduction for the fiscal year ended September 30, 2020.
Pursuant to Section 852 of the Internal Revenue Code, $259,229,813 was designated as a 20% rate gain distribution for the fiscal year ended September 30, 2020.
Pursuant to Section 854 of the Internal Revenue Code, $6,289,167 of income dividends paid during the fiscal year ended September 30, 2020 has been designated as qualified dividend income (QDI).
For the fiscal year ended September 30, 2020, $18,015,375 has been designated as short-term capital gain dividends for nonresident alien shareholders pursuant to Section 871 of the Internal Revenue Code.
PROXY VOTING INFORMATION
A description of the policies and procedures used to determine how to vote proxies relating to portfolio securities is available, upon request, by calling 1-800-222-8222, visiting our website at wfam.com, or visiting the SEC website at sec.gov. Information regarding how the proxies related to portfolio securities were voted during the most recent 12-month period ended June 30 is available on the website at wfam.com or by visiting the SEC website at sec.gov.
QUARTERLY PORTFOLIO HOLDINGS INFORMATION
The Fund files its complete schedule of portfolio holdings with the SEC for the first and third quarters of each fiscal year as an exhibit to its reports on Form N-PORT. Shareholders may view the filed Form N-PORT by visiting the SEC website at sec.gov.
30 | Wells Fargo Discovery Fund
Table of Contents
Other information (unaudited)
BOARD OF TRUSTEES AND OFFICERS
Each of the Trustees and Officers1 listed in the table below acts in identical capacities for each fund in the Wells Fargo family of funds, which consists of 142 mutual funds comprising the Wells Fargo Funds Trust, Wells Fargo Variable Trust, Wells Fargo Master Trust and four closed-end funds (collectively the “Fund Complex”). This table should be read in conjunction with the Prospectus and the Statement of Additional Information2. The mailing address of each Trustee and Officer is 525 Market Street, 12th Floor, San Francisco, CA 94105. Each Trustee and Officer serves an indefinite term, however, each Trustee serves such term until reaching the mandatory retirement age established by the Trustees.
Independent Trustees
Name and year of birth | Position held and length of service* | Principal occupations during past five years or longer | Current other public company or investment company directorships | |||
William R. Ebsworth (Born 1957) | Trustee, since 2015 | Retired. From 1984 to 2013, equities analyst, portfolio manager, research director and chief investment officer at Fidelity Management and Research Company in Boston, Tokyo, and Hong Kong, and retired in 2013 as Chief Investment Officer of Fidelity Strategic Advisers, Inc. where he led a team of investment professionals managing client assets. Prior thereto, Board member of Hong Kong Securities Clearing Co., Hong Kong Options Clearing Corp., the Thailand International Fund, Ltd., Fidelity Investments Life Insurance Company, and Empire Fidelity Investments Life Insurance Company. Audit Committee Chair and Investment Committee Chair of the Vincent Memorial Hospital Endowment (non-profit organization). Mr. Ebsworth is a CFA® charterholder. | N/A | |||
Jane A. Freeman (Born 1953) | Trustee, since 2015; Chair Liaison, since 2018 | Retired. From 2012 to 2014 and 1999 to 2008, Chief Financial Officer of Scientific Learning Corporation. From 2008 to 2012, Ms. Freeman provided consulting services related to strategic business projects. Prior to 1999, Portfolio Manager at Rockefeller & Co. and Scudder, Stevens & Clark. Board member of the Harding Loevner Funds from 1996 to 2014, serving as both Lead Independent Director and chair of the Audit Committee. Board member of the Russell Exchange Traded Funds Trust from 2011 to 2012 and the chair of the Audit Committee. Ms. Freeman is also an inactive Chartered Financial Analyst. | N/A | |||
Isaiah Harris, Jr. (Born 1952) | Trustee, since 2009; Audit Committee Chairman, since 2019 | Retired. Chairman of the Board of CIGNA Corporation since 2009, and Director since 2005. From 2003 to 2011, Director of Deluxe Corporation. Prior thereto, President and CEO of BellSouth Advertising and Publishing Corp. from 2005 to 2007, President and CEO of BellSouth Enterprises from 2004 to 2005 and President of BellSouth Consumer Services from 2000 to 2003. Emeritus member of the Iowa State University Foundation Board of Governors. Emeritus Member of the Advisory Board of Iowa State University School of Business. Advisory Board Member, Palm Harbor Academy (private school). Mr. Harris is a certified public accountant (inactive status). | CIGNA Corporation | |||
Judith M. Johnson (Born 1949) | Trustee, since 2008 | Retired. Prior thereto, Chief Executive Officer and Chief Investment Officer of Minneapolis Employees Retirement Fund from 1996 to 2008. Ms. Johnson is an attorney, certified public accountant and a certified managerial accountant. | N/A | |||
David F. Larcker (Born 1950) | Trustee, since 2009 | James Irvin Miller Professor of Accounting at the Graduate School of Business (Emeritus), Stanford University, Director of the Corporate Governance Research Initiative and Senior Faculty of The Rock Center for Corporate Governance since 2006. From 2005 to 2008, Professor of Accounting at the Graduate School of Business, Stanford University. Prior thereto, Ernst & Young Professor of Accounting at The Wharton School, University of Pennsylvania from 1985 to 2005. | N/A | |||
Wells Fargo Discovery Fund | 31
Table of Contents
Other information (unaudited)
Name and year of birth | Position held and length of service* | Principal occupations during past five years or longer | Current other public company or investment company directorships | |||
Olivia S. Mitchell (Born 1953) | Trustee, since 2006; Nominating and Governance Committee Chair, since 2018 | International Foundation of Employee Benefit Plans Professor, Wharton School of the University of Pennsylvania since 1993. Director of Wharton’s Pension Research Council and Boettner Center on Pensions & Retirement Research, and Research Associate at the National Bureau of Economic Research. Previously, Cornell University Professor from 1978 to 1993. | N/A | |||
Timothy J. Penny (Born 1951) | Trustee, since 1996; Chairman, since 2018 | President and Chief Executive Officer of Southern Minnesota Initiative Foundation, a non-profit organization, since 2007. Member of the Board of Trustees of NorthStar Education Finance, Inc., a non-profit organization, since 2007. | N/A | |||
James G. Polisson (Born 1959) | Trustee, since 2018 | Retired. Chief Marketing Officer, Source (ETF) UK Services, Ltd, from 2015 to 2017. From 2012 to 2015, Principal of The Polisson Group, LLC, a management consulting, corporate advisory and principal investing company. Chief Executive Officer and Managing Director at Russell Investments, Global Exchange Traded Funds from 2010 to 2012. Managing Director of Barclays Global Investors from 1998 to 2010 and Global Chief Marketing Officer for iShares and Barclays Global Investors from 2000 to 2010. Trustee of the San Francisco Mechanics’ Institute, a non-profit organization, from 2013 to 2015. Board member of the Russell Exchange Traded Fund Trust from 2011 to 2012. Director of Barclays Global Investors Holdings Deutschland GmbH from 2006 to 2009. Mr. Polisson is an attorney and has a retired status with the Massachusetts and District of Columbia Bar Associations. | N/A | |||
Pamela Wheelock (Born 1959) | Trustee, since January 2020; previously Trustee from January 2018 to July 2019 | Board member of the Destination Medical Center Economic Development Agency, Rochester, Minnesota since 2019. Interim President of the McKnight Foundation from January to September 2020. Acting Commissioner, Minnesota Department of Human Services, July 2019 through September 2019. Human Services Manager (part-time), Minnesota Department of Human Services, October 2019 through December 2019. Chief Operating Officer, Twin Cities Habitat for Humanity from 2017 to 2019. Vice President of University Services, University of Minnesota from 2012 to 2016. Prior thereto, on the Board of Directors, Governance Committee and Finance Committee for the Minnesota Philanthropy Partners (Saint Paul Foundation) from 2012 to 2018, Interim Chief Executive Officer of Blue Cross Blue Shield of Minnesota from 2011 to 2012, Chairman of the Board from 2009 to 2012 and Board Director from 2003 to 2015. Vice President, Leadership and Community Engagement, Bush Foundation, Saint Paul, Minnesota (a private foundation) from 2009 to 2011. Executive Vice President and Chief Financial Officer, Minnesota Sports and Entertainment from 2004 to 2009 and Senior Vice President from 2002 to 2004. Executive Vice President of the Minnesota Wild Foundation from 2004 to 2008. Commissioner of Finance, State of Minnesota, from 1999 to 2002. Currently Board Chair of the Minnesota Wild Foundation since 2010. | N/A | |||
| * | Length of service dates reflect the Trustee’s commencement of service with the Trust’s predecessor entities, where applicable. |
32 | Wells Fargo Discovery Fund
Table of Contents
Other information (unaudited)
Officers
Name and year of birth | Position held and length of service | Principal occupations during past five years or longer | ||
Andrew Owen (Born 1960) | President, since 2017 | Executive Vice President of Wells Fargo & Company and Head of Affiliated Managers, Wells Fargo Asset Management, since 2014. In addition, Mr. Owen is currently President, Chief Executive Officer and Director of Wells Fargo Funds Management, LLC since 2017. Prior thereto, Executive Vice President responsible for marketing, investments and product development for Wells Fargo Funds Management, LLC, from 2009 to 2014. | ||
Nancy Wiser1 (Born 1967) | Treasurer, since 2012 | Executive Vice President of Wells Fargo Funds Management, LLC since 2011. Chief Operating Officer and Chief Compliance Officer at LightBox Capital Management LLC, from 2008 to 2011. | ||
Michelle Rhee (Born 1966) | Chief Legal Officer, since 2019 | Secretary of Wells Fargo Funds Management, LLC, Chief Legal Counsel of Wells Fargo Asset Management and Assistant General Counsel of Wells Fargo Bank, N.A. since 2018. Associate General Counsel and Managing Director of Bank of America Corporation from 2004 to 2018. | ||
Catherine Kennedy (Born 1969) | Secretary, since 2019 | Vice President of Wells Fargo Funds Management, LLC and Senior Counsel of the Wells Fargo Legal Department since 2010. Vice President and Senior Counsel of Evergreen Investment Management Company, LLC from 1998 to 2010. | ||
Michael H. Whitaker (Born 1967) | Chief Compliance Officer, since 2016 | Chief Compliance Officer of Wells Fargo Asset Management since 2016. Senior Vice President and Chief Compliance Officer for Fidelity Investments from 2007 to 2016. | ||
Jeremy DePalma1 (Born 1974) | Assistant Treasurer, since 2009 | Senior Vice President of Wells Fargo Funds Management, LLC since 2009. Senior Vice President of Evergreen Investment Management Company, LLC from 2008 to 2010 and head of the Fund Reporting and Control Team within Fund Administration from 2005 to 2010. | ||
| 1 | Nancy Wiser acts as Treasurer of 65 funds in the Fund Complex. Jeremy DePalma acts as the Treasurer of 77 funds and Assistant Treasurer of 65 funds in the Fund Complex. |
| 2 | The Statement of Additional Information includes additional information about the Trustees and is available, without charge, upon request, by calling 1-800-222-8222 or by visiting the website at wfam.com. |
Wells Fargo Discovery Fund | 33
Table of Contents
Other information (unaudited)
BOARD CONSIDERATION OF INVESTMENT MANAGEMENT AND SUB-ADVISORY AGREEMENTS:
Wells Fargo Discovery Fund
Under the Investment Company Act of 1940 (the “1940 Act”), the Board of Trustees (the “Board”) of Wells Fargo Funds Trust (the “Trust”) must determine annually whether to approve the continuation of the Trust’s investment management and sub-advisory agreements. In this regard, at a Board meeting held on May 26, 2020 and May 28, 2020 (together, the “Meeting”), the Board, all the members of which have no direct or indirect interest in the investment management and sub-advisory agreements and are not “interested persons” of the Trust, as defined in the 1940 Act (the “Independent Trustees”), reviewed and approved for Wells Fargo Discovery Fund (the “Fund”): (i) an investment management agreement (the “Management Agreement”) with Wells Fargo Funds Management, LLC (“Funds Management”); and (ii) an investment sub-advisory agreement (the “Sub-Advisory Agreement”) with Wells Capital Management Incorporated (the “Sub-Adviser”), an affiliate of Funds Management. The Management Agreement and the Sub-Advisory Agreement are collectively referred to as the “Advisory Agreements.”
At the Meeting, the Board considered the factors and reached the conclusions described below relating to the selection of Funds Management and the Sub-Adviser and the approval of the Advisory Agreements. Prior to the Meeting, including at a Board meeting held in April 2020, the Trustees conferred extensively among themselves and with representatives of Funds Management about these matters. Also, the Board has adopted a team-based approach, with each team consisting of a sub-set of Trustees, to assist the full Board in the discharge of its duties in reviewing investment performance and other matters throughout the year. The Independent Trustees were assisted in their evaluation of the Advisory Agreements by independent legal counsel, from whom they received separate legal advice and with whom they met separately.
In providing information to the Board, Funds Management and the Sub-Adviser were guided by a detailed set of requests for information submitted to them by independent legal counsel on behalf of the Independent Trustees at the start of the Board’s annual contract renewal process earlier in 2020. In considering and approving the Advisory Agreements, the Trustees considered the information they believed relevant, including but not limited to the information discussed below. The Board considered not only the specific information presented in connection with the Meeting, but also the knowledge gained over time through interaction with Funds Management and the Sub-Adviser about various topics. In this regard, the Board reviewed reports of Funds Management at each of its quarterly meetings, which included, among other things, portfolio reviews and investment performance reports. In addition, the Board and the teams mentioned above confer with portfolio managers at various times throughout the year. The Board did not identify any particular information or consideration that was all-important or controlling, and each individual Trustee may have attributed different weights to various factors.
After its deliberations, the Board unanimously approved the continuation of the Advisory Agreements for a one-year term and determined that the compensation payable to Funds Management and the Sub-Adviser under each of the Advisory Agreements was reasonable. The Board considered the approval of the Advisory Agreements for the Fund as part of its consideration of agreements for funds across the complex, but its approvals were made on a fund-by-fund basis. The following summarizes a number of important, but not necessarily all, factors considered by the Board in support of its approvals.
Nature, extent and quality of services
The Board received and considered various information regarding the nature, extent and quality of services provided to the Fund by Funds Management and the Sub-Adviser under the Advisory Agreements. This information included a description of the investment advisory services and Fund-level administrative services covered by the Management Agreement, as well as, among other things, a summary of the background and experience of senior management of Wells Fargo Asset Management (“WFAM”), of which Funds Management and the Sub-Adviser are a part, and a summary of investments made in the business of WFAM. The Board also received a description of Funds Management’s and the Sub-Adviser’s business continuity plans and of their approaches to data privacy and cybersecurity, and related testing. The Board also received and reviewed information about Funds Management’s role as administrator of the Fund’s liquidity risk management program, Funds Management’s approach to risk management, and Funds Management’s intermediary and vendor oversight program.
The Board also considered the qualifications, background, tenure and responsibilities of each of the portfolio managers primarily responsible for the day-to-day portfolio management of the Fund. The Board evaluated the ability of Funds Management and the Sub-Adviser to attract and retain qualified investment professionals, including research, advisory and supervisory personnel. The Board further considered the compliance programs and compliance records of Funds Management and the Sub-Adviser. In addition, the Board took into account the full range of services provided to the Fund by Funds Management and its affiliates.
34 | Wells Fargo Discovery Fund
Table of Contents
Other information (unaudited)
Fund investment performance and expenses
The Board considered the investment performance results for the Fund over various time periods ended December 31, 2019. The Board also considered more current results for various time periods ended March 31, 2020. The Board considered these results in comparison to the investment performance of funds in a universe that was determined by Broadridge Inc. (“Broadridge”) to be similar to the Fund (the “Universe”), and in comparison to the Fund’s benchmark index and to other comparative data. Broadridge is an independent provider of investment company data. The Board received a description of the methodology used by Broadridge to select the mutual funds in the performance Universe. The Board noted that the investment performance of the Fund (Administrator Class) was higher than the average investment performance of the Universe for the one-, three-, five- and ten-year periods ended December 31, 2019. The Board also noted that the investment performance of the Fund (Administrator Class) was higher than the average investment performance of the Universe for all periods ended March 31, 2020. The Board also noted that the investment performance of the Fund was higher than its benchmark index, the Russell 2500™ Growth Index, for all periods ended December 31, 2019. The Board also noted that the investment performance of the Fund was higher than its benchmark index, the Russell 2500™ Growth Index, for all periods ended March 31, 2020.
The Board also received and considered information regarding the Fund’s net operating expense ratios and their various components, including actual management fees, custodian and other non-management fees, and Rule 12b-1 and non-Rule 12b-1 shareholder service fees. The Board considered these ratios in comparison to the median ratios of funds in class-specific expense groups that were determined by Broadridge to be similar to the Fund (the “Groups”). The Board received a description of the methodology used by Broadridge to select the mutual funds in the expense Groups and an explanation of how funds comprising expense groups and their expense ratios may vary from year-to-year. Based on the Broadridge reports, the Board noted that the net operating expense ratios of the Fund were equal to or in range of the median net operating expense ratios of the expense Groups for each share class.
The Board took into account the Fund’s investment performance and expense information provided to it among the factors considered in deciding to re-approve the Advisory Agreements.
Investment management and sub-advisory fee rates
The Board reviewed and considered the contractual fee rates payable by the Fund to Funds Management under the Management Agreement, as well as the contractual fee rates payable by the Fund to Funds Management for class-level administrative services under a Class-Level Administration Agreement, which include, among other things, class-level transfer agency and sub-transfer agency costs (collectively, the “Management Rates”). The Board also reviewed and considered the contractual investment sub-advisory fee rates that are payable by Funds Management to the Sub-Adviser for investment sub-advisory services.
Among other information reviewed by the Board was a comparison of the Fund’s Management Rates with the average contractual investment management fee rates of funds in the expense Groups at a common asset level as well as transfer agency costs of the funds in the expense Groups. The Board noted that the Management Rates of the Fund were in range of the sum of these average rates for the Fund’s expense Groups for all share classes.
The Board also received and considered information about the portion of the total management fee that was retained by Funds Management after payment of the fee to the Sub-Adviser for sub-advisory services. In assessing the reasonableness of this amount, the Board received and evaluated information about the nature and extent of responsibilities retained and risks assumed by Funds Management and not delegated to or assumed by the Sub-Adviser, and about Funds Management’s on-going oversight services. Given the affiliation between Funds Management and the Sub-Adviser, the Board ascribed limited relevance to the allocation of fees between them.
The Board also received and considered information about the nature and extent of services offered and fee rates charged by Funds Management and the Sub-Adviser to other types of clients with investment strategies similar to those of the Fund. In this regard, the Board received information about the significantly greater scope of services, and compliance, reporting and other legal burdens and risks of managing proprietary mutual funds compared with those associated with managing assets of other types of clients, including third-party sub-advised fund clients and non-mutual fund clients such as institutional separate accounts.
Based on its consideration of the factors and information it deemed relevant, including those described here, the Board determined that the compensation payable to Funds Management under the Management Agreement and to the Sub-Adviser under the Sub-Advisory Agreement was reasonable.
Profitability
The Board received and considered information concerning the profitability of Funds Management, as well as the profitability of both WFAM and Wells Fargo & Co. (“Wells Fargo”) from providing services to the fund family as a whole. The Board noted that the Sub-Adviser’s profitability information with respect to providing services to the Fund and other funds in the family was subsumed in the WFAM and Wells Fargo profitability analysis.
Wells Fargo Discovery Fund | 35
Table of Contents
Other information (unaudited)
Funds Management reported on the methodologies and estimates used in calculating profitability, including a description of the methodology used to allocate certain expenses. Among other things, the Board noted that the levels of profitability reported on a fund-by-fund basis varied widely, depending on factors such as the size, type and age of fund.
Based on its review, the Board did not deem the profits reported by Funds Management, WFAM or Wells Fargo from services provided to the Fund to be at a level that would prevent it from approving the continuation of the Advisory Agreements.
Economies of scale
The Board received and considered information about the potential for Funds Management to experience economies of scale in the provision of management services to the Fund, the difficulties of calculating economies of scale at an individual fund level, and the extent to which potential scale benefits are shared with shareholders. The Board noted the existence of breakpoints in the Fund’s management fee structure, which operate generally to reduce the Fund’s expense ratios as the Fund grows in size, and the size of the Fund in relation to such breakpoints. The Board considered that in addition to management fee breakpoints, Funds Management shares potential economies of scale from its management business in a variety of ways, including through fee waiver and expense reimbursement arrangements, services that benefit shareholders, competitive management fee rates set at the outset without regard to breakpoints, and investments in the business intended to enhance services available to shareholders.
The Board concluded that Funds Management’s arrangements with respect to the Fund, including contractual breakpoints, constituted a reasonable approach to sharing potential economies of scale with the Fund and its shareholders.
Other benefits to Funds Management and the Sub-Adviser
The Board received and considered information regarding potential “fall-out” or ancillary benefits received by Funds Management and its affiliates, including the Sub-Adviser, as a result of their relationships with the Fund. Ancillary benefits could include, among others, benefits directly attributable to other relationships with the Fund and benefits potentially derived from an increase in Funds Management’s and the Sub-Adviser’s business as a result of their relationships with the Fund. The Board noted that various affiliates of Funds Management may receive distribution-related fees, shareholder servicing payments and sub-transfer agency fees in respect of shares sold or held through them and services provided.
The Board also reviewed information about soft dollar credits earned and utilized by the Sub-Adviser, fees earned by Funds Management and the Sub-Adviser from managing a private investment vehicle for the fund family’s securities lending collateral, and commissions earned by an affiliated broker from portfolio transactions.
Based on its consideration of the factors and information it deemed relevant, including those described here, the Board did not find that any ancillary benefits received by Funds Management and its affiliates, including the Sub-Adviser, were unreasonable.
Conclusion
At the Meeting, after considering the above-described factors and based on its deliberations and its evaluation of the information described above, the Board unanimously approved the continuation of the Advisory Agreements for a one-year term and determined that the compensation payable to Funds Management and the Sub-Adviser under each of the Advisory Agreements was reasonable.
36 | Wells Fargo Discovery Fund
Table of Contents
Other information (unaudited)
LIQUIDITY RISK MANAGEMENT PROGRAM
In accordance with Rule 22e-4 under the Investment Company Act of 1940, as amended (the “Liquidity Rule”), Wells Fargo Funds Trust (the “Trust”) has adopted and implemented a liquidity risk management program (the “Program”) on behalf of each of its series, including the Fund, which is reasonably designed to assess and manage the Fund’s liquidity risk. “Liquidity risk” is defined as the risk that the Fund is unable to meet redemption requests without significantly diluting remaining investors’ interests in the Fund. The Trust’s Board of Trustees (the “Board”) previously approved the designation of Wells Fargo Funds Management, LLC (“Funds Management”), the Fund’s investment manager, as the administrator of the Program, and Funds Management has established a Liquidity Risk Management Council composed of personnel from multiple departments within Funds Management and its affiliates to assist Funds Management in the implementation and on-going administration of the Program.
The Program is comprised of various components designed to support the assessment and/or management of liquidity risk, including: (1) the periodic assessment (no less frequently than annually) of certain factors that influence the Fund’s liquidity risk; (2) the periodic classification (no less frequently than monthly) of the Fund’s investments into one of four liquidity categories that reflect an estimate of their liquidity under current market conditions; (3) a 15% limit on the acquisition of “illiquid investments” (as defined under the Liquidity Rule); (4) to the extent the Fund does not invest primarily in “highly liquid investments” (as defined under the Liquidity Rule), the determination of a minimum percentage of the Fund’s assets that generally will be invested in highly liquid investments (an “HLIM”); (5) if the Fund has established an HLIM, the periodic review (no less frequently than annually) of the HLIM and the adoption of policies and procedures for responding to a shortfall of the Fund’s “highly liquid investments” below its HLIM; and (6) periodic reporting to the Board.
At a meeting of the Board held on May 26 and 28, 2020, the Board received a written report (the “Report”) from Funds Management that addressed the operation of the Program and assessed its adequacy and effectiveness of implementation. The Report covered the initial period from December 1, 2018 through December 31, 2019 (the “Reporting Period”). No significant liquidity events impacting the Fund were noted in the Report. There were no material changes to the Program during the Reporting Period. The Report concluded that the Program is operating effectively to assess and manage the Fund’s liquidity risk, and that the Program has been and continues to be adequately and effectively implemented to monitor and, as applicable, respond to the Fund’s liquidity developments.
There can be no assurance that the Program will achieve its objectives under all circumstances in the future. Please refer to the Fund’s prospectus for more information regarding the Fund’s exposure to liquidity risk and other risks to which an investment in the Fund may be subject.
Wells Fargo Discovery Fund | 37
Table of Contents
Effective June 1, 2020, shareholders purchasing Fund shares through an Oppenheimer & Co. Inc. (“Oppenheimer”) platform or account are eligible only for the following load waivers (front-end sales charge waivers and contingent deferred or back-end, sales charge waivers) and discounts, which may differ from those disclosed in the Fund’s Prospectus or SAI.
| Front-end Sales Load Waivers on Class A Shares available at Oppenheimer |
| Employer-sponsored retirement, deferred compensation and employee benefit plans (including health savings accounts) and trusts used to fund those plans, provided that the shares are not held in a commission-based brokerage account and shares are held for the benefit of the plan. |
| Shares purchased by or through a 529 Plan. |
| Shares purchased through an Oppenheimer affiliated investment advisory program. |
| Shares purchased through reinvestment of capital gains distributions and dividend reinvestment when purchasing shares of the same fund (but not any other fund within the fund family). |
| Shares purchased from the proceeds of redemptions within the same fund family, provided (1) the repurchase occurs within 90 days following the redemption, (2) the redemption and purchase occur in the same account, and (3) redeemed shares were subject to a front-end or deferred sales load (known as Rights of Restatement). |
| A shareholder in the Fund’s Class C shares will have their shares exchanged at net asset value to Class A shares (or the appropriate share class) of the Fund if the shares are no longer subject to a CDSC and the exchange is in line with the policies and procedures of Oppenheimer. |
| Employees and registered representatives of Oppenheimer or its affiliates and their family members. |
| Directors or Trustees of the Fund, and employees of the Fund’s investment adviser or any of its affiliates, as described in the Prospectus. |
| CDSC Waivers on A and C Shares available at Oppenheimer |
| Death or disability of the shareholder. |
| Shares sold as part of a systematic withdrawal plan as described in the Prospectus. |
| Return of excess contributions from an IRA Account. |
| Shares sold as part of a required minimum distribution for IRA and retirement accounts due to the shareholder reaching the qualified age based on applicable IRS regulations as described in the Prospectus. |
| Shares sold to pay Oppenheimer fees but only if the transaction is initiated by Oppenheimer. |
| Shares acquired through a right of reinstatement. |
| Front-end load Discounts Available at Oppenheimer: Breakpoints, Rights of Accumulation & Letters of Intent |
| Breakpoints as described in the Prospectus. |
| Rights of Accumulation (ROA), which entitle shareholders to breakpoint discounts, will be automatically calculated based on the aggregated holding of fund family assets held by accounts within the purchaser’s household at Oppenheimer. Eligible fund family assets not held at Oppenheimer may be included in the ROA calculation only if the shareholder notifies his or her financial advisor about such assets. |
38 | Wells Fargo Discovery Fund
Table of Contents
Effective June 15, 2020, shareholders purchasing fund shares through a Robert W. Baird & Co. (“Baird”) platform or account will only be eligible for the following sales charge waivers (front-end sales charge waivers and CDSC waivers) and discounts, which may differ from those disclosed elsewhere in the Fund’s Prospectus or the SAI.
| Front-end Sales Load Waivers on Class A Shares available at Baird |
| Shares purchased through reinvestment of capital gains distributions and dividend reinvestment when purchasing share of the same fund. |
| Share purchase by employees and registers representatives of Baird or its affiliate and their family members as designated by Baird. |
| Shares purchase from the proceeds of redemptions within the same fund family, provided (1) the repurchase occurs within 90 days following the redemption, (2) the redemption and purchase occur in the same accounts, and (3) redeemed shares were subject to a front-end or deferred sales charge (known as rights of reinstatement). |
| A shareholder in the Funds Investor C Shares will have their share exchanged at net asset value to Investor A shares of the fund if the shares are no longer subject to CDSC and the exchange is in line with the policies and procedures of Baird. |
| Employer-sponsored retirement plans or charitable accounts in a transactional brokerage account at Baird, including 401(k) plans, 457 plans, employer-sponsored 403(b) plans, profit sharing and money purchase pension plans and defined benefit plans. For purposes of this provision, employer-sponsored retirement plans do not include SEP IRAs, Simple IRAs or SAR-SEPs. |
| CDSC Waivers on A and C Shares available at Baird |
| Shares sold due to death or disability of the shareholder. |
| Shares sold as part of a systematic withdrawal plan as described in the Fund’s Prospectus. |
| Shares bought due to returns of excess contributions from an IRA Account. |
| Shares sold as part of a required minimum distribution for IRA and retirement accounts due to the shareholder reaching age 72 as described in the Fund’s Prospectus. |
| Shares sold to pay Baird fees but only if the transaction is initiated by Baird. |
| Shares acquired through a right of reinstatement. |
| Front-end load Discounts Available at Baird: Breakpoint and/or Rights of Accumulation |
| Breakpoints as described in the Prospectus. |
| Rights of accumulations which entitles shareholders to breakpoint discounts will be automatically calculated based on the aggregated holding of fund family assets held by accounts within the purchaser’s household at Baird. Eligible fund family assets not held at Baird may be included in the rights of accumulations calculation only if the shareholder notifies his or her financial advisor about such assets. |
| Letters of Intent (LOI) allow for breakpoint discounts based on anticipated purchases within a fund family through Baird, over a 13-month period of time. |
Wells Fargo Discovery Fund | 39
Table of Contents
This page is intentionally left blank.
Table of Contents
For more information
More information about Wells Fargo Funds is available free upon request. To obtain literature, please write, visit the Fund’s website, or call:
Wells Fargo Funds
P.O. Box 219967
Kansas City, MO 64121-9967
Website: wfam.com
Individual investors: 1-800-222-8222
Retail investment professionals: 1-888-877-9275
Institutional investment professionals: 1-866-765-0778

This report and the financial statements contained herein are submitted for the general information of the shareholders of the Fund. If this report is used for promotional purposes, distribution of the report must be accompanied or preceded by a current prospectus. Before investing, please consider the investment objectives, risks, charges, and expenses of the investment. For a current prospectus and, if available, a summary prospectus, containing this information, call 1-800-222-8222 or visit the Fund’s website at wfam.com. Read the prospectus carefully before you invest or send money.
Wells Fargo Asset Management (WFAM) is the trade name for certain investment advisory/management firms owned by Wells Fargo & Company. These firms include but are not limited to Wells Capital Management Incorporated and Wells Fargo Funds Management, LLC. Certain products managed by WFAM entities are distributed by Wells Fargo Funds Distributor, LLC (a broker-dealer and Member FINRA).
This material is for general informational and educational purposes only and is NOT intended to provide investment advice or a recommendation of any kind—including a recommendation for any specific investment, strategy, or plan.
INVESTMENT PRODUCTS: NOT FDIC INSURED ◾ NO BANK GUARANTEE ◾ MAY LOSE VALUE
© 2020 Wells Fargo & Company. All rights reserved.
PAR-1020-00570 11-20
A230/AR230 09-20
Table of Contents

Annual Report
September 30, 2020
Wells Fargo Enterprise Fund
Beginning on January 1, 2021, as permitted by new regulations adopted by the Securities and Exchange Commission, paper copies of the Wells Fargo Funds’ annual and semi-annual shareholder reports issued after this date will no longer be sent by mail, unless you specifically request paper copies of the reports. Instead, the reports will be made available on the Funds’ website, and you will be notified by mail each time a report is posted and provided with a website address to access the report.
If you already elected to receive shareholder reports electronically, you will not be affected by this change and you need not take any action. You may elect to receive shareholder reports and other communications from the Fund electronically at any time by contacting your financial intermediary (such as a broker-dealer or bank) or, if you are a direct investor, by calling 1-800-222-8222 or by enrolling at wellsfargo.com/advantagedelivery.
You may elect to receive all future reports in paper free of charge. If you invest through a financial intermediary, you can contact your financial intermediary to request that you continue to receive paper copies of your shareholder reports; if you invest directly with the Fund, you can call 1-800-222-8222. Your election to receive reports in paper will apply to all Wells Fargo Funds held in your account with your financial intermediary or, if you are a direct investor, to all Wells Fargo Funds that you hold.
Table of Contents
|
Reduce clutter. Save trees. |
Sign up for electronic delivery of prospectuses and |
The views expressed and any forward-looking statements are as of September 30, 2020, unless otherwise noted, and are those of the Fund’s portfolio managers and/or Wells Fargo Asset Management. Discussions of individual securities, or the markets generally, or any Wells Fargo Fund are not intended as individual recommendations. Future events or results may vary significantly from those expressed in any forward-looking statements. The views expressed are subject to change at any time in response to changing circumstances in the market. Wells Fargo Asset Management and the Fund disclaim any obligation to publicly update or revise any views expressed or forward-looking statements.
INVESTMENT PRODUCTS: NOT FDIC INSURED ◾ NO BANK GUARANTEE ◾ MAY LOSE VALUE
Wells Fargo Enterprise Fund | 1
Table of Contents
Letter to shareholders (unaudited)

Andrew Owen
President
Wells Fargo Funds
Dear Shareholder:
We are pleased to offer you this annual report for the Wells Fargo Enterprise Fund for the 12-month period that ended September 30, 2020. Global stock markets saw earlier gains erased in March as governments around the world took unprecedented measures, attempting to stop the spread of COVID-19 at the expense of short-term economic output. However, markets rallied strongly from April on to more than offset those short-term losses as central banks bolstered capital markets and confidence.
For the 12-month period, equities had broadly positive total returns despite intense volatility in March. Non-U.S. developed market equities had weaker performance than emerging market and U.S. stocks. While gains from fixed-income securities were positive, they were more modest than equities. For the period, U.S. stocks, based on the S&P 500 Index,1 gained 15.15%. International stocks, as measured by the MSCI ACWI ex USA Index (Net),2 returned 3.00%, while the MSCI EM Index (Net)3 had stronger performance, with a 10.54% gain. For bond investors, the Bloomberg Barclays U.S. Aggregate Bond Index4 returned 6.98%, the Bloomberg Barclays Global Aggregate ex-USD Index5 gained 5.48%, and the Bloomberg Barclays Municipal Bond Index6 returned 4.09% while the ICE BofA U.S. High Yield Index7 returned 2.30%.
The period began with mixed economic readings.
The fourth quarter of 2019 started on a strong note. U.S.-China trade tensions, which had been building for months, relaxed in October; optimism rose for a U.K. Brexit deal; and macroeconomic data turned positive. The initial estimate of U.S. third-quarter gross domestic product (GDP) growth was a resilient 1.9% annualized rate, while the U.S. unemployment rate fell to a 50-year low of 3.5% in September. However, despite strength among U.S. consumers, business confidence declined while manufacturing activity contracted. Concerned with a potential economic slowdown, the U.S. Federal Reserve (Fed) lowered interest rates a quarter point in late October—its third rate cut in four months. This helped push the S&P 500 Index to an all-time high while emerging market equities rallied and global bonds declined overall, reflecting a broad pickup in risk appetite.
Equity markets continued to rally in November despite ongoing geopolitical risks. Hopes for a U.S.-China trade deal buoyed investor confidence. U.S. business sentiment improved slightly and manufacturing and services activity picked up. While consumer confidence and purchasing managers’ activity rose in the eurozone, China reported weakening manufacturing and consumer data. Bond yields rose marginally, leading to slightly negative returns for global government and investment-grade corporate bonds.
| 1 | The S&P 500 Index consists of 500 stocks chosen for market size, liquidity, and industry group representation. It is a market-value-weighted index with each stock’s weight in the index proportionate to its market value. You cannot invest directly in an index. |
| 2 | The Morgan Stanley Capital International (MSCI) All Country World Index (ACWI) ex USA Index (Net) is a free-float-adjusted market-capitalization-weighted index that is designed to measure the equity market performance of developed and emerging markets, excluding the United States. Source: MSCI. MSCI makes no express or implied warranties or representations and shall have no liability whatsoever with respect to any MSCI data contained herein. The MSCI data may not be further redistributed or used as a basis for other indices or any securities or financial products. This report is not approved, reviewed, or produced by MSCI. You cannot invest directly in an index. |
| 3 | The MSCI Emerging Markets (EM) Index (Net) is a free-float-adjusted market-capitalization-weighted index that is designed to measure equity market performance of emerging markets. You cannot invest directly in an index. |
| 4 | The Bloomberg Barclays U.S. Aggregate Bond Index is a broad-based benchmark that measures the investment-grade, U.S. dollar-denominated, fixed-rate taxable bond market, including Treasuries, government-related and corporate securities, mortgage-backed securities (agency fixed-rate and hybrid adjustable-rate mortgage pass-throughs), asset-backed securities, and commercial mortgage-backed securities. You cannot invest directly in an index. |
| 5 | The Bloomberg Barclays Global Aggregate ex-USD Index is an unmanaged index that provides a broad-based measure of the global investment-grade fixed-income markets excluding the U.S. dollar-denominated debt market. You cannot invest directly in an index. |
| 6 | The Bloomberg Barclays Municipal Bond Index is an unmanaged index composed of long-term tax-exempt bonds with a minimum credit rating of Baa. You cannot invest directly in an index. |
| 7 | The ICE BofA U.S. High Yield Index is a market-capitalization-weighted index of domestic and Yankee high-yield bonds. The index tracks the performance of high-yield securities traded in the U.S. bond market. You cannot invest directly in an index. Copyright 2020. ICE Data Indices, LLC. All rights reserved. |
2 | Wells Fargo Enterprise Fund
Table of Contents
Letter to shareholders (unaudited)
Financial markets ended 2019 with a boost from the U.S. and China accord on a Phase One trade deal. That, along with the landslide win by the pro-Brexit U.K. Conservative Party in a national election and ongoing central bank support, gave investors greater confidence. U.S. economic indicators were generally positive, with the exception of manufacturing activity and business confidence. Consumer confidence was resilient, fed by a robust labor market, tame inflation, and lower interest rates, which boosted housing affordability and stimulated homebuyer activity. The impeachment of President Trump had little impact on the markets. Meanwhile, slowing Chinese economic activity, partly attributable to the trade war, led to further government stimulus at year-end through lower reserve ratios, allowing banks to lend more money.
The year-end rally continued in early January 2020. However, capital market volatility spiked in late January on concerns over the potential impact of COVID-19 on the global economy and stock markets. With sentiment somewhat souring, perceived safe havens did well in January. The U.S. dollar and Japanese yen both rose and government bonds outperformed equities. While the S&P 500 Index held its ground, emerging market equities tumbled, including those in Asia.
In February, COVID-19 became the major market focus. Fears of the virus’s impact on Chinese and global growth led to expectations of increased global central bank monetary policy support. That led the 10-year U.S. Treasury yield to fall to an all-time low of 1.1%. Although equity markets initially shrugged off concerns about the outbreak, focusing instead on strong fourth-quarter earnings and improving business confidence in January, market sentiment turned sharply lower and the S&P 500 Index lost 8.2% for the month. Oil prices tumbled as Russia and the Organization of the Petroleum Exporting Countries compounded a major decline in oil demand with a brutal price war, partly aimed at dissuading further U.S. shale production, causing the price of West Texas Intermediate crude oil to plummet.
The global spread of COVID-19 led country after country to clamp down on social and business-related activity in order to contain the virus from causing even greater devastation and overwhelming health care systems. This abrupt stoppage of economic activity led to the sharp deceleration of global output, sending economies into a deep contraction. Central banks responded swiftly, slashing interest rates and expanding quantitative easing programs to restore liquidity and confidence to the markets. In the U.S., the Fed introduced several new lending programs, funding investment-grade bonds, money market mutual funds, and commercial paper while purchasing Treasuries, mortgage-backed securities, and overnight repurchase agreements. Meanwhile, stock markets tumbled quickly into a bear market, ending the longest bull stock market in U.S. history.
Markets rebounded strongly in April, fueled by unprecedented government and central bank stimulus measures. The U.S. economy contracted by an annualized 5.0% pace in the first quarter, with 30 million new unemployment insurance claims in six weeks. In the eurozone, first-quarter real GDP shrank 3.8%, with the composite April Flash Purchasing Managers’ Index (PMI), a monthly survey of purchasing managers, falling to an all-time low of 13.5. The European Central Bank expanded its quantitative easing to include the purchase of additional government bonds of countries with the greatest virus-related need, including Italy and Spain. China’s first-quarter GDP fell by 6.8% year over year. However, retail sales, production, and investment showed signs of recovery. Extreme oil-price volatility continued as global supply far exceeded demand.
The global equity market rebound continued in May, with widespread strong monthly gains. Investors regained confidence on reports of early signs of success in human trials of a COVID-19 vaccine. Growth stocks continued to outperform value stocks while returns on global government bonds were generally flat. In the U.S., a gap grew between the stock market rebound and devastating economic data points, including an April unemployment rate of 14.7%, the highest level since World War II. PMIs reflected
“The global spread of COVID-19 led country after country to clamp down on social and business-related activity in order to contain the virus from causing even greater devastation and overwhelming health care systems.”
Wells Fargo Enterprise Fund | 3
Table of Contents
Letter to shareholders (unaudited)
“The stock market continued to rally in August despite concerns over rising numbers of COVID-19 cases in the United States and several European countries, including France and Spain, as well as the expiration of the $600 weekly bonus unemployment benefit at the end of July.”
weakening activity in May in both the manufacturing and services sectors. U.S. corporate earnings reports indicated a 14% year-over-year contraction in earnings from the first quarter of 2019. However, high demand for technology, driven by remote activity, supported robust information technology sector earnings, which helped drive major technology stocks higher.
Financial markets posted widely positive returns in June despite ongoing economic weakness and high levels of uncertainty on the containment of COVID-19 and the timing of an effective vaccine. There were hopeful signs as economies reopened, with both U.S. and U.K. retail sales rebounding sharply in May. However, year over year, sales remained depressed. Vitally important to market sentiment was the ongoing commitment by central banks globally to do all they could to provide economic support through liquidity and low borrowing costs. U.S. economic activity was aided by one-time $1,200 stimulus checks and $600 bonus weekly unemployment benefits that expired at the end of July. However, unemployment remained historically high, easing somewhat from 14.7% in April to 11.1% in June. By month-end, numerous states reported increases of COVID-19 cases. China’s economic recovery picked up momentum in June, though it remained far from a full recovery.
July was a broadly positive month for both global equities and fixed income. However, economic data and a resurgence of COVID-19 cases pointed to the vulnerability of the global economy and the ongoing imperative to regain control of the pandemic. Second-quarter GDP shrank from the previous quarter by 9.5% and 12.1% in the U.S. and the eurozone, respectively. In contrast, China reported a 3.2% year-over-year expansion in its second-quarter GDP. U.S. unemployment remained high despite adding 1.8 million jobs in July, with a double-digit jobless rate persisting. However, manufacturing activity grew in both the U.S. and the eurozone. In Asia, while China’s manufacturing sector continued to expand, activity in Japan and South Korea contracted. In July, a rising concern was the rapid and broad reemergence of COVID-19 infections.
The stock market continued to rally in August despite concerns over rising numbers of COVID-19 cases in the United States and several European countries, including France and Spain, as well as the expiration of the $600 weekly bonus unemployment benefit at the end of July. U.S. stocks had strong monthly gains, led by the FAANG stocks—Facebook, Apple, Amazon, Netflix, and Google (Alphabet)—which dominate these indices and continued to rally. U.S. stocks generally surpassed other broadly positive global equity performance while fixed-income market monthly returns were broadly flat. Generally stronger-than-expected second-quarter earnings boosted investor sentiment along with the Fed’s announcement of a policy shift that will likely lead to longer-term low interest rates and supportive monetary policy. The U.S. Flash PMIs for both manufacturing and services beat expectations while U.S. housing market indicators were strong. In Europe, retail sales expanded and consumer confidence remained steady. China’s economy continued its fairly steady expansion. Overall, developed markets performed better than emerging market equities for the month of August as people took comfort in better-known equities in perceived safer markets.
Stocks grew more volatile in September on mixed economic data. U.S. PMIs showed solid growth in economic activity in both manufacturing and services. However, six months after the bottom fell out of the labor market in the early spring, only half of the 22 million jobs lost had returned. The U.S. unemployment rate fell to 7.9% in September, the fifth straight month of improvement but far higher than the 3.5% pre-COVID-19 rate. Only 661,000 jobs were added for the month, down from 1.5 million in August. Meanwhile, a reported 2.3 million people have given up looking for work. With U.S. Congress failing to pass further fiscal relief and uncertainties surrounding a possible vaccine, doubts crept back into the financial markets. In the U.K., a lack of progress in Brexit talks with the European Union weighed on markets. China’s economy picked up steam, however, with growth fueled by increased global demand, and China’s service sector had its strongest PMI reading in seven years.
4 | Wells Fargo Enterprise Fund
Table of Contents
Letter to shareholders (unaudited)
Don’t let short-term uncertainty derail long-term investment goals.
Periods of investment uncertainty can present challenges, but experience has taught us that maintaining long-term investment goals can be an effective way to plan for the future. To help you create a sound strategy based on your personal goals and risk tolerance, Wells Fargo Funds offers more than 100 mutual funds spanning a wide range of asset classes and investment styles. Although diversification cannot guarantee an investment profit or prevent losses, we believe it can be an effective way to manage investment risk and potentially smooth out overall portfolio performance. We encourage investors to know their investments and to understand that appropriate levels of risk-taking may unlock opportunities.
Thank you for choosing to invest with Wells Fargo Funds. We appreciate your confidence in us and remain committed to helping you meet your financial needs.
Sincerely,

Andrew Owen
President
Wells Fargo Funds
|
For further information about your Fund, contact your investment professional, visit our website at wfam.com, or call us directly at 1-800-222-8222. |
Notice to Shareholders
At a meeting held on August 10-12, 2020, the Board of Trustees of the Fund approved a change to the Fund’s automatic conversion feature for Class C shares in order to shorten the required holding period from 10 to 8 years. As a result, on a monthly basis beginning November 5, 2020, Class C shares will convert automatically into Class A shares 8 years after the initial date of purchase or, if you acquired your Class C shares through an exchange or conversion from another share class, 8 years after the date you acquired your Class C shares. When Class C shares that you acquired through a purchase or exchange convert, any other Class C shares that you purchased with reinvested dividends and distributions also will convert into Class A shares on a pro rata basis.
Please note that a shorter holding period may apply depending on your intermediary. Please see “Appendix A—Sales Charge Reductions and Waivers for Certain Intermediaries” in the Fund’s prospectus for further information.
Wells Fargo Enterprise Fund | 5
Table of Contents
Performance highlights (unaudited)
Investment objective
The Fund seeks long-term capital appreciation.
Manager
Wells Fargo Funds Management, LLC
Subadviser
Wells Capital Management Incorporated
Portfolio managers
Michael T. Smith, CFA®‡
Christopher J. Warner, CFA®‡
Average annual total returns (%) as of September 30, 2020
| Including sales charge | Excluding sales charge | Expense ratios1 (%) | ||||||||||||||||||||||||||||||||
| Inception date | 1 year | 5 year | 10 year | 1 year | 5 year | 10 year | Gross | Net2 | ||||||||||||||||||||||||||
| Class A (SENAX) | 2-24-2000 | 29.30 | 17.37 | 14.34 | 37.19 | 18.78 | 15.02 | 1.25 | 1.18 | |||||||||||||||||||||||||
| Class C (WENCX) | 3-31-2008 | 35.13 | 17.88 | 14.17 | 36.13 | 17.88 | 14.17 | 2.00 | 1.93 | |||||||||||||||||||||||||
| Class R6 (WENRX)3 | 10-31-2014 | – | – | – | 37.69 | 19.23 | 15.44 | 0.82 | 0.80 | |||||||||||||||||||||||||
| Administrator Class (SEPKX) | 8-30-2002 | – | – | – | 37.29 | 18.87 | 15.13 | 1.17 | 1.10 | |||||||||||||||||||||||||
| Institutional Class (WFEIX) | 6-30-2003 | – | – | – | 37.63 | 19.17 | 15.41 | 0.92 | 0.85 | |||||||||||||||||||||||||
| Russell Midcap® Growth Index4 | – | – | – | – | 23.23 | 15.53 | 14.55 | – | – | |||||||||||||||||||||||||
Figures quoted represent past performance, which is no guarantee of future results, and do not reflect taxes that a shareholder may pay on an investment in a fund. Investment return and principal value of an investment will fluctuate so that an investor’s shares, when redeemed, may be worth more or less than their original cost. Performance shown without sales charges would be lower if sales charges were reflected. Current performance may be lower or higher than the performance data quoted, which assumes the reinvestment of dividends and capital gains. Current month-end performance is available on the Fund’s website, wfam.com.
Please keep in mind that high double-digit returns were primarily achieved during favorable market conditions. You should not expect that such favorable returns can be consistently achieved. A fund’s performance, especially for short time periods, should not be the sole factor in making your investment decision.
Index returns do not include transaction costs associated with buying and selling securities, any mutual fund fees or expenses, or any taxes. It is not possible to invest directly in an index.
For Class A shares, the maximum front-end sales charge is 5.75%. For Class C shares, the maximum contingent deferred sales charge is 1.00%. Performance including a contingent deferred sales charge assumes the sales charge for the corresponding time period. Class R6, Administrator Class, and Institutional Class shares are sold without a front-end sales charge or contingent deferred sales charge.
Stock values fluctuate in response to the activities of individual companies and general market and economic conditions. Smaller-company stocks tend to be more volatile and less liquid than those of larger companies. Certain investment strategies tend to increase the total risk of an investment (relative to the broader market). The Fund is exposed to foreign investment risk. Consult the Fund’s prospectus for additional information on these and other risks.
Please see footnotes on page 7.
6 | Wells Fargo Enterprise Fund
Table of Contents
Performance highlights (unaudited)
| Growth of $10,000 investment as of September 30, 20205 |
|
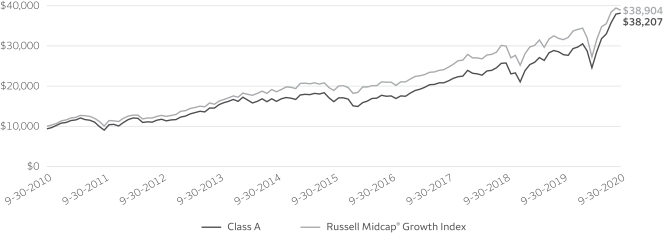
| ‡ | CFA® and Chartered Financial Analyst® are trademarks owned by CFA Institute. |
| 1 | Reflects the expense ratios as stated in the most recent prospectuses. The expense ratios shown are subject to change and may differ from the annualized expense ratios shown in the financial highlights of this report. |
| 2 | The manager has contractually committed through January 31, 2021, to waive fees and/or reimburse expenses to the extent necessary to cap total annual fund operating expenses after fee waivers at 1.18% for Class A, 1.93% for Class C, 0.80% for Class R6, 1.10% for Administrator Class, and 0.85% for Institutional Class. Brokerage commissions, stamp duty fees, interest, taxes, acquired fund fees and expenses (if any), and extraordinary expenses are excluded from the expense caps. Prior to or after the commitment expiration date, the caps may be increased or the commitment to maintain the caps may be terminated only with the approval of the Board of Trustees. Without these caps, the Fund’s returns would have been lower. The expense ratio paid by an investor is the net expense ratio (the total annual fund operating expenses after fee waivers) as stated in the prospectuses. |
| 3 | Historical performance shown for the Class R6 shares prior to their inception reflects the performance of the Institutional Class shares, and includes the higher expenses applicable to the Institutional Class shares. If these expenses had not been included, returns for the Class R6 shares would be higher. |
| 4 | The Russell Midcap® Growth Index measures the performance of those Russell Midcap companies with higher price/book ratios and higher forecasted growth values. The stocks are also members of the Russell 1000® Growth index. You cannot invest directly in an index. |
| 5 | The chart compares the performance of Class A shares for the most recent ten years with the Russell Midcap® Growth Index. The chart assumes a hypothetical investment of $10,000 in Class A shares and reflects all operating expenses and assumes the maximum initial sales charge of 5.75%. |
| 6 | The ten largest holdings, excluding cash, cash equivalents and any money market funds, are calculated based on the value of the investments divided by total net assets of the Fund. Holdings are subject to change and may have changed since the date specified. |
| 7 | Amounts are calculated based on the total long-term investments of the Fund. These amounts are subject to change and may have changed since the date specified. |
Wells Fargo Enterprise Fund | 7
Table of Contents
Performance highlights (unaudited)
MANAGER’S DISCUSSION
Fund highlights
| ∎ | The Fund outperformed its benchmark, the Russell Midcap® Growth Index, for the 12-month period that ended September 30, 2020. |
| ∎ | Stock selection within the information technology (IT) and health care sectors contributed to performance. |
| ∎ | Stock selection in the consumer staples and materials sectors negatively affected performance. |
Global pandemic triggers massive policy response.
Over the past 12 months, global economies shifted from long-toothed bull markets to rapid recessions, spurred by a global pandemic and shelter-at-home orders to combat the coronavirus. Central banks and governments rallied quickly to prevent a possible depression by proposing massive stimulus packages. Within the United States, the Federal Reserve (Fed) took extraordinary measures to provide liquidity, including purchasing corporate bonds and indicating short-term interest rates would stay near zero until at least 2023. These aggressive actions signaled the Fed would effectively take any measures to support the economy. With persistently low Treasury bond yields, U.S. stocks were propelled by the sentiment of “there is no alternative.” The equity markets were further fueled by optimism as progress continued on the development of therapeutic treatments and vaccines for the coronavirus.
Our investment process has long focused on companies harnessing technology to create superior growth. The Fund remains positioned toward companies that we believe are on the right side of change. As a result, our portfolios were well positioned for the changes in 2020, and we have not made significant changes to our portfolio.
| Ten largest holdings (%) as of September 30, 20206 | ||||
Veeva Systems Incorporated Class A | 3.06 | |||
Twilio Incorporated Class A | 2.96 | |||
Cadence Design Systems Incorporated | 2.85 | |||
Chipotle Mexican Grill Incorporated | 2.84 | |||
Align Technology Incorporated | 2.51 | |||
MercadoLibre Incorporated | 2.48 | |||
Advanced Micro Devices Incorporated | 2.39 | |||
EPAM Systems Incorporated | 2.27 | |||
lululemon athletica Incorporated | 2.22 | |||
Waste Connections Incorporated | 2.21 | |||
Stock selection in the IT and health care sectors contributed to performance relative to the index.
Within IT, shares of Twilio Incorporated outperformed. The company’s software has become an essential tool for developers looking to speed up and simplify the code-writing and development process for digital communications. The company reported strong new user growth, which helped deliver results ahead of expectations and raise financial guidance for the full year.
Within the health care sector, DexCom, Incorporated, was a key contributor. In lieu of the traditional finger-prick method, DexCom has created wearable sensors and
software to continuously monitor glucose levels for diabetes patients. By expanding to patients with Type 1 and Type 2 diabetes, DexCom has an opportunity to serve an expansive and growing addressable market. The ability for doctors to write virtual prescriptions along with DexCom’s next-generation contactless monitoring device drove shares higher.
Please see footnotes on page 7.
8 | Wells Fargo Enterprise Fund
Table of Contents
Performance highlights (unaudited)
| Sector allocation as of September 30, 20207 |
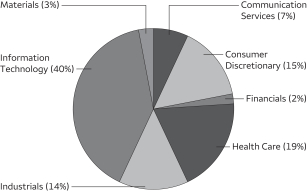 |
Stock selection within the consumer staples and materials sectors detracted from relative performance.
Within consumer staples, shares of foodservice distributor US Foods Holding Corp. were negatively affected by the global pandemic. Diminished demand from restaurants, hospitals, and hotels weighed on the shares for most of the year. With uncertainty as to when demand may return to pre-pandemic levels, we exited our position.
Within materials, shares of Vulcan Materials Company underperformed as investors became concerned that stressed state and local budgets would lead to lower demand for infrastructure and road construction projects. As construction projects continued to be delayed in 2020, resulting in weakening fundamentals, we followed our sell discipline and exited the position.
While volatility remains high, companies on the “right side of change” should provide resiliency.
We do not believe the recovery will unfold in a linear, V-shaped fashion. The vexing challenges of an intertwined health care crisis, financial crisis, and social crisis will likely remain. Progress is being made toward containing and treating the coronavirus, but cases continue to spike and the distribution of a vaccine will take considerable time. Political and policy uncertainty will represent an ongoing risk to markets. Given the lack of clarity, we remain cautious in our outlook and anticipate that volatility will continue.
We continue to emphasize companies on the “right side of change.” These are dynamic businesses positioned to take advantage of the massive shift around digital transformation. Trillions of dollars have moved online from offline. Growth themes, such as telemedicine, cloud software, digital payments, and e-commerce, will likely continue for the foreseeable future. We are long-term investors focused on opportunities well beyond 2020. As economic growth remains scarce, stocks with superior fundamentals should have defensive qualities and continue to be rewarded with premium valuations. As financial guidance continues to be revised, we believe this is a great time for active management and deep fundamental research. While we are cautious on the markets overall, we remain optimistic and confident in companies that we believe are positioned on the “right side of change.”
Please see footnotes on page 7.
Wells Fargo Enterprise Fund | 9
Table of Contents
As a shareholder of the Fund, you incur two types of costs: (1) transaction costs, including sales charges (loads) on purchase payments and contingent deferred sales charges (if any) on redemptions and (2) ongoing costs, including management fees, distribution (12b-1) and/or shareholder servicing fees, and other Fund expenses. This example is intended to help you understand your ongoing costs (in dollars) of investing in the Fund and to compare these costs with the ongoing costs of investing in other mutual funds.
The example is based on an investment of $1,000 invested at the beginning of the six-month period and held for the entire period from April 1, 2020 to September 30, 2020.
Actual expenses
The “Actual” line of the table below provides information about actual account values and actual expenses. You may use the information in this line, together with the amount you invested, to estimate the expenses that you paid over the period. Simply divide your account value by $1,000 (for example, an $8,600 account value divided by $1,000 = 8.6), then multiply the result by the number in the “Actual” line under the heading entitled “Expenses paid during period” for your applicable class of shares to estimate the expenses you paid on your account during this period.
Hypothetical example for comparison purposes
The “Hypothetical” line of the table below provides information about hypothetical account values and hypothetical expenses based on the Fund’s actual expense ratio and an assumed rate of return of 5% per year before expenses, which is not the Fund’s actual return. The hypothetical account values and expenses may not be used to estimate the actual ending account balance or expenses you paid for the period. You may use this information to compare the ongoing costs of investing in the Fund and other funds. To do so, compare this 5% hypothetical example with the 5% hypothetical examples that appear in the shareholder reports of the other funds.
Please note that the expenses shown in the table are meant to highlight your ongoing costs only and do not reflect any transactional costs, such as sales charges (loads) and contingent deferred sales charges. Therefore, the “Hypothetical” line of the table is useful in comparing ongoing costs only and will not help you determine the relative total costs of owning different funds. In addition, if these transactional costs were included, your costs would have been higher.
| Beginning account value 4-1-2020 | Ending account value 9-30-2020 | Expenses paid during the period1 | Annualized net expense ratio | |||||||||||||
Class A | ||||||||||||||||
Actual | $ | 1,000.00 | $ | 1,555.85 | $ | 7.51 | 1.17 | % | ||||||||
Hypothetical (5% return before expenses) | $ | 1,000.00 | $ | 1,019.19 | $ | 5.94 | 1.17 | % | ||||||||
Class C | ||||||||||||||||
Actual | $ | 1,000.00 | $ | 1,549.99 | $ | 12.34 | 1.93 | % | ||||||||
Hypothetical (5% return before expenses) | $ | 1,000.00 | $ | 1,015.39 | $ | 9.75 | 1.93 | % | ||||||||
Class R6 | ||||||||||||||||
Actual | $ | 1,000.00 | $ | 1,558.88 | $ | 5.11 | 0.80 | % | ||||||||
Hypothetical (5% return before expenses) | $ | 1,000.00 | $ | 1,021.08 | $ | 4.03 | 0.80 | % | ||||||||
Administrator Class | ||||||||||||||||
Actual | $ | 1,000.00 | $ | 1,556.31 | $ | 7.05 | 1.10 | % | ||||||||
Hypothetical (5% return before expenses) | $ | 1,000.00 | $ | 1,019.55 | $ | 5.57 | 1.10 | % | ||||||||
Institutional Class | ||||||||||||||||
Actual | $ | 1,000.00 | $ | 1,558.56 | $ | 5.45 | 0.85 | % | ||||||||
Hypothetical (5% return before expenses) | $ | 1,000.00 | $ | 1,020.81 | $ | 4.31 | 0.85 | % | ||||||||
| 1 | Expenses paid is equal to the annualized net expense ratio of each class multiplied by the average account value over the period, multiplied by the number of days in the most recent fiscal half-year divided by the number of days in the fiscal year (to reflect the one-half-year period). |
10 | Wells Fargo Enterprise Fund
Table of Contents
Portfolio of investments—September 30, 2020
| Shares | Value | |||||||||||||||
| Common Stocks: 99.69% | ||||||||||||||||
Communication Services: 6.78% | ||||||||||||||||
| Entertainment: 3.63% | ||||||||||||||||
Roku Incorporated † | 78,700 | $ | 14,858,560 | |||||||||||||
Spotify Technology † | 82,200 | 19,939,254 | ||||||||||||||
| 34,797,814 | ||||||||||||||||
|
| |||||||||||||||
| Interactive Media & Services: 3.15% | ||||||||||||||||
Match Group Incorporated † | 168,158 | 18,606,683 | ||||||||||||||
Pinterest Incorporated Class A † | 281,000 | 11,664,310 | ||||||||||||||
| 30,270,993 | ||||||||||||||||
|
| |||||||||||||||
Consumer Discretionary: 15.36% | ||||||||||||||||
| Automobiles: 0.91% | ||||||||||||||||
Ferrari NV | 47,541 | 8,751,823 | ||||||||||||||
|
| |||||||||||||||
| Diversified Consumer Services: 1.56% | ||||||||||||||||
Bright Horizons Family Solutions Incorporated † | 98,800 | 15,021,552 | ||||||||||||||
|
| |||||||||||||||
| Hotels, Restaurants & Leisure: 4.79% | ||||||||||||||||
Chipotle Mexican Grill Incorporated † | 21,935 | 27,280,779 | ||||||||||||||
Domino’s Pizza Incorporated | 43,900 | 18,669,792 | ||||||||||||||
| 45,950,571 | ||||||||||||||||
|
| |||||||||||||||
| Internet & Direct Marketing Retail: 3.64% | ||||||||||||||||
Chewy Incorporated Class A † | 201,848 | 11,067,326 | ||||||||||||||
MercadoLibre Incorporated † | 22,004 | 23,818,890 | ||||||||||||||
| 34,886,216 | ||||||||||||||||
|
| |||||||||||||||
| Leisure Products: 0.99% | ||||||||||||||||
Peloton Interactive Incorporated Class A † | 95,600 | 9,487,344 | ||||||||||||||
|
| |||||||||||||||
| Specialty Retail: 1.25% | ||||||||||||||||
Carvana Company † | 53,700 | 11,978,322 | ||||||||||||||
|
| |||||||||||||||
| Textiles, Apparel & Luxury Goods: 2.22% | �� | |||||||||||||||
lululemon athletica Incorporated † | 64,800 | 21,343,176 | ||||||||||||||
|
| |||||||||||||||
Financials: 1.57% | ||||||||||||||||
| Capital Markets: 1.57% | ||||||||||||||||
MarketAxess Holdings Incorporated | 31,200 | 15,025,608 | ||||||||||||||
|
| |||||||||||||||
Health Care: 19.27% | ||||||||||||||||
| Biotechnology: 3.93% | ||||||||||||||||
Exact Sciences Corporation † | 198,517 | 20,238,808 | ||||||||||||||
Sarepta Therapeutics Incorporated † | 47,681 | 6,695,843 | ||||||||||||||
Turning Point Therapeutics Incorporated † | 68,800 | 6,010,368 | ||||||||||||||
Zai Lab Limited ADR † | 57,500 | 4,782,275 | ||||||||||||||
| 37,727,294 | ||||||||||||||||
|
| |||||||||||||||
| Health Care Equipment & Supplies: 7.23% | ||||||||||||||||
ABIOMED Incorporated † | 41,275 | 11,435,652 | ||||||||||||||
Align Technology Incorporated † | 73,510 | 24,064,234 | ||||||||||||||
DexCom Incorporated † | 34,577 | 14,253,677 | ||||||||||||||
Insulet Corporation † | 83,039 | 19,646,197 | ||||||||||||||
| 69,399,760 | ||||||||||||||||
|
| |||||||||||||||
The accompanying notes are an integral part of these financial statements.
Wells Fargo Enterprise Fund | 11
Table of Contents
Portfolio of investments—September 30, 2020
| Shares | Value | |||||||||||||||
| Health Care Providers & Services: 3.62% | ||||||||||||||||
Chemed Corporation | 28,682 | $ | 13,777,399 | |||||||||||||
Guardant Health Incorporated † | 120,800 | 13,503,024 | ||||||||||||||
HealthEquity Incorporated † | 144,442 | 7,419,986 | ||||||||||||||
| 34,700,409 | ||||||||||||||||
|
| |||||||||||||||
| Health Care Technology: 3.06% | ||||||||||||||||
Veeva Systems Incorporated Class A † | 104,405 | 29,357,642 | ||||||||||||||
|
| |||||||||||||||
| Life Sciences Tools & Services: 1.43% | ||||||||||||||||
Bio-Rad Laboratories Incorporated Class A † | 26,586 | 13,704,020 | ||||||||||||||
|
| |||||||||||||||
Industrials: 13.84% |
| |||||||||||||||
| Aerospace & Defense: 3.43% | ||||||||||||||||
HEICO Corporation | 109,843 | 11,496,168 | ||||||||||||||
Mercury Systems Incorporated † | 129,000 | 9,992,340 | ||||||||||||||
Teledyne Technologies Incorporated † | 36,900 | 11,446,749 | ||||||||||||||
| 32,935,257 | ||||||||||||||||
|
| |||||||||||||||
| Commercial Services & Supplies: 5.55% | ||||||||||||||||
Cintas Corporation | 55,160 | 18,358,903 | ||||||||||||||
IAA Incorporated † | 262,540 | 13,670,458 | ||||||||||||||
Waste Connections Incorporated | 204,312 | 21,207,586 | ||||||||||||||
| 53,236,947 | ||||||||||||||||
|
| |||||||||||||||
| Electrical Equipment: 1.02% | ||||||||||||||||
Generac Holdings Incorporated † | 50,600 | 9,798,184 | ||||||||||||||
|
| |||||||||||||||
| Professional Services: 2.85% | ||||||||||||||||
Clarivate plc † | 481,133 | 14,910,312 | ||||||||||||||
Equifax Incorporated | 79,000 | 12,395,100 | ||||||||||||||
| 27,305,412 | ||||||||||||||||
|
| |||||||||||||||
| Road & Rail: 0.99% | ||||||||||||||||
Saia Incorporated † | 75,641 | 9,541,356 | ||||||||||||||
|
| |||||||||||||||
Information Technology: 40.43% |
| |||||||||||||||
| Electronic Equipment, Instruments & Components: 1.40% | ||||||||||||||||
Zebra Technologies Corporation Class A † | 53,168 | 13,422,793 | ||||||||||||||
|
| |||||||||||||||
| IT Services: 20.90% | ||||||||||||||||
Black Knight Incorporated † | 238,107 | 20,727,214 | ||||||||||||||
Booz Allen Hamilton Holding Corporation | 193,920 | 16,091,482 | ||||||||||||||
EPAM Systems Incorporated † | 67,365 | 21,777,757 | ||||||||||||||
Fiserv Incorporated † | 177,500 | 18,291,375 | ||||||||||||||
MongoDB Incorporated † | 71,602 | 16,576,579 | ||||||||||||||
Okta Incorporated † | 93,978 | 20,097,195 | ||||||||||||||
Shopify Incorporated Class A † | 10,892 | 11,142,189 | ||||||||||||||
Square Incorporated Class A † | 125,290 | 20,365,890 | ||||||||||||||
StoneCo Ltd Class A † | 311,983 | 16,500,781 | ||||||||||||||
Twilio Incorporated Class A † | 115,110 | 28,442,530 | ||||||||||||||
WEX Incorporated † | 75,700 | 10,520,029 | ||||||||||||||
| 200,533,021 | ||||||||||||||||
|
| |||||||||||||||
The accompanying notes are an integral part of these financial statements.
12 | Wells Fargo Enterprise Fund
Table of Contents
Portfolio of investments—September 30, 2020
| Shares | Value | |||||||||||||||
Semiconductors & Semiconductor Equipment: 4.52% | ||||||||||||||||
Advanced Micro Devices Incorporated † | 280,040 | $ | 22,960,480 | |||||||||||||
Micron Technology Incorporated † | 227,747 | 10,694,999 | ||||||||||||||
Universal Display Corporation | 53,600 | 9,687,664 | ||||||||||||||
| 43,343,143 | ||||||||||||||||
|
| |||||||||||||||
Software: 13.61% | ||||||||||||||||
Atlassian Corporation plc Class A † | 98,234 | 17,857,959 | ||||||||||||||
Autodesk Incorporated † | 51,612 | 11,922,888 | ||||||||||||||
Cadence Design Systems Incorporated † | 256,416 | 27,341,633 | ||||||||||||||
Crowdstrike Holdings Incorporated Class A † | 120,383 | 16,530,994 | ||||||||||||||
Datadog Incorporated Class A † | 147,500 | 15,068,600 | ||||||||||||||
ServiceNow Incorporated † | 33,777 | 16,381,845 | ||||||||||||||
Unity Software Incorporated Ǡ | 98,371 | 8,585,821 | ||||||||||||||
Zoom Video Communications Incorporated † | 36,060 | 16,952,167 | ||||||||||||||
| 130,641,907 | ||||||||||||||||
|
| |||||||||||||||
Materials: 2.44% | ||||||||||||||||
| Chemicals: 2.44% | ||||||||||||||||
Air Products & Chemicals Incorporated | 37,983 | 11,313,616 | ||||||||||||||
The Sherwin-Williams Company | 17,326 | 12,071,717 | ||||||||||||||
| 23,385,333 | ||||||||||||||||
|
| |||||||||||||||
Total Common Stocks (Cost $578,675,841) | 956,545,897 | |||||||||||||||
|
| |||||||||||||||
| Yield | ||||||||||||||||
| Short-Term Investments: 0.90% | ||||||||||||||||
| Investment Companies: 0.90% | ||||||||||||||||
Securities Lending Cash Investments LLC (I)(r)(u) | 0.12 | % | 2,915,185 | 2,915,185 | ||||||||||||
Wells Fargo Government Money Market Fund Select Class (I)(u) | 0.05 | 5,703,013 | 5,703,013 | |||||||||||||
Total Short-Term Investments (Cost $8,618,198) |
| 8,618,198 | ||||||||||||||
|
| |||||||||||||||
| Total investments in securities (Cost $587,294,039) | 100.59 | % | 965,164,095 | |||||
Other assets and liabilities, net | (0.59 | ) | (5,634,937 | ) | ||||
|
|
|
| |||||
| Total net assets | 100.00 | % | $ | 959,529,158 | ||||
|
|
|
| |||||
| † | Non-income-earning security |
| « | All or a portion of this security is on loan. |
| (l) | The issuer of the security is an affiliated person of the Fund as defined in the Investment Company Act of 1940. |
| (r) | The investment is a non-registered investment company purchased with cash collateral received from securities on loan. |
| (u) | The rate represents the 7-day annualized yield at period end. |
Abbreviations:
| ADR | American depositary receipt |
The accompanying notes are an integral part of these financial statements.
Wells Fargo Enterprise Fund | 13
Table of Contents
Portfolio of investments—September 30, 2020
Investments in Affiliates
An affiliated investment is an investment in which the Fund owns at least 5% of the outstanding voting shares of the issuer or as a result of other relationships, such as the Fund and the issuer having the same investment manager. Transactions with issuers that were either affiliated persons of the Fund at the beginning of the period or the end of the period were as follows:
| Value, beginning of period | Purchases | Sales proceeds | Net realized gains (losses) | Net change in unrealized gains (losses) | Income from affiliated securities | Value, end of period | % of net assets | |||||||||||||||||||||||||
| Short-Term Investments | ||||||||||||||||||||||||||||||||
Investment Companies | ||||||||||||||||||||||||||||||||
Securities Lending Cash Investments LLC | $ | 25,581,368 | $ | 211,067,731 | $ | (233,731,310 | ) | $ | (2,604 | ) | $ | 0 | $ | 222,478 | # | $ | 2,915,185 | |||||||||||||||
Wells Fargo Government Money Market Fund Select Class | 2,635,132 | 192,501,944 | (189,434,063 | ) | 0 | 0 | 44,187 | 5,703,013 | ||||||||||||||||||||||||
|
|
|
|
|
|
|
|
|
| |||||||||||||||||||||||
| $ | (2,604 | ) | $ | 0 | $ | 266,665 | $ | 8,618,198 | 0.90 | % | ||||||||||||||||||||||
|
|
|
|
|
|
|
|
|
| |||||||||||||||||||||||
| # | Amount shown represents income before fees and rebates. |
The accompanying notes are an integral part of these financial statements.
14 | Wells Fargo Enterprise Fund
Table of Contents
Statement of assets and liabilities—September 30, 2020
Assets | ||||
Investments in unaffiliated securities (Including $2,627,128 of securities loaned), at value (cost $578,675,841) | $ | 956,545,897 | ||
Investment in affiliated securities, at value (cost $8,618,198) | 8,618,198 | |||
Receivable for investments sold | 20,095,543 | |||
Receivable for Fund shares sold | 125,310 | |||
Receivable for dividends | 167,957 | |||
Receivable for securities lending income, net | 473 | |||
Prepaid expenses and other assets | 19,622 | |||
|
| |||
Total assets | 985,573,000 | |||
|
| |||
Liabilities | ||||
Payable upon receipt of securities loaned | 2,915,185 | |||
Payable for investments purchased | 21,271,060 | |||
Payable for Fund shares redeemed | 787,556 | |||
Management fee payable | 630,299 | |||
Administration fees payable | 145,372 | |||
Distribution fee payable | 1,361 | |||
Trustees’ fees and expenses payable | 1,962 | |||
Accrued expenses and other liabilities | 291,047 | |||
|
| |||
Total liabilities | 26,043,842 | |||
|
| |||
Total net assets | $ | 959,529,158 | ||
|
| |||
Net assets consist of | ||||
Paid-in capital | $ | 492,437,276 | ||
Total distributable earnings | 467,091,882 | |||
|
| |||
Total net assets | $ | 959,529,158 | ||
|
| |||
Computation of net asset value and offering price per share | ||||
Net assets – Class A | $ | 813,724,581 | ||
Shares outstanding – Class A1 | 12,672,799 | |||
Net asset value per share – Class A | $64.21 | |||
Maximum offering price per share – Class A2 | $68.13 | |||
Net assets – Class C | $ | 2,223,577 | ||
Shares outstanding – Class C1 | 41,091 | |||
Net asset value per share – Class C | $54.11 | |||
Net assets – Class R6 | $ | 71,641,075 | ||
Shares outstanding – Class R61 | 982,153 | |||
Net asset value per share – Class R6 | $72.94 | |||
Net assets – Administrator Class | $ | 4,205,092 | ||
Shares outstanding – Administrator Class1 | 61,348 | |||
Net asset value per share – Administrator Class | $68.54 | |||
Net assets – Institutional Class | $ | 67,734,833 | ||
Shares outstanding – Institutional Class1 | 932,258 | |||
Net asset value per share – Institutional Class | $72.66 | |||
| 1 | The Fund has an unlimited number of authorized shares. |
| 2 | Maximum offering price is computed as 100/94.25 of net asset value. On investments of $50,000 or more, the offering price is reduced. |
The accompanying notes are an integral part of these financial statements.
Wells Fargo Enterprise Fund | 15
Table of Contents
Statement of operations—year ended September 30, 2020
Investment income | ||||
Dividends (net of foreign withholding taxes of $80,683) | $ | 2,743,004 | ||
Securities lending income from affiliates, net | 203,223 | |||
Income from affiliated securities | 44,187 | |||
|
| |||
Total investment income | 2,990,414 | |||
|
| |||
Expenses | ||||
Management fee | 5,939,510 | |||
Administration fees | ||||
Class A | 1,430,112 | |||
Class C | 4,513 | |||
Class R6 | 17,245 | |||
Administrator Class | 4,884 | |||
Institutional Class | 74,886 | |||
Shareholder servicing fees | ||||
Class A | 1,699,936 | |||
Class C | 5,363 | |||
Administrator Class | 8,936 | |||
Distribution fee | ||||
Class C | 16,048 | |||
Custody and accounting fees | 56,854 | |||
Professional fees | 42,656 | |||
Registration fees | 92,626 | |||
Shareholder report expenses | 67,860 | |||
Trustees’ fees and expenses | 21,260 | |||
Other fees and expenses | 17,505 | |||
|
| |||
Total expenses | 9,500,194 | |||
Less: Fee waivers and/or expense reimbursements | ||||
Fund-level | (79,241 | ) | ||
Class A | (434,639 | ) | ||
Class C | (965 | ) | ||
Administrator Class | (1,347 | ) | ||
Institutional Class | (27,832 | ) | ||
|
| |||
Net expenses | 8,956,170 | |||
|
| |||
Net investment loss | (5,965,756 | ) | ||
|
| |||
Realized and unrealized gains (losses) on investments | ||||
Net realized gains (losses) on | ||||
Unaffiliated securities | 105,475,300 | |||
Affiliated securities | (2,604 | ) | ||
|
| |||
Net realized gains on investments | 105,472,696 | |||
Net change in unrealized gains (losses) on investments | 164,486,707 | |||
|
| |||
Net realized and unrealized gains (losses) on investments | 269,959,403 | |||
|
| |||
Net increase in net assets resulting from operations | $ | 263,993,647 | ||
|
| |||
The accompanying notes are an integral part of these financial statements.
16 | Wells Fargo Enterprise Fund
Table of Contents
Statement of changes in net assets
| Year ended September 30, 2020 | Year ended September 30, 2019 | |||||||||||||||
Operations | ||||||||||||||||
Net investment loss | $ | (5,965,756 | ) | $ | (3,924,917 | ) | ||||||||||
Net realized gains on investments | 105,472,696 | 40,830,879 | ||||||||||||||
Net change in unrealized gains (losses) on investments | 164,486,707 | 16,452,262 | ||||||||||||||
|
| |||||||||||||||
Net increase in net assets resulting from operations | 263,993,647 | 53,358,224 | ||||||||||||||
|
| |||||||||||||||
Distributions to shareholders from net investment income and net | ||||||||||||||||
Class A | (41,991,432 | ) | (70,134,961 | ) | ||||||||||||
Class C | (169,192 | ) | (816,461 | ) | ||||||||||||
Class R6 | (3,065,210 | ) | (4,758,790 | ) | ||||||||||||
Administrator Class | (233,637 | ) | (354,535 | ) | ||||||||||||
Institutional Class | (3,042,253 | ) | (4,789,875 | ) | ||||||||||||
|
| |||||||||||||||
Total distributions to shareholders | (48,501,724 | ) | (80,854,622 | ) | ||||||||||||
|
| |||||||||||||||
Capital share transactions | Shares | Shares | ||||||||||||||
Proceeds from shares sold | ||||||||||||||||
Class A | 209,379 | 10,822,879 | 314,721 | 14,539,690 | ||||||||||||
Class C | 12,820 | 570,917 | 6,455 | 248,651 | ||||||||||||
Class R6 | 117,768 | 7,229,301 | 95,098 | 5,042,506 | ||||||||||||
Administrator Class | 13,354 | 720,970 | 7,854 | 408,606 | ||||||||||||
Institutional Class | 454,409 | 25,643,025 | 329,158 | 17,257,242 | ||||||||||||
|
| |||||||||||||||
| 44,987,092 | 37,496,695 | |||||||||||||||
|
| |||||||||||||||
Reinvestment of distributions | ||||||||||||||||
Class A | 824,197 | 40,006,548 | 1,674,293 | 66,553,135 | ||||||||||||
Class C | 4,042 | 166,374 | 23,541 | 808,616 | ||||||||||||
Class R6 | 54,701 | 3,007,434 | 106,814 | 4,755,337 | ||||||||||||
Administrator Class | 4,403 | 228,012 | 8,166 | 344,706 | ||||||||||||
Institutional Class | 52,410 | 2,871,023 | 102,726 | 4,559,989 | ||||||||||||
|
| |||||||||||||||
| 46,279,391 | 77,021,783 | |||||||||||||||
|
| |||||||||||||||
Payment for shares redeemed | ||||||||||||||||
Class A | (1,348,785 | ) | (68,998,770 | ) | (1,374,541 | ) | (63,202,802 | ) | ||||||||
Class C | (34,314 | ) | (1,501,923 | ) | (134,665 | ) | (5,157,166 | ) | ||||||||
Class R6 | (130,426 | ) | (7,451,430 | ) | (88,918 | ) | (4,650,355 | ) | ||||||||
Administrator Class | (25,846 | ) | (1,339,682 | ) | (12,643 | ) | (610,976 | ) | ||||||||
Institutional Class | (508,996 | ) | (28,322,291 | ) | (327,960 | ) | (16,479,135 | ) | ||||||||
|
| |||||||||||||||
| (107,614,096 | ) | (90,100,434 | ) | |||||||||||||
|
| |||||||||||||||
Net increase (decrease) in net assets resulting from capital share transactions | (16,347,613 | ) | 24,418,044 | |||||||||||||
|
| |||||||||||||||
Total increase (decrease) in net assets | 199,144,310 | (3,078,354 | ) | |||||||||||||
|
| |||||||||||||||
Net assets | ||||||||||||||||
Beginning of period | 760,384,848 | 763,463,202 | ||||||||||||||
|
| |||||||||||||||
End of period | $ | 959,529,158 | $ | 760,384,848 | ||||||||||||
|
| |||||||||||||||
The accompanying notes are an integral part of these financial statements.
Wells Fargo Enterprise Fund | 17
Table of Contents
(For a share outstanding throughout each period)
| Year ended September 30 | ||||||||||||||||||||
| CLASS A | 2020 | 2019 | 2018 | 2017 | 2016 | |||||||||||||||
Net asset value, beginning of period | $49.98 | $52.96 | $48.80 | $41.94 | $41.90 | |||||||||||||||
Net investment loss | (0.41 | )1 | (0.29 | ) | (0.31 | ) | (0.25 | ) | (0.21 | )1 | ||||||||||
Net realized and unrealized gains (losses) on investments | 17.93 | 3.05 | 9.66 | 8.94 | 3.61 | |||||||||||||||
|
|
|
|
|
|
|
|
|
| |||||||||||
Total from investment operations | 17.52 | 2.76 | 9.35 | 8.69 | 3.40 | |||||||||||||||
Distributions to shareholders from | ||||||||||||||||||||
Net realized gains | (3.29 | ) | (5.74 | ) | (5.19 | ) | (1.83 | ) | (3.36 | ) | ||||||||||
Net asset value, end of period | $64.21 | $49.98 | $52.96 | $48.80 | $41.94 | |||||||||||||||
Total return2 | 37.19 | % | 8.00 | % | 20.83 | % | 21.55 | % | 8.63 | % | ||||||||||
Ratios to average net assets (annualized) | ||||||||||||||||||||
Gross expenses | 1.24 | % | 1.25 | % | 1.25 | % | 1.26 | % | 1.26 | % | ||||||||||
Net expenses | 1.16 | % | 1.18 | % | 1.18 | % | 1.18 | % | 1.18 | % | ||||||||||
Net investment loss | (0.79 | )% | (0.59 | )% | (0.61 | )% | (0.55 | )% | (0.52 | )% | ||||||||||
Supplemental data | ||||||||||||||||||||
Portfolio turnover rate | 62 | % | 50 | % | 62 | % | 75 | % | 99 | % | ||||||||||
Net assets, end of period (000s omitted) | $813,725 | $649,106 | $655,338 | $591,002 | $542,077 | |||||||||||||||
| 1 | Calculated based upon average shares outstanding |
| 2 | Total return calculations do not include any sales charges. |
The accompanying notes are an integral part of these financial statements.
18 | Wells Fargo Enterprise Fund
Table of Contents
Financial highlights
(For a share outstanding throughout each period)
| Year ended September 30 | ||||||||||||||||||||
| CLASS C | 2020 | 2019 | 2018 | 2017 | 2016 | |||||||||||||||
Net asset value, beginning of period | $42.93 | $46.74 | $43.95 | $38.23 | $38.75 | |||||||||||||||
Net investment loss | (0.68 | )1 | (0.52 | )1 | (0.60 | )1 | (0.85 | ) | (0.47 | )1 | ||||||||||
Net realized and unrealized gains (losses) on investments | 15.15 | 2.45 | 8.58 | 8.40 | 3.31 | |||||||||||||||
|
|
|
|
|
|
|
|
|
| |||||||||||
Total from investment operations | 14.47 | 1.93 | 7.98 | 7.55 | 2.84 | |||||||||||||||
Distributions to shareholders from | ||||||||||||||||||||
Net realized gains | (3.29 | ) | (5.74 | ) | (5.19 | ) | (1.83 | ) | (3.36 | ) | ||||||||||
Net asset value, end of period | $54.11 | $42.93 | $46.74 | $43.95 | $38.23 | |||||||||||||||
Total return2 | 36.13 | % | 7.20 | % | 19.93 | % | 20.66 | % | 7.80 | % | ||||||||||
Ratios to average net assets (annualized) | ||||||||||||||||||||
Gross expenses | 1.98 | % | 2.00 | % | 2.00 | % | 2.01 | % | 2.01 | % | ||||||||||
Net expenses | 1.93 | % | 1.93 | % | 1.93 | % | 1.93 | % | 1.93 | % | ||||||||||
Net investment loss | (1.55 | )% | (1.29 | )% | (1.37 | )% | (1.13 | )% | (1.28 | )% | ||||||||||
Supplemental data | ||||||||||||||||||||
Portfolio turnover rate | 62 | % | 50 | % | 62 | % | 75 | % | 99 | % | ||||||||||
Net assets, end of period (000s omitted) | $2,224 | $2,513 | $7,629 | $8,898 | $9,181 | |||||||||||||||
| 1 | Calculated based upon average shares outstanding |
| 2 | Total return calculations do not include any sales charges. |
The accompanying notes are an integral part of these financial statements.
Wells Fargo Enterprise Fund | 19
Table of Contents
Financial highlights
(For a share outstanding throughout each period)
| Year ended September 30 | ||||||||||||||||||||
| CLASS R6 | 2020 | 2019 | 2018 | 2017 | 2016 | |||||||||||||||
Net asset value, beginning of period | $56.15 | $58.47 | $53.17 | $45.37 | $44.89 | |||||||||||||||
Net investment loss | (0.25 | )1 | (0.11 | )1 | (0.13 | )1 | (0.08 | ) | (0.06 | )1 | ||||||||||
Net realized and unrealized gains (losses) on investments | 20.33 | 3.53 | 10.62 | 9.71 | 3.90 | |||||||||||||||
|
|
|
|
|
|
|
|
|
| |||||||||||
Total from investment operations | 20.08 | 3.42 | 10.49 | 9.63 | 3.84 | |||||||||||||||
Distributions to shareholders from | ||||||||||||||||||||
Net realized gains | (3.29 | ) | (5.74 | ) | (5.19 | ) | (1.83 | ) | (3.36 | ) | ||||||||||
Net asset value, end of period | $72.94 | $56.15 | $58.47 | $53.17 | $45.37 | |||||||||||||||
Total return | 37.69 | % | 8.41 | % | 21.30 | % | 22.01 | % | 9.06 | % | ||||||||||
Ratios to average net assets (annualized) | ||||||||||||||||||||
Gross expenses | 0.81 | % | 0.82 | % | 0.82 | % | 0.82 | % | 0.83 | % | ||||||||||
Net expenses | 0.80 | % | 0.80 | % | 0.80 | % | 0.80 | % | 0.80 | % | ||||||||||
Net investment loss | (0.43 | )% | (0.21 | )% | (0.23 | )% | (0.17 | )% | (0.14 | )% | ||||||||||
Supplemental data | ||||||||||||||||||||
Portfolio turnover rate | 62 | % | 50 | % | 62 | % | 75 | % | 99 | % | ||||||||||
Net assets, end of period (000s omitted) | $71,641 | $52,783 | $48,363 | $35,923 | $29,861 | |||||||||||||||
| 1 | Calculated based upon average shares outstanding |
The accompanying notes are an integral part of these financial statements.
20 | Wells Fargo Enterprise Fund
Table of Contents
Financial highlights
(For a share outstanding throughout each period)
| Year ended September 30 | ||||||||||||||||||||
| ADMINISTRATOR CLASS | 2020 | 2019 | 2018 | 2017 | 2016 | |||||||||||||||
Net asset value, beginning of period | $53.10 | $55.82 | $51.12 | $43.81 | $43.58 | |||||||||||||||
Net investment loss | (0.40 | )1 | (0.25 | )1 | (0.28 | )1 | (0.20 | )1 | (0.18 | )1 | ||||||||||
Net realized and unrealized gains (losses) on investments | 19.13 | 3.27 | 10.17 | 9.34 | 3.77 | |||||||||||||||
|
|
|
|
|
|
|
|
|
| |||||||||||
Total from investment operations | 18.73 | 3.02 | 9.89 | 9.14 | 3.59 | |||||||||||||||
Distributions to shareholders from | ||||||||||||||||||||
Net realized gains | (3.29 | ) | (5.74 | ) | (5.19 | ) | (1.83 | ) | (3.36 | ) | ||||||||||
Net asset value, end of period | $68.54 | $53.10 | $55.82 | $51.12 | $43.81 | |||||||||||||||
Total return | 37.29 | % | 8.06 | % | 20.95 | % | 21.66 | % | 8.74 | % | ||||||||||
Ratios to average net assets (annualized) | ||||||||||||||||||||
Gross expenses | 1.15 | % | 1.16 | % | 1.16 | % | 1.18 | % | 1.15 | % | ||||||||||
Net expenses | 1.10 | % | 1.10 | % | 1.10 | % | 1.10 | % | 1.07 | % | ||||||||||
Net investment loss | (0.72 | )% | (0.51 | )% | (0.53 | )% | (0.44 | )% | (0.41 | )% | ||||||||||
Supplemental data | ||||||||||||||||||||
Portfolio turnover rate | 62 | % | 50 | % | 62 | % | 75 | % | 99 | % | ||||||||||
Net assets, end of period (000s omitted) | $4,205 | $3,687 | $3,687 | $3,705 | $4,693 | |||||||||||||||
| 1 | Calculated based upon average shares outstanding |
The accompanying notes are an integral part of these financial statements.
Wells Fargo Enterprise Fund | 21
Table of Contents
Financial highlights
(For a share outstanding throughout each period)
| Year ended September 30 | ||||||||||||||||||||
| INSTITUTIONAL CLASS | 2020 | 2019 | 2018 | 2017 | 2016 | |||||||||||||||
Net asset value, beginning of period | $55.97 | $58.33 | $53.08 | $45.32 | $44.87 | |||||||||||||||
Net investment loss | (0.28 | )1 | (0.14 | )1 | (0.15 | )1 | (0.09 | )1 | (0.09 | )1 | ||||||||||
Net realized and unrealized gains (losses) on investments | 20.26 | 3.52 | 10.59 | 9.68 | 3.90 | |||||||||||||||
|
|
|
|
|
|
|
|
|
| |||||||||||
Total from investment operations | 19.98 | 3.38 | 10.44 | 9.59 | 3.81 | |||||||||||||||
Distributions to shareholders from | ||||||||||||||||||||
Net realized gains | (3.29 | ) | (5.74 | ) | (5.19 | ) | (1.83 | ) | (3.36 | ) | ||||||||||
Net asset value, end of period | $72.66 | $55.97 | $58.33 | $53.08 | $45.32 | |||||||||||||||
Total return | 37.63 | % | 8.36 | % | 21.24 | % | 21.97 | % | 8.97 | % | ||||||||||
Ratios to average net assets (annualized) | ||||||||||||||||||||
Gross expenses | 0.91 | % | 0.92 | % | 0.92 | % | 0.93 | % | 0.93 | % | ||||||||||
Net expenses | 0.85 | % | 0.85 | % | 0.85 | % | 0.85 | % | 0.85 | % | ||||||||||
Net investment loss | (0.48 | )% | (0.26 | )% | (0.29 | )% | (0.19 | )% | (0.21 | )% | ||||||||||
Supplemental data | ||||||||||||||||||||
Portfolio turnover rate | 62 | % | 50 | % | 62 | % | 75 | % | 99 | % | ||||||||||
Net assets, end of period (000s omitted) | $67,735 | $52,296 | $48,446 | $54,877 | $61,563 | |||||||||||||||
| 1 | Calculated based upon average shares outstanding |
The accompanying notes are an integral part of these financial statements.
22 | Wells Fargo Enterprise Fund
Table of Contents
1. ORGANIZATION
Wells Fargo Funds Trust (the “Trust”), a Delaware statutory trust organized on March 10, 1999, is an open-end management investment company registered under the Investment Company Act of 1940, as amended (the “1940 Act”). As an investment company, the Trust follows the accounting and reporting guidance in Financial Accounting Standards Board (“FASB”) Accounting Standards Codification Topic 946, Financial Services – Investment Companies. These financial statements report on the Wells Fargo Enterprise Fund (the “Fund”) which is a diversified series of the Trust.
2. SIGNIFICANT ACCOUNTING POLICIES
The following significant accounting policies, which are consistently followed in the preparation of the financial statements of the Fund, are in conformity with U.S. generally accepted accounting principles which require management to make estimates and assumptions that affect the reported amounts of assets and liabilities, disclosure of contingent assets and liabilities at the date of the financial statements, and the reported amounts of revenues and expenses during the reporting period. Actual results could differ from those estimates.
Securities valuation
All investments are valued each business day as of the close of regular trading on the New York Stock Exchange (generally 4 p.m. Eastern Time), although the Fund may deviate from this calculation time under unusual or unexpected circumstances.
Equity securities that are listed on a foreign or domestic exchange or market are valued at the official closing price or, if none, the last sales price. If no sale occurs on the principal exchange or market that day, a fair value price will be determined in accordance with the Fund’s Valuation Procedures.
Investments in registered open-end investment companies are valued at net asset value. Interests in non-registered investment companies that are redeemable at net asset value are fair valued normally at net asset value.
Investments which are not valued using any of the methods discussed above are valued at their fair value, as determined in good faith by the Board of Trustees of the Fund. The Board of Trustees has established a Valuation Committee comprised of the Trustees and has delegated to it the authority to take any actions regarding the valuation of portfolio securities that the Valuation Committee deems necessary or appropriate, including determining the fair value of portfolio securities, unless the determination has been delegated to the Wells Fargo Asset Management Pricing Committee at Wells Fargo Funds Management, LLC (“Funds Management”). The Board of Trustees retains the authority to make or ratify any valuation decisions or approve any changes to the Valuation Procedures as it deems appropriate. On a quarterly basis, the Board of Trustees receives reports on any valuation actions taken by the Valuation Committee or the Wells Fargo Asset Management Pricing Committee which may include items for ratification.
Securities lending
The Fund may lend its securities from time to time in order to earn additional income in the form of fees or interest on securities received as collateral or the investment of any cash received as collateral. When securities are on loan, the Fund receives interest or dividends on those securities. Cash collateral received in connection with its securities lending transactions is invested in Securities Lending Cash Investments, LLC (the “Securities Lending Fund”). Investments in Securities Lending Fund are valued at the evaluated bid price provided by an independent pricing service. Income earned from investment in the Securities Lending Fund, if any, is included in securities lending income from affiliates (net of fees and rebates) on the Statement of Operations.
In a securities lending transaction, the net asset value of the Fund is affected by an increase or decrease in the value of the securities loaned and by an increase or decrease in the value of the instrument in which collateral is invested. The amount of securities lending activity undertaken by the Fund fluctuates from time to time. The Fund has the right under the lending agreement to recover the securities from the borrower on demand. In the event of default or bankruptcy by the borrower, the Fund may be prevented from recovering the loaned securities or gaining access to the collateral or may experience delays or costs in doing so. In such an event, the terms of the agreement allow the unaffiliated securities lending agent to use the collateral to purchase replacement securities on behalf of the Fund or pay the Fund the market value of the loaned securities. The Fund bears the risk of loss with respect to depreciation of its investment of the cash collateral.
Security transactions and income recognition
Securities transactions are recorded on a trade date basis. Realized gains or losses are recorded on the basis of identified cost.
Dividend income is recognized on the ex-dividend date. Dividend income is recorded net of foreign taxes withheld where recovery of such taxes is not assured.
Wells Fargo Enterprise Fund | 23
Table of Contents
Notes to financial statements
Distributions to shareholders
Distributions to shareholders from net investment income and any net realized gains are recorded on the ex-dividend date and paid at least annually. Such distributions are determined in accordance with income tax regulations and may differ from U.S. generally accepted accounting principles. Dividend sources are estimated at the time of declaration. The tax character of distributions is determined as of the Fund’s fiscal year end. Therefore, a portion of the Fund’s distributions made prior to the Fund’s fiscal year end may be categorized as a tax return of capital at year end.
Federal and other taxes
The Fund intends to continue to qualify as a regulated investment company by distributing substantially all of its investment company taxable income and any net realized capital gains (after reduction for capital loss carryforwards) sufficient to relieve it from all, or substantially all, federal income taxes. Accordingly, no provision for federal income taxes was required.
The Fund’s income and federal excise tax returns and all financial records supporting those returns for the prior three fiscal years are subject to examination by the federal and Delaware revenue authorities. Management has analyzed the Fund’s tax positions taken on federal, state, and foreign tax returns for all open tax years and does not believe that there are any uncertain tax positions that require recognition of a tax liability.
As of September 30, 2020, the aggregate cost of all investments for federal income tax purposes was $588,588,234 and the unrealized gains (losses) consisted of:
Gross unrealized gains | $ | 381,014,627 | ||
Gross unrealized losses | (4,438,766 | ) | ||
Net unrealized gains | $ | 376,575,861 | ||
Reclassifications are made to the Fund’s capital accounts for permanent tax differences to reflect income and gains available for distribution (or available capital loss carryforwards) under federal income tax regulations. U.S. generally accepted accounting principles require that certain components of net assets be adjusted to reflect permanent differences between financial and tax reporting. These reclassifications have no effect on net assets or net asset values per share. The primary permanent difference causing such reclassification is due to net operating losses. At September 30, 2020, as a result of permanent book-to-tax differences, the following reclassification adjustments were made on the Statement of Assets and Liabilities:
| Paid-in capital | Total distributable earnings | |
| $(1,834,504) | $1,834,504 | |
As of September 30, 2020, the Fund had a qualified late-year ordinary loss of $4,881,867 which will be recognized on the first day of the following fiscal year.
Class allocations
The separate classes of shares offered by the Fund differ principally in applicable sales charges, distribution, shareholder servicing, and administration fees. Class specific expenses are charged directly to that share class. Investment income, common fund-level expenses, and realized and unrealized gains (losses) on investments are allocated daily to each class of shares based on the relative proportion of net assets of each class.
3. FAIR VALUATION MEASUREMENTS
Fair value measurements of investments are determined within a framework that has established a fair value hierarchy based upon the various data inputs utilized in determining the value of the Fund’s investments. The three-level hierarchy gives the highest priority to unadjusted quoted prices in active markets for identical assets or liabilities (Level 1) and the lowest priority to unobservable inputs (Level 3). The Fund’s investments are classified within the fair value hierarchy based on the lowest level of input that is significant to the fair value measurement. The inputs are summarized into three broad levels as follows:
| ∎ | Level 1 – quoted prices in active markets for identical securities |
| ∎ | Level 2 – other significant observable inputs (including quoted prices for similar securities, interest rates, prepayment speeds, credit risk, etc.) |
| ∎ | Level 3 – significant unobservable inputs (including the Fund’s own assumptions in determining the fair value of investments) |
The inputs or methodologies used for valuing investments in securities are not necessarily an indication of the risk associated with investing in those securities.
24 | Wells Fargo Enterprise Fund
Table of Contents
Notes to financial statements
The following is a summary of the inputs used in valuing the Fund’s assets and liabilities as of September 30, 2020:
| Quoted prices (Level 1) | Other significant observable inputs (Level 2) | Significant (Level 3) | Total | |||||||||||||
Assets | ||||||||||||||||
Investments in: | ||||||||||||||||
Common stocks | ||||||||||||||||
Communication services | $ | 65,068,807 | $ | 0 | $ | 0 | $ | 65,068,807 | ||||||||
Consumer discretionary | 147,419,004 | 0 | 0 | 147,419,004 | ||||||||||||
Financials | 15,025,608 | 0 | 0 | 15,025,608 | ||||||||||||
Health care | 184,889,125 | 0 | 0 | 184,889,125 | ||||||||||||
Industrials | 132,817,156 | 0 | 0 | 132,817,156 | ||||||||||||
Information technology | 387,940,864 | 0 | 0 | 387,940,864 | ||||||||||||
Materials | 23,385,333 | 0 | 0 | 23,385,333 | ||||||||||||
Short-term investments | ||||||||||||||||
Investment companies | 8,618,198 | 0 | 0 | 8,618,198 | ||||||||||||
Total assets | $ | 965,164,095 | $ | 0 | $ | 0 | $ | 965,164,095 | ||||||||
Additional sector, industry or geographic detail is included in the Portfolio of Investments.
For the year ended September 30, 2020, the Fund did not have any transfers into/out of Level 3.
4. TRANSACTIONS WITH AFFILIATES
Management fee
Funds Management, an indirect wholly owned subsidiary of Wells Fargo & Company (“Wells Fargo”), is the manager of the Fund and provides advisory and fund-level administrative services under an investment management agreement. Under the investment management agreement, Funds Management is responsible for, among other services, implementing the investment objectives and strategies of the Fund, supervising the subadviser and providing fund-level administrative services in connection with the Fund’s operations. As compensation for its services under the investment management agreement, Funds Management is entitled to receive a management fee at the following annual rate based on the Fund’s average daily net assets:
| Average daily net assets | Management fee | |||
First $500 million | 0.750 | % | ||
Next $500 million | 0.725 | |||
Next $1 billion | 0.700 | |||
Next $2 billion | 0.675 | |||
Next $1 billion | 0.650 | |||
Next $5 billion | 0.640 | |||
Next $2 billion | 0.630 | |||
Next $4 billion | 0.620 | |||
Over $16 billion | 0.610 | |||
For the year ended September 30, 2020, the management fee was equivalent to an annual rate of 0.74% of the Fund’s average daily net assets.
Funds Management has retained the services of a subadviser to provide daily portfolio management to the Fund. The fee for subadvisory services is borne by Funds Management. Wells Capital Management Incorporated (“WellsCap”), an affiliate of Funds Management and an indirect wholly owned subsidiary of Wells Fargo, is the subadviser to the Fund and is entitled to receive a fee from Funds Management at an annual rate starting at 0.45% and declining to 0.30% as the average daily net assets of the Fund increase.
Wells Fargo Enterprise Fund | 25
Table of Contents
Notes to financial statements
Administration fees
Under a class-level administration agreement, Funds Management provides class-level administrative services to the Fund, which includes paying fees and expenses for services provided by the transfer agent, sub-transfer agents, omnibus account servicers and record-keepers. As compensation for its services under the class-level administration agreement, Funds Management receives an annual fee which is calculated based on the average daily net assets of each class as follows:
| Class-level administration fee | ||||
Class A, Class C | 0.21 | % | ||
Class R6 | 0.03 | |||
Administrator Class, Institutional Class | 0.13 | |||
Waivers and/or expense reimbursements
Funds Management has contractually waived and/or reimbursed management and administration fees to the extent necessary to maintain certain net operating expense ratios for the Fund. When each class of the Fund has exceeded its expense cap, Funds Management has waived fees and/or reimbursed expenses from fund-level expenses on a proportionate basis and then from class specific expenses. When only certain classes exceed their expense caps, waivers and/or reimbursements are applied against class specific expenses before fund-level expenses. Funds Management has committed through January 31, 2021 to waive fees and/or reimburse expenses to the extent necessary to cap the Fund’s expenses at 1.18% for Class A shares, 1.93% for Class C shares, 0.80% for Class R6 shares, 1.10% for Administrator Class shares, and 0.85% for Institutional Class shares. Prior to or after the commitment expiration date, the cap may be increased or the commitment to maintain the cap may be terminated only with the approval of the Board of Trustees.
Distribution fee
The Trust has adopted a distribution plan for Class C shares of the Fund pursuant to Rule 12b-1 under the 1940 Act. A distribution fee is charged to Class C shares and paid to Wells Fargo Funds Distributor, LLC (“Funds Distributor”), the principal underwriter, at an annual rate of 0.75% of the average daily net assets of Class C shares.
In addition, Funds Distributor is entitled to receive the front-end sales charge from the purchase of Class A shares and a contingent deferred sales charge on the redemption of certain Class A shares. Funds Distributor is also entitled to receive the contingent deferred sales charges from redemptions of Class C shares. For the year ended September 30, 2020, Funds Distributor received $5,202 amount from the sale of Class A shares. No contingent deferred sales charges were incurred by Class A and Class C shares for the year ended September 30, 2020.
Shareholder servicing fees
The Trust has entered into contracts with one or more shareholder servicing agents, whereby Class A, Class C, and Administrator Class of the Fund are charged a fee at an annual rate of 0.25% of the average daily net assets of each respective class. A portion of these total shareholder servicing fees were paid to affiliates of Wells Fargo.
Interfund transactions
The Fund may purchase or sell portfolio investment securities to certain other Wells Fargo affiliates pursuant to Rule 17a-7 under the 1940 Act and under procedures adopted by the Board of Trustees. The procedures have been designed to ensure that these interfund transactions, which do not incur broker commissions, are effected at current market prices.
5. INVESTMENT PORTFOLIO TRANSACTIONS
Purchases and sales of investments, excluding U.S. government obligations (if any) and short-term securities, for the year ended September 30, 2020 were $500,862,571 and $568,458,969, respectively.
6. SECURITIES LENDING TRANSACTIONS
The Fund lends its securities through an unaffiliated securities lending agent and receives collateral in the form of cash or securities with a value at least equal to the value of the securities on loan. The value of the loaned securities is determined at the close of each business day and any increases or decreases in the required collateral are exchanged between the Fund and the counterparty on the next business day. Cash collateral received is invested in the Securities Lending Fund which seeks to provide a positive return compared to the daily Fed Funds Open Rate by investing in high-quality, U.S. dollar-denominated short-term money market instruments and is exempt from registration under Section 3(c)(7) of the 1940 Act. Securities Lending Fund is managed by Funds Management and is subadvised by WellsCap. Funds Management receives an advisory fee
26 | Wells Fargo Enterprise Fund
Table of Contents
Notes to financial statements
starting at 0.05% and declining to 0.01% as the average daily net assets of the Securities Lending Fund increase. All of the fees received by Funds Management are paid to WellsCap for its services as subadviser.
In the event of counterparty default or the failure of a borrower to return a loaned security, the Fund has the right to use the collateral to offset any losses incurred. As of September 30, 2020, the Fund had securities lending transactions with the following counterparties which are subject to offset:
| Counterparty | Value of securities on loan | Collateral received1 | Net amount | |||||||||
Citigroup Global Markets Inc. | $ | 2,627,128 | $ | (2,627,128 | ) | $ | 0 | |||||
| 1 | Collateral received within this table is limited to the collateral for the net transaction with the counterparty. |
7. BANK BORROWINGS
The Trust (excluding the money market funds), Wells Fargo Master Trust and Wells Fargo Variable Trust are parties to a $350,000,000 revolving credit agreement whereby the Fund is permitted to use bank borrowings for temporary or emergency purposes, such as to fund shareholder redemption requests. Interest under the credit agreement is charged to the Fund based on a borrowing rate equal to the higher of the Federal Funds rate in effect on that day plus 1.25% or the overnight LIBOR rate in effect on that day plus 1.25%. In addition, an annual commitment fee equal to 0.25% of the unused balance is allocated to each participating fund.
For the year ended September 30, 2020, there were no borrowings by the Fund under the agreement.
8. DISTRIBUTIONS TO SHAREHOLDERS
The tax character of distributions paid during the years ended September 30, 2020 and September 30, 2019 were as follows:
| Year ended September 30 | ||||||||
| 2020 | 2019 | |||||||
Ordinary income | $ | 0 | $ | 14,372,015 | ||||
Long-term capital gain | 48,501,724 | 66,482,607 | ||||||
As of September 30, 2020, the components of distributable earnings on a tax basis were as follows:
| Undistributed long-term gain | Unrealized gains | Late-year ordinary losses deferred | ||
| $95,415,382 | $376,575,861 | $(4,881,867) | ||
9. CONCENTRATION RISK
Concentration risks result from exposure to a limited number of sectors. As of the end of the period, the Fund invests a concentration of its portfolio in the information technology sector. A fund that invests a substantial portion of its assets in any sector may be more affected by changes in that sector than would be a fund whose investments are not heavily weighted in any sector.
10. INDEMNIFICATION
Under the Fund’s organizational documents, the officers and Trustees have been granted certain indemnification rights against certain liabilities that may arise out of performance of their duties to the Fund. The Fund has entered into a separate agreement with each Trustee that converts indemnification rights currently existing under the Fund’s organizational documents into contractual rights that cannot be changed in the future without the consent of the Trustee. Additionally, in the normal course of business, the Fund may enter into contracts with service providers that contain a variety of indemnification clauses. The Fund’s maximum exposure under these arrangements is dependent on future claims that may be made against the Fund and, therefore, cannot be estimated.
11. NEW ACCOUNTING PRONOUNCEMENT
In August 2018, FASB issued Accounting Standards Update (“ASU”) No. 2018-13, Fair Value Measurement (Topic 820) Disclosure Framework—Changes to the Disclosure Requirements for Fair Value Measurement. ASU 2018-13 updates the disclosure
Wells Fargo Enterprise Fund | 27
Table of Contents
Notes to financial statements
requirements on fair value measurements in Topic 820, Fair Value Measurements. The amendments are effective for fiscal years, and interim periods within those fiscal years, beginning after December 15, 2019. Management has adopted this guidance which did not have a material impact on the financial statements.
12. CORONAVIRUS (COVID-19) PANDEMIC
On March 11, 2020, the World Health Organization announced that it had made the assessment that coronavirus disease 2019 (“COVID-19”) is a pandemic. The impacts of COVID-19 are adversely affecting the entire global economy, individual companies and investment products, and the market in general. There is significant uncertainty around the extent and duration of business disruptions related to COVID-19 and the impacts may be short term or may last for an extended period of time. The risk of further spreading of COVID-19 has led to significant uncertainty and volatility in the financial markets.
28 | Wells Fargo Enterprise Fund
Table of Contents
Report of independent registered public accounting firm
To the Shareholders of the Fund and Board of Trustees
Wells Fargo Funds Trust:
Opinion on the Financial Statements
We have audited the accompanying statement of assets and liabilities of Wells Fargo Enterprise Fund (the Fund), one of the funds constituting Wells Fargo Funds Trust, including the portfolio of investments, as of September 30, 2020, the related statement of operations for the year then ended, the statements of changes in net assets for each of the years in the two-year period then ended, and the related notes (collectively, the financial statements) and the financial highlights for each of the years in the five-year period then ended. In our opinion, the financial statements and financial highlights present fairly, in all material respects, the financial position of the Fund as of September 30, 2020, the results of its operations for the year then ended, the changes in its net assets for each of the years in the two-year period then ended, and the financial highlights for each of the years in the five-year period then ended, in conformity with U.S. generally accepted accounting principles.
Basis for Opinion
These financial statements and financial highlights are the responsibility of the Fund’s management. Our responsibility is to express an opinion on these financial statements and financial highlights based on our audits. We are a public accounting firm registered with the Public Company Accounting Oversight Board (United States) (PCAOB) and are required to be independent with respect to the Fund in accordance with the U.S. federal securities laws and the applicable rules and regulations of the Securities and Exchange Commission and the PCAOB.
We conducted our audits in accordance with the standards of the PCAOB. Those standards require that we plan and perform the audit to obtain reasonable assurance about whether the financial statements and financial highlights are free of material misstatement, whether due to error or fraud. Our audits included performing procedures to assess the risks of material misstatement of the financial statements and financial highlights, whether due to error or fraud, and performing procedures that respond to those risks. Such procedures included examining, on a test basis, evidence regarding the amounts and disclosures in the financial statements and financial highlights. Such procedures also included confirmation of securities owned as of September 30, 2020, by correspondence with the custodian, transfer agent and brokers, or by other appropriate auditing procedures. Our audits also included evaluating the accounting principles used and significant estimates made by management, as well as evaluating the overall presentation of the financial statements and financial highlights. We believe that our audits provide a reasonable basis for our opinion.

We have not been able to determine the specific year that we began serving as the auditor of one or more Wells Fargo Funds investment companies; however we are aware that we have served as the auditor of one or more Wells Fargo Funds investment companies since at least 1955.
Boston, Massachusetts
November 24, 2020
Wells Fargo Enterprise Fund | 29
Table of Contents
TAX INFORMATION
Pursuant to Section 852 of the Internal Revenue Code, $48,501,724 was designated as a 20% rate gain distribution for the fiscal year ended September 30, 2020.
PROXY VOTING INFORMATION
A description of the policies and procedures used to determine how to vote proxies relating to portfolio securities is available, upon request, by calling 1-800-222-8222, visiting our website at wfam.com, or visiting the SEC website at sec.gov. Information regarding how the proxies related to portfolio securities were voted during the most recent 12-month period ended June 30 is available on the website at wfam.com or by visiting the SEC website at sec.gov.
QUARTERLY PORTFOLIO HOLDINGS INFORMATION
The Fund files its complete schedule of portfolio holdings with the SEC for the first and third quarters of each fiscal year as an exhibit to its reports on Form N-PORT. Shareholders may view the filed Form N-PORT by visiting the SEC website at sec.gov.
30 | Wells Fargo Enterprise Fund
Table of Contents
Other information (unaudited)
BOARD OF TRUSTEES AND OFFICERS
Each of the Trustees and Officers1 listed in the table below acts in identical capacities for each fund in the Wells Fargo family of funds, which consists of 142 mutual funds comprising the Wells Fargo Funds Trust, Wells Fargo Variable Trust, Wells Fargo Master Trust and four closed-end funds (collectively the “Fund Complex”). This table should be read in conjunction with the Prospectus and the Statement of Additional Information2. The mailing address of each Trustee and Officer is 525 Market Street, 12th Floor, San Francisco, CA 94105. Each Trustee and Officer serves an indefinite term, however, each Trustee serves such term until reaching the mandatory retirement age established by the Trustees.
Independent Trustees
| Name and year of birth | Position held and length of service* | Principal occupations during past five years or longer | Current other public company or investment company directorships | |||
| William R. Ebsworth (Born 1957) | Trustee, since 2015 | Retired. From 1984 to 2013, equities analyst, portfolio manager, research director and chief investment officer at Fidelity Management and Research Company in Boston, Tokyo, and Hong Kong, and retired in 2013 as Chief Investment Officer of Fidelity Strategic Advisers, Inc. where he led a team of investment professionals managing client assets. Prior thereto, Board member of Hong Kong Securities Clearing Co., Hong Kong Options Clearing Corp., the Thailand International Fund, Ltd., Fidelity Investments Life Insurance Company, and Empire Fidelity Investments Life Insurance Company. Audit Committee Chair and Investment Committee Chair of the Vincent Memorial Hospital Endowment (non-profit organization). Mr. Ebsworth is a CFA® charterholder. | N/A | |||
| Jane A. Freeman (Born 1953) | Trustee, since 2015; Chair Liaison, since 2018 | Retired. From 2012 to 2014 and 1999 to 2008, Chief Financial Officer of Scientific Learning Corporation. From 2008 to 2012, Ms. Freeman provided consulting services related to strategic business projects. Prior to 1999, Portfolio Manager at Rockefeller & Co. and Scudder, Stevens & Clark. Board member of the Harding Loevner Funds from 1996 to 2014, serving as both Lead Independent Director and chair of the Audit Committee. Board member of the Russell Exchange Traded Funds Trust from 2011 to 2012 and the chair of the Audit Committee. Ms. Freeman is also an inactive Chartered Financial Analyst. | N/A | |||
| Isaiah Harris, Jr. (Born 1952) | Trustee, since 2009; Audit Committee Chairman, since 2019 | Retired. Chairman of the Board of CIGNA Corporation since 2009, and Director since 2005. From 2003 to 2011, Director of Deluxe Corporation. Prior thereto, President and CEO of BellSouth Advertising and Publishing Corp. from 2005 to 2007, President and CEO of BellSouth Enterprises from 2004 to 2005 and President of BellSouth Consumer Services from 2000 to 2003. Emeritus member of the Iowa State University Foundation Board of Governors. Emeritus Member of the Advisory Board of Iowa State University School of Business. Advisory Board Member, Palm Harbor Academy (private school). Mr. Harris is a certified public accountant (inactive status). | CIGNA Corporation | |||
| Judith M. Johnson (Born 1949) | Trustee, since 2008 | Retired. Prior thereto, Chief Executive Officer and Chief Investment Officer of Minneapolis Employees Retirement Fund from 1996 to 2008. Ms. Johnson is an attorney, certified public accountant and a certified managerial accountant. | N/A | |||
| David F. Larcker (Born 1950) | Trustee, since 2009 | James Irvin Miller Professor of Accounting at the Graduate School of Business (Emeritus), Stanford University, Director of the Corporate Governance Research Initiative and Senior Faculty of The Rock Center for Corporate Governance since 2006. From 2005 to 2008, Professor of Accounting at the Graduate School of Business, Stanford University. Prior thereto, Ernst & Young Professor of Accounting at The Wharton School, University of Pennsylvania from 1985 to 2005. | N/A | |||
Wells Fargo Enterprise Fund | 31
Table of Contents
Other information (unaudited)
| Name and year of birth | Position held and length of service* | Principal occupations during past five years or longer | Current other public company or investment company directorships | |||
| Olivia S. Mitchell (Born 1953) | Trustee, since 2006; Nominating and Governance Committee Chair, since 2018 | International Foundation of Employee Benefit Plans Professor, Wharton School of the University of Pennsylvania since 1993. Director of Wharton’s Pension Research Council and Boettner Center on Pensions & Retirement Research, and Research Associate at the National Bureau of Economic Research. Previously, Cornell University Professor from 1978 to 1993. | N/A | |||
| Timothy J. Penny (Born 1951) | Trustee, since 1996; Chairman, since 2018 | President and Chief Executive Officer of Southern Minnesota Initiative Foundation, a non-profit organization, since 2007. Member of the Board of Trustees of NorthStar Education Finance, Inc., a non-profit organization, since 2007. | N/A | |||
| James G. Polisson (Born 1959) | Trustee, since 2018 | Retired. Chief Marketing Officer, Source (ETF) UK Services, Ltd, from 2015 to 2017. From 2012 to 2015, Principal of The Polisson Group, LLC, a management consulting, corporate advisory and principal investing company. Chief Executive Officer and Managing Director at Russell Investments, Global Exchange Traded Funds from 2010 to 2012. Managing Director of Barclays Global Investors from 1998 to 2010 and Global Chief Marketing Officer for iShares and Barclays Global Investors from 2000 to 2010. Trustee of the San Francisco Mechanics’ Institute, a non-profit organization, from 2013 to 2015. Board member of the Russell Exchange Traded Fund Trust from 2011 to 2012. Director of Barclays Global Investors Holdings Deutschland GmbH from 2006 to 2009. Mr. Polisson is an attorney and has a retired status with the Massachusetts and District of Columbia Bar Associations. | N/A | |||
| Pamela Wheelock (Born 1959) | Trustee, since January 2020; previously Trustee from January 2018 to July 2019 | Board member of the Destination Medical Center Economic Development Agency, Rochester, Minnesota since 2019. Interim President of the McKnight Foundation from January to September 2020. Acting Commissioner, Minnesota Department of Human Services, July 2019 through September 2019. Human Services Manager (part-time), Minnesota Department of Human Services, October 2019 through December 2019. Chief Operating Officer, Twin Cities Habitat for Humanity from 2017 to 2019. Vice President of University Services, University of Minnesota from 2012 to 2016. Prior thereto, on the Board of Directors, Governance Committee and Finance Committee for the Minnesota Philanthropy Partners (Saint Paul Foundation) from 2012 to 2018, Interim Chief Executive Officer of Blue Cross Blue Shield of Minnesota from 2011 to 2012, Chairman of the Board from 2009 to 2012 and Board Director from 2003 to 2015. Vice President, Leadership and Community Engagement, Bush Foundation, Saint Paul, Minnesota (a private foundation) from 2009 to 2011. Executive Vice President and Chief Financial Officer, Minnesota Sports and Entertainment from 2004 to 2009 and Senior Vice President from 2002 to 2004. Executive Vice President of the Minnesota Wild Foundation from 2004 to 2008. Commissioner of Finance, State of Minnesota, from 1999 to 2002. Currently Board Chair of the Minnesota Wild Foundation since 2010. | N/A | |||
| * | Length of service dates reflect the Trustee’s commencement of service with the Trust’s predecessor entities, where applicable. |
32 | Wells Fargo Enterprise Fund
Table of Contents
Other information (unaudited)
Officers
| Name and year of birth | Position held and length of service | Principal occupations during past five years or longer | ||
| Andrew Owen (Born 1960) | President, since 2017 | Executive Vice President of Wells Fargo & Company and Head of Affiliated Managers, Wells Fargo Asset Management, since 2014. In addition, Mr. Owen is currently President, Chief Executive Officer and Director of Wells Fargo Funds Management, LLC since 2017. Prior thereto, Executive Vice President responsible for marketing, investments and product development for Wells Fargo Funds Management, LLC, from 2009 to 2014. | ||
| Nancy Wiser1 (Born 1967) | Treasurer, since 2012 | Executive Vice President of Wells Fargo Funds Management, LLC since 2011. Chief Operating Officer and Chief Compliance Officer at LightBox Capital Management LLC, from 2008 to 2011. | ||
| Michelle Rhee (Born 1966) | Chief Legal Officer, since 2019 | Secretary of Wells Fargo Funds Management, LLC, Chief Legal Counsel of Wells Fargo Asset Management and Assistant General Counsel of Wells Fargo Bank, N.A. since 2018. Associate General Counsel and Managing Director of Bank of America Corporation from 2004 to 2018. | ||
| Catherine Kennedy (Born 1969) | Secretary, since 2019 | Vice President of Wells Fargo Funds Management, LLC and Senior Counsel of the Wells Fargo Legal Department since 2010. Vice President and Senior Counsel of Evergreen Investment Management Company, LLC from 1998 to 2010. | ||
| Michael H. Whitaker (Born 1967) | Chief Compliance Officer, since 2016 | Chief Compliance Officer of Wells Fargo Asset Management since 2016. Senior Vice President and Chief Compliance Officer for Fidelity Investments from 2007 to 2016. | ||
| Jeremy DePalma1 (Born 1974) | Assistant Treasurer, since 2009 | Senior Vice President of Wells Fargo Funds Management, LLC since 2009. Senior Vice President of Evergreen Investment Management Company, LLC from 2008 to 2010 and head of the Fund Reporting and Control Team within Fund Administration from 2005 to 2010. | ||
| 1 | Nancy Wiser acts as Treasurer of 65 funds in the Fund Complex. Jeremy DePalma acts as the Treasurer of 77 funds and Assistant Treasurer of 65 funds in the Fund Complex. |
| 2 | The Statement of Additional Information includes additional information about the Trustees and is available, without charge, upon request, by calling 1-800-222-8222 or by visiting the website at wfam.com. |
Wells Fargo Enterprise Fund | 33
Table of Contents
Other information (unaudited)
BOARD CONSIDERATION OF INVESTMENT MANAGEMENT AND SUB-ADVISORY AGREEMENTS:
Wells Fargo Enterprise Fund
Under the Investment Company Act of 1940 (the “1940 Act”), the Board of Trustees (the “Board”) of Wells Fargo Funds Trust (the “Trust”) must determine annually whether to approve the continuation of the Trust’s investment management and sub-advisory agreements. In this regard, at a Board meeting held on May 26, 2020 and May 28, 2020 (together, the “Meeting”), the Board, all the members of which have no direct or indirect interest in the investment management and sub-advisory agreements and are not “interested persons” of the Trust, as defined in the 1940 Act (the “Independent Trustees”), reviewed and approved for Wells Fargo Enterprise Fund (the “Fund”): (i) an investment management agreement (the “Management Agreement”) with Wells Fargo Funds Management, LLC (“Funds Management”); and (ii) an investment sub-advisory agreement (the “Sub-Advisory Agreement”) with Wells Capital Management Incorporated (the “Sub-Adviser”), an affiliate of Funds Management. The Management Agreement and the Sub-Advisory Agreement are collectively referred to as the “Advisory Agreements.”
At the Meeting, the Board considered the factors and reached the conclusions described below relating to the selection of Funds Management and the Sub-Adviser and the approval of the Advisory Agreements. Prior to the Meeting, including at a Board meeting held in April 2020, the Trustees conferred extensively among themselves and with representatives of Funds Management about these matters. Also, the Board has adopted a team-based approach, with each team consisting of a sub-set of Trustees, to assist the full Board in the discharge of its duties in reviewing investment performance and other matters throughout the year. The Independent Trustees were assisted in their evaluation of the Advisory Agreements by independent legal counsel, from whom they received separate legal advice and with whom they met separately.
In providing information to the Board, Funds Management and the Sub-Adviser were guided by a detailed set of requests for information submitted to them by independent legal counsel on behalf of the Independent Trustees at the start of the Board’s annual contract renewal process earlier in 2020. In considering and approving the Advisory Agreements, the Trustees considered the information they believed relevant, including but not limited to the information discussed below. The Board considered not only the specific information presented in connection with the Meeting, but also the knowledge gained over time through interaction with Funds Management and the Sub-Adviser about various topics. In this regard, the Board reviewed reports of Funds Management at each of its quarterly meetings, which included, among other things, portfolio reviews and investment performance reports. In addition, the Board and the teams mentioned above confer with portfolio managers at various times throughout the year. The Board did not identify any particular information or consideration that was all-important or controlling, and each individual Trustee may have attributed different weights to various factors.
After its deliberations, the Board unanimously approved the continuation of the Advisory Agreements for a one-year term and determined that the compensation payable to Funds Management and the Sub-Adviser under each of the Advisory Agreements was reasonable. The Board considered the approval of the Advisory Agreements for the Fund as part of its consideration of agreements for funds across the complex, but its approvals were made on a fund-by-fund basis. The following summarizes a number of important, but not necessarily all, factors considered by the Board in support of its approvals.
Nature, extent and quality of services
The Board received and considered various information regarding the nature, extent and quality of services provided to the Fund by Funds Management and the Sub-Adviser under the Advisory Agreements. This information included a description of the investment advisory services and Fund-level administrative services covered by the Management Agreement, as well as, among other things, a summary of the background and experience of senior management of Wells Fargo Asset Management (“WFAM”), of which Funds Management and the Sub-Adviser are a part, and a summary of investments made in the business of WFAM. The Board also received a description of Funds Management’s and the Sub-Adviser’s business continuity plans and of their approaches to data privacy and cybersecurity, and related testing. The Board also received and reviewed information about Funds Management’s role as administrator of the Fund’s liquidity risk management program, Funds Management’s approach to risk management, and Funds Management’s intermediary and vendor oversight program.
The Board also considered the qualifications, background, tenure and responsibilities of each of the portfolio managers primarily responsible for the day-to-day portfolio management of the Fund. The Board evaluated the ability of Funds Management and the Sub-Adviser to attract and retain qualified investment professionals, including research, advisory and supervisory personnel. The Board further considered the compliance programs and compliance records of Funds Management and the Sub-Adviser. In addition, the Board took into account the full range of services provided to the Fund by Funds Management and its affiliates.
34 | Wells Fargo Enterprise Fund
Table of Contents
Other information (unaudited)
Fund investment performance and expenses
The Board considered the investment performance results for the Fund over various time periods ended December 31, 2019. The Board also considered more current results for various time periods ended March 31, 2020. The Board considered these results in comparison to the investment performance of funds in a universe that was determined by Broadridge Inc. (“Broadridge”) to be similar to the Fund (the “Universe”), and in comparison to the Fund’s benchmark index and to other comparative data. Broadridge is an independent provider of investment company data. The Board received a description of the methodology used by Broadridge to select the mutual funds in the performance Universe. The Board noted that the investment performance of the Fund (Administrator Class) was higher than the average investment performance of the Universe for the one-, three-, five- and ten-year periods ended December 31, 2019. The Board also noted that the investment performance of the Fund (Administrator Class) was higher than the average investment performance of the Universe for all periods ended March 31, 2020. The Board also noted that the investment performance of the Fund was higher than its benchmark index, the Russell Midcap® Growth Index, for the one-, three- and five-year periods ended December 31, 2019, and lower than its benchmark for the ten-year period ended December 31, 2019. The Board also noted that the investment performance of the Fund was higher than or in range of its benchmark index, the Russell Midcap® Growth Index, for all periods ended March 31, 2020.
The Board also received and considered information regarding the Fund’s net operating expense ratios and their various components, including actual management fees, custodian and other non-management fees, and Rule 12b-1 and non-Rule 12b-1 shareholder service fees. The Board considered these ratios in comparison to the median ratios of funds in class-specific expense groups that were determined by Broadridge to be similar to the Fund (the “Groups”). The Board received a description of the methodology used by Broadridge to select the mutual funds in the expense Groups and an explanation of how funds comprising expense groups and their expense ratios may vary from year-to-year. Based on the Broadridge reports, the Board noted that the net operating expense ratios of the Fund were lower than, equal to or in range of the median net operating expense ratios of the expense Groups for each share class.
The Board took into account the Fund’s investment performance and expense information provided to it among the factors considered in deciding to re-approve the Advisory Agreements.
Investment management and sub-advisory fee rates
The Board reviewed and considered the contractual fee rates payable by the Fund to Funds Management under the Management Agreement, as well as the contractual fee rates payable by the Fund to Funds Management for class-level administrative services under a Class-Level Administration Agreement, which include, among other things, class-level transfer agency and sub-transfer agency costs (collectively, the “Management Rates”). The Board also reviewed and considered the contractual investment sub-advisory fee rates that are payable by Funds Management to the Sub-Adviser for investment sub-advisory services.
Among other information reviewed by the Board was a comparison of the Fund’s Management Rates with the average contractual investment management fee rates of funds in the expense Groups at a common asset level as well as transfer agency costs of the funds in the expense Groups. The Board noted that the Management Rates of the Fund were lower than, equal to or in range of the sum of these average rates for the Fund’s expense Groups for all share classes.
The Board also received and considered information about the portion of the total management fee that was retained by Funds Management after payment of the fee to the Sub-Adviser for sub-advisory services. In assessing the reasonableness of this amount, the Board received and evaluated information about the nature and extent of responsibilities retained and risks assumed by Funds Management and not delegated to or assumed by the Sub-Adviser, and about Funds Management’s on-going oversight services. Given the affiliation between Funds Management and the Sub-Adviser, the Board ascribed limited relevance to the allocation of fees between them.
The Board also received and considered information about the nature and extent of services offered and fee rates charged by Funds Management and the Sub-Adviser to other types of clients with investment strategies similar to those of the Fund. In this regard, the Board received information about the significantly greater scope of services, and compliance, reporting and other legal burdens and risks of managing proprietary mutual funds compared with those associated with managing assets of other types of clients, including third-party sub-advised fund clients and non-mutual fund clients such as institutional separate accounts.
Based on its consideration of the factors and information it deemed relevant, including those described here, the Board determined that the compensation payable to Funds Management under the Management Agreement and to the Sub-Adviser under the Sub-Advisory Agreement was reasonable.
Wells Fargo Enterprise Fund | 35
Table of Contents
Other information (unaudited)
Profitability
The Board received and considered information concerning the profitability of Funds Management, as well as the profitability of both WFAM and Wells Fargo & Co. (“Wells Fargo”) from providing services to the fund family as a whole. The Board noted that the Sub-Adviser’s profitability information with respect to providing services to the Fund and other funds in the family was subsumed in the WFAM and Wells Fargo profitability analysis.
Funds Management reported on the methodologies and estimates used in calculating profitability, including a description of the methodology used to allocate certain expenses. Among other things, the Board noted that the levels of profitability reported on a fund-by-fund basis varied widely, depending on factors such as the size, type and age of fund.
Based on its review, the Board did not deem the profits reported by Funds Management, WFAM or Wells Fargo from services provided to the Fund to be at a level that would prevent it from approving the continuation of the Advisory Agreements.
Economies of scale
The Board received and considered information about the potential for Funds Management to experience economies of scale in the provision of management services to the Fund, the difficulties of calculating economies of scale at an individual fund level, and the extent to which potential scale benefits are shared with shareholders. The Board noted the existence of breakpoints in the Fund’s management fee structure, which operate generally to reduce the Fund’s expense ratios as the Fund grows in size, and the size of the Fund in relation to such breakpoints. The Board considered that in addition to management fee breakpoints, Funds Management shares potential economies of scale from its management business in a variety of ways, including through fee waiver and expense reimbursement arrangements, services that benefit shareholders, competitive management fee rates set at the outset without regard to breakpoints, and investments in the business intended to enhance services available to shareholders.
The Board concluded that Funds Management’s arrangements with respect to the Fund, including contractual breakpoints, constituted a reasonable approach to sharing potential economies of scale with the Fund and its shareholders.
Other benefits to Funds Management and the Sub-Adviser
The Board received and considered information regarding potential “fall-out” or ancillary benefits received by Funds Management and its affiliates, including the Sub-Adviser, as a result of their relationships with the Fund. Ancillary benefits could include, among others, benefits directly attributable to other relationships with the Fund and benefits potentially derived from an increase in Funds Management’s and the Sub-Adviser’s business as a result of their relationships with the Fund. The Board noted that various affiliates of Funds Management may receive distribution-related fees, shareholder servicing payments and sub-transfer agency fees in respect of shares sold or held through them and services provided.
The Board also reviewed information about soft dollar credits earned and utilized by the Sub-Adviser, fees earned by Funds Management and the Sub-Adviser from managing a private investment vehicle for the fund family’s securities lending collateral, and commissions earned by an affiliated broker from portfolio transactions.
Based on its consideration of the factors and information it deemed relevant, including those described here, the Board did not find that any ancillary benefits received by Funds Management and its affiliates, including the Sub-Adviser, were unreasonable.
Conclusion
At the Meeting, after considering the above-described factors and based on its deliberations and its evaluation of the information described above, the Board unanimously approved the continuation of the Advisory Agreements for a one-year term and determined that the compensation payable to Funds Management and the Sub-Adviser under each of the Advisory Agreements was reasonable.
36 | Wells Fargo Enterprise Fund
Table of Contents
Other information (unaudited)
LIQUIDITY RISK MANAGEMENT PROGRAM
In accordance with Rule 22e-4 under the Investment Company Act of 1940, as amended (the “Liquidity Rule”), Wells Fargo Funds Trust (the “Trust”) has adopted and implemented a liquidity risk management program (the “Program”) on behalf of each of its series, including the Fund, which is reasonably designed to assess and manage the Fund’s liquidity risk. “Liquidity risk” is defined as the risk that the Fund is unable to meet redemption requests without significantly diluting remaining investors’ interests in the Fund. The Trust’s Board of Trustees (the “Board”) previously approved the designation of Wells Fargo Funds Management, LLC (“Funds Management”), the Fund’s investment manager, as the administrator of the Program, and Funds Management has established a Liquidity Risk Management Council composed of personnel from multiple departments within Funds Management and its affiliates to assist Funds Management in the implementation and on-going administration of the Program.
The Program is comprised of various components designed to support the assessment and/or management of liquidity risk, including: (1) the periodic assessment (no less frequently than annually) of certain factors that influence the Fund’s liquidity risk; (2) the periodic classification (no less frequently than monthly) of the Fund’s investments into one of four liquidity categories that reflect an estimate of their liquidity under current market conditions; (3) a 15% limit on the acquisition of “illiquid investments” (as defined under the Liquidity Rule); (4) to the extent the Fund does not invest primarily in “highly liquid investments” (as defined under the Liquidity Rule), the determination of a minimum percentage of the Fund’s assets that generally will be invested in highly liquid investments (an “HLIM”); (5) if the Fund has established an HLIM, the periodic review (no less frequently than annually) of the HLIM and the adoption of policies and procedures for responding to a shortfall of the Fund’s “highly liquid investments” below its HLIM; and (6) periodic reporting to the Board.
At a meeting of the Board held on May 26 and 28, 2020, the Board received a written report (the “Report”) from Funds Management that addressed the operation of the Program and assessed its adequacy and effectiveness of implementation. The Report covered the initial period from December 1, 2018 through December 31, 2019 (the “Reporting Period”). No significant liquidity events impacting the Fund were noted in the Report. There were no material changes to the Program during the Reporting Period. The Report concluded that the Program is operating effectively to assess and manage the Fund’s liquidity risk, and that the Program has been and continues to be adequately and effectively implemented to monitor and, as applicable, respond to the Fund’s liquidity developments.
There can be no assurance that the Program will achieve its objectives under all circumstances in the future. Please refer to the Fund’s prospectus for more information regarding the Fund’s exposure to liquidity risk and other risks to which an investment in the Fund may be subject.
Wells Fargo Enterprise Fund | 37
Table of Contents
Effective June 1, 2020, shareholders purchasing Fund shares through an Oppenheimer & Co. Inc. (“Oppenheimer”) platform or account are eligible only for the following load waivers (front-end sales charge waivers and contingent deferred or back-end, sales charge waivers) and discounts, which may differ from those disclosed in the Fund’s Prospectus or SAI.
| Front-end Sales Load Waivers on Class A Shares available at Oppenheimer |
| Employer-sponsored retirement, deferred compensation and employee benefit plans (including health savings accounts) and trusts used to fund those plans, provided that the shares are not held in a commission-based brokerage account and shares are held for the benefit of the plan. |
| Shares purchased by or through a 529 Plan. |
| Shares purchased through an Oppenheimer affiliated investment advisory program. |
| Shares purchased through reinvestment of capital gains distributions and dividend reinvestment when purchasing shares of the same fund (but not any other fund within the fund family). |
| Shares purchased from the proceeds of redemptions within the same fund family, provided (1) the repurchase occurs within 90 days following the redemption, (2) the redemption and purchase occur in the same account, and (3) redeemed shares were subject to a front-end or deferred sales load (known as Rights of Restatement). |
| A shareholder in the Fund’s Class C shares will have their shares exchanged at net asset value to Class A shares (or the appropriate share class) of the Fund if the shares are no longer subject to a CDSC and the exchange is in line with the policies and procedures of Oppenheimer. |
| Employees and registered representatives of Oppenheimer or its affiliates and their family members. |
| Directors or Trustees of the Fund, and employees of the Fund’s investment adviser or any of its affiliates, as described in the Prospectus. |
| CDSC Waivers on A and C Shares available at Oppenheimer |
| Death or disability of the shareholder. |
| Shares sold as part of a systematic withdrawal plan as described in the Prospectus. |
| Return of excess contributions from an IRA Account. |
| Shares sold as part of a required minimum distribution for IRA and retirement accounts due to the shareholder reaching the qualified age based on applicable IRS regulations as described in the Prospectus. |
| Shares sold to pay Oppenheimer fees but only if the transaction is initiated by Oppenheimer. |
| Shares acquired through a right of reinstatement. |
| Front-end load Discounts Available at Oppenheimer: Breakpoints, Rights of Accumulation & Letters of Intent |
| Breakpoints as described in the Prospectus. |
| Rights of Accumulation (ROA), which entitle shareholders to breakpoint discounts, will be automatically calculated based on the aggregated holding of fund family assets held by accounts within the purchaser’s household at Oppenheimer. Eligible fund family assets not held at Oppenheimer may be included in the ROA calculation only if the shareholder notifies his or her financial advisor about such assets. |
38 | Wells Fargo Enterprise Fund
Table of Contents
Effective June 15, 2020, shareholders purchasing fund shares through a Robert W. Baird & Co. (“Baird”) platform or account will only be eligible for the following sales charge waivers (front-end sales charge waivers and CDSC waivers) and discounts, which may differ from those disclosed elsewhere in the Fund’s Prospectus or the SAI.
| Front-end Sales Load Waivers on Class A Shares available at Baird |
| Shares purchased through reinvestment of capital gains distributions and dividend reinvestment when purchasing share of the same fund. |
| Share purchase by employees and registers representatives of Baird or its affiliate and their family members as designated by Baird. |
| Shares purchase from the proceeds of redemptions within the same fund family, provided (1) the repurchase occurs within 90 days following the redemption, (2) the redemption and purchase occur in the same accounts, and (3) redeemed shares were subject to a front-end or deferred sales charge (known as rights of reinstatement). |
| A shareholder in the Funds Investor C Shares will have their share exchanged at net asset value to Investor A shares of the fund if the shares are no longer subject to CDSC and the exchange is in line with the policies and procedures of Baird. |
| Employer-sponsored retirement plans or charitable accounts in a transactional brokerage account at Baird, including 401(k)plans, 457 plans, employer-sponsored 403(b) plans, profit sharing and money purchase pension plans and defined benefit plans. For purposes of this provision, employer-sponsored retirement plans do not include SEP IRAs, Simple IRAs or SAR-SEPs. |
| CDSC Waivers on A and C Shares available at Baird |
| Shares sold due to death or disability of the shareholder. |
| Shares sold as part of a systematic withdrawal plan as described in the Fund’s Prospectus. |
| Shares bought due to returns of excess contributions from an IRA Account. |
| Shares sold as part of a required minimum distribution for IRA and retirement accounts due to the shareholder reaching age 72as described in the Fund’s Prospectus. |
| Shares sold to pay Baird fees but only if the transaction is initiated by Baird. |
| Shares acquired through a right of reinstatement. |
| Front-end load Discounts Available at Baird: Breakpoint and/or Rights of Accumulation |
| Breakpoints as described in the Prospectus. |
| Rights of accumulations which entitles shareholders to breakpoint discounts will be automatically calculated based on the aggregated holding of fund family assets held by accounts within the purchaser’s household at Baird. Eligible fund family assets not held at Baird may be included in the rights of accumulations calculation only if the shareholder notifies his or her financial advisor about such assets. |
| Letters of Intent (LOI) allow for breakpoint discounts based on anticipated purchases within a fund family through Baird, over a 13-month period of time. |
Wells Fargo Enterprise Fund | 39
Table of Contents
This page is intentionally left blank.
Table of Contents
For more information
More information about Wells Fargo Funds is available free upon request. To obtain literature, please write, visit the Fund’s website, or call:
Wells Fargo Funds
P.O. Box 219967
Kansas City, MO 64121-9967
Website: wfam.com
Individual investors: 1-800-222-8222
Retail investment professionals: 1-888-877-9275
Institutional investment professionals: 1-866-765-0778

This report and the financial statements contained herein are submitted for the general information of the shareholders of the Fund. If this report is used for promotional purposes, distribution of the report must be accompanied or preceded by a current prospectus. Before investing, please consider the investment objectives, risks, charges, and expenses of the investment. For a current prospectus and, if available, a summary prospectus, containing this information, call 1-800-222-8222 or visit the Fund’s website at wfam.com. Read the prospectus carefully before you invest or send money.
Wells Fargo Asset Management (WFAM) is the trade name for certain investment advisory/management firms owned by Wells Fargo & Company. These firms include but are not limited to Wells Capital Management Incorporated and Wells Fargo Funds Management, LLC. Certain products managed by WFAM entities are distributed by Wells Fargo Funds Distributor, LLC (a broker-dealer and Member FINRA).
This material is for general informational and educational purposes only and is NOT intended to provide investment advice or a recommendation of any kind—including a recommendation for any specific investment, strategy, or plan.
INVESTMENT PRODUCTS: NOT FDIC INSURED ◾ NO BANK GUARANTEE ◾ MAY LOSE VALUE
© 2020 Wells Fargo & Company. All rights reserved.
PAR-1020-00574 11-20
A231/AR231 09-20
Table of Contents

Annual Report
September 30, 2020
Wells Fargo
Special Mid Cap Value Fund
Beginning on January 1, 2021, as permitted by new regulations adopted by the Securities and Exchange Commission, paper copies of the Wells Fargo Funds’ annual and semi-annual shareholder reports issued after this date will no longer be sent by mail, unless you specifically request paper copies of the reports. Instead, the reports will be made available on the Funds’ website, and you will be notified by mail each time a report is posted and provided with a website address to access the report.
If you already elected to receive shareholder reports electronically, you will not be affected by this change and you need not take any action. You may elect to receive shareholder reports and other communications from the Fund electronically at any time by contacting your financial intermediary (such as a broker-dealer or bank) or, if you are a direct investor, by calling 1-800-222-8222 or by enrolling at wellsfargo.com/advantagedelivery.
You may elect to receive all future reports in paper free of charge. If you invest through a financial intermediary, you can contact your financial intermediary to request that you continue to receive paper copies of your shareholder reports; if you invest directly with the Fund, you can call 1-800-222-8222. Your election to receive reports in paper will apply to all Wells Fargo Funds held in your account with your financial intermediary or, if you are a direct investor, to all Wells Fargo Funds that you hold.
Table of Contents
|
Reduce clutter. Save trees. |
Sign up for electronic delivery of prospectuses and shareholder reports at wellsfargo.com/ |
The views expressed and any forward-looking statements are as of September 30, 2020, unless otherwise noted, and are those of the Fund’s portfolio managers and/or Wells Fargo Asset Management. Discussions of individual securities, or the markets generally, or any Wells Fargo Fund are not intended as individual recommendations. Future events or results may vary significantly from those expressed in any forward-looking statements. The views expressed are subject to change at any time in response to changing circumstances in the market. Wells Fargo Asset Management and the Fund disclaim any obligation to publicly update or revise any views expressed or forward-looking statements.
INVESTMENT PRODUCTS: NOT FDIC INSURED ◾ NO BANK GUARANTEE ◾ MAY LOSE VALUE
Wells Fargo Special Mid Cap Value Fund | 1
Table of Contents
Letter to shareholders (unaudited)

Andrew Owen
President
Wells Fargo Funds
Dear Shareholder:
We are pleased to offer you this annual report for the Wells Fargo Special Mid Cap Value Fund for the 12-month period that ended September 30, 2020. Global stock markets saw earlier gains erased in March as governments around the world took unprecedented measures, attempting to stop the spread of COVID-19 at the expense of short-term economic output. However, markets rallied strongly from April on to more than offset those short-term losses as central banks bolstered capital markets and confidence.
For the 12-month period, equities had broadly positive total returns despite intense volatility in March. Non-U.S. developed market equities had weaker performance than emerging market and U.S. stocks. While gains from fixed-income securities were positive, they were more modest than equities. For the period, U.S. stocks, based on the S&P 500 Index,1 gained 15.15%. International stocks, as measured by the MSCI ACWI ex USA Index (Net),2 returned 3.00%, while the MSCI EM Index (Net)3 had stronger performance, with a 10.54% gain. For bond investors, the Bloomberg Barclays U.S. Aggregate Bond Index4 returned 6.98%, the Bloomberg Barclays Global Aggregate ex-USD Index5 gained 5.48%, and the Bloomberg Barclays Municipal Bond Index6 returned 4.09% while the ICE BofA U.S. High Yield Index7 returned 2.30%.
The period began with mixed economic readings.
The fourth quarter of 2019 started on a strong note. U.S.-China trade tensions, which had been building for months, relaxed in October; optimism rose for a U.K. Brexit deal; and macroeconomic data turned positive. The initial estimate of U.S. third-quarter gross domestic product (GDP) growth was a resilient 1.9% annualized rate, while the U.S. unemployment rate fell to a 50-year low of 3.5% in September. However, despite strength among U.S. consumers, business confidence declined while manufacturing activity contracted. Concerned with a potential economic slowdown, the U.S. Federal Reserve (Fed) lowered interest rates a quarter point in late October—its third rate cut in four months. This helped push the S&P 500 Index to an all-time high while emerging market equities rallied and global bonds declined overall, reflecting a broad pickup in risk appetite.
Equity markets continued to rally in November despite ongoing geopolitical risks. Hopes for a U.S.-China trade deal buoyed investor confidence. U.S. business sentiment improved slightly and manufacturing and services activity picked up. While consumer confidence and purchasing managers’ activity rose in the eurozone, China reported weakening manufacturing and consumer data. Bond yields rose marginally, leading to slightly negative returns for global government and investment-grade corporate bonds.
| 1 | The S&P 500 Index consists of 500 stocks chosen for market size, liquidity, and industry group representation. It is a market-value-weighted index with each stock’s weight in the index proportionate to its market value. You cannot invest directly in an index. |
| 2 | The Morgan Stanley Capital International (MSCI) All Country World Index (ACWI) ex USA Index (Net) is a free-float-adjusted market-capitalization-weighted index that is designed to measure the equity market performance of developed and emerging markets, excluding the United States. Source: MSCI. MSCI makes no express or implied warranties or representations and shall have no liability whatsoever with respect to any MSCI data contained herein. The MSCI data may not be further redistributed or used as a basis for other indices or any securities or financial products. This report is not approved, reviewed, or produced by MSCI. You cannot invest directly in an index. |
| 3 | The MSCI Emerging Markets (EM) Index (Net) is a free-float-adjusted market-capitalization-weighted index that is designed to measure equity market performance of emerging markets. You cannot invest directly in an index. |
| 4 | The Bloomberg Barclays U.S. Aggregate Bond Index is a broad-based benchmark that measures the investment-grade, U.S. dollar-denominated, fixed-rate taxable bond market, including Treasuries, government-related and corporate securities, mortgage-backed securities (agency fixed-rate and hybrid adjustable-rate mortgage pass-throughs), asset-backed securities, and commercial mortgage-backed securities. You cannot invest directly in an index. |
| 5 | The Bloomberg Barclays Global Aggregate ex-USD Index is an unmanaged index that provides a broad-based measure of the global investment-grade fixed-income markets excluding the U.S. dollar-denominated debt market. You cannot invest directly in an index. |
| 6 | The Bloomberg Barclays Municipal Bond Index is an unmanaged index composed of long-term tax-exempt bonds with a minimum credit rating of Baa. You cannot invest directly in an index. |
| 7 | The ICE BofA U.S. High Yield Index is a market-capitalization-weighted index of domestic and Yankee high-yield bonds. The index tracks the performance of high-yield securities traded in the U.S. bond market. You cannot invest directly in an index. Copyright 2020. ICE Data Indices, LLC. All rights reserved. |
2 | Wells Fargo Special Mid Cap Value Fund
Table of Contents
Letter to shareholders (unaudited)
Financial markets ended 2019 with a boost from the U.S. and China accord on a Phase One trade deal. That, along with the landslide win by the pro-Brexit U.K. Conservative Party in a national election and ongoing central bank support, gave investors greater confidence. U.S. economic indicators were generally positive, with the exception of manufacturing activity and business confidence. Consumer confidence was resilient, fed by a robust labor market, tame inflation, and lower interest rates, which boosted housing affordability and stimulated homebuyer activity. The impeachment of President Trump had little impact on the markets. Meanwhile, slowing Chinese economic activity, partly attributable to the trade war, led to further government stimulus at year-end through lower reserve ratios, allowing banks to lend more money.
The year-end rally continued in early January 2020. However, capital market volatility spiked in late January on concerns over the potential impact of COVID-19 on the global economy and stock markets. With sentiment somewhat souring, perceived safe havens did well in January. The U.S. dollar and Japanese yen both rose and government bonds outperformed equities. While the S&P 500 Index held its ground, emerging market equities tumbled, including those in Asia.
In February, COVID-19 became the major market focus. Fears of the virus’s impact on Chinese and global growth led to expectations of increased global central bank monetary policy support. That led the 10-year U.S. Treasury yield to fall to an all-time low of 1.1%. Although equity markets initially shrugged off concerns about the outbreak, focusing instead on strong fourth-quarter earnings and improving business confidence in January, market sentiment turned sharply lower and the S&P 500 Index lost 8.2% for the month. Oil prices tumbled as Russia and the Organization of the Petroleum Exporting Countries compounded a major decline in oil demand with a brutal price war, partly aimed at dissuading further U.S. shale production, causing the price of West Texas Intermediate crude oil to plummet.
The global spread of COVID-19 led country after country to clamp down on social and business-related activity in order to contain the virus from causing even greater devastation and overwhelming health care systems. This abrupt stoppage of economic activity led to the sharp deceleration of global output, sending economies into a deep contraction. Central banks responded swiftly, slashing interest rates and expanding quantitative easing programs to restore liquidity and confidence to the markets. In the U.S., the Fed introduced several new lending programs, funding investment-grade bonds, money market mutual funds, and commercial paper while purchasing Treasuries, mortgage-backed securities, and overnight repurchase agreements. Meanwhile, stock markets tumbled quickly into a bear market, ending the longest bull stock market in U.S. history.
Markets rebounded strongly in April, fueled by unprecedented government and central bank stimulus measures. The U.S. economy contracted by an annualized 5.0% pace in the first quarter, with 30 million new unemployment insurance claims in six weeks. In the eurozone, first-quarter real GDP shrank 3.8%, with the composite April Flash Purchasing Managers’ Index (PMI), a monthly survey of purchasing managers, falling to an all-time low of 13.5. The European Central Bank expanded its quantitative easing to include the purchase of additional government bonds of countries with the greatest virus-related need, including Italy and Spain. China’s first-quarter GDP fell by 6.8% year over year. However, retail sales, production, and investment showed signs of recovery. Extreme oil-price volatility continued as global supply far exceeded demand.
The global equity market rebound continued in May, with widespread strong monthly gains. Investors regained confidence on reports of early signs of success in human trials of a COVID-19 vaccine. Growth stocks continued to outperform value stocks while returns on global government bonds were generally flat. In the U.S., a gap grew between the stock market rebound and devastating economic data points, including an April unemployment rate of 14.7%, the highest level since World War II. PMIs reflected
“The global spread of COVID-19 led country after country to clamp down on social and business-related activity in order to contain the virus from causing even greater devastation and overwhelming health care systems.”
Wells Fargo Special Mid Cap Value Fund | 3
Table of Contents
Letter to shareholders (unaudited)
“The stock market continued to rally in August despite concerns over rising numbers of COVID-19 cases in the United States and several European countries, including France and Spain, as well as the expiration of the $600 weekly bonus unemployment benefit at the end of July.”
weakening activity in May in both the manufacturing and services sectors. U.S. corporate earnings reports indicated a 14% year-over-year contraction in earnings from the first quarter of 2019. However, high demand for technology, driven by remote activity, supported robust information technology sector earnings, which helped drive major technology stocks higher.
Financial markets posted widely positive returns in June despite ongoing economic weakness and high levels of uncertainty on the containment of COVID-19 and the timing of an effective vaccine. There were hopeful signs as economies reopened, with both U.S. and U.K. retail sales rebounding sharply in May. However, year over year, sales remained depressed. Vitally important to market sentiment was the ongoing commitment by central banks globally to do all they could to provide economic support through liquidity and low borrowing costs. U.S. economic activity was aided by one-time $1,200 stimulus checks and $600 bonus weekly unemployment benefits that expired at the end of July. However, unemployment remained historically high, easing somewhat from 14.7% in April to 11.1% in June. By month-end, numerous states reported increases of COVID-19 cases. China’s economic recovery picked up momentum in June, though it remained far from a full recovery.
July was a broadly positive month for both global equities and fixed income. However, economic data and a resurgence of COVID-19 cases pointed to the vulnerability of the global economy and the ongoing imperative to regain control of the pandemic. Second-quarter GDP shrank from the previous quarter by 9.5% and 12.1% in the U.S. and the eurozone, respectively. In contrast, China reported a 3.2% year-over-year expansion in its second-quarter GDP. U.S. unemployment remained high despite adding 1.8 million jobs in July, with a double-digit jobless rate persisting. However, manufacturing activity grew in both the U.S. and the eurozone. In Asia, while China’s manufacturing sector continued to expand, activity in Japan and South Korea contracted. In July, a rising concern was the rapid and broad reemergence of COVID-19 infections.
The stock market continued to rally in August despite concerns over rising numbers of COVID-19 cases in the United States and several European countries, including France and Spain, as well as the expiration of the $600 weekly bonus unemployment benefit at the end of July. U.S. stocks had strong monthly gains, led by the FAANG stocks—Facebook, Apple, Amazon, Netflix, and Google (Alphabet)—which dominate these indices and continued to rally. U.S. stocks generally surpassed other broadly positive global equity performance while fixed-income market monthly returns were broadly flat. Generally stronger-than-expected second-quarter earnings boosted investor sentiment along with the Fed’s announcement of a policy shift that will likely lead to longer-term low interest rates and supportive monetary policy. The U.S. Flash PMIs for both manufacturing and services beat expectations while U.S. housing market indicators were strong. In Europe, retail sales expanded and consumer confidence remained steady. China’s economy continued its fairly steady expansion. Overall, developed markets performed better than emerging market equities for the month of August as people took comfort in better-known equities in perceived safer markets.
Stocks grew more volatile in September on mixed economic data. U.S. PMIs showed solid growth in economic activity in both manufacturing and services. However, six months after the bottom fell out of the labor market in the early spring, only half of the 22 million jobs lost had returned. The U.S. unemployment rate fell to 7.9% in September, the fifth straight month of improvement but far higher than the 3.5% pre-COVID-19 rate. Only 661,000 jobs were added for the month, down from 1.5 million in August. Meanwhile, a reported 2.3 million people have given up looking for work. With U.S. Congress failing to pass further fiscal relief and uncertainties surrounding a possible vaccine, doubts crept back into the financial markets. In the U.K., a lack of progress in Brexit talks with the European Union weighed on markets. China’s economy picked up steam, however, with growth fueled by increased global demand, and China’s service sector had its strongest PMI reading in seven years.
4 | Wells Fargo Special Mid Cap Value Fund
Table of Contents
Letter to shareholders (unaudited)
Don’t let short-term uncertainty derail long-term investment goals.
Periods of investment uncertainty can present challenges, but experience has taught us that maintaining long-term investment goals can be an effective way to plan for the future. To help you create a sound strategy based on your personal goals and risk tolerance, Wells Fargo Funds offers more than 100 mutual funds spanning a wide range of asset classes and investment styles. Although diversification cannot guarantee an investment profit or prevent losses, we believe it can be an effective way to manage investment risk and potentially smooth out overall portfolio performance. We encourage investors to know their investments and to understand that appropriate levels of risk-taking may unlock opportunities.
Thank you for choosing to invest with Wells Fargo Funds. We appreciate your confidence in us and remain committed to helping you meet your financial needs.
Sincerely,

Andrew Owen
President
Wells Fargo Funds
|
For further information about your Fund, contact your investment professional, visit our website at wfam.com, or call us directly at 1-800-222-8222. |
Notice to Shareholders
At a meeting held on August 10-12, 2020, the Board of Trustees of the Fund approved a change to the Fund’s automatic conversion feature for Class C shares in order to shorten the required holding period from 10 to 8 years. As a result, on a monthly basis beginning November 5, 2020, Class C shares will convert automatically into Class A shares 8 years after the initial date of purchase or, if you acquired your Class C shares through an exchange or conversion from another share class, 8 years after the date you acquired your Class C shares. When Class C shares that you acquired through a purchase or exchange convert, any other Class C shares that you purchased with reinvested dividends and distributions also will convert into Class A shares on a pro rata basis.
Please note that a shorter holding period may apply depending on your intermediary. Please see “Appendix A—Sales Charge Reductions and Waivers for Certain Intermediaries” in the Fund’s prospectus for further information.
Wells Fargo Special Mid Cap Value Fund | 5
Table of Contents
Performance highlights (unaudited)
Investment objective
The Fund seeks long-term capital appreciation.
Manager
Wells Fargo Funds Management, LLC
Subadviser
Wells Capital Management Incorporated
Portfolio managers
James M. Tringas, CFA®‡
Bryant VanCronkhite, CFA®‡, CPA
Shane Zweck, CFA®‡
Average annual total returns (%) as of September 30, 2020
| Including sales charge | Excluding sales charge | Expense ratios1 (%) | ||||||||||||||||||||||||||||||||
| Inception date | 1 year | 5 year | 10 year | 1 year | 5 year | 10 year | Gross | Net2 | ||||||||||||||||||||||||||
| Class A (WFPAX) | 7-31-2007 | -12.56 | 5.39 | 9.74 | -7.22 | 6.64 | 10.39 | 1.15 | 1.15 | |||||||||||||||||||||||||
| Class C (WFPCX) | 7-31-2007 | -8.89 | 5.85 | 9.57 | -7.89 | 5.85 | 9.57 | 1.90 | 1.90 | |||||||||||||||||||||||||
| Class R (WFHHX)3 | 9-30-2015 | – | – | – | -7.45 | 6.37 | 10.12 | 1.40 | 1.40 | |||||||||||||||||||||||||
| Class R6 (WFPRX)4 | 6-28-2013 | – | – | – | -6.84 | 7.10 | 10.86 | 0.72 | 0.72 | |||||||||||||||||||||||||
| Administrator Class (WFMDX) | 4-8-2005 | – | – | – | -7.15 | 6.72 | 10.50 | 1.07 | 1.07 | |||||||||||||||||||||||||
| Institutional Class (WFMIX) | 4-8-2005 | – | – | – | -6.93 | 6.99 | 10.79 | 0.82 | 0.82 | |||||||||||||||||||||||||
| Russell Midcap® Value Index5 | – | – | – | – | -7.30 | 6.38 | 9.71 | – | – | |||||||||||||||||||||||||
Figures quoted represent past performance, which is no guarantee of future results, and do not reflect taxes that a shareholder may pay on an investment in a fund. Investment return and principal value of an investment will fluctuate so that an investor’s shares, when redeemed, may be worth more or less than their original cost. Performance shown without sales charges would be lower if sales charges were reflected. Current performance may be lower or higher than the performance data quoted, which assumes the reinvestment of dividends and capital gains. Current month-end performance is available on the Fund’s website, wfam.com.
Index returns do not include transaction costs associated with buying and selling securities, any mutual fund fees or expenses, or any taxes. It is not possible to invest directly in an index.
For Class A shares, the maximum front-end sales charge is 5.75%. For Class C shares, the maximum contingent deferred sales charge is 1.00%. Performance including a contingent deferred sales charge assumes the sales charge for the corresponding time period. Class R, Class R6, Administrator Class, and Institutional Class shares are sold without a front-end sales charge or contingent deferred sales charge.
Stock values fluctuate in response to the activities of individual companies and general market and economic conditions. Smaller-company stocks tend to be more volatile and less liquid than those of larger companies. Consult the Fund’s prospectus for additional information on these and other risks.
Please see footnotes on page 7.
6 | Wells Fargo Special Mid Cap Value Fund
Table of Contents
Performance highlights (unaudited)
| Growth of $10,000 investment as of September 30, 20206 |
|
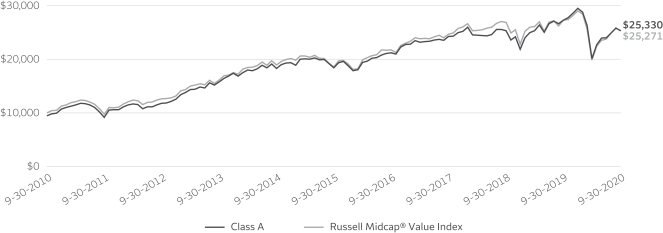
| ‡ | CFA® and Chartered Financial Analyst® are trademarks owned by CFA Institute. |
| 1 | Reflects the expense ratios as stated in the most recent prospectuses. The expense ratios shown are subject to change and may differ from the annualized expense ratios shown in the financial highlights of this report. |
| 2 | The manager has contractually committed through January 31, 2021, to waive fees and/or reimburse expenses to the extent necessary to cap total annual fund operating expenses after fee waivers at 1.16% for Class A, 1.91% for Class C, 1.41% for Class R, 0.73% for Class R6, 1.08% for Administrator Class, and 0.83% for Institutional Class. Brokerage commissions, stamp duty fees, interest, taxes, acquired fund fees and expenses (if any), and extraordinary expenses are excluded from the expense caps. Prior to or after the commitment expiration date, the caps may be increased or the commitment to maintain the caps may be terminated only with the approval of the Board of Trustees. Without these caps, the Fund’s returns would have been lower. The expense ratio paid by an investor is the net expense ratio (the total annual fund operating expenses after fee waivers) as stated in the prospectuses. |
| 3 | Historical performance shown for the Class R shares prior to their inception reflects the performance of the Institutional Class shares, adjusted to reflect the higher expenses applicable to the Class R shares. |
| 4 | Historical performance shown for the Class R6 shares prior to their inception reflects the performance of the Institutional Class shares, and includes the higher expenses applicable to the Institutional Class shares. If these expenses had not been included, the returns for the Class R6 shares would be higher. |
| 5 | The Russell Midcap® Value Index measures the performance of those Russell Midcap companies with lower price/book ratios and lower forecasted growth values. The stocks are also members of the Russell 1000® Value Index. You cannot invest directly in an index. |
| 6 | The chart compares the performance of Class A shares for the most recent ten years with the Russell Midcap® Value Index. The chart assumes a hypothetical investment of $10,000 in Class A shares and reflects all operating expenses and assumes the maximum initial sales charge of 5.75%. |
| 7 | The ten largest holdings, excluding cash, cash equivalents and any money market funds, are calculated based on the value of the investments divided by total net assets of the Fund. Holdings are subject to change and may have changed since the date specified. |
| 8 | Amounts are calculated based on the total long-term investments of the Fund. These amounts are subject to change and may have changed since the date specified. |
Wells Fargo Special Mid Cap Value Fund | 7
Table of Contents
Performance highlights (unaudited)
MANAGER’S DISCUSSION
Fund highlights
| ∎ | The Fund (Class A, excluding sales charges) outperformed its benchmark, the Russell Midcap® Value Index, for the 12-month period that ended September 30, 2020. |
| ∎ | Contributors to performance included stock selection in the health care sector and an underweight to the real estate sector. |
| ∎ | Detractors from performance included stock selection in the consumer discretionary and information technology (IT) sectors. |
Volatility increased significantly surrounding the coronavirus.
Over the 12-month period, the equity markets and mid-cap value stocks experienced significant volatility as the coronavirus pandemic emerged in early 2020. As the economy screeched to a halt in an attempt to slow the spread of the virus, the equity market experienced one of the sharpest drawdowns in history. This was met with robust fiscal and monetary stimulus, which led to a sharp recovery in the calendar second quarter. Macro events and political headlines were the largest drivers of stocks in the period. We expect these short-term macro influences to eventually subside as transparency surrounding the virus, the economy, and the November U.S. election improves. Despite this near-term uncertainty, our bottom-up selection process is designed to find companies that can control their own destiny via their clear competitive advantages, sustainable free cash flows, and flexible balance sheets that can be used to grow shareholder value across numerous market environments.
We made modest changes to sector weightings.
Our stock selection process is predominantly driven by our bottom-up stock analysis. This process led to modest changes to the Fund’s sector weightings during the period. The Fund increased its overweights to the industrials and IT sectors as the coronavirus volatility created some attractive buying opportunities when seen through our multiyear lens. The Fund’s energy and financials weights were reduced as the risks surrounding the pandemic increased dramatically, causing the reward-to-risk ratios to be less attractive. The team’s reward-to-risk process continues to guide portfolio decisions as we strive to properly compensate the Fund’s shareholders for each unit of risk being taken.
Stock selection in the health care sector and an underweight to real estate benefited the Fund’s performance.
In the health care sector, Humana Incorporated was the Fund’s largest contributor. Humana is a predominantly Medicare-focused managed care organization in what we believe to be the best positioned subcategory of the health insurance market. Humana has been investing capital to modernize and make a more efficient general health care system. We believe those investments continue to pay off, as evidenced through strong growth in membership, which caused the stock to outperform.
The Fund’s underweight to real estate contributed to relative performance. The sector was one of the worst-performing sectors within the index as concerns around coronavirus-related closures and general economic softness weighed on the sector. Our underweight is driven by the view that we are finding better reward-to-risk value that meets our process in other sectors and also provide similar protection if 10-year yields were to fall further.
Stock selection in the IT and consumer discretionary sectors detracted from performance.
| Ten largest holdings (%) as of September 30, 20207 | ||||
Brown & Brown Incorporated | 2.93 | |||
Alcon Incorporated | 2.93 | |||
Carlisle Companies Incorporated | 2.88 | |||
CBRE Group Incorporated Class A | 2.88 | |||
Republic Services Incorporated | 2.87 | |||
Reynolds Consumer Products Incorporated | 2.85 | |||
Amdocs Limited | 2.64 | |||
Arch Capital Group Limited | 2.57 | |||
American Water Works Company Incorporated | 2.47 | |||
Jacobs Engineering Group Incorporated | 2.26 | |||
IT stock selection was hurt by our preference for the reoccurring cash flow associated with the IT services holdings, opposed to the more cyclical semiconductor industry. Semiconductor companies significantly outperformed as investors expected a strong supply/demand tailwind. IT services companies were held back by slowing transaction activity related to the pandemic, but we believe this to be a short-term concern.
Consumer discretionary retailer Kohl’s Corporation detracted from relative performance as the pandemic-related slowdown dramatically affected sales. We chose to exit the position during the early stages of the pandemic as we believed long-term free cash flow would suffer from changing consumer behavior related to the pandemic and the company’s balance sheet would no longer be able to support the company’s growth initiatives.
Please see footnotes on page 7.
8 | Wells Fargo Special Mid Cap Value Fund
Table of Contents
Performance highlights (unaudited)
| Sector allocation as of September 30, 20208 |
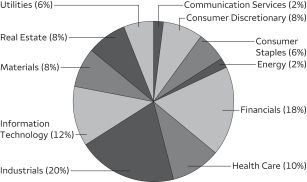 |
Our outlook for the Fund and our process remain positive.
As we look out over the next 6 to 12 months, we see numerous forces at play that could bring increased volatility. Equity investors continue to balance a potential second wave of the virus, a U.S. political regime change, and the prospects for a vaccine and an improving economy. We are not experts in forecasting macro events or the direction of the market. However, it is commonly the sources of macro-driven volatility, such as political events, interest rates, and regulatory changes, that create inefficiencies in individual stock prices. We believe it is prudent to manage downside risks, and we will continue to invest in companies that we believe have taken steps to control their own destinies.
We believe our team’s fundamental analysis, risk management, and active investment process are well suited to take advantage of new opportunities as the stock market evolves. While volatility may increase, we look to the strong balance sheets and stable cash flows of the companies within the Fund to support consistent long-term performance. We maintain a favorable outlook for the Fund.
Please see footnotes on page 7.
Wells Fargo Special Mid Cap Value Fund | 9
Table of Contents
As a shareholder of the Fund, you incur two types of costs: (1) transaction costs, including sales charges (loads) on purchase payments and contingent deferred sales charges (if any) on redemptions and (2) ongoing costs, including management fees, distribution (12b-1) and/or shareholder servicing fees, and other Fund expenses. This example is intended to help you understand your ongoing costs (in dollars) of investing in the Fund and to compare these costs with the ongoing costs of investing in other mutual funds.
The example is based on an investment of $1,000 invested at the beginning of the six-month period and held for the entire period from April 1, 2020 to September 30, 2020.
Actual expenses
The “Actual” line of the table below provides information about actual account values and actual expenses. You may use the information in this line, together with the amount you invested, to estimate the expenses that you paid over the period. Simply divide your account value by $1,000 (for example, an $8,600 account value divided by $1,000 = 8.6), then multiply the result by the number in the “Actual” line under the heading entitled “Expenses paid during period” for your applicable class of shares to estimate the expenses you paid on your account during this period.
Hypothetical example for comparison purposes
The “Hypothetical” line of the table below provides information about hypothetical account values and hypothetical expenses based on the Fund’s actual expense ratio and an assumed rate of return of 5% per year before expenses, which is not the Fund’s actual return. The hypothetical account values and expenses may not be used to estimate the actual ending account balance or expenses you paid for the period. You may use this information to compare the ongoing costs of investing in the Fund and other funds. To do so, compare this 5% hypothetical example with the 5% hypothetical examples that appear in the shareholder reports of the other funds.
Please note that the expenses shown in the table are meant to highlight your ongoing costs only and do not reflect any transactional costs, such as sales charges (loads) and contingent deferred sales charges. Therefore, the “Hypothetical” line of the table is useful in comparing ongoing costs only and will not help you determine the relative total costs of owning different funds. In addition, if these transactional costs were included, your costs would have been higher.
| Beginning account value 4-1-2020 | Ending account value 9-30-2020 | Expenses paid during the period1 | Annualized net expense ratio | |||||||||||||
Class A | ||||||||||||||||
Actual | $ | 1,000.00 | $ | 1,259.99 | $ | 6.44 | 1.14 | % | ||||||||
Hypothetical (5% return before expenses) | $ | 1,000.00 | $ | 1,019.37 | $ | 5.76 | 1.14 | % | ||||||||
Class C | ||||||||||||||||
Actual | $ | 1,000.00 | $ | 1,255.32 | $ | 10.66 | 1.89 | % | ||||||||
Hypothetical (5% return before expenses) | $ | 1,000.00 | $ | 1,015.61 | $ | 9.53 | 1.89 | % | ||||||||
Class R | ||||||||||||||||
Actual | $ | 1,000.00 | $ | 1,258.01 | $ | 7.85 | 1.39 | % | ||||||||
Hypothetical (5% return before expenses) | $ | 1,000.00 | $ | 1,018.11 | $ | 7.02 | 1.39 | % | ||||||||
Class R6 | ||||||||||||||||
Actual | $ | 1,000.00 | $ | 1,262.23 | $ | 4.03 | 0.71 | % | ||||||||
Hypothetical (5% return before expenses) | $ | 1,000.00 | $ | 1,021.51 | $ | 3.60 | 0.71 | % | ||||||||
Administrator Class | ||||||||||||||||
Actual | $ | 1,000.00 | $ | 1,260.32 | $ | 5.99 | 1.06 | % | ||||||||
Hypothetical (5% return before expenses) | $ | 1,000.00 | $ | 1,019.77 | $ | 5.35 | 1.06 | % | ||||||||
Institutional Class | ||||||||||||||||
Actual | $ | 1,000.00 | $ | 1,261.90 | $ | 4.59 | 0.81 | % | ||||||||
Hypothetical (5% return before expenses) | $ | 1,000.00 | $ | 1,021.01 | $ | 4.10 | 0.81 | % | ||||||||
| 1 | Expenses paid is equal to the annualized net expense ratio of each class multiplied by the average account value over the period, multiplied by the number of days in the most recent fiscal half-year divided by the number of days in the fiscal year (to reflect the one-half-year period). |
10 | Wells Fargo Special Mid Cap Value Fund
Table of Contents
Portfolio of investments—September 30, 2020
| Shares | Value | |||||||||||||||
| Common Stocks: 96.83% |
| |||||||||||||||
Communication Services: 1.80% |
| |||||||||||||||
| Media: 1.80% | ||||||||||||||||
Discovery Communications Incorporated Class C † | 5,599,442 | $ | 109,749,063 | |||||||||||||
Omnicom Group Incorporated | 961,300 | 47,584,350 | ||||||||||||||
| 157,333,413 | ||||||||||||||||
|
| |||||||||||||||
Consumer Discretionary: 7.38% |
| |||||||||||||||
| Auto Components: 3.62% | ||||||||||||||||
Aptiv plc | 2,148,115 | 196,939,183 | ||||||||||||||
Lear Corporation | 1,092,900 | 119,180,745 | ||||||||||||||
| 316,119,928 | ||||||||||||||||
|
| |||||||||||||||
| Diversified Consumer Services: 0.28% | ||||||||||||||||
Terminix Global Holdings Incorporated † | 623,500 | 24,865,180 | ||||||||||||||
|
| |||||||||||||||
| Hotels, Restaurants & Leisure: 2.29% | ||||||||||||||||
Vail Resorts Incorporated | 203,100 | 43,457,307 | ||||||||||||||
Yum China Holdings Incorporated | 2,949,200 | 156,160,140 | ||||||||||||||
| 199,617,447 | ||||||||||||||||
|
| |||||||||||||||
| Household Durables: 0.60% | ||||||||||||||||
D.R. Horton Incorporated | 696,600 | 52,683,858 | ||||||||||||||
|
| |||||||||||||||
| Specialty Retail: 0.20% | ||||||||||||||||
Best Buy Company Incorporated | 154,600 | 17,205,434 | ||||||||||||||
|
| |||||||||||||||
| Textiles, Apparel & Luxury Goods: 0.39% | ||||||||||||||||
PVH Corporation # | 570,600 | 34,030,584 | ||||||||||||||
|
| |||||||||||||||
Consumer Staples: 5.78% |
| |||||||||||||||
| Beverages: 1.27% | ||||||||||||||||
Keurig Dr. Pepper Incorporated | 4,013,969 | 110,785,544 | ||||||||||||||
|
| |||||||||||||||
| Food & Staples Retailing: 1.66% | ||||||||||||||||
BJ’s Wholesale Club Holdings Incorporated † | 3,490,581 | 145,033,641 | ||||||||||||||
|
| |||||||||||||||
| Household Products: 2.85% | ||||||||||||||||
Reynolds Consumer Products Incorporated | 8,137,900 | 249,182,498 | ||||||||||||||
|
| |||||||||||||||
Energy: 2.23% |
| |||||||||||||||
| Energy Equipment & Services: 0.92% | ||||||||||||||||
Baker Hughes Incorporated | 3,224,634 | 42,855,386 | ||||||||||||||
National Oilwell Varco Incorporated | 4,067,000 | 36,847,020 | ||||||||||||||
| 79,702,406 | ||||||||||||||||
|
| |||||||||||||||
| Oil, Gas & Consumable Fuels: 1.31% | ||||||||||||||||
Devon Energy Corporation | 2,645,300 | 25,024,538 | ||||||||||||||
Hess Corporation | 1,011,300 | 41,392,509 | ||||||||||||||
Valero Energy Corporation | 1,111,800 | 48,163,176 | ||||||||||||||
| 114,580,223 | ||||||||||||||||
|
| |||||||||||||||
The accompanying notes are an integral part of these financial statements.
Wells Fargo Special Mid Cap Value Fund | 11
Table of Contents
Portfolio of investments—September 30, 2020
| Shares | Value | |||||||||||||||
Financials: 17.77% |
| |||||||||||||||
| Banks: 4.85% | ||||||||||||||||
Fifth Third Bancorp | 7,141,600 | $ | 152,258,912 | |||||||||||||
PacWest Bancorp | 3,283,000 | 56,073,640 | ||||||||||||||
Regions Financial Corporation | 12,621,500 | 145,525,895 | ||||||||||||||
Zions Bancorporation | 2,373,900 | 69,365,358 | ||||||||||||||
| 423,223,805 | ||||||||||||||||
|
| |||||||||||||||
| Capital Markets: 1.74% | ||||||||||||||||
Pershing Square Tontine Holdings Limited Class A † | 6,701,100 | 152,047,959 | ||||||||||||||
|
| |||||||||||||||
| Consumer Finance: 0.82% | ||||||||||||||||
Discover Financial Services | 1,245,100 | 71,941,878 | ||||||||||||||
|
| |||||||||||||||
| Insurance: 8.92% | ||||||||||||||||
Arch Capital Group Limited † | 7,674,208 | 224,470,584 | ||||||||||||||
Brown & Brown Incorporated | 5,651,200 | 255,829,824 | ||||||||||||||
Fidelity National Financial Incorporated | 1,408,700 | 44,106,397 | ||||||||||||||
Loews Corporation | 3,082,700 | 107,123,825 | ||||||||||||||
The Allstate Corporation | 1,558,400 | 146,707,776 | ||||||||||||||
| 778,238,406 | ||||||||||||||||
|
| |||||||||||||||
| Mortgage REITs: 1.44% | ||||||||||||||||
Annaly Capital Management Incorporated | 17,624,500 | 125,486,440 | ||||||||||||||
|
| |||||||||||||||
Health Care: 9.57% |
| |||||||||||||||
| Health Care Equipment & Supplies: 4.92% | ||||||||||||||||
Alcon Incorporated † | 4,489,200 | 255,659,940 | ||||||||||||||
Zimmer Biomet Holdings Incorporated | 1,278,300 | 174,027,762 | ||||||||||||||
| 429,687,702 | ||||||||||||||||
|
| |||||||||||||||
| Health Care Providers & Services: 3.22% | ||||||||||||||||
Humana Incorporated | 346,700 | 143,495,663 | ||||||||||||||
Universal Health Services Incorporated Class B | 1,285,200 | 137,542,104 | ||||||||||||||
| 281,037,767 | ||||||||||||||||
|
| |||||||||||||||
| Life Sciences Tools & Services: 1.43% | ||||||||||||||||
Charles River Laboratories International Incorporated † | 551,100 | 124,796,595 | ||||||||||||||
|
| |||||||||||||||
Industrials: 19.83% |
| |||||||||||||||
| Aerospace & Defense: 1.82% | ||||||||||||||||
General Dynamics Corporation | 613,700 | 84,954,491 | ||||||||||||||
L3Harris Technologies Incorporated | 434,300 | 73,761,512 | ||||||||||||||
| 158,716,003 | ||||||||||||||||
|
| |||||||||||||||
| Building Products: 1.15% | ||||||||||||||||
Masco Corporation | 1,824,100 | 100,562,633 | ||||||||||||||
|
| |||||||||||||||
| Commercial Services & Supplies: 2.87% | ||||||||||||||||
Republic Services Incorporated | 2,686,100 | 250,747,435 | ||||||||||||||
|
| |||||||||||||||
| Construction & Engineering: 2.26% | ||||||||||||||||
Jacobs Engineering Group Incorporated | 2,124,300 | 197,071,311 | ||||||||||||||
|
| |||||||||||||||
| Industrial Conglomerates: 2.88% | ||||||||||||||||
Carlisle Companies Incorporated | 2,058,000 | 251,837,460 | ||||||||||||||
|
| |||||||||||||||
The accompanying notes are an integral part of these financial statements.
12 | Wells Fargo Special Mid Cap Value Fund
Table of Contents
Portfolio of investments—September 30, 2020
| Shares | Value | |||||||||||||||
| Machinery: 3.68% | ||||||||||||||||
Cummins Incorporated | 409,700 | $ | 86,512,252 | |||||||||||||
Pentair plc | 1,411,000 | 64,581,470 | ||||||||||||||
Stanley Black & Decker Incorporated | 1,048,700 | 170,099,140 | ||||||||||||||
| 321,192,862 | ||||||||||||||||
|
| |||||||||||||||
| Road & Rail: 1.97% | ||||||||||||||||
Kansas City Southern | 950,200 | 171,824,666 | ||||||||||||||
|
| |||||||||||||||
| Trading Companies & Distributors: 3.20% | ||||||||||||||||
AerCap Holdings NV † | 5,043,500 | 127,045,765 | ||||||||||||||
United Rentals Incorporated † | 874,100 | 152,530,450 | ||||||||||||||
| 279,576,215 | ||||||||||||||||
|
| |||||||||||||||
Information Technology: 11.25% |
| |||||||||||||||
| Communications Equipment: 1.14% | ||||||||||||||||
Juniper Networks Incorporated | 4,617,500 | 99,276,250 | ||||||||||||||
|
| |||||||||||||||
| Electronic Equipment, Instruments & Components: 1.80% | ||||||||||||||||
CDW Corporation of Delaware | 519,700 | 62,119,741 | ||||||||||||||
FLIR Systems Incorporated | 2,656,000 | 95,217,600 | ||||||||||||||
| 157,337,341 | ||||||||||||||||
|
| |||||||||||||||
| IT Services: 4.69% | ||||||||||||||||
Amdocs Limited | 4,009,100 | 230,162,431 | ||||||||||||||
Euronet Worldwide Incorporated † | 1,358,100 | 123,722,910 | ||||||||||||||
Paychex Incorporated | 694,600 | 55,408,242 | ||||||||||||||
| 409,293,583 | ||||||||||||||||
|
| |||||||||||||||
| Semiconductors & Semiconductor Equipment: 1.71% | ||||||||||||||||
Analog Devices Incorporated | 1,167,100 | 136,247,254 | ||||||||||||||
CMC Materials Incorporated | 90,000 | 12,852,900 | ||||||||||||||
| 149,100,154 | ||||||||||||||||
|
| |||||||||||||||
| Software: 0.40% | ||||||||||||||||
Synopsys Incorporated † | 162,700 | 34,814,546 | ||||||||||||||
|
| |||||||||||||||
| Technology Hardware, Storage & Peripherals: 1.51% | ||||||||||||||||
NCR Corporation † | 5,971,320 | 132,205,025 | ||||||||||||||
|
| |||||||||||||||
Materials: 7.73% |
| |||||||||||||||
| Chemicals: 3.65% | ||||||||||||||||
Celanese Corporation Series A | 1,332,900 | 143,220,105 | ||||||||||||||
PPG Industries Incorporated | 1,438,200 | 175,575,456 | ||||||||||||||
| 318,795,561 | ||||||||||||||||
|
| |||||||||||||||
| Construction Materials: 1.20% | ||||||||||||||||
Vulcan Materials Company | 773,800 | 104,880,852 | ||||||||||||||
|
| |||||||||||||||
| Containers & Packaging: 1.99% | ||||||||||||||||
AptarGroup Incorporated | 760,000 | 86,032,000 | ||||||||||||||
Packaging Corporation of America | 799,913 | 87,230,513 | ||||||||||||||
| 173,262,513 | ||||||||||||||||
|
| |||||||||||||||
The accompanying notes are an integral part of these financial statements.
Wells Fargo Special Mid Cap Value Fund | 13
Table of Contents
Portfolio of investments—September 30, 2020
| Shares | Value | |||||||||||||||
| Metals & Mining: 0.89% | ||||||||||||||||
Barrick Gold Corporation | 2,760,900 | $ | 77,608,899 | |||||||||||||
|
| |||||||||||||||
Real Estate: 7.70% |
| |||||||||||||||
| Equity REITs: 4.82% | ||||||||||||||||
American Campus Communities Incorporated | 3,396,705 | 118,612,939 | ||||||||||||||
Invitation Homes Incorporated | 6,811,000 | 190,639,890 | ||||||||||||||
Mid-America Apartment Communities Incorporated | 959,400 | 111,242,430 | ||||||||||||||
| 420,495,259 | ||||||||||||||||
|
| |||||||||||||||
| Real Estate Management & Development: 2.88% | ||||||||||||||||
CBRE Group Incorporated Class A † | 5,352,700 | 251,416,319 | ||||||||||||||
|
| |||||||||||||||
Utilities: 5.79% |
| |||||||||||||||
| Electric Utilities: 3.32% | ||||||||||||||||
American Electric Power Company Incorporated | 2,006,300 | 163,974,899 | ||||||||||||||
FirstEnergy Corporation | 4,391,900 | 126,091,449 | ||||||||||||||
| 290,066,348 | ||||||||||||||||
|
| |||||||||||||||
| Water Utilities: 2.47% | ||||||||||||||||
American Water Works Company Incorporated | 1,488,700 | 215,682,856 | ||||||||||||||
|
| |||||||||||||||
Total Common Stocks (Cost $7,534,989,343) |
| 8,453,364,799 | ||||||||||||||
|
| |||||||||||||||
| Expiration date | ||||||||||||||||
| Warrants: 0.06% | ||||||||||||||||
Financials: 0.06% |
| |||||||||||||||
| Capital Markets: 0.06% | ||||||||||||||||
Pershing Square Tontine Holdings Limited Class A † | 7-24-2025 | 739,021 | 5,298,782 | |||||||||||||
|
| |||||||||||||||
Total Warrants (Cost $4,270,666) |
| 5,298,782 | ||||||||||||||
|
| |||||||||||||||
| Yield | ||||||||||||||||
| Short-Term Investments: 2.74% | ||||||||||||||||
| Investment Companies: 2.74% | ||||||||||||||||
Securities Lending Cash Investments LLC (l)(r)(u) | 0.12 | % | 500 | 500 | ||||||||||||
Wells Fargo Government Money Market Fund Select Class (l)(u) | 0.05 | 239,359,353 | 239,359,353 | |||||||||||||
Total Short-Term Investments (Cost $239,359,853) |
| 239,359,853 | ||||||||||||||
|
| |||||||||||||||
| Total investments in securities (Cost $7,778,619,862) | 99.63 | % | 8,698,023,434 | |||||
Other assets and liabilities, net | 0.37 | 32,492,768 | ||||||
|
|
|
| |||||
| Total net assets | 100.00 | % | $ | 8,730,516,202 | ||||
|
|
|
| |||||
| † | Non-income-earning security |
| # | All or a portion of this security is segregated as collateral for investments in derivative instruments. |
| (l) | The issuer of the security is an affiliated person of the Fund as defined in the Investment Company Act of 1940. |
| (r) | The investment is a non-registered investment company. |
| (u) | The rate represents the 7-day annualized yield at period end. |
Abbreviations:
| REIT | Real estate investment trust |
The accompanying notes are an integral part of these financial statements.
14 | Wells Fargo Special Mid Cap Value Fund
Table of Contents
Portfolio of investments—September 30, 2020
Written Options
| Description | Number of contracts | Notional amount | Exercise price | Expiration date | Value | |||||||||||||||
Call | ||||||||||||||||||||
PVH Corporation | (4,900) | $ | (36,750,000 | ) | $ | 75.00 | 10-16-2020 | $ | (98,000 | ) | ||||||||||
Put | ||||||||||||||||||||
ServiceMaster Global Holdings Incorporated | 2,000 | 8,000,000 | 40.00 | 11-20-2020 | (535,000 | ) | ||||||||||||||
|
| |||||||||||||||||||
| $ | (633,000 | ) | ||||||||||||||||||
|
| |||||||||||||||||||
Investments in Affiliates
An affiliated investment is an investment in which the Fund owns at least 5% of the outstanding voting shares of the issuer or as a result of other relationships, such as the Fund and the issuer having the same investment manager. Transactions with issuers that were either affiliates of the Fund at the beginning of the period or the end of the period were as follows:
| Value, beginning of period | Purchases | Sales proceeds | Net realized gains (losses) | Net change in unrealized gains (losses) | Income from affiliated securities | Value, end of period | % of net assets | |||||||||||||||||||||||||
| Short-Term Investments | ||||||||||||||||||||||||||||||||
Investment Companies | ||||||||||||||||||||||||||||||||
Securities Lending Cash Investments LLC | $ | 0 | $ | 84,710,046 | $ | (84,714,216 | ) | $ | 4,670 | $ | 0 | $ | 24,804 | # | $ | 500 | ||||||||||||||||
Wells Fargo Government Money Market Fund Select Class | 528,149,536 | 2,567,644,863 | (2,856,435,046 | ) | 0 | 0 | 3,382,896 | 239,359,353 | ||||||||||||||||||||||||
|
|
|
|
|
|
|
|
|
| |||||||||||||||||||||||
| $ | 4,670 | $ | 0 | $ | 3,407,700 | $ | 239,359,853 | 2.74 | % | |||||||||||||||||||||||
|
|
|
|
|
|
|
|
|
| |||||||||||||||||||||||
| # | Amount shown represents income before fees and rebates. |
The accompanying notes are an integral part of these financial statements.
Wells Fargo Special Mid Cap Value Fund | 15
Table of Contents
Statement of assets and liabilities—September 30, 2020
Assets | ||||
Investments in unaffiliated securities, at value (cost $7,539,260,009) | $ | 8,458,663,581 | ||
Investments in affiliated securities, at value (cost $239,359,853) | 239,359,853 | |||
Cash segregated for written options | 8,000,000 | |||
Receivable for investments sold | 87,891,124 | |||
Receivable for Fund shares sold | 15,502,246 | |||
Receivable for dividends | 11,957,255 | |||
Receivable for securities lending income, net | 2,710 | |||
Prepaid expenses and other assets | 104,772 | |||
|
| |||
Total assets | 8,821,481,541 | |||
|
| |||
Liabilities | ||||
Payable for investments purchased | 72,117,547 | |||
Payable for Fund shares redeemed | 11,043,602 | |||
Written options, at value (premiums received $2,230,817) | 633,000 | |||
Management fee payable | 5,546,654 | |||
Administration fees payable | 830,667 | |||
Distribution fees payable | 74,328 | |||
Trustees’ fees and expenses payable | 3,170 | |||
Accrued expenses and other liabilities | 716,371 | |||
|
| |||
Total liabilities | 90,965,339 | |||
|
| |||
Total net assets | $ | 8,730,516,202 | ||
|
| |||
Net assets consist of | ||||
Paid-in capital | $ | 7,982,221,973 | ||
Total distributable earnings | 748,294,229 | |||
|
| |||
Total net assets | $ | 8,730,516,202 | ||
|
| |||
Computation of net asset value and offering price per share | ||||
Net assets – Class A | $ | 969,508,246 | ||
Shares outstanding – Class A1 | 27,443,882 | |||
Net asset value per share – Class A | $35.33 | |||
Maximum offering price per share – Class A2 | $37.49 | |||
Net assets – Class C | $ | 110,317,929 | ||
Shares outstanding – Class C1 | 3,280,308 | |||
Net asset value per share – Class C | $33.63 | |||
Net assets – Class R | $ | 24,705,095 | ||
Shares outstanding – Class R1 | 691,150 | |||
Net asset value per share – Class R | $35.74 | |||
Net assets – Class R6 | $ | 2,103,895,312 | ||
Shares outstanding – Class R61 | 57,810,205 | |||
Net asset value per share – Class R6 | $36.39 | |||
Net assets – Administrator Class | $ | 324,727,212 | ||
Shares outstanding – Administrator Class1 | 9,014,447 | |||
Net asset value per share – Administrator Class | $36.02 | |||
Net assets – Institutional Class | $ | 5,197,362,408 | ||
Shares outstanding – Institutional Class1 | 143,042,097 | |||
Net asset value per share – Institutional Class | $36.33 | |||
| 1 | The Fund has an unlimited number of authorized shares. |
| 2 | Maximum offering price is computed as 100/94.25 of net asset value. On investments of $50,000 or more, the offering price is reduced. |
The accompanying notes are an integral part of these financial statements.
16 | Wells Fargo Special Mid Cap Value Fund
Table of Contents
Statement of operations—year ended September 30, 2020
Investment income | ||||
Dividends (net of foreign withholding taxes of $154,513) | $ | 152,848,064 | ||
Income from affiliated securities | 3,410,693 | |||
|
| |||
Total investment income | 156,258,757 | |||
|
| |||
Expenses | ||||
Management fee | 61,101,759 | |||
Administration fees |
| |||
Class A | 2,067,417 | |||
Class C | 269,136 | |||
Class R | 59,792 | |||
Class R6 | 659,555 | |||
Administrator Class | 601,168 | |||
Institutional Class | 6,988,280 | |||
Shareholder servicing fees |
| |||
Class A | 2,458,421 | |||
Class C | 319,865 | |||
Class R | 71,034 | |||
Administrator Class | 1,151,162 | |||
Distribution fees |
| |||
Class C | 959,318 | |||
Class R | 70,979 | |||
Custody and accounting fees | 350,369 | |||
Professional fees | 44,324 | |||
Registration fees | 304,901 | |||
Shareholder report expenses | 649,407 | |||
Trustees’ fees and expenses | 21,260 | |||
Other fees and expenses | 139,561 | |||
|
| |||
Total expenses | 78,287,708 | |||
Less: Fee waivers and/or expense reimbursements |
| |||
Fund-level | (10,063 | ) | ||
Class A | (44,780 | ) | ||
Class C | (1 | ) | ||
Administrator Class | (215 | ) | ||
|
| |||
Net expenses | 78,232,649 | |||
|
| |||
Net investment income | 78,026,108 | |||
|
| |||
Realized and unrealized gains (losses) on investments | ||||
Net realized gains (losses) on |
| |||
Unaffiliated securities | (185,015,267 | ) | ||
Affiliated securities | 4,670 | |||
Written options | 5,299,727 | |||
|
| |||
Net realized losses on investments | (179,710,870 | ) | ||
|
| |||
Net change in unrealized gains (losses) on |
| |||
Unaffiliated securities | (521,066,944 | ) | ||
Written options | 1,597,817 | |||
|
| |||
Net change in unrealized gains (losses) on investments | (519,469,127 | ) | ||
|
| |||
Net realized and unrealized gains (losses) on investments | (699,179,997 | ) | ||
|
| |||
Net decrease in net assets resulting from operations | $ | (621,153,889 | ) | |
|
| |||
The accompanying notes are an integral part of these financial statements.
Wells Fargo Special Mid Cap Value Fund | 17
Table of Contents
Statement of changes in net assets
| Year ended September 30, 2020 | Year ended September 30, 2019 | |||||||||||||||
Operations |
| |||||||||||||||
Net investment income | $ | 78,026,108 | $ | 77,380,134 | ||||||||||||
Net realized gains (losses) on investments | (179,710,870 | ) | 303,691,561 | |||||||||||||
Net change in unrealized gains (losses) on investments | (519,469,127 | ) | 233,760,522 | |||||||||||||
|
| |||||||||||||||
Net increase (decrease) in net assets resulting from operations | (621,153,889 | ) | 614,832,217 | |||||||||||||
|
| |||||||||||||||
Distributions to shareholders from net investment income and net realized gains | ||||||||||||||||
Class A | (42,557,946 | ) | (20,592,515 | ) | ||||||||||||
Class C | (5,334,641 | ) | (2,703,167 | ) | ||||||||||||
Class R | (1,279,526 | ) | (562,316 | ) | ||||||||||||
Class R6 | (100,004,255 | ) | (36,838,837 | ) | ||||||||||||
Administrator Class | (24,372,266 | ) | (17,454,931 | ) | ||||||||||||
Institutional Class | (243,751,453 | ) | (114,026,310 | ) | ||||||||||||
|
| |||||||||||||||
Total distributions to shareholders | (417,300,087 | ) | (192,178,076 | ) | ||||||||||||
|
| |||||||||||||||
Capital share transactions | Shares | Shares | ||||||||||||||
Proceeds from shares sold |
| |||||||||||||||
Class A | 9,854,743 | 348,696,853 | 5,327,538 | 192,757,937 | ||||||||||||
Class C | 407,609 | 14,546,860 | 395,515 | 13,743,148 | ||||||||||||
Class R | 219,967 | 7,988,211 | 312,326 | 11,470,210 | ||||||||||||
Class R6 | 25,955,043 | 962,352,547 | 19,811,243 | 753,877,254 | ||||||||||||
Administrator Class | 2,021,462 | 74,053,375 | 2,524,441 | 92,078,365 | ||||||||||||
Institutional Class | 73,446,153 | 2,568,631,752 | 49,318,478 | 1,865,932,723 | ||||||||||||
|
| |||||||||||||||
| 3,976,269,598 | 2,929,859,637 | |||||||||||||||
|
| |||||||||||||||
Reinvestment of distributions |
| |||||||||||||||
Class A | 982,408 | 39,537,339 | 578,559 | 19,307,072 | ||||||||||||
Class C | 131,467 | 5,025,996 | 79,940 | 2,563,693 | ||||||||||||
Class R | 31,409 | 1,278,194 | 16,602 | 561,690 | ||||||||||||
Class R6 | 2,282,372 | 94,677,008 | 1,023,710 | 35,011,870 | ||||||||||||
Administrator Class | 592,191 | 24,283,965 | 512,565 | 17,408,508 | ||||||||||||
Institutional Class | 5,501,267 | 227,806,608 | 3,085,272 | 105,464,480 | ||||||||||||
|
| |||||||||||||||
| 392,609,110 | 180,317,313 | |||||||||||||||
|
| |||||||||||||||
Payment for shares redeemed |
| |||||||||||||||
Class A | (8,719,115 | ) | (308,529,296 | ) | (8,214,077 | ) | (295,833,462 | ) | ||||||||
Class C | (1,144,867 | ) | (38,288,578 | ) | (1,443,715 | ) | (49,286,556 | ) | ||||||||
Class R | (357,364 | ) | (13,041,741 | ) | (177,050 | ) | (6,492,936 | ) | ||||||||
Class R6 | (21,827,939 | ) | (779,801,393 | ) | (8,066,799 | ) | (299,782,094 | ) | ||||||||
Administrator Class | (8,570,743 | ) | (280,525,180 | ) | (13,653,775 | ) | (493,668,005 | ) | ||||||||
Institutional Class | �� | (67,358,421 | ) | (2,411,269,322 | ) | (48,844,550 | ) | (1,804,574,146 | ) | |||||||
|
| |||||||||||||||
| (3,831,455,510 | ) | (2,949,637,199 | ) | |||||||||||||
|
| |||||||||||||||
Net increase in net assets resulting from capital share transactions | 537,423,198 | 160,539,751 | ||||||||||||||
|
| |||||||||||||||
Total increase (decrease) in net assets | (501,030,778 | ) | 583,193,892 | |||||||||||||
|
| |||||||||||||||
Net assets | ||||||||||||||||
Beginning of period | 9,231,546,980 | 8,648,353,088 | ||||||||||||||
|
| |||||||||||||||
End of period | $ | 8,730,516,202 | $ | 9,231,546,980 | ||||||||||||
|
| |||||||||||||||
The accompanying notes are an integral part of these financial statements.
18 | Wells Fargo Special Mid Cap Value Fund
Table of Contents
(For a share outstanding throughout each period)
| Year ended September 30 | ||||||||||||||||||||
| CLASS A | 2020 | 2019 | 2018 | 2017 | 2016 | |||||||||||||||
Net asset value, beginning of period | $39.63 | $37.59 | $37.49 | $33.12 | $29.91 | |||||||||||||||
Net investment income | 0.18 | 0.26 | 0.15 | 0.33 | 0.19 | |||||||||||||||
Net realized and unrealized gains (losses) on investments | (2.85 | ) | 2.54 | 1.50 | 4.42 | 4.23 | ||||||||||||||
|
|
|
|
|
|
|
|
|
| |||||||||||
Total from investment operations | (2.67 | ) | 2.80 | 1.65 | 4.75 | 4.42 | ||||||||||||||
Distributions to shareholders from | ||||||||||||||||||||
Net investment income | (0.23 | ) | (0.17 | ) | (0.23 | ) | (0.19 | ) | (0.08 | ) | ||||||||||
Net realized gains | (1.40 | ) | (0.59 | ) | (1.32 | ) | (0.19 | ) | (1.13 | ) | ||||||||||
|
|
|
|
|
|
|
|
|
| |||||||||||
Total distributions to shareholders | (1.63 | ) | (0.76 | ) | (1.55 | ) | (0.38 | ) | (1.21 | ) | ||||||||||
Net asset value, end of period | $35.33 | $39.63 | $37.59 | $37.49 | $33.12 | |||||||||||||||
Total return1 | (7.22 | )% | 7.81 | % | 4.50 | % | 14.41 | % | 15.34 | % | ||||||||||
Ratios to average net assets (annualized) | ||||||||||||||||||||
Gross expenses | 1.14 | % | 1.15 | % | 1.15 | % | 1.18 | % | 1.19 | % | ||||||||||
Net expenses | 1.14 | % | 1.15 | % | 1.15 | % | 1.18 | % | 1.19 | % | ||||||||||
Net investment income | 0.56 | % | 0.67 | % | 0.40 | % | 0.78 | % | 0.82 | % | ||||||||||
Supplemental data | ||||||||||||||||||||
Portfolio turnover rate | 51 | % | 37 | % | 37 | % | 46 | % | 30 | % | ||||||||||
Net assets, end of period (000s omitted) | $969,508 | $1,003,560 | $1,038,883 | $1,070,690 | $1,363,213 | |||||||||||||||
| 1 | Total return calculations do not include any sales charges. |
The accompanying notes are an integral part of these financial statements.
Wells Fargo Special Mid Cap Value Fund | 19
Table of Contents
Financial highlights
(For a share outstanding throughout each period)
| Year ended September 30 | ||||||||||||||||||||
| CLASS C | 2020 | 2019 | 2018 | 2017 | 2016 | |||||||||||||||
Net asset value, beginning of period | $37.85 | $36.02 | $36.03 | $31.91 | $29.00 | |||||||||||||||
Net investment income (loss) | (0.11 | ) | (0.07 | ) | (0.14 | ) | 0.06 | 0.03 | ||||||||||||
Net realized and unrealized gains (losses) on investments | (2.71 | ) | 2.49 | 1.46 | 4.26 | 4.02 | ||||||||||||||
|
|
|
|
|
|
|
|
|
| |||||||||||
Total from investment operations | (2.82 | ) | 2.42 | 1.32 | 4.32 | 4.05 | ||||||||||||||
Distributions to shareholders from | ||||||||||||||||||||
Net investment income | 0.00 | 0.00 | (0.01 | ) | (0.01 | ) | (0.01 | ) | ||||||||||||
Net realized gains | (1.40 | ) | (0.59 | ) | (1.32 | ) | (0.19 | ) | (1.13 | ) | ||||||||||
|
|
|
|
|
|
|
|
|
| |||||||||||
Total distributions to shareholders | (1.40 | ) | (0.59 | ) | (1.33 | ) | (0.20 | ) | (1.14 | ) | ||||||||||
Net asset value, end of period | $33.63 | $37.85 | $36.02 | $36.03 | $31.91 | |||||||||||||||
Total return1 | (7.89 | )% | 7.00 | % | 3.72 | % | 13.56 | % | 14.47 | % | ||||||||||
Ratios to average net assets (annualized) | ||||||||||||||||||||
Gross expenses | 1.89 | % | 1.90 | % | 1.90 | % | 1.92 | % | 1.94 | % | ||||||||||
Net expenses | 1.89 | % | 1.90 | % | 1.90 | % | 1.92 | % | 1.94 | % | ||||||||||
Net investment income (loss) | (0.19 | )% | (0.09 | )% | (0.35 | )% | 0.14 | % | 0.03 | % | ||||||||||
Supplemental data | ||||||||||||||||||||
Portfolio turnover rate | 51 | % | 37 | % | 37 | % | 46 | % | 30 | % | ||||||||||
Net assets, end of period (000s omitted) | $110,318 | $147,086 | $174,839 | $191,954 | $116,022 | |||||||||||||||
| 1 | Total return calculations do not include any sales charges. |
The accompanying notes are an integral part of these financial statements.
20 | Wells Fargo Special Mid Cap Value Fund
Table of Contents
Financial highlights
(For a share outstanding throughout each period)
| Year ended September 30 | ||||||||||||||||||||
| CLASS R | 2020 | 2019 | 2018 | 2017 | 2016 | |||||||||||||||
Net asset value, beginning of period | $40.10 | $38.09 | $38.08 | $33.78 | $30.70 | |||||||||||||||
Net investment income | 0.09 | 0.17 | 0.09 | 0.32 | 0.12 | 1 | ||||||||||||||
Net realized and unrealized gains (losses) on investments | (2.90 | ) | 2.57 | 1.49 | 4.43 | 4.32 | ||||||||||||||
|
|
|
|
|
|
|
|
|
| |||||||||||
Total from investment operations | (2.81 | ) | 2.74 | 1.58 | 4.75 | 4.44 | ||||||||||||||
Distributions to shareholders from | ||||||||||||||||||||
Net investment income | (0.15 | ) | (0.14 | ) | (0.25 | ) | (0.26 | ) | (0.23 | ) | ||||||||||
Net realized gains | (1.40 | ) | (0.59 | ) | (1.32 | ) | (0.19 | ) | (1.13 | ) | ||||||||||
|
|
|
|
|
|
|
|
|
| |||||||||||
Total distributions to shareholders | (1.55 | ) | (0.73 | ) | (1.57 | ) | (0.45 | ) | (1.36 | ) | ||||||||||
Net asset value, end of period | $35.74 | $40.10 | $38.09 | $38.08 | $33.78 | |||||||||||||||
Total return | (7.45 | )% | 7.52 | % | 4.23 | % | 14.13 | % | 15.05 | % | ||||||||||
Ratios to average net assets (annualized) | ||||||||||||||||||||
Gross expenses | 1.39 | % | 1.40 | % | 1.40 | % | 1.42 | % | 1.44 | % | ||||||||||
Net expenses | 1.39 | % | 1.40 | % | 1.40 | % | 1.42 | % | 1.44 | % | ||||||||||
Net investment income | 0.31 | % | 0.43 | % | 0.18 | % | 0.77 | % | 0.37 | % | ||||||||||
Supplemental data | ||||||||||||||||||||
Portfolio turnover rate | 51 | % | 37 | % | 37 | % | 46 | % | 30 | % | ||||||||||
Net assets, end of period (000s omitted) | $24,705 | $31,961 | $24,575 | $14,505 | $1,778 | |||||||||||||||
| 1 | Calculated based upon average shares outstanding |
The accompanying notes are an integral part of these financial statements.
Wells Fargo Special Mid Cap Value Fund | 21
Table of Contents
Financial highlights
(For a share outstanding throughout each period)
| Year ended September 30 | ||||||||||||||||||||
| CLASS R6 | 2020 | 2019 | 2018 | 2017 | 2016 | |||||||||||||||
Net asset value, beginning of period | $40.76 | $38.67 | $38.52 | $34.03 | $30.71 | |||||||||||||||
Net investment income | 0.36 | 0.40 | 0.32 | 1 | 0.50 | 1 | 0.38 | 1 | ||||||||||||
Net realized and unrealized gains (losses) on investments | (2.94 | ) | 2.62 | 1.55 | 4.53 | 4.30 | ||||||||||||||
|
|
|
|
|
|
|
|
|
| |||||||||||
Total from investment operations | (2.58 | ) | 3.02 | 1.87 | 5.03 | 4.68 | ||||||||||||||
Distributions to shareholders from | ||||||||||||||||||||
Net investment income | (0.39 | ) | (0.34 | ) | (0.40 | ) | (0.35 | ) | (0.23 | ) | ||||||||||
Net realized gains | (1.40 | ) | (0.59 | ) | (1.32 | ) | (0.19 | ) | (1.13 | ) | ||||||||||
|
|
|
|
|
|
|
|
|
| |||||||||||
Total distributions to shareholders | (1.79 | ) | (0.93 | ) | (1.72 | ) | (0.54 | ) | (1.36 | ) | ||||||||||
Net asset value, end of period | $36.39 | $40.76 | $38.67 | $38.52 | $34.03 | |||||||||||||||
Total return | (6.84 | )% | 8.28 | % | 4.95 | % | 14.88 | % | 15.84 | % | ||||||||||
Ratios to average net assets (annualized) | ||||||||||||||||||||
Gross expenses | 0.71 | % | 0.72 | % | 0.72 | % | 0.74 | % | 0.76 | % | ||||||||||
Net expenses | 0.71 | % | 0.72 | % | 0.72 | % | 0.74 | % | 0.76 | % | ||||||||||
Net investment income | 0.99 | % | 1.12 | % | 0.85 | % | 1.37 | % | 1.21 | % | ||||||||||
Supplemental data | ||||||||||||||||||||
Portfolio turnover rate | 51 | % | 37 | % | 37 | % | 46 | % | 30 | % | ||||||||||
Net assets, end of period (000s omitted) | $2,103,895 | $2,094,860 | $1,493,787 | $906,784 | $374,557 | |||||||||||||||
| 1 | Calculated based upon average shares outstanding |
The accompanying notes are an integral part of these financial statements.
22 | Wells Fargo Special Mid Cap Value Fund
Table of Contents
Financial highlights
(For a share outstanding throughout each period)
| Year ended September 30 | ||||||||||||||||||||
| ADMINISTRATOR CLASS | 2020 | 2019 | 2018 | 2017 | 2016 | |||||||||||||||
Net asset value, beginning of period | $40.35 | $38.23 | $38.12 | $33.67 | $30.45 | |||||||||||||||
Net investment income | 0.24 | 1 | 0.27 | 1 | 0.18 | 1 | 0.34 | 1 | 0.26 | |||||||||||
Net realized and unrealized gains (losses) on investments | (2.93 | ) | 2.61 | 1.52 | 4.52 | 4.26 | ||||||||||||||
|
|
|
|
|
|
|
|
|
| |||||||||||
Total from investment operations | (2.69 | ) | 2.88 | 1.70 | 4.86 | 4.52 | ||||||||||||||
Distributions to shareholders from | ||||||||||||||||||||
Net investment income | (0.24 | ) | (0.17 | ) | (0.27 | ) | (0.22 | ) | (0.17 | ) | ||||||||||
Net realized gains | (1.40 | ) | (0.59 | ) | (1.32 | ) | (0.19 | ) | (1.13 | ) | ||||||||||
|
|
|
|
|
|
|
|
|
| |||||||||||
Total distributions to shareholders | (1.64 | ) | (0.76 | ) | (1.59 | ) | (0.41 | ) | (1.30 | ) | ||||||||||
Net asset value, end of period | $36.02 | $40.35 | $38.23 | $38.12 | $33.67 | |||||||||||||||
Total return | (7.15 | )% | 7.88 | % | 4.58 | % | 14.50 | % | 15.42 | % | ||||||||||
Ratios to average net assets (annualized) | ||||||||||||||||||||
Gross expenses | 1.06 | % | 1.07 | % | 1.07 | % | 1.09 | % | 1.10 | % | ||||||||||
Net expenses | 1.06 | % | 1.07 | % | 1.07 | % | 1.09 | % | 1.10 | % | ||||||||||
Net investment income | 0.65 | % | 0.72 | % | 0.47 | % | 0.95 | % | 0.88 | % | ||||||||||
Supplemental data | ||||||||||||||||||||
Portfolio turnover rate | 51 | % | 37 | % | 37 | % | 46 | % | 30 | % | ||||||||||
Net assets, end of period (000s omitted) | $324,727 | $604,126 | $978,368 | $1,156,796 | $834,134 | |||||||||||||||
| 1 | Calculated based upon average shares outstanding |
The accompanying notes are an integral part of these financial statements.
Wells Fargo Special Mid Cap Value Fund | 23
Table of Contents
Financial highlights
(For a share outstanding throughout each period)
| Year ended September 30 | ||||||||||||||||||||
| INSTITUTIONAL CLASS | 2020 | 2019 | 2018 | 2017 | 2016 | |||||||||||||||
Net asset value, beginning of period | $40.70 | $38.61 | $38.47 | $34.00 | $30.70 | |||||||||||||||
Net investment income | 0.32 | 0.38 | 1 | 0.26 | 0.41 | 0.35 | 1 | |||||||||||||
Net realized and unrealized gains (losses) on investments | (2.94 | ) | 2.60 | 1.56 | 4.58 | 4.29 | ||||||||||||||
|
|
|
|
|
|
|
|
|
| |||||||||||
Total from investment operations | (2.62 | ) | 2.98 | 1.82 | 4.99 | 4.64 | ||||||||||||||
Distributions to shareholders from | ||||||||||||||||||||
Net investment income | (0.35 | ) | (0.30 | ) | (0.36 | ) | (0.33 | ) | (0.21 | ) | ||||||||||
Net realized gains | (1.40 | ) | (0.59 | ) | (1.32 | ) | (0.19 | ) | (1.13 | ) | ||||||||||
|
|
|
|
|
|
|
|
|
| |||||||||||
Total distributions to shareholders | (1.75 | ) | (0.89 | ) | (1.68 | ) | (0.52 | ) | (1.34 | ) | ||||||||||
Net asset value, end of period | $36.33 | $40.70 | $38.61 | $38.47 | $34.00 | |||||||||||||||
Total return | (6.93 | )% | 8.17 | % | 4.84 | % | 14.76 | % | 15.73 | % | ||||||||||
Ratios to average net assets (annualized) | ||||||||||||||||||||
Gross expenses | 0.81 | % | 0.82 | % | 0.82 | % | 0.84 | % | 0.86 | % | ||||||||||
Net expenses | 0.81 | % | 0.82 | % | 0.82 | % | 0.84 | % | 0.86 | % | ||||||||||
Net investment income | 0.89 | % | 1.00 | % | 0.73 | % | 1.24 | % | 1.07 | % | ||||||||||
Supplemental data | ||||||||||||||||||||
Portfolio turnover rate | 51 | % | 37 | % | 37 | % | 46 | % | 30 | % | ||||||||||
Net assets, end of period (000s omitted) | $5,197,362 | $5,349,953 | $4,937,901 | $4,595,274 | $2,325,777 | |||||||||||||||
| 1 | Calculated based upon average shares outstanding |
The accompanying notes are an integral part of these financial statements.
24 | Wells Fargo Special Mid Cap Value Fund
Table of Contents
1. ORGANIZATION
Wells Fargo Funds Trust (the “Trust”), a Delaware statutory trust organized on March 10, 1999, is an open-end management investment company registered under the Investment Company Act of 1940, as amended (the “1940 Act”). As an investment company, the Trust follows the accounting and reporting guidance in Financial Accounting Standards Board (“FASB”) Accounting Standards Codification Topic 946, Financial Services – Investment Companies. These financial statements report on the Wells Fargo Special Mid Cap Value Fund (the “Fund”) which is a diversified series of the Trust.
2. SIGNIFICANT ACCOUNTING POLICIES
The following significant accounting policies, which are consistently followed in the preparation of the financial statements of the Fund, are in conformity with U.S. generally accepted accounting principles which require management to make estimates and assumptions that affect the reported amounts of assets and liabilities, disclosure of contingent assets and liabilities at the date of the financial statements, and the reported amounts of revenues and expenses during the reporting period. Actual results could differ from those estimates.
Securities valuation
All investments are valued each business day as of the close of regular trading on the New York Stock Exchange (generally 4 p.m. Eastern Time), although the Fund may deviate from this calculation time under unusual or unexpected circumstances.
Equity securities and options that are listed on a foreign or domestic exchange or market are valued at the official closing price or, if none, the last sales price. If no sale occurs on the principal exchange or market that day, a fair value price will be determined in accordance with the Fund’s Valuation Procedures.
Investments in registered open-end investment companies are valued at net asset value. Interests in non-registered investment companies that are redeemable at net asset value are fair valued normally at net asset value.
Investments which are not valued using any of the methods discussed above are valued at their fair value, as determined in good faith by the Board of Trustees of the Fund. The Board of Trustees has established a Valuation Committee comprised of the Trustees and has delegated to it the authority to take any actions regarding the valuation of portfolio securities that the Valuation Committee deems necessary or appropriate, including determining the fair value of portfolio securities, unless the determination has been delegated to the Wells Fargo Asset Management Pricing Committee at Wells Fargo Funds Management, LLC (“Funds Management”). The Board of Trustees retains the authority to make or ratify any valuation decisions or approve any changes to the Valuation Procedures as it deems appropriate. On a quarterly basis, the Board of Trustees receives reports on any valuation actions taken by the Valuation Committee or the Wells Fargo Asset Management Pricing Committee which may include items for ratification.
Securities lending
The Fund may lend its securities from time to time in order to earn additional income in the form of fees or interest on securities received as collateral or the investment of any cash received as collateral. When securities are on loan, the Fund receives interest or dividends on those securities. Cash collateral received in connection with its securities lending transactions is invested in Securities Lending Cash Investments, LLC (the “Securities Lending Fund”). Investments in Securities Lending Fund are valued at the evaluated bid price provided by an independent pricing service. Income earned from investment in the Securities Lending Fund (net of fees and rebates), if any, is included in income from affiliated securities on the Statement of Operations.
In a securities lending transaction, the net asset value of the Fund is affected by an increase or decrease in the value of the securities loaned and by an increase or decrease in the value of the instrument in which collateral is invested. The amount of securities lending activity undertaken by the Fund fluctuates from time to time. The Fund has the right under the lending agreement to recover the securities from the borrower on demand. In the event of default or bankruptcy by the borrower, the Fund may be prevented from recovering the loaned securities or gaining access to the collateral or may experience delays or costs in doing so. In such an event, the terms of the agreement allow the unaffiliated securities lending agent to use the collateral to purchase replacement securities on behalf of the Fund or pay the Fund the market value of the loaned securities. The Fund bears the risk of loss with respect to depreciation of its investment of the cash collateral.
Options
The Fund may write covered call options or secured put options on individual securities and/or indexes. When the Fund writes an option, an amount equal to the premium received is recorded as a liability and is subsequently adjusted to the current market value of the written option. Premiums received from written options that expire unexercised are recognized as realized gains on the expiration date. For exercised options, the difference between the premium received and the amount paid on effecting a
Wells Fargo Special Mid Cap Value Fund | 25
Table of Contents
Notes to financial statements
closing purchase transaction, including brokerage commissions, is treated as a realized gain or loss. If a call option is exercised, the premium is added to the proceeds from the sale of the underlying security in calculating the realized gain or loss on the sale. If a put option is exercised, the premium reduces the cost of the security purchased. The Fund, as a writer of an option, bears the market risk of an unfavorable change in the price of the security and/or index underlying the written option.
The Fund may also purchase call or put options. Premiums paid are included in the Statement of Assets and Liabilities as investments, the values of which are subsequently adjusted based on the current market values of the options. Premiums paid for purchased options that expire are recognized as realized losses on the expiration date. Premiums paid for purchased options that are exercised or closed are added to the amount paid or offset against the proceeds received for the underlying security to determine the realized gain or loss. The risk of loss associated with purchased options is limited to the premium paid.
Options traded on an exchange are regulated and terms of the options are standardized. The Fund is subject to equity price risk. Purchased options traded over-the-counter expose the Fund to counterparty risk in the event the counterparty does not perform. This risk can be mitigated by having a master netting arrangement between the Fund and the counterparty and by having the counterparty post collateral to cover the Fund’s exposure to the counterparty.
Security transactions and income recognition
Securities transactions are recorded on a trade date basis. Realized gains or losses are recorded on the basis of identified cost.
Dividend income is recognized on the ex-dividend date. Dividend income from foreign securities is recorded net of foreign taxes withheld where recovery of such taxes is not assured.
Distributions to shareholders
Distributions to shareholders from net investment income and any net realized gains are recorded on the ex-dividend date and paid at least annually. Such distributions are determined in accordance with income tax regulations and may differ from U.S. generally accepted accounting principles. Dividend sources are estimated at the time of declaration. The tax character of distributions is determined as of the Fund’s fiscal year end. Therefore, a portion of the Fund’s distributions made prior to the Fund’s fiscal year end may be categorized as a tax return of capital at year end.
Federal and other taxes
The Fund intends to continue to qualify as a regulated investment company by distributing substantially all of its investment company taxable income and any net realized capital gains (after reduction for capital loss carryforwards) sufficient to relieve it from all, or substantially all, federal income taxes. Accordingly, no provision for federal income taxes was required.
The Fund’s income and federal excise tax returns and all financial records supporting those returns for the prior three fiscal years are subject to examination by the federal and Delaware revenue authorities. Management has analyzed the Fund’s tax positions taken on federal, state, and foreign tax returns for all open tax years and does not believe that there are any uncertain tax positions that require recognition of a tax liability.
As of September 30, 2020, the aggregate cost of all investments for federal income tax purposes was $7,793,385,732 and the unrealized gains (losses) consisted of:
Gross unrealized gains | $ | 1,582,813,384 | ||
Gross unrealized losses | (676,577,865 | ) | ||
Net unrealized gains | $ | 906,235,519 | ||
Reclassifications are made to the Fund’s capital accounts for permanent tax differences to reflect income and gains available for distribution (or available capital loss carryforwards) under federal income tax regulations. U.S. generally accepted accounting principles require that certain components of net assets be adjusted to reflect permanent differences between financial and tax reporting. These reclassifications have no effect on net assets or net asset values per share. At September 30, 2020, as a result of permanent book-to-tax differences, the following reclassification adjustments were made on the Statement of Assets and Liabilities:
| Paid-in capital | Total distributable earnings | |
| $59,673 | $(59,673) | |
As of September 30, 2020, the Fund had current year deferred post-October capital losses consisting of $205,403,024 in short-term losses and $3,124,039 in long-term losses which will be recognized on the first day of the following fiscal year.
26 | Wells Fargo Special Mid Cap Value Fund
Table of Contents
Notes to financial statements
Class allocations
The separate classes of shares offered by the Fund differ principally in applicable sales charges, distribution, shareholder servicing, and administration fees. Class specific expenses are charged directly to that share class. Investment income, common fund-level expenses, and realized and unrealized gains (losses) on investments are allocated daily to each class of shares based on the relative proportion of net assets of each class.
3. FAIR VALUATION MEASUREMENTS
Fair value measurements of investments are determined within a framework that has established a fair value hierarchy based upon the various data inputs utilized in determining the value of the Fund’s investments. The three-level hierarchy gives the highest priority to unadjusted quoted prices in active markets for identical assets or liabilities (Level 1) and the lowest priority to unobservable inputs (Level 3). The Fund’s investments are classified within the fair value hierarchy based on the lowest level of input that is significant to the fair value measurement. The inputs are summarized into three broad levels as follows:
| ∎ | Level 1 – quoted prices in active markets for identical securities |
| ∎ | Level 2 – other significant observable inputs (including quoted prices for similar securities, interest rates, prepayment speeds, credit risk, etc.) |
| ∎ | Level 3 – significant unobservable inputs (including the Fund’s own assumptions in determining the fair value of investments) |
The inputs or methodologies used for valuing investments in securities are not necessarily an indication of the risk associated with investing in those securities.
The following is a summary of the inputs used in valuing the Fund’s assets and liabilities as of September 30, 2020:
| Quoted prices (Level 1) | Other significant observable inputs (Level 2) | Significant (Level 3) | Total | |||||||||||||
Assets | ||||||||||||||||
Investments in: | ||||||||||||||||
Common stocks | ||||||||||||||||
Communication services | $ | 157,333,413 | $ | 0 | $ | 0 | $ | 157,333,413 | ||||||||
Consumer discretionary | 644,522,431 | 0 | 0 | 644,522,431 | ||||||||||||
Consumer staples | 505,001,683 | 0 | 0 | 505,001,683 | ||||||||||||
Energy | 194,282,629 | 0 | 0 | 194,282,629 | ||||||||||||
Financials | 1,550,938,488 | 0 | 0 | 1,550,938,488 | ||||||||||||
Health care | 835,522,064 | 0 | 0 | 835,522,064 | ||||||||||||
Industrials | 1,731,528,585 | 0 | 0 | 1,731,528,585 | ||||||||||||
Information technology | 982,026,899 | 0 | 0 | 982,026,899 | ||||||||||||
Materials | 674,547,825 | 0 | 0 | 674,547,825 | ||||||||||||
Real estate | 671,911,578 | 0 | 0 | 671,911,578 | ||||||||||||
Utilities | 505,749,204 | 0 | 0 | 505,749,204 | ||||||||||||
Warrants | ||||||||||||||||
Financials | 0 | 5,298,782 | 0 | 5,298,782 | ||||||||||||
Short-term investments | ||||||||||||||||
Investment companies | 239,359,853 | 0 | 0 | 239,359,853 | ||||||||||||
Total assets | $ | 8,692,724,652 | $ | 5,298,782 | $ | 0 | $ | 8,698,023,434 | ||||||||
Liabilities | ||||||||||||||||
Written options | $ | 0 | $ | 633,000 | $ | 0 | $ | 633,000 | ||||||||
Total liabilities | $ | 0 | $ | 633,000 | $ | 0 | $ | 633,000 | ||||||||
Additional sector, industry or geographic detail is included in the Portfolio of Investments.
For the year ended September 30, 2020, the Fund did not have any transfers into/out of Level 3.
Wells Fargo Special Mid Cap Value Fund | 27
Table of Contents
Notes to financial statements
4. TRANSACTIONS WITH AFFILIATES
Management fee
Funds Management, an indirect wholly owned subsidiary of Wells Fargo & Company (“Wells Fargo”), is the manager of the Fund and provides advisory and fund-level administrative services under an investment management agreement. Under the investment management agreement, Funds Management is responsible for, among other services, implementing the investment objectives and strategies of the Fund, supervising the subadviser and providing fund-level administrative services in connection with the Fund’s operations. As compensation for its services under the investment management agreement, Funds Management is entitled to receive a management fee at the following annual rate based on the Fund’s average daily net assets:
| Average daily net assets | Management fee | |||
First $500 million | 0.750 | % | ||
Next $500 million | 0.725 | |||
Next $1 billion | 0.700 | |||
Next $2 billion | 0.675 | |||
Next $1 billion | 0.650 | |||
Next $5 billion | 0.640 | |||
Next $2 billion | 0.630 | |||
Next $4 billion | 0.620 | |||
Over $16 billion | 0.610 | |||
For the year ended September 30, 2020, the management fee was equivalent to an annual rate of 0.67% of the Fund’s average daily net assets.
Funds Management has retained the services of a subadviser to provide daily portfolio management to the Fund. The fee for subadvisory services is borne by Funds Management. Wells Capital Management Incorporated (“WellsCap”), an affiliate of Funds Management and an indirect wholly owned subsidiary of Wells Fargo, is the subadviser to the Fund and is entitled to receive a fee from Funds Management at an annual rate starting at 0.45% and declining to 0.30% as the average daily net assets of the Fund increase.
Administration fees
Under a class-level administration agreement, Funds Management provides class-level administrative services to the Fund, which includes paying fees and expenses for services provided by the transfer agent, sub-transfer agents, omnibus account servicers and record-keepers. As compensation for its services under the class-level administration agreement, Funds Management receives an annual fee which is calculated based on the average daily net assets of each class as follows:
| Class-level administration fee | ||||
Class A, Class C, Class R | 0.21 | % | ||
Class R6 | 0.03 | |||
Administrator Class, Institutional Class | 0.13 | |||
Waivers and/or expense reimbursements
Funds Management has contractually waived and/or reimbursed management and administration fees to the extent necessary to maintain certain net operating expense ratios for the Fund. When each class of the Fund has exceeded its expense cap, Funds Management has waived fees and/or reimbursed expenses from fund-level expenses on a proportionate basis and then from class specific expenses. When only certain classes exceed their expense caps, waivers and/or reimbursements are applied against class specific expenses before fund-level expenses. Funds Management has committed through January 31, 2021 to waive fees and/or reimburse expenses to the extent necessary to cap the Fund’s expenses at 1.16% for Class A shares, 1.91% for Class C shares, 1.41% for Class R shares, 0.73% for Class R6 shares, 1.08% for Administrator Class shares, and 0.83% for Institutional Class shares. Prior to or after the commitment expiration date, the cap may be increased or the commitment to maintain the cap may be terminated only with the approval of the Board of Trustees.
28 | Wells Fargo Special Mid Cap Value Fund
Table of Contents
Notes to financial statements
Distribution fees
The Trust has adopted a distribution plan for Class C and Class R shares of the Fund pursuant to Rule 12b-1 under the 1940 Act. Distribution fees are charged to Class C and Class R shares and paid to Wells Fargo Funds Distributor, LLC (“Funds Distributor”), the principal underwriter, at an annual rate of 0.75% of the average daily net assets of Class C shares and 0.25% of the average daily net assets of Class R shares.
In addition, Funds Distributor is entitled to receive the front-end sales charge from the purchase of Class A shares and a contingent deferred sales charge on the redemption of certain Class A shares. Funds Distributor is also entitled to receive the contingent deferred sales charges from redemptions of Class C shares. For the year ended September 30, 2020, Funds Distributor received $55,769 from the sale of Class A shares and $318 in contingent deferred sales charges from redemptions of Class C shares. No contingent deferred sales charges were incurred by Class A shares for the year ended September 30, 2020.
Shareholder servicing fees
The Trust has entered into contracts with one or more shareholder servicing agents, whereby Class A, Class C, Class R and Administrator Class of the Fund are charged a fee at an annual rate of 0.25% of the average daily net assets of each respective class. A portion of these total shareholder servicing fees were paid to affiliates of Wells Fargo.
Interfund transactions
The Fund may purchase or sell portfolio investment securities to certain other Wells Fargo affiliates pursuant to Rule 17a-7 under the 1940 Act and under procedures adopted by the Board of Trustees. The procedures have been designed to ensure that these interfund transactions, which do not incur broker commissions, are effected at current market prices.
5. INVESTMENT PORTFOLIO TRANSACTIONS
Purchases and sales of investments, excluding U.S. government obligations (if any) and short-term securities, for the year ended September 30, 2020 were $4,970,946,162 and $4,454,983,200, respectively.
6. SECURITIES LENDING TRANSACTIONS
The Fund lends its securities through an unaffiliated securities lending agent and receives collateral in the form of cash or securities with a value at least equal to the value of the securities on loan. The value of the loaned securities is determined at the close of each business day and any increases or decreases in the required collateral are exchanged between the Fund and the counterparty on the next business day. Cash collateral received is invested in the Securities Lending Fund which seeks to provide a positive return compared to the daily Federal Funds Open Rate by investing in high-quality, U.S. dollar-denominated short-term money market instruments and is exempt from registration under Section 3(c)(7) of the 1940 Act. Securities Lending Fund is managed by Funds Management and is subadvised by WellsCap. Funds Management receives an advisory fee starting at 0.05% and declining to 0.01% as the average daily net assets of the Securities Lending Fund increase. All of the fees received by Funds Management are paid to WellsCap for its services as subadviser.
In the event of counterparty default or the failure of a borrower to return a loaned security, the Fund has the right to use the collateral to offset any losses incurred. As of September 30, 2020, the Fund did not have any securities on loan.
7. DERIVATIVE TRANSACTIONS
During the year ended September 30, 2020, the Fund entered into written options for hedging purposes. The Fund had an average of 11,137 written option contracts during the year ended September 30, 2020.
The fair value, realized gains or losses and change in unrealized gains or losses, if any, on derivative instruments are reflected in the corresponding financial statement captions.
8. BANK BORROWINGS
The Trust (excluding the money market funds), Wells Fargo Master Trust and Wells Fargo Variable Trust are parties to a $350,000,000 revolving credit agreement whereby the Fund is permitted to use bank borrowings for temporary or emergency purposes, such as to fund shareholder redemption requests. Interest under the credit agreement is charged to the Fund based on a borrowing rate equal to the higher of the Federal Funds rate in effect on that day plus 1.25% or the overnight LIBOR rate in effect on that day plus 1.25%. In addition, an annual commitment fee equal to 0.25% of the unused balance is allocated to each participating fund.
For the year ended September 30, 2020, there were no borrowings by the Fund under the agreement.
Wells Fargo Special Mid Cap Value Fund | 29
Table of Contents
Notes to financial statements
9. DISTRIBUTIONS TO SHAREHOLDERS
The tax character of distributions paid during the years ended September 30, 2020 and September 30, 2019 were as follows:
| Year ended September 30 | ||||||||
| 2020 | 2019 | |||||||
Ordinary income | $ | 161,129,912 | $ | 61,719,949 | ||||
Long-term capital gain | 256,170,175 | 130,458,127 | ||||||
As of September 30, 2020, the components of distributable earnings on a tax basis were as follows:
Undistributed income | Unrealized | Post-October capital losses deferred | ||
| $50,585,755 | $906,235,519 | $(208,527,063) | ||
10. INDEMNIFICATION
Under the Fund’s organizational documents, the officers and Trustees have been granted certain indemnification rights against certain liabilities that may arise out of performance of their duties to the Fund. The Fund has entered into a separate agreement with each Trustee that converts indemnification rights currently existing under the Fund’s organizational documents into contractual rights that cannot be changed in the future without the consent of the Trustee. Additionally, in the normal course of business, the Fund may enter into contracts with service providers that contain a variety of indemnification clauses. The Fund’s maximum exposure under these arrangements is dependent on future claims that may be made against the Fund and, therefore, cannot be estimated.
11. REDEMPTION IN-KIND
After the close of business on January 31, 2020, the Fund redeemed assets through an in-kind redemption. In the redemption transaction, the Fund distributed securities with a value of $11,005,873 and cash in the amount of $943,556. The Fund recognized gains in the amount of $59,791 which is reflected on the Statement of Operations. The redemption in-kind by a shareholder of the Class R6 represented 0.11% of the Fund and is reflected on the Statement of Changes in Net Assets.
12. NEW ACCOUNTING PRONOUNCEMENT
In August 2018, FASB issued Accounting Standards Update (“ASU”) No. 2018-13, Fair Value Measurement (Topic 820) Disclosure Framework—Changes to the Disclosure Requirements for Fair Value Measurement. ASU 2018-13 updates the disclosure requirements on fair value measurements in Topic 820, Fair Value Measurements. The amendments are effective for fiscal years, and interim periods within those fiscal years, beginning after December 15, 2019. Management has adopted this guidance which did not have a material impact on the financial statements.
13. CORONAVIRUS (COVID-19) PANDEMIC
On March 11, 2020, the World Health Organization announced that it had made the assessment that coronavirus disease 2019 (“COVID-19”) is a pandemic. The impacts of COVID-19 are adversely affecting the entire global economy, individual companies and investment products, and the market in general. There is significant uncertainty around the extent and duration of business disruptions related to COVID-19 and the impacts may be short term or may last for an extended period of time. The risk of further spreading of COVID-19 has led to significant uncertainty and volatility in the financial markets.
30 | Wells Fargo Special Mid Cap Value Fund
Table of Contents
Report of independent registered public accounting firm
To the Shareholders of the Fund and Board of Trustees
Wells Fargo Funds Trust:
Opinion on the Financial Statements
We have audited the accompanying statement of assets and liabilities of Wells Fargo Special Mid Cap Value Fund (the Fund), one of the funds constituting Wells Fargo Funds Trust, including the portfolio of investments, as of September 30, 2020, the related statement of operations for the year then ended, the statements of changes in net assets for each of the years in the two-year period then ended, and the related notes (collectively, the financial statements) and the financial highlights for each of the years in the five-year period then ended. In our opinion, the financial statements and financial highlights present fairly, in all material respects, the financial position of the Fund as of September 30, 2020, the results of its operations for the year then ended, the changes in its net assets for each of the years in the two-year period then ended, and the financial highlights for each of the years in the five-year period then ended, in conformity with U.S. generally accepted accounting principles.
Basis for Opinion
These financial statements and financial highlights are the responsibility of the Fund’s management. Our responsibility is to express an opinion on these financial statements and financial highlights based on our audits. We are a public accounting firm registered with the Public Company Accounting Oversight Board (United States) (PCAOB) and are required to be independent with respect to the Fund in accordance with the U.S. federal securities laws and the applicable rules and regulations of the Securities and Exchange Commission and the PCAOB.
We conducted our audits in accordance with the standards of the PCAOB. Those standards require that we plan and perform the audit to obtain reasonable assurance about whether the financial statements and financial highlights are free of material misstatement, whether due to error or fraud. Our audits included performing procedures to assess the risks of material misstatement of the financial statements and financial highlights, whether due to error or fraud, and performing procedures that respond to those risks. Such procedures included examining, on a test basis, evidence regarding the amounts and disclosures in the financial statements and financial highlights. Such procedures also included confirmation of securities owned as of September 30, 2020, by correspondence with the custodian, transfer agent and brokers, or by other appropriate auditing procedures. Our audits also included evaluating the accounting principles used and significant estimates made by management, as well as evaluating the overall presentation of the financial statements and financial highlights. We believe that our audits provide a reasonable basis for our opinion.

We have not been able to determine the specific year that we began serving as the auditor of one or more Wells Fargo Funds investment companies; however we are aware that we have served as the auditor of one or more Wells Fargo Funds investment companies since at least 1955.
Boston, Massachusetts
November 24, 2020
Wells Fargo Special Mid Cap Value Fund | 31
Table of Contents
TAX INFORMATION
For corporate shareholders, pursuant to Section 854 of the Internal Revenue Code, 85.29% of ordinary income dividends qualify for the corporate dividends-received deduction for the fiscal year ended September 30, 2020.
Pursuant to Section 852 of the Internal Revenue Code, $256,170,175 was designated as a 20% rate gain distribution for the fiscal year ended September 30, 2020.
Pursuant to Section 854 of the Internal Revenue Code, $142,830,983 of income dividends paid during the fiscal year ended September 30, 2020 has been designated as qualified dividend income (QDI).
For the fiscal year ended September 30, 2020, $3,174,756 has been designated as interest-related dividends for nonresident alien shareholders pursuant to Section 871 of the Internal Revenue Code.
For the fiscal year ended September 30, 2020, $68,765,061 has been designated as short-term capital gain dividends for nonresident alien shareholders pursuant to Section 871 of the Internal Revenue Code.
PROXY VOTING INFORMATION
A description of the policies and procedures used to determine how to vote proxies relating to portfolio securities is available, upon request, by calling 1-800-222-8222, visiting our website at wfam.com, or visiting the SEC website at sec.gov. Information regarding how the proxies related to portfolio securities were voted during the most recent 12-month period ended June 30 is available on the website at wfam.com or by visiting the SEC website at sec.gov.
QUARTERLY PORTFOLIO HOLDINGS INFORMATION
The Fund files its complete schedule of portfolio holdings with the SEC for the first and third quarters of each fiscal year as an exhibit to its reports on Form N-PORT. Shareholders may view the filed Form N-PORT by visiting the SEC website at sec.gov.
32 | Wells Fargo Special Mid Cap Value Fund
Table of Contents
Other information (unaudited)
BOARD OF TRUSTEES AND OFFICERS
Each of the Trustees and Officers1 listed in the table below acts in identical capacities for each fund in the Wells Fargo family of funds, which consists of 142 mutual funds comprising the Wells Fargo Funds Trust, Wells Fargo Variable Trust, Wells Fargo Master Trust and four closed-end funds (collectively the “Fund Complex”). This table should be read in conjunction with the Prospectus and the Statement of Additional Information2. The mailing address of each Trustee and Officer is 525 Market Street, 12th Floor, San Francisco, CA 94105. Each Trustee and Officer serves an indefinite term, however, each Trustee serves such term until reaching the mandatory retirement age established by the Trustees.
Independent Trustees
Name and year of birth | Position held and length of service* | Principal occupations during past five years or longer | Current other public company or investment company directorships | |||
William R. Ebsworth (Born 1957) | Trustee, since 2015 | Retired. From 1984 to 2013, equities analyst, portfolio manager, research director and chief investment officer at Fidelity Management and Research Company in Boston, Tokyo, and Hong Kong, and retired in 2013 as Chief Investment Officer of Fidelity Strategic Advisers, Inc. where he led a team of investment professionals managing client assets. Prior thereto, Board member of Hong Kong Securities Clearing Co., Hong Kong Options Clearing Corp., the Thailand International Fund, Ltd., Fidelity Investments Life Insurance Company, and Empire Fidelity Investments Life Insurance Company. Audit Committee Chair and Investment Committee Chair of the Vincent Memorial Hospital Endowment (non-profit organization). Mr. Ebsworth is a CFA® charterholder. | N/A | |||
Jane A. Freeman (Born 1953) | Trustee, since 2015; Chair Liaison, since 2018 | Retired. From 2012 to 2014 and 1999 to 2008, Chief Financial Officer of Scientific Learning Corporation. From 2008 to 2012, Ms. Freeman provided consulting services related to strategic business projects. Prior to 1999, Portfolio Manager at Rockefeller & Co. and Scudder, Stevens & Clark. Board member of the Harding Loevner Funds from 1996 to 2014, serving as both Lead Independent Director and chair of the Audit Committee. Board member of the Russell Exchange Traded Funds Trust from 2011 to 2012 and the chair of the Audit Committee. Ms. Freeman is also an inactive Chartered Financial Analyst. | N/A | |||
Isaiah Harris, Jr. (Born 1952) | Trustee, since 2009; Audit Committee Chairman, since 2019 | Retired. Chairman of the Board of CIGNA Corporation since 2009, and Director since 2005. From 2003 to 2011, Director of Deluxe Corporation. Prior thereto, President and CEO of BellSouth Advertising and Publishing Corp. from 2005 to 2007, President and CEO of BellSouth Enterprises from 2004 to 2005 and President of BellSouth Consumer Services from 2000 to 2003. Emeritus member of the Iowa State University Foundation Board of Governors. Emeritus Member of the Advisory Board of Iowa State University School of Business. Advisory Board Member, Palm Harbor Academy (private school). Mr. Harris is a certified public accountant (inactive status). | CIGNA Corporation | |||
Judith M. Johnson (Born 1949) | Trustee, since 2008 | Retired. Prior thereto, Chief Executive Officer and Chief Investment Officer of Minneapolis Employees Retirement Fund from 1996 to 2008. Ms. Johnson is an attorney, certified public accountant and a certified managerial accountant. | N/A | |||
David F. Larcker (Born 1950) | Trustee, since 2009 | James Irvin Miller Professor of Accounting at the Graduate School of Business (Emeritus), Stanford University, Director of the Corporate Governance Research Initiative and Senior Faculty of The Rock Center for Corporate Governance since 2006. From 2005 to 2008, Professor of Accounting at the Graduate School of Business, Stanford University. Prior thereto, Ernst & Young Professor of Accounting at The Wharton School, University of Pennsylvania from 1985 to 2005. | N/A | |||
Wells Fargo Special Mid Cap Value Fund | 33
Table of Contents
Other information (unaudited)
Name and year of birth | Position held and length of service* | Principal occupations during past five years or longer | Current other public company or investment company directorships | |||
Olivia S. Mitchell (Born 1953) | Trustee, since 2006; Nominating and Governance Committee Chair, since 2018 | International Foundation of Employee Benefit Plans Professor, Wharton School of the University of Pennsylvania since 1993. Director of Wharton’s Pension Research Council and Boettner Center on Pensions & Retirement Research, and Research Associate at the National Bureau of Economic Research. Previously, Cornell University Professor from 1978 to 1993. | N/A | |||
Timothy J. Penny (Born 1951) | Trustee, since 1996; Chairman, since 2018 | President and Chief Executive Officer of Southern Minnesota Initiative Foundation, a non-profit organization, since 2007. Member of the Board of Trustees of NorthStar Education Finance, Inc., a non-profit organization, since 2007. | N/A | |||
James G. Polisson (Born 1959) | Trustee, since 2018 | Retired. Chief Marketing Officer, Source (ETF) UK Services, Ltd, from 2015 to 2017. From 2012 to 2015, Principal of The Polisson Group, LLC, a management consulting, corporate advisory and principal investing company. Chief Executive Officer and Managing Director at Russell Investments, Global Exchange Traded Funds from 2010 to 2012. Managing Director of Barclays Global Investors from 1998 to 2010 and Global Chief Marketing Officer for iShares and Barclays Global Investors from 2000 to 2010. Trustee of the San Francisco Mechanics’ Institute, a non-profit organization, from 2013 to 2015. Board member of the Russell Exchange Traded Fund Trust from 2011 to 2012. Director of Barclays Global Investors Holdings Deutschland GmbH from 2006 to 2009. Mr. Polisson is an attorney and has a retired status with the Massachusetts and District of Columbia Bar Associations. | N/A | |||
Pamela Wheelock (Born 1959) | Trustee, since January 2020; previously Trustee from January 2018 to July 2019 | Board member of the Destination Medical Center Economic Development Agency, Rochester, Minnesota since 2019. Interim President of the McKnight Foundation from January to September 2020. Acting Commissioner, Minnesota Department of Human Services, July 2019 through September 2019. Human Services Manager (part-time), Minnesota Department of Human Services, October 2019 through December 2019. Chief Operating Officer, Twin Cities Habitat for Humanity from 2017 to 2019. Vice President of University Services, University of Minnesota from 2012 to 2016. Prior thereto, on the Board of Directors, Governance Committee and Finance Committee for the Minnesota Philanthropy Partners (Saint Paul Foundation) from 2012 to 2018, Interim Chief Executive Officer of Blue Cross Blue Shield of Minnesota from 2011 to 2012, Chairman of the Board from 2009 to 2012 and Board Director from 2003 to 2015. Vice President, Leadership and Community Engagement, Bush Foundation, Saint Paul, Minnesota (a private foundation) from 2009 to 2011. Executive Vice President and Chief Financial Officer, Minnesota Sports and Entertainment from 2004 to 2009 and Senior Vice President from 2002 to 2004. Executive Vice President of the Minnesota Wild Foundation from 2004 to 2008. Commissioner of Finance, State of Minnesota, from 1999 to 2002. Currently Board Chair of the Minnesota Wild Foundation since 2010. | N/A | |||
| * | Length of service dates reflect the Trustee’s commencement of service with the Trust’s predecessor entities, where applicable. |
34 | Wells Fargo Special Mid Cap Value Fund
Table of Contents
Other information (unaudited)
Officers
Name and year of birth | Position held and length of service | Principal occupations during past five years or longer | ||
Andrew Owen (Born 1960) | President, since 2017 | Executive Vice President of Wells Fargo & Company and Head of Affiliated Managers, Wells Fargo Asset Management, since 2014. In addition, Mr. Owen is currently President, Chief Executive Officer and Director of Wells Fargo Funds Management, LLC since 2017. Prior thereto, Executive Vice President responsible for marketing, investments and product development for Wells Fargo Funds Management, LLC, from 2009 to 2014. | ||
Nancy Wiser1 (Born 1967) | Treasurer, since 2012 | Executive Vice President of Wells Fargo Funds Management, LLC since 2011. Chief Operating Officer and Chief Compliance Officer at LightBox Capital Management LLC, from 2008 to 2011. | ||
Michelle Rhee (Born 1966) | Chief Legal Officer, since 2019 | Secretary of Wells Fargo Funds Management, LLC, Chief Legal Counsel of Wells Fargo Asset Management and Assistant General Counsel of Wells Fargo Bank, N.A. since 2018. Associate General Counsel and Managing Director of Bank of America Corporation from 2004 to 2018. | ||
Catherine Kennedy (Born 1969) | Secretary, since 2019 | Vice President of Wells Fargo Funds Management, LLC and Senior Counsel of the Wells Fargo Legal Department since 2010. Vice President and Senior Counsel of Evergreen Investment Management Company, LLC from 1998 to 2010. | ||
Michael H. Whitaker (Born 1967) | Chief Compliance Officer, since 2016 | Chief Compliance Officer of Wells Fargo Asset Management since 2016. Senior Vice President and Chief Compliance Officer for Fidelity Investments from 2007 to 2016. | ||
Jeremy DePalma1 (Born 1974) | Assistant Treasurer, since 2009 | Senior Vice President of Wells Fargo Funds Management, LLC since 2009. Senior Vice President of Evergreen Investment Management Company, LLC from 2008 to 2010 and head of the Fund Reporting and Control Team within Fund Administration from 2005 to 2010. | ||
| 1 | Nancy Wiser acts as Treasurer of 65 funds in the Fund Complex. Jeremy DePalma acts as the Treasurer of 77 funds and Assistant Treasurer of 65 funds in the Fund Complex. |
| 2 | The Statement of Additional Information includes additional information about the Trustees and is available, without charge, upon request, by calling 1-800-222-8222 or by visiting the website at wfam.com. |
Wells Fargo Special Mid Cap Value Fund | 35
Table of Contents
Other information (unaudited)
BOARD CONSIDERATION OF INVESTMENT MANAGEMENT AND SUB-ADVISORY AGREEMENTS:
Wells Fargo Special Mid Cap Value Fund
Under the Investment Company Act of 1940 (the “1940 Act”), the Board of Trustees (the “Board”) of Wells Fargo Funds Trust (the “Trust”) must determine annually whether to approve the continuation of the Trust’s investment management and sub-advisory agreements. In this regard, at a Board meeting held on May 26, 2020 and May 28, 2020 (together, the “Meeting”), the Board, all the members of which have no direct or indirect interest in the investment management and sub-advisory agreements and are not “interested persons” of the Trust, as defined in the 1940 Act (the “Independent Trustees”), reviewed and approved for Wells Fargo Special Mid Cap Value Fund (the “Fund”): (i) an investment management agreement (the “Management Agreement”) with Wells Fargo Funds Management, LLC (“Funds Management”); and (ii) an investment sub-advisory agreement (the “Sub-Advisory Agreement”) with Wells Capital Management Incorporated (the “Sub-Adviser”), an affiliate of Funds Management. The Management Agreement and the Sub-Advisory Agreement are collectively referred to as the “Advisory Agreements.”
At the Meeting, the Board considered the factors and reached the conclusions described below relating to the selection of Funds Management and the Sub-Adviser and the approval of the Advisory Agreements. Prior to the Meeting, including at a Board meeting held in April 2020, the Trustees conferred extensively among themselves and with representatives of Funds Management about these matters. Also, the Board has adopted a team-based approach, with each team consisting of a sub-set of Trustees, to assist the full Board in the discharge of its duties in reviewing investment performance and other matters throughout the year. The Independent Trustees were assisted in their evaluation of the Advisory Agreements by independent legal counsel, from whom they received separate legal advice and with whom they met separately.
In providing information to the Board, Funds Management and the Sub-Adviser were guided by a detailed set of requests for information submitted to them by independent legal counsel on behalf of the Independent Trustees at the start of the Board’s annual contract renewal process earlier in 2020. In considering and approving the Advisory Agreements, the Trustees considered the information they believed relevant, including but not limited to the information discussed below. The Board considered not only the specific information presented in connection with the Meeting, but also the knowledge gained over time through interaction with Funds Management and the Sub-Adviser about various topics. In this regard, the Board reviewed reports of Funds Management at each of its quarterly meetings, which included, among other things, portfolio reviews and investment performance reports. In addition, the Board and the teams mentioned above confer with portfolio managers at various times throughout the year. The Board did not identify any particular information or consideration that was all-important or controlling, and each individual Trustee may have attributed different weights to various factors.
After its deliberations, the Board unanimously approved the continuation of the Advisory Agreements for a one-year term and determined that the compensation payable to Funds Management and the Sub-Adviser under each of the Advisory Agreements was reasonable. The Board considered the approval of the Advisory Agreements for the Fund as part of its consideration of agreements for funds across the complex, but its approvals were made on a fund-by-fund basis. The following summarizes a number of important, but not necessarily all, factors considered by the Board in support of its approvals.
Nature, extent and quality of services
The Board received and considered various information regarding the nature, extent and quality of services provided to the Fund by Funds Management and the Sub-Adviser under the Advisory Agreements. This information included a description of the investment advisory services and Fund-level administrative services covered by the Management Agreement, as well as, among other things, a summary of the background and experience of senior management of Wells Fargo Asset Management (“WFAM”), of which Funds Management and the Sub-Adviser are a part, and a summary of investments made in the business of WFAM. The Board also received a description of Funds Management’s and the Sub-Adviser’s business continuity plans and of their approaches to data privacy and cybersecurity, and related testing. The Board also received and reviewed information about Funds Management’s role as administrator of the Fund’s liquidity risk management program, Funds Management’s approach to risk management, and Funds Management’s intermediary and vendor oversight program.
The Board also considered the qualifications, background, tenure and responsibilities of each of the portfolio managers primarily responsible for the day-to-day portfolio management of the Fund. The Board evaluated the ability of Funds Management and the Sub-Adviser to attract and retain qualified investment professionals, including research, advisory and supervisory personnel. The Board further considered the compliance programs and compliance records of Funds Management and the Sub-Adviser. In addition, the Board took into account the full range of services provided to the Fund by Funds Management and its affiliates.
36 | Wells Fargo Special Mid Cap Value Fund
Table of Contents
Other information (unaudited)
Fund investment performance and expenses
The Board considered the investment performance results for the Fund over various time periods ended December 31, 2019. The Board also considered more current results for various time periods ended March 31, 2020. The Board considered these results in comparison to the investment performance of funds in a universe that was determined by Broadridge Inc. (“Broadridge”) to be similar to the Fund (the “Universe”), and in comparison to the Fund’s benchmark index and to other comparative data. Broadridge is an independent provider of investment company data. The Board received a description of the methodology used by Broadridge to select the mutual funds in the performance Universe. The Board noted that the investment performance of the Fund (Administrator Class) was higher than the average investment performance of the Universe for the one-, three-, five- and ten-year periods ended December 31, 2019. The Board also noted that the investment performance of the Fund (Administrator Class) was higher than the average investment performance of the Universe for all periods ended March 31, 2020. The Board also noted that the investment performance of the Fund was higher than its benchmark index, the Russell Midcap® Value Index, for all periods ended December 31, 2019. The Board also noted that the investment performance of the Fund was higher than its benchmark index, the Russell Midcap® Value Index, for all periods ended March 31, 2020.
The Board also received and considered information regarding the Fund’s net operating expense ratios and their various components, including actual management fees, custodian and other non-management fees, and Rule 12b-1 and non-Rule 12b-1 shareholder service fees. The Board considered these ratios in comparison to the median ratios of funds in class-specific expense groups that were determined by Broadridge to be similar to the Fund (the “Groups”). The Board received a description of the methodology used by Broadridge to select the mutual funds in the expense Groups and an explanation of how funds comprising expense groups and their expense ratios may vary from year-to-year. Based on the Broadridge reports, the Board noted that the net operating expense ratios of the Fund were lower than, equal to or in range of the median net operating expense ratios of the expense Groups for each share class.
The Board took into account the Fund’s investment performance and expense information provided to it among the factors considered in deciding to re-approve the Advisory Agreements.
Investment management and sub-advisory fee rates
The Board reviewed and considered the contractual fee rates payable by the Fund to Funds Management under the Management Agreement, as well as the contractual fee rates payable by the Fund to Funds Management for class-level administrative services under a Class-Level Administration Agreement, which include, among other things, class-level transfer agency and sub-transfer agency costs (collectively, the “Management Rates”). The Board also reviewed and considered the contractual investment sub-advisory fee rates that are payable by Funds Management to the Sub-Adviser for investment sub-advisory services.
Among other information reviewed by the Board was a comparison of the Fund’s Management Rates with the average contractual investment management fee rates of funds in the expense Groups at a common asset level as well as transfer agency costs of the funds in the expense Groups. The Board noted that the Management Rates of the Fund were in range of the sum of these average rates for the Fund’s expense Groups for all share classes.
The Board also received and considered information about the portion of the total management fee that was retained by Funds Management after payment of the fee to the Sub-Adviser for sub-advisory services. In assessing the reasonableness of this amount, the Board received and evaluated information about the nature and extent of responsibilities retained and risks assumed by Funds Management and not delegated to or assumed by the Sub-Adviser, and about Funds Management’s on-going oversight services. Given the affiliation between Funds Management and the Sub-Adviser, the Board ascribed limited relevance to the allocation of fees between them.
The Board also received and considered information about the nature and extent of services offered and fee rates charged by Funds Management and the Sub-Adviser to other types of clients with investment strategies similar to those of the Fund. In this regard, the Board received information about the significantly greater scope of services, and compliance, reporting and other legal burdens and risks of managing proprietary mutual funds compared with those associated with managing assets of other types of clients, including third-party sub-advised fund clients and non-mutual fund clients such as institutional separate accounts.
Based on its consideration of the factors and information it deemed relevant, including those described here, the Board determined that the compensation payable to Funds Management under the Management Agreement and to the Sub-Adviser under the Sub-Advisory Agreement was reasonable.
Wells Fargo Special Mid Cap Value Fund | 37
Table of Contents
Other information (unaudited)
Profitability
The Board received and considered information concerning the profitability of Funds Management, as well as the profitability of both WFAM and Wells Fargo & Co. (“Wells Fargo”) from providing services to the fund family as a whole. The Board noted that the Sub-Adviser’s profitability information with respect to providing services to the Fund and other funds in the family was subsumed in the WFAM and Wells Fargo profitability analysis.
Funds Management reported on the methodologies and estimates used in calculating profitability, including a description of the methodology used to allocate certain expenses. Among other things, the Board noted that the levels of profitability reported on a fund-by-fund basis varied widely, depending on factors such as the size, type and age of fund.
Based on its review, the Board did not deem the profits reported by Funds Management, WFAM or Wells Fargo from services provided to the Fund to be at a level that would prevent it from approving the continuation of the Advisory Agreements.
Economies of scale
The Board received and considered information about the potential for Funds Management to experience economies of scale in the provision of management services to the Fund, the difficulties of calculating economies of scale at an individual fund level, and the extent to which potential scale benefits are shared with shareholders. The Board noted the existence of breakpoints in the Fund’s management fee structure, which operate generally to reduce the Fund’s expense ratios as the Fund grows in size, and the size of the Fund in relation to such breakpoints. The Board considered that in addition to management fee breakpoints, Funds Management shares potential economies of scale from its management business in a variety of ways, including through fee waiver and expense reimbursement arrangements, services that benefit shareholders, competitive management fee rates set at the outset without regard to breakpoints, and investments in the business intended to enhance services available to shareholders.
The Board concluded that Funds Management’s arrangements with respect to the Fund, including contractual breakpoints, constituted a reasonable approach to sharing potential economies of scale with the Fund and its shareholders.
Other benefits to Funds Management and the Sub-Adviser
The Board received and considered information regarding potential “fall-out” or ancillary benefits received by Funds Management and its affiliates, including the Sub-Adviser, as a result of their relationships with the Fund. Ancillary benefits could include, among others, benefits directly attributable to other relationships with the Fund and benefits potentially derived from an increase in Funds Management’s and the Sub-Adviser’s business as a result of their relationships with the Fund. The Board noted that various affiliates of Funds Management may receive distribution-related fees, shareholder servicing payments and sub-transfer agency fees in respect of shares sold or held through them and services provided.
The Board also reviewed information about soft dollar credits earned and utilized by the Sub-Adviser, fees earned by Funds Management and the Sub-Adviser from managing a private investment vehicle for the fund family’s securities lending collateral, and commissions earned by an affiliated broker from portfolio transactions.
Based on its consideration of the factors and information it deemed relevant, including those described here, the Board did not find that any ancillary benefits received by Funds Management and its affiliates, including the Sub-Adviser, were unreasonable.
Conclusion
At the Meeting, after considering the above-described factors and based on its deliberations and its evaluation of the information described above, the Board unanimously approved the continuation of the Advisory Agreements for a one-year term and determined that the compensation payable to Funds Management and the Sub-Adviser under each of the Advisory Agreements was reasonable.
38 | Wells Fargo Special Mid Cap Value Fund
Table of Contents
Other information (unaudited)
LIQUIDITY RISK MANAGEMENT PROGRAM
In accordance with Rule 22e-4 under the Investment Company Act of 1940, as amended (the “Liquidity Rule”), Wells Fargo Funds Trust (the “Trust”) has adopted and implemented a liquidity risk management program (the “Program”) on behalf of each of its series, including the Fund, which is reasonably designed to assess and manage the Fund’s liquidity risk. “Liquidity risk” is defined as the risk that the Fund is unable to meet redemption requests without significantly diluting remaining investors’ interests in the Fund. The Trust’s Board of Trustees (the “Board”) previously approved the designation of Wells Fargo Funds Management, LLC (“Funds Management”), the Fund’s investment manager, as the administrator of the Program, and Funds Management has established a Liquidity Risk Management Council composed of personnel from multiple departments within Funds Management and its affiliates to assist Funds Management in the implementation and on-going administration of the Program.
The Program is comprised of various components designed to support the assessment and/or management of liquidity risk, including: (1) the periodic assessment (no less frequently than annually) of certain factors that influence the Fund’s liquidity risk; (2) the periodic classification (no less frequently than monthly) of the Fund’s investments into one of four liquidity categories that reflect an estimate of their liquidity under current market conditions; (3) a 15% limit on the acquisition of “illiquid investments” (as defined under the Liquidity Rule); (4) to the extent the Fund does not invest primarily in “highly liquid investments” (as defined under the Liquidity Rule), the determination of a minimum percentage of the Fund’s assets that generally will be invested in highly liquid investments (an “HLIM”); (5) if the Fund has established an HLIM, the periodic review (no less frequently than annually) of the HLIM and the adoption of policies and procedures for responding to a shortfall of the Fund’s “highly liquid investments” below its HLIM; and (6) periodic reporting to the Board.
At a meeting of the Board held on May 26 and 28, 2020, the Board received a written report (the “Report”) from Funds Management that addressed the operation of the Program and assessed its adequacy and effectiveness of implementation. The Report covered the initial period from December 1, 2018 through December 31, 2019 (the “Reporting Period”). No significant liquidity events impacting the Fund were noted in the Report. There were no material changes to the Program during the Reporting Period. The Report concluded that the Program is operating effectively to assess and manage the Fund’s liquidity risk, and that the Program has been and continues to be adequately and effectively implemented to monitor and, as applicable, respond to the Fund’s liquidity developments.
There can be no assurance that the Program will achieve its objectives under all circumstances in the future. Please refer to the Fund’s prospectus for more information regarding the Fund’s exposure to liquidity risk and other risks to which an investment in the Fund may be subject.
Wells Fargo Special Mid Cap Value Fund | 39
Table of Contents
Effective June 1, 2020, shareholders purchasing Fund shares through an Oppenheimer & Co. Inc. (“Oppenheimer”) platform or account are eligible only for the following load waivers (front-end sales charge waivers and contingent deferred or back-end, sales charge waivers) and discounts, which may differ from those disclosed in the Fund’s Prospectus or SAI.
| Front-end Sales Load Waivers on Class A Shares available at Oppenheimer |
| Employer-sponsored retirement, deferred compensation and employee benefit plans (including health savings accounts) and trusts used to fund those plans, provided that the shares are not held in a commission-based brokerage account and shares are held for the benefit of the plan. |
| Shares purchased by or through a 529 Plan. |
| Shares purchased through an Oppenheimer affiliated investment advisory program. |
| Shares purchased through reinvestment of capital gains distributions and dividend reinvestment when purchasing shares of the same fund (but not any other fund within the fund family). |
| Shares purchased from the proceeds of redemptions within the same fund family, provided (1) the repurchase occurs within 90 days following the redemption, (2) the redemption and purchase occur in the same account, and (3) redeemed shares were subject to a front-end or deferred sales load (known as Rights of Restatement). |
| A shareholder in the Fund’s Class C shares will have their shares exchanged at net asset value to Class A shares (or the appropriate share class) of the Fund if the shares are no longer subject to a CDSC and the exchange is in line with the policies and procedures of Oppenheimer. |
| Employees and registered representatives of Oppenheimer or its affiliates and their family members. |
| Directors or Trustees of the Fund, and employees of the Fund’s investment adviser or any of its affiliates, as described in the Prospectus. |
| CDSC Waivers on A and C Shares available at Oppenheimer |
| Death or disability of the shareholder. |
| Shares sold as part of a systematic withdrawal plan as described in the Prospectus. |
| Return of excess contributions from an IRA Account. |
| Shares sold as part of a required minimum distribution for IRA and retirement accounts due to the shareholder reaching the qualified age based on applicable IRS regulations as described in the Prospectus. |
| Shares sold to pay Oppenheimer fees but only if the transaction is initiated by Oppenheimer. |
| Shares acquired through a right of reinstatement. |
| Front-end load Discounts Available at Oppenheimer: Breakpoints, Rights of Accumulation & Letters of Intent |
| Breakpoints as described in the Prospectus. |
| Rights of Accumulation (ROA), which entitle shareholders to breakpoint discounts, will be automatically calculated based on the aggregated holding of fund family assets held by accounts within the purchaser’s household at Oppenheimer. Eligible fund family assets not held at Oppenheimer may be included in the ROA calculation only if the shareholder notifies his or her financial advisor about such assets. |
40 | Wells Fargo Special Mid Cap Value Fund
Table of Contents
Effective June 15, 2020, shareholders purchasing fund shares through a Robert W. Baird & Co. (“Baird”) platform or account will only be eligible for the following sales charge waivers (front-end sales charge waivers and CDSC waivers) and discounts, which may differ from those disclosed elsewhere in the Fund’s Prospectus or the SAI.
| Front-end Sales Load Waivers on Class A Shares available at Baird |
| Shares purchased through reinvestment of capital gains distributions and dividend reinvestment when purchasing share of the same fund. |
| Share purchase by employees and registers representatives of Baird or its affiliate and their family members as designated by Baird. |
| Shares purchase from the proceeds of redemptions within the same fund family, provided (1) the repurchase occurs within 90 days following the redemption, (2) the redemption and purchase occur in the same accounts, and (3) redeemed shares were subject to a front-end or deferred sales charge (known as rights of reinstatement). |
| A shareholder in the Funds Investor C Shares will have their share exchanged at net asset value to Investor A shares of the fund if the shares are no longer subject to CDSC and the exchange is in line with the policies and procedures of Baird. |
| Employer-sponsored retirement plans or charitable accounts in a transactional brokerage account at Baird, including 401(k) plans, 457 plans, employer-sponsored 403(b) plans, profit sharing and money purchase pension plans and defined benefit plans. For purposes of this provision, employer-sponsored retirement plans do not include SEP IRAs, Simple IRAs or SAR-SEPs. |
| CDSC Waivers on A and C Shares available at Baird |
| Shares sold due to death or disability of the shareholder. |
| Shares sold as part of a systematic withdrawal plan as described in the Fund’s Prospectus. |
| Shares bought due to returns of excess contributions from an IRA Account. |
| Shares sold as part of a required minimum distribution for IRA and retirement accounts due to the shareholder reaching age 72 as described in the Fund’s Prospectus. |
| Shares sold to pay Baird fees but only if the transaction is initiated by Baird. |
| Shares acquired through a right of reinstatement. |
| Front-end load Discounts Available at Baird: Breakpoint and/or Rights of Accumulation |
| Breakpoints as described in the Prospectus. |
| Rights of accumulations which entitles shareholders to breakpoint discounts will be automatically calculated based on the aggregated holding of fund family assets held by accounts within the purchaser’s household at Baird. Eligible fund family assets not held at Baird may be included in the rights of accumulations calculation only if the shareholder notifies his or her financial advisor about such assets. |
| Letters of Intent (LOI) allow for breakpoint discounts based on anticipated purchases within a fund family through Baird, over a 13-month period of time. |
Wells Fargo Special Mid Cap Value Fund | 41
Table of Contents
This page is intentionally left blank.
Table of Contents
This page is intentionally left blank.
Table of Contents
This page is intentionally left blank.
Table of Contents
For more information
More information about Wells Fargo Funds is available free upon request. To obtain literature, please write, visit the Fund’s website, or call:
Wells Fargo Funds
P.O. Box 219967
Kansas City, MO 64121-9967
Website: wfam.com
Individual investors: 1-800-222-8222
Retail investment professionals: 1-888-877-9275
Institutional investment professionals: 1-866-765-0778

This report and the financial statements contained herein are submitted for the general information of the shareholders of the Fund. If this report is used for promotional purposes, distribution of the report must be accompanied or preceded by a current prospectus. Before investing, please consider the investment objectives, risks, charges, and expenses of the investment. For a current prospectus and, if available, a summary prospectus, containing this information, call 1-800-222-8222 or visit the Fund’s website at wfam.com. Read the prospectus carefully before you invest or send money.
Wells Fargo Asset Management (WFAM) is the trade name for certain investment advisory/management firms owned by Wells Fargo & Company. These firms include but are not limited to Wells Capital Management Incorporated and Wells Fargo Funds Management, LLC. Certain products managed by WFAM entities are distributed by Wells Fargo Funds Distributor, LLC (a broker-dealer and Member FINRA).
This material is for general informational and educational purposes only and is NOT intended to provide investment advice or a recommendation of any kind—including a recommendation for any specific investment, strategy, or plan.
INVESTMENT PRODUCTS: NOT FDIC INSURED ◾ NO BANK GUARANTEE ◾ MAY LOSE VALUE
© 2020 Wells Fargo & Company. All rights reserved.
PAR-1120-01039 11-20
A234/AR234 09-20
Table of Contents

Annual Report
September 30, 2020
Wells Fargo Opportunity Fund
Beginning on January 1, 2021, as permitted by new regulations adopted by the Securities and Exchange Commission, paper copies of the Wells Fargo Funds’ annual and semi-annual shareholder reports issued after this date will no longer be sent by mail, unless you specifically request paper copies of the reports. Instead, the reports will be made available on the Funds’ website, and you will be notified by mail each time a report is posted and provided with a website address to access the report.
If you already elected to receive shareholder reports electronically, you will not be affected by this change and you need not take any action. You may elect to receive shareholder reports and other communications from the Fund electronically at any time by contacting your financial intermediary (such as a broker-dealer or bank) or, if you are a direct investor, by calling 1-800-222-8222 or by enrolling at wellsfargo.com/advantagedelivery.
You may elect to receive all future reports in paper free of charge. If you invest through a financial intermediary, you can contact your financial intermediary to request that you continue to receive paper copies of your shareholder reports; if you invest directly with the Fund, you can call 1-800-222-8222. Your election to receive reports in paper will apply to all Wells Fargo Funds held in your account with your financial intermediary or, if you are a direct investor, to all Wells Fargo Funds that you hold.
Table of Contents
|
Reduce clutter. Save trees. |
Sign up for electronic delivery of prospectuses and |
The views expressed and any forward-looking statements are as of September 30, 2020, unless otherwise noted, and are those of the Fund’s portfolio managers and/or Wells Fargo Asset Management. Discussions of individual securities, or the markets generally, or any Wells Fargo Fund are not intended as individual recommendations. Future events or results may vary significantly from those expressed in any forward-looking statements. The views expressed are subject to change at any time in response to changing circumstances in the market. Wells Fargo Asset Management and the Fund disclaim any obligation to publicly update or revise any views expressed or forward-looking statements.
INVESTMENT PRODUCTS: NOT FDIC INSURED ◾ NO BANK GUARANTEE ◾ MAY LOSE VALUE
Wells Fargo Opportunity Fund | 1
Table of Contents
Letter to shareholders (unaudited)

Andrew Owen
President
Wells Fargo Funds
Dear Shareholder:
We are pleased to offer you this annual report for the Wells Fargo Opportunity Fund for the 12-month period that ended September 30, 2020. Global stock markets saw earlier gains erased in March as governments around the world took unprecedented measures, attempting to stop the spread of COVID-19 at the expense of short-term economic output. However, markets rallied strongly from April on to more than offset those short-term losses as central banks bolstered capital markets and confidence.
For the 12-month period, equities had broadly positive total returns despite intense volatility in March. Non-U.S. developed market equities had weaker performance than emerging market and U.S. stocks. While gains from fixed-income securities were positive, they were more modest than equities. For the period, U.S. stocks, based on the S&P 500 Index,1 gained 15.15%. International stocks, as measured by the MSCI ACWI ex USA Index (Net),2 returned 3.00%, while the MSCI EM Index (Net)3 had stronger performance, with a 10.54% gain. For bond investors, the Bloomberg Barclays U.S. Aggregate Bond Index4 returned 6.98%, the Bloomberg Barclays Global Aggregate ex-USD Index5 gained 5.48%, and the Bloomberg Barclays Municipal Bond Index6 returned 4.09% while the ICE BofA U.S. High Yield Index7 returned 2.30%.
The period began with mixed economic readings.
The fourth quarter of 2019 started on a strong note. U.S.-China trade tensions, which had been building for months, relaxed in October; optimism rose for a U.K. Brexit deal; and macroeconomic data turned positive. The initial estimate of U.S. third-quarter gross domestic product (GDP) growth was a resilient 1.9% annualized rate, while the U.S. unemployment rate fell to a 50-year low of 3.5% in September. However, despite strength among U.S. consumers, business confidence declined while manufacturing activity contracted. Concerned with a potential economic slowdown, the U.S. Federal Reserve (Fed) lowered interest rates a quarter point in late October—its third rate cut in four months. This helped push the S&P 500 Index to an all-time high while emerging market equities rallied and global bonds declined overall, reflecting a broad pickup in risk appetite.
Equity markets continued to rally in November despite ongoing geopolitical risks. Hopes for a U.S.-China trade deal buoyed investor confidence. U.S. business sentiment improved slightly and manufacturing and services activity picked up. While consumer confidence and purchasing managers’ activity rose in the eurozone, China reported weakening manufacturing and consumer data. Bond yields rose marginally, leading to slightly negative returns for global government and investment-grade corporate bonds.
| 1 | The S&P 500 Index consists of 500 stocks chosen for market size, liquidity, and industry group representation. It is a market-value-weighted index with each stock’s weight in the index proportionate to its market value. You cannot invest directly in an index. |
| 2 | The Morgan Stanley Capital International (MSCI) All Country World Index (ACWI) ex USA Index (Net) is a free-float-adjusted market-capitalization-weighted index that is designed to measure the equity market performance of developed and emerging markets, excluding the United States. Source: MSCI. MSCI makes no express or implied warranties or representations and shall have no liability whatsoever with respect to any MSCI data contained herein. The MSCI data may not be further redistributed or used as a basis for other indices or any securities or financial products. This report is not approved, reviewed, or produced by MSCI. You cannot invest directly in an index. |
| 3 | The MSCI Emerging Markets (EM) Index (Net) is a free-float-adjusted market-capitalization-weighted index that is designed to measure equity market performance of emerging markets. You cannot invest directly in an index. |
| 4 | The Bloomberg Barclays U.S. Aggregate Bond Index is a broad-based benchmark that measures the investment-grade, U.S. dollar-denominated, fixed-rate taxable bond market, including Treasuries, government-related and corporate securities, mortgage-backed securities (agency fixed-rate and hybrid adjustable-rate mortgage pass-throughs), asset-backed securities, and commercial mortgage-backed securities. You cannot invest directly in an index. |
| 5 | The Bloomberg Barclays Global Aggregate ex-USD Index is an unmanaged index that provides a broad-based measure of the global investment-grade fixed-income markets excluding the U.S. dollar-denominated debt market. You cannot invest directly in an index. |
| 6 | The Bloomberg Barclays Municipal Bond Index is an unmanaged index composed of long-term tax-exempt bonds with a minimum credit rating of Baa. You cannot invest directly in an index. |
| 7 | The ICE BofA U.S. High Yield Index is a market-capitalization-weighted index of domestic and Yankee high-yield bonds. The index tracks the performance of high-yield securities traded in the U.S. bond market. You cannot invest directly in an index. Copyright 2020. ICE Data Indices, LLC. All rights reserved. |
2 | Wells Fargo Opportunity Fund
Table of Contents
Letter to shareholders (unaudited)
Financial markets ended 2019 with a boost from the U.S. and China accord on a Phase One trade deal. That, along with the landslide win by the pro-Brexit U.K. Conservative Party in a national election and ongoing central bank support, gave investors greater confidence. U.S. economic indicators were generally positive, with the exception of manufacturing activity and business confidence. Consumer confidence was resilient, fed by a robust labor market, tame inflation, and lower interest rates, which boosted housing affordability and stimulated homebuyer activity. The impeachment of President Trump had little impact on the markets. Meanwhile, slowing Chinese economic activity, partly attributable to the trade war, led to further government stimulus at year-end through lower reserve ratios, allowing banks to lend more money.
The year-end rally continued in early January 2020. However, capital market volatility spiked in late January on concerns over the potential impact of COVID-19 on the global economy and stock markets. With sentiment somewhat souring, perceived safe havens did well in January. The U.S. dollar and Japanese yen both rose and government bonds outperformed equities. While the S&P 500 Index held its ground, emerging market equities tumbled, including those in Asia.
In February, COVID-19 became the major market focus. Fears of the virus’s impact on Chinese and global growth led to expectations of increased global central bank monetary policy support. That led the 10-year U.S. Treasury yield to fall to an all-time low of 1.1%. Although equity markets initially shrugged off concerns about the outbreak, focusing instead on strong fourth-quarter earnings and improving business confidence in January, market sentiment turned sharply lower and the S&P 500 Index lost 8.2% for the month. Oil prices tumbled as Russia and the Organization of the Petroleum Exporting Countries compounded a major decline in oil demand with a brutal price war, partly aimed at dissuading further U.S. shale production, causing the price of West Texas Intermediate crude oil to plummet.
The global spread of COVID-19 led country after country to clamp down on social and business-related activity in order to contain the virus from causing even greater devastation and overwhelming health care systems. This abrupt stoppage of economic activity led to the sharp deceleration of global output, sending economies into a deep contraction. Central banks responded swiftly, slashing interest rates and expanding quantitative easing programs to restore liquidity and confidence to the markets. In the U.S., the Fed introduced several new lending programs, funding investment-grade bonds, money market mutual funds, and commercial paper while purchasing Treasuries, mortgage-backed securities, and overnight repurchase agreements. Meanwhile, stock markets tumbled quickly into a bear market, ending the longest bull stock market in U.S. history.
Markets rebounded strongly in April, fueled by unprecedented government and central bank stimulus measures. The U.S. economy contracted by an annualized 5.0% pace in the first quarter, with 30 million new unemployment insurance claims in six weeks. In the eurozone, first-quarter real GDP shrank 3.8%, with the composite April Flash Purchasing Managers’ Index (PMI), a monthly survey of purchasing managers, falling to an all-time low of 13.5. The European Central Bank expanded its quantitative easing to include the purchase of additional government bonds of countries with the greatest virus-related need, including Italy and Spain. China’s first-quarter GDP fell by 6.8% year over year. However, retail sales, production, and investment showed signs of recovery. Extreme oil-price volatility continued as global supply far exceeded demand.
The global equity market rebound continued in May, with widespread strong monthly gains. Investors regained confidence on reports of early signs of success in human trials of a COVID-19 vaccine. Growth stocks continued to outperform value stocks while returns on global government bonds were generally flat. In the U.S., a gap grew between the stock market rebound and devastating economic data points, including an April unemployment rate of 14.7%, the highest level since World War II. PMIs reflected
“The global spread of COVID-19 led country after country to clamp down on social and business-related activity in order to contain the virus from causing even greater devastation and overwhelming health care systems.”
Wells Fargo Opportunity Fund | 3
Table of Contents
Letter to shareholders (unaudited)
“The stock market continued to rally in August despite concerns over rising numbers of COVID-19 cases in the United States and several European countries, including France and Spain, as well as the expiration of the $600 weekly bonus unemployment benefit at the end of July.”
weakening activity in May in both the manufacturing and services sectors. U.S. corporate earnings reports indicated a 14% year-over-year contraction in earnings from the first quarter of 2019. However, high demand for technology, driven by remote activity, supported robust information technology sector earnings, which helped drive major technology stocks higher.
Financial markets posted widely positive returns in June despite ongoing economic weakness and high levels of uncertainty on the containment of COVID-19 and the timing of an effective vaccine. There were hopeful signs as economies reopened, with both U.S. and U.K. retail sales rebounding sharply in May. However, year over year, sales remained depressed. Vitally important to market sentiment was the ongoing commitment by central banks globally to do all they could to provide economic support through liquidity and low borrowing costs. U.S. economic activity was aided by one-time $1,200 stimulus checks and $600 bonus weekly unemployment benefits that expired at the end of July. However, unemployment remained historically high, easing somewhat from 14.7% in April to 11.1% in June. By month-end, numerous states reported increases of COVID-19 cases. China’s economic recovery picked up momentum in June, though it remained far from a full recovery.
July was a broadly positive month for both global equities and fixed income. However, economic data and a resurgence of COVID-19 cases pointed to the vulnerability of the global economy and the ongoing imperative to regain control of the pandemic. Second-quarter GDP shrank from the previous quarter by 9.5% and 12.1% in the U.S. and the eurozone, respectively. In contrast, China reported a 3.2% year-over-year expansion in its second-quarter GDP. U.S. unemployment remained high despite adding 1.8 million jobs in July, with a double-digit jobless rate persisting. However, manufacturing activity grew in both the U.S. and the eurozone. In Asia, while China’s manufacturing sector continued to expand, activity in Japan and South Korea contracted. In July, a rising concern was the rapid and broad reemergence of COVID-19 infections.
The stock market continued to rally in August despite concerns over rising numbers of COVID-19 cases in the United States and several European countries, including France and Spain, as well as the expiration of the $600 weekly bonus unemployment benefit at the end of July. U.S. stocks had strong monthly gains, led by the FAANG stocks—Facebook, Apple, Amazon, Netflix, and Google (Alphabet)—which dominate these indices and continued to rally. U.S. stocks generally surpassed other broadly positive global equity performance while fixed-income market monthly returns were broadly flat. Generally stronger-than-expected second-quarter earnings boosted investor sentiment along with the Fed’s announcement of a policy shift that will likely lead to longer-term low interest rates and supportive monetary policy. The U.S. Flash PMIs for both manufacturing and services beat expectations while U.S. housing market indicators were strong. In Europe, retail sales expanded and consumer confidence remained steady. China’s economy continued its fairly steady expansion. Overall, developed markets performed better than emerging market equities for the month of August as people took comfort in better-known equities in perceived safer markets.
Stocks grew more volatile in September on mixed economic data. U.S. PMIs showed solid growth in economic activity in both manufacturing and services. However, six months after the bottom fell out of the labor market in the early spring, only half of the 22 million jobs lost had returned. The U.S. unemployment rate fell to 7.9% in September, the fifth straight month of improvement but far higher than the 3.5% pre-COVID-19 rate. Only 661,000 jobs were added for the month, down from 1.5 million in August. Meanwhile, a reported 2.3 million people have given up looking for work. With U.S. Congress failing to pass further fiscal relief and uncertainties surrounding a possible vaccine, doubts crept back into the financial markets. In the U.K., a lack of progress in Brexit talks with the European Union weighed on markets. China’s economy picked up steam, however, with growth fueled by increased global demand, and China’s service sector had its strongest PMI reading in seven years.
4 | Wells Fargo Opportunity Fund
Table of Contents
Letter to shareholders (unaudited)
Don’t let short-term uncertainty derail long-term investment goals.
Periods of investment uncertainty can present challenges, but experience has taught us that maintaining long-term investment goals can be an effective way to plan for the future. To help you create a sound strategy based on your personal goals and risk tolerance, Wells Fargo Funds offers more than 100 mutual funds spanning a wide range of asset classes and investment styles. Although diversification cannot guarantee an investment profit or prevent losses, we believe it can be an effective way to manage investment risk and potentially smooth out overall portfolio performance. We encourage investors to know their investments and to understand that appropriate levels of risk-taking may unlock opportunities.
Thank you for choosing to invest with Wells Fargo Funds. We appreciate your confidence in us and remain committed to helping you meet your financial needs.
Sincerely,

Andrew Owen
President
Wells Fargo Funds
|
For further information about your Fund, contact your investment professional, visit our website at wfam.com, or call us directly at 1-800-222-8222. |
Notice to Shareholders
At a meeting held on August 10-12, 2020, the Board of Trustees of the Fund approved a change to the Fund’s automatic conversion feature for Class C shares in order to shorten the required holding period from 10 to 8 years. As a result, on a monthly basis beginning November 5, 2020, Class C shares will convert automatically into Class A shares 8 years after the initial date of purchase or, if you acquired your Class C shares through an exchange or conversion from another share class, 8 years after the date you acquired your Class C shares. When Class C shares that you acquired through a purchase or exchange convert, any other Class C shares that you purchased with reinvested dividends and distributions also will convert into Class A shares on a pro rata basis.
Please note that a shorter holding period may apply depending on your intermediary. Please see “Appendix A—Sales Charge Reductions and Waivers for Certain Intermediaries” in the Fund’s prospectus for further information.
Wells Fargo Opportunity Fund | 5
Table of Contents
Performance highlights (unaudited)
Investment objective
The Fund seeks long-term capital appreciation.
Manager
Wells Fargo Funds Management, LLC
Subadviser
Wells Capital Management Incorporated
Portfolio managers
Kurt Gunderson†
Christopher G. Miller, CFA®‡
Average annual total returns (%) as of September 30, 2020
| Including sales charge | Excluding sales charge | Expense ratios1 (%) | ||||||||||||||||||||||||||||||||
| Inception date | 1 year | 5 year | 10 year | 1 year | 5 year | 10 year | Gross | Net2 | ||||||||||||||||||||||||||
| Class A (SOPVX) | 2-24-2000 | 5.19 | 10.80 | 10.16 | 11.62 | 12.11 | 10.82 | 1.21 | 1.18 | |||||||||||||||||||||||||
| Class C (WFOPX) | 3-31-2008 | 11.13 | 11.54 | 10.12 | 12.13 | 11.54 | 10.12 | 1.96 | 1.93 | |||||||||||||||||||||||||
| Class R6 (WOFRX)3 | 5-29-2020 | – | – | – | 12.09 | 12.61 | 11.32 | 0.78 | 0.72 | |||||||||||||||||||||||||
| Administrator Class (WOFDX) | 8-30-2002 | – | – | – | 11.85 | 12.33 | 11.05 | 1.13 | 1.00 | |||||||||||||||||||||||||
| Institutional Class (WOFNX) | 7-30-2010 | – | – | – | 12.09 | 12.61 | 11.32 | 0.88 | 0.75 | |||||||||||||||||||||||||
| Russell 3000® Index4 | – | – | – | – | 15.00 | 13.69 | 13.48 | – | – | |||||||||||||||||||||||||
Figures quoted represent past performance, which is no guarantee of future results, and do not reflect taxes that a shareholder may pay on an investment in a fund. Investment return and principal value of an investment will fluctuate so that an investor’s shares, when redeemed, may be worth more or less than their original cost. Performance shown without sales charges would be lower if sales charges were reflected. Current performance may be lower or higher than the performance data quoted, which assumes the reinvestment of dividends and capital gains. Current month-end performance is available on the Fund’s website, wfam.com.
Index returns do not include transaction costs associated with buying and selling securities, any mutual fund fees or expenses, or any taxes. It is not possible to invest directly in an index.
For Class A shares, the maximum front-end sales charge is 5.75%. For Class C shares, the maximum contingent deferred sales charge is 1.00%. Performance including a contingent deferred sales charge assumes the sales charge for the corresponding time period. Class R6, Administrator Class, and Institutional Class shares are sold without a front-end sales charge or contingent deferred sales charge.
Stock values fluctuate in response to the activities of individual companies and general market and economic conditions. Smaller-company stocks tend to be more volatile and less liquid than those of larger companies. Certain investment strategies tend to increase the total risk of an investment (relative to the broader market). The Fund is exposed to foreign investment risk. Consult the Fund’s prospectus for additional information on these and other risks.
Please see footnotes on page 7.
6 | Wells Fargo Opportunity Fund
Table of Contents
Performance highlights (unaudited)
| Growth of $10,000 investment as of September 30, 20205 |
|

| † | Mr. Gunderson became a portfolio manager of the Fund on February 1, 2020. |
| ‡ | CFA® and Chartered Financial Analyst® are trademarks owned by CFA Institute. |
| 1 | Reflects the expense ratios as stated in the most recent prospectuses. The expense ratios shown are subject to change and may differ from the annualized expense ratios shown in the financial highlights of this report. |
| 2 | The manager has contractually committed through January 31, 2021 (January 31, 2022 for Class R6), to waive fees and/or reimburse expenses to the extent necessary to cap total annual fund operating expenses after fee waivers at 1.18% for Class A, 1.93% for Class C, 0.72% for Class R6, 1.00% for Administrator Class, and 0.75% for Institutional Class. Brokerage commissions, stamp duty fees, interest, taxes, acquired fund fees and expenses (if any), and extraordinary expenses are excluded from the expense caps. Prior to or after the commitment expiration date, the caps may be increased or the commitment to maintain the caps may be terminated only with the approval of the Board of Trustees. Without these caps, the Fund’s returns would have been lower. The expense ratio paid by an investor is the net expense ratio (the total annual fund operating expenses after fee waivers) as stated in the prospectuses. |
| 3 | Historical performance shown for the Class R6 shares prior to their inception reflects the performance of the Institutional Class shares and includes the higher expenses applicable to the Institutional Class shares. If these expenses had not been included, returns for the Class R6 shares would be higher. |
| 4 | The Russell 3000® Index measures the performance of the 3,000 largest U.S. companies based on total market capitalization, which represents approximately 98% of the investable U.S. equity market. You cannot invest directly in an index. |
| 5 | The chart compares the performance of Class A shares for the most recent ten years with the Russell 3000® Index. The chart assumes a hypothetical investment of $10,000 in Class A shares and reflects all operating expenses and assumes the maximum initial sales charge of 5.75%. |
| 6 | The ten largest holdings, excluding cash, cash equivalents and money market funds, are calculated based on the value of the investments divided by total net assets of the Fund. Holdings are subject to change and may have changed since the date specified. |
| 7 | Amounts are calculated based on the total long-term investments of the Fund. These amounts are subject to change and may have changed since the date specified. |
Wells Fargo Opportunity Fund | 7
Table of Contents
Performance highlights (unaudited)
MANAGER’S DISCUSSION
Fund highlights
| ∎ | The Fund underperformed its benchmark, the Russell 3000® Index, for the 12-month period that ended September 30, 2020. |
| ∎ | Stock selection in the industrials, information technology (IT), and health care sectors contributed to relative underperformance even though IT and health care were the largest sources of absolute return. |
| ∎ | Stock selection in financials and real estate and an underweight positioning in the energy sector were the largest sources of relative outperformance. |
The U.S. equity markets were extremely volatile and moved sharply in both directions during the reporting period. The markets rose in all four quarters in 2019 and into mid-February, hitting new all-time highs along the way. Then, as the global pandemic took hold, the equity markets proceeded to lose more than 35% of their value in less than six weeks, ending the longest bull market in U.S. history while entering bear market territory in record time. Beginning in the last week of March, U.S. equities began to recover and rose for the next five months before retreating a bit in September. The Fund’s benchmark followed a similar pattern and ended up gaining 15% for the 12-month period. IT, consumer discretionary, and health care were the best-performing sectors in the benchmark while energy, financials, and real estate declined the most. Growth stocks generally outperformed value.
Leading up to the mid-February high, the U.S. equities benefited from a dovish U.S. Federal Reserve (Fed), lower corporate taxes, less regulation, share buybacks, capital spending, and high-profile merger and acquisition activity that boosted optimism in U.S. businesses. Rising wages, low unemployment, low inflation, and declining household debt fueled consumer confidence. COVID-19 evolved into a global pandemic, largely shutting down the international economy and eventually accumulating a worldwide death toll of around 1 million by the end of the period. The six-week market decline was followed by a recovery that can mostly be attributed to the speed and aggressiveness of the U.S. government’s fiscal and monetary policy response. Sentiment ebbed and flowed with news of infection rates, mortality rates, vaccines, therapeutics, and partial business openings. The legislature approved three stimulus bills, including the Coronavirus Aid, Relief, and Economic Security Act, representing the largest stimulus bill in U.S. history at $2.2 trillion. The Fed had cut interest rates to near zero by mid-March and announced an aggressive open-ended commitment to keep buying assets under its quantitative easing measures to also include corporate bonds for the first time in its history. The Fed’s “whatever it takes” mantra increased its balance sheet to over $7.2 trillion. Through the period, we continued to seek companies with solid business models, strong management teams, and healthy cash flow prospects.
Holdings in industrials, IT, and health care contributed to relative underperformance.
The Fund’s holdings in industrials, particularly in aerospace/defense and building products, were overweight and underperformed the benchmark. Hexcel Corporation (HXL) is a leading producer of carbon fiber reinforcements and resin systems and honeycomb manufacturing for the commercial aerospace, industrial, and defense industries. Travel restrictions severely curtailed demand from aircraft manufacturers and the stock declined 55% during the period. The Fund’s holdings in IT made the largest contribution to overall returns but underperformed the benchmark. Apple Incorporated (AAPL) rose 109% during the period after consistently beating expectations on financial performance, product sales, new product launches, and future demand. AAPL is one of the top holdings in the Fund but is still underweight the top-heavy benchmark, turning it into a relative underperformer. Health care was the second-largest contributor to overall returns but underperformed the benchmark. LivaNova PLC (LIVN) is a medical technology company that specializes in neuromodulation, cardiac surgery, and cardiac rhythm management. The stock declined 39% during the period, affected by a pandemic-related delay in clinical trial timelines and postponement of non-emergent procedures that hurt the firm’s neuromodulation business. Conversely, in the life sciences industry, Bio-Rad Laboratories, Incorporated (BIO), was one of the largest relative contributors to the Fund. BIO is a leading life science company providing instruments, software, consumables, reagents, and related content. The stock rose 55% on increased demand for its products, including a real-time PCR screening assay and a blood-based immunoassay kit to identify antibodies to COVID-19.
8 | Wells Fargo Opportunity Fund
Table of Contents
Performance highlights (unaudited)
| Ten largest holdings (%) as of September 30, 20206 | ||||
Apple Incorporated | 4.32 | |||
Alphabet Incorporated Class C | 4.08 | |||
Amazon.com Incorporated | 3.81 | |||
Salesforce.com Incorporated | 3.68 | |||
Facebook Incorporated Class A | 2.91 | |||
Texas Instruments Incorporated | 2.71 | |||
MasterCard Incorporated Class A | 2.60 | |||
UnitedHealth Group Incorporated | 1.99 | |||
Thermo Fisher Scientific Incorporated | 1.97 | |||
Novartis AG ADR | 1.95 | |||
Financials, real estate, and energy contributed the most to relative performance.
The financials sector was the largest detractor from overall returns in the benchmark, but the Fund’s holdings outperformed the benchmark, turning it into a relative contributor. The Fund was underweight banks, a group that declined from falling interest rates and elevated credit risks associated with the economic impact of the pandemic. The Fund was overweight and outperformed the capital markets group, which generally benefited from low interest rates as well as activity in the equity and debt markets. S&P Global Incorporated (SPGI), which provides transparent and independent ratings, benchmarks, analytics, and data to the capital and commodity markets, rose 48% during the period.
The real estate sector in the benchmark declined during the period, but the Fund was overweight and outperformed the group. Fund holdings in data centers and cell towers benefited from increased use of cloud computing and electronic commerce by businesses and increased electronic communications between/among people and things. Equinix, Incoporated (EQIX), is a data center and co-location provider operating in 52 markets across five continents, with a portfolio of interconnection-dense data centers that have limited supply and strong demand. EQIX rose 34% during the period on increased demand as more people work from home and more economic activity is conducted online. The energy sector was hurt by the collapse in the price of crude oil, as global demand faded from the pandemic-induced economic slowdown without a proportional reduction in supply. Energy was the worst-performing sector in the benchmark with a decline of 45%, but it was a relative contributor to the Fund from being underweight. Utilities also declined during the period and lack of exposure there was also a source of relative gains.
| Sector allocation as of September 30, 20207 |
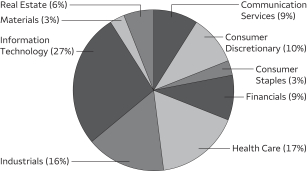 |
Our focus is constant: To add value by investing in attractively priced holdings.
We seek to buy stocks at a discount to their estimated private market valuation (PMV) and sell them as they reach the top of their PMV range. The PMV represents the expected price an investor would pay for the entire company as a stand-alone private entity. Our disciplined, bottom-up investment process leads us to be overweight or underweight certain sectors. This positioning changes over time based on macroeconomic and industry-specific factors. During the reporting period, we were overweight the industrials, health care, and real estate sectors and underweight consumer staples, utilities, and consumer discretionary. Through our disciplined investment process, we remain keenly aware of both price and enterprise values on a company-by-company basis.
The economic impact of the global COVID-19 pandemic will consume the equity markets for the foreseeable future. As infection rates have slowed down and patient recovery rates have improved, the country has been gradually opening up and eventually the economy will get back in motion. The U.S. economy went into a recession in the first quarter of 2020, but it’s too early to know how deep the economic damage will be, how soon it can begin to recover, and whether the extraordinary responses to date will be effective. We now know a lot more about COVID-19, and we believe there is a lot of promise in the vaccines and therapeutics under development. This economic downturn has been different from anything else in recent history, and there is the possibility that things could get back to normal sooner than expected.
Please see footnotes on page 7.
Wells Fargo Opportunity Fund | 9
Table of Contents
As a shareholder of the Fund, you incur two types of costs: (1) transaction costs, including sales charges (loads) on purchase payments and contingent deferred sales charges (if any) on redemptions and (2) ongoing costs, including management fees, distribution (12b-1) and/or shareholder servicing fees, and other Fund expenses. This example is intended to help you understand your ongoing costs (in dollars) of investing in the Fund and to compare these costs with the ongoing costs of investing in other mutual funds.
The example is based on an investment of $1,000 invested at the beginning of the six-month period and held for the entire period from April 1, 2020 to September 30, 2020.
Actual expenses
The “Actual” line of the table below provides information about actual account values and actual expenses. You may use the information in this line, together with the amount you invested, to estimate the expenses that you paid over the period. Simply divide your account value by $1,000 (for example, an $8,600 account value divided by $1,000 = 8.6), then multiply the result by the number in the “Actual” line under the heading entitled “Expenses paid during period” for your applicable class of shares to estimate the expenses you paid on your account during this period.
Hypothetical example for comparison purposes
The “Hypothetical” line of the table below provides information about hypothetical account values and hypothetical expenses based on the Fund’s actual expense ratio and an assumed rate of return of 5% per year before expenses, which is not the Fund’s actual return. The hypothetical account values and expenses may not be used to estimate the actual ending account balance or expenses you paid for the period. You may use this information to compare the ongoing costs of investing in the Fund and other funds. To do so, compare this 5% hypothetical example with the 5% hypothetical examples that appear in the shareholder reports of the other funds.
Please note that the expenses shown in the table are meant to highlight your ongoing costs only and do not reflect any transactional costs, such as sales charges (loads) and contingent deferred sales charges. Therefore, the “Hypothetical” line of the table is useful in comparing ongoing costs only and will not help you determine the relative total costs of owning different funds. In addition, if these transactional costs were included, your costs would have been higher.
| Beginning account value 4-1-2020 | Ending account value 9-30-2020 | Expenses paid during the period1 | Annualized net expense ratio | |||||||||||||
Class A | ||||||||||||||||
Actual | $ | 1,000.00 | $ | 1,331.00 | $ | 6.84 | 1.17 | % | ||||||||
Hypothetical (5% return before expenses) | $ | 1,000.00 | $ | 1,019.20 | $ | 5.93 | 1.17 | % | ||||||||
Class C | ||||||||||||||||
Actual | $ | 1,000.00 | $ | 1,342.35 | $ | 11.23 | 1.91 | % | ||||||||
Hypothetical (5% return before expenses) | $ | 1,000.00 | $ | 1,015.48 | $ | 9.66 | 1.91 | % | ||||||||
Class R6 | ||||||||||||||||
Actual | $ | 1,000.00 | $ | 1,333.76 | $ | 2.79 | 0.72 | % | ||||||||
Hypothetical (5% return before expenses) | $ | 1,000.00 | $ | 1,014.19 | $ | 2.40 | 0.72 | % | ||||||||
Administrator Class | ||||||||||||||||
Actual | $ | 1,000.00 | $ | 1,332.28 | $ | 5.77 | 0.99 | % | ||||||||
Hypothetical (5% return before expenses) | $ | 1,000.00 | $ | 1,020.12 | $ | 5.00 | 0.99 | % | ||||||||
Institutional Class | ||||||||||||||||
Actual | $ | 1,000.00 | $ | 1,333.76 | $ | 4.39 | 0.75 | % | ||||||||
Hypothetical (5% return before expenses) | $ | 1,000.00 | $ | 1,021.31 | $ | 3.80 | 0.75 | % | ||||||||
| 1 | Expenses paid is equal to the annualized net expense ratio of each class multiplied by the average account value over the period, multiplied by the number of days in the most recent fiscal half-year divided by the number of days in the fiscal year (to reflect the one-half-year period). |
10 | Wells Fargo Opportunity Fund
Table of Contents
Portfolio of investments—September 30, 2020
| Shares | Value | |||||||||||||||
| Common Stocks: 98.70% |
| |||||||||||||||
Communication Services: 8.48% |
| |||||||||||||||
| Interactive Media & Services: 7.00% | ||||||||||||||||
Alphabet Incorporated Class C † | 47,392 | $ | 69,647,282 | |||||||||||||
Facebook Incorporated Class A † | 189,942 | 49,745,810 | ||||||||||||||
| 119,393,092 | ||||||||||||||||
|
| |||||||||||||||
| Wireless Telecommunication Services: 1.48% | ||||||||||||||||
T-Mobile US Incorporated † | 221,056 | 25,279,964 | ||||||||||||||
|
| |||||||||||||||
Consumer Discretionary: 10.13% |
| |||||||||||||||
| Automobiles: 1.82% | ||||||||||||||||
General Motors Company | 1,048,248 | 31,017,658 | ||||||||||||||
|
| |||||||||||||||
| Internet & Direct Marketing Retail: 3.81% | ||||||||||||||||
Amazon.com Incorporated † | 20,633 | 64,967,746 | ||||||||||||||
|
| |||||||||||||||
| Multiline Retail: 1.28% | ||||||||||||||||
Dollar General Corporation | 104,574 | 21,920,802 | ||||||||||||||
|
| |||||||||||||||
| Specialty Retail: 3.22% | ||||||||||||||||
Burlington Stores Incorporated † | 156,501 | 32,253,291 | ||||||||||||||
Ulta Beauty Incorporated † | 101,663 | 22,770,479 | ||||||||||||||
| 55,023,770 | ||||||||||||||||
|
| |||||||||||||||
Consumer Staples: 2.62% |
| |||||||||||||||
| Food & Staples Retailing: 1.51% | ||||||||||||||||
Sysco Corporation | 414,432 | 25,785,959 | ||||||||||||||
|
| |||||||||||||||
| Household Products: 1.11% | ||||||||||||||||
Church & Dwight Company Incorporated | 201,474 | 18,880,129 | ||||||||||||||
|
| |||||||||||||||
Financials: 9.20% |
| |||||||||||||||
| Capital Markets: 5.18% | ||||||||||||||||
CME Group Incorporated | 91,094 | 15,240,937 | ||||||||||||||
Intercontinental Exchange Incorporated | 319,835 | 31,999,492 | ||||||||||||||
S&P Global Incorporated | 71,785 | 25,885,671 | ||||||||||||||
The Charles Schwab Corporation | 422,483 | 15,306,559 | ||||||||||||||
| 88,432,659 | ||||||||||||||||
|
| |||||||||||||||
| Consumer Finance: 1.19% | ||||||||||||||||
Discover Financial Services | 352,668 | 20,377,157 | ||||||||||||||
|
| |||||||||||||||
| Insurance: 2.83% | ||||||||||||||||
Chubb Limited | 166,999 | 19,391,924 | ||||||||||||||
Marsh & McLennan Companies Incorporated | 251,521 | 28,849,459 | ||||||||||||||
| 48,241,383 | ||||||||||||||||
|
| |||||||||||||||
Health Care: 16.48% |
| |||||||||||||||
| Biotechnology: 0.99% | ||||||||||||||||
Alexion Pharmaceuticals Incorporated † | 147,877 | 16,921,565 | ||||||||||||||
|
| |||||||||||||||
| Health Care Equipment & Supplies: 5.52% | ||||||||||||||||
Align Technology Incorporated † | 48,447 | 15,859,610 | ||||||||||||||
Boston Scientific Corporation † | 717,989 | 27,434,360 | ||||||||||||||
The accompanying notes are an integral part of these financial statements.
Wells Fargo Opportunity Fund | 11
Table of Contents
Portfolio of investments—September 30, 2020
| Shares | Value | |||||||||||||||
| Health Care Equipment & Supplies (continued) | ||||||||||||||||
LivaNova plc † | 516,651 | $ | 23,357,792 | |||||||||||||
Medtronic plc | 264,842 | 27,522,381 | ||||||||||||||
| 94,174,143 | ||||||||||||||||
|
| |||||||||||||||
| Health Care Providers & Services: 1.99% | ||||||||||||||||
UnitedHealth Group Incorporated | 109,033 | 33,993,218 | ||||||||||||||
|
| |||||||||||||||
| Life Sciences Tools & Services: 5.44% | ||||||||||||||||
Agilent Technologies Incorporated | 293,741 | 29,650,217 | ||||||||||||||
Bio-Rad Laboratories Incorporated Class A † | 57,138 | 29,452,353 | ||||||||||||||
Thermo Fisher Scientific Incorporated | 76,275 | 33,676,938 | ||||||||||||||
| 92,779,508 | ||||||||||||||||
|
| |||||||||||||||
| Pharmaceuticals: 2.54% | ||||||||||||||||
Mylan NV † | 674,828 | 10,007,699 | ||||||||||||||
Novartis AG ADR | 382,770 | 33,285,679 | ||||||||||||||
| 43,293,378 | ||||||||||||||||
|
| |||||||||||||||
| Industrials: 15.59% | ||||||||||||||||
| Aerospace & Defense: 3.26% | ||||||||||||||||
Hexcel Corporation | 315,073 | 10,570,699 | ||||||||||||||
MTU Aero Engines AG † | 124,736 | 20,677,566 | ||||||||||||||
Teledyne Technologies Incorporated † | 78,861 | 24,463,471 | ||||||||||||||
| 55,711,736 | ||||||||||||||||
|
| |||||||||||||||
| Commercial Services & Supplies: 1.24% | ||||||||||||||||
Republic Services Incorporated | 225,987 | 21,095,886 | ||||||||||||||
|
| |||||||||||||||
| Electrical Equipment: 1.81% | ||||||||||||||||
AMETEK Incorporated | 310,847 | 30,898,192 | ||||||||||||||
|
| |||||||||||||||
| Industrial Conglomerates: 1.51% | ||||||||||||||||
Carlisle Companies Incorporated | 210,169 | 25,718,381 | ||||||||||||||
|
| |||||||||||||||
| Machinery: 6.38% | ||||||||||||||||
Fortive Corporation | 320,686 | 24,439,480 | ||||||||||||||
Ingersoll Rand Incorporated † | 638,812 | 22,741,707 | ||||||||||||||
ITT Incorporated | 481,908 | 28,456,667 | ||||||||||||||
Otis Worldwide Corporation | 272,268 | 16,994,969 | ||||||||||||||
SPX Corporation † | 349,978 | 16,231,980 | ||||||||||||||
| 108,864,803 | ||||||||||||||||
|
| |||||||||||||||
| Trading Companies & Distributors: 1.39% | ||||||||||||||||
United Rentals Incorporated † | 136,003 | 23,732,524 | ||||||||||||||
|
| |||||||||||||||
Information Technology: 26.51% |
| |||||||||||||||
| Electronic Equipment, Instruments & Components: 1.72% | ||||||||||||||||
Amphenol Corporation Class A | 270,200 | 29,254,554 | ||||||||||||||
|
| |||||||||||||||
IT Services: 3.99% |
| |||||||||||||||
Fidelity National Information Services Incorporated | 160,830 | 23,675,784 | ||||||||||||||
MasterCard Incorporated Class A | 131,443 | 44,450,079 | ||||||||||||||
| 68,125,863 | ||||||||||||||||
|
| |||||||||||||||
The accompanying notes are an integral part of these financial statements.
12 | Wells Fargo Opportunity Fund
Table of Contents
Portfolio of investments—September 30, 2020
| Shares | Value | |||||||||||||||
| Semiconductors & Semiconductor Equipment: 4.53% | ||||||||||||||||
Marvell Technology Group Limited | 783,786 | $ | 31,116,304 | |||||||||||||
Texas Instruments Incorporated | 323,846 | 46,241,970 | ||||||||||||||
| 77,358,274 | ||||||||||||||||
|
| |||||||||||||||
| Software: 11.95% | ||||||||||||||||
Fair Isaac Corporation † | 55,300 | 23,523,514 | ||||||||||||||
Palo Alto Networks Incorporated † | 95,797 | 23,446,316 | ||||||||||||||
Proofpoint Incorporated † | 211,831 | 22,358,762 | ||||||||||||||
RealPage Incorporated † | 361,710 | 20,848,964 | ||||||||||||||
Salesforce.com Incorporated † | 249,796 | 62,778,731 | ||||||||||||||
ServiceNow Incorporated † | 38,683 | 18,761,255 | ||||||||||||||
Workday Incorporated Class A † | 149,866 | 32,240,673 | ||||||||||||||
| 203,958,215 | ||||||||||||||||
|
| |||||||||||||||
| Technology Hardware, Storage & Peripherals: 4.32% | ||||||||||||||||
Apple Incorporated | 636,373 | 73,698,357 | ||||||||||||||
|
| |||||||||||||||
Materials: 3.20% |
| |||||||||||||||
| Chemicals: 2.19% | ||||||||||||||||
The Sherwin-Williams Company | 34,648 | 24,140,648 | ||||||||||||||
Westlake Chemical Corporation | 210,239 | 13,291,310 | ||||||||||||||
| 37,431,958 | ||||||||||||||||
|
| |||||||||||||||
| Metals & Mining: 1.01% | ||||||||||||||||
Steel Dynamics Incorporated | 602,352 | 17,245,338 | ||||||||||||||
|
| |||||||||||||||
Real Estate: 6.49% |
| |||||||||||||||
| Equity REITs: 6.49% | ||||||||||||||||
American Tower Corporation | 107,741 | 26,044,232 | ||||||||||||||
Equinix Incorporated | 33,533 | 25,489,439 | ||||||||||||||
Sun Communities Incorporated | 199,147 | 28,002,060 | ||||||||||||||
VICI Properties Incorporated | 1,336,098 | 31,224,610 | ||||||||||||||
| 110,760,341 | ||||||||||||||||
|
| |||||||||||||||
Total Common Stocks (Cost $1,078,928,826) |
| 1,684,336,553 | ||||||||||||||
|
| |||||||||||||||
| Yield | ||||||||||||||||
| Short-Term Investments: 1.33% |
| |||||||||||||||
| Investment Companies: 1.33% | ||||||||||||||||
Wells Fargo Government Money Market Fund Select Class (l)(u) | 0.05 | % | 22,715,468 | 22,715,468 | ||||||||||||
|
| |||||||||||||||
Total Short-Term Investments (Cost $22,715,468) |
| 22,715,468 | ||||||||||||||
|
| |||||||||||||||
| Total investments in securities (Cost $1,101,644,294) | 100.03 | % | 1,707,052,021 | |||||
Other assets and liabilities, net | (0.03 | ) | (467,312 | ) | ||||
|
|
|
| |||||
| Total net assets | 100.00 | % | $ | 1,706,584,709 | ||||
|
|
|
| |||||
| † | Non-income-earning security |
| (l) | The issuer of the security is an affiliated person of the Fund as defined in the Investment Company Act of 1940. |
| (u) | The rate represents the 7-day annualized yield at period end. |
Abbreviations:
| ADR | American depositary receipt |
| REIT | Real estate investment trust |
The accompanying notes are an integral part of these financial statements.
Wells Fargo Opportunity Fund | 13
Table of Contents
Portfolio of investments—September 30, 2020
Investments in Affiliates
An affiliated investment is an investment in which the Fund owns at least 5% of the outstanding voting shares of the issuer or as a result of other relationships, such as the Fund and the issuer having the same investment manager. Transactions with issuers that were either affiliated persons of the Fund at the beginning of the period or the end of the period were as follows:
Value, beginning of period | Purchases | Sales proceeds | Net realized gains (losses) | Net change in unrealized gains (losses) | Income from affiliated securities | Value, end of | % of net | |||||||||||||||||||||||||
| Short-Term Investments | ||||||||||||||||||||||||||||||||
Investment Companies | ||||||||||||||||||||||||||||||||
Securities Lending Cash Investments LLC* | $ | 25,484,000 | $ | 25,880,225 | $ | (51,364,225 | ) | $ | 0 | $ | 0 | $ | 10,809 | # | $ | 0 | ||||||||||||||||
Wells Fargo Government Money Market Fund Select Class | 18,124,846 | 350,692,096 | (346,101,474 | ) | 0 | 0 | 170,981 | 22,715,468 | ||||||||||||||||||||||||
|
|
|
|
|
|
|
|
|
| |||||||||||||||||||||||
| $ | 0 | $ | 0 | $ | 181,790 | $ | 22,715,468 | 1.33 | % | |||||||||||||||||||||||
|
|
|
|
|
|
|
|
|
| |||||||||||||||||||||||
| * | No longer held at the end of the period. |
| # | Amount shown represents income before fees and rebates. |
The accompanying notes are an integral part of these financial statements.
14 | Wells Fargo Opportunity Fund
Table of Contents
Statement of assets and liabilities—September 30, 2020
Assets | ||||
Investments in unaffiliated securities, at value (cost $1,078,928,826) | $ | 1,684,336,553 | ||
Investments in affiliated securities, at value (cost $22,715,468) | 22,715,468 | |||
Foreign currency, at value (cost $63) | 63 | |||
Receivable for investments sold | 2,330,282 | |||
Receivable for Fund shares sold | 32,479 | |||
Receivable for dividends | 2,178,080 | |||
Prepaid expenses and other assets | 41,921 | |||
|
| |||
Total assets | 1,711,634,846 | |||
|
| |||
Liabilities | ||||
Payable for investments purchased | 2,606,890 | |||
Payable for Fund shares redeemed | 485,309 | |||
Management fee payable | 1,056,621 | |||
Administration fees payable | 279,398 | |||
Distribution fee payable | 1,348 | |||
Shareholder servicing fees payable | 346,703 | |||
Accrued expenses and other liabilities | 273,868 | |||
|
| |||
Total liabilities | 5,050,137 | |||
|
| |||
Total net assets | $ | 1,706,584,709 | ||
|
| |||
Net assets consist of | ||||
Paid-in capital | $ | 999,466,853 | ||
Total distributable earnings | 707,117,856 | |||
|
| |||
Total net assets | $ | 1,706,584,709 | ||
|
| |||
Computation of net asset value and offering price per share | ||||
Net assets – Class A | $ | 1,453,975,000 | ||
Shares outstanding – Class A1 | 31,858,206 | |||
Net asset value per share – Class A | $45.64 | |||
Maximum offering price per share – Class A2 | $48.42 | |||
Net assets – Class C | $ | 2,268,288 | ||
Shares outstanding – Class C1 | 53,760 | |||
Net asset value per share – Class C | $42.19 | |||
Net assets – Class R6 | $ | 27,675 | ||
Shares outstanding – Class R61 | 534 | |||
Net asset value per share – Class R6 | $51.83 | |||
Net assets – Administrator Class | $ | 225,604,135 | ||
Shares outstanding – Administrator Class1 | 4,451,902 | |||
Net asset value per share – Administrator Class | $50.68 | |||
Net assets – Institutional Class | $ | 24,709,611 | ||
Shares outstanding – Institutional Class1 | 476,748 | |||
Net asset value per share – Institutional Class | $51.83 | |||
| 1 | The Fund has an unlimited number of authorized shares. |
| 2 | Maximum offering price is computed as 100/94.25 of net asset value. On investments of $50,000 or more, the offering price is reduced. |
The accompanying notes are an integral part of these financial statements.
Wells Fargo Opportunity Fund | 15
Table of Contents
Statement of operations—year ended September 30, 2020
Investment income | ||||
Dividends (net of foreign withholding taxes of $194,326) | $ | 19,651,587 | ||
Income from affiliated securities | 172,956 | |||
|
| |||
Total investment income | 19,824,543 | |||
|
| |||
Expenses | ||||
Management fee | 11,969,836 | |||
Administration fees |
| |||
Class A | 2,962,148 | |||
Class C | 5,505 | |||
Class R6 | 2 | 1 | ||
Administrator Class | 281,941 | |||
Institutional Class | 34,256 | |||
Shareholder servicing fees |
| |||
Class A | 3,522,367 | |||
Class C | 6,542 | |||
Administrator Class | 540,047 | |||
Distribution fee |
| |||
Class C | 19,243 | |||
Custody and accounting fees | 89,279 | |||
Professional fees | 51,769 | |||
Registration fees | 80,018 | |||
Shareholder report expenses | 111,710 | |||
Trustees’ fees and expenses | 21,260 | |||
Other fees and expenses | 50,962 | |||
|
| |||
Total expenses | 19,746,885 | |||
Less: Fee waivers and/or expense reimbursements |
| |||
Fund-level | (405,523 | ) | ||
Class A | (321,994 | ) | ||
Class C | (170 | ) | ||
Administrator Class | (278,415 | ) | ||
Institutional Class | (26,989 | ) | ||
|
| |||
Net expenses | 18,713,794 | |||
|
| |||
Net investment income | 1,110,749 | |||
|
| |||
Payment from affiliate | 34,135 | |||
|
| |||
Realized and unrealized gains (losses) on investments | ||||
Net realized gains on investments | 104,293,081 | |||
Net change in unrealized gains (losses) on investments | 74,954,479 | |||
|
| |||
Net realized and unrealized gains (losses) on investments | 179,247,560 | |||
|
| |||
Net increase in net assets resulting from operations | $ | 180,392,444 | ||
|
| |||
| 1 | For the period from May 29, 2020 (commencement of class operations) to September 30, 2020 |
The accompanying notes are an integral part of these financial statements.
16 | Wells Fargo Opportunity Fund
Table of Contents
Statement of changes in net assets
| Year ended September 30, 2020 | Year ended September 30, 2019 | |||||||||||||||
Operations |
| |||||||||||||||
Net investment income | $ | 1,110,749 | $ | 4,276,187 | ||||||||||||
Payment from affiliate | 34,135 | 0 | ||||||||||||||
Net realized gains on investments | 104,293,081 | 94,543,210 | ||||||||||||||
Net change in unrealized gains (losses) on investments | 74,954,479 | (20,640,995 | ) | |||||||||||||
|
| |||||||||||||||
Net increase in net assets resulting from operations | 180,392,444 | 78,178,402 | ||||||||||||||
|
| |||||||||||||||
Distributions to shareholders from net investment income and net realized gains | ||||||||||||||||
Class A | (85,913,524 | ) | (148,689,321 | ) | ||||||||||||
Class C | (177,607 | ) | (3,194,912 | ) | ||||||||||||
Administrator Class | (12,052,779 | ) | (21,792,735 | ) | ||||||||||||
Institutional Class | (1,499,585 | ) | (2,724,775 | ) | ||||||||||||
|
| |||||||||||||||
Total distributions to shareholders | (99,643,495 | ) | (176,401,743 | ) | ||||||||||||
|
| |||||||||||||||
Capital share transactions | Shares | Shares | ||||||||||||||
Proceeds from shares sold |
| |||||||||||||||
Class A | 366,718 | 15,359,130 | 930,098 | 37,142,175 | ||||||||||||
Class C | 7,277 | 279,818 | 12,229 | 460,797 | ||||||||||||
Class R6 | 534 | 1 | 25,000 | 1 | N/A | N/A | ||||||||||
Administrator Class | 33,759 | 1,562,280 | 46,303 | 2,094,423 | ||||||||||||
Institutional Class | 161,022 | 7,664,409 | 228,906 | 10,662,670 | ||||||||||||
|
| |||||||||||||||
| 24,890,637 | 50,360,065 | |||||||||||||||
|
| |||||||||||||||
Reinvestment of distributions |
| |||||||||||||||
Class A | 1,957,543 | 83,556,394 | 3,891,150 | 144,750,768 | ||||||||||||
Class C | 4,247 | 166,102 | 91,007 | 3,143,382 | ||||||||||||
Administrator Class | 242,678 | 11,500,332 | 504,265 | 20,669,150 | ||||||||||||
Institutional Class | 27,588 | 1,337,917 | 58,962 | 2,469,867 | ||||||||||||
|
| |||||||||||||||
| 96,560,745 | 171,033,167 | |||||||||||||||
|
| |||||||||||||||
Payment for shares redeemed |
| |||||||||||||||
Class A | (4,164,215 | ) | (173,332,142 | ) | (4,134,053 | ) | (168,457,293 | ) | ||||||||
Class C | (51,203 | ) | (1,993,712 | ) | (732,350 | ) | (26,708,914 | ) | ||||||||
Administrator Class | (588,564 | ) | (27,709,639 | ) | (620,318 | ) | (27,798,000 | ) | ||||||||
Institutional Class | (252,821 | ) | (12,074,682 | ) | (320,957 | ) | (14,616,198 | ) | ||||||||
|
| |||||||||||||||
| (215,110,175 | ) | (237,580,405 | ) | |||||||||||||
|
| |||||||||||||||
Net decrease in net assets resulting from capital share transactions | (93,658,793 | ) | (16,187,173 | ) | ||||||||||||
|
| |||||||||||||||
Total decrease in net assets | (12,909,844 | ) | (114,410,514 | ) | ||||||||||||
|
| |||||||||||||||
Net assets | ||||||||||||||||
Beginning of period | 1,719,494,553 | 1,833,905,067 | ||||||||||||||
|
| |||||||||||||||
End of period | $ | 1,706,584,709 | $ | 1,719,494,553 | ||||||||||||
|
| |||||||||||||||
| 1 | For the period from May 29, 2020 (commencement of class operations) to September 30, 2020 |
The accompanying notes are an integral part of these financial statements.
Wells Fargo Opportunity Fund | 17
Table of Contents
(For a share outstanding throughout each period)
| Year ended September 30 | ||||||||||||||||||||
| CLASS A | 2020 | 2019 | 2018 | 2017 | 2016 | |||||||||||||||
Net asset value, beginning of period | $43.37 | $46.31 | $45.83 | $41.86 | $43.35 | |||||||||||||||
Net investment income (loss) | 0.01 | 0.10 | (0.01 | )1 | 0.04 | 0.13 | 1 | |||||||||||||
Payment from affiliate | 0.00 | 2 | 0.00 | 0.00 | 0.00 | 0.00 | ||||||||||||||
Net realized and unrealized gains (losses) on investments | 4.85 | 1.54 | 6.41 | 6.60 | 4.72 | |||||||||||||||
|
|
|
|
|
|
|
|
|
| |||||||||||
Total from investment operations | 4.86 | 1.64 | 6.40 | 6.64 | 4.85 | |||||||||||||||
Distributions to shareholders from | ||||||||||||||||||||
Net investment income | (0.10 | ) | 0.00 | (0.17 | ) | (0.13 | ) | (0.57 | ) | |||||||||||
Net realized gains | (2.49 | ) | (4.58 | ) | (5.75 | ) | (2.54 | ) | (5.77 | ) | ||||||||||
|
|
|
|
|
|
|
|
|
| |||||||||||
Total distributions to shareholders | (2.59 | ) | (4.58 | ) | (5.92 | ) | (2.67 | ) | (6.34 | ) | ||||||||||
Net asset value, end of period | $45.64 | $43.37 | $46.31 | $45.83 | $41.86 | |||||||||||||||
Total return3 | 11.62 | %4 | 5.18 | % | 15.16 | % | 16.49 | % | 12.46 | % | ||||||||||
Ratios to average net assets (annualized) | ||||||||||||||||||||
Gross expenses | 1.21 | % | 1.21 | % | 1.20 | % | 1.21 | % | 1.21 | % | ||||||||||
Net expenses | 1.16 | % | 1.19 | % | 1.20 | % | 1.21 | % | 1.21 | % | ||||||||||
Net investment income (loss) | 0.04 | % | 0.23 | % | (0.01 | )% | 0.11 | % | 0.33 | % | ||||||||||
Supplemental data | ||||||||||||||||||||
Portfolio turnover rate | 43 | % | 28 | % | 30 | % | 43 | % | 34 | % | ||||||||||
Net assets, end of period (000s omitted) | $1,453,975 | $1,461,345 | $1,528,852 | $1,479,457 | $1,418,614 | |||||||||||||||
| 1 | Calculated based upon average shares outstanding |
| 2 | Amount is less than $0.005. |
| 3 | Total return calculations do not include any sales charges. |
| 4 | During the year ended September 30, 2020, the Fund received a payment from an affiliate that had an impact of less than 0.005% on the total return. See Note 4 in the Notes to Financial Statements for additional information. |
The accompanying notes are an integral part of these financial statements.
18 | Wells Fargo Opportunity Fund
Table of Contents
Financial highlights
(For a share outstanding throughout each period)
| Year ended September 30 | ||||||||||||||||||||
| CLASS C | 2020 | 2019 | 2018 | 2017 | 2016 | |||||||||||||||
Net asset value, beginning of period | $40.02 | $43.43 | $43.46 | $39.99 | $41.60 | |||||||||||||||
Net investment loss | (0.28 | )1 | (0.26 | )1 | (0.43 | ) | (0.26 | )1 | (0.16 | )1 | ||||||||||
Payment from affiliate | 0.54 | 0.00 | 0.00 | 0.00 | 0.00 | |||||||||||||||
Net realized and unrealized gains (losses) on investments | 4.40 | 1.43 | 6.15 | 6.27 | 4.51 | |||||||||||||||
|
|
|
|
|
|
|
|
|
| |||||||||||
Total from investment operations | 4.66 | 1.17 | 5.72 | 6.01 | 4.35 | |||||||||||||||
Distributions to shareholders from | ||||||||||||||||||||
Net investment income | 0.00 | 0.00 | 0.00 | 0.00 | (0.19 | ) | ||||||||||||||
Net realized gains | (2.49 | ) | (4.58 | ) | (5.75 | ) | (2.54 | ) | (5.77 | ) | ||||||||||
|
|
|
|
|
|
|
|
|
| |||||||||||
Total distributions to shareholders | (2.49 | ) | (4.58 | ) | (5.75 | ) | (2.54 | ) | (5.96 | ) | ||||||||||
Net asset value, end of period | $42.19 | $40.02 | $43.43 | $43.46 | $39.99 | |||||||||||||||
Total return2 | 12.13 | %3 | 4.37 | % | 14.31 | % | 15.62 | % | 11.62 | % | ||||||||||
Ratios to average net assets (annualized) | ||||||||||||||||||||
Gross expenses | 1.94 | % | 1.96 | % | 1.95 | % | 1.96 | % | 1.96 | % | ||||||||||
Net expenses | 1.92 | % | 1.95 | % | 1.95 | % | 1.96 | % | 1.96 | % | ||||||||||
Net investment loss | (0.71 | )% | (0.69 | )% | (0.76 | )% | (0.64 | )% | (0.40 | )% | ||||||||||
Supplemental data | ||||||||||||||||||||
Portfolio turnover rate | 43 | % | 28 | % | 30 | % | 43 | % | 34 | % | ||||||||||
Net assets, end of period (000s omitted) | $2,268 | $3,739 | $31,381 | $33,057 | $34,721 | |||||||||||||||
| 1 | Calculated based upon average shares outstanding |
| 2 | Total return calculations do not include any sales charges. |
| 3 | During the year ended September 30, 2020, the Fund received a payment from an affiliate which had a 1.44% impact on the total return. See Note 4 in the Notes to Financial Statements for additional information. |
The accompanying notes are an integral part of these financial statements.
Wells Fargo Opportunity Fund | 19
Table of Contents
Financial highlights
(For a share outstanding throughout the period)
| Year ended | ||||
| CLASS R6 | September 30, 20201 | |||
Net asset value, beginning of period | $46.84 | |||
Net investment income | 0.04 | |||
Net realized and unrealized gains (losses) on investments | 4.95 | |||
|
| |||
Total from investment operations | 4.99 | |||
Net asset value, end of period | $51.83 | |||
Total return2 | 10.65 | % | ||
Ratios to average net assets (annualized) | ||||
Gross expenses | 0.76 | % | ||
Net expenses | 0.72 | % | ||
Net investment income | 0.25 | % | ||
Supplemental data | ||||
Portfolio turnover rate | 43 | % | ||
Net assets, end of period (000s omitted) | $28 | |||
| 1 | For the period from May 29, 2020 (commencement of class operations) to September 30, 2020 |
| 2 | Returns for periods of less than one year are not annualized. |
The accompanying notes are an integral part of these financial statements.
20 | Wells Fargo Opportunity Fund
Table of Contents
Financial highlights
(For a share outstanding throughout each period)
| Year ended September 30 | ||||||||||||||||||||
| ADMINISTRATOR CLASS | 2020 | 2019 | 2018 | 2017 | 2016 | |||||||||||||||
Net asset value, beginning of period | $47.85 | $50.50 | $49.45 | $44.93 | $46.11 | |||||||||||||||
Net investment income | 0.18 | 0.21 | 0.07 | 0.15 | 1 | 0.24 | 1 | |||||||||||||
Net realized and unrealized gains (losses) on investments | 5.30 | 1.73 | 6.97 | 7.09 | 5.04 | |||||||||||||||
|
|
|
|
|
|
|
|
|
| |||||||||||
Total from investment operations | 5.48 | 1.94 | 7.04 | 7.24 | 5.28 | |||||||||||||||
Distributions to shareholders from | ||||||||||||||||||||
Net investment income | (0.16 | ) | (0.01 | ) | (0.24 | ) | (0.18 | ) | (0.69 | ) | ||||||||||
Net realized gains | (2.49 | ) | (4.58 | ) | (5.75 | ) | (2.54 | ) | (5.77 | ) | ||||||||||
|
|
|
|
|
|
|
|
|
| |||||||||||
Total distributions to shareholders | (2.65 | ) | (4.59 | ) | (5.99 | ) | (2.72 | ) | (6.46 | ) | ||||||||||
Net asset value, end of period | $50.68 | $47.85 | $50.50 | $49.45 | $44.93 | |||||||||||||||
Total return | 11.85 | % | 5.37 | % | 15.38 | % | 16.74 | % | 12.68 | % | ||||||||||
Ratios to average net assets (annualized) | ||||||||||||||||||||
Gross expenses | 1.13 | % | 1.13 | % | 1.12 | % | 1.13 | % | 1.13 | % | ||||||||||
Net expenses | 0.97 | % | 1.00 | % | 1.00 | % | 1.00 | % | 1.00 | % | ||||||||||
Net investment income | 0.22 | % | 0.42 | % | 0.19 | % | 0.31 | % | 0.56 | % | ||||||||||
Supplemental data | ||||||||||||||||||||
Portfolio turnover rate | 43 | % | 28 | % | 30 | % | 43 | % | 34 | % | ||||||||||
Net assets, end of period (000s omitted) | $225,604 | $227,963 | $244,110 | $237,315 | $226,140 | |||||||||||||||
| 1 | Calculated based upon average shares outstanding |
The accompanying notes are an integral part of these financial statements.
Wells Fargo Opportunity Fund | 21
Table of Contents
Financial highlights
(For a share outstanding throughout each period)
| Year ended September 30 | ||||||||||||||||||||
| INSTITUTIONAL CLASS | 2020 | 2019 | 2018 | 2017 | 2016 | |||||||||||||||
Net asset value, beginning of period | $48.89 | $51.50 | $50.30 | $45.63 | $46.76 | |||||||||||||||
Net investment income | 0.34 | 0.35 | 0.22 | 0.22 | 1 | 0.35 | 1 | |||||||||||||
Net realized and unrealized gains (losses) on investments | 5.37 | 1.74 | 7.08 | 7.25 | 5.12 | |||||||||||||||
|
|
|
|
|
|
|
|
|
| |||||||||||
Total from investment operations | 5.71 | 2.09 | 7.30 | 7.47 | 5.47 | |||||||||||||||
Distributions to shareholders from | ||||||||||||||||||||
Net investment income | (0.28 | ) | (0.12 | ) | (0.35 | ) | (0.26 | ) | (0.83 | ) | ||||||||||
Net realized gains | (2.49 | ) | (4.58 | ) | (5.75 | ) | (2.54 | ) | (5.77 | ) | ||||||||||
|
|
|
|
|
|
|
|
|
| |||||||||||
Total distributions to shareholders | (2.77 | ) | (4.70 | ) | (6.10 | ) | (2.80 | ) | (6.60 | ) | ||||||||||
Net asset value, end of period | $51.83 | $48.89 | $51.50 | $50.30 | $45.63 | |||||||||||||||
Total return | 12.09 | % | 5.63 | % | 15.69 | % | 17.02 | % | 12.97 | % | ||||||||||
Ratios to average net assets (annualized) | ||||||||||||||||||||
Gross expenses | 0.88 | % | 0.88 | % | 0.87 | % | 0.88 | % | 0.88 | % | ||||||||||
Net expenses | 0.75 | % | 0.75 | % | 0.75 | % | 0.75 | % | 0.75 | % | ||||||||||
Net investment income | 0.44 | % | 0.66 | % | 0.44 | % | 0.47 | % | 0.79 | % | ||||||||||
Supplemental data | ||||||||||||||||||||
Portfolio turnover rate | 43 | % | 28 | % | 30 | % | 43 | % | 34 | % | ||||||||||
Net assets, end of period (000s omitted) | $24,710 | $26,447 | $29,562 | $29,709 | $17,222 | |||||||||||||||
| 1 | Calculated based upon average shares outstanding |
The accompanying notes are an integral part of these financial statements.
22 | Wells Fargo Opportunity Fund
Table of Contents
1. ORGANIZATION
Wells Fargo Funds Trust (the “Trust”), a Delaware statutory trust organized on March 10, 1999, is an open-end management investment company registered under the Investment Company Act of 1940, as amended (the “1940 Act”). As an investment company, the Trust follows the accounting and reporting guidance in Financial Accounting Standards Board (“FASB”) Accounting Standards Codification Topic 946, Financial Services – Investment Companies. These financial statements report on the Wells Fargo Opportunity Fund (the “Fund”) which is a diversified series of the Trust.
2. SIGNIFICANT ACCOUNTING POLICIES
The following significant accounting policies, which are consistently followed in the preparation of the financial statements of the Fund, are in conformity with U.S. generally accepted accounting principles which require management to make estimates and assumptions that affect the reported amounts of assets and liabilities, disclosure of contingent assets and liabilities at the date of the financial statements, and the reported amounts of revenues and expenses during the reporting period. Actual results could differ from those estimates.
Securities valuation
All investments are valued each business day as of the close of regular trading on the New York Stock Exchange (generally 4 p.m. Eastern Time), although the Fund may deviate from this calculation time under unusual or unexpected circumstances.
Equity securities that are listed on a foreign or domestic exchange or market are valued at the official closing price or, if none, the last sales price. If no sale occurs on the principal exchange or market that day, a fair value price will be determined in accordance with the Fund’s Valuation Procedures.
The values of securities denominated in foreign currencies are translated into U.S. dollars at rates provided by an independent foreign currency pricing source at a time each business day specified by the Wells Fargo Asset Management Pricing Committee at Wells Fargo Funds Management, LLC (“Funds Management”).
Many securities markets and exchanges outside the U.S. close prior to the close of the New York Stock Exchange and therefore may not fully reflect trading or events that occur after the close of the principal exchange in which the foreign securities are traded, but before the close of the New York Stock Exchange. If such trading or events are expected to materially affect the value of such securities, then fair value pricing procedures approved by the Board of Trustees of the Fund are applied. These procedures take into account multiple factors including movements in U.S. securities markets after foreign exchanges close. Foreign securities that are fair valued under these procedures are categorized as Level 2 and the application of these procedures may result in transfers between Level 1 and Level 2. Depending on market activity, such fair valuations may be frequent. Such fair value pricing may result in net asset values that are higher or lower than net asset values based on the last reported sales price or latest quoted bid price. On September 30, 2020, such fair value pricing was used in pricing certain foreign securities.
Investments in registered open-end investment companies are valued at net asset value. Interests in non-registered investment companies that are redeemable at net asset value are fair valued normally at net asset value.
Investments which are not valued using any of the methods discussed above are valued at their fair value, as determined in good faith by the Board of Trustees. The Board of Trustees has established a Valuation Committee comprised of the Trustees and has delegated to it the authority to take any actions regarding the valuation of portfolio securities that the Valuation Committee deems necessary or appropriate, including determining the fair value of portfolio securities, unless the determination has been delegated to the Wells Fargo Asset Management Pricing Committee. The Board of Trustees retains the authority to make or ratify any valuation decisions or approve any changes to the Valuation Procedures as it deems appropriate. On a quarterly basis, the Board of Trustees receives reports on any valuation actions taken by the Valuation Committee or the Wells Fargo Asset Management Pricing Committee which may include items for ratification.
Foreign currency translation
The accounting records of the Fund are maintained in U.S. dollars. The values of other assets and liabilities denominated in foreign currencies are translated into U.S. dollars at rates provided by an independent foreign currency pricing source at a time each business day specified by the Wells Fargo Asset Management Pricing Committee. Purchases and sales of securities, and income and expenses are converted at the rate of exchange on the respective dates of such transactions. Net realized foreign exchange gains or losses arise from sales of foreign currencies, currency gains or losses realized between the trade and settlement dates on securities transactions, and the difference between the amounts of dividends, interest and foreign withholding taxes recorded and the U.S. dollar equivalent of the amounts actually paid or received. Net unrealized foreign exchange gains and losses arise from changes in the fair value of assets and liabilities other than investments in securities resulting from changes in exchange rates. The changes in net assets arising from changes in exchange rates of securities and the changes in net assets resulting from changes in market prices of securities are not separately presented. Such changes are included in net realized and unrealized gains or losses from investments.
Wells Fargo Opportunity Fund | 23
Table of Contents
Notes to financial statements
Securities lending
The Fund may lend its securities from time to time in order to earn additional income in the form of fees or interest on securities received as collateral or the investment of any cash received as collateral. When securities are on loan, the Fund receives interest or dividends on those securities. Cash collateral received in connection with its securities lending transactions is invested in Securities Lending Cash Investments, LLC (the “Securities Lending Fund”). Investments in Securities Lending Fund are valued at the evaluated bid price provided by an independent pricing service. Income earned from investment in the Securities Lending Fund (net of fees and rebates), if any, is included in income from affiliated securities on the Statement of Operations.
In a securities lending transaction, the net asset value of the Fund is affected by an increase or decrease in the value of the securities loaned and by an increase or decrease in the value of the instrument in which collateral is invested. The amount of securities lending activity undertaken by the Fund fluctuates from time to time. The Fund has the right under the lending agreement to recover the securities from the borrower on demand. In the event of default or bankruptcy by the borrower, the Fund may be prevented from recovering the loaned securities or gaining access to the collateral or may experience delays or costs in doing so. In such an event, the terms of the agreement allow the unaffiliated securities lending agent to use the collateral to purchase replacement securities on behalf of the Fund or pay the Fund the market value of the loaned securities. The Fund bears the risk of loss with respect to depreciation of its investment of the cash collateral.
Security transactions and income recognition
Securities transactions are recorded on a trade date basis. Realized gains or losses are recorded on the basis of identified cost.
Dividend income is recognized on the ex-dividend date, except for certain dividends from foreign securities, which are recorded as soon as the custodian verifies the ex-dividend date. Dividend income from foreign securities is recorded net of foreign taxes withheld where recovery of such taxes is not assured.
Distributions to shareholders
Distributions to shareholders from net investment income and any net realized gains are recorded on the ex-dividend date and paid at least annually. Such distributions are determined in accordance with income tax regulations and may differ from U.S. generally accepted accounting principles. Dividend sources are estimated at the time of declaration. The tax character of distributions is determined as of the Fund’s fiscal year end. Therefore, a portion of the Fund’s distributions made prior to the Fund’s fiscal year end may be categorized as a tax return of capital at year end.
Federal and other taxes
The Fund intends to continue to qualify as a regulated investment company by distributing substantially all of its investment company taxable income and any net realized capital gains (after reduction for capital loss carryforwards) sufficient to relieve it from all, or substantially all, federal income taxes. Accordingly, no provision for federal income taxes was required.
The Fund’s income and federal excise tax returns and all financial records supporting those returns for the prior three fiscal years are subject to examination by the federal and Delaware revenue authorities. Management has analyzed the Fund’s tax positions taken on federal, state, and foreign tax returns for all open tax years and does not believe that there are any uncertain tax positions that require recognition of a tax liability.
As of September 30, 2020, the aggregate cost of all investments for federal income tax purposes was $1,112,147,686 and the unrealized gains (losses) consisted of:
Gross unrealized gains | $ | 649,593,665 | ||
Gross unrealized losses | (54,689,330 | ) | ||
Net unrealized gains | $ | 594,904,335 | ||
Class allocations
The separate classes of shares offered by the Fund differ principally in applicable sales charges, distribution, shareholder servicing, and administration fees. Class specific expenses are charged directly to that share class. Investment income, common fund-level expenses, and realized and unrealized gains (losses) on investments are allocated daily to each class of shares based on the relative proportion of net assets of each class.
3. FAIR VALUATION MEASUREMENTS
Fair value measurements of investments are determined within a framework that has established a fair value hierarchy based upon the various data inputs utilized in determining the value of the Fund’s investments. The three-level hierarchy gives the highest priority to unadjusted quoted prices in active markets for identical assets or liabilities (Level 1) and the lowest priority to
24 | Wells Fargo Opportunity Fund
Table of Contents
Notes to financial statements
unobservable inputs (Level 3). The Fund’s investments are classified within the fair value hierarchy based on the lowest level of input that is significant to the fair value measurement. The inputs are summarized into three broad levels as follows:
| ∎ | Level 1 – quoted prices in active markets for identical securities |
| ∎ | Level 2 – other significant observable inputs (including quoted prices for similar securities, interest rates, prepayment speeds, credit risk, etc.) |
| ∎ | Level 3 – significant unobservable inputs (including the Fund’s own assumptions in determining the fair value of investments) |
The inputs or methodologies used for valuing investments in securities are not necessarily an indication of the risk associated with investing in those securities.
The following is a summary of the inputs used in valuing the Fund’s assets and liabilities as of September 30, 2020:
| Quoted prices (Level 1) | Other significant observable inputs (Level 2) | Significant (Level 3) | Total | |||||||||||||
Assets | ||||||||||||||||
Investments in: | ||||||||||||||||
Common stocks | ||||||||||||||||
Communication services | $ | 144,673,056 | $ | 0 | $ | 0 | $ | 144,673,056 | ||||||||
Consumer discretionary | 172,929,976 | 0 | 0 | 172,929,976 | ||||||||||||
Consumer staples | 44,666,088 | 0 | 0 | 44,666,088 | ||||||||||||
Financials | 157,051,199 | 0 | 0 | 157,051,199 | ||||||||||||
Health care | 281,161,812 | 0 | 0 | 281,161,812 | ||||||||||||
Industrials | 245,343,956 | 20,677,566 | 0 | 266,021,522 | ||||||||||||
Information technology | 452,395,263 | 0 | 0 | 452,395,263 | ||||||||||||
Materials | 54,677,296 | 0 | 0 | 54,677,296 | ||||||||||||
Real estate | 110,760,341 | 0 | 0 | 110,760,341 | ||||||||||||
Short-term investments | ||||||||||||||||
Investment companies | 22,715,468 | 0 | 0 | 22,715,468 | ||||||||||||
Total assets | $ | 1,686,374,455 | $ | 20,677,566 | $ | 0 | $ | 1,707,052,021 | ||||||||
Additional sector, industry or geographic detail is included in the Portfolio of Investments.
For the year ended September 30, 2020, the Fund did not have any transfers into/out of Level 3.
4. TRANSACTIONS WITH AFFILIATES
Management fee
Funds Management, an indirect wholly owned subsidiary of Wells Fargo & Company (“Wells Fargo”), is the manager of the Fund and provides advisory and fund-level administrative services under an investment management agreement. Under the investment management agreement, Funds Management is responsible for, among other services, implementing the investment objectives and strategies of the Fund, supervising the subadviser and providing fund-level administrative services in connection with the Fund’s operations. As compensation for its services under the investment management agreement, Funds Management is entitled to receive a management fee at the following annual rate based on the Fund’s average daily net assets:
| Average daily net assets | Management fee | |||
First $500 million | 0.750 | % | ||
Next $500 million | 0.725 | |||
Next $1 billion | 0.700 | |||
Next $2 billion | 0.675 | |||
Next $1 billion | 0.650 | |||
Next $5 billion | 0.640 | |||
Next $2 billion | 0.630 | |||
Next $4 billion | 0.620 | |||
Over $16 billion | 0.610 | |||
Wells Fargo Opportunity Fund | 25
Table of Contents
Notes to financial statements
For the year ended September 30, 2020, the management fee was equivalent to an annual rate of 0.72% of the Fund’s average daily net assets.
Funds Management has retained the services of a subadviser to provide daily portfolio management to the Fund. The fee for subadvisory services is borne by Funds Management. Wells Capital Management Incorporated (“WellsCap”), an affiliate of Funds Management and an indirect wholly owned subsidiary of Wells Fargo, is the subadviser to the Fund and is entitled to receive a fee from Funds Management at an annual rate starting at 0.45% and declining to 0.30% as the average daily net assets of the Fund increase.
Administration fees
Under a class-level administration agreement, Funds Management provides class-level administrative services to the Fund, which includes paying fees and expenses for services provided by the transfer agent, sub-transfer agents, omnibus account servicers and record-keepers. As compensation for its services under the class-level administration agreement, Funds Management receives an annual fee which is calculated based on the average daily net assets of each class as follows:
| Class-level administration fee | ||||
Class A, Class C | 0.21 | % | ||
Class R6 | 0.03 | |||
Administrator Class, Institutional Class | 0.13 | |||
Waivers and/or expense reimbursements
Funds Management has contractually waived and/or reimbursed management and administration fees to the extent necessary to maintain certain net operating expense ratios for the Fund. When each class of the Fund has exceeded its expense cap, Funds Management has waived fees and/or reimbursed expenses from fund-level expenses on a proportionate basis and then from class specific expenses. When only certain classes exceed their expense caps, waivers and/or reimbursements are applied against class specific expenses before fund-level expenses. Funds Management has committed through January 31, 2021 (January 31, 2022 for Class R6) to waive fees and/or reimburse expenses to the extent necessary to cap the Fund’s expenses at 1.18% for Class A shares, 1.93% for Class C shares, 0.72% for Class R6 shares, 1.00% for Administrator Class shares, and 0.75% for Institutional Class shares. Prior to or after the commitment expiration date, the cap may be increased or the commitment to maintain the cap may be terminated only with the approval of the Board of Trustees. Prior to or after the commitment expiration date, the cap may be increased or the commitment to maintain the cap may be terminated only with the approval of the Board of Trustees.
Distribution fee
The Trust has adopted a distribution plan for Class C shares of the Fund pursuant to Rule 12b-1 under the 1940 Act. A distribution fee is charged to Class C shares and paid to Wells Fargo Funds Distributor, LLC (“Funds Distributor”), the principal underwriter, at an annual rate of 0.75% of the average daily net assets of Class C shares.
In addition, Funds Distributor is entitled to receive the front-end sales charge from the purchase of Class A shares and a contingent deferred sales charge on the redemption of certain Class A shares. Funds Distributor is also entitled to receive the contingent deferred sales charges from redemptions of Class C shares. For the year ended September 30, 2020, Funds Distributor received $3,907 from the sale of Class A shares and $52 and $63 in contingent deferred sales charges from redemptions of Class A and Class C shares, respectively.
Shareholder servicing fees
The Trust has entered into contracts with one or more shareholder servicing agents, whereby Class A, Class C, and Administrator Class of the Fund are charged a fee at an annual rate of 0.25% of the average daily net assets of each respective class. A portion of these total shareholder servicing fees were paid to affiliates of Wells Fargo.
Interfund transactions
The Fund may purchase or sell portfolio investment securities to certain other Wells Fargo affiliates pursuant to Rule 17a-7 under the 1940 Act and under procedures adopted by the Board of Trustees. The procedures have been designed to ensure that these interfund transactions, which do not incur broker commissions, are effected at current market prices.
Other transactions
On August 14, 2020, Class A and Class C of the Fund were reimbursed by Funds Management in the amount of $5,051 and $29,084, respectively. The reimbursements were made in connection with resolving certain fee reimbursements.
26 | Wells Fargo Opportunity Fund
Table of Contents
Notes to financial statements
5. INVESTMENT PORTFOLIO TRANSACTIONS
Purchases and sales of investments, excluding U.S. government obligations (if any) and short-term securities, for the year ended September 30, 2020 were $698,870,699 and $897,000,123, respectively.
6. SECURITIES LENDING TRANSACTIONS
The Fund lends its securities through an unaffiliated securities lending agent and receives collateral in the form of cash or securities with a value at least equal to the value of the securities on loan. The value of the loaned securities is determined at the close of each business day and any increases or decreases in the required collateral are exchanged between the Fund and the counterparty on the next business day. Cash collateral received is invested in the Securities Lending Fund which seeks to provide a positive return compared to the daily Federal Funds Open Rate by investing in high-quality, U.S. dollar-denominated short-term money market instruments and is exempt from registration under Section 3(c)(7) of the 1940 Act. Securities Lending Fund is managed by Funds Management and is subadvised by WellsCap. Funds Management receives an advisory fee starting at 0.05% and declining to 0.01% as the average daily net assets of the Securities Lending Fund increase. All of the fees received by Funds Management are paid to WellsCap for its services as subadviser.
In the event of counterparty default or the failure of a borrower to return a loaned security, the Fund has the right to use the collateral to offset any losses incurred. As of September 30, 2020, the Fund did not have any securities on loan.
7. BANK BORROWINGS
The Trust (excluding the money market funds), Wells Fargo Master Trust and Wells Fargo Variable Trust are parties to a $350,000,000 revolving credit agreement whereby the Fund is permitted to use bank borrowings for temporary or emergency purposes, such as to fund shareholder redemption requests. Interest under the credit agreement is charged to the Fund based on a borrowing rate equal to the higher of the Federal Funds rate in effect on that day plus 1.25% or the overnight LIBOR rate in effect on that day plus 1.25%. In addition, an annual commitment fee equal to 0.25% of the unused balance is allocated to each participating fund.
For the year ended September 30, 2020, there were no borrowings by the Fund under the agreement.
8. DISTRIBUTIONS TO SHAREHOLDERS
The tax character of distributions paid during the years ended September 30, 2020 and September 30, 2019 were as follows:
| Year ended September 30 | ||||||||
| 2020 | 2019 | |||||||
Ordinary income | $ | 11,352,682 | $ | 20,040,871 | ||||
Long-term capital gain | 88,290,813 | 156,360,872 | ||||||
As of September 30, 2020, the components of distributable earnings on a tax basis were as follows:
| Undistributed ordinary income | Undistributed long-term gain | Unrealized | ||
| $1,084,056 | $111,209,866 | $594,904,335 | ||
9. CONCENTRATION RISK
Concentration risks result from exposure to a limited number of sectors. As of the end of the period, the Fund invested a concentration of its portfolio in the information technology sector. A fund that invests a substantial portion of its assets in any sector may be more affected by changes in that sector than would be a fund whose investments are not heavily weighted in any sector.
10. INDEMNIFICATION
Under the Fund’s organizational documents, the officers and Trustees have been granted certain indemnification rights against certain liabilities that may arise out of performance of their duties to the Fund. The Fund has entered into a separate agreement with each Trustee that converts indemnification rights currently existing under the Fund’s organizational documents into contractual rights that cannot be changed in the future without the consent of the Trustee. Additionally, in the normal course of business, the Fund may enter into contracts with service providers that contain a variety of indemnification clauses. The Fund’s maximum exposure under these arrangements is dependent on future claims that may be made against the Fund and, therefore, cannot be estimated.
Wells Fargo Opportunity Fund | 27
Table of Contents
Notes to financial statements
11. NEW ACCOUNTING PRONOUNCEMENT
In August 2018, FASB issued Accounting Standards Update (“ASU”) No. 2018-13, Fair Value Measurement (Topic 820) Disclosure Framework—Changes to the Disclosure Requirements for Fair Value Measurement. ASU 2018-13 updates the disclosure requirements on fair value measurements in Topic 820, Fair Value Measurements. The amendments are effective for fiscal years, and interim periods within those fiscal years, beginning after December 15, 2019. Management has adopted this guidance which did not have a material impact on the financial statements.
12. CORONAVIRUS (COVID-19) PANDEMIC
On March 11, 2020, the World Health Organization announced that it had made the assessment that coronavirus disease 2019 (“COVID-19”) is a pandemic. The impacts of COVID-19 are adversely affecting the entire global economy, individual companies and investment products, and the market in general. There is significant uncertainty around the extent and duration of business disruptions related to COVID-19 and the impacts may be short term or may last for an extended period of time. The risk of further spreading of COVID-19 has led to significant uncertainty and volatility in the financial markets.
28 | Wells Fargo Opportunity Fund
Table of Contents
Report of independent registered public accounting firm
To the Shareholders of the Fund and Board of Trustees
Wells Fargo Funds Trust:
Opinion on the Financial Statements
We have audited the accompanying statement of assets and liabilities of Wells Fargo Opportunity Fund (the Fund), one of the funds constituting Wells Fargo Funds Trust, including the portfolio of investments, as of September 30, 2020, the related statement of operations for the year then ended, the statements of changes in net assets for each of the years in the two-year period then ended, and the related notes (collectively, the financial statements) and the financial highlights for each of the years or periods in the five-year period then ended. In our opinion, the financial statements and financial highlights present fairly, in all material respects, the financial position of the Fund as of September 30, 2020, the results of its operations for the year then ended, the changes in its net assets for each of the years in the two-year period then ended, and the financial highlights for each of the years or periods in the five-year period then ended, in conformity with U.S. generally accepted accounting principles.
Basis for Opinion
These financial statements and financial highlights are the responsibility of the Fund’s management. Our responsibility is to express an opinion on these financial statements and financial highlights based on our audits. We are a public accounting firm registered with the Public Company Accounting Oversight Board (United States) (PCAOB) and are required to be independent with respect to the Fund in accordance with the U.S. federal securities laws and the applicable rules and regulations of the Securities and Exchange Commission and the PCAOB.
We conducted our audits in accordance with the standards of the PCAOB. Those standards require that we plan and perform the audit to obtain reasonable assurance about whether the financial statements and financial highlights are free of material misstatement, whether due to error or fraud. Our audits included performing procedures to assess the risks of material misstatement of the financial statements and financial highlights, whether due to error or fraud, and performing procedures that respond to those risks. Such procedures included examining, on a test basis, evidence regarding the amounts and disclosures in the financial statements and financial highlights. Such procedures also included confirmation of securities owned as of September 30, 2020, by correspondence with the custodian, transfer agent and brokers, or by other appropriate auditing procedures. Our audits also included evaluating the accounting principles used and significant estimates made by management, as well as evaluating the overall presentation of the financial statements and financial highlights. We believe that our audits provide a reasonable basis for our opinion.

We have not been able to determine the specific year that we began serving as the auditor of one or more Wells Fargo Funds investment companies; however we are aware that we have served as the auditor of one or more Wells Fargo Funds investment companies since at least 1955.
Boston, Massachusetts
November 24, 2020
Wells Fargo Opportunity Fund | 29
Table of Contents
TAX INFORMATION
For corporate shareholders, pursuant to Section 854 of the Internal Revenue Code, 100% of ordinary income dividends qualify for the corporate dividends-received deduction for the fiscal year ended September 30, 2020.
Pursuant to Section 852 of the Internal Revenue Code, $88,290,813 was designated as a 20% rate gain distribution for the fiscal year ended September 30, 2020.
Pursuant to Section 854 of the Internal Revenue Code, $11,352,682 of income dividends paid during the fiscal year ended September 30, 2020 has been designated as qualified dividend income (QDI).
For the fiscal year ended September 30, 2020, $115,335 has been designated as interest-related dividends for nonresident alien shareholders pursuant to Section 871 of the Internal Revenue Code.
For the fiscal year ended September 30, 2020, $7,080,567 has been designated as short-term capital gain dividends for nonresident alien shareholders pursuant to Section 871 of the Internal Revenue Code.
PROXY VOTING INFORMATION
A description of the policies and procedures used to determine how to vote proxies relating to portfolio securities is available, upon request, by calling 1-800-222-8222, visiting our website at wfam.com, or visiting the SEC website at sec.gov. Information regarding how the proxies related to portfolio securities were voted during the most recent 12-month period ended June 30 is available on the website at wfam.com or by visiting the SEC website at sec.gov.
QUARTERLY PORTFOLIO HOLDINGS INFORMATION
The Fund files its complete schedule of portfolio holdings with the SEC for the first and third quarters of each fiscal year as an exhibit to its reports on Form N-PORT. Shareholders may view the filed Form N-PORT by visiting the SEC website at sec.gov.
30 | Wells Fargo Opportunity Fund
Table of Contents
Other information (unaudited)
BOARD OF TRUSTEES AND OFFICERS
Each of the Trustees and Officers1 listed in the table below acts in identical capacities for each fund in the Wells Fargo family of funds, which consists of 142 mutual funds comprising the Wells Fargo Funds Trust, Wells Fargo Variable Trust, Wells Fargo Master Trust and four closed-end funds (collectively the “Fund Complex”). This table should be read in conjunction with the Prospectus and the Statement of Additional Information2. The mailing address of each Trustee and Officer is 525 Market Street, 12th Floor, San Francisco, CA 94105. Each Trustee and Officer serves an indefinite term, however, each Trustee serves such term until reaching the mandatory retirement age established by the Trustees.
Independent Trustees
| Name and year of birth | Position held and length of service* | Principal occupations during past five years or longer | Current other public company or investment company directorships | |||
| William R. Ebsworth (Born 1957) | Trustee, since 2015 | Retired. From 1984 to 2013, equities analyst, portfolio manager, research director and chief investment officer at Fidelity Management and Research Company in Boston, Tokyo, and Hong Kong, and retired in 2013 as Chief Investment Officer of Fidelity Strategic Advisers, Inc. where he led a team of investment professionals managing client assets. Prior thereto, Board member of Hong Kong Securities Clearing Co., Hong Kong Options Clearing Corp., the Thailand International Fund, Ltd., Fidelity Investments Life Insurance Company, and Empire Fidelity Investments Life Insurance Company. Audit Committee Chair and Investment Committee Chair of the Vincent Memorial Hospital Endowment (non-profit organization). Mr. Ebsworth is a CFA® charterholder. | N/A | |||
| Jane A. Freeman (Born 1953) | Trustee, since 2015; Chair Liaison, since 2018 | Retired. From 2012 to 2014 and 1999 to 2008, Chief Financial Officer of Scientific Learning Corporation. From 2008 to 2012, Ms. Freeman provided consulting services related to strategic business projects. Prior to 1999, Portfolio Manager at Rockefeller & Co. and Scudder, Stevens & Clark. Board member of the Harding Loevner Funds from 1996 to 2014, serving as both Lead Independent Director and chair of the Audit Committee. Board member of the Russell Exchange Traded Funds Trust from 2011 to 2012 and the chair of the Audit Committee. Ms. Freeman is also an inactive Chartered Financial Analyst. | N/A | |||
| Isaiah Harris, Jr. (Born 1952) | Trustee, since 2009; Audit Committee Chairman, since 2019 | Retired. Chairman of the Board of CIGNA Corporation since 2009, and Director since 2005. From 2003 to 2011, Director of Deluxe Corporation. Prior thereto, President and CEO of BellSouth Advertising and Publishing Corp. from 2005 to 2007, President and CEO of BellSouth Enterprises from 2004 to 2005 and President of BellSouth Consumer Services from 2000 to 2003. Emeritus member of the Iowa State University Foundation Board of Governors. Emeritus Member of the Advisory Board of Iowa State University School of Business. Advisory Board Member, Palm Harbor Academy (private school). Mr. Harris is a certified public accountant (inactive status). | CIGNA Corporation | |||
| Judith M. Johnson (Born 1949) | Trustee, since 2008 | Retired. Prior thereto, Chief Executive Officer and Chief Investment Officer of Minneapolis Employees Retirement Fund from 1996 to 2008. Ms. Johnson is an attorney, certified public accountant and a certified managerial accountant. | N/A | |||
| David F. Larcker (Born 1950) | Trustee, since 2009 | James Irvin Miller Professor of Accounting at the Graduate School of Business (Emeritus), Stanford University, Director of the Corporate Governance Research Initiative and Senior Faculty of The Rock Center for Corporate Governance since 2006. From 2005 to 2008, Professor of Accounting at the Graduate School of Business, Stanford University. Prior thereto, Ernst & Young Professor of Accounting at The Wharton School, University of Pennsylvania from 1985 to 2005. | N/A | |||
Wells Fargo Opportunity Fund | 31
Table of Contents
Other information (unaudited)
| Name and year of birth | Position held and length of service* | Principal occupations during past five years or longer | Current other public company or investment company directorships | |||
| Olivia S. Mitchell (Born 1953) | Trustee, since 2006; Nominating and Governance Committee Chair, since 2018 | International Foundation of Employee Benefit Plans Professor, Wharton School of the University of Pennsylvania since 1993. Director of Wharton’s Pension Research Council and Boettner Center on Pensions & Retirement Research, and Research Associate at the National Bureau of Economic Research. Previously, Cornell University Professor from 1978 to 1993. | N/A | |||
| Timothy J. Penny (Born 1951) | Trustee, since 1996; Chairman, since 2018 | President and Chief Executive Officer of Southern Minnesota Initiative Foundation, a non-profit organization, since 2007. Member of the Board of Trustees of NorthStar Education Finance, Inc., a non-profit organization, since 2007. | N/A | |||
| James G. Polisson (Born 1959) | Trustee, since 2018 | Retired. Chief Marketing Officer, Source (ETF) UK Services, Ltd, from 2015 to 2017. From 2012 to 2015, Principal of The Polisson Group, LLC, a management consulting, corporate advisory and principal investing company. Chief Executive Officer and Managing Director at Russell Investments, Global Exchange Traded Funds from 2010 to 2012. Managing Director of Barclays Global Investors from 1998 to 2010 and Global Chief Marketing Officer for iShares and Barclays Global Investors from 2000 to 2010. Trustee of the San Francisco Mechanics’ Institute, a non-profit organization, from 2013 to 2015. Board member of the Russell Exchange Traded Fund Trust from 2011 to 2012. Director of Barclays Global Investors Holdings Deutschland GmbH from 2006 to 2009. Mr. Polisson is an attorney and has a retired status with the Massachusetts and District of Columbia Bar Associations. | N/A | |||
| Pamela Wheelock (Born 1959) | Trustee, since January 2020; previously Trustee from January 2018 to July 2019 | Board member of the Destination Medical Center Economic Development Agency, Rochester, Minnesota since 2019. Interim President of the McKnight Foundation from January to September 2020. Acting Commissioner, Minnesota Department of Human Services, July 2019 through September 2019. Human Services Manager (part-time), Minnesota Department of Human Services, October 2019 through December 2019. Chief Operating Officer, Twin Cities Habitat for Humanity from 2017 to 2019. Vice President of University Services, University of Minnesota from 2012 to 2016. Prior thereto, on the Board of Directors, Governance Committee and Finance Committee for the Minnesota Philanthropy Partners (Saint Paul Foundation) from 2012 to 2018, Interim Chief Executive Officer of Blue Cross Blue Shield of Minnesota from 2011 to 2012, Chairman of the Board from 2009 to 2012 and Board Director from 2003 to 2015. Vice President, Leadership and Community Engagement, Bush Foundation, Saint Paul, Minnesota (a private foundation) from 2009 to 2011. Executive Vice President and Chief Financial Officer, Minnesota Sports and Entertainment from 2004 to 2009 and Senior Vice President from 2002 to 2004. Executive Vice President of the Minnesota Wild Foundation from 2004 to 2008. Commissioner of Finance, State of Minnesota, from 1999 to 2002. Currently Board Chair of the Minnesota Wild Foundation since 2010. | N/A | |||
| * | Length of service dates reflect the Trustee’s commencement of service with the Trust’s predecessor entities, where applicable. |
32 | Wells Fargo Opportunity Fund
Table of Contents
Other information (unaudited)
Officers
| Name and year of birth | Position held and length of service | Principal occupations during past five years or longer | ||
| Andrew Owen (Born 1960) | President, since 2017 | Executive Vice President of Wells Fargo & Company and Head of Affiliated Managers, Wells Fargo Asset Management, since 2014. In addition, Mr. Owen is currently President, Chief Executive Officer and Director of Wells Fargo Funds Management, LLC since 2017. Prior thereto, Executive Vice President responsible for marketing, investments and product development for Wells Fargo Funds Management, LLC, from 2009 to 2014. | ||
| Nancy Wiser1 (Born 1967) | Treasurer, since 2012 | Executive Vice President of Wells Fargo Funds Management, LLC since 2011. Chief Operating Officer and Chief Compliance Officer at LightBox Capital Management LLC, from 2008 to 2011. | ||
| Michelle Rhee (Born 1966) | Chief Legal Officer, since 2019 | Secretary of Wells Fargo Funds Management, LLC, Chief Legal Counsel of Wells Fargo Asset Management and Assistant General Counsel of Wells Fargo Bank, N.A. since 2018. Associate General Counsel and Managing Director of Bank of America Corporation from 2004 to 2018. | ||
| Catherine Kennedy (Born 1969) | Secretary, since 2019 | Vice President of Wells Fargo Funds Management, LLC and Senior Counsel of the Wells Fargo Legal Department since 2010. Vice President and Senior Counsel of Evergreen Investment Management Company, LLC from 1998 to 2010. | ||
| Michael H. Whitaker (Born 1967) | Chief Compliance Officer, since 2016 | Chief Compliance Officer of Wells Fargo Asset Management since 2016. Senior Vice President and Chief Compliance Officer for Fidelity Investments from 2007 to 2016. | ||
Jeremy DePalma1 (Born 1974) | Assistant Treasurer, since 2009 | Senior Vice President of Wells Fargo Funds Management, LLC since 2009. Senior Vice President of Evergreen Investment Management Company, LLC from 2008 to 2010 and head of the Fund Reporting and Control Team within Fund Administration from 2005 to 2010. | ||
| 1 | Nancy Wiser acts as Treasurer of 65 funds in the Fund Complex. Jeremy DePalma acts as the Treasurer of 77 funds and Assistant Treasurer of 65 funds in the Fund Complex. |
| 2 | The Statement of Additional Information includes additional information about the Trustees and is available, without charge, upon request, by calling 1-800-222-8222 or by visiting the website at wfam.com. |
Wells Fargo Opportunity Fund | 33
Table of Contents
Other information (unaudited)
BOARD CONSIDERATION OF INVESTMENT MANAGEMENT AND SUB-ADVISORY AGREEMENTS:
Wells Fargo Opportunity Fund
Under the Investment Company Act of 1940 (the “1940 Act”), the Board of Trustees (the “Board”) of Wells Fargo Funds Trust (the “Trust”) must determine annually whether to approve the continuation of the Trust’s investment management and sub-advisory agreements. In this regard, at a Board meeting held on May 26, 2020 and May 28, 2020 (together, the “Meeting”), the Board, all the members of which have no direct or indirect interest in the investment management and sub-advisory agreements and are not “interested persons” of the Trust, as defined in the 1940 Act (the “Independent Trustees”), reviewed and approved for Wells Fargo Opportunity Fund (the “Fund”): (i) an investment management agreement (the “Management Agreement”) with Wells Fargo Funds Management, LLC (“Funds Management”); and (ii) an investment sub-advisory agreement (the “Sub-Advisory Agreement”) with Wells Capital Management Incorporated (the “Sub-Adviser”), an affiliate of Funds Management. The Management Agreement and the Sub-Advisory Agreement are collectively referred to as the “Advisory Agreements.”
At the Meeting, the Board considered the factors and reached the conclusions described below relating to the selection of Funds Management and the Sub-Adviser and the approval of the Advisory Agreements. Prior to the Meeting, including at a Board meeting held in April 2020, the Trustees conferred extensively among themselves and with representatives of Funds Management about these matters. Also, the Board has adopted a team-based approach, with each team consisting of a sub-set of Trustees, to assist the full Board in the discharge of its duties in reviewing investment performance and other matters throughout the year. The Independent Trustees were assisted in their evaluation of the Advisory Agreements by independent legal counsel, from whom they received separate legal advice and with whom they met separately.
In providing information to the Board, Funds Management and the Sub-Adviser were guided by a detailed set of requests for information submitted to them by independent legal counsel on behalf of the Independent Trustees at the start of the Board’s annual contract renewal process earlier in 2020. In considering and approving the Advisory Agreements, the Trustees considered the information they believed relevant, including but not limited to the information discussed below. The Board considered not only the specific information presented in connection with the Meeting, but also the knowledge gained over time through interaction with Funds Management and the Sub-Adviser about various topics. In this regard, the Board reviewed reports of Funds Management at each of its quarterly meetings, which included, among other things, portfolio reviews and investment performance reports. In addition, the Board and the teams mentioned above confer with portfolio managers at various times throughout the year. The Board did not identify any particular information or consideration that was all-important or controlling, and each individual Trustee may have attributed different weights to various factors.
After its deliberations, the Board unanimously approved the continuation of the Advisory Agreements for a one-year term and determined that the compensation payable to Funds Management and the Sub-Adviser under each of the Advisory Agreements was reasonable. The Board considered the approval of the Advisory Agreements for the Fund as part of its consideration of agreements for funds across the complex, but its approvals were made on a fund-by-fund basis. The following summarizes a number of important, but not necessarily all, factors considered by the Board in support of its approvals.
Nature, extent and quality of services
The Board received and considered various information regarding the nature, extent and quality of services provided to the Fund by Funds Management and the Sub-Adviser under the Advisory Agreements. This information included a description of the investment advisory services and Fund-level administrative services covered by the Management Agreement, as well as, among other things, a summary of the background and experience of senior management of Wells Fargo Asset Management (“WFAM”), of which Funds Management and the Sub-Adviser are a part, and a summary of investments made in the business of WFAM. The Board also received a description of Funds Management’s and the Sub-Adviser’s business continuity plans and of their approaches to data privacy and cybersecurity, and related testing. The Board also received and reviewed information about Funds Management’s role as administrator of the Fund’s liquidity risk management program, Funds Management’s approach to risk management, and Funds Management’s intermediary and vendor oversight program.
The Board also considered the qualifications, background, tenure and responsibilities of each of the portfolio managers primarily responsible for the day-to-day portfolio management of the Fund. The Board evaluated the ability of Funds Management and the Sub-Adviser to attract and retain qualified investment professionals, including research, advisory and supervisory personnel. The Board further considered the compliance programs and compliance records of Funds Management and the Sub-Adviser. In addition, the Board took into account the full range of services provided to the Fund by Funds Management and its affiliates.
34 | Wells Fargo Opportunity Fund
Table of Contents
Other information (unaudited)
Fund investment performance and expenses
The Board considered the investment performance results for the Fund over various time periods ended December 31, 2019. The Board also considered more current results for various time periods ended March 31, 2020. The Board considered these results in comparison to the investment performance of funds in a universe that was determined by Broadridge Inc. (“Broadridge”) to be similar to the Fund (the “Universe”), and in comparison to the Fund’s benchmark index and to other comparative data. Broadridge is an independent provider of investment company data. The Board received a description of the methodology used by Broadridge to select the mutual funds in the performance Universe. The Board noted that the investment performance of the Fund (Administrator Class) was higher than the average investment performance of the Universe for the one-, three-, five- and ten-year periods ended December 31, 2019. The Board also noted that the investment performance of the Fund (Administrator Class) was higher than the average investment performance of the Universe for all periods ended March 31, 2020. The Board also noted that the investment performance of the Fund was lower than its benchmark index, the Russell 3000® Index, for the three-, five- and ten-year periods ended December 31, 2019, and higher than its benchmark for the one-year period ended December 31, 2019. The Board also noted that the investment performance of the Fund was lower than its benchmark index, the Russell 3000® Index, for all periods ended March 31, 2020.
The Board also received and considered information regarding the Fund’s net operating expense ratios and their various components, including actual management fees, custodian and other non-management fees, and Rule 12b-1 and non-Rule 12b-1 shareholder service fees. The Board considered these ratios in comparison to the median ratios of funds in class-specific expense groups that were determined by Broadridge to be similar to the Fund (the “Groups”). The Board received a description of the methodology used by Broadridge to select the mutual funds in the expense Groups and an explanation of how funds comprising expense groups and their expense ratios may vary from year-to-year. Based on the Broadridge reports, the Board noted that the net operating expense ratios of the Fund were lower than, equal to, or in range of the median net operating expense ratios of the expense Groups for each share class.
The Board took into account the Fund’s investment performance and expense information provided to it among the factors considered in deciding to re-approve the Advisory Agreements.
Investment management and sub-advisory fee rates
The Board reviewed and considered the contractual fee rates payable by the Fund to Funds Management under the Management Agreement, as well as the contractual fee rates payable by the Fund to Funds Management for class-level administrative services under a Class-Level Administration Agreement, which include, among other things, class-level transfer agency and sub-transfer agency costs (collectively, the “Management Rates”). The Board also reviewed and considered the contractual investment sub-advisory fee rates that are payable by Funds Management to the Sub-Adviser for investment sub-advisory services.
Among other information reviewed by the Board was a comparison of the Fund’s Management Rates with the average contractual investment management fee rates of funds in the expense Groups at a common asset level as well as transfer agency costs of the funds in the expense Groups. The Board noted that the Management Rates of the Fund were in range of the sum of these average rates for the Fund’s expense Groups for all share classes, except the Institutional Class. The Board noted that the Management Rates of the Fund was higher than the sum of these average rates for the Fund’s expense Groups for the Institutional Class. However, the Board also noted that the net operating expense ratios of the Fund were lower than, equal to, or in range of the median net operating expense ratios of the expense Groups for each share class.
The Board also received and considered information about the portion of the total management fee that was retained by Funds Management after payment of the fee to the Sub-Adviser for sub-advisory services. In assessing the reasonableness of this amount, the Board received and evaluated information about the nature and extent of responsibilities retained and risks assumed by Funds Management and not delegated to or assumed by the Sub-Adviser, and about Funds Management’s on-going oversight services. Given the affiliation between Funds Management and the Sub-Adviser, the Board ascribed limited relevance to the allocation of fees between them.
The Board also received and considered information about the nature and extent of services offered and fee rates charged by Funds Management and the Sub-Adviser to other types of clients with investment strategies similar to those of the Fund. In this regard, the Board received information about the significantly greater scope of services, and compliance, reporting and other legal burdens and risks of managing proprietary mutual funds compared with those associated with managing assets of other types of clients, including third-party sub-advised fund clients and non-mutual fund clients such as institutional separate accounts.
Based on its consideration of the factors and information it deemed relevant, including those described here, the Board determined that the compensation payable to Funds Management under the Management Agreement and to the Sub-Adviser under the Sub-Advisory Agreement was reasonable.
Wells Fargo Opportunity Fund | 35
Table of Contents
Other information (unaudited)
Profitability
The Board received and considered information concerning the profitability of Funds Management, as well as the profitability of both WFAM and Wells Fargo & Co. (“Wells Fargo”) from providing services to the fund family as a whole. The Board noted that the Sub-Adviser’s profitability information with respect to providing services to the Fund and other funds in the family was subsumed in the WFAM and Wells Fargo profitability analysis.
Funds Management reported on the methodologies and estimates used in calculating profitability, including a description of the methodology used to allocate certain expenses. Among other things, the Board noted that the levels of profitability reported on a fund-by-fund basis varied widely, depending on factors such as the size, type and age of fund.
Based on its review, the Board did not deem the profits reported by Funds Management, WFAM or Wells Fargo from services provided to the Fund to be at a level that would prevent it from approving the continuation of the Advisory Agreements.
Economies of scale
The Board received and considered information about the potential for Funds Management to experience economies of scale in the provision of management services to the Fund, the difficulties of calculating economies of scale at an individual fund level, and the extent to which potential scale benefits are shared with shareholders. The Board noted the existence of breakpoints in the Fund’s management fee structure, which operate generally to reduce the Fund’s expense ratios as the Fund grows in size, and the size of the Fund in relation to such breakpoints. The Board considered that in addition to management fee breakpoints, Funds Management shares potential economies of scale from its management business in a variety of ways, including through fee waiver and expense reimbursement arrangements, services that benefit shareholders, competitive management fee rates set at the outset without regard to breakpoints, and investments in the business intended to enhance services available to shareholders.
The Board concluded that Funds Management’s arrangements with respect to the Fund, including contractual breakpoints, constituted a reasonable approach to sharing potential economies of scale with the Fund and its shareholders.
Other benefits to Funds Management and the Sub-Adviser
The Board received and considered information regarding potential “fall-out” or ancillary benefits received by Funds Management and its affiliates, including the Sub-Adviser, as a result of their relationships with the Fund. Ancillary benefits could include, among others, benefits directly attributable to other relationships with the Fund and benefits potentially derived from an increase in Funds Management’s and the Sub-Adviser’s business as a result of their relationships with the Fund. The Board noted that various affiliates of Funds Management may receive distribution-related fees, shareholder servicing payments and sub-transfer agency fees in respect of shares sold or held through them and services provided.
The Board also reviewed information about soft dollar credits earned and utilized by the Sub-Adviser, fees earned by Funds Management and the Sub-Adviser from managing a private investment vehicle for the fund family’s securities lending collateral, and commissions earned by an affiliated broker from portfolio transactions.
Based on its consideration of the factors and information it deemed relevant, including those described here, the Board did not find that any ancillary benefits received by Funds Management and its affiliates, including the Sub-Adviser, were unreasonable.
Conclusion
At the Meeting, after considering the above-described factors and based on its deliberations and its evaluation of the information described above, the Board unanimously approved the continuation of the Advisory Agreements for a one-year term and determined that the compensation payable to Funds Management and the Sub-Adviser under each of the Advisory Agreements was reasonable.
36 | Wells Fargo Opportunity Fund
Table of Contents
Other information (unaudited)
LIQUIDITY RISK MANAGEMENT PROGRAM
In accordance with Rule 22e-4 under the Investment Company Act of 1940, as amended (the “Liquidity Rule”), Wells Fargo Funds Trust (the “Trust”) has adopted and implemented a liquidity risk management program (the “Program”) on behalf of each of its series, including the Fund, which is reasonably designed to assess and manage the Fund’s liquidity risk. “Liquidity risk” is defined as the risk that the Fund is unable to meet redemption requests without significantly diluting remaining investors’ interests in the Fund. The Trust’s Board of Trustees (the “Board”) previously approved the designation of Wells Fargo Funds Management, LLC (“Funds Management”), the Fund’s investment manager, as the administrator of the Program, and Funds Management has established a Liquidity Risk Management Council composed of personnel from multiple departments within Funds Management and its affiliates to assist Funds Management in the implementation and on-going administration of the Program.
The Program is comprised of various components designed to support the assessment and/or management of liquidity risk, including: (1) the periodic assessment (no less frequently than annually) of certain factors that influence the Fund’s liquidity risk; (2) the periodic classification (no less frequently than monthly) of the Fund’s investments into one of four liquidity categories that reflect an estimate of their liquidity under current market conditions; (3) a 15% limit on the acquisition of “illiquid investments” (as defined under the Liquidity Rule); (4) to the extent the Fund does not invest primarily in “highly liquid investments” (as defined under the Liquidity Rule), the determination of a minimum percentage of the Fund’s assets that generally will be invested in highly liquid investments (an “HLIM”); (5) if the Fund has established an HLIM, the periodic review (no less frequently than annually) of the HLIM and the adoption of policies and procedures for responding to a shortfall of the Fund’s “highly liquid investments” below its HLIM; and (6) periodic reporting to the Board.
At a meeting of the Board held on May 26 and 28, 2020, the Board received a written report (the “Report”) from Funds Management that addressed the operation of the Program and assessed its adequacy and effectiveness of implementation. The Report covered the initial period from December 1, 2018 through December 31, 2019 (the “Reporting Period”). No significant liquidity events impacting the Fund were noted in the Report. There were no material changes to the Program during the Reporting Period. The Report concluded that the Program is operating effectively to assess and manage the Fund’s liquidity risk, and that the Program has been and continues to be adequately and effectively implemented to monitor and, as applicable, respond to the Fund’s liquidity developments.
There can be no assurance that the Program will achieve its objectives under all circumstances in the future. Please refer to the Fund’s prospectus for more information regarding the Fund’s exposure to liquidity risk and other risks to which an investment in the Fund may be subject.
Wells Fargo Opportunity Fund | 37
Table of Contents
Effective June 1, 2020, shareholders purchasing Fund shares through an Oppenheimer & Co. Inc. (“Oppenheimer”) platform or account are eligible only for the following load waivers (front-end sales charge waivers and contingent deferred or back-end, sales charge waivers) and discounts, which may differ from those disclosed in the Fund’s Prospectus or SAI.
| Front-end Sales Load Waivers on Class A Shares available at Oppenheimer |
| Employer-sponsored retirement, deferred compensation and employee benefit plans (including health savings accounts) and trusts used to fund those plans, provided that the shares are not held in a commission-based brokerage account and shares are held for the benefit of the plan. |
| Shares purchased by or through a 529 Plan. |
| Shares purchased through an Oppenheimer affiliated investment advisory program. |
| Shares purchased through reinvestment of capital gains distributions and dividend reinvestment when purchasing shares of the same fund (but not any other fund within the fund family). |
| Shares purchased from the proceeds of redemptions within the same fund family, provided (1) the repurchase occurs within 90 days following the redemption, (2) the redemption and purchase occur in the same account, and (3) redeemed shares were subject to a front-end or deferred sales load (known as Rights of Restatement). |
| A shareholder in the Fund’s Class C shares will have their shares exchanged at net asset value to Class A shares (or the appropriate share class) of the Fund if the shares are no longer subject to a CDSC and the exchange is in line with the policies and procedures of Oppenheimer. |
| Employees and registered representatives of Oppenheimer or its affiliates and their family members. |
| Directors or Trustees of the Fund, and employees of the Fund’s investment adviser or any of its affiliates, as described in the Prospectus. |
| CDSC Waivers on A and C Shares available at Oppenheimer |
| Death or disability of the shareholder. |
| Shares sold as part of a systematic withdrawal plan as described in the Prospectus. |
| Return of excess contributions from an IRA Account. |
| Shares sold as part of a required minimum distribution for IRA and retirement accounts due to the shareholder reaching the qualified age based on applicable IRS regulations as described in the Prospectus. |
| Shares sold to pay Oppenheimer fees but only if the transaction is initiated by Oppenheimer. |
| Shares acquired through a right of reinstatement. |
| Front-end load Discounts Available at Oppenheimer: Breakpoints, Rights of Accumulation & Letters of Intent |
| Breakpoints as described in the Prospectus. |
| Rights of Accumulation (ROA), which entitle shareholders to breakpoint discounts, will be automatically calculated based on the aggregated holding of fund family assets held by accounts within the purchaser’s household at Oppenheimer. Eligible fund family assets not held at Oppenheimer may be included in the ROA calculation only if the shareholder notifies his or her financial advisor about such assets. |
38 | Wells Fargo Opportunity Fund
Table of Contents
Effective June 15, 2020, shareholders purchasing fund shares through a Robert W. Baird & Co. (“Baird”) platform or account will only be eligible for the following sales charge waivers (front-end sales charge waivers and CDSC waivers) and discounts, which may differ from those disclosed elsewhere in the Fund’s Prospectus or the SAI.
| Front-end Sales Load Waivers on Class A Shares available at Baird |
| Shares purchased through reinvestment of capital gains distributions and dividend reinvestment when purchasing share of the same fund. |
| Share purchase by employees and registers representatives of Baird or its affiliate and their family members as designated by Baird. |
| Shares purchase from the proceeds of redemptions within the same fund family, provided (1) the repurchase occurs within 90 days following the redemption, (2) the redemption and purchase occur in the same accounts, and (3) redeemed shares were subject to a front-end or deferred sales charge (known as rights of reinstatement). |
| A shareholder in the Funds Investor C Shares will have their share exchanged at net asset value to Investor A shares of the fund if the shares are no longer subject to CDSC and the exchange is in line with the policies and procedures of Baird. |
| Employer-sponsored retirement plans or charitable accounts in a transactional brokerage account at Baird, including 401(k)plans, 457 plans, employer-sponsored 403(b) plans, profit sharing and money purchase pension plans and defined benefit plans. For purposes of this provision, employer-sponsored retirement plans do not include SEP IRAs, Simple IRAs or SAR-SEPs. |
| CDSC Waivers on A and C Shares available at Baird |
| Shares sold due to death or disability of the shareholder. |
| Shares sold as part of a systematic withdrawal plan as described in the Fund’s Prospectus. |
| Shares bought due to returns of excess contributions from an IRA Account. |
| Shares sold as part of a required minimum distribution for IRA and retirement accounts due to the shareholder reaching age 72as described in the Fund’s Prospectus. |
| Shares sold to pay Baird fees but only if the transaction is initiated by Baird. |
| Shares acquired through a right of reinstatement. |
| Front-end load Discounts Available at Baird: Breakpoint and/or Rights of Accumulation |
| Breakpoints as described in the Prospectus. |
| Rights of accumulations which entitles shareholders to breakpoint discounts will be automatically calculated based on the aggregated holding of fund family assets held by accounts within the purchaser’s household at Baird. Eligible fund family assets not held at Baird may be included in the rights of accumulations calculation only if the shareholder notifies his or her financial advisor about such assets. |
| Letters of Intent (LOI) allow for breakpoint discounts based on anticipated purchases within a fund family through Baird, over a 13-month period of time. |
Wells Fargo Opportunity Fund | 39
Table of Contents
This page is intentionally left blank.
Table of Contents
For more information
More information about Wells Fargo Funds is available free upon request. To obtain literature, please write, visit the Fund’s website, or call:
Wells Fargo Funds
P.O. Box 219967
Kansas City, MO 64121-9967
Website: wfam.com
Individual investors: 1-800-222-8222
Retail investment professionals: 1-888-877-9275
Institutional investment professionals: 1-866-765-0778

This report and the financial statements contained herein are submitted for the general information of the shareholders of the Fund. If this report is used for promotional purposes, distribution of the report must be accompanied or preceded by a current prospectus. Before investing, please consider the investment objectives, risks, charges, and expenses of the investment. For a current prospectus and, if available, a summary prospectus, containing this information, call 1-800-222-8222 or visit the Fund’s website at wfam.com. Read the prospectus carefully before you invest or send money.
Wells Fargo Asset Management (WFAM) is the trade name for certain investment advisory/management firms owned by Wells Fargo & Company. These firms include but are not limited to Wells Capital Management Incorporated and Wells Fargo Funds Management, LLC. Certain products managed by WFAM entities are distributed by Wells Fargo Funds Distributor, LLC (a broker-dealer and Member FINRA).
This material is for general informational and educational purposes only and is NOT intended to provide investment advice or a recommendation of any kind—including a recommendation for any specific investment, strategy, or plan.
INVESTMENT PRODUCTS: NOT FDIC INSURED ◾ NO BANK GUARANTEE ◾ MAY LOSE VALUE
© 2020 Wells Fargo & Company. All rights reserved.
PAR-1020-00573 11-20
A232/AR232 09-20
Table of Contents

Annual Report
September 30, 2020
Wells Fargo
International Bond Fund
Beginning on January 1, 2021, as permitted by new regulations adopted by the Securities and Exchange Commission, paper copies of the Wells Fargo Funds’ annual and semi-annual shareholder reports issued after this date will no longer be sent by mail, unless you specifically request paper copies of the reports. Instead, the reports will be made available on the Funds’ website, and you will be notified by mail each time a report is posted and provided with a website address to access the report.
If you already elected to receive shareholder reports electronically, you will not be affected by this change and you need not take any action. You may elect to receive shareholder reports and other communications from the Fund electronically at any time by contacting your financial intermediary (such as a broker-dealer or bank) or, if you are a direct investor, by calling 1-800-222-8222 or by enrolling at wellsfargo.com/advantagedelivery.
You may elect to receive all future reports in paper free of charge. If you invest through a financial intermediary, you can contact your financial intermediary to request that you continue to receive paper copies of your shareholder reports; if you invest directly with the Fund, you can call 1-800-222-8222. Your election to receive reports in paper will apply to all Wells Fargo Funds held in your account with your financial intermediary or, if you are a direct investor, to all Wells Fargo Funds that you hold.
Table of Contents
|
Reduce clutter. Save trees. |
Sign up for electronic delivery of prospectuses and shareholder reports at wellsfargo.com/ |
The views expressed and any forward-looking statements are as of September 30, 2020, unless otherwise noted, and are those of the Fund’s portfolio managers and/or Wells Fargo Asset Management. Discussions of individual securities, or the markets generally, or any Wells Fargo Fund are not intended as individual recommendations. Future events or results may vary significantly from those expressed in any forward-looking statements. The views expressed are subject to change at any time in response to changing circumstances in the market. Wells Fargo Asset Management and the Fund disclaim any obligation to publicly update or revise any views expressed or forward-looking statements.
INVESTMENT PRODUCTS: NOT FDIC INSURED ◾ NO BANK GUARANTEE ◾ MAY LOSE VALUE
Wells Fargo International Bond Fund | 1
Table of Contents
Letter to shareholders (unaudited)

Andrew Owen
President
Wells Fargo Funds
Dear Shareholder:
We are pleased to offer you this annual report for the Wells Fargo International Bond Fund for the 12-month period that ended September 30, 2020. Global stock markets saw earlier gains erased in March as governments around the world took unprecedented measures, attempting to stop the spread of COVID-19 at the expense of short-term economic output. However, markets rallied strongly from April on to more than offset those short-term losses as central banks bolstered capital markets and confidence.
For the 12-month period, equities had broadly positive total returns despite intense volatility in March. Non-U.S. developed market equities had weaker performance than emerging market and U.S. stocks. While gains from fixed-income securities were positive, they were more modest than equities. For the period, U.S. stocks, based on the S&P 500 Index,1 gained 15.15%. International stocks, as measured by the MSCI ACWI ex USA Index (Net),2 returned 3.00%, while the MSCI EM Index (Net)3 had stronger performance, with a 10.54% gain. For bond investors, the Bloomberg Barclays U.S. Aggregate Bond Index4 returned 6.98%, the Bloomberg Barclays Global Aggregate ex-USD Index5 gained 5.48%, and the Bloomberg Barclays Municipal Bond Index6 returned 4.09% while the ICE BofA U.S. High Yield Index7 returned 2.30%.
The period began with mixed economic readings.
The fourth quarter of 2019 started on a strong note. U.S.-China trade tensions, which had been building for months, relaxed in October; optimism rose for a U.K. Brexit deal; and macroeconomic data turned positive. The initial estimate of U.S. third-quarter gross domestic product (GDP) growth was a resilient 1.9% annualized rate, while the U.S. unemployment rate fell to a 50-year low of 3.5% in September. However, despite strength among U.S. consumers, business confidence declined while manufacturing activity contracted. Concerned with a potential economic slowdown, the U.S. Federal Reserve (Fed) lowered interest rates a quarter point in late October—its third rate cut in four months. This helped push the S&P 500 Index to an all-time high while emerging market equities rallied and global bonds declined overall, reflecting a broad pickup in risk appetite.
Equity markets continued to rally in November despite ongoing geopolitical risks. Hopes for a U.S.-China trade deal buoyed investor confidence. U.S. business sentiment improved slightly and manufacturing and services activity picked up. While consumer confidence and purchasing managers’ activity rose in the eurozone, China reported weakening manufacturing and consumer data. Bond yields rose marginally, leading to slightly negative returns for global government and investment-grade corporate bonds.
| 1 | The S&P 500 Index consists of 500 stocks chosen for market size, liquidity, and industry group representation. It is a market-value-weighted index with each stock’s weight in the index proportionate to its market value. You cannot invest directly in an index. |
| 2 | The Morgan Stanley Capital International (MSCI) All Country World Index (ACWI) ex USA Index (Net) is a free-float-adjusted market-capitalization-weighted index that is designed to measure the equity market performance of developed and emerging markets, excluding the United States. Source: MSCI. MSCI makes no express or implied warranties or representations and shall have no liability whatsoever with respect to any MSCI data contained herein. The MSCI data may not be further redistributed or used as a basis for other indices or any securities or financial products. This report is not approved, reviewed, or produced by MSCI. You cannot invest directly in an index. |
| 3 | The MSCI Emerging Markets (EM) Index (Net) is a free-float-adjusted market-capitalization-weighted index that is designed to measure equity market performance of emerging markets. You cannot invest directly in an index. |
| 4 | The Bloomberg Barclays U.S. Aggregate Bond Index is a broad-based benchmark that measures the investment-grade, U.S. dollar-denominated, fixed-rate taxable bond market, including Treasuries, government-related and corporate securities, mortgage-backed securities (agency fixed-rate and hybrid adjustable-rate mortgage pass-throughs), asset-backed securities, and commercial mortgage-backed securities. You cannot invest directly in an index. |
| 5 | The Bloomberg Barclays Global Aggregate ex-USD Index is an unmanaged index that provides a broad-based measure of the global investment-grade fixed-income markets excluding the U.S. dollar-denominated debt market. You cannot invest directly in an index. |
| 6 | The Bloomberg Barclays Municipal Bond Index is an unmanaged index composed of long-term tax-exempt bonds with a minimum credit rating of Baa. You cannot invest directly in an index. |
| 7 | The ICE BofA U.S. High Yield Index is a market-capitalization-weighted index of domestic and Yankee high-yield bonds. The index tracks the performance of high-yield securities traded in the U.S. bond market. You cannot invest directly in an index. Copyright 2020. ICE Data Indices, LLC. All rights reserved. |
2 | Wells Fargo International Bond Fund
Table of Contents
Letter to shareholders (unaudited)
Financial markets ended 2019 with a boost from the U.S. and China accord on a Phase One trade deal. That, along with the landslide win by the pro-Brexit U.K. Conservative Party in a national election and ongoing central bank support, gave investors greater confidence. U.S. economic indicators were generally positive, with the exception of manufacturing activity and business confidence. Consumer confidence was resilient, fed by a robust labor market, tame inflation, and lower interest rates, which boosted housing affordability and stimulated homebuyer activity. The impeachment of President Trump had little impact on the markets. Meanwhile, slowing Chinese economic activity, partly attributable to the trade war, led to further government stimulus at year-end through lower reserve ratios, allowing banks to lend more money.
The year-end rally continued in early January 2020. However, capital market volatility spiked in late January on concerns over the potential impact of COVID-19 on the global economy and stock markets. With sentiment somewhat souring, perceived safe havens did well in January. The U.S. dollar and Japanese yen both rose and government bonds outperformed equities. While the S&P 500 Index held its ground, emerging market equities tumbled, including those in Asia.
In February, COVID-19 became the major market focus. Fears of the virus’s impact on Chinese and global growth led to expectations of increased global central bank monetary policy support. That led the 10-year U.S. Treasury yield to fall to an all-time low of 1.1%. Although equity markets initially shrugged off concerns about the outbreak, focusing instead on strong fourth-quarter earnings and improving business confidence in January, market sentiment turned sharply lower and the S&P 500 Index lost 8.2% for the month. Oil prices tumbled as Russia and the Organization of the Petroleum Exporting Countries compounded a major decline in oil demand with a brutal price war, partly aimed at dissuading further U.S. shale production, causing the price of West Texas Intermediate crude oil to plummet.
The global spread of COVID-19 led country after country to clamp down on social and business-related activity in order to contain the virus from causing even greater devastation and overwhelming health care systems. This abrupt stoppage of economic activity led to the sharp deceleration of global output, sending economies into a deep contraction. Central banks responded swiftly, slashing interest rates and expanding quantitative easing programs to restore liquidity and confidence to the markets. In the U.S., the Fed introduced several new lending programs, funding investment-grade bonds, money market mutual funds, and commercial paper while purchasing Treasuries, mortgage-backed securities, and overnight repurchase agreements. Meanwhile, stock markets tumbled quickly into a bear market, ending the longest bull stock market in U.S. history.
Markets rebounded strongly in April, fueled by unprecedented government and central bank stimulus measures. The U.S. economy contracted by an annualized 5.0% pace in the first quarter, with 30 million new unemployment insurance claims in six weeks. In the eurozone, first-quarter real GDP shrank 3.8%, with the composite April Flash Purchasing Managers’ Index (PMI), a monthly survey of purchasing managers, falling to an all-time low of 13.5. The European Central Bank expanded its quantitative easing to include the purchase of additional government bonds of countries with the greatest virus-related need, including Italy and Spain. China’s first-quarter GDP fell by 6.8% year over year. However, retail sales, production, and investment showed signs of recovery. Extreme oil-price volatility continued as global supply far exceeded demand.
The global equity market rebound continued in May, with widespread strong monthly gains. Investors regained confidence on reports of early signs of success in human trials of a COVID-19 vaccine. Growth stocks continued to outperform value stocks while returns on global government bonds were generally flat. In the U.S., a gap grew between the stock market rebound and devastating economic data points, including an April unemployment rate of 14.7%, the highest level since World War II. PMIs reflected
“The global spread of COVID-19 led country after country to clamp down on social and business-related activity in order to contain the virus from causing even greater devastation and overwhelming health care systems.”
Wells Fargo International Bond Fund | 3
Table of Contents
Letter to shareholders (unaudited)
“The stock market continued to rally in August despite concerns over rising numbers of COVID-19 cases in the United States and several European countries, including France and Spain, as well as the expiration of the $600 weekly bonus unemployment benefit at the end of July.”
weakening activity in May in both the manufacturing and services sectors. U.S. corporate earnings reports indicated a 14% year-over-year contraction in earnings from the first quarter of 2019. However, high demand for technology, driven by remote activity, supported robust information technology sector earnings, which helped drive major technology stocks higher.
Financial markets posted widely positive returns in June despite ongoing economic weakness and high levels of uncertainty on the containment of COVID-19 and the timing of an effective vaccine. There were hopeful signs as economies reopened, with both U.S. and U.K. retail sales rebounding sharply in May. However, year over year, sales remained depressed. Vitally important to market sentiment was the ongoing commitment by central banks globally to do all they could to provide economic support through liquidity and low borrowing costs. U.S. economic activity was aided by one-time $1,200 stimulus checks and $600 bonus weekly unemployment benefits that expired at the end of July. However, unemployment remained historically high, easing somewhat from 14.7% in April to 11.1% in June. By month-end, numerous states reported increases of COVID-19 cases. China’s economic recovery picked up momentum in June, though it remained far from a full recovery.
July was a broadly positive month for both global equities and fixed income. However, economic data and a resurgence of COVID-19 cases pointed to the vulnerability of the global economy and the ongoing imperative to regain control of the pandemic. Second-quarter GDP shrank from the previous quarter by 9.5% and 12.1% in the U.S. and the eurozone, respectively. In contrast, China reported a 3.2% year-over-year expansion in its second-quarter GDP. U.S. unemployment remained high despite adding 1.8 million jobs in July, with a double-digit jobless rate persisting. However, manufacturing activity grew in both the U.S. and the eurozone. In Asia, while China’s manufacturing sector continued to expand, activity in Japan and South Korea contracted. In July, a rising concern was the rapid and broad reemergence of COVID-19 infections.
The stock market continued to rally in August despite concerns over rising numbers of COVID-19 cases in the United States and several European countries, including France and Spain, as well as the expiration of the $600 weekly bonus unemployment benefit at the end of July. U.S. stocks had strong monthly gains, led by the FAANG stocks—Facebook, Apple, Amazon, Netflix, and Google (Alphabet)—which dominate these indices and continued to rally. U.S. stocks generally surpassed other broadly positive global equity performance while fixed-income market monthly returns were broadly flat. Generally stronger-than-expected second-quarter earnings boosted investor sentiment along with the Fed’s announcement of a policy shift that will likely lead to longer-term low interest rates and supportive monetary policy. The U.S. Flash PMIs for both manufacturing and services beat expectations while U.S. housing market indicators were strong. In Europe, retail sales expanded and consumer confidence remained steady. China’s economy continued its fairly steady expansion. Overall, developed markets performed better than emerging market equities for the month of August as people took comfort in better-known equities in perceived safer markets.
Stocks grew more volatile in September on mixed economic data. U.S. PMIs showed solid growth in economic activity in both manufacturing and services. However, six months after the bottom fell out of the labor market in the early spring, only half of the 22 million jobs lost had returned. The U.S. unemployment rate fell to 7.9% in September, the fifth straight month of improvement but far higher than the 3.5% pre-COVID-19 rate. Only 661,000 jobs were added for the month, down from 1.5 million in August. Meanwhile, a reported 2.3 million people have given up looking for work. With U.S. Congress failing to pass further fiscal relief and uncertainties surrounding a possible vaccine, doubts crept back into the financial markets. In the U.K., a lack of progress in Brexit talks with the European Union weighed on markets. China’s economy picked up steam, however, with growth fueled by increased global demand, and China’s service sector had its strongest PMI reading in seven years.
4 | Wells Fargo International Bond Fund
Table of Contents
Letter to shareholders (unaudited)
Don’t let short-term uncertainty derail long-term investment goals.
Periods of investment uncertainty can present challenges, but experience has taught us that maintaining long-term investment goals can be an effective way to plan for the future. To help you create a sound strategy based on your personal goals and risk tolerance, Wells Fargo Funds offers more than 100 mutual funds spanning a wide range of asset classes and investment styles. Although diversification cannot guarantee an investment profit or prevent losses, we believe it can be an effective way to manage investment risk and potentially smooth out overall portfolio performance. We encourage investors to know their investments and to understand that appropriate levels of risk-taking may unlock opportunities.
Thank you for choosing to invest with Wells Fargo Funds. We appreciate your confidence in us and remain committed to helping you meet your financial needs.
Sincerely,

Andrew Owen
President
Wells Fargo Funds
|
For further information about your Fund, contact your investment professional, visit our website at wfam.com, or call us directly at 1-800-222-8222. |
Notice to Shareholders
At a meeting held on August 10-12, 2020, the Board of Trustees of the Fund approved a change to the Fund’s automatic conversion feature for Class C shares in order to shorten the required holding period from 10 to 8 years. As a result, on a monthly basis beginning November 5, 2020, Class C shares will convert automatically into Class A shares 8 years after the initial date of purchase or, if you acquired your Class C shares through an exchange or conversion from another share class, 8 years after the date you acquired your Class C shares. When Class C shares that you acquired through a purchase or exchange convert, any other Class C shares that you purchased with reinvested dividends and distributions also will convert into Class A shares on a pro rata basis.
Please note that a shorter holding period may apply depending on your intermediary. Please see “Appendix A—Sales Charge Reductions and Waivers for Certain Intermediaries” in the Fund’s prospectus for further information.
Wells Fargo International Bond Fund | 5
Table of Contents
Letter to shareholders (unaudited)
Notice to Shareholders
Preparing for LIBOR Transition
The global financial industry is preparing to transition away from the London Interbank Offered Rate (LIBOR), a key benchmark interest rate, to new alternative rates. LIBOR underpins more than $350 trillion of financial contracts. It is the benchmark rate for a wide spectrum of products ranging from residential mortgages to corporate bonds to derivatives. Regulators have called for a market-wide transition away from LIBOR to successor reference rates by the end of 2021, which requires proactive steps be taken by issuers, counterparties, and asset managers to identify impacted products and adopt new reference rates.
The Fund holds at least one security that uses LIBOR as a floating reference rate and has a maturity date after 12-31-2021.
Although the transition process away from LIBOR has become increasingly well-defined in advance of the anticipated discontinuation date, there remains uncertainty regarding the nature of successor reference rates, and any potential effects of the transition away from LIBOR on investment instruments that use it as a benchmark rate. The transition process may result in, among other things, increased volatility or illiquidity in markets for instruments that currently rely on LIBOR and could negatively impact the value of certain instruments held by the Fund.
Wells Fargo Asset Management is monitoring LIBOR exposure closely and has put resources and controls in place to manage this transition effectively. The Fund’s portfolio management team is evaluating LIBOR holdings to understand what happens to those securities when LIBOR ceases to exist, including examining security documentation to identify the presence or absence of fallback language identifying a replacement rate to LIBOR.
While the pace of transition away from LIBOR will differ by asset class and investment strategy, the portfolio management team will monitor market conditions for those holdings to identify and mitigate deterioration or volatility in pricing and liquidity and ensure appropriate actions are taken in a timely manner.
Further information regarding the potential risks associated with the discontinuation of LIBOR can be found in the Fund’s Statement of Additional Information.
6 | Wells Fargo International Bond Fund
Table of Contents
This page is intentionally left blank.
Table of Contents
Performance highlights (unaudited)
Investment objective
The Fund seeks total return, consisting of income and capital appreciation.
Manager
Wells Fargo Funds Management, LLC
Subadviser
Wells Fargo Asset Management (International) Limited
Portfolio managers
Michael Lee
Alex Perrin
Lauren van Biljon, CFA®‡
Peter Wilson
Average annual total returns (%) as of September 30, 2020
| Including sales charge | Excluding sales charge | Expense ratios1 (%) | ||||||||||||||||||||||||||||||||
| Inception date | 1 year | 5 year | 10 year | 1 year | 5 year | 10 year | Gross | Net2 | ||||||||||||||||||||||||||
| Class A (ESIYX) | 9-30-2003 | 1.28 | 2.03 | 0.45 | 6.03 | 2.97 | 0.92 | 1.28 | 1.03 | |||||||||||||||||||||||||
| Class C (ESIVX) | 9-30-2003 | 4.81 | 2.31 | 0.21 | 5.81 | 2.31 | 0.21 | 2.03 | 1.78 | |||||||||||||||||||||||||
| Class R6 (ESIRX)3 | 11-30-2012 | – | – | – | 6.37 | 3.35 | 1.30 | 0.90 | 0.65 | |||||||||||||||||||||||||
| Administrator Class (ESIDX) | 7-30-2010 | – | – | – | 6.27 | 3.15 | 1.09 | 1.22 | 0.85 | |||||||||||||||||||||||||
| Institutional Class (ESICX) | 12-15-1993 | – | – | – | 6.30 | 3.28 | 1.24 | 0.95 | 0.70 | |||||||||||||||||||||||||
| Bloomberg Barclays Global Aggregate ex-USD Index4 | – | – | – | – | 5.48 | 3.60 | 1.35 | – | – | |||||||||||||||||||||||||
Figures quoted represent past performance, which is no guarantee of future results, and do not reflect taxes that a shareholder may pay on an investment in a fund. Investment return and principal value of an investment will fluctuate so that an investor’s shares, when redeemed, may be worth more or less than their original cost. Performance shown without sales charges would be lower if sales charges were reflected. Current performance may be lower or higher than the performance data quoted, which assumes the reinvestment of dividends and capital gains. Current month-end performance is available on the Fund’s website, wfam.com.
Index returns do not include transaction costs associated with buying and selling securities, any mutual fund fees or expenses, or any taxes. It is not possible to invest directly in an index.
For Class A shares, the maximum front-end sales charge is 4.50%. For Class C shares, the maximum contingent deferred sales charge is 1.00%. Performance including a contingent deferred sales charge assumes the sales charge for the corresponding time period. Class R6, Administrator Class, and Institutional Class shares are sold without a front-end sales charge or contingent deferred sales charge.
Bond values fluctuate in response to the financial condition of individual issuers, general market and economic conditions, and changes in interest rates. Changes in market conditions and government policies may lead to periods of heightened volatility in the bond market and reduced liquidity for certain bonds held by the Fund. In general, when interest rates rise, bond values fall and investors may lose principal value. Interest rate changes and their impact on the fund and its share price can be sudden and unpredictable. Foreign investments are especially volatile and can rise or fall dramatically due to differences in the political and economic conditions of the host country. These risks are generally intensified in emerging markets. The use of derivatives may reduce returns and/or increase volatility. Securities issued by U.S. government agencies or government-sponsored entities may not be guaranteed by the U.S. Treasury. Certain investment strategies tend to increase the total risk of an investment (relative to the broader market). The Fund is exposed to high-yield securities risk and geographic risk. Consult the Fund’s prospectus for additional information on these and other risks.
Please see footnotes on page 9.
8 | Wells Fargo International Bond Fund
Table of Contents
Performance highlights (unaudited)
| Growth of $10,000 investment as of September 30, 20205 |
|
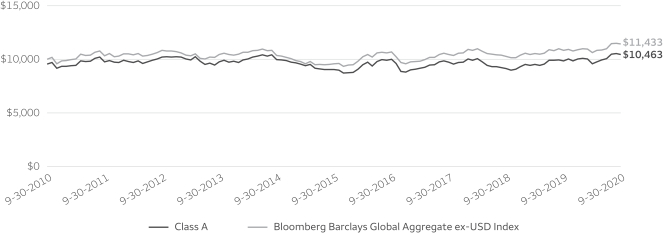
| ‡ | CFA® and Chartered Financial Analyst® are trademarks owned by CFA Institute. |
| 1 | Reflects the expense ratios as stated in the most recent prospectuses. The expense ratios shown are subject to change and may differ from the annualized expense ratios shown in the financial highlights of this report. |
| 2 | The manager has contractually committed through January 31, 2021, to waive fees and/or reimburse expenses to the extent necessary to cap total annual fund operating expenses after fee waivers at 1.03% for Class A, 1.78% for Class C, 0.65 for Class R6, 0.85% for Administrator Class, and 0.70% for Institutional Class. Brokerage commissions, stamp duty fees, interest, taxes, acquired fund fees and expenses (if any), and extraordinary expenses are excluded from the expense caps. Prior to or after the commitment expiration date, the caps may be increased or the commitment to maintain the caps may be terminated only with the approval of the Board of Trustees. Without these caps, the Fund’s returns would have been lower. The expense ratio paid by an investor is the net expense ratio (the total annual fund operating expenses after fee waivers) as stated in the prospectuses. |
| 3 | Historical performance shown for the Class R6 shares prior to their inception reflects the performance of the Institutional Class shares and includes the higher expenses applicable to the Institutional Class shares. If these expenses had not been included, returns for the Class R6 shares would be higher. |
| 4 | The Bloomberg Barclays Global Aggregate ex-USD Index is an unmanaged index that provides a broad-based measure of the global investment grade fixed income markets excluding the U.S. dollar denominated debt market. You cannot invest directly in an index. |
| 5 | The chart compares the performance of Class A shares for the most recent ten years with the Bloomberg Barclays Global Aggregate ex-USD Index. The chart assumes a hypothetical investment of $10,000 in Class A shares and reflects all operating expenses and assumes the maximum initial sales charge of 4.50%. |
| 6 | The ten largest holdings, excluding cash, cash equivalents and any money market funds, are calculated based on the value of the investments divided by total net assets of the Fund. Holdings are subject to change and may have changed since the date specified. |
| 7 | Amounts are calculated based on the total long-term investments of the Fund. These amounts are subject to change and may have changed since the date specified. |
Wells Fargo International Bond Fund | 9
Table of Contents
Performance highlights (unaudited)
MANAGER’S DISCUSSION
Fund highlights
| ∎ | The Fund outperformed its benchmark, the Bloomberg Barclays Global Aggregate ex-USD Index, for the 12-month period that ended September 30, 2020. |
| ∎ | Country allocation was the main driver of value-add over the reporting period, led by an overweight to Canada and the off-benchmark overweight to the U.S. bond market. An underweight to the Japanese interest rate environment and an overweight to Indonesia and Mexico were also large contributors. An underweight to the U.K. detracted from value marginally. Duration positioning was a net contributor to performance. |
| ∎ | Currency exposure was a net detractor from performance, with positives from the euro, Malaysian ringgit, Russian ruble, and Thai baht offset by positioning in the Brazilian real, U.K. sterling, Indonesian rupiah, and Norwegian krona. The hedge cost also detracted. |
The coronavirus pandemic caused volatility to spike.
While the past 12 months have been constructive for the Fund, the background cannot be described as calm. The Fund finished 2019 on a strong note, but the global impact of the coronavirus pandemic caused a large risk-off environment in the first quarter of 2020. The Fund’s bias to liquid developed market sovereign bond markets was a good support, but the allocations to developing and emerging markets was a drag on overall performance. The portfolio had limited credit exposure when spreads widened significantly in the first quarter. This sell-off in risk assets was very swift and the managers took the opportunity to increase exposure to credit spreads in the second quarter, which it maintained. There was also a material rebound in the smaller (developing and emerging) markets. Over this time, the U.S. dollar also declined. The third quarter was less volatile, marked by an uptick in yields.
| Ten largest holdings (%) as of September 30, 20206 | ||||
Japan, 0.10%, 6-20-2030 | 12.70 | |||
Realkredit Danmark AS, 1.00%, 10-1-2050 | 4.93 | |||
Nykredit Realkredit AS, 1.00%, 10-1-2050 | 4.93 | |||
Canada, 2.55%, 3-15-2025 | 4.37 | |||
Italy Buoni Poliennali del Tesoro, 0.95%, 8-1-2030 | 4.17 | |||
Mexico, 8.50%, 5-31-2029 | 3.79 | |||
Spain Bonos y Obligaciones del Estado, 0.60%, 10-31-2029 | 3.65 | |||
Japan, 0.10%, 3-20-2027 | 3.60 | |||
Nordea Kredit Realkredit AS, 1.00%, 10-1-2050 | 2.82 | |||
Italy Buoni Poliennali del Tesoro, 0.35%, 2-1-2025 | 2.81 | |||
As we move through the impact of the pandemic, there has been a significant hit to global growth, and while growth is rebounding, it is coming off a low base and economies are much smaller than at the beginning of the year. That means that central banks will remain accommodative, with short-term interest rates anchored around zero. Longer yields can fluctuate more and 10-year yields have fallen to new all-time lows.
Yields have been in a cyclical decline that we think ended in 2020, as it did in previous election years: 2008, 2012, and 2016. However, we do not foresee a huge rise in longer-maturity yields as the global economy recovers. Over the longer term, yields are likely to remain low as central banks keep short-term rates at or close to zero. The Fund did shorten duration over this year, and we are monitoring the yield increase to determine the time to add some duration once more.
| Portfolio composition as of September 30, 20207 |
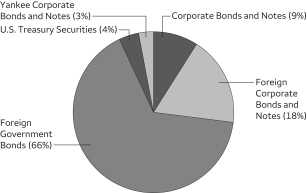 |
Debt dynamics of major economies are expected to deteriorate.
Over the two-year period spanning 2020 and 2021, nominal gross domestic product in developed economies is forecast to remain unchanged or falling. This comes at a time when budget deficits have exploded in response to the COVID-19-induced slowdown. The net result will be a sharp deterioration in the debt dynamics of major economies (and many others, too). The past two decades in developed economies, particularly Japan and Europe, have shown that over-indebtedness is a strong deflationary backdrop. At the moment, there is no sign of an uptick in inflation expectations, but there is potential for inflation to pick up, and this should be closely monitored. The rise in the gold price, which has accelerated and continues to make new all-time highs, could be an early indication of a rise in inflation.
Please see footnotes on page 9.
10 | Wells Fargo International Bond Fund
Table of Contents
Performance highlights (unaudited)
The significant accommodation by central banks globally has also added to debt levels and government deficits, putting increased downward pressure on some currencies—in particular, the U.S. dollar. We believe this has increased the downward pressure on the dollar overall, making the asset class more attractive, and while it will not decline on a linear basis, the probability of a multiyear U.S. dollar decline has increased. Although we do not believe the dollar will lose its reserve currency status anytime soon, a decline seems probable. We are also conscious that to support and increase growth, some countries could devalue their currencies to encourage exports.
There have been three major periods of U.S. dollar strength over the past four decades (October 1978 to February 1985, September 1992 to July 2001, and March 2008 to January 2017). The first two periods were both followed by 40%/50% declines in the U.S. dollar that lasted several years. It may be too early to say that January 2017 was a major peak, but as the twin deficits (trade and budget deficits) continues to deteriorate and the fact that the U.S. has lost its interest rate advantage, it may well prove to be.
Please see footnotes on page 9.
Wells Fargo International Bond Fund | 11
Table of Contents
As a shareholder of the Fund, you incur two types of costs: (1) transaction costs, including sales charges (loads) on purchase payments and contingent deferred sales charges (if any) on redemptions and (2) ongoing costs, including management fees, distribution (12b-1) and/or shareholder servicing fees, and other Fund expenses. This example is intended to help you understand your ongoing costs (in dollars) of investing in the Fund and to compare these costs with the ongoing costs of investing in other mutual funds.
The example is based on an investment of $1,000 invested at the beginning of the six-month period and held for the entire period from April 1, 2020 to September 30, 2020.
Actual expenses
The “Actual” line of the table below provides information about actual account values and actual expenses. You may use the information in this line, together with the amount you invested, to estimate the expenses that you paid over the period. Simply divide your account value by $1,000 (for example, an $8,600 account value divided by $1,000 = 8.6), then multiply the result by the number in the “Actual” line under the heading entitled “Expenses paid during period” for your applicable class of shares to estimate the expenses you paid on your account during this period.
Hypothetical example for comparison purposes
The “Hypothetical” line of the table below provides information about hypothetical account values and hypothetical expenses based on the Fund’s actual expense ratio and an assumed rate of return of 5% per year before expenses, which is not the Fund’s actual return. The hypothetical account values and expenses may not be used to estimate the actual ending account balance or expenses you paid for the period. You may use this information to compare the ongoing costs of investing in the Fund and other funds. To do so, compare this 5% hypothetical example with the 5% hypothetical examples that appear in the shareholder reports of the other funds.
Please note that the expenses shown in the table are meant to highlight your ongoing costs only and do not reflect any transactional costs, such as sales charges (loads) and contingent deferred sales charges. Therefore, the “Hypothetical” line of the table is useful in comparing ongoing costs only and will not help you determine the relative total costs of owning different funds. In addition, if these transactional costs were included, your costs would have been higher.
| Beginning account value 4-1-2020 | Ending account value 9-30-2020 | Expenses paid during the period1 | Annualized net expense ratio | |||||||||||||
Class A | ||||||||||||||||
Actual | $ | 1,000.00 | $ | 1,091.63 | $ | 5.41 | 1.03 | % | ||||||||
Hypothetical (5% return before expenses) | $ | 1,000.00 | $ | 1,019.90 | $ | 5.22 | 1.03 | % | ||||||||
Class C | ||||||||||||||||
Actual | $ | 1,000.00 | $ | 1,093.17 | $ | 9.35 | 1.78 | % | ||||||||
Hypothetical (5% return before expenses) | $ | 1,000.00 | $ | 1,016.13 | $ | 9.01 | 1.78 | % | ||||||||
Class R6 | ||||||||||||||||
Actual | $ | 1,000.00 | $ | 1,093.36 | $ | 3.42 | 0.65 | % | ||||||||
Hypothetical (5% return before expenses) | $ | 1,000.00 | $ | 1,021.80 | $ | 3.30 | 0.65 | % | ||||||||
Administrator Class | ||||||||||||||||
Actual | $ | 1,000.00 | $ | 1,091.71 | $ | 4.47 | 0.85 | % | ||||||||
Hypothetical (5% return before expenses) | $ | 1,000.00 | $ | 1,020.80 | $ | 4.31 | 0.85 | % | ||||||||
Institutional Class | ||||||||||||||||
Actual | $ | 1,000.00 | $ | 1,092.75 | $ | 3.68 | 0.70 | % | ||||||||
Hypothetical (5% return before expenses) | $ | 1,000.00 | $ | 1,021.55 | $ | 3.56 | 0.70 | % | ||||||||
| 1 | Expenses paid is equal to the annualized net expense ratio of each class multiplied by the average account value over the period, multiplied by the number of days in the most recent fiscal half-year divided by the number of days in the fiscal year (to reflect the one-half-year period). |
12 | Wells Fargo International Bond Fund
Table of Contents
Portfolio of investments—September 30, 2020
| Interest rate | Maturity date | Principal | Value | |||||||||||||
| Corporate Bonds and Notes: 8.60% | ||||||||||||||||
| United States: 8.60% | ||||||||||||||||
Abbvie Incorporated (Health Care, Biotechnology) | 2.60 | % | 11-21-2024 | $ | 200,000 | $ | 212,098 | |||||||||
Amazon.com Incorporated (Consumer Discretionary, Internet & Direct Marketing Retail) | 3.15 | 8-22-2027 | 300,000 | 341,894 | ||||||||||||
American International Group Incorporated (Financials, Insurance) | 2.50 | 6-30-2025 | 150,000 | 160,305 | ||||||||||||
Anthem Incorporated (Health Care, Health Care Providers & Services) | 2.25 | 5-15-2030 | 275,000 | 282,229 | ||||||||||||
Apple Incorporated (Information Technology, Technology Hardware, Storage & Peripherals) | 2.90 | 9-12-2027 | 300,000 | 336,701 | ||||||||||||
AT&T Incorporated (Communication Services, Diversified Telecommunication Services) | 4.35 | 3-1-2029 | 250,000 | 293,440 | ||||||||||||
Bank of America Corporation (3 Month LIBOR +1.21%) (Financials, Banks) ± | 3.97 | 2-7-2030 | 300,000 | 348,650 | ||||||||||||
BP Capital Markets America Incorporated (Energy, Oil, Gas & Consumable Fuels) | 3.22 | 4-14-2024 | 275,000 | 296,537 | ||||||||||||
Broadcom Incorporated (Information Technology, Semiconductors & Semiconductor Equipment) | 3.15 | 11-15-2025 | 175,000 | 188,750 | ||||||||||||
Campbell Soup Company (Consumer Staples, Food Products) | 3.65 | 3-15-2023 | 72,000 | 77,077 | ||||||||||||
Chevron Corporation (Energy, Oil, Gas & Consumable Fuels) | 2.00 | 5-11-2027 | 200,000 | 211,427 | ||||||||||||
Chevron USA Incorporated (Energy, Oil, Gas & Consumable Fuels) | 0.69 | 8-12-2025 | 375,000 | 373,461 | ||||||||||||
Citigroup Incorporated (Financials, Banks) | 3.20 | 10-21-2026 | 325,000 | 358,355 | ||||||||||||
Comcast Corporation (Communication Services, Media) | 3.70 | 4-15-2024 | 400,000 | 441,690 | ||||||||||||
CVS Health Corporation (Health Care, Health Care Providers & Services) | 1.30 | 8-21-2027 | 400,000 | 393,761 | ||||||||||||
CVS Health Corporation (Health Care, Health Care Providers & Services) | 4.10 | 3-25-2025 | 73,000 | 82,479 | ||||||||||||
Discovery Communications LLC (Communication Services, Media) | 3.95 | 3-20-2028 | 300,000 | 341,102 | ||||||||||||
Ford Motor Company (Consumer Discretionary, Automobiles) | 8.50 | 4-21-2023 | 75,000 | 81,750 | ||||||||||||
General Motors Company (Consumer Discretionary, Automobiles) | 5.40 | 10-2-2023 | 50,000 | 55,115 | ||||||||||||
Global Payments Incorporated (Information Technology, IT Services) | 3.20 | 8-15-2029 | 350,000 | 381,784 | ||||||||||||
IBM Corporation (Information Technology, IT Services) | 3.30 | 5-15-2026 | 400,000 | 450,706 | ||||||||||||
IQVIA Incorporated (Health Care, Health Care Providers & Services) | 2.88 | 6-15-2028 | 225,000 | 266,439 | ||||||||||||
JPMorgan Chase & Company (Financials, Banks) | 3.30 | 4-1-2026 | 200,000 | 221,583 | ||||||||||||
Mastercard Incorporated (Information Technology, IT Services) | 2.95 | 6-1-2029 | 400,000 | 451,520 | ||||||||||||
Microsoft Corporation (Information Technology, Software) | 2.40 | 8-8-2026 | 300,000 | 326,790 | ||||||||||||
Oracle Corporation (Information Technology, Software) | 2.80 | 4-1-2027 | 250,000 | 274,280 | ||||||||||||
Paypal Holdings Incorporated (Information Technology, IT Services) | 1.65 | 6-1-2025 | 175,000 | 181,213 | ||||||||||||
PepsiCo Incorporated (Consumer Staples, Beverages) | 1.63 | 5-1-2030 | 250,000 | 256,619 | ||||||||||||
Pfizer Incorporated (Health Care, Pharmaceuticals) | 1.70 | 5-28-2030 | 175,000 | 180,138 | ||||||||||||
Qualcomm Incorporated (Information Technology, Semiconductors & Semiconductor Equipment) | 2.15 | 5-20-2030 | 150,000 | 157,159 | ||||||||||||
The Procter & Gamble Company (Consumer Staples, Household Products) | 3.00 | 3-25-2030 | 150,000 | 173,900 | ||||||||||||
The Upjohn Company (Health Care, Health Care Providers & Services) 144A | 1.65 | 6-22-2025 | 75,000 | 76,757 | ||||||||||||
Unilever Capital Corporation (Consumer Staples, Household Products) | 1.38 | 9-14-2030 | 150,000 | 150,947 | ||||||||||||
UnitedHealth Group Incorporated (Health Care, Health Care Providers & Services) | 1.25 | 1-15-2026 | 75,000 | 76,773 | ||||||||||||
Verizon Communications Incorporated (Communication Services, Diversified Telecommunication Services) | 4.33 | 9-21-2028 | 250,000 | 302,446 | ||||||||||||
Visa Incorporated (Information Technology, IT Services) | 1.90 | 4-15-2027 | 75,000 | 79,573 | ||||||||||||
Walmart Incorporated (Consumer Staples, Food & Staples Retailing) | 3.70 | 6-26-2028 | 300,000 | 354,546 | ||||||||||||
Walt Disney Company (Communication Services, Entertainment) | 3.80 | 3-22-2030 | 150,000 | 177,833 | ||||||||||||
Total Corporate Bonds and Notes (Cost $8,724,049) |
| 9,417,827 | ||||||||||||||
|
| |||||||||||||||
The accompanying notes are an integral part of these financial statements.
Wells Fargo International Bond Fund | 13
Table of Contents
Portfolio of investments—September 30, 2020
| Interest rate | Maturity date | Principal | Value | |||||||||||||
| Foreign Corporate Bonds and Notes: 18.17% |
| |||||||||||||||
| Denmark: 12.69% | ||||||||||||||||
Nordea Kredit Realkredit AS (Financials, Thrifts & Mortgage Finance) | 1.00 | % | 10-1-2050 | DKK | 19,508,059 | $ | 3,088,466 | |||||||||
Nykredit Realkredit AS (Financials, Thrifts & Mortgage Finance) | 1.00 | 10-1-2050 | DKK | 34,117,204 | 5,394,364 | |||||||||||
Realkredit Danmark AS (Financials, Thrifts & Mortgage Finance) | 1.00 | 10-1-2050 | DKK | 34,173,947 | 5,400,645 | |||||||||||
| 13,883,475 | ||||||||||||||||
|
| |||||||||||||||
| France: 0.61% | ||||||||||||||||
Altice France SA (Communication Services, Diversified Telecommunication Services) 144A | 4.13 | 1-15-2029 | EUR | 100,000 | 117,169 | |||||||||||
Banijay Group SAS (Communication Services, Media) | 3.50 | 3-1-2025 | EUR | 175,000 | 199,776 | |||||||||||
Rubis Terminal Infra SAS (Energy, Oil, Gas & Consumable Fuels) | 5.63 | 5-15-2025 | EUR | 100,000 | 120,880 | |||||||||||
SPCM SA (Materials, Chemicals) 144A | 2.00 | 2-1-2026 | EUR | 200,000 | 234,134 | |||||||||||
| 671,959 | ||||||||||||||||
|
| |||||||||||||||
| Germany: 0.21% | ||||||||||||||||
Rebecca Bidco (Consumer Discretionary, Diversified Consumer Services) | 5.75 | 7-15-2025 | EUR | 200,000 | 235,193 | |||||||||||
|
| |||||||||||||||
| India: 1.17% | ||||||||||||||||
International Finance Corporation (Financials, Capital Markets) | 6.30 | 11-25-2024 | INR | 92,750,000 | 1,284,144 | |||||||||||
|
| |||||||||||||||
| Italy: 0.21% | ||||||||||||||||
Gamma Bidco SpA (Industrials, Electrical Equipment) | 6.25 | 7-15-2025 | EUR | 200,000 | 232,145 | |||||||||||
|
| |||||||||||||||
| Luxembourg: 0.11% | ||||||||||||||||
PLT VII Finance (Financials, Diversified Financial Services) | 4.63 | 1-5-2026 | EUR | 100,000 | 119,080 | |||||||||||
|
| |||||||||||||||
| Netherlands: 0.55% | ||||||||||||||||
Maxeda DIY Holding BV (Consumer Discretionary, Household Durables) 144A | 5.88 | 10-1-2026 | EUR | 100,000 | 117,063 | |||||||||||
Sigma Holdco BV (Consumer Staples, Food Products) | 5.75 | 5-15-2026 | EUR | 200,000 | 230,683 | |||||||||||
United Group BV (Communication Services, Media) | 3.13 | 2-15-2026 | EUR | 125,000 | 137,798 | |||||||||||
Ziggo Bond Company BV (Communication Services, Media) | 3.38 | 2-28-2030 | EUR | 100,000 | 111,305 | |||||||||||
| 596,849 | ||||||||||||||||
|
| |||||||||||||||
| Philippines: 0.54% | ||||||||||||||||
Asian Development Bank (Financials, Capital Markets) | 5.90 | 12-20-2022 | INR | 43,000,000 | 592,139 | |||||||||||
|
| |||||||||||||||
| Sweden: 0.11% | ||||||||||||||||
Verisure Holding AB (Industrials, Commercial Services & Supplies) | 3.88 | 7-15-2026 | EUR | 100,000 | 117,304 | |||||||||||
|
| |||||||||||||||
| United Kingdom: 1.97% | ||||||||||||||||
European Bank for Reconstruction and Development (Financials, Capital Markets) | 6.50 | 6-19-2023 | INR | 55,000,000 | 771,191 | |||||||||||
FCE Bank plc (Financials, Banks) | 1.66 | 2-11-2021 | EUR | 200,000 | 232,462 | |||||||||||
Galaxy Bidco Limited (Financials, Insurance) | 6.50 | 7-31-2026 | GBP | 200,000 | 262,844 | |||||||||||
Pinewood Finance Company Limited (Financials, Diversified Financial Services) | 3.25 | 9-30-2025 | GBP | 100,000 | 128,467 | |||||||||||
Playtech plc (Consumer Discretionary, Hotels, Restaurants & Leisure) | 3.75 | 10-12-2023 | EUR | 175,000 | 204,278 | |||||||||||
Synthomer plc (Materials, Chemicals) | 3.88 | 7-1-2025 | EUR | 100,000 | 119,297 | |||||||||||
Victoria plc (Consumer Discretionary, Household Durables) | 5.25 | 7-15-2024 | EUR | 100,000 | 116,454 | |||||||||||
Virgin Media Secured Finance plc (Communication Services, Media) | 4.25 | 1-15-2030 | GBP | 250,000 | 317,485 | |||||||||||
| 2,152,478 | ||||||||||||||||
|
| |||||||||||||||
Total Foreign Corporate Bonds and Notes (Cost $19,291,274) |
| 19,884,766 | ||||||||||||||
|
| |||||||||||||||
The accompanying notes are an integral part of these financial statements.
14 | Wells Fargo International Bond Fund
Table of Contents
Portfolio of investments—September 30, 2020
| Interest rate | Maturity date | Principal | Value | |||||||||||||
| Foreign Government Bonds: 64.98% |
| |||||||||||||||
Brazil | 10.00 | % | 1-1-2023 | BRL | 1,775,000 | $ | 350,701 | |||||||||
Brazil | 10.00 | 1-1-2025 | BRL | 3,870,000 | 779,122 | |||||||||||
Canada 144A | 2.55 | 3-15-2025 | CAD | 5,850,000 | 4,786,232 | |||||||||||
Colombia | 6.00 | 4-28-2028 | COP | 1,235,000,000 | 340,926 | |||||||||||
India | 7.32 | 1-28-2024 | INR | 24,000,000 | 347,932 | |||||||||||
Indonesia | 7.50 | 8-15-2032 | IDR | 42,500,000,000 | 2,898,740 | |||||||||||
Indonesia | 8.25 | 5-15-2029 | IDR | 5,750,000,000 | 420,739 | |||||||||||
Indonesia | 6.50 | 6-15-2025 | IDR | 9,500,000,000 | 658,552 | |||||||||||
Italy Buoni Poliennali del Tesoro | 0.35 | 2-1-2025 | EUR | 2,600,000 | 3,072,756 | |||||||||||
Italy Buoni Poliennali del Tesoro | 0.95 | 8-1-2030 | EUR | 3,850,000 | 4,569,002 | |||||||||||
Japan †† | 0.10 | 3-20-2027 | JPY | 410,000,000 | 3,940,261 | |||||||||||
Japan | 0.10 | 6-20-2030 | JPY | 1,455,000,000 | 13,902,276 | |||||||||||
Korea Treasury Bond | 1.88 | 6-10-2029 | KRW | 1,425,000,000 | 1,263,359 | |||||||||||
Korea Treasury Bond | 2.38 | 3-10-2023 | KRW | 1,375,000,000 | 1,218,731 | |||||||||||
Malaysia | 3.90 | 11-30-2026 | MYR | 1,100,000 | 287,002 | |||||||||||
Malaysia | 3.96 | 9-15-2025 | MYR | 600,000 | 155,729 | |||||||||||
Mexico | 5.75 | 3-5-2026 | MXN | 7,850,000 | 363,447 | |||||||||||
Mexico | 8.00 | 11-7-2047 | MXN | 7,150,000 | 357,321 | |||||||||||
Mexico | 8.50 | 5-31-2029 | MXN | 77,510,000 | 4,144,769 | |||||||||||
New South Wales | 3.00 | 5-20-2027 | AUD | 1,815,000 | 1,493,656 | |||||||||||
New South Wales | 5.00 | 8-20-2024 | AUD | 900,000 | 760,899 | |||||||||||
Poland | 2.50 | 1-25-2023 | PLN | 1,000,000 | 273,148 | |||||||||||
Poland | 2.75 | 10-25-2029 | PLN | 325,000 | 94,757 | |||||||||||
Queensland Treasury Corporation 144A | 4.75 | 7-21-2025 | AUD | 3,200,000 | 2,761,252 | |||||||||||
Republic of Peru | 5.70 | 8-12-2024 | PEN | 400,000 | 130,664 | |||||||||||
Republic of South Africa | 8.75 | 2-28-2048 | ZAR | 25,750,000 | 1,181,425 | |||||||||||
Republic of South Africa | 8.75 | 2-28-2048 | ZAR | 5,185,000 | 237,891 | |||||||||||
Republic of South Africa | 10.50 | 12-21-2026 | ZAR | 25,285,000 | 1,746,900 | |||||||||||
Romania | 3.25 | 4-29-2024 | RON | 4,240,000 | 1,021,562 | |||||||||||
Romania | 3.40 | 3-8-2022 | RON | 600,000 | 144,976 | |||||||||||
Romania | 4.85 | 4-22-2026 | RON | 3,725,000 | 963,021 | |||||||||||
Romania | 5.00 | 2-12-2029 | RON | 3,535,000 | 941,343 | |||||||||||
Russia | 4.50 | 7-16-2025 | RUB | 176,000,000 | 2,187,945 | |||||||||||
Russia | 6.50 | 2-28-2024 | RUB | 38,600,000 | 517,862 | |||||||||||
Russia | 7.00 | 12-15-2021 | RUB | 26,000,000 | 344,821 | |||||||||||
Spain Bonos y Obligaciones del Estado | 0.01 | 1-31-2025 | EUR | 1,115,000 | 1,323,753 | |||||||||||
Spain Bonos y Obligaciones del Estado 144A | 0.60 | 10-31-2029 | EUR | 3,275,000 | 3,998,371 | |||||||||||
Swedish 144A | 0.13 | 5-12-2031 | SEK | 26,600,000 | 3,007,123 | |||||||||||
United Kingdom Gilt Bond | 0.63 | 6-7-2025 | GBP | 2,305,000 | 3,069,895 | |||||||||||
United Kingdom Gilt Bond | 0.75 | 7-22-2023 | GBP | 800,000 | 1,056,335 | |||||||||||
Total Foreign Government Bonds (Cost $70,792,245) |
| 71,115,196 | ||||||||||||||
|
| |||||||||||||||
| U.S. Treasury Securities: 3.78% | ||||||||||||||||
U.S. Treasury Bond | 0.25 | 8-31-2025 | $ | 1,575,000 | 1,573,400 | |||||||||||
U.S. Treasury Bond | 0.50 | 8-31-2027 | 1,450,000 | 1,453,398 | ||||||||||||
U.S. Treasury Bond | 1.50 | 2-15-2030 | 1,025,000 | 1,105,559 | ||||||||||||
Total U.S. Treasury Securities (Cost $4,134,230) |
| 4,132,357 | ||||||||||||||
|
| |||||||||||||||
| Yankee Corporate Bonds and Notes: 2.86% | ||||||||||||||||
| Cayman Islands: 0.49% | ||||||||||||||||
Tencent Holdings Limited (Communication Services, Interactive Media & Services) 144A | 3.28 | 4-11-2024 | 500,000 | 532,540 | ||||||||||||
|
| |||||||||||||||
The accompanying notes are an integral part of these financial statements.
Wells Fargo International Bond Fund | 15
Table of Contents
Portfolio of investments—September 30, 2020
| Interest rate | Maturity date | Principal | Value | |||||||||||||
| France: 0.72% | ||||||||||||||||
Danone SA (Consumer Staples, Food Products) | 2.95 | % | 11-2-2026 | $ | 500,000 | $ | 554,339 | |||||||||
Electricite de France SA (Utilities, Electric Utilities) | 4.50 | 9-21-2028 | 200,000 | 237,576 | ||||||||||||
| 791,915 | ||||||||||||||||
|
| |||||||||||||||
| Japan: 0.19% | ||||||||||||||||
Takeda Pharmaceutical (Health Care, Pharmaceuticals) | 2.05 | 3-31-2030 | 200,000 | 202,555 | ||||||||||||
|
| |||||||||||||||
| Netherlands: 0.29% | ||||||||||||||||
Shell International Finance BV (Energy, Oil, Gas & Consumable Fuels) | 2.38 | 4-6-2025 | 300,000 | 319,952 | ||||||||||||
|
| |||||||||||||||
| Norway: 0.28% | ||||||||||||||||
Equinor ASA (Energy, Oil, Gas & Consumable Fuels) | 1.75 | 1-22-2026 | 300,000 | 311,150 | ||||||||||||
|
| |||||||||||||||
| Spain: 0.29% | ||||||||||||||||
Telefonica Emisiones SAU (Communication Services, Diversified Telecommunication Services) | 4.10 | 3-8-2027 | 275,000 | 312,651 | ||||||||||||
|
| |||||||||||||||
| United Kingdom: 0.60% | ||||||||||||||||
State Grid Overseas Investment Limited (Utilities, Multi-Utilities) | 3.50 | 5-4-2027 | 275,000 | 307,264 | ||||||||||||
Vodafone Group plc (Communication Services, Wireless Telecommunication Services) | 4.38 | 5-30-2028 | 300,000 | 355,034 | ||||||||||||
| 662,298 | ||||||||||||||||
|
| |||||||||||||||
Total Yankee Corporate Bonds and Notes (Cost $2,864,348) |
| 3,133,061 | ||||||||||||||
|
| |||||||||||||||
| Yield | Shares | |||||||||||||||
| Short-Term Investments: 0.92% | ||||||||||||||||
| Investment Companies: 0.92% | ||||||||||||||||
Wells Fargo Government Money Market Fund Select Class (l)(u) | 0.05 | 1,002,714 | 1,002,714 | |||||||||||||
|
| |||||||||||||||
Total Short-Term Investments (Cost $1,002,714) | 1,002,714 | |||||||||||||||
|
| |||||||||||||||
| Total investments in securities (Cost $106,808,860) | 99.31 | % | 108,685,921 | |||||
Other assets and liabilities, net | 0.69 | 760,550 | ||||||
|
|
|
| |||||
| Total net assets | 100.00 | % | $ | 109,446,471 | ||||
|
|
|
| |||||
| ± | Variable rate investment. The rate shown is the rate in effect at period end. |
| 144A | The security may be resold in transactions exempt from registration, normally to qualified institutional buyers, pursuant to Rule 144A under the Securities Act of 1933. |
| †† | On the last interest date, partial interest was paid. |
| (l) | The issuer of the security is an affiliated person of the Fund as defined in the Investment Company Act of 1940. |
| (u) | The rate represents the 7-day annualized yield at period end. |
The accompanying notes are an integral part of these financial statements.
16 | Wells Fargo International Bond Fund
Table of Contents
Portfolio of investments—September 30, 2020
Abbreviations:
| AUD | Australian dollar |
| BRL | Brazilian real |
| CAD | Canadian dollar |
| COP | Colombian peso |
| DKK | Danish krone |
| EUR | Euro |
| GBP | Great British pound |
| IDR | Indonesian rupiah |
| INR | Indian Rupee |
| JPY | Japanese yen |
| KRW | Republic of Korea won |
| LIBOR | London Interbank Offered Rate |
| MXN | Mexican peso |
| MYR | Malaysian ringgit |
| PEN | Peruvian sol |
| PLN | Polish zloty |
| RON | Romanian lei |
| RUB | Russian ruble |
| SEK | Swedish krona |
| ZAR | South African rand |
Forward Foreign Currency Contracts
Currency to be received | Currency to be delivered | Counterparty | Settlement date | Unrealized gains | Unrealized losses | |||||||||
| 915,000 PLN | 231,201 USD | State Street Bank | 10-6-2020 | $ | 5,517 | $ | 0 | |||||||
| 1,150,000,000 IDR | 77,504 USD | State Street Bank | 10-6-2020 | 0 | (247 | ) | ||||||||
| 1,050,000,000 IDR | 70,338 USD | State Street Bank | 10-6-2020 | 201 | 0 | |||||||||
| 11,375,000 INR | 153,903 USD | State Street Bank | 10-6-2020 | 257 | 0 | |||||||||
| 148,850 USD | 2,200,000,000 IDR | State Street Bank | 10-6-2020 | 1,054 | 0 | |||||||||
| 150,563 USD | 11,375,000 INR | State Street Bank | 10-6-2020 | 0 | (3,598 | ) | ||||||||
| 13,419 USD | 50,000 PLN | State Street Bank | 10-6-2020 | 484 | 0 | |||||||||
| 4,000,000 BRL | 774,234 USD | State Street Bank | 10-8-2020 | 0 | (62,122 | ) | ||||||||
| 800,000 BRL | 154,847 USD | State Street Bank | 10-8-2020 | 0 | (12,424 | ) | ||||||||
| 1,615,000 BRL | 291,832 USD | State Street Bank | 10-8-2020 | 0 | (4,317 | ) | ||||||||
| 75,202 USD | 400,000 BRL | State Street Bank | 10-8-2020 | 3,991 | 0 | |||||||||
| 204,994 USD | 1,100,000 BRL | State Street Bank | 10-8-2020 | 9,164 | 0 | |||||||||
| 78,254 USD | 425,000 BRL | State Street Bank | 10-8-2020 | 2,593 | 0 | |||||||||
| 630,000 GBP | 801,976 USD | State Street Bank | 10-9-2020 | 10,970 | 0 | |||||||||
| 2,375,000 GBP | 2,964,427 USD | State Street Bank | 10-9-2020 | 100,247 | 0 | |||||||||
| 17,425,000 CNY | 2,478,522 USD | State Street Bank | 10-26-2020 | 77,491 | 0 | |||||||||
| 3,225,000 CNY | 471,698 USD | State Street Bank | 10-26-2020 | 1,366 | 0 | |||||||||
| 495,000,000 JPY | 4,642,743 USD | State Street Bank | 10-30-2020 | 52,199 | 0 | |||||||||
| 145,000,000 JPY | 1,382,034 USD | State Street Bank | 10-30-2020 | 0 | (6,748 | ) | ||||||||
| 170,000,000 JPY | 1,612,527 USD | State Street Bank | 10-30-2020 | 0 | (123 | ) | ||||||||
| 26,500,000 JPY | 251,635 USD | State Street Bank | 10-30-2020 | 0 | (290 | ) | ||||||||
| 6,785,000 EUR | 8,048,984 USD | State Street Bank | 11-10-2020 | 0 | (87,504 | ) | ||||||||
| 4,585,000 EUR | 5,346,825 USD | State Street Bank | 11-10-2020 | 33,188 | 0 | |||||||||
| 175,000 EUR | 203,769 USD | State Street Bank | 11-10-2020 | 1,575 | 0 | |||||||||
The accompanying notes are an integral part of these financial statements.
Wells Fargo International Bond Fund | 17
Table of Contents
Portfolio of investments—September 30, 2020
Currency to be received | Currency to be delivered | Counterparty | Settlement date | Unrealized gains | Unrealized losses | |||||||||
| 583,705 USD | 8,640,000,000 IDR | State Street Bank | 11-10-2020 | $ | 5,128 | $ | 0 | |||||||
| 83,367 USD | 1,250,000,000 IDR | State Street Bank | 11-10-2020 | 0 | (339 | ) | ||||||||
| 151,905 USD | 2,700,000 ZAR | State Street Bank | 11-12-2020 | 0 | (8,509 | ) | ||||||||
| 737,019 USD | 13,100,000 ZAR | State Street Bank | 11-12-2020 | 0 | (41,283 | ) | ||||||||
| 203,324 USD | 3,475,000 ZAR | State Street Bank | 11-12-2020 | 0 | (3,134 | ) | ||||||||
| 2,125,000 CAD | 1,618,533 USD | State Street Bank | 11-23-2020 | 0 | (22,398 | ) | ||||||||
| 2,850,000 CAD | 2,168,570 USD | State Street Bank | 11-23-2020 | 0 | (27,870 | ) | ||||||||
| 3,919,593 USD | 5,175,000 CAD | State Street Bank | 11-23-2020 | 32,533 | 0 | |||||||||
| 37,327 USD | 50,000 CAD | State Street Bank | 11-23-2020 | 0 | (229 | ) | ||||||||
| 1,393,379 USD | 107,750,000 RUB | State Street Bank | 11-24-2020 | 14,385 | 0 | |||||||||
| 565,095 USD | 44,100,000 RUB | State Street Bank | 11-24-2020 | 699 | 0 | |||||||||
| 228,479 USD | 17,175,000 RUB | State Street Bank | 11-25-2020 | 8,694 | 0 | |||||||||
| 123,766 USD | 9,200,000 INR | State Street Bank | 11-27-2020 | 0 | (260 | ) | ||||||||
| 1,802,220 USD | 40,010,000 MXN | State Street Bank | 11-27-2020 | 4,394 | 0 | |||||||||
| 129,502 USD | 2,875,000 MXN | State Street Bank | 11-27-2020 | 316 | 0 | |||||||||
| 70,879 USD | 1,575,000 MXN | State Street Bank | 11-27-2020 | 107 | 0 | |||||||||
| 2,174,935 USD | 162,000,000 INR | State Street Bank | 11-27-2020 | 0 | (8,989 | ) | ||||||||
| 472,733 USD | 10,675,000 MXN | State Street Bank | 11-27-2020 | 0 | (6,942 | ) | ||||||||
| 508,206 USD | 37,700,000 INR | State Street Bank | 11-27-2020 | 0 | (28 | ) | ||||||||
| 5,200,000 CZK | 234,282 USD | State Street Bank | 12-8-2020 | 0 | (8,865 | ) | ||||||||
| 11,077,615 USD | 69,450,000 DKK | State Street Bank | 12-8-2020 | 126,699 | 0 | |||||||||
| 2,903,170 USD | 18,525,000 DKK | State Street Bank | 12-8-2020 | 0 | (17,863 | ) | ||||||||
| 17,000,000 THB | 540,369 USD | State Street Bank | 12-9-2020 | 0 | (3,932 | ) | ||||||||
| 2,021,046 USD | 2,780,000 AUD | State Street Bank | 12-14-2020 | 29,485 | 0 | |||||||||
| 527,401 USD | 750,000 AUD | State Street Bank | 12-14-2020 | 0 | (9,891 | ) | ||||||||
| 10,475,000 EUR | 12,431,992 USD | State Street Bank | 12-15-2020 | 0 | (130,252 | ) | ||||||||
|
|
|
| |||||||||||
| $ | 522,737 | $ | (468,157 | ) | ||||||||||
|
|
|
| |||||||||||
Investments in Affiliates
An affiliated investment is an investment in which the Fund owns at least 5% of the outstanding voting shares of the issuer or as a result of other relationships, such as the Fund and the issuer having the same investment manager. Transactions with issuers that were either affiliated persons of the Fund at the beginning of the period or the end of the period were as follows:
| Value, beginning of period | Purchases | Shares proceeds | Net realized gains (losses) | Net change in unrealized gains (losses) | Income from affiliated securities | Value, end of period | % of net assets | |||||||||||||||||||||||||
| Short-Term Investments | ||||||||||||||||||||||||||||||||
Investment Companies | ||||||||||||||||||||||||||||||||
Wells Fargo Government Money Market Fund Select Class | $ | 446,052 | $ | 57,463,295 | $ | (56,906,633 | ) | $ | 0 | $ | 0 | $ | 12,597 | $ | 1,002,714 | 0.92 | % | |||||||||||||||
The accompanying notes are an integral part of these financial statements.
18 | Wells Fargo International Bond Fund
Table of Contents
Statement of assets and liabilities—September 30, 2020
Assets | ||||
Investments in unaffiliated securities, at value (cost $105,806,146) | $ | 107,683,207 | ||
Investments in affiliated securities, at value (cost $1,002,714) | 1,002,714 | |||
Cash | 215,012 | |||
Foreign currency, at value (cost $122,649) | 122,027 | |||
Receivable for Fund shares sold | 104,581 | |||
Receivable for interest | 696,844 | |||
Unrealized gains on forward foreign currency contracts | 522,737 | |||
Prepaid expenses and other assets | 109,033 | |||
|
| |||
Total assets | 110,456,155 | |||
|
| |||
Liabilities | ||||
Payable for investments purchased | 416,486 | |||
Payable for Fund shares redeemed | 82,453 | |||
Unrealized losses on forward foreign currency contracts | 468,157 | |||
Management fee payable | 18,854 | |||
Administration fees payable | 6,947 | |||
Distribution fee payable | 436 | |||
Trustees’ fees and expenses payable | 2,678 | |||
Accrued expenses and other liabilities | 13,673 | |||
|
| |||
Total liabilities | 1,009,684 | |||
|
| |||
Total net assets | $ | 109,446,471 | ||
|
| |||
Net assets consist of | ||||
Paid-in capital | $ | 112,810,780 | ||
Total distributable loss | (3,364,309 | ) | ||
|
| |||
Total net assets | $ | 109,446,471 | ||
|
| |||
Computation of net asset value and offering price per share | ||||
Net assets – Class A | $ | 11,236,927 | ||
Shares outstanding – Class A1 | 1,014,579 | |||
Net asset value per share – Class A | $11.08 | |||
Maximum offering price per share – Class A2 | $11.60 | |||
Net assets – Class C | $ | 704,059 | ||
Shares outstanding – Class C1 | 66,699 | |||
Net asset value per share – Class C | $10.56 | |||
Net assets – Class R6 | $ | 6,020,232 | ||
Shares outstanding – Class R61 | 529,975 | |||
Net asset value per share – Class R6 | $11.36 | |||
Net assets – Administrator Class | $ | 34,220,853 | ||
Shares outstanding – Administrator Class1 | 3,059,168 | |||
Net asset value per share – Administrator Class | $11.19 | |||
Net assets – Institutional Class | $ | 57,264,400 | ||
Shares outstanding – Institutional Class1 | 5,062,746 | |||
Net asset value per share – Institutional Class | $11.31 | |||
| 1 | The Fund has an unlimited number of authorized shares. |
| 2 | Maximum offering price is computed as 100/95.50 of net asset value. On investments of $50,000 or more, the offering price is reduced. |
The accompanying notes are an integral part of these financial statements.
Wells Fargo International Bond Fund | 19
Table of Contents
Statement of operations—year ended September 30, 2020
Investment income | ||||
Interest (net of foreign withholding taxes of $39,333) | $ | 2,676,533 | ||
Income from affiliated securities | 12,597 | |||
|
| |||
Total investment income | 2,689,130 | |||
|
| |||
Expenses | ||||
Management fee | 590,191 | |||
Administration fees |
| |||
Class A | 18,519 | |||
Class C | 1,239 | |||
Class R6 | 2,314 | |||
Administrator Class | 14,460 | |||
Institutional Class | 51,075 | |||
Shareholder servicing fees |
| |||
Class A | 28,921 | |||
Class C | 1,934 | |||
Administrator Class | 36,029 | |||
Distribution fee |
| |||
Class C | 5,786 | |||
Custody and accounting fees | 181,835 | |||
Professional fees | 56,920 | |||
Registration fees | 125,542 | |||
Shareholder report expenses | 80,042 | |||
Trustees’ fees and expenses | 21,260 | |||
Interest expense | 750 | |||
Other fees and expenses | 17,867 | |||
|
| |||
Total expenses | 1,234,684 | |||
Less: Fee waivers and/or expense reimbursements |
| |||
Fund-level | (464,387 | ) | ||
Class A | (53 | ) | ||
Administrator Class | (16,600 | ) | ||
|
| |||
Net expenses | 753,644 | |||
|
| |||
Net investment income | 1,935,486 | |||
|
| |||
Payment from affiliate | 3,879 | |||
|
| |||
Realized and unrealized gains (losses) on investments | ||||
Net realized gains (losses) on |
| |||
Unaffiliated securities | (1,273,216 | ) | ||
Forward foreign currency contracts | 1,532,243 | |||
|
| |||
Net realized gains on investments | 259,027 | |||
|
| |||
Net change in unrealized gains (losses) on |
| |||
Unaffiliated securities | 2,150,995 | |||
Forward foreign currency contracts | 762,408 | |||
|
| |||
Net change in unrealized gains (losses) on investments | 2,913,403 | |||
|
| |||
Net realized and unrealized gains (losses) on investments | 3,172,430 | |||
|
| |||
Net increase in net assets resulting from operations | $ | 5,111,795 | ||
|
| |||
The accompanying notes are an integral part of these financial statements.
20 | Wells Fargo International Bond Fund
Table of Contents
Statement of changes in net assets
| Year ended September 30, 2020 | Year ended September 30, 2019 | |||||||||||||||
Operations |
| |||||||||||||||
Net investment income | $ | 1,935,486 | $ | 7,564,786 | ||||||||||||
Payment from affiliate | 3,879 | 0 | ||||||||||||||
Net realized gains (losses) on investments | 259,027 | (17,627,770 | ) | |||||||||||||
Net change in unrealized gains (losses) on investments | 2,913,403 | 25,851,494 | ||||||||||||||
|
| |||||||||||||||
Net increase in net assets resulting from operations | 5,111,795 | 15,788,510 | ||||||||||||||
|
| |||||||||||||||
Capital share transactions | Shares | Shares | ||||||||||||||
Proceeds from shares sold |
| |||||||||||||||
Class A | 163,139 | 1,732,816 | 382,864 | 3,845,786 | ||||||||||||
Class C | 18,134 | 168,996 | 4,716 | 45,352 | ||||||||||||
Class R6 | 976 | 10,383 | 240,845 | 2,428,431 | ||||||||||||
Administrator Class | 2,400,187 | 26,527,800 | 326,113 | 3,274,172 | ||||||||||||
Institutional Class | 1,866,137 | 20,194,483 | 1,734,775 | 17,401,980 | ||||||||||||
|
| |||||||||||||||
| 48,634,478 | 26,995,721 | |||||||||||||||
|
| |||||||||||||||
Payment for shares redeemed |
| |||||||||||||||
Class A | (328,420 | ) | (3,481,337 | ) | (3,796,911 | ) | (36,769,127 | ) | ||||||||
Class C | (54,324 | ) | (544,461 | ) | (186,284 | ) | (1,790,879 | ) | ||||||||
Class R6 | (312,094 | ) | (3,404,671 | ) | (4,444,880 | ) | (44,590,677 | ) | ||||||||
Administrator Class | (1,070,419 | ) | (11,406,831 | ) | (1,459,494 | ) | (14,446,041 | ) | ||||||||
Institutional Class | (4,110,389 | ) | (43,737,008 | ) | (19,409,739 | ) | (197,377,886 | ) | ||||||||
|
| |||||||||||||||
| (62,574,308 | ) | (294,974,610 | ) | |||||||||||||
|
| |||||||||||||||
Net decrease in net assets resulting from capital share transactions | (13,939,830 | ) | (267,978,889 | ) | ||||||||||||
|
| |||||||||||||||
Total decrease in net assets | (8,828,035 | ) | (252,190,379 | ) | ||||||||||||
|
| |||||||||||||||
Net assets | ||||||||||||||||
Beginning of period | 118,274,506 | 370,464,885 | ||||||||||||||
|
| |||||||||||||||
End of period | $ | 109,446,471 | $ | 118,274,506 | ||||||||||||
|
| |||||||||||||||
The accompanying notes are an integral part of these financial statements.
Wells Fargo International Bond Fund | 21
Table of Contents
(For a share outstanding throughout each period)
| Year ended September 30 | Year ended October 31, 2015 | |||||||||||||||||||||||
| CLASS A | 2020 | 2019 | 2018 | 2017 | 20161 | |||||||||||||||||||
Net asset value, beginning of period | $10.45 | $9.69 | $10.31 | $10.77 | $9.74 | $10.84 | ||||||||||||||||||
Net investment income | 0.18 | 2 | 0.32 | 2 | 0.27 | 2 | 0.26 | 2 | 0.24 | 2 | 0.31 | 2 | ||||||||||||
Payment from affiliate | 0.00 | 3 | 0.00 | 0.00 | 0.00 | 0.00 | 0.00 | |||||||||||||||||
Net realized and unrealized gains (losses) on investments | 0.45 | 0.44 | (0.89 | ) | (0.57 | ) | 0.85 | (1.33 | ) | |||||||||||||||
|
|
|
|
|
|
|
|
|
|
|
| |||||||||||||
Total from investment operations | 0.63 | 0.76 | (0.62 | ) | (0.31 | ) | 1.09 | (1.02 | ) | |||||||||||||||
Distributions to shareholders from | ||||||||||||||||||||||||
Net investment income | 0.00 | 0.00 | 0.00 | 0.00 | 0.00 | (0.05 | ) | |||||||||||||||||
Net realized gains | 0.00 | 0.00 | 0.00 | (0.15 | ) | (0.06 | ) | (0.03 | ) | |||||||||||||||
|
|
|
|
|
|
|
|
|
|
|
| |||||||||||||
Total distributions to shareholders | 0.00 | 0.00 | 0.00 | (0.15 | ) | (0.06 | ) | (0.08 | ) | |||||||||||||||
Net asset value, end of period | $11.08 | $10.45 | $9.69 | $10.31 | $10.77 | $9.74 | ||||||||||||||||||
Total return4 | 6.03 | %5 | 7.84 | % | (6.01 | )% | (2.78 | )% | 11.24 | % | (9.50 | )% | ||||||||||||
Ratios to average net assets (annualized) | ||||||||||||||||||||||||
Gross expenses | 1.50 | % | 1.30 | % | 1.08 | % | 1.03 | % | 1.08 | % | 1.06 | % | ||||||||||||
Net expenses | 1.03 | % | 1.03 | % | 1.03 | % | 1.03 | % | 1.03 | % | 1.03 | % | ||||||||||||
Net investment income | 1.68 | % | 3.21 | % | 2.75 | % | 2.61 | % | 2.64 | % | 3.07 | % | ||||||||||||
Supplemental data | ||||||||||||||||||||||||
Portfolio turnover rate | 158 | % | 129 | % | 99 | % | 68 | % | 96 | % | 136 | % | ||||||||||||
Net assets, end of period (000s omitted) | $11,237 | $12,329 | $44,519 | $69,885 | $54,399 | $79,727 | ||||||||||||||||||
| 1 | For the eleven months ended September 30, 2016. The Fund changed its fiscal year end from October 31 to September 30, effective September 30, 2016. |
| 2 | Calculated based upon average shares outstanding |
| 3 | Amount is less than $0.005. |
| 4 | Total return calculations do not include any sales charges. Returns for periods of less than one year are not annualized. |
| 5 | During the year ended September 30, 2020, the Fund received a payment from an affiliate that had an impact of less than 0.005% on total return. See Note 4 in the Notes to Financial Statements for additional information. |
The accompanying notes are an integral part of these financial statements.
22 | Wells Fargo International Bond Fund
Table of Contents
Financial highlights
(For a share outstanding throughout each period)
| Year ended September 30 | Year ended October 31, 2015 | |||||||||||||||||||||||
| CLASS C | 2020 | 2019 | 2018 | 2017 | 20161 | |||||||||||||||||||
Net asset value, beginning of period | $9.98 | $9.32 | $10.00 | $10.52 | $9.58 | $10.70 | ||||||||||||||||||
Net investment income | 0.09 | 2 | 0.24 | 2 | 0.19 | 2 | 0.18 | 2 | 0.17 | 2 | 0.23 | 2 | ||||||||||||
Payment from affiliate | 0.06 | 0.00 | 0.00 | 0.00 | 0.00 | 0.00 | ||||||||||||||||||
Net realized and unrealized gains (losses) on investments | 0.43 | 0.42 | (0.87 | ) | (0.55 | ) | 0.83 | (1.32 | ) | |||||||||||||||
|
|
|
|
|
|
|
|
|
|
|
| |||||||||||||
Total from investment operations | 0.58 | 0.66 | (0.68 | ) | (0.37 | ) | 1.00 | (1.09 | ) | |||||||||||||||
Distributions to shareholders from | ||||||||||||||||||||||||
Net investment income | 0.00 | 0.00 | 0.00 | 0.00 | 0.00 | 0.00 | ||||||||||||||||||
Net realized gains | 0.00 | 0.00 | 0.00 | (0.15 | ) | (0.06 | ) | (0.03 | ) | |||||||||||||||
|
|
|
|
|
|
|
|
|
|
|
| |||||||||||||
Total distributions to shareholders | 0.00 | 0.00 | 0.00 | (0.15 | ) | (0.06 | ) | (0.03 | ) | |||||||||||||||
Net asset value, end of period | $10.56 | $9.98 | $9.32 | $10.00 | $10.52 | $9.58 | ||||||||||||||||||
Total return3 | 5.81 | %4 | 7.08 | % | (6.80 | )% | (3.43 | )% | 10.49 | % | (10.21 | )% | ||||||||||||
Ratios to average net assets (annualized) | ||||||||||||||||||||||||
Gross expenses | 2.25 | % | 2.04 | % | 1.83 | % | 1.78 | % | 1.83 | % | 1.81 | % | ||||||||||||
Net expenses | 1.78 | % | 1.78 | % | 1.78 | % | 1.78 | % | 1.78 | % | 1.78 | % | ||||||||||||
Net investment income | 0.94 | % | 2.51 | % | 2.00 | % | 1.88 | % | 1.86 | % | 2.33 | % | ||||||||||||
Supplemental data | ||||||||||||||||||||||||
Portfolio turnover rate | 158 | % | 129 | % | 99 | % | 68 | % | 96 | % | 136 | % | ||||||||||||
Net assets, end of period (000s omitted) | $704 | $1,027 | $2,652 | $3,493 | $5,520 | $6,895 | ||||||||||||||||||
| 1 | For the eleven months ended September 30, 2016. The Fund changed its fiscal year end from October 31 to September 30, effective September 30, 2016. |
| 2 | Calculated based upon average shares outstanding |
| 3 | Total return calculations do not include any sales charges. Returns for periods of less than one year are not annualized. |
| 4 | During the year ended September 30, 2020, the Fund received a payment from an affiliate which had a 0.58% impact on the total return. See Note 4 in the Notes to Financial Statements for additional information. |
The accompanying notes are an integral part of these financial statements.
Wells Fargo International Bond Fund | 23
Table of Contents
Financial highlights
(For a share outstanding throughout each period)
| Year ended September 30 | Year ended October 31, 2015 | |||||||||||||||||||||||
| CLASS R6 | 2020 | 2019 | 2018 | 2017 | 20161 | |||||||||||||||||||
Net asset value, beginning of period | $10.68 | $9.86 | $10.45 | $10.88 | $9.80 | $10.88 | ||||||||||||||||||
Net investment income | 0.23 | 2 | 0.37 | 2 | 0.31 | 2 | 0.30 | 2 | 0.28 | 2 | 0.35 | 2 | ||||||||||||
Net realized and unrealized gains (losses) on investments | 0.45 | 0.45 | (0.90 | ) | (0.58 | ) | 0.86 | (1.34 | ) | |||||||||||||||
|
|
|
|
|
|
|
|
|
|
|
| |||||||||||||
Total from investment operations | 0.68 | 0.82 | (0.59 | ) | (0.28 | ) | 1.14 | (0.99 | ) | |||||||||||||||
Distributions to shareholders from | ||||||||||||||||||||||||
Net investment income | 0.00 | 0.00 | 0.00 | 0.00 | 0.00 | (0.06 | ) | |||||||||||||||||
Net realized gains | 0.00 | 0.00 | 0.00 | (0.15 | ) | (0.06 | ) | (0.03 | ) | |||||||||||||||
|
|
|
|
|
|
|
|
|
|
|
| |||||||||||||
Total distributions to shareholders | 0.00 | 0.00 | 0.00 | (0.15 | ) | (0.06 | ) | (0.09 | ) | |||||||||||||||
Net asset value, end of period | $11.36 | $10.68 | $9.86 | $10.45 | $10.88 | $9.80 | ||||||||||||||||||
Total return3 | 6.37 | % | 8.32 | % | (5.65 | )% | (2.48 | )% | 11.69 | % | (9.18 | )% | ||||||||||||
Ratios to average net assets (annualized) | ||||||||||||||||||||||||
Gross expenses | 1.13 | % | 0.90 | % | 0.72 | % | 0.65 | % | 0.70 | % | 0.68 | % | ||||||||||||
Net expenses | 0.65 | % | 0.65 | % | 0.65 | % | 0.65 | % | 0.65 | % | 0.65 | % | ||||||||||||
Net investment income | 2.08 | % | 3.68 | % | 3.18 | % | 3.01 | % | 3.00 | % | 3.46 | % | ||||||||||||
Supplemental data | ||||||||||||||||||||||||
Portfolio turnover rate | 158 | % | 129 | % | 99 | % | 68 | % | 96 | % | 136 | % | ||||||||||||
Net assets, end of period (000s omitted) | $6,020 | $8,979 | $49,749 | $30,876 | $12,501 | $13,152 | ||||||||||||||||||
| 1 | For the eleven months ended September 30, 2016. The Fund changed its fiscal year end from October 31 to September 30, effective September 30, 2016. |
| 2 | Calculated based upon average shares outstanding |
| 3 | Returns for periods of less than one year are not annualized. |
The accompanying notes are an integral part of these financial statements.
24 | Wells Fargo International Bond Fund
Table of Contents
Financial highlights
(For a share outstanding throughout each period)
| Year ended September 30 | Year ended October 31, 2015 | |||||||||||||||||||||||
| ADMINISTRATOR CLASS | 2020 | 2019 | 2018 | 2017 | 20161 | |||||||||||||||||||
Net asset value, beginning of period | $10.53 | $9.75 | $10.36 | $10.80 | $9.75 | $10.84 | ||||||||||||||||||
Net investment income | 0.20 | 2 | 0.34 | 2 | 0.29 | 2 | 0.28 | 2 | 0.26 | 2 | 0.33 | 2 | ||||||||||||
Net realized and unrealized gains (losses) on investments | 0.46 | 0.44 | (0.90 | ) | (0.57 | ) | 0.85 | (1.34 | ) | |||||||||||||||
|
|
|
|
|
|
|
|
|
|
|
| |||||||||||||
Total from investment operations | 0.66 | 0.78 | (0.61 | ) | (0.29 | ) | 1.11 | (1.01 | ) | |||||||||||||||
Distributions to shareholders from | ||||||||||||||||||||||||
Net investment income | 0.00 | 0.00 | 0.00 | 0.00 | 0.00 | (0.05 | ) | |||||||||||||||||
Net realized gains | 0.00 | 0.00 | 0.00 | (0.15 | ) | (0.06 | ) | (0.03 | ) | |||||||||||||||
|
|
|
|
|
|
|
|
|
|
|
| |||||||||||||
Total distributions to shareholders | 0.00 | 0.00 | 0.00 | (0.15 | ) | (0.06 | ) | (0.08 | ) | |||||||||||||||
Net asset value, end of period | $11.19 | $10.53 | $9.75 | $10.36 | $10.80 | $9.75 | ||||||||||||||||||
Total return3 | 6.27 | % | 8.00 | % | (5.89 | )% | (2.59 | )% | 11.44 | % | (9.36 | )% | ||||||||||||
Ratios to average net assets (annualized) | ||||||||||||||||||||||||
Gross expenses | 1.44 | % | 1.24 | % | 1.01 | % | 0.97 | % | 1.02 | % | 0.99 | % | ||||||||||||
Net expenses | 0.85 | % | 0.85 | % | 0.85 | % | 0.85 | % | 0.85 | % | 0.85 | % | ||||||||||||
Net investment income | 1.87 | % | 3.37 | % | 2.93 | % | 2.80 | % | 2.85 | % | 3.26 | % | ||||||||||||
Supplemental data | ||||||||||||||||||||||||
Portfolio turnover rate | 158 | % | 129 | % | 99 | % | 68 | % | 96 | % | 136 | % | ||||||||||||
Net assets, end of period (000s omitted) | $34,221 | $18,213 | $27,911 | $41,045 | $50,825 | $266,849 | ||||||||||||||||||
| 1 | For the eleven months ended September 30, 2016. The Fund changed its fiscal year end from October 31 to September 30, effective September 30, 2016. |
| 2 | Calculated based upon average shares outstanding |
| 3 | Returns for periods of less than one year are not annualized. |
The accompanying notes are an integral part of these financial statements.
Wells Fargo International Bond Fund | 25
Table of Contents
Financial highlights
(For a share outstanding throughout each period)
| Year ended September 30 | Year ended October 31, 2015 | |||||||||||||||||||||||
| INSTITUTIONAL CLASS | 2020 | 2019 | 2018 | 2017 | 20161 | |||||||||||||||||||
Net asset value, beginning of period | $10.64 | $9.83 | $10.43 | $10.86 | $9.79 | $10.87 | ||||||||||||||||||
Net investment income | 0.22 | 2 | 0.37 | 2 | 0.31 | 2 | 0.29 | 2 | 0.27 | 2 | 0.35 | 2 | ||||||||||||
Net realized and unrealized gains (losses) on investments | 0.45 | 0.44 | (0.91 | ) | (0.57 | ) | 0.86 | (1.34 | ) | |||||||||||||||
|
|
|
|
|
|
|
|
|
|
|
| |||||||||||||
Total from investment operations | 0.67 | 0.81 | (0.60 | ) | (0.28 | ) | 1.13 | (0.99 | ) | |||||||||||||||
Distributions to shareholders from | ||||||||||||||||||||||||
Net investment income | 0.00 | 0.00 | 0.00 | 0.00 | 0.00 | (0.06 | ) | |||||||||||||||||
Net realized gains | 0.00 | 0.00 | 0.00 | (0.15 | ) | (0.06 | ) | (0.03 | ) | |||||||||||||||
|
|
|
|
|
|
|
|
|
|
|
| |||||||||||||
Total distributions to shareholders | 0.00 | 0.00 | 0.00 | (0.15 | ) | (0.06 | ) | (0.09 | ) | |||||||||||||||
Net asset value, end of period | $11.31 | $10.64 | $9.83 | $10.43 | $10.86 | $9.79 | ||||||||||||||||||
Total return3 | 6.30 | % | 8.24 | % | (5.75 | )% | (2.48 | )% | 11.60 | % | (9.20 | )% | ||||||||||||
Ratios to average net assets (annualized) | ||||||||||||||||||||||||
Gross expenses | 1.17 | % | 0.95 | % | 0.74 | % | 0.70 | % | 0.75 | % | 0.73 | % | ||||||||||||
Net expenses | 0.70 | % | 0.70 | % | 0.70 | % | 0.70 | % | 0.70 | % | 0.70 | % | ||||||||||||
Net investment income | 2.04 | % | 3.61 | % | 3.06 | % | 2.96 | % | 2.95 | % | 3.41 | % | ||||||||||||
Supplemental data | ||||||||||||||||||||||||
Portfolio turnover rate | 158 | % | 129 | % | 99 | % | 68 | % | 96 | % | 136 | % | ||||||||||||
Net assets, end of period (000s omitted) | $57,264 | $77,727 | $245,633 | $443,888 | $553,208 | $689,964 | ||||||||||||||||||
| 1 | For the eleven months ended September 30, 2016. The Fund changed its fiscal year end from October 31 to September 30, effective September 30, 2016. |
| 2 | Calculated based upon average shares outstanding |
| 3 | Returns for periods of less than one year are not annualized. |
The accompanying notes are an integral part of these financial statements.
26 | Wells Fargo International Bond Fund
Table of Contents
1. ORGANIZATION
Wells Fargo Funds Trust (the “Trust”), a Delaware statutory trust organized on March 10, 1999, is an open-end management investment company registered under the Investment Company Act of 1940, as amended (the “1940 Act”). As an investment company, the Trust follows the accounting and reporting guidance in Financial Accounting Standards Board (“FASB”) Accounting Standards Codification Topic 946, Financial Services – Investment Companies. These financial statements report on the Wells Fargo International Bond Fund (the “Fund”) which is a diversified series of the Trust.
2. SIGNIFICANT ACCOUNTING POLICIES
The following significant accounting policies, which are consistently followed in the preparation of the financial statements of the Fund, are in conformity with U.S. generally accepted accounting principles which require management to make estimates and assumptions that affect the reported amounts of assets and liabilities, disclosure of contingent assets and liabilities at the date of the financial statements, and the reported amounts of revenues and expenses during the reporting period. Actual results could differ from those estimates.
Securities valuation
All investments are valued each business day as of the close of regular trading on the New York Stock Exchange (generally 4 p.m. Eastern Time), although the Fund may deviate from this calculation time under unusual or unexpected circumstances.
Debt securities are valued at the evaluated bid price provided by an independent pricing service (e.g. taking into account various factors, including yields, maturities, or credit ratings) or, if a reliable price is not available, the quoted bid price from an independent broker-dealer.
Forward foreign currency contracts are recorded at the forward rate provided by an independent foreign currency pricing source at a time each business day specified by the Wells Fargo Asset Management Pricing Committee at Wells Fargo Funds Management, LLC (“Funds Management”).
The values of securities denominated in foreign currencies are translated into U.S. dollars at rates provided by an independent foreign currency pricing source at a time each business day specified by the Wells Fargo Asset Management Pricing Committee.
Investments in registered open-end investment companies are valued at net asset value.
Investments which are not valued using any of the methods discussed above are valued at their fair value, as determined in good faith by the Board of Trustees of the Fund. The Board of Trustees has established a Valuation Committee comprised of the Trustees and has delegated to it the authority to take any actions regarding the valuation of portfolio securities that the Valuation Committee deems necessary or appropriate, including determining the fair value of portfolio securities, unless the determination has been delegated to the Wells Fargo Asset Management Pricing Committee. The Board of Trustees retains the authority to make or ratify any valuation decisions or approve any changes to the Valuation Procedures as it deems appropriate. On a quarterly basis, the Board of Trustees receives reports on any valuation actions taken by the Valuation Committee or the Wells Fargo Asset Management Pricing Committee which may include items for ratification.
Foreign currency translation
The accounting records of the Fund are maintained in U.S. dollars. The values of other assets and liabilities denominated in foreign currencies are translated into U.S. dollars at rates provided by an independent foreign currency pricing source at a time each business day specified by the Wells Fargo Asset Management Pricing Committee. Purchases and sales of securities, and income and expenses are converted at the rate of exchange on the respective dates of such transactions. Net realized foreign exchange gains or losses arise from sales of foreign currencies, currency gains or losses realized between the trade and settlement dates on securities transactions, and the difference between the amounts of dividends, interest and foreign withholding taxes recorded and the U.S. dollar equivalent of the amounts actually paid or received. Net unrealized foreign exchange gains and losses arise from changes in the fair value of assets and liabilities other than investments in securities resulting from changes in exchange rates. The changes in net assets arising from changes in exchange rates of securities and the changes in net assets resulting from changes in market prices of securities are not separately presented. Such changes are included in net realized and unrealized gains or losses from investments.
Forward foreign currency contracts
A forward foreign currency contract is an agreement between two parties to purchase or sell a specific currency for an agreed-upon price at a future date. The Fund enters into forward foreign currency contracts to facilitate transactions in foreign-denominated securities and to attempt to minimize the risk to the Fund from adverse changes in the relationship between currencies. Forward foreign currency contracts are recorded at the forward rate and marked-to-market daily. When the contracts are closed, realized gains and losses arising from such transactions are recorded as realized gains or losses on forward
Wells Fargo International Bond Fund | 27
Table of Contents
Notes to financial statements
foreign currency contracts. The Fund is subject to foreign currency risk and may be exposed to risks if the counterparties to the contracts are unable to meet the terms of their contracts or if the value of the foreign currency changes unfavorably. The Fund’s maximum risk of loss from counterparty credit risk is the unrealized gains on the contracts. This risk may be mitigated if there is a master netting arrangement between the Fund and the counterparty.
When-issued transactions
The Fund may purchase securities on a forward commitment or when-issued basis. The Fund records a when-issued transaction on the trade date and will segregate assets in an amount at least equal in value to the Fund’s commitment to purchase when-issued securities. Securities purchased on a when-issued basis are marked-to-market daily and the Fund begins earning interest on the settlement date. Losses may arise due to changes in the market value of the underlying securities or if the counterparty does not perform under the contract.
Security transactions and income recognition
Securities transactions are recorded on a trade date basis. Realized gains or losses are recorded on the basis of identified cost.
Interest income is accrued daily and bond discounts are accreted and premiums are amortized daily. To the extent debt obligations are placed on non-accrual status, any related interest income may be reduced by writing off interest receivables when the collection of all or a portion of interest has been determined to be doubtful based on consistently applied procedures and the fair value has decreased. If the issuer subsequently resumes interest payments or when the collectability of interest is reasonably assured, the debt obligation is removed from non-accrual status.
Income from foreign securities is recorded net of foreign taxes withheld where recovery of such taxes is not assured.
Distributions to shareholders
Distributions to shareholders are recorded on the ex-dividend date and paid from net investment income quarterly and any net realized gains are paid at least annually. Such distributions are determined in accordance with income tax regulations and may differ from U.S. generally accepted accounting principles. Dividend sources are estimated at the time of declaration. The tax character of distributions is determined as of the Fund’s fiscal year end. Therefore, a portion of the Fund’s distributions made prior to the Fund’s fiscal year end may be categorized as a tax return of capital at year end.
Federal and other taxes
The Fund intends to continue to qualify as a regulated investment company by distributing substantially all of its investment company taxable income and any net realized capital gains (after reduction for capital loss carryforwards) sufficient to relieve it from all, or substantially all, federal income taxes. Accordingly, no provision for federal income taxes was required.
The Fund’s income and federal excise tax returns and all financial records supporting those returns for the prior three fiscal years are subject to examination by the federal and Delaware revenue authorities. Management has analyzed the Fund’s tax positions taken on federal, state, and foreign tax returns for all open tax years and does not believe that there are any uncertain tax positions that require recognition of a tax liability.
As of September 30, 2020, the aggregate cost of all investments for federal income tax purposes was $106,832,876 and the unrealized gains (losses) consisted of:
Gross unrealized gains | $ | 3,325,969 | ||
Gross unrealized losses | (1,418,344 | ) | ||
Net unrealized gains | $ | 1,907,625 | ||
Reclassifications are made to the Fund’s capital accounts for permanent tax differences to reflect income and gains available for distribution (or available capital loss carryforwards) under federal income tax regulations. U.S. generally accepted accounting principles require that certain components of net assets be adjusted to reflect permanent differences between financial and tax reporting. These reclassifications have no effect on net assets or net asset values per share. The primary permanent difference causing such reclassification is due to net operating losses. At September 30, 2020, as a result of permanent book-to-tax differences, the following reclassification adjustments were made on the Statement of Assets and Liabilities:
| Paid-in capital | Total distributable loss | |
| $(7,952,111) | $7,952,111 | |
As of September 30, 2020, the Fund had capital loss carryforwards which consist of $810,128 in short-term capital losses and $3,299,562 in long-term capital losses.
28 | Wells Fargo International Bond Fund
Table of Contents
Notes to financial statements
As of September 30, 2020, the Fund had a qualified late-year ordinary loss of $1,142,908 which will be recognized on the first day of the following fiscal year.
Class allocations
The separate classes of shares offered by the Fund differ principally in applicable sales charges, distribution, shareholder servicing, and administration fees. Class specific expenses are charged directly to that share class. Investment income, common fund-level expenses, and realized and unrealized gains (losses) on investments are allocated daily to each class of shares based on the relative proportion of net assets of each class.
3. FAIR VALUATION MEASUREMENTS
Fair value measurements of investments are determined within a framework that has established a fair value hierarchy based upon the various data inputs utilized in determining the value of the Fund’s investments. The three-level hierarchy gives the highest priority to unadjusted quoted prices in active markets for identical assets or liabilities (Level 1) and the lowest priority to unobservable inputs (Level 3). The Fund’s investments are classified within the fair value hierarchy based on the lowest level of input that is significant to the fair value measurement. The inputs are summarized into three broad levels as follows:
| ∎ | Level 1 – quoted prices in active markets for identical securities |
| ∎ | Level 2 – other significant observable inputs (including quoted prices for similar securities, interest rates, prepayment speeds, credit risk, etc.) |
| ∎ | Level 3 – significant unobservable inputs (including the Fund’s own assumptions in determining the fair value of investments) |
The inputs or methodologies used for valuing investments in securities are not necessarily an indication of the risk associated with investing in those securities.
The following is a summary of the inputs used in valuing the Fund’s assets and liabilities as of September 30, 2020:
| Quoted prices (Level 1) | Other significant observable inputs (Level 2) | Significant (Level 3) | Total | |||||||||||||
Assets | ||||||||||||||||
Investments in: | ||||||||||||||||
Corporate bonds and notes | $ | 0 | $ | 9,417,827 | $ | 0 | $ | 9,417,827 | ||||||||
Foreign corporate bonds and notes | 0 | 19,884,766 | 0 | 19,884,766 | ||||||||||||
Foreign government bonds | 0 | 71,115,196 | 0 | 71,115,196 | ||||||||||||
U.S. Treasury securities | 4,132,357 | 0 | 0 | 4,132,357 | ||||||||||||
Yankee corporate bonds and notes | 0 | 3,133,061 | 0 | 3,133,061 | ||||||||||||
Short-term investments | ||||||||||||||||
Investment companies | 1,002,714 | 0 | 0 | 1,002,714 | ||||||||||||
| 5,135,071 | 103,550,850 | 0 | 108,685,921 | |||||||||||||
Forward foreign currency contracts | 0 | 522,737 | 0 | 522,737 | ||||||||||||
Total assets | $ | 5,135,071 | $ | 104,073,587 | $ | 0 | $ | 109,208,658 | ||||||||
Liabilities | ||||||||||||||||
Forward foreign currency contracts | $ | 0 | $ | 468,157 | $ | 0 | $ | 468,157 | ||||||||
Total liabilities | $ | 0 | $ | 468,157 | $ | 0 | $ | 468,157 | ||||||||
Additional sector, industry or geographic detail is included in the Portfolio of Investments.
Forward foreign currency contracts are reported at their cumulative unrealized gains (losses) at measurement date as reported in the table following the Portfolio of Investments. All other assets and liabilities are reported at their market value at measurement date.
For the year ended September 30, 2020, the Fund did not have any transfers into/out of Level 3.
Wells Fargo International Bond Fund | 29
Table of Contents
Notes to financial statements
4. TRANSACTIONS WITH AFFILIATES
Management fee
Funds Management, an indirect wholly owned subsidiary of Wells Fargo & Company (“Wells Fargo”), is the manager of the Fund and provides advisory and fund-level administrative services under an investment management agreement. Under the investment management agreement, Funds Management is responsible for, among other services, implementing the investment objectives and strategies of the Fund, supervising the subadviser and providing fund-level administrative services in connection with the Fund’s operations. As compensation for its services under the investment management agreement, Funds Management is entitled to receive a management fee at the following annual rate based on the Fund’s average daily net assets:
| Average daily net assets | Management fee | |||
First $500 million | 0.600 | % | ||
Next $500 million | 0.575 | |||
Next $2 billion | 0.550 | |||
Next $2 billion | 0.525 | |||
Next $5 billion | 0.490 | |||
Over $10 billion | 0.480 | |||
For the year ended September 30, 2020, the management fee was equivalent to an annual rate of 0.60% of the Fund’s average daily net assets.
Funds Management has retained the services of a subadviser to provide daily portfolio management to the Fund. The fee for subadvisory services is borne by Funds Management. Wells Fargo Asset Management (International) Limited, an affiliate of Funds Management and an indirect wholly owned subsidiary of Wells Fargo, is the subadviser to the Fund and is entitled to receive a fee from Funds Management at an annual rate starting at 0.35% and declining to 0.20% as the average daily net assets of the Fund increase.
Administration fees
Under a class-level administration agreement, Funds Management provides class-level administrative services to the Fund, which includes paying fees and expenses for services provided by the transfer agent, sub-transfer agents, omnibus account servicers and record-keepers. As compensation for its services under the class-level administration agreement, Funds Management receives an annual fee which is calculated based on the average daily net assets of each class as follows:
| Class-level administration fee | ||||
Class A, Class C | 0.16 | % | ||
Class R6 | 0.03 | |||
Administrator Class | 0.10 | |||
Institutional Class | 0.08 | |||
Waivers and/or expense reimbursements
Funds Management has contractually waived and/or reimbursed management and administration fees to the extent necessary to maintain certain net operating expense ratios for the Fund. When each class of the Fund has exceeded its expense cap, Funds Management has waived fees and/or reimbursed expenses from fund-level expenses on a proportionate basis and then from class specific expenses. When only certain classes exceed their expense caps, waivers and/or reimbursements are applied against class specific expenses before fund-level expenses. Funds Management has committed through January 31, 2021 to waive fees and/or reimburse expenses to the extent necessary to cap the Fund’s expenses at 1.03% for Class A shares, 1.78% for Class C shares, 0.65% for Class R6 shares, 0.85% for Administrator Class shares, and 0.70% for Institutional Class shares. Prior to or after the commitment expiration date, the cap may be increased or the commitment to maintain the cap may be terminated only with the approval of the Board of Trustees.
Distribution fee
The Trust has adopted a distribution plan for Class C shares of the Fund pursuant to Rule 12b-1 under the 1940 Act. A distribution fee is charged to Class C shares and paid to Wells Fargo Funds Distributor, LLC (“Funds Distributor”), the principal underwriter, at an annual rate of 0.75% of the average daily net assets of Class C shares.
30 | Wells Fargo International Bond Fund
Table of Contents
Notes to financial statements
In addition, Funds Distributor is entitled to receive the front-end sales charge from the purchase of Class A shares and a contingent deferred sales charge on the redemption of certain Class A shares. Funds Distributor is also entitled to receive the contingent deferred sales charges from redemptions of Class C shares. For the year ended September 30, 2020, Funds Distributor received $249 from the sale of Class A shares. No contingent deferred sales charges were incurred by Class A and Class C shares for the year ended September 30, 2020.
Shareholder servicing fees
The Trust has entered into contracts with one or more shareholder servicing agents, whereby Class A, Class C, and Administrator Class of the Fund are charged a fee at an annual rate of 0.25% of the average daily net assets of each respective class. A portion of these total shareholder servicing fees were paid to affiliates of Wells Fargo.
Interfund transactions
The Fund may purchase or sell portfolio investment securities to certain other Wells Fargo affiliates pursuant to Rule 17a-7 under the 1940 Act and under procedures adopted by the Board of Trustees. The procedures have been designed to ensure that these interfund transactions, which do not incur broker commissions, are effected at current market prices.
Other transactions
On August 14, 2020, Class A and Class C of the Fund were reimbursed by Funds Management in the amount of $11 and $3,868 respectively. The reimbursements were made in connection with resolving certain fee reimbursements.
5. INVESTMENT PORTFOLIO TRANSACTIONS
Purchases and sales of investments, excluding short-term securities, for the year ended September 30, 2020 were as follows:
Purchases at cost | Sales proceeds | |||||
| U.S. government | Non-U.S. government | U.S. government | Non-U.S. government | |||
| $11,627,709 | $142,571,363 | $14,460,013 | $149,058,149 | |||
6. DERIVATIVE TRANSACTIONS
During the year ended September 30, 2020, the Fund entered into forward foreign currency contracts for hedging purposes. The Fund had average contract amounts of $63,877,842 and $45,773,959 in forward foreign currency contracts to buy and forward foreign currency contracts to sell, respectively, during the year ended September 30, 2020.
The fair value, realized gains or losses and change in unrealized gains or losses, if any, on derivative instruments are reflected in the corresponding financial statement captions.
For certain types of derivative transactions, the Fund has entered into International Swaps and Derivatives Association, Inc. master agreements (“ISDA Master Agreements”) or similar agreements with approved counterparties. The ISDA Master Agreements or similar agreements may have requirements to deliver/deposit securities or cash to/with an exchange or broker-dealer as collateral and allows the Fund to offset, with each counterparty, certain derivative financial instrument’s assets and/or liabilities with collateral held or pledged. Collateral requirements differ by type of derivative. Collateral or margin requirements are set by the broker or exchange clearinghouse for exchange traded derivatives while collateral terms are contract specific for over-the-counter traded derivatives. Cash collateral that has been pledged to cover obligations of the Fund under ISDA Master Agreements or similar agreements, if any, are reported separately in the Statement of Assets and Liabilities. Securities pledged as collateral, if any, are noted in the Portfolio of Investments. With respect to balance sheet offsetting, absent an event of default by the counterparty or a termination of the agreement, the reported amounts of financial assets and financial liabilities in the Statement of Assets and Liabilities are not offset across transactions between the Fund and the applicable counterparty. A reconciliation of the gross amounts on the Statement of Assets and Liabilities to the net amounts by counterparty, including any collateral exposure, for OTC derivatives is as follows:
| Counterparty | Gross amounts of assets in the Statement of Assets and Liabilities | Amounts subject to netting agreements | Collateral received | Net amount of assets | ||||||||
State Street Bank | $522,737 | $(468,157) | $ | 0 | $ | 54,580 | ||||||
Wells Fargo International Bond Fund | 31
Table of Contents
Notes to financial statements
| Counterparty | Gross amounts of liabilities in the Statement of Assets and Liabilities | Amounts subject to netting agreements | Collateral pledged | Net amount of liabilities | ||||||||
State Street Bank | $468,157 | $(468,157) | $ | 0 | $ | 0 | ||||||
7. BANK BORROWINGS
The Trust (excluding the money market funds), Wells Fargo Master Trust and Wells Fargo Variable Trust are parties to a $350,000,000 revolving credit agreement whereby the Fund is permitted to use bank borrowings for temporary or emergency purposes, such as to fund shareholder redemption requests. Interest under the credit agreement is charged to the Fund based on a borrowing rate equal to the higher of the Federal Funds rate in effect on that day plus 1.25% or the overnight LIBOR rate in effect on that day plus 1.25%. In addition, an annual commitment fee equal to 0.25% of the unused balance is allocated to each participating fund.
For the year ended September 30, 2020, the Fund had average borrowings outstanding of $55,556 at an average interest rate of 1.35% and paid interest in the amount of $750.
8. DISTRIBUTIONS TO SHAREHOLDERS
For the years ended September 30, 2020 and September 30, 2019, the Fund did not pay any distributions to shareholders.
As of September 30, 2020, the components of distributable earnings on a tax basis were as follows:
Unrealized gains | Late-year ordinary losses deferred | Capital loss carryforward | ||
| $1,907,229 | $(1,142,908) | $(4,109,690) | ||
9. INDEMNIFICATION
Under the Fund’s organizational documents, the officers and Trustees have been granted certain indemnification rights against certain liabilities that may arise out of performance of their duties to the Fund. The Fund has entered into a separate agreement with each Trustee that converts indemnification rights currently existing under the Fund’s organizational documents into contractual rights that cannot be changed in the future without the consent of the Trustee. Additionally, in the normal course of business, the Fund may enter into contracts with service providers that contain a variety of indemnification clauses. The Fund’s maximum exposure under these arrangements is dependent on future claims that may be made against the Fund and, therefore, cannot be estimated.
10. NEW ACCOUNTING PRONOUNCEMENTS
In August 2018, FASB issued Accounting Standards Update (“ASU”) No. 2018-13, Fair Value Measurement (Topic 820) Disclosure Framework—Changes to the Disclosure Requirements for Fair Value Measurement. ASU 2018-13 updates the disclosure requirements on fair value measurements in Topic 820, Fair Value Measurements. The amendments are effective for fiscal years, and interim periods within those fiscal years, beginning after December 15, 2019. Management has adopted this guidance which did not have a material impact on the financial statements.
11. CORONAVIRUS (COVID-19) PANDEMIC
On March 11, 2020, the World Health Organization announced that it had made the assessment that coronavirus disease 2019 (“COVID-19”) is a pandemic. The impacts of COVID-19 are adversely affecting the entire global economy, individual companies and investment products, and the market in general. There is significant uncertainty around the extent and duration of business disruptions related to COVID-19 and the impacts may be short term or may last for an extended period of time. The risk of further spreading of COVID-19 has led to significant uncertainty and volatility in the financial markets.
32 | Wells Fargo International Bond Fund
Table of Contents
Report of independent registered public accounting firm
To the Shareholders of the Fund and Board of Trustees
Wells Fargo Funds Trust:
Opinion on the Financial Statements
We have audited the accompanying statement of assets and liabilities of Wells Fargo International Bond Fund (the Fund), one of the funds constituting Wells Fargo Funds Trust, including the portfolio of investments, as of September 30, 2020, the related statement of operations for the year then ended, the statements of changes in net assets for each of the years in the two-year period then ended, and the related notes (collectively, the financial statements) and the financial highlights for each of the years in the four-year period then ended, for the period ended September 30, 2016, and for the year ended October 31, 2015. In our opinion, the financial statements and financial highlights present fairly, in all material respects, the financial position of the Fund as of September 30, 2020, the results of its operations for the year then ended, the changes in its net assets for each of the years in the two-year period then ended, and the financial highlights for each of the years in the four-year period then ended, for the period ended September 30, 2016, and for the year ended October 31, 2015, in conformity with U.S. generally accepted accounting principles.
Basis for Opinion
These financial statements and financial highlights are the responsibility of the Fund’s management. Our responsibility is to express an opinion on these financial statements and financial highlights based on our audits. We are a public accounting firm registered with the Public Company Accounting Oversight Board (United States) (PCAOB) and are required to be independent with respect to the Fund in accordance with the U.S. federal securities laws and the applicable rules and regulations of the Securities and Exchange Commission and the PCAOB.
We conducted our audits in accordance with the standards of the PCAOB. Those standards require that we plan and perform the audit to obtain reasonable assurance about whether the financial statements and financial highlights are free of material misstatement, whether due to error or fraud. Our audits included performing procedures to assess the risks of material misstatement of the financial statements and financial highlights, whether due to error or fraud, and performing procedures that respond to those risks. Such procedures included examining, on a test basis, evidence regarding the amounts and disclosures in the financial statements and financial highlights. Such procedures also included confirmation of securities owned as of September 30, 2020, by correspondence with the custodian, transfer agent and brokers, or by other appropriate auditing procedures. Our audits also included evaluating the accounting principles used and significant estimates made by management, as well as evaluating the overall presentation of the financial statements and financial highlights. We believe that our audits provide a reasonable basis for our opinion.

We have not been able to determine the specific year that we began serving as the auditor of one or more Wells Fargo Funds investment companies; however we are aware that we have served as the auditor of one or more Wells Fargo Funds investment companies since at least 1955.
Boston, Massachusetts
November 24, 2020
Wells Fargo International Bond Fund | 33
Table of Contents
PROXY VOTING INFORMATION
A description of the policies and procedures used to determine how to vote proxies relating to portfolio securities is available, upon request, by calling 1-800-222-8222, visiting our website at wfam.com, or visiting the SEC website at sec.gov. Information regarding how the proxies related to portfolio securities were voted during the most recent 12-month period ended June 30 is available on the website at wfam.com or by visiting the SEC website at sec.gov.
QUARTERLY PORTFOLIO HOLDINGS INFORMATION
The Fund files its complete schedule of portfolio holdings with the SEC for the first and third quarters of each fiscal year as an exhibit to its reports on Form N-PORT. Shareholders may view the filed Form N-PORT by visiting the SEC website at sec.gov.
34 | Wells Fargo International Bond Fund
Table of Contents
Other information (unaudited)
BOARD OF TRUSTEES AND OFFICERS
Each of the Trustees and Officers1 listed in the table below acts in identical capacities for each fund in the Wells Fargo family of funds, which consists of 142 mutual funds comprising the Wells Fargo Funds Trust, Wells Fargo Variable Trust, Wells Fargo Master Trust and four closed-end funds (collectively the “Fund Complex”). This table should be read in conjunction with the Prospectus and the Statement of Additional Information2. The mailing address of each Trustee and Officer is 525 Market Street, 12th Floor, San Francisco, CA 94105. Each Trustee and Officer serves an indefinite term, however, each Trustee serves such term until reaching the mandatory retirement age established by the Trustees.
Independent Trustees
Name and year of birth | Position held and length of service* | Principal occupations during past five years or longer | Current other public company or investment company directorships | |||
| William R. Ebsworth (Born 1957) | Trustee, since 2015 | Retired. From 1984 to 2013, equities analyst, portfolio manager, research director and chief investment officer at Fidelity Management and Research Company in Boston, Tokyo, and Hong Kong, and retired in 2013 as Chief Investment Officer of Fidelity Strategic Advisers, Inc. where he led a team of investment professionals managing client assets. Prior thereto, Board member of Hong Kong Securities Clearing Co., Hong Kong Options Clearing Corp., the Thailand International Fund, Ltd., Fidelity Investments Life Insurance Company, and Empire Fidelity Investments Life Insurance Company. Audit Committee Chair and Investment Committee Chair of the Vincent Memorial Hospital Endowment (non-profit organization). Mr. Ebsworth is a CFA® charterholder. | N/A | |||
| Jane A. Freeman (Born 1953) | Trustee, since 2015; Chair Liaison, since 2018 | Retired. From 2012 to 2014 and 1999 to 2008, Chief Financial Officer of Scientific Learning Corporation. From 2008 to 2012, Ms. Freeman provided consulting services related to strategic business projects. Prior to 1999, Portfolio Manager at Rockefeller & Co. and Scudder, Stevens & Clark. Board member of the Harding Loevner Funds from 1996 to 2014, serving as both Lead Independent Director and chair of the Audit Committee. Board member of the Russell Exchange Traded Funds Trust from 2011 to 2012 and the chair of the Audit Committee. Ms. Freeman is also an inactive Chartered Financial Analyst. | N/A | |||
| Isaiah Harris, Jr. (Born 1952) | Trustee, since 2009; Audit Committee Chairman, since 2019 | Retired. Chairman of the Board of CIGNA Corporation since 2009, and Director since 2005. From 2003 to 2011, Director of Deluxe Corporation. Prior thereto, President and CEO of BellSouth Advertising and Publishing Corp. from 2005 to 2007, President and CEO of BellSouth Enterprises from 2004 to 2005 and President of BellSouth Consumer Services from 2000 to 2003. Emeritus member of the Iowa State University Foundation Board of Governors. Emeritus Member of the Advisory Board of Iowa State University School of Business. Advisory Board Member, Palm Harbor Academy (private school). Mr. Harris is a certified public accountant (inactive status). | CIGNA Corporation | |||
| Judith M. Johnson (Born 1949) | Trustee, since 2008 | Retired. Prior thereto, Chief Executive Officer and Chief Investment Officer of Minneapolis Employees Retirement Fund from 1996 to 2008. Ms. Johnson is an attorney, certified public accountant and a certified managerial accountant. | N/A | |||
| David F. Larcker (Born 1950) | Trustee, since 2009 | James Irvin Miller Professor of Accounting at the Graduate School of Business (Emeritus), Stanford University, Director of the Corporate Governance Research Initiative and Senior Faculty of The Rock Center for Corporate Governance since 2006. From 2005 to 2008, Professor of Accounting at the Graduate School of Business, Stanford University. Prior thereto, Ernst & Young Professor of Accounting at The Wharton School, University of Pennsylvania from 1985 to 2005. | N/A | |||
Wells Fargo International Bond Fund | 35
Table of Contents
Other information (unaudited)
Name and year of birth | Position held and length of service* | Principal occupations during past five years or longer | Current other public company or investment company directorships | |||
| Olivia S. Mitchell (Born 1953) | Trustee, since 2006; Nominating and Governance Committee Chair, since 2018 | International Foundation of Employee Benefit Plans Professor, Wharton School of the University of Pennsylvania since 1993. Director of Wharton’s Pension Research Council and Boettner Center on Pensions & Retirement Research, and Research Associate at the National Bureau of Economic Research. Previously, Cornell University Professor from 1978 to 1993. | N/A | |||
| Timothy J. Penny (Born 1951) | Trustee, since 1996; Chairman, since 2018 | President and Chief Executive Officer of Southern Minnesota Initiative Foundation, a non-profit organization, since 2007. Member of the Board of Trustees of NorthStar Education Finance, Inc., a non-profit organization, since 2007. | N/A | |||
| James G. Polisson (Born 1959) | Trustee, since 2018 | Retired. Chief Marketing Officer, Source (ETF) UK Services, Ltd, from 2015 to 2017. From 2012 to 2015, Principal of The Polisson Group, LLC, a management consulting, corporate advisory and principal investing company. Chief Executive Officer and Managing Director at Russell Investments, Global Exchange Traded Funds from 2010 to 2012. Managing Director of Barclays Global Investors from 1998 to 2010 and Global Chief Marketing Officer for iShares and Barclays Global Investors from 2000 to 2010. Trustee of the San Francisco Mechanics’ Institute, a non-profit organization, from 2013 to 2015. Board member of the Russell Exchange Traded Fund Trust from 2011 to 2012. Director of Barclays Global Investors Holdings Deutschland GmbH from 2006 to 2009. Mr. Polisson is an attorney and has a retired status with the Massachusetts and District of Columbia Bar Associations. | N/A | |||
| Pamela Wheelock (Born 1959) | Trustee, since January 2020; previously Trustee from January 2018 to July 2019 | Board member of the Destination Medical Center Economic Development Agency, Rochester, Minnesota since 2019. Interim President of the McKnight Foundation from January to September 2020. Acting Commissioner, Minnesota Department of Human Services, July 2019 through September 2019. Human Services Manager (part-time), Minnesota Department of Human Services, October 2019 through December 2019. Chief Operating Officer, Twin Cities Habitat for Humanity from 2017 to 2019. Vice President of University Services, University of Minnesota from 2012 to 2016. Prior thereto, on the Board of Directors, Governance Committee and Finance Committee for the Minnesota Philanthropy Partners (Saint Paul Foundation) from 2012 to 2018, Interim Chief Executive Officer of Blue Cross Blue Shield of Minnesota from 2011 to 2012, Chairman of the Board from 2009 to 2012 and Board Director from 2003 to 2015. Vice President, Leadership and Community Engagement, Bush Foundation, Saint Paul, Minnesota (a private foundation) from 2009 to 2011. Executive Vice President and Chief Financial Officer, Minnesota Sports and Entertainment from 2004 to 2009 and Senior Vice President from 2002 to 2004. Executive Vice President of the Minnesota Wild Foundation from 2004 to 2008. Commissioner of Finance, State of Minnesota, from 1999 to 2002. Currently Board Chair of the Minnesota Wild Foundation since 2010. | N/A | |||
| * | Length of service dates reflect the Trustee’s commencement of service with the Trust’s predecessor entities, where applicable. |
36 | Wells Fargo International Bond Fund
Table of Contents
Other information (unaudited)
Officers
Name and year of birth | Position held and length of service | Principal occupations during past five years or longer | ||
| Andrew Owen (Born 1960) | President, since 2017 | Executive Vice President of Wells Fargo & Company and Head of Affiliated Managers, Wells Fargo Asset Management, since 2014. In addition, Mr. Owen is currently President, Chief Executive Officer and Director of Wells Fargo Funds Management, LLC since 2017. Prior thereto, Executive Vice President responsible for marketing, investments and product development for Wells Fargo Funds Management, LLC, from 2009 to 2014. | ||
| Nancy Wiser1 (Born 1967) | Treasurer, since 2012 | Executive Vice President of Wells Fargo Funds Management, LLC since 2011. Chief Operating Officer and Chief Compliance Officer at LightBox Capital Management LLC, from 2008 to 2011. | ||
| Michelle Rhee (Born 1966) | Chief Legal Officer, since 2019 | Secretary of Wells Fargo Funds Management, LLC, Chief Legal Counsel of Wells Fargo Asset Management and Assistant General Counsel of Wells Fargo Bank, N.A. since 2018. Associate General Counsel and Managing Director of Bank of America Corporation from 2004 to 2018. | ||
| Catherine Kennedy (Born 1969) | Secretary, since 2019 | Vice President of Wells Fargo Funds Management, LLC and Senior Counsel of the Wells Fargo Legal Department since 2010. Vice President and Senior Counsel of Evergreen Investment Management Company, LLC from 1998 to 2010. | ||
| Michael H. Whitaker (Born 1967) | Chief Compliance Officer, since 2016 | Chief Compliance Officer of Wells Fargo Asset Management since 2016. Senior Vice President and Chief Compliance Officer for Fidelity Investments from 2007 to 2016. | ||
| Jeremy DePalma1 (Born 1974) | Assistant Treasurer, since 2009 | Senior Vice President of Wells Fargo Funds Management, LLC since 2009. Senior Vice President of Evergreen Investment Management Company, LLC from 2008 to 2010 and head of the Fund Reporting and Control Team within Fund Administration from 2005 to 2010. | ||
| 1 | Nancy Wiser acts as Treasurer of 65 funds in the Fund Complex. Jeremy DePalma acts as the Treasurer of 77 funds and Assistant Treasurer of 65 funds in the Fund Complex. |
| 2 | The Statement of Additional Information includes additional information about the Trustees and is available, without charge, upon request, by calling 1-800-222-8222 or by visiting the website at wfam.com. |
Wells Fargo International Bond Fund | 37
Table of Contents
Other information (unaudited)
BOARD CONSIDERATION OF INVESTMENT MANAGEMENT AND SUB-ADVISORY AGREEMENTS:
Wells Fargo International Bond Fund
Under the Investment Company Act of 1940 (the “1940 Act”), the Board of Trustees (the “Board”) of Wells Fargo Funds Trust (the “Trust”) must determine annually whether to approve the continuation of the Trust’s investment management and sub-advisory agreements. In this regard, at a Board meeting held on May 26, 2020 and May 28, 2020 (together, the “Meeting”), the Board, all the members of which have no direct or indirect interest in the investment management and sub-advisory agreements and are not “interested persons” of the Trust, as defined in the 1940 Act (the “Independent Trustees”), reviewed and approved for Wells Fargo International Bond Fund (the “Fund”): (i) an investment management agreement (the “Management Agreement”) with Wells Fargo Funds Management, LLC (“Funds Management”); and (ii) an investment sub-advisory agreement (the “Sub-Advisory Agreement”) with Wells Fargo Asset Management (International) Limited (the “Sub-Adviser”), an affiliate of Funds Management. The Management Agreement and the Sub-Advisory Agreement are collectively referred to as the “Advisory Agreements.”
At the Meeting, the Board considered the factors and reached the conclusions described below relating to the selection of Funds Management and the Sub-Adviser and the approval of the Advisory Agreements. Prior to the Meeting, including at a Board meeting held in April 2020, the Trustees conferred extensively among themselves and with representatives of Funds Management about these matters. Also, the Board has adopted a team-based approach, with each team consisting of a sub-set of Trustees, to assist the full Board in the discharge of its duties in reviewing investment performance and other matters throughout the year. The Independent Trustees were assisted in their evaluation of the Advisory Agreements by independent legal counsel, from whom they received separate legal advice and with whom they met separately.
In providing information to the Board, Funds Management and the Sub-Adviser were guided by a detailed set of requests for information submitted to them by independent legal counsel on behalf of the Independent Trustees at the start of the Board’s annual contract renewal process earlier in 2020. In considering and approving the Advisory Agreements, the Trustees considered the information they believed relevant, including but not limited to the information discussed below. The Board considered not only the specific information presented in connection with the Meeting, but also the knowledge gained over time through interaction with Funds Management and the Sub-Adviser about various topics. In this regard, the Board reviewed reports of Funds Management at each of its quarterly meetings, which included, among other things, portfolio reviews and investment performance reports. In addition, the Board and the teams mentioned above confer with portfolio managers at various times throughout the year. The Board did not identify any particular information or consideration that was all-important or controlling, and each individual Trustee may have attributed different weights to various factors.
After its deliberations, the Board unanimously approved the continuation of the Advisory Agreements for a one-year term and determined that the compensation payable to Funds Management and the Sub-Adviser under each of the Advisory Agreements was reasonable. The Board considered the approval of the Advisory Agreements for the Fund as part of its consideration of agreements for funds across the complex, but its approvals were made on a fund-by-fund basis. The following summarizes a number of important, but not necessarily all, factors considered by the Board in support of its approvals.
Nature, extent and quality of services
The Board received and considered various information regarding the nature, extent and quality of services provided to the Fund by Funds Management and the Sub-Adviser under the Advisory Agreements. This information included a description of the investment advisory services and Fund-level administrative services covered by the Management Agreement, as well as, among other things, a summary of the background and experience of senior management of Wells Fargo Asset Management (“WFAM”), of which Funds Management and the Sub-Adviser are a part, and a summary of investments made in the business of WFAM. The Board also received a description of Funds Management’s and the Sub-Adviser’s business continuity plans and of their approaches to data privacy and cybersecurity, and related testing. The Board also received and reviewed information about Funds Management’s role as administrator of the Fund’s liquidity risk management program, Funds Management’s approach to risk management, and Funds Management’s intermediary and vendor oversight program.
The Board also considered the qualifications, background, tenure and responsibilities of each of the portfolio managers primarily responsible for the day-to-day portfolio management of the Fund. The Board evaluated the ability of Funds Management and the Sub-Adviser to attract and retain qualified investment professionals, including research, advisory and supervisory personnel. The Board further considered the compliance programs and compliance records of Funds Management and the Sub-Adviser. In addition, the Board took into account the full range of services provided to the Fund by Funds Management and its affiliates.
38 | Wells Fargo International Bond Fund
Table of Contents
Other information (unaudited)
Fund investment performance and expenses
The Board considered the investment performance results for the Fund over various time periods ended December 31, 2019. The Board also considered more current results for various time periods ended March 31, 2020. The Board considered these results in comparison to the investment performance of funds in a universe that was determined by Broadridge Inc. (“Broadridge”) to be similar to the Fund (the “Universe”), and in comparison to the Fund’s benchmark index and to other comparative data. Broadridge is an independent provider of investment company data. The Board received a description of the methodology used by Broadridge to select the mutual funds in the performance Universe. The Board noted that the investment performance of the Fund (Class A) was higher than the average investment performance of the Universe for the one- and three-year periods ended December 31, 2019, and lower than the average investment performance of the Universe for the five- and ten-year periods ended December 31, 2019. The Board also noted that the investment performance of the Fund (Administrator Class) was higher than the average investment performance of the Universe for the one-, three- and five-year periods ended March 31, 2020, and lower than the average investment performance of the Universe for the ten-year period ended March 31, 2020. The Board also noted that the investment performance of the Fund was higher than or in range of its benchmark index, the Bloomberg Barclays Global Aggregate ex-USD Index, for the one-, three- and ten-year periods ended December 31, 2019, and lower than its benchmark index for the five-year period ended December 31, 2019. The Board also noted that the investment performance of the Fund was lower than its benchmark index, the Bloomberg Barclays Global Aggregate ex-USD Index, for the three-, five- and ten-year periods ended March 31, 2020, and higher than its benchmark for the one-year period ended March 31, 2020.
The Board also received and considered information regarding the Fund’s net operating expense ratios and their various components, including actual management fees, custodian and other non-management fees, and Rule 12b-1 and non-Rule 12b-1 shareholder service fees. The Board considered these ratios in comparison to the median ratios of funds in class-specific expense groups that were determined by Broadridge to be similar to the Fund (the “Groups”). The Board received a description of the methodology used by Broadridge to select the mutual funds in the expense Groups and an explanation of how funds comprising expense groups and their expense ratios may vary from year-to-year. Based on the Broadridge reports, the Board noted that the net operating expense ratios of the Fund were lower than or equal to the median net operating expense ratios of the expense Groups for each share class.
The Board took into account the Fund’s investment performance and expense information provided to it among the factors considered in deciding to re-approve the Advisory Agreements.
Investment management and sub-advisory fee rates
The Board reviewed and considered the contractual fee rates payable by the Fund to Funds Management under the Management Agreement, as well as the contractual fee rates payable by the Fund to Funds Management for class-level administrative services under a Class-Level Administration Agreement, which include, among other things, class-level transfer agency and sub-transfer agency costs (collectively, the “Management Rates”). The Board also reviewed and considered the contractual investment sub-advisory fee rates that are payable by Funds Management to the Sub-Adviser for investment sub-advisory services.
Among other information reviewed by the Board was a comparison of the Fund’s Management Rates with the average contractual investment management fee rates of funds in the expense Groups at a common asset level as well as transfer agency costs of the funds in the expense Groups. The Board noted that the Management Rates of the Fund were lower than or in range of the sum of these average rates for the Fund’s expense Groups for all share classes.
The Board also received and considered information about the portion of the total management fee that was retained by Funds Management after payment of the fee to the Sub-Adviser for sub-advisory services. In assessing the reasonableness of this amount, the Board received and evaluated information about the nature and extent of responsibilities retained and risks assumed by Funds Management and not delegated to or assumed by the Sub-Adviser, and about Funds Management’s on-going oversight services. Given the affiliation between Funds Management and the Sub-Adviser, the Board ascribed limited relevance to the allocation of fees between them.
The Board also received and considered information about the nature and extent of services offered and fee rates charged by Funds Management and the Sub-Adviser to other types of clients with investment strategies similar to those of the Fund. In this regard, the Board received information about the significantly greater scope of services, and compliance, reporting and other legal burdens and risks of managing proprietary mutual funds compared with those associated with managing assets of other types of clients, including third-party sub-advised fund clients and non-mutual fund clients such as institutional separate accounts.
Wells Fargo International Bond Fund | 39
Table of Contents
Other information (unaudited)
Based on its consideration of the factors and information it deemed relevant, including those described here, the Board determined that the compensation payable to Funds Management under the Management Agreement and to the Sub-Adviser under the Sub-Advisory Agreement was reasonable.
Profitability
The Board received and considered information concerning the profitability of Funds Management, as well as the profitability of both WFAM and Wells Fargo & Co. (“Wells Fargo”) from providing services to the fund family as a whole. The Board noted that the Sub-Adviser’s profitability information with respect to providing services to the Fund and other funds in the family was subsumed in the WFAM and Wells Fargo profitability analysis.
Funds Management reported on the methodologies and estimates used in calculating profitability, including a description of the methodology used to allocate certain expenses. Among other things, the Board noted that the levels of profitability reported on a fund-by-fund basis varied widely, depending on factors such as the size, type and age of fund.
Based on its review, the Board did not deem the profits reported by Funds Management, WFAM or Wells Fargo from services provided to the Fund to be at a level that would prevent it from approving the continuation of the Advisory Agreements.
Economies of scale
The Board received and considered information about the potential for Funds Management to experience economies of scale in the provision of management services to the Fund, the difficulties of calculating economies of scale at an individual fund level, and the extent to which potential scale benefits are shared with shareholders. The Board noted the existence of breakpoints in the Fund’s management fee structure, which operate generally to reduce the Fund’s expense ratios as the Fund grows in size, and the size of the Fund in relation to such breakpoints. The Board considered that in addition to management fee breakpoints, Funds Management shares potential economies of scale from its management business in a variety of ways, including through fee waiver and expense reimbursement arrangements, services that benefit shareholders, competitive management fee rates set at the outset without regard to breakpoints, and investments in the business intended to enhance services available to shareholders.
The Board concluded that Funds Management’s arrangements with respect to the Fund, including contractual breakpoints, constituted a reasonable approach to sharing potential economies of scale with the Fund and its shareholders.
Other benefits to Funds Management and the Sub-Adviser
The Board received and considered information regarding potential “fall-out” or ancillary benefits received by Funds Management and its affiliates, including the Sub-Adviser, as a result of their relationships with the Fund. Ancillary benefits could include, among others, benefits directly attributable to other relationships with the Fund and benefits potentially derived from an increase in Funds Management’s and the Sub-Adviser’s business as a result of their relationships with the Fund. The Board noted that various affiliates of Funds Management may receive distribution-related fees, shareholder servicing payments and sub-transfer agency fees in respect of shares sold or held through them and services provided.
The Board also reviewed information about soft dollar credits earned and utilized by the Sub-Adviser, fees earned by Funds Management from managing a private investment vehicle for the fund family’s securities lending collateral, and commissions earned by an affiliated broker from portfolio transactions.
Based on its consideration of the factors and information it deemed relevant, including those described here, the Board did not find that any ancillary benefits received by Funds Management and its affiliates, including the Sub-Adviser, were unreasonable.
Conclusion
At the Meeting, after considering the above-described factors and based on its deliberations and its evaluation of the information described above, the Board unanimously approved the continuation of the Advisory Agreements for a one-year term and determined that the compensation payable to Funds Management and the Sub-Adviser under each of the Advisory Agreements was reasonable.
40 | Wells Fargo International Bond Fund
Table of Contents
Other information (unaudited)
LIQUIDITY RISK MANAGEMENT PROGRAM
In accordance with Rule 22e-4 under the Investment Company Act of 1940, as amended (the “Liquidity Rule”), Wells Fargo Funds Trust (the “Trust”) has adopted and implemented a liquidity risk management program (the “Program”) on behalf of each of its series, including the Fund, which is reasonably designed to assess and manage the Fund’s liquidity risk. “Liquidity risk” is defined as the risk that the Fund is unable to meet redemption requests without significantly diluting remaining investors’ interests in the Fund. The Trust’s Board of Trustees (the “Board”) previously approved the designation of Wells Fargo Funds Management, LLC (“Funds Management”), the Fund’s investment manager, as the administrator of the Program, and Funds Management has established a Liquidity Risk Management Council composed of personnel from multiple departments within Funds Management and its affiliates to assist Funds Management in the implementation and on-going administration of the Program.
The Program is comprised of various components designed to support the assessment and/or management of liquidity risk, including: (1) the periodic assessment (no less frequently than annually) of certain factors that influence the Fund’s liquidity risk; (2) the periodic classification (no less frequently than monthly) of the Fund’s investments into one of four liquidity categories that reflect an estimate of their liquidity under current market conditions; (3) a 15% limit on the acquisition of “illiquid investments” (as defined under the Liquidity Rule); (4) to the extent the Fund does not invest primarily in “highly liquid investments” (as defined under the Liquidity Rule), the determination of a minimum percentage of the Fund’s assets that generally will be invested in highly liquid investments (an “HLIM”); (5) if the Fund has established an HLIM, the periodic review (no less frequently than annually) of the HLIM and the adoption of policies and procedures for responding to a shortfall of the Fund’s “highly liquid investments” below its HLIM; and (6) periodic reporting to the Board.
At a meeting of the Board held on May 26 and 28, 2020, the Board received a written report (the “Report”) from Funds Management that addressed the operation of the Program and assessed its adequacy and effectiveness of implementation. The Report covered the initial period from December 1, 2018 through December 31, 2019 (the “Reporting Period”). No significant liquidity events impacting the Fund were noted in the Report. There were no material changes to the Program during the Reporting Period. The Report concluded that the Program is operating effectively to assess and manage the Fund’s liquidity risk, and that the Program has been and continues to be adequately and effectively implemented to monitor and, as applicable, respond to the Fund’s liquidity developments.
There can be no assurance that the Program will achieve its objectives under all circumstances in the future. Please refer to the Fund’s prospectus for more information regarding the Fund’s exposure to liquidity risk and other risks to which an investment in the Fund may be subject.
Wells Fargo International Bond Fund | 41
Table of Contents
Effective June 1, 2020, shareholders purchasing Fund shares through an Oppenheimer & Co. Inc. (“Oppenheimer”) platform or account are eligible only for the following load waivers (front-end sales charge waivers and contingent deferred or back-end, sales charge waivers) and discounts, which may differ from those disclosed in the Fund’s Prospectus or SAI.
| Front-end Sales Load Waivers on Class A Shares available at Oppenheimer |
| Employer-sponsored retirement, deferred compensation and employee benefit plans (including health savings accounts) and trusts used to fund those plans, provided that the shares are not held in a commission-based brokerage account and shares are held for the benefit of the plan. |
| Shares purchased by or through a 529 Plan. |
| Shares purchased through an Oppenheimer affiliated investment advisory program. |
| Shares purchased through reinvestment of capital gains distributions and dividend reinvestment when purchasing shares of the same fund (but not any other fund within the fund family). |
| Shares purchased from the proceeds of redemptions within the same fund family, provided (1) the repurchase occurs within 90 days following the redemption, (2) the redemption and purchase occur in the same account, and (3) redeemed shares were subject to a front-end or deferred sales load (known as Rights of Restatement). |
| A shareholder in the Fund’s Class C shares will have their shares exchanged at net asset value to Class A shares (or the appropriate share class) of the Fund if the shares are no longer subject to a CDSC and the exchange is in line with the policies and procedures of Oppenheimer. |
| Employees and registered representatives of Oppenheimer or its affiliates and their family members. |
| Directors or Trustees of the Fund, and employees of the Fund’s investment adviser or any of its affiliates, as described in the Prospectus. |
| CDSC Waivers on A and C Shares available at Oppenheimer |
| Death or disability of the shareholder. |
| Shares sold as part of a systematic withdrawal plan as described in the Prospectus. |
| Return of excess contributions from an IRA Account. |
| Shares sold as part of a required minimum distribution for IRA and retirement accounts due to the shareholder reaching the qualified age based on applicable IRS regulations as described in the Prospectus. |
| Shares sold to pay Oppenheimer fees but only if the transaction is initiated by Oppenheimer. |
| Shares acquired through a right of reinstatement. |
| Front-end load Discounts Available at Oppenheimer: Breakpoints, Rights of Accumulation & Letters of Intent |
| Breakpoints as described in the Prospectus. |
| Rights of Accumulation (ROA), which entitle shareholders to breakpoint discounts, will be automatically calculated based on the aggregated holding of fund family assets held by accounts within the purchaser’s household at Oppenheimer. Eligible fund family assets not held at Oppenheimer may be included in the ROA calculation only if the shareholder notifies his or her financial advisor about such assets. |
42 | Wells Fargo International Bond Fund
Table of Contents
Effective June 15, 2020, shareholders purchasing fund shares through a Robert W. Baird & Co. (“Baird”) platform or account will only be eligible for the following sales charge waivers (front-end sales charge waivers and CDSC waivers) and discounts, which may differ from those disclosed elsewhere in the Fund’s Prospectus or the SAI.
| Front-end Sales Load Waivers on Class A Shares available at Baird |
| Shares purchased through reinvestment of capital gains distributions and dividend reinvestment when purchasing share of the same fund. |
| Share purchase by employees and registers representatives of Baird or its affiliate and their family members as designated by Baird. |
| Shares purchase from the proceeds of redemptions within the same fund family, provided (1) the repurchase occurs within 90 days following the redemption, (2) the redemption and purchase occur in the same accounts, and (3) redeemed shares were subject to a front-end or deferred sales charge (known as rights of reinstatement). |
| A shareholder in the Funds Investor C Shares will have their share exchanged at net asset value to Investor A shares of the fund if the shares are no longer subject to CDSC and the exchange is in line with the policies and procedures of Baird. |
| Employer-sponsored retirement plans or charitable accounts in a transactional brokerage account at Baird, including 401(k) plans, 457 plans, employer-sponsored 403(b) plans, profit sharing and money purchase pension plans and defined benefit plans. For purposes of this provision, employer-sponsored retirement plans do not include SEP IRAs, Simple IRAs or SAR-SEPs. |
| CDSC Waivers on A and C Shares available at Baird |
| Shares sold due to death or disability of the shareholder. |
| Shares sold as part of a systematic withdrawal plan as described in the Fund’s Prospectus. |
| Shares bought due to returns of excess contributions from an IRA Account. |
| Shares sold as part of a required minimum distribution for IRA and retirement accounts due to the shareholder reaching age 72 as described in the Fund’s Prospectus. |
| Shares sold to pay Baird fees but only if the transaction is initiated by Baird. |
| Shares acquired through a right of reinstatement. |
| Front-end load Discounts Available at Baird: Breakpoint and/or Rights of Accumulation |
| Breakpoints as described in the Prospectus. |
| Rights of accumulations which entitles shareholders to breakpoint discounts will be automatically calculated based on the aggregated holding of fund family assets held by accounts within the purchaser’s household at Baird. Eligible fund family assets not held at Baird may be included in the rights of accumulations calculation only if the shareholder notifies his or her financial advisor about such assets. |
| Letters of Intent (LOI) allow for breakpoint discounts based on anticipated purchases within a fund family through Baird, over a 13-month period of time. |
Wells Fargo International Bond Fund | 43
Table of Contents
This page is intentionally left blank.
Table of Contents
For more information
More information about Wells Fargo Funds is available free upon request. To obtain literature, please write, visit the Fund’s website, or call:
Wells Fargo Funds
P.O. Box 219967
Kansas City, MO 64121-9967
Website: wfam.com
Individual investors: 1-800-222-8222
Retail investment professionals: 1-888-877-9275
Institutional investment professionals: 1-866-765-0778

This report and the financial statements contained herein are submitted for the general information of the shareholders of the Fund. If this report is used for promotional purposes, distribution of the report must be accompanied or preceded by a current prospectus. Before investing, please consider the investment objectives, risks, charges, and expenses of the investment. For a current prospectus and, if available, a summary prospectus, containing this information, call 1-800-222-8222 or visit the Fund’s website at wfam.com. Read the prospectus carefully before you invest or send money.
Wells Fargo Asset Management (WFAM) is the trade name for certain investment advisory/management firms owned by Wells Fargo & Company. These firms include but are not limited to Wells Capital Management Incorporated and Wells Fargo Funds Management, LLC. Certain products managed by WFAM entities are distributed by Wells Fargo Funds Distributor, LLC (a broker-dealer and Member FINRA).
This material is for general informational and educational purposes only and is NOT intended to provide investment advice or a recommendation of any kind—including a recommendation for any specific investment, strategy, or plan.
INVESTMENT PRODUCTS: NOT FDIC INSURED ◾ NO BANK GUARANTEE ◾ MAY LOSE VALUE
© 2020 Wells Fargo & Company. All rights reserved.
PAR-1020-00553 11-20
A235/AR235 09-20
Table of Contents

Annual Report
September 30, 2020
Wells Fargo
Diversified Capital Builder Fund
Beginning on January 1, 2021, as permitted by new regulations adopted by the Securities and Exchange Commission, paper copies of the Wells Fargo Funds’ annual and semi-annual shareholder reports issued after this date will no longer be sent by mail, unless you specifically request paper copies of the reports. Instead, the reports will be made available on the Funds’ website, and you will be notified by mail each time a report is posted and provided with a website address to access the report.
If you already elected to receive shareholder reports electronically, you will not be affected by this change and you need not take any action. You may elect to receive shareholder reports and other communications from the Fund electronically at any time by contacting your financial intermediary (such as a broker-dealer or bank) or, if you are a direct investor, by calling 1-800-222-8222 or by enrolling at wellsfargo.com/advantagedelivery.
You may elect to receive all future reports in paper free of charge. If you invest through a financial intermediary, you can contact your financial intermediary to request that you continue to receive paper copies of your shareholder reports; if you invest directly with the Fund, you can call 1-800-222-8222. Your election to receive reports in paper will apply to all Wells Fargo Funds held in your account with your financial intermediary or, if you are a direct investor, to all Wells Fargo Funds that you hold.
Table of Contents
|
Reduce clutter. Save trees. |
Sign up for electronic delivery of prospectuses and shareholder reports at wellsfargo.com/ |
The views expressed and any forward-looking statements are as of September 30, 2020, unless otherwise noted, and are those of the Fund’s portfolio managers and/or Wells Fargo Asset Management. Discussions of individual securities, or the markets generally, or any Wells Fargo Fund are not intended as individual recommendations. Future events or results may vary significantly from those expressed in any forward-looking statements. The views expressed are subject to change at any time in response to changing circumstances in the market. Wells Fargo Asset Management and the Fund disclaim any obligation to publicly update or revise any views expressed or forward-looking statements.
INVESTMENT PRODUCTS: NOT FDIC INSURED ◾ NO BANK GUARANTEE ◾ MAY LOSE VALUE
Wells Fargo Diversified Capital Builder Fund | 1
Table of Contents
Letter to shareholders (unaudited)

Andrew Owen
President
Wells Fargo Funds
Dear Shareholder:
We are pleased to offer you this annual report for the Wells Fargo Diversified Capital Builder Fund for the 12-month period that ended September 30, 2020. Global stock markets saw earlier gains erased in March as governments around the world took unprecedented measures, attempting to stop the spread of COVID-19 at the expense of short-term economic output. However, markets rallied strongly from April on to more than offset those short-term losses as central banks bolstered capital markets and confidence.
For the 12-month period, equities had broadly positive total returns despite intense volatility in March. Non-U.S. developed market equities had weaker performance than emerging market and U.S. stocks. While gains from fixed-income securities were positive, they were more modest than equities. For the period, U.S. stocks, based on the S&P 500 Index,1 gained 15.15%. International stocks, as measured by the MSCI ACWI ex USA Index (Net),2 returned 3.00%, while the MSCI EM Index (Net)3 had stronger performance, with a 10.54% gain. For bond investors, the Bloomberg Barclays U.S. Aggregate Bond Index4 returned 6.98%, the Bloomberg Barclays Global Aggregate ex-USD Index5 gained 5.48%, and the Bloomberg Barclays Municipal Bond Index6 returned 4.09% while the ICE BofA U.S. High Yield Index7 returned 2.30%.
The period began with mixed economic readings.
The fourth quarter of 2019 started on a strong note. U.S.-China trade tensions, which had been building for months, relaxed in October; optimism rose for a U.K. Brexit deal; and macroeconomic data turned positive. The initial estimate of U.S. third-quarter gross domestic product (GDP) growth was a resilient 1.9% annualized rate, while the U.S. unemployment rate fell to a 50-year low of 3.5% in September. However, despite strength among U.S. consumers, business confidence declined while manufacturing activity contracted. Concerned with a potential economic slowdown, the U.S. Federal Reserve (Fed) lowered interest rates a quarter point in late October—its third rate cut in four months. This helped push the S&P 500 Index to an all-time high while emerging market equities rallied and global bonds declined overall, reflecting a broad pickup in risk appetite.
Equity markets continued to rally in November despite ongoing geopolitical risks. Hopes for a U.S.-China trade deal buoyed investor confidence. U.S. business sentiment improved slightly and manufacturing and services activity picked up. While consumer confidence and purchasing managers’ activity rose in the eurozone, China reported weakening manufacturing and consumer data. Bond yields rose marginally, leading to slightly negative returns for global government and investment-grade corporate bonds.
| 1 | The S&P 500 Index consists of 500 stocks chosen for market size, liquidity, and industry group representation. It is a market-value-weighted index with each stock’s weight in the index proportionate to its market value. You cannot invest directly in an index. |
| 2 | The Morgan Stanley Capital International (MSCI) All Country World Index (ACWI) ex USA Index (Net) is a free-float-adjusted market-capitalization-weighted index that is designed to measure the equity market performance of developed and emerging markets, excluding the United States. Source: MSCI. MSCI makes no express or implied warranties or representations and shall have no liability whatsoever with respect to any MSCI data contained herein. The MSCI data may not be further redistributed or used as a basis for other indices or any securities or financial products. This report is not approved, reviewed, or produced by MSCI. You cannot invest directly in an index. |
| 3 | The MSCI Emerging Markets (EM) Index (Net) is a free-float-adjusted market-capitalization-weighted index that is designed to measure equity market performance of emerging markets. You cannot invest directly in an index. |
| 4 | The Bloomberg Barclays U.S. Aggregate Bond Index is a broad-based benchmark that measures the investment-grade, U.S. dollar-denominated, fixed-rate taxable bond market, including Treasuries, government-related and corporate securities, mortgage-backed securities (agency fixed-rate and hybrid adjustable-rate mortgage pass-throughs), asset-backed securities, and commercial mortgage-backed securities. You cannot invest directly in an index. |
| 5 | The Bloomberg Barclays Global Aggregate ex-USD Index is an unmanaged index that provides a broad-based measure of the global investment-grade fixed-income markets excluding the U.S. dollar-denominated debt market. You cannot invest directly in an index. |
| 6 | The Bloomberg Barclays Municipal Bond Index is an unmanaged index composed of long-term tax-exempt bonds with a minimum credit rating of Baa. You cannot invest directly in an index. |
| 7 | The ICE BofA U.S. High Yield Index is a market-capitalization-weighted index of domestic and Yankee high-yield bonds. The index tracks the performance of high-yield securities traded in the U.S. bond market. You cannot invest directly in an index. Copyright 2020. ICE Data Indices, LLC. All rights reserved. |
2 | Wells Fargo Diversified Capital Builder Fund
Table of Contents
Letter to shareholders (unaudited)
Financial markets ended 2019 with a boost from the U.S. and China accord on a Phase One trade deal. That, along with the landslide win by the pro-Brexit U.K. Conservative Party in a national election and ongoing central bank support, gave investors greater confidence. U.S. economic indicators were generally positive, with the exception of manufacturing activity and business confidence. Consumer confidence was resilient, fed by a robust labor market, tame inflation, and lower interest rates, which boosted housing affordability and stimulated homebuyer activity. The impeachment of President Trump had little impact on the markets. Meanwhile, slowing Chinese economic activity, partly attributable to the trade war, led to further government stimulus at year-end through lower reserve ratios, allowing banks to lend more money.
The year-end rally continued in early January 2020. However, capital market volatility spiked in late January on concerns over the potential impact of COVID-19 on the global economy and stock markets. With sentiment somewhat souring, perceived safe havens did well in January. The U.S. dollar and Japanese yen both rose and government bonds outperformed equities. While the S&P 500 Index held its ground, emerging market equities tumbled, including those in Asia.
In February, COVID-19 became the major market focus. Fears of the virus’s impact on Chinese and global growth led to expectations of increased global central bank monetary policy support. That led the 10-year U.S. Treasury yield to fall to an all-time low of 1.1%. Although equity markets initially shrugged off concerns about the outbreak, focusing instead on strong fourth-quarter earnings and improving business confidence in January, market sentiment turned sharply lower and the S&P 500 Index lost 8.2% for the month. Oil prices tumbled as Russia and the Organization of the Petroleum Exporting Countries compounded a major decline in oil demand with a brutal price war, partly aimed at dissuading further U.S. shale production, causing the price of West Texas Intermediate crude oil to plummet.
The global spread of COVID-19 led country after country to clamp down on social and business-related activity in order to contain the virus from causing even greater devastation and overwhelming health care systems. This abrupt stoppage of economic activity led to the sharp deceleration of global output, sending economies into a deep contraction. Central banks responded swiftly, slashing interest rates and expanding quantitative easing programs to restore liquidity and confidence to the markets. In the U.S., the Fed introduced several new lending programs, funding investment-grade bonds, money market mutual funds, and commercial paper while purchasing Treasuries, mortgage-backed securities, and overnight repurchase agreements. Meanwhile, stock markets tumbled quickly into a bear market, ending the longest bull stock market in U.S. history.
Markets rebounded strongly in April, fueled by unprecedented government and central bank stimulus measures. The U.S. economy contracted by an annualized 5.0% pace in the first quarter, with 30 million new unemployment insurance claims in six weeks. In the eurozone, first-quarter real GDP shrank 3.8%, with the composite April Flash Purchasing Managers’ Index (PMI), a monthly survey of purchasing managers, falling to an all-time low of 13.5. The European Central Bank expanded its quantitative easing to include the purchase of additional government bonds of countries with the greatest virus-related need, including Italy and Spain. China’s first-quarter GDP fell by 6.8% year over year. However, retail sales, production, and investment showed signs of recovery. Extreme oil-price volatility continued as global supply far exceeded demand.
The global equity market rebound continued in May, with widespread strong monthly gains. Investors regained confidence on reports of early signs of success in human trials of a COVID-19 vaccine. Growth stocks continued to outperform value stocks while returns on global government bonds were generally flat. In the U.S., a gap grew between the stock market rebound and devastating economic data points, including an April unemployment rate of 14.7%, the highest level since World War II. PMIs reflected
“The global spread of COVID-19 led country after country to clamp down on social and business-related activity in order to contain the virus from causing even greater devastation and overwhelming health care systems.”
Wells Fargo Diversified Capital Builder Fund | 3
Table of Contents
Letter to shareholders (unaudited)
“The stock market continued to rally in August despite concerns over rising numbers of COVID-19 cases in the United States and several European countries, including France and Spain, as well as the expiration of the $600 weekly bonus unemployment benefit at the end of July.”
weakening activity in May in both the manufacturing and services sectors. U.S. corporate earnings reports indicated a 14% year-over-year contraction in earnings from the first quarter of 2019. However, high demand for technology, driven by remote activity, supported robust information technology sector earnings, which helped drive major technology stocks higher.
Financial markets posted widely positive returns in June despite ongoing economic weakness and high levels of uncertainty on the containment of COVID-19 and the timing of an effective vaccine. There were hopeful signs as economies reopened, with both U.S. and U.K. retail sales rebounding sharply in May. However, year over year, sales remained depressed. Vitally important to market sentiment was the ongoing commitment by central banks globally to do all they could to provide economic support through liquidity and low borrowing costs. U.S. economic activity was aided by one-time $1,200 stimulus checks and $600 bonus weekly unemployment benefits that expired at the end of July. However, unemployment remained historically high, easing somewhat from 14.7% in April to 11.1% in June. By month-end, numerous states reported increases of COVID-19 cases. China’s economic recovery picked up momentum in June, though it remained far from a full recovery.
July was a broadly positive month for both global equities and fixed income. However, economic data and a resurgence of COVID-19 cases pointed to the vulnerability of the global economy and the ongoing imperative to regain control of the pandemic. Second-quarter GDP shrank from the previous quarter by 9.5% and 12.1% in the U.S. and the eurozone, respectively. In contrast, China reported a 3.2% year-over-year expansion in its second-quarter GDP. U.S. unemployment remained high despite adding 1.8 million jobs in July, with a double-digit jobless rate persisting. However, manufacturing activity grew in both the U.S. and the eurozone. In Asia, while China’s manufacturing sector continued to expand, activity in Japan and South Korea contracted. In July, a rising concern was the rapid and broad reemergence of COVID-19 infections.
The stock market continued to rally in August despite concerns over rising numbers of COVID-19 cases in the United States and several European countries, including France and Spain, as well as the expiration of the $600 weekly bonus unemployment benefit at the end of July. U.S. stocks had strong monthly gains, led by the FAANG stocks—Facebook, Apple, Amazon, Netflix, and Google (Alphabet)—which dominate these indices and continued to rally. U.S. stocks generally surpassed other broadly positive global equity performance while fixed-income market monthly returns were broadly flat. Generally stronger-than-expected second-quarter earnings boosted investor sentiment along with the Fed’s announcement of a policy shift that will likely lead to longer-term low interest rates and supportive monetary policy. The U.S. Flash PMIs for both manufacturing and services beat expectations while U.S. housing market indicators were strong. In Europe, retail sales expanded and consumer confidence remained steady. China’s economy continued its fairly steady expansion. Overall, developed markets performed better than emerging market equities for the month of August as people took comfort in better-known equities in perceived safer markets.
Stocks grew more volatile in September on mixed economic data. U.S. PMIs showed solid growth in economic activity in both manufacturing and services. However, six months after the bottom fell out of the labor market in the early spring, only half of the 22 million jobs lost had returned. The U.S. unemployment rate fell to 7.9% in September, the fifth straight month of improvement but far higher than the 3.5% pre-COVID-19 rate. Only 661,000 jobs were added for the month, down from 1.5 million in August. Meanwhile, a reported 2.3 million people have given up looking for work. With U.S. Congress failing to pass further fiscal relief and uncertainties surrounding a possible vaccine, doubts crept back into the financial markets. In the U.K., a lack of progress in Brexit talks with the European Union weighed on markets. China’s economy picked up steam, however, with growth fueled by increased global demand, and China’s service sector had its strongest PMI reading in seven years.
4 | Wells Fargo Diversified Capital Builder Fund
Table of Contents
Letter to shareholders (unaudited)
Don’t let short-term uncertainty derail long-term investment goals.
Periods of investment uncertainty can present challenges, but experience has taught us that maintaining long-term investment goals can be an effective way to plan for the future. To help you create a sound strategy based on your personal goals and risk tolerance, Wells Fargo Funds offers more than 100 mutual funds spanning a wide range of asset classes and investment styles. Although diversification cannot guarantee an investment profit or prevent losses, we believe it can be an effective way to manage investment risk and potentially smooth out overall portfolio performance. We encourage investors to know their investments and to understand that appropriate levels of risk-taking may unlock opportunities.
Thank you for choosing to invest with Wells Fargo Funds. We appreciate your confidence in us and remain committed to helping you meet your financial needs.
Sincerely,

Andrew Owen
President
Wells Fargo Funds
|
For further information about your Fund, contact your investment professional, visit our website at wfam.com, or call us directly at 1-800-222-8222. |
Notice to Shareholders
At a meeting held on August 10-12, 2020, the Board of Trustees of the Fund approved a change to the Fund’s automatic conversion feature for Class C shares in order to shorten the required holding period from 10 to 8 years. As a result, on a monthly basis beginning November 5, 2020, Class C shares will convert automatically into Class A shares 8 years after the initial date of purchase or, if you acquired your Class C shares through an exchange or conversion from another share class, 8 years after the date you acquired your Class C shares. When Class C shares that you acquired through a purchase or exchange convert, any other Class C shares that you purchased with reinvested dividends and distributions also will convert into Class A shares on a pro rata basis.
Please note that a shorter holding period may apply depending on your intermediary. Please see “Appendix A—Sales Charge Reductions and Waivers for Certain Intermediaries” in the Fund’s prospectus for further information.
Wells Fargo Diversified Capital Builder Fund | 5
Table of Contents
Performance highlights (unaudited)
Investment objective
The Fund seeks long-term total return, consisting of capital appreciation and current income.
Manager
Wells Fargo Funds Management, LLC
Subadviser
Wells Capital Management Incorporated
Portfolio managers
Robert Junkin
Margaret Patel
Average annual total returns (%) as of September 30, 2020
| Including sales charge | Excluding sales charge | Expense ratios1 (%) | ||||||||||||||||||||||||||||||||
| Inception date | 1 year | 5 year | 10 year | 1 year | 5 year | 10 year | Gross | Net2 | ||||||||||||||||||||||||||
| Class A (EKBAX) | 1-20-1998 | 1.13 | 10.72 | 10.53 | 7.26 | 12.05 | 11.19 | 1.12 | 1.12 | |||||||||||||||||||||||||
| Class C (EKBCX) | 1-22-1998 | 5.44 | 11.23 | 10.37 | 6.44 | 11.23 | 10.37 | 1.87 | 1.87 | |||||||||||||||||||||||||
| Administrator Class (EKBDX) | 7-30-2010 | – | – | – | 7.33 | 12.16 | 11.37 | 1.04 | 1.04 | |||||||||||||||||||||||||
| Institutional Class (EKBYX) | 1-26-1998 | – | – | – | 7.58 | * | 12.44 | 11.62 | 0.79 | 0.78 | ||||||||||||||||||||||||
| Diversified Capital Builder Blended Index3 | – | – | – | – | 12.63 | 12.29 | 11.92 | – | – | |||||||||||||||||||||||||
| ICE BofA U.S. Cash Pay High Yield Index4 | – | – | – | – | 2.35 | 6.61 | 6.26 | – | – | |||||||||||||||||||||||||
| Russell 1000® Index5 | – | – | – | – | 16.01 | 14.09 | 13.76 | – | – | |||||||||||||||||||||||||
| * | Total return differs from the return in the Financial Highlights in this report. The total return presented is calculated based on the NAV at which the shareholder transactions were processed. The NAV and total return presented in the Financial Highlights reflects certain adjustments made to the net assets of the Fund that are necessary under U.S. generally accepted accounting principles. |
Figures quoted represent past performance, which is no guarantee of future results, and do not reflect taxes that a shareholder may pay on an investment in a fund. Investment return and principal value of an investment will fluctuate so that an investor’s shares, when redeemed, may be worth more or less than their original cost. Performance shown without sales charges would be lower if sales charges were reflected. Current performance may be lower or higher than the performance data quoted, which assumes the reinvestment of dividends and capital gains. Current month-end performance is available on the Fund’s website, wfam.com.
Index returns do not include transaction costs associated with buying and selling securities, any mutual fund fees or expenses, or any taxes. It is not possible to invest directly in an index.
For Class A shares, the maximum front-end sales charge is 5.75%. For Class C shares, the maximum contingent deferred sales charge is 1.00%. Performance including a contingent deferred sales charge assumes the sales charge for the corresponding time period. Administrator Class and Institutional Class shares are sold without a front-end sales charge or contingent deferred sales charge.
Balanced funds may invest in stocks and bonds. Stock values fluctuate in response to the activities of individual companies and general market and economic conditions. Bond values fluctuate in response to the financial condition of individual issuers, general market and economic conditions, and changes in interest rates. Changes in market conditions and government policies may lead to periods of heightened volatility in the bond market and reduced liquidity for certain bonds held by the Fund. In general, when interest rates rise, bond values fall and investors may lose principal value. Interest rate changes and their impact on the Fund and its share price can be sudden and unpredictable. Certain investment strategies tend to increase the total risk of an investment (relative to the broader market). The Fund is exposed to foreign investment risk, high-yield securities risk, and smaller-company securities risk. Consult the Fund’s prospectus for additional information on these and other risks.
Please see footnotes on page 7.
6 | Wells Fargo Diversified Capital Builder Fund
Table of Contents
Performance highlights (unaudited)
| Growth of $10,000 investment as of September 30, 20206 |
|
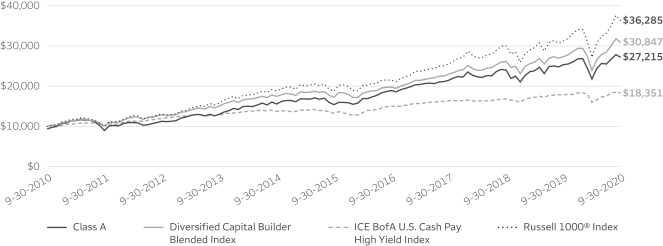
| 1 | Reflects the expense ratios as stated in the most recent prospectuses. The expense ratios shown are subject to change and may differ from the annualized expense ratios shown in the financial highlights of this report. |
| 2 | The manager has contractually committed through January 31, 2021, to waive fees and/or reimburse expenses to the extent necessary to cap total annual fund operating expenses after fee waivers at 1.13% for Class A, 1.88% for Class C, 1.05% for Administrator Class, and 0.78% for Institutional Class. Brokerage commissions, stamp duty fees, interest, taxes, acquired fund fees and expenses (if any), and extraordinary expenses are excluded from the expense caps. Prior to or after the commitment expiration date, the caps may be increased or the commitment to maintain the caps may be terminated only with the approval of the Board of Trustees. Without these caps, the Fund’s returns would have been lower. The expense ratio paid by an investor is the net expense ratio (the total annual fund operating expenses after fee waivers) as stated in the prospectuses. |
| 3 | Source: Wells Fargo Funds Management, LLC. The Diversified Capital Builder Blended Index is composed 75% of the Russell 1000® Index and 25% of the ICE BofA U.S. Cash Pay High Yield Index. You cannot invest directly in an index. |
| 4 | The ICE BofA U.S. Cash Pay High Yield Index is an unmanaged market index that provides a broad-based performance measure of the non-investment grade U.S. domestic bond index. You cannot invest directly in an index. Copyright 2020. ICE Data Indices, LLC. All rights reserved. |
| 5 | The Russell 1000® Index measures the performance of the 1,000 largest companies in the Russell 3000® Index, which represents approximately 92% of the total market capitalization of the Russell 3000® Index. You cannot invest directly in an index. |
| 6 | The chart compares the performance of Class A shares for the most recent ten years with the Diversified Capital Builder Blended Index, the ICE BofA U.S. Cash Pay High Yield Index, and the Russell 1000® Index. The chart assumes a hypothetical investment of $10,000 in Class A shares and reflects all operating expenses and assumes the maximum initial sales charge of 5.75%. |
| 7 | The ten largest holdings, excluding cash, cash equivalents and any money market funds, are calculated based on the value of the investments divided by total net assets of the Fund. Holdings are subject to change and may have changed since the date specified. |
| 8 | Amounts are calculated based on the total long-term investments of the Fund. These amounts are subject to change and may have changed since the date specified. |
| * | This security was no longer held at the end of the reporting period. |
Wells Fargo Diversified Capital Builder Fund | 7
Table of Contents
Performance highlights (unaudited)
MANAGER’S DISCUSSION
Fund highlights
| ∎ | The Fund underperformed its benchmark, the Diversified Capital Builder Blended Index, for the 12-month period that ended September 30, 2020. |
| ∎ | Underperforming sectors were in economically sensitive areas such as industrials, materials, and financials. |
| ∎ | Information technology (IT) holdings contributed to results. Although our holdings somewhat underperformed the sector’s performance in the Russell 1000® Index, the Fund’s IT holdings substantially outperformed other industries in the market. |
| ∎ | Our health care holdings significantly outperformed the stocks in the index’s health care sector. |
| ∎ | In the Fund’s bond portfolio, holdings notably outperformed the ICE BofA U.S. Cash Pay High Yield Index due to our above-average quality holdings. Better-quality below-investment-grade bonds outperformed lower-quality high-yield issues. |
The Russell 1000® Index made steady gains from the start of the Fund’s fiscal year on September 30, 2019, until mid-February 2020. After reaching a high for the fiscal year in February, the stock market fell sharply in reaction to the closure of a number of economic sectors as federal and state governments attempted to slow the spread of the coronavirus. The Federal Reserve (Fed) worked to limit the effect of economic closures and rapidly increasing unemployment by establishing measures to provide short-term liquidity to the financial markets. In addition, it substantially lowered U.S. Treasury interest rates.
As a result of these actions, the stock market stabilized in late March 2020 and began a long climb upward, reflecting expectations of subsequent improvement in the economy. By month-end September 2020, the index climbed to levels slightly below its mid-February high.
From the beginning of the fiscal year on September 30, 2019, until mid-February 2020, interest rates on Treasury issues with 10-year maturities were relatively stable and fluctuated between 1.50% and 1.95%. After the stock market decline in mid-February, the Fed quickly acted to ensure market liquidity and substantially lowered interest rates. Yields on 10-year maturity Treasuries fell and, by April 2020, were trading in a range of 0.50% to 0.75% and remained in this range for the rest of the fiscal year.
| Ten largest holdings (%) as of September 30, 20207 | ||||
Broadcom Incorporated | 5.21 | |||
AbbVie Incorporated | 4.34 | |||
Bristol-Myers Squibb Company | 3.68 | |||
Akamai Technologies Incorporated | 3.58 | |||
Amgen Incorporated | 3.39 | |||
Amphenol Corporation Class A | 3.09 | |||
Leidos Holdings Incorporated | 2.97 | |||
Thermo Fisher Scientific Incorporated | 2.94 | |||
Danaher Corporation | 2.87 | |||
Vistra Energy Corporation | 2.79 | |||
Stocks gained in value during the period.
Most stocks gained in value from the start of the fiscal year, reflecting a growing economy with rising sales and profits. However, after reaching a peak in mid-February 2020, the market began a sharp correction that lasted until late March. The market declined because of concerns that shutting down the economy to reduce the risk of the coronavirus would badly damage corporate profits, resulting in continued market erosion. After Fed actions to provide liquidity and lower interest rates, along with the federal government’s very large provisions of unemployment payments and loans to businesses hurt by the reduction in activity, the market began to rebound, optimistic that these monetary and fiscal measures would backstop the economy and help business grow again. As a result of these efforts, the market finished the 12-month period ending September 30, 2020, at levels only slightly below its mid-February peak.
Please see footnotes on page 7.
8 | Wells Fargo Diversified Capital Builder Fund
Table of Contents
Performance highlights (unaudited)
| Portfolio composition as of September 30, 20208 |
 |
The Fund underperformed its benchmark primarily due to holdings of a number of economically sensitive stocks, which declined and did not make a full recovery by the end of the fiscal year. Holdings in industrials, materials, and financials declined as investors were concerned about the strength of the economic recovery. Within the equity portfolio, its holdings in consumer discretionary, health care, and IT outperformed the return of the equity benchmark. In addition, the Fund’s IT holdings, while slightly lagging the sector return of the benchmark, substantially outpaced the average market gain and thus materially added to incremental returns. Detracting from performance were holdings in industrials, financials, materials, and utilities.
Equity outperformers in IT included Advanced Micro Devices, Incorporated; Broadcom Incorporated; and Adobe Systems Incorporated. In health care, Thermo Fisher Scientific Incorporated; Danaher Corporation; and Horizon Therapeutics PLC contributed to relative performance. In the consumer discretionary sector, The Home Depot, Incorporated, added to performance.
Detractors in industrials included Curtiss-Wright Corporation; L3Harris Technologies, Incorporated; and Huntington Ingalls Industries, Incorporated. Utility companies Vistra Corporation; Atmos Energy Corporation; DTE Energy Company; and American Electric Power Company, Incorporated, detracted from performance. In materials, LyondellBasell Industries N.V.* underperformed.
U.S. Treasury rates moved lower.
In the bond market, interest rates were relatively stable in the first half of the fiscal year until mid-February, when Treasury rates plummeted as a result of the Fed substantially increasing liquidity in the financial system to help stabilize the economy from coronavirus-related shutdowns. To illustrate, short-term Treasury notes due in two years traded in a range of yields from 1.40% to 1.65% from month-end September 2019 until mid-February 2020, when they began to drop sharply from Fed actions. From the end of March 2020 until the end of the fiscal year in September 2020, the yields of these notes fluctuated between 0.15%, or 15 basis points (bps; 100 bps equal 1.00%) to 0.21% (21 bps).
The Fund’s bond holdings consisted primarily in high-yield, below-investment-grade issues. High-yield bonds historically have been more sensitive to prospects of future economic growth. In contrast, investment-grade bonds, because of their higher quality, are more sensitive to movements in Treasury bond yields than to the economic outlook. Thus, during the fiscal year, investment-grade bonds experienced substantially lower yields and higher prices and outperformed high-yield bonds, which increased only modestly in price due to concerns about their deteriorating financial prospects. Over the fiscal year, returns for high-yield bonds were moderately positive, as somewhat-higher prices added to the coupon income of these bonds. To illustrate, at month-end September 2019, the average yield to maturity of the index of high-yield bonds was 5.87%, with a yield advantage over comparable maturity Treasuries of +420 bps. By September 30, 2020, the average yield was 5.70%, but the yield advantage had widened to +539 bps, reflecting much lower Treasury yields.
In general, better-quality high-yield bonds outperformed lower-quality holdings because investors became more concerned with the prospects of poor credit quality, should future economic growth slow materially. The Fund’s high-yield bonds outperformed the index of high-yield bonds because our holdings were above the average quality of the index.
Relative outperformers in the bond portfolio included IT companies Western Digital Corporation; TTM Technologies, Incorporated; and Seagate HDD Cayman. Health care issues Centene Corporation, Davita HealthCare Partners Incorporated, and Bausch Health Companies added to performance. Materials companies Koppers Holdings Incorporated and Tronox Finance LLC also contributed. Bond detractors were industrial company Resideo Technologies, Incorporated; materials issuer Rayonier Advanced Materials Incorporated; and health care company Teleflex Incorporated.
Our outlook remains one of cautious optimism.
The Fund’s positioning reflects our expectation for continued economic growth over the next year, although at levels somewhat lower than recent economic growth rates. We find stock prices reasonable compared with the earnings growth potential of many stocks. Thus, we are optimistic that equities may provide returns above those available on the very low yields of risk-free alternatives. In addition, with yields of Treasuries likely to be at low levels for the foreseeable future, we feel stock dividend yields are attractive alternatives to yields offered on short-term fixed-income securities. Within the Fund’s fixed-income assets, virtually all of the bond holdings are of companies with U.S. public equity outstanding, which we think provides a more flexible capital structure and more transparent reporting of financial results. We expect these high-yield bonds to provide a competitive return to that available on lower-yielding, higher-rated bonds.
Please see footnotes on page 7.
Wells Fargo Diversified Capital Builder Fund | 9
Table of Contents
As a shareholder of the Fund, you incur two types of costs: (1) transaction costs, including sales charges (loads) on purchase payments and contingent deferred sales charges (if any) on redemptions and (2) ongoing costs, including management fees, distribution (12b-1) and/or shareholder servicing fees, and other Fund expenses. This example is intended to help you understand your ongoing costs (in dollars) of investing in the Fund and to compare these costs with the ongoing costs of investing in other mutual funds.
The example is based on an investment of $1,000 invested at the beginning of the six-month period and held for the entire period from April 1, 2020 to September 30, 2020.
Actual expenses
The “Actual” line of the table below provides information about actual account values and actual expenses. You may use the information in this line, together with the amount you invested, to estimate the expenses that you paid over the period. Simply divide your account value by $1,000 (for example, an $8,600 account value divided by $1,000 = 8.6), then multiply the result by the number in the “Actual” line under the heading entitled “Expenses paid during period” for your applicable class of shares to estimate the expenses you paid on your account during this period.
Hypothetical example for comparison purposes
The “Hypothetical” line of the table below provides information about hypothetical account values and hypothetical expenses based on the Fund’s actual expense ratio and an assumed rate of return of 5% per year before expenses, which is not the Fund’s actual return. The hypothetical account values and expenses may not be used to estimate the actual ending account balance or expenses you paid for the period. You may use this information to compare the ongoing costs of investing in the Fund and other funds. To do so, compare this 5% hypothetical example with the 5% hypothetical examples that appear in the shareholder reports of the other funds.
Please note that the expenses shown in the table are meant to highlight your ongoing costs only and do not reflect any transactional costs, such as sales charges (loads) and contingent deferred sales charges. Therefore, the “Hypothetical” line of the table is useful in comparing ongoing costs only and will not help you determine the relative total costs of owning different funds. In addition, if these transactional costs were included, your costs would have been higher.
Beginning account value 4-1-2020 | Ending account value 9-30-2020 | Expenses paid during the period1 | Annualized net expense ratio | |||||||||||||
Class A | ||||||||||||||||
Actual | $ | 1,000.00 | $ | 1,246.22 | $ | 6.29 | 1.12 | % | ||||||||
Hypothetical (5% return before expenses) | $ | 1,000.00 | $ | 1,019.47 | $ | 5.66 | 1.12 | % | ||||||||
Class C | ||||||||||||||||
Actual | $ | 1,000.00 | $ | 1,242.10 | $ | 10.50 | 1.87 | % | ||||||||
Hypothetical (5% return before expenses) | $ | 1,000.00 | $ | 1,015.70 | $ | 9.44 | 1.87 | % | ||||||||
Administrator Class | ||||||||||||||||
Actual | $ | 1,000.00 | $ | 1,246.26 | $ | 5.85 | 1.04 | % | ||||||||
Hypothetical (5% return before expenses) | $ | 1,000.00 | $ | 1,019.86 | $ | 5.26 | 1.04 | % | ||||||||
Institutional Class | ||||||||||||||||
Actual | $ | 1,000.00 | $ | 1,249.09 | $ | 4.40 | 0.78 | % | ||||||||
Hypothetical (5% return before expenses) | $ | 1,000.00 | $ | 1,021.16 | $ | 3.95 | 0.78 | % | ||||||||
| 1 | Expenses paid is equal to the annualized net expense ratio of each class multiplied by the average account value over the period, multiplied by the number of days in the most recent fiscal half-year divided by the number of days in the fiscal year (to reflect the one-half-year period). |
10 | Wells Fargo Diversified Capital Builder Fund
Table of Contents
Portfolio of investments—September 30, 2020
| Shares | Value | |||||||||||||||
| Common Stocks: 85.13% |
| |||||||||||||||
Communication Services: 2.33% | ||||||||||||||||
| Diversified Telecommunication Services: 1.08% | ||||||||||||||||
Verizon Communications Incorporated | 190,000 | $ | 11,303,100 | |||||||||||||
|
| |||||||||||||||
Interactive Media & Services: 1.25% | ||||||||||||||||
Alphabet Incorporated Class A † | 9,000 | 13,190,400 | ||||||||||||||
|
| |||||||||||||||
Consumer Discretionary: 1.06% | ||||||||||||||||
| Specialty Retail: 1.06% | ||||||||||||||||
The Home Depot Incorporated | 40,000 | 11,108,400 | ||||||||||||||
|
| |||||||||||||||
Consumer Staples: 1.12% | ||||||||||||||||
| Food Products: 0.19% | ||||||||||||||||
Lamb Weston Holdings Incorporated | 30,001 | 1,988,166 | ||||||||||||||
|
| |||||||||||||||
Household Products: 0.93% | ||||||||||||||||
The Procter & Gamble Company | 70,000 | 9,729,300 | ||||||||||||||
|
| |||||||||||||||
Health Care: 30.76% | ||||||||||||||||
| Biotechnology: 10.85% | ||||||||||||||||
AbbVie Incorporated | 520,000 | 45,546,800 | ||||||||||||||
Alexion Pharmaceuticals Incorporated † | 140,000 | 16,020,200 | ||||||||||||||
Amgen Incorporated | 140,000 | 35,582,400 | ||||||||||||||
Neurocrine Biosciences Incorporated † | 75,000 | 7,212,000 | ||||||||||||||
Vertex Pharmaceuticals Incorporated † | 35,000 | 9,524,200 | ||||||||||||||
| 113,885,600 | ||||||||||||||||
|
| |||||||||||||||
Health Care Equipment & Supplies: 5.76% | ||||||||||||||||
Abbott Laboratories | 160,000 | 17,412,800 | ||||||||||||||
Becton Dickinson & Company | 55,000 | 12,797,400 | ||||||||||||||
Danaher Corporation | 140,000 | 30,146,200 | ||||||||||||||
ElectroCore LLC †« | 30,000 | 51,900 | ||||||||||||||
| 60,408,300 | ||||||||||||||||
|
| |||||||||||||||
Health Care Providers & Services: 2.46% | ||||||||||||||||
Anthem Incorporated | 35,000 | 9,400,650 | ||||||||||||||
McKesson Corporation | 110,000 | 16,382,300 | ||||||||||||||
| 25,782,950 | ||||||||||||||||
|
| |||||||||||||||
Life Sciences Tools & Services: 4.58% | ||||||||||||||||
Bio-Rad Laboratories Incorporated Class A † | 15,000 | 7,731,900 | ||||||||||||||
IQVIA Holdings Incorporated † | 60,000 | 9,457,800 | ||||||||||||||
Thermo Fisher Scientific Incorporated | 70,000 | 30,906,400 | ||||||||||||||
| 48,096,100 | ||||||||||||||||
|
| |||||||||||||||
Pharmaceuticals: 7.11% | ||||||||||||||||
Bausch Health Companies Incorporated † | 540,000 | 8,391,600 | ||||||||||||||
Bristol-Myers Squibb Company | 640,000 | 38,585,600 | ||||||||||||||
Horizon Therapeutics plc † | 205,000 | 15,924,400 | ||||||||||||||
Merck KGaA ADR | 400,000 | 11,728,000 | ||||||||||||||
| 74,629,600 | ||||||||||||||||
|
| |||||||||||||||
The accompanying notes are an integral part of these financial statements.
Wells Fargo Diversified Capital Builder Fund | 11
Table of Contents
Portfolio of investments—September 30, 2020
| Shares | Value | |||||||||||||||
| Industrials: 8.84% |
| |||||||||||||||
Aerospace & Defense: 3.27% | ||||||||||||||||
Curtiss-Wright Corporation | 45,000 | $ | 4,196,700 | |||||||||||||
Huntington Ingalls Industries Incorporated | 30,000 | 4,222,500 | ||||||||||||||
L3Harris Technologies Incorporated | 130,000 | 22,079,200 | ||||||||||||||
Lockheed Martin Corporation | 10,000 | 3,832,800 | ||||||||||||||
| 34,331,200 | ||||||||||||||||
|
| |||||||||||||||
Electrical Equipment: 1.37% | ||||||||||||||||
AMETEK Incorporated | 145,000 | 14,413,000 | ||||||||||||||
|
| |||||||||||||||
Industrial Conglomerates: 1.12% | ||||||||||||||||
Honeywell International Incorporated | 35,000 | 5,761,350 | ||||||||||||||
Roper Technologies Incorporated | 15,000 | 5,926,650 | ||||||||||||||
| 11,688,000 | ||||||||||||||||
|
| |||||||||||||||
Machinery: 3.08% | ||||||||||||||||
Crane Company | 60,000 | 3,007,800 | ||||||||||||||
IDEX Corporation | 80,000 | 14,592,800 | ||||||||||||||
John Bean Technologies Corporation | 160,000 | 14,702,400 | ||||||||||||||
| 32,303,000 | ||||||||||||||||
|
| |||||||||||||||
Information Technology: 32.84% | ||||||||||||||||
| Electronic Equipment, Instruments & Components: 4.26% | ||||||||||||||||
Amphenol Corporation Class A | 300,000 | 32,481,000 | ||||||||||||||
FLIR Systems Incorporated | 300,000 | 10,755,000 | ||||||||||||||
MTS Systems Corporation | 75,000 | 1,433,250 | ||||||||||||||
| 44,669,250 | ||||||||||||||||
|
| |||||||||||||||
IT Services: 6.88% | ||||||||||||||||
Akamai Technologies Incorporated † | 340,000 | 37,583,600 | ||||||||||||||
Leidos Holdings Incorporated | 350,000 | 31,202,500 | ||||||||||||||
MasterCard Incorporated Class A | 10,000 | 3,381,700 | ||||||||||||||
| 72,167,800 | ||||||||||||||||
|
| |||||||||||||||
Semiconductors & Semiconductor Equipment: 12.22% | ||||||||||||||||
Advanced Micro Devices Incorporated † | 300,000 | 24,597,000 | ||||||||||||||
Analog Devices Incorporated | 20,000 | 2,334,800 | ||||||||||||||
Broadcom Incorporated | 150,000 | 54,648,000 | ||||||||||||||
Microchip Technology Incorporated | 235,000 | 24,148,600 | ||||||||||||||
Micron Technology Incorporated † | 25,000 | 1,174,000 | ||||||||||||||
QUALCOMM Incorporated | 35,000 | 4,118,800 | ||||||||||||||
Texas Instruments Incorporated | 70,000 | 9,995,300 | ||||||||||||||
Xilinx Incorporated | 70,000 | 7,296,800 | ||||||||||||||
| 128,313,300 | ||||||||||||||||
|
| |||||||||||||||
Software: 7.41% | ||||||||||||||||
Adobe Incorporated † | 50,000 | 24,521,500 | ||||||||||||||
ANSYS Incorporated † | 30,000 | 9,816,900 | ||||||||||||||
Microsoft Corporation | 120,000 | 25,239,600 | ||||||||||||||
Synopsys Incorporated † | 85,000 | 18,188,300 | ||||||||||||||
| 77,766,300 | ||||||||||||||||
|
| |||||||||||||||
The accompanying notes are an integral part of these financial statements.
12 | Wells Fargo Diversified Capital Builder Fund
Table of Contents
Portfolio of investments—September 30, 2020
| Shares | Value | |||||||||||||||
| Technology Hardware, Storage & Peripherals: 2.07% | ||||||||||||||||
Apple Incorporated | 172,000 | $ | 19,919,320 | |||||||||||||
Western Digital Corporation | 50,000 | 1,827,500 | ||||||||||||||
| 21,746,820 | ||||||||||||||||
|
| |||||||||||||||
Materials: 3.66% | ||||||||||||||||
| Chemicals: 1.73% | ||||||||||||||||
Eastman Chemical Company | 30,000 | 2,343,600 | ||||||||||||||
Huntsman Corporation | 80,000 | 1,776,800 | ||||||||||||||
The Sherwin-Williams Company | 18,500 | 12,889,690 | ||||||||||||||
Tronox Holdings plc Class A | 150,000 | 1,180,500 | ||||||||||||||
| 18,190,590 | ||||||||||||||||
|
| |||||||||||||||
Containers & Packaging: 1.93% | ||||||||||||||||
AptarGroup Incorporated | 76,500 | 8,659,800 | ||||||||||||||
Berry Global Group Incorporated † | 240,000 | 11,596,800 | ||||||||||||||
| 20,256,600 | ||||||||||||||||
|
| |||||||||||||||
Real Estate: 0.84% | ||||||||||||||||
| Equity REITs: 0.84% | ||||||||||||||||
Crown Castle International Corporation | 50,000 | 8,325,000 | ||||||||||||||
Saul Centers Incorporated | 20,000 | 531,600 | ||||||||||||||
| 8,856,600 | ||||||||||||||||
|
| |||||||||||||||
Utilities: 3.68% | ||||||||||||||||
| Electric Utilities: 0.39% | ||||||||||||||||
American Electric Power Company Incorporated | 50,000 | 4,086,500 | ||||||||||||||
|
| |||||||||||||||
Gas Utilities: 0.18% | ||||||||||||||||
Atmos Energy Corporation | 20,000 | 1,911,800 | ||||||||||||||
|
| |||||||||||||||
Independent Power & Renewable Electricity Producers: 2.78% | ||||||||||||||||
Vistra Energy Corporation | 1,550,000 | 29,233,000 | ||||||||||||||
|
| |||||||||||||||
Multi-Utilities: 0.33% | ||||||||||||||||
DTE Energy Company | 30,000 | 3,451,200 | ||||||||||||||
|
| |||||||||||||||
Total Common Stocks (Cost $688,752,538) |
| 893,506,876 | ||||||||||||||
|
| |||||||||||||||
Interest rate | Maturity date | Principal | ||||||||||||||
| Corporate Bonds and Notes: 13.01% | ||||||||||||||||
Consumer Discretionary: 0.27% | ||||||||||||||||
| Household Durables: 0.27% | ||||||||||||||||
Installed Building Company 144A | 5.75 | % | 2-1-2028 | $ | 2,700,000 | 2,841,750 | ||||||||||
|
| |||||||||||||||
Health Care: 3.57% | ||||||||||||||||
| Health Care Equipment & Supplies: 0.52% | ||||||||||||||||
Hologic Incorporated 144A | 3.25 | 2-15-2029 | 5,440,000 | 5,474,000 | ||||||||||||
|
| |||||||||||||||
| Health Care Providers & Services: 2.95% | ||||||||||||||||
AMN Healthcare Incorporated 144A | 4.63 | 10-1-2027 | 1,000,000 | 1,025,000 | ||||||||||||
Centene Corporation | 4.63 | 12-15-2029 | 6,500,000 | 7,011,290 | ||||||||||||
DaVita Incorporated 144A | 4.63 | 6-1-2030 | 12,550,000 | 12,881,320 | ||||||||||||
The accompanying notes are an integral part of these financial statements.
Wells Fargo Diversified Capital Builder Fund | 13
Table of Contents
Portfolio of investments—September 30, 2020
Interest rate | Maturity date | Principal | Value | |||||||||||||
| Health Care Providers & Services (continued) | ||||||||||||||||
Encompass Health Corporation %% | 4.63 | % | 4-1-2031 | $ | 2,500,000 | $ | 2,500,000 | |||||||||
West Street Merger Sub Incorporated 144A | 6.38 | 9-1-2025 | 7,400,000 | 7,546,446 | ||||||||||||
| 30,964,056 | ||||||||||||||||
|
| |||||||||||||||
Pharmaceuticals: 0.10% | ||||||||||||||||
Catalent Pharma Solutions Incorporated 144A | 4.88 | 1-15-2026 | 1,000,000 | 1,020,000 | ||||||||||||
|
| |||||||||||||||
Industrials: 2.50% | ||||||||||||||||
| Aerospace & Defense: 0.81% | ||||||||||||||||
TransDigm Group Incorporated | 6.38 | 6-15-2026 | 7,000,000 | 7,027,510 | ||||||||||||
TransDigm Group Incorporated | 6.50 | 5-15-2025 | 1,500,000 | 1,495,313 | ||||||||||||
| 8,522,823 | ||||||||||||||||
|
| |||||||||||||||
Commercial Services & Supplies: 0.15% | ||||||||||||||||
ACCO Brands Corporation 144A | 5.25 | 12-15-2024 | 1,500,000 | 1,535,625 | ||||||||||||
|
| |||||||||||||||
Electrical Equipment: 0.11% | ||||||||||||||||
Resideo Funding Incorporated 144A | 6.13 | 11-1-2026 | 1,112,000 | 1,095,320 | ||||||||||||
|
| |||||||||||||||
Machinery: 1.04% | ||||||||||||||||
SPX FLOW Incorporated 144A | 5.88 | 8-15-2026 | 10,500,000 | 10,920,000 | ||||||||||||
|
| |||||||||||||||
Trading Companies & Distributors: 0.39% | ||||||||||||||||
WESCO Distribution Incorporated | 5.38 | 6-15-2024 | 4,000,000 | 4,105,000 | ||||||||||||
|
| |||||||||||||||
Information Technology: 3.93% | ||||||||||||||||
| Electronic Equipment, Instruments & Components: 1.69% | ||||||||||||||||
MTS Systems Corporation 144A | 5.75 | 8-15-2027 | 4,000,000 | 3,938,800 | ||||||||||||
TTM Technologies Incorporated 144A | 5.63 | 10-1-2025 | 13,505,000 | 13,775,100 | ||||||||||||
| 17,713,900 | ||||||||||||||||
|
| |||||||||||||||
Semiconductors & Semiconductor Equipment: 0.94% | ||||||||||||||||
Broadcom Incorporated | 4.75 | 4-15-2029 | 4,000,000 | 4,645,402 | ||||||||||||
Microchip Technology Incorporated 144A | 4.25 | 9-1-2025 | 5,000,000 | 5,186,912 | ||||||||||||
| 9,832,314 | ||||||||||||||||
|
| |||||||||||||||
Software: 0.41% | ||||||||||||||||
Citrix Systems Incorporated | 3.30 | 3-1-2030 | 4,000,000 | 4,269,114 | ||||||||||||
|
| |||||||||||||||
Technology Hardware, Storage & Peripherals: 0.89% | ||||||||||||||||
Western Digital Corporation | 4.75 | 2-15-2026 | 8,700,000 | 9,396,000 | ||||||||||||
|
| |||||||||||||||
Materials: 2.21% | ||||||||||||||||
| Chemicals: 0.89% | ||||||||||||||||
Koppers Incorporated 144A | 6.00 | 2-15-2025 | 8,190,000 | 8,302,612 | ||||||||||||
Olin Corporation | 5.50 | 8-15-2022 | 1,000,000 | 1,022,500 | ||||||||||||
| 9,325,112 | ||||||||||||||||
|
| |||||||||||||||
Containers & Packaging: 1.32% | ||||||||||||||||
Ball Corporation | 2.88 | 8-15-2030 | 12,000,000 | 11,865,000 | ||||||||||||
Berry Global Incorporated 144A | 4.50 | 2-15-2026 | 2,000,000 | 2,020,000 | ||||||||||||
| 13,885,000 | ||||||||||||||||
|
| |||||||||||||||
The accompanying notes are an integral part of these financial statements.
14 | Wells Fargo Diversified Capital Builder Fund
Table of Contents
Portfolio of investments—September 30, 2020
Interest rate | Maturity date | Principal | Value | |||||||||||||
| Real Estate: 0.43% | ||||||||||||||||
Equity REITs: 0.43% | ||||||||||||||||
Iron Mountain Incorporated 144A | 4.50 | % | 2-15-2031 | $ | 4,500,000 | $ | 4,524,818 | |||||||||
|
| |||||||||||||||
Utilities: 0.10% | ||||||||||||||||
| Electric Utilities: 0.10% | ||||||||||||||||
NRG Energy Incorporated 144A | 5.25 | 6-15-2029 | 1,000,000 | 1,087,500 | ||||||||||||
|
| |||||||||||||||
Total Corporate Bonds and Notes (Cost $133,691,014) |
| 136,512,332 | ||||||||||||||
|
| |||||||||||||||
Yankee Corporate Bonds and Notes: 1.96% | ||||||||||||||||
Financials: 0.47% | ||||||||||||||||
| Diversified Financial Services: 0.47% | ||||||||||||||||
Tronox Finance plc 144A | 5.75 | 10-1-2025 | 5,000,000 | 4,925,000 | ||||||||||||
|
| |||||||||||||||
Health Care: 0.94% | ||||||||||||||||
| Pharmaceuticals: 0.94% | ||||||||||||||||
Bausch Health Companies Incorporated 144A | 5.25 | 1-30-2030 | 10,000,000 | 9,852,600 | ||||||||||||
|
| |||||||||||||||
Information Technology: 0.36% | ||||||||||||||||
| Technology Hardware, Storage & Peripherals: 0.36% | ||||||||||||||||
Seagate HDD 144A | 4.09 | 6-1-2029 | 3,488,000 | 3,769,881 | ||||||||||||
|
| |||||||||||||||
Materials: 0.19% | ||||||||||||||||
| Chemicals: 0.19% | ||||||||||||||||
Methanex Corporation | 5.13 | 10-15-2027 | 2,000,000 | 1,990,000 | ||||||||||||
|
| |||||||||||||||
Total Yankee Corporate Bonds and Notes (Cost $20,511,210) |
| 20,537,481 | ||||||||||||||
|
| |||||||||||||||
| Yield | Shares | |||||||||||||||
| Short-Term Investments: 0.88% | ||||||||||||||||
| Investment Companies: 0.88% | ||||||||||||||||
Securities Lending Cash Investments LLC (l)(r)(u) | 0.12 | 44,100 | 44,100 | |||||||||||||
Wells Fargo Government Money Market Fund Select Class (l)(u)## | 0.05 | 9,255,832 | 9,255,832 | |||||||||||||
Total Short-Term Investments (Cost $9,299,932) |
| 9,299,932 | ||||||||||||||
|
| |||||||||||||||
| Total investments in securities (Cost $852,254,694) | 100.98 | % | 1,059,856,621 | |||||
Other assets and liabilities, net | (0.98 | ) | (10,300,713 | ) | ||||
|
|
|
| |||||
| Total net assets | 100.00 | % | $ | 1,049,555,908 | ||||
|
|
|
| |||||
| † | Non-income-earning security |
| « | All or a portion of this security is on loan. |
| 144A | The security may be resold in transactions exempt from registration, normally to qualified institutional buyers, pursuant to Rule 144A under the Securities Act of 1933. |
| %% | The security is purchased on a when-issued basis. |
| (l) | The issuer of the security is an affiliated person of the Fund as defined in the Investment Company Act of 1940. |
| (r) | The investment is a non-registered investment company purchased with cash collateral received from securities on loan. |
| (u) | The rate represents the 7-day annualized yield at period end. |
| ## | All or a portion of this security is segregated for when-issued securities. |
Abbreviations:
| ADR | American depositary receipt |
| GO | General obligation |
The accompanying notes are an integral part of these financial statements.
Wells Fargo Diversified Capital Builder Fund | 15
Table of Contents
Portfolio of investments—September 30, 2020
Investments in Affiliates
An affiliated investment is an investment in which the Fund owns at least 5% of the outstanding voting shares of the issuer or as a result of other relationships, such as the Fund and the issuer having the same investment manager. Transactions with issuers that were either affiliated persons of the Fund at the beginning of the period or the end of the period were as follows:
| Value, beginning of period | Purchases | Sales proceeds | Net realized gains (losses) | Net change in unrealized gains (losses) | Income from affiliated securities | Value, end of period | % of net assets | |||||||||||||||||||||||||
| Short-Term Investments | ||||||||||||||||||||||||||||||||
Investment Companies | ||||||||||||||||||||||||||||||||
Securities Lending Cash Investments LLC | $ | 5,715,472 | $ | 112,184,118 | $ | (117,855,843 | ) | $ | 353 | $ | 0 | $ | 93,935 | # | $ | 44,100 | ||||||||||||||||
Wells Fargo Government Money Market Fund Select Class | 5,712,610 | 200,984,199 | (197,440,977 | ) | 0 | 0 | 36,115 | 9,255,832 | ||||||||||||||||||||||||
|
|
|
|
|
|
|
|
|
| |||||||||||||||||||||||
| $ | 353 | $ | 0 | $ | 130,050 | $ | 9,299,932 | 0.88 | % | |||||||||||||||||||||||
|
|
|
|
|
|
|
|
|
| |||||||||||||||||||||||
| # | Amount shown represents income before fees and rebates. |
The accompanying notes are an integral part of these financial statements.
16 | Wells Fargo Diversified Capital Builder Fund
Table of Contents
Statement of assets and liabilities—September 30, 2020
Assets | ||||
Investments in unaffiliated securities (including $43,596 of securities on loan) at value (cost $842,954,762) | $ | 1,050,556,689 | ||
Investments in affiliated securities, at value (cost $9,299,932) | 9,299,932 | |||
Receivable for Fund shares sold | 289,987 | |||
Receivable for dividends and interest | 2,008,369 | |||
Receivable for securities lending income, net | 548 | |||
Prepaid expenses and other assets | 82,176 | |||
|
| |||
Total assets | 1,062,237,701 | |||
|
| |||
Liabilities | ||||
Payable upon receipt of securities loaned | 44,100 | |||
Payable for investments purchased | 7,550,347 | |||
Payable for when-issued securities | 2,536,250 | |||
Payable for Fund shares redeemed | 1,700,324 | |||
Management fee payable | 533,211 | |||
Administration fees payable | 159,506 | |||
Distribution fee payable | 75,196 | |||
Accrued expenses and other liabilities | 82,859 | |||
|
| |||
Total liabilities | 12,681,793 | |||
|
| |||
Total net assets | $ | 1,049,555,908 | ||
|
| |||
Net assets consist of | ||||
Paid-in capital | $ | 830,093,794 | ||
Total distributable earnings | 219,462,114 | |||
|
| |||
Total net assets | $ | 1,049,555,908 | ||
|
| |||
Computation of net asset value and offering price per share | ||||
Net assets – Class A | $ | 601,950,965 | ||
Shares outstanding – Class A1 | 55,344,374 | |||
Net asset value per share – Class A | $10.88 | |||
Maximum offering price per share – Class A2 | $11.54 | |||
Net assets – Class C | $ | 121,946,977 | ||
Shares outstanding – Class C1 | 11,231,163 | |||
Net asset value per share – Class C | $10.86 | |||
Net assets – Administrator Class | $ | 6,429,070 | ||
Shares outstanding – Administrator Class1 | 590,621 | |||
Net asset value per share – Administrator Class | $10.89 | |||
Net assets – Institutional Class | $ | 319,228,896 | ||
Shares outstanding – Institutional Class1 | 29,573,992 | |||
Net asset value per share – Institutional Class | $10.79 | |||
| 1 | The Fund has an unlimited number of authorized shares. |
| 2 | Maximum offering price is computed as 100/94.25 of net asset value. On investments of $50,000 or more, the offering price is reduced. |
The accompanying notes are an integral part of these financial statements.
Wells Fargo Diversified Capital Builder Fund | 17
Table of Contents
Statement of operations—year ended September 30, 2020
Investment income | ||||
Dividends (net of foreign withholding taxes of $17,481) | $ | 15,080,687 | ||
Interest | 8,321,930 | |||
Income from affiliated securities | 57,829 | |||
|
| |||
Total investment income | 23,460,446 | |||
|
| |||
Expenses | ||||
Management fee | 6,607,685 | |||
Administration fees | ||||
Class A | 1,254,727 | |||
Class C | 254,795 | |||
Administrator Class | 10,314 | |||
Institutional Class | 441,401 | |||
Shareholder servicing fees | ||||
Class A | 1,491,566 | |||
Class C | 303,145 | |||
Administrator Class | 19,793 | |||
Distribution fee | ||||
Class C | 909,234 | |||
Custody and accounting fees | 49,752 | |||
Professional fees | 47,390 | |||
Registration fees | 99,407 | |||
Shareholder report expenses | 103,575 | |||
Trustees’ fees and expenses | 21,260 | |||
Other fees and expenses | 40,493 | |||
|
| |||
Total expenses | 11,654,537 | |||
Less: Fee waivers and/or expense reimbursements | ||||
Fund-level | (1,131 | ) | ||
Class A | (18,101 | ) | ||
Class C | (217 | ) | ||
Administrator Class | (8 | ) | ||
Institutional Class | (17,879 | ) | ||
|
| |||
Net expenses | 11,617,201 | |||
|
| |||
Net investment income | 11,843,245 | |||
|
| |||
Realized and unrealized gains (losses) on investments | ||||
Net realized gains on | ||||
Unaffiliated securities | 10,794,062 | |||
Affiliated securities | 353 | |||
|
| |||
Net realized gains on investments | 10,794,415 | |||
Net change in unrealized gains (losses) on investments | 42,479,631 | |||
|
| |||
Net realized and unrealized gains (losses) on investments | 53,274,046 | |||
|
| |||
Net increase in net assets resulting from operations | $ | 65,117,291 | ||
|
| |||
The accompanying notes are an integral part of these financial statements.
18 | Wells Fargo Diversified Capital Builder Fund
Table of Contents
Statement of changes in net assets
| Year ended September 30, 2020 | Year ended September 30, 2019 | |||||||||||||||
Operations | ||||||||||||||||
Net investment income | $ | 11,843,245 | $ | 14,574,587 | ||||||||||||
Net realized gains on investments | 10,794,415 | 53,801,908 | ||||||||||||||
Net change in unrealized gains (losses) on investments | 42,479,631 | (8,891,274 | ) | |||||||||||||
|
| |||||||||||||||
Net increase in net assets resulting from operations | 65,117,291 | 59,485,221 | ||||||||||||||
|
| |||||||||||||||
Distributions to shareholders from net investment income and net realized gains | ||||||||||||||||
Class A | (32,619,920 | ) | (36,253,338 | ) | ||||||||||||
Class C | (5,629,511 | ) | (7,460,798 | ) | ||||||||||||
Administrator Class | (491,553 | ) | (764,433 | ) | ||||||||||||
Institutional Class | (20,579,220 | ) | (21,977,654 | ) | ||||||||||||
|
| |||||||||||||||
Total distributions to shareholders | (59,320,204 | ) | (66,456,223 | ) | ||||||||||||
|
| |||||||||||||||
Capital share transactions | Shares | Shares | ||||||||||||||
Proceeds from shares sold | ||||||||||||||||
Class A | 3,965,389 | 41,907,199 | 9,391,056 | 93,260,195 | ||||||||||||
Class C | 2,956,606 | 30,937,431 | 4,595,019 | 46,061,402 | ||||||||||||
Administrator Class | 151,606 | 1,529,330 | 227,726 | 2,281,752 | ||||||||||||
Institutional Class | 7,957,364 | 82,460,036 | 15,448,752 | 154,786,786 | ||||||||||||
|
| |||||||||||||||
| 156,833,996 | 296,390,135 | |||||||||||||||
|
| |||||||||||||||
Reinvestment of distributions | ||||||||||||||||
Class A | 3,027,088 | 31,259,543 | 3,667,392 | 34,796,863 | ||||||||||||
Class C | 523,869 | 5,421,139 | 774,676 | 7,255,587 | ||||||||||||
Administrator Class | 47,212 | 487,564 | 79,989 | 758,159 | ||||||||||||
Institutional Class | 1,851,509 | 18,977,296 | 2,124,090 | 20,080,474 | ||||||||||||
|
| |||||||||||||||
| 56,145,542 | 62,891,083 | |||||||||||||||
|
| |||||||||||||||
Payment for shares redeemed | ||||||||||||||||
Class A | (9,176,945 | ) | (93,301,844 | ) | (8,342,798 | ) | (83,876,599 | ) | ||||||||
Class C | (3,315,378 | ) | (33,616,928 | ) | (6,420,901 | ) | (63,323,374 | ) | ||||||||
Administrator Class | (513,380 | ) | (5,090,942 | ) | (671,418 | ) | (7,048,173 | ) | ||||||||
Institutional Class | (14,006,603 | ) | (140,839,941 | ) | (13,982,283 | ) | (140,897,557 | ) | ||||||||
|
| |||||||||||||||
| (272,849,655 | ) | (295,145,703 | ) | |||||||||||||
|
| |||||||||||||||
Net increase (decrease) in net assets resulting from capital share transactions | (59,870,117 | ) | 64,135,515 | |||||||||||||
|
| |||||||||||||||
Total increase (decrease) in net assets | (54,073,030 | ) | 57,164,513 | |||||||||||||
|
| |||||||||||||||
Net assets | ||||||||||||||||
Beginning of period | 1,103,628,938 | 1,046,464,425 | ||||||||||||||
|
| |||||||||||||||
End of period | $ | 1,049,555,908 | $ | 1,103,628,938 | ||||||||||||
|
| |||||||||||||||
The accompanying notes are an integral part of these financial statements.
Wells Fargo Diversified Capital Builder Fund | 19
Table of Contents
(For a share outstanding throughout each period)
| Year ended September 30 | ||||||||||||||||||||
| CLASS A | 2020 | 2019 | 2018 | 2017 | 2016 | |||||||||||||||
Net asset value, beginning of period | $10.71 | $10.88 | $10.30 | $9.96 | $9.12 | |||||||||||||||
Net investment income | 0.11 | 0.14 | 0.10 | 0.14 | 1 | 0.17 | ||||||||||||||
Net realized and unrealized gains (losses) on investments | 0.63 | 0.37 | 1.06 | 1.12 | 1.71 | |||||||||||||||
|
|
|
|
|
|
|
|
|
| |||||||||||
Total from investment operations | 0.74 | 0.51 | 1.16 | 1.26 | 1.88 | |||||||||||||||
Distributions to shareholders from | ||||||||||||||||||||
Net investment income | (0.13 | ) | (0.14 | ) | (0.09 | ) | (0.14 | ) | (0.15 | ) | ||||||||||
Net realized gains | (0.44 | ) | (0.54 | ) | (0.49 | ) | (0.78 | ) | (0.89 | ) | ||||||||||
|
|
|
|
|
|
|
|
|
| |||||||||||
Total distributions to shareholders | (0.57 | ) | (0.68 | ) | (0.58 | ) | (0.92 | ) | (1.04 | ) | ||||||||||
Net asset value, end of period | $10.88 | $10.71 | $10.88 | $10.30 | $9.96 | |||||||||||||||
Total return2 | 7.26 | % | 5.60 | % | 11.72 | % | 13.62 | % | 22.85 | % | ||||||||||
Ratios to average net assets (annualized) | ||||||||||||||||||||
Gross expenses | 1.11 | % | 1.12 | % | 1.11 | % | 1.12 | % | 1.14 | % | ||||||||||
Net expenses | 1.11 | % | 1.12 | % | 1.11 | % | 1.12 | % | 1.14 | % | ||||||||||
Net investment income | 1.09 | % | 1.38 | % | 0.96 | % | 1.43 | % | 1.77 | % | ||||||||||
Supplemental data | ||||||||||||||||||||
Portfolio turnover rate | 44 | % | 61 | % | 31 | % | 54 | % | 73 | % | ||||||||||
Net assets, end of period (000s omitted) | $601,951 | $616,346 | $574,760 | $551,272 | $467,503 | |||||||||||||||
| 1 | Calculated based upon average shares outstanding |
| 2 | Total return calculations do not include any sales charges. |
The accompanying notes are an integral part of these financial statements.
20 | Wells Fargo Diversified Capital Builder Fund
Table of Contents
Financial highlights
(For a share outstanding throughout each period)
| Year ended September 30 | ||||||||||||||||||||
| CLASS C | 2020 | 2019 | 2018 | 2017 | 2016 | |||||||||||||||
Net asset value, beginning of period | $10.69 | $10.86 | $10.28 | $9.96 | $9.12 | |||||||||||||||
Net investment income | 0.03 | 0.06 | 0.02 | 0.08 | 0.10 | |||||||||||||||
Net realized and unrealized gains (losses) on investments | 0.63 | 0.37 | 1.06 | 1.11 | 1.72 | |||||||||||||||
|
|
|
|
|
|
|
|
|
| |||||||||||
Total from investment operations | 0.66 | 0.43 | 1.08 | 1.19 | 1.82 | |||||||||||||||
Distributions to shareholders from | ||||||||||||||||||||
Net investment income | (0.05 | ) | (0.06 | ) | (0.01 | ) | (0.09 | ) | (0.09 | ) | ||||||||||
Net realized gains | (0.44 | ) | (0.54 | ) | (0.49 | ) | (0.78 | ) | (0.89 | ) | ||||||||||
|
|
|
|
|
|
|
|
|
| |||||||||||
Total distributions to shareholders | (0.49 | ) | (0.60 | ) | (0.50 | ) | (0.87 | ) | (0.98 | ) | ||||||||||
Net asset value, end of period | $10.86 | $10.69 | $10.86 | $10.28 | $9.96 | |||||||||||||||
Total return1 | 6.44 | % | 4.81 | % | 10.88 | % | 12.85 | % | 21.96 | % | ||||||||||
Ratios to average net assets (annualized) | ||||||||||||||||||||
Gross expenses | 1.86 | % | 1.87 | % | 1.87 | % | 1.87 | % | 1.89 | % | ||||||||||
Net expenses | 1.86 | % | 1.87 | % | 1.87 | % | 1.87 | % | 1.89 | % | ||||||||||
Net investment income | 0.34 | % | 0.65 | % | 0.21 | % | 0.65 | % | 1.03 | % | ||||||||||
Supplemental data | ||||||||||||||||||||
Portfolio turnover rate | 44 | % | 61 | % | 31 | % | 54 | % | 73 | % | ||||||||||
Net assets, end of period (000s omitted) | $121,947 | $118,297 | $131,601 | $117,346 | $67,630 | |||||||||||||||
| 1 | Total return calculations do not include any sales charges. |
The accompanying notes are an integral part of these financial statements.
Wells Fargo Diversified Capital Builder Fund | 21
Table of Contents
Financial highlights
(For a share outstanding throughout each period)
| Year ended September 30 | ||||||||||||||||||||
| ADMINISTRATOR CLASS | 2020 | 2019 | 2018 | 2017 | 2016 | |||||||||||||||
Net asset value, beginning of period | $10.72 | $10.89 | $10.32 | $9.97 | $9.12 | |||||||||||||||
Net investment income | 0.12 | 1 | 0.15 | 1 | 0.11 | 1 | 0.16 | 1 | 0.18 | 1 | ||||||||||
Net realized and unrealized gains (losses) on investments | 0.63 | 0.37 | 1.06 | 1.12 | 1.73 | |||||||||||||||
|
|
|
|
|
|
|
|
|
| |||||||||||
Total from investment operations | 0.75 | 0.52 | 1.17 | 1.28 | 1.91 | |||||||||||||||
Distributions to shareholders from | ||||||||||||||||||||
Net investment income | (0.14 | ) | (0.15 | ) | (0.11 | ) | (0.15 | ) | (0.17 | ) | ||||||||||
Net realized gains | (0.44 | ) | (0.54 | ) | (0.49 | ) | (0.78 | ) | (0.89 | ) | ||||||||||
|
|
|
|
|
|
|
|
|
| |||||||||||
Total distributions to shareholders | (0.58 | ) | (0.69 | ) | (0.60 | ) | (0.93 | ) | (1.06 | ) | ||||||||||
Net asset value, end of period | $10.89 | $10.72 | $10.89 | $10.32 | $9.97 | |||||||||||||||
Total return | 7.33 | % | 5.67 | % | 11.73 | % | 13.75 | % | 23.14 | % | ||||||||||
Ratios to average net assets (annualized) | ||||||||||||||||||||
Gross expenses | 1.03 | % | 1.04 | % | 1.03 | % | 1.04 | % | 1.06 | % | ||||||||||
Net expenses | 1.03 | % | 1.04 | % | 1.03 | % | 1.04 | % | 1.03 | % | ||||||||||
Net investment income | 1.19 | % | 1.47 | % | 1.04 | % | 1.58 | % | 1.89 | % | ||||||||||
Supplemental data | ||||||||||||||||||||
Portfolio turnover rate | 44 | % | 61 | % | 31 | % | 54 | % | 73 | % | ||||||||||
Net assets, end of period (000s omitted) | $6,429 | $9,708 | $13,821 | $10,225 | $21,398 | |||||||||||||||
| 1 | Calculated based upon average shares outstanding |
The accompanying notes are an integral part of these financial statements.
22 | Wells Fargo Diversified Capital Builder Fund
Table of Contents
Financial highlights
(For a share outstanding throughout each period)
| Year ended September 30 | ||||||||||||||||||||
| INSTITUTIONAL CLASS | 2020 | 2019 | 2018 | 2017 | 2016 | |||||||||||||||
Net asset value, beginning of period | $10.64 | $10.81 | $10.25 | $9.90 | $9.07 | |||||||||||||||
Net investment income | 0.14 | 0.18 | 0.14 | 0.19 | 0.20 | |||||||||||||||
Net realized and unrealized gains (losses) on investments | 0.62 | 0.36 | 1.05 | 1.11 | 1.71 | |||||||||||||||
|
|
|
|
|
|
|
|
|
| |||||||||||
Total from investment operations | 0.76 | 0.54 | 1.19 | 1.30 | 1.91 | |||||||||||||||
Distributions to shareholders from | ||||||||||||||||||||
Net investment income | (0.17 | ) | (0.17 | ) | (0.14 | ) | (0.17 | ) | (0.19 | ) | ||||||||||
Net realized gains | (0.44 | ) | (0.54 | ) | (0.49 | ) | (0.78 | ) | (0.89 | ) | ||||||||||
|
|
|
|
|
|
|
|
|
| |||||||||||
Total distributions to shareholders | (0.61 | ) | (0.71 | ) | (0.63 | ) | (0.95 | ) | (1.08 | ) | ||||||||||
Net asset value, end of period | $10.79 | $10.64 | $10.81 | $10.25 | $9.90 | |||||||||||||||
Total return | 7.48 | % | 5.98 | % | 12.04 | % | 14.11 | % | 23.28 | % | ||||||||||
Ratios to average net assets (annualized) | ||||||||||||||||||||
Gross expenses | 0.78 | % | 0.79 | % | 0.79 | % | 0.79 | % | 0.81 | % | ||||||||||
Net expenses | 0.78 | % | 0.78 | % | 0.78 | % | 0.78 | % | 0.78 | % | ||||||||||
Net investment income | 1.42 | % | 1.73 | % | 1.30 | % | 1.71 | % | 2.14 | % | ||||||||||
Supplemental data | ||||||||||||||||||||
Portfolio turnover rate | 44 | % | 61 | % | 31 | % | 54 | % | 73 | % | ||||||||||
Net assets, end of period (000s omitted) | $319,229 | $359,278 | $326,283 | $262,754 | $122,769 | |||||||||||||||
The accompanying notes are an integral part of these financial statements.
Wells Fargo Diversified Capital Builder Fund | 23
Table of Contents
1. ORGANIZATION
Wells Fargo Funds Trust (the “Trust”), a Delaware statutory trust organized on March 10, 1999, is an open-end management investment company registered under the Investment Company Act of 1940, as amended (the “1940 Act”). As an investment company, the Trust follows the accounting and reporting guidance in Financial Accounting Standards Board (“FASB”) Accounting Standards Codification Topic 946, Financial Services – Investment Companies. These financial statements report on the Wells Fargo Diversified Capital Builder Fund (the “Fund”) which is a diversified series of the Trust.
2. SIGNIFICANT ACCOUNTING POLICIES
The following significant accounting policies, which are consistently followed in the preparation of the financial statements of the Fund, are in conformity with U.S. generally accepted accounting principles which require management to make estimates and assumptions that affect the reported amounts of assets and liabilities, disclosure of contingent assets and liabilities at the date of the financial statements, and the reported amounts of revenues and expenses during the reporting period. Actual results could differ from those estimates.
Securities valuation
All investments are valued each business day as of the close of regular trading on the New York Stock Exchange (generally 4 p.m. Eastern Time), although the Fund may deviate from this calculation time under unusual or unexpected circumstances.
Equity securities that are listed on a foreign or domestic exchange or market are valued at the official closing price or, if none, the last sales price. If no sale occurs on the principal exchange or market that day, a fair value price will be determined in accordance with the Fund’s Valuation Procedures.
Debt securities are valued at the evaluated bid price provided by an independent pricing service (e.g. taking into account various factors, including yields, maturities, or credit ratings) or, if a reliable price is not available, the quoted bid price from an independent broker-dealer.
Investments in registered open-end investment companies are valued at net asset value. Interests in non-registered investment companies that are redeemable at net asset value are fair valued normally at net asset value.
Investments which are not valued using any of the methods discussed above are valued at their fair value, as determined in good faith by the Board of Trustees of the Fund. The Board of Trustees has established a Valuation Committee comprised of the Trustees and has delegated to it the authority to take any actions regarding the valuation of portfolio securities that the Valuation Committee deems necessary or appropriate, including determining the fair value of portfolio securities, unless the determination has been delegated to the Wells Fargo Asset Management Pricing Committee at Wells Fargo Funds Management, LLC (“Funds Management”). The Board of Trustees retains the authority to make or ratify any valuation decisions or approve any changes to the Valuation Procedures as it deems appropriate. On a quarterly basis, the Board of Trustees receives reports on any valuation actions taken by the Valuation Committee or the Wells Fargo Asset Management Pricing Committee which may include items for ratification.
Securities lending
The Fund may lend its securities from time to time in order to earn additional income in the form of fees or interest on securities received as collateral or the investment of any cash received as collateral. When securities are on loan, the Fund receives interest or dividends on those securities. Cash collateral received in connection with its securities lending transactions is invested in Securities Lending Cash Investments, LLC (the “Securities Lending Fund”). Investments in Securities Lending Fund are valued at the evaluated bid price provided by an independent pricing service. Income earned from investment in the Securities Lending Fund (net of fees and rebates), if any, is included in income from affiliated securities on the Statement of Operations.
In a securities lending transaction, the net asset value of the Fund is affected by an increase or decrease in the value of the securities loaned and by an increase or decrease in the value of the instrument in which collateral is invested. The amount of securities lending activity undertaken by the Fund fluctuates from time to time. The Fund has the right under the lending agreement to recover the securities from the borrower on demand. In the event of default or bankruptcy by the borrower, the Fund may be prevented from recovering the loaned securities or gaining access to the collateral or may experience delays or costs in doing so. In such an event, the terms of the agreement allow the unaffiliated securities lending agent to use the collateral to purchase replacement securities on behalf of the Fund or pay the Fund the market value of the loaned securities. The Fund bears the risk of loss with respect to depreciation of its investment of the cash collateral.
24 | Wells Fargo Diversified Capital Builder Fund
Table of Contents
Notes to financial statements
When-issued transactions
The Fund may purchase securities on a forward commitment or when-issued basis. The Fund records a when-issued transaction on the trade date and will segregate assets in an amount at least equal in value to the Fund’s commitment to purchase when-issued securities. Securities purchased on a when-issued basis are marked-to-market daily and the Fund begins earning interest on the settlement date. Losses may arise due to changes in the market value of the underlying securities or if the counterparty does not perform under the contract.
Security transactions and income recognition
Securities transactions are recorded on a trade date basis. Realized gains or losses are recorded on the basis of identified cost.
Dividend income is recognized on the ex-dividend date. Dividend income is recorded net of foreign taxes withheld where recovery of such taxes is not assured.
Interest income is accrued daily and bond discounts are accreted and premiums are amortized daily. To the extent debt obligations are placed on non-accrual status, any related interest income may be reduced by writing off interest receivables when the collection of all or a portion of interest has been determined to be doubtful based on consistently applied procedures and the fair value has decreased. If the issuer subsequently resumes interest payments or when the collectability of interest is reasonably assured, the debt obligation is removed from non-accrual status.
Distributions to shareholders
Distributions to shareholders are recorded on the ex-dividend date and paid from net investment income quarterly and any net realized gains are paid at least annually. Such distributions are determined in accordance with income tax regulations and may differ from U.S. generally accepted accounting principles. Dividend sources are estimated at the time of declaration. The tax character of distributions is determined as of the Fund’s fiscal year end. Therefore, a portion of the Fund’s distributions made prior to the Fund’s fiscal year end may be categorized as a tax return of capital at year end.
Federal and other taxes
The Fund intends to continue to qualify as a regulated investment company by distributing substantially all of its investment company taxable income and any net realized capital gains (after reduction for capital loss carryforwards) sufficient to relieve it from all, or substantially all, federal income taxes. Accordingly, no provision for federal income taxes was required.
The Fund’s income and federal excise tax returns and all financial records supporting those returns for the prior three fiscal years are subject to examination by the federal and Delaware revenue authorities. Management has analyzed the Fund’s tax positions taken on federal, state, and foreign tax returns for all open tax years and does not believe that there are any uncertain tax positions that require recognition of a tax liability.
As of September 30, 2020, the aggregate cost of all investments for federal income tax purposes was $852,307,124 and the unrealized gains (losses) consisted of:
Gross unrealized gains | $ | 237,474,039 | ||
Gross unrealized losses | (29,924,542 | ) | ||
Net unrealized gains | $ | 207,549,497 | ||
Reclassifications are made to the Fund’s capital accounts for permanent tax differences to reflect income and gains available for distribution (or available capital loss carryforwards) under federal income tax regulations. U.S. generally accepted accounting principles require that certain components of net assets be adjusted to reflect permanent differences between financial and tax reporting. These reclassifications have no effect on net assets or net asset values per share. At September 30, 2020, as a result of permanent book-to-tax differences, the following reclassification adjustments were made on the Statement of Assets and Liabilities:
| Paid-in capital | Total distributable earnings | |
| $(87,273) | $87,273 | |
Class allocations
The separate classes of shares offered by the Fund differ principally in applicable sales charges, distribution, shareholder servicing, and administration fees. Class specific expenses are charged directly to that share class. Investment income, common fund-level expenses, and realized and unrealized gains (losses) on investments are allocated daily to each class of shares based on the relative proportion of net assets of each class.
Wells Fargo Diversified Capital Builder Fund | 25
Table of Contents
Notes to financial statements
3. FAIR VALUATION MEASUREMENTS
Fair value measurements of investments are determined within a framework that has established a fair value hierarchy based upon the various data inputs utilized in determining the value of the Fund’s investments. The three-level hierarchy gives the highest priority to unadjusted quoted prices in active markets for identical assets or liabilities (Level 1) and the lowest priority to unobservable inputs (Level 3). The Fund’s investments are classified within the fair value hierarchy based on the lowest level of input that is significant to the fair value measurement. The inputs are summarized into three broad levels as follows:
| ∎ | Level 1 – quoted prices in active markets for identical securities |
| ∎ | Level 2 – other significant observable inputs (including quoted prices for similar securities, interest rates, prepayment speeds, credit risk, etc.) |
| ∎ | Level 3 – significant unobservable inputs (including the Fund’s own assumptions in determining the fair value of investments) |
The inputs or methodologies used for valuing investments in securities are not necessarily an indication of the risk associated with investing in those securities.
The following is a summary of the inputs used in valuing the Fund’s assets and liabilities as of September 30, 2020:
Quoted prices (Level 1) | Other significant observable inputs (Level 2) | Significant unobservable inputs (Level 3) | Total | |||||||||||||
Assets | ||||||||||||||||
Investments in: | ||||||||||||||||
Common stocks | ||||||||||||||||
Communication services | $ | 24,493,500 | $ | 0 | $ | 0 | $ | 24,493,500 | ||||||||
Consumer discretionary | 11,108,400 | 0 | 0 | 11,108,400 | ||||||||||||
Consumer staples | 11,717,466 | 0 | 0 | 11,717,466 | ||||||||||||
Health care | 322,802,550 | 0 | 0 | 322,802,550 | ||||||||||||
Industrials | 92,735,200 | 0 | 0 | 92,735,200 | ||||||||||||
Information technology | 344,663,470 | 0 | 0 | 344,663,470 | ||||||||||||
Materials | 38,447,190 | 0 | 0 | 38,447,190 | ||||||||||||
Real estate | 8,856,600 | 0 | 0 | 8,856,600 | ||||||||||||
Utilities | 38,682,500 | 0 | 0 | 38,682,500 | ||||||||||||
Corporate bonds and notes | 0 | 136,512,332 | 0 | 136,512,332 | ||||||||||||
Yankee corporate bonds and notes | 0 | 20,537,481 | 0 | 20,537,481 | ||||||||||||
Short-term investments | ||||||||||||||||
Investment companies | 9,299,932 | 0 | 0 | 9,299,932 | ||||||||||||
Total assets | $ | 902,806,808 | $ | 157,049,813 | $ | 0 | $ | 1,059,856,621 | ||||||||
Additional sector, industry or geographic detail is included in the Portfolio of Investments.
For the year ended September 30, 2020, the Fund did not have any transfers into/out of Level 3.
4. TRANSACTIONS WITH AFFILIATES
Management fee
Funds Management, an indirect wholly owned subsidiary of Wells Fargo & Company (“Wells Fargo”), is the manager of the Fund and provides advisory and fund-level administrative services under an investment management agreement. Under the investment management agreement, Funds Management is responsible for, among other services, implementing the investment objectives and strategies of the Fund, supervising the subadviser and providing fund-level administrative services in
26 | Wells Fargo Diversified Capital Builder Fund
Table of Contents
Notes to financial statements
connection with the Fund’s operations. As compensation for its services under the investment management agreement, Funds Management is entitled to receive a management fee at the following annual rate based on the Fund’s average daily net assets:
| Average daily net assets | Management fee | |||
First $500 million | 0.650 | % | ||
Next $500 million | 0.600 | |||
Next $2 billion | 0.550 | |||
Next $2 billion | 0.525 | |||
Next $5 billion | 0.490 | |||
Over $10 billion | 0.480 | |||
For the year ended September 30, 2020, the management fee was equivalent to an annual rate of 0.62% of the Fund’s average daily net assets.
Funds Management has retained the services of a subadviser to provide daily portfolio management to the Fund. The fee for subadvisory services is borne by Funds Management. Wells Capital Management Incorporated (“WellsCap), an affiliate of Funds Management and an indirect wholly owned subsidiary of Wells Fargo, is the subadviser to the Fund and is entitled to receive a fee from Funds Management at an annual rate starting at 0.35% and declining to 0.20% as the average daily net assets of the Fund increase.
Administration fees
Under a class-level administration agreement, Funds Management provides class-level administrative services to the Fund, which includes paying fees and expenses for services provided by the transfer agent, sub-transfer agents, omnibus account servicers and record-keepers. As compensation for its services under the class-level administration agreement, Funds Management receives an annual fee which is calculated based on the average daily net assets of each class as follows:
| Class-level administration fee | ||||
Class A, Class C | 0.21 | % | ||
Administrator Class, Institutional Class | 0.13 | |||
Waivers and/or expense reimbursements
Funds Management has contractually waived and/or reimbursed management and administration fees to the extent necessary to maintain certain net operating expense ratios for the Fund. When each class of the Fund has exceeded its expense cap, Funds Management has waived fees and/or reimbursed expenses from fund-level expenses on a proportionate basis and then from class specific expenses. When only certain classes exceed their expense caps, waivers and/or reimbursements are applied against class specific expenses before fund-level expenses. Funds Management has committed through January 31, 2021 to waive fees and/or reimburse expenses to the extent necessary to cap the Fund’s expenses at 1.13% for Class A shares, 1.88% for Class C shares, 1.05% for Administrator Class share and 0.78% for Institutional Class shares. Prior to or after the commitment expiration date, the cap may be increased or the commitment to maintain the cap may be terminated only with the approval of the Board of Trustees. Prior to January 31, 2020, the Fund’s expenses were capped at 1.20% for Class A shares, and 1.95% for Class C shares.
Distribution fee
The Trust has adopted a distribution plan for Class C shares of the Fund pursuant to Rule 12b-1 under the 1940 Act. A distribution fee is charged to Class C shares and paid to Wells Fargo Funds Distributor, LLC (“Funds Distributor”), the principal underwriter, at an annual rate of 0.75% of the average daily net assets of Class C shares.
In addition, Funds Distributor is entitled to receive the front-end sales charge from the purchase of Class A shares and a contingent deferred sales charge on the redemption of certain Class A shares. Funds Distributor is also entitled to receive the contingent deferred sales charges from redemptions of Class C shares. For the year ended September 30, 2020, Funds Distributor received $63,679 from the sale of Class A shares and $983 in contingent deferred sales charges from redemptions of Class C shares. No contingent deferred sales charges were incurred by Class A for the year ended September 30, 2020.
Wells Fargo Diversified Capital Builder Fund | 27
Table of Contents
Notes to financial statements
Shareholder servicing fees
The Trust has entered into contracts with one or more shareholder servicing agents, whereby Class A, Class C, and Administrator Class of the Fund are charged a fee at an annual rate of 0.25% of the average daily net assets of each respective class. A portion of these total shareholder servicing fees were paid to affiliates of Wells Fargo.
Interfund transactions
The Fund may purchase or sell portfolio investment securities to certain other Wells Fargo affiliates pursuant to Rule 17a-7 under the 1940 Act and under procedures adopted by the Board of Trustees. The procedures have been designed to ensure that these interfund transactions, which do not incur broker commissions, are effected at current market prices. Pursuant to these procedures, the Fund had $6,633,750 and $0 in interfund purchases and sales, respectively, during the year ended September 30, 2020.
5. INVESTMENT PORTFOLIO TRANSACTIONS
Purchases and sales of investments, excluding U.S. government obligations (if any) and short-term securities, for the year ended September 30, 2020 were $463,471,638 and $551,605,173, respectively.
6. SECURITIES LENDING TRANSACTIONS
The Fund lends its securities through an unaffiliated securities lending agent and receives collateral in the form of cash or securities with a value at least equal to the value of the securities on loan. The value of the loaned securities is determined at the close of each business day and any increases or decreases in the required collateral are exchanged between the Fund and the counterparty on the next business day. Cash collateral received is invested in the Securities Lending Fund which seeks to provide a positive return compared to the daily Federal Funds Open Rate by investing in high-quality, U.S. dollar-denominated short-term money market instruments and is exempt from registration under Section 3(c)(7) of the 1940 Act. Securities Lending Fund is managed by Funds Management and is subadvised by WellsCap. Funds Management receives an advisory fee starting at 0.05% and declining to 0.01% as the average daily net assets of the Securities Lending Fund increase. All of the fees received by Funds Management are paid to WellsCap for its services as subadviser.
In the event of counterparty default or the failure of a borrower to return a loaned security, the Fund has the right to use the collateral to offset any losses incurred. As of September 30, 2020, the Fund had securities lending transactions with the following counterparties which are subject to offset:
| Counterparty | Value of securities on loan | Collateral received1 | Net amount | |||||||||
Barclays Capital Inc. | $ | 43,596 | (43,596 | ) | $ | 0 | ||||||
| 1 | Collateral received within this table is limited to the collateral for the net transaction with the counterparty. |
7. BANK BORROWINGS
The Trust (excluding the money market funds), Wells Fargo Master Trust and Wells Fargo Variable Trust are parties to a $350,000,000 revolving credit agreement whereby the Fund is permitted to use bank borrowings for temporary or emergency purposes, such as to fund shareholder redemption requests. Interest under the credit agreement is charged to the Fund based on a borrowing rate equal to the higher of the Federal Funds rate in effect on that day plus 1.25% or the overnight LIBOR rate in effect on that day plus 1.25%. In addition, an annual commitment fee equal to 0.25% of the unused balance is allocated to each participating fund.
For the year ended September 30, 2020, there were no borrowings by the Fund under the agreement.
8. DISTRIBUTIONS TO SHAREHOLDERS
The tax character of distributions paid during the years ended September 30, 2020 and September 30, 2019 were as follows:
| Year ended September 30 | ||||||||
| 2020 | 2019 | |||||||
Ordinary income | $ | 16,013,965 | $ | 14,455,943 | ||||
Long-term capital gain | 43,306,239 | 52,000,280 | ||||||
28 | Wells Fargo Diversified Capital Builder Fund
Table of Contents
Notes to financial statements
As of September 30, 2020, the components of distributable earnings on a tax basis were as follows:
| Undistributed ordinary income | Undistributed long-term gain | Unrealized gains | ||
| $2,235,312 | $9,761,299 | $207,549,497 | ||
9. CONCENTRATION RISK
Concentration risks result from exposure to a limited number of sectors. As of the end of the period, the Fund invested a concentration of its portfolio in the health care and information technology sectors. A fund that invests a substantial portion of its assets in any sector may be more affected by changes in that sector than would be a fund whose investments are not heavily weighted in any sector.
10. INDEMNIFICATION
Under the Fund’s organizational documents, the officers and Trustees have been granted certain indemnification rights against certain liabilities that may arise out of performance of their duties to the Fund. The Fund has entered into a separate agreement with each Trustee that converts indemnification rights currently existing under the Fund’s organizational documents into contractual rights that cannot be changed in the future without the consent of the Trustee. Additionally, in the normal course of business, the Fund may enter into contracts with service providers that contain a variety of indemnification clauses. The Fund’s maximum exposure under these arrangements is dependent on future claims that may be made against the Fund and, therefore, cannot be estimated.
11. NEW ACCOUNTING PRONOUNCEMENT
In August 2018, FASB issued Accounting Standards Update (“ASU”) No. 2018-13, Fair Value Measurement (Topic 820) Disclosure Framework—Changes to the Disclosure Requirements for Fair Value Measurement. ASU 2018-13 updates the disclosure requirements on fair value measurements in Topic 820, Fair Value Measurements. The amendments are effective for fiscal years, and interim periods within those fiscal years, beginning after December 15, 2019. Management has adopted this guidance which did not have a material impact on the financial statements.
12. CORONAVIRUS (COVID-19) PANDEMIC
On March 11, 2020, the World Health Organization announced that it had made the assessment that coronavirus disease 2019 (“COVID-19”) is a pandemic. The impacts of COVID-19 are adversely affecting the entire global economy, individual companies and investment products, and the market in general. There is significant uncertainty around the extent and duration of business disruptions related to COVID-19 and the impacts may be short term or may last for an extended period of time. The risk of further spreading of COVID-19 has led to significant uncertainty and volatility in the financial markets.
Wells Fargo Diversified Capital Builder Fund | 29
Table of Contents
Report of independent registered public accounting firm
To the Shareholders of the Fund and Board of Trustees
Wells Fargo Funds Trust:
Opinion on the Financial Statements
We have audited the accompanying statement of assets and liabilities of Wells Fargo Diversified Capital Builder Fund (the Fund), one of the funds constituting Wells Fargo Funds Trust, including the portfolio of investments, as of September 30, 2020, the related statement of operations for the year then ended, the statements of changes in net assets for each of the years in the two-year period then ended, and the related notes (collectively, the financial statements) and the financial highlights for each of the years in the five-year period then ended. In our opinion, the financial statements and financial highlights present fairly, in all material respects, the financial position of the Fund as of September 30, 2020, the results of its operations for the year then ended, the changes in its net assets for each of the years in the two-year period then ended, and the financial highlights for each of the years in the five-year period then ended, in conformity with U.S. generally accepted accounting principles.
Basis for Opinion
These financial statements and financial highlights are the responsibility of the Fund’s management. Our responsibility is to express an opinion on these financial statements and financial highlights based on our audits. We are a public accounting firm registered with the Public Company Accounting Oversight Board (United States) (PCAOB) and are required to be independent with respect to the Fund in accordance with the U.S. federal securities laws and the applicable rules and regulations of the Securities and Exchange Commission and the PCAOB.
We conducted our audits in accordance with the standards of the PCAOB. Those standards require that we plan and perform the audit to obtain reasonable assurance about whether the financial statements and financial highlights are free of material misstatement, whether due to error or fraud. Our audits included performing procedures to assess the risks of material misstatement of the financial statements and financial highlights, whether due to error or fraud, and performing procedures that respond to those risks. Such procedures included examining, on a test basis, evidence regarding the amounts and disclosures in the financial statements and financial highlights. Such procedures also included confirmation of securities owned as of September 30, 2020, by correspondence with the custodian, transfer agent and brokers, or by other appropriate auditing procedures. Our audits also included evaluating the accounting principles used and significant estimates made by management, as well as evaluating the overall presentation of the financial statements and financial highlights. We believe that our audits provide a reasonable basis for our opinion.

We have not been able to determine the specific year that we began serving as the auditor of one or more Wells Fargo Funds investment companies; however we are aware that we have served as the auditor of one or more Wells Fargo Funds investment companies since at least 1955.
Boston, Massachusetts
November 24, 2020
30 | Wells Fargo Diversified Capital Builder Fund
Table of Contents
TAX INFORMATION
For corporate shareholders, pursuant to Section 854 of the Internal Revenue Code, 83.38% of ordinary income dividends qualify for the corporate dividends-received deduction for the fiscal year ended September 30, 2020.
Pursuant to Section 852 of the Internal Revenue Code, $43,306,239 was designated as a 20% rate gain distribution for the fiscal year ended September 30, 2020.
Pursuant to Section 854 of the Internal Revenue Code, $13,758,614 of income dividends paid during the fiscal year ended September 30, 2020 has been designated as qualified dividend income (QDI).
For the fiscal year ended September 30, 2020, $5,092,900 has been designated as interest-related dividends for nonresident alien shareholders pursuant to Section 871 of the Internal Revenue Code.
For the fiscal year ended September 30, 2020, $2,206,403 has been designated as short-term capital gain dividends for nonresident alien shareholders pursuant to Section 871 of the Internal Revenue Code.
PROXY VOTING INFORMATION
A description of the policies and procedures used to determine how to vote proxies relating to portfolio securities is available, upon request, by calling 1-800-222-8222, visiting our website at wfam.com, or visiting the SEC website at sec.gov. Information regarding how the proxies related to portfolio securities were voted during the most recent 12-month period ended June 30 is available on the website at wfam.com or by visiting the SEC website at sec.gov.
QUARTERLY PORTFOLIO HOLDINGS INFORMATION
The Fund files its complete schedule of portfolio holdings with the SEC for the first and third quarters of each fiscal year as an exhibit to its reports on Form N-PORT. Shareholders may view the filed Form N-PORT by visiting the SEC website at sec.gov.
Wells Fargo Diversified Capital Builder Fund | 31
Table of Contents
Other information (unaudited)
BOARD OF TRUSTEES AND OFFICERS
Each of the Trustees and Officers1 listed in the table below acts in identical capacities for each fund in the Wells Fargo family of funds, which consists of 142 mutual funds comprising the Wells Fargo Funds Trust, Wells Fargo Variable Trust, Wells Fargo Master Trust and four closed-end funds (collectively the “Fund Complex”). This table should be read in conjunction with the Prospectus and the Statement of Additional Information2. The mailing address of each Trustee and Officer is 525 Market Street, 12th Floor, San Francisco, CA 94105. Each Trustee and Officer serves an indefinite term, however, each Trustee serves such term until reaching the mandatory retirement age established by the Trustees.
Independent Trustees
Name and year of birth | Position held and length of service* | Principal occupations during past five years or longer | Current other public company or investment company directorships | |||
William R. Ebsworth (Born 1957) | Trustee, since 2015 | Retired. From 1984 to 2013, equities analyst, portfolio manager, research director and chief investment officer at Fidelity Management and Research Company in Boston, Tokyo, and Hong Kong, and retired in 2013 as Chief Investment Officer of Fidelity Strategic Advisers, Inc. where he led a team of investment professionals managing client assets. Prior thereto, Board member of Hong Kong Securities Clearing Co., Hong Kong Options Clearing Corp., the Thailand International Fund, Ltd., Fidelity Investments Life Insurance Company, and Empire Fidelity Investments Life Insurance Company. Audit Committee Chair and Investment Committee Chair of the Vincent Memorial Hospital Endowment (non-profit organization). Mr. Ebsworth is a CFA® charterholder. | N/A | |||
Jane A. Freeman (Born 1953) | Trustee, since 2015; Chair Liaison, since 2018 | Retired. From 2012 to 2014 and 1999 to 2008, Chief Financial Officer of Scientific Learning Corporation. From 2008 to 2012, Ms. Freeman provided consulting services related to strategic business projects. Prior to 1999, Portfolio Manager at Rockefeller & Co. and Scudder, Stevens & Clark. Board member of the Harding Loevner Funds from 1996 to 2014, serving as both Lead Independent Director and chair of the Audit Committee. Board member of the Russell Exchange Traded Funds Trust from 2011 to 2012 and the chair of the Audit Committee. Ms. Freeman is also an inactive Chartered Financial Analyst. | N/A | |||
Isaiah Harris, Jr. (Born 1952) | Trustee, since 2009; Audit Committee Chairman, since 2019 | Retired. Chairman of the Board of CIGNA Corporation since 2009, and Director since 2005. From 2003 to 2011, Director of Deluxe Corporation. Prior thereto, President and CEO of BellSouth Advertising and Publishing Corp. from 2005 to 2007, President and CEO of BellSouth Enterprises from 2004 to 2005 and President of BellSouth Consumer Services from 2000 to 2003. Emeritus member of the Iowa State University Foundation Board of Governors. Emeritus Member of the Advisory Board of Iowa State University School of Business. Advisory Board Member, Palm Harbor Academy (private school). Mr. Harris is a certified public accountant (inactive status). | CIGNA Corporation | |||
Judith M. Johnson (Born 1949) | Trustee, since 2008 | Retired. Prior thereto, Chief Executive Officer and Chief Investment Officer of Minneapolis Employees Retirement Fund from 1996 to 2008. Ms. Johnson is an attorney, certified public accountant and a certified managerial accountant. | N/A | |||
David F. Larcker (Born 1950) | Trustee, since 2009 | James Irvin Miller Professor of Accounting at the Graduate School of Business (Emeritus), Stanford University, Director of the Corporate Governance Research Initiative and Senior Faculty of The Rock Center for Corporate Governance since 2006. From 2005 to 2008, Professor of Accounting at the Graduate School of Business, Stanford University. Prior thereto, Ernst & Young Professor of Accounting at The Wharton School, University of Pennsylvania from 1985 to 2005. | N/A | |||
32 | Wells Fargo Diversified Capital Builder Fund
Table of Contents
Other information (unaudited)
Name and year of birth | Position held and length of service* | Principal occupations during past five years or longer | Current other public company or investment company directorships | |||
Olivia S. Mitchell (Born 1953) | Trustee, since 2006; Nominating and Governance Committee Chair, since 2018 | International Foundation of Employee Benefit Plans Professor, Wharton School of the University of Pennsylvania since 1993. Director of Wharton’s Pension Research Council and Boettner Center on Pensions & Retirement Research, and Research Associate at the National Bureau of Economic Research. Previously, Cornell University Professor from 1978 to 1993. | N/A | |||
Timothy J. Penny (Born 1951) | Trustee, since 1996; Chairman, since 2018 | President and Chief Executive Officer of Southern Minnesota Initiative Foundation, a non-profit organization, since 2007. Member of the Board of Trustees of NorthStar Education Finance, Inc., a non-profit organization, since 2007. | N/A | |||
James G. Polisson (Born 1959) | Trustee, since 2018 | Retired. Chief Marketing Officer, Source (ETF) UK Services, Ltd, from 2015 to 2017. From 2012 to 2015, Principal of The Polisson Group, LLC, a management consulting, corporate advisory and principal investing company. Chief Executive Officer and Managing Director at Russell Investments, Global Exchange Traded Funds from 2010 to 2012. Managing Director of Barclays Global Investors from 1998 to 2010 and Global Chief Marketing Officer for iShares and Barclays Global Investors from 2000 to 2010. Trustee of the San Francisco Mechanics’ Institute, a non-profit organization, from 2013 to 2015. Board member of the Russell Exchange Traded Fund Trust from 2011 to 2012. Director of Barclays Global Investors Holdings Deutschland GmbH from 2006 to 2009. Mr. Polisson is an attorney and has a retired status with the Massachusetts and District of Columbia Bar Associations. | N/A | |||
Pamela Wheelock (Born 1959) | Trustee, since January 2020; previously Trustee from January 2018 to July 2019 | Board member of the Destination Medical Center Economic Development Agency, Rochester, Minnesota since 2019. Interim President of the McKnight Foundation from January to September 2020. Acting Commissioner, Minnesota Department of Human Services, July 2019 through September 2019. Human Services Manager (part-time), Minnesota Department of Human Services, October 2019 through December 2019. Chief Operating Officer, Twin Cities Habitat for Humanity from 2017 to 2019. Vice President of University Services, University of Minnesota from 2012 to 2016. Prior thereto, on the Board of Directors, Governance Committee and Finance Committee for the Minnesota Philanthropy Partners (Saint Paul Foundation) from 2012 to 2018, Interim Chief Executive Officer of Blue Cross Blue Shield of Minnesota from 2011 to 2012, Chairman of the Board from 2009 to 2012 and Board Director from 2003 to 2015. Vice President, Leadership and Community Engagement, Bush Foundation, Saint Paul, Minnesota (a private foundation) from 2009 to 2011. Executive Vice President and Chief Financial Officer, Minnesota Sports and Entertainment from 2004 to 2009 and Senior Vice President from 2002 to 2004. Executive Vice President of the Minnesota Wild Foundation from 2004 to 2008. Commissioner of Finance, State of Minnesota, from 1999 to 2002. Currently Board Chair of the Minnesota Wild Foundation since 2010. | N/A | |||
| * | Length of service dates reflect the Trustee’s commencement of service with the Trust’s predecessor entities, where applicable. |
Wells Fargo Diversified Capital Builder Fund | 33
Table of Contents
Other information (unaudited)
Officers
Name and year of birth | Position held and length of service | Principal occupations during past five years or longer | ||
Andrew Owen (Born 1960) | President, since 2017 | Executive Vice President of Wells Fargo & Company and Head of Affiliated Managers, Wells Fargo Asset Management, since 2014. In addition, Mr. Owen is currently President, Chief Executive Officer and Director of Wells Fargo Funds Management, LLC since 2017. Prior thereto, Executive Vice President responsible for marketing, investments and product development for Wells Fargo Funds Management, LLC, from 2009 to 2014. | ||
Jeremy DePalma1 (Born 1974) | Treasurer, since 2012 | Senior Vice President of Wells Fargo Funds Management, LLC since 2009. Senior Vice President of Evergreen Investment Management Company, LLC from 2008 to 2010 and head of the Fund Reporting and Control Team within Fund Administration from 2005 to 2010. | ||
Michelle Rhee (Born 1966) | Chief Legal Officer, since 2019 | Secretary of Wells Fargo Funds Management, LLC, Chief Legal Counsel of Wells Fargo Asset Management and Assistant General Counsel of Wells Fargo Bank, N.A. since 2018. Associate General Counsel and Managing Director of Bank of America Corporation from 2004 to 2018. | ||
Catherine Kennedy (Born 1969) | Secretary, since 2019 | Vice President of Wells Fargo Funds Management, LLC and Senior Counsel of the Wells Fargo Legal Department since 2010. Vice President and Senior Counsel of Evergreen Investment Management Company, LLC from 1998 to 2010. | ||
Michael H. Whitaker (Born 1967) | Chief Compliance Officer, since 2016 | Chief Compliance Officer of Wells Fargo Asset Management since 2016. Senior Vice President and Chief Compliance Officer for Fidelity Investments from 2007 to 2016. | ||
| 1 | Jeremy DePalma acts as Treasurer of 77 funds in the Fund Complex. |
| 2 | The Statement of Additional Information includes additional information about the Trustees and is available, without charge, upon request, by calling 1-800-222-8222 or by visiting the website at wfam.com. |
34 | Wells Fargo Diversified Capital Builder Fund
Table of Contents
Other information (unaudited)
BOARD CONSIDERATION OF INVESTMENT MANAGEMENT AND SUB-ADVISORY AGREEMENTS:
Wells Fargo Diversified Capital Builder Fund
Under the Investment Company Act of 1940 (the “1940 Act”), the Board of Trustees (the “Board”) of Wells Fargo Funds Trust (the “Trust”) must determine annually whether to approve the continuation of the Trust’s investment management and sub-advisory agreements. In this regard, at a Board meeting held on May 26, 2020 and May 28, 2020 (together, the “Meeting”), the Board, all the members of which have no direct or indirect interest in the investment management and sub-advisory agreements and are not “interested persons” of the Trust, as defined in the 1940 Act (the “Independent Trustees”), reviewed and approved for Wells Fargo Diversified Capital Builder Fund (the “Fund”): (i) an investment management agreement (the “Management Agreement”) with Wells Fargo Funds Management, LLC (“Funds Management”); and (ii) an investment sub-advisory agreement (the “Sub-Advisory Agreement”) with Wells Capital Management Incorporated (the “Sub-Adviser”), an affiliate of Funds Management. The Management Agreement and the Sub-Advisory Agreement are collectively referred to as the “Advisory Agreements.”
At the Meeting, the Board considered the factors and reached the conclusions described below relating to the selection of Funds Management and the Sub-Adviser and the approval of the Advisory Agreements. Prior to the Meeting, including at a Board meeting held in April 2020, the Trustees conferred extensively among themselves and with representatives of Funds Management about these matters. Also, the Board has adopted a team-based approach, with each team consisting of a sub-set of Trustees, to assist the full Board in the discharge of its duties in reviewing investment performance and other matters throughout the year. The Independent Trustees were assisted in their evaluation of the Advisory Agreements by independent legal counsel, from whom they received separate legal advice and with whom they met separately.
In providing information to the Board, Funds Management and the Sub-Adviser were guided by a detailed set of requests for information submitted to them by independent legal counsel on behalf of the Independent Trustees at the start of the Board’s annual contract renewal process earlier in 2020. In considering and approving the Advisory Agreements, the Trustees considered the information they believed relevant, including but not limited to the information discussed below. The Board considered not only the specific information presented in connection with the Meeting, but also the knowledge gained over time through interaction with Funds Management and the Sub-Adviser about various topics. In this regard, the Board reviewed reports of Funds Management at each of its quarterly meetings, which included, among other things, portfolio reviews and investment performance reports. In addition, the Board and the teams mentioned above confer with portfolio managers at various times throughout the year. The Board did not identify any particular information or consideration that was all-important or controlling, and each individual Trustee may have attributed different weights to various factors.
After its deliberations, the Board unanimously approved the continuation of the Advisory Agreements for a one-year term and determined that the compensation payable to Funds Management and the Sub-Adviser under each of the Advisory Agreements was reasonable. The Board considered the approval of the Advisory Agreements for the Fund as part of its consideration of agreements for funds across the complex, but its approvals were made on a fund-by-fund basis. The following summarizes a number of important, but not necessarily all, factors considered by the Board in support of its approvals.
Nature, extent and quality of services
The Board received and considered various information regarding the nature, extent and quality of services provided to the Fund by Funds Management and the Sub-Adviser under the Advisory Agreements. This information included a description of the investment advisory services and Fund-level administrative services covered by the Management Agreement, as well as, among other things, a summary of the background and experience of senior management of Wells Fargo Asset Management (“WFAM”), of which Funds Management and the Sub-Adviser are a part, and a summary of investments made in the business of WFAM. The Board also received a description of Funds Management’s and the Sub-Adviser’s business continuity plans and of their approaches to data privacy and cybersecurity, and related testing. The Board also received and reviewed information about Funds Management’s role as administrator of the Fund’s liquidity risk management program, Funds Management’s approach to risk management, and Funds Management’s intermediary and vendor oversight program.
The Board also considered the qualifications, background, tenure and responsibilities of each of the portfolio managers primarily responsible for the day-to-day portfolio management of the Fund. The Board evaluated the ability of Funds Management and the Sub-Adviser to attract and retain qualified investment professionals, including research, advisory and supervisory personnel. The Board further considered the compliance programs and compliance records of Funds Management and the Sub-Adviser. In addition, the Board took into account the full range of services provided to the Fund by Funds Management and its affiliates.
Wells Fargo Diversified Capital Builder Fund | 35
Table of Contents
Other information (unaudited)
Fund investment performance and expenses
The Board considered the investment performance results for the Fund over various time periods ended December 31, 2019. The Board also considered more current results for various time periods ended March 31, 2020. The Board considered these results in comparison to the investment performance of funds in a universe that was determined by Broadridge Inc. (“Broadridge”) to be similar to the Fund (the “Universe”), and in comparison to the Fund’s benchmark index and to other comparative data. Broadridge is an independent provider of investment company data. The Board received a description of the methodology used by Broadridge to select the mutual funds in the performance Universe. The Board noted that the investment performance of the Fund (Class A) was higher than the average investment performance of the Universe for the one-, three, five- and ten-year periods ended December 31, 2019. The Board also noted that the investment performance of the Fund (Administrator Class) was higher than the average investment performance of the Universe for the three-, five- and ten-year periods ended March 31, 2020, and lower than the average investment performance of the Universe for one-year period ended March 31, 2020. The Board also noted that the investment performance of the Fund was higher than its benchmark index, the Diversified Capital Builder Blended Index, for the one- and five-year periods ended December 31, 2019, and lower than its benchmark index for the three- and ten-year periods ended December 31, 2019. The Board also noted that the investment performance of the Fund was higher than or in range of its benchmark index, the Diversified Capital Builder Blended Index, for the five- and ten-year periods ended March 31, 2020, and lower than its benchmark index for the one- and three-year periods ended March 31, 2020.
The Board also received and considered information regarding the Fund’s net operating expense ratios and their various components, including actual management fees, custodian and other non-management fees, and Rule 12b-1 and non-Rule 12b-1 shareholder service fees. The Board considered these ratios in comparison to the median ratios of funds in class-specific expense groups that were determined by Broadridge to be similar to the Fund (the “Groups”). The Board received a description of the methodology used by Broadridge to select the mutual funds in the expense Groups and an explanation of how funds comprising expense groups and their expense ratios may vary from year-to-year. Based on the Broadridge reports, the Board noted that the net operating expense ratios of the Fund were lower than, equal to or in range of the median net operating expense ratios of the expense Groups for each share class.
The Board took into account the Fund’s investment performance and expense information provided to it among the factors considered in deciding to re-approve the Advisory Agreements.
Investment management and sub-advisory fee rates
The Board reviewed and considered the contractual fee rates payable by the Fund to Funds Management under the Management Agreement, as well as the contractual fee rates payable by the Fund to Funds Management for class-level administrative services under a Class-Level Administration Agreement, which include, among other things, class-level transfer agency and sub-transfer agency costs (collectively, the “Management Rates”). The Board also reviewed and considered the contractual investment sub-advisory fee rates that are payable by Funds Management to the Sub-Adviser for investment sub-advisory services.
Among other information reviewed by the Board was a comparison of the Fund’s Management Rates with the average contractual investment management fee rates of funds in the expense Groups at a common asset level as well as transfer agency costs of the funds in the expense Groups. The Board noted that the Management Rates of the Fund were lower than or in range of the sum of these average rates for the Fund’s expense Groups for all share classes.
The Board also received and considered information about the portion of the total management fee that was retained by Funds Management after payment of the fee to the Sub-Adviser for sub-advisory services. In assessing the reasonableness of this amount, the Board received and evaluated information about the nature and extent of responsibilities retained and risks assumed by Funds Management and not delegated to or assumed by the Sub-Adviser, and about Funds Management’s on-going oversight services. Given the affiliation between Funds Management and the Sub-Adviser, the Board ascribed limited relevance to the allocation of fees between them.
Based on its consideration of the factors and information it deemed relevant, including those described here, the Board determined that the compensation payable to Funds Management under the Management Agreement and to the Sub-Adviser under the Sub-Advisory Agreement was reasonable.
Profitability
The Board received and considered information concerning the profitability of Funds Management, as well as the profitability of both WFAM and Wells Fargo & Co. (“Wells Fargo”) from providing services to the fund family as a whole. The Board noted that the Sub-Adviser’s profitability information with respect to providing services to the Fund and other funds in the family was subsumed in the WFAM and Wells Fargo profitability analysis.
36 | Wells Fargo Diversified Capital Builder Fund
Table of Contents
Other information (unaudited)
Funds Management reported on the methodologies and estimates used in calculating profitability, including a description of the methodology used to allocate certain expenses. Among other things, the Board noted that the levels of profitability reported on a fund-by-fund basis varied widely, depending on factors such as the size, type and age of fund.
Based on its review, the Board did not deem the profits reported by Funds Management, WFAM or Wells Fargo from services provided to the Fund to be at a level that would prevent it from approving the continuation of the Advisory Agreements.
Economies of scale
The Board received and considered information about the potential for Funds Management to experience economies of scale in the provision of management services to the Fund, the difficulties of calculating economies of scale at an individual fund level, and the extent to which potential scale benefits are shared with shareholders. The Board noted the existence of breakpoints in the Fund’s management fee structure, which operate generally to reduce the Fund’s expense ratios as the Fund grows in size, and the size of the Fund in relation to such breakpoints. The Board considered that in addition to management fee breakpoints, Funds Management shares potential economies of scale from its management business in a variety of ways, including through fee waiver and expense reimbursement arrangements, services that benefit shareholders, competitive management fee rates set at the outset without regard to breakpoints, and investments in the business intended to enhance services available to shareholders.
The Board concluded that Funds Management’s arrangements with respect to the Fund, including contractual breakpoints, constituted a reasonable approach to sharing potential economies of scale with the Fund and its shareholders.
Other benefits to Funds Management and the Sub-Adviser
The Board received and considered information regarding potential “fall-out” or ancillary benefits received by Funds Management and its affiliates, including the Sub-Adviser, as a result of their relationships with the Fund. Ancillary benefits could include, among others, benefits directly attributable to other relationships with the Fund and benefits potentially derived from an increase in Funds Management’s and the Sub-Adviser’s business as a result of their relationships with the Fund. The Board noted that various affiliates of Funds Management may receive distribution-related fees, shareholder servicing payments and sub-transfer agency fees in respect of shares sold or held through them and services provided.
The Board also reviewed information about soft dollar credits earned and utilized by the Sub-Adviser, fees earned by Funds Management and the Sub-Adviser from managing a private investment vehicle for the fund family’s securities lending collateral, and commissions earned by an affiliated broker from portfolio transactions.
Based on its consideration of the factors and information it deemed relevant, including those described here, the Board did not find that any ancillary benefits received by Funds Management and its affiliates, including the Sub-Adviser, were unreasonable.
Conclusion
At the Meeting, after considering the above-described factors and based on its deliberations and its evaluation of the information described above, the Board unanimously approved the continuation of the Advisory Agreements for a one-year term and determined that the compensation payable to Funds Management and the Sub-Adviser under each of the Advisory Agreements was reasonable.
Wells Fargo Diversified Capital Builder Fund | 37
Table of Contents
Other information (unaudited)
LIQUIDITY RISK MANAGEMENT PROGRAM
In accordance with Rule 22e-4 under the Investment Company Act of 1940, as amended (the “Liquidity Rule”), Wells Fargo Funds Trust (the “Trust”) has adopted and implemented a liquidity risk management program (the “Program”) on behalf of each of its series, including the Fund, which is reasonably designed to assess and manage the Fund’s liquidity risk. “Liquidity risk” is defined as the risk that the Fund is unable to meet redemption requests without significantly diluting remaining investors’ interests in the Fund. The Trust’s Board of Trustees (the “Board”) previously approved the designation of Wells Fargo Funds Management, LLC (“Funds Management”), the Fund’s investment manager, as the administrator of the Program, and Funds Management has established a Liquidity Risk Management Council composed of personnel from multiple departments within Funds Management and its affiliates to assist Funds Management in the implementation and on-going administration of the Program.
The Program is comprised of various components designed to support the assessment and/or management of liquidity risk, including: (1) the periodic assessment (no less frequently than annually) of certain factors that influence the Fund’s liquidity risk; (2) the periodic classification (no less frequently than monthly) of the Fund’s investments into one of four liquidity categories that reflect an estimate of their liquidity under current market conditions; (3) a 15% limit on the acquisition of “illiquid investments” (as defined under the Liquidity Rule); (4) to the extent the Fund does not invest primarily in “highly liquid investments” (as defined under the Liquidity Rule), the determination of a minimum percentage of the Fund’s assets that generally will be invested in highly liquid investments (an “HLIM”); (5) if the Fund has established an HLIM, the periodic review (no less frequently than annually) of the HLIM and the adoption of policies and procedures for responding to a shortfall of the Fund’s “highly liquid investments” below its HLIM; and (6) periodic reporting to the Board.
At a meeting of the Board held on May 26 and 28, 2020, the Board received a written report (the “Report”) from Funds Management that addressed the operation of the Program and assessed its adequacy and effectiveness of implementation. The Report covered the initial period from December 1, 2018 through December 31, 2019 (the “Reporting Period”). No significant liquidity events impacting the Fund were noted in the Report. There were no material changes to the Program during the Reporting Period. The Report concluded that the Program is operating effectively to assess and manage the Fund’s liquidity risk, and that the Program has been and continues to be adequately and effectively implemented to monitor and, as applicable, respond to the Fund’s liquidity developments.
There can be no assurance that the Program will achieve its objectives under all circumstances in the future. Please refer to the Fund’s prospectus for more information regarding the Fund’s exposure to liquidity risk and other risks to which an investment in the Fund may be subject.
38 | Wells Fargo Diversified Capital Builder Fund
Table of Contents
Effective June 1, 2020, shareholders purchasing Fund shares through an Oppenheimer & Co. Inc. (“Oppenheimer”) platform or account are eligible only for the following load waivers (front-end sales charge waivers and contingent deferred or back-end, sales charge waivers) and discounts, which may differ from those disclosed in the Fund’s Prospectus or SAI.
| Front-end Sales Load Waivers on Class A Shares available at Oppenheimer |
| Employer-sponsored retirement, deferred compensation and employee benefit plans (including health savings accounts) and trusts used to fund those plans, provided that the shares are not held in a commission-based brokerage account and shares are held for the benefit of the plan. |
| Shares purchased by or through a 529 Plan. |
| Shares purchased through an Oppenheimer affiliated investment advisory program. |
| Shares purchased through reinvestment of capital gains distributions and dividend reinvestment when purchasing shares of the same fund (but not any other fund within the fund family). |
| Shares purchased from the proceeds of redemptions within the same fund family, provided (1) the repurchase occurs within 90 days following the redemption, (2) the redemption and purchase occur in the same account, and (3) redeemed shares were subject to a front-end or deferred sales load (known as Rights of Restatement). |
| A shareholder in the Fund’s Class C shares will have their shares exchanged at net asset value to Class A shares (or the appropriate share class) of the Fund if the shares are no longer subject to a CDSC and the exchange is in line with the policies and procedures of Oppenheimer. |
| Employees and registered representatives of Oppenheimer or its affiliates and their family members. |
| Directors or Trustees of the Fund, and employees of the Fund’s investment adviser or any of its affiliates, as described in the Prospectus. |
| CDSC Waivers on A and C Shares available at Oppenheimer |
| Death or disability of the shareholder. |
| Shares sold as part of a systematic withdrawal plan as described in the Prospectus. |
| Return of excess contributions from an IRA Account. |
| Shares sold as part of a required minimum distribution for IRA and retirement accounts due to the shareholder reaching the qualified age based on applicable IRS regulations as described in the Prospectus. |
| Shares sold to pay Oppenheimer fees but only if the transaction is initiated by Oppenheimer. |
| Shares acquired through a right of reinstatement. |
| Front-end load Discounts Available at Oppenheimer: Breakpoints, Rights of Accumulation & Letters of Intent |
| Breakpoints as described in the Prospectus. |
| Rights of Accumulation (ROA), which entitle shareholders to breakpoint discounts, will be automatically calculated based on the aggregated holding of fund family assets held by accounts within the purchaser’s household at Oppenheimer. Eligible fund family assets not held at Oppenheimer may be included in the ROA calculation only if the shareholder notifies his or her financial advisor about such assets. |
Wells Fargo Diversified Capital Builder Fund | 39
Table of Contents
Effective June 15, 2020, shareholders purchasing fund shares through a Robert W. Baird & Co. (“Baird”) platform or account will only be eligible for the following sales charge waivers (front-end sales charge waivers and CDSC waivers) and discounts, which may differ from those disclosed elsewhere in the Fund’s Prospectus or the SAI.
| Front-end Sales Load Waivers on Class A Shares available at Baird |
| Shares purchased through reinvestment of capital gains distributions and dividend reinvestment when purchasing share of the same fund. |
| Share purchase by employees and registers representatives of Baird or its affiliate and their family members as designated by Baird. |
| Shares purchase from the proceeds of redemptions within the same fund family, provided (1) the repurchase occurs within 90 days following the redemption, (2) the redemption and purchase occur in the same accounts, and (3) redeemed shares were subject to a front-end or deferred sales charge (known as rights of reinstatement). |
| A shareholder in the Funds Investor C Shares will have their share exchanged at net asset value to Investor A shares of the fund if the shares are no longer subject to CDSC and the exchange is in line with the policies and procedures of Baird. |
| Employer-sponsored retirement plans or charitable accounts in a transactional brokerage account at Baird, including 401(k) plans, 457 plans, employer-sponsored 403(b) plans, profit sharing and money purchase pension plans and defined benefit plans. For purposes of this provision, employer-sponsored retirement plans do not include SEP IRAs, Simple IRAs or SAR-SEPs. |
| CDSC Waivers on A and C Shares available at Baird |
| Shares sold due to death or disability of the shareholder. |
| Shares sold as part of a systematic withdrawal plan as described in the Fund’s Prospectus. |
| Shares bought due to returns of excess contributions from an IRA Account. |
| Shares sold as part of a required minimum distribution for IRA and retirement accounts due to the shareholder reaching age 72 as described in the Fund’s Prospectus. |
| Shares sold to pay Baird fees but only if the transaction is initiated by Baird. |
| Shares acquired through a right of reinstatement. |
| Front-end load Discounts Available at Baird: Breakpoint and/or Rights of Accumulation |
| Breakpoints as described in the Prospectus. |
| Rights of accumulations which entitles shareholders to breakpoint discounts will be automatically calculated based on the aggregated holding of fund family assets held by accounts within the purchaser’s household at Baird. Eligible fund family assets not held at Baird may be included in the rights of accumulations calculation only if the shareholder notifies his or her financial advisor about such assets. |
| Letters of Intent (LOI) allow for breakpoint discounts based on anticipated purchases within a fund family through Baird, over a 13-month period of time. |
40 | Wells Fargo Diversified Capital Builder Fund
Table of Contents
For more information
More information about Wells Fargo Funds is available free upon request. To obtain literature, please write, visit the Fund’s website, or call:
Wells Fargo Funds
P.O. Box 219967
Kansas City, MO 64121-9967
Website: wfam.com
Individual investors: 1-800-222-8222
Retail investment professionals: 1-888-877-9275
Institutional investment professionals: 1-866-765-0778

This report and the financial statements contained herein are submitted for the general information of the shareholders of the Fund. If this report is used for promotional purposes, distribution of the report must be accompanied or preceded by a current prospectus. Before investing, please consider the investment objectives, risks, charges, and expenses of the investment. For a current prospectus and, if available, a summary prospectus, containing this information, call 1-800-222-8222 or visit the Fund’s website at wfam.com. Read the prospectus carefully before you invest or send money.
Wells Fargo Asset Management (WFAM) is the trade name for certain investment advisory/management firms owned by Wells Fargo & Company. These firms include but are not limited to Wells Capital Management Incorporated and Wells Fargo Funds Management, LLC. Certain products managed by WFAM entities are distributed by Wells Fargo Funds Distributor, LLC (a broker-dealer and Member FINRA).
This material is for general informational and educational purposes only and is NOT intended to provide investment advice or a recommendation of any kind—including a recommendation for any specific investment, strategy, or plan.
INVESTMENT PRODUCTS: NOT FDIC INSURED ◾ NO BANK GUARANTEE ◾ MAY LOSE VALUE
© 2020 Wells Fargo & Company. All rights reserved.
PAR-1020-00545 11-20
A225/AR225 09-20
Table of Contents

Annual Report
September 30, 2020
Wells Fargo
Diversified Income Builder Fund
Beginning on January 1, 2021, as permitted by new regulations adopted by the Securities and Exchange Commission, paper copies of the Wells Fargo Funds’ annual and semiannual shareholder reports issued after this date will no longer be sent by mail, unless you specifically request paper copies of the reports. Instead, the reports will be made available on the Funds’ website, and you will be notified by mail each time a report is posted and provided with a website address to access the report.
If you already elected to receive shareholder reports electronically, you will not be affected by this change and you need not take any action. You may elect to receive shareholder reports and other communications from the Fund electronically at any time by contacting your financial intermediary (such as a broker-dealer or bank) or, if you are a direct investor, by calling 1-800-222-8222 or by enrolling at wellsfargo.com/advantagedelivery.
You may elect to receive all future reports in paper free of charge. If you invest through a financial intermediary, you can contact your financial intermediary to request that you continue to receive paper copies of your shareholder reports; if you invest directly with the Fund, you can call 1-800-222-8222. Your election to receive reports in paper will apply to all Wells Fargo Funds held in your account with your financial intermediary or, if you are a direct investor, to all Wells Fargo Funds that you hold.
Table of Contents
|
Reduce clutter. Save trees. |
Sign up for electronic delivery of prospectuses and shareholder reports at wellsfargo.com/advantagedelivery |
The views expressed and any forward-looking statements are as of September 30, 2020, unless otherwise noted, and are those of the Fund’s portfolio managers and/or Wells Fargo Asset Management. Discussions of individual securities, or the markets generally, or any Wells Fargo Fund are not intended as individual recommendations. Future events or results may vary significantly from those expressed in any forward-looking statements. The views expressed are subject to change at any time in response to changing circumstances in the market. Wells Fargo Asset Management and the Fund disclaim any obligation to publicly update or revise any views expressed or forward-looking statements.
INVESTMENT PRODUCTS: NOT FDIC INSURED ◾ NO BANK GUARANTEE ◾ MAY LOSE VALUE
Wells Fargo Diversified Income Builder Fund | 1
Table of Contents
Letter to shareholders (unaudited)

Andrew Owen
President
Wells Fargo Funds
Dear Shareholder:
We are pleased to offer you this annual report for the Wells Fargo Diversified Income Builder Fund for the 12-month period that ended September 30, 2020. Global stock markets saw earlier gains erased in March as governments around the world took unprecedented measures, attempting to stop the spread of COVID-19 at the expense of short-term economic output. However, markets rallied strongly from April on to more than offset those short-term losses as central banks bolstered capital markets and confidence.
For the 12-month period, equities had broadly positive total returns despite intense volatility in March. Non-U.S. developed market equities had weaker performance than emerging market and U.S. stocks. While gains from fixed-income securities were positive, they were more modest than equities. For the period, U.S. stocks, based on the S&P 500 Index,1 gained 15.15%. International stocks, as measured by the MSCI ACWI ex USA Index (Net),2 returned 3.00%, while the MSCI EM Index (Net)3 had stronger performance, with a 10.54% gain. For bond investors, the Bloomberg Barclays U.S. Aggregate Bond Index4 returned 6.98%, the Bloomberg Barclays Global Aggregate ex-USD Index5 gained 5.48%, and the Bloomberg Barclays Municipal Bond Index6 returned 4.09% while the ICE BofA U.S. High Yield Index7 returned 2.30%.
The period began with mixed economic readings.
The fourth quarter of 2019 started on a strong note. U.S.-China trade tensions, which had been building for months, relaxed in October; optimism rose for a U.K. Brexit deal; and macroeconomic data turned positive. The initial estimate of U.S. third-quarter gross domestic product (GDP) growth was a resilient 1.9% annualized rate, while the U.S. unemployment rate fell to a 50-year low of 3.5% in September. However, despite strength among U.S. consumers, business confidence declined while manufacturing activity contracted. Concerned with a potential economic slowdown, the U.S. Federal Reserve (Fed) lowered interest rates a quarter point in late October—its third rate cut in four months. This helped push the S&P 500 Index to an all-time high while emerging market equities rallied and global bonds declined overall, reflecting a broad pickup in risk appetite.
Equity markets continued to rally in November despite ongoing geopolitical risks. Hopes for a U.S.-China trade deal buoyed investor confidence. U.S. business sentiment improved slightly and manufacturing and services activity picked up. While consumer confidence and purchasing managers’ activity rose in the eurozone, China reported weakening manufacturing and consumer data. Bond yields rose marginally, leading to slightly negative returns for global government and investment-grade corporate bonds.
| 1 | The S&P 500 Index consists of 500 stocks chosen for market size, liquidity, and industry group representation. It is a market-value-weighted index with each stock’s weight in the index proportionate to its market value. You cannot invest directly in an index. |
| 2 | The Morgan Stanley Capital International (MSCI) All Country World Index (ACWI) ex USA Index (Net) is a free-float-adjusted market-capitalization-weighted index that is designed to measure the equity market performance of developed and emerging markets, excluding the United States. Source: MSCI. MSCI makes no express or implied warranties or representations and shall have no liability whatsoever with respect to any MSCI data contained herein. The MSCI data may not be further redistributed or used as a basis for other indices or any securities or financial products. This report is not approved, reviewed, or produced by MSCI. You cannot invest directly in an index. |
| 3 | The MSCI Emerging Markets (EM) Index (Net) is a free-float-adjusted market-capitalization-weighted index that is designed to measure equity market performance of emerging markets. You cannot invest directly in an index. |
| 4 | The Bloomberg Barclays U.S. Aggregate Bond Index is a broad-based benchmark that measures the investment-grade, U.S. dollar-denominated, fixed-rate taxable bond market, including Treasuries, government-related and corporate securities, mortgage-backed securities (agency fixed-rate and hybrid adjustable-rate mortgage pass-throughs), asset-backed securities, and commercial mortgage-backed securities. You cannot invest directly in an index. |
| 5 | The Bloomberg Barclays Global Aggregate ex-USD Index is an unmanaged index that provides a broad-based measure of the global investment-grade fixed-income markets excluding the U.S. dollar-denominated debt market. You cannot invest directly in an index. |
| 6 | The Bloomberg Barclays Municipal Bond Index is an unmanaged index composed of long-term tax-exempt bonds with a minimum credit rating of Baa. You cannot invest directly in an index. |
| 7 | The ICE BofA U.S. High Yield Index is a market-capitalization-weighted index of domestic and Yankee high-yield bonds. The index tracks the performance of high-yield securities traded in the U.S. bond market. You cannot invest directly in an index. Copyright 2020. ICE Data Indices, LLC. All rights reserved. |
2 | Wells Fargo Diversified Income Builder Fund
Table of Contents
Letter to shareholders (unaudited)
Financial markets ended 2019 with a boost from the U.S. and China accord on a Phase One trade deal. That, along with the landslide win by the pro-Brexit U.K. Conservative Party in a national election and ongoing central bank support, gave investors greater confidence. U.S. economic indicators were generally positive, with the exception of manufacturing activity and business confidence. Consumer confidence was resilient, fed by a robust labor market, tame inflation, and lower interest rates, which boosted housing affordability and stimulated homebuyer activity. The impeachment of President Trump had little impact on the markets. Meanwhile, slowing Chinese economic activity, partly attributable to the trade war, led to further government stimulus at year-end through lower reserve ratios, allowing banks to lend more money.
The year-end rally continued in early January 2020. However, capital market volatility spiked in late January on concerns over the potential impact of COVID-19 on the global economy and stock markets. With sentiment somewhat souring, perceived safe havens did well in January. The U.S. dollar and Japanese yen both rose and government bonds outperformed equities. While the S&P 500 Index held its ground, emerging market equities tumbled, including those in Asia.
In February, COVID-19 became the major market focus. Fears of the virus’s impact on Chinese and global growth led to expectations of increased global central bank monetary policy support. That led the 10-year U.S. Treasury yield to fall to an all-time low of 1.1%. Although equity markets initially shrugged off concerns about the outbreak, focusing instead on strong fourth-quarter earnings and improving business confidence in January, market sentiment turned sharply lower and the S&P 500 Index lost 8.2% for the month. Oil prices tumbled as Russia and the Organization of the Petroleum Exporting Countries compounded a major decline in oil demand with a brutal price war, partly aimed at dissuading further U.S. shale production, causing the price of West Texas Intermediate crude oil to plummet.
The global spread of COVID-19 led country after country to clamp down on social and business-related activity in order to contain the virus from causing even greater devastation and overwhelming health care systems. This abrupt stoppage of economic activity led to the sharp deceleration of global output, sending economies into a deep contraction. Central banks responded swiftly, slashing interest rates and expanding quantitative easing programs to restore liquidity and confidence to the markets. In the U.S., the Fed introduced several new lending programs, funding investment-grade bonds, money market mutual funds, and commercial paper while purchasing Treasuries, mortgage-backed securities, and overnight repurchase agreements. Meanwhile, stock markets tumbled quickly into a bear market, ending the longest bull stock market in U.S. history.
Markets rebounded strongly in April, fueled by unprecedented government and central bank stimulus measures. The U.S. economy contracted by an annualized 5.0% pace in the first quarter, with 30 million new unemployment insurance claims in six weeks. In the eurozone, first-quarter real GDP shrank 3.8%, with the composite April Flash Purchasing Managers’ Index (PMI), a monthly survey of purchasing managers, falling to an all-time low of 13.5. The European Central Bank expanded its quantitative easing to include the purchase of additional government bonds of countries with the greatest virus-related need, including Italy and Spain. China’s first-quarter GDP fell by 6.8% year over year. However, retail sales, production, and investment showed signs of recovery. Extreme oil-price volatility continued as global supply far exceeded demand.
The global equity market rebound continued in May, with widespread strong monthly gains. Investors regained confidence on reports of early signs of success in human trials of a COVID-19 vaccine. Growth stocks continued to outperform value stocks while returns on global government bonds were generally flat. In the U.S., a gap grew between the stock market rebound and devastating economic data points, including an April unemployment rate of 14.7%, the highest level since World War II. PMIs reflected
“The global spread of COVID-19 led country after country to clamp down on social and business-related activity in order to contain the virus from causing even greater devastation and overwhelming health care systems.”
Wells Fargo Diversified Income Builder Fund | 3
Table of Contents
Letter to shareholders (unaudited)
“The stock market continued to rally in August despite concerns over rising numbers of COVID-19 cases in the United States and several European countries, including France and Spain, as well as the expiration of the $600 weekly bonus unemployment benefit at the end of July.”
weakening activity in May in both the manufacturing and services sectors. U.S. corporate earnings reports indicated a 14% year-over-year contraction in earnings from the first quarter of 2019. However, high demand for technology, driven by remote activity, supported robust information technology sector earnings, which helped drive major technology stocks higher.
Financial markets posted widely positive returns in June despite ongoing economic weakness and high levels of uncertainty on the containment of COVID-19 and the timing of an effective vaccine. There were hopeful signs as economies reopened, with both U.S. and U.K. retail sales rebounding sharply in May. However, year over year, sales remained depressed. Vitally important to market sentiment was the ongoing commitment by central banks globally to do all they could to provide economic support through liquidity and low borrowing costs. U.S. economic activity was aided by one-time $1,200 stimulus checks and $600 bonus weekly unemployment benefits that expired at the end of July. However, unemployment remained historically high, easing somewhat from 14.7% in April to 11.1% in June. By month-end, numerous states reported increases of COVID-19 cases. China’s economic recovery picked up momentum in June, though it remained far from a full recovery.
July was a broadly positive month for both global equities and fixed income. However, economic data and a resurgence of COVID-19 cases pointed to the vulnerability of the global economy and the ongoing imperative to regain control of the pandemic. Second-quarter GDP shrank from the previous quarter by 9.5% and 12.1% in the U.S. and the eurozone, respectively. In contrast, China reported a 3.2% year-over-year expansion in its second-quarter GDP. U.S. unemployment remained high despite adding 1.8 million jobs in July, with a double-digit jobless rate persisting. However, manufacturing activity grew in both the U.S. and the eurozone. In Asia, while China’s manufacturing sector continued to expand, activity in Japan and South Korea contracted. In July, a rising concern was the rapid and broad reemergence of COVID-19 infections.
The stock market continued to rally in August despite concerns over rising numbers of COVID-19 cases in the United States and several European countries, including France and Spain, as well as the expiration of the $600 weekly bonus unemployment benefit at the end of July. U.S. stocks had strong monthly gains, led by the FAANG stocks—Facebook, Apple, Amazon, Netflix, and Google (Alphabet)—which dominate these indices and continued to rally. U.S. stocks generally surpassed other broadly positive global equity performance while fixed-income market monthly returns were broadly flat. Generally stronger-than-expected second-quarter earnings boosted investor sentiment along with the Fed’s announcement of a policy shift that will likely lead to longer-term low interest rates and supportive monetary policy. The U.S. Flash PMIs for both manufacturing and services beat expectations while U.S. housing market indicators were strong. In Europe, retail sales expanded and consumer confidence remained steady. China’s economy continued its fairly steady expansion. Overall, developed markets performed better than emerging market equities for the month of August as people took comfort in better-known equities in perceived safer markets.
Stocks grew more volatile in September on mixed economic data. U.S. PMIs showed solid growth in economic activity in both manufacturing and services. However, six months after the bottom fell out of the labor market in the early spring, only half of the 22 million jobs lost had returned. The U.S. unemployment rate fell to 7.9% in September, the fifth straight month of improvement but far higher than the 3.5% pre-COVID-19 rate. Only 661,000 jobs were added for the month, down from 1.5 million in August. Meanwhile, a reported 2.3 million people have given up looking for work. With U.S. Congress failing to pass further fiscal relief and uncertainties surrounding a possible vaccine, doubts crept back into the financial markets. In the U.K., a lack of progress in Brexit talks with the European Union weighed on markets. China’s economy picked up steam, however, with growth fueled by increased global demand, and China’s service sector had its strongest PMI reading in seven years.
4 | Wells Fargo Diversified Income Builder Fund
Table of Contents
Letter to shareholders (unaudited)
Don’t let short-term uncertainty derail long-term investment goals.
Periods of investment uncertainty can present challenges, but experience has taught us that maintaining long-term investment goals can be an effective way to plan for the future. To help you create a sound strategy based on your personal goals and risk tolerance, Wells Fargo Funds offers more than 100 mutual funds spanning a wide range of asset classes and investment styles. Although diversification cannot guarantee an investment profit or prevent losses, we believe it can be an effective way to manage investment risk and potentially smooth out overall portfolio performance. We encourage investors to know their investments and to understand that appropriate levels of risk-taking may unlock opportunities.
Thank you for choosing to invest with Wells Fargo Funds. We appreciate your confidence in us and remain committed to helping you meet your financial needs.
Sincerely,

Andrew Owen
President
Wells Fargo Funds
|
For further information about your Fund, contact your investment professional, visit our website at wfam.com, or call us directly at 1-800-222-8222. |
Notice to Shareholders
At a meeting held on August 10-12, 2020, the Board of Trustees of the Fund approved a change to the Fund’s automatic conversion feature for Class C shares in order to shorten the required holding period from 10 to 8 years. As a result, on a monthly basis beginning November 5, 2020, Class C shares will convert automatically into Class A shares 8 years after the initial date of purchase or, if you acquired your Class C shares through an exchange or conversion from another share class, 8 years after the date you acquired your Class C shares. When Class C shares that you acquired through a purchase or exchange convert, any other Class C shares that you purchased with reinvested dividends and distributions also will convert into Class A shares on a pro rata basis.
Please note that a shorter holding period may apply depending on your intermediary. Please see “Appendix A—Sales Charge Reductions and Waivers for Certain Intermediaries” in the Fund’s prospectus for further information.
Wells Fargo Diversified Income Builder Fund | 5
Table of Contents
Performance highlights (unaudited)
Investment objective
The Fund seeks long-term total return, consisting of current income and capital appreciation.
Manager
Wells Fargo Funds Management, LLC
Subadviser
Wells Capital Management Incorporated
Portfolio managers
Kandarp R. Acharya, CFA®‡, FRM
Margaret Patel
Average annual total returns (%) as of September 30, 2020
| Including sales charge | Excluding sales charge | Expense ratios1 (%) | ||||||||||||||||||||||||||||||||
| Inception date | 1 year | 5 year | 10 year | 1 year | 5 year | 10 year | Gross | Net2 | ||||||||||||||||||||||||||
| Class A (EKSAX) | 4-14-1987 | -4.26 | 5.40 | 5.98 | 1.59 | 6.66 | 6.61 | 1.06 | 0.86 | |||||||||||||||||||||||||
| Class C (EKSCX) | 2-1-1993 | -0.02 | 5.89 | 5.82 | 0.98 | 5.89 | 5.82 | 1.81 | 1.61 | |||||||||||||||||||||||||
| Class R6 (EKSRX)3 | 7-31-2018 | – | – | – | 2.25 | 7.12 | 7.04 | 0.63 | 0.43 | |||||||||||||||||||||||||
| Administrator Class (EKSDX) | 7-30-2010 | – | – | – | 1.89 | 6.79 | 6.79 | 0.98 | 0.78 | |||||||||||||||||||||||||
| Institutional Class (EKSYX) | 1-13-1997 | – | – | – | 1.98 | 7.04 | 7.00 | 0.73 | 0.53 | |||||||||||||||||||||||||
| Diversified Income Builder Blended Index4 | – | – | – | – | 6.39 | 8.79 | 8.29 | – | – | |||||||||||||||||||||||||
| ICE BofA U.S. Cash Pay High Yield Index5 | – | – | – | – | 2.35 | 6.61 | 6.26 | – | – | |||||||||||||||||||||||||
| Russell 1000® Index6 | – | – | – | – | 16.01 | 14.09 | 13.76 | – | – | |||||||||||||||||||||||||
Figures quoted represent past performance, which is no guarantee of future results, and do not reflect taxes that a shareholder may pay on an investment in a fund. Investment return and principal value of an investment will fluctuate so that an investor’s shares, when redeemed, may be worth more or less than their original cost. Performance shown without sales charges would be lower if sales charges were reflected. Current performance may be lower or higher than the performance data quoted, which assumes the reinvestment of dividends and capital gains. Current month-end performance is available on the Fund’s website, wfam.com.
Index returns do not include transaction costs associated with buying and selling securities, any mutual fund fees or expenses, or any taxes. It is not possible to invest directly in an index.
For Class A shares, the maximum front-end sales charge is 5.75%. For Class C shares, the maximum contingent deferred sales charge is 1.00%. Performance including a contingent deferred sales charge assumes the sales charge for the corresponding time period. Class R6, Administrator Class, and Institutional Class shares are sold without a front-end sales charge or contingent deferred sales charge.
Balanced funds may invest in stocks and bonds. Stock values fluctuate in response to the activities of individual companies and general market and economic conditions. Bond values fluctuate in response to the financial condition of individual issuers, general market and economic conditions, and changes in interest rates. Changes in market conditions and government policies may lead to periods of heightened volatility in the bond market and reduced liquidity for certain bonds held by the Fund. In general, when interest rates rise, bond values fall and investors may lose principal value. Interest rate changes and their impact on the Fund and its share price can be sudden and unpredictable. Certain investment strategies tend to increase the total risk of an investment (relative to the broader market). The Fund is exposed to foreign investment risk, high-yield securities risk, and smaller-company securities risk. Consult the Fund’s prospectus for additional information on these and other risks.
Please see footnotes on page 7.
6 | Wells Fargo Diversified Income Builder Fund
Table of Contents
Performance highlights (unaudited)
| Growth of $10,000 investment as of September 30, 20207 |
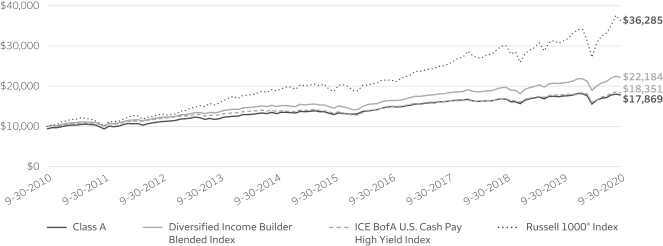 |
| ‡ | CFA® and Chartered Financial Analyst® are trademarks owned by CFA Institute. |
| 1 | Reflects the expense ratios as stated in the most recent prospectuses, which include the impact of 0.01% in acquired fund fees and expenses. The expense ratios shown are subject to change and may differ from the annualized expense ratios shown in the financial highlights of this report, which do not include acquired fund fees and expenses. |
| 2 | The manager has contractually committed through January 31, 2021, to waive fees and/or reimburse expenses to the extent necessary to cap total annual fund operating expenses after fee waivers at 0.85% for Class A, 1.60% for Class C, 0.42% for Class R6, 0.77% for Administrator Class, and 0.52% for Institutional Class. Brokerage commissions, stamp duty fees, interest, taxes, acquired fund fees and expenses (if any), and extraordinary expenses are excluded from the expense caps. Prior to or after the commitment expiration date, the caps may be increased or the commitment to maintain the caps may be terminated only with the approval of the Board of Trustees. Without these caps, the Fund’s returns would have been lower. The expense ratio paid by an investor is the net expense ratio (the total annual fund operating expenses after fee waivers) as stated in the prospectuses. |
| 3 | Historical performance shown for the Class R6 shares prior to their inception reflects the performance of the Institutional Class shares, and is not adjusted to reflect the Class R6 expenses. If these expenses had been included, returns for the Class R6 would be higher. |
| 4 | Source: Wells Fargo Funds Management, LLC. The Diversified Income Builder Blended Index is composed 60% of the ICE BofA U.S. Cash Pay High Yield Index, 25% of the Morgan Stanley Capital International (MSCI) All Country World Index (ACWI) and 15% of the Bloomberg Barclays U.S. Aggregate Bond Index. Prior to February 1, 2020, the Diversified Income Builder Blended Index was composed 65% of the ICE BofA U.S. Cash Pay High Yield Index, and 35% of the Russell 1000® Index. Prior to January 2, 2018, the Diversified Income Builder Blended Index was composed 75% of the ICE BofA U.S. Cash Pay High Yield Index, and 25% the Russell 1000® Index. You cannot invest directly in an index. |
The MSCI ACWI is a free-float-adjusted market-capitalization-weighted index that is designed to measure the equity market performance of developed and emerging markets. |
The Bloomberg Barclays U.S. Aggregate Bond Index is a broad-based benchmark that measures the investment-grade, U.S.-dollar-denominated, fixed-rate taxable bond market, including Treasuries, government-related and corporate securities, mortgage-backed securities (agency fixed-rate and hybrid adjustable-rate mortgage pass-throughs), asset-backed securities, and commercial mortgage-backed securities. You cannot invest directly in an index. |
| 5 | The ICE BofA U.S. Cash Pay High Yield Index is an unmanaged market index that provides a broad-based performance measure of the noninvestment grade U.S. domestic bond index. You cannot invest directly in an index. Copyright 2020. ICE Data Indices, LLC. All rights reserved. |
| 6 | The Russell 1000® Index measures the performance of the 1,000 largest companies in the Russell 3000® Index, which represents approximately 92% of the total market capitalization of the Russell 3000® Index. You cannot invest directly in an index. |
| 7 | The chart compares the performance of Class A shares for the most recent ten years with the Diversified Income Builder Blended Index, ICE BofA U.S. Cash Pay High Yield Index, and the Russell 1000® Index. The chart assumes a hypothetical investment of $10,000 in Class A shares and reflects all operating expenses and assumes the maximum initial sales charge of 5.75%. |
| 8 | The S&P 500 Index consists of 500 stocks chosen for market size, liquidity, and industry group representation. It is a market-value-weighted index with each stock’s weight in the index proportionate to its market value. You cannot invest directly in an index. |
| 9 | The Morgan Stanley Capital International (MSCI) All Country World Index (ACWI) (Net) is a free-float-adjusted market-capitalization-weighted index that is designed to measure the equity market performance of developed and emerging markets. You cannot invest directly in an index. |
| 10 | The MSCI Emerging Markets (EM) Index (Net) is a free-float-adjusted market-capitalization-weighted index that is designed to measure equity market performance of emerging markets. You cannot invest directly in an index. |
| 11 | The Bloomberg Barclays U.S. Treasury Index is an unmanaged index of prices of U.S. Treasury bonds with maturities of 1 to 30 years. You cannot invest directly in an index. |
Wells Fargo Diversified Income Builder Fund | 7
Table of Contents
Performance highlights (unaudited)
| 12 | The Bloomberg Barclays 20+ Year U.S. Treasury Index is an unmanaged index composed of securities in the U.S. Treasury Index with maturities of 20 years or greater. You cannot invest directly in an index. |
| 13 | The ten largest holdings, excluding cash, cash equivalents and any money market funds, are calculated based on the value of the investments divided by total net assets of the Fund. Holdings are subject to change and may have changed since the date specified. |
| 14 | Amounts are calculated based on the total long-term investments of the Fund. These amounts are subject to change and may have changed since the date specified. |
8 | Wells Fargo Diversified Income Builder Fund
Table of Contents
Performance highlights (unaudited)
MANAGER’S DISCUSSION
Fund highlights
| ∎ | The Fund underperformed its benchmark, the Diversified Income Builder Blended Index, for the 12-month period that ended September 30, 2020. |
| ∎ | The Fund’s equity selection in information technology (IT) was the main detractor from performance. An overweight to the energy sector also detracted from performance. |
| ∎ | The Fund’s high-yield allocation outperformed the bond index from an underweight to energy companies. |
Equity markets posted more-than-decent gains during the 12-month period, despite the sharp sell-off in the first quarter. After a relatively quiet start to the year, mounting fears of the rapid spread of the coronavirus and the economic impact of shutdowns in the U.S. and across the globe sent markets reeling in February and March. In fact, markets experienced their fastest bear market in history. The subsequent recovery, which picked up steam in the second quarter, was just as remarkable. After a miserable first quarter, equity markets posted their strongest second-quarter gains in more than 20 years. During the 12-month period as a whole, U.S. equity markets—as measured by the S&P 500 Index8—rose by 15.15%. International equity returns, meanwhile, were slightly muted. The MSCI ACWI (Net)9—a measure of international developed and emerging market stocks—gained 10.44% during the same period. The MSCI EM Index (Net)10 was up 10.54%.
Longer-duration U.S. government bond prices rose sharply amid a precipitous decline in yields. For the 12-month period, the yield on 30-year U.S. Treasury bonds fell by 0.65%, from 2.11% to 1.46%, while yields on 10-year U.S. Treasury notes fell by 0.98%, from 1.67% to 0.69%. The Bloomberg Barclays U.S. Treasury Index11, a broad measure of U.S. Treasury notes and bonds, gained 8.04% during the 12-month period, while the Bloomberg Barclays 20+ Year U.S. Treasury Index12 returned 16.62%. U.S. high-yield bonds were up 2.33% while high-yield municipal bonds gained 2.60%.
| Ten largest holdings (%) as of September 30, 202013 | ||||
TTM Technologies Incorporated, 5.63%, 10-1-2025 | 2.83 | |||
Koppers Incorporated, 6.00%, 2-15-2025 | 2.24 | |||
Installed Building Company, 5.75%, 2-1-2028 | 2.15 | |||
Iron Mountain Incorporated, 4.88%, 9-15-2027 | 2.06 | |||
Tronox Finance plc, 5.75%, 10-1-2025 | 1.99 | |||
Cheniere Corpus Christi Holdings LLC, 5.13%, 6-30-2027 | 1.78 | |||
HCA Incorporated, 5.38%, 2-1-2025 | 1.75 | |||
Valvoline Incorporated, 4.38%, 8-15-2025 | 1.73 | |||
AMN Healthcare Incorporated, 5.13%, 10-1-2024 | 1.61 | |||
Ball Corporation, 2.88%, 8-15-2030 | 1.58 | |||
Diversification continued to deliver.
In the third quarter of 2020, we removed the master limited partnership (MLP) holdings. Given the reduction in overall number of MLP securities, this asset class has become too concentrated to warrant its continued place in our allocation mix. We also decreased our emerging market equity exposure. Our current allocation helped maintain the portfolio’s overall yield while providing diversification. U.S. high-yield, high-yield municipal, securitized, and contingent convertible bonds all had positive performance for the trailing one-year period. High-yield holdings added to performance as higher-quality companies outperformed the lower-quality firms in the portfolio.
| Portfolio composition as of September 30, 202014 |
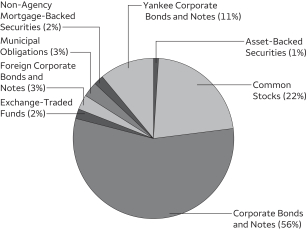 |
Within equities, the global equity allocation detracted from Fund performance due to selection in the poorly performing energy sector. This strategy is also tilted toward value stocks during a period of outperformance for growth stocks. Emerging market holdings also detracted from performance on global trade fears and a stronger dollar.
Looking ahead, the team is cautiously optimistic.
Our macroeconomic outlook is best defined as cautious optimism. There is such a massive amount of uncertainty surrounding the virus, as well as the upcoming U.S. elections, that this view is subject to change, and quickly. On the positive side of the ledger, coordinated global policy action has released trillions of dollars into the market, which is one reason we believe it is unlikely that we will hit the March 2020 market lows again. From an investor psychology aspect, we
Please see footnotes on page 7-8.
Wells Fargo Diversified Income Builder Fund | 9
Table of Contents
Performance highlights (unaudited)
suspect that even if a significant second wave of the coronavirus strikes, the economy now has a path to follow forward and that markets should not behave as negatively as they did in March. However, the “easy money” off the low may have been realized. The upside from here should be limited. We have moved from a “beta-driven” (risk embracing and broadly positive) market recovery to more of a sector- and issuer-driven market. Market participants went from fear of recession to the reality of recession faster than at any other time in history. We find it reasonable to conclude that the recovery should be in proportion to the decline.
We will continue to monitor the situation very carefully and stand ready to adjust exposures as needed.
10 | Wells Fargo Diversified Income Builder Fund
Table of Contents
As a shareholder of the Fund, you incur two types of costs: (1) transaction costs, including sales charges (loads) on purchase payments and contingent deferred sales charges (if any) on redemptions and (2) ongoing costs, including management fees, distribution (12b-1) and/or shareholder servicing fees, and other Fund expenses. This example is intended to help you understand your ongoing costs (in dollars) of investing in the Fund and to compare these costs with the ongoing costs of investing in other mutual funds.
The example is based on an investment of $1,000 invested at the beginning of the six-month period and held for the entire period from April 1, 2020 to September 30, 2020.
Actual expenses
The “Actual” line of the table below provides information about actual account values and actual expenses. You may use the information in this line, together with the amount you invested, to estimate the expenses that you paid over the period. Simply divide your account value by $1,000 (for example, an $8,600 account value divided by $1,000 = 8.6), then multiply the result by the number in the “Actual” line under the heading entitled “Expenses paid during period” for your applicable class of shares to estimate the expenses you paid on your account during this period.
Hypothetical example for comparison purposes
The “Hypothetical” line of the table below provides information about hypothetical account values and hypothetical expenses based on the Fund’s actual expense ratio and an assumed rate of return of 5% per year before expenses, which is not the Fund’s actual return. The hypothetical account values and expenses may not be used to estimate the actual ending account balance or expenses you paid for the period. You may use this information to compare the ongoing costs of investing in the Fund and other funds. To do so, compare this 5% hypothetical example with the 5% hypothetical examples that appear in the shareholder reports of the other funds.
Please note that the expenses shown in the table are meant to highlight your ongoing costs only and do not reflect any transactional costs, such as sales charges (loads) and contingent deferred sales charges. Therefore, the “Hypothetical” line of the table is useful in comparing ongoing costs only and will not help you determine the relative total costs of owning different funds. In addition, if these transactional costs were included, your costs would have been higher.
| Beginning account value 4-1-2020 | Ending account value 9-30-2020 | Expenses paid during the period1 | Annualized net expense ratio | |||||||||||||
Class A | ||||||||||||||||
Actual | $ | 1,000.00 | $ | 1,145.35 | $ | 4.56 | 0.85 | % | ||||||||
Hypothetical (5% return before expenses) | $ | 1,000.00 | $ | 1,020.81 | $ | 4.30 | 0.85 | % | ||||||||
Class C | ||||||||||||||||
Actual | $ | 1,000.00 | $ | 1,140.51 | $ | 8.58 | 1.60 | % | ||||||||
Hypothetical (5% return before expenses) | $ | 1,000.00 | $ | 1,017.05 | $ | 8.08 | 1.60 | % | ||||||||
Class R6 | ||||||||||||||||
Actual | $ | 1,000.00 | $ | 1,149.89 | $ | 2.26 | 0.42 | % | ||||||||
Hypothetical (5% return before expenses) | $ | 1,000.00 | $ | 1,022.96 | $ | 2.13 | 0.42 | % | ||||||||
Administrator Class | ||||||||||||||||
Actual | $ | 1,000.00 | $ | 1,147.59 | $ | 4.15 | 0.77 | % | ||||||||
Hypothetical (5% return before expenses) | $ | 1,000.00 | $ | 1,021.21 | $ | 3.90 | 0.77 | % | ||||||||
Institutional Class | ||||||||||||||||
Actual | $ | 1,000.00 | $ | 1,147.09 | $ | 2.80 | 0.52 | % | ||||||||
Hypothetical (5% return before expenses) | $ | 1,000.00 | $ | 1,022.46 | $ | 2.64 | 0.52 | % | ||||||||
| 1 | Expenses paid is equal to the annualized net expense ratio of each class multiplied by the average account value over the period, multiplied by the number of days in the most recent fiscal half-year divided by the number of days in the fiscal year (to reflect the one-half-year period). |
Wells Fargo Diversified Income Builder Fund | 11
Table of Contents
Portfolio of investments—September 30, 2020
| Interest rate | Maturity date | Principal | Value | |||||||||||||
| Asset-Backed Securities: 1.60% | ||||||||||||||||
Avis Budget Rental Car Funding Series 2019-2A Class C 144A | 4.24 | % | 9-22-2025 | $ | 2,000,000 | $ | 2,048,978 | |||||||||
Chesapeake Funding II LLC Series 2018-1A Class D 144A | 3.92 | 4-15-2030 | 1,980,000 | 1,999,498 | ||||||||||||
Hertz Vehicle Financing LLC Series 2019-1A Class B 144A | 4.10 | 3-25-2023 | 1,380,000 | 1,372,816 | ||||||||||||
Santander Retail Auto Lease Trust Series 2019-A Class D 144A | 3.66 | 5-20-2024 | 2,000,000 | 2,061,244 | ||||||||||||
SoFi Consumer Loan Program Trust Series 2019-2 Class C 144A | 3.46 | 4-25-2028 | 2,000,000 | 2,044,294 | ||||||||||||
Total Asset-Backed Securities (Cost $9,388,947) |
| 9,526,830 | ||||||||||||||
|
| |||||||||||||||
| Shares | ||||||||||||||||
| Common Stocks: 20.12% | ||||||||||||||||
Communication Services: 1.03% | ||||||||||||||||
| Diversified Telecommunication Services: 0.22% | ||||||||||||||||
Bharti Infratel Limited | 23,667 | 56,366 | ||||||||||||||
China Telecom Corporation Limited Class H | 264,000 | 79,318 | ||||||||||||||
Hellenic Telecommunications Organization SA | 3,922 | 56,486 | ||||||||||||||
PT Telekomunikasi Indonesia Persero Tbk | 399,100 | 68,910 | ||||||||||||||
Verizon Communications Incorporated # | 17,743 | 1,055,531 | ||||||||||||||
| 1,316,611 | ||||||||||||||||
|
| |||||||||||||||
| Entertainment: 0.24% | ||||||||||||||||
Netease Incorporated | 8,725 | 156,653 | ||||||||||||||
NetEase Incorporated ADR # | 1,576 | 716,560 | ||||||||||||||
Nintendo Company Limited | 1,000 | 566,691 | ||||||||||||||
| 1,439,904 | ||||||||||||||||
|
| |||||||||||||||
| Interactive Media & Services: 0.21% | ||||||||||||||||
Alphabet Incorporated Class A †# | 539 | 789,958 | ||||||||||||||
Facebook Incorporated Class A †# | 1,718 | 449,944 | ||||||||||||||
| 1,239,902 | ||||||||||||||||
|
| |||||||||||||||
| Media: 0.07% | ||||||||||||||||
Eutelsat Communications SA | 44,554 | 433,941 | ||||||||||||||
|
| |||||||||||||||
| Wireless Telecommunication Services: 0.29% | ||||||||||||||||
Advanced Info Service PCL | 8,400 | 45,208 | ||||||||||||||
America Movil SAB de CV ADR | 4,495 | 56,143 | ||||||||||||||
China Mobile Limited | 106,104 | 681,111 | ||||||||||||||
KDDI Corporation | 27,016 | 679,494 | ||||||||||||||
Mobile TeleSystems PJSC ADR | 9,438 | 82,394 | ||||||||||||||
MTN Group Limited | 15,221 | 51,069 | ||||||||||||||
SK Telecom Company Limited | 549 | 111,601 | ||||||||||||||
| 1,707,020 | ||||||||||||||||
|
| |||||||||||||||
Consumer Discretionary: 1.26% | ||||||||||||||||
| Auto Components: 0.01% | ||||||||||||||||
Minth Group Limited | 18,000 | 78,601 | ||||||||||||||
|
| |||||||||||||||
| Automobiles: 0.05% | ||||||||||||||||
Geely Automobile Holdings Limited | 47,000 | 94,283 | ||||||||||||||
Hero Motorcorp Limited | 1,808 | 77,172 | ||||||||||||||
Kia Motors Corporation | 3,686 | 147,816 | ||||||||||||||
| 319,271 | ||||||||||||||||
|
| |||||||||||||||
The accompanying notes are an integral part of these financial statements.
12 | Wells Fargo Diversified Income Builder Fund
Table of Contents
Portfolio of investments—September 30, 2020
| Shares | Value | |||||||||||||||
| Hotels, Restaurants & Leisure: 0.01% | ||||||||||||||||
Sands China Limited | 12,400 | $ | 48,065 | |||||||||||||
|
| |||||||||||||||
| Household Durables: 0.26% | ||||||||||||||||
Gree Electric Appliances Incorporated | 14,400 | 113,380 | ||||||||||||||
Midea Group Company Limited Class A | 23,499 | 251,858 | ||||||||||||||
Pulte Group Incorporated # | 12,795 | 592,281 | ||||||||||||||
Suofeiya Home Collection Company Limited Class A | 17,399 | 67,633 | ||||||||||||||
The Berkeley Group Holdings plc | 9,394 | 512,092 | ||||||||||||||
| 1,537,244 | ||||||||||||||||
|
| |||||||||||||||
| Internet & Direct Marketing Retail: 0.42% | ||||||||||||||||
Alibaba Group Holding Limited ADR † | 15,300 | 561,680 | ||||||||||||||
Amazon.com Incorporated †# | 330 | 1,039,081 | ||||||||||||||
eBay Incorporated # | 13,476 | 702,100 | ||||||||||||||
Naspers Limited | 1,075 | 189,871 | ||||||||||||||
| 2,492,732 | ||||||||||||||||
|
| |||||||||||||||
| Leisure Products: 0.01% | ||||||||||||||||
Giant Manufacturing Company Limited | 3,000 | 28,426 | ||||||||||||||
|
| |||||||||||||||
| Multiline Retail: 0.14% | ||||||||||||||||
Detsky Mir PJSC | 37,700 | 56,908 | ||||||||||||||
Target Corporation # | 4,911 | 773,090 | ||||||||||||||
| 829,998 | ||||||||||||||||
|
| |||||||||||||||
| Specialty Retail: 0.34% | ||||||||||||||||
Best Buy Company Incorporated # | 6,242 | 694,672 | ||||||||||||||
China Yongda Automobile Service Holding Company | 87,000 | 103,872 | ||||||||||||||
Chow Tai Fook Jewellery Company Limited | 79,000 | 103,329 | ||||||||||||||
Jarir Marketing Company | 1,308 | 65,483 | ||||||||||||||
Petrobras Distribuidora SA | 16,700 | 59,920 | ||||||||||||||
The Home Depot Incorporated # | 3,633 | 1,008,920 | ||||||||||||||
| 2,036,196 | ||||||||||||||||
|
| |||||||||||||||
| Textiles, Apparel & Luxury Goods: 0.02% | ||||||||||||||||
Topsports International Holdings Limited 144A | 87,000 | 120,952 | ||||||||||||||
|
| |||||||||||||||
Consumer Staples: 0.85% |
| |||||||||||||||
| Beverages: 0.02% | ||||||||||||||||
Thai Beverage plc | 200,300 | 89,119 | ||||||||||||||
|
| |||||||||||||||
| Food & Staples Retailing: 0.28% | ||||||||||||||||
Koninklijke Ahold Delhaize NV | 22,308 | 659,378 | ||||||||||||||
Magnit PJSC | 911 | 58,203 | ||||||||||||||
Walmart de Mexico SAB de CV | 28,900 | 69,154 | ||||||||||||||
Walmart Incorporated # | 5,964 | 834,423 | ||||||||||||||
Yonghui Superstores Company Limited | 45,800 | 52,814 | ||||||||||||||
| 1,673,972 | ||||||||||||||||
|
| |||||||||||||||
| Food Products: 0.38% | ||||||||||||||||
Inner Mongolia Yili Industrial Group Company Limited Class A | 17,800 | 101,054 | ||||||||||||||
Lamb Weston Holdings Incorporated | 15,000 | 994,050 | ||||||||||||||
Nestle SA | 4,381 | 521,391 | ||||||||||||||
Tingyi Holding Corporation | 54,000 | 95,617 | ||||||||||||||
WH Group Limited 144A | 677,898 | 552,966 | ||||||||||||||
| 2,265,078 | ||||||||||||||||
|
| |||||||||||||||
The accompanying notes are an integral part of these financial statements.
Wells Fargo Diversified Income Builder Fund | 13
Table of Contents
Portfolio of investments—September 30, 2020
| Shares | Value | |||||||||||||||
| Household Products: 0.16% | ||||||||||||||||
Kimberly-Clark de Mexico SAB de CV Class A | 36,177 | $ | 57,166 | |||||||||||||
The Procter & Gamble Company # | 6,588 | 915,666 | ||||||||||||||
| 972,832 | ||||||||||||||||
|
| |||||||||||||||
| Personal Products: 0.01% | ||||||||||||||||
Hengan International Group Company Limited | 6,600 | 48,312 | ||||||||||||||
|
| |||||||||||||||
Energy: 0.28% |
| |||||||||||||||
| Oil, Gas & Consumable Fuels: 0.28% | ||||||||||||||||
Bharat Petroleum Corporation Limited | 22,902 | 109,611 | ||||||||||||||
CNOOC Limited | 100,000 | 96,188 | ||||||||||||||
ConocoPhillips # | 11,034 | 362,357 | ||||||||||||||
Euronav NV | 60,693 | 537,406 | ||||||||||||||
Hindustan Petroleum Corporation Limited | 33,177 | 81,213 | ||||||||||||||
Lukoil PJSC ADR | 821 | 47,438 | ||||||||||||||
NovaTek OAO Sponsored GDR | 363 | 49,689 | ||||||||||||||
Valero Energy Corporation # | 9,047 | 391,916 | ||||||||||||||
| 1,675,818 | ||||||||||||||||
|
| |||||||||||||||
Financials: 1.84% |
| |||||||||||||||
| Banks: 0.42% | ||||||||||||||||
China Construction Bank Class H | 326,000 | 211,826 | ||||||||||||||
China Merchants Bank Company Limited H Shares | 22,000 | 104,399 | ||||||||||||||
Citigroup Incorporated # | 8,440 | 363,848 | ||||||||||||||
Credicorp Limited | 369 | 45,752 | ||||||||||||||
ING Groep NV † | 65,640 | 468,464 | ||||||||||||||
JPMorgan Chase & Company # | 9,509 | 915,431 | ||||||||||||||
KB Financial Group Incorporated | 3,292 | 106,002 | ||||||||||||||
National Commercial Bank | 5,868 | 58,290 | ||||||||||||||
PKO Bank Polski SA † | 12,848 | 70,515 | ||||||||||||||
PT Bank Rakyat Indonesia Tbk | 253,800 | 52,068 | ||||||||||||||
Sberbank PJSC ADR | 5,134 | 59,937 | ||||||||||||||
Standard Bank Group Limited | 9,056 | 58,165 | ||||||||||||||
| 2,514,697 | ||||||||||||||||
|
| |||||||||||||||
| Capital Markets: 0.60% | ||||||||||||||||
Ares Capital Corporation # | 34,572 | 482,279 | ||||||||||||||
Artisan Partners Asset Management Incorporated Class A # | 16,777 | 654,135 | ||||||||||||||
B3 Brasil Bolsa Balcao SA | 10,000 | 97,954 | ||||||||||||||
Banco BTG Pactual SA | 7,701 | 99,898 | ||||||||||||||
Bangkok Commercial Asset Management PCL | 70,200 | 43,865 | ||||||||||||||
BlackRock Incorporated # | 1,260 | 710,073 | ||||||||||||||
Bursa Malaysia Bhd | 28,100 | 57,443 | ||||||||||||||
CITIC Securities Company Limited Class H | 59,000 | 132,699 | ||||||||||||||
Hong Kong Exchanges & Clearing Limited | 2,600 | 122,391 | ||||||||||||||
Intermediate Capital Group | 30,159 | 463,841 | ||||||||||||||
Morgan Stanley # | 14,317 | 692,227 | ||||||||||||||
| 3,556,805 | ||||||||||||||||
|
| |||||||||||||||
| Consumer Finance: 0.03% | ||||||||||||||||
Manappuram Finance Limited | 72,886 | 156,442 | ||||||||||||||
|
| |||||||||||||||
| Diversified Financial Services: 0.17% | ||||||||||||||||
ORIX Corporation | 32,000 | 399,688 | ||||||||||||||
The accompanying notes are an integral part of these financial statements.
14 | Wells Fargo Diversified Income Builder Fund
Table of Contents
Portfolio of investments—September 30, 2020
| Shares | Value | |||||||||||||||
| Diversified Financial Services (continued) | ||||||||||||||||
Plus500 Limited | 29,590 | $ | 598,139 | |||||||||||||
| 997,827 | ||||||||||||||||
|
| |||||||||||||||
| Insurance: 0.45% | ||||||||||||||||
China Life Insurance Company Class H | 35,000 | 79,344 | ||||||||||||||
Chubb Limited | 20,000 | 2,322,400 | ||||||||||||||
Ping An Insurance Group Company Class H | 21,900 | 227,341 | ||||||||||||||
Samsung Fire & Marine Insurance | 550 | 85,681 | ||||||||||||||
| 2,714,766 | ||||||||||||||||
|
| |||||||||||||||
| Mortgage REITs: 0.17% | ||||||||||||||||
AGNC Investment Corporation # | 37,267 | 518,384 | ||||||||||||||
New Residential Investment Corporation # | 59,294 | 471,387 | ||||||||||||||
| 989,771 | ||||||||||||||||
|
| |||||||||||||||
| Health Care: 3.47% | ||||||||||||||||
| Biotechnology: 0.70% | ||||||||||||||||
AbbVie Incorporated # | 26,900 | 2,356,171 | ||||||||||||||
Alexion Pharmaceuticals Incorporated † | 10,000 | 1,144,300 | ||||||||||||||
Amgen Incorporated # | 2,603 | 661,578 | ||||||||||||||
| 4,162,049 | ||||||||||||||||
|
| |||||||||||||||
| Health Care Equipment & Supplies: 1.40% | ||||||||||||||||
Abbott Laboratories | 45,000 | 4,897,350 | ||||||||||||||
Becton Dickinson & Company | 8,000 | 1,861,440 | ||||||||||||||
Danaher Corporation | 7,000 | 1,507,310 | ||||||||||||||
Top Glove Corporation Bhd | 32,300 | 64,762 | ||||||||||||||
| 8,330,862 | ||||||||||||||||
|
| |||||||||||||||
| Health Care Providers & Services: 0.36% | ||||||||||||||||
CVS Health Corporation # | 11,833 | 691,047 | ||||||||||||||
McKesson Corporation | 5,000 | 744,650 | ||||||||||||||
Sinopharm Group Company Limited Class H | 46,000 | 97,207 | ||||||||||||||
UnitedHealth Group Incorporated # | 2,027 | 631,958 | ||||||||||||||
| 2,164,862 | ||||||||||||||||
|
| |||||||||||||||
| Life Sciences Tools & Services: 0.37% | ||||||||||||||||
Thermo Fisher Scientific Incorporated | 5,000 | 2,207,600 | ||||||||||||||
|
| |||||||||||||||
| Pharmaceuticals: 0.64% | ||||||||||||||||
Bristol-Myers Squibb Company # | 21,549 | 1,299,189 | ||||||||||||||
GlaxoSmithKline plc | 25,266 | 473,674 | ||||||||||||||
Johnson & Johnson # | 4,870 | 725,046 | ||||||||||||||
Roche Holding AG | 1,904 | 652,197 | ||||||||||||||
Sanofi SA | 6,441 | 645,464 | ||||||||||||||
| 3,795,570 | ||||||||||||||||
|
| |||||||||||||||
Industrials: 2.24% |
| |||||||||||||||
| Aerospace & Defense: 0.55% | ||||||||||||||||
Curtiss-Wright Corporation | 10,000 | 932,600 | ||||||||||||||
Huntington Ingalls Industries Incorporated | 8,000 | 1,126,000 | ||||||||||||||
Raytheon Technologies Corporation | 21,013 | 1,209,088 | ||||||||||||||
| 3,267,688 | ||||||||||||||||
|
| |||||||||||||||
The accompanying notes are an integral part of these financial statements.
Wells Fargo Diversified Income Builder Fund | 15
Table of Contents
Portfolio of investments—September 30, 2020
| Shares | Value | |||||||||||||||
| Construction & Engineering: 0.10% | ||||||||||||||||
China Communications Services Corporation Limited Class H | 76,000 | $ | 44,867 | |||||||||||||
Cury Construtora e Incorporadora SA † | 52,109 | 100,211 | ||||||||||||||
Obayashi Corporation | 50,722 | 463,056 | ||||||||||||||
| 608,134 | ||||||||||||||||
|
| |||||||||||||||
| Electrical Equipment: 0.41% | ||||||||||||||||
AMETEK Incorporated | 15,000 | 1,491,000 | ||||||||||||||
Nari Technology Company Limited | 29,700 | 86,347 | ||||||||||||||
Schneider Electric SE | 6,679 | 830,192 | ||||||||||||||
| 2,407,539 | ||||||||||||||||
|
| |||||||||||||||
| Industrial Conglomerates: 0.14% | ||||||||||||||||
Honeywell International Incorporated # | 5,077 | 835,725 | ||||||||||||||
|
| |||||||||||||||
| Machinery: 0.72% | ||||||||||||||||
Cummins Incorporated # | 3,454 | 729,347 | ||||||||||||||
IDEX Corporation | 9,000 | 1,641,690 | ||||||||||||||
John Bean Technologies Corporation | 20,000 | 1,837,800 | ||||||||||||||
Weichai Power Company Limited Class H | 50,000 | 101,173 | ||||||||||||||
| 4,310,010 | ||||||||||||||||
|
| |||||||||||||||
| Road & Rail: 0.22% | ||||||||||||||||
TFI International Incorporated | 11,601 | 485,107 | ||||||||||||||
Union Pacific Corporation # | 4,059 | 799,095 | ||||||||||||||
| 1,284,202 | ||||||||||||||||
|
| |||||||||||||||
| Trading Companies & Distributors: 0.09% | ||||||||||||||||
BOC Aviation Limited 144A | 12,100 | 82,910 | ||||||||||||||
Brenntag AG | 7,171 | 455,945 | ||||||||||||||
| 538,855 | ||||||||||||||||
|
| |||||||||||||||
| Transportation Infrastructure: 0.01% | ||||||||||||||||
China Merchants Port Holdings Company Limited | 74,000 | 76,016 | ||||||||||||||
|
| |||||||||||||||
Information Technology: 5.95% |
| |||||||||||||||
| Electronic Equipment, Instruments & Components: 1.15% | ||||||||||||||||
Amphenol Corporation Class A | 25,000 | 2,706,750 | ||||||||||||||
Corning Incorporated | 80,000 | 2,592,800 | ||||||||||||||
Delta Electronics Incorporated | 10,000 | 65,664 | ||||||||||||||
FLIR Systems Incorporated | 22,000 | 788,700 | ||||||||||||||
Hon Hai Precision Industry Company Limited | 42,600 | 114,531 | ||||||||||||||
Keysight Technologies Incorporated †# | 5,757 | 568,676 | ||||||||||||||
| 6,837,121 | ||||||||||||||||
|
| |||||||||||||||
| IT Services: 0.68% | ||||||||||||||||
Adyen NV 144A† | 278 | 512,766 | ||||||||||||||
Infosys Limited ADR | 13,955 | 192,719 | ||||||||||||||
Leidos Holdings Incorporated # | 36,057 | 3,214,482 | ||||||||||||||
Tech Mahindra Limited | 10,424 | 112,189 | ||||||||||||||
| 4,032,156 | ||||||||||||||||
|
| |||||||||||||||
| Semiconductors & Semiconductor Equipment: 1.94% | ||||||||||||||||
ASE Technology Holding Company Limited | 28,000 | 57,649 | ||||||||||||||
ASM Pacific Technology | 6,900 | 70,636 | ||||||||||||||
The accompanying notes are an integral part of these financial statements.
16 | Wells Fargo Diversified Income Builder Fund
Table of Contents
Portfolio of investments—September 30, 2020
| Shares | Value | |||||||||||||||
| Semiconductors & Semiconductor Equipment (continued) | ||||||||||||||||
ASML Holding NV | 1,961 | $ | 724,340 | |||||||||||||
Broadcom Incorporated | 10,000 | 3,643,200 | ||||||||||||||
KLA Corporation # | 3,577 | 693,008 | ||||||||||||||
Mediatek Incorporated | 6,000 | 127,134 | ||||||||||||||
Microchip Technology Incorporated | 9,000 | 924,840 | ||||||||||||||
NVIDIA Corporation # | 1,005 | 543,926 | ||||||||||||||
QUALCOMM Incorporated # | 5,579 | 656,537 | ||||||||||||||
Realtek Semiconductor Corporation | 5,000 | 64,092 | ||||||||||||||
SK Hynix Incorporated | 1,757 | 125,947 | ||||||||||||||
Taiwan Semiconductor Manufacturing Company Limited | 59,000 | 887,600 | ||||||||||||||
Taiwan Semiconductor Manufacturing Company Limited ADR # | 9,696 | 786,055 | ||||||||||||||
Texas Instruments Incorporated # | 15,615 | 2,229,666 | ||||||||||||||
| 11,534,630 | ||||||||||||||||
|
| |||||||||||||||
| Software: 1.48% | ||||||||||||||||
Adobe Incorporated † | 5,000 | 2,452,150 | ||||||||||||||
Microsoft Corporation # | 12,660 | 2,662,778 | ||||||||||||||
SAP SE | 3,162 | 492,381 | ||||||||||||||
Synopsys Incorporated † | 15,000 | 3,209,700 | ||||||||||||||
| 8,817,009 | ||||||||||||||||
|
| |||||||||||||||
| Technology Hardware, Storage & Peripherals: 0.70% | ||||||||||||||||
Advantech Company Limited | 10,000 | 101,193 | ||||||||||||||
Apple Incorporated # | 12,187 | 1,411,376 | ||||||||||||||
Lenovo Group Limited | 882,000 | 583,145 | ||||||||||||||
Quanta Computer Incorporated | 34,000 | 89,282 | ||||||||||||||
Samsung Electronics Company Limited | 10,276 | 510,143 | ||||||||||||||
Samsung Electronics Company Limited GDR 144A | 588 | 745,539 | ||||||||||||||
Western Digital Corporation | 20,000 | 731,000 | ||||||||||||||
| 4,171,678 | ||||||||||||||||
|
| |||||||||||||||
Materials: 0.83% |
| |||||||||||||||
| Chemicals: 0.26% | ||||||||||||||||
Akzo Nobel NV | 5,281 | 533,753 | ||||||||||||||
Lomon Billions Group Company Limited | 27,500 | 94,531 | ||||||||||||||
LyondellBasell Industries NV Class A # | 6,135 | 432,456 | ||||||||||||||
Valvoline Incorporated # | 24,028 | 457,493 | ||||||||||||||
Wanhua Chemical Group Company Limited Class A | 5,300 | 54,273 | ||||||||||||||
| 1,572,506 | ||||||||||||||||
|
| |||||||||||||||
| Construction Materials: 0.07% | ||||||||||||||||
China Resources Cement Holdings Limited | 320,000 | 439,920 | ||||||||||||||
|
| |||||||||||||||
| Metals & Mining: 0.48% | ||||||||||||||||
Barrick Gold Corporation | 27,832 | 781,733 | ||||||||||||||
Fortescue Metals Group Limited | 58,711 | 689,738 | ||||||||||||||
Gold Fields Limited ADR | 7,292 | 89,619 | ||||||||||||||
MMC Norilsk Nickel PJSC | 315 | 76,082 | ||||||||||||||
Polymetal International plc | 4,418 | 96,265 | ||||||||||||||
POSCO | 687 | 115,013 | ||||||||||||||
Rio Tinto plc | 12,371 | 744,393 | ||||||||||||||
Southern Copper Corporation | 1,548 | 70,078 | ||||||||||||||
Vale SA | 16,100 | 169,460 | ||||||||||||||
| 2,832,381 | ||||||||||||||||
|
| |||||||||||||||
The accompanying notes are an integral part of these financial statements.
Wells Fargo Diversified Income Builder Fund | 17
Table of Contents
Portfolio of investments—September 30, 2020
| Shares | Value | |||||||||||||||
| Paper & Forest Products: 0.02% | ||||||||||||||||
Nine Dragons Paper Holdings Limited | 77,000 | $ | 97,215 | |||||||||||||
|
| |||||||||||||||
| Real Estate: 0.88% | ||||||||||||||||
| Equity REITs: 0.73% | ||||||||||||||||
Crown Castle International Corporation | 20,000 | 3,330,000 | ||||||||||||||
Embassy Office Parks REIT | 22,000 | 107,946 | ||||||||||||||
Saul Centers Incorporated | 35,000 | 930,300 | ||||||||||||||
| 4,368,246 | ||||||||||||||||
|
| |||||||||||||||
| Real Estate Management & Development: 0.15% | ||||||||||||||||
China Merchants Shekou Industrial Zone Holdings Company Limited Class A | 25,100 | 56,139 | ||||||||||||||
China Resources Land Limited | 37,350 | 170,347 | ||||||||||||||
Logan Property Holdings Company Limited | 350,442 | 557,620 | ||||||||||||||
Shimao Property Holding Limited | 27,500 | 114,728 | ||||||||||||||
| 898,834 | ||||||||||||||||
|
| |||||||||||||||
Utilities: 1.49% |
| |||||||||||||||
| Electric Utilities: 0.41% | ||||||||||||||||
American Electric Power Company Incorporated | 22,000 | 1,798,060 | ||||||||||||||
Red Eléctrica de Espana SA | 34,906 | 654,674 | ||||||||||||||
| 2,452,734 | ||||||||||||||||
|
| |||||||||||||||
| Gas Utilities: 0.30% | ||||||||||||||||
Atmos Energy Corporation | 10,000 | 955,900 | ||||||||||||||
ENN Energy Holdings Limited | 10,400 | 114,122 | ||||||||||||||
Kunlun Energy Company Limited | 140,000 | 92,445 | ||||||||||||||
Mahanagar Gas Limited | 6,911 | 78,005 | ||||||||||||||
National Fuel Gas Company # | 13,171 | 534,611 | ||||||||||||||
| 1,775,083 | ||||||||||||||||
|
| |||||||||||||||
| Independent Power & Renewable Electricity Producers: 0.18% | ||||||||||||||||
Drax Group plc | 199,181 | 683,816 | ||||||||||||||
Vistra Energy Corporation | 20,000 | 377,200 | ||||||||||||||
| 1,061,016 | ||||||||||||||||
|
| |||||||||||||||
| Multi-Utilities: 0.60% | ||||||||||||||||
CMS Energy Corporation | 30,000 | 1,842,300 | ||||||||||||||
DTE Energy Company | 15,000 | 1,725,600 | ||||||||||||||
| 3,567,900 | ||||||||||||||||
|
| |||||||||||||||
Total Common Stocks (Cost $95,955,806) | 119,731,843 | |||||||||||||||
|
| |||||||||||||||
| Interest rate | Maturity date | Principal | ||||||||||||||
| Corporate Bonds and Notes: 52.31% | ||||||||||||||||
Consumer Discretionary: 4.21% |
| |||||||||||||||
| Auto Components: 2.06% | ||||||||||||||||
Dana Holding Corporation | 5.50 | % | 12-15-2024 | $ | 3,925,000 | 4,003,500 | ||||||||||
Speedway Motors Incorporated 144A | 4.88 | 11-1-2027 | 3,000,000 | 2,879,100 | ||||||||||||
Tenneco Incorporated | 5.00 | 7-15-2026 | 7,250,000 | 5,365,000 | ||||||||||||
| 12,247,600 | ||||||||||||||||
|
| |||||||||||||||
The accompanying notes are an integral part of these financial statements.
18 | Wells Fargo Diversified Income Builder Fund
Table of Contents
Portfolio of investments—September 30, 2020
| Interest rate | Maturity date | Principal | Value | |||||||||||||
| Household Durables: 2.15% | ||||||||||||||||
Installed Building Company 144A | 5.75 | % | 2-1-2028 | $ | 12,140,000 | $ | 12,777,350 | |||||||||
|
| |||||||||||||||
Consumer Staples: 2.44% |
| |||||||||||||||
| Food Products: 2.44% | ||||||||||||||||
Lamb Weston Holdings Incorporated 144A | 4.63 | 11-1-2024 | 9,000,000 | 9,382,500 | ||||||||||||
Post Holdings Incorporated 144A | 5.00 | 8-15-2026 | 5,000,000 | 5,125,000 | ||||||||||||
| 14,507,500 | ||||||||||||||||
|
| |||||||||||||||
Energy: 1.78% |
| |||||||||||||||
| Oil, Gas & Consumable Fuels: 1.78% | ||||||||||||||||
Cheniere Corpus Christi Holdings LLC | 5.13 | 6-30-2027 | 9,500,000 | 10,577,344 | ||||||||||||
|
| |||||||||||||||
Financials: 2.06% |
| |||||||||||||||
| Banks: 1.66% | ||||||||||||||||
Allied Irish Banks plc (EUR Swap Annual (vs. 6 Month EURIBOR) 5 Year +7.34%) ± | 7.38 | 12-29-2049 | 1,500,000 | 1,763,177 | ||||||||||||
Citigroup Incorporated (U.S. SOFR +3.23%) ±(s) | 4.70 | 1-30-2025 | 1,000,000 | 966,250 | ||||||||||||
Citizens Financial Group (5 Year Treasury Constant Maturity +5.31%) ±(s) | 5.65 | 10-6-2025 | 2,000,000 | 2,085,740 | ||||||||||||
Fifth Third Bancorp (5 Year Treasury Constant Maturity +4.22%) ±(s) | 4.50 | 9-30-2025 | 2,000,000 | 2,012,500 | ||||||||||||
JPMorgan Chase & Company (U.S. SOFR +3.13%) ±(s) | 4.60 | 2-1-2025 | 1,000,000 | 980,000 | ||||||||||||
Truist Financial Corporation (5 Year Treasury Constant Maturity +4.61%) ±(s) | 4.95 | 9-1-2025 | 2,000,000 | 2,105,000 | ||||||||||||
| 9,912,667 | ||||||||||||||||
|
| |||||||||||||||
| Consumer Finance: 0.18% | ||||||||||||||||
Discover Financial Services (5 Year Treasury Constant Maturity +5.78%) ±(s) | 6.13 | 6-23-2025 | 1,000,000 | 1,057,800 | ||||||||||||
|
| |||||||||||||||
| Diversified Financial Services: 0.22% | ||||||||||||||||
Toll Road Investors Partnership II LP 144A¤ | 0.00 | 2-15-2030 | 2,000,000 | 1,289,723 | ||||||||||||
|
| |||||||||||||||
Health Care: 12.84% |
| |||||||||||||||
| Health Care Equipment & Supplies: 2.25% | ||||||||||||||||
Hologic Incorporated 144A | 4.38 | 10-15-2025 | 7,000,000 | 7,157,500 | ||||||||||||
Teleflex Incorporated | 4.63 | 11-15-2027 | 1,984,000 | 2,088,160 | ||||||||||||
Teleflex Incorporated | 4.88 | 6-1-2026 | 4,000,000 | 4,130,000 | ||||||||||||
| 13,375,660 | ||||||||||||||||
|
| |||||||||||||||
| Health Care Providers & Services: 6.87% | ||||||||||||||||
AMN Healthcare Incorporated 144A | 4.63 | 10-1-2027 | 1,350,000 | 1,383,750 | ||||||||||||
AMN Healthcare Incorporated 144A | 5.13 | 10-1-2024 | 9,335,000 | 9,556,706 | ||||||||||||
Centene Corporation | 3.38 | 2-15-2030 | 3,000,000 | 3,112,500 | ||||||||||||
Centene Corporation | 4.63 | 12-15-2029 | 7,000,000 | 7,550,620 | ||||||||||||
Davita Incorporated 144A | 4.63 | 6-1-2030 | 1,000,000 | 1,026,400 | ||||||||||||
Emcompass Health Corporation | 5.13 | 3-15-2023 | 2,000,000 | 2,010,000 | ||||||||||||
HCA Incorporated | 5.38 | 2-1-2025 | 9,500,000 | 10,402,500 | ||||||||||||
West Street Merger Sub Incorporated 144A | 6.38 | 9-1-2025 | 5,700,000 | 5,812,803 | ||||||||||||
| 40,855,279 | ||||||||||||||||
|
| |||||||||||||||
| Health Care Technology: 0.88% | ||||||||||||||||
IQVIA Incorporated 144A | 5.00 | 10-15-2026 | 5,000,000 | 5,225,000 | ||||||||||||
|
| |||||||||||||||
| Life Sciences Tools & Services: 1.42% | ||||||||||||||||
Charles River Laboratories Incorporated 144A | 5.50 | 4-1-2026 | 5,075,000 | 5,341,438 | ||||||||||||
Charles River Laboratories Incorporated 144A | 4.25 | 5-1-2028 | 3,000,000 | 3,148,470 | ||||||||||||
| 8,489,908 | ||||||||||||||||
|
| |||||||||||||||
The accompanying notes are an integral part of these financial statements.
Wells Fargo Diversified Income Builder Fund | 19
Table of Contents
Portfolio of investments—September 30, 2020
| Interest rate | Maturity date | Principal | Value | |||||||||||||
| Pharmaceuticals: 1.42% | ||||||||||||||||
Catalent Pharma Solutions Incorporated 144A | 4.88 | % | 1-15-2026 | $ | 8,300,000 | $ | 8,466,000 | |||||||||
|
| |||||||||||||||
Industrials: 9.01% |
| |||||||||||||||
| Aerospace & Defense: 1.60% | ||||||||||||||||
Moog Incorporated 144A | 4.25 | 12-15-2027 | 700,000 | 715,785 | ||||||||||||
TransDigm Group Incorporated | 6.38 | 6-15-2026 | 8,800,000 | 8,834,584 | ||||||||||||
| 9,550,369 | ||||||||||||||||
|
| |||||||||||||||
| Commercial Services & Supplies: 2.64% | ||||||||||||||||
ACCO Brands Corporation 144A | 5.25 | 12-15-2024 | 5,000,000 | 5,118,750 | ||||||||||||
Clean Harbors Incorporated 144A | 5.13 | 7-15-2029 | 2,000,000 | 2,169,740 | ||||||||||||
Northern Light Health | 5.02 | 7-1-2036 | 1,000,000 | 1,062,113 | ||||||||||||
South Nassau Communities Hospital Incorporated | 4.65 | 8-1-2048 | 2,000,000 | 2,151,375 | ||||||||||||
Stericycle Incorporated 144A | 5.38 | 7-15-2024 | 5,000,000 | 5,192,250 | ||||||||||||
| 15,694,228 | ||||||||||||||||
|
| |||||||||||||||
| Construction & Engineering: 0.36% | ||||||||||||||||
Aecom Company | 5.13 | 3-15-2027 | 2,000,000 | 2,160,240 | ||||||||||||
|
| |||||||||||||||
| Electrical Equipment: 0.50% | ||||||||||||||||
Resideo Funding Incorporated 144A | 6.13 | 11-1-2026 | 3,000,000 | 2,955,000 | ||||||||||||
|
| |||||||||||||||
| Machinery: 2.36% | ||||||||||||||||
HD Supply Incorporated 144A | 5.38 | 10-15-2026 | 8,100,000 | 8,505,000 | ||||||||||||
SPX FLOW Incorporated 144A | 5.88 | 8-15-2026 | 5,328,000 | 5,541,120 | ||||||||||||
| 14,046,120 | ||||||||||||||||
|
| |||||||||||||||
| Trading Companies & Distributors: 1.55% | ||||||||||||||||
WESCO Distribution Incorporated | 5.38 | 6-15-2024 | 8,974,000 | 9,209,568 | ||||||||||||
|
| |||||||||||||||
Information Technology: 5.31% |
| |||||||||||||||
| Communications Equipment: 1.05% | ||||||||||||||||
CommScope Technologies Finance LLC 144A | 5.00 | 3-15-2027 | 6,500,000 | 6,240,000 | ||||||||||||
|
| |||||||||||||||
| Electronic Equipment, Instruments & Components: 3.71% | ||||||||||||||||
MTS Systems Corporation 144A | 5.75 | 8-15-2027 | 5,340,000 | 5,258,298 | ||||||||||||
TTM Technologies Incorporated 144A | 5.63 | 10-1-2025 | 16,495,000 | 16,824,900 | ||||||||||||
| 22,083,198 | ||||||||||||||||
|
| |||||||||||||||
| Technology Hardware, Storage & Peripherals: 0.55% | ||||||||||||||||
Western Digital Corporation | 4.75 | 2-15-2026 | 3,000,000 | 3,240,000 | ||||||||||||
|
| |||||||||||||||
Materials: 10.50% |
| |||||||||||||||
| Chemicals: 6.46% | ||||||||||||||||
Koppers Incorporated 144A | 6.00 | 2-15-2025 | 13,150,000 | 13,330,813 | ||||||||||||
Olin Corporation | 5.13 | 9-15-2027 | 5,000,000 | 4,950,000 | ||||||||||||
Olin Corporation | 5.50 | 8-15-2022 | 5,500,000 | 5,623,750 | ||||||||||||
Scotts Miracle-Gro Company | 5.25 | 12-15-2026 | 4,000,000 | 4,265,000 | ||||||||||||
Valvoline Incorporated | 4.38 | 8-15-2025 | 10,000,000 | 10,287,500 | ||||||||||||
| 38,457,063 | ||||||||||||||||
|
| |||||||||||||||
| Containers & Packaging: 3.66% | ||||||||||||||||
Ball Corporation | 2.88 | 8-15-2030 | 9,500,000 | 9,393,125 | ||||||||||||
Ball Corporation | 4.00 | 11-15-2023 | 1,000,000 | 1,061,500 | ||||||||||||
The accompanying notes are an integral part of these financial statements.
20 | Wells Fargo Diversified Income Builder Fund
Table of Contents
Portfolio of investments—September 30, 2020
| Interest rate | Maturity date | Principal | Value | |||||||||||||
| Containers & Packaging (continued) | ||||||||||||||||
Ball Corporation | 5.00 | % | 3-15-2022 | $ | 2,500,000 | $ | 2,628,125 | |||||||||
Berry Global Incorporated | 5.13 | 7-15-2023 | 1,014,000 | 1,029,311 | ||||||||||||
Sealed Air Corporation 144A | 5.25 | 4-1-2023 | 4,650,000 | 4,905,750 | ||||||||||||
Sealed Air Corporation 144A | 5.50 | 9-15-2025 | 2,500,000 | 2,775,000 | ||||||||||||
| 21,792,811 | ||||||||||||||||
|
| |||||||||||||||
| Metals & Mining: 0.38% | ||||||||||||||||
Commercial Metals Company | 4.88 | 5-15-2023 | 2,150,000 | 2,236,000 | ||||||||||||
|
| |||||||||||||||
Real Estate: 3.88% |
| |||||||||||||||
| Equity REITs: 3.88% | ||||||||||||||||
Iron Mountain Incorporated 144A | 4.88 | 9-15-2027 | 12,000,000 | 12,237,150 | ||||||||||||
Sabra Health Care LP/Sabra Capital Corporation | 3.90 | 10-15-2029 | 4,175,000 | 4,064,515 | ||||||||||||
SBA Communications Corporation 144A | 3.88 | 2-15-2027 | 6,650,000 | 6,749,750 | ||||||||||||
| 23,051,415 | ||||||||||||||||
|
| |||||||||||||||
Utilities: 0.28% |
| |||||||||||||||
| Electric Utilities: 0.28% | ||||||||||||||||
NRG Energy Incorporated 144A | 5.25 | 6-15-2029 | 1,550,000 | 1,685,625 | ||||||||||||
|
| |||||||||||||||
Total Corporate Bonds and Notes (Cost $305,980,166) |
| 311,183,468 | ||||||||||||||
|
| |||||||||||||||
| Shares | ||||||||||||||||
Exchange-Traded Funds: 1.54% |
| |||||||||||||||
Industrial Select Sector SPDR ETF |
| 118,835 | 9,147,918 | |||||||||||||
|
| |||||||||||||||
Total Exchange-Traded Funds (Cost $9,271,744) |
| 9,147,918 | ||||||||||||||
|
| |||||||||||||||
| Principal | ||||||||||||||||
Foreign Corporate Bonds and Notes: 2.30% |
| |||||||||||||||
Financials: 2.30% |
| |||||||||||||||
| Banks: 2.30% | ||||||||||||||||
ABN AMRO Bank NV (EUR Swap Annual (vs. 6 Month EURIBOR) 5 Year +3.90%) ±(s) | 4.75 | 9-22-2027 | EUR | 3,000,000 | 3,526,143 | |||||||||||
Banco Santander SA (EUR Swap Annual (vs. 6 Month EURIBOR) 5 Year +4.53%) ±(s) | 4.38 | 1-14-2026 | EUR | 3,000,000 | 3,174,408 | |||||||||||
Bankia SA (EUR Swap Annual (vs. 6 Month EURIBOR) 5 Year +6.22%) ±(s) | 6.38 | 9-19-2023 | EUR | 3,000,000 | 3,593,008 | |||||||||||
Cooperatieve Rabobank UA (EUR Swap Annual (vs. 6 Month EURIBOR) 5 Year +6.70%) ±(s) | 6.63 | 6-29-2021 | EUR | 2,800,000 | 3,381,345 | |||||||||||
Total Foreign Corporate Bonds and Notes (Cost $13,242,906) |
| 13,674,904 | ||||||||||||||
|
| |||||||||||||||
Municipal Obligations: 3.08% | ||||||||||||||||
California: 0.47% | ||||||||||||||||
| Education Revenue: 0.37% | ||||||||||||||||
California School Finance Authority Charter School 144A | 4.25 | 7-1-2025 | $ | 935,000 | 919,002 | |||||||||||
California School Finance Authority Charter School 144A | 5.00 | 6-15-2031 | 1,350,000 | 1,292,774 | ||||||||||||
| 2,211,776 | ||||||||||||||||
|
| |||||||||||||||
| Health Revenue: 0.10% |
| |||||||||||||||
California Municipal Finance Authority Series 2019B 144A | 4.25 | 11-1-2023 | 610,000 | 607,719 | ||||||||||||
| 2,819,495 | ||||||||||||||||
|
| |||||||||||||||
The accompanying notes are an integral part of these financial statements.
Wells Fargo Diversified Income Builder Fund | 21
Table of Contents
Portfolio of investments—September 30, 2020
| Interest rate | Maturity date | Principal | Value | |||||||||||||
| Colorado: 0.08% | ||||||||||||||||
| Health Revenue: 0.08% | ||||||||||||||||
Denver CO Health & Hospital Authority Series B | 5.15 | % | 12-1-2026 | $ | 445,000 | $ | 479,821 | |||||||||
|
| |||||||||||||||
Florida: 0.27% |
| |||||||||||||||
| Education Revenue: 0.27% | ||||||||||||||||
Capital Trust Agency Renaissance Charter School Project Series B 144A | 5.63 | 6-15-2023 | 590,000 | 591,156 | ||||||||||||
Florida HEFAR Jacksonville University Project Series A2 144A | 5.43 | 6-1-2027 | 1,000,000 | 1,008,720 | ||||||||||||
| 1,599,876 | ||||||||||||||||
|
| |||||||||||||||
Georgia: 0.08% |
| |||||||||||||||
| Health Revenue: 0.08% | ||||||||||||||||
Cobb County Development Authority Presbyterian Village Austell Project Series 2019B 144A | 5.75 | 12-1-2028 | 500,000 | 490,210 | ||||||||||||
|
| |||||||||||||||
Guam: 0.11% |
| |||||||||||||||
| Airport Revenue: 0.11% | ||||||||||||||||
Guam Port Authority Series C | 3.78 | 7-1-2021 | 635,000 | 641,998 | ||||||||||||
|
| |||||||||||||||
Illinois: 0.53% |
| |||||||||||||||
| Miscellaneous Revenue: 0.53% | ||||||||||||||||
Chicago IL Board of Education Taxable Build America Bonds Series E | 6.04 | 12-1-2029 | 1,255,000 | 1,294,771 | ||||||||||||
Chicago IL Certificate of Participation River Point Plaza Redevelopment Project Series A 144A | 4.84 | 4-15-2028 | 1,825,000 | 1,846,170 | ||||||||||||
| 3,140,941 | ||||||||||||||||
|
| |||||||||||||||
Indiana: 0.08% |
| |||||||||||||||
| Health Revenue: 0.08% | ||||||||||||||||
Knox County IN Good Samaritian Hospital Project Industry Economic Development Series B | 5.90 | 4-1-2034 | 480,000 | 489,245 | ||||||||||||
|
| |||||||||||||||
Iowa: 0.20% |
| |||||||||||||||
| GO Revenue: 0.20% | ||||||||||||||||
Coralville IA Series C | 5.00 | 5-1-2030 | 1,200,000 | 1,190,580 | ||||||||||||
|
| |||||||||||||||
Louisiana: 0.17% |
| |||||||||||||||
| Health Revenue: 0.17% | ||||||||||||||||
Louisiana Local Government Environmental Facilities and Community Development Authority | 5.75 | 1-1-2029 | 1,000,000 | 987,030 | ||||||||||||
|
| |||||||||||||||
New Jersey: 0.37% |
| |||||||||||||||
| Education Revenue: 0.18% | ||||||||||||||||
New Jersey Educational Facilities Authority Georgian Court University Series H | 4.25 | 7-1-2028 | 1,000,000 | 1,067,540 | ||||||||||||
|
| |||||||||||||||
| Utilities Revenue: 0.19% | ||||||||||||||||
Newark NJ Redevelopment Area Public Service Electric & Gas Project 144A | 4.49 | 12-1-2047 | 1,000,000 | 1,137,430 | ||||||||||||
|
| |||||||||||||||
| 2,204,970 | ||||||||||||||||
|
| |||||||||||||||
New York: 0.23% |
| |||||||||||||||
| Education Revenue: 0.09% | ||||||||||||||||
Yonkers Economic Development Corporation Series 2019B | 4.50 | 10-15-2024 | 545,000 | 534,607 | ||||||||||||
|
| |||||||||||||||
The accompanying notes are an integral part of these financial statements.
22 | Wells Fargo Diversified Income Builder Fund
Table of Contents
Portfolio of investments—September 30, 2020
| Interest rate | Maturity date | Principal | Value | |||||||||||||
| Health Revenue: 0.05% | ||||||||||||||||
Jefferson County NY Civic Facility Development Corporation Refunding Bond Series B Samaritan Medical Center Obligated Group | 4.25 | % | 11-1-2028 | $ | 305,000 | $ | 321,064 | |||||||||
|
| |||||||||||||||
| Utilities Revenue: 0.09% | ||||||||||||||||
New York Energy Research & Development Authority Green Bond Series A | 4.81 | 4-1-2034 | 500,000 | 521,365 | ||||||||||||
|
| |||||||||||||||
| 1,377,036 | ||||||||||||||||
|
| |||||||||||||||
Oklahoma: 0.10% |
| |||||||||||||||
| Health Revenue: 0.10% | ||||||||||||||||
Oklahoma Development Finance Authority | 5.45 | 8-15-2028 | 500,000 | 587,745 | ||||||||||||
|
| |||||||||||||||
Tennessee: 0.16% |
| |||||||||||||||
| Tax Revenue: 0.16% | ||||||||||||||||
Bristol TN Industrial Development Board The Pinnacle Project Series A 144A | 5.13 | 12-1-2042 | 1,000,000 | 944,680 | ||||||||||||
|
| |||||||||||||||
Wisconsin: 0.23% |
| |||||||||||||||
| Education Revenue: 0.23% | ||||||||||||||||
PFA Burrell College of Osteopathic Medicine Project 144A | 5.13 | 6-1-2028 | 1,360,000 | 1,396,217 | ||||||||||||
|
| |||||||||||||||
Total Municipal Obligations (Cost $17,882,359) |
| 18,349,844 | ||||||||||||||
|
| |||||||||||||||
| Non-Agency Mortgage-Backed Securities: 1.63% | ||||||||||||||||
AFN LLC Series 2019-1A Class A2 144A | 4.46 | 5-20-2049 | 1,000,000 | 995,130 | ||||||||||||
Aqua Finance Trust Series 2019-A Class A 144A | 3.14 | 7-16-2040 | 415,268 | 425,039 | ||||||||||||
BCC Funding Corporation Series 2019-1A Class D 144A | 3.94 | 7-20-2027 | 450,000 | 454,364 | ||||||||||||
Capital Automotive Real Estate Services Series 1A Class A6 144A | 3.81 | 2-15-2050 | 500,000 | 519,415 | ||||||||||||
Citigroup Commercial Mortgage Trust Series 2015-GC27 Class B | 3.77 | 2-10-2048 | 2,524,616 | 2,636,477 | ||||||||||||
CLI Funding LLC Series 2019-1A Class A 144A | 3.71 | 5-18-2044 | 867,579 | 883,110 | ||||||||||||
CLI Funding LLC Series 2019-1A Class B 144A | 4.64 | 5-18-2044 | 475,439 | 472,427 | ||||||||||||
Conn Funding II LP Series A Class A 144A | 3.40 | 10-16-2023 | 243,498 | 243,962 | ||||||||||||
Driven Brands Funding LLC Series 2019-2A Class A2 144A | 3.98 | 10-20-2049 | 794,000 | 820,520 | ||||||||||||
JPMorgan Mortgage Trust Series 2019-2 Class A3 144A±± | 4.00 | 8-25-2049 | 423,151 | 435,336 | ||||||||||||
Longtrain Leasing III LLC Series 2015-1A Class A2 144A | 4.06 | 1-15-2045 | 980,190 | 1,010,981 | ||||||||||||
Mosaic Solar Loans LLC Series 2019-2A Class A 144A | 2.88 | 9-20-2040 | 190,522 | 201,433 | ||||||||||||
Sequoia Mortgage Trust Series 2018-6 Class A19 144A±± | 4.00 | 7-25-2048 | 567,244 | 576,637 | ||||||||||||
Total Non-Agency Mortgage-Backed Securities (Cost $9,471,705) |
| 9,674,831 | ||||||||||||||
|
| |||||||||||||||
| Dividend yield | Shares | |||||||||||||||
| Preferred Stocks: 0.06% | ||||||||||||||||
Energy: 0.01% |
| |||||||||||||||
| Oil, Gas & Consumable Fuels: 0.01% | ||||||||||||||||
Petroleo Brasil SP ADR | 3.49 | 7,815 | 55,018 | |||||||||||||
|
| |||||||||||||||
Financials: 0.02% |
| |||||||||||||||
| Banks: 0.02% | ||||||||||||||||
Banco Bradesco SA | 11.19 | 14,854 | 51,339 | |||||||||||||
Itaúsa Investimentos Itaú SA | 7.36 | 38,600 | 60,485 | |||||||||||||
| 111,824 | ||||||||||||||||
|
| |||||||||||||||
The accompanying notes are an integral part of these financial statements.
Wells Fargo Diversified Income Builder Fund | 23
Table of Contents
Portfolio of investments—September 30, 2020
| Dividend yield | Shares | |||||||||||||||
| Diversified Financial Services: 0.00% | ||||||||||||||||
Banco BTG Pactual SA | 2.49 | % | 1,958 | $ | 5,927 | |||||||||||
|
| |||||||||||||||
Information Technology: 0.03% |
| |||||||||||||||
| Technology Hardware, Storage & Peripherals: 0.03% | ||||||||||||||||
Samsung Electronics Company Limited | 2.07 | 4,086 | 175,865 | |||||||||||||
|
| |||||||||||||||
Total Preferred Stocks (Cost $365,961) |
| 348,634 | ||||||||||||||
|
| |||||||||||||||
| Interest rate | Principal | |||||||||||||||
| Yankee Corporate Bonds and Notes: 9.97% | ||||||||||||||||
Financials: 7.36% |
| |||||||||||||||
| Banks: 4.14% | ||||||||||||||||
Barclays plc (USD Swap Semi Annual (vs. 3 Month LIBOR) 5 Year +4.84%) ±(s) | 7.75 | 9-15-2023 | $ | 2,160,000 | 2,231,928 | |||||||||||
Credit Agricole SA (USD Swap Semi Annual (vs. 3 Month LIBOR) 5 Year +4.90%) 144A± | 7.88 | 12-29-2049 | 1,750,000 | 1,933,750 | ||||||||||||
Credit Agricole SA (USD Swap Semi Annual (vs. 3 Month LIBOR) 5 Year +6.19%) 144A± | 8.13 | 12-29-2049 | 1,750,000 | 2,056,250 | ||||||||||||
Danske Bank AS (7 Year Treasury Constant Maturity +4.13%) ±(s) | 7.00 | 6-26-2025 | 2,300,000 | 2,478,250 | ||||||||||||
HSBC Holdings plc (USD ICE Swap Rate 11:00am NY 5 Y +4.37%) ± | 6.38 | 12-29-2049 | 2,000,000 | 2,093,370 | ||||||||||||
ING Groep NV (USD ICE Swap Rate 11:00am NY 5 Y +4.20%) ±(s) | 6.75 | 4-16-2024 | 3,800,000 | 4,018,500 | ||||||||||||
Lloyds Banking Group plc (USD Swap Semi Annual (vs. 3 Month LIBOR) 5 Year +4.76%) ±(s) | 7.50 | 6-27-2024 | 3,665,000 | 3,843,669 | ||||||||||||
Skandinaviska Enskilda Banken AB (5 Year Treasury Constant Maturity +3.46%) ±(s) | 5.13 | 5-13-2025 | 2,000,000 | 2,032,500 | ||||||||||||
Societe Generale SA (USD ICE Swap Rate 11:00am NY 5 Y +5.87%) 144A±(s) | 8.00 | 9-29-2025 | 3,535,000 | 3,945,944 | ||||||||||||
| 24,634,161 | ||||||||||||||||
|
| |||||||||||||||
| Capital Markets: 0.61% | ||||||||||||||||
Credit Suisse Group AG (USD Swap Semi Annual (vs. 3 Month LIBOR) 5 Year +4.60%) 144A± | 7.50 | 12-29-2049 | 2,395,000 | 2,610,550 | ||||||||||||
Credit Suisse Group AG (5 Year Treasury Constant Maturity +4.89%) 144A±(s) | 5.25 | 2-11-2027 | 1,000,000 | 1,002,000 | ||||||||||||
| 3,612,550 | ||||||||||||||||
|
| |||||||||||||||
| Diversified Financial Services: 2.61% | ||||||||||||||||
Tronox Finance plc 144A | 5.75 | 10-1-2025 | 12,000,000 | 11,820,000 | ||||||||||||
UBS Group Funding Switzerland AG (USD Swap Semi Annual (vs. 6 Month LIBOR) 5 Year +4.87%) ±(s) | 7.00 | 2-19-2025 | 3,330,000 | 3,700,463 | ||||||||||||
| 15,520,463 | ||||||||||||||||
|
| |||||||||||||||
Health Care: 1.08% |
| |||||||||||||||
| Pharmaceuticals: 1.08% | ||||||||||||||||
Bausch Health Companies Incorporated 144A | 5.25 | 1-30-2030 | 6,550,000 | 6,453,453 | ||||||||||||
|
| |||||||||||||||
Industrials: 0.68% |
| |||||||||||||||
| Electrical Equipment: 0.68% | ||||||||||||||||
Sensata Technologies BV 144A | 5.63 | 11-1-2024 | 3,750,000 | 4,068,750 | ||||||||||||
|
| |||||||||||||||
Information Technology: 0.68% |
| |||||||||||||||
| Technology Hardware, Storage & Peripherals: 0.68% | ||||||||||||||||
Seagate HDD 144A | 4.09 | 6-1-2029 | 1,908,000 | 2,062,194 | ||||||||||||
Seagate HDD | 4.88 | 6-1-2027 | 1,761,000 | 1,971,763 | ||||||||||||
| 4,033,957 | ||||||||||||||||
|
| |||||||||||||||
The accompanying notes are an integral part of these financial statements.
24 | Wells Fargo Diversified Income Builder Fund
Table of Contents
Portfolio of investments—September 30, 2020
| Interest rate | Maturity date | Principal | Value | |||||||||||||
| Materials: 0.17% | ||||||||||||||||
| Chemicals: 0.17% | ||||||||||||||||
Methanex Corporation | 5.13 | % | 10-15-2027 | $ | 1,000,000 | $ | 995,000 | |||||||||
|
| |||||||||||||||
Total Yankee Corporate Bonds and Notes (Cost $57,132,751) |
| 59,318,334 | ||||||||||||||
|
| |||||||||||||||
| Yield | Shares | |||||||||||||||
| Short-Term Investments: 4.11% | ||||||||||||||||
| Investment Companies: 4.11% | ||||||||||||||||
Wells Fargo Government Money Market Fund Select Class (l)(u) | 0.05 | 24,438,752 | 24,438,752 | |||||||||||||
|
| |||||||||||||||
Total Short-Term Investments (Cost $24,438,752) |
| 24,438,752 | ||||||||||||||
|
| |||||||||||||||
| Total investments in securities (Cost $543,131,097) | 96.72 | % | 575,395,358 | |||
Other assets and liabilities, net | 3.28 | 19,519,326 | ||||
|
|
| ||||
| Total net assets | 100.00 | % | $594,914,684 | |||
|
|
| ||||
| 144A | The security may be resold in transactions exempt from registration, normally to qualified institutional buyers, pursuant to Rule 144A under the Securities Act of 1933. |
| # | All or a portion of this security is segregated as collateral for investments in derivative instruments. |
| † | Non-income-earning security |
| ± | Variable rate investment. The rate shown is the rate in effect at period end. |
| (s) | Security is perpetual in nature and has no stated maturity date. The date shown reflects the next call date. |
| ¤ | The security is issued in zero coupon form with no periodic interest payments. |
| ±± | The coupon of the security is adjusted based on the principal and interest payments received from the underlying pool of mortgages as well as the credit quality and the actual prepayment speed of the underlying mortgages. |
| (l) | The issuer of the security is an affiliated person of the Fund as defined in the Investment Company Act of 1940. |
| (u) | The rate represents the 7-day annualized yield at period end. |
Abbreviations:
| ADR | American depositary receipt |
| EUR | Euro |
| GDR | Global depositary receipt |
| GO | General obligation |
| HEFAR | Higher Education Facilities Authority Revenue |
| LIBOR | London Interbank Offered Rate |
| PFA | Public Finance Authority |
| REIT | Real estate investment trust |
| SOFR | Secured Overnight Financing Rate |
Futures Contracts
| Description | Number of contracts | Expiration date | Notional cost | Notional value | Unrealized gains | Unrealized losses | ||||||||||||||||||
Long | ||||||||||||||||||||||||
Japanese Yen Futures | 152 | 12-14-2020 | $ | 18,155,187 | $ | 18,026,250 | $ | 0 | $ | (128,937 | ) | |||||||||||||
NASDAQ 100 E-Mini Index | 56 | 12-18-2020 | 12,374,786 | 12,776,120 | 401,334 | 0 | ||||||||||||||||||
Short | ||||||||||||||||||||||||
Nikkei 225 Index CME | (111) | 12-10-2020 | (12,772,885 | ) | (12,934,275 | ) | 0 | (161,390 | ) | |||||||||||||||
US Ultra Bond CBT | (111) | 12-21-2020 | (24,348,827 | ) | (24,621,188 | ) | 0 | (272,361 | ) | |||||||||||||||
|
|
|
| |||||||||||||||||||||
| $ | 401,334 | $ | (562,688 | ) | ||||||||||||||||||||
|
|
|
| |||||||||||||||||||||
The accompanying notes are an integral part of these financial statements.
Wells Fargo Diversified Income Builder Fund | 25
Table of Contents
Portfolio of investments—September 30, 2020
Forward Foreign Currency Contracts
Currency to be received | Currency to be delivered | Counterparty | Settlement date | Unrealized gains | Unrealized losses | |||||||||
| 11,884,430 USD | 10,000,000 EUR | Citibank | 12-31-2020 | $ | 133,832 | $ | 0 | |||||||
Written Options
| Description | Number of contracts | Notional amount | Exercise price | Expiration date | Value | |||||||||||||||
Call | ||||||||||||||||||||
iShares MSCI EAFE ETF | (565 | ) | $ | (3,757,250 | ) | $ | 66.50 | 10-2-2020 | $ | (1,695 | ) | |||||||||
iShares MSCI Emerging Markets ETF | (374 | ) | (1,739,100 | ) | 46.50 | 10-2-2020 | (748 | ) | ||||||||||||
iShares MSCI Emerging Markets ETF | (1,105 | ) | (5,248,750 | ) | 47.50 | 10-2-2020 | (1,105 | ) | ||||||||||||
NASDAQ 100 Stock Index | (4 | ) | (4,990,000 | ) | 12,475.00 | 10-2-2020 | (800 | ) | ||||||||||||
Russell 2000 Index | (1 | ) | (159,500 | ) | 1,595.00 | 10-2-2020 | (55 | ) | ||||||||||||
iShares MSCI EAFE ETF | (291 | ) | (1,935,150 | ) | 66.50 | 10-9-2020 | (1,601 | ) | ||||||||||||
iShares MSCI Emerging Markets ETF | (682 | ) | (3,069,000 | ) | 45.00 | 10-9-2020 | (13,640 | ) | ||||||||||||
S&P 500 Index | (15 | ) | (5,535,000 | ) | 3,690.00 | 10-9-2020 | (488 | ) | ||||||||||||
S&P 500 Index | (9 | ) | (3,105,000 | ) | 3,450.00 | 10-9-2020 | (9,945 | ) | ||||||||||||
Dow Jones Industrial Average | (65 | ) | (1,852,500 | ) | 285.00 | 10-16-2020 | (10,368 | ) | ||||||||||||
iShares MSCI EAFE ETF | (491 | ) | (3,289,700 | ) | 67.00 | 10-16-2020 | (4,910 | ) | ||||||||||||
iShares MSCI Emerging Markets ETF | (915 | ) | (4,209,000 | ) | 46.00 | 10-16-2020 | (9,150 | ) | ||||||||||||
NASDAQ 100 Stock Index | (1 | ) | (1,155,000 | ) | 11,550.00 | 10-16-2020 | (17,675 | ) | ||||||||||||
S&P 500 Index | (15 | ) | (5,422,500 | ) | 3,615.00 | 10-16-2020 | (3,713 | ) | ||||||||||||
S&P 500 Index | (8 | ) | (2,724,000 | ) | 3,405.00 | 10-16-2020 | (29,000 | ) | ||||||||||||
iShares MSCI EAFE ETF | (374 | ) | (2,412,300 | 64.50 | 10-23-2020 | (33,099 | ) | |||||||||||||
iShares MSCI Emerging Markets ETF | (1,635 | ) | (7,357,500 | ) | 45.00 | 10-23-2020 | (85,835 | ) | ||||||||||||
NASDAQ 100 Stock Index | (1 | ) | (1,177,500 | ) | 11,775.00 | 10-23-2020 | (15,260 | ) | ||||||||||||
S&P 500 Index | (1 | ) | (359,000 | ) | 3,590.00 | 10-23-2020 | (590 | ) | ||||||||||||
S&P 500 Index | (13 | ) | (4,394,000 | ) | 3,380.00 | 10-23-2020 | (76,700 | ) | ||||||||||||
|
| |||||||||||||||||||
| $ | (316,377 | ) | ||||||||||||||||||
|
| |||||||||||||||||||
Investments in Affiliates
An affiliated investment is an investment in which the Fund owns at least 5% of the outstanding voting shares of the issuer or as a result of other relationships, such as the Fund and the issuer having the same investment manager. Transactions with issuers that were either affiliated persons of the Fund at the beginning of the period or the end of the period were as follows:
Value, beginning of period | Purchases | Shares proceeds | Net realized gains (losses) | Net change in unrealized gains (losses) | Income from affiliated securities | Value, end of | % of net assets | |||||||||||||||||||||||||
| Short-Term Investments | ||||||||||||||||||||||||||||||||
Investment Companies | ||||||||||||||||||||||||||||||||
Wells Fargo Government Money Market Fund Select Class | $ | 19,875,845 | $ | 242,730,888 | $ | (238,167,981 | ) | $ | 0 | $ | 0 | $ | 234,742 | $ | 24,438,752 | 4.11 | % | |||||||||||||||
The accompanying notes are an integral part of these financial statements.
26 | Wells Fargo Diversified Income Builder Fund
Table of Contents
Statement of assets and liabilities—September 30, 2020
Assets | ||||
Investments in unaffiliated securities, at value (cost $518,692,345) | $ | 550,956,606 | ||
Investments in affiliated securities, at value (cost $24,438,752) | 24,438,752 | |||
Cash | 13,824 | |||
Cash segregated at broker for futures contracts | 2,760,534 | |||
Cash segregated at broker for forward foreign currency contracts | 910,000 | |||
Receivable for investments sold | 10,614,086 | |||
Receivable for Fund shares sold | 322,814 | |||
Receivable for dividends and interest | 5,694,554 | |||
Unrealized gains on forward foreign currency contracts | 133,832 | |||
Receivable for daily variation margin on open futures contracts | 439,389 | |||
Receivable for securities lending income, net | 287 | |||
Prepaid expenses and other assets | 273,796 | |||
|
| |||
Total assets | 596,558,474 | |||
|
| |||
Liabilities | ||||
Payable for investments purchased | 9,301 | |||
Payable for Fund shares redeemed | 966,026 | |||
Overdraft due to custodian bank, foreign currency, at value (cost $104,636) | 104,657 | |||
Written options, at value (premiums received $461,841) | 316,377 | |||
Management fee payable | 86,507 | |||
Administration fees payable | 86,053 | |||
Distribution fee payable | 72,165 | |||
Trustees’ fees and expenses payable | 2,704 | |||
|
| |||
Total liabilities | 1,643,790 | |||
|
| |||
Total net assets | $ | 594,914,684 | ||
|
| |||
Net assets consist of | ||||
Paid-in capital | $ | 612,403,270 | ||
Total distributable loss | (17,488,586 | ) | ||
|
| |||
Total net assets | $ | 594,914,684 | ||
|
| |||
Computation of net asset value and offering price per share | ||||
Net assets – Class A | $ | 213,550,678 | ||
Shares outstanding – Class A1 | 35,879,888 | |||
Net asset value per share – Class A | $5.95 | |||
Maximum offering price per share – Class A2 | $6.31 | |||
Net assets – Class C | $ | 115,928,689 | ||
Shares outstanding – Class C1 | 19,427,438 | |||
Net asset value per share – Class C | $5.97 | |||
Net assets – Class R6 | $ | 2,604,634 | ||
Shares outstanding – Class R61 | 448,525 | |||
Net asset value per share – Class R6 | $5.81 | |||
Net assets – Administrator Class | $ | 7,867,581 | ||
Shares outstanding – Administrator Class1 | 1,354,906 | |||
Net asset value per share – Administrator Class | $5.81 | |||
Net assets – Institutional Class | $ | 254,963,102 | ||
Shares outstanding – Institutional Class1 | 43,954,196 | |||
Net asset value per share – Institutional Class | $5.80 | |||
| 1 | The Fund has an unlimited number of authorized shares. |
| 2 | Maximum offering price is computed as 100/94.25 of net asset value. On investments of $50,000 or more, the offering price is reduced. |
The accompanying notes are an integral part of these financial statements.
Wells Fargo Diversified Income Builder Fund | 27
Table of Contents
Statement of operations—year ended September 30, 2020
Investment income | ||||
Interest | $ | 22,537,297 | ||
Dividends (net of foreign withholding taxes of $206,839) | 6,373,071 | |||
Income from affiliated securities | 234,742 | |||
|
| |||
Total investment income | 29,145,110 | |||
|
| |||
Expenses | ||||
Management fee | 3,642,901 | |||
Administration fees |
| |||
Class A | 495,491 | |||
Class C | 274,841 | |||
Class R6 | 566 | |||
Administrator Class | 12,666 | |||
Institutional Class | 379,106 | |||
Shareholder servicing fees |
| |||
Class A | 589,129 | |||
Class C | 326,830 | |||
Administrator Class | 24,326 | |||
Distribution fee |
| |||
Class C | 980,500 | |||
Custody and accounting fees | 108,169 | |||
Professional fees | 65,006 | |||
Registration fees | 100,349 | |||
Shareholder report expenses | 100,635 | |||
Trustees’ fees and expenses | 21,260 | |||
Interest expense | 259 | |||
Other fees and expenses | 48,544 | |||
|
| |||
Total expenses | 7,170,578 | |||
Less: Fee waivers and/or expense reimbursements |
| |||
Fund-level | (1,472,103 | ) | ||
Class A | (6,960 | ) | ||
Class C | (17 | ) | ||
|
| |||
Net expenses | 5,691,498 | |||
|
| |||
Net investment income | 23,453,612 | |||
|
| |||
Realized and unrealized gains (losses) on investments | ||||
Net realized gains (losses) on |
| |||
Unaffiliated securities | (27,825,844 | ) | ||
Futures contracts | 928,543 | |||
Forward foreign currency contracts | (958,736 | ) | ||
Written options | 1,421,587 | |||
|
| |||
Net realized losses on investments | (26,434,450 | ) | ||
|
| |||
Net change in unrealized gains (losses) on |
| |||
Unaffiliated securities | 3,443,013 | |||
Futures contracts | (260,045 | ) | ||
Forward foreign currency contracts | (279,152 | ) | ||
Written options | 145,464 | |||
|
| |||
Net change in unrealized gains (losses) on investments | 3,049,280 | |||
|
| |||
Net realized and unrealized gains (losses) on investments | (23,385,170 | ) | ||
|
| |||
Net increase in net assets resulting from operations | $ | 68,442 | ||
|
| |||
The accompanying notes are an integral part of these financial statements.
28 | Wells Fargo Diversified Income Builder Fund
Table of Contents
Statement of changes in net assets
| Year ended September 30, 2020 | Year ended September 30, 2019 | |||||||||||||||
Operations |
| |||||||||||||||
Net investment income | $ | 23,453,612 | $ | 25,931,305 | ||||||||||||
Net realized losses on investments | (26,434,450 | ) | (23,328,410 | ) | ||||||||||||
Net change in unrealized gains (losses) on investments | 3,049,280 | 22,911,044 | ||||||||||||||
|
| |||||||||||||||
Net increase in net assets resulting from operations | 68,442 | 25,513,939 | ||||||||||||||
|
| |||||||||||||||
Distributions to shareholders from net investment income and net realized gains | ||||||||||||||||
Class A | (7,974,881 | ) | (19,291,628 | ) | ||||||||||||
Class C | (3,442,983 | ) | (11,757,683 | ) | ||||||||||||
Class R6 | (73,583 | ) | (2,192 | ) | ||||||||||||
Administrator Class | (348,382 | ) | (2,015,528 | ) | ||||||||||||
Institutional Class | (11,069,027 | ) | (26,837,985 | ) | ||||||||||||
|
| |||||||||||||||
Total distributions to shareholders | (22,908,856 | ) | (59,905,016 | ) | ||||||||||||
|
| |||||||||||||||
Capital share transactions | Shares | Shares | ||||||||||||||
Proceeds from shares sold |
| |||||||||||||||
Class A | 8,052,563 | 48,385,274 | 15,741,839 | 94,086,277 | ||||||||||||
Class C | 3,953,049 | 23,706,227 | 6,522,568 | 38,947,259 | ||||||||||||
Class R6 | 841,991 | 4,847,478 | 0 | 0 | ||||||||||||
Administrator Class | 355,491 | 2,049,792 | 729,093 | 4,244,341 | ||||||||||||
Institutional Class | 14,351,208 | 83,589,460 | 22,831,336 | 132,583,652 | ||||||||||||
|
| |||||||||||||||
| 162,578,231 | 269,861,529 | |||||||||||||||
|
| |||||||||||||||
Reinvestment of distributions |
| |||||||||||||||
Class A | 1,272,184 | 7,483,676 | 3,135,334 | 18,209,570 | ||||||||||||
Class C | 528,297 | 3,114,940 | 1,853,575 | 10,728,732 | ||||||||||||
Class R6 | 12,784 | 72,670 | 0 | 0 | ||||||||||||
Administrator Class | 51,332 | 294,574 | 322,489 | 1,815,085 | ||||||||||||
Institutional Class | 1,568,325 | 8,983,878 | 3,849,831 | 21,832,218 | ||||||||||||
|
| |||||||||||||||
| 19,949,738 | 52,585,605 | |||||||||||||||
|
| |||||||||||||||
Payment for shares redeemed |
| |||||||||||||||
Class A | (14,997,369 | ) | (86,951,189 | ) | (13,852,338 | ) | (82,279,885 | ) | ||||||||
Class C | (8,233,132 | ) | (47,960,287 | ) | (11,490,423 | ) | (68,292,199 | ) | ||||||||
Class R6 | (410,302 | ) | (2,237,315 | ) | 0 | 0 | ||||||||||
Administrator Class | (1,068,453 | ) | (6,052,620 | ) | (4,353,482 | ) | (24,635,205 | ) | ||||||||
Institutional Class | (24,780,617 | ) | (137,999,151 | ) | (28,099,288 | ) | (162,899,174 | ) | ||||||||
|
| |||||||||||||||
| (281,200,562 | ) | (338,106,463 | ) | |||||||||||||
|
| |||||||||||||||
Net decrease in net assets resulting from capital share transactions | (98,672,593 | ) | (15,659,329 | ) | ||||||||||||
|
| |||||||||||||||
Total decrease in net assets | (121,513,007 | ) | (50,050,406 | ) | ||||||||||||
|
| |||||||||||||||
Net assets | ||||||||||||||||
Beginning of period | 716,427,691 | 766,478,097 | ||||||||||||||
|
| |||||||||||||||
End of period | $ | 594,914,684 | $ | 716,427,691 | ||||||||||||
|
| |||||||||||||||
The accompanying notes are an integral part of these financial statements.
Wells Fargo Diversified Income Builder Fund | 29
Table of Contents
(For a share outstanding throughout each period)
| Year ended September 30 | ||||||||||||||||||||
| CLASS A | 2020 | 2019 | 2018 | 2017 | 2016 | |||||||||||||||
Net asset value, beginning of period | $6.06 | $6.33 | $6.42 | $6.13 | $5.71 | |||||||||||||||
Net investment income | 0.21 | 0.22 | 0.21 | 0.20 | 0.20 | |||||||||||||||
Net realized and unrealized gains (losses) on investments | (0.12 | ) | 0.02 | (0.01 | ) | 0.35 | 0.64 | |||||||||||||
|
|
|
|
|
|
|
|
|
| |||||||||||
Total from investment operations | 0.09 | 0.24 | 0.20 | 0.55 | 0.84 | |||||||||||||||
Distributions to shareholders from | ||||||||||||||||||||
Net investment income | (0.20 | ) | (0.23 | ) | (0.19 | ) | (0.22 | ) | (0.21 | ) | ||||||||||
Net realized gains | 0.00 | (0.28 | ) | (0.10 | ) | (0.04 | ) | (0.21 | ) | |||||||||||
|
|
|
|
|
|
|
|
|
| |||||||||||
Total distributions to shareholders | (0.20 | ) | (0.51 | ) | (0.29 | ) | (0.26 | ) | (0.42 | ) | ||||||||||
Net asset value, end of period | $5.95 | $6.06 | $6.33 | $6.42 | $6.13 | |||||||||||||||
Total return1 | 1.59 | % | 4.51 | % | 3.23 | % | 9.16 | % | 15.39 | % | ||||||||||
Ratios to average net assets (annualized) | ||||||||||||||||||||
Gross expenses | 1.07 | % | 1.05 | % | 1.04 | % | 1.05 | % | 1.08 | % | ||||||||||
Net expenses | 0.85 | % | 0.85 | % | 0.90 | % | 1.05 | % | 1.08 | % | ||||||||||
Net investment income | 3.50 | % | 3.75 | % | 3.34 | % | 3.29 | % | 3.55 | % | ||||||||||
Supplemental data | ||||||||||||||||||||
Portfolio turnover rate | 39 | % | 43 | % | 50 | % | 29 | % | 38 | % | ||||||||||
Net assets, end of period (000s omitted) | $213,551 | $251,673 | $231,176 | $220,977 | $154,496 | |||||||||||||||
| 1 | Total return calculations do not include any sales charges. |
The accompanying notes are an integral part of these financial statements.
30 | Wells Fargo Diversified Income Builder Fund
Table of Contents
Financial highlights
(For a share outstanding throughout each period)
| Year ended September 30 | ||||||||||||||||||||
| CLASS C | 2020 | 2019 | 2018 | 2017 | 2016 | |||||||||||||||
Net asset value, beginning of period | $6.07 | $6.34 | $6.44 | $6.14 | $5.72 | |||||||||||||||
Net investment income | 0.17 | 0.18 | 0.17 | 0.16 | 0.16 | 1 | ||||||||||||||
Net realized and unrealized gains (losses) on investments | (0.11 | ) | 0.02 | (0.02 | ) | 0.35 | 0.63 | |||||||||||||
|
|
|
|
|
|
|
|
|
| |||||||||||
Total from investment operations | 0.06 | 0.20 | 0.15 | 0.51 | 0.79 | |||||||||||||||
Distributions to shareholders from | ||||||||||||||||||||
Net investment income | (0.16 | ) | (0.19 | ) | (0.15 | ) | (0.17 | ) | (0.16 | ) | ||||||||||
Net realized gains | 0.00 | (0.28 | ) | (0.10 | ) | (0.04 | ) | (0.21 | ) | |||||||||||
|
|
|
|
|
|
|
|
|
| |||||||||||
Total distributions to shareholders | (0.16 | ) | (0.47 | ) | (0.25 | ) | (0.21 | ) | (0.37 | ) | ||||||||||
Net asset value, end of period | $5.97 | $6.07 | $6.34 | $6.44 | $6.14 | |||||||||||||||
Total return2 | 0.98 | % | 3.71 | % | 2.32 | % | 8.51 | % | 14.51 | % | ||||||||||
Ratios to average net assets (annualized) | ||||||||||||||||||||
Gross expenses | 1.82 | % | 1.80 | % | 1.79 | % | 1.80 | % | 1.83 | % | ||||||||||
Net expenses | 1.60 | % | 1.60 | % | 1.65 | % | 1.80 | % | 1.83 | % | ||||||||||
Net investment income | 2.75 | % | 2.99 | % | 2.59 | % | 2.54 | % | 2.80 | % | ||||||||||
Supplemental data | ||||||||||||||||||||
Portfolio turnover rate | 39 | % | 43 | % | 50 | % | 29 | % | 38 | % | ||||||||||
Net assets, end of period (000s omitted) | $115,929 | $140,722 | $166,750 | $165,513 | $129,856 | |||||||||||||||
| 1 | Calculated based upon average shares outstanding |
| 2 | Total return calculations do not include any sales charges. |
The accompanying notes are an integral part of these financial statements.
Wells Fargo Diversified Income Builder Fund | 31
Table of Contents
Financial highlights
(For a share outstanding throughout each period)
| Year ended September 30 | ||||||||||||
| CLASS R6 | 2020 | 2019 | 20181 | |||||||||
Net asset value, beginning of period | $5.91 | $6.18 | $6.17 | |||||||||
Net investment income | 0.22 | 0.24 | 2 | 0.02 | 2 | |||||||
Net realized and unrealized gains (losses) on investments | (0.09 | ) | 0.03 | 0.02 | ||||||||
|
|
|
|
|
| |||||||
Total from investment operations | 0.13 | 0.27 | 0.04 | |||||||||
Distributions to shareholders from | ||||||||||||
Net investment income | (0.23 | ) | (0.26 | ) | (0.03 | ) | ||||||
Net realized gains | 0.00 | (0.28 | ) | 0.00 | ||||||||
|
|
|
|
|
| |||||||
Total distributions to shareholders | (0.23 | ) | (0.54 | ) | (0.03 | ) | ||||||
Net asset value, end of period | $5.81 | $5.91 | $6.18 | |||||||||
Total return3 | 2.25 | % | 5.07 | % | 0.71 | % | ||||||
Ratios to average net assets (annualized) | ||||||||||||
Gross expenses | 0.64 | % | 0.61 | % | 0.64 | % | ||||||
Net expenses | 0.42 | % | 0.42 | % | 0.41 | % | ||||||
Net investment income | 3.89 | % | 4.17 | % | 2.31 | % | ||||||
Supplemental data | ||||||||||||
Portfolio turnover rate | 39 | % | 43 | % | 50 | % | ||||||
Net assets, end of period (000s omitted) | $2,605 | $24 | $25 | |||||||||
| 1 | For the period from July 31, 2018 (commencement of class operations) to September 30, 2018 |
| 2 | Calculated based upon average shares outstanding |
| 3 | Returns for periods of less than one year are not annualized. |
The accompanying notes are an integral part of these financial statements.
32 | Wells Fargo Diversified Income Builder Fund
Table of Contents
Financial highlights
(For a share outstanding throughout each period)
| Year ended September 30 | ||||||||||||||||||||
| ADMINISTRATOR CLASS | 2020 | 2019 | 2018 | 2017 | 2016 | |||||||||||||||
Net asset value, beginning of period | $5.91 | $6.19 | $6.29 | $6.00 | $5.60 | |||||||||||||||
Net investment income | 0.21 | 1 | 0.22 | 1 | 0.21 | 1 | 0.21 | 1 | 0.21 | 1 | ||||||||||
Net realized and unrealized gains (losses) on investments | (0.10 | ) | 0.02 | (0.01 | ) | 0.34 | 0.61 | |||||||||||||
|
|
|
|
|
|
|
|
|
| |||||||||||
Total from investment operations | 0.11 | 0.24 | 0.20 | 0.55 | 0.82 | |||||||||||||||
Distributions to shareholders from | ||||||||||||||||||||
Net investment income | (0.21 | ) | (0.24 | ) | (0.20 | ) | (0.22 | ) | (0.21 | ) | ||||||||||
Net realized gains | 0.00 | (0.28 | ) | (0.10 | ) | (0.04 | ) | (0.21 | ) | |||||||||||
|
|
|
|
|
|
|
|
|
| |||||||||||
Total distributions to shareholders | (0.21 | ) | (0.52 | ) | (0.30 | ) | (0.26 | ) | (0.42 | ) | ||||||||||
Net asset value, end of period | $5.81 | $5.91 | $6.19 | $6.29 | $6.00 | |||||||||||||||
Total return | 1.89 | % | 4.52 | % | 3.21 | % | 9.45 | % | 15.45 | % | ||||||||||
Ratios to average net assets (annualized) | ||||||||||||||||||||
Gross expenses | 0.99 | % | 0.97 | % | 0.96 | % | 0.97 | % | 1.00 | % | ||||||||||
Net expenses | 0.77 | % | 0.77 | % | 0.81 | % | 0.90 | % | 0.90 | % | ||||||||||
Net investment income | 3.57 | % | 3.77 | % | 3.40 | % | 3.51 | % | 3.72 | % | ||||||||||
Supplemental data | ||||||||||||||||||||
Portfolio turnover rate | 39 | % | 43 | % | 50 | % | 29 | % | 38 | % | ||||||||||
Net assets, end of period (000s omitted) | $7,868 | $11,916 | $32,938 | $41,975 | $70,051 | |||||||||||||||
| 1 | Calculated based upon average shares outstanding |
The accompanying notes are an integral part of these financial statements.
Wells Fargo Diversified Income Builder Fund | 33
Table of Contents
Financial highlights
(For a share outstanding throughout each period)
| Year ended September 30 | ||||||||||||||||||||
| INSTITUTIONAL CLASS | 2020 | 2019 | 2018 | 2017 | 2016 | |||||||||||||||
Net asset value, beginning of period | $5.91 | $6.19 | $6.28 | $6.00 | $5.59 | |||||||||||||||
Net investment income | 0.22 | 1 | 0.24 | 0.23 | 0.24 | 0.23 | ||||||||||||||
Net realized and unrealized gains (losses) on investments | (0.11 | ) | 0.01 | (0.01 | ) | 0.31 | 0.61 | |||||||||||||
|
|
|
|
|
|
|
|
|
| |||||||||||
Total from investment operations | 0.11 | 0.25 | 0.22 | 0.55 | 0.84 | |||||||||||||||
Distributions to shareholders from | ||||||||||||||||||||
Net investment income | (0.22 | ) | (0.25 | ) | (0.21 | ) | (0.23 | ) | (0.22 | ) | ||||||||||
Net realized gains | 0.00 | (0.28 | ) | (0.10 | ) | (0.04 | ) | (0.21 | ) | |||||||||||
|
|
|
|
|
|
|
|
|
| |||||||||||
Total distributions to shareholders | (0.22 | ) | (0.53 | ) | (0.31 | ) | (0.27 | ) | (0.43 | ) | ||||||||||
Net asset value, end of period | $5.80 | $5.91 | $6.19 | $6.28 | $6.00 | |||||||||||||||
Total return | 1.98 | % | 4.80 | % | 3.62 | % | 9.49 | % | 15.88 | % | ||||||||||
Ratios to average net assets (annualized) | ||||||||||||||||||||
Gross expenses | 0.74 | % | 0.72 | % | 0.71 | % | 0.72 | % | 0.75 | % | ||||||||||
Net expenses | 0.52 | % | 0.52 | % | 0.57 | % | 0.71 | % | 0.71 | % | ||||||||||
Net investment income | 3.83 | % | 4.07 | % | 3.67 | % | 3.60 | % | 3.92 | % | ||||||||||
Supplemental data | ||||||||||||||||||||
Portfolio turnover rate | 39 | % | 43 | % | 50 | % | 29 | % | 38 | % | ||||||||||
Net assets, end of period (000s omitted) | $254,963 | $312,093 | $335,589 | $315,413 | $124,116 | |||||||||||||||
| 1 | Calculated based upon average shares outstanding |
The accompanying notes are an integral part of these financial statements.
34 | Wells Fargo Diversified Income Builder Fund
Table of Contents
1. ORGANIZATION
Wells Fargo Funds Trust (the “Trust”), a Delaware statutory trust organized on March 10, 1999, is an open-end management investment company registered under the Investment Company Act of 1940, as amended (the “1940 Act”). As an investment company, the Trust follows the accounting and reporting guidance in Financial Accounting Standards Board (“FASB”) Accounting Standards Codification Topic 946, Financial Services – Investment Companies. These financial statements report on the Wells Fargo Diversified Income Builder Fund (the “Fund”) which is a diversified series of the Trust.
2. SIGNIFICANT ACCOUNTING POLICIES
The following significant accounting policies, which are consistently followed in the preparation of the financial statements of the Fund, are in conformity with U.S. generally accepted accounting principles which require management to make estimates and assumptions that affect the reported amounts of assets and liabilities, disclosure of contingent assets and liabilities at the date of the financial statements, and the reported amounts of revenues and expenses during the reporting period. Actual results could differ from those estimates.
Securities valuation
All investments are valued each business day as of the close of regular trading on the New York Stock Exchange (generally 4 p.m. Eastern Time), although the Fund may deviate from this calculation time under unusual or unexpected circumstances.
Debt securities are valued at the evaluated bid price provided by an independent pricing service (e.g. taking into account various factors, including yields, maturities, or credit ratings) or, if a reliable price is not available, the quoted bid price from an independent broker-dealer.
Equity securities, options, and futures contracts that are listed on a foreign or domestic exchange or market are valued at the official closing price or, if none, the last sales price. If no sale occurs on the principal exchange or market that day, a fair value price will be determined in accordance with the Fund’s Valuation Procedures.
Forward foreign currency contracts are recorded at the forward rate provided by an independent foreign currency pricing source at a time each business day specified by the Wells Fargo Asset Management Pricing Committee at Wells Fargo Funds Management, LLC (“Funds Management”).
The values of securities denominated in foreign currencies are translated into U.S. dollars at rates provided by an independent foreign currency pricing source at a time each business day specified by the Wells Fargo Asset Management Pricing Committee.
Many securities markets and exchanges outside the U.S. close prior to the close of the New York Stock Exchange and therefore may not fully reflect trading or events that occur after the close of the principal exchange in which the foreign securities are traded, but before the close of the New York Stock Exchange. If such trading or events are expected to materially affect the value of such securities, then fair value pricing procedures approved by the Board of Trustees of the Fund are applied. These procedures take into account multiple factors including movements in U.S. securities markets after foreign exchanges close. Foreign securities that are fair valued under these procedures are categorized as Level 2 and the application of these procedures may result in transfers between Level 1 and Level 2. Depending on market activity, such fair valuations may be frequent. Such fair value pricing may result in net asset values that are higher or lower than net asset values based on the last reported sales price or latest quoted bid price. On September 30, 2020, such fair value pricing was used in pricing certain foreign securities.
Investments in registered open-end investment companies are valued at net asset value. Interests in non-registered investment companies that are redeemable at net asset value are fair valued normally at net asset value.
Investments which are not valued using any of the methods discussed above are valued at their fair value, as determined in good faith by the Board of Trustees. The Board of Trustees has established a Valuation Committee comprised of the Trustees and has delegated to it the authority to take any actions regarding the valuation of portfolio securities that the Valuation Committee deems necessary or appropriate, including determining the fair value of portfolio securities, unless the determination has been delegated to the Wells Fargo Asset Management Pricing Committee. The Board of Trustees retains the authority to make or ratify any valuation decisions or approve any changes to the Valuation Procedures as it deems appropriate. On a quarterly basis, the Board of Trustees receives reports on any valuation actions taken by the Valuation Committee or the Wells Fargo Asset Management Pricing Committee which may include items for ratification.
Foreign currency translation
The accounting records of the Fund are maintained in U.S. dollars. The values of other assets and liabilities denominated in foreign currencies are translated into U.S. dollars at rates provided by an independent foreign currency pricing source at a time each business day specified by the Wells Fargo Asset Management Pricing Committee. Purchases and sales of securities, and income and expenses are converted at the rate of exchange on the respective dates of such transactions. Net realized foreign
Wells Fargo Diversified Income Builder Fund | 35
Table of Contents
Notes to financial statements
exchange gains or losses arise from sales of foreign currencies, currency gains or losses realized between the trade and settlement dates on securities transactions, and the difference between the amounts of dividends, interest and foreign withholding taxes recorded and the U.S. dollar equivalent of the amounts actually paid or received. Net unrealized foreign exchange gains and losses arise from changes in the fair value of assets and liabilities other than investments in securities resulting from changes in exchange rates. The changes in net assets arising from changes in exchange rates of securities and the changes in net assets resulting from changes in market prices of securities are not separately presented. Such changes are included in net realized and unrealized gains or losses from investments.
Forward foreign currency contracts
A forward foreign currency contract is an agreement between two parties to purchase or sell a specific currency for an agreed-upon price at a future date. The Fund enters into forward foreign currency contracts to facilitate transactions in foreign-denominated securities and to attempt to minimize the risk to the Fund from adverse changes in the relationship between currencies. Forward foreign currency contracts are recorded at the forward rate and marked-to-market daily. When the contracts are closed, realized gains and losses arising from such transactions are recorded as realized gains or losses on forward foreign currency contracts. The Fund is subject to foreign currency risk and may be exposed to risks if the counterparties to the contracts are unable to meet the terms of their contracts or if the value of the foreign currency changes unfavorably. The Fund’s maximum risk of loss from counterparty credit risk is the unrealized gains on the contracts. This risk may be mitigated if there is a master netting arrangement between the Fund and the counterparty.
Futures contracts
Futures contracts are agreements between the Fund and a counterparty to buy or sell a specific amount of a commodity, financial instrument or currency at a specified price and on a specified date. The Fund may buy and sell futures contracts in order to gain exposure to, or protect against, changes in interest rates, security values, and foreign exchange rates and is subject to interest rate risk, equity price risk, and foreign currency risk. The primary risks associated with the use of futures contracts are the imperfect correlation between changes in market values of securities held by the Fund and the prices of futures contracts, and the possibility of an illiquid market. Futures contracts are generally entered into on a regulated futures exchange and cleared through a clearinghouse associated with the exchange. With futures contracts, there is minimal counterparty risk to the Fund since futures contracts are exchange traded and the exchange’s clearinghouse, as the counterparty to all exchange traded futures, guarantees the futures contracts against default.
Upon entering into a futures contracts, the Fund is required to deposit either cash or securities (initial margin) with the broker in an amount equal to a certain percentage of the contract value. Subsequent payments (variation margin) are paid to or from the broker each day equal to the daily changes in the contract value. Such payments are recorded as unrealized gains or losses and, if any, shown as variation margin receivable (payable) in the Statement of Assets and Liabilities. Should the Fund fail to make requested variation margin payments, the broker can gain access to the initial margin to satisfy the Fund’s payment obligations. When the contracts are closed, a realized gain or loss is recorded in the Statement of Operations.
Options
The Fund may write covered call options or secured put options on individual securities and/or indexes. When the Fund writes an option, an amount equal to the premium received is recorded as a liability and is subsequently adjusted to the current market value of the written option. Premiums received from written options that expire unexercised are recognized as realized gains on the expiration date. For exercised options, the difference between the premium received and the amount paid on effecting a closing purchase transaction, including brokerage commissions, is treated as a realized gain or loss. If a call option is exercised, the premium is added to the proceeds from the sale of the underlying security in calculating the realized gain or loss on the sale. If a put option is exercised, the premium reduces the cost of the security purchased. The Fund, as a writer of an option, bears the market risk of an unfavorable change in the price of the security and/or index underlying the written option.
The Fund may also purchase call or put options. Premiums paid are included in the Statement of Assets and Liabilities as investments, the values of which are subsequently adjusted based on the current market values of the options. Premiums paid for purchased options that expire are recognized as realized losses on the expiration date. Premiums paid for purchased options that are exercised or closed are added to the amount paid or offset against the proceeds received for the underlying security to determine the realized gain or loss. The risk of loss associated with purchased options is limited to the premium paid.
Options traded on an exchange are regulated and terms of the options are standardized. The Fund is subject to equity price risk. Purchased options traded over-the-counter expose the Fund to counterparty risk in the event the counterparty does not perform. This risk can be mitigated by having a master netting arrangement between the Fund and the counterparty and by having the counterparty post collateral to cover the Fund’s exposure to the counterparty.
36 | Wells Fargo Diversified Income Builder Fund
Table of Contents
Notes to financial statements
Security transactions and income recognition
Securities transactions are recorded on a trade date basis. Realized gains or losses are recorded on the basis of identified cost.
Interest income is accrued daily and bond discounts are accreted and premiums are amortized daily. To the extent debt obligations are placed on non-accrual status, any related interest income may be reduced by writing off interest receivables when the collection of all or a portion of interest has been determined to be doubtful based on consistently applied procedures and the fair value has decreased. If the issuer subsequently resumes interest payments or when the collectability of interest is reasonably assured, the debt obligation is removed from non-accrual status.
Dividend income is recognized on the ex-dividend date, except for certain dividends from foreign securities, which are recorded as soon as the custodian verifies the ex-dividend date. Dividend income from foreign securities is recorded net of foreign taxes withheld where recovery of such taxes is not assured.
Income dividends and capital gain distributions from investment companies are recorded on the ex-dividend date. Capital gain distributions from investment companies are treated as realized gains.
Distributions to shareholders
Distributions to shareholders are recorded on the ex-dividend date and paid from net investment income monthly and any net realized gains are paid at least annually. Such distributions are determined in accordance with income tax regulations and may differ from U.S. generally accepted accounting principles. Dividend sources are estimated at the time of declaration. The tax character of distributions is determined as of the Fund’s fiscal year end. Therefore, a portion of the Fund’s distributions made prior to the Fund’s fiscal year end may be categorized as a tax return of capital at year end.
Federal and other taxes
The Fund intends to continue to qualify as a regulated investment company by distributing substantially all of its investment company taxable income and any net realized capital gains (after reduction for capital loss carryforwards) sufficient to relieve it from all, or substantially all, federal income taxes. Accordingly, no provision for federal income taxes was required.
The Fund’s income and federal excise tax returns and all financial records supporting those returns for the prior three fiscal years are subject to examination by the federal and Delaware revenue authorities. Management has analyzed the Fund’s tax positions taken on federal, state, and foreign tax returns for all open tax years and does not believe that there are any uncertain tax positions that require recognition of a tax liability.
As of September 30, 2020, the aggregate cost of all investments for federal income tax purposes was $545,338,539 and the unrealized gains (losses) consisted of:
Gross unrealized gains | $ | 39,636,039 | ||
Gross unrealized losses | (9,461,278 | ) | ||
Net unrealized gains | $ | 30,174,761 | ||
Reclassifications are made to the Fund’s capital accounts for permanent tax differences to reflect income and gains available for distribution (or available capital loss carryforwards) under federal income tax regulations. U.S. generally accepted accounting principles require that certain components of net assets be adjusted to reflect permanent differences between financial and tax reporting. These reclassifications have no effect on net assets or net asset values per share. At September 30, 2020, as a result of permanent book-to-tax differences, the following reclassification adjustments were made on the Statement of Assets and Liabilities:
| Paid-in capital | Total distributable loss | |
| $(139,502) | $139,502 | |
As of September 30, 2020, the Fund had capital loss carryforwards which consist of $20,392,779 in short-term capital losses and $29,814,193 in long-term capital losses.
Class allocations
The separate classes of shares offered by the Fund differ principally in applicable sales charges, distribution, shareholder servicing, and administration fees. Class specific expenses are charged directly to that share class. Investment income, common fund-level expenses, and realized and unrealized gains (losses) on investments are allocated daily to each class of shares based on the relative proportion of net assets of each class.
3. FAIR VALUATION MEASUREMENTS
Fair value measurements of investments are determined within a framework that has established a fair value hierarchy based upon the various data inputs utilized in determining the value of the Fund’s investments. The three-level hierarchy gives the
Wells Fargo Diversified Income Builder Fund | 37
Table of Contents
Notes to financial statements
highest priority to unadjusted quoted prices in active markets for identical assets or liabilities (Level 1) and the lowest priority to unobservable inputs (Level 3). The Fund’s investments are classified within the fair value hierarchy based on the lowest level of input that is significant to the fair value measurement. The inputs are summarized into three broad levels as follows:
| ∎ | Level 1 – quoted prices in active markets for identical securities |
| ∎ | Level 2 – other significant observable inputs (including quoted prices for similar securities, interest rates, prepayment speeds, credit risk, etc.) |
| ∎ | Level 3 – significant unobservable inputs (including the Fund’s own assumptions in determining the fair value of investments) |
The inputs or methodologies used for valuing investments in securities are not necessarily an indication of the risk associated with investing in those securities.
The following is a summary of the inputs used in valuing the Fund’s assets and liabilities as of September 30, 2020:
| Quoted prices (Level 1) | Other significant observable inputs (Level 2) | Significant (Level 3) | Total | |||||||||||||
Assets | ||||||||||||||||
Investments in: | ||||||||||||||||
Asset-backed securities | $ | 0 | $ | 9,526,830 | $ | 0 | $ | 9,526,830 | ||||||||
Common stocks | ||||||||||||||||
Communication services | 3,150,530 | 2,986,848 | 0 | 6,137,378 | ||||||||||||
Consumer discretionary | 4,870,064 | 2,621,421 | 0 | 7,491,485 | ||||||||||||
Consumer staples | 2,870,459 | 2,178,854 | 0 | 5,049,313 | ||||||||||||
Energy | 754,273 | 921,545 | 0 | 1,675,818 | ||||||||||||
Financials | 7,417,633 | 3,512,675 | 0 | 10,930,308 | ||||||||||||
Health care | 18,727,639 | 1,933,304 | 0 | 20,660,943 | ||||||||||||
Industrials | 11,187,663 | 2,140,506 | 0 | 13,328,169 | ||||||||||||
Information technology | 30,008,363 | 5,384,231 | 0 | 35,392,594 | ||||||||||||
Materials | 2,000,839 | 2,941,183 | 0 | 4,942,022 | ||||||||||||
Real estate | 4,260,300 | 1,006,780 | 0 | 5,267,080 | ||||||||||||
Utilities | 7,233,671 | 1,623,062 | 0 | 8,856,733 | ||||||||||||
Corporate bonds and notes | 0 | 311,183,468 | 0 | 311,183,468 | ||||||||||||
Exchange-traded funds | 9,147,918 | 0 | 0 | 9,147,918 | ||||||||||||
Foreign corporate bonds and notes | 0 | 13,674,904 | 0 | 13,674,904 | ||||||||||||
Municipal obligations | 0 | 18,349,844 | 0 | 18,349,844 | ||||||||||||
Non-agency mortgage-backed securities | 0 | 9,674,831 | 0 | 9,674,831 | ||||||||||||
Preferred stocks | ||||||||||||||||
Energy | 55,018 | 0 | 0 | 55,018 | ||||||||||||
Financials | 117,751 | 0 | 0 | 117,751 | ||||||||||||
Information technology | 0 | 175,865 | 0 | 175,865 | ||||||||||||
Yankee corporate bonds and notes | 0 | 59,318,334 | 0 | 59,318,334 | ||||||||||||
Short-term investments | ||||||||||||||||
Investment companies | 24,438,752 | 0 | 0 | 24,438,752 | ||||||||||||
| 126,240,873 | 449,154,485 | 0 | 575,395,358 | |||||||||||||
Futures contracts | 401,334 | 0 | 0 | 401,334 | ||||||||||||
Forward foreign currency contracts | 0 | 133,832 | 0 | 133,832 | ||||||||||||
Total assets | $ | 126,642,207 | $ | 449,288,317 | $ | 0 | $ | 575,930,524 | ||||||||
Liabilities | ||||||||||||||||
Futures contracts | $ | 562,688 | $ | 0 | $ | 0 | $ | 562,688 | ||||||||
Written options | 0 | 316,377 | 0 | 316,377 | ||||||||||||
Total liabilities | $ | 562,688 | $ | 316,377 | $ | 0 | $ | 879,065 | ||||||||
38 | Wells Fargo Diversified Income Builder Fund
Table of Contents
Notes to financial statements
Additional sector, industry or geographic detail is included in the Portfolio of Investments.
Futures contracts and forward foreign currency contracts are reported at their cumulative unrealized gains (losses) at measurement date as reported in the tables following the Portfolio of Investments. For futures contracts, the current day’s variation margin is reported on the Statement of Assets and Liabilities. All other assets and liabilities are reported at their market value at measurement date.
For the year ended September 30, 2020, the Fund had no material transfers into/out of Level 3.
4. TRANSACTIONS WITH AFFILIATES
Management fee
Funds Management, an indirect wholly owned subsidiary of Wells Fargo & Company (“Wells Fargo”), is the manager of the Fund and provides advisory and fund-level administrative services under an investment management agreement. Under the investment management agreement, Funds Management is responsible for, among other services, implementing the investment objectives and strategies of the Fund, supervising the subadviser and providing fund-level administrative services in connection with the Fund’s operations. As compensation for its services under the investment management agreement, Funds Management is entitled to receive a management fee at the following annual rate based on the Fund’s average daily net assets:
| Average daily net assets | Management fee | |
First $500 million | 0.550% | |
Next $500 million | 0.525 | |
Next $2 billion | 0.500 | |
Next $2 billion | 0.475 | |
Next $5 billion | 0.440 | |
Over $10 billion | 0.430 | |
For the year ended September 30, 2020, the management fee was equivalent to an annual rate of 0.54% of the Fund’s average daily net assets.
Funds Management has retained the services of a subadviser to provide daily portfolio management to the Fund. The fee for subadvisory services is borne by Funds Management. Wells Capital Management Incorporated (“WellsCap”), an affiliate of Funds Management and an indirect wholly owned subsidiary of Wells Fargo, is the subadviser to the Fund and is entitled to receive a fee from Funds Management at an annual rate starting at 0.35% and declining to 0.20% as the average daily net assets of the Fund increase.
Administration fees
Under a class-level administration agreement, Funds Management provides class-level administrative services to the Fund, which includes paying fees and expenses for services provided by the transfer agent, sub-transfer agents, omnibus account servicers and record-keepers. As compensation for its services under the class-level administration agreement, Funds Management receives an annual fee which is calculated based on the average daily net assets of each class as follows:
| Class-level administration fee | ||
Class A, Class C | 0.21% | |
Class R6 | 0.03 | |
Administrator Class, Institutional Class | 0.13 | |
Waivers and/or expense reimbursements
Funds Management has contractually waived and/or reimbursed management and administration fees to the extent necessary to maintain certain net operating expense ratios for the Fund. When each class of the Fund has exceeded its expense cap, Funds Management has waived fees and/or reimbursed expenses from fund level expenses on a proportionate basis and then from class specific expenses. When only certain classes exceed their expense caps, waivers and/or reimbursements are applied against class specific expenses before fund level expenses. Funds Management has committed through January 31, 2021 to waive fees and/or reimburse expenses to the extent necessary to cap the Fund’s expenses at 0.85% for Class A shares, 1.60% for
Wells Fargo Diversified Income Builder Fund | 39
Table of Contents
Notes to financial statements
Class C shares, 0.42% for Class R6 shares, 0.77% for Administrator Class shares, and 0.52% for Institutional Class shares. Prior to or after the commitment expiration date, the cap may be increased or the commitment to maintain the cap may be terminated only with the approval of the Board of Trustees.
Distribution fee
The Trust has adopted a distribution plan for Class C shares of the Fund pursuant to Rule 12b-1 under the 1940 Act. A distribution fee is charged to Class C shares and paid to Wells Fargo Funds Distributor, LLC (“Funds Distributor”), the principal underwriter, at an annual rate of 0.75% of the average daily net assets of Class C shares.
In addition, Funds Distributor is entitled to receive the front-end sales charge from the purchase of Class A shares and a contingent deferred sales charge on the redemption of certain Class A shares. Funds Distributor is also entitled to receive the contingent deferred sales charges from redemptions of Class C shares. For the year ended September 30, 2020, Funds Distributor received $36,797 from the sale of Class A shares and $497 in contingent deferred sales charges from redemptions of Class C shares. No contingent deferred sales charges were incurred by Class A for the year ended September 30, 2020.
Shareholder servicing fees
The Trust has entered into contracts with one or more shareholder servicing agents, whereby Class A, Class C, and Administrator Class of the Fund are charged a fee at an annual rate of 0.25% of the average daily net assets of each respective class. A portion of these total shareholder servicing fees were paid to affiliates of Wells Fargo.
Interfund transactions
The Fund may purchase or sell portfolio investment securities to certain other Wells Fargo affiliates pursuant to Rule 17a-7 under the 1940 Act and under procedures adopted by the Board of Trustees. The procedures have been designed to ensure that these interfund transactions, which do not incur broker commissions, are effected at current market prices. Pursuant to these procedures, the Fund had $7,343,750 and $0 in interfund purchases and sales, respectively, during the year ended September 30, 2020.
5. INVESTMENT PORTFOLIO TRANSACTIONS
Purchases and sales of investments, excluding U.S. government obligations (if any) and short-term securities, for the year ended September 30, 2020 were $248,095,761 and $343,245,884, respectively.
6. DERIVATIVE TRANSACTIONS
During the year ended September 30, 2020, the Fund entered into futures contracts, forward foreign currency contracts, and written options for economic hedging purposes.
The volume of the Fund’s futures contracts, forward foreign currency contracts, and written options during the year ended September 30, 2020 was as follows:
Options | ||||
Average number of contracts written | 4,350 | |||
Futures contracts | ||||
Average notional balance on long futures | $ | 44,932,894 | ||
Average notional balance on short futures | 39,177,231 | |||
Forward foreign currency contracts | ||||
Average contract amounts to buy | $ | 6,765,653 | ||
Average contract amounts to sell | 29,595,343 | |||
40 | Wells Fargo Diversified Income Builder Fund
Table of Contents
Notes to financial statements
A summary of the location of derivative instruments on the financial statements by primary risk exposure is outlined in the following tables.
The fair value of derivative instruments as of September 30, 2020 by risk type was as follows for the Fund:
Asset derivatives | Liability derivatives | |||||||||||
| Statement of Assets and Liabilities location | Fair value | Statement of Assets and Liabilities location | Fair value | |||||||||
Interest rate risk | Unrealized gains on futures contracts | $ | 0 | * | Unrealized losses on futures contracts | $ | 272,361 | * | ||||
Equity risk | Unrealized gains on futures contracts | $ | 401,334 | * | Unrealized losses on futures contracts | $ | 161,390 | * | ||||
Foreign currency risk | Unrealized gains on futures contracts | 0 | * | Unrealized losses on futures contracts | 128,937 | * | ||||||
Foreign currency risk | Unrealized gains on forward foreign currency contracts | 133,832 | Unrealized losses on forward foreign currency contracts | 0 | ||||||||
Equity risk | Written options, at value | 316,377 | ||||||||||
| $ | 535,166 | $ | 879,065 | |||||||||
| * | Amount represents cumulative unrealized gains (losses) as reported in the table following the Portfolio of Investments. Only the current day’s variation margin as of September 30, 2020 is reported separately on the Statement of Assets and Liabilities. |
The effect of derivative instruments on the Statement of Operations for the year ended September 30, 2020 was as follows for the Fund:
| Amount of realized gains (losses) on derivatives | ||||||||||||||||
| Futures contracts | Forward foreign currency contracts | Written options | Total | |||||||||||||
Interest rate risk | $ | (590,263 | ) | $ | 0 | $ | 0 | $ | (590,263 | ) | ||||||
Equity risk | 4,454,640 | 0 | 1,421,587 | 5,876,227 | ||||||||||||
Foreign currency risk | (2,935,834 | ) | (958,736 | ) | 0 | (3,894,570 | ) | |||||||||
| $ | 928,543 | $ | (958,736 | ) | $ | 1,421,587 | $ | 1,391,394 | ||||||||
| Change in unrealized gains (losses) on derivatives | ||||||||||||||||
| Futures contracts | Forward foreign currency contracts | Written options | Total | |||||||||||||
Interest rate risk | $ | 223,913 | $ | 0 | $ | 0 | $ | 223,913 | ||||||||
Equity risk | 112,515 | 0 | 145,464 | 257,979 | ||||||||||||
Foreign currency risk | (596,473 | ) | (279,152 | ) | 0 | (875,625 | ) | |||||||||
| $ | (260,045 | ) | $ | (279,152 | ) | $ | 145,464 | $ | (393,733 | ) | ||||||
For certain types of derivative transactions, the Fund has entered into International Swaps and Derivatives Association, Inc. master agreements (“ISDA Master Agreements”) or similar agreements with approved counterparties. The ISDA Master Agreements or similar agreements may have requirements to deliver/deposit securities or cash to/with an exchange or broker-dealer as collateral and allows the Fund to offset, with each counterparty, certain derivative financial instrument’s assets and/or liabilities with collateral held or pledged. Collateral requirements differ by type of derivative. Collateral or margin requirements are set by the broker or exchange clearinghouse for exchange traded derivatives while collateral terms are contract specific for over-the-counter traded derivatives. Cash collateral that has been pledged to cover obligations of the Fund under ISDA Master Agreements or similar agreements, if any, are reported separately in the Statement of Assets and Liabilities. Securities pledged as collateral, if any, are noted in the Portfolio of Investments. With respect to balance sheet offsetting, absent an event of default by the counterparty or a termination of the agreement, the reported amounts of financial assets and financial liabilities
Wells Fargo Diversified Income Builder Fund | 41
Table of Contents
Notes to financial statements
in the Statement of Assets and Liabilities are not offset across transactions between the Fund and the applicable counterparty. A reconciliation of the gross amounts on the Statement of Assets and Liabilities to the net amounts by counterparty, including any collateral exposure, for OTC derivatives is as follows:
| Counterparty | Gross amounts of assets in the Statement of Assets and Liabilities | Amounts subject to netting agreements | Collateral received1 | Net amount of assets | ||||||||||||
Citibank | $ | 133,832 | $ | 0 | $ | (133,832 | ) | $ | 0 | |||||||
| 1 | Collateral received within this table is limited to the collateral for the net transaction with the counterparty. |
7. BANK BORROWINGS
The Trust (excluding the money market funds), Wells Fargo Master Trust and Wells Fargo Variable Trust are parties to a $350,000,000 revolving credit agreement whereby the Fund is permitted to use bank borrowings for temporary or emergency purposes, such as to fund shareholder redemption requests. Interest under the credit agreement is charged to the Fund based on a borrowing rate equal to the higher of the Federal Funds rate in effect on that day plus 1.25% or the overnight LIBOR rate in effect on that day plus 1.25%. In addition, an annual commitment fee equal to 0.25% of the unused balance is allocated to each participating fund.
During the year ended September 30, 2020, the Fund had average borrowings outstanding of $15,988 at an average rate of 1.62% and paid interest in the amount of $259.
8. DISTRIBUTIONS TO SHAREHOLDERS
The tax character of distributions paid during the years ended September 30, 2020 and September 30, 2019 were as follows:
| Year ended September 30 | ||||||||
| 2020 | 2019 | |||||||
Ordinary income | $ | 22,908,856 | $ | 33,578,334 | ||||
Long-term capital gain | 0 | 26,326,682 | ||||||
As of September 30, 2020, the components of distributable earnings on a tax basis were as follows:
| Undistributed ordinary income | Unrealized gains | Capital loss carryforward | ||
| $2,550,740 | $30,175,084 | $(50,206,972) | ||
9. INDEMNIFICATION
Under the Fund’s organizational documents, the officers and Trustees have been granted certain indemnification rights against certain liabilities that may arise out of performance of their duties to the Fund. The Fund has entered into a separate agreement with each Trustee that converts indemnification rights currently existing under the Fund’s organizational documents into contractual rights that cannot be changed in the future without the consent of the Trustee. Additionally, in the normal course of business, the Fund may enter into contracts with service providers that contain a variety of indemnification clauses. The Fund’s maximum exposure under these arrangements is dependent on future claims that may be made against the Fund and, therefore, cannot be estimated.
10. NEW ACCOUNTING PRONOUNCEMENTS
In August 2018, FASB issued Accounting Standards Update (“ASU”) No. 2018-13, Fair Value Measurement (Topic 820) Disclosure Framework—Changes to the Disclosure Requirements for Fair Value Measurement. ASU 2018-13 updates the disclosure requirements on fair value measurements in Topic 820, Fair Value Measurements. The amendments are effective for fiscal years, and interim periods within those fiscal years, beginning after December 15, 2019. Management has adopted this guidance which did not have a material impact on the financial statements.
11. CORONAVIRUS (COVID-19) PANDEMIC
On March 11, 2020, the World Health Organization announced that it had made the assessment that coronavirus disease 2019 (“COVID-19”) is a pandemic. The impacts of COVID-19 are adversely affecting the entire global economy, individual companies and investment products, and the market in general. There is significant uncertainty around the extent and duration of business disruptions related to COVID-19 and the impacts may be short term or may last for an extended period of time. The risk of further spreading of COVID-19 has led to significant uncertainty and volatility in the financial markets.
42 | Wells Fargo Diversified Income Builder Fund
Table of Contents
Report of independent registered public accounting firm
To the Shareholders of the Fund and Board of Trustees
Wells Fargo Funds Trust:
Opinion on the Financial Statements
We have audited the accompanying statement of assets and liabilities of Wells Fargo Diversified Income Builder Fund (the Fund), one of the funds constituting Wells Fargo Funds Trust, including the portfolio of investments, as of September 30, 2020, the related statement of operations for the year then ended, the statements of changes in net assets for each of the years in the two-year period then ended, and the related notes (collectively, the financial statements) and the financial highlights for each of the years or periods in the five-year period then ended. In our opinion, the financial statements and financial highlights present fairly, in all material respects, the financial position of the Fund as of September 30, 2020, the results of its operations for the year then ended, the changes in its net assets for each of the years in the two-year period then ended, and the financial highlights for each of the years or periods in the five-year period then ended, in conformity with U.S. generally accepted accounting principles.
Basis for Opinion
These financial statements and financial highlights are the responsibility of the Fund’s management. Our responsibility is to express an opinion on these financial statements and financial highlights based on our audits. We are a public accounting firm registered with the Public Company Accounting Oversight Board (United States) (PCAOB) and are required to be independent with respect to the Fund in accordance with the U.S. federal securities laws and the applicable rules and regulations of the Securities and Exchange Commission and the PCAOB.
We conducted our audits in accordance with the standards of the PCAOB. Those standards require that we plan and perform the audit to obtain reasonable assurance about whether the financial statements and financial highlights are free of material misstatement, whether due to error or fraud. Our audits included performing procedures to assess the risks of material misstatement of the financial statements and financial highlights, whether due to error or fraud, and performing procedures that respond to those risks. Such procedures included examining, on a test basis, evidence regarding the amounts and disclosures in the financial statements and financial highlights. Such procedures also included confirmation of securities owned as of September 30, 2020, by correspondence with the custodian, transfer agent and brokers, or by other appropriate auditing procedures. Our audits also included evaluating the accounting principles used and significant estimates made by management, as well as evaluating the overall presentation of the financial statements and financial highlights. We believe that our audits provide a reasonable basis for our opinion.

We have not been able to determine the specific year that we began serving as the auditor of one or more Wells Fargo Funds investment companies; however we are aware that we have served as the auditor of one or more Wells Fargo Funds investment companies since at least 1955.
Boston, Massachusetts
November 24, 2020
Wells Fargo Diversified Income Builder Fund | 43
Table of Contents
TAX INFORMATION
For corporate shareholders, pursuant to Section 854 of the Internal Revenue Code, 8.38% of ordinary income dividends qualify for the corporate dividends-received deduction for the fiscal year ended September 30, 2020.
Pursuant to Section 854 of the Internal Revenue Code, $3,571,851 of income dividends paid during the fiscal year ended September 30, 2020 has been designated as qualified dividend income (QDI).
For the fiscal year ended September 30, 2020, $15,521,813 has been designated as interest-related dividends for nonresident alien shareholders pursuant to Section 871 of the Internal Revenue Code.
PROXY VOTING INFORMATION
A description of the policies and procedures used to determine how to vote proxies relating to portfolio securities is available, upon request, by calling 1-800-222-8222, visiting our website at wfam.com, or visiting the SEC website at sec.gov. Information regarding how the proxies related to portfolio securities were voted during the most recent 12-month period ended June 30 is available on the website at wfam.com or by visiting the SEC website at sec.gov.
QUARTERLY PORTFOLIO HOLDINGS INFORMATION
The Fund files its complete schedule of portfolio holdings with the SEC for the first and third quarters of each fiscal year as an exhibit to its reports on Form N-PORT. Shareholders may view the filed Form N-PORT by visiting the SEC website at sec.gov.
44 | Wells Fargo Diversified Income Builder Fund
Table of Contents
Other information (unaudited)
BOARD OF TRUSTEES AND OFFICERS
Each of the Trustees and Officers1 listed in the table below acts in identical capacities for each fund in the Wells Fargo family of funds, which consists of 142 mutual funds comprising the Wells Fargo Funds Trust, Wells Fargo Variable Trust, Wells Fargo Master Trust and four closed-end funds (collectively the “Fund Complex”). This table should be read in conjunction with the Prospectus and the Statement of Additional Information2. The mailing address of each Trustee and Officer is 525 Market Street, 12th Floor, San Francisco, CA 94105. Each Trustee and Officer serves an indefinite term, however, each Trustee serves such term until reaching the mandatory retirement age established by the Trustees.
Independent Trustees
Name and year of birth | Position held and length of service* | Principal occupations during past five years or longer | Current other public company or investment company directorships | |||
William R. Ebsworth (Born 1957) | Trustee, since 2015 | Retired. From 1984 to 2013, equities analyst, portfolio manager, research director and chief investment officer at Fidelity Management and Research Company in Boston, Tokyo, and Hong Kong, and retired in 2013 as Chief Investment Officer of Fidelity Strategic Advisers, Inc. where he led a team of investment professionals managing client assets. Prior thereto, Board member of Hong Kong Securities Clearing Co., Hong Kong Options Clearing Corp., the Thailand International Fund, Ltd., Fidelity Investments Life Insurance Company, and Empire Fidelity Investments Life Insurance Company. Audit Committee Chair and Investment Committee Chair of the Vincent Memorial Hospital Endowment (non-profit organization). Mr. Ebsworth is a CFA® charterholder. | N/A | |||
Jane A. Freeman (Born 1953) | Trustee, since 2015; Chair Liaison, since 2018 | Retired. From 2012 to 2014 and 1999 to 2008, Chief Financial Officer of Scientific Learning Corporation. From 2008 to 2012, Ms. Freeman provided consulting services related to strategic business projects. Prior to 1999, Portfolio Manager at Rockefeller & Co. and Scudder, Stevens & Clark. Board member of the Harding Loevner Funds from 1996 to 2014, serving as both Lead Independent Director and chair of the Audit Committee. Board member of the Russell Exchange Traded Funds Trust from 2011 to 2012 and the chair of the Audit Committee. Ms. Freeman is also an inactive Chartered Financial Analyst. | N/A | |||
Isaiah Harris, Jr. (Born 1952) | Trustee, since 2009; Audit Committee Chairman, since 2019 | Retired. Chairman of the Board of CIGNA Corporation since 2009, and Director since 2005. From 2003 to 2011, Director of Deluxe Corporation. Prior thereto, President and CEO of BellSouth Advertising and Publishing Corp. from 2005 to 2007, President and CEO of BellSouth Enterprises from 2004 to 2005 and President of BellSouth Consumer Services from 2000 to 2003. Emeritus member of the Iowa State University Foundation Board of Governors. Emeritus Member of the Advisory Board of Iowa State University School of Business. Advisory Board Member, Palm Harbor Academy (private school). Mr. Harris is a certified public accountant (inactive status). | CIGNA Corporation | |||
| Judith M. Johnson (Born 1949) | Trustee, since 2008 | Retired. Prior thereto, Chief Executive Officer and Chief Investment Officer of Minneapolis Employees Retirement Fund from 1996 to 2008. Ms. Johnson is an attorney, certified public accountant and a certified managerial accountant. | N/A | |||
Wells Fargo Diversified Income Builder Fund | 45
Table of Contents
Other information (unaudited)
Name and year of birth | Position held and length of service* | Principal occupations during past five years or longer | Current other public company or investment company directorships | |||
David F. Larcker (Born 1950) | Trustee, since 2009 | James Irvin Miller Professor of Accounting at the Graduate School of Business (Emeritus), Stanford University, Director of the Corporate Governance Research Initiative and Senior Faculty of The Rock Center for Corporate Governance since 2006. From 2005 to 2008, Professor of Accounting at the Graduate School of Business, Stanford University. Prior thereto, Ernst & Young Professor of Accounting at The Wharton School, University of Pennsylvania from 1985 to 2005. | N/A | |||
| Olivia S. Mitchell (Born 1953) | Trustee, since 2006; Nominating and Governance Committee Chair, since 2018 | International Foundation of Employee Benefit Plans Professor, Wharton School of the University of Pennsylvania since 1993. Director of Wharton’s Pension Research Council and Boettner Center on Pensions & Retirement Research, and Research Associate at the National Bureau of Economic Research. Previously, Cornell University Professor from 1978 to 1993. | N/A | |||
Timothy J. Penny (Born 1951) | Trustee, since 1996; Chairman, since 2018 | President and Chief Executive Officer of Southern Minnesota Initiative Foundation, a non-profit organization, since 2007. Member of the Board of Trustees of NorthStar Education Finance, Inc., a non-profit organization, since 2007. | N/A | |||
James G. Polisson (Born 1959) | Trustee, since 2018 | Retired. Chief Marketing Officer, Source (ETF) UK Services, Ltd, from 2015 to 2017. From 2012 to 2015, Principal of The Polisson Group, LLC, a management consulting, corporate advisory and principal investing company. Chief Executive Officer and Managing Director at Russell Investments, Global Exchange Traded Funds from 2010 to 2012. Managing Director of Barclays Global Investors from 1998 to 2010 and Global Chief Marketing Officer for iShares and Barclays Global Investors from 2000 to 2010. Trustee of the San Francisco Mechanics’ Institute, a non-profit organization, from 2013 to 2015. Board member of the Russell Exchange Traded Fund Trust from 2011 to 2012. Director of Barclays Global Investors Holdings Deutschland GmbH from 2006 to 2009. Mr. Polisson is an attorney and has a retired status with the Massachusetts and District of Columbia Bar Associations. | N/A | |||
| Pamela Wheelock (Born 1959) | Trustee, since January 2020; previously Trustee from January 2018 to July 2019 | Board member of the Destination Medical Center Economic Development Agency, Rochester, Minnesota since 2019. Interim President of the McKnight Foundation from January to September 2020. Acting Commissioner, Minnesota Department of Human Services, July 2019 through September 2019. Human Services Manager (part-time), Minnesota Department of Human Services, October 2019 through December 2019. Chief Operating Officer, Twin Cities Habitat for Humanity from 2017 to 2019. Vice President of University Services, University of Minnesota from 2012 to 2016. Prior thereto, on the Board of Directors, Governance Committee and Finance Committee for the Minnesota Philanthropy Partners (Saint Paul Foundation) from 2012 to 2018, Interim Chief Executive Officer of Blue Cross Blue Shield of Minnesota from 2011 to 2012, Chairman of the Board from 2009 to 2012 and Board Director from 2003 to 2015. Vice President, Leadership and Community Engagement, Bush Foundation, Saint Paul, Minnesota (a private foundation) from 2009 to 2011. Executive Vice President and Chief Financial Officer, Minnesota Sports and Entertainment from 2004 to 2009 and Senior Vice President from 2002 to 2004. Executive Vice President of the Minnesota Wild Foundation from 2004 to 2008. Commissioner of Finance, State of Minnesota, from 1999 to 2002. Currently Board Chair of the Minnesota Wild Foundation since 2010. | N/A | |||
| * | Length of service dates reflect the Trustee’s commencement of service with the Trust’s predecessor entities, where applicable. |
46 | Wells Fargo Diversified Income Builder Fund
Table of Contents
Other information (unaudited)
Officers
Name and year of birth | Position held and length of service | Principal occupations during past five years or longer | ||
Andrew Owen (Born 1960) | President, since 2017 | Executive Vice President of Wells Fargo & Company and Head of Affiliated Managers, Wells Fargo Asset Management, since 2014. In addition, Mr. Owen is currently President, Chief Executive Officer and Director of Wells Fargo Funds Management, LLC since 2017. Prior thereto, Executive Vice President responsible for marketing, investments and product development for Wells Fargo Funds Management, LLC, from 2009 to 2014. | ||
Jeremy DePalma1 (Born 1974) | Treasurer, since 2012 | Senior Vice President of Wells Fargo Funds Management, LLC since 2009. Senior Vice President of Evergreen Investment Management Company, LLC from 2008 to 2010 and head of the Fund Reporting and Control Team within Fund Administration from 2005 to 2010. | ||
Michelle Rhee (Born 1966) | Chief Legal Officer, since 2019 | Secretary of Wells Fargo Funds Management, LLC, Chief Legal Counsel of Wells Fargo Asset Management and Assistant General Counsel of Wells Fargo Bank, N.A. since 2018. Associate General Counsel and Managing Director of Bank of America Corporation from 2004 to 2018. | ||
Catherine Kennedy (Born 1969) | Secretary, since 2019 | Vice President of Wells Fargo Funds Management, LLC and Senior Counsel of the Wells Fargo Legal Department since 2010. Vice President and Senior Counsel of Evergreen Investment Management Company, LLC from 1998 to 2010. | ||
Michael H. Whitaker (Born 1967) | Chief Compliance Officer, since 2016 | Chief Compliance Officer of Wells Fargo Asset Management since 2016. Senior Vice President and Chief Compliance Officer for Fidelity Investments from 2007 to 2016. | ||
| 1 | Jeremy DePalma acts as Treasurer of 77 funds in the Fund Complex. |
| 2 | The Statement of Additional Information includes additional information about the Trustees and is available, without charge, upon request, by calling 1-800-222-8222 or by visiting the website at wfam.com. |
Wells Fargo Diversified Income Builder Fund | 47
Table of Contents
Other information (unaudited)
BOARD CONSIDERATION OF INVESTMENT MANAGEMENT AND SUB-ADVISORY AGREEMENTS:
Wells Fargo Diversified Income Builder Fund
Under the Investment Company Act of 1940 (the “1940 Act”), the Board of Trustees (the “Board”) of Wells Fargo Funds Trust (the “Trust”) must determine annually whether to approve the continuation of the Trust’s investment management and sub-advisory agreements. In this regard, at a Board meeting held on May 26, 2020 and May 28, 2020 (together, the “Meeting”), the Board, all the members of which have no direct or indirect interest in the investment management and sub-advisory agreements and are not “interested persons” of the Trust, as defined in the 1940 Act (the “Independent Trustees”), reviewed and approved for Wells Fargo Diversified Income Builder Fund (the “Fund”): (i) an investment management agreement (the “Management Agreement”) with Wells Fargo Funds Management, LLC (“Funds Management”); and (ii) an investment sub-advisory agreement (the “Sub-Advisory Agreement”) with Wells Capital Management Incorporated (the “Sub-Adviser”), an affiliate of Funds Management. The Management Agreement and the Sub-Advisory Agreement are collectively referred to as the “Advisory Agreements.”
At the Meeting, the Board considered the factors and reached the conclusions described below relating to the selection of Funds Management and the Sub-Adviser and the approval of the Advisory Agreements. Prior to the Meeting, including at a Board meeting held in April 2020, the Trustees conferred extensively among themselves and with representatives of Funds Management about these matters. Also, the Board has adopted a team-based approach, with each team consisting of a sub-set of Trustees, to assist the full Board in the discharge of its duties in reviewing investment performance and other matters throughout the year. The Independent Trustees were assisted in their evaluation of the Advisory Agreements by independent legal counsel, from whom they received separate legal advice and with whom they met separately.
In providing information to the Board, Funds Management and the Sub-Adviser were guided by a detailed set of requests for information submitted to them by independent legal counsel on behalf of the Independent Trustees at the start of the Board’s annual contract renewal process earlier in 2020. In considering and approving the Advisory Agreements, the Trustees considered the information they believed relevant, including but not limited to the information discussed below. The Board considered not only the specific information presented in connection with the Meeting, but also the knowledge gained over time through interaction with Funds Management and the Sub-Adviser about various topics. In this regard, the Board reviewed reports of Funds Management at each of its quarterly meetings, which included, among other things, portfolio reviews and investment performance reports. In addition, the Board and the teams mentioned above confer with portfolio managers at various times throughout the year. The Board did not identify any particular information or consideration that was all-important or controlling, and each individual Trustee may have attributed different weights to various factors.
After its deliberations, the Board unanimously approved the continuation of the Advisory Agreements for a one-year term and determined that the compensation payable to Funds Management and the Sub-Adviser under each of the Advisory Agreements was reasonable. The Board considered the approval of the Advisory Agreements for the Fund as part of its consideration of agreements for funds across the complex, but its approvals were made on a fund-by-fund basis. The following summarizes a number of important, but not necessarily all, factors considered by the Board in support of its approvals.
Nature, extent and quality of services
The Board received and considered various information regarding the nature, extent and quality of services provided to the Fund by Funds Management and the Sub-Adviser under the Advisory Agreements. This information included a description of the investment advisory services and Fund-level administrative services covered by the Management Agreement, as well as, among other things, a summary of the background and experience of senior management of Wells Fargo Asset Management (“WFAM”), of which Funds Management and the Sub-Adviser are a part, and a summary of investments made in the business of WFAM. The Board also received a description of Funds Management’s and the Sub-Adviser’s business continuity plans and of their approaches to data privacy and cybersecurity, and related testing. The Board also received and reviewed information about Funds Management’s role as administrator of the Fund’s liquidity risk management program, Funds Management’s approach to risk management, and Funds Management’s intermediary and vendor oversight program.
The Board also considered the qualifications, background, tenure and responsibilities of each of the portfolio managers primarily responsible for the day-to-day portfolio management of the Fund. The Board evaluated the ability of Funds Management and the Sub-Adviser to attract and retain qualified investment professionals, including research, advisory and supervisory personnel. The Board further considered the compliance programs and compliance records of Funds Management and the Sub-Adviser. In addition, the Board took into account the full range of services provided to the Fund by Funds Management and its affiliates.
48 | Wells Fargo Diversified Income Builder Fund
Table of Contents
Other information (unaudited)
Fund investment performance and expenses
The Board considered the investment performance results for the Fund over various time periods ended December 31, 2019. The Board also considered more current results for various time periods ended March 31, 2020. The Board considered these results in comparison to the investment performance of funds in a universe that was determined by Broadridge Inc. (“Broadridge”) to be similar to the Fund (the “Universe”), and in comparison to the Fund’s benchmark index and to other comparative data. Broadridge is an independent provider of investment company data. The Board received a description of the methodology used by Broadridge to select the mutual funds in the performance Universe. The Board noted that the investment performance of the Fund (Class A) was higher than the average investment performance of the Universe for the one-, three-, five- and ten-year periods ended December 31, 2019. The Board also noted that the investment performance of the Fund (Administrator Class) was higher than the average investment performance of the Universe for the five- and ten-year periods ended March 31, 2020, and lower than the average investment performance of the Universe for the one- and three-year periods ended March 31, 2020. The Board also noted that the investment performance of the Fund was lower than its benchmark index, the Diversified Income Builder Blended Index, for all periods ended December 31, 2019. The Board also noted that the investment performance of the Fund was lower than its benchmark index, the Diversified Income Builder Blended Index, for all periods ended March 31, 2020.
The Board received information concerning, and discussed factors contributing to, the underperformance of the Fund relative to the Universe and benchmark index for the periods identified above. The Board took note of the explanations for the relative underperformance during these periods, including with respect to investment decisions and market factors that affected the Fund’s investment performance. The Board also took note of the Fund’s outperformance relative to the Universe over the longer time periods under review.
The Board also received and considered information regarding the Fund’s net operating expense ratios and their various components, including actual management fees, custodian and other non-management fees, and Rule 12b-1 and non-Rule 12b-1 shareholder service fees. The Board considered these ratios in comparison to the median ratios of funds in class-specific expense groups that were determined by Broadridge to be similar to the Fund (the “Groups”). The Board received a description of the methodology used by Broadridge to select the mutual funds in the expense Groups and an explanation of how funds comprising expense groups and their expense ratios may vary from year-to-year. Based on the Broadridge reports, the Board noted that the net operating expense ratios of the Fund were lower than the median net operating expense ratios of the expense Groups for each share class.
The Board took into account the Fund’s investment performance and expense information provided to it among the factors considered in deciding to re-approve the Advisory Agreements.
Investment management and sub-advisory fee rates
The Board reviewed and considered the contractual fee rates payable by the Fund to Funds Management under the Management Agreement, as well as the contractual fee rates payable by the Fund to Funds Management for class-level administrative services under a Class-Level Administration Agreement, which include, among other things, class-level transfer agency and sub-transfer agency costs (collectively, the “Management Rates”). The Board also reviewed and considered the contractual investment sub-advisory fee rates that are payable by Funds Management to the Sub-Adviser for investment sub-advisory services.
Among other information reviewed by the Board was a comparison of the Fund’s Management Rates with the average contractual investment management fee rates of funds in the expense Groups at a common asset level as well as transfer agency costs of the funds in the expense Groups. The Board noted that the Management Rates of the Fund were lower than or in range of the sum of these average rates for the Fund’s expense Groups for all share classes.
The Board also received and considered information about the portion of the total management fee that was retained by Funds Management after payment of the fee to the Sub-Adviser for sub-advisory services. In assessing the reasonableness of this amount, the Board received and evaluated information about the nature and extent of responsibilities retained and risks assumed by Funds Management and not delegated to or assumed by the Sub-Adviser, and about Funds Management’s on-going oversight services. Given the affiliation between Funds Management and the Sub-Adviser, the Board ascribed limited relevance to the allocation of fees between them.
Based on its consideration of the factors and information it deemed relevant, including those described here, the Board determined that the compensation payable to Funds Management under the Management Agreement and to the Sub-Adviser under the Sub-Advisory Agreement was reasonable.
Wells Fargo Diversified Income Builder Fund | 49
Table of Contents
Other information (unaudited)
Profitability
The Board received and considered information concerning the profitability of Funds Management, as well as the profitability of both WFAM and Wells Fargo & Co. (“Wells Fargo”) from providing services to the fund family as a whole. The Board noted that the Sub-Adviser’s profitability information with respect to providing services to the Fund and other funds in the family was subsumed in the WFAM and Wells Fargo profitability analysis.
Funds Management reported on the methodologies and estimates used in calculating profitability, including a description of the methodology used to allocate certain expenses. Among other things, the Board noted that the levels of profitability reported on a fund-by-fund basis varied widely, depending on factors such as the size, type and age of fund.
Based on its review, the Board did not deem the profits reported by Funds Management, WFAM or Wells Fargo from services provided to the Fund to be at a level that would prevent it from approving the continuation of the Advisory Agreements.
Economies of scale
The Board received and considered information about the potential for Funds Management to experience economies of scale in the provision of management services to the Fund, the difficulties of calculating economies of scale at an individual fund level, and the extent to which potential scale benefits are shared with shareholders. The Board noted the existence of breakpoints in the Fund’s management fee structure, which operate generally to reduce the Fund’s expense ratios as the Fund grows in size, and the size of the Fund in relation to such breakpoints. The Board considered that in addition to management fee breakpoints, Funds Management shares potential economies of scale from its management business in a variety of ways, including through fee waiver and expense reimbursement arrangements, services that benefit shareholders, competitive management fee rates set at the outset without regard to breakpoints, and investments in the business intended to enhance services available to shareholders.
The Board concluded that Funds Management’s arrangements with respect to the Fund, including contractual breakpoints, constituted a reasonable approach to sharing potential economies of scale with the Fund and its shareholders.
Other benefits to Funds Management and the Sub-Adviser
The Board received and considered information regarding potential “fall-out” or ancillary benefits received by Funds Management and its affiliates, including the Sub-Adviser, as a result of their relationships with the Fund. Ancillary benefits could include, among others, benefits directly attributable to other relationships with the Fund and benefits potentially derived from an increase in Funds Management’s and the Sub-Adviser’s business as a result of their relationships with the Fund. The Board noted that various affiliates of Funds Management may receive distribution-related fees, shareholder servicing payments and sub-transfer agency fees in respect of shares sold or held through them and services provided.
The Board also reviewed information about soft dollar credits earned and utilized by the Sub-Adviser, fees earned by Funds Management and the Sub-Adviser from managing a private investment vehicle for the fund family’s securities lending collateral, and commissions earned by an affiliated broker from portfolio transactions.
Based on its consideration of the factors and information it deemed relevant, including those described here, the Board did not find that any ancillary benefits received by Funds Management and its affiliates, including the Sub-Adviser, were unreasonable.
Conclusion
At the Meeting, after considering the above-described factors and based on its deliberations and its evaluation of the information described above, the Board unanimously approved the continuation of the Advisory Agreements for a one-year term and determined that the compensation payable to Funds Management and the Sub-Adviser under each of the Advisory Agreements was reasonable.
50 | Wells Fargo Diversified Income Builder Fund
Table of Contents
Other information (unaudited)
LIQUIDITY RISK MANAGEMENT PROGRAM
In accordance with Rule 22e-4 under the Investment Company Act of 1940, as amended (the “Liquidity Rule”), Wells Fargo Funds Trust (the “Trust”) has adopted and implemented a liquidity risk management program (the “Program”) on behalf of each of its series, including the Fund, which is reasonably designed to assess and manage the Fund’s liquidity risk. “Liquidity risk” is defined as the risk that the Fund is unable to meet redemption requests without significantly diluting remaining investors’ interests in the Fund. The Trust’s Board of Trustees (the “Board”) previously approved the designation of Wells Fargo Funds Management, LLC (“Funds Management”), the Fund’s investment manager, as the administrator of the Program, and Funds Management has established a Liquidity Risk Management Council composed of personnel from multiple departments within Funds Management and its affiliates to assist Funds Management in the implementation and on-going administration of the Program.
The Program is comprised of various components designed to support the assessment and/or management of liquidity risk, including: (1) the periodic assessment (no less frequently than annually) of certain factors that influence the Fund’s liquidity risk; (2) the periodic classification (no less frequently than monthly) of the Fund’s investments into one of four liquidity categories that reflect an estimate of their liquidity under current market conditions; (3) a 15% limit on the acquisition of “illiquid investments” (as defined under the Liquidity Rule); (4) to the extent the Fund does not invest primarily in “highly liquid investments” (as defined under the Liquidity Rule), the determination of a minimum percentage of the Fund’s assets that generally will be invested in highly liquid investments (an “HLIM”); (5) if the Fund has established an HLIM, the periodic review (no less frequently than annually) of the HLIM and the adoption of policies and procedures for responding to a shortfall of the Fund’s “highly liquid investments” below its HLIM; and (6) periodic reporting to the Board.
At a meeting of the Board held on May 26 and 28, 2020, the Board received a written report (the “Report”) from Funds Management that addressed the operation of the Program and assessed its adequacy and effectiveness of implementation. The Report covered the initial period from December 1, 2018 through December 31, 2019 (the “Reporting Period”). No significant liquidity events impacting the Fund were noted in the Report. There were no material changes to the Program during the Reporting Period. The Report concluded that the Program is operating effectively to assess and manage the Fund’s liquidity risk, and that the Program has been and continues to be adequately and effectively implemented to monitor and, as applicable, respond to the Fund’s liquidity developments.
There can be no assurance that the Program will achieve its objectives under all circumstances in the future. Please refer to the Fund’s prospectus for more information regarding the Fund’s exposure to liquidity risk and other risks to which an investment in the Fund may be subject.
Wells Fargo Diversified Income Builder Fund | 51
Table of Contents
Effective June 1, 2020, shareholders purchasing Fund shares through an Oppenheimer & Co. Inc. (“Oppenheimer”) platform or account are eligible only for the following load waivers (front-end sales charge waivers and contingent deferred or back-end, sales charge waivers) and discounts, which may differ from those disclosed in the Fund’s Prospectus or SAI.
| Front-end Sales Load Waivers on Class A Shares available at Oppenheimer |
| Employer-sponsored retirement, deferred compensation and employee benefit plans (including health savings accounts) and trusts used to fund those plans, provided that the shares are not held in a commission-based brokerage account and shares are held for the benefit of the plan. |
| Shares purchased by or through a 529 Plan. |
| Shares purchased through an Oppenheimer affiliated investment advisory program. |
| Shares purchased through reinvestment of capital gains distributions and dividend reinvestment when purchasing shares of the same fund (but not any other fund within the fund family). |
| Shares purchased from the proceeds of redemptions within the same fund family, provided (1) the repurchase occurs within 90 days following the redemption, (2) the redemption and purchase occur in the same account, and (3) redeemed shares were subject to a front-end or deferred sales load (known as Rights of Restatement). |
| A shareholder in the Fund’s Class C shares will have their shares exchanged at net asset value to Class A shares (or the appropriate share class) of the Fund if the shares are no longer subject to a CDSC and the exchange is in line with the policies and procedures of Oppenheimer. |
| Employees and registered representatives of Oppenheimer or its affiliates and their family members. |
| Directors or Trustees of the Fund, and employees of the Fund’s investment adviser or any of its affiliates, as described in the Prospectus. |
| CDSC Waivers on A and C Shares available at Oppenheimer |
| Death or disability of the shareholder. |
| Shares sold as part of a systematic withdrawal plan as described in the Prospectus. |
| Return of excess contributions from an IRA Account. |
| Shares sold as part of a required minimum distribution for IRA and retirement accounts due to the shareholder reaching the qualified age based on applicable IRS regulations as described in the Prospectus. |
| Shares sold to pay Oppenheimer fees but only if the transaction is initiated by Oppenheimer. |
| Shares acquired through a right of reinstatement. |
| Front-end load Discounts Available at Oppenheimer: Breakpoints, Rights of Accumulation & Letters of Intent |
| Breakpoints as described in the Prospectus. |
| Rights of Accumulation (ROA), which entitle shareholders to breakpoint discounts, will be automatically calculated based on the aggregated holding of fund family assets held by accounts within the purchaser’s household at Oppenheimer. Eligible fund family assets not held at Oppenheimer may be included in the ROA calculation only if the shareholder notifies his or her financial advisor about such assets. |
52 | Wells Fargo Diversified Income Builder Fund
Table of Contents
Effective June 15, 2020, shareholders purchasing fund shares through a Robert W. Baird & Co. (“Baird”) platform or account will only be eligible for the following sales charge waivers (front-end sales charge waivers and CDSC waivers) and discounts, which may differ from those disclosed elsewhere in the Fund’s Prospectus or the SAI.
| Front-end Sales Load Waivers on Class A Shares available at Baird |
| Shares purchased through reinvestment of capital gains distributions and dividend reinvestment when purchasing share of the same fund. |
| Share purchase by employees and registers representatives of Baird or its affiliate and their family members as designated by Baird. |
| Shares purchase from the proceeds of redemptions within the same fund family, provided (1) the repurchase occurs within 90 days following the redemption, (2) the redemption and purchase occur in the same accounts, and (3) redeemed shares were subject to a front-end or deferred sales charge (known as rights of reinstatement). |
| A shareholder in the Funds Investor C Shares will have their share exchanged at net asset value to Investor A shares of the fund if the shares are no longer subject to CDSC and the exchange is in line with the policies and procedures of Baird. |
| Employer-sponsored retirement plans or charitable accounts in a transactional brokerage account at Baird, including 401(k)plans, 457 plans, employer-sponsored 403(b) plans, profit sharing and money purchase pension plans and defined benefit plans. For purposes of this provision, employer-sponsored retirement plans do not include SEP IRAs, Simple IRAs or SAR-SEPs. |
| CDSC Waivers on A and C Shares available at Baird |
| Shares sold due to death or disability of the shareholder. |
| Shares sold as part of a systematic withdrawal plan as described in the Fund’s Prospectus. |
| Shares bought due to returns of excess contributions from an IRA Account. |
| Shares sold as part of a required minimum distribution for IRA and retirement accounts due to the shareholder reaching age 72as described in the Fund’s Prospectus. |
| Shares sold to pay Baird fees but only if the transaction is initiated by Baird. |
| Shares acquired through a right of reinstatement. |
| Front-end load Discounts Available at Baird: Breakpoint and/or Rights of Accumulation |
| Breakpoints as described in the Prospectus. |
| Rights of accumulations which entitles shareholders to breakpoint discounts will be automatically calculated based on the aggregated holding of fund family assets held by accounts within the purchaser’s household at Baird. Eligible fund family assets not held at Baird may be included in the rights of accumulations calculation only if the shareholder notifies his or her financial advisor about such assets. |
| Letters of Intent (LOI) allow for breakpoint discounts based on anticipated purchases within a fund family through Baird, over a 13-month period of time. |
Wells Fargo Diversified Income Builder Fund | 53
Table of Contents
This page is intentionally left blank.
Table of Contents
This page is intentionally left blank.
Table of Contents
This page is intentionally left blank.
Table of Contents
For more information
More information about Wells Fargo Funds is available free upon request. To obtain literature, please write, visit the Fund’s website, or call:
Wells Fargo Funds
P.O. Box 219967
Kansas City, MO 64121-9967
Website: wfam.com
Individual investors: 1-800-222-8222
Retail investment professionals: 1-888-877-9275
Institutional investment professionals: 1-866-765-0778

This report and the financial statements contained herein are submitted for the general information of the shareholders of the Fund. If this report is used for promotional purposes, distribution of the report must be accompanied or preceded by a current prospectus. Before investing, please consider the investment objectives, risks, charges, and expenses of the investment. For a current prospectus and, if available, a summary prospectus, containing this information, call 1-800-222-8222 or visit the Fund’s website at wfam.com. Read the prospectus carefully before you invest or send money.
Wells Fargo Asset Management (WFAM) is the trade name for certain investment advisory/management firms owned by Wells Fargo & Company. These firms include but are not limited to Wells Capital Management Incorporated and Wells Fargo Funds Management, LLC. Certain products managed by WFAM entities are distributed by Wells Fargo Funds Distributor, LLC (a broker-dealer and Member FINRA).
This material is for general informational and educational purposes only and is NOT intended to provide investment advice or a recommendation of any kind—including a recommendation for any specific investment, strategy, or plan.
INVESTMENT PRODUCTS: NOT FDIC INSURED ◾ NO BANK GUARANTEE ◾ MAY LOSE VALUE
© 2020 Wells Fargo & Company. All rights reserved.
PAR-1020-00547 11-20
A226/AR226 09-20
Table of Contents

Annual Report
September 30, 2020
Wells Fargo Income Plus Fund
(formerly Wells Fargo Strategic Income Fund)
Beginning on January 1, 2021, as permitted by new regulations adopted by the Securities and Exchange Commission, paper copies of the Wells Fargo Funds’ annual and semi-annual shareholder reports issued after this date will no longer be sent by mail, unless you specifically request paper copies of the reports. Instead, the reports will be made available on the Funds’ website, and you will be notified by mail each time a report is posted and provided with a website address to access the report.
If you already elected to receive shareholder reports electronically, you will not be affected by this change and you need not take any action. You may elect to receive shareholder reports and other communications from the Fund electronically at any time by contacting your financial intermediary (such as a broker-dealer or bank) or, if you are a direct investor, by calling 1-800-222-8222 or by enrolling at wellsfargo.com/advantagedelivery.
You may elect to receive all future reports in paper free of charge. If you invest through a financial intermediary, you can contact your financial intermediary to request that you continue to receive paper copies of your shareholder reports; if you invest directly with the Fund, you can call 1-800-222-8222. Your election to receive reports in paper will apply to all Wells Fargo Funds held in your account with your financial intermediary or, if you are a direct investor, to all Wells Fargo Funds that you hold.
Table of Contents
|
Reduce clutter. Save trees. |
Sign up for electronic delivery of prospectuses and shareholder reports at wellsfargo.com/ |
The views expressed and any forward-looking statements are as of September 30, 2020, unless otherwise noted, and are those of the Fund’s portfolio managers and/or Wells Fargo Asset Management. Discussions of individual securities, or the markets generally, or any Wells Fargo Fund are not intended as individual recommendations. Future events or results may vary significantly from those expressed in any forward-looking statements. The views expressed are subject to change at any time in response to changing circumstances in the market. Wells Fargo Asset Management and the Fund disclaim any obligation to publicly update or revise any views expressed or forward-looking statements.
INVESTMENT PRODUCTS: NOT FDIC INSURED ◾ NO BANK GUARANTEE ◾ MAY LOSE VALUE
Wells Fargo Income Plus Fund | 1
Table of Contents
Letter to shareholders (unaudited)

Andrew Owen
President
Wells Fargo Funds
Dear Shareholder:
We are pleased to offer you this annual report for the Wells Fargo Income Plus Fund for the 12-month period that ended September 30, 2020. Effective August 3, 2020, the Fund changed its name from the Wells Fargo Strategic Income Fund to the Wells Fargo Income Plus Fund.
Global stock markets saw earlier gains erased in March as governments around the world took unprecedented measures, attempting to stop the spread of COVID-19 at the expense of short-term economic output. However, markets rallied strongly from April on to more than offset those short-term losses as central banks bolstered capital markets and confidence.
For the 12-month period, equities had broadly positive total returns despite intense volatility in March. Non-U.S. developed market equities had weaker performance than emerging market and U.S. stocks. While gains from fixed-income securities were positive, they were more modest than equities. For the period, U.S. stocks, based on the S&P 500 Index,1 gained 15.15%. International stocks, as measured by the MSCI ACWI ex USA Index (Net),2 returned 3.00%, while the MSCI EM Index (Net)3 had stronger performance, with a 10.54% gain. For bond investors, the Bloomberg Barclays U.S. Aggregate Bond Index4 returned 6.98%, the Bloomberg Barclays Global Aggregate ex-USD Index5 gained 5.48%, and the Bloomberg Barclays Municipal Bond Index6 returned 4.09% while the ICE BofA U.S. High Yield Index7 returned 2.30%.
The period began with mixed economic readings.
The fourth quarter of 2019 started on a strong note. U.S.-China trade tensions, which had been building for months, relaxed in October; optimism rose for a U.K. Brexit deal; and macroeconomic data turned positive. The initial estimate of U.S. third-quarter gross domestic product (GDP) growth was a resilient 1.9% annualized rate, while the U.S. unemployment rate fell to a 50-year low of 3.5% in September. However, despite strength among U.S. consumers, business confidence declined while manufacturing activity contracted. Concerned with a potential economic slowdown, the U.S. Federal Reserve (Fed) lowered interest rates a quarter point in late October—its third rate cut in four months. This helped push the S&P 500 Index to an all-time high while emerging market equities rallied and global bonds declined overall, reflecting a broad pickup in risk appetite.
Equity markets continued to rally in November despite ongoing geopolitical risks. Hopes for a U.S.-China trade deal buoyed investor confidence. U.S. business sentiment improved slightly and manufacturing and services activity picked up. While consumer
| 1 | The S&P 500 Index consists of 500 stocks chosen for market size, liquidity, and industry group representation. It is a market-value-weighted index with each stock’s weight in the index proportionate to its market value. You cannot invest directly in an index. |
| 2 | The Morgan Stanley Capital International (MSCI) All Country World Index (ACWI) ex USA Index (Net) is a free-float-adjusted market-capitalization-weighted index that is designed to measure the equity market performance of developed and emerging markets, excluding the United States. Source: MSCI. MSCI makes no express or implied warranties or representations and shall have no liability whatsoever with respect to any MSCI data contained herein. The MSCI data may not be further redistributed or used as a basis for other indices or any securities or financial products. This report is not approved, reviewed, or produced by MSCI. You cannot invest directly in an index. |
| 3 | The MSCI Emerging Markets (EM) Index (Net) is a free-float-adjusted market-capitalization-weighted index that is designed to measure equity market performance of emerging markets. You cannot invest directly in an index. |
| 4 | The Bloomberg Barclays U.S. Aggregate Bond Index is a broad-based benchmark that measures the investment-grade, U.S. dollar-denominated, fixed-rate taxable bond market, including Treasuries, government-related and corporate securities, mortgage-backed securities (agency fixed-rate and hybrid adjustable-rate mortgage pass-throughs), asset-backed securities, and commercial mortgage-backed securities. You cannot invest directly in an index. |
| 5 | The Bloomberg Barclays Global Aggregate ex-USD Index is an unmanaged index that provides a broad-based measure of the global investment-grade fixed-income markets excluding the U.S. dollar-denominated debt market. You cannot invest directly in an index. |
| 6 | The Bloomberg Barclays Municipal Bond Index is an unmanaged index composed of long-term tax-exempt bonds with a minimum credit rating of Baa. You cannot invest directly in an index. |
| 7 | The ICE BofA U.S. High Yield Index is a market-capitalization-weighted index of domestic and Yankee high-yield bonds. The index tracks the performance of high-yield securities traded in the U.S. bond market. You cannot invest directly in an index. Copyright 2020. ICE Data Indices, LLC. All rights reserved. |
2 | Wells Fargo Income Plus Fund
Table of Contents
Letter to shareholders (unaudited)
confidence and purchasing managers’ activity rose in the eurozone, China reported weakening manufacturing and consumer data. Bond yields rose marginally, leading to slightly negative returns for global government and investment-grade corporate bonds.
Financial markets ended 2019 with a boost from the U.S. and China accord on a Phase One trade deal. That, along with the landslide win by the pro-Brexit U.K. Conservative Party in a national election and ongoing central bank support, gave investors greater confidence. U.S. economic indicators were generally positive, with the exception of manufacturing activity and business confidence. Consumer confidence was resilient, fed by a robust labor market, tame inflation, and lower interest rates, which boosted housing affordability and stimulated homebuyer activity. The impeachment of President Trump had little impact on the markets. Meanwhile, slowing Chinese economic activity, partly attributable to the trade war, led to further government stimulus at year-end through lower reserve ratios, allowing banks to lend more money.
The year-end rally continued in early January 2020. However, capital market volatility spiked in late January on concerns over the potential impact of COVID-19 on the global economy and stock markets. With sentiment somewhat souring, perceived safe havens did well in January. The U.S. dollar and Japanese yen both rose and government bonds outperformed equities. While the S&P 500 Index held its ground, emerging market equities tumbled, including those in Asia.
In February, COVID-19 became the major market focus. Fears of the virus’s impact on Chinese and global growth led to expectations of increased global central bank monetary policy support. That led the 10-year U.S. Treasury yield to fall to an all-time low of 1.1%. Although equity markets initially shrugged off concerns about the outbreak, focusing instead on strong fourth-quarter earnings and improving business confidence in January, market sentiment turned sharply lower and the S&P 500 Index lost 8.2% for the month. Oil prices tumbled as Russia and the Organization of the Petroleum Exporting Countries compounded a major decline in oil demand with a brutal price war, partly aimed at dissuading further U.S. shale production, causing the price of West Texas Intermediate crude oil to plummet.
The global spread of COVID-19 led country after country to clamp down on social and business-related activity in order to contain the virus from causing even greater devastation and overwhelming health care systems. This abrupt stoppage of economic activity led to the sharp deceleration of global output, sending economies into a deep contraction. Central banks responded swiftly, slashing interest rates and expanding quantitative easing programs to restore liquidity and confidence to the markets. In the U.S., the Fed introduced several new lending programs, funding investment-grade bonds, money market mutual funds, and commercial paper while purchasing Treasuries, mortgage-backed securities, and overnight repurchase agreements. Meanwhile, stock markets tumbled quickly into a bear market, ending the longest bull stock market in U.S. history.
Markets rebounded strongly in April, fueled by unprecedented government and central bank stimulus measures. The U.S. economy contracted by an annualized 5.0% pace in the first quarter, with 30 million new unemployment insurance claims in six weeks. In the eurozone, first-quarter real GDP shrank 3.8%, with the composite April Flash Purchasing Managers’ Index (PMI), a monthly survey of purchasing managers, falling to an all-time low of 13.5. The European Central Bank expanded its quantitative easing to include the purchase of additional government bonds of countries with the greatest virus-related need, including Italy and Spain. China’s first-quarter GDP fell by 6.8% year over year. However, retail sales, production, and investment showed signs of recovery. Extreme oil-price volatility continued as global supply far exceeded demand.
The global equity market rebound continued in May, with widespread strong monthly gains. Investors regained confidence on reports of early signs of success in human trials
“The global spread of COVID-19 led country after country to clamp down on social and business-related activity in order to contain the virus from causing even greater devastation and overwhelming health care systems.”
Wells Fargo Income Plus Fund | 3
Table of Contents
Letter to shareholders (unaudited)
“The stock market continued to rally in August despite concerns over rising numbers of COVID-19 cases in the United States and several European countries, including France and Spain, as well as the expiration of the $600 weekly bonus unemployment benefit at the end of July.”
of a COVID-19 vaccine. Growth stocks continued to outperform value stocks while returns on global government bonds were generally flat. In the U.S., a gap grew between the stock market rebound and devastating economic data points, including an April unemployment rate of 14.7%, the highest level since World War II. PMIs reflected weakening activity in May in both the manufacturing and services sectors. U.S. corporate earnings reports indicated a 14% year-over-year contraction in earnings from the first quarter of 2019. However, high demand for technology, driven by remote activity, supported robust information technology sector earnings, which helped drive major technology stocks higher.
Financial markets posted widely positive returns in June despite ongoing economic weakness and high levels of uncertainty on the containment of COVID-19 and the timing of an effective vaccine. There were hopeful signs as economies reopened, with both U.S. and U.K. retail sales rebounding sharply in May. However, year over year, sales remained depressed. Vitally important to market sentiment was the ongoing commitment by central banks globally to do all they could to provide economic support through liquidity and low borrowing costs. U.S. economic activity was aided by one-time $1,200 stimulus checks and $600 bonus weekly unemployment benefits that expired at the end of July. However, unemployment remained historically high, easing somewhat from 14.7% in April to 11.1% in June. By month-end, numerous states reported increases of COVID-19 cases. China’s economic recovery picked up momentum in June, though it remained far from a full recovery.
July was a broadly positive month for both global equities and fixed income. However, economic data and a resurgence of COVID-19 cases pointed to the vulnerability of the global economy and the ongoing imperative to regain control of the pandemic. Second-quarter GDP shrank from the previous quarter by 9.5% and 12.1% in the U.S. and the eurozone, respectively. In contrast, China reported a 3.2% year-over-year expansion in its second-quarter GDP. U.S. unemployment remained high despite adding 1.8 million jobs in July, with a double-digit jobless rate persisting. However, manufacturing activity grew in both the U.S. and the eurozone. In Asia, while China’s manufacturing sector continued to expand, activity in Japan and South Korea contracted. In July, a rising concern was the rapid and broad reemergence of COVID-19 infections.
The stock market continued to rally in August despite concerns over rising numbers of COVID-19 cases in the United States and several European countries, including France and Spain, as well as the expiration of the $600 weekly bonus unemployment benefit at the end of July. U.S. stocks had strong monthly gains, led by the FAANG stocks—Facebook, Apple, Amazon, Netflix, and Google (Alphabet)—which dominate these indices and continued to rally. U.S. stocks generally surpassed other broadly positive global equity performance while fixed-income market monthly returns were broadly flat. Generally stronger-than-expected second-quarter earnings boosted investor sentiment along with the Fed’s announcement of a policy shift that will likely lead to longer-term low interest rates and supportive monetary policy. The U.S. Flash PMIs for both manufacturing and services beat expectations while U.S. housing market indicators were strong. In Europe, retail sales expanded and consumer confidence remained steady. China’s economy continued its fairly steady expansion. Overall, developed markets performed better than emerging market equities for the month of August as people took comfort in better-known equities in perceived safer markets.
Stocks grew more volatile in September on mixed economic data. U.S. PMIs showed solid growth in economic activity in both manufacturing and services. However, six months after the bottom fell out of the labor market in the early spring, only half of the 22 million jobs lost had returned. The U.S. unemployment rate fell to 7.9% in September, the fifth straight month of improvement but far higher than the 3.5% pre-COVID-19 rate. Only 661,000 jobs were added for the month, down from 1.5 million in August. Meanwhile, a reported 2.3 million people have given up looking for work. With U.S. Congress failing to pass further fiscal relief and uncertainties surrounding a possible
4 | Wells Fargo Income Plus Fund
Table of Contents
Letter to shareholders (unaudited)
vaccine, doubts crept back into the financial markets. In the U.K., a lack of progress in Brexit talks with the European Union weighed on markets. China’s economy picked up steam, however, with growth fueled by increased global demand, and China’s service sector had its strongest PMI reading in seven years.
Don’t let short-term uncertainty derail long-term investment goals.
Periods of investment uncertainty can present challenges, but experience has taught us that maintaining long-term investment goals can be an effective way to plan for the future. To help you create a sound strategy based on your personal goals and risk tolerance, Wells Fargo Funds offers more than 100 mutual funds spanning a wide range of asset classes and investment styles. Although diversification cannot guarantee an investment profit or prevent losses, we believe it can be an effective way to manage investment risk and potentially smooth out overall portfolio performance. We encourage investors to know their investments and to understand that appropriate levels of risk-taking may unlock opportunities.
Thank you for choosing to invest with Wells Fargo Funds. We appreciate your confidence in us and remain committed to helping you meet your financial needs.
Sincerely,

Andrew Owen
President
Wells Fargo Funds
|
For further information about your Fund, contact your investment professional, visit our website at wfam.com, or call us directly at 1-800-222-8222. |
Notice to Shareholders
At a meeting held on August 10-12, 2020, the Board of Trustees of the Fund approved a change to the Fund’s automatic conversion feature for Class C shares in order to shorten the required holding period from 10 to 8 years. As a result, on a monthly basis beginning November 5, 2020, Class C shares will convert automatically into Class A shares 8 years after the initial date of purchase or, if you acquired your Class C shares through an exchange or conversion from another share class, 8 years after the date you acquired your Class C shares. When Class C shares that you acquired through a purchase or exchange convert, any other Class C shares that you purchased with reinvested dividends and distributions also will convert into Class A shares on a pro rata basis.
Please note that a shorter holding period may apply depending on your intermediary. Please see “Appendix A—Sales Charge Reductions and Waivers for Certain Intermediaries” in the Fund’s prospectus for further information.
Wells Fargo Income Plus Fund | 5
Table of Contents
Letter to shareholders (unaudited)
Notice to Shareholders
Preparing for LIBOR Transition
The global financial industry is preparing to transition away from the London Interbank Offered Rate (LIBOR), a key benchmark interest rate, to new alternative rates. LIBOR underpins more than $350 trillion of financial contracts. It is the benchmark rate for a wide spectrum of products ranging from residential mortgages to corporate bonds to derivatives. Regulators have called for a market-wide transition away from LIBOR to successor reference rates by the end of 2021, which requires proactive steps be taken by issuers, counterparties, and asset managers to identify impacted products and adopt new reference rates.
The Fund holds at least one security that uses LIBOR as a floating reference rate and has a maturity date after 12-31-2021.
Although the transition process away from LIBOR has become increasingly well-defined in advance of the anticipated discontinuation date, there remains uncertainty regarding the nature of successor reference rates, and any potential effects of the transition away from LIBOR on investment instruments that use it as a benchmark rate. The transition process may result in, among other things, increased volatility or illiquidity in markets for instruments that currently rely on LIBOR and could negatively impact the value of certain instruments held by the Fund.
Wells Fargo Asset Management is monitoring LIBOR exposure closely and has put resources and controls in place to manage this transition effectively. The Fund’s portfolio management team is evaluating LIBOR holdings to understand what happens to those securities when LIBOR ceases to exist, including examining security documentation to identify the presence or absence of fallback language identifying a replacement rate to LIBOR.
While the pace of transition away from LIBOR will differ by asset class and investment strategy, the portfolio management team will monitor market conditions for those holdings to identify and mitigate deterioration or volatility in pricing and liquidity and ensure appropriate actions are taken in a timely manner.
Further information regarding the potential risks associated with the discontinuation of LIBOR can be found in the Fund’s Statement of Additional Information.
6 | Wells Fargo Income Plus Fund
Table of Contents
This page is intentionally left blank.
Table of Contents
Performance highlights (unaudited)
Investment objective
The Fund seeks total return, consisting of a high level of current income and capital appreciation.
Manager
Wells Fargo Funds Management, LLC
Subadviser
Wells Capital Management Incorporated
Portfolio managers
Christopher Kauffman, CFA®‡†
Jay Mueller, CFA®‡†
Janet Rilling, CFA®‡†
Michael Schueller, CFA®‡†
Noah Wise, CFA®‡
Average annual total returns (%) as of September 30, 2020
| Including sales charge | Excluding sales charge | Expense ratios1 (%) | ||||||||||||||||||||||||||||||||
| Inception date | 1 year | 5 year | Since inception | 1 year | 5 year | Since inception | Gross | Net2 | ||||||||||||||||||||||||||
| Class A (WSIAX) | 1-31-2013 | 0.37 | 3.37 | 1.89 | 4.60 | 4.22 | 2.44 | 1.10 | 0.92 | |||||||||||||||||||||||||
| Class C (WSICX) | 1-31-2013 | 3.45 | 3.59 | 1.77 | 4.45 | 3.59 | 1.77 | 1.85 | 1.67 | |||||||||||||||||||||||||
| Administrator Class (WSIDX) | 1-31-2013 | – | – | – | 4.72 | 4.33 | 2.57 | 1.04 | 0.77 | |||||||||||||||||||||||||
| Institutional Class (WSINX) | 1-31-2013 | – | – | – | 4.96 | 4.55 | 2.76 | 0.77 | 0.62 | |||||||||||||||||||||||||
| Bloomberg Barclays U.S. Aggregate Bond Index3 | – | – | – | – | 6.98 | 4.18 | 3.46 | * | – | – | ||||||||||||||||||||||||
| Bloomberg Barclays U.S. Universal Bond Index4 | – | – | – | – | 6.68 | 4.49 | 3.65 | * | – | – | ||||||||||||||||||||||||
| ICE BofA 3-Month LIBOR Constant Maturity Index5 | – | – | – | – | 1.57 | 1.50 | 1.07 | * | – | – | ||||||||||||||||||||||||
| * | Return is based on inception date of the oldest Fund class. |
Figures quoted represent past performance, which is no guarantee of future results, and do not reflect taxes that a shareholder may pay on an investment in a fund. Investment return and principal value of an investment will fluctuate so that an investor’s shares, when redeemed, may be worth more or less than their original cost. Performance shown without sales charges would be lower if sales charges were reflected. Current performance may be lower or higher than the performance data quoted, which assumes the reinvestment of dividends and capital gains. Current month-end performance is available on the Fund’s website, wfam.com.
Index returns do not include transaction costs associated with buying and selling securities, any mutual fund fees or expenses, or any taxes. It is not possible to invest directly in an index.
For Class A shares, the maximum front-end sales charge is 4.00%. For Class C shares, the maximum contingent deferred sales charge is 1.00%. Performance including a contingent deferred sales charge assumes the sales charge for the corresponding time period. Administrator Class and Institutional Class shares are sold without a front-end sales charge or contingent deferred sales charge.
Bond values fluctuate in response to the financial condition of individual issuers, general market and economic conditions, and changes in interest rates. Changes in market conditions and government policies may lead to periods of heightened volatility in the bond market and reduced liquidity for certain bonds held by the Fund. In general, when interest rates rise, bond values fall and investors may lose principal value. Interest rate changes and their impact on the Fund and its share price can be sudden and unpredictable. High-yield securities have a greater risk of default and tend to be more volatile than higher-rated debt securities. Loans are subject to risks similar to those associated with other below investment- grade bond investments, such as credit risk (for example, risk of issuer default), below-investment-grade bond risk (for example, risk of greater volatility in value), and risk that the loan may become illiquid or difficult to price. Foreign investments are especially volatile and can rise or fall dramatically due to differences in the political and economic conditions of the host country. These risks are generally intensified in emerging markets. The use of derivatives may reduce returns and/or increase volatility. Certain investment strategies tend to increase the total risk of an investment (relative to the broader market). The Fund is exposed to mortgage- and asset-backed securities risk, regulatory risk, and geographic risk. Consult the Fund’s prospectus for additional information on these and other risks.
Please see footnotes on page 9.
8 | Wells Fargo Income Plus Fund
Table of Contents
Performance highlights (unaudited)
| Growth of $10,000 investment as of September 30, 20206 |
|
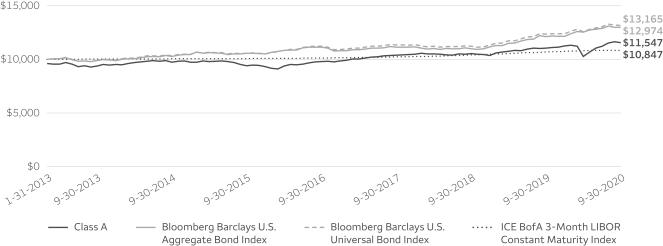
| ‡ | CFA® and Chartered Financial Analyst® are trademarks owned by CFA Institute. |
| † | Mr. Kauffman, Mr. Mueller, Miss Rilling, and Mr. Schueller became portfolio managers of the Fund on August 3, 2020. |
| 1 | Reflects the expense ratios as stated in the most recent prospectuses, which include the impact of 0.02% in acquired fund fees and expenses. The expense ratios shown are subject to change and may differ from the annualized expense ratios shown in the financial highlights of this report, which do not include acquired fund fees and expenses. |
| 2 | The manager has contractually committed through January 31, 2021, to waive fees and/or reimburse expenses to the extent necessary to cap total annual fund operating expenses after fee waivers at 0.90% for Class A, 1.65% for Class C, 0.75% for Administrator Class, and 0.60% for Institutional Class. Brokerage commissions, stamp duty fees, interest, taxes, acquired fund fees and expenses (if any), and extraordinary expenses are excluded from the expense caps. Prior to or after the commitment expiration date, the caps may be increased or the commitment to maintain the caps may be terminated only with the approval of the Board of Trustees. Without these caps, the Fund’s returns would have been lower. The expense ratio paid by an investor is the net expense ratio (the total annual fund operating expenses after fee waivers) as stated in the prospectuses. |
| 3 | The Bloomberg Barclays U.S. Aggregate Bond Index is a broad-based benchmark that measures the investment-grade, U.S. dollar–denominated, fixed-rate taxable bond market, including Treasuries, government-related and corporate securities, mortgage-backed securities (agency fixed-rate and hybrid adjustable-rate mortgage pass-throughs), asset-backed securities, and commercial mortgage-backed securities. You cannot invest directly in an index. Effective August 17, 2020, the Fund replaced its performance benchmarks, the Bloomberg Barclays U.S. Universal Bond Index and the ICE BofA 3-Month LIBOR Constant Maturity Index, with the Bloomberg Barclays U.S. Aggregate Bond Index in order to better match the Fund’s investment strategy. |
| 4 | The Bloomberg Barclays U.S. Universal Bond Index is an unmanaged market-value-weighted performance benchmark for the U.S. dollar denominated bond market, which includes investment-grade, high-yield, and emerging markets debt securities with maturities of one year or more. You cannot invest directly in an index. |
| 5 | The ICE BofA 3-Month LIBOR Constant Maturity Index is based on the assumed purchase of a synthetic instrument having three months to maturity and with a coupon equal to the closing quote for three-month LIBOR. That issue is sold the following day (priced at a yield equal to the current-day closing three-month LIBOR) and is rolled into a new three-month instrument. The index, therefore, will always have a constant maturity equal to exactly three months. You cannot invest directly in an index. Copyright 2020. ICE Data Indices, LLC. All rights reserved. |
| 6 | The chart compares the performance of Class A shares since inception with the Bloomberg Barclays U.S. Aggregate Bond Index, Bloomberg Barclays U.S. Universal Bond Index, and the ICE BofA 3-Month LIBOR Constant Maturity Index. The chart assumes a hypothetical investment of $10,000 in Class A shares and reflects all operating expenses and assumes the maximum initial sales charge of 4.00%. |
| 7 | The ten largest holdings, excluding cash, cash equivalents and any money market funds, are calculated based on the value of the investments divided by total net assets of the Fund. Holdings are subject to change and may have changed since the date specified. |
| 8 | Amounts are calculated based on the total long-term investments of the Fund. These amounts are subject to change and may have changed since the date specified. |
Wells Fargo Income Plus Fund | 9
Table of Contents
Performance highlights (unaudited)
MANAGER’S DISCUSSION
Effective August 3, 2020, Wells Fargo Strategic Income Fund was renamed the Wells Fargo Income Plus Fund. Four previous portfolio managers were removed from the Fund and four were added: Janet Rilling, CFA; Jay Mueller, CFA; Christopher Kauffman, CFA; and Michael Schueller, CFA. Noah Wise, CFA, remains as a lead manager on the Fund, maintaining his role leading asset allocation and in global credit selection. The Fund’s official benchmark also changed from the Bloomberg Barclays U.S. Universal Bond Index and the ICE BofA 3-Month LIBOR Constant Maturity Index to the Bloomberg Barclays U.S. Aggregate Bond Index on August 17, 2020.
Fund highlights
| ∎ | The Fund underperformed the Bloomberg Barclays U.S. Aggregate Bond Index for the 12-month period that ended September 30, 2020. |
| ∎ | The Fund’s shorter duration posture compared with the Bloomberg Barclays U.S. Universal Bond Index detracted from performance, while the longer duration position relative to the ICE BofA 3-Month LIBOR Constant Maturity Index contributed to performance. |
| ∎ | The Fund’s underweight to U.S. Treasuries was the biggest detractor relative to broad-based Bloomberg benchmarks, while a market value overweight to credit contributed. Holdings in European investment-grade and high-yield corporate bonds, asset-backed securities (ABS), collateralized loan obligations (CLOs), and emerging market bonds detracted slightly from benchmark-relative performance. However, most posted positive returns, contributing to outperformance versus the 3-Month LIBOR Index. U.S. high-yield bonds tended to underperform similar-duration Treasuries during the period and, despite posting positive returns, detracted from performance relative to the Bloomberg Barclays U.S. Universal Bond Index. |
The coronavirus made a significant impact.
After years of steady expansion, the U.S. economy received a traumatic shock in 2020 with the arrival of the coronavirus. Public reaction and government-ordered lockdowns resulted in a collapse in economic activity, with the second quarter of 2020 recording a nearly 10% drop in gross domestic product. Unemployment swiftly soared to double digits. Most areas of consumption declined precipitously. Travel and leisure services bore the brunt of the disruption. Spurred by a negative demand shock, prices for many goods declined during the March–April period, pushing most inflation indicators substantially lower.
The Federal Reserve responded to the pandemic with a dramatic easing of monetary policy, setting overnight rate targets to near zero, as well as purchasing bonds for its own account. A host of credit support measures were put in place to improve the functioning of teetering financial markets. In their actions and rhetoric, the monetary authorities made it clear that an aggressive posture to support the economic and financial markets would be in place as long as needed.
| Ten largest holdings (%) as of September 30, 20207 | ||||
Xtrackers USD High Yield Corporate Bond ETF | 3.21 | |||
U.S. Treasury Note, 0.50%, 6-3-2027 | 2.51 | |||
VanEck Vectors J. P. Morgan EM Local Currency Bond ETF | 1.82 | |||
Longtrain Leasing III LLC Series 2015-1A Class A2, 4.06%, 1-15-2045 | 1.06 | |||
GS Mortgage Security Trust Series 2014-GC22 Class AS, 4.11%, 6-10-2047 | 1.04 | |||
Transatlantic Holdings Incorporated, 8.00%, 11-30-2039 | 1.03 | |||
Hertz Fleet Lease Funding LP Series 2019-1 Class E, 4.62%, 1-10-2033 | 1.03 | |||
Verus Securitization Trust Series 2019-3 Class A2, 2.94%, 7-25-2059 | 0.99 | |||
Ellington Financial Mortgage Trust Series 2019-1 Class M1, 3.59%, 6-25-2059 | 0.99 | |||
GS Mortgage Security Trust Series 2018-LUAU Class B, 1.55%, 11-15-2032 | 0.97 | |||
Fiscal policy also responded swiftly to the pandemic in the form of relief payments to the general public as well as extended unemployment benefits. These measures more than offset the loss of income associated with unemployment increases and other wage losses for many people.
Economic activity bottomed in late April, and by the end of May both consumption and employment were turning around. Substantial job gains occurred while claims for unemployment insurance began to subside. Prices generally stabilized, with oil rallying from distressed levels and core inflation measures rebounding from their crisis lows. Stock indices hit new all-time highs over the course of the summer, while Treasury yields remained extremely low. Credit spreads, which widened sharply in the March–April period, narrowed substantially in the ensuing few months.
Please see footnotes on page 9.
10 | Wells Fargo Income Plus Fund
Table of Contents
Performance highlights (unaudited)
The Fund increased its overall allocation to high-yield sectors, including U.S. and European corporate bonds, and made reductions to investment-grade securitized sectors, including mortgages, CLOs, ABS, and commercial mortgage-backed securities.
Most of the additions came during the volatility experienced at the beginning of 2020 following coronavirus-related market disruptions and tended to focus on sectors not directly exposed to continuing business risk associated with the coronavirus. We added marginally to European high-yield securities and reduced investment-grade securitized sectors. We maintain a meaningful allocation to high-yield securities in general and have added credit opportunistically in the new issue investment-grade market, which has provided attractive entry points due to new issue concessions.
| Portfolio composition as of September 30, 20208 |
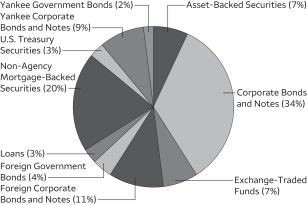 |
As the period came to a close, generally speaking, relative value had deteriorated in emerging market credit as credit fundamentals continued to deteriorate. We continue to favor an allocation to U.S. credit, both investment grade and high yield, due to somewhat attractive valuations and the positive technical backdrop that has been historically supportive of the asset class. The current desire for U.S. high-yield exposure is more modest than when spreads were wider earlier in 2020. The lack of appetite for another widespread shutdown likely limits the degree of potential credit spread widening, and the market will likely look past deteriorating credit metrics and toward a recovery next year amid global policy support.
Recovery and uncertainty.
The outlook holds considerable uncertainty, as the ultimate resolution of the coronavirus pandemic remains unknown. Consumer behavior is likely to have been altered by the crisis, though lower consumption in some areas, such as travel and leisure, could well be offset by higher spending on housing, in-home entertainment, and the like. The upcoming U.S. elections present an additional source of uncertainty, with the potential for meaningful swings in tax, spending, and regulatory policies. Bearing in mind the higher-than-normal degree of uncertainty, we expect the present recovery to continue, albeit at a gradually declining pace, as pent-up demand is sated and lingering damage from the pandemic proves difficult to heal. We believe it could take a year or longer to make up for all the shortfall.
We will implement our time-tested process and philosophy to attempt to capitalize on market dislocations. We maintain liquidity and dry powder, giving us ample flexibility to selectively add risk within the portfolio. In March and April 2020, we exploited market volatility through a number of tactical trades in sectors with significant dislocations, including an increase in high-yield exposure early in the quarter. Within emerging markets, we added modest exposure in longer-maturity credits that brought new issues at attractive discounts. While we continue to see value in certain pockets of risk markets, the quick rebound in spreads following dislocations in March, and the unknown pace of coronavirus-related economic disruptions, we continue to believe that security selection within asset classes, as well as a well-thought-out asset allocation, will be critical to portfolio management.
Please see footnotes on page 9.
Wells Fargo Income Plus Fund | 11
Table of Contents
As a shareholder of the Fund, you incur two types of costs: (1) transaction costs, including sales charges (loads) on purchase payments and contingent deferred sales charges (if any) on redemptions and (2) ongoing costs, including management fees, distribution (12b-1) and/or shareholder servicing fees, and other Fund expenses. This example is intended to help you understand your ongoing costs (in dollars) of investing in the Fund and to compare these costs with the ongoing costs of investing in other mutual funds.
The example is based on an investment of $1,000 invested at the beginning of the six-month period and held for the entire period from April 1, 2020 to September 30, 2020.
Actual expenses
The “Actual” line of the table below provides information about actual account values and actual expenses. You may use the information in this line, together with the amount you invested, to estimate the expenses that you paid over the period. Simply divide your account value by $1,000 (for example, an $8,600 account value divided by $1,000 = 8.6), then multiply the result by the number in the “Actual” line under the heading entitled “Expenses paid during period” for your applicable class of shares to estimate the expenses you paid on your account during this period.
Hypothetical example for comparison purposes
The “Hypothetical” line of the table below provides information about hypothetical account values and hypothetical expenses based on the Fund’s actual expense ratio and an assumed rate of return of 5% per year before expenses, which is not the Fund’s actual return. The hypothetical account values and expenses may not be used to estimate the actual ending account balance or expenses you paid for the period. You may use this information to compare the ongoing costs of investing in the Fund and other funds. To do so, compare this 5% hypothetical example with the 5% hypothetical examples that appear in the shareholder reports of the other funds.
Please note that the expenses shown in the table are meant to highlight your ongoing costs only and do not reflect any transactional costs, such as sales charges (loads) and contingent deferred sales charges. Therefore, the “Hypothetical” line of the table is useful in comparing ongoing costs only and will not help you determine the relative total costs of owning different funds. In addition, if these transactional costs were included, your costs would have been higher.
| Beginning account value 4-1-2020 | Ending account value 9-30-2020 | Consolidated expenses paid during the period1 | Annualized net expense ratio | |||||||||||||
Class A | ||||||||||||||||
Actual | $ | 1,000.00 | $ | 1,123.56 | $ | 4.78 | 0.90 | % | ||||||||
Hypothetical (5% return before expenses) | $ | 1,000.00 | $ | 1,020.56 | $ | 4.55 | 0.90 | % | ||||||||
Class C | ||||||||||||||||
Actual | $ | 1,000.00 | $ | 1,126.60 | $ | 8.80 | 1.65 | % | ||||||||
Hypothetical (5% return before expenses) | $ | 1,000.00 | $ | 1,016.80 | $ | 8.34 | 1.65 | % | ||||||||
Administrator Class | ||||||||||||||||
Actual | $ | 1,000.00 | $ | 1,124.28 | $ | 3.99 | 0.75 | % | ||||||||
Hypothetical (5% return before expenses) | $ | 1,000.00 | $ | 1,021.31 | $ | 3.80 | 0.75 | % | ||||||||
Institutional Class | ||||||||||||||||
Actual | $ | 1,000.00 | $ | 1,124.57 | $ | 3.19 | 0.60 | % | ||||||||
Hypothetical (5% return before expenses) | $ | 1,000.00 | $ | 1,022.06 | $ | 3.04 | 0.60 | % | ||||||||
| 1 | Consolidated expenses paid is equal to the annualized net expense ratio of each class multiplied by the average account value over the period, multiplied by the number of days in the most recent fiscal half-year divided by the number of days in the fiscal year (to reflect the one-half-year period). |
12 | Wells Fargo Income Plus Fund
Table of Contents
Consolidated portfolio of investments—September 30, 2020
| Interest rate | Maturity date | Principal | Value | |||||||||||||
| Asset-Backed Securities: 6.29% |
| |||||||||||||||
AmeriCredit Automobile Receivables Trust Series 2018-3 Class D | 4.04 | % | 11-18-2024 | $ | 1,100,000 | $ | 1,162,782 | |||||||||
Avis Budget Rental Car Funding LLC Series 2017-1A Class C 144A | 4.15 | 9-20-2023 | 650,000 | 639,780 | ||||||||||||
Bank of the West Auto Trust Series 2018-1 Class C 144A | 3.98 | 5-15-2024 | 1,100,000 | 1,140,773 | ||||||||||||
Chesapeake Funding II LLC Series 2017-3A Class C 144A | 2.78 | 8-15-2029 | 800,000 | 804,729 | ||||||||||||
Chesapeake Funding II LLC Series 2017-3A Class D 144A | 3.38 | 8-15-2029 | 120,000 | 121,018 | ||||||||||||
Chesapeake Funding II LLC Series 2017-4A Class D 144A | 3.26 | 11-15-2029 | 400,000 | 399,306 | ||||||||||||
Coinstar Funding LLC Series 2017-1A Class A2 144A | 5.22 | 4-25-2047 | 1,078,763 | 1,023,400 | ||||||||||||
DRB Prime Student Loan Trust Series 2017-C Class C 144A | 3.29 | 11-25-2042 | 295,202 | 305,128 | ||||||||||||
Hertz Fleet Lease Funding LP Series 2019-1 Class E 144A | 4.62 | 1-10-2033 | 1,550,000 | 1,563,702 | ||||||||||||
Hertz Vehicle Financing LLC Series 2015-3A Class B 144A | 3.71 | 9-25-2021 | 750,000 | 752,044 | ||||||||||||
SMB Private Education Loan Trust Series 2015-C Class C 144A | 4.50 | 9-17-2046 | 290,000 | 314,917 | ||||||||||||
SoFi Consumer Loan Program Trust Series 2018-1 Class C 144A | 3.97 | 2-25-2027 | 700,000 | 709,563 | ||||||||||||
SoFi Consumer Loan Program Trust Series 2018-4 Class D 144A | 4.76 | 11-26-2027 | 300,000 | 309,257 | ||||||||||||
SoFi Professional Loan Program LLC Series 2017-E Class B 144A | 3.49 | 11-26-2040 | 300,000 | 313,356 | ||||||||||||
Total Asset-Backed Securities (Cost $9,426,611) |
| 9,559,755 | ||||||||||||||
|
| |||||||||||||||
| Shares | ||||||||||||||||
| Common Stocks: 0.14% |
| |||||||||||||||
| Energy: 0.14% | ||||||||||||||||
| Oil, Gas & Consumable Fuels: 0.14% | ||||||||||||||||
Denbury Incorporated † |
| 11,919 | 209,779 | |||||||||||||
|
| |||||||||||||||
Total Common Stocks (Cost $388,269) |
| 209,779 | ||||||||||||||
|
| |||||||||||||||
| Principal | ||||||||||||||||
| Corporate Bonds and Notes: 31.14% |
| |||||||||||||||
Communication Services: 3.85% |
| |||||||||||||||
| Diversified Telecommunication Services: 0.28% | ||||||||||||||||
Cablevision Lightpath LLC 144A | 5.63 | 9-15-2028 | $ | 100,000 | 101,610 | |||||||||||
Consolidated Communications Incorporated 144A%% | 6.50 | 10-1-2028 | 105,000 | 107,100 | ||||||||||||
Level 3 Financing Incorporated 144A | 3.63 | 1-15-2029 | 155,000 | 153,063 | ||||||||||||
Level 3 Financing Incorporated | 5.38 | 1-15-2024 | 60,000 | 60,552 | ||||||||||||
| 422,325 | ||||||||||||||||
|
| |||||||||||||||
| Interactive Media & Services: 0.02% | ||||||||||||||||
Match Group Incorporated 144A | 4.13 | 8-1-2030 | 25,000 | 25,289 | ||||||||||||
|
| |||||||||||||||
| Media: 3.08% | ||||||||||||||||
Block Communications Incorporated 144A | 4.88 | 3-1-2028 | 150,000 | 153,000 | ||||||||||||
CCO Holdings LLC 144A | 4.50 | 8-15-2030 | 175,000 | 183,758 | ||||||||||||
Cinemark Incorporated | 5.13 | 12-15-2022 | 250,000 | 222,500 | ||||||||||||
Cinemark USA Incorporated | 4.88 | 6-1-2023 | 500,000 | 427,500 | ||||||||||||
CSC Holdings LLC 144A | 4.13 | 12-1-2030 | 50,000 | 50,963 | ||||||||||||
CSC Holdings LLC 144A | 4.63 | 12-1-2030 | 200,000 | 200,946 | ||||||||||||
CSC Holdings LLC 144A | 6.50 | 2-1-2029 | 450,000 | 501,750 | ||||||||||||
Diamond Sports Group LLC 144A | 6.63 | 8-15-2027 | 75,000 | 39,000 | ||||||||||||
Discovery Communications LLC | 4.65 | 5-15-2050 | 860,000 | 980,613 | ||||||||||||
Gray Television Incorporated 144A | 5.13 | 10-15-2024 | 100,000 | 102,000 | ||||||||||||
Gray Television Incorporated 144A | 5.88 | 7-15-2026 | 150,000 | 155,625 | ||||||||||||
Lamar Media Corporation 144A | 4.00 | 2-15-2030 | 200,000 | 200,000 | ||||||||||||
Nexstar Broadcasting Incorporated 144A | 5.63 | 7-15-2027 | 150,000 | 157,343 | ||||||||||||
The accompanying notes are an integral part of these consolidated financial statements.
Wells Fargo Income Plus Fund | 13
Table of Contents
Consolidated portfolio of investments—September 30, 2020
| Interest rate | Maturity date | Principal | Value | |||||||||||||
| Media (continued) | ||||||||||||||||
Nexstar Broadcasting Incorporated 144A | 4.75 | % | 11-1-2028 | $ | 160,000 | $ | 163,200 | |||||||||
Nielsen Finance LLC 144A | 5.88 | 10-1-2030 | 275,000 | 284,625 | ||||||||||||
Outfront Media Capital Corporation 144A | 4.63 | 3-15-2030 | 175,000 | 168,000 | ||||||||||||
Outfront Media Capital Corporation 144A | 5.00 | 8-15-2027 | 25,000 | 24,375 | ||||||||||||
QVC Incorporated | 4.75 | 2-15-2027 | 250,000 | 256,753 | ||||||||||||
Salem Media Group Incorporated 144A | 6.75 | 6-1-2024 | 175,000 | 151,375 | ||||||||||||
Scripps Escrow Incorporated 144A | 5.88 | 7-15-2027 | 125,000 | 120,625 | ||||||||||||
The E.W. Scripps Company 144A | 5.13 | 5-15-2025 | 150,000 | 146,625 | ||||||||||||
| 4,690,576 | ||||||||||||||||
|
| |||||||||||||||
| Wireless Telecommunication Services: 0.47% | ||||||||||||||||
Sprint Spectrum Company 144A | 5.15 | 9-20-2029 | 65,000 | 76,538 | ||||||||||||
T Mobile USA Incorporated 144A | 4.50 | 4-15-2050 | 535,000 | 643,049 | ||||||||||||
| 719,587 | ||||||||||||||||
|
| |||||||||||||||
Consumer Discretionary: 3.72% |
| |||||||||||||||
| Auto Components: 0.77% | ||||||||||||||||
Adient Global Holdings 144A | 3.50 | 8-15-2024 | 515,000 | 555,507 | ||||||||||||
Allison Transmission Incorporated 144A | 4.75 | 10-1-2027 | 225,000 | 231,469 | ||||||||||||
Allison Transmission Incorporated 144A | 5.00 | 10-1-2024 | 150,000 | 151,509 | ||||||||||||
Allison Transmission Incorporated 144A | 5.88 | 6-1-2029 | 25,000 | 27,038 | ||||||||||||
Clarios Global LP 144A | 6.25 | 5-15-2026 | 200,000 | 209,710 | ||||||||||||
| 1,175,233 | ||||||||||||||||
|
| |||||||||||||||
| Automobiles: 0.37% | ||||||||||||||||
Ford Motor Company | 4.75 | 1-15-2043 | 160,000 | 144,868 | ||||||||||||
Ford Motor Company | 7.45 | 7-16-2031 | 80,000 | 91,745 | ||||||||||||
Ford Motor Company | 9.00 | 4-22-2025 | 260,000 | 298,093 | ||||||||||||
Ford Motor Company | 9.63 | 4-22-2030 | 25,000 | 32,281 | ||||||||||||
| 566,987 | ||||||||||||||||
|
| |||||||||||||||
| Diversified Consumer Services: 0.19% | ||||||||||||||||
Carriage Services Incorporated 144A | 6.63 | 6-1-2026 | 275,000 | 288,750 | ||||||||||||
|
| |||||||||||||||
| Hotels, Restaurants & Leisure: 1.07% | ||||||||||||||||
GLP Capital LP | 4.00 | 1-15-2031 | 1,000,000 | 1,041,030 | ||||||||||||
KFC Holding Company 144A | 5.00 | 6-1-2024 | 250,000 | 256,325 | ||||||||||||
Royal Caribbean Cruises | 4.25 | 6-15-2023 | 250,000 | 291,734 | ||||||||||||
Yum! Brands Incorporated 144A | 7.75 | 4-1-2025 | 25,000 | 27,625 | ||||||||||||
| 1,616,714 | ||||||||||||||||
|
| |||||||||||||||
| Multiline Retail: 0.06% | ||||||||||||||||
Kohl’s Corporation | 9.50 | 5-15-2025 | 75,000 | 88,487 | ||||||||||||
|
| |||||||||||||||
| Specialty Retail: 0.46% | ||||||||||||||||
Asbury Automotive Group Incorporated 144A | 4.50 | 3-1-2028 | 22,000 | 22,138 | ||||||||||||
Asbury Automotive Group Incorporated 144A | 4.75 | 3-1-2030 | 110,000 | 110,825 | ||||||||||||
Lithia Motors Incorporated 144A | 4.63 | 12-15-2027 | 200,000 | 206,500 | ||||||||||||
Penske Auto Group Incorporated | 5.38 | 12-1-2024 | 150,000 | 152,327 | ||||||||||||
Sonic Automotive Incorporated | 6.13 | 3-15-2027 | 200,000 | 206,500 | ||||||||||||
| 698,290 | ||||||||||||||||
|
| |||||||||||||||
The accompanying notes are an integral part of these consolidated financial statements.
14 | Wells Fargo Income Plus Fund
Table of Contents
Consolidated portfolio of investments—September 30, 2020
| Interest rate | Maturity date | Principal | Value | |||||||||||||
| Textiles, Apparel & Luxury Goods: 0.80% | ||||||||||||||||
Levi Strauss & Company | 5.00 | % | 5-1-2025 | $ | 200,000 | $ | 204,625 | |||||||||
Tapestry Incorporated | 4.13 | 7-15-2027 | 1,000,000 | 983,789 | ||||||||||||
The William Carter Company 144A | 5.50 | 5-15-2025 | 25,000 | 26,188 | ||||||||||||
| 1,214,602 | ||||||||||||||||
|
| |||||||||||||||
Consumer Staples: 0.54% |
| |||||||||||||||
| Food & Staples Retailing: 0.33% | ||||||||||||||||
Walgreens Boots Alliance | 4.10 | 4-15-2050 | 500,000 | 503,838 | ||||||||||||
|
| |||||||||||||||
| Food Products: 0.21% | ||||||||||||||||
Kraft Heinz Foods Company 144A | 4.88 | 10-1-2049 | 305,000 | 321,229 | ||||||||||||
|
| |||||||||||||||
Energy: 5.58% |
| |||||||||||||||
| Energy Equipment & Services: 0.64% | ||||||||||||||||
Bristow Group Incorporated | 7.75 | 12-15-2022 | 125,000 | 119,388 | ||||||||||||
Hilcorp Energy Company 144A | 5.75 | 10-1-2025 | 175,000 | 158,375 | ||||||||||||
NGPL PipeCo LLC 144A | 7.77 | 12-15-2037 | 25,000 | 31,676 | ||||||||||||
Oceaneering International Incorporated | 6.00 | 2-1-2028 | 150,000 | 93,825 | ||||||||||||
Pattern Energy Operations LP 144A | 4.50 | 8-15-2028 | 300,000 | 311,250 | ||||||||||||
USA Compression Partners LP | 6.88 | 4-1-2026 | 250,000 | 247,813 | ||||||||||||
| 962,327 | ||||||||||||||||
|
| |||||||||||||||
| Oil, Gas & Consumable Fuels: 4.94% | ||||||||||||||||
Antero Midstream Partners LP 144A | 5.75 | 1-15-2028 | 300,000 | 246,750 | ||||||||||||
Apache Corporation | 4.75 | 4-15-2043 | 100,000 | 88,840 | ||||||||||||
Archrock Partners LP 144A | 6.25 | 4-1-2028 | 25,000 | 23,563 | ||||||||||||
Archrock Partners LP 144A | 6.88 | 4-1-2027 | 300,000 | 288,063 | ||||||||||||
Baker Hughes Holdings LLC | 4.49 | 5-1-2030 | 750,000 | 853,325 | ||||||||||||
Buckeye Partners LP | 5.85 | 11-15-2043 | 100,000 | 92,635 | ||||||||||||
Callon Petroleum Company | 8.25 | 7-15-2025 | 278,000 | 75,060 | ||||||||||||
Callon Petroleum Company | 6.13 | 10-1-2024 | 75,000 | 21,375 | ||||||||||||
Cheniere Energy Partners LP | 4.50 | 10-1-2029 | 375,000 | 384,563 | ||||||||||||
Cheniere Energy Partners LP | 5.25 | 10-1-2025 | 100,000 | 102,300 | ||||||||||||
Cheniere Energy Partners LP | 5.63 | 10-1-2026 | 200,000 | 208,000 | ||||||||||||
EnLink Midstream Partners LP | 4.40 | 4-1-2024 | 25,000 | 22,518 | ||||||||||||
EnLink Midstream Partners LP | 5.05 | 4-1-2045 | 175,000 | 111,463 | ||||||||||||
EnLink Midstream Partners LP | 5.45 | 6-1-2047 | 362,000 | 226,923 | ||||||||||||
EnLink Midstream Partners LP | 5.60 | 4-1-2044 | 75,000 | 48,188 | ||||||||||||
Enviva Partners LP 144A | 6.50 | 1-15-2026 | 525,000 | 553,219 | ||||||||||||
EQM Midstream Partners LP 144A | 6.50 | 7-1-2027 | 25,000 | 26,501 | ||||||||||||
EQT Corporation | 1.75 | 5-1-2026 | 750,000 | 854,773 | ||||||||||||
Murphy Oil Corporation | 5.75 | 8-15-2025 | 155,000 | 135,218 | ||||||||||||
Murphy Oil Corporation | 5.88 | 12-1-2027 | 200,000 | 170,808 | ||||||||||||
Occidental Petroleum Corporation | 4.63 | 6-15-2045 | 200,000 | 144,524 | ||||||||||||
Occidental Petroleum Corporation | 6.20 | 3-15-2040 | 50,000 | 41,000 | ||||||||||||
Occidental Petroleum Corporation | 6.45 | 9-15-2036 | 520,000 | 442,010 | ||||||||||||
Occidental Petroleum Corporation | 6.60 | 3-15-2046 | 25,000 | 21,583 | ||||||||||||
ONEOK Incorporated | 7.15 | 1-15-2051 | 500,000 | 593,107 | ||||||||||||
Rockies Express Pipeline LLC 144A | 6.88 | 4-15-2040 | 375,000 | 390,274 | ||||||||||||
Southwestern Energy Company | 7.75 | 10-1-2027 | 225,000 | 218,250 | ||||||||||||
Sunoco Logistics Partner LP | 5.40 | 10-1-2047 | 750,000 | 706,932 | ||||||||||||
Tallgrass Energy Partners LP 144A | 5.50 | 9-15-2024 | 225,000 | 211,500 | ||||||||||||
Western Midstream Operating LP | 5.05 | 2-1-2030 | 50,000 | 48,746 | ||||||||||||
Western Midstream Operating LP | 5.30 | 3-1-2048 | 175,000 | 140,875 | ||||||||||||
Western Midstream Operating LP | 6.25 | 2-1-2050 | 25,000 | 23,156 | ||||||||||||
| 7,516,042 | ||||||||||||||||
|
| |||||||||||||||
The accompanying notes are an integral part of these consolidated financial statements.
Wells Fargo Income Plus Fund | 15
Table of Contents
Consolidated portfolio of investments—September 30, 2020
| Interest rate | Maturity date | Principal | Value | |||||||||||||
| Financials: 8.09% | ||||||||||||||||
| Banks: 1.34% | ||||||||||||||||
Bank of America Corporation (3 Month LIBOR +4.55%) ± | 6.30 | % | 12-29-2049 | $ | 265,000 | $ | 299,477 | |||||||||
JPMorgan Chase & Company (U.S. SOFR +3.13%) ±(s) | 4.60 | 2-1-2025 | 500,000 | 490,000 | ||||||||||||
JPMorgan Chase & Company (3 Month LIBOR +3.25%) ± | 5.15 | 12-29-2049 | 350,000 | 351,750 | ||||||||||||
JPMorgan Chase & Company (3 Month LIBOR +3.30%) ± | 6.00 | 12-31-2049 | 100,000 | 102,500 | ||||||||||||
PNC Financial Services (3 Month LIBOR +3.30%) ± | 5.00 | 12-29-2049 | 250,000 | 263,925 | ||||||||||||
Truist Financial Corporation (5 Year Treasury Constant Maturity +4.61%) ±(s) | 4.95 | 9-1-2025 | 500,000 | 526,250 | ||||||||||||
| 2,033,902 | ||||||||||||||||
|
| |||||||||||||||
| Capital Markets: 0.66% | ||||||||||||||||
Bank of NY Mellon Corporation (5 Year Treasury Constant Maturity +4.36%) ±(s) | 4.70 | 9-20-2025 | 185,000 | 196,285 | ||||||||||||
Charles Schwab Corporation (5 Year Treasury Constant Maturity +4.97%) ±(s) | 5.38 | 6-1-2025 | 750,000 | 812,663 | ||||||||||||
| 1,008,948 | ||||||||||||||||
|
| |||||||||||||||
| Consumer Finance: 1.72% | ||||||||||||||||
Aviation Capital Group LLC 144A | 5.50 | 12-15-2024 | 500,000 | 515,778 | ||||||||||||
Ford Motor Credit Company LLC | 4.39 | 1-8-2026 | 175,000 | 173,003 | ||||||||||||
Ford Motor Credit Company LLC | 5.11 | 5-3-2029 | 275,000 | 282,563 | ||||||||||||
Ford Motor Credit Company LLC | 5.13 | 6-16-2025 | 25,000 | 25,781 | ||||||||||||
General Motors Financial Company Incorporated (5 Year Treasury Constant Maturity +5.00%) ±(s) | 5.70 | 9-30-2030 | 500,000 | 501,875 | ||||||||||||
Harley Davidson Financial Services Company 144A | 3.35 | 6-8-2025 | 750,000 | 784,414 | ||||||||||||
Onemain Finance Corporation | 5.38 | 11-15-2029 | 50,000 | 52,000 | ||||||||||||
Onemain Finance Corporation | 6.63 | 1-15-2028 | 225,000 | 249,705 | ||||||||||||
Onemain Finance Corporation | 7.13 | 3-15-2026 | 25,000 | 27,930 | ||||||||||||
| 2,613,049 | ||||||||||||||||
|
| |||||||||||||||
| Diversified Financial Services: 0.22% | ||||||||||||||||
LPL Holdings Incorporated 144A | 4.63 | 11-15-2027 | 125,000 | 126,250 | ||||||||||||
LPL Holdings Incorporated 144A | 5.75 | 9-15-2025 | 200,000 | 207,237 | ||||||||||||
| 333,487 | ||||||||||||||||
|
| |||||||||||||||
| Insurance: 4.03% | ||||||||||||||||
AmWINS Group Incorporated 144A | 7.75 | 7-1-2026 | 145,000 | 155,150 | ||||||||||||
Athene Global Funding 144A | 2.45 | 8-20-2027 | 1,000,000 | 1,026,785 | ||||||||||||
Guardian Life Insurance Company 144A | 4.85 | 1-24-2077 | 200,000 | 258,849 | ||||||||||||
HUB International Limited 144A | 7.00 | 5-1-2026 | 75,000 | 77,719 | ||||||||||||
Lincoln National Corporation | 7.00 | 6-15-2040 | 855,000 | 1,251,266 | ||||||||||||
Markel Corporation (5 Year Treasury Constant Maturity +5.66%) ±(s) | 6.00 | 6-1-2025 | 1,000,000 | 1,057,500 | ||||||||||||
MetLife Incorporated | 6.40 | 12-15-2066 | 200,000 | 248,567 | ||||||||||||
OneAmerica Financial Partners Incorporated 144A | 4.25 | 10-15-2050 | 130,000 | 131,580 | ||||||||||||
Prudential Financial Incorporated (5 Year Treasury Constant Maturity +3.04%) ± | 3.70 | 10-1-2050 | 270,000 | 275,481 | ||||||||||||
Transatlantic Holdings Incorporated | 8.00 | 11-30-2039 | 1,000,000 | 1,569,995 | ||||||||||||
USI Incorporated 144A | 6.88 | 5-1-2025 | 75,000 | 75,938 | ||||||||||||
| 6,128,830 | ||||||||||||||||
|
| |||||||||||||||
| Thrifts & Mortgage Finance: 0.12% | ||||||||||||||||
Ladder Capital Finance Holdings LP 144A | 5.25 | 3-15-2022 | 25,000 | 24,508 | ||||||||||||
Ladder Capital Finance Holdings LP 144A | 4.25 | 2-1-2027 | 25,000 | 21,625 | ||||||||||||
Ladder Capital Finance Holdings LP 144A | 5.25 | 10-1-2025 | 150,000 | 138,938 | ||||||||||||
| 185,071 | ||||||||||||||||
|
| |||||||||||||||
The accompanying notes are an integral part of these consolidated financial statements.
16 | Wells Fargo Income Plus Fund
Table of Contents
Consolidated portfolio of investments—September 30, 2020
| Interest rate | Maturity date | Principal | Value | |||||||||||||
Health Care: 1.91% |
| |||||||||||||||
| Health Care Equipment & Supplies: 0.05% | ||||||||||||||||
Hill-Rom Holdings Incorporated 144A | 4.38 | % | 9-15-2027 | $ | 75,000 | $ | 77,621 | |||||||||
|
| |||||||||||||||
| Health Care Providers & Services: 1.54% | ||||||||||||||||
Community Health Systems Incorporated 144A | 6.63 | 2-15-2025 | 250,000 | 241,850 | ||||||||||||
Encompass Health Corporation | 4.50 | 2-1-2028 | 75,000 | 75,375 | ||||||||||||
Highmark Incorporated 144A | 6.13 | 5-15-2041 | 850,000 | 1,082,313 | ||||||||||||
MPH Acquisition Holdings LLC 144A | 7.13 | 6-1-2024 | 125,000 | 128,438 | ||||||||||||
MPT Operating Partnership LP | 4.63 | 8-1-2029 | 250,000 | 260,118 | ||||||||||||
Select Medical Corporation 144A | 6.25 | 8-15-2026 | 125,000 | 130,000 | ||||||||||||
Tenet Healthcare Corporation 144A | 4.63 | 6-15-2028 | 25,000 | 25,211 | ||||||||||||
Tenet Healthcare Corporation | 5.13 | 5-1-2025 | 125,000 | 125,125 | ||||||||||||
Tenet Healthcare Corporation | 7.00 | 8-1-2025 | 100,000 | 102,930 | ||||||||||||
Tenet Healthcare Corporation 144A | 7.50 | 4-1-2025 | 50,000 | 53,875 | ||||||||||||
Vizient Incorporated 144A | 6.25 | 5-15-2027 | 105,000 | 109,988 | ||||||||||||
| 2,335,223 | ||||||||||||||||
|
| |||||||||||||||
| Health Care Technology: 0.32% | ||||||||||||||||
Change Healthcare Holdings Incorporated 144A | 5.75 | 3-1-2025 | 275,000 | 278,438 | ||||||||||||
IQVIA Incorporated 144A | 5.00 | 5-15-2027 | 200,000 | 209,714 | ||||||||||||
| 488,152 | ||||||||||||||||
|
| |||||||||||||||
Industrials: 3.08% |
| |||||||||||||||
| Aerospace & Defense: 0.89% | ||||||||||||||||
RBS Global & Rexnord LLC 144A | 4.88 | 12-15-2025 | 150,000 | 152,063 | ||||||||||||
Signature Aviation US Holdings Incorporated 144A | 4.00 | 3-1-2028 | 50,000 | 46,500 | ||||||||||||
Signature Aviation US Holdings Incorporated 144A | 5.38 | 5-1-2026 | 34,000 | 34,340 | ||||||||||||
The Boeing Company | 5.15 | 5-1-2030 | 1,000,000 | 1,120,246 | ||||||||||||
| 1,353,149 | ||||||||||||||||
|
| |||||||||||||||
| Airlines: 0.91% | ||||||||||||||||
Alaska Airlines 144A | 4.80 | 2-15-2029 | 185,000 | 193,714 | ||||||||||||
Delta Air Lines Incorporated | 2.00 | 12-10-2029 | 800,000 | 772,947 | ||||||||||||
Delta Air Lines Incorporated 144A | 4.75 | 10-20-2028 | 150,000 | 155,625 | ||||||||||||
Mileage Plus Holdings LLC 144A | 6.50 | 6-20-2027 | 250,000 | 260,313 | ||||||||||||
| 1,382,599 | ||||||||||||||||
|
| |||||||||||||||
| Commercial Services & Supplies: 0.47% | ||||||||||||||||
Advanced Disposal Services Incorporated 144A | 5.63 | 11-15-2024 | 50,000 | 51,500 | ||||||||||||
Covanta Holding Corporation | 6.00 | 1-1-2027 | 175,000 | 182,000 | ||||||||||||
IAA Spinco Incorporated 144A | 5.50 | 6-15-2027 | 200,000 | 208,250 | ||||||||||||
KAR Auction Services Incorporated 144A | 5.13 | 6-1-2025 | 275,000 | 274,995 | ||||||||||||
| 716,745 | ||||||||||||||||
|
| |||||||||||||||
| Industrial Conglomerates: 0.33% | ||||||||||||||||
General Electric Company | 4.35 | 5-1-2050 | 500,000 | 508,731 | ||||||||||||
|
| |||||||||||||||
| Machinery: 0.18% | ||||||||||||||||
Stevens Holding Company Incorporated 144A | 6.13 | 10-1-2026 | 150,000 | 160,500 | ||||||||||||
Trimas Corporation 144A | 4.88 | 10-15-2025 | 110,000 | 111,375 | ||||||||||||
| 271,875 | ||||||||||||||||
|
| |||||||||||||||
The accompanying notes are an integral part of these consolidated financial statements.
Wells Fargo Income Plus Fund | 17
Table of Contents
Consolidated portfolio of investments—September 30, 2020
| Interest rate | Maturity date | Principal | Value | |||||||||||||
| Trading Companies & Distributors: 0.20% | ||||||||||||||||
Fortress Transportation & Infrastructure Investors LLC 144A | 6.50 | % | 10-1-2025 | $ | 299,000 | $ | 293,768 | |||||||||
Fortress Transportation & Infrastructure Investors LLC 144A | 9.75 | 8-1-2027 | 15,000 | 15,994 | ||||||||||||
| 309,762 | ||||||||||||||||
|
| |||||||||||||||
| Transportation Infrastructure: 0.10% | ||||||||||||||||
Toll Road Investors Partnership II LP 144A¤ | 0.00 | 2-15-2027 | 200,000 | 145,660 | ||||||||||||
|
| |||||||||||||||
| Information Technology: 1.67% | ||||||||||||||||
| Communications Equipment: 0.67% | ||||||||||||||||
CommScope Incorporated 144A | 8.25 | 3-1-2027 | 100,000 | 104,000 | ||||||||||||
CommScope Technologies Finance LLC 144A | 6.00 | 6-15-2025 | 47,000 | 47,637 | ||||||||||||
Motorola Solutions Incorporated | 5.50 | 9-1-2044 | 750,000 | 867,656 | ||||||||||||
| 1,019,293 | ||||||||||||||||
|
| |||||||||||||||
| Electronic Equipment, Instruments & Components: 0.34% | ||||||||||||||||
Jabil Incorporated | 3.00 | 1-15-2031 | 500,000 | 510,119 | ||||||||||||
|
| |||||||||||||||
| IT Services: 0.20% | ||||||||||||||||
Cardtronics Incorporated 144A | 5.50 | 5-1-2025 | 300,000 | 300,000 | ||||||||||||
|
| |||||||||||||||
| Software: 0.36% | ||||||||||||||||
Fair Isaac Corporation 144A | 4.00 | 6-15-2028 | 150,000 | 154,688 | ||||||||||||
Fair Isaac Corporation 144A | 5.25 | 5-15-2026 | 50,000 | 55,500 | ||||||||||||
NortonLifeLock Incorporated 144A | 5.00 | 4-15-2025 | 150,000 | 153,515 | ||||||||||||
SS&C Technologies Incorporated 144A | 5.50 | 9-30-2027 | 175,000 | 185,976 | ||||||||||||
| 549,679 | ||||||||||||||||
|
| |||||||||||||||
| Technology Hardware, Storage & Peripherals: 0.10% | ||||||||||||||||
NCR Corporation 144A | 5.75 | 9-1-2027 | 150,000 | 156,824 | ||||||||||||
|
| |||||||||||||||
Materials: 0.72% |
| |||||||||||||||
| Chemicals: 0.17% | ||||||||||||||||
Valvoline Incorporated 144A | 4.25 | 2-15-2030 | 250,000 | 255,000 | ||||||||||||
|
| |||||||||||||||
| Containers & Packaging: 0.35% | ||||||||||||||||
Berry Global Incorporated 144A | 4.88 | 7-15-2026 | 50,000 | 52,438 | ||||||||||||
Crown Americas Capital Corporation VI | 4.75 | 2-1-2026 | 200,000 | 207,500 | ||||||||||||
Flex Acquisition Company Incorporated 144A | 6.88 | 1-15-2025 | 75,000 | 74,954 | ||||||||||||
Flex Acquisition Company Incorporated 144A | 7.88 | 7-15-2026 | 200,000 | 202,000 | ||||||||||||
| 536,892 | ||||||||||||||||
|
| |||||||||||||||
| Metals & Mining: 0.18% | ||||||||||||||||
Freeport-McMoRan Incorporated | 4.13 | 3-1-2028 | 100,000 | 101,250 | ||||||||||||
Novelis Corporation 144A | 5.88 | 9-30-2026 | 175,000 | 179,813 | ||||||||||||
| 281,063 | ||||||||||||||||
|
| |||||||||||||||
| Paper & Forest Products: 0.02% | ||||||||||||||||
Clearwater Paper Corporation 144A | 5.38 | 2-1-2025 | 25,000 | 26,203 | ||||||||||||
|
| |||||||||||||||
Real Estate: 0.65% |
| |||||||||||||||
| Equity REITs: 0.65% | ||||||||||||||||
CoreCivic Incorporated | 4.63 | 5-1-2023 | 225,000 | 213,750 | ||||||||||||
SBA Communications Corporation 144A | 3.88 | 2-15-2027 | 300,000 | 304,500 | ||||||||||||
The accompanying notes are an integral part of these consolidated financial statements.
18 | Wells Fargo Income Plus Fund
Table of Contents
Consolidated portfolio of investments—September 30, 2020
| Interest rate | Maturity date | Principal | Value | |||||||||||||
| Equity REITs (continued) | ||||||||||||||||
Service Properties Trust Company | 3.95 | % | 1-15-2028 | $ | 50,000 | $ | 41,801 | |||||||||
Service Properties Trust Company | 4.38 | 2-15-2030 | 50,000 | 41,500 | ||||||||||||
Service Properties Trust Company | 4.75 | 10-1-2026 | 25,000 | 22,279 | ||||||||||||
Service Properties Trust Company | 4.95 | 2-15-2027 | 75,000 | 66,750 | ||||||||||||
Service Properties Trust Company | 5.25 | 2-15-2026 | 50,000 | 46,084 | ||||||||||||
Service Properties Trust Company | 7.50 | 9-15-2025 | 10,000 | 10,636 | ||||||||||||
Simon Property Group LP | 3.80 | 7-15-2050 | 120,000 | 121,285 | ||||||||||||
The Geo Group Incorporated | 5.13 | 4-1-2023 | 150,000 | 121,875 | ||||||||||||
| 990,460 | ||||||||||||||||
|
| |||||||||||||||
Utilities: 1.33% |
| |||||||||||||||
| Electric Utilities: 0.83% | ||||||||||||||||
NextEra Energy Operating Partners LP 144A | 4.50 | 9-15-2027 | 275,000 | 295,625 | ||||||||||||
Oglethorpe Power Corporation | 4.25 | 4-1-2046 | 400,000 | 412,749 | ||||||||||||
PG&E Corporation | 5.00 | 7-1-2028 | 25,000 | 24,250 | ||||||||||||
PG&E Corporation | 5.25 | 7-1-2030 | 25,000 | 24,188 | ||||||||||||
The Southern Company (5 Year Treasury Constant Maturity +3.73%) ± | 4.00 | 1-15-2051 | 500,000 | 501,387 | ||||||||||||
| 1,258,199 | ||||||||||||||||
|
| |||||||||||||||
| Independent Power & Renewable Electricity Producers: 0.38% | ||||||||||||||||
NSG Holdings LLC 144A | 7.75 | 12-15-2025 | 68,847 | 72,978 | ||||||||||||
TerraForm Power Operating LLC 144A | 4.25 | 1-31-2023 | 100,000 | 102,488 | ||||||||||||
TerraForm Power Operating LLC 144A | 4.75 | 1-15-2030 | 100,000 | 106,250 | ||||||||||||
TerraForm Power Operating LLC 144A | 5.00 | 1-31-2028 | 275,000 | 301,036 | ||||||||||||
| 582,752 | ||||||||||||||||
|
| |||||||||||||||
| Multi-Utilities: 0.12% | ||||||||||||||||
Oglethorpe Power Corporation 144A | 3.75 | 8-1-2050 | 190,000 | 188,815 | ||||||||||||
|
| |||||||||||||||
Total Corporate Bonds and Notes (Cost $44,851,415) |
| 47,358,379 | ||||||||||||||
|
| |||||||||||||||
| Shares | ||||||||||||||||
| Exchange-Traded Funds: 6.64% | ||||||||||||||||
Invesco Taxable Municipal Bond ETF |
| 30,600 | 1,020,510 | |||||||||||||
SPDR Bloomberg Barclays High Yield Bond ETF |
| 13,708 | 1,429,333 | |||||||||||||
VanEck Vectors J. P. Morgan EM Local Currency Bond ETF |
| 89,600 | 2,763,264 | |||||||||||||
Xtrackers USD High Yield Corporate Bond ETF « |
| 101,500 | 4,882,150 | |||||||||||||
Total Exchange-Traded Funds (Cost $9,496,408) |
| 10,095,257 | ||||||||||||||
|
| |||||||||||||||
Principal | ||||||||||||||||
Foreign Corporate Bonds and Notes: 10.29% |
| |||||||||||||||
Communication Services: 0.60% |
| |||||||||||||||
| Media: 0.60% | ||||||||||||||||
Tele Columbus AG 144A | 3.88 | 5-2-2025 | EUR | 510,000 | 569,241 | |||||||||||
Ziggo Bond Company BV 144A | 3.38 | 2-28-2030 | EUR | 300,000 | 333,916 | |||||||||||
| 903,157 | ||||||||||||||||
|
| |||||||||||||||
Consumer Discretionary: 1.50% |
| |||||||||||||||
| Auto Components: 0.48% | ||||||||||||||||
HP Pelzer Holding GmbH 144A | 4.13 | 4-1-2024 | EUR | 800,000 | 727,106 | |||||||||||
|
| |||||||||||||||
The accompanying notes are an integral part of these consolidated financial statements.
Wells Fargo Income Plus Fund | 19
Table of Contents
Consolidated portfolio of investments—September 30, 2020
| Interest rate | Maturity date | Principal | Value | |||||||||||||
| Automobiles: 0.40% | ||||||||||||||||
Peugeot SA Company | 2.00 | % | 3-20-2025 | EUR | 500,000 | $ | 606,961 | |||||||||
|
| |||||||||||||||
| Diversified Consumer Services: 0.32% | ||||||||||||||||
Intertrust Group BV 144A | 3.38 | 11-15-2025 | EUR | 400,000 | 477,131 | |||||||||||
|
| |||||||||||||||
| Hotels, Restaurants & Leisure: 0.30% | ||||||||||||||||
Accor SA | 1.25 | 1-25-2024 | EUR | 400,000 | 460,690 | |||||||||||
|
| |||||||||||||||
Consumer Staples: 2.10% |
| |||||||||||||||
| Food & Staples Retailing: 0.48% | ||||||||||||||||
Casino Guichard Perracho SA | 3.58 | 2-7-2025 | EUR | 400,000 | 354,301 | |||||||||||
Tasty Bondco 1 SA 144A | 6.25 | 5-15-2026 | EUR | 400,000 | 380,990 | |||||||||||
| 735,291 | ||||||||||||||||
|
| |||||||||||||||
| Food Products: 0.69% | ||||||||||||||||
Danone SA (s) | 1.75 | 3-27-2023 | EUR | 400,000 | 469,226 | |||||||||||
Sigma Holdings Company BV 144A | 5.75 | 5-15-2026 | EUR | 500,000 | 576,707 | |||||||||||
| 1,045,933 | ||||||||||||||||
|
| |||||||||||||||
| Household Products: 0.32% | ||||||||||||||||
Energizer Gamma Acquisition BV 144A | 4.63 | 7-15-2026 | EUR | 400,000 | 481,689 | |||||||||||
|
| |||||||||||||||
| Tobacco: 0.61% | ||||||||||||||||
BAT International Finance plc | 2.25 | 1-16-2030 | EUR | 750,000 | 935,923 | |||||||||||
|
| |||||||||||||||
Energy: 0.73% |
| |||||||||||||||
| Oil, Gas & Consumable Fuels: 0.73% | ||||||||||||||||
Eni SpA | 1.13 | 9-19-2028 | EUR | 800,000 | 988,713 | |||||||||||
Total SA | 3.88 | 12-29-2049 | EUR | 100,000 | 122,521 | |||||||||||
| 1,111,234 | ||||||||||||||||
|
| |||||||||||||||
Financials: 2.73% |
| |||||||||||||||
| Banks: 1.30% | ||||||||||||||||
Asian Development Bank | 6.20 | 10-6-2026 | INR | 18,450,000 | 253,444 | |||||||||||
Bankia SA (s) | 6.00 | 7-18-2022 | EUR | 600,000 | 708,746 | |||||||||||
Caixa Geral de Depositos SA | 5.75 | 6-28-2028 | EUR | 400,000 | 507,638 | |||||||||||
Caixa Geral de Depositos SA (s) | 10.75 | 3-30-2022 | EUR | 400,000 | 507,085 | |||||||||||
| 1,976,913 | ||||||||||||||||
|
| |||||||||||||||
| Capital Markets: 0.41% | ||||||||||||||||
International Finance Corporation | 6.30 | 11-25-2024 | INR | 45,000,000 | 623,035 | |||||||||||
|
| |||||||||||||||
| Diversified Financial Services: 0.72% | ||||||||||||||||
JAB Holdings BV | 1.75 | 6-25-2026 | EUR | 400,000 | 494,418 | |||||||||||
LKQ European Holdings BV Company 144A | 3.63 | 4-1-2026 | EUR | 500,000 | 591,360 | |||||||||||
| 1,085,778 | ||||||||||||||||
|
| |||||||||||||||
| Thrifts & Mortgage Finance: 0.30% | ||||||||||||||||
Deutsche Pfandbriefbank AG | 2.88 | 6-28-2027 | EUR | 400,000 | 457,555 | |||||||||||
|
| |||||||||||||||
| Health Care: 0.61% | ||||||||||||||||
| Pharmaceuticals: 0.61% | ||||||||||||||||
Takeda Pharmaceutical Company Limited | 2.00 | 7-9-2040 | EUR | 750,000 | 931,366 | |||||||||||
|
| |||||||||||||||
The accompanying notes are an integral part of these consolidated financial statements.
20 | Wells Fargo Income Plus Fund
Table of Contents
Consolidated portfolio of investments—September 30, 2020
| Interest rate | Maturity date | Principal | Value | |||||||||||||
Industrials: 0.96% |
| |||||||||||||||
| Commercial Services & Supplies: 0.65% | ||||||||||||||||
Paprec Holding SA 144A | 4.00 | % | 3-31-2025 | EUR | 450,000 | $ | 502,482 | |||||||||
Prosegur Cash SA | 1.38 | 2-4-2026 | EUR | 400,000 | 482,069 | |||||||||||
| 984,551 | ||||||||||||||||
|
| |||||||||||||||
| Electrical Equipment: 0.15% | ||||||||||||||||
Gamma Bidco SpA 144A | 6.25 | 7-15-2025 | EUR | 200,000 | 232,145 | |||||||||||
|
| |||||||||||||||
| Road & Rail: 0.16% | ||||||||||||||||
Europcar Groupe SA 144A | 4.13 | 11-15-2024 | EUR | 500,000 | 247,129 | |||||||||||
|
| |||||||||||||||
Real Estate: 0.75% |
| |||||||||||||||
| Equity REITs: 0.27% | ||||||||||||||||
Unibail Rodamco SE (s) | 2.13 | 7-23-2023 | EUR | 400,000 | 418,621 | |||||||||||
|
| |||||||||||||||
| Real Estate Management & Development: 0.48% | ||||||||||||||||
Akelius Residential Property AB | 3.88 | 10-5-2078 | EUR | 500,000 | 602,346 | |||||||||||
ATF Netherlands BV | 1.50 | 7-15-2024 | EUR | 100,000 | 120,645 | |||||||||||
| 722,991 | ||||||||||||||||
|
| |||||||||||||||
Utilities: 0.31% |
| |||||||||||||||
| Multi-Utilities: 0.31% | ||||||||||||||||
EP Infrastructure AS | 1.66 | 4-26-2024 | EUR | 400,000 | 476,350 | |||||||||||
|
| |||||||||||||||
Total Foreign Corporate Bonds and Notes (Cost $15,555,163) |
| 15,641,549 | ||||||||||||||
|
| |||||||||||||||
| Foreign Government Bonds: 3.95% | ||||||||||||||||
Brazil | 10.00 | 1-1-2023 | BRL | 2,765,000 | 559,516 | |||||||||||
Colombia | 7.00 | 5-4-2022 | COP | 2,000,000,000 | 558,982 | |||||||||||
Dominican Republic 144A | 4.50 | 1-30-2030 | DOP | 200,000 | 196,500 | |||||||||||
Indonesia | 6.50 | 6-15-2025 | IDR | 13,500,000,000 | 935,837 | |||||||||||
Malaysia | 3.96 | 9-15-2025 | MYR | 2,300,000 | 596,959 | |||||||||||
Mexico | 6.50 | 6-9-2022 | MXN | 7,600,000 | 355,010 | |||||||||||
Mexico | 6.50 | 6-9-2022 | MXN | 13,260,000 | 619,400 | |||||||||||
Republic of South Africa | 6.75 | 3-31-2021 | ZAR | 5,500,000 | 333,415 | |||||||||||
Republic of South Africa | 8.75 | 2-28-2048 | ZAR | 9,100,000 | 417,513 | |||||||||||
Romania | 3.40 | 3-8-2022 | RON | 1,500,000 | 362,441 | |||||||||||
Russia | 6.50 | 2-28-2024 | RUB | 35,000,000 | 469,564 | |||||||||||
Russia | 7.00 | 12-15-2021 | RUB | 45,000,000 | 596,805 | |||||||||||
Total Foreign Government Bonds (Cost $6,531,413) |
| 6,001,942 | ||||||||||||||
|
| |||||||||||||||
Loans: 2.19% |
| |||||||||||||||
Communication Services: 0.66% |
| |||||||||||||||
| Media: 0.66% | ||||||||||||||||
Ancestry.com Incorporated (1 Month LIBOR +4.25%) ± | 4.41 | 8-27-2026 | $ | 356,578 | 355,559 | |||||||||||
Charter Communications Operating LLC (1 Month LIBOR +1.75%) ± | 1.91 | 4-30-2025 | 489,924 | 480,680 | ||||||||||||
Gray Television Incorporated (1 Month LIBOR +2.50%) ± | 2.66 | 1-2-2026 | 84,964 | 83,362 | ||||||||||||
Nexstar Broadcasting Incorporated (1 Month LIBOR +2.25%) ± | 2.41 | 1-17-2024 | 82,697 | 80,526 | ||||||||||||
| 1,000,127 | ||||||||||||||||
|
| |||||||||||||||
The accompanying notes are an integral part of these consolidated financial statements.
Wells Fargo Income Plus Fund | 21
Table of Contents
Consolidated portfolio of investments—September 30, 2020
| Interest rate | Maturity date | Principal | Value | |||||||||||||
Consumer Discretionary: 0.34% |
| |||||||||||||||
| Distributors: 0.19% | ||||||||||||||||
Spin Holdco Incorporated (3 Month LIBOR +3.25%) ± | 4.25 | % | 11-14-2022 | $ | 296,407 | $ | 289,898 | |||||||||
|
| |||||||||||||||
| Hotels, Restaurants & Leisure: 0.15% | ||||||||||||||||
CCM Merger Incorporated (1 Month LIBOR +2.25%) ± | 3.00 | 8-8-2021 | 233,312 | 231,926 | ||||||||||||
|
| |||||||||||||||
Financials: 0.36% |
| |||||||||||||||
| Capital Markets: 0.24% | ||||||||||||||||
Nexus Buyer LLC (1 Month LIBOR +3.75%) ± | 3.91 | 11-9-2026 | 199,000 | 197,466 | ||||||||||||
VFH Parent LLC (1 Month LIBOR +3.00%) ± | 3.16 | 3-1-2026 | 168,864 | 167,546 | ||||||||||||
| 365,012 | ||||||||||||||||
|
| |||||||||||||||
| Diversified Financial Services: 0.09% | ||||||||||||||||
Intelsat Jackson Holdings SA (1 Month LIBOR +4.75%) ± | 8.00 | 11-27-2023 | 140,332 | 140,819 | ||||||||||||
|
| |||||||||||||||
| Insurance: 0.03% | ||||||||||||||||
HUB International Limited (3 Month LIBOR +4.00%) ± | 5.00 | 4-25-2025 | 24,813 | 24,696 | ||||||||||||
USI Incorporated (3 Month LIBOR +4.00%) ± | 4.31 | 12-2-2026 | 24,813 | 24,523 | ||||||||||||
| 49,219 | ||||||||||||||||
|
| |||||||||||||||
Health Care: 0.18% |
| |||||||||||||||
| Pharmaceuticals: 0.18% | ||||||||||||||||
Valeant Pharmaceuticals International Incorporated (1 Month LIBOR +3.00%) ± | 3.18 | 6-2-2025 | 279,336 | 273,458 | ||||||||||||
|
| |||||||||||||||
Industrials: 0.11% |
| |||||||||||||||
| Commercial Services & Supplies: 0.01% | ||||||||||||||||
KAR Auction Services Incorporated (1 Month LIBOR +2.25%) ±‡ | 2.44 | 9-19-2026 | 22,600 | 21,753 | ||||||||||||
|
| |||||||||||||||
| Machinery: 0.10% | ||||||||||||||||
Columbus McKinnon Corporation (3 Month LIBOR +2.50%) ±‡ | 3.50 | 1-31-2024 | 146,735 | 145,634 | ||||||||||||
|
| |||||||||||||||
Information Technology: 0.41% |
| |||||||||||||||
| Electronic Equipment, Instruments & Components: 0.38% | ||||||||||||||||
Dell International LLC (1 Month LIBOR +2.00%) ± | 2.75 | 9-19-2025 | 578,814 | 575,763 | ||||||||||||
|
| |||||||||||||||
| Software: 0.03% | ||||||||||||||||
Emerald Topco Incorporated (3 Month LIBOR +3.50%) ± | 3.76 | 7-24-2026 | 49,500 | 47,551 | ||||||||||||
|
| |||||||||||||||
Materials: 0.13% |
| |||||||||||||||
| Containers & Packaging: 0.13% | ||||||||||||||||
RING Container Technologies (1 Month LIBOR +2.75%) ± | 2.91 | 10-31-2024 | 198,975 | 193,338 | ||||||||||||
|
| |||||||||||||||
Total Loans (Cost $3,374,968) |
| 3,334,498 | ||||||||||||||
|
| |||||||||||||||
Municipal Obligations: 0.30% |
| |||||||||||||||
Illinois: 0.08% |
| |||||||||||||||
| GO Revenue: 0.08% | ||||||||||||||||
Chicago IL Refunding Bonds Taxable Project Series E | 6.05 | 1-1-2029 | 125,000 | 129,364 | ||||||||||||
|
| |||||||||||||||
The accompanying notes are an integral part of these consolidated financial statements.
22 | Wells Fargo Income Plus Fund
Table of Contents
Consolidated portfolio of investments—September 30, 2020
| Interest rate | Maturity date | Principal | Value | |||||||||||||
Kansas: 0.08% | ||||||||||||||||
| Health Revenue: 0.08% | ||||||||||||||||
Kansas Development Finance Authority Village Shalom Project Series 2018-B | 4.00 | % | 11-15-2025 | $ | 130,000 | $ | 127,751 | |||||||||
|
| |||||||||||||||
Maryland: 0.07% | ||||||||||||||||
| Education Revenue: 0.07% | ||||||||||||||||
Maryland Health & HEFAR Green Street Academy Series B 144A | 6.75 | 7-1-2023 | 100,000 | 100,059 | ||||||||||||
|
| |||||||||||||||
Pennsylvania: 0.07% | ||||||||||||||||
| Health Revenue: 0.07% | ||||||||||||||||
Quakertown PA General Authority U.S. Department of Agriculture Loan Anticipation Notes Series 2017-B | 3.80 | 7-1-2021 | 100,000 | 99,763 | ||||||||||||
|
| |||||||||||||||
Total Municipal Obligations (Cost $443,241) | 456,937 | |||||||||||||||
|
| |||||||||||||||
| Non-Agency Mortgage-Backed Securities: 18.12% | ||||||||||||||||
AFN LLC Series 2019-1A Class A2 144A | 4.46 | 5-20-2049 | 700,000 | 696,591 | ||||||||||||
ALM Loan Funding Series 2016-18A Class A2R (3 Month LIBOR +1.65%) 144A± | 1.93 | 1-15-2028 | 600,000 | 595,688 | ||||||||||||
Aqua Finance Trust Series 2019-A Class A 144A | 3.14 | 7-16-2040 | 380,662 | 389,619 | ||||||||||||
Arbys Funding LLC Series 2020-1A Class A2 144A | 3.24 | 7-30-2050 | 800,000 | 822,648 | ||||||||||||
Arroyo Mortgage Trust Series 2019-2 Class A2 144A±± | 3.50 | 4-25-2049 | 1,055,975 | 1,088,085 | ||||||||||||
BB-UBS Trust Series 2012-TFT Class C 144A±± | 3.58 | 6-5-2030 | 150,000 | 83,889 | ||||||||||||
BCC Funding Corporation Series 2019-1A Class D 144A | 3.94 | 7-20-2027 | 1,300,000 | 1,312,607 | ||||||||||||
Bojangles Issuer LLC Series 2020-1A Class A2 144A%% | 3.83 | 10-20-2050 | 605,000 | 605,000 | ||||||||||||
BX Trust Series 2019-11 Class D 144A±± | 4.08 | 12-9-2041 | 500,000 | 484,820 | ||||||||||||
CFCRE Commercial Mortgage Trust Series 2016-C7 Class AM | 4.16 | 12-10-2054 | 400,000 | 456,133 | ||||||||||||
CIFC Funding Limited Series 2018-1A Class B (3 Month LIBOR +1.40%) 144A± | 1.67 | 4-18-2031 | 1,000,000 | 977,550 | ||||||||||||
CLI Funding LLC Series 2019-1A Class A 144A | 3.71 | 5-18-2044 | 1,301,369 | 1,324,665 | ||||||||||||
CLI Funding LLC Series 2019-1A Class B 144A | 4.64 | 5-18-2044 | 520,554 | 517,255 | ||||||||||||
CommonBond Student Loan Trust Series 2018-CGS Class C 144A | 4.35 | 2-25-2046 | 194,527 | 197,679 | ||||||||||||
Consumer Lending Receivables LLC Series 2019-A Class A 144A | 3.52 | 4-15-2026 | 238,242 | 238,677 | ||||||||||||
Consumer Loan Underlying Bond Credit Trust Series 2018-P2 Class B 144A | 4.10 | 10-15-2025 | 500,000 | 502,410 | ||||||||||||
Deephaven Residential Mortgage Trust Series 2019-1A Class A2 144A±± | 3.90 | 1-25-2059 | 583,798 | 589,397 | ||||||||||||
Deephaven Residential Mortgage Trust Series 2019-3A Class B1 144A±± | 4.26 | 7-25-2059 | 500,000 | 479,384 | ||||||||||||
Driven Brands Funding LLC Series 2019-2A Class A2 144A | 3.98 | 10-20-2049 | 347,375 | 358,977 | ||||||||||||
Ellington Financial Mortgage Trust Series 2019-1 Class M1 144A±± | 3.59 | 6-25-2059 | 1,500,000 | 1,498,557 | ||||||||||||
Foundation Finance Trust Series 2019-1A Class A 144A | 3.86 | 11-15-2034 | 568,752 | 586,740 | ||||||||||||
FREMF Mortgage Trust Series 2017-K724 Class B 144A±± | 3.60 | 11-25-2023 | 400,000 | 422,442 | ||||||||||||
FREMF Mortgage Trust Series 2020-KF76 Class B (1 Month LIBOR +2.75%) 144A± | 2.91 | 1-25-2030 | 410,000 | 402,323 | ||||||||||||
GS Mortgage Security Trust Series 2014-GC22 Class AS | 4.11 | 6-10-2047 | 1,450,000 | 1,581,739 | ||||||||||||
GS Mortgage Security Trust Series 2018-LUAU Class B (1 Month LIBOR +1.40%) 144A± | 1.55 | 11-15-2032 | 1,600,000 | 1,481,680 | ||||||||||||
Harley Marine Financing LLC Barge Series 2018-1A Class A2 144A | 5.68 | 5-15-2043 | 647,131 | 585,239 | ||||||||||||
Longtrain Leasing III LLC Series 2015-1A Class A2 144A | 4.06 | 1-15-2045 | 1,568,304 | 1,617,570 | ||||||||||||
Marlette Funding Trust Series 2018-4A Class B 144A | 4.21 | 12-15-2028 | 1,100,000 | 1,116,555 | ||||||||||||
MP CLO VIII Limited Series 2015-2A Class AR (3 Month LIBOR +0.91%) 144A± | 1.16 | 10-28-2027 | 559,535 | 555,019 | ||||||||||||
Onemain Financial Issuance Trust Series 2019-1A Class D 144A | 4.22 | 2-14-2031 | 1,100,000 | 1,130,688 | ||||||||||||
Oxford Finance Funding Trust Series 2019-1A Class A2 144A | 4.46 | 2-15-2027 | 800,000 | 824,128 | ||||||||||||
Store Master Funding LLC Series 2014-1A Class A2 144A | 5.00 | 4-20-2044 | 96,833 | 101,759 | ||||||||||||
The accompanying notes are an integral part of these consolidated financial statements.
Wells Fargo Income Plus Fund | 23
Table of Contents
Consolidated portfolio of investments—September 30, 2020
| Interest rate | Maturity date | Principal | Value | |||||||||||||
| Non-Agency Mortgage-Backed Securities (continued) | ||||||||||||||||
Store Master Funding LLC Series 2015-1A Class A1 144A | 3.75 | % | 4-20-2045 | $ | 1,342,625 | $ | 1,363,889 | |||||||||
Verus Securitization Trust Series 2019-3 Class A2 144A | 2.94 | 7-25-2059 | 1,475,878 | 1,501,225 | ||||||||||||
Visio Trust Series 2019-1 Class A1 144A±± | 3.57 | 6-25-2054 | 1,044,519 | 1,065,406 | ||||||||||||
Total Non-Agency Mortgage-Backed Securities (Cost $27,386,511) |
| 27,556,033 | ||||||||||||||
|
| |||||||||||||||
| Expiration date | Shares | |||||||||||||||
| Rights: 0.00% |
| |||||||||||||||
Utilities: 0.00% |
| |||||||||||||||
| Independent Power & Renewable Electricity Producers: 0.00% | ||||||||||||||||
Vistra Energy Corporation † |
| 12-31-2046 | 6,516 | 6,842 | ||||||||||||
|
| |||||||||||||||
Total Rights (Cost $6,757) |
| 6,842 | ||||||||||||||
|
| |||||||||||||||
| Maturity date | Principal | |||||||||||||||
| U.S. Treasury Securities: 2.85% | ||||||||||||||||
U.S. Treasury Bond | 2.25 | 8-15-2049 | $ | 440,000 | 523,239 | |||||||||||
U.S. Treasury Note | 0.50 | 6-30-2027 | 3,800,000 | 3,813,359 | ||||||||||||
Total U.S. Treasury Securities (Cost $4,251,106) |
| 4,336,598 | ||||||||||||||
|
| |||||||||||||||
Yankee Corporate Bonds and Notes: 8.62% |
| |||||||||||||||
Communication Services: 0.13% |
| |||||||||||||||
| Diversified Telecommunication Services: 0.13% | ||||||||||||||||
Intelsat Luxembourg SA † | 8.13 | 6-1-2023 | 50,000 | 2,125 | ||||||||||||
Telesat Canada Incorporated 144A | 6.50 | 10-15-2027 | 200,000 | 201,440 | ||||||||||||
| 203,565 | ||||||||||||||||
|
| |||||||||||||||
Consumer Discretionary: 0.33% |
| |||||||||||||||
| Internet & Direct Marketing Retail: 0.33% | ||||||||||||||||
Prosus NV 144A | 4.03 | 8-3-2050 | 500,000 | 509,423 | ||||||||||||
|
| |||||||||||||||
Energy: 1.25% |
| |||||||||||||||
| Oil, Gas & Consumable Fuels: 1.25% | ||||||||||||||||
Baytex Energy Corporation 144A | 5.63 | 6-1-2024 | 425,000 | 240,125 | ||||||||||||
BP Capital Markets plc (5 Year Treasury Constant Maturity +4.40%) ±(s) | 4.88 | 3-22-2030 | 325,000 | 347,750 | ||||||||||||
Cenovus Energy Incorporated | 5.38 | 7-15-2025 | 10,000 | 9,622 | ||||||||||||
Comision Federal de Electricidad 144A | 4.75 | 2-23-2027 | 250,000 | 268,438 | ||||||||||||
Enbridge Incorporated (5 Year Treasury Constant Maturity +5.31%) ± | 5.75 | 7-15-2080 | 1,000,000 | 1,034,802 | ||||||||||||
| 1,900,737 | ||||||||||||||||
|
| |||||||||||||||
Financials: 6.14% |
| |||||||||||||||
| Banks: 3.80% | ||||||||||||||||
Banco De Bogota SA 144A | 6.25 | 5-12-2026 | 400,000 | 434,004 | ||||||||||||
Banco Internacional del Peru 144A | 3.25 | 10-4-2026 | 525,000 | 547,318 | ||||||||||||
Banistmo SA 144A | 4.25 | 7-31-2027 | 315,000 | 320,355 | ||||||||||||
Credit Agricole SA (USD Swap Semi Annual (vs. 3 Month LIBOR) 5 Year +6.19%) 144A±(s) | 8.13 | 12-23-2025 | 1,000,000 | 1,175,000 | ||||||||||||
Deutsche Bank AG (USD ICE Swap Rate 11:00am NY 5 Year +2.55%) ± | 4.88 | 12-1-2032 | 500,000 | 480,000 | ||||||||||||
The accompanying notes are an integral part of these consolidated financial statements.
24 | Wells Fargo Income Plus Fund
Table of Contents
Consolidated portfolio of investments—September 30, 2020
| Interest rate | Maturity date | Principal | Value | |||||||||||||
| Banks (continued) | ||||||||||||||||
Intesa Sanpaolo SpA 144A | 5.71 | % | 1-15-2026 | $ | 635,000 | $ | 692,119 | |||||||||
Itau Unibanco Holding SA 144A | 3.25 | 1-24-2025 | 800,000 | 813,600 | ||||||||||||
Royal Bank Scotland Group plc (5 Year Treasury Constant Maturity +5.63%) ±(s) | 6.00 | 12-29-2025 | 700,000 | 712,250 | ||||||||||||
Unicredit SpA (5 Year Treasury Constant Maturity +4.75%) 144A± | 5.46 | 6-30-2035 | 600,000 | 610,875 | ||||||||||||
| 5,785,521 | ||||||||||||||||
|
| |||||||||||||||
| Capital Markets: 0.33% | ||||||||||||||||
Credit Suisse Group AG (5 Year Treasury Constant Maturity +4.89%) 144A ±(s) | 5.25 | 2-22-2027 | 500,000 | 501,000 | ||||||||||||
|
| |||||||||||||||
| Diversified Financial Services: 0.78% | ||||||||||||||||
Intelsat Jackson Holdings SA † | 5.50 | 8-1-2023 | 260,000 | 163,150 | ||||||||||||
Vale Overseas Limited Company | 3.75 | 7-8-2030 | 1,000,000 | 1,029,000 | ||||||||||||
| 1,192,150 | ||||||||||||||||
|
| |||||||||||||||
| Insurance: 1.05% | ||||||||||||||||
Allied World Assurance Company Holdings Limited | 4.35 | 10-29-2025 | 810,000 | 876,807 | ||||||||||||
Swiss Re Finance (Luxembourg) SA (5 Year Treasury Constant Maturity +3.58%) 144A± | 5.00 | 4-2-2049 | 400,000 | 455,110 | ||||||||||||
Validus Holdings Limited | 8.88 | 1-26-2040 | 160,000 | 259,708 | ||||||||||||
| 1,591,625 | ||||||||||||||||
|
| |||||||||||||||
| Thrifts & Mortgage Finance: 0.18% | ||||||||||||||||
Nationwide Building Society (USD ICE Swap Rate 11:00am NY 5 Year +1.85%) 144A± | 4.13 | 10-18-2032 | 250,000 | 266,128 | ||||||||||||
|
| |||||||||||||||
Health Care: 0.61% |
| |||||||||||||||
| Pharmaceuticals: 0.61% | ||||||||||||||||
Bausch Health Companies Incorporated 144A | 5.00 | 1-30-2028 | 25,000 | 24,281 | ||||||||||||
Bausch Health Companies Incorporated 144A | 5.25 | 1-30-2030 | 100,000 | 98,526 | ||||||||||||
Bausch Health Companies Incorporated 144A | 5.50 | 3-1-2023 | 8,000 | 7,970 | ||||||||||||
Bausch Health Companies Incorporated 144A | 5.50 | 11-1-2025 | 50,000 | 51,188 | ||||||||||||
Bausch Health Companies Incorporated 144A | 6.13 | 4-15-2025 | 225,000 | 230,344 | ||||||||||||
Bausch Health Companies Incorporated 144A | 6.25 | 2-15-2029 | 125,000 | 128,570 | ||||||||||||
Bausch Health Companies Incorporated 144A | 7.00 | 3-15-2024 | 25,000 | 25,875 | ||||||||||||
Teva Pharmaceutical Finance Netherlands III BV | 4.10 | 10-1-2046 | 175,000 | 145,548 | ||||||||||||
Teva Pharmaceutical Finance Netherlands III BV | 6.75 | 3-1-2028 | 200,000 | 208,500 | ||||||||||||
| 920,802 | ||||||||||||||||
|
| |||||||||||||||
Industrials: 0.14% |
| |||||||||||||||
| Commercial Services & Supplies: 0.14% | ||||||||||||||||
Ritchie Brothers Auctioneers Incorporated 144A | 5.38 | 1-15-2025 | 200,000 | 205,750 | ||||||||||||
|
| |||||||||||||||
Materials: 0.02% |
| |||||||||||||||
| Containers & Packaging: 0.02% | ||||||||||||||||
Ardagh Packaging Finance plc 144A | 5.25 | 4-30-2025 | 25,000 | 26,125 | ||||||||||||
|
| |||||||||||||||
Total Yankee Corporate Bonds and Notes (Cost $12,799,362) |
| 13,102,826 | ||||||||||||||
|
| |||||||||||||||
| Yankee Government Bonds: 1.91% | ||||||||||||||||
Commonwealth of Bahamas | 6.00 | 11-21-2028 | 200,000 | 176,000 | ||||||||||||
Mongolia Government | 5.63 | 5-1-2023 | 200,000 | 205,254 | ||||||||||||
The accompanying notes are an integral part of these consolidated financial statements.
Wells Fargo Income Plus Fund | 25
Table of Contents
Consolidated portfolio of investments—September 30, 2020
| Interest rate | Maturity date | Principal | Value | |||||||||||||
| Yankee Government Bonds (continued) | ||||||||||||||||
Provincia de Cordoba 144A | 7.13 | % | 6-10-2021 | $ | 250,000 | $ | 152,503 | |||||||||
Provincia de Cordoba 144A | 7.13 | 8-1-2027 | 550,000 | 299,756 | ||||||||||||
Provincia de Santa Fe | 7.00 | 3-23-2023 | 350,000 | 275,625 | ||||||||||||
Republic of Angola | 9.50 | 11-12-2025 | 400,000 | 347,016 | ||||||||||||
Republic of Rwanda | 6.63 | 5-2-2023 | 200,000 | 205,810 | ||||||||||||
Republic of Sri Lanka | 5.75 | 1-18-2022 | 200,000 | 163,500 | ||||||||||||
Saudi Arabia 144A | 4.50 | 4-22-2060 | 200,000 | 248,000 | ||||||||||||
United Mexican States | 5.00 | 4-27-2051 | 750,000 | 837,000 | ||||||||||||
Total Yankee Government Bonds (Cost $3,243,243) | 2,910,464 | |||||||||||||||
|
| |||||||||||||||
| Yield | Shares | |||||||||||||||
| Short-Term Investments: 7.46% | ||||||||||||||||
| Investment Companies: 7.46% | ||||||||||||||||
Securities Lending Cash Investments LLC (l)(r)(u) | 0.12 | 4,723,600 | 4,723,600 | |||||||||||||
Wells Fargo Government Money Market Fund Select Class (l)(u)##* | 0.05 | 6,620,735 | 6,620,735 | |||||||||||||
Total Short-Term Investments (Cost $11,344,335) | 11,344,335 | |||||||||||||||
|
| |||||||||||||||
| Total investments in securities (Cost $149,098,802) | 99.90 | % | 151,915,194 | |||||
Other assets and liabilities, net | 0.10 | 156,242 | ||||||
|
|
|
| |||||
| Total net assets | 100.00 | % | $ | 152,071,436 | ||||
|
|
|
| |||||
| 144A | The security may be resold in transactions exempt from registration, normally to qualified institutional buyers, pursuant to Rule 144A under the Securities Act of 1933. |
| † | Non-income-earning security |
| %% | The security is purchased on a when-issued basis. |
| ± | Variable rate investment. The rate shown is the rate in effect at period end. |
| (s) | Security is perpetual in nature and has no stated maturity date. The date shown reflects the next call date. |
| ¤ | The security is issued in zero coupon form with no periodic interest payments. |
| « | All or a portion of this security is on loan. |
| ‡ | Security is valued using significant unobservable inputs. |
| ±± | The coupon of the security is adjusted based on the principal and interest payments received from the underlying pool of mortgages as well as the credit quality and the actual prepayment speed of the underlying mortgages. |
| (l) | The issuer of the security is an affiliated person of the Fund as defined in the Investment Company Act of 1940. |
| (r) | The investment is a non-registered investment company purchased with cash collateral received from securities on loan. |
| (u) | The rate represents the 7-day annualized yield at period end. |
| ## | All or a portion of this security is segregated for when-issued securities. |
| * | A portion of the holding represents an investment held in Strategic Income Special Investment (Cayman) Ltd., the consolidated entity. |
Abbreviations:
| BRL | Brazilian real |
| COP | Colombian peso |
| DOP | Dominican peso |
| EUR | Euro |
| GO | General obligation |
| HEFAR | Higher Education Facilities Authority Revenue |
| IDR | Indonesian rupiah |
| INR | Indian Rupee |
| LIBOR | London Interbank Offered Rate |
| MXN | Mexican peso |
| MYR | Malaysian ringgit |
| RON | Romanian lei |
| RUB | Russian ruble |
| SOFR | Secured Overnight Financing Rate |
| ZAR | South African rand |
The accompanying notes are an integral part of these consolidated financial statements.
26 | Wells Fargo Income Plus Fund
Table of Contents
Consolidated portfolio of investments—September 30, 2020
Futures Contracts
| Description | Number of contracts | Expiration date | Notional cost | Notional value | Unrealized gains | Unrealized losses | ||||||||||||||||||
Long | ||||||||||||||||||||||||
U.S. Long Bond | 20 | 12-21-2020 | $ | 3,561,285 | $ | 3,525,625 | $ | 0 | $ | (35,660 | ) | |||||||||||||
10-Year Ultra Futures | 35 | 12-21-2020 | 5,611,555 | 5,597,266 | 0 | (14,289 | ) | |||||||||||||||||
5-Year U.S. Treasury Notes | 9 | 12-31-2020 | 1,133,733 | 1,134,281 | 548 | 0 | ||||||||||||||||||
Short | ||||||||||||||||||||||||
Euro-Bund Futures | (82) | 12-8-2020 | (16,704,344 | ) | (16,778,507 | ) | 0 | (74,163 | ) | |||||||||||||||
10-Year U.S. Treasury Notes | (55) | 12-21-2020 | (7,643,189 | ) | (7,674,219 | ) | 0 | (31,030 | ) | |||||||||||||||
U.S. Ultra Bond | (17) | 12-21-2020 | (3,786,188 | ) | (3,770,813 | ) | 15,375 | 0 | ||||||||||||||||
|
|
|
| |||||||||||||||||||||
| $ | 15,923 | $ | (155,142 | ) | ||||||||||||||||||||
|
|
|
| |||||||||||||||||||||
Forward Foreign Currency Contracts
| Currency to be received | Currency to be delivered | Counterparty | Settlement date | Unrealized gains | Unrealized losses | |||||||||
| 7,950,000,000 IDR | 536,836 USD | Morgan Stanley | 10-6-2020 | $ | 0 | $ | (2,755 | ) | ||||||
| 37,500,000 RUB | 491,645 USD | Morgan Stanley | 10-6-2020 | 0 | (9,240 | ) | ||||||||
| 3,385,000 BRL | 623,756 USD | Morgan Stanley | 10-6-2020 | 0 | (21,090 | ) | ||||||||
| 2,150,000,000 COP | 563,754 USD | Morgan Stanley | 10-6-2020 | 0 | (2,075 | ) | ||||||||
| 572,722 USD | 2,150,000,000 COP | Morgan Stanley | 10-6-2020 | 11,044 | 0 | |||||||||
| 507,008 USD | 37,500,000 RUB | Morgan Stanley | 10-6-2020 | 24,602 | 0 | |||||||||
| 652,971 USD | 3,385,000 BRL | Morgan Stanley | 10-6-2020 | 50,304 | 0 | |||||||||
| 533,915 USD | 7,950,000,000 IDR | Morgan Stanley | 10-6-2020 | 0 | (165 | ) | ||||||||
| 94,250,000 JPY | 881,737 USD | State Street Bank | 10-20-2020 | 12,100 | 0 | |||||||||
| 897,650 USD | 94,250,000 JPY | State Street Bank | 10-20-2020 | 3,813 | 0 | |||||||||
| 12,183,644 USD | 10,267,000 EUR | Citibank | 12-31-2020 | 120,351 | 0 | |||||||||
| 1,003,043 USD | 21,410,000 MXN | Citibank | 12-31-2020 | 44,484 | 0 | |||||||||
| 775,359 USD | 12,795,000 ZAR | Citibank | 12-31-2020 | 19,531 | 0 | |||||||||
| 3,700,000 USD | 3,140,895 EUR | Citibank | 12-31-2020 | 9,581 | 0 | |||||||||
| 94,250,000 JPY | 900,633 USD | Citibank | 1-8-2021 | 0 | (5,611 | ) | ||||||||
| 307,706,653 JPY | 2,950,000 USD | Citibank | 1-8-2021 | 0 | (27,941 | ) | ||||||||
| 560,458 USD | 2,150,000,000 COP | Morgan Stanley | 1-8-2021 | 1,488 | 0 | |||||||||
| 621,934 USD | 3,385,000 BRL | Morgan Stanley | 1-8-2021 | 20,808 | 0 | |||||||||
| 529,975 USD | 7,950,000,000 IDR | Morgan Stanley | 1-8-2021 | 486 | 0 | |||||||||
| 486,547 USD | 37,500,000 RUB | Morgan Stanley | 1-15-2021 | 9,209 | 0 | |||||||||
|
|
|
| |||||||||||
| $ | 327,801 | $ | (68,877 | ) | ||||||||||
|
|
|
| |||||||||||
The accompanying notes are an integral part of these consolidated financial statements.
Wells Fargo Income Plus Fund | 27
Table of Contents
Consolidated portfolio of investments—September 30, 2020
Centrally Cleared Credit Default Swaps
| Reference index | Fixed rate received | Payment frequency | Maturity date | Notional amount | Value | Premiums paid (received) | Unrealized gains | Unrealized losses | ||||||||||||||||||||||||
| Sell protection | ||||||||||||||||||||||||||||||||
Markit CDX North American High Yield Index * | 5.00 | % | Quarterly | 12-20-2024 | 3,560,000 USD | $ | 182,063 | $ | (239,287 | ) | $ | 421,350 | $ | 0 | ||||||||||||||||||
Markit iTraxx Europe Subordinated Financial Index * | 1.00 | % | Quarterly | 6-20-2025 | 8,000,000 EUR | (163,866 | ) | (334,470 | ) | 170,604 | 0 | |||||||||||||||||||||
Markit iTraxx Europe Crossover Index * | 5.00 | % | Quarterly | 6-20-2025 | 2,920,020 EUR | 216,515 | (37,138 | ) | 253,653 | 0 | ||||||||||||||||||||||
|
|
|
|
|
| |||||||||||||||||||||||||||
| $ | (610,895 | ) | $ | 845,607 | $ | 0 | ||||||||||||||||||||||||||
|
|
|
|
|
| |||||||||||||||||||||||||||
| * | Represents an investment held in Strategic Income Special Investment (Cayman) Ltd., the consolidated entity. |
Investments in Affiliates
An affiliated investment is an investment in which the Fund owns at least 5% of the outstanding voting shares of the issuer or as a result of other relationships, such as the Fund and the issuer having the same investment manager. Transactions with issuers that were either affiliated persons of the Fund at the beginning of the period or the end of the period were as follows:
| Value, beginning of period | Purchases | Sales proceeds | Net realized gains (losses) | Net change in unrealized gains (losses) | Income from affiliated securities | Value, end of period | % of net assets | |||||||||||||||||||||||||
| Short-Term Investments | ||||||||||||||||||||||||||||||||
Investment Companies | ||||||||||||||||||||||||||||||||
Securities Lending Cash Investments LLC | $ | 1,264,965 | $ | 48,969,719 | $ | (45,511,098 | ) | $ | 14 | $ | 0 | $ | 19,626 | # | $ | 4,723,600 | ||||||||||||||||
Wells Fargo Government Money Market Fund Select Class | 5,727,766 | 123,839,108 | (122,946,139 | ) | 0 | 0 | 58,780 | 6,620,735 | ||||||||||||||||||||||||
|
|
|
|
|
|
|
|
|
| |||||||||||||||||||||||
| $ | 14 | $ | 0 | $ | 78,406 | $ | 11,344,335 | 7.46 | % | |||||||||||||||||||||||
|
|
|
|
|
|
|
|
|
| |||||||||||||||||||||||
| # | Amount shown represents income before fees and rebates. |
The accompanying notes are an integral part of these consolidated financial statements.
28 | Wells Fargo Income Plus Fund
Table of Contents
Consolidated statement of assets and liabilities—September 30, 2020
Assets | ||||
Investments in unaffiliated securities (including $4,636,840 of securities loaned), at value (cost $137,754,467) | $ | 140,570,859 | ||
Investments in affiliated securities, at value (cost $11,344,335) | 11,344,335 | |||
Cash at broker segregated for centrally cleared swap contracts | 1,281,441 | |||
Cash at broker segregated for forward foreign currency contracts | 360,088 | |||
Cash at broker segregated for open futures contracts | 1,434,357 | |||
Foreign currency, at value (cost $105,715) | 118,355 | |||
Receivable for investments sold | 603,067 | |||
Receivable for Fund shares sold | 262,454 | |||
Receivable for dividends and interest | 1,305,464 | |||
Receivable for daily variation margin on centrally cleared swap contracts | 21,552 | |||
Receivable for daily variation margin on open futures contracts | 50,964 | |||
Receivable for securities lending income, net | 4,980 | |||
Unrealized gains on forward foreign currency contracts | 327,801 | |||
Prepaid expenses and other assets | 42,076 | |||
|
| |||
Total assets | 157,727,793 | |||
|
| |||
Liabilities | ||||
Payable upon receipt of securities loaned | 4,723,600 | |||
Payable for when-issued transactions | 711,313 | |||
Payable for Fund shares redeemed | 40,700 | |||
Unrealized losses on forward foreign currency contracts | 68,877 | |||
Management fee payable | 47,498 | |||
Administration fees payable | 10,245 | |||
Distribution fee payable | 395 | |||
Trustees’ fees and expenses payable | 3,470 | |||
Accrued expenses and other liabilities | 50,259 | |||
|
| |||
Total liabilities | 5,656,357 | |||
|
| |||
Total net assets | $ | 152,071,436 | ||
|
| |||
Net assets consist of | ||||
Paid-in capital | $ | 148,808,300 | ||
Total distributable earnings | 3,263,136 | |||
|
| |||
Total net assets | $ | 152,071,436 | ||
|
| |||
Computation of net asset value and offering price per share | ||||
Net assets – Class A | $ | 1,662,280 | ||
Shares outstanding – Class A1 | 172,422 | |||
Net asset value per share – Class A | $9.64 | |||
Maximum offering price per share – Class A2 | $10.04 | |||
Net assets – Class C | $ | 646,896 | ||
Shares outstanding – Class C1 | 66,819 | |||
Net asset value per share – Class C | $9.68 | |||
Net assets – Administrator Class | $ | 39,981 | ||
Shares outstanding – Administrator Class1 | 4,119 | |||
Net asset value per share – Administrator Class | $9.71 | |||
Net assets – Institutional Class | $ | 149,722,279 | ||
Shares outstanding – Institutional Class1 | 15,551,227 | |||
Net asset value per share – Institutional Class | $9.63 | |||
| 1 | The Fund has an unlimited number of authorized shares. |
| 2 | Maximum offering price is computed as 100/96 of net asset value. On investments of $50,000 or more, the offering price is reduced. |
The accompanying notes are an integral part of these consolidated financial statements.
Wells Fargo Income Plus Fund | 29
Table of Contents
Consolidated statement of operations—year ended September 30, 2020
Investment income | ||||
Interest (net of foreign interest withholding taxes of $20,715) | $ | 6,015,290 | ||
Dividends | 356,956 | |||
Income from affiliated securities | 75,558 | |||
|
| |||
Total investment income | 6,447,804 | |||
|
| |||
Expenses | ||||
Management fee | 783,141 | |||
Administration fees |
| |||
Class A | 2,048 | |||
Class C | 951 | |||
Administrator Class | 42 | |||
Institutional Class | 117,803 | |||
Shareholder servicing fees |
| |||
Class A | 3,199 | |||
Class C | 1,485 | |||
Administrator Class | 104 | |||
Distribution fee |
| |||
Class C | 4,442 | |||
Custody and accounting fees | 42,682 | |||
Professional fees | 55,232 | |||
Registration fees | 59,933 | |||
Shareholder report expenses | 28,724 | |||
Trustees’ fees and expenses | 21,260 | |||
Other fees and expenses | 8,156 | |||
|
| |||
Total expenses | 1,129,202 | |||
Less: Fee waivers and/or expense reimbursements |
| |||
Fund-level | (223,436 | ) | ||
Class A | (449 | ) | ||
Class C | (170 | ) | ||
Administrator Class | (50 | ) | ||
|
| |||
Net expenses | 905,097 | |||
|
| |||
Net investment income | 5,542,707 | |||
|
| |||
Payment from affiliate | 4,844 | |||
|
| |||
Realized and unrealized gains (losses) on investments | ||||
Net realized gains (losses) on |
| |||
Unaffiliated securities | (717,581 | ) | ||
Affiliated securities | 14 | |||
Futures contracts | 1,293,079 | |||
Forward foreign currency contracts | 637,536 | |||
Swap contracts | (552,003 | ) | ||
|
| |||
Net realized gains on investments | 661,045 | |||
|
| |||
Net change in unrealized gains (losses) on |
| |||
Unaffiliated securities | 1,045,089 | |||
Futures contracts | (683,605 | ) | ||
Forward foreign currency contracts | (18,859 | ) | ||
Swap contracts | 773,452 | |||
|
| |||
Net change in unrealized gains (losses) on investments | 1,116,077 | |||
|
| |||
Net realized and unrealized gains (losses) on investments | 1,777,122 | |||
|
| |||
Net increase in net assets resulting from operations | $ | 7,324,673 | ||
|
| |||
The accompanying notes are an integral part of these consolidated financial statements.
30 | Wells Fargo Income Plus Fund
Table of Contents
Consolidated statement of changes in net assets
| Year ended September 30, 2020 | Year ended September 30, 2019 | |||||||||||||||
Operations |
| |||||||||||||||
Net investment income | $ | 5,542,707 | $ | 5,933,019 | ||||||||||||
Payment from affiliate | 4,844 | 0 | ||||||||||||||
Net realized gains (losses) on investments | 661,045 | (1,109,628 | ) | |||||||||||||
Net change in unrealized gains (losses) on investments | 1,116,077 | 3,592,086 | ||||||||||||||
|
| |||||||||||||||
Net increase in net assets resulting from operations | 7,324,673 | 8,415,477 | ||||||||||||||
|
| |||||||||||||||
Distributions to shareholders from net investment income and net realized gains | ||||||||||||||||
Class A | (38,988 | ) | (49,220 | ) | ||||||||||||
Class C | (14,146 | ) | (15,657 | ) | ||||||||||||
Administrator Class | (1,190 | ) | (32,865 | ) | ||||||||||||
Institutional Class | (5,017,004 | ) | (5,853,845 | ) | ||||||||||||
|
| |||||||||||||||
Total distributions to shareholders | (5,071,328 | ) | (5,951,587 | ) | ||||||||||||
|
| |||||||||||||||
Capital share transactions | Shares | Shares | ||||||||||||||
Proceeds from shares sold |
| |||||||||||||||
Class A | 150,512 | 1,444,612 | 348,536 | 3,298,070 | ||||||||||||
Class C | 29,426 | 280,500 | 31,806 | 297,418 | ||||||||||||
Administrator Class | 657 | 6,322 | 7,156 | 67,124 | ||||||||||||
Institutional Class | 3,895,449 | 36,532,793 | 18,145,872 | 169,524,726 | ||||||||||||
|
| |||||||||||||||
| 38,264,227 | 173,187,338 | |||||||||||||||
|
| |||||||||||||||
Reinvestment of distributions |
| |||||||||||||||
Class A | 4,067 | 38,988 | 5,230 | 49,054 | ||||||||||||
Class C | 1,475 | 14,146 | 1,676 | 15,657 | ||||||||||||
Administrator Class | 91 | 872 | 3,474 | 32,494 | ||||||||||||
Institutional Class | 495,225 | 4,735,565 | 596,321 | 5,581,802 | ||||||||||||
|
| |||||||||||||||
| 4,789,571 | 5,679,007 | |||||||||||||||
|
| |||||||||||||||
Payment for shares redeemed |
| |||||||||||||||
Class A | (128,840 | ) | (1,233,596 | ) | (341,311 | ) | (3,228,609 | ) | ||||||||
Class C | (18,931 | ) | (178,945 | ) | (33,529 | ) | (314,988 | ) | ||||||||
Administrator Class | (4,466 | ) | (42,955 | ) | (581,301 | ) | (5,483,073 | ) | ||||||||
Institutional Class | (4,996,793 | ) | (47,183,521 | ) | (7,379,074 | ) | (69,328,595 | ) | ||||||||
|
| |||||||||||||||
| (48,639,017 | ) | (78,355,265 | ) | |||||||||||||
|
| |||||||||||||||
Net increase (decrease) in net assets resulting from capital share transactions | (5,585,219 | ) | 100,511,080 | |||||||||||||
|
| |||||||||||||||
Total increase (decrease) in net assets | (3,331,874 | ) | 102,974,970 | |||||||||||||
|
| |||||||||||||||
Net assets | ||||||||||||||||
Beginning of period | 155,403,310 | 52,428,340 | ||||||||||||||
|
| |||||||||||||||
End of period | $ | 152,071,436 | $ | 155,403,310 | ||||||||||||
|
| |||||||||||||||
The accompanying notes are an integral part of these consolidated financial statements.
Wells Fargo Income Plus Fund | 31
Table of Contents
Consolidated financial highlights
(For a share outstanding throughout each period)
| Year ended September 30 | Year ended October 31, 2015 | |||||||||||||||||||||||
| CLASS A | 2020 | 2019 | 2018 | 2017 | 20161 | |||||||||||||||||||
Net asset value, beginning of period | $9.50 | $9.43 | $9.59 | $9.25 | $9.13 | $9.72 | ||||||||||||||||||
Net investment income | 0.29 | 0.34 | 2 | 0.31 | 2 | 0.33 | 2 | 0.31 | 0.34 | |||||||||||||||
Net realized and unrealized gains (losses) on investments | 0.14 | 0.09 | (0.16 | ) | 0.22 | (0.01 | ) | (0.69 | ) | |||||||||||||||
|
|
|
|
|
|
|
|
|
|
|
| |||||||||||||
Total from investment operations | 0.43 | 0.43 | 0.15 | 0.55 | 0.30 | (0.35 | ) | |||||||||||||||||
Distributions to shareholders from | ||||||||||||||||||||||||
Net investment income | (0.29 | ) | (0.36 | ) | (0.31 | ) | (0.21 | ) | (0.13 | ) | (0.22 | ) | ||||||||||||
Tax basis return of capital | 0.00 | 0.00 | 0.00 | 0.00 | (0.05 | ) | (0.02 | ) | ||||||||||||||||
|
|
|
|
|
|
|
|
|
|
|
| |||||||||||||
Total distributions to shareholders | (0.29 | ) | (0.36 | ) | (0.31 | ) | (0.21 | ) | (0.18 | ) | (0.24 | ) | ||||||||||||
Net asset value, end of period | $9.64 | $9.50 | $9.43 | $9.59 | $9.25 | $9.13 | ||||||||||||||||||
Total return3 | 4.60 | % | 4.66 | % | 1.59 | % | 6.05 | % | 3.34 | % | (3.64 | )% | ||||||||||||
Ratios to average net assets (annualized) | ||||||||||||||||||||||||
Gross expenses | 1.08 | % | 1.09 | % | 1.45 | % | 1.78 | % | 1.80 | % | 1.63 | % | ||||||||||||
Net expenses | 0.90 | % | 0.90 | % | 0.90 | % | 0.90 | % | 0.90 | % | 0.90 | % | ||||||||||||
Net investment income | 3.43 | % | 3.65 | % | 3.26 | % | 3.47 | % | 3.85 | % | 3.77 | % | ||||||||||||
Supplemental data | ||||||||||||||||||||||||
Portfolio turnover rate | 88 | % | 116 | % | 50 | % | 65 | % | 52 | % | 53 | % | ||||||||||||
Net assets, end of period (000s omitted) | $1,662 | $1,394 | $1,266 | $896 | $1,047 | $928 | ||||||||||||||||||
| 1 | For the eleven months ended September 30, 2016. The Fund changed its fiscal year end from October 31 to September 30, effective September 30, 2016. |
| 2 | Calculated based upon average shares outstanding |
| 3 | Total return calculations do not include any sales charges. Returns for periods of less than one year are not annualized. |
The accompanying notes are an integral part of these consolidated financial statements.
32 | Wells Fargo Income Plus Fund
Table of Contents
Consolidated financial highlights
(For a share outstanding throughout each period)
| Year ended September 30 | Year ended October 2015 | |||||||||||||||||||||||
| CLASS C | 2020 | 2019 | 2018 | 2017 | 20161 | |||||||||||||||||||
Net asset value, beginning of period | $9.49 | $9.41 | $9.57 | $9.22 | $9.10 | $9.71 | ||||||||||||||||||
Net investment income | 0.23 | 0.27 | 0.23 | 0.29 | 0.25 | 0.28 | ||||||||||||||||||
Payment from affiliate | 0.07 | 0.00 | 0.00 | 0.00 | 0.00 | 0.00 | ||||||||||||||||||
Net realized and unrealized gains (losses) on investments | 0.12 | 0.10 | (0.15 | ) | 0.18 | (0.02 | ) | (0.68 | ) | |||||||||||||||
|
|
|
|
|
|
|
|
|
|
|
| |||||||||||||
Total from investment operations | 0.42 | 0.37 | 0.08 | 0.47 | 0.23 | (0.40 | ) | |||||||||||||||||
Distributions to shareholders from | ||||||||||||||||||||||||
Net investment income | (0.23 | ) | (0.29 | ) | (0.24 | ) | (0.12 | ) | (0.08 | ) | (0.19 | ) | ||||||||||||
Tax basis return of capital | 0.00 | 0.00 | 0.00 | 0.00 | (0.03 | ) | (0.02 | ) | ||||||||||||||||
|
|
|
|
|
|
|
|
|
|
|
| |||||||||||||
Total distributions to shareholders | (0.23 | ) | (0.29 | ) | (0.24 | ) | (0.12 | ) | (0.11 | ) | (0.21 | ) | ||||||||||||
Net asset value, end of period | $9.68 | $9.49 | $9.41 | $9.57 | $9.22 | $9.10 | ||||||||||||||||||
Total return2 | 4.45 | %3 | 4.00 | % | 0.88 | % | 5.20 | % | 2.67 | % | (4.35 | )% | ||||||||||||
Ratios to average net assets (annualized) | ||||||||||||||||||||||||
Gross expenses | 1.83 | % | 1.84 | % | 2.20 | % | 2.59 | % | 2.54 | % | 2.37 | % | ||||||||||||
Net expenses | 1.65 | % | 1.65 | % | 1.65 | % | 1.65 | % | 1.65 | % | 1.65 | % | ||||||||||||
Net investment income | 2.67 | % | 2.92 | % | 2.52 | % | 2.80 | % | 3.10 | % | 3.02 | % | ||||||||||||
Supplemental data | ||||||||||||||||||||||||
Portfolio turnover rate | 88 | % | 116 | % | 50 | % | 65 | % | 52 | % | 53 | % | ||||||||||||
Net assets, end of period (000s omitted) | $647 | $520 | $517 | $403 | $766 | $711 | ||||||||||||||||||
| 1 | For the eleven months ended September 30, 2016. The Fund changed its fiscal year end from October 31 to September 30, effective September 30, 2016. |
| 2 | Total return calculations do not include any sales charges. Returns for periods of less than one year are not annualized. |
| 3 | During the year ended September 30, 2020, the Fund received a payment from an affiliate which had a 0.79% impact on the total return. See Note 5 in the Consolidated Notes to Financial Statements for additional information. |
The accompanying notes are an integral part of these consolidated financial statements.
Wells Fargo Income Plus Fund | 33
Table of Contents
Consolidated financial highlights
(For a share outstanding throughout each period)
| Year ended September 30 | Year ended October 31, 2015 | |||||||||||||||||||||||
| ADMINISTRATOR CLASS | 2020 | 2019 | 2018 | 2017 | 20161 | |||||||||||||||||||
Net asset value, beginning of period | $9.56 | $9.46 | $9.61 | $9.29 | $9.16 | $9.74 | ||||||||||||||||||
Net investment income | 0.34 | 2 | 0.36 | 2 | 0.33 | 2 | 0.34 | 2 | 0.33 | 2 | 0.37 | |||||||||||||
Net realized and unrealized gains (losses) on investments | 0.11 | 0.09 | (0.16 | ) | 0.20 | (0.01 | ) | (0.70 | ) | |||||||||||||||
|
|
|
|
|
|
|
|
|
|
|
| |||||||||||||
Total from investment operations | 0.45 | 0.45 | 0.17 | 0.54 | 0.32 | (0.33 | ) | |||||||||||||||||
Distributions to shareholders from | ||||||||||||||||||||||||
Net investment income | (0.30 | ) | (0.35 | ) | (0.32 | ) | (0.22 | ) | (0.14 | ) | (0.22 | ) | ||||||||||||
Tax basis return of capital | 0.00 | 0.00 | 0.00 | 0.00 | (0.05 | ) | (0.03 | ) | ||||||||||||||||
|
|
|
|
|
|
|
|
|
|
|
| |||||||||||||
Total distributions to shareholders | (0.30 | ) | (0.35 | ) | (0.32 | ) | (0.22 | ) | (0.19 | ) | (0.25 | ) | ||||||||||||
Net asset value, end of period | $9.71 | $9.56 | $9.46 | $9.61 | $9.29 | $9.16 | ||||||||||||||||||
Total return3 | 4.72 | % | 4.83 | % | 1.81 | % | 5.91 | % | 3.52 | % | (3.51 | )% | ||||||||||||
Ratios to average net assets (annualized) | ||||||||||||||||||||||||
Gross expenses | 1.02 | % | 1.08 | % | 1.38 | % | 1.72 | % | 1.74 | % | 1.56 | % | ||||||||||||
Net expenses | 0.75 | % | 0.75 | % | 0.75 | % | 0.75 | % | 0.75 | % | 0.75 | % | ||||||||||||
Net investment income | 3.61 | % | 3.80 | % | 3.48 | % | 3.64 | % | 4.00 | % | 3.92 | % | ||||||||||||
Supplemental data | ||||||||||||||||||||||||
Portfolio turnover rate | 88 | % | 116 | % | 50 | % | 65 | % | 52 | % | 53 | % | ||||||||||||
Net assets, end of period (000s omitted) | $40 | $75 | $5,471 | $562 | $597 | $496 | ||||||||||||||||||
| 1 | For the eleven months ended September 30, 2016. The Fund changed its fiscal year end from October 31 to September 30, effective September 30, 2016. |
| 2 | Calculated based upon average shares outstanding |
| 3 | Returns for periods of less than one year are not annualized. |
The accompanying notes are an integral part of these consolidated financial statements.
34 | Wells Fargo Income Plus Fund
Table of Contents
Consolidated financial highlights
(For a share outstanding throughout each period)
| Year ended September 30 | Year ended October 31, 2015 | |||||||||||||||||||||||
| INSTITUTIONAL CLASS | 2020 | 2019 | 2018 | 2017 | 20161 | |||||||||||||||||||
Net asset value, beginning of period | $9.49 | $9.42 | $9.58 | $9.24 | $9.14 | $9.71 | ||||||||||||||||||
Net investment income | 0.36 | 0.37 | 2 | 0.34 | 0.35 | 2 | 0.34 | 0.40 | ||||||||||||||||
Net realized and unrealized gains (losses) on investments | 0.10 | 0.09 | (0.16 | ) | 0.24 | (0.02 | ) | (0.71 | ) | |||||||||||||||
|
|
|
|
|
|
|
|
|
|
|
| |||||||||||||
Total from investment operations | 0.46 | 0.46 | 0.18 | 0.59 | 0.32 | (0.31 | ) | |||||||||||||||||
Distributions to shareholders from | ||||||||||||||||||||||||
Net investment income | (0.32 | ) | (0.39 | ) | (0.34 | ) | (0.25 | ) | (0.16 | ) | (0.23 | ) | ||||||||||||
Tax basis return of capital | 0.00 | 0.00 | 0.00 | 0.00 | (0.06 | ) | (0.03 | ) | ||||||||||||||||
|
|
|
|
|
|
|
|
|
|
|
| |||||||||||||
Total distributions to shareholders | (0.32 | ) | (0.39 | ) | (0.34 | ) | (0.25 | ) | (0.22 | ) | (0.26 | ) | ||||||||||||
Net asset value, end of period | $9.63 | $9.49 | $9.42 | $9.58 | $9.24 | $9.14 | ||||||||||||||||||
Total return3 | 4.96 | % | 5.00 | % | 1.93 | % | 6.43 | % | 3.55 | % | (3.28 | )% | ||||||||||||
Ratios to average net assets (annualized) | ||||||||||||||||||||||||
Gross expenses | 0.75 | % | 0.75 | % | 1.12 | % | 1.40 | % | 1.46 | % | 1.19 | % | ||||||||||||
Net expenses | 0.60 | % | 0.60 | % | 0.60 | % | 0.60 | % | 0.60 | % | 0.60 | % | ||||||||||||
Net investment income | 3.72 | % | 3.97 | % | 3.54 | % | 3.71 | % | 4.16 | % | 4.04 | % | ||||||||||||
Supplemental data | ||||||||||||||||||||||||
Portfolio turnover rate | 88 | % | 116 | % | 50 | % | 65 | % | 52 | % | 53 | % | ||||||||||||
Net assets, end of period (000s omitted) | $149,722 | $153,414 | $45,175 | $45,862 | $23,190 | $17,564 | ||||||||||||||||||
| 1 | For the eleven months ended September 30, 2016. The Fund changed its fiscal year end from October 31 to September 30, effective September 30, 2016. |
| 2 | Calculated based upon average shares outstanding |
| 3 | Returns for periods of less than one year are not annualized. |
The accompanying notes are an integral part of these consolidated financial statements.
Wells Fargo Income Plus Fund | 35
Table of Contents
Consolidated notes to financial statements
1. ORGANIZATION
Wells Fargo Funds Trust (the “Trust”), a Delaware statutory trust organized on March 10, 1999, is an open-end management investment company registered under the Investment Company Act of 1940, as amended (the “1940 Act”). As an investment company, the Trust follows the accounting and reporting guidance in Financial Accounting Standards Board (“FASB”) Accounting Standards Codification Topic 946, Financial Services – Investment Companies. These consolidated financial statements report on the Wells Fargo Income Plus Fund (formerly, Wells Fargo Strategic Income Fund) (the “Fund”) which is a diversified series of the Trust.
2. INVESTMENT IN SUBSIDIARY
The Fund invests in Strategic Income Special Investment (Cayman) Ltd. (the “Subsidiary”), a wholly-owned subsidiary incorporated on July 11, 2019 under the laws of the Cayman Islands as an exempted segregated portfolio company with limited liability. As of September 30, 2020, the Subsidiary had $6,615,094 invested in swap contracts and cash equivalents and had $1,039,602 in cash segregated at the broker for the swap contracts which in the aggregate represented 99.51% of its net assets. The Fund is the sole shareholder of the Subsidiary. As of September 30, 2020, the Fund held $7,692,702 in the Subsidiary, representing 5.06% of the Fund’s net assets prior to consolidation.
The consolidated financial statements of the Fund include the financial results of its wholly-owned subsidiary. The Consolidated Portfolio of Investments includes positions of the Fund and the Subsidiary and the consolidated financial statements include the accounts of the Fund and the Subsidiary. Accordingly, all interfund balances and transactions between the Fund and the Subsidiary have been eliminated in consolidation.
3. SIGNIFICANT ACCOUNTING POLICIES
The following significant accounting policies, which are consistently followed in the preparation of the consolidated financial statements of the Fund, are in conformity with U.S. generally accepted accounting principles which require management to make estimates and assumptions that affect the reported amounts of assets and liabilities, disclosure of contingent assets and liabilities at the date of the consolidated financial statements, and the reported amounts of revenues and expenses during the reporting period. Actual results could differ from those estimates.
Securities valuation
All investments are valued each business day as of the close of regular trading on the New York Stock Exchange (generally 4 p.m. Eastern Time), although the Fund may deviate from this calculation time under unusual or unexpected circumstances.
Debt securities are valued at the evaluated bid price provided by an independent pricing service (e.g. taking into account various factors, including yields, maturities, or credit ratings) or, if a reliable price is not available, the quoted bid price from an independent broker-dealer.
Equity securities and futures contracts that are listed on a foreign or domestic exchange or market are valued at the official closing price or, if none, the last sales price. If no sale occurs on the principal exchange or market that day, a fair value price will be determined in accordance with the Fund’s Valuation Procedures.
Swap contracts are valued at the evaluated price provided by an independent pricing service or, if a reliable price is not available, the quoted bid price from an independent broker-dealer.
Forward foreign currency contracts are recorded at the forward rate provided by an independent foreign currency pricing source at a time each business day specified by the Wells Fargo Asset Management Pricing Committee at Wells Fargo Funds Management, LLC (“Funds Management”).
The values of securities denominated in foreign currencies are translated into U.S. dollars at rates provided by an independent foreign currency pricing source at a time each business day specified by the Wells Fargo Asset Management Pricing Committee.
Investments in registered open-end investment companies are valued at net asset value. Interests in non-registered investment companies that are redeemable at net asset value are fair valued normally at net asset value.
Investments which are not valued using any of the methods discussed above are valued at their fair value, as determined in good faith by the Board of Trustees of the Fund. The Board of Trustees has established a Valuation Committee comprised of the Trustees and has delegated to it the authority to take any actions regarding the valuation of portfolio securities that the Valuation Committee deems necessary or appropriate, including determining the fair value of portfolio securities, unless the determination has been delegated to the Wells Fargo Asset Management Pricing Committee. The Board of Trustees retains the authority to make or ratify any valuation decisions or approve any changes to the Valuation Procedures as it deems appropriate. On a quarterly basis, the Board of Trustees receives reports on any valuation actions taken by the Valuation Committee or the Wells Fargo Asset Management Pricing Committee which may include items for ratification.
36 | Wells Fargo Income Plus Fund
Table of Contents
Consolidated notes to financial statements
Foreign currency translation
The accounting records of the Fund are maintained in U.S. dollars. The values of other assets and liabilities denominated in foreign currencies are translated into U.S. dollars at rates provided by an independent foreign currency pricing source at a time each business day specified by the Wells Fargo Asset Management Pricing Committee. Purchases and sales of securities, and income and expenses are converted at the rate of exchange on the respective dates of such transactions. Net realized foreign exchange gains or losses arise from sales of foreign currencies, currency gains or losses realized between the trade and settlement dates on securities transactions, and the difference between the amounts of dividends, interest and foreign withholding taxes recorded and the U.S. dollar equivalent of the amounts actually paid or received. Net unrealized foreign exchange gains and losses arise from changes in the fair value of assets and liabilities other than investments in securities resulting from changes in exchange rates. The changes in net assets arising from changes in exchange rates of securities and the changes in net assets resulting from changes in market prices of securities are not separately presented. Such changes are included in net realized and unrealized gains or losses from investments.
Forward foreign currency contracts
A forward foreign currency contract is an agreement between two parties to purchase or sell a specific currency for an agreed-upon price at a future date. The Fund enters into forward foreign currency contracts to facilitate transactions in foreign-denominated securities and to attempt to minimize the risk to the Fund from adverse changes in the relationship between currencies. Forward foreign currency contracts are recorded at the forward rate and marked-to-market daily. When the contracts are closed, realized gains and losses arising from such transactions are recorded as realized gains or losses on forward foreign currency contracts. The Fund is subject to foreign currency risk and may be exposed to risks if the counterparties to the contracts are unable to meet the terms of their contracts or if the value of the foreign currency changes unfavorably. The Fund’s maximum risk of loss from counterparty credit risk is the unrealized gains on the contracts. This risk may be mitigated if there is a master netting arrangement between the Fund and the counterparty.
Securities lending
The Fund may lend its securities from time to time in order to earn additional income in the form of fees or interest on securities received as collateral or the investment of any cash received as collateral. When securities are on loan, the Fund receives interest or dividends on those securities. Cash collateral received in connection with its securities lending transactions is invested in Securities Lending Cash Investments, LLC (the “Securities Lending Fund”). Investments in Securities Lending Fund are valued at the evaluated bid price provided by an independent pricing service. Income earned from investment in the Securities Lending Fund (net of fees and rebates), if any, is included in income from affiliated securities on the Consolidated Statement of Operations.
In a securities lending transaction, the net asset value of the Fund is affected by an increase or decrease in the value of the securities loaned and by an increase or decrease in the value of the instrument in which collateral is invested. The amount of securities lending activity undertaken by the Fund fluctuates from time to time. The Fund has the right under the lending agreement to recover the securities from the borrower on demand. In the event of default or bankruptcy by the borrower, the Fund may be prevented from recovering the loaned securities or gaining access to the collateral or may experience delays or costs in doing so. In such an event, the terms of the agreement allow the unaffiliated securities lending agent to use the collateral to purchase replacement securities on behalf of the Fund or pay the Fund the market value of the loaned securities. The Fund bears the risk of loss with respect to depreciation of its investment of the cash collateral.
When-issued transactions
The Fund may purchase securities on a forward commitment or when-issued basis. The Fund records a when-issued transaction on the trade date and will segregate assets in an amount at least equal in value to the Fund’s commitment to purchase when-issued securities. Securities purchased on a when-issued basis are marked-to-market daily and the Fund begins earning interest on the settlement date. Losses may arise due to changes in the market value of the underlying securities or if the counterparty does not perform under the contract.
Loans
The Fund may invest in direct debt instruments which are interests in amounts owed to lenders by corporate or other borrowers. The loans pay interest at rates which are periodically reset by reference to a base lending rate plus a spread. Investments in loans may be in the form of participations in loans or assignments of all or a portion of loans from third parties. When the Fund purchases participations, it generally has no rights to enforce compliance with the terms of the loan agreement with the borrower. As a result, the Fund assumes the credit risk of both the borrower and the lender that is selling the participation. When the Fund purchases assignments from lenders, it acquires direct rights against the borrower on the loan and may enforce compliance by the borrower with the terms of the loan agreement. Loans may include fully funded term loans or unfunded loan commitments, which are contractual obligations for future funding.
Wells Fargo Income Plus Fund | 37
Table of Contents
Consolidated notes to financial statements
Futures contracts
Futures contracts are agreements between the Fund and a counterparty to buy or sell a specific amount of a commodity, financial instrument or currency at a specified price and on a specified date. The Fund may buy and sell futures contracts in order to gain exposure to, or protect against, changes in interest rates and is subject to interest rate risk. The primary risks associated with the use of futures contracts are the imperfect correlation between changes in market values of securities held by the Fund and the prices of futures contracts, and the possibility of an illiquid market. Futures contracts are generally entered into on a regulated futures exchange and cleared through a clearinghouse associated with the exchange. With futures contracts, there is minimal counterparty risk to the Fund since futures contracts are exchange traded and the exchange’s clearinghouse, as the counterparty to all exchange traded futures, guarantees the futures contracts against default.
Upon entering into a futures contracts, the Fund is required to deposit either cash or securities (initial margin) with the broker in an amount equal to a certain percentage of the contract value. Subsequent payments (variation margin) are paid to or from the broker each day equal to the daily changes in the contract value. Such payments are recorded as unrealized gains or losses and, if any, shown as variation margin receivable (payable) in the Consolidated Statement of Assets and Liabilities. Should the Fund fail to make requested variation margin payments, the broker can gain access to the initial margin to satisfy the Fund’s payment obligations. When the contracts are closed, a realized gain or loss is recorded in the Consolidated Statement of Operations.
Swap contracts
Swap contracts are agreements between the Fund and a counterparty to exchange a series of cash flows over a specified period. Swap agreements are privately negotiated contracts between the Fund that are entered into as bilateral contracts in the OTC market (“OTC swaps”) or centrally cleared (“centrally cleared swaps”) with a central clearinghouse.
The Fund entered into centrally cleared swaps. In a centrally cleared swap, immediately following execution of the swap contract, the swap contract is novated to a central counterparty (the “CCP”) and the Fund’s counterparty on the swap agreement becomes the CCP. Upon entering into a centrally cleared swap, the Fund is required to deposit an initial margin with the broker in the form of cash or securities. Securities deposited as initial margin are designated in the Consolidated Portfolio of Investments and cash deposited is shown as cash segregated for centrally cleared swaps in the Consolidated Statement of Assets and Liabilities. Pursuant to the contract, the Fund agrees to receive from or pay to the broker an amount of cash equal to the daily fluctuation in market value of the contract (“variation margin”). The variation margin is recorded as an unrealized gain (or loss) and shown as variation margin receivable (or payable) on centrally cleared swaps in the Consolidated Statement of Assets and Liabilities. Payments received from (paid to) the counterparty, including at termination, are recorded as realized gains (losses) in the Consolidated Statement of Operations.
Credit default swaps
The Fund may enter into credit default swaps for hedging or speculative purposes to provide or receive a measure of protection against default on a referenced entity, obligation or index or a basket of single-name issuers or traded indexes. An index credit default swap references all the names in the index, and if a credit event is triggered, the credit event is settled based on that name’s weight in the index. Credit default swaps are agreements in which the protection buyer pays fixed periodic payments to the protection seller in consideration for a promise from the protection seller to make a specific payment should a negative credit event take place with respect to the referenced entity (e.g., bankruptcy, failure to pay, obligation acceleration, repudiation, moratorium or restructuring).
The Fund may enter into credit default swaps as either the seller of protection or the buyer of protection. If the Fund is the buyer of protection and a credit event occurs, the Fund will either receive from the seller an amount equal to the notional amount of the swap and deliver the referenced security or underlying securities comprising the index, or receive a net settlement of cash equal to the notional amount of the swap less the recovery value of the security or underlying securities comprising the index. If the Fund is the seller of protection and a credit event occurs, the Fund will either pay the buyer an amount equal to the notional amount of the swap and take delivery of the referenced security or underlying securities comprising the index or pay a net settlement of cash equal to the notional amount of the swap less the recovery value of the security or underlying securities comprising the index.
As the seller of protection, the Fund is subject to investment exposure on the notional amount of the swap and has assumed the risk of default of the underlying security or index. As the buyer of protection, the Fund could be exposed to risks if the seller of the protection defaults on its obligation to perform, or if there are unfavorable changes in the fluctuation of interest rates.
By entering into credit default swap contracts, the Fund is exposed to credit risk. In addition, certain credit default swap contracts entered into by the Fund provide for conditions that result in events of default or termination that enable the counterparty to the agreement to cause an early termination of the transactions under those agreements.
38 | Wells Fargo Income Plus Fund
Table of Contents
Consolidated notes to financial statements
Security transactions and income recognition
Securities transactions are recorded on a trade date basis. Realized gains or losses are recorded on the basis of identified cost.
Interest income is accrued daily and bond discounts are accreted and premiums are amortized daily. To the extent debt obligations are placed on non-accrual status, any related interest income may be reduced by writing off interest receivables when the collection of all or a portion of interest has been determined to be doubtful based on consistently applied procedures and the fair value has decreased. If the issuer subsequently resumes interest payments or when the collectability of interest is reasonably assured, the debt obligation is removed from non-accrual status.
Dividend income is recognized on the ex-dividend date.
Income from foreign securities is recorded net of foreign taxes withheld where recovery of such taxes is not assured.
Income dividends and capital gain distributions from investment companies are recorded on the ex-dividend date. Capital gain distributions from investment companies are treated as realized gains.
Distributions to shareholders
Distributions to shareholders are recorded on the ex-dividend date and paid from net investment income monthly and any net realized gains are paid at least annually. Such distributions are determined in accordance with income tax regulations and may differ from U.S. generally accepted accounting principles. Dividend sources are estimated at the time of declaration. The tax character of distributions is determined as of the Fund’s fiscal year end. Therefore, a portion of the Fund’s distributions made prior to the Fund’s fiscal year end may be categorized as a tax return of capital at year end.
Federal and other taxes
The Fund intends to continue to qualify as a regulated investment company by distributing substantially all of its investment company taxable income and any net realized capital gains (after reduction for capital loss carryforwards) sufficient to relieve it from all, or substantially all, federal income taxes. Accordingly, no provision for federal income taxes was required.
The Fund’s income and federal excise tax returns and all financial records supporting those returns for the prior three fiscal years are subject to examination by the federal and Delaware revenue authorities. Management has analyzed the Fund’s tax positions taken on federal, state, and foreign tax returns for all open tax years and does not believe that there are any uncertain tax positions that require recognition of a tax liability.
As of September 30, 2020, the aggregate cost of all investments for federal income tax purposes was $149,187,503 and the unrealized gains (losses) consisted of:
Gross unrealized gains | $ | 7,624,160 | ||
Gross unrealized losses | (3,931,157 | ) | ||
Net unrealized gains | $ | 3,693,003 | ||
Reclassifications are made to the Fund’s capital accounts for permanent tax differences to reflect income and gains available for distribution (or available capital loss carryforwards) under federal income tax regulations. U.S. generally accepted accounting principles require that certain components of net assets be adjusted to reflect permanent differences between financial and tax reporting. These reclassifications have no effect on net assets or net asset values per share. The primary permanent difference causing such reclassification is due to losses from a controlled foreign corporation. At September 30, 2020, as a result of permanent book-to-tax differences, the following reclassification adjustments were made on the Statement of Assets and Liabilities:
| Paid-in capital | Total distributable earnings | |
| $(45,737) | $45,737 | |
As of September 30, 2020, the Fund had capital loss carryforwards which consist of $584,258 in long-term capital losses.
Class allocations
The separate classes of shares offered by the Fund differ principally in applicable sales charges, distribution, shareholder servicing, and administration fees. Class specific expenses are charged directly to that share class. Investment income, common fund-level expenses, and realized and unrealized gains (losses) on investments are allocated daily to each class of shares based on the relative proportion of net assets of each class.
4. FAIR VALUATION MEASUREMENTS
Fair value measurements of investments are determined within a framework that has established a fair value hierarchy based upon the various data inputs utilized in determining the value of the Fund’s investments. The three-level hierarchy gives the
Wells Fargo Income Plus Fund | 39
Table of Contents
Consolidated notes to financial statements
highest priority to unadjusted quoted prices in active markets for identical assets or liabilities (Level 1) and the lowest priority to unobservable inputs (Level 3). The Fund’s investments are classified within the fair value hierarchy based on the lowest level of input that is significant to the fair value measurement. The inputs are summarized into three broad levels as follows:
| ∎ | Level 1 – quoted prices in active markets for identical securities |
| ∎ | Level 2 – other significant observable inputs (including quoted prices for similar securities, interest rates, prepayment speeds, credit risk, etc.) |
| ∎ | Level 3 – significant unobservable inputs (including the Fund’s own assumptions in determining the fair value of investments) |
The inputs or methodologies used for valuing investments in securities are not necessarily an indication of the risk associated with investing in those securities.
The following is a summary of the inputs used in valuing the Fund’s assets and liabilities as of September 30, 2020:
| Quoted prices (Level 1) | Other significant observable inputs (Level 2) | Significant (Level 3) | Total | |||||||||||||
Assets | ||||||||||||||||
Investments in: | ||||||||||||||||
Agency securities | $ | 0 | $ | 9,559,755 | $ | 0 | $ | 9,559,755 | ||||||||
Common stocks | ||||||||||||||||
Energy | 209,779 | 0 | 0 | 209,779 | ||||||||||||
Corporate bonds and notes | 0 | 47,358,379 | 0 | 47,358,379 | ||||||||||||
Exchange-traded funds | 10,095,257 | 0 | 0 | 10,095,257 | ||||||||||||
Foreign corporate bonds and notes | 0 | 15,641,549 | 0 | 15,641,549 | ||||||||||||
Foreign government bonds | 0 | 6,001,942 | 0 | 6,001,942 | ||||||||||||
Loans | 0 | 3,167,111 | 167,387 | 3,334,498 | ||||||||||||
Municipal obligations | 0 | 456,937 | 0 | 456,937 | ||||||||||||
Non-agency mortgage-backed securities | 0 | 27,556,033 | 0 | 27,556,033 | ||||||||||||
Rights | ||||||||||||||||
Utilities | 0 | 6,842 | 0 | 6,842 | ||||||||||||
U.S. Treasury securities | 4,336,598 | 0 | 0 | 4,336,598 | ||||||||||||
Yankee corporate bonds and notes | 0 | 13,102,826 | 0 | 13,102,826 | ||||||||||||
Yankee government bonds | 0 | 2,910,464 | 0 | 2,910,464 | ||||||||||||
Short-term investments | ||||||||||||||||
Investment companies | 11,344,335 | 0 | 0 | 11,344,335 | ||||||||||||
| 25,985,969 | 125,761,838 | 167,387 | 151,915,194 | |||||||||||||
Futures contracts | 15,923 | 0 | 0 | 15,923 | ||||||||||||
| Forward foreign currency contracts | 0 | 327,801 | 0 | 327,801 | ||||||||||||
| Credit default swap contracts | 0 | 845,607 | 0 | 845,607 | ||||||||||||
Total assets | $ | 26,001,892 | $ | 126,935,246 | $ | 167,387 | $ | 153,104,525 | ||||||||
Liabilities | ||||||||||||||||
Futures contracts | $ | 155,142 | $ | 0 | $ | 0 | $ | 155,142 | ||||||||
Forward foreign currency contracts | 0 | 68,877 | 0 | 68,877 | ||||||||||||
Total liabilities | $ | 155,142 | $ | 68,877 | $ | 0 | $ | 224,019 | ||||||||
Additional sector, industry or geographic detail is included in the Consolidated Portfolio of Investments.
40 | Wells Fargo Income Plus Fund
Table of Contents
Consolidated notes to financial statements
Futures contracts, forward foreign currency contracts and swap contracts are reported at their cumulative unrealized gains (losses) at measurement date as reported in the tables following the Consolidated Portfolio of Investments. For futures contracts and centrally cleared swaps, the current day’s variation margin is reported on the Consolidated Statement of Assets and Liabilities. All other assets and liabilities are reported at their market value at measurement date.
For the year ended September 30, 2020, the Fund had no material transfers into/out of Level 3.
5. TRANSACTIONS WITH AFFILIATES
Management fee
Funds Management, an indirect wholly owned subsidiary of Wells Fargo & Company (“Wells Fargo”), is the manager of the Fund and provides advisory and fund-level administrative services under an investment management agreement. Under the investment management agreement, Funds Management is responsible for, among other services, implementing the investment objectives and strategies of the Fund, supervising the subadviser and providing fund-level administrative services in connection with the Fund’s operations. As compensation for its services under the investment management agreement, Funds Management is entitled to receive a management fee at the following annual rate based on the Fund’s average daily net assets:
| Average daily net assets | Management fee | |||
First $500 million | 0.525 | % | ||
Next $500 million | 0.500 | |||
Next $2 billion | 0.475 | |||
Next $2 billion | 0.450 | |||
Next $5 billion | 0.415 | |||
Over $10 billion | 0.405 | |||
For the year ended September 30, 2020, the management fee was equivalent to an annual rate of 0.525% of the Fund’s average daily net assets.
Funds Management has retained the services of a subadviser to provide daily portfolio management to the Fund. The fee for subadvisory services is borne by Funds Management. Wells Capital Management Incorporated (“WellsCap”) is the subadviser to the Fund and is entitled to receive a fee from Funds Management at an annual rate starting at 0.30% and declining to 0.15% as the average daily net assets of the Fund increase. Prior to August 3, 2020 Wells Fargo Asset Management (International), Limited, an affiliate of Funds Management and an indirect wholly owned subsidiary of Wells Fargo, also served as a subadviser to the Fund and was entitled to receive a fee from Funds Management at an annual rate which started at 0.35% and declined to 0.20% as the average daily net assets of the Fund increased.
Administration fees
Under a class-level administration agreement, Funds Management provides class-level administrative services to the Fund, which includes paying fees and expenses for services provided by the transfer agent, sub-transfer agents, omnibus account servicers and record-keepers. As compensation for its services under the class-level administration agreement, Funds Management receives an annual fee which is calculated based on the average daily net assets of each class as follows:
| Class-level administration fee | ||||
Class A, Class C | 0.16 | % | ||
Administrator Class | 0.10 | |||
Institutional Class | 0.08 | |||
Waivers and/or expense reimbursements
Funds Management has contractually waived and/or reimbursed management and administration fees to the extent necessary to maintain certain net operating expense ratios for the Fund. When each class of the Fund has exceeded its expense cap, Funds Management has waived fees and/or reimbursed expenses from fund-level expenses on a proportionate basis and then from class specific expenses. When only certain classes exceed their expense caps, waivers and/or reimbursements are applied against class specific expenses before fund-level expenses. Funds Management has committed through January 31, 2021 to waive fees and/or reimburse expenses to the extent necessary to cap the Fund’s expenses at 0.90% for Class A shares, 1.65% for
Wells Fargo Income Plus Fund | 41
Table of Contents
Consolidated notes to financial statements
Class C shares, 0.75% for Administrator Class shares, and 0.60% for Institutional Class shares. Prior to or after the commitment expiration date, the cap may be increased or the commitment to maintain the cap may be terminated only with the approval of the Board of Trustees.
Distribution fee
The Trust has adopted a distribution plan for Class C shares of the Fund pursuant to Rule 12b-1 under the 1940 Act. A distribution fee is charged to Class C shares and paid to Wells Fargo Funds Distributor, LLC (“Funds Distributor”), the principal underwriter, at an annual rate of 0.75% of the average daily net assets of Class C shares.
In addition, Funds Distributor is entitled to receive the front-end sales charge from the purchase of Class A shares and a contingent deferred sales charge on the redemption of certain Class A shares. Funds Distributor is also entitled to receive the contingent deferred sales charges from redemptions of Class C shares. For the year ended September 30, 2020, Funds Distributor received $17 from the sale of Class A shares. No contingent deferred sales charges were incurred by Class A and Class C shares for the year ended September 30, 2020.
Shareholder servicing fees
The Trust has entered into contracts with one or more shareholder servicing agents, whereby Class A, Class C, and Administrator Class of the Fund are charged a fee at an annual rate of 0.25% of the average daily net assets of each respective class. A portion of these total shareholder servicing fees were paid to affiliates of Wells Fargo.
Interfund transactions
The Fund may purchase or sell portfolio investment securities to certain other Wells Fargo affiliates pursuant to Rule 17a-7 under the 1940 Act and under procedures adopted by the Board of Trustees. The procedures have been designed to ensure that these interfund transactions, which do not incur broker commissions, are effected at current market prices.
Other transactions
On August 14, 2020, Class C of the Fund was reimbursed by Funds Management in the amount of $4,844. The reimbursement was made in connection with resolving certain fee reimbursements.
6. INVESTMENT PORTFOLIO TRANSACTIONS
Purchases and sales of investments, excluding short-term securities, for the year ended September 30, 2020 were as follows:
Purchases at cost | Sales proceeds | |||||
| U.S. government | Non-U.S. government | U.S. government | Non-U.S. government | |||
| $15,814,463 | $108,544,235 | $11,363,918 | $111,322,498 | |||
As of September 30, 2020, the Fund had no unfunded term loan commitments.
7. SECURITIES LENDING TRANSACTIONS
The Fund lends its securities through an unaffiliated securities lending agent and receives collateral in the form of cash or securities with a value at least equal to the value of the securities on loan. The value of the loaned securities is determined at the close of each business day and any increases or decreases in the required collateral are exchanged between the Fund and the counterparty on the next business day. Cash collateral received is invested in the Securities Lending Fund which seeks to provide a positive return compared to the daily Federal Funds Open Rate by investing in high-quality, U.S. dollar-denominated short-term money market instruments and is exempt from registration under Section 3(c)(7) of the 1940 Act. Securities Lending Fund is managed by Funds Management and is subadvised by WellsCap. Funds Management receives an advisory fee starting at 0.05% and declining to 0.01% as the average daily net assets of the Securities Lending Fund increase. All of the fees received by Funds Management are paid to WellsCap for its services as subadviser.
In the event of counterparty default or the failure of a borrower to return a loaned security, the Fund has the right to use the collateral to offset any losses incurred. As of September 30, 2020, the Fund had securities lending transactions with the following counterparties which are subject to offset:
| Counterparty | Value of securities on loan | Collateral received1 | Net amount | |||||
Barclays Capital Inc. | $4,636,840 | $(4,636,840) | $ | 0 | ||||
| 1 | Collateral received within this table is limited to the collateral for the net transaction with the counterparty. |
42 | Wells Fargo Income Plus Fund
Table of Contents
Consolidated notes to financial statements
8. DERIVATIVE TRANSACTIONS
During the year ended September 30, 2020, the Fund entered into futures contracts and forward foreign currency contracts for economic hedging purposes and credit default swap contracts as a substitute for taking a position in the underlying security or index to potentially enhance the Fund’s total return.
The volume of the Fund’s derivative activity during the year ended September 30, 2020 was as follows:
Futures contracts | ||||
Average notional balance on long futures | $ | 23,504,228 | ||
Average notional balance on short futures | 53,888,235 | |||
Forward foreign currency contracts | ||||
Average contract amounts to buy | $ | 9,690,440 | ||
Average contract amounts to sell | 28,709,822 | |||
Credit default swap contracts | ||||
Average notional balance | $ | 17,688,926 | ||
The Subsidiary’s credit default swap agreement contains provisions for early termination in the event the net assets of the Subsidiary declines below specific levels identified by the counterparty. If these levels are triggered, the counterparty may terminate the transaction and seek payment or request full collateralization of the derivative transactions in net liability positions.
A summary of the location of derivative instruments on the consolidated financial statements by primary risk exposure is outlined in the following tables.
The fair value of derivative instruments as of September 30, 2020 by primary risk type was as follows for the Fund:
Asset derivatives | Liability derivatives | |||||||||||
| Consolidated Statement of Assets and Liabilities location | Fair value | Consolidated Statement of Assets and Liabilities location | Fair value | |||||||||
Interest rate risk | Unrealized gains on futures contracts | $ | 15,923 | * | Unrealized losses on futures contracts | $ | 155,142 | * | ||||
Foreign currency risk | Unrealized gains on forward foreign currency contracts | 327,801 | Unrealized gains on forward foreign currency contracts | 68,877 | ||||||||
Credit risk | Net unrealized gains on swap contracts | 845,607 | * | Net unrealized losses on swap contracts | 0 | * | ||||||
| $ | 1,189,331 | $ | 224,019 | |||||||||
| * | Amount represents cumulative unrealized gains (losses) as reported in the tables following the Consolidated Portfolio of Investments. Only the current day’s variation margin as of September 30, 2020 is reported separately on the Consolidated Statement of Assets and Liabilities. |
The effect of derivative instruments on the Consolidated Statement of Operations for the year ended September 30, 2020 was as follows for the Fund:
| Amount of realized gains on derivatives | ||||||||||||||||
| Futures contracts | Forward foreign currency contracts | Swap contracts | Total | |||||||||||||
Interest rate risk | $ | 1,293,079 | $ | 0 | $ | 0 | $ | 1,293,079 | ||||||||
Foreign currency risk | 0 | 637,536 | 0 | 637,536 | ||||||||||||
Credit risk | 0 | 0 | (552,003 | ) | (552,003 | ) | ||||||||||
| $ | 1,293,079 | $ | 637,536 | $ | (552,003 | ) | $ | 1,378,612 | ||||||||
| Change in unrealized gains (losses) on derivatives | ||||||||||||||||
| Futures contracts | Forward foreign currency contracts | Swap contracts | Total | |||||||||||||
Interest rate risk | $ | (683,605 | ) | $ | 0 | $ | 0 | $ | (683,605 | ) | ||||||
Foreign currency risk | 0 | (18,859 | ) | 0 | (18,859 | ) | ||||||||||
Credit risk | 0 | 0 | 773,452 | 773,452 | ||||||||||||
| $ | (683,605 | ) | $ | (18,859 | ) | $ | 773,452 | $ | 70,988 | |||||||
Wells Fargo Income Plus Fund | 43
Table of Contents
Consolidated notes to financial statements
For certain types of derivative transactions, the Fund has entered into International Swaps and Derivatives Association, Inc. master agreements (“ISDA Master Agreements”) or similar agreements with approved counterparties. The ISDA Master Agreements or similar agreements may have requirements to deliver/deposit securities or cash to/with an exchange or broker-dealer as collateral and allows the Fund to offset, with each counterparty, certain derivative financial instrument’s assets and/or liabilities with collateral held or pledged. Collateral requirements differ by type of derivative. Collateral or margin requirements are set by the broker or exchange clearinghouse for exchange traded derivatives while collateral terms are contract specific for over-the-counter traded derivatives. Cash collateral that has been pledged to cover obligations of the Fund under ISDA Master Agreements or similar agreements, if any, are reported separately in the Consolidated Statement of Assets and Liabilities. Securities pledged as collateral, if any, are noted in the Consolidated Portfolio of Investments. With respect to balance sheet offsetting, absent an event of default by the counterparty or a termination of the agreement, the reported amounts of financial assets and financial liabilities in the Consolidated Statement of Assets and Liabilities are not offset across transactions between the Fund and the applicable counterparty. A reconciliation of the gross amounts on the Consolidated Statement of Assets and Liabilities to the net amounts by counterparty, including any collateral exposure, for OTC derivatives is as follows:
| Counterparty | Gross amounts of assets in the Consolidated Statement of Assets and Liabilities | Amounts subject to netting agreements | Collateral received | Net amount of assets | ||||||||||||
Morgan Stanley | $ | 117,941 | $ | (35,325 | ) | $ | 0 | $ | 82,616 | |||||||
State Street | 15,913 | 0 | (88 | ) | 15,825 | |||||||||||
Citibank | 193,947 | (33,552 | ) | (160,395 | ) | 0 | ||||||||||
| Counterparty | Gross amounts of liabilities in the Consolidated Statement of Assets and Liabilities | Amounts subject to netting agreements | Collateral pledged | Net amount of liabilities | ||||||||||||
Morgan Stanley | $ | 35,325 | $ | (35,325 | ) | $ | 0 | $ | 0 | |||||||
Citibank | 33,552 | (33,552 | ) | 0 | 0 | |||||||||||
9. BANK BORROWINGS
The Trust (excluding the money market funds), Wells Fargo Master Trust and Wells Fargo Variable Trust are parties to a $350,000,000 revolving credit agreement whereby the Fund is permitted to use bank borrowings for temporary or emergency purposes, such as to fund shareholder redemption requests. Interest under the credit agreement is charged to the Fund based on a borrowing rate equal to the higher of the Federal Funds rate in effect on that day plus 1.25% or the overnight LIBOR rate in effect on that day plus 1.25%. In addition, an annual commitment fee equal to 0.25% of the unused balance is allocated to each participating fund.
For the year ended September 30, 2020, there were no borrowings by the Fund under the agreement.
10. DISTRIBUTIONS TO SHAREHOLDERS
The tax character of distributions paid was $5,071,328 and $5,951,587 of ordinary income for the years ended September 30, 2020 and September 30, 2019, respectively.
As of September 30, 2020, the components of distributable earnings on a tax basis were as follows:
| Undistributed ordinary income | Unrealized gains | Capital loss carryforward | ||
| $154,391 | $3,693,003 | $(584,258) | ||
44 | Wells Fargo Income Plus Fund
Table of Contents
Consolidated notes to financial statements
11. INDEMNIFICATION
Under the Fund’s organizational documents, the officers and Trustees have been granted certain indemnification rights against certain liabilities that may arise out of performance of their duties to the Fund. The Fund has entered into a separate agreement with each Trustee that converts indemnification rights currently existing under the Fund’s organizational documents into contractual rights that cannot be changed in the future without the consent of the Trustee. Additionally, in the normal course of business, the Fund may enter into contracts with service providers that contain a variety of indemnification clauses. The Fund’s maximum exposure under these arrangements is dependent on future claims that may be made against the Fund and, therefore, cannot be estimated.
12. NEW ACCOUNTING PRONOUNCEMENT
In August 2018, FASB issued Accounting Standards Update (“ASU”) No. 2018-13, Fair Value Measurement (Topic 820) Disclosure Framework—Changes to the Disclosure Requirements for Fair Value Measurement. ASU 2018-13 updates the disclosure requirements on fair value measurements in Topic 820, Fair Value Measurements. The amendments are effective for fiscal years, and interim periods within those fiscal years, beginning after December 15, 2019. Management has adopted this guidance which did not have a material impact on the consolidated financial statements.
13. CORONAVIRUS (COVID-19) PANDEMIC
On March 11, 2020, the World Health Organization announced that it had made the assessment that coronavirus disease 2019 (“COVID-19”) is a pandemic. The impacts of COVID-19 are adversely affecting the entire global economy, individual companies and investment products, and the market in general. There is significant uncertainty around the extent and duration of business disruptions related to COVID-19 and the impacts may be short term or may last for an extended period of time. The risk of further spreading of COVID-19 has led to significant uncertainty and volatility in the financial markets.
Wells Fargo Income Plus Fund | 45
Table of Contents
Report of independent registered public accounting firm
To the Shareholders of the Fund and Board of Trustees
Wells Fargo Funds Trust:
Opinion on the Consolidated Financial Statements
We have audited the accompanying consolidated statement of assets and liabilities of Wells Fargo Income Plus Fund (formerly, Wells Fargo Strategic Income Fund) and subsidiary (the Fund), one of the funds constituting Wells Fargo Funds Trust, including the consolidated portfolio of investments, as of September 30, 2020, the related consolidated statement of operations for the year then ended, the consolidated statements of changes in net assets for each of the years in the two-year period then ended, and the related notes (collectively, the consolidated financial statements) and the consolidated financial highlights for each of the years in the four-year period then ended, for the period ended September 30, 2016, and for the year ended October 31, 2015. In our opinion, the consolidated financial statements and consolidated financial highlights present fairly, in all material respects, the financial position of the Fund as of September 30, 2020, the results of its operations for the year then ended, the changes in its net assets for each of the years in the two-year period then ended, and the financial highlights for each of the years in the four-year period then ended, for the period ended September 30, 2016, and for the year ended October 31, 2015, in conformity with U.S. generally accepted accounting principles.
Basis for Opinion
These consolidated financial statements and consolidated financial highlights are the responsibility of the Fund’s management. Our responsibility is to express an opinion on these consolidated financial statements and consolidated financial highlights based on our audits. We are a public accounting firm registered with the Public Company Accounting Oversight Board (United States) (PCAOB) and are required to be independent with respect to the Fund in accordance with the U.S. federal securities laws and the applicable rules and regulations of the Securities and Exchange Commission and the PCAOB.
We conducted our audits in accordance with the standards of the PCAOB. Those standards require that we plan and perform the audit to obtain reasonable assurance about whether the consolidated financial statements and consolidated financial highlights are free of material misstatement, whether due to error or fraud. Our audits included performing procedures to assess the risks of material misstatement of the consolidated financial statements and consolidated financial highlights, whether due to error or fraud, and performing procedures that respond to those risks. Such procedures included examining, on a test basis, evidence regarding the amounts and disclosures in the consolidated financial statements and consolidated financial highlights. Such procedures also included confirmation of securities owned as of September 30, 2020, by correspondence with the custodian, transfer agent and brokers, or by other appropriate auditing procedures. Our audits also included evaluating the accounting principles used and significant estimates made by management, as well as evaluating the overall presentation of the consolidated financial statements and consolidated financial highlights. We believe that our audits provide a reasonable basis for our opinion.

We have not been able to determine the specific year that we began serving as the auditor of one or more Wells Fargo Funds investment companies; however we are aware that we have served as the auditor of one or more Wells Fargo Funds investment companies since at least 1955.
Boston, Massachusetts
November 24, 2020
46 | Wells Fargo Income Plus Fund
Table of Contents
TAX INFORMATION
For the fiscal year ended September 30, 2020, $3,188,842 has been designated as interest-related dividends for nonresident alien shareholders pursuant to Section 871 of the Internal Revenue Code.
PROXY VOTING INFORMATION
A description of the policies and procedures used to determine how to vote proxies relating to portfolio securities is available, upon request, by calling 1-800-222-8222, visiting our website at wfam.com, or visiting the SEC website at sec.gov. Information regarding how the proxies related to portfolio securities were voted during the most recent 12-month period ended June 30 is available on the website at wfam.com or by visiting the SEC website at sec.gov.
QUARTERLY PORTFOLIO HOLDINGS INFORMATION
The Fund files its complete schedule of portfolio holdings with the SEC for the first and third quarters of each fiscal year as an exhibit to its reports on Form N-PORT. Shareholders may view the filed Form N-PORT by visiting the SEC website at sec.gov.
Wells Fargo Income Plus Fund | 47
Table of Contents
Other information (unaudited)
BOARD OF TRUSTEES AND OFFICERS
Each of the Trustees and Officers1 listed in the table below acts in identical capacities for each fund in the Wells Fargo family of funds, which consists of 142 mutual funds comprising the Wells Fargo Funds Trust, Wells Fargo Variable Trust, Wells Fargo Master Trust and four closed-end funds (collectively the “Fund Complex”). This table should be read in conjunction with the Prospectus and the Statement of Additional Information2. The mailing address of each Trustee and Officer is 525 Market Street, 12th Floor, San Francisco, CA 94105. Each Trustee and Officer serves an indefinite term, however, each Trustee serves such term until reaching the mandatory retirement age established by the Trustees.
Independent Trustees
| Name and year of birth | Position held and length of service* | Principal occupations during past five years or longer | Current other public company or investment company directorships | |||
| William R. Ebsworth (Born 1957) | Trustee, since 2015 | Retired. From 1984 to 2013, equities analyst, portfolio manager, research director and chief investment officer at Fidelity Management and Research Company in Boston, Tokyo, and Hong Kong, and retired in 2013 as Chief Investment Officer of Fidelity Strategic Advisers, Inc. where he led a team of investment professionals managing client assets. Prior thereto, Board member of Hong Kong Securities Clearing Co., Hong Kong Options Clearing Corp., the Thailand International Fund, Ltd., Fidelity Investments Life Insurance Company, and Empire Fidelity Investments Life Insurance Company. Audit Committee Chair and Investment Committee Chair of the Vincent Memorial Hospital Endowment (non-profit organization). Mr. Ebsworth is a CFA® charterholder. | N/A | |||
| Jane A. Freeman (Born 1953) | Trustee, since 2015; Chair Liaison, since 2018 | Retired. From 2012 to 2014 and 1999 to 2008, Chief Financial Officer of Scientific Learning Corporation. From 2008 to 2012, Ms. Freeman provided consulting services related to strategic business projects. Prior to 1999, Portfolio Manager at Rockefeller & Co. and Scudder, Stevens & Clark. Board member of the Harding Loevner Funds from 1996 to 2014, serving as both Lead Independent Director and chair of the Audit Committee. Board member of the Russell Exchange Traded Funds Trust from 2011 to 2012 and the chair of the Audit Committee. Ms. Freeman is also an inactive Chartered Financial Analyst. | N/A | |||
| Isaiah Harris, Jr. (Born 1952) | Trustee, since 2009; Audit Committee Chairman, since 2019 | Retired. Chairman of the Board of CIGNA Corporation since 2009, and Director since 2005. From 2003 to 2011, Director of Deluxe Corporation. Prior thereto, President and CEO of BellSouth Advertising and Publishing Corp. from 2005 to 2007, President and CEO of BellSouth Enterprises from 2004 to 2005 and President of BellSouth Consumer Services from 2000 to 2003. Emeritus member of the Iowa State University Foundation Board of Governors. Emeritus Member of the Advisory Board of Iowa State University School of Business. Advisory Board Member, Palm Harbor Academy (private school). Mr. Harris is a certified public accountant (inactive status). | CIGNA Corporation | |||
| Judith M. Johnson (Born 1949) | Trustee, since 2008 | Retired. Prior thereto, Chief Executive Officer and Chief Investment Officer of Minneapolis Employees Retirement Fund from 1996 to 2008. Ms. Johnson is an attorney, certified public accountant and a certified managerial accountant. | N/A | |||
| David F. Larcker (Born 1950) | Trustee, since 2009 | James Irvin Miller Professor of Accounting at the Graduate School of Business (Emeritus), Stanford University, Director of the Corporate Governance Research Initiative and Senior Faculty of The Rock Center for Corporate Governance since 2006. From 2005 to 2008, Professor of Accounting at the Graduate School of Business, Stanford University. Prior thereto, Ernst & Young Professor of Accounting at The Wharton School, University of Pennsylvania from 1985 to 2005. | N/A | |||
48 | Wells Fargo Income Plus Fund
Table of Contents
Other information (unaudited)
| Name and year of birth | Position held and length of service* | Principal occupations during past five years or longer | Current other public company or investment company directorships | |||
| Olivia S. Mitchell (Born 1953) | Trustee, since 2006; Nominating and Governance Committee Chair, since 2018 | International Foundation of Employee Benefit Plans Professor, Wharton School of the University of Pennsylvania since 1993. Director of Wharton’s Pension Research Council and Boettner Center on Pensions & Retirement Research, and Research Associate at the National Bureau of Economic Research. Previously, Cornell University Professor from 1978 to 1993. | N/A | |||
| Timothy J. Penny (Born 1951) | Trustee, since 1996; Chairman, since 2018 | President and Chief Executive Officer of Southern Minnesota Initiative Foundation, a non-profit organization, since 2007. Member of the Board of Trustees of NorthStar Education Finance, Inc., a non-profit organization, since 2007. | N/A | |||
| James G. Polisson (Born 1959) | Trustee, since 2018 | Retired. Chief Marketing Officer, Source (ETF) UK Services, Ltd, from 2015 to 2017. From 2012 to 2015, Principal of The Polisson Group, LLC, a management consulting, corporate advisory and principal investing company. Chief Executive Officer and Managing Director at Russell Investments, Global Exchange Traded Funds from 2010 to 2012. Managing Director of Barclays Global Investors from 1998 to 2010 and Global Chief Marketing Officer for iShares and Barclays Global Investors from 2000 to 2010. Trustee of the San Francisco Mechanics’ Institute, a non-profit organization, from 2013 to 2015. Board member of the Russell Exchange Traded Fund Trust from 2011 to 2012. Director of Barclays Global Investors Holdings Deutschland GmbH from 2006 to 2009. Mr. Polisson is an attorney and has a retired status with the Massachusetts and District of Columbia Bar Associations. | N/A | |||
| Pamela Wheelock (Born 1959) | Trustee, since January 2020; previously Trustee from January 2018 to July 2019 | Board member of the Destination Medical Center Economic Development Agency, Rochester, Minnesota since 2019. Interim President of the McKnight Foundation from January to September 2020. Acting Commissioner, Minnesota Department of Human Services, July 2019 through September 2019. Human Services Manager (part-time), Minnesota Department of Human Services, October 2019 through December 2019. Chief Operating Officer, Twin Cities Habitat for Humanity from 2017 to 2019. Vice President of University Services, University of Minnesota from 2012 to 2016. Prior thereto, on the Board of Directors, Governance Committee and Finance Committee for the Minnesota Philanthropy Partners (Saint Paul Foundation) from 2012 to 2018, Interim Chief Executive Officer of Blue Cross Blue Shield of Minnesota from 2011 to 2012, Chairman of the Board from 2009 to 2012 and Board Director from 2003 to 2015. Vice President, Leadership and Community Engagement, Bush Foundation, Saint Paul, Minnesota (a private foundation) from 2009 to 2011. Executive Vice President and Chief Financial Officer, Minnesota Sports and Entertainment from 2004 to 2009 and Senior Vice President from 2002 to 2004. Executive Vice President of the Minnesota Wild Foundation from 2004 to 2008. Commissioner of Finance, State of Minnesota, from 1999 to 2002. Currently Board Chair of the Minnesota Wild Foundation since 2010. | N/A | |||
| * | Length of service dates reflect the Trustee’s commencement of service with the Trust’s predecessor entities, where applicable. |
Wells Fargo Income Plus Fund | 49
Table of Contents
Other information (unaudited)
Officers
| Name and year of birth | Position held and length of service | Principal occupations during past five years or longer | ||
| Andrew Owen (Born 1960) | President, since 2017 | Executive Vice President of Wells Fargo & Company and Head of Affiliated Managers, Wells Fargo Asset Management, since 2014. In addition, Mr. Owen is currently President, Chief Executive Officer and Director of Wells Fargo Funds Management, LLC since 2017. Prior thereto, Executive Vice President responsible for marketing, investments and product development for Wells Fargo Funds Management, LLC, from 2009 to 2014. | ||
| Nancy Wiser1 (Born 1967) | Treasurer, since 2012 | Executive Vice President of Wells Fargo Funds Management, LLC since 2011. Chief Operating Officer and Chief Compliance Officer at LightBox Capital Management LLC, from 2008 to 2011. | ||
| Michelle Rhee (Born 1966) | Chief Legal Officer, since 2019 | Secretary of Wells Fargo Funds Management, LLC, Chief Legal Counsel of Wells Fargo Asset Management and Assistant General Counsel of Wells Fargo Bank, N.A. since 2018. Associate General Counsel and Managing Director of Bank of America Corporation from 2004 to 2018. | ||
| Catherine Kennedy (Born 1969) | Secretary, since 2019 | Vice President of Wells Fargo Funds Management, LLC and Senior Counsel of the Wells Fargo Legal Department since 2010. Vice President and Senior Counsel of Evergreen Investment Management Company, LLC from 1998 to 2010. | ||
| Michael H. Whitaker (Born 1967) | Chief Compliance Officer, since 2016 | Chief Compliance Officer of Wells Fargo Asset Management since 2016. Senior Vice President and Chief Compliance Officer for Fidelity Investments from 2007 to 2016. | ||
| Jeremy DePalma1 (Born 1974) | Assistant Treasurer, since 2009 | Senior Vice President of Wells Fargo Funds Management, LLC since 2009. Senior Vice President of Evergreen Investment Management Company, LLC from 2008 to 2010 and head of the Fund Reporting and Control Team within Fund Administration from 2005 to 2010. | ||
| 1 | Nancy Wiser acts as Treasurer of 65 funds in the Fund Complex. Jeremy DePalma acts as the Treasurer of 77 funds and Assistant Treasurer of 65 funds in the Fund Complex. |
| 2 | The Statement of Additional Information includes additional information about the Trustees and is available, without charge, upon request, by calling 1-800-222-8222 or by visiting the website at wfam.com. |
50 | Wells Fargo Income Plus Fund
Table of Contents
Other information (unaudited)
BOARD CONSIDERATION OF INVESTMENT MANAGEMENT AND SUB-ADVISORY AGREEMENTS:
Wells Fargo Income Plus Fund
(formerly, Wells Fargo Strategic Income Fund)
Under the Investment Company Act of 1940 (the “1940 Act”), the Board of Trustees (the “Board”) of Wells Fargo Funds Trust (the “Trust”) must determine annually whether to approve the continuation of the Trust’s investment management and sub-advisory agreements. In this regard, at a Board meeting held on May 26, 2020 and May 28, 2020 (together, the “Meeting”), the Board, all the members of which have no direct or indirect interest in the investment management and sub-advisory agreements and are not “interested persons” of the Trust, as defined in the 1940 Act (the “Independent Trustees”), reviewed and approved for Wells Fargo Income Plus Fund (formerly, Wells Fargo Strategic Income Fund, the “Fund”): (i) an investment management agreement (the “Management Agreement”) with Wells Fargo Funds Management, LLC (“Funds Management”); and (ii) investment sub-advisory agreements (the “Sub-Advisory Agreements”) with each of Wells Capital Management Incorporated and Wells Fargo Asset Management (International) Limited (collectively, the “Sub-Advisers”), both affiliates of Funds Management. The Management Agreement and the Sub-Advisory Agreements are collectively referred to as the “Advisory Agreements.”
At the Meeting, the Board considered the factors and reached the conclusions described below relating to the selection of Funds Management and the Sub-Advisers and the approval of the Advisory Agreements. Prior to the Meeting, including at a Board meeting held in April 2020, the Trustees conferred extensively among themselves and with representatives of Funds Management about these matters. Also, the Board has adopted a team-based approach, with each team consisting of a sub-set of Trustees, to assist the full Board in the discharge of its duties in reviewing investment performance and other matters throughout the year. The Independent Trustees were assisted in their evaluation of the Advisory Agreements by independent legal counsel, from whom they received separate legal advice and with whom they met separately.
In providing information to the Board, Funds Management and the Sub-Advisers were guided by a detailed set of requests for information submitted to them by independent legal counsel on behalf of the Independent Trustees at the start of the Board’s annual contract renewal process earlier in 2020. In considering and approving the Advisory Agreements, the Trustees considered the information they believed relevant, including but not limited to the information discussed below. The Board considered not only the specific information presented in connection with the Meeting, but also the knowledge gained over time through interaction with Funds Management and the Sub-Advisers about various topics. In this regard, the Board reviewed reports of Funds Management at each of its quarterly meetings, which included, among other things, portfolio reviews and investment performance reports. In addition, the Board and the teams mentioned above confer with portfolio managers at various times throughout the year. The Board did not identify any particular information or consideration that was all-important or controlling, and each individual Trustee may have attributed different weights to various factors.
After its deliberations, the Board unanimously approved the continuation of the Advisory Agreements for a one-year term and determined that the compensation payable to Funds Management and the Sub-Advisers under each of the Advisory Agreements was reasonable. The Board considered the approval of the Advisory Agreements for the Fund as part of its consideration of agreements for funds across the complex, but its approvals were made on a fund-by-fund basis. The following summarizes a number of important, but not necessarily all, factors considered by the Board in support of its approvals.
Nature, extent and quality of services
The Board received and considered various information regarding the nature, extent and quality of services provided to the Fund by Funds Management and the Sub-Advisers under the Advisory Agreements. This information included a description of the investment advisory services and Fund-level administrative services covered by the Management Agreement, as well as, among other things, a summary of the background and experience of senior management of Wells Fargo Asset Management (“WFAM”), of which Funds Management and the Sub-Advisers are a part, and a summary of investments made in the business of WFAM. The Board also received a description of Funds Management’s and the Sub-Advisers’ business continuity plans and of their approaches to data privacy and cybersecurity, and related testing. The Board also received and reviewed information about Funds Management’s role as administrator of the Fund’s liquidity risk management program, Funds Management’s approach to risk management, and Funds Management’s intermediary and vendor oversight program.
The Board also considered the qualifications, background, tenure and responsibilities of each of the portfolio managers primarily responsible for the day-to-day portfolio management of the Fund. The Board evaluated the ability of Funds Management and the Sub-Advisers to attract and retain qualified investment professionals, including research, advisory and supervisory personnel. The Board further considered the compliance programs and compliance records of Funds Management and the Sub-Advisers. In addition, the Board took into account the full range of services provided to the Fund by Funds Management and its affiliates.
Wells Fargo Income Plus Fund | 51
Table of Contents
Other information (unaudited)
Fund investment performance and expenses
The Board considered the investment performance results for the Fund over various time periods ended December 31, 2019. The Board also considered more current results for various time periods ended March 31, 2020. The Board considered these results in comparison to the investment performance of funds in a universe that was determined by Broadridge Inc. (“Broadridge”) to be similar to the Fund (the “Universe”), and in comparison to the Fund’s benchmark index and to other comparative data. Broadridge is an independent provider of investment company data. The Board received a description of the methodology used by Broadridge to select the mutual funds in the performance Universe. The Board noted that the investment performance of the Fund (Administrator Class) was lower than the average investment performance of the Universe for the one- and five-year periods ended December 31, 2019, and in range of the average investment performance of the Universe for the three-year period ended December 31, 2019. The Board also noted that the investment performance of the Fund (Administrator Class) was higher than the average investment performance of the Universe for the three-year period ended March 31, 2020, and lower than the average investment performance of the Universe for the one- and five-year periods ended March 31, 2020. The Board also noted that the investment performance of the Fund was higher than its benchmark index, the Bloomberg Barclays U.S. Universal Bond Index, for the three-year period ended December 31, 2019, and lower than its benchmark for the one- and five-year periods ended December 31, 2019. The Board also noted that the investment performance of the Fund was lower than its benchmark index, the Bloomberg Barclays U.S. Universal Bond Index, for all periods ended March 31, 2020.
The Board received information concerning, and discussed factors contributing to, the underperformance of the Fund relative to the Universe and benchmark index for the periods identified above. The Board took note of the explanations for the relative underperformance during these periods, including with respect to investment decisions and market factors that affected the Fund’s investment performance.
The Board also received and considered information regarding the Fund’s net operating expense ratios and their various components, including actual management fees, custodian and other non-management fees, and Rule 12b-1 and non-Rule 12b-1 shareholder service fees. The Board considered these ratios in comparison to the median ratios of funds in class-specific expense groups that were determined by Broadridge to be similar to the Fund (the “Groups”). The Board received a description of the methodology used by Broadridge to select the mutual funds in the expense Groups and an explanation of how funds comprising expense groups and their expense ratios may vary from year-to-year. Based on the Broadridge reports, the Board noted that the net operating expense ratios of the Fund were lower than the median net operating expense ratios of the expense Groups for each share class.
The Board took into account the Fund’s investment performance and expense information provided to it among the factors considered in deciding to re-approve the Advisory Agreements.
Investment management and sub-advisory fee rates
The Board reviewed and considered the contractual fee rates payable by the Fund to Funds Management under the Management Agreement, as well as the contractual fee rates payable by the Fund to Funds Management for class-level administrative services under a Class-Level Administration Agreement, which include, among other things, class-level transfer agency and sub-transfer agency costs (collectively, the “Management Rates”). The Board also reviewed and considered the contractual investment sub-advisory fee rates that are payable by Funds Management to the Sub-Advisers for investment sub-advisory services.
Among other information reviewed by the Board was a comparison of the Fund’s Management Rates with the average contractual investment management fee rates of funds in the expense Groups at a common asset level as well as transfer agency costs of the funds in the expense Groups. The Board noted that the Management Rates of the Fund were lower than or in range of the sum of these average rates for the Fund’s expense Groups for all share classes.
The Board also received and considered information about the portion of the total management fee that was retained by Funds Management after the payment of fees to the Sub-Advisers for sub-advisory services. In assessing the reasonableness of this amount, the Board received and evaluated information about the nature and extent of responsibilities retained and risks assumed by Funds Management and not delegated to or assumed by the Sub-Advisers, and about Funds Management’s on-going oversight services. Given the affiliation between Funds Management and the Sub-Advisers, the Board ascribed limited relevance to the allocation of fees between them.
The Board also received and considered information about the nature and extent of services offered and fee rates charged by Funds Management and the Sub-Advisers to other types of clients with investment strategies similar to those of the Fund. In this regard, the Board received information about the significantly greater scope of services, and compliance, reporting and other legal burdens and risks of managing proprietary mutual funds compared with those associated with managing assets of other types of clients, including third-party sub-advised fund clients and non-mutual fund clients such as institutional separate accounts.
52 | Wells Fargo Income Plus Fund
Table of Contents
Other information (unaudited)
Based on its consideration of the factors and information it deemed relevant, including those described here, the Board determined that the compensation payable to Funds Management under the Management Agreement and to the Sub-Advisers under the Sub-Advisory Agreements was reasonable.
Profitability
The Board received and considered information concerning the profitability of Funds Management, as well as the profitability of both WFAM and Wells Fargo & Co. (“Wells Fargo”) from providing services to the fund family as a whole. The Board noted that the Sub-Advisers’ profitability information with respect to providing services to the Fund and other funds in the family was subsumed in the WFAM and Wells Fargo profitability analysis.
Funds Management reported on the methodologies and estimates used in calculating profitability, including a description of the methodology used to allocate certain expenses. Among other things, the Board noted that the levels of profitability reported on a fund-by-fund basis varied widely, depending on factors such as the size, type and age of fund.
Based on its review, the Board did not deem the profits reported by Funds Management, WFAM or Wells Fargo from services provided to the Fund to be at a level that would prevent it from approving the continuation of the Advisory Agreements.
Economies of scale
The Board received and considered information about the potential for Funds Management to experience economies of scale in the provision of management services to the Fund, the difficulties of calculating economies of scale at an individual fund level, and the extent to which potential scale benefits are shared with shareholders. The Board noted the existence of breakpoints in the Fund’s management fee structure, which operate generally to reduce the Fund’s expense ratios as the Fund grows in size, and the size of the Fund in relation to such breakpoints. The Board considered that in addition to management fee breakpoints, Funds Management shares potential economies of scale from its management business in a variety of ways, including through fee waiver and expense reimbursement arrangements, services that benefit shareholders, competitive management fee rates set at the outset without regard to breakpoints, and investments in the business intended to enhance services available to shareholders.
The Board concluded that Funds Management’s arrangements with respect to the Fund, including contractual breakpoints, constituted a reasonable approach to sharing potential economies of scale with the Fund and its shareholders.
Other benefits to Funds Management and the Sub-Advisers
The Board received and considered information regarding potential “fall-out” or ancillary benefits received by Funds Management and its affiliates, including the Sub-Advisers, as a result of their relationships with the Fund. Ancillary benefits could include, among others, benefits directly attributable to other relationships with the Fund and benefits potentially derived from an increase in Funds Management’s and the Sub-Advisers’ businesses as a result of their relationships with the Fund. The Board noted that various affiliates of Funds Management may receive distribution-related fees, shareholder servicing payments and sub-transfer agency fees in respect of shares sold or held through them and services provided.
The Board also reviewed information about soft dollar credits earned and utilized by the Sub-Advisers, fees earned by Funds Management and Wells Capital Management Incorporated from managing a private investment vehicle for the fund family’s securities lending collateral, and commissions earned by an affiliated broker from portfolio transactions.
Based on its consideration of the factors and information it deemed relevant, including those described here, the Board did not find that any ancillary benefits received by Funds Management and its affiliates, including the Sub-Advisers, were unreasonable.
Conclusion
At the Meeting, after considering the above-described factors and based on its deliberations and its evaluation of the information described above, the Board unanimously approved the continuation of the Advisory Agreements for a one-year term and determined that the compensation payable to Funds Management and the Sub-Advisers under each of the Advisory Agreements was reasonable.
Wells Fargo Income Plus Fund | 53
Table of Contents
Other information (unaudited)
LIQUIDITY RISK MANAGEMENT PROGRAM
In accordance with Rule 22e-4 under the Investment Company Act of 1940, as amended (the “Liquidity Rule”), Wells Fargo Funds Trust (the “Trust”) has adopted and implemented a liquidity risk management program (the “Program”) on behalf of each of its series, including the Fund, which is reasonably designed to assess and manage the Fund’s liquidity risk. “Liquidity risk” is defined as the risk that the Fund is unable to meet redemption requests without significantly diluting remaining investors’ interests in the Fund. The Trust’s Board of Trustees (the “Board”) previously approved the designation of Wells Fargo Funds Management, LLC (“Funds Management”), the Fund’s investment manager, as the administrator of the Program, and Funds Management has established a Liquidity Risk Management Council composed of personnel from multiple departments within Funds Management and its affiliates to assist Funds Management in the implementation and on-going administration of the Program.
The Program is comprised of various components designed to support the assessment and/or management of liquidity risk, including: (1) the periodic assessment (no less frequently than annually) of certain factors that influence the Fund’s liquidity risk; (2) the periodic classification (no less frequently than monthly) of the Fund’s investments into one of four liquidity categories that reflect an estimate of their liquidity under current market conditions; (3) a 15% limit on the acquisition of “illiquid investments” (as defined under the Liquidity Rule); (4) to the extent the Fund does not invest primarily in “highly liquid investments” (as defined under the Liquidity Rule), the determination of a minimum percentage of the Fund’s assets that generally will be invested in highly liquid investments (an “HLIM”); (5) if the Fund has established an HLIM, the periodic review (no less frequently than annually) of the HLIM and the adoption of policies and procedures for responding to a shortfall of the Fund’s “highly liquid investments” below its HLIM; and (6) periodic reporting to the Board.
At a meeting of the Board held on May 26 and 28, 2020, the Board received a written report (the “Report”) from Funds Management that addressed the operation of the Program and assessed its adequacy and effectiveness of implementation. The Report covered the initial period from December 1, 2018 through December 31, 2019 (the “Reporting Period”). No significant liquidity events impacting the Fund were noted in the Report. There were no material changes to the Program during the Reporting Period. The Report concluded that the Program is operating effectively to assess and manage the Fund’s liquidity risk, and that the Program has been and continues to be adequately and effectively implemented to monitor and, as applicable, respond to the Fund’s liquidity developments.
There can be no assurance that the Program will achieve its objectives under all circumstances in the future. Please refer to the Fund’s prospectus for more information regarding the Fund’s exposure to liquidity risk and other risks to which an investment in the Fund may be subject.
54 | Wells Fargo Income Plus Fund
Table of Contents
Effective June 1, 2020, shareholders purchasing Fund shares through an Oppenheimer & Co. Inc. (“Oppenheimer”) platform or account are eligible only for the following load waivers (front-end sales charge waivers and contingent deferred or back-end, sales charge waivers) and discounts, which may differ from those disclosed in the Fund’s Prospectus or SAI.
| Front-end Sales Load Waivers on Class A Shares available at Oppenheimer |
| Employer-sponsored retirement, deferred compensation and employee benefit plans (including health savings accounts) and trusts used to fund those plans, provided that the shares are not held in a commission-based brokerage account and shares are held for the benefit of the plan. |
| Shares purchased by or through a 529 Plan. |
| Shares purchased through an Oppenheimer affiliated investment advisory program. |
| Shares purchased through reinvestment of capital gains distributions and dividend reinvestment when purchasing shares of the same fund (but not any other fund within the fund family). |
| Shares purchased from the proceeds of redemptions within the same fund family, provided (1) the repurchase occurs within 90 days following the redemption, (2) the redemption and purchase occur in the same account, and (3) redeemed shares were subject to a front-end or deferred sales load (known as Rights of Restatement). |
| A shareholder in the Fund’s Class C shares will have their shares exchanged at net asset value to Class A shares (or the appropriate share class) of the Fund if the shares are no longer subject to a CDSC and the exchange is in line with the policies and procedures of Oppenheimer. |
| Employees and registered representatives of Oppenheimer or its affiliates and their family members. |
| Directors or Trustees of the Fund, and employees of the Fund’s investment adviser or any of its affiliates, as described in the Prospectus. |
| CDSC Waivers on A and C Shares available at Oppenheimer |
| Death or disability of the shareholder. |
| Shares sold as part of a systematic withdrawal plan as described in the Prospectus. |
| Return of excess contributions from an IRA Account. |
| Shares sold as part of a required minimum distribution for IRA and retirement accounts due to the shareholder reaching the qualified age based on applicable IRS regulations as described in the Prospectus. |
| Shares sold to pay Oppenheimer fees but only if the transaction is initiated by Oppenheimer. |
| Shares acquired through a right of reinstatement. |
| Front-end load Discounts Available at Oppenheimer: Breakpoints, Rights of Accumulation & Letters of Intent |
| Breakpoints as described in the Prospectus. |
| Rights of Accumulation (ROA), which entitle shareholders to breakpoint discounts, will be automatically calculated based on the aggregated holding of fund family assets held by accounts within the purchaser’s household at Oppenheimer. Eligible fund family assets not held at Oppenheimer may be included in the ROA calculation only if the shareholder notifies his or her financial advisor about such assets. |
Wells Fargo Income Plus Fund | 55
Table of Contents
Effective June 15, 2020, shareholders purchasing fund shares through a Robert W. Baird & Co. (“Baird”) platform or account will only be eligible for the following sales charge waivers (front-end sales charge waivers and CDSC waivers) and discounts, which may differ from those disclosed elsewhere in the Fund’s Prospectus or the SAI.
| Front-end Sales Load Waivers on Class A Shares available at Baird |
| Shares purchased through reinvestment of capital gains distributions and dividend reinvestment when purchasing share of the same fund. |
| Share purchase by employees and registers representatives of Baird or its affiliate and their family members as designated by Baird. |
| Shares purchase from the proceeds of redemptions within the same fund family, provided (1) the repurchase occurs within 90 days following the redemption, (2) the redemption and purchase occur in the same accounts, and (3) redeemed shares were subject to a front-end or deferred sales charge (known as rights of reinstatement). |
| A shareholder in the Funds Investor C Shares will have their share exchanged at net asset value to Investor A shares of the fund if the shares are no longer subject to CDSC and the exchange is in line with the policies and procedures of Baird. |
| Employer-sponsored retirement plans or charitable accounts in a transactional brokerage account at Baird, including 401(k) plans, 457 plans, employer-sponsored 403(b) plans, profit sharing and money purchase pension plans and defined benefit plans. For purposes of this provision, employer-sponsored retirement plans do not include SEP IRAs, Simple IRAs or SAR-SEPs. |
| CDSC Waivers on A and C Shares available at Baird |
| Shares sold due to death or disability of the shareholder. |
| Shares sold as part of a systematic withdrawal plan as described in the Fund’s Prospectus. |
| Shares bought due to returns of excess contributions from an IRA Account. |
| Shares sold as part of a required minimum distribution for IRA and retirement accounts due to the shareholder reaching age 72 as described in the Fund’s Prospectus. |
| Shares sold to pay Baird fees but only if the transaction is initiated by Baird. |
| Shares acquired through a right of reinstatement. |
| Front-end load Discounts Available at Baird: Breakpoint and/or Rights of Accumulation |
| Breakpoints as described in the Prospectus. |
| Rights of accumulations which entitles shareholders to breakpoint discounts will be automatically calculated based on the aggregated holding of fund family assets held by accounts within the purchaser’s household at Baird. Eligible fund family assets not held at Baird may be included in the rights of accumulations calculation only if the shareholder notifies his or her financial advisor about such assets. |
| Letters of Intent (LOI) allow for breakpoint discounts based on anticipated purchases within a fund family through Baird, over a 13-month period of time. |
56 | Wells Fargo Income Plus Fund
Table of Contents
For more information
More information about Wells Fargo Funds is available free upon request. To obtain literature, please write, visit the Fund’s website, or call:
Wells Fargo Funds
P.O. Box 219967
Kansas City, MO 64121-9967
Website: wfam.com
Individual investors: 1-800-222-8222
Retail investment professionals: 1-888-877-9275
Institutional investment professionals: 1-866-765-0778

This report and the financial statements contained herein are submitted for the general information of the shareholders of the Fund. If this report is used for promotional purposes, distribution of the report must be accompanied or preceded by a current prospectus. Before investing, please consider the investment objectives, risks, charges, and expenses of the investment. For a current prospectus and, if available, a summary prospectus, containing this information, call 1-800-222-8222 or visit the Fund’s website at wfam.com. Read the prospectus carefully before you invest or send money.
Wells Fargo Asset Management (WFAM) is the trade name for certain investment advisory/management firms owned by Wells Fargo & Company. These firms include but are not limited to Wells Capital Management Incorporated and Wells Fargo Funds Management, LLC. Certain products managed by WFAM entities are distributed by Wells Fargo Funds Distributor, LLC (a broker-dealer and Member FINRA).
This material is for general informational and educational purposes only and is NOT intended to provide investment advice or a recommendation of any kind—including a recommendation for any specific investment, strategy, or plan.
INVESTMENT PRODUCTS: NOT FDIC INSURED ◾ NO BANK GUARANTEE ◾ MAY LOSE VALUE
© 2020 Wells Fargo & Company. All rights reserved.
PAR-1020-00556 11-20
A263/AR263 09-20
Table of Contents

Annual Report
September 30, 2020
Wells Fargo
Global Investment Grade Credit Fund
Beginning on January 1, 2021, as permitted by new regulations adopted by the Securities and Exchange Commission, paper copies of the Wells Fargo Funds’ annual and semi-annual shareholder reports issued after this date will no longer be sent by mail, unless you specifically request paper copies of the reports. Instead, the reports will be made available on the Funds’ website, and you will be notified by mail each time a report is posted and provided with a website address to access the report.
If you already elected to receive shareholder reports electronically, you will not be affected by this change and you need not take any action. You may elect to receive shareholder reports and other communications from the Fund electronically at any time by contacting your financial intermediary (such as a broker-dealer or bank) or, if you are a direct investor, by calling 1-800-222-8222 or by enrolling at wellsfargo.com/advantagedelivery.
You may elect to receive all future reports in paper free of charge. If you invest through a financial intermediary, you can contact your financial intermediary to request that you continue to receive paper copies of your shareholder reports; if you invest directly with the Fund, you can call 1-800-222-8222. Your election to receive reports in paper will apply to all Wells Fargo Funds held in your account with your financial intermediary or, if you are a direct investor, to all Wells Fargo Funds that you hold.
Table of Contents
|
Reduce clutter. Save trees. |
Sign up for |
The views expressed and any forward-looking statements are as of September 30, 2020, unless otherwise noted, and are those of the Fund’s portfolio managers and/or Wells Fargo Asset Management. Discussions of individual securities, or the markets generally, or any Wells Fargo Fund are not intended as individual recommendations. Future events or results may vary significantly from those expressed in any forward-looking statements. The views expressed are subject to change at any time in response to changing circumstances in the market. Wells Fargo Asset Management and the Fund disclaim any obligation to publicly update or revise any views expressed or forward-looking statements.
INVESTMENT PRODUCTS: NOT FDIC INSURED ◾ NO BANK GUARANTEE ◾ MAY LOSE VALUE
Wells Fargo Global Investment Grade Credit Fund | 1
Table of Contents
Letter to shareholders (unaudited)

Andrew Owen
President
Wells Fargo Funds
Dear Shareholder:
We are pleased to offer you this annual report for the Wells Fargo Global Investment Grade Credit Fund for the 12-month period that ended September 30, 2020. Global stock markets saw earlier gains erased in March as governments around the world took unprecedented measures, attempting to stop the spread of COVID-19 at the expense of short-term economic output. However, markets rallied strongly from April on to more than offset those short-term losses as central banks bolstered capital markets and confidence.
For the 12-month period, equities had broadly positive total returns despite intense volatility in March. Non-U.S. developed market equities had weaker performance than emerging market and U.S. stocks. While gains from fixed-income securities were positive, they were more modest than equities. For the period, U.S. stocks, based on the S&P 500 Index,1 gained 15.15%. International stocks, as measured by the MSCI ACWI ex USA Index (Net),2 returned 3.00%, while the MSCI EM Index (Net)3 had stronger performance, with a 10.54% gain. For bond investors, the Bloomberg Barclays U.S. Aggregate Bond Index4 returned 6.98%, the Bloomberg Barclays Global Aggregate ex-USD Index5 gained 5.48%, and the Bloomberg Barclays Municipal Bond Index6 returned 4.09% while the ICE BofA U.S. High Yield Index7 returned 2.30%.
The period began with mixed economic readings.
The fourth quarter of 2019 started on a strong note. U.S.-China trade tensions, which had been building for months, relaxed in October; optimism rose for a U.K. Brexit deal; and macroeconomic data turned positive. The initial estimate of U.S. third-quarter gross domestic product (GDP) growth was a resilient 1.9% annualized rate, while the U.S. unemployment rate fell to a 50-year low of 3.5% in September. However, despite strength among U.S. consumers, business confidence declined while manufacturing activity contracted. Concerned with a potential economic slowdown, the U.S. Federal Reserve (Fed) lowered interest rates a quarter point in late October—its third rate cut in four months. This helped push the S&P 500 Index to an all-time high while emerging market equities rallied and global bonds declined overall, reflecting a broad pickup in risk appetite.
Equity markets continued to rally in November despite ongoing geopolitical risks. Hopes for a U.S.-China trade deal buoyed investor confidence. U.S. business sentiment improved slightly and manufacturing and services activity picked up. While consumer confidence and purchasing managers’ activity rose in the eurozone, China reported weakening manufacturing and consumer data. Bond yields rose marginally, leading to slightly negative returns for global government and investment-grade corporate bonds.
| 1 | The S&P 500 Index consists of 500 stocks chosen for market size, liquidity, and industry group representation. It is a market-value-weighted index with each stock’s weight in the index proportionate to its market value. You cannot invest directly in an index. |
| 2 | The Morgan Stanley Capital International (MSCI) All Country World Index (ACWI) ex USA Index (Net) is a free-float-adjusted market-capitalization-weighted index that is designed to measure the equity market performance of developed and emerging markets, excluding the United States. Source: MSCI. MSCI makes no express or implied warranties or representations and shall have no liability whatsoever with respect to any MSCI data contained herein. The MSCI data may not be further redistributed or used as a basis for other indices or any securities or financial products. This report is not approved, reviewed, or produced by MSCI. You cannot invest directly in an index. |
| 3 | The MSCI Emerging Markets (EM) Index (Net) is a free-float-adjusted market-capitalization-weighted index that is designed to measure equity market performance of emerging markets. You cannot invest directly in an index. |
| 4 | The Bloomberg Barclays U.S. Aggregate Bond Index is a broad-based benchmark that measures the investment-grade, U.S. dollar-denominated, fixed-rate taxable bond market, including Treasuries, government-related and corporate securities, mortgage-backed securities (agency fixed-rate and hybrid adjustable-rate mortgage pass-throughs), asset-backed securities, and commercial mortgage-backed securities. You cannot invest directly in an index. |
| 5 | The Bloomberg Barclays Global Aggregate ex-USD Index is an unmanaged index that provides a broad-based measure of the global investment-grade fixed-income markets excluding the U.S. dollar-denominated debt market. You cannot invest directly in an index. |
| 6 | The Bloomberg Barclays Municipal Bond Index is an unmanaged index composed of long-term tax-exempt bonds with a minimum credit rating of Baa. You cannot invest directly in an index. |
| 7 | The ICE BofA U.S. High Yield Index is a market-capitalization-weighted index of domestic and Yankee high-yield bonds. The index tracks the performance of high-yield securities traded in the U.S. bond market. You cannot invest directly in an index. Copyright 2020. ICE Data Indices, LLC. All rights reserved. |
2 | Wells Fargo Global Investment Grade Credit Fund
Table of Contents
Letter to shareholders (unaudited)
Financial markets ended 2019 with a boost from the U.S. and China accord on a Phase One trade deal. That, along with the landslide win by the pro-Brexit U.K. Conservative Party in a national election and ongoing central bank support, gave investors greater confidence. U.S. economic indicators were generally positive, with the exception of manufacturing activity and business confidence. Consumer confidence was resilient, fed by a robust labor market, tame inflation, and lower interest rates, which boosted housing affordability and stimulated homebuyer activity. The impeachment of President Trump had little impact on the markets. Meanwhile, slowing Chinese economic activity, partly attributable to the trade war, led to further government stimulus at year-end through lower reserve ratios, allowing banks to lend more money.
The year-end rally continued in early January 2020. However, capital market volatility spiked in late January on concerns over the potential impact of COVID-19 on the global economy and stock markets. With sentiment somewhat souring, perceived safe havens did well in January. The U.S. dollar and Japanese yen both rose and government bonds outperformed equities. While the S&P 500 Index held its ground, emerging market equities tumbled, including those in Asia.
In February, COVID-19 became the major market focus. Fears of the virus’s impact on Chinese and global growth led to expectations of increased global central bank monetary policy support. That led the 10-year U.S. Treasury yield to fall to an all-time low of 1.1%. Although equity markets initially shrugged off concerns about the outbreak, focusing instead on strong fourth-quarter earnings and improving business confidence in January, market sentiment turned sharply lower and the S&P 500 Index lost 8.2% for the month. Oil prices tumbled as Russia and the Organization of the Petroleum Exporting Countries compounded a major decline in oil demand with a brutal price war, partly aimed at dissuading further U.S. shale production, causing the price of West Texas Intermediate crude oil to plummet.
The global spread of COVID-19 led country after country to clamp down on social and business-related activity in order to contain the virus from causing even greater devastation and overwhelming health care systems. This abrupt stoppage of economic activity led to the sharp deceleration of global output, sending economies into a deep contraction. Central banks responded swiftly, slashing interest rates and expanding quantitative easing programs to restore liquidity and confidence to the markets. In the U.S., the Fed introduced several new lending programs, funding investment-grade bonds, money market mutual funds, and commercial paper while purchasing Treasuries, mortgage-backed securities, and overnight repurchase agreements. Meanwhile, stock markets tumbled quickly into a bear market, ending the longest bull stock market in U.S. history.
Markets rebounded strongly in April, fueled by unprecedented government and central bank stimulus measures. The U.S. economy contracted by an annualized 5.0% pace in the first quarter, with 30 million new unemployment insurance claims in six weeks. In the eurozone, first-quarter real GDP shrank 3.8%, with the composite April Flash Purchasing Managers’ Index (PMI), a monthly survey of purchasing managers, falling to an all-time low of 13.5. The European Central Bank expanded its quantitative easing to include the purchase of additional government bonds of countries with the greatest virus-related need, including Italy and Spain. China’s first-quarter GDP fell by 6.8% year over year. However, retail sales, production, and investment showed signs of recovery. Extreme oil-price volatility continued as global supply far exceeded demand.
The global equity market rebound continued in May, with widespread strong monthly gains. Investors regained confidence on reports of early signs of success in human trials of a COVID-19 vaccine. Growth stocks continued to outperform value stocks while returns on global government bonds were generally flat. In the U.S., a gap grew between the stock market rebound and devastating economic data points, including an April unemployment rate of 14.7%, the highest level since World War II. PMIs reflected
“The global spread of COVID-19 led country after country to clamp down on social and business related activity in order to contain the virus from causing even greater devastation and overwhelming health care systems.”
Wells Fargo Global Investment Grade Credit Fund | 3
Table of Contents
Letter to shareholders (unaudited)
“The stock market continued to rally in August despite concerns over rising numbers of COVID-19 cases in the United States and several European countries, including France and Spain, as well as the expiration of the $600 weekly bonus unemployment benefit at the end of July.”
weakening activity in May in both the manufacturing and services sectors. U.S. corporate earnings reports indicated a 14% year-over-year contraction in earnings from the first quarter of 2019. However, high demand for technology, driven by remote activity, supported robust information technology sector earnings, which helped drive major technology stocks higher.
Financial markets posted widely positive returns in June despite ongoing economic weakness and high levels of uncertainty on the containment of COVID-19 and the timing of an effective vaccine. There were hopeful signs as economies reopened, with both U.S. and U.K. retail sales rebounding sharply in May. However, year over year, sales remained depressed. Vitally important to market sentiment was the ongoing commitment by central banks globally to do all they could to provide economic support through liquidity and low borrowing costs. U.S. economic activity was aided by one-time $1,200 stimulus checks and $600 bonus weekly unemployment benefits that expired at the end of July. However, unemployment remained historically high, easing somewhat from 14.7% in April to 11.1% in June. By month-end, numerous states reported increases of COVID-19 cases. China’s economic recovery picked up momentum in June, though it remained far from a full recovery.
July was a broadly positive month for both global equities and fixed income. However, economic data and a resurgence of COVID-19 cases pointed to the vulnerability of the global economy and the ongoing imperative to regain control of the pandemic. Second-quarter GDP shrank from the previous quarter by 9.5% and 12.1% in the U.S. and the eurozone, respectively. In contrast, China reported a 3.2% year-over-year expansion in its second-quarter GDP. U.S. unemployment remained high despite adding 1.8 million jobs in July, with a double-digit jobless rate persisting. However, manufacturing activity grew in both the U.S. and the eurozone. In Asia, while China’s manufacturing sector continued to expand, activity in Japan and South Korea contracted. In July, a rising concern was the rapid and broad reemergence of COVID-19 infections.
The stock market continued to rally in August despite concerns over rising numbers of COVID-19 cases in the United States and several European countries, including France and Spain, as well as the expiration of the $600 weekly bonus unemployment benefit at the end of July. U.S. stocks had strong monthly gains, led by the FAANG stocks—Facebook, Apple, Amazon, Netflix, and Google (Alphabet)—which dominate these indices and continued to rally. U.S. stocks generally surpassed other broadly positive global equity performance while fixed-income market monthly returns were broadly flat. Generally stronger-than-expected second-quarter earnings boosted investor sentiment along with the Fed’s announcement of a policy shift that will likely lead to longer-term low interest rates and supportive monetary policy. The U.S. Flash PMIs for both manufacturing and services beat expectations while U.S. housing market indicators were strong. In Europe, retail sales expanded and consumer confidence remained steady. China’s economy continued its fairly steady expansion. Overall, developed markets performed better than emerging market equities for the month of August as people took comfort in better-known equities in perceived safer markets.
Stocks grew more volatile in September on mixed economic data. U.S. PMIs showed solid growth in economic activity in both manufacturing and services. However, six months after the bottom fell out of the labor market in the early spring, only half of the 22 million jobs lost had returned. The U.S. unemployment rate fell to 7.9% in September, the fifth straight month of improvement but far higher than the 3.5% pre-COVID-19 rate. Only 661,000 jobs were added for the month, down from 1.5 million in August. Meanwhile, a reported 2.3 million people have given up looking for work. With U.S. Congress failing to pass further fiscal relief and uncertainties surrounding a possible vaccine, doubts crept back into the financial markets. In the U.K., a lack of progress in Brexit talks with the European Union weighed on markets. China’s economy picked up steam, however, with growth fueled by increased global demand, and China’s service sector had its strongest PMI reading in seven years.
4 | Wells Fargo Global Investment Grade Credit Fund
Table of Contents
Letter to shareholders (unaudited)
Don’t let short-term uncertainty derail long-term investment goals.
Periods of investment uncertainty can present challenges, but experience has taught us that maintaining long-term investment goals can be an effective way to plan for the future. To help you create a sound strategy based on your personal goals and risk tolerance, Wells Fargo Funds offers more than 100 mutual funds spanning a wide range of asset classes and investment styles. Although diversification cannot guarantee an investment profit or prevent losses, we believe it can be an effective way to manage investment risk and potentially smooth out overall portfolio performance. We encourage investors to know their investments and to understand that appropriate levels of risk-taking may unlock opportunities.
Thank you for choosing to invest with Wells Fargo Funds. We appreciate your confidence in us and remain committed to helping you meet your financial needs.
Sincerely,

Andrew Owen
President
Wells Fargo Funds
|
For further information about your Fund, contact your investment professional, visit our website at wfam.com, or call us directly at 1-800-222-8222. |
Notice to Shareholders
Preparing for LIBOR Transition
The global financial industry is preparing to transition away from the London Interbank Offered Rate (LIBOR), a key benchmark interest rate, to new alternative rates. LIBOR underpins more than $350 trillion of financial contracts. It is the benchmark rate for a wide spectrum of products ranging from residential mortgages to corporate bonds to derivatives. Regulators have called for a market-wide transition away from LIBOR to successor reference rates by the end of 2021, which requires proactive steps be taken by issuers, counterparties, and asset managers to identify impacted products and adopt new reference rates.
The Fund holds at least one security that uses LIBOR as a floating reference rate and has a maturity date after 12-31-2021.
Although the transition process away from LIBOR has become increasingly well-defined in advance of the anticipated discontinuation date, there remains uncertainty regarding the nature of successor reference rates, and any potential effects of the transition away from LIBOR on investment instruments that use it as a benchmark rate. The transition process may result in, among other things, increased volatility or illiquidity in markets for instruments that currently rely on LIBOR and could negatively impact the value of certain instruments held by the Fund.
Wells Fargo Asset Management is monitoring LIBOR exposure closely and has put resources and controls in place to manage this transition effectively. The Fund’s portfolio management team is evaluating LIBOR holdings to understand what happens to those securities when LIBOR ceases to exist, including examining security documentation to identify the presence or absence of fallback language identifying a replacement rate to LIBOR.
While the pace of transition away from LIBOR will differ by asset class and investment strategy, the portfolio management team will monitor market conditions for those holdings to identify and mitigate deterioration or volatility in pricing and liquidity and ensure appropriate actions are taken in a timely manner.
Further information regarding the potential risks associated with the discontinuation of LIBOR can be found in the Fund’s Statement of Additional Information.
Wells Fargo Global Investment Grade Credit Fund | 5
Table of Contents
Performance highlights (unaudited)
Investment objective
The Fund seeks total return, consisting of income and capital appreciation.
Manager
Wells Fargo Funds Management, LLC
Subadvisers
Wells Capital Management Incorporated
Wells Fargo Asset Management (International) Limited
Portfolio managers
Henrietta Pacquement, CFA®‡
Scott M. Smith, CFA®‡
Alex Temple
Jonathan Terry, CFA®‡
Average annual total returns (%) as of September 30, 2020
| Expense ratios1 (%) | ||||||||||||||||||
| Inception date | 1 year | Since inception | Gross | Net2 | ||||||||||||||
| Class R6 (WGCRX) | 2-28-2019 | 6.10 | 9.38 | 0.86 | 0.45 | |||||||||||||
| Institutional Class (WGCIX) | 2-28-2019 | 6.04 | 9.33 | 0.91 | 0.50 | |||||||||||||
| Bloomberg Barclays Global Aggregate Credit Index Hedged (USD)3 | – | 5.80 | 9.28 | * | – | – | ||||||||||||
| * | Based on the inception date of the oldest Fund class. |
Figures quoted represent past performance, which is no guarantee of future results, and do not reflect taxes that a shareholder may pay on an investment in a fund. Investment return and principal value of an investment will fluctuate so that an investor’s shares, when redeemed, may be worth more or less than their original cost. Current performance may be lower or higher than the performance data quoted, which assumes the reinvestment of dividends and capital gains. Current month-end performance is available on the Fund’s website, wfam.com.
Index returns do not include transaction costs associated with buying and selling securities, any mutual fund fees or expenses, or any taxes. It is not possible to invest directly in an index.
Class R6 and Institutional Class shares are sold without a front-end sales charge or contingent deferred sales charge.
Bond values fluctuate in response to the financial condition of individual issuers, general market and economic conditions, and changes in interest rates. Changes in market conditions and government policies may lead to periods of heightened volatility in the bond market and reduced liquidity for certain bonds held by the fund. In general, when interest rates rise, bond values fall and investors may lose principal value. Interest rate changes and their impact on the fund and its share price can be sudden and unpredictable. Foreign investments are especially volatile and can rise or fall dramatically due to differences in the political and economic conditions of the host country. These risks are generally intensified in emerging markets. The use of derivatives may reduce returns and/or increase volatility. Securities issued by U.S. government agencies or government-sponsored entities may not be guaranteed by the U.S. Treasury. Certain investment strategies tend to increase the total risk of an investment (relative to the broader market). The Fund is exposed to municipal securities risk, high-yield securities risk, and mortgage- and asset-backed securities risk. Consult the Fund’s prospectus for additional information on these and other risks.
Please see footnotes on page 7.
6 | Wells Fargo Global Investment Grade Credit Fund
Table of Contents
Performance highlights (unaudited)
| Growth of $1,000,000 investment as of September 30, 20204 |
|
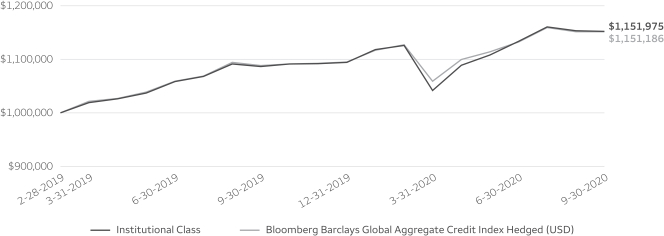
| ‡ | CFA® and Chartered Financial Analyst® are trademarks owned by CFA Institute. |
| 1 | Reflects the expense ratios as stated in the most recent prospectuses. The expense ratios shown are subject to change and may differ from the annualized expense ratios shown in the financial highlights of this report. |
| 2 | The manager has contractually committed through January 31, 2021, to waive fees and/or reimburse expenses to the extent necessary to cap total annual fund operating expenses after fee waivers at 0.45% for Class R6 and 0.50% for Institutional Class. Brokerage commissions, stamp duty fees, interest, taxes, acquired fund fees and expenses (if any), and extraordinary expenses are excluded from the expense caps. Prior to or after the commitment expiration date, the caps may be increased or the commitment to maintain the caps may be terminated only with the approval of the Board of Trustees. Without these caps, the Fund’s returns would have been lower. The expense ratio paid by an investor is the net expense ratio (the total annual fund operating expenses after fee waivers) as stated in the prospectuses. |
| 3 | Bloomberg Barclays Global Aggregate Credit Index Hedged (USD) measures the credit sector of the global investment grade fixed-rate bond market, including corporate, government and agency securities, hedged in USD. You cannot invest directly in an index. |
| 4 | The chart compares the performance of the Institutional Class shares since inception with the Bloomberg Barclays Global Aggregate Credit Index Hedged (USD). The chart assumes a hypothetical investment of $1,000,000 in Institutional Class shares shares and reflects all operating expenses . |
| 5 | The ten largest holdings, excluding cash, cash equivalents and any money market funds, are calculated based on the value of the investments divided by total net assets of the Fund. Holdings are subject to change and may have changed since the date specified. |
| 6 | Amounts are calculated based on the total long-term investments of the Fund. These amounts are subject to change and may have changed since the date specified. |
| 7 | The credit quality distribution of portfolio holdings reflected in the chart is based on ratings from Standard & Poor’s, Moody’s Investors Service, and/or Fitch Ratings Ltd. Credit quality ratings apply to the underlying holdings of the Fund and not to the Fund itself. The percentages of the Fund’s portfolio with the ratings depicted in the chart are calculated based on the total market value of fixed income securities held by the Fund. If a security was rated by all three rating agencies, the middle rating was utilized. If rated by two of three rating agencies, the lower rating was utilized, and if rated by one of the rating agencies, that rating was utilized. Standard & Poor’s rates the creditworthiness of bonds, ranging from AAA (highest) to D (lowest). Ratings from A to CCC may be modified by the addition of a plus (+) or minus (-) sign to show relative standing within the rating categories. Standard & Poor’s rates the creditworthiness of short-term notes from SP-1 (highest) to SP-3 (lowest). Moody’s rates the creditworthiness of bonds, ranging from Aaa (highest) to C (lowest). Ratings Aa to B may be modified by the addition of a number 1 (highest) to 3 (lowest) to show relative standing within the ratings categories. Moody’s rates the creditworthiness of short-term U.S. tax-exempt municipal securities from MIG 1/VMIG 1 (highest) to SG (lowest). Fitch rates the creditworthiness of bonds, ranging from AAA (highest) to D (lowest). Credit quality distribution is subject to change and may have changed since the date specified. |
Wells Fargo Global Investment Grade Credit Fund | 7
Table of Contents
Performance highlights (unaudited)
MANAGERS’ DISCUSSION
Fund highlights
| ∎ | The Fund outperformed its benchmark, the Bloomberg Barclays Global Aggregate Credit Index Hedged (USD), for the 12-month period that ended September 30, 2020. |
| ∎ | Performance was primarily driven by security selection. |
| ∎ | Active participation in cheap new deals from issuers refinancing short-term debt with longer-term debt was a source of outperformance. |
The coronavirus pandemic was met by a global fiscal and monetary response.
The 12 months ending September 30, 2020, were characterized by the impact and subsequent monetary and fiscal response to the coronavirus crisis. The final quarter of 2019 through February 2020 saw spreads tighten as political risks dissipated, including a first-round trade deal between China and the United States and additional Brexit clarity following a snap U.K. general election. March 2020 saw spreads sell off aggressively as the liquidity of all asset classes, including U.S. Treasuries and corporate bonds, became challenged as the world adapted to the impact of the coronavirus. While each jurisdiction had its own fiscal response, the major central banks reacted aggressively, cutting interest rates and restarting/upsizing quantitative easing programs, including the purchase of corporate bonds.
The U.S. 10-year government bond yield declined by 98 basis points (bps; 100 bps equal 1.00%) over the one-year period. The option-adjusted spread for the benchmark moved from 108 bps in September 2019 to just 90 bps in January 2020 before widening to 287 bps in March and subsequently tightening to close at 126 bps in September 2020.
We actively rotated the portfolio.
In the fourth quarter of 2019, the Fund added to the financials and reduced some of the communications overweight, reflecting relative-value opportunities. The allocation to BBB-rated credits was increased by 2% as the European Central Bank restarted its corporate bond purchasing program. We used the market rebound at the end of March to reduce exposure to previously high-quality names that could struggle as the lockdown is gradually lifted and social distancing rules remain in place. Names including Darden Restaurants and U.K. holiday parks owner Centre Parcs were exchanged for credits with better near-term momentum and liquidity. The Fund continued to be very active in the new issue market throughout the second and third quarters of 2020. In the third quarter, we added more subordinated paper from higher-quality issuers as opposed to reaching into senior paper from lower-quality issuers.
| Ten largest holdings (%) as of September 30, 20204 | ||||
Citigroup Incorporated, 3.30%, 4-27-2025 | 1.50 | |||
Morgan Stanley, 3.13%, 7-27-2026 | 1.36 | |||
Bank of America Corporation, 4.13%, 1-22-2024 | 1.34 | |||
American International Group Incorporated, 4.75%, 4-1-2048 | 1.18 | |||
Toronto Dominion Bank, 3.23%, 7-24-2024 | 1.06 | |||
Goldman Sachs Group Incorporated, 3.63%, 1-22-2023 | 1.03 | |||
Intercontinental Exchange Incorporated, 3.75%, 12-1-2025 | 0.98 | |||
Tencent Holdings Limited. 3.60%, 1-19-2028 | 0.98 | |||
Cantor Fitzgerald LP, 4.88%, 5-1-2024 | 0.95 | |||
U.S. Treasury Bond, 2.00%, 2-15-2050 | 0.93 | |||
| Portfolio composition as of September 30, 20206 |
|
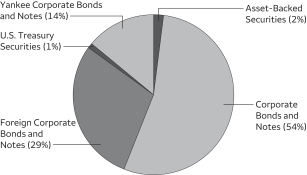
Please see footnotes on page 7.
8 | Wells Fargo Global Investment Grade Credit Fund
Table of Contents
Performance highlights
| Effective maturity distribution as of September 30, 20206 |
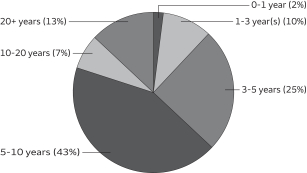 |
| Credit quality as of September 30, 20207 |
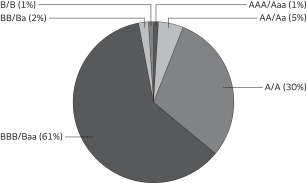 |
Record volumes of issuance provide an opportunity for alpha.
From September 2019 through March 2020, overweights to telecommunications, BBB-rated, and sterling-denominated credits all contributed to performance as spreads compressed and fears of a hard Brexit subsided. Generous new issue premiums from corporate issuers in the second and third quarters of 2020 helped drive performance as high-quality issuers scrambled to refinance shorter-term debt with longer-term debt and build cash buffers ahead of a second wave of the coronavirus. Underweighting sectors and credits hardest hit by the pandemic also contributed to performance as many have struggled to recover or have been downgraded aggressively by rating agencies.
Detractors
In the final quarter of 2019, at a market level, low-spread-duration and high-quality securities underperformed their lower-quality and longer-duration counterparts. The Fund had a small allocation to U.S. Treasuries, which underperformed as spreads tightened. Underperformers include high-quality issuers such as PacifiCorp Utility; Apple Incorporated; and Mars, Incorporated. In the March sell-off, the BBB-rating cohort, to which the Fund has a 10% overweight, was the worst-performing rating cohort with only the AAA-rating cohort posting positive absolute returns. Within credit, the energy sector overweight underperformed as a price war between Saudi Arabia and Russia in early March led to a one-day decline of more than 25% in crude oil prices.
Ongoing economic weakness could lead to looser monetary policy.
We expect demand for global investment-grade credit to persist as investors hunt for yield. The pace of flows could, however, slow down as market valuations become more balanced. While all-in yields are still around historical lows, they remain attractive relative to other asset classes, and particularly on a global basis given the significant volume of negative-yielding debt. After a record amount of new issue supply the past two quarters, we expect supply in the fourth quarter in the U.S. and Europe to be low, with some suggesting only $100 billion total in the U.S. and volumes in Europe dropping off as the reporting season commences. We believe this will serve as a large technical factor and offset potential negatives.
Please see footnotes on page 7.
Wells Fargo Global Investment Grade Credit Fund | 9
Table of Contents
As a shareholder of the Fund, you incur ongoing costs, including management fees and other Fund expenses. This example is intended to help you understand your ongoing costs (in dollars) of investing in the Fund and to compare these costs with the ongoing costs of investing in other mutual funds.
The example is based on an investment of $1,000 invested at the beginning of the six-month period and held for the entire period from April 1, 2020 to September 30, 2020.
Actual expenses
The “Actual” line of the table below provides information about actual account values and actual expenses. You may use the information in this line, together with the amount you invested, to estimate the expenses that you paid over the period. Simply divide your account value by $1,000 (for example, an $8,600 account value divided by $1,000 = 8.6), then multiply the result by the number in the “Actual” line under the heading entitled “Expenses paid during period” for your applicable class of shares to estimate the expenses you paid on your account during this period.
Hypothetical example for comparison purposes
The “Hypothetical” line of the table below provides information about hypothetical account values and hypothetical expenses based on the Fund’s actual expense ratio and an assumed rate of return of 5% per year before expenses, which is not the Fund’s actual return. The hypothetical account values and expenses may not be used to estimate the actual ending account balance or expenses you paid for the period. You may use this information to compare the ongoing costs of investing in the Fund and other funds. To do so, compare this 5% hypothetical example with the 5% hypothetical examples that appear in the shareholder reports of the other funds.
Please note that the expenses shown in the table are meant to highlight your ongoing costs only. Therefore, the “Hypothetical”
line of the table is useful in comparing ongoing costs only and will not help you determine the relative total costs of owning
different funds.
| Beginning account value 4-1-2020 | Ending account value 9-30-2020 | Expenses paid during the period1 | Annualized net expense ratio | |||||||||||||
Class R6 | ||||||||||||||||
Actual | $ | 1,000.00 | $ | 1,106.19 | $ | 2.38 | 0.45 | % | ||||||||
Hypothetical (5% return before expenses) | $ | 1,000.00 | $ | 1,022.81 | $ | 2.28 | 0.45 | % | ||||||||
Institutional Class | ||||||||||||||||
Actual | $ | 1,000.00 | $ | 1,105.78 | $ | 2.64 | 0.50 | % | ||||||||
Hypothetical (5% return before expenses) | $ | 1,000.00 | $ | 1,022.56 | $ | 2.54 | 0.50 | % | ||||||||
| 1 | Expenses paid is equal to the annualized net expense ratio of each class multiplied by the average account value over the period, multiplied by the number of days in the most recent fiscal half-year divided by the number of days in the fiscal year (to reflect the one-half-year period). |
10 | Wells Fargo Global Investment Grade Credit Fund
Table of Contents
Portfolio of investments—September 30, 2020
| Interest rate | Maturity date | Principal | Value | |||||||||||||
| Asset-Backed Securities: 1.61% | ||||||||||||||||
American Airlines Series 2014-1 Class A Pass-Through Trust | 3.70 | % | 4-1-2028 | $ | 256,074 | $ | 212,701 | |||||||||
British Airways Series 2019-1 Class AA Pass-Through Trust 144A | 3.30 | 6-15-2034 | 626,526 | 587,198 | ||||||||||||
Delta Air Lines Series 2019-1 Class AA Pass-Through Trust | 3.20 | 10-25-2025 | 440,000 | 438,426 | ||||||||||||
Total Asset-Backed Securities (Cost $1,321,573) |
| 1,238,325 | ||||||||||||||
|
| |||||||||||||||
Corporate Bonds and Notes: 52.37% |
| |||||||||||||||
Communication Services: 7.13% |
| |||||||||||||||
| Diversified Telecommunication Services: 3.76% | ||||||||||||||||
AT&T Incorporated | 2.75 | 6-1-2031 | 225,000 | 236,586 | ||||||||||||
AT&T Incorporated | 3.65 | 6-1-2051 | 505,000 | 509,691 | ||||||||||||
AT&T Incorporated | 4.25 | 3-1-2027 | 555,000 | 644,086 | ||||||||||||
T-Mobile USA Incorporated 144A | 2.55 | 2-15-2031 | 60,000 | 62,165 | ||||||||||||
T-Mobile USA Incorporated 144A%% | 3.30 | 2-15-2051 | 235,000 | 231,292 | ||||||||||||
T-Mobile USA Incorporated 144A | 3.75 | 4-15-2027 | 220,000 | 246,299 | ||||||||||||
Verizon Communications Incorporated | 2.88 | 1-15-2038 | 200,000 | 289,852 | ||||||||||||
Verizon Communications Incorporated | 4.13 | 8-15-2046 | 545,000 | 670,961 | ||||||||||||
| 2,890,932 | ||||||||||||||||
|
| |||||||||||||||
| Entertainment: 0.22% | ||||||||||||||||
The Walt Disney Company | 3.60 | 1-13-2051 | 150,000 | 168,908 | ||||||||||||
|
| |||||||||||||||
| Media: 3.15% | ||||||||||||||||
Charter Communications Operating LLC | 2.80 | 4-1-2031 | 135,000 | 140,026 | ||||||||||||
Charter Communications Operating LLC | 4.91 | 7-23-2025 | 395,000 | 456,569 | ||||||||||||
Comcast Corporation | 3.40 | 4-1-2030 | 155,000 | 178,794 | ||||||||||||
Cox Communications Incorporated 144A | 4.60 | 8-15-2047 | 390,000 | 486,643 | ||||||||||||
Discovery Incorporated | 5.30 | 5-15-2049 | 190,000 | 232,766 | ||||||||||||
Fox Corporation | 4.71 | 1-25-2029 | 575,000 | 688,625 | ||||||||||||
ViacomCBS Incorporated | 4.95 | 1-15-2031 | 200,000 | 239,173 | ||||||||||||
| 2,422,596 | ||||||||||||||||
|
| |||||||||||||||
Consumer Discretionary: 1.82% |
| |||||||||||||||
| Automobiles: 0.72% | ||||||||||||||||
Ford Motor Company | 9.00 | 4-22-2025 | 170,000 | 194,907 | ||||||||||||
General Motors Company | 6.13 | 10-1-2025 | 310,000 | 360,041 | ||||||||||||
| 554,948 | ||||||||||||||||
|
| |||||||||||||||
| Hotels, Restaurants & Leisure: 0.35% | ||||||||||||||||
McDonald’s Corporation | 1.45 | 9-1-2025 | 200,000 | 205,915 | ||||||||||||
McDonald’s Corporation | 4.20 | 4-1-2050 | 50,000 | 60,716 | ||||||||||||
| 266,631 | ||||||||||||||||
|
| |||||||||||||||
| Internet & Direct Marketing Retail: 0.32% | ||||||||||||||||
Booking Holdings Incorporated | 1.80 | 3-3-2027 | 200,000 | 247,016 | ||||||||||||
|
| |||||||||||||||
| Multiline Retail : 0.04% | ||||||||||||||||
Target Corporation | 2.65 | 9-15-2030 | 25,000 | 27,963 | ||||||||||||
|
| |||||||||||||||
| Specialty Retail: 0.17% | ||||||||||||||||
Home Depot Incorporated | 2.70 | 4-15-2030 | 65,000 | 72,315 | ||||||||||||
TJX Companies Incorporated | 3.88 | 4-15-2030 | 50,000 | 59,261 | ||||||||||||
| 131,576 | ||||||||||||||||
|
| |||||||||||||||
The accompanying notes are an integral part of these financial statements.
Wells Fargo Global Investment Grade Credit Fund | 11
Table of Contents
Portfolio of investments—September 30, 2020
| Interest rate | Maturity date | Principal | Value | |||||||||||||
| Textiles, Apparel & Luxury Goods: 0.22% | ||||||||||||||||
Ralph Lauren Corporation | 2.95 | % | 6-15-2030 | $ | 160,000 | $ | 166,938 | |||||||||
|
| |||||||||||||||
Consumer Staples: 3.74% |
| |||||||||||||||
| Beverages: 2.09% | ||||||||||||||||
Anheuser-Busch InBev Finance Incorporated | 3.65 | 2-1-2026 | 485,000 | 541,546 | ||||||||||||
Coca Cola Company | 0.13 | 3-15-2029 | 400,000 | 465,474 | ||||||||||||
Coca Cola Company | 1.65 | 6-1-2030 | 95,000 | 98,285 | ||||||||||||
Keurig Dr Pepper Incorporated | 4.60 | 5-25-2028 | 415,000 | 498,099 | ||||||||||||
| 1,603,404 | ||||||||||||||||
|
| |||||||||||||||
| Food & Staples Retailing: 0.25% | ||||||||||||||||
Walmart Incorporated | 3.70 | 6-26-2028 | 165,000 | 195,000 | ||||||||||||
|
| |||||||||||||||
| Food Products: 0.79% | ||||||||||||||||
Mars Incorporated 144A | 3.95 | 4-1-2049 | 320,000 | 386,498 | ||||||||||||
Smithfield Foods Incorporated 144A | 3.00 | 10-15-2030 | 220,000 | 222,218 | ||||||||||||
| 608,716 | ||||||||||||||||
|
| |||||||||||||||
| Tobacco: 0.61% | ||||||||||||||||
BAT Capital Corporation | 4.54 | 8-15-2047 | 440,000 | 470,242 | ||||||||||||
|
| |||||||||||||||
Energy: 5.01% |
| |||||||||||||||
| Oil, Gas & Consumable Fuels: 5.01% | ||||||||||||||||
BP Capital Markets America Incorporated | 2.75 | 5-10-2023 | 300,000 | 316,250 | ||||||||||||
Energy Transfer Operating Partners LP | 3.75 | 5-15-2030 | 245,000 | 237,129 | ||||||||||||
Energy Transfer Operating Partners LP | 6.25 | 4-15-2049 | 650,000 | 668,877 | ||||||||||||
Exxon Mobil Corporation | 2.61 | 10-15-2030 | 435,000 | 469,200 | ||||||||||||
Kinder Morgan Energy Partners LP | 5.40 | 9-1-2044 | 335,000 | 388,138 | ||||||||||||
Marathon Petroleum Corporation | 3.80 | 4-1-2028 | 375,000 | 407,140 | ||||||||||||
MPLX LP | 4.00 | 3-15-2028 | 530,000 | 578,310 | ||||||||||||
Sabine Pass Liquefaction LLC 144A | 4.50 | 5-15-2030 | 165,000 | 185,704 | ||||||||||||
Sabine Pass Liquefaction LLC | 5.75 | 5-15-2024 | 530,000 | 599,978 | ||||||||||||
| 3,850,726 | ||||||||||||||||
|
| |||||||||||||||
Financials: 16.48% |
| |||||||||||||||
| Banks: 4.13% | ||||||||||||||||
Bank of America Corporation | 4.13 | 1-22-2024 | 930,000 | 1,029,910 | ||||||||||||
Citigroup Incorporated | 3.30 | 4-27-2025 | 1,045,000 | 1,150,480 | ||||||||||||
Huntington Bancshares Incorporated | 2.55 | 2-4-2030 | 70,000 | 73,101 | ||||||||||||
JPMorgan Chase & Company (U.S. SOFR +2.52%) ± | 2.96 | 5-13-2031 | 225,000 | 240,504 | ||||||||||||
JPMorgan Chase & Company (3 Month LIBOR +1.34%) ± | 3.78 | 2-1-2028 | 220,000 | 248,712 | ||||||||||||
Santander Holdings USA Incorporated | 4.40 | 7-13-2027 | 390,000 | 429,369 | ||||||||||||
| 3,172,076 | ||||||||||||||||
|
| |||||||||||||||
| Capital Markets: 6.57% | ||||||||||||||||
Belrose Funding Trust 144A | 2.33 | 8-15-2030 | 285,000 | 281,451 | ||||||||||||
Blackrock Incorporated | 1.90 | 1-28-2031 | 55,000 | 57,031 | ||||||||||||
Cantor Fitzgerald LP 144A | 4.88 | 5-1-2024 | 670,000 | 733,106 | ||||||||||||
Five Corners Funding Trust 144A | 2.85 | 5-15-2030 | 100,000 | 107,861 | ||||||||||||
Five Corners Funding Trust 144A | 4.42 | 11-15-2023 | 10,000 | 11,111 | ||||||||||||
Goldman Sachs Group Incorporated | 3.63 | 1-22-2023 | 740,000 | 790,975 | ||||||||||||
Intercontinental Exchange | 3.00 | 6-15-2050 | 215,000 | 225,417 | ||||||||||||
Morgan Stanley | 3.13 | 7-27-2026 | 945,000 | 1,043,211 | ||||||||||||
The accompanying notes are an integral part of these financial statements.
12 | Wells Fargo Global Investment Grade Credit Fund
Table of Contents
Portfolio of investments—September 30, 2020
| Interest rate | Maturity date | Principal | Value | |||||||||||||
| Capital Markets (continued) | ||||||||||||||||
Morgan Stanley | 3.70 | % | 10-23-2024 | $ | 520,000 | $ | 576,342 | |||||||||
Raymond James Financial Services Incorporated | 4.65 | 4-1-2030 | 135,000 | 164,128 | ||||||||||||
Raymond James Financial Services Incorporated | 4.95 | 7-15-2046 | 435,000 | 561,437 | ||||||||||||
S&P Global Incorporated | 1.25 | 8-15-2030 | 155,000 | 152,381 | ||||||||||||
S&P Global Incorporated | 2.30 | 8-15-2060 | 140,000 | 125,372 | ||||||||||||
State Street Corporation | 2.40 | 1-24-2030 | 200,000 | 217,881 | ||||||||||||
| 5,047,704 | ||||||||||||||||
|
| |||||||||||||||
| Consumer Finance: 2.10% | ||||||||||||||||
American Express Credit Corporation | 3.30 | 5-3-2027 | 470,000 | 530,596 | ||||||||||||
Aviation Capital Group LLC 144A | 5.50 | 12-15-2024 | 510,000 | 526,094 | ||||||||||||
Harley Davidson Financial Services Company 144A | 3.35 | 6-8-2025 | 60,000 | 62,753 | ||||||||||||
Hyundai Capital America 144A | 1.80 | 10-15-2025 | 500,000 | 497,243 | ||||||||||||
| 1,616,686 | ||||||||||||||||
|
| |||||||||||||||
| Diversified Financial Services: 0.98% | ||||||||||||||||
Intercontinental Exchange Incorporated | 3.75 | 12-1-2025 | 670,000 | 756,563 | ||||||||||||
|
| |||||||||||||||
| Insurance: 2.70% | ||||||||||||||||
American International Group Incorporated | 4.75 | 4-1-2048 | 740,000 | 905,285 | ||||||||||||
Berkshire Hathaway Incorporated | 2.38 | 6-19-2039 | 100,000 | 144,801 | ||||||||||||
Brighthouse Financial Incorporated | 4.70 | 6-22-2047 | 390,000 | 372,944 | ||||||||||||
Empower Finance 2020 LP 144A | 1.78 | 3-17-2031 | 500,000 | 499,692 | ||||||||||||
Unum Group | 4.50 | 12-15-2049 | 160,000 | 154,731 | ||||||||||||
| 2,077,453 | ||||||||||||||||
|
| |||||||||||||||
Health Care: 3.00% |
| |||||||||||||||
| Biotechnology: 0.93% | ||||||||||||||||
AbbVie Incorporated 144A | 2.60 | 11-21-2024 | 405,000 | 429,498 | ||||||||||||
AbbVie Incorporated 144A | 4.25 | 11-21-2049 | 245,000 | 289,382 | ||||||||||||
| 718,880 | ||||||||||||||||
|
| |||||||||||||||
| Health Care Providers & Services: 1.10% | ||||||||||||||||
Anthem Incorporated | 2.25 | 5-15-2030 | 30,000 | 30,789 | ||||||||||||
CVS Health Corporation | 3.70 | 3-9-2023 | 192,000 | 205,662 | ||||||||||||
CVS Health Corporation | 4.25 | 4-1-2050 | 165,000 | 193,504 | ||||||||||||
CVS Health Corporation | 4.30 | 3-25-2028 | 180,000 | 210,568 | ||||||||||||
UnitedHealth Group Incorporated | 2.90 | 5-15-2050 | 195,000 | 203,221 | ||||||||||||
| 843,744 | ||||||||||||||||
|
| |||||||||||||||
| Life Sciences Tools & Services: 0.30% | ||||||||||||||||
Thermo Fisher Scientific Incorporated | 1.50 | 10-1-2039 | 200,000 | 233,941 | ||||||||||||
|
| |||||||||||||||
| Pharmaceuticals: 0.67% | ||||||||||||||||
Royalty Pharma plc 144A | 2.20 | 9-2-2030 | 515,000 | 511,990 | ||||||||||||
|
| |||||||||||||||
Industrials: 4.32% |
| |||||||||||||||
| Aerospace & Defense: 0.70% | ||||||||||||||||
United Technologies Corporation | 4.13 | 11-16-2028 | 455,000 | 538,455 | ||||||||||||
|
| |||||||||||||||
| Airlines: 0.91% | ||||||||||||||||
Aviation Capital Group Corporation 144A | 2.88 | 1-20-2022 | 430,000 | 426,721 | ||||||||||||
US Airways Group Incorporated | 4.63 | 12-3-2026 | 326,529 | 270,572 | ||||||||||||
| 697,293 | ||||||||||||||||
|
| |||||||||||||||
The accompanying notes are an integral part of these financial statements.
Wells Fargo Global Investment Grade Credit Fund | 13
Table of Contents
Portfolio of investments—September 30, 2020
| Interest rate | Maturity date | Principal | Value | |||||||||||||
| Industrial Conglomerates: 0.67% | ||||||||||||||||
General Electric Company | 3.63 | % | 5-1-2030 | $ | 495,000 | $ | 513,337 | |||||||||
|
| |||||||||||||||
| Machinery: 0.20% | ||||||||||||||||
Caterpillar Incorporated | 3.25 | 4-9-2050 | 95,000 | 106,438 | ||||||||||||
Deere & Company | 3.10 | 4-15-2030 | 40,000 | 45,759 | ||||||||||||
| 152,197 | ||||||||||||||||
|
| |||||||||||||||
| Professional Services: 0.72% | ||||||||||||||||
Equifax Incorporated | 2.60 | 12-1-2024 | 400,000 | 426,906 | ||||||||||||
Equifax Incorporated | 3.10 | 5-15-2030 | 120,000 | 130,647 | ||||||||||||
| 557,553 | ||||||||||||||||
|
| |||||||||||||||
| Road & Rail: 1.12% | ||||||||||||||||
Penske Truck Leasing Company LP 144A | 3.45 | 7-1-2024 | 405,000 | 438,328 | ||||||||||||
Union Pacific Corporation | 2.40 | 2-5-2030 | 390,000 | 419,507 | ||||||||||||
| 857,835 | ||||||||||||||||
|
| |||||||||||||||
Information Technology: 5.61% |
| |||||||||||||||
| Communications Equipment: 0.89% | ||||||||||||||||
Motorola Solutions Incorporated | 4.60 | 2-23-2028 | 590,000 | 688,518 | ||||||||||||
|
| |||||||||||||||
| Electronic Equipment, Instruments & Components: 0.32% | ||||||||||||||||
Jabil Incorporated | 3.60 | 1-15-2030 | 230,000 | 244,607 | ||||||||||||
|
| |||||||||||||||
| IT Services: 1.06% | ||||||||||||||||
Fiserv Incorporated | 2.65 | 6-1-2030 | 70,000 | 75,274 | ||||||||||||
Fiserv Incorporated | 3.50 | 7-1-2029 | 215,000 | 244,699 | ||||||||||||
Western Union Company | 4.25 | 6-9-2023 | 460,000 | 496,600 | ||||||||||||
| 816,573 | ||||||||||||||||
|
| |||||||||||||||
| Semiconductors & Semiconductor Equipment: 1.66% | ||||||||||||||||
Broadcom Incorporated | 3.15 | 11-15-2025 | 145,000 | 156,393 | ||||||||||||
Broadcom Incorporated | 4.15 | 11-15-2030 | 255,000 | 286,285 | ||||||||||||
Microchip Technology Incorporated 144A | 2.67 | 9-1-2023 | 230,000 | 238,093 | ||||||||||||
Qualcomm Incorporated | 3.25 | 5-20-2027 | 530,000 | 593,936 | ||||||||||||
| 1,274,707 | ||||||||||||||||
|
| |||||||||||||||
| Software: 0.12% | ||||||||||||||||
Oracle Corporation | 3.60 | 4-1-2050 | 85,000 | 94,777 | ||||||||||||
|
| |||||||||||||||
| Technology Hardware, Storage & Peripherals: 1.56% | ||||||||||||||||
Apple Incorporated | 2.95 | 9-11-2049 | 200,000 | 218,680 | ||||||||||||
Apple Incorporated | 3.60 | 7-31-2042 | 100,000 | 187,746 | ||||||||||||
Dell International LLC / EMC Corporation 144A | 5.45 | 6-15-2023 | 505,000 | 553,652 | ||||||||||||
Dell International LLC / EMC Corporation 144A | 6.20 | 7-15-2030 | 145,000 | 173,864 | ||||||||||||
NetApp Incorporated | 2.70 | 6-22-2030 | 60,000 | 62,083 | ||||||||||||
| 1,196,025 | ||||||||||||||||
|
| |||||||||||||||
Materials: 1.37% |
| |||||||||||||||
| Chemicals: 1.37% | ||||||||||||||||
Linde Incorporated | 1.10 | 8-10-2030 | 310,000 | 300,147 | ||||||||||||
Nutrition and Biosciences Incorporated 144A | 2.30 | 11-1-2030 | 520,000 | 523,348 | ||||||||||||
The accompanying notes are an integral part of these financial statements.
14 | Wells Fargo Global Investment Grade Credit Fund
Table of Contents
Portfolio of investments—September 30, 2020
| Interest rate | Maturity date | Principal | Value | |||||||||||||
| Chemicals (continued) | ||||||||||||||||
Westlake Chemical Corporation | 1.63 | % | 7-17-2029 | $ | 200,000 | $ | 230,415 | |||||||||
| 1,053,910 | ||||||||||||||||
|
| |||||||||||||||
Real Estate: 1.64% |
| |||||||||||||||
| Equity REITs: 0.83% | ||||||||||||||||
Equinix Incorporated | 2.15 | 7-15-2030 | 465,000 | 470,734 | ||||||||||||
Sabra Health Care LP / Sabra Capital Corporation | 4.80 | 6-1-2024 | 160,000 | 168,096 | ||||||||||||
| 638,830 | ||||||||||||||||
|
| |||||||||||||||
| Real Estate Management & Development: 0.81% | ||||||||||||||||
ACC Operating Partnership | 3.88 | 1-30-2031 | 210,000 | 229,155 | ||||||||||||
Simon Property Group LP | 3.25 | 9-13-2049 | 425,000 | 388,873 | ||||||||||||
| 618,028 | ||||||||||||||||
|
| |||||||||||||||
Utilities: 2.25% |
| |||||||||||||||
| Electric Utilities: 2.00% | ||||||||||||||||
Duke Energy Florida LLC | 1.75 | 6-15-2030 | 140,000 | 142,512 | ||||||||||||
Firstenergy Corporation | 2.25 | 9-1-2030 | 230,000 | 224,785 | ||||||||||||
Nevada Power Company | 2.40 | 5-1-2030 | 195,000 | 209,324 | ||||||||||||
New York State Electric & Gas Corporation 144A | 3.25 | 12-1-2026 | 220,000 | 247,316 | ||||||||||||
PacifiCorp | 3.50 | 6-15-2029 | 495,000 | 574,821 | ||||||||||||
Union Electric Company | 2.95 | 3-15-2030 | 125,000 | 140,471 | ||||||||||||
| 1,539,229 | ||||||||||||||||
|
| |||||||||||||||
| Multi-Utilities: 0.25% | ||||||||||||||||
Oglethorpe Power Corporation 144A | 3.75 | 8-1-2050 | 195,000 | 193,784 | ||||||||||||
|
| |||||||||||||||
Total Corporate Bonds and Notes (Cost $37,431,419) |
| 40,260,291 | ||||||||||||||
|
| |||||||||||||||
Foreign Corporate Bonds and Notes: 28.41% |
| |||||||||||||||
Communication Services: 1.01% |
| |||||||||||||||
| Diversified Telecommunication Services: 0.54% | ||||||||||||||||
Deutsche Telekom International Finance BV | 2.25 | 4-13-2029 | GBP | 300,000 | 413,478 | |||||||||||
|
| |||||||||||||||
| Wireless Telecommunication Services: 0.47% | ||||||||||||||||
Rogers Communications Incorporated | 5.34 | 3-22-2021 | CAD | 300,000 | 230,359 | |||||||||||
Tele2 AB | 2.13 | 5-15-2028 | EUR | 100,000 | 129,052 | |||||||||||
| 359,411 | ||||||||||||||||
|
| |||||||||||||||
Consumer Discretionary: 0.33% |
| |||||||||||||||
| Textiles, Apparel & Luxury Goods: 0.33% | ||||||||||||||||
Burberry Group plc | 1.13 | 9-21-2025 | GBP | 200,000 | 255,950 | |||||||||||
|
| |||||||||||||||
Consumer Staples: 0.48% |
| |||||||||||||||
| Beverages: 0.17% | ||||||||||||||||
Coca-Cola European Partners plc | 1.50 | 11-8-2027 | EUR | 100,000 | 127,708 | |||||||||||
|
| |||||||||||||||
| Food & Staples Retailing: 0.31% | ||||||||||||||||
Tesco Corporate Treasury Services plc | 0.88 | 5-29-2026 | EUR | 200,000 | 238,508 | |||||||||||
|
| |||||||||||||||
The accompanying notes are an integral part of these financial statements.
Wells Fargo Global Investment Grade Credit Fund | 15
Table of Contents
Portfolio of investments—September 30, 2020
| Interest rate | Maturity date | Principal | Value | |||||||||||||
Energy: 1.14% |
| |||||||||||||||
| Oil, Gas & Consumable Fuels: 1.14% | ||||||||||||||||
Shell International Finance BV | 1.00 | % | 12-10-2030 | GBP | 500,000 | $ | 637,302 | |||||||||
Total SA (EUR Swap Annual (vs. 6 Month EURIBOR) 5 Year +2.75%) ± | 2.71 | 12-29-2049 | EUR | 200,000 | 242,395 | |||||||||||
| 879,697 | ||||||||||||||||
|
| |||||||||||||||
Financials: 15.93% |
| |||||||||||||||
| Banks: 8.38% | ||||||||||||||||
Argenta Spaarbank NV (EUR Swap Annual (vs. 6 Month EURIBOR) 5 Year +3.95%) ± | 3.88 | 5-24-2026 | EUR | 200,000 | 238,031 | |||||||||||
Banco BPM SpA | 2.50 | 6-21-2024 | EUR | 200,000 | 239,436 | |||||||||||
Banco de Sabadell SA | 1.13 | 3-27-2025 | EUR | 200,000 | 224,545 | |||||||||||
Bankia SA | 1.13 | 11-12-2026 | EUR | 100,000 | 117,285 | |||||||||||
Bankinter SA | 0.63 | 10-6-2027 | EUR | 200,000 | 229,046 | |||||||||||
Banque Federative du Credit Mutuel | 3.00 | 5-21-2024 | EUR | 200,000 | 255,141 | |||||||||||
Barclays plc (GBP Swap Semi Annual (vs. 6 Month LIBOR) 1 Year +1.32%) ± | 2.38 | 10-6-2023 | GBP | 100,000 | 131,728 | |||||||||||
Bawag Group AG (EUR Swap Annual (vs. 6 Month EURIBOR) 5 Year +2.30%) ± | 2.38 | 3-26-2029 | EUR | 100,000 | 119,751 | |||||||||||
BNP Paribas | 1.25 | 3-19-2025 | EUR | 300,000 | 366,034 | |||||||||||
Caixabank SA | 0.63 | 10-1-2024 | EUR | 100,000 | 116,307 | |||||||||||
Credit Agricole Assurances | 2.00 | 7-17-2030 | EUR | 300,000 | 358,384 | |||||||||||
FCA Bank SpA | 1.63 | 9-29-2021 | GBP | 100,000 | 128,983 | |||||||||||
Jyske Bank AS (EUR Swap Annual (vs. 6 Month EURIBOR) 5 Year +1.90%) ± | 2.25 | 4-5-2029 | EUR | 300,000 | 361,101 | |||||||||||
Kutxabank SA | 0.50 | 9-25-2024 | EUR | 100,000 | 116,408 | |||||||||||
Landesbank Baden-Wurttemberg (EUR Swap Annual (vs. 6 Month EURIBOR) 5 Year +1.77%) ± | 2.88 | 5-27-2026 | EUR | 100,000 | 116,511 | |||||||||||
Landsbankinn HF | 1.38 | 3-14-2022 | EUR | 100,000 | 119,181 | |||||||||||
Lloyds Banking Group plc (EUR Swap Annual (vs. 6 Month EURIBOR) 1 Year +0.85%) ± | 0.50 | 11-12-2025 | EUR | 200,000 | 233,334 | |||||||||||
Lloyds Banking Group plc | 2.25 | 10-16-2024 | GBP | 100,000 | 133,420 | |||||||||||
Mizuho Financial Group | 0.80 | 4-15-2030 | EUR | 400,000 | 475,766 | |||||||||||
NIBC Bank NV | 2.00 | 4-9-2024 | EUR | 200,000 | 236,997 | |||||||||||
Raiffeisen Bank International AG (EURIBOR ICE Swap Rate 11:00am +3.15%) ± | 2.88 | 6-18-2032 | EUR | 200,000 | 240,124 | |||||||||||
Royal Bank of Canada | 1.97 | 3-2-2022 | CAD | 200,000 | 153,266 | |||||||||||
Royal Bank of Canada | 2.00 | 3-21-2022 | CAD | 400,000 | 306,936 | |||||||||||
Royal Bank of Scotland Group plc (GBP Swap Semi Annual (vs. 6 Month LIBOR) 1 Year +1.49%) ± | 2.88 | 9-19-2026 | GBP | 200,000 | 272,294 | |||||||||||
Toronto Dominion Bank | 3.23 | 7-24-2024 | CAD | 1,000,000 | 818,392 | |||||||||||
Unicaja Banco SA (EUR Swap Annual (vs. 6 Month EURIBOR) 5 Year +3.11%) ± | 2.88 | 11-13-2029 | EUR | 100,000 | 111,383 | |||||||||||
Unicredit SpA (EUR Swap Annual (vs. 6 Month EURIBOR) 5 Year +2.80%) ± | 2.73 | 1-15-2032 | EUR | 200,000 | 221,007 | |||||||||||
| 6,440,791 | ||||||||||||||||
|
| |||||||||||||||
| Capital Markets: 1.74% | ||||||||||||||||
Credit Suisse Group AG (UK Gilts 1 Year +2.23%) ± | 2.25 | 6-9-2028 | GBP | 300,000 | 397,224 | |||||||||||
Deutsche Bank AG | 0.38 | 1-18-2021 | EUR | 200,000 | 234,607 | |||||||||||
Phoenix PIB Dutch Finance BV | 2.38 | 8-5-2025 | EUR | 200,000 | 236,206 | |||||||||||
UBS Group AG (EUR Swap Annual (vs. 6 Month EURIBOR) 1 Year +0.55%) ± | 0.25 | 1-29-2026 | EUR | 400,000 | 468,834 | |||||||||||
| 1,336,871 | ||||||||||||||||
|
| |||||||||||||||
| Consumer Finance: 1.24% | ||||||||||||||||
LeasePlan Corporation NV | 1.38 | 3-7-2024 | EUR | 200,000 | 236,807 | |||||||||||
PSA Banque France | 0.63 | 6-21-2024 | EUR | 300,000 | 354,312 | |||||||||||
Transurban Finance Company | 1.75 | 3-29-2028 | EUR | 300,000 | 367,006 | |||||||||||
| 958,125 | ||||||||||||||||
|
| |||||||||||||||
The accompanying notes are an integral part of these financial statements.
16 | Wells Fargo Global Investment Grade Credit Fund
Table of Contents
Portfolio of investments—September 30, 2020
| Interest rate | Maturity date | Principal | Value | |||||||||||||
| Diversified Financial Services: 1.41% | ||||||||||||||||
Bevco Lux Sarl | 1.75 | % | 2-9-2023 | EUR | 300,000 | $ | 359,541 | |||||||||
Nykredit Realkredit AS | 0.88 | 1-17-2024 | EUR | 300,000 | 358,425 | |||||||||||
SELP Finance Sarl | 1.50 | 11-20-2025 | EUR | 300,000 | 363,287 | |||||||||||
| 1,081,253 | ||||||||||||||||
|
| |||||||||||||||
| Insurance: 2.86% | ||||||||||||||||
Aviva plc (EUR Swap Annual (vs. 6 Month EURIBOR) 5 Year +5.13%) ± | 6.13 | 7-5-2043 | EUR | 100,000 | 132,926 | |||||||||||
Aviva plc (ICE LIBOR GBP 6 Month +4.14%) ± | 6.63 | 6-3-2041 | GBP | 200,000 | 266,934 | |||||||||||
Legal & General Group plc (U.S. Treasury 3 Month Bill +9.33%) ± | 10.00 | 7-23-2041 | GBP | 200,000 | 276,457 | |||||||||||
Mandatum Life Insurance Company Limited (3 Month EURIBOR +2.30%) ± | 1.88 | 10-4-2049 | EUR | 300,000 | 350,820 | |||||||||||
Munich Re Group (ICE LIBOR GBP 3 Month +4.95%) ± | 6.63 | 5-26-2042 | GBP | 200,000 | 280,687 | |||||||||||
Sampo Oyj | 1.63 | 2-21-2028 | EUR | 200,000 | 256,999 | |||||||||||
Sampo Oyj (3 Month EURIBOR +4.05%) ± | 3.38 | 5-23-2049 | EUR | 200,000 | 258,599 | |||||||||||
Swiss Re Finance (Luxembourg) SA (EURIBOR ICE Swap Rate 11:00am +2.85%) ± | 2.53 | 4-30-2050 | EUR | 300,000 | 375,491 | |||||||||||
| 2,198,913 | ||||||||||||||||
|
| |||||||||||||||
| Thrifts & Mortgage Finance: 0.30% | ||||||||||||||||
Aareal Bank AG (EUR Swap Annual (vs. 6 Month EURIBOR) 5 Year +2.90%) ± | 4.25 | 3-18-2026 | EUR | 200,000 | 230,914 | |||||||||||
|
| |||||||||||||||
Health Care: 2.13% |
| |||||||||||||||
| Biotechnology: 0.76% | ||||||||||||||||
GlaxoSmithKline Capital Incorporated | 1.63 | 5-12-2035 | GBP | 250,000 | 329,000 | |||||||||||
Lonza Finance International NV | 1.63 | 4-21-2027 | EUR | 200,000 | 251,453 | |||||||||||
| 580,453 | ||||||||||||||||
|
| |||||||||||||||
| Health Care Equipment & Supplies: 0.28% | ||||||||||||||||
Motability Operations Group plc | 2.38 | 7-3-2039 | GBP | 150,000 | 218,225 | |||||||||||
|
| |||||||||||||||
| Health Care Providers & Services: 0.48% | ||||||||||||||||
Fresenius Medical Care AG & Company | 1.50 | 5-29-2030 | EUR | 300,000 | 369,191 | |||||||||||
|
| |||||||||||||||
| Pharmaceuticals: 0.61% | ||||||||||||||||
Bayer AG (EURIBOR ICE Swap Rate 11:00am +2.65%) ± | 2.38 | 11-12-2079 | EUR | 100,000 | 115,256 | |||||||||||
Bayer AG (EUR Swap Annual (vs. 6 Month EURIBOR) 5 Year +3.11%) ± | 3.13 | 11-12-2079 | EUR | 100,000 | 118,029 | |||||||||||
Merck KGaA (EURIBOR ICE Swap Rate 11:00am +1.95%) ± | 1.63 | 6-25-2079 | EUR | 200,000 | 236,017 | |||||||||||
| 469,302 | ||||||||||||||||
|
| |||||||||||||||
Industrials: 0.48% |
| |||||||||||||||
| Aerospace & Defense: 0.32% | ||||||||||||||||
MTU Aero Engines AG | 3.00 | 7-1-2025 | EUR | 200,000 | 245,187 | |||||||||||
|
| |||||||||||||||
| Containers & Packaging: 0.16% | ||||||||||||||||
Brambles Finance plc | 1.50 | 10-4-2027 | EUR | 100,000 | 122,405 | |||||||||||
|
| |||||||||||||||
Information Technology: 0.63% |
| |||||||||||||||
| IT Services: 0.47% | ||||||||||||||||
Edenred Company | 1.38 | 6-18-2029 | EUR | 300,000 | 363,888 | |||||||||||
|
| |||||||||||||||
| Semiconductors & Semiconductor Equipment: 0.16% | ||||||||||||||||
ASML Holding NV | 0.63 | 5-7-2029 | EUR | 100,000 | 120,780 | |||||||||||
|
| |||||||||||||||
Materials: 2.05% |
| |||||||||||||||
| Chemicals: 1.73% | ||||||||||||||||
Arkema SA (EUR Swap Annual (vs. 6 Month EURIBOR) 5 Year +1.57%) ± | 1.50 | 12-31-2099 | EUR | 200,000 | 223,374 | |||||||||||
Arkema SA (EUR Swap Annual (vs. 6 Month EURIBOR) 5 Year +2.87%) ± | 2.75 | 12-31-2099 | EUR | 300,000 | 358,858 | |||||||||||
The accompanying notes are an integral part of these financial statements.
Wells Fargo Global Investment Grade Credit Fund | 17
Table of Contents
Portfolio of investments—September 30, 2020
| Interest rate | Maturity date | Principal | Value | |||||||||||||
| Chemicals (continued) | ||||||||||||||||
Covestro AG | 0.88 | % | 2-3-2026 | EUR | 100,000 | $ | 118,380 | |||||||||
Sika Capital BV | 1.50 | 4-29-2031 | EUR | 100,000 | 128,747 | |||||||||||
Solvay SA (EUR Swap Annual (vs. 6 Month EURIBOR) 5 Year +3.92%) ± | 4.25 | 12-31-2099 | EUR | 200,000 | 246,214 | |||||||||||
Syngenta Finance NV | 3.38 | 4-16-2026 | EUR | 200,000 | 251,659 | |||||||||||
| 1,327,232 | ||||||||||||||||
|
| |||||||||||||||
| Paper & Forest Products: 0.32% | ||||||||||||||||
Mondi Finance plc | 1.63 | 4-27-2026 | EUR | 200,000 | 250,182 | |||||||||||
|
| |||||||||||||||
Real Estate: 1.37% |
| |||||||||||||||
| Equity REITs: 0.16% | ||||||||||||||||
Inmobiliaria Colonial SA | 1.45 | 10-28-2024 | EUR | 100,000 | 120,613 | |||||||||||
|
| |||||||||||||||
| Real Estate Management & Development: 1.21% | ||||||||||||||||
Akelius Residential Property AB (EUR Swap Annual (vs. 6 Month EURIBOR) 5 Year +2.48%) ± | 2.25 | 5-17-2081 | EUR | 200,000 | 221,673 | |||||||||||
Akelius Residential Property AB (EUR Swap Annual (vs. 6 Month EURIBOR) 5 Year +3.49%) ± | 3.88 | 10-5-2078 | EUR | 200,000 | 240,938 | |||||||||||
Heimstaden Bostad AB | 1.13 | 1-21-2026 | EUR | 200,000 | 233,929 | |||||||||||
Heimstaden Bostad AB | 1.38 | 3-3-2027 | EUR | 200,000 | 235,180 | |||||||||||
| 931,720 | ||||||||||||||||
|
| |||||||||||||||
Utilities: 2.86% |
| |||||||||||||||
| Electric Utilities: 2.25% | ||||||||||||||||
Electricite de France SA (EUR Swap Annual (vs. 6 Month EURIBOR) 5 Year +3.37%) ± | 2.88 | 12-31-2099 | EUR | 200,000 | 228,757 | |||||||||||
Electricite de France SA | 5.50 | 10-17-2041 | GBP | 200,000 | 379,130 | |||||||||||
Enel Finance International NV | 0.38 | 6-17-2027 | EUR | 100,000 | 117,691 | |||||||||||
ESB Finance Designated Activity Company | 1.13 | 6-11-2030 | EUR | 200,000 | 252,016 | |||||||||||
Fortum Oyj | 0.88 | 2-27-2023 | EUR | 200,000 | 238,696 | |||||||||||
Orsted A/S (EURIBOR ICE Swap Rate 11:00am +1.95%) ± | 1.75 | 12-9-2099 | EUR | 200,000 | 234,315 | |||||||||||
Reseau de Transport d’Electricite | 1.88 | 10-23-2037 | EUR | 200,000 | 281,140 | |||||||||||
| 1,731,745 | ||||||||||||||||
|
| |||||||||||||||
| Gas Utilities: 0.30% | ||||||||||||||||
APT Pipelines Limited | 2.00 | 7-15-2030 | EUR | 180,000 | 228,403 | |||||||||||
|
| |||||||||||||||
| Water Utilities: 0.31% | ||||||||||||||||
FCC Aqualia SA | 1.41 | 6-8-2022 | EUR | 200,000 | 237,392 | |||||||||||
|
| |||||||||||||||
Total Foreign Corporate Bonds and Notes (Cost $20,739,012) |
| 21,838,337 | ||||||||||||||
|
| |||||||||||||||
Municipal Obligations: 0.31% |
| |||||||||||||||
New Jersey: 0.31% |
| |||||||||||||||
| Transportation Revenue: 0.31% | ||||||||||||||||
New Jersey State Transportation Trust Fund Authority Transportation System Refunding Bond Series B | 4.13 | 6-15-2042 | $ | 250,000 | 238,265 | |||||||||||
|
| |||||||||||||||
Total Municipal Obligations (Cost $250,000) |
| 238,265 | ||||||||||||||
|
| |||||||||||||||
U.S. Treasury Securities: 0.97% |
| |||||||||||||||
U.S. Treasury Bond | 2.00 | 2-15-2050 | 635,000 | 718,245 | ||||||||||||
U.S. Treasury Note | 0.63 | 5-15-2030 | 30,000 | 29,892 | ||||||||||||
Total U.S. Treasury Securities (Cost $740,924) |
| 748,137 | ||||||||||||||
|
| |||||||||||||||
The accompanying notes are an integral part of these financial statements.
18 | Wells Fargo Global Investment Grade Credit Fund
Table of Contents
Portfolio of investments—September 30, 2020
| Interest rate | Maturity date | Principal | Value | |||||||||||||
Yankee Corporate Bonds and Notes: 13.76% |
| |||||||||||||||
Communication Services: 2.41% |
| |||||||||||||||
| Diversified Telecommunication Services: 0.59% | ||||||||||||||||
Telefonica Emisiones SAU | 4.10 | % | 3-8-2027 | $ | 400,000 | $ | 454,766 | |||||||||
|
| |||||||||||||||
| Interactive Media & Services: 0.98% | ||||||||||||||||
Tencent Holdings Limited 144A | 3.60 | 1-19-2028 | 685,000 | 753,774 | ||||||||||||
|
| |||||||||||||||
| Wireless Telecommunication Services: 0.84% | ||||||||||||||||
Vodafone Group plc | 4.38 | 5-30-2028 | 545,000 | 644,978 | ||||||||||||
|
| |||||||||||||||
Consumer Discretionary: 0.68% |
| |||||||||||||||
| Automobiles: 0.68% | ||||||||||||||||
Nissan Motor Company 144A | 3.52 | 9-17-2025 | 260,000 | 262,728 | ||||||||||||
Nissan Motor Company 144A | 4.35 | 9-17-2027 | 260,000 | 261,026 | ||||||||||||
| 523,754 | ||||||||||||||||
|
| |||||||||||||||
Consumer Staples: 0.91% |
| |||||||||||||||
| Household Products: 0.77% | ||||||||||||||||
Reckitt Benckiser Treasury Services plc 144A | 2.75 | 6-26-2024 | 555,000 | 590,815 | ||||||||||||
|
| |||||||||||||||
| Tobacco: 0.14% | ||||||||||||||||
Imperial Brands Finance plc 144A | 3.50 | 7-26-2026 | 100,000 | 108,158 | ||||||||||||
|
| |||||||||||||||
Energy: 0.51% |
| |||||||||||||||
| Oil, Gas & Consumable Fuels: 0.51% | ||||||||||||||||
BP Capital Markets plc (EUR Swap Annual (vs. 6 Month EURIBOR) 5 Year +3.88%) ±(s) | 3.25 | 3-22-2026 | 100,000 | 120,395 | ||||||||||||
BP Capital Markets plc (U.S. Treasury 3 Month Bill +4.17%) ±(s) | 4.25 | 3-22-2027 | 100,000 | 135,164 | ||||||||||||
Equinor ASA | 2.38 | 5-22-2030 | 45,000 | 47,556 | ||||||||||||
Saudi Arabian Oil Company 144A | 4.38 | 4-16-2049 | 75,000 | 90,167 | ||||||||||||
| 393,282 | ||||||||||||||||
|
| |||||||||||||||
Financials: 7.66% |
| |||||||||||||||
| Banks: 4.95% | ||||||||||||||||
Banco Santander SA | 3.49 | 5-28-2030 | 400,000 | 435,106 | ||||||||||||
Credit Suisse New York | 3.63 | 9-9-2024 | 580,000 | 641,961 | ||||||||||||
HSBC Holdings plc (U.S. SOFR +2.39%) ± | 2.85 | 6-4-2031 | 200,000 | 206,936 | ||||||||||||
HSBC Holdings plc | 4.30 | 3-8-2026 | 430,000 | 485,091 | ||||||||||||
Mitsubishi UFJ Financial Group Incorporated | 2.56 | 2-25-2030 | 200,000 | 210,076 | ||||||||||||
National Australia Bank 144A | 2.33 | 8-21-2030 | 260,000 | 257,003 | ||||||||||||
NatWest Group plc | 3.88 | 9-12-2023 | 490,000 | 526,240 | ||||||||||||
Sumitomo Mitsui Financial Group | 2.13 | 7-8-2030 | 200,000 | 203,079 | ||||||||||||
Sumitomo Mitsui Financial Group | 3.10 | 1-17-2023 | 365,000 | 385,335 | ||||||||||||
Westpac Banking Corporation (5 Year Treasury Constant Maturity +1.35%) ± | 2.89 | 2-4-2030 | 105,000 | 108,797 | ||||||||||||
Westpac Banking Corporation | 3.65 | 5-15-2023 | 320,000 | 346,195 | ||||||||||||
| 3,805,819 | ||||||||||||||||
|
| |||||||||||||||
| Capital Markets: 0.67% | ||||||||||||||||
Credit Suisse Group AG (U.S. SOFR +3.73%) 144A± | 4.19 | 4-1-2031 | 250,000 | 288,434 | ||||||||||||
Macquarie Group Limited (3 Month LIBOR +1.02%) 144A± | 3.19 | 11-28-2023 | 220,000 | 230,040 | ||||||||||||
| 518,474 | ||||||||||||||||
|
| |||||||||||||||
The accompanying notes are an integral part of these financial statements.
Wells Fargo Global Investment Grade Credit Fund | 19
Table of Contents
Portfolio of investments—September 30, 2020
| Interest rate | Maturity date | Principal | Value | |||||||||||||
| Consumer Finance: 0.42% | ||||||||||||||||
AerCap Ireland Capital DAC | 4.50 | % | 9-15-2023 | $ | 310,000 | $ | 319,373 | |||||||||
|
| |||||||||||||||
| Diversified Financial Services: 1.32% | ||||||||||||||||
GE Capital International Funding Company | 4.42 | 11-15-2035 | 280,000 | 295,916 | ||||||||||||
Siemens Financieringsmaatschappij NV 144A | 2.35 | 10-15-2026 | 380,000 | 407,602 | ||||||||||||
WPP Finance 2010 | 3.75 | 9-19-2024 | 280,000 | 307,315 | ||||||||||||
| 1,010,833 | ||||||||||||||||
|
| |||||||||||||||
| Insurance: 0.30% | ||||||||||||||||
Allied World Assurance Company Holdings Limited | 4.35 | 10-29-2025 | 216,000 | 233,815 | ||||||||||||
|
| |||||||||||||||
Health Care: 0.44% |
| |||||||||||||||
| Pharmaceuticals: 0.44% | ||||||||||||||||
Astrazeneca plc | 1.38 | 8-6-2030 | 345,000 | 335,587 | ||||||||||||
|
| |||||||||||||||
Information Technology: 0.79% |
| |||||||||||||||
| Semiconductors & Semiconductor Equipment: 0.79% | ||||||||||||||||
NXP BV 144A | 3.40 | 5-1-2030 | 130,000 | 142,210 | ||||||||||||
NXP BV 144A | 3.88 | 6-18-2026 | 415,000 | 464,933 | ||||||||||||
| 607,143 | ||||||||||||||||
|
| |||||||||||||||
| Real Estate: 0.36% | ||||||||||||||||
Scentre Group Trust 2 Company (5 Year Treasury Constant Maturity +4.69%) 144A± | 5.13 | 9-24-2080 | 285,000 | 279,798 | ||||||||||||
|
| |||||||||||||||
Total Yankee Corporate Bonds and Notes (Cost $9,949,048) |
| 10,580,369 | ||||||||||||||
|
| |||||||||||||||
| Yield | Shares | |||||||||||||||
| Short-Term Investments: 1.51% | ||||||||||||||||
| Investment Companies: 1.51% | ||||||||||||||||
Wells Fargo Government Money Market Fund Select Class (l)(u)## | 0.05 | 1,157,095 | 1,157,095 | |||||||||||||
|
| |||||||||||||||
Total Short-Term Investments (Cost $1,157,095) |
| 1,157,095 | ||||||||||||||
|
| |||||||||||||||
| Total investments in securities (Cost $71,589,071) | 98.94 | % | 76,060,819 | |||||
Other assets and liabilities, net | 1.06 | 813,926 | ||||||
|
|
|
| |||||
| Total net assets | 100.00 | % | $ | 76,874,745 | ||||
|
|
|
| |||||
| 144A | The security may be resold in transactions exempt from registration, normally to qualified institutional buyers, pursuant to Rule 144A under the Securities Act of 1933. |
| %% | The security is purchased on a when-issued basis. |
| ± | Variable rate investment. The rate shown is the rate in effect at period end. |
| (s) | Security is perpetual in nature and has no stated maturity date. The date shown reflects the next call date. |
| (l) | The issuer of the security is an affiliated person of the Fund as defined in the Investment Company Act of 1940. |
| (u) | The rate represents the 7-day annualized yield at period end. |
| ## | All or a portion of this security is segregated for when-issued securities. |
Abbreviations:
| CAD | Canadian dollar |
| EUR | Euro |
| EURIBOR | Euro Interbank Offered Rate |
| GBP | Great British pound |
| LIBOR | London Interbank Offered Rate |
| REIT | Real estate investment trust |
| SOFR | Secured Overnight Financing Rate |
The accompanying notes are an integral part of these financial statements.
20 | Wells Fargo Global Investment Grade Credit Fund
Table of Contents
Portfolio of investments—September 30, 2020
Futures Contracts
| Description | Number of contracts | Expiration date | Notional cost | Notional value | Unrealized gains | Unrealized losses | ||||||||||||||||||
Long | ||||||||||||||||||||||||
Euro-Bund Futures | 3 | 12-8-2020 | $ | 611,918 | $ | 613,848 | $ | 1,930 | $ | 0 | ||||||||||||||
Forward Foreign Currency Contracts
| Currency to be received | Currency to be delivered | Counterparty | Settlement date | Unrealized gains | Unrealized losses | |||||||||
| 18,302,058 USD | 15,450,000 EUR | State Street Bank | 10-28-2020 | $ | 177,989 | $ | 0 | |||||||
| 1,511,672 USD | 1,996,351 CAD | State Street Bank | 10-28-2020 | 12,279 | 0 | |||||||||
| 4,664,554 USD | 3,610,000 GBP | State Street Bank | 10-28-2020 | 5,763 | 0 | |||||||||
|
|
|
| |||||||||||
| $ | 196,031 | $ | 0 | |||||||||||
|
|
|
| |||||||||||
Investments in Affiliates
An affiliated investment is an investment in which the Fund owns at least 5% of the outstanding voting shares of the issuer or as a result of other relationships, such as the Fund and the issuer having the same investment manager. Transactions with issuers that were either affiliated persons of the Fund at the beginning of the period or the end of the period were as follows:
| Value, beginning of period | Purchases | Sales proceeds | Net realized gains (losses) | Net change in unrealized gains (losses) | Income from affiliated securities | Value, end of priod | % of net assets | |||||||||||||||||||||||||
| Short-Term Investments | ||||||||||||||||||||||||||||||||
Investment Companies | ||||||||||||||||||||||||||||||||
Wells Fargo Government Money Market Fund Select Class | $ | 1,834,198 | $ | 40,722,031 | $ | (41,399,134 | ) | $ | 0 | $ | 0 | $ | 6,480 | $ | 1,157,095 | 1.51 | % | |||||||||||||||
The accompanying notes are an integral part of these financial statements.
Wells Fargo Global Investment Grade Credit Fund | 21
Table of Contents
Statement of assets and liabilities—September 30, 2020
Assets | ||||
Investments in unaffiliated securities, at value (cost $70,431,976) | $ | 74,903,724 | ||
Investments in affiliated securities, at value (cost $1,157,095) | 1,157,095 | |||
Foreign currency, at value (cost $180,329) | 180,786 | |||
Segregated cash for futures contracts | 9,176 | |||
Receivable for investments sold | 140,214 | |||
Receivable for interest | 664,019 | |||
Unrealized gains on forward foreign currency contracts | 196,031 | |||
|
| |||
Total assets | 77,251,045 | |||
|
| |||
Liabilities | ||||
Payable for when-issued transactions | 234,514 | |||
Payable for Fund shares redeemed | 46,238 | |||
Payable for daily variation margin on open futures contracts | 1,126 | |||
Management fee payable | 12,562 | |||
Administration fees payable | 1,902 | |||
Trustees’ fees and expenses payable | 2,951 | |||
Accrued expenses and other liabilities | 77,007 | |||
|
| |||
Total liabilities | 376,300 | |||
|
| |||
Total net assets | $ | 76,874,745 | ||
|
| |||
Net assets consist of | ||||
Paid-in capital | $ | 71,502,047 | ||
Total distributable earnings | 5,372,698 | |||
|
| |||
Total net assets | $ | 76,874,745 | ||
|
| |||
Computation of net asset value per share | ||||
Net assets – Class R6 | $ | 76,847,470 | ||
Shares outstanding – Class R61 | 7,044,446 | |||
Net asset value per share – Class R6 | $10.91 | |||
Net assets – Institutional Class | $ | 27,275 | ||
Shares outstanding – Institutional Class1 | 2,500 | |||
Net asset value per share – Institutional Class | $10.91 | |||
| 1 | The Fund has an unlimited number of authorized shares. |
The accompanying notes are an integral part of these financial statements.
22 | Wells Fargo Global Investment Grade Credit Fund
Table of Contents
Statement of operations—year ended September 30, 2020
Investment income | ||||
Interest | $ | 1,980,917 | ||
Income from affiliated securities | 6,480 | |||
|
| |||
Total investment income | 1,987,397 | |||
|
| |||
Expenses | ||||
Management fee | 290,645 | |||
Administration fees | ||||
Class R6 | 21,790 | |||
Institutional Class | 22 | |||
Custody and accounting fees | 33,579 | |||
Professional fees | 76,558 | |||
Registration fees | 58,196 | |||
Shareholder report expenses | 36,953 | |||
Trustees’ fees and expenses | 20,550 | |||
Other fees and expenses | 23,623 | |||
|
| |||
Total expenses | 561,916 | |||
Less: Fee waivers and/or expense reimbursements | ||||
Fund-level | (234,926 | ) | ||
Institutional Class | (1 | ) | ||
|
| |||
Net expenses | 326,989 | |||
|
| |||
Net investment income | 1,660,408 | |||
|
| |||
Realized and unrealized gains (losses) on investments | ||||
Net realized gains (losses) on | ||||
Unaffiliated securities | 1,946,903 | |||
Futures contracts | 1,355 | |||
Forward foreign currency contracts | (1,395,236 | ) | ||
|
| |||
Net realized gains on investments | 553,022 | |||
|
| |||
Net change in unrealized gains (losses) on | ||||
Unaffiliated securities | 2,076,369 | |||
Futures contracts | 1,930 | |||
Forward foreign currency contracts | (215,534 | ) | ||
|
| |||
Net change in unrealized gains (losses) on investments | 1,862,765 | |||
|
| |||
Net realized and unrealized gains (losses) on investments | 2,415,787 | |||
|
| |||
Net increase in net assets resulting from operations | $ | 4,076,195 | ||
|
| |||
The accompanying notes are an integral part of these financial statements.
Wells Fargo Global Investment Grade Credit Fund | 23
Table of Contents
Statement of changes in net assets
| Year ended September 30, 2020 | Year ended September 30, 20191 | |||||||||||||||
Operations | ||||||||||||||||
Net investment income | $ | 1,660,408 | $ | 891,407 | ||||||||||||
Net realized gains on investments | 553,022 | 1,479,319 | ||||||||||||||
Net change in unrealized gains (losses) on investments | 1,862,765 | 2,812,716 | ||||||||||||||
|
| |||||||||||||||
Net increase in net assets resulting from operations | 4,076,195 | 5,183,442 | ||||||||||||||
|
| |||||||||||||||
Distributions to shareholders from net investment income and net realized gains | ||||||||||||||||
Class R6 | (3,157,773 | ) | (727,723 | ) | ||||||||||||
Institutional Class | (1,164 | ) | (279 | ) | ||||||||||||
|
| |||||||||||||||
Total distributions to shareholders | (3,158,937 | ) | (728,002 | ) | ||||||||||||
|
| |||||||||||||||
Capital share transactions | Shares | Shares | ||||||||||||||
Proceeds from shares sold | ||||||||||||||||
Class R6 | 2,217,342 | 23,933,431 | 9,630,811 | 99,080,247 | ||||||||||||
Institutional Class | 0 | 0 | 2,500 | 25,000 | ||||||||||||
|
| |||||||||||||||
| 23,933,431 | 99,105,247 | |||||||||||||||
|
| |||||||||||||||
Reinvestment of distributions | ||||||||||||||||
Class R6 | 197,523 | 2,091,911 | 20,783 | 222,474 | ||||||||||||
|
| |||||||||||||||
Payment for shares redeemed | ||||||||||||||||
Class R6 | (4,376,341 | ) | (46,930,121 | ) | (645,672 | ) | (6,920,895 | ) | ||||||||
|
| |||||||||||||||
Net increase (decrease) in net assets resulting from capital share transactions | (20,904,779 | ) | 92,406,826 | |||||||||||||
|
| |||||||||||||||
Total increase (decrease) in net assets | (19,987,521 | ) | 96,862,266 | |||||||||||||
|
| |||||||||||||||
Net assets | ||||||||||||||||
Beginning of period | 96,862,266 | 0 | ||||||||||||||
|
| |||||||||||||||
End of period | $ | 76,874,745 | $ | 96,862,266 | ||||||||||||
|
| |||||||||||||||
| 1 | For the period from February 28, 2019 (commencement of operations) to September 30, 2019 |
The accompanying notes are an integral part of these financial statements.
24 | Wells Fargo Global Investment Grade Credit Fund
Table of Contents
(For a share outstanding throughout each period)
| Year ended September 30 | ||||||||
| CLASS R6 | 2020 | 20191 | ||||||
Net asset value, beginning of period | $10.75 | $10.00 | ||||||
Net investment income | 0.24 | 2 | 0.13 | |||||
Net realized and unrealized gains (losses) on investments | 0.39 | 0.73 | ||||||
|
|
|
| |||||
Total from investment operations | 0.63 | 0.86 | ||||||
Distributions to shareholders from | ||||||||
Net investment income | (0.34 | ) | (0.11 | ) | ||||
Net realized gains | (0.13 | ) | 0.00 | |||||
|
|
|
| |||||
Total distributions to shareholders | (0.47 | ) | (0.11 | ) | ||||
Net asset value, end of period | $10.91 | $10.75 | ||||||
Total return3 | 6.10 | % | 8.64 | % | ||||
Ratios to average net assets (annualized) | ||||||||
Gross expenses | 0.77 | % | 0.86 | % | ||||
Net expenses | 0.45 | % | 0.45 | % | ||||
Net investment income | 2.29 | % | 2.34 | % | ||||
Supplemental data | ||||||||
Portfolio turnover rate | 79 | % | 36 | % | ||||
Net assets, end of period (000s omitted) | $76,847 | $96,835 | ||||||
| 1 | For the period from February 28, 2019 (commencement of class operations) to September 30, 2019 |
| 2 | Calculated based upon average shares outstanding |
| 3 | Returns for periods of less than one year are not annualized. |
The accompanying notes are an integral part of these financial statements.
Wells Fargo Global Investment Grade Credit Fund | 25
Table of Contents
Financial highlights
(For a share outstanding throughout each period)
| Year ended September 30 | ||||||||
| INSTITUTIONAL CLASS | 2020 | 20191 | ||||||
Net asset value, beginning of period | $10.75 | $10.00 | ||||||
Net investment income | 0.24 | 0.14 | ||||||
Net realized and unrealized gains (losses) on investments | 0.38 | 0.72 | ||||||
|
|
|
| |||||
Total from investment operations | 0.62 | 0.86 | ||||||
Distributions to shareholders from | ||||||||
Net investment income | (0.33 | ) | (0.11 | ) | ||||
Net realized gains | (0.13 | ) | 0.00 | |||||
|
|
|
| |||||
Total distributions to shareholders | (0.46 | ) | (0.11 | ) | ||||
Net asset value, end of period | $10.91 | $10.75 | ||||||
Total return2 | 6.04 | % | 8.64 | % | ||||
Ratios to average net assets (annualized) | ||||||||
Gross expenses | 0.83 | % | 0.97 | % | ||||
Net expenses | 0.50 | % | 0.50 | % | ||||
Net investment income | 2.24 | % | 2.34 | % | ||||
Supplemental data | ||||||||
Portfolio turnover rate | 79 | % | 36 | % | ||||
Net assets, end of period (000s omitted) | $27 | $27 | ||||||
| 1 | For the period from February 28, 2019 (commencement of class operations) to September 30, 2019 |
| 2 | Returns for periods of less than one year are not annualized. |
The accompanying notes are an integral part of these financial statements.
26 | Wells Fargo Global Investment Grade Credit Fund
Table of Contents
1. ORGANIZATION
Wells Fargo Funds Trust (the “Trust”), a Delaware statutory trust organized on March 10, 1999, is an open-end management investment company registered under the Investment Company Act of 1940, as amended (the “1940 Act”). As an investment company, the Trust follows the accounting and reporting guidance in Financial Accounting Standards Board (“FASB”) Accounting Standards Codification Topic 946, Financial Services – Investment Companies. These financial statements report on the Wells Fargo Global Investment Grade Credit Fund (the “Fund”) which is a diversified series of the Trust.
2. SIGNIFICANT ACCOUNTING POLICIES
The following significant accounting policies, which are consistently followed in the preparation of the financial statements of the Fund, are in conformity with U.S. generally accepted accounting principles which require management to make estimates and assumptions that affect the reported amounts of assets and liabilities, disclosure of contingent assets and liabilities at the date of the financial statements, and the reported amounts of revenues and expenses during the reporting period. Actual results could differ from those estimates.
Securities valuation
All investments are valued each business day as of the close of regular trading on the New York Stock Exchange (generally 4 p.m. Eastern Time), although the Fund may deviate from this calculation time under unusual or unexpected circumstances.
Debt securities are valued at the evaluated bid price provided by an independent pricing service (e.g. taking into account various factors, including yields, maturities, or credit ratings) or, if a reliable price is not available, the quoted bid price from an independent broker-dealer.
Futures contracts that are listed on a foreign or domestic exchange or market are valued at the official closing price or, if none, the last sales price.
Forward foreign currency contracts are recorded at the forward rate provided by an independent foreign currency pricing source at a time each business day specified by the Wells Fargo Asset Management Pricing Committee at Wells Fargo Funds Management, LLC (“Funds Management”).
The values of securities denominated in foreign currencies are translated into U.S. dollars at rates provided by an independent foreign currency pricing source at a time each business day specified by the Wells Fargo Asset Management Pricing Committee.
Investments in registered open-end investment companies are valued at net asset value.
Investments which are not valued using any of the methods discussed above are valued at their fair value, as determined in good faith by the Board of Trustees of the Fund. The Board of Trustees has established a Valuation Committee comprised of the Trustees and has delegated to it the authority to take any actions regarding the valuation of portfolio securities that the Valuation Committee deems necessary or appropriate, including determining the fair value of portfolio securities, unless the determination has been delegated to the Wells Fargo Asset Management Pricing Committee. The Board of Trustees retains the authority to make or ratify any valuation decisions or approve any changes to the Valuation Procedures as it deems appropriate. On a quarterly basis, the Board of Trustees receives reports on any valuation actions taken by the Valuation Committee or the Wells Fargo Asset Management Pricing Committee which may include items for ratification.
Foreign currency translation
The accounting records of the Fund are maintained in U.S. dollars. The values of other assets and liabilities denominated in foreign currencies are translated into U.S. dollars at rates provided by an independent foreign currency pricing source at a time each business day specified by the Wells Fargo Asset Management Pricing Committee. Purchases and sales of securities, and income and expenses are converted at the rate of exchange on the respective dates of such transactions. Net realized foreign exchange gains or losses arise from sales of foreign currencies, currency gains or losses realized between the trade and settlement dates on securities transactions, and the difference between the amounts of dividends, interest and foreign withholding taxes recorded and the U.S. dollar equivalent of the amounts actually paid or received. Net unrealized foreign exchange gains and losses arise from changes in the fair value of assets and liabilities other than investments in securities resulting from changes in exchange rates. The changes in net assets arising from changes in exchange rates of securities and the changes in net assets resulting from changes in market prices of securities are not separately presented. Such changes are included in net realized and unrealized gains or losses from investments.
Forward foreign currency contracts
A forward foreign currency contract is an agreement between two parties to purchase or sell a specific currency for an agreed-upon price at a future date. The Fund enters into forward foreign currency contracts to facilitate transactions in foreign-denominated securities and to attempt to minimize the risk to the Fund from adverse changes in the relationship between
Wells Fargo Global Investment Grade Credit Fund | 27
Table of Contents
Notes to financial statements
currencies. Forward foreign currency contracts are recorded at the forward rate and marked-to-market daily. When the contracts are closed, realized gains and losses arising from such transactions are recorded as realized gains or losses on forward foreign currency contracts. The Fund is subject to foreign currency risk and may be exposed to risks if the counterparties to the contracts are unable to meet the terms of their contracts or if the value of the foreign currency changes unfavorably. The Fund’s maximum risk of loss from counterparty credit risk is the unrealized gains on the contracts. This risk may be mitigated if there is a master netting arrangement between the Fund and the counterparty.
When-issued transactions
The Fund may purchase securities on a forward commitment or when-issued basis. The Fund records a when-issued transaction on the trade date and will segregate assets in an amount at least equal in value to the Fund’s commitment to purchase when-issued securities. Securities purchased on a when-issued basis are marked-to-market daily and the Fund begins earning interest on the settlement date. Losses may arise due to changes in the market value of the underlying securities or if the counterparty does not perform under the contract.
Futures contracts
Futures contracts are agreements between the Fund and a counterparty to buy or sell a specific amount of a commodity, financial instrument or currency at a specified price and on a specified date. The Fund may buy and sell futures contracts in order to gain exposure to, or protect against, changes in interest rates and is subject to interest rate risk. The primary risks associated with the use of futures contracts are the imperfect correlation between changes in market values of securities held by the Fund and the prices of futures contracts, and the possibility of an illiquid market. Futures contracts are generally entered into on a regulated futures exchange and cleared through a clearinghouse associated with the exchange. With futures contracts, there is minimal counterparty risk to the Fund since futures contracts are exchange traded and the exchange’s clearinghouse, as the counterparty to all exchange traded futures, guarantees the futures contracts against default.
Upon entering into a futures contracts, the Fund is required to deposit either cash or securities (initial margin) with the broker in an amount equal to a certain percentage of the contract value. Subsequent payments (variation margin) are paid to or from the broker each day equal to the daily changes in the contract value. Such payments are recorded as unrealized gains or losses and, if any, shown as variation margin receivable (payable) in the Statement of Assets and Liabilities. Should the Fund fail to make requested variation margin payments, the broker can gain access to the initial margin to satisfy the Fund’s payment obligations. When the contracts are closed, a realized gain or loss is recorded in the Statement of Operations.
Security transactions and income recognition
Securities transactions are recorded on a trade date basis. Realized gains or losses are recorded on the basis of identified cost.
Interest income is accrued daily and bond discounts are accreted and premiums are amortized daily. To the extent debt obligations are placed on non-accrual status, any related interest income may be reduced by writing off interest receivables when the collection of all or a portion of interest has been determined to be doubtful based on consistently applied procedures and the fair value has decreased. If the issuer subsequently resumes interest payments or when the collectability of interest is reasonably assured, the debt obligation is removed from non-accrual status.
Distributions to shareholders
Distributions to shareholders are recorded on the ex-dividend date and paid from net investment income monthly and any net realized gains are paid at least annually. Such distributions are determined in accordance with income tax regulations and may differ from U.S. generally accepted accounting principles. Dividend sources are estimated at the time of declaration. The tax character of distributions is determined as of the Fund’s fiscal year end. Therefore, a portion of the Fund’s distributions made prior to the Fund’s fiscal year end may be categorized as a tax return of capital at year end.
Federal and other taxes
The Fund intends to continue to qualify as a regulated investment company by distributing substantially all of its investment company taxable income and any net realized capital gains (after reduction for capital loss carryforwards) sufficient to relieve it from all, or substantially all, federal income taxes. Accordingly, no provision for federal income taxes was required.
The Fund’s income and federal excise tax returns and all financial records supporting those returns for the prior three fiscal years are subject to examination by the federal and Delaware revenue authorities. Management has analyzed the Fund’s tax positions taken on federal, state, and foreign tax returns for all open tax years and does not believe that there are any uncertain tax positions that require recognition of a tax liability.
28 | Wells Fargo Global Investment Grade Credit Fund
Table of Contents
Notes to financial statements
As of September 30, 2020, the aggregate cost of all investments for federal income tax purposes was $72,647,350 and the unrealized gains (losses) consisted of:
Gross unrealized gains | $4,027,743 | |||
Gross unrealized losses | (416,313 | ) | ||
Net unrealized gains | $3,611,430 | |||
Class allocations
The separate classes of shares offered by the Fund differ principally in administration fees. Class specific expenses are charged directly to that share class. Investment income, common fund-level expenses, and realized and unrealized gains (losses) on investments are allocated daily to each class of shares based on the relative proportion of net assets of each class.
3. FAIR VALUATION MEASUREMENTS
Fair value measurements of investments are determined within a framework that has established a fair value hierarchy based upon the various data inputs utilized in determining the value of the Fund’s investments. The three-level hierarchy gives the highest priority to unadjusted quoted prices in active markets for identical assets or liabilities (Level 1) and the lowest priority to unobservable inputs (Level 3). The Fund’s investments are classified within the fair value hierarchy based on the lowest level of input that is significant to the fair value measurement. The inputs are summarized into three broad levels as follows:
| ∎ | Level 1 – quoted prices in active markets for identical securities |
| ∎ | Level 2 – other significant observable inputs (including quoted prices for similar securities, interest rates, prepayment speeds, credit risk, etc.) |
| ∎ | Level 3 – significant unobservable inputs (including the Fund’s own assumptions in determining the fair value of investments) |
The inputs or methodologies used for valuing investments in securities are not necessarily an indication of the risk associated with investing in those securities.
The following is a summary of the inputs used in valuing the Fund’s assets and liabilities as of September 30, 2020:
| Quoted prices (Level 1) | Other significant observable inputs (Level 2) | Significant (Level 3) | Total | |||||||||||||
Assets | ||||||||||||||||
Investments in: | ||||||||||||||||
Asset-backed securities | $ | 0 | $ | 1,238,325 | $ | 0 | $ | 1,238,325 | ||||||||
Corporate bonds and notes | 0 | 40,260,291 | 0 | 40,260,291 | ||||||||||||
Foreign corporate bonds and notes | 0 | 21,838,337 | 0 | 21,838,337 | ||||||||||||
Municipal obligations | 0 | 238,265 | 0 | 238,265 | ||||||||||||
U.S. Treasury securities | 748,137 | 0 | 0 | 748,137 | ||||||||||||
Yankee corporate bonds and notes | 0 | 10,580,369 | 0 | 10,580,369 | ||||||||||||
Short-term investments | ||||||||||||||||
Investment companies | 1,157,095 | 0 | 0 | 1,157,095 | ||||||||||||
| 1,905,232 | 74,155,587 | 0 | 76,060,819 | |||||||||||||
Futures contracts | 1,930 | 0 | 0 | 1,930 | ||||||||||||
Forward foreign currency contracts | 0 | 196,031 | 0 | 196,031 | ||||||||||||
Total assets | $ | 1,907,162 | $ | 74,351,618 | $ | 0 | $ | 76,258,780 | ||||||||
Additional sector, industry or geographic detail is included in the Portfolio of Investments.
For the year ended September 30, 2020, the Fund did not have any transfers into/out of Level 3.
Wells Fargo Global Investment Grade Credit Fund | 29
Table of Contents
Notes to financial statements
4. TRANSACTIONS WITH AFFILIATES
Management fee
Funds Management, an indirect wholly owned subsidiary of Wells Fargo & Company (“Wells Fargo”), is the manager of the Fund and provides advisory and fund-level administrative services under an investment management agreement. Under the investment management agreement, Funds Management is responsible for, among other services, implementing the investment objectives and strategies of the Fund, supervising the subadviser and providing fund-level administrative services in connection with the Fund’s operations. As compensation for its services under the investment management agreement, Funds Management is entitled to receive a management fee at the following annual rate based on the Fund’s average daily net assets:
| Average daily net assets | Management fee | |
First $500 million | 0.400% | |
Next $500 million | 0.375 | |
Next $2 billion | 0.350 | |
Next $2 billion | 0.325 | |
Next $5 billion | 0.290 | |
Over $10 billion | 0.280 | |
For the year ended September 30, 2020, the management fee was equivalent to an annual rate of 0.40% of the Fund’s average daily net assets.
Funds Management has retained the services of subadvisers to provide daily portfolio management to the Fund. The fee for subadvisory services is borne by Funds Management. Wells Capital Management Incorporated and Wells Fargo Asset Management (International) Limited, each an affiliate of Funds Management and an indirect wholly owned subsidiary of Wells Fargo, serve as subadvisers to the Fund and are each entitled to receive a fee from Funds Management at an annual rate starting at 0.10% and declining to 0.05% as the average daily net assets of the Fund increase.
Administration fees
Under a class-level administration agreement, Funds Management provides class-level administrative services to the Fund, which includes paying fees and expenses for services provided by the transfer agent, sub-transfer agents, omnibus account servicers and record-keepers. As compensation for its services under the class-level administration agreement, Funds Management receives an annual fee which is calculated based on the average daily net assets of each class as follows:
| Class-level administration fee | ||
Class R6 | 0.03% | |
Institutional Class | 0.08 | |
Waivers and/or expense reimbursements
Funds Management has contractually waived and/or reimbursed management and administration fees to the extent necessary to maintain certain net operating expense ratios for the Fund. When each class of the Fund has exceeded its expense cap, Funds Management has waived fees and/or reimbursed expenses from fund-level expenses on a proportionate basis and then from class specific expenses. When only certain classes exceed their expense caps, waivers and/or reimbursements are applied against class specific expenses before fund-level expenses. Funds Management has committed through January 31, 2021 to waive fees and/or reimburse expenses to the extent necessary to cap the Fund’s expenses at 0.45% for Class R6 shares and 0.50% for Institutional Class shares. Prior to or after the commitment expiration date, the cap may be increased or the commitment to maintain the cap may be terminated only with the approval of the Board of Trustees.
Interfund transactions
The Fund may purchase or sell portfolio investment securities to certain other Wells Fargo affiliates pursuant to Rule 17a-7 under the 1940 Act and under procedures adopted by the Board of Trustees. The procedures have been designed to ensure that these interfund transactions, which do not incur broker commissions, are effected at current market prices.
30 | Wells Fargo Global Investment Grade Credit Fund
Table of Contents
Notes to financial statements
5. INVESTMENT PORTFOLIO TRANSACTIONS
Purchases and sales of investments, excluding short-term securities, for the year ended September 30, 2020 were as follows:
Purchases at cost | Sales proceeds | |||||
| U.S. government | Non-U.S. government | U.S. government | Non-U.S. government | |||
| $8,051,253 | $48,673,837 | $7,519,122 | $70,947,837 | |||
6. DERIVATIVE TRANSACTIONS
During the year ended September 30, 2020, the Fund entered into futures contracts and forward foreign currency contracts for economic hedging purposes.
The volume of the Fund’s futures contracts and forward foreign currency contracts during the year ended September 30, 2020 was as follows:
Futures contracts | ||||
Average notional balance on long futures | $ | 159,819 | ||
Forward foreign currency contracts | ||||
Average contract amounts to buy | $ | 553,764 | ||
Average contract amounts to sell | 24,488,347 | |||
The fair value, realized gains or losses and change in unrealized gains or losses, if any, on derivative instruments are reflected in the corresponding financial statement captions.
A summary of the location of derivative instruments on the financial statements by primary risk exposure is outlined in the following tables.
The fair value of derivative instruments as of September 30, 2020 by risk type was as follows for the Fund:
Asset derivatives | Liability derivatives | |||||||||||
| Statement of Assets and Liabilities location | Fair value | Statement of Assets and Liabilities location | Fair value | |||||||||
Interest rate risk | Unrealized gains on | Unrealized losses on | ||||||||||
| futures contracts | $ | 1,930 | * | futures contracts | $ | 0 | * | |||||
Foreign currency risk | Unrealized gains on | Unrealized losses on | ||||||||||
| forward foreign currency contracts | 196,031 | forward foreign currency contracts | 0 | |||||||||
| $ | 197,961 | $ | 0 | |||||||||
| * | Amount represents cumulative unrealized gains (losses) as reported in the table following the Portfolio of Investments. For futures contracts, only the current day’s variation margin as of September 30, 2020 is reported separately on the Statement of Assets and Liabilities. |
The effect of derivative instruments on the Statement of Operations for the year ended September 30, 2020 was as follows for the Fund:
| Amount of realized gains (losses) on derivatives | Change in unrealized gains (losses) on derivatives | |||||||||||||||||||||||
| Futures contracts | Forward foreign currency contracts | Total | Futures contracts | Forward foreign currency contracts | Total | |||||||||||||||||||
Interest rate risk | $ | 1,355 | $ | 0 | $ | 1,355 | $ | 1,930 | $ | 0 | $ | 1,930 | ||||||||||||
Foreign currency risk | 0 | (1,395,236 | ) | (1,395,236 | ) | 0 | (215,534 | ) | (215,534 | ) | ||||||||||||||
| $ | 1,355 | $ | (1,395,236 | ) | $ | (1,393,881 | ) | $ | 1,930 | $ | (215,534 | ) | $ | (213,604 | ) | |||||||||
For certain types of derivative transactions, the Fund has entered into International Swaps and Derivatives Association, Inc. master agreements (“ISDA Master Agreements”) or similar agreements with approved counterparties. The ISDA Master Agreements or similar agreements may have requirements to deliver/deposit securities or cash to/with an exchange or
Wells Fargo Global Investment Grade Credit Fund | 31
Table of Contents
Notes to financial statements
broker-dealer as collateral and allows the Fund to offset, with each counterparty, certain derivative financial instrument’s assets and/or liabilities with collateral held or pledged. Collateral requirements differ by type of derivative. Collateral or margin requirements are set by the broker or exchange clearinghouse for exchange traded derivatives while collateral terms are contract specific for over-the-counter traded derivatives. Cash collateral that has been pledged to cover obligations of the Fund under ISDA Master Agreements or similar agreements, if any, are reported separately in the Statement of Assets and Liabilities. Securities pledged as collateral, if any, are noted in the Portfolio of Investments. With respect to balance sheet offsetting, absent an event of default by the counterparty or a termination of the agreement, the reported amounts of financial assets and financial liabilities in the Statement of Assets and Liabilities are not offset across transactions between the Fund and the applicable counterparty. A reconciliation of the gross amounts on the Statement of Assets and Liabilities to the net amounts by counterparty, including any collateral exposure, for OTC derivatives is as follows:
| Counterparty | Gross amounts of assets in the Statement of Assets and Liabilities | Amounts subject to netting agreements | Collateral received | Net amount of assets | ||||||||
State Street Bank | $196,031 | $0 | $ | 0 | $ | 196,031 | ||||||
7. BANK BORROWINGS
The Trust (excluding the money market funds), Wells Fargo Master Trust and Wells Fargo Variable Trust are parties to a $350,000,000 revolving credit agreement whereby the Fund is permitted to use bank borrowings for temporary or emergency purposes, such as to fund shareholder redemption requests. Interest under the credit agreement is charged to the Fund based on a borrowing rate equal to the higher of the Federal Funds rate in effect on that day plus 1.25% or the overnight LIBOR rate in effect on that day plus 1.25%. In addition, an annual commitment fee equal to 0.25% of the unused balance is allocated to each participating fund.
For the year ended September 30, 2020, there were no borrowings by the Fund under the agreement.
8. DISTRIBUTIONS TO SHAREHOLDERS
The tax character of distributions paid was $3,158,937 and $728,002 of ordinary income for the years ended September 30, 2020 and for the period from February 28, 2019 (commencement of operations) to September 30, 2019, respectively.
As of September 30, 2020, the components of distributable earnings on a tax basis were as follows:
| Undistributed ordinary income | Undistributed long-term gain | Unrealized gains | ||
| $1,375,135 | $386,133 | $3,611,430 | ||
9. INDEMNIFICATION
Under the Fund’s organizational documents, the officers and Trustees have been granted certain indemnification rights against certain liabilities that may arise out of performance of their duties to the Fund. The Fund has entered into a separate agreement with each Trustee that converts indemnification rights currently existing under the Fund’s organizational documents into contractual rights that cannot be changed in the future without the consent of the Trustee. Additionally, in the normal course of business, the Fund may enter into contracts with service providers that contain a variety of indemnification clauses. The Fund’s maximum exposure under these arrangements is dependent on future claims that may be made against the Fund and, therefore, cannot be estimated.
10. NEW ACCOUNTING PRONOUNCEMENTS
In August 2018, FASB issued Accounting Standards Update (“ASU”) No. 2018-13, Fair Value Measurement (Topic 820) Disclosure Framework—Changes to the Disclosure Requirements for Fair Value Measurement. ASU 2018-13 updates the disclosure requirements on fair value measurements in Topic 820, Fair Value Measurements. The amendments are effective for fiscal years, and interim periods within those fiscal years, beginning after December 15, 2019. Management has adopted this guidance which did not have a material impact on the financial statements.
32 | Wells Fargo Global Investment Grade Credit Fund
Table of Contents
Notes to financial statements
11. CORONAVIRUS (COVID-19) PANDEMIC
On March 11, 2020, the World Health Organization announced that it had made the assessment that coronavirus disease 2019 (“COVID-19”) is a pandemic. The impacts of COVID-19 are adversely affecting the entire global economy, individual companies and investment products, and the market in general. There is significant uncertainty around the extent and duration of business disruptions related to COVID-19 and the impacts may be short term or may last for an extended period of time. The risk of further spreading of COVID-19 has led to significant uncertainty and volatility in the financial markets.
Wells Fargo Global Investment Grade Credit Fund | 33
Table of Contents
Report of independent registered public accounting firm
To the Shareholders of the Fund and Board of Trustees
Wells Fargo Funds Trust:
Opinion on the Financial Statements
We have audited the accompanying statement of assets and liabilities of Wells Fargo Global Investment Grade Credit Fund (the Fund), one of the funds constituting Wells Fargo Funds Trust, including the portfolio of investments, as of September 30, 2020, the related statement of operations for the year then ended, the statements of changes in net assets for the year then ended and for the period from February 28, 2019 (commencement of operations) to September 30, 2019, and the related notes (collectively, the financial statements) and the financial highlights for the year then ended and for the period from February 28, 2019 to September 30, 2019. In our opinion, the financial statements and financial highlights present fairly, in all material respects, the financial position of the Fund as of September 30, 2020, the results of its operations for the year then ended, and the changes in its net assets and the financial highlights for the year then ended and for the period from February 28, 2019 to September 30, 2019, in conformity with U.S. generally accepted accounting principles.
Basis for Opinion
These financial statements and financial highlights are the responsibility of the Fund’s management. Our responsibility is to express an opinion on these financial statements and financial highlights based on our audits. We are a public accounting firm registered with the Public Company Accounting Oversight Board (United States) (PCAOB) and are required to be independent with respect to the Fund in accordance with the U.S. federal securities laws and the applicable rules and regulations of the Securities and Exchange Commission and the PCAOB.
We conducted our audits in accordance with the standards of the PCAOB. Those standards require that we plan and perform the audit to obtain reasonable assurance about whether the financial statements and financial highlights are free of material misstatement, whether due to error or fraud. Our audits included performing procedures to assess the risks of material misstatement of the financial statements and financial highlights, whether due to error or fraud, and performing procedures that respond to those risks. Such procedures included examining, on a test basis, evidence regarding the amounts and disclosures in the financial statements and financial highlights. Such procedures also included confirmation of securities owned as of September 30, 2020, by correspondence with the custodian, transfer agent and brokers, or by other appropriate auditing procedures. Our audits also included evaluating the accounting principles used and significant estimates made by management, as well as evaluating the overall presentation of the financial statements and financial highlights. We believe that our audits provide a reasonable basis for our opinion.

We have not been able to determine the specific year that we began serving as the auditor of one or more Wells Fargo Funds investment companies; however we are aware that we have served as the auditor of one or more Wells Fargo Funds investment companies since at least 1955.
Boston, Massachusetts
November 24, 2020
34 | Wells Fargo Global Investment Grade Credit Fund
Table of Contents
TAX INFORMATION
For the fiscal year ended September 30, 2020, $1,217,110 has been designated as interest-related dividends for nonresident alien shareholders pursuant to Section 871 of the Internal Revenue Code.
For the fiscal year ended September 30, 2020, $904,064 has been designated as short-term capital gain dividends for nonresident alien shareholders pursuant to Section 871 of the Internal Revenue Code.
PROXY VOTING INFORMATION
A description of the policies and procedures used to determine how to vote proxies relating to portfolio securities is available, upon request, by calling 1-800-222-8222, visiting our website at wfam.com, or visiting the SEC website at sec.gov. Information regarding how the proxies related to portfolio securities were voted during the most recent 12-month period ended June 30 is available on the website at wfam.com or by visiting the SEC website at sec.gov.
QUARTERLY PORTFOLIO HOLDINGS INFORMATION
The Fund files its complete schedule of portfolio holdings with the SEC for the first and third quarters of each fiscal year as an exhibit to its reports on Form N-PORT. Shareholders may view the filed Form N-PORT by visiting the SEC website at sec.gov.
Wells Fargo Global Investment Grade Credit Fund | 35
Table of Contents
Other information (unaudited)
BOARD OF TRUSTEES AND OFFICERS
Each of the Trustees and Officers1 listed in the table below acts in identical capacities for each fund in the Wells Fargo family of funds, which consists of 142 mutual funds comprising the Wells Fargo Funds Trust, Wells Fargo Variable Trust, Wells Fargo Master Trust and four closed-end funds (collectively the “Fund Complex”). This table should be read in conjunction with the Prospectus and the Statement of Additional Information2. The mailing address of each Trustee and Officer is 525 Market Street, 12th Floor, San Francisco, CA 94105. Each Trustee and Officer serves an indefinite term, however, each Trustee serves such term until reaching the mandatory retirement age established by the Trustees.
Independent Trustees
| Name and year of birth | Position held and length of service* | Principal occupations during past five years or longer | Current other public company or investment company directorships | |||
William R. Ebsworth (Born 1957) | Trustee, since 2015 | Retired. From 1984 to 2013, equities analyst, portfolio manager, research director and chief investment officer at Fidelity Management and Research Company in Boston, Tokyo, and Hong Kong, and retired in 2013 as Chief Investment Officer of Fidelity Strategic Advisers, Inc. where he led a team of investment professionals managing client assets. Prior thereto, Board member of Hong Kong Securities Clearing Co., Hong Kong Options Clearing Corp., the Thailand International Fund, Ltd., Fidelity Investments Life Insurance Company, and Empire Fidelity Investments Life Insurance Company. Audit Committee Chair and Investment Committee Chair of the Vincent Memorial Hospital Endowment (non-profit organization). Mr. Ebsworth is a CFA® charterholder. | N/A | |||
Jane A. Freeman (Born 1953) | Trustee, since 2015; Chair Liaison, since 2018 | Retired. From 2012 to 2014 and 1999 to 2008, Chief Financial Officer of Scientific Learning Corporation. From 2008 to 2012, Ms. Freeman provided consulting services related to strategic business projects. Prior to 1999, Portfolio Manager at Rockefeller & Co. and Scudder, Stevens & Clark. Board member of the Harding Loevner Funds from 1996 to 2014, serving as both Lead Independent Director and chair of the Audit Committee. Board member of the Russell Exchange Traded Funds Trust from 2011 to 2012 and the chair of the Audit Committee. Ms. Freeman is also an inactive Chartered Financial Analyst. | N/A | |||
Isaiah Harris, Jr. (Born 1952) | Trustee, since 2009; Audit Committee Chairman, since 2019 | Retired. Chairman of the Board of CIGNA Corporation since 2009, and Director since 2005. From 2003 to 2011, Director of Deluxe Corporation. Prior thereto, President and CEO of BellSouth Advertising and Publishing Corp. from 2005 to 2007, President and CEO of BellSouth Enterprises from 2004 to 2005 and President of BellSouth Consumer Services from 2000 to 2003. Emeritus member of the Iowa State University Foundation Board of Governors. Emeritus Member of the Advisory Board of Iowa State University School of Business. Advisory Board Member, Palm Harbor Academy (private school). Mr. Harris is a certified public accountant (inactive status). | CIGNA Corporation | |||
Judith M. Johnson (Born 1949) | Trustee, since 2008 | Retired. Prior thereto, Chief Executive Officer and Chief Investment Officer of Minneapolis Employees Retirement Fund from 1996 to 2008. Ms. Johnson is an attorney, certified public accountant and a certified managerial accountant. | N/A | |||
David F. Larcker (Born 1950) | Trustee, since 2009 | James Irvin Miller Professor of Accounting at the Graduate School of Business (Emeritus), Stanford University, Director of the Corporate Governance Research Initiative and Senior Faculty of The Rock Center for Corporate Governance since 2006. From 2005 to 2008, Professor of Accounting at the Graduate School of Business, Stanford University. Prior thereto, Ernst & Young Professor of Accounting at The Wharton School, University of Pennsylvania from 1985 to 2005. | N/A | |||
36 | Wells Fargo Global Investment Grade Credit Fund
Table of Contents
Other information (unaudited)
| Name and year of birth | Position held and length of service* | Principal occupations during past five years or longer | Current other public company or investment company directorships | |||
Olivia S. Mitchell (Born 1953) | Trustee, since 2006; Nominating and Governance Committee Chair, since 2018 | International Foundation of Employee Benefit Plans Professor, Wharton School of the University of Pennsylvania since 1993. Director of Wharton’s Pension Research Council and Boettner Center on Pensions & Retirement Research, and Research Associate at the National Bureau of Economic Research. Previously, Cornell University Professor from 1978 to 1993. | N/A | |||
Timothy J. Penny (Born 1951) | Trustee, since 1996; Chairman, since 2018 | President and Chief Executive Officer of Southern Minnesota Initiative Foundation, a non-profit organization, since 2007. Member of the Board of Trustees of NorthStar Education Finance, Inc., a non-profit organization, since 2007. | N/A | |||
| James G. Polisson (Born 1959) | Trustee, since 2018 | Retired. Chief Marketing Officer, Source (ETF) UK Services, Ltd, from 2015 to 2017. From 2012 to 2015, Principal of The Polisson Group, LLC, a management consulting, corporate advisory and principal investing company. Chief Executive Officer and Managing Director at Russell Investments, Global Exchange Traded Funds from 2010 to 2012. Managing Director of Barclays Global Investors from 1998 to 2010 and Global Chief Marketing Officer for iShares and Barclays Global Investors from 2000 to 2010. Trustee of the San Francisco Mechanics’ Institute, a non-profit organization, from 2013 to 2015. Board member of the Russell Exchange Traded Fund Trust from 2011 to 2012. Director of Barclays Global Investors Holdings Deutschland GmbH from 2006 to 2009. Mr. Polisson is an attorney and has a retired status with the Massachusetts and District of Columbia Bar Associations. | N/A | |||
Pamela Wheelock (Born 1959) | Trustee, since January 2020; previously Trustee from January 2018 to July 2019 | Board member of the Destination Medical Center Economic Development Agency, Rochester, Minnesota since 2019. Interim President of the McKnight Foundation from January to September 2020. Acting Commissioner, Minnesota Department of Human Services, July 2019 through September 2019. Human Services Manager (part-time), Minnesota Department of Human Services, October 2019 through December 2019. Chief Operating Officer, Twin Cities Habitat for Humanity from 2017 to 2019. Vice President of University Services, University of Minnesota from 2012 to 2016. Prior thereto, on the Board of Directors, Governance Committee and Finance Committee for the Minnesota Philanthropy Partners (Saint Paul Foundation) from 2012 to 2018, Interim Chief Executive Officer of Blue Cross Blue Shield of Minnesota from 2011 to 2012, Chairman of the Board from 2009 to 2012 and Board Director from 2003 to 2015. Vice President, Leadership and Community Engagement, Bush Foundation, Saint Paul, Minnesota (a private foundation) from 2009 to 2011. Executive Vice President and Chief Financial Officer, Minnesota Sports and Entertainment from 2004 to 2009 and Senior Vice President from 2002 to 2004. Executive Vice President of the Minnesota Wild Foundation from 2004 to 2008. Commissioner of Finance, State of Minnesota, from 1999 to 2002. Currently Board Chair of the Minnesota Wild Foundation since 2010. | N/A | |||
| * | Length of service dates reflect the Trustee’s commencement of service with the Trust’s predecessor entities, where applicable. |
Wells Fargo Global Investment Grade Credit Fund | 37
Table of Contents
Other information (unaudited)
Officers
| Name and year of birth | Position held and length of service | Principal occupations during past five years or longer | ||
| Andrew Owen (Born 1960) | President, since 2017 | Executive Vice President of Wells Fargo & Company and Head of Affiliated Managers, Wells Fargo Asset Management, since 2014. In addition, Mr. Owen is currently President, Chief Executive Officer and Director of Wells Fargo Funds Management, LLC since 2017. Prior thereto, Executive Vice President responsible for marketing, investments and product development for Wells Fargo Funds Management, LLC, from 2009 to 2014. | ||
| Jeremy DePalma1 (Born 1974) | Treasurer, since 2012 | Senior Vice President of Wells Fargo Funds Management, LLC since 2009. Senior Vice President of Evergreen Investment Management Company, LLC from 2008 to 2010 and head of the Fund Reporting and Control Team within Fund Administration from 2005 to 2010. | ||
| Michelle Rhee (Born 1966) | Chief Legal Officer, since 2019 | Secretary of Wells Fargo Funds Management, LLC, Chief Legal Counsel of Wells Fargo Asset Management and Assistant General Counsel of Wells Fargo Bank, N.A. since 2018. Associate General Counsel and Managing Director of Bank of America Corporation from 2004 to 2018. | ||
| Catherine Kennedy (Born 1969) | Secretary, since 2019 | Vice President of Wells Fargo Funds Management, LLC and Senior Counsel of the Wells Fargo Legal Department since 2010. Vice President and Senior Counsel of Evergreen Investment Management Company, LLC from 1998 to 2010. | ||
| Michael H. Whitaker (Born 1967) | Chief Compliance Officer, since 2016 | Chief Compliance Officer of Wells Fargo Asset Management since 2016. Senior Vice President and Chief Compliance Officer for Fidelity Investments from 2007 to 2016. | ||
| 1 | Jeremy DePalma acts as Treasurer of 77 funds in the Fund Complex. |
| 2 | The Statement of Additional Information includes additional information about the Trustees and is available, without charge, upon request, by calling 1-800-222-8222 or by visiting the website at wfam.com. |
38 | Wells Fargo Global Investment Grade Credit Fund
Table of Contents
Other information (unaudited)
BOARD CONSIDERATION OF INVESTMENT MANAGEMENT AND SUB-ADVISORY AGREEMENTS:
Wells Fargo Global Investment Grade Credit Fund
Under the Investment Company Act of 1940 (the “1940 Act”), the Board of Trustees (the “Board”) of Wells Fargo Funds Trust (the “Trust”) must determine annually whether to approve the continuation of the Trust’s investment management and sub-advisory agreements. In this regard, at a Board meeting held on May 26, 2020 and May 28, 2020 (together, the “Meeting”), the Board, all the members of which have no direct or indirect interest in the investment management and sub-advisory agreements and are not “interested persons” of the Trust, as defined in the 1940 Act (the “Independent Trustees”), reviewed and approved for Wells Fargo Global Investment Grade Credit Fund (the “Fund”): (i) an investment management agreement (the “Management Agreement”) with Wells Fargo Funds Management, LLC (“Funds Management”); and (ii) investment sub-advisory agreements (the “Sub-Advisory Agreements”) with Wells Capital Management Incorporated and Wells Fargo Asset Management (International) Limited (collectively, the “Sub-Advisers”), both affiliates of Funds Management. The Management Agreement and the Sub-Advisory Agreements are collectively referred to as the “Advisory Agreements.”
At the Meeting, the Board considered the factors and reached the conclusions described below relating to the selection of Funds Management and the Sub-Advisers and the approval of the Advisory Agreements. Prior to the Meeting, including at a Board meeting held in April 2020, the Trustees conferred extensively among themselves and with representatives of Funds Management about these matters. Also, the Board has adopted a team-based approach, with each team consisting of a sub-set of Trustees, to assist the full Board in the discharge of its duties in reviewing investment performance and other matters throughout the year. The Independent Trustees were assisted in their evaluation of the Advisory Agreements by independent legal counsel, from whom they received separate legal advice and with whom they met separately.
In providing information to the Board, Funds Management and the Sub-Advisers were guided by a detailed set of requests for information submitted to them by independent legal counsel on behalf of the Independent Trustees at the start of the Board’s annual contract renewal process earlier in 2020. In considering and approving the Advisory Agreements, the Trustees considered the information they believed relevant, including but not limited to the information discussed below. The Board considered not only the specific information presented in connection with the Meeting, but also the knowledge gained over time through interaction with Funds Management and the Sub-Advisers about various topics. In this regard, the Board reviewed reports of Funds Management at each of its quarterly meetings, which included, among other things, portfolio reviews and investment performance reports. In addition, the Board and the teams mentioned above confer with portfolio managers at various times throughout the year. The Board did not identify any particular information or consideration that was all-important or controlling, and each individual Trustee may have attributed different weights to various factors.
After its deliberations, the Board unanimously approved the continuation of the Advisory Agreements for a one-year term and determined that the compensation payable to Funds Management and the Sub-Advisers under each of the Advisory Agreements was reasonable. The Board considered the approval of the Advisory Agreements for the Fund as part of its consideration of agreements for funds across the complex, but its approvals were made on a fund-by-fund basis. The following summarizes a number of important, but not necessarily all, factors considered by the Board in support of its approvals.
Nature, extent and quality of services
The Board received and considered various information regarding the nature, extent and quality of services provided to the Fund by Funds Management and the Sub-Advisers under the Advisory Agreements. This information included a description of the investment advisory services and Fund-level administrative services covered by the Management Agreement, as well as, among other things, a summary of the background and experience of senior management of Wells Fargo Asset Management (“WFAM”), of which Funds Management and the Sub-Advisers are a part, and a summary of investments made in the business of WFAM. The Board also received a description of Funds Management’s and the Sub-Advisers’ business continuity plans and of their approaches to data privacy and cybersecurity, and related testing. The Board also received and reviewed information about Funds Management’s role as administrator of the Fund’s liquidity risk management program, Funds Management’s approach to risk management, and Funds Management’s intermediary and vendor oversight program.
The Board also considered the qualifications, background, tenure and responsibilities of each of the portfolio managers primarily responsible for the day-to-day portfolio management of the Fund. The Board evaluated the ability of Funds Management and the Sub-Advisers to attract and retain qualified investment professionals, including research, advisory and supervisory personnel. The Board further considered the compliance programs and compliance records of Funds Management and the Sub-Advisers. In addition, the Board took into account the full range of services provided to the Fund by Funds Management and its affiliates.
Wells Fargo Global Investment Grade Credit Fund | 39
Table of Contents
Other information (unaudited)
Fund investment performance and expenses
The Board considered the investment performance results for the Fund for the one-year period ended March 31, 2020. The Board considered these results in comparison to the investment performance of funds in a universe that was determined by Broadridge Inc. (“Broadridge”) to be similar to the Fund (the “Universe”), and in comparison to the Fund’s benchmark index and to other comparative data. Broadridge is an independent provider of investment company data. The Board received a description of the methodology used by Broadridge to select the mutual funds in the performance Universe. The Board noted that the Fund had recently commenced operations and had no performance history for the period ended December 31, 2019 to review. The Board noted that the investment performance of the Fund (Institutional Class) was higher than the average investment performance of the Universe for the one-year period ended March 31, 2020. The Board also noted that the investment performance of the Fund was higher than its benchmark index, the Bloomberg Barclays Global Aggregate ex USD Index, for the one-year period ended March 31, 2020.
The Board also received and considered information regarding the Fund’s net operating expense ratios and their various components, including actual management fees, custodian and other non-management fees, and Rule 12b-1 and non-Rule 12b-1 shareholder service fees. The Board considered these ratios in comparison to the median ratios of funds in class-specific expense groups that were determined by Broadridge to be similar to the Fund (the “Groups”). The Board received a description of the methodology used by Broadridge to select the mutual funds in the expense Groups and an explanation of how funds comprising expense groups and their expense ratios may vary from year-to-year. Based on the Broadridge reports, the Board noted that the net operating expense ratios of the Fund were lower than the median net operating expense ratios of the expense Groups for each share class.
The Board took into account the Fund’s investment performance and expense information provided to it among the factors considered in deciding to re-approve the Advisory Agreements.
Investment management and sub-advisory fee rates
The Board reviewed and considered the contractual fee rates payable by the Fund to Funds Management under the Management Agreement, as well as the contractual fee rates payable by the Fund to Funds Management for class-level administrative services under a Class-Level Administration Agreement, which include, among other things, class-level transfer agency and sub-transfer agency costs (collectively, the “Management Rates”). The Board also reviewed and considered the contractual investment sub-advisory fee rates that are payable by Funds Management to the Sub-Advisers for investment sub-advisory services.
Among other information reviewed by the Board was a comparison of the Fund’s Management Rates with the average contractual investment management fee rates of funds in the expense Groups at a common asset level as well as transfer agency costs of the funds in the expense Groups. The Board noted that the Management Rates of the Fund were lower than the sum of these average rates for the Fund’s expense Groups for all share classes.
The Board also received and considered information about the portion of the total management fee that was retained by Funds Management after the payment of fees to the Sub-Advisers for sub-advisory services. In assessing the reasonableness of this amount, the Board received and evaluated information about the nature and extent of responsibilities retained and risks assumed by Funds Management and not delegated to or assumed by the Sub-Advisers, and about Funds Management’s on-going oversight services. Given the affiliation between Funds Management and the Sub-Advisers, the Board ascribed limited relevance to the allocation of fees between them.
The Board also received and considered information about the nature and extent of services offered and fee rates charged by Funds Management and the Sub-Advisers to other types of clients with investment strategies similar to those of the Fund. In this regard, the Board received information about the significantly greater scope of services, and compliance, reporting and other legal burdens and risks of managing proprietary mutual funds compared with those associated with managing assets of other types of clients, including third-party sub-advised fund clients and non-mutual fund clients such as institutional separate accounts.
Based on its consideration of the factors and information it deemed relevant, including those described here, the Board determined that the compensation payable to Funds Management under the Management Agreement and to the Sub-Advisers under the Sub-Advisory Agreements was reasonable.
Profitability
The Board received and considered information concerning the profitability of Funds Management, as well as the profitability of both WFAM and Wells Fargo & Co. (“Wells Fargo”) from providing services to the fund family as a whole. The Board noted that the Sub-Advisers’ profitability information with respect to providing services to the Fund and other funds in the family was subsumed in the WFAM and Wells Fargo profitability analysis.
40 | Wells Fargo Global Investment Grade Credit Fund
Table of Contents
Other information (unaudited)
Funds Management reported on the methodologies and estimates used in calculating profitability, including a description of the methodology used to allocate certain expenses. Among other things, the Board noted that the levels of profitability reported on a fund-by-fund basis varied widely, depending on factors such as the size, type and age of fund.
Based on its review, the Board did not deem the profits reported by Funds Management, WFAM or Wells Fargo from services provided to the Fund to be at a level that would prevent it from approving the continuation of the Advisory Agreements.
Economies of Scale
The Board received and considered information about the potential for Funds Management to experience economies of scale in the provision of management services to the Fund, the difficulties of calculating economies of scale at an individual fund level, and the extent to which potential scale benefits are shared with shareholders. The Board noted the existence of breakpoints in the Fund’s management fee structure, which operate generally to reduce the Fund’s expense ratios as the Fund grows in size, and the size of the Fund in relation to such breakpoints. The Board considered that in addition to management fee breakpoints, Funds Management shares potential economies of scale from its management business in a variety of ways, including through fee waiver and expense reimbursement arrangements, services that benefit shareholders, competitive management fee rates set at the outset without regard to breakpoints, and investments in the business intended to enhance services available to shareholders.
The Board concluded that Funds Management’s arrangements with respect to the Fund, including contractual breakpoints, constituted a reasonable approach to sharing potential economies of scale with the Fund and its shareholders.
Other benefits to Funds Management and the Sub-Advisers
The Board received and considered information regarding potential “fall-out” or ancillary benefits received by Funds Management and its affiliates, including the Sub-Advisers, as a result of their relationships with the Fund. Ancillary benefits could include, among others, benefits directly attributable to other relationships with the Fund and benefits potentially derived from an increase in Funds Management’s and the Sub-Advisers’ businesses as a result of their relationships with the Fund. The Board noted that various affiliates of Funds Management may receive distribution-related fees, shareholder servicing payments and sub-transfer agency fees in respect of shares sold or held through them and services provided.
The Board also reviewed information about soft dollar credits earned and utilized by the Sub-Advisers, fees earned by Funds Management and Wells Capital Management Incorporated from managing a private investment vehicle for the fund family’s securities lending collateral, and commissions earned by an affiliated broker from portfolio transactions.
Based on its consideration of the factors and information it deemed relevant, including those described here, the Board did not find that any ancillary benefits received by Funds Management and its affiliates, including the Sub-Advisers, were unreasonable.
Conclusion
At the Meeting, after considering the above-described factors and based on its deliberations and its evaluation of the information described above, the Board unanimously approved the continuation of the Advisory Agreements for a one-year term and determined that the compensation payable to Funds Management and the Sub-Advisers under each of the Advisory Agreements was reasonable.
Wells Fargo Global Investment Grade Credit Fund | 41
Table of Contents
Other information (unaudited)
LIQUIDITY RISK MANAGEMENT PROGRAM
In accordance with Rule 22e-4 under the Investment Company Act of 1940, as amended (the “Liquidity Rule”), Wells Fargo Funds Trust (the “Trust”) has adopted and implemented a liquidity risk management program (the “Program”) on behalf of each of its series, including the Fund, which is reasonably designed to assess and manage the Fund’s liquidity risk. “Liquidity risk” is defined as the risk that the Fund is unable to meet redemption requests without significantly diluting remaining investors’ interests in the Fund. The Trust’s Board of Trustees (the “Board”) previously approved the designation of Wells Fargo Funds Management, LLC (“Funds Management”), the Fund’s investment manager, as the administrator of the Program, and Funds Management has established a Liquidity Risk Management Council composed of personnel from multiple departments within Funds Management and its affiliates to assist Funds Management in the implementation and on-going administration of the Program.
The Program is comprised of various components designed to support the assessment and/or management of liquidity risk, including: (1) the periodic assessment (no less frequently than annually) of certain factors that influence the Fund’s liquidity risk; (2) the periodic classification (no less frequently than monthly) of the Fund’s investments into one of four liquidity categories that reflect an estimate of their liquidity under current market conditions; (3) a 15% limit on the acquisition of “illiquid investments” (as defined under the Liquidity Rule); (4) to the extent the Fund does not invest primarily in “highly liquid investments” (as defined under the Liquidity Rule), the determination of a minimum percentage of the Fund’s assets that generally will be invested in highly liquid investments (an “HLIM”); (5) if the Fund has established an HLIM, the periodic review (no less frequently than annually) of the HLIM and the adoption of policies and procedures for responding to a shortfall of the Fund’s “highly liquid investments” below its HLIM; and (6) periodic reporting to the Board.
At a meeting of the Board held on May 26 and 28, 2020, the Board received a written report (the “Report”) from Funds Management that addressed the operation of the Program and assessed its adequacy and effectiveness of implementation. The Report covered the initial period from December 1, 2018 through December 31, 2019 (the “Reporting Period”). No significant liquidity events impacting the Fund were noted in the Report. There were no material changes to the Program during the Reporting Period. The Report concluded that the Program is operating effectively to assess and manage the Fund’s liquidity risk, and that the Program has been and continues to be adequately and effectively implemented to monitor and, as applicable, respond to the Fund’s liquidity developments.
There can be no assurance that the Program will achieve its objectives under all circumstances in the future. Please refer to the Fund’s prospectus for more information regarding the Fund’s exposure to liquidity risk and other risks to which an investment in the Fund may be subject.
42 | Wells Fargo Global Investment Grade Credit Fund
Table of Contents
This page is intentionally left blank.
Table of Contents
This page is intentionally left blank.
Table of Contents
For more information
More information about Wells Fargo Funds is available free upon request. To obtain literature, please write, visit the Fund’s website, or call:
Wells Fargo Funds
P.O. Box 219967
Kansas City, MO 64121-9967
Website: wfam.com
Individual investors: 1-800-222-8222
Retail investment professionals: 1-888-877-9275
Institutional investment professionals: 1-866-765-0778

This report and the financial statements contained herein are submitted for the general information of the shareholders of the Fund. If this report is used for promotional purposes, distribution of the report must be accompanied or preceded by a current prospectus. Before investing, please consider the investment objectives, risks, charges, and expenses of the investment. For a current prospectus and, if available, a summary prospectus, containing this information, call 1-800-222-8222 or visit the Fund’s website at wfam.com. Read the prospectus carefully before you invest or send money.
Wells Fargo Asset Management (WFAM) is the trade name for certain investment advisory/management firms owned by Wells Fargo & Company. These firms include but are not limited to Wells Capital Management Incorporated and Wells Fargo Funds Management, LLC. Certain products managed by WFAM entities are distributed by Wells Fargo Funds Distributor, LLC (a broker-dealer and Member FINRA).
This material is for general informational and educational purposes only and is NOT intended to provide investment advice or a recommendation of any kind—including a recommendation for any specific investment, strategy, or plan.
INVESTMENT PRODUCTS: NOT FDIC INSURED ◾ NO BANK GUARANTEE ◾ MAY LOSE VALUE
© 2020 Wells Fargo & Company. All rights reserved.
PAR-1020-00560 11-20
A294/AR294 09-20
Table of Contents
| ITEM 2. | CODE OF ETHICS |
(a) As of the end of the period covered by the report, Wells Fargo Funds Trust has adopted a code of ethics that applies to its President and Treasurer. A copy of the code of ethics is filed as an exhibit to this Form N-CSR.
(c) During the period covered by this report, there were no amendments to the provisions of the code of ethics adopted in Item 2(a) above.
(d) During the period covered by this report, there were no implicit or explicit waivers to the provisions of the code of ethics adopted in Item 2(a) above.
| ITEM 3. | AUDIT COMMITTEE FINANCIAL EXPERT |
The Board of Trustees of Wells Fargo Funds Trust has determined that Judith Johnson is an audit committee financial expert, as defined in Item 3 of Form N-CSR. Mrs. Johnson is independent for purposes of Item 3 of Form N-CSR.
| ITEM 4. | PRINCIPAL ACCOUNTANT FEES AND SERVICES |
(a), (b), (c), (d) The following table presents aggregate fees billed in each of the last two fiscal years for services rendered
to the Registrant by the Registrant’s principal accountant. These fees were billed to the registrant and were approved by
the Registrant’s audit committee.
| Fiscal year ended September 30, 2020 | Fiscal year ended September 30, 2019 | |||||||
Audit fees | $ | 428,670 | $ | 426,910 | ||||
Audit-related fees | — | — | ||||||
Tax fees (1) | 61,460 | 51,560 | ||||||
All other fees | — | — | ||||||
|
|
|
| |||||
| $ | 490,130 | $ | 478,470 | |||||
|
|
|
| |||||
| (1) | Tax fees consist of fees for tax compliance, tax advice, tax planning and excise tax. |
(e) The Chairman of the Audit Committees is authorized to pre-approve: (1) audit services for the mutual funds of Wells Fargo Funds Trust; (2) non-audit tax or compliance consulting or training services provided to the Funds by the independent auditors (“Auditors”) if the fees for any particular engagement are not anticipated to exceed $50,000; and (3) non-audit tax or compliance consulting or training services provided by the Auditors to a Fund’s investment adviser and its controlling entities (where pre-approval is required because the engagement relates directly to the operations and financial reporting of the Fund) if the fee to the Auditors for any particular engagement is not anticipated to exceed $50,000. For any such pre-approval sought from the Chairman, Management shall prepare a brief description of the proposed services.
Table of Contents
If the Chairman approves of such service, he or she shall sign the statement prepared by Management. Such written statement shall be presented to the full Committees at their next regularly scheduled meetings.
(f) Not applicable
(g) Not applicable
(h) Not applicable
| ITEM 5. | AUDIT COMMITTEE OF LISTED REGISTRANTS |
Not applicable.
| ITEM 6. | INVESTMENTS |
A Portfolio of Investments for each series of Wells Fargo Funds Trust is included as part of the report to shareholders filed under Item 1 of this Form.
| ITEM 7. | DISCLOSURE OF PROXY VOTING POLICIES AND PROCEDURES FOR CLOSED-END MANAGEMENT INVESTMENT COMPANIES |
Not applicable.
| ITEM 8. | PORTFOLIO MANAGERS OF CLOSED-END MANAGEMENT INVESTMENT COMPANIES |
Not applicable.
| ITEM 9. | PURCHASES OF EQUITY SECURITIES BY CLOSED-END MANAGEMENT INVESTMENT COMPANY AND AFFILIATED PURCHASERS |
Not applicable.
| ITEM 10. | SUBMISSION OF MATTERS TO A VOTE OF SECURITY HOLDERS |
There have been no material changes to the procedures by which shareholders may recommend nominees to the registrant’s Board of Trustees that have been implemented since the registrant’s last provided disclosure in response to the requirements of this Item.
| ITEM 11. | CONTROLS AND PROCEDURES |
(a) The President and Treasurer have concluded that the Wells Fargo Funds Trust disclosure controls and procedures (as defined in Rule 30a-3(c) under the Investment Company Act of 1940) provide reasonable assurances that material information relating to the registrant is made known to them by the appropriate persons based on their evaluation of these controls and procedures as of a date within 90 days of the filing of this report.
Table of Contents
(b) There were no significant changes in the registrant’s internal controls over financial reporting (as defined in Rule 30a-3(d) under the Investment Company Act of 1940) that occurred during the most recent fiscal half-year of the period covered by this report that materially affected, or is reasonably likely to materially affect, the registrant’s internal control over financial reporting.
| ITEM 12. | DISCLOSURES OF SECURITIES LENDING ACTIVITES FOR CLOSED-END MANAGEMENT INVESTMENT COMPANIES |
Not applicable.
| ITEM 13. | EXHIBITS |
(a)(1) Code of Ethics.
(a)(2) Certifications pursuant to Section 302 of the Sarbanes-Oxley Act of 2002.
(b) Certifications pursuant to Section 906 of the Sarbanes-Oxley Act of 2002.
Table of Contents
SIGNATURES
Pursuant to the requirements of the Securities Exchange Act of 1934 and the Investment Company Act of 1940, the registrant has duly caused this report to be signed on its behalf by the undersigned, thereunto duly authorized.
| Wells Fargo Funds Trust | ||
| By: | /s/ Andrew Owen | |
| Andrew Owen | ||
| President | ||
| Date: | November 24, 2020 | |
Pursuant to the requirements of the Securities Exchange Act of 1934 and the Investment Company Act of 1940, this report has been signed below by the following persons on behalf of the registrant and in the capacities and on the date indicated.
| Wells Fargo Funds Trust | ||
| By: | /s/ Andrew Owen | |
| Andrew Owen | ||
| President | ||
| Date: | November 24, 2020 | |
| By: | /s/Nancy Wiser | |
| Nancy Wiser | ||
| Treasurer | ||
| Date: | November 24, 2020 | |
| By: | /s/Jeremy DePalma | |
| Jeremy DePalma | ||
| Treasurer | ||
| Date: | November 24, 2020 | |